neighborhood analyses of small-mammal dynamics: impacts on
TRANSCRIPT
741
Ecology, 85(3), 2004, pp. 741–755q 2004 by the Ecological Society of America
NEIGHBORHOOD ANALYSES OF SMALL-MAMMAL DYNAMICS:IMPACTS ON SEED PREDATION AND SEEDLING ESTABLISHMENT
JACLYN L. SCHNURR,1,3,4 CHARLES D. CANHAM,2 RICHARD S. OSTFELD,2 AND RICHARD S. INOUYE3
1Sheldon Jackson College, 801 Lincoln Street, Sitka, Alaska 99835 USA2Institute of Ecosystem Studies, Millbrook, New York 12545 USA
3Center for Ecological Research and Education, Idaho State University, Pocatello, Idaho 83209 USA
Abstract. The spatial distribution of canopy trees in the temperate deciduous forestsof the northeastern United States creates ‘‘neighborhoods’’ that vary in species compositionas well as understory features. These neighborhoods may affect the distribution and abun-dance of generalist small-mammal seed predators by creating spatial variation in the avail-ability of food resources, protective cover, and interactions with competitors. Small-mammaldistribution and abundance may then influence tree population dynamics through variationin seed predation and seedling establishment. To determine if small-mammal activity pat-terns, seed survival, and seedling recruitment varied with neighborhood structure, we de-signed a study conducted at two habitat levels: canopy-tree neighborhoods, which reflectedvariation in seed production, and understory neighborhoods, which reflected differences inprotective cover and interactions among animals. We live-trapped small mammals duringthe summer and fall of 1995 and 1996, experimentally measured seed survival in the fallsof 1995 and 1996, and quantified total tree seedling recruitment in the spring of 1997. Wedeveloped a new method for nonlinear Poisson regression to relate canopy and understoryneighborhood composition to small-mammal distribution and activity, seed survival, andseedling establishment. Small-mammal activity patterns changed between 1995 and 1996in response to seed production. Canopy tree neighborhoods were a good predictor of overallsmall-mammal activity, and neighborhoods with high small-mammal activity had low seedsurvival. The canopy-tree neighborhoods with sufficient seed rain and high seed survivaldisplayed increased seedling recruitment. Understory structure was a poor predictor of seedsurvival and seedling recruitment but appeared to be the primary axis along which habitatpartitioning among mammal species took place when population densities were low. Thisstudy demonstrates that small-mammal seed predators influence tree recruitment patternsthrough their actions as seed predators in temperate deciduous forests, and that local effectsof small mammals on seedling recruitment can be predicted from the species compositionof tree neighborhoods.
Key words: canopy-tree neighborhoods; Clethrionomys gapperi; maximum likelihood estimation;microhabitat neighborhoods; nonlinear Poisson regression; Peromyscus spp.; principal componentsanalysis; seedling recruitment; seed survival; small-mammal dynamics; Tamias striatus; temperateforests.
INTRODUCTION
The distribution and abundance of small mammalsin temperate forests are influenced by a suite of factorsincluding predator avoidance (Barnum et al. 1992,Morris 1996, 2002), competition with other species(Falkenberg and Clarke 1998, Perri and Randall 1999),and resource levels, especially the availability of foodand water (Getz 1962, 1968, Miller and Getz 1977,McShea and Gilles 1992, Ostfeld et al. 1996, Wolff1996, McCracken et al. 1999). Most studies of small-mammal distribution in temperate forests have exam-ined coarse habitat characteristics such as density anddistribution of adult trees (regardless of species), aswell as microhabitat measures such as distribution ofwoody debris and percent cover of structural features
Manuscript received 16 October 2002; revised 25 July 2003;accepted 25 July 2003. Corresponding Editor: T. P. Young.
4 E-mail:[email protected]
such as shrubs (Dueser and Shugart 1978, Kitchingsand Levy 1981, Morris 1984, Buckner and Shure 1985,Seagle 1985). Studies demonstrating effects of partic-ular tree species on small-mammal activity tend to con-centrate on the regional effects of mast-producing spe-cies with large seeds (McShea and Gilles 1992, Ostfeldet al. 1996, Wolff 1996, McCracken et al. 1999). How-ever, whether the spatial distribution of small mammalsis predictable from the small-scale distribution of spe-cific tree or understory species is unknown.
The effects of small mammals on tree populationdynamics in temperate forests have received little at-tention. Effective seed dispersal distances of many treespecies are limited (Ribbens et al. 1994, Clark et al.1998), and recruitment limitation may play a role inthe maintenance of tree species diversity (Pacala et al.1996). Small mammals potentially can reduce recruit-ment limitation through secondary dispersal (Sork1983, Kollmann and Schill 1996, Hoshizaki et al.

742 JACLYN L. SCHNURR ET AL. Ecology, Vol. 85, No. 3
PLATE 1. Red oaks (Quercus rubra) in a mature, second-growth stand of the transition oak–northern hardwood forestsof Great Mountain Forest in northwestern Connecticut. Theunderstory in the foreground is dominated by hayscented fern(Dennstaedtia punctilobula). Photo by C. D. Canham.
1999), but the more obvious effects of small mammalsare as seed predators (Whelan et al. 1991, Ostfeld etal. 1997, Hulme and Hunt 1999, LoGiudice and Ostfeld2002, Schnurr et al. 2002). Seedling establishment inthese forests is highly episodic due, in part, to mastseeding and predator satiation (Sork 1983, Schnurr etal. 2002).
Recent models of forest dynamics focus on the im-portance of fine-scale spatial interactions among treespecies (e.g., Urban et al. 1991, Pacala et al. 1993,1996). Many processes in forest ecosystems can beviewed as ‘‘neighborhood’’ phenomena, in which thecritical interactions occur over the spatial scales of ad-jacent dominant canopy trees (i.e., tens of meters).These include seed dispersal and seedling establish-ment (Ribbens et al. 1994, Clark et al. 1998, LePageet al. 2000), shading and competition for light (Canham1989, Canham et al. 1994, Finzi and Canham 2000),and tree species effects on soil properties and nutrientavailability (e.g., Finzi et al. 1998a, b).
Tree seed size and, hence, suitability as a food re-source for rodent seed predators, varies dramaticallyamong temperate tree species. Most species of north-eastern trees disperse seeds in the autumn (Fowells1965), and tree seeds represent an important food re-source for rodents during this period. Home ranges ofthe major rodent species in North American temperateforests (i.e., Peromyscus species, Clethrionomys gap-peri, and Tamias striatus) can range from 0.03 to 0.5ha, which would include the crowns of 1–10 canopytrees (Merritt 1981, Snyder 1982, Lackey et al. 1985).Thus, neighborhood-scale variation in canopy treecomposition may well act as a critical determinant ofhabitat quality for small mammals at both individualand population levels in these forests.
Understory community structure can be an importantfactor in small-mammal habitat selection (Dueser andShugart 1978, Kitchings and Levy 1981, Vickery 1981,Yahner 1982, Parren and Capen 1985, Seagle 1985).Understory habitats can vary in (1) predation risk dueto cover by shrubs or herbs (Kaufman et al. 1985, Long-land and Price 1991); (2) availability of food resourcessuch as fruit and fungi that can be important when treeseeds are scarce (Vickery 1979, Hansson 1985, 1999);and (3) structure such as exposed rock and coarsewoody debris that can serve as runways (Barnum et al.1992, Waters and Zabel 1998, Loeb 1999). Thus, bothcanopy tree and understory microhabitat neighbor-hoods can influence small-mammal activity and distri-bution, and may affect patterns of seed predation and,ultimately, seedling recruitment.
We designed a study to examine feedbacks betweenneighborhood-scale spatial variation in plant commu-nity composition and structure, and the spatial distri-bution, abundance and activity of the small-mammalseed predators in a temperate deciduous forest of thenortheastern United States. Using newly developedmethods for nonlinear Poisson regression, we examined
the influence of variation in the composition of thecanopy tree neighborhoods on small-mammal abun-dance and activity. We also conducted a similar anal-ysis of the effects of neighborhood-scale variation inthe structure and composition of the forest understory.We then investigated the effects of the seed predatorson seed survival and seedling establishment, as a func-tion of canopy and understory neighborhood types. Weconducted our study for two years, which allowed usto incorporate the effects of temporal changes in seedproduction, seed survival, and small-mammal activity.Specifically, we asked: (1) do the major small-mammalgenera partition habitat with respect to either canopyor understory neighborhoods; (2) do small mammalsinfluence patterns of seed survival; and, (3) does seed-ling recruitment reflect the patterns of small-mammalhabitat occupancy or seed survival?
METHODS
Study area
This study was conducted at the 2500-ha GreatMountain Forest (GMF), located in Litchfield County,Connecticut, USA (418579 N, 738159 W; see Plate 1).The major tree species included red oak (Quercus rubraL.), beech (Fagus grandifolia Ehrh.), black cherry
March 2004 743NEIGHBORHOODS, RODENTS, AND SEEDS
(Prunus serotina Ehrh.), sugar maple (Acer saccharumMarsh.), red maple (Acer rubrum L.), white pine (Pinusstrobus L.), white ash (Fraxinus americana L.), andeastern hemlock (Tsuga canadensis (L.) Carr.). The ma-jor small-mammal seed predators in this area were Per-omyscus maniculatus (deer mice), P. leucopus (white-footed mice), Clethrionomys gapperi (southern red-backed voles), and Tamias striatus (eastern chip-munks).
In the summer of 1995, nine 1-ha sites were chosenthroughout GMF on the basis of adult tree composition:three were in locations dominated by red oak, two werein locations dominated by sugar maple, two were inlocations dominated by eastern hemlock, and two werein mixed red maple and black cherry stands. All siteswere located in continuous habitats $100 m from anyroads or edges, the minimum distance between the siteswas 200 m, and most sites were $1 km apart. Thesesites included the most common mixtures of canopytree species and understory structure at GMF.
Small-mammal live trapping
A 9 3 9 small-mammal live-trapping grid with 12.5-m spacing between stations was established coveringeach 1-ha site. Live trapping was conducted for threeconsecutive days, four times from June to Novemberin 1995, and three times from June to November in1996. We used large folding Sherman live traps (8 39 3 23 cm; Sherman Traps, Tallahassee, Florida, USA)baited with crimped oats and, in November,supplied with cotton bedding. Traps were opened at;1700 hours and were checked and closed beginningat 0700 hours daily. Captured small mammals wereidentified to species, given a numbered ear tag (Monelfingerling tags, #1 size; National Band and Tag Com-pany, Newport, Kentucky, USA), weighed, checked forreproductive condition, and released at the point ofcapture. Total numbers of captures of each genus foreach trapping location were used in these analyses toreflect activity densities.
Canopy tree and understory neighborhoods
We mapped all adult trees (stems . 10 cm dbh)within each 1-ha site. Because the average crown radiusof the major tree species at GMF ranges from 4.5 to6.5 m (Canham et al. 1994) and most seed dispersaloccurs within 10 m of an adult (Ribbens et al. 1994),we defined the neighborhood surrounding each live-trapping location to be the area within a 10 m radiusof the trap. For trap stations located on the outer edge,the neighborhood only included those trees within themapped hectare. The total basal area of each tree spe-cies within the 10 m radius neighborhood for each traplocation at every site (N 5 729) was used in a principalcomponents analysis (PCA) to describe the variationin canopy tree neighborhoods in the study area.
We characterized understory neighborhoods withineach 12.5 3 12.5-m quadrat defined by trapping lo-
cations. We estimated the percent cover of fern, her-baceous vegetation, woody vegetation, woody debris(such as fallen logs), and exposed rock, each to thenearest 10%. The values for quadrats surrounding eachtrap station (four for most locations; fewer quadratswere used for edge trap locations) were averaged andanalyzed using PCA.
Seed removal and seedling recruitment
Seed removal trials were conducted in randomly lo-cated 1 3 1-m quadrats during the fall of 1995 (ninequadrats per site) and 1996 (15 quadrats per site). With-in each quadrat, we chose 25 random points separatedby $10 cm. These 25 points were then randomly as-signed one of five different tree seeds: red oak, blackcherry, sugar maple, red maple, or white pine. The fivelocations for each tree seed were marked with a 15-cmwooden coffee stirrer (the top 0.5 cm was colored toidentify seed species), and a single seed was placeddirectly on the ground at the base of the stirrer. Latexgloves were worn while handling the coffee stirrersand seeds to avoid scent contamination. Seeds werechecked daily for three days, after which the total num-ber of seeds surviving was recorded. Separate trialsdemonstrated that seed removal rates saturated veryquickly (usually within three days). As time pro-gressed, direct visual evidence of predation (such asseed coat fragments) disappeared. Most seed removalin these forests is from small mammals; bird and insectremoval is insignificant (Ostfeld et al. 1994).
To correlate seed survival with seedling recruitment,the total numbers of newly germinated seedlings werecounted in the spring of 1997 from the 1996 seed re-moval quadrats. Few seedlings occurred near the seedmarkers, indicating that most newly recruited seedlingswere from natural seed rain and not from our experi-mental seeds. We estimated seed rain within each ofthe 1996 seed removal quadrats by estimating the av-erage number of seeds produced by all trees in thesurrounding neighborhood, using the data from Schnurret al. (2002).
Data analyses
To identify relationships among small-mammal cap-tures, seed survival, seed rain, and seedling recruit-ment, we used the values for the first PCA axis for boththe canopy tree and understory neighborhoods as in-dependent variables in all analyses (canopy tree neigh-borhood explained 18.8% of the variation, and under-story neighborhood explained 26.1%; see Results forfurther explanation). Because the dependent variableswere all count data and displayed nonlinear trends, weused nonlinear Poisson regression to fit an equation ofthe form Y 5 AB . We chose this equation because2(X2C)
it has a flexible shape and the parameters are easy tointerpret: A is the curve height, B determines the curvewidth, and C is the mode. We used simulated annealing(a global optimization procedure) to find the parameter

744 JACLYN L. SCHNURR ET AL. Ecology, Vol. 85, No. 3
estimates for A, B, and C that maximized the likelihoodof observing the data set (Goffe et al. 1994, Hilbornand Mangel 1997). The global optimization procedurewas performed using software written in the Delphiprogramming environment (Borland Software 2001).
We used the nonlinear Poisson regression to estimateparameters for the small-mammal captures and seedsurvival data in 1995, and for small-mammal captures,seed survival, seed rain, and seedling recruitment in1996. For the small-mammal data, the value of param-eter A is the highest average capture rate. B is a measureof habitat breadth, ranging from 0, if captures were allin one habitat type, to 1, if the average capture rate didnot vary across the PCA axis. C indicates the positionalong the axis at which the capture rate was highest.For seed survival, A is the maximum number of seedssurviving (with the maximum possible being 25 seeds);B is the size of the area where seeds survived; and Cis the habitat where survival was greatest. The param-eters for seed rain and seedling recruitment are similarto the seed survival values, except that there is no upperlimit on A.
We used likelihood ratio tests to test hypothesesabout differences among the Poisson regression modelsand to construct 95% asymptotic support intervals forparameter estimates (Hilborn and Mangel 1997). Inparticular, the likelihood ratio test for whether the pa-rameter B was significantly less than a fixed value of1 was used to test the hypothesis that there was sig-nificant variation in the response variable (mammalcapture rate, seed survival, seed rain, or seedling es-tablishment) along each axis. This is a direct test ofthe significance of the relationship between the ordi-nation axis and a particular response variable (i.e., thatthe relationship differs from a flat line). There is nodirect analogue to an R2 statistic for goodness of fit ofPoisson regression because the variance is equal to themean for Poisson-distributed data. Thus, the relation-ship between observed and expected for a given dataset is a unique function of the range of expected valuesin the data set, and the expected scatter in the residualsincreases necessarily as the expected values increase.
We examined the distribution of body mass of cap-tured animals to test whether variation between yearsin the distribution of small mammals among neigh-borhoods was associated with changing body condi-tion. We divided both the canopy tree and understoryPCA ordination axes into lower, middle, and upper sec-tions and determined the average mass of captured an-imals for each area. We used ANOVA and Bonferronipairwise comparisons to compare values among areasof the axis, using SYSTAT version 8 (Wilkinson 1998).
RESULTS
Canopy tree and understory neighborhoods
Principal components analysis identified three fac-tors that explained ;50% of the variation in the canopy
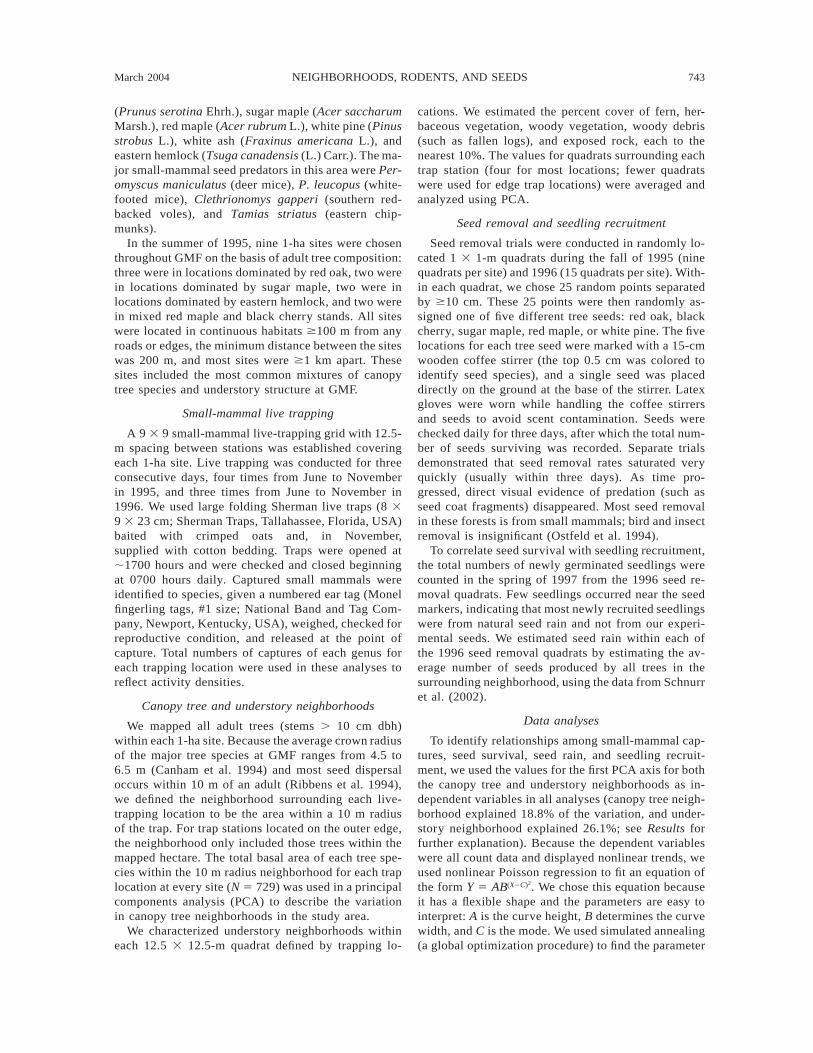
tree neighborhoods (Appendix A). Although these threefactors were nearly equivalent statistically, which isunusual in analyses of this type, we choose to concen-trate our analysis on the first factor. This factor dis-criminated between neighborhoods dominated by sugarmaple and white ash on the left (negative) side of theaxis, black cherry and red maple in the center of theaxis, and red oak and beech on the right (positive) side(Fig. 1A). Other studies at Great Mountain Forest haveshown that this axis reflects responses of the dominanttree species to fine-scale spatial variation in soil fer-tility, particularly the availability of calcium and otherbase cations (van Breemen et al. 1997, Bigelow andCanham 2002). We confined our analyses to the firstfactor for several reasons: (1) this factor was readilyinterpretable and ecologically meaningful; (2) this fac-tor consistently displayed significant relationships be-tween variables, whereas the analyses involving factors2 and 3 had many nonsignificant regressions; and (3)this factor displayed variation shown to be importantfor other forest processes at GMF (van Breemen et al.1997, Bigelow and Canham 2002).
Principal components analysis identified three fac-tors that explained ;75% of the variation in understoryneighborhoods, although again the three axes werenearly equivalent (Appendix B). We again chose to useonly the first factor in our analyses because it was easilyinterpretable and displayed consistently significant re-lationships. This factor ranged from high amounts ofwoody debris on the negative side of the axis to highamounts of herbaceous vegetation on the positive side.The middle portion of the axis was a ‘‘mixed’’ under-story habitat with high amounts of fern and woodyvegetation (Fig. 1B).
Canopy tree and understory neighborhoods werelargely independent of each other (correlation betweenthe ordination scores for the first axes of the two PCAs5 0.056, P 5 0.13). Examination of contour plots dem-onstrated that a wide range of understory neighbor-hoods occurred in each canopy tree neighborhood type(data not shown).
Seed rain
Total seed rain varied significantly among the threeyears (Schnurr et al. 2002). In 1994, seed rain was highfor all species, including a moderate red oak crop of;12 acorns/m2. We observed a near-total seed cropfailure in 1995 across all species. Subsequently, mostspecies produced seed in 1996, with the notable ex-ception of red oak.
The estimated 1996 seed rain was greatest in themixed canopy tree neighborhoods, primarily becauseof a large seed crop by red maple, which had its greatestabundance in those neighborhoods (Figs. 1 and 2A).Seed rain by other tree species was similar across allcanopy tree neighborhoods (Fig. 2A). Total seed rainand red maple seed rain across the understory neigh-
March 2004 745NEIGHBORHOODS, RODENTS, AND SEEDS
FIG. 1. (A) Basal area of tree species plotted against the first factor identified by the principal components analysis (PCA)of canopy trees. Note that the negative side of the axis is dominated by sugar maple and white ash, the middle is mixed,and the positive side is dominated by red oak and beech neighborhoods. (B) Percent cover of understory components plottedagainst the first factor identified by the understory PCA. Note that the negative side of the axis is dominated by woodydebris, the middle is mixed, and the positive side is dominated by herbaceous vegetation neighborhoods.
borhoods was also greatest in mixed areas, but seedrain by other tree species was greatest in understoryneighborhoods dominated by herbaceous vegetation(Fig. 2B). For the means and 95% support intervals forthe parameter estimates for the curves in Figs. 2 and4–6, see Appendix C.
Small-mammal distribution and abundance
1995, following a red oak mast in 1994.—In 1995,small-mammal population sizes were high, apparentlyin response to the red oak mast of 1994 (Schnurr et al.
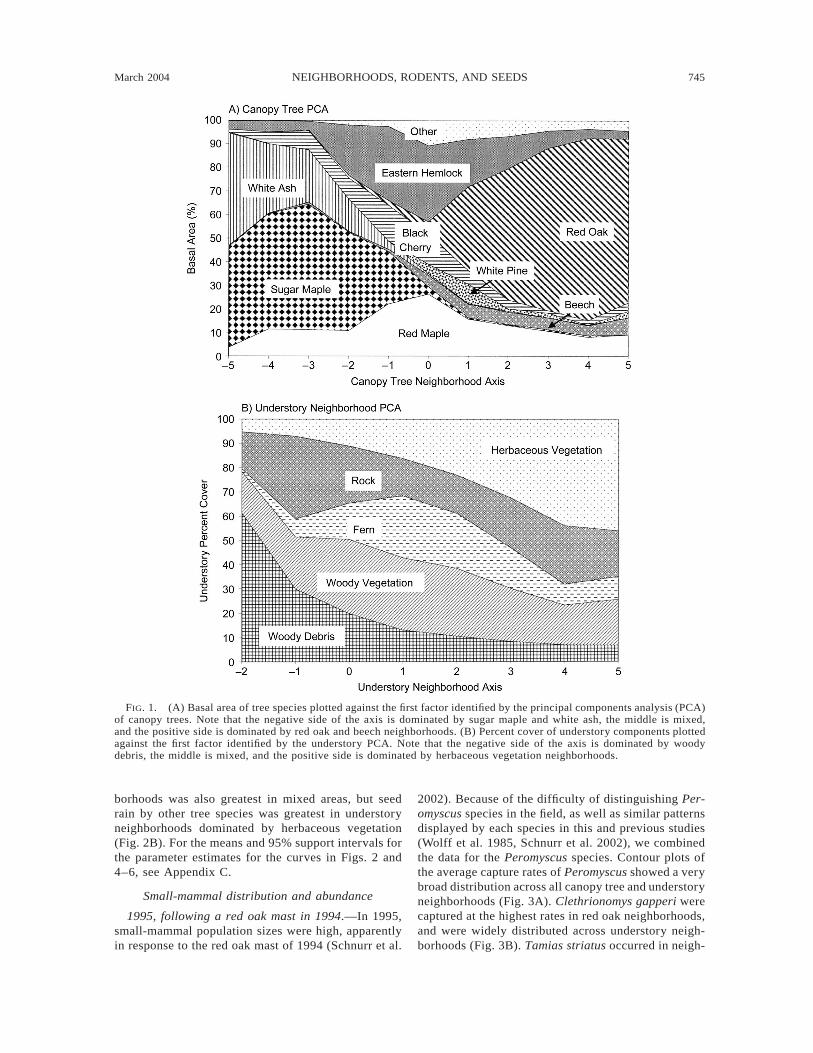
2002). Because of the difficulty of distinguishing Per-omyscus species in the field, as well as similar patternsdisplayed by each species in this and previous studies(Wolff et al. 1985, Schnurr et al. 2002), we combinedthe data for the Peromyscus species. Contour plots ofthe average capture rates of Peromyscus showed a verybroad distribution across all canopy tree and understoryneighborhoods (Fig. 3A). Clethrionomys gapperi werecaptured at the highest rates in red oak neighborhoods,and were widely distributed across understory neigh-borhoods (Fig. 3B). Tamias striatus occurred in neigh-

746 JACLYN L. SCHNURR ET AL. Ecology, Vol. 85, No. 3
FIG. 2. Estimated 1996 seed rain across the neighborhood axes. The major PCA neighborhood type is identified to aidin interpretation. Note that the total seed rain contains seed rain by both red maple and other species. (A) Estimated seedrain across the canopy tree neighborhood axis; (B) estimated seed rain across the understory neighborhood axis.
borhoods similar to those where C. gapperi were cap-tured (Fig. 3C).
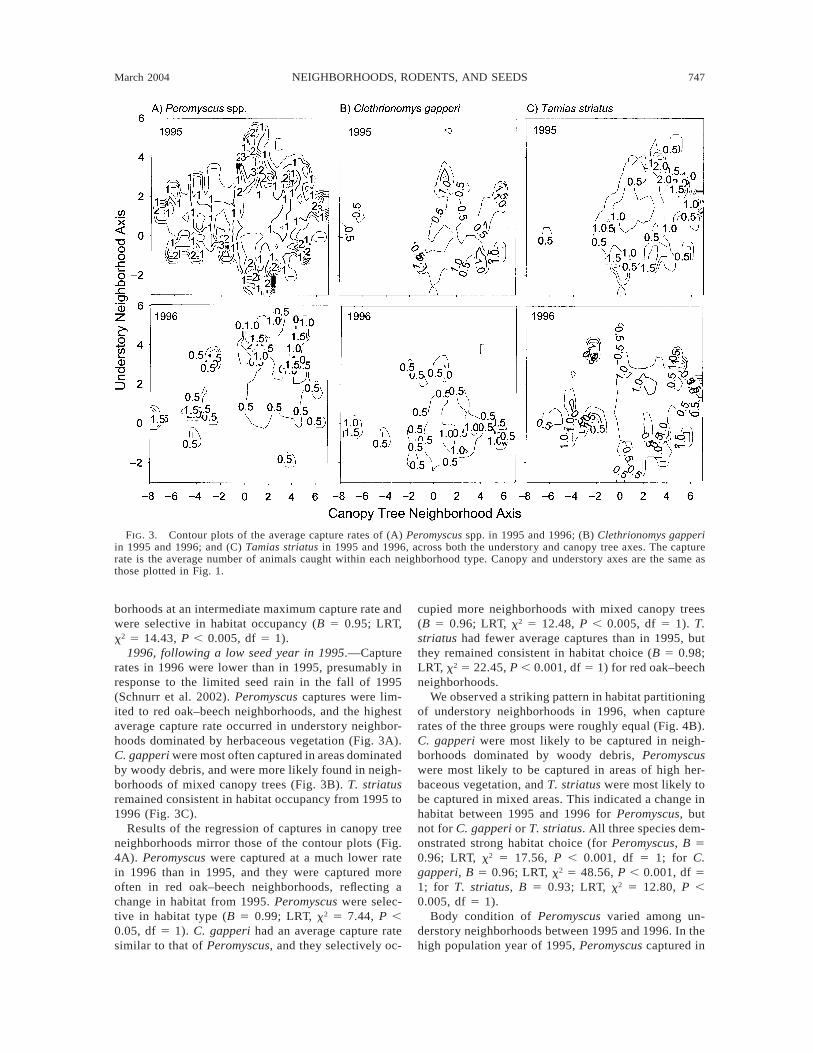
Peromyscus had the highest predicted capture rateacross the entire canopy tree neighborhood axis (Fig.4A), with the greatest number of captures occurring inthe mixed red maple–black cherry neighborhoods. Al-though the estimated curve for Peromyscus is shallow(B 5 0.98), a likelihood ratio test (LRT) indicated thatit was significantly different from a flat line, i.e., com-pared to a model with B 5 1 (LRT, x2 5 7.961, P ,0.005, df 5 1). C. gapperi and T. striatus were mostoften captured in the red oak neighborhoods, althoughC. gapperi were captured at a much lower rate than T.striatus. Both C. gapperi and T. striatus had B values thatwere significantly different from 1 (for C. gapperi, B 5
0.97; LRT, x2 5 17.34, P , 0.001, df 5 1; for T. striatus,B 5 0.96; LRT, x2 5 45.68, P , 0.001, df 5 1).
Understory regression results were also consistentwith the contour plots (Fig. 4B). In 1995, Peromyscuswere captured at high rates across all understory neigh-borhoods, and the mode of the captures occurred inneighborhoods dominated by woody debris. Again, al-though the line was only slightly curved (B 5 0.99),the likelihood ratio test indicated a significant differ-ence from a horizontal line (LRT, x2 5 13.71, P ,0.005, df 5 1). C. gapperi were captured at a lowmaximum rate in areas dominated by woody debris,and were selective in their habitat occupancy (B 5 0.98;LRT, x2 5 9.27, P , 0.005, df 5 1). T. striatus weremore likely to be captured in mixed-understory neigh-
March 2004 747NEIGHBORHOODS, RODENTS, AND SEEDS
FIG. 3. Contour plots of the average capture rates of (A) Peromyscus spp. in 1995 and 1996; (B) Clethrionomys gapperiin 1995 and 1996; and (C) Tamias striatus in 1995 and 1996, across both the understory and canopy tree axes. The capturerate is the average number of animals caught within each neighborhood type. Canopy and understory axes are the same asthose plotted in Fig. 1.
borhoods at an intermediate maximum capture rate andwere selective in habitat occupancy (B 5 0.95; LRT,x2 5 14.43, P , 0.005, df 5 1).
1996, following a low seed year in 1995.—Capturerates in 1996 were lower than in 1995, presumably inresponse to the limited seed rain in the fall of 1995(Schnurr et al. 2002). Peromyscus captures were lim-ited to red oak–beech neighborhoods, and the highestaverage capture rate occurred in understory neighbor-hoods dominated by herbaceous vegetation (Fig. 3A).C. gapperi were most often captured in areas dominatedby woody debris, and were more likely found in neigh-borhoods of mixed canopy trees (Fig. 3B). T. striatusremained consistent in habitat occupancy from 1995 to1996 (Fig. 3C).
Results of the regression of captures in canopy treeneighborhoods mirror those of the contour plots (Fig.4A). Peromyscus were captured at a much lower ratein 1996 than in 1995, and they were captured moreoften in red oak–beech neighborhoods, reflecting achange in habitat from 1995. Peromyscus were selec-tive in habitat type (B 5 0.99; LRT, x2 5 7.44, P ,0.05, df 5 1). C. gapperi had an average capture ratesimilar to that of Peromyscus, and they selectively oc-
cupied more neighborhoods with mixed canopy trees(B 5 0.96; LRT, x2 5 12.48, P , 0.005, df 5 1). T.striatus had fewer average captures than in 1995, butthey remained consistent in habitat choice (B 5 0.98;LRT, x2 5 22.45, P , 0.001, df 5 1) for red oak–beechneighborhoods.
We observed a striking pattern in habitat partitioningof understory neighborhoods in 1996, when capturerates of the three groups were roughly equal (Fig. 4B).C. gapperi were most likely to be captured in neigh-borhoods dominated by woody debris, Peromyscuswere most likely to be captured in areas of high her-baceous vegetation, and T. striatus were most likely tobe captured in mixed areas. This indicated a change inhabitat between 1995 and 1996 for Peromyscus, butnot for C. gapperi or T. striatus. All three species dem-onstrated strong habitat choice (for Peromyscus, B 50.96; LRT, x2 5 17.56, P , 0.001, df 5 1; for C.gapperi, B 5 0.96; LRT, x2 5 48.56, P , 0.001, df 51; for T. striatus, B 5 0.93; LRT, x2 5 12.80, P ,0.005, df 5 1).
Body condition of Peromyscus varied among un-derstory neighborhoods between 1995 and 1996. In thehigh population year of 1995, Peromyscus captured in

748 JACLYN L. SCHNURR ET AL. Ecology, Vol. 85, No. 3
FIG. 4. Likelihood of capture for the three major small-mammal species based on (A) canopy tree neighborhood and (B)understory neighborhood for 1995 and 1996. Note the different scale on the y-axis between the two years, which reflectshigher abundances in 1995.
neighborhoods dominated by woody debris were sig-nificantly smaller (mass 18.2 6 0.3 g; mean 6 1 SE)than animals captured in areas dominated by herba-ceous vegetation (mass 20.0 6 0.5 g; F 5 4.713, P 50.009, df 5 2,616). In 1996, Peromyscus body massvalues were equal across all subsampled sections; how-ever, values in 1996 were significantly higher than in1995 (mass 21.5 6 0.5 g; F 5 19.095, P , 0.001, df5 1,616). There were no significant mass differencesacross canopy tree neighborhoods.
Seed removal
Canopy tree neighborhoods.—Seed survival waslower in 1995 than in 1996, most likely due to the largepopulations of Peromyscus in 1995. In 1995, red oak–beech neighborhoods had the largest number of seedsremaining of any canopy tree neighborhood. Althoughthe line was only slightly curved (B 5 0.98), it was asignificantly better fit to the data than a horizontal line(LRT, x2 5 38.19, P , 0.001, df 5 1). Sugar mapleneighborhoods had the greatest seed survival in 1996,and seed survival was much higher than in 1995. Again,there was a significant curve to the regression line (B5 0.99; LRT, x2 5 39.80, P , 0.05, df 5 1).
In 1995, removal of different species of seeds variedamong neighborhood types (Fig. 5A). Red oak acornsconsistently had the lowest survival overall, althoughthey had significantly higher survival rates in the red
oak neighborhoods (B 5 0.98; LRT, x2 5 5.134, P 50.01, df 5 1). Sugar maple and white pine seeds ex-perienced significantly higher survival when in mixedneighborhoods (for sugar maple, B 5 0.95; LRT, x2 54.74, P 5 0.02, df 5 1; for white pine, B 5 0.97, LRT,x2 5 2.02, P 5 0.045, df 5 1). Seeds of black cherry(B 5 0.99; LRT, x2 5 1.6, P 5 0.065, df 5 1) and redmaple (B 5 0.98; LRT, x2 5 1.12, P 5 0.07, df 5 1)displayed marginally nonsignificant variation in sur-vival across canopy tree neighborhoods.
In 1996, all seed species displayed a similar trendacross canopy tree neighborhoods (Fig. 5A). Sugar ma-ple neighborhoods had significantly higher survivalrates (LRT for all seed species, x2 . 2.5, P , 0.05, df5 1), and red oak neighborhoods had the lowest. Whitepine seeds had the lowest survival of all species.
Understory microhabitat neighborhoods.—In 1995,overall rates of seed removal did not vary significantlyas a function of understory neighborhood (B 5 1.0;LRT, x2 5 0.821, P 5 0.25, df 5 1). Seed survival in1996 was highest in a small range of understory neigh-borhoods (B 5 0.86; LRT, x2 5 86.0, P , 0.001, df 51). The lowest seed survival occurred in the areas whereC. gapperi and Peromyscus were most active, i.e., inareas dominated by woody debris and herbaceous veg-etation. The highest seed survival occurred in the in-terstitial area between those supporting the maximumcapture rates of T. striatus and Peromyscus.

March 2004 749NEIGHBORHOODS, RODENTS, AND SEEDS
FIG. 5. Species-specific seed survival along the (A) canopy tree neighborhood axis and (B) understory neighborhood axisfor 1995 and 1996. Note the different scales on the y-axes, reflecting higher seed survival in 1996.
Survival patterns of individual species of seeds var-ied between 1995 and 1996 in understory neighbor-hoods (Fig. 5B). In 1995, red oak acorns experiencedequal survival across all neighborhoods (B 5 0.98;LRT, x2 5 0.79, P 5 0.36, df 5 1), as did red mapleseeds (B 5 0.99; LRT, x2 5 0.63, P 5 0.44, df 5 1),black cherry seeds (B 5 1; LRT, x2 5 0.891, P 5 0.25,df 5 1), and sugar maple seeds (B 5 1; LRT, x2 5 0,P 5 1, df 5 1). More white pine seeds survived (B 50.96; LRT, x2 5 2.47, P 5 0.03, df 5 1) in the mixedunderstory neighborhoods. In 1996, all species dis-played a similar pattern, with significantly increasedsurvival (LRT for all species, x2 . 1.92, P , 0.05, df5 1) in mixed understory neighborhoods.
Seedling establishment
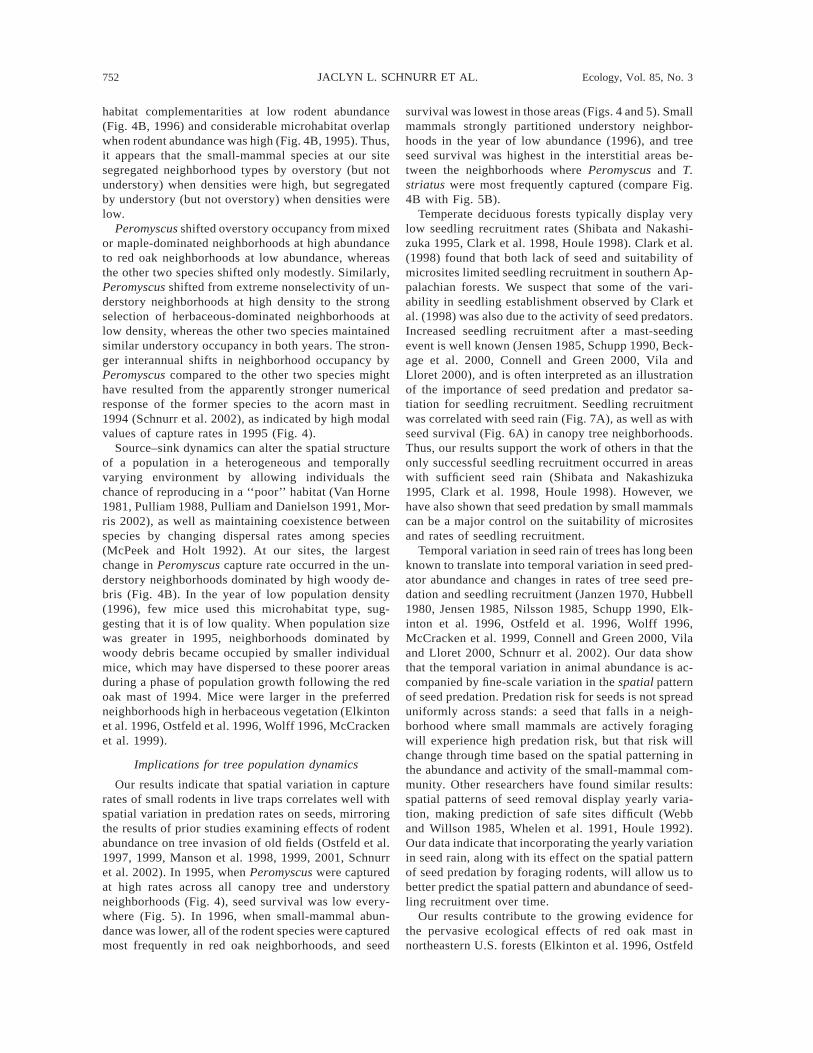
Canopy tree neighborhoods.—Seedling establish-ment was greatest in canopy tree neighborhoods whereseed production and seed survival were both favorable(Figs. 2A and 6A). The maximum number of seedlingsof all species occurred in the sugar maple neighbor-hoods (Fig. 6A). Red maple seedlings were the mostnumerous of the new germinants, and had maximumrecruitment nearer to neighborhoods of the mixed can-opy trees, where red maple was a canopy dominant,than did seedlings of other species (Fig. 6A).
To assess the correlation between seed rain and seed-ling establishment, we plotted the proportion of seedsthat germinated as a function of the canopy tree neigh-borhoods. If seed rain were solely responsible for seed-ling emergence, the proportion of seeds that germinatedshould be constant. A greater proportion of the totalseed rain germinated in the sugar maple neighborhoodtypes (Fig. 7AI), as did a greater proportion of speciesother than red maple (Fig. 7AIII). Red maple seedlingestablishment was lowest in the areas of highest redmaple seed production (Figs. 2A and 7AII).
Understory microhabitat neighborhoods.—Totalseedling recruitment (across all species) was not high-est in understory neighborhoods that had the greatestoverall seed survival in our seed removal trials (Fig.6B). Although seed survival was highest in the areasdominated by herbaceous vegetation, total seedling re-cruitment was greatest in areas dominated by woodydebris. Similarly, red maple seedling recruitment wasgreatest in neighborhoods dominated by woody debris.However, the greatest recruitment of species other thanred maple occurred in neighborhoods with the mostherbaceous vegetation, which was also where the great-est seed survival occurred.
The proportion of seeds that germinated in differentunderstory neighborhoods was not as easily interpret-

750 JACLYN L. SCHNURR ET AL. Ecology, Vol. 85, No. 3
FIG. 6. Upper panels: Seedling recruitment of all species and seed survival in the previous fall along the (A) canopy treeneighborhood axis and (B) understory neighborhood axis. Lower panels: Recruitment separated into red maple seedlings andseedlings of other species along the (A) canopy tree neighborhood axis and (B) understory neighborhood axis.
able as in the canopy tree neighborhoods (Fig. 7B). Aconsistent, low proportion of the total and red mapleseed rain germinated across all understory neighbor-hoods. However, both total seeds and red maple seedsshowed a slight trend for an increase in the proportionthat germinated in the neighborhoods dominated bywoody debris. The proportion of other seeds that ger-minated was highest in the mixed-understory neigh-borhoods.
DISCUSSION
We found that the distribution and activity of a guildof small mammals was predictable on the basis of thedistribution of canopy trees in neighborhoods (;100–200 m2 areas) that represent both individual adult treecanopies and small-mammal home ranges. The distri-bution of the granivorous small mammals, in turn, wasa good predictor of the intensity of predation on ex-perimentally introduced seeds. Neighborhoods inwhich seed predation was lowest were characterizedby the highest natural rates of seedling recruitment. Ifthe seedling recruitment signal persists into the saplingand adult tree stages, then canopy trees would appearto be influencing their own neighborhood-specific pop-
ulation dynamics indirectly via their impacts on seedpredators. Our study encompassed a year of light seedproduction and a year of heavy seed production, andwe correlated this variation with the population sizesof rodent seed predators. In addition, small-mammalspecies responded differently to: (1) species-specifictree seed production, and (2) neighborhoods charac-terized by canopy trees vs. those characterized by un-derstory features. These complexities, which both en-rich and complicate the interpretation of our results,will be discussed.
Neighborhood analyses of the distribution andactivity of small mammals
Much attention has been devoted to describing pat-terns of small-mammal abundance and distribution asa function of habitat variables in deciduous forests ofeastern North America. The earliest studies of this typelooked at coarse-scale aspects of the environment, suchas correlating vegetation type and density with capturelocations (M’Closkey and LaJoie 1975, Miller and Getz1977). We selected the neighborhood level of analysisa priori because we expected that heterogeneity at thescale of tens of meters would be representative of both

March 2004 751NEIGHBORHOODS, RODENTS, AND SEEDS
FIG. 7. The proportion of seeds that germinated across the (A) canopy tree neighborhood axis and (B) understoryneighborhood axis for (I) all species, (II) only red maple, and (III) only other species.
local tree seed inputs (a critical food resource) andindividual small-mammal home ranges. In our analy-ses, conducted over years of high and low mammalabundance, we incorporated both the more traditionalunderstory habitat features (e.g., Kitchings and Levy1981, Vickery 1981, Yahner 1982, Parren and Capen1985, Seagle 1985) and the neglected overstory habitatfeatures. To incorporate suspected nonlinear relation-ships between small mammals and neighborhood com-position, we developed a new nonlinear Poisson re-gression approach, which, combined with maximumlikelihood statistics, allowed us to quantify and visu-alize activity densities.
We found that small-mammal responses to overstoryand understory composition were dramatically differ-ent. In the year of low rodent abundance (1996), muchoverlap occurred among all three groups (Peromyscusspp., Clethrionomys gapperi, and Tamias striatus) inneighborhoods dominated by red oak overstory. How-ever, in the year of high rodent abundance (1995), Per-omyscus was captured most frequently in mixed neigh-borhoods or those dominated by sugar maple, whereasthe other two species maintained their occupancy ofoak-dominated neighborhoods. This pattern is inmarked contrast to our analyses of understory neigh-borhoods, which demonstrated almost perfect micro-
752 JACLYN L. SCHNURR ET AL. Ecology, Vol. 85, No. 3
habitat complementarities at low rodent abundance(Fig. 4B, 1996) and considerable microhabitat overlapwhen rodent abundance was high (Fig. 4B, 1995). Thus,it appears that the small-mammal species at our sitesegregated neighborhood types by overstory (but notunderstory) when densities were high, but segregatedby understory (but not overstory) when densities werelow.
Peromyscus shifted overstory occupancy from mixedor maple-dominated neighborhoods at high abundanceto red oak neighborhoods at low abundance, whereasthe other two species shifted only modestly. Similarly,Peromyscus shifted from extreme nonselectivity of un-derstory neighborhoods at high density to the strongselection of herbaceous-dominated neighborhoods atlow density, whereas the other two species maintainedsimilar understory occupancy in both years. The stron-ger interannual shifts in neighborhood occupancy byPeromyscus compared to the other two species mighthave resulted from the apparently stronger numericalresponse of the former species to the acorn mast in1994 (Schnurr et al. 2002), as indicated by high modalvalues of capture rates in 1995 (Fig. 4).
Source–sink dynamics can alter the spatial structureof a population in a heterogeneous and temporallyvarying environment by allowing individuals thechance of reproducing in a ‘‘poor’’ habitat (Van Horne1981, Pulliam 1988, Pulliam and Danielson 1991, Mor-ris 2002), as well as maintaining coexistence betweenspecies by changing dispersal rates among species(McPeek and Holt 1992). At our sites, the largestchange in Peromyscus capture rate occurred in the un-derstory neighborhoods dominated by high woody de-bris (Fig. 4B). In the year of low population density(1996), few mice used this microhabitat type, sug-gesting that it is of low quality. When population sizewas greater in 1995, neighborhoods dominated bywoody debris became occupied by smaller individualmice, which may have dispersed to these poorer areasduring a phase of population growth following the redoak mast of 1994. Mice were larger in the preferredneighborhoods high in herbaceous vegetation (Elkintonet al. 1996, Ostfeld et al. 1996, Wolff 1996, McCrackenet al. 1999).
Implications for tree population dynamics
Our results indicate that spatial variation in capturerates of small rodents in live traps correlates well withspatial variation in predation rates on seeds, mirroringthe results of prior studies examining effects of rodentabundance on tree invasion of old fields (Ostfeld et al.1997, 1999, Manson et al. 1998, 1999, 2001, Schnurret al. 2002). In 1995, when Peromyscus were capturedat high rates across all canopy tree and understoryneighborhoods (Fig. 4), seed survival was low every-where (Fig. 5). In 1996, when small-mammal abun-dance was lower, all of the rodent species were capturedmost frequently in red oak neighborhoods, and seed
survival was lowest in those areas (Figs. 4 and 5). Smallmammals strongly partitioned understory neighbor-hoods in the year of low abundance (1996), and treeseed survival was highest in the interstitial areas be-tween the neighborhoods where Peromyscus and T.striatus were most frequently captured (compare Fig.4B with Fig. 5B).
Temperate deciduous forests typically display verylow seedling recruitment rates (Shibata and Nakashi-zuka 1995, Clark et al. 1998, Houle 1998). Clark et al.(1998) found that both lack of seed and suitability ofmicrosites limited seedling recruitment in southern Ap-palachian forests. We suspect that some of the vari-ability in seedling establishment observed by Clark etal. (1998) was also due to the activity of seed predators.Increased seedling recruitment after a mast-seedingevent is well known (Jensen 1985, Schupp 1990, Beck-age et al. 2000, Connell and Green 2000, Vila andLloret 2000), and is often interpreted as an illustrationof the importance of seed predation and predator sa-tiation for seedling recruitment. Seedling recruitmentwas correlated with seed rain (Fig. 7A), as well as withseed survival (Fig. 6A) in canopy tree neighborhoods.Thus, our results support the work of others in that theonly successful seedling recruitment occurred in areaswith sufficient seed rain (Shibata and Nakashizuka1995, Clark et al. 1998, Houle 1998). However, wehave also shown that seed predation by small mammalscan be a major control on the suitability of micrositesand rates of seedling recruitment.
Temporal variation in seed rain of trees has long beenknown to translate into temporal variation in seed pred-ator abundance and changes in rates of tree seed pre-dation and seedling recruitment (Janzen 1970, Hubbell1980, Jensen 1985, Nilsson 1985, Schupp 1990, Elk-inton et al. 1996, Ostfeld et al. 1996, Wolff 1996,McCracken et al. 1999, Connell and Green 2000, Vilaand Lloret 2000, Schnurr et al. 2002). Our data showthat the temporal variation in animal abundance is ac-companied by fine-scale variation in the spatial patternof seed predation. Predation risk for seeds is not spreaduniformly across stands: a seed that falls in a neigh-borhood where small mammals are actively foragingwill experience high predation risk, but that risk willchange through time based on the spatial patterning inthe abundance and activity of the small-mammal com-munity. Other researchers have found similar results:spatial patterns of seed removal display yearly varia-tion, making prediction of safe sites difficult (Webband Willson 1985, Whelen et al. 1991, Houle 1992).Our data indicate that incorporating the yearly variationin seed rain, along with its effect on the spatial patternof seed predation by foraging rodents, will allow us tobetter predict the spatial pattern and abundance of seed-ling recruitment over time.
Our results contribute to the growing evidence forthe pervasive ecological effects of red oak mast innortheastern U.S. forests (Elkinton et al. 1996, Ostfeld

March 2004 753NEIGHBORHOODS, RODENTS, AND SEEDS
et al. 1996, Wolff 1996, McCracken et al. 1999, Schnurret al. 2002, Schmidt and Ostfeld 2003). Mast yearsproduce subsequent increases in Peromyscus numbersand distribution across canopy and understory neigh-borhoods, decreasing seed survival in all neighbor-hoods (Fig. 5). Tree species that produce seeds in ahigh mouse year (i.e., the year following a mast crop)will experience high rates of seed predation (Schnurret al. 2002) that will decrease seedling recruitment.Mouse abundance typically declines in years followinglow acorn abundance (Schnurr et al. 2002), and ourresults indicate that mouse distribution and activity be-come concentrated in red oak neighborhoods. Thisshould result in higher seed survival and seedling es-tablishment for species that produce seed in a year withlow Peromyscus numbers, but the rates of seedling es-tablishment should still vary among canopy tree andunderstory neighborhoods.
Our results suggest that there is an ‘‘associationalrisk’’ for trees of species other than red oak that occurin neighborhoods dominated by red oak: throughoutthe mast cycle, their seeds should experience higherseed predation and lower probability of seedling es-tablishment than seeds produced away from red oaks.Similar ‘‘associational’’ risks have been documentedin seed removal studies, where less-preferred speciesexperience higher removal when found with highly pre-ferred species (Veech 2000; C. D. Canham, unpub-lished data). This result may help to explain the spatialsegregation of red oak and sugar maple neighborhoods:maples present in oak stands will face higher predationrisk, integrated over time, than maples locate awayfrom oaks. Thus, sugar maples may be better able toestablish in sugar maple neighborhoods, whereas redoaks can have increased seedling recruitment in redoak neighborhoods because of increased seed survivaldue to predator satiation after a mast (Janzen 1970,Hubbell 1980, Jensen 1985, Nilsson 1985, Schupp1990, Elkinton et al. 1996, Ostfeld et al. 1996, Wolff1996, McCracken et al. 1999, Connell and Green 2000,Vila and Lloret 2000, Schnurr et al. 2002).
ACKNOWLEDGMENTS
Chris Tripler, Chris Flanagan, and Sue Bookhout providedoutstanding field assistance. We are grateful to the Childsfamily for allowing us to use Great Mountain Forest, and toJodie Bronson for logistical support. We also thank Bridge-port Hydraulic Company for allowing us to use their land.Beverly Collins, Brian Hough, Nancy Huntly, Chris Tripler,Truman Young, and two anonymous reviewers provided help-ful comments on a draft of the manuscript. This research wasfunded by NSF grants DEB-9815390 and DEB-9807115. Thisstudy is a contribution to the program of the Institute ofEcosystem Studies.
LITERATURE CITED
Barnum, S. A., C. J. Manville, J. R. Tester, and W. J. Carmen.1992. Path selection by Peromyscus leucopus in the pres-ence and absence of vegetative cover. Journal of Mam-malogy 73:797–801.
Beckage, B., J. S. Clark, B. D. Clinton, and B. L. Haines.2000. A long-term study of tree seedling recruitment in
southern Appalachian forests: the effects of canopy gapsand shrub understories. Canadian Journal of Forest Re-search 30:1617–1631.
Bigelow, S. W., and C. D. Canham. 2002. Community or-ganization of tree species along soil gradients in a north-eastern USA forest. Journal of Ecology 90:188–200.
Borland Software Corporation. 2001. Delphi 6.0 for Win-dows. Borland Software Corporation, Scott Valley, Cali-fornia, USA.
Buckner, C. A., and D. J. Shure. 1985. The response of Per-omyscus to forest opening size in the southern AppalachianMountains. Journal of Mammalogy 66:299–307.
Canham, C. D. 1989. Different responses to gaps amongshade-tolerant tree species. Ecology 70:548–550.
Canham, C. D., A. C. Finzi, S. W. Pacala, and D. H. Burbank.1994. Causes and consequences of resource heterogeneityin forests: interspecific variation in light transmission bycanopy trees. Canadian Journal of Forest Research 24:337–349.
Clark, J. S., E. Macklin, and L. Wood. 1998. Stages andspatial scales of recruitment limitation in southern Appa-lachian forests. Ecological Monographs 68:213–235.
Connell, J. H., and P. T. Green. 2000. Seedling dynamicsover thirty-two years in a tropical rain forest tree. Ecology81:568–584.
Dueser, R. D., and H. H. Shugart, Jr. 1978. Microhabitats ina forest-floor small mammal fauna. Ecology 59:89–98.
Elkinton, J. S., W. M. Healy, J. P. Buonaccorsi, G. H. Boettner,A. M. Hazzard, H. R. Smith, and A. M. Liebhold. 1996.Interactions among gypsy moths, white-footed mice, andacorns. Ecology 77:2332–2342.
Falkenberg, J. C., and J. A. Clarke. 1998. Microhabitat useof deer mice: effects of interspecific interaction risks. Jour-nal of Mammalogy 79:558–565.
Finzi, A. C., and C. D. Canham. 2000. Sapling growth inresponse to light and nitrogen availability in a southernNew England forest. Forest Ecology and Management 131:153–165.
Finzi, A. C., N. van Breemen, and C. D. Canham 1998a.Canopy tree–soil interactions within mixed species forests:species effects on carbon and nitrogen. Ecological Appli-cations 8:440–446.
Finzi, A. C., N. van Breemen, and C. D. Canham. 1998b.Non-additive effects of litter mixtures on net N-minerali-zation in a southern New England forest. Forest Ecologyand Management 105:129–136.
Fowells, H. A. 1965. Silvics of forest trees of the UnitedStates. USDA Agriculture Handbook Number 271.
Getz, L. L. 1962. Notes on the water balance of the redbackvole. Ecology 43:565–566.
Getz, L. L. 1968. Influence of water balance and microclimateon the local distribution of the redback vole and white-footed mouse. Ecology 49:276–286.
Goffe, W. L., G. D. Ferrier, and J. Rogers. 1994. Globaloptimization of statistical functions with simulated an-nealing. Journal of Econometrics 60:65–99.
Hansson, L. 1985. Clethrionomys food: generic, specific andregional characteristics. Annals Zoologica Fennici 22:315–318.
Hansson, L. 1999. Intraspecific variation in dynamics: smallrodents between food and predation in changing land-scapes. Oikos 86:159–169.
Hilborn, R., and M. Mangel. 1997. The ecological detective:confronting models with data. Monographs in PopulationBiology 28, Princeton University Press, Princeton, NewJersey, USA.
Hoshizaki, K. W. Suzuki, and T. Nakashizuka. 1999. Eval-uation of secondary dispersal in a large-seeded tree Aes-culus turbinata: a test of directed dispersal. Plant Ecology144:167–176.

754 JACLYN L. SCHNURR ET AL. Ecology, Vol. 85, No. 3
Houle, G. 1992. Spatial relationship between seed and seed-ling abundance and mortality in a deciduous forest of north-eastern North America. Journal of Ecology 80:99–108.
Houle, G. 1998. Seed dispersal and seedling recruitment ofBetula alleghaniensis: spatial inconsistency in time. Ecol-ogy 79:807–818.
Hubbell, S. P. 1980. Seed predation and the coexistence oftree species in tropical forests. Oikos 35:214–229.
Hulme, P. E., and M. K. Hunt. 1999. Rodent post-dispersalseed predation in deciduous woodland: predator responseto absolute and relative abundance of prey. Journal of An-imal Ecology 68:417–428.
Janzen, D. H. 1970. Herbivores and the number of tree spe-cies in tropical forests. American Naturalist 104:501–528.
Jensen, T. S. 1985. Seed–seed predator interactions of Eu-ropean beech, Fagus silvatica and forest rodents, Cleth-rionomys glareolus and Apodemus flavicollis. Oikos 44:149–156.
Kaufman, D. W., M. E. Peak, and G. A. Kaufman. 1985.Peromyscus leucopus in riparian woodlands: the use of treesand shrubs. Journal of Mammalogy 66:139–143.
Kitchings, J. T., and D. J. Levy. 1981. Habitat patterns in asmall mammal community. Journal of Mammalogy 62:814–820.
Kollmann, J., and H. P. Schill. 1996. Spatial patterns of dis-persal, seed predation and germination during colonizationof abandoned grassland by Quercus petraea and Corylusavellana. Vegetatio 125:193–205.
Lackey, J. A., D. G. Huckaby, and B. G. Ormiston. 1985.Peromyscus leucopus. Mammalian Species Number 247.American Society of Mammalogists, Lawrence, Kansas,USA.
LePage, P. T., C. D. Canham, K. D. Coates, and P. Bartemucci.2000. Seed source versus substrate limitation of seedlingrecruitment in northern temperate forests of British Colum-bia. Canadian Journal of Forest Research 30:415–427.
Loeb, S. C. 1999. Responses of small mammals to coarsewoody debris in a southeastern pine forest. Journal of Mam-malogy 80:460–471.
LoGiudice, K., and R. S. Ostfeld. 2002. Interactions betweenmammals and trees: predation on mammal-dispersed seedsand the effect of ambient food. Oecologia 130:420–425.
Longland, W. S., and M. V. Price. 1991. Direct observationsof owls and heteromyid rodents: Can predation risk explainmicrohabitat use? Ecology 72:2261–2273.
Manson, R. H., R. S. Ostfeld, and C. D. Canham. 1998. Theeffects of tree seed and seedling density on predation ratesby rodents in old fields. Ecoscience 5:183–190.
Manson, R. H., R. S. Ostfeld, and C. D. Canham. 1999. Re-sponses of a small mammal community to heterogeneityalong forest–old-field edges. Landscape Ecology 14:355–367.
Manson, R. H., R. S. Ostfeld, and C. D. Canham. 2001. Long-term effects of rodent herbivores on tree invasion dynamicsalong forest–field edges. Ecology 82:3320–3329.
McCracken, K. E., J. W. Witham, and M. L. Hunter, Jr. 1999.Relationships between seed fall of three tree species andPeromyscus leucopus and Clethrionomys gapperi during 10years in an oak–pine forest. Journal of Mammalogy 80:1288–1296.
M’Closkey, R. T., and D. T. LaJoie. 1975. Determinants oflocal distribution and abundance in white-footed mice.Ecology 56:467–472.
McPeek, M. A., and R. D. Holt. 1992. The evolution ofdispersal in spatially and temporally varying environments.American Naturalist 140:1010–1027.
McShea, W. J., and A. B. Gilles. 1992. A comparison of trapsand fluorescent powder to describe foraging for mast byPeromyscus leucopus. Journal of Mammalogy 73:218–222.
Merritt, J. F. 1981. Clethrionomys gapperi. Mammalian Spe-cies Number 146. American Society of Mammalogists,Lawrence, Kansas, USA.
Miller, D. H., and L. L. Getz. 1977. Factors influencing localdistribution and diversity of forest small mammals in NewEngland. Canadian Journal of Zoology 55:806–814.
Morris, D. W. 1984. Patterns and scale of habitat use in twotemperate-zone, small mammal faunas. Canadian Journalof Zoology 62:1540–1547.
Morris, D. W. 1996. Coexistence of specialist and generalistrodents via habitat selection. Ecology 77:2352–2364.
Morris, D. W. 2002. Measuring the Allee effect: positivedensity dependence in small mammals. Ecology 83:14–20.
Nilsson, S. G. 1985. Ecological and evolutionary interactionsbetween reproduction of beech Fagus silvatica and seedeating animals. Oikos 44:157–164.
Ostfeld, R. S., C. G. Jones, and J. O. Wolff. 1996. Of miceand mast: ecological connections in eastern deciduous for-ests. BioScience 46:323–330.
Ostfeld, R. S., N. Lewin, J. Schnurr, C. D. Canham, and S.T. A. Pickett. 1994. The roles of small rodents in creatingpatchy environments. Polish Ecological Studies 20:265–276.
Ostfeld, R. S., R. H. Manson, and C. D. Canham. 1997. Ef-fects of rodents on survival of tree seeds and seedlingsinvading old fields. Ecology 78:1531–1542.
Ostfeld, R. S., R. H. Manson, and C. D. Canham. 1999. In-teractions between meadow voles and white-footed miceat forest–oldfield edges: competition and net effects on treeinvasion of oldfields. Pages 229–247 in W. Barrett and J.D. Peles, editors. Landscape ecology of small mammals.Springer-Verlag, New York, New York, USA.
Pacala, S. W., C. D. Canham, J. Saponara, J. A. Silander, R.K. Kobe, and E. Ribbens. 1996. Forest models defined byfield measurements: estimation, error analysis and dynam-ics. Ecological Monographs 66:1–43.
Pacala, S. W., C. D. Canham, and J. A. Silander. 1993. Forestmodels defined by field measurements: I. The design of anortheastern forest simulator. Canadian Journal of ForestResearch 23:1980–1988.
Parren, S. G. and D. E. Capen. 1985. Local distribution andcoexistence of two species of Peromyscus in Vermont. Jour-nal of Mammalogy 66:36–44.
Perri, L. M., and J. A. Randall. 1999. Behavioral mechanismsof coexistence in sympatric species of desert rodents, Di-podomys ordii and D. merriami. Journal of Mammalogy80:1297–1310.
Pulliam, H. R. 1988. Sources, sinks, and population regu-lation. American Naturalist 132:652–661.
Pulliam, H. R., and B. J. Danielson. 1991. Sources, sinks,and habitat selection: a landscape perspective on populationdynamics. American Naturalist 137:S50–S66.
Ribbens, E., J. A. Silander, Jr., and S. W. Pacala. 1994. Re-cruitment in forests: calibrating models to predict patternsof tree seedling dispersal. Ecology 75:1794–1804.
Schmidt, K. A., and R. S. Ostfeld. 2003. Songbird popula-tions in fluctuating environments: predator responses topulsed resources. Ecology 84:406–415.
Schnurr, J. L., R. S. Ostfeld, and C. D. Canham. 2002. Directand indirect effects of masting on rodent populations andtree seed survival. Oikos 96:402–410.
Schupp, E. W. 1990. Annual variation in seedfall, postdis-persal predation, and recruitment of a neotropical tree.Ecology 71:504–515.
Seagle, S. W. 1985. Patterns of small mammal microhabitatutilization in cedar glade and deciduous forest habitats.Journal of Mammalogy 66:22–35.
Shibata, M., and T. Nakashizuka. 1995. Seed and seedlingdemography of four co-occurring Carpinus species in atemperate deciduous forest. Ecology 76:1099–1108.

March 2004 755NEIGHBORHOODS, RODENTS, AND SEEDS
Snyder, D. P. 1982. Tamias striatus. Mammalian SpeciesNumber 168. American Society of Mammalogists, Lawr-ence, Kansas, USA.
Sork, V. L. 1983. Mammalian seed dispersal of pignut hick-ory during three fruiting seasons. Ecology 64:1049–1056.
Urban, D. L., G. B. Bonan, T. M. Smith, and H. H. Shugart.1991. Spatial applications of gap models. Forest Ecologyand Management 42:95–110.
van Breeman, N., A. C. Finzi, and C. D. Canham. 1997.Canopy tree–soil interactions within temperate forests: ef-fects of fine-scale variation in soil texture and elementalcomposition on species distributions. Canadian Journal ofForest Research 27:1110–1116.
Van Horne, B. 1981. Demography of Peromyscus manicu-latus populations in seral stages of coastal coniferous forestin southeast Alaska. Canadian Journal of Zoology 59:1045–1061.
Veech, J. A. 2000. Predator-mediated interactions among theseeds of desert plants. Oecologia 124:402–407.
Vickery, W. L. 1979. Food consumption and preferences inwild populations of Clethrionomys gapperi and Napaeo-zapus insignis. Canadian Journal of Zoology 57:1536–1542.
Vickery, W. L. 1981. Habitat use by northeastern forest ro-dents. American Midland Naturalist 106:111–118.
Vila, M., and F. Lloret. 2000. Seed dynamics of the mastseeding tussock grass Ampelodesmos mauritanica in Med-iterranean shrublands. Journal of Ecology 88:479–491.
Waters, J. R., and C. J. Zabel. 1998. Abundances of smallmammals in fir forests in northeastern California. Journalof Mammalogy 79:1244–1253.
Webb, S. L., and M. F. Willson. 1985. Spatial heterogeneityin post-dispersal predation on Prunus and Uvularia seeds.Oecologia 67:150–153.
Whelan, C. J., M. F. Willson, C. A. Tuma, and I. Souza-Pinto.1991. Spatial and temporal patterns of postdisperal seedpredation. Canadian Journal of Botany 69:428–436.
Wilkinson, L. 1998. SYSTAT. Version 8. SPSS, Chicago,Illinois, USA.
Wolff, J. O. 1996. Population fluctuations of mast-eating ro-dents are correlated with the production of acorns. Journalof Mammalogy 77:850–856.
Wolff, J. O., R. D. Dueser, and K. S. Berry. 1985. Food habitsof sympatric Peromyscus leucopus and Peromyscus mani-culatus. Journal of Mammalogy 66:795–798.
Yahner, R. H. 1982. Microhabitat use by small mammals infarmstead shelterbelts. Journal of Mammalogy 63:440–445.
APPENDIX A
A table showing principal components factor loadings for the sum of the canopy tree (dbh . 10 cm) basal areas foundwithin a 10-m radius from each trap location is available in ESA’s Electronic Data Archive: Ecological Archives E085-018-A1.
APPENDIX B
A table showing principal components factor loadings for the understory variables based on the average value for the 625m2 surrounding each trap location is available in ESA’s Electronic Data Archive: Ecological Archives E085-018-A2.
APPENDIX C
A table showing maximum likelihood parameter estimates for all estimated curves using the equation Y 5 AB is2(X 2 C)
available in ESA’s Electronic Data Archive: Ecological Archives E085-018-A3.