needham growth investor...
TRANSCRIPT

NEEDHAM GROWTHINVESTOR CONFERENCERoger Shannon – SVP of Finance & CFO
January 18, 2018

2018 © ADTRAN, Inc.G ener al Business
Safe Harbor StatementDuring the course of this meeting, ADTRAN representatives expect to make forward-looking statements, which reflect management’s best judgment, based on factors currently known. However, these statements involve risks and uncertainties, including the successful development and market acceptance of core products, the degree of competition in the market for such products, the product and channel mix, component cost, manufacturing efficiencies, foreign exchange rate variations and other risks detailed in our Annual Report on Form 10-K for the year ended December 31, 2016. These risks and uncertainties could cause actual results to differ materially from those in the forward-looking statements, which may be made during this meeting.
2

© 2015 ADTRAN, Inc. All rights reserved.
STRATEGIC FOCUS
FOR THE PAST THREE DECADES,ADTRAN HAS BEEN ENABLING A FULLY CONNECTED WORLD.

2018 © ADTRAN, Inc.G ener al Business
Corporate Strategic Plan Focus
§ Capitalize and expand our position in enabling Service Providers to:§ Increase competitiveness through advanced broadband speeds/capacity§ Provide ubiquitous broadband availability§ Expand adjacent markets into Cable/MSO broadband access
§ Exploit two distinct and major shifts in the environment1. Evolution of the Service Delivery Platform for scale and service agility2. Expansion of wireless in the network
4
Near Term Focus (0-3 yrs)
Med/Long Term Focus (3+ yrs)

2018 © ADTRAN, Inc.G ener al Business
Market DynamicsOperator Perspective
CompetitivePositioning
Scale and
Agility
BroadbandAvailability
Connect America Fund• $9B to connect 3.6M homes• 6yr build out• 10Mbps/1Mbps
European Commission• Digital agenda Evolution of Service
Delivery Platform• Open source / White box• 70% of AT&T’s network will
be software by 2020
Gigabit speeds & expansion of wireless in the network• Comcast 2Gbps• AT&T Fiber - Gigabit• 5G – 1Gbps up to 500yds
o 2018 commercial launch (Vz)
5
Strategic Plan 0-3yrs
Strategic Plan 3yrs+

2018 © ADTRAN, Inc.G ener al Business
ADTRAN’s Market Focus
ADTRAN
DomesticTier 1
DomesticTier 2
DomesticTier 3
Cable / MSO
Int’l
6
Operator Focus• SDN Transformation• Gigabit Competition• Netflix/Amazon/Google competition
ADTRAN Focus• 10G PON, G.fast, Vectoring, SD-Access, Services
Operator Focus• CAF2 • Cable competition• Rapid follower
ADTRAN Focus• FTTN / Vectoring, PON,
Services
Operator Focus• RoR CAF• Cable competition• Slow SDN adopter
ADTRAN Focus• PON• Subscriber Experience
Operator Focus• SDN Transformation• Regulatory Hurdles• EU Gigabit Society
ADTRAN Focus• G.fast, Vectoring,
10G PON, Services
Operator Focus• Deep Fiber• DOCSIS 3.1 Transition• SDN Transformation• Protect market share
ADTRAN Focus• 10G PON

2018 © ADTRAN, Inc.G ener al Business
ADTRAN History of Innovation
DIVESTITURE ERA
INTERNET ERA
IP TRANSITIONERA
GIGABITERA
SDN ERA
Created T1 Access Market
Broke $1000 Economic Barrier with HDSL, 95%
market share
Disrupted WesternElectric Monopoly
Redefined Economics for D4 channel cards
Drove Innovationin DSL andConverged Services
Repeaterlessbreakthru
Total Reach ISDN
Redefined economics for SONET Fiber Access(OPTI-3, OPTI-6100)
1st ConvergedVoice & Data
Business Gateways
1st AllEthernetMSAN
1st VDSLDeployment
Based on IP DSLAM
1st demo of VDSL2 825Mbps
w/ phantom, bonding, vectoring
Global Leader in OSP
broadband solutions
Market Leader in DSL and
Converged Services
350 Gig Communities by 2016
Frequency DivisionVectoring
(FDV)
1st Edged Optimized
Packet-Optical
Networking Platform
MarketLeadership
In G.fastinnovation
Breakthrough In NGPON2Tunable Optics
1st Deployment of System Level Vectoring (SLV) (US)
1st converged, multi-service
Gigabit enterprise and MTU gateways
1st Cloud-based WLAN
ProCloudWi-Fi services
Leading SDN/NFV Access in Broadband
Forum
Mosaic Activate SD- Automation
for Service Activation
1st Open Platform for G.fast DPU
1st system level CORD
demo
Mosaic Cloud Platform wins 13 Industry Awards
MosaicCloud
PlatformLaunch
7

2018 © ADTRAN, Inc.G ener al Business
The Access Mosaic
8

2018 © ADTRAN, Inc.G ener al Business
Broadband Access§ Market leader in 10 Gigabit optical access innovation
§ XGS PON – commercial deployments, standards leadership§ NGPON-2 – customer trials underway with US Tier 1
§ Over 100 G.fast trials/deployments announced on six (6) continents
§ 5 Nationwide commercial deployments on 4 continents US Tier 1s, DT (Croatia), Bezeq (Israel), nbn (Australia)
§ Europe’s (and World’s) and NA’s largest deployment of Vectoring and SuperVectoring
§ Over 400 Gigabit Communities§ Leader in CAF2 solutions
9
Innovation Leadership

2018 © ADTRAN, Inc.G ener al Business
ADTRAN Gfast/FTTdp Leadership
World’s 1st
FTTdp (UBE) Architecture
Best Fixed Access Product (UBE)
World’s 1st
Fully SealedG.fast Demo
BTGOLD Project
World’s Only Chipset AgnosticG.fastArchitecture
World’s 1st
SD-Access G.fastSolution
Global Leader for Sealed FTTxSolutions
Fully sealedSymmetric serviceReverse power
2010
UBE wins World Vendor Award 100,000 sealed
units deployed
2012 2014 2015 2015 2015 2015
Most G.fastTrials and Demos
World’s 1st
G.fast over Coax
Top 2 Global G.fast Vendors
Broadband Forum Circle of Excellence Award
World’s 1st
Public Demo of G.fast 212 MHz
Most Innovative and Broadest G.fast Portfolio
Five Nationwide G.fast Deployments on Four Continents Broadband Trends
Customer SurveyDevelopment of SD-Access Yang Models
ITU-T meeting in Huntsville, AL Power, port and
placement variants
Primary Vendorto Tier I operators
With DTA DemoOver 100 acrosssix continents
2016 2016 2016 2017 2017 2017 2017

2018 © ADTRAN, Inc.G ener al Business
SDN Access§ Complete cloud-edge to subscriber-edge solution set§ 1st to integrate and deploy complete FTTx portfolio with an
open source SDN controller§ Only vendor with a complete Software Defined Access
solution set built around a CORD architecture§ 1st (and only) 10G PON vOLT CORD demo in a Tier 1§ 1st industry interop - vCPE portfolio
§ Modular software architecture with Agile/DevOps model§ Leadership in Broadband Forum, ITU, ETSI, Celtic-Plus, and
UK NICC standards activities§ Industry’s Most Awarded (13) ADTRAN Mosaic Cloud Platform
11
Innovation Leadership

2018 © ADTRAN, Inc.G ener al Business
2017 © ADTRAN, Inc.
MosaicMost Awarded SD-Access Solution
in the Industry

2018 © ADTRAN, Inc.G ener al Business
13
Company Financial Performance

14
Financial Stability§ Nearly 3 Decades of
Continuous Profitability§ Ongoing Strong Balance
Sheet and Cash Flow§ Publicly Traded for 23 Years
with Full Transparency(NASDAQ-ADTN)

2018 © ADTRAN, Inc.G ener al Business
Historically Strong Cash Flow and Solid Balance Sheet
2012-2017 Dec. 31, 2017Cash Returned to Shareholders Cash & Investments Debt Total Assets
Dividends
$233M $27M $665M $118MShare Buybacks
$354M

2018 © ADTRAN, Inc.G ener al Business
ADTRAN - FY 2017 Financial Highlights FY 2017 FY 2016
Revenue $667M $637M
Gross Margin 45.6% 45.8%
Operating Expense (GAAP) $266M $257M
Operating Margin (%) (GAAP) 5.7% 5.5%
GAAP EPS (diluted) $0.49* $0.72
Non-GAAP EPS (diluted) $0.89 $0.84
* FY 2017 GAAP EPS includes the one-time tax impact of 11.9 million relating to the Tax Cuts and Jobs Act of 2017.

2018 © ADTRAN, Inc.G ener al Business
2015 – 2017 Revenue by Segment and Categories
$527 $526 $541
$73 $111 $126$600
$637$667
$0
$100
$200
$300
$400
$500
$600
$700
2015 2016 2017
Products Services
$406 $436 $474
$126$138
$138$69$63
$55$600$637
$667
$0
$100
$200
$300
$400
$500
$600
$700
2015 2016 2017
AccessandAggregation CustomerDevices TraditionalProducts

2018 © ADTRAN, Inc.G ener al Business
2015 – 2017 Gross Margin by Segments
44.3%48.5% 48.3%
45.9%
32.8% 33.8%
44.5% 45.8% 45.6%
0.0%
10.0%
20.0%
30.0%
40.0%
50.0%
60.0%
2015 2016 2017
Products Services Total
ü 2017 GM% flat with 2016 despite 17% increase in International Revenueü Services GM% up 1% point on 13% increase in Services Revenue

2018 © ADTRAN, Inc.G ener al Business
Revenue – U.S. vs. International
$419$501 $508
$181$135 $159
$600$637
$667
$0
$100
$200
$300
$400
$500
$600
$700
2015 2016 2017
Domestic International

20
2017 Summary§ 2017 ended with 2nd best revenue performance in company
history § Record 1H Revenue§ Ties Record revenue through 3Q17 (2011); Full year up 5%§ Record Services Revenue in Q3
§ Disappointing 4Q revenue due to unforseen event§ 10% customer temporarily paused spending in 4Q due to a merger-
related review§ Prudent management of Q4 margins and OPEX§ All other accounts and market segments remain on track
§ Gross Margin Improvements in 2017§ Total Gross Margin % flat to 2016 despite 17% Int’l Revenue growth§ Services gross margins up 1% point over 2016 on 13% Revenue
growth§ Outstanding engagement by Tier 1s globally
§ High interest / acceptance of next gen SD-Access solutions (Mosaic, G.fast, NGPON2)
§ Historic breadth of opportunities, both domestically and internationally

2018 © ADTRAN, Inc.G ener al Business
Quarterly Financial Highlights
$170$185 $185
$127
$0
$20
$40
$60
$80
$100
$120
$140
$160
$180
$200
Q1 Q2 Q3 Q4
2015 2016 2017
After strong three quarters in line with ongoing major investment cycle in wireline networks…
…4Q17 performance impacted by a merger-related review & slowdown in the spending at a domestic Tier 1 customer.
Revenue (M)
2018 © ADTRAN, Inc.G ener al Business
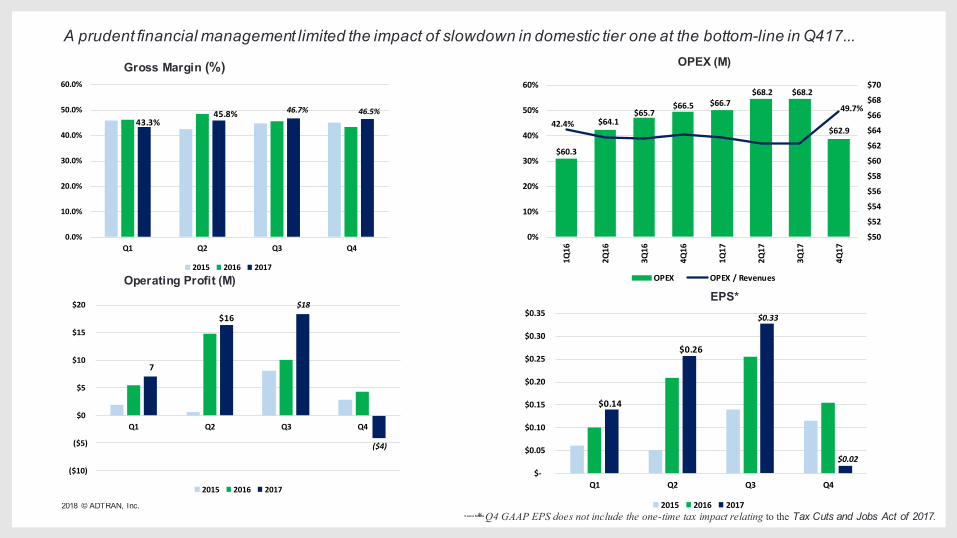
A prudent financial management limited the impact of slowdown in domestic tier one at the bottom-line in Q417...
43.3%45.8% 46.7% 46.5%
0.0%
10.0%
20.0%
30.0%
40.0%
50.0%
60.0%
Q1 Q2 Q3 Q4
2015 2016 2017
$60.3
$64.1$65.7
$66.5 $66.7$68.2 $68.2
$62.942.4%
49.7%
$50
$52
$54
$56
$58
$60
$62
$64
$66
$68
$70
0%
10%
20%
30%
40%
50%
60%
1Q16
2Q16
3Q16
4Q16
1Q17
2Q17
3Q17
4Q17
OPEX OPEX/Revenues
Gross Margin (%) OPEX (M)
Operating Profit (M)
7
$16$18
($4)
($10)
($5)
$0
$5
$10
$15
$20
Q1 Q2 Q3 Q4
2015 2016 2017
$0.14
$0.26
$0.33
$0.02$-
$0.05
$0.10
$0.15
$0.20
$0.25
$0.30
$0.35
Q1 Q2 Q3 Q4
2015 2016 2017
EPS*
* Q4 GAAP EPS does not include the one-time tax impact relating to the Tax Cuts and Jobs Act of 2017.

2018 © ADTRAN, Inc.G ener al Business
Q4 FY 2017 Q3 FY 2017 Q4 FY 2016Amount ($M) GM (%) Amount ($M) GM (%) Amount ($M) GM (%)
Network Solutions 96.1 48.3 145.5 49.5 126.8 46.5Services & Support 30.5 40.9 39.6 36.7 36.2 32.6Total 126.5 46.5 185.1 46.7 163.0 43.4
Revenue & Gross Margin (GM) by Operating Segment
Revenue by Categories
Q4 FY 2017 Q3 FY 2017 Q4 FY 2016Access and Aggregation 78.9 136.0 119.7Customer Devices 32.8 35.6 31.4Traditional Products 14.9 13.6 11.9Total 126.5 185.1 163.0
U.S. and International Revenue
Q4 FY 2017 Q3 FY 2017 Q4 FY 2016United States 93.7 147.9 123.7International 32.8 37.2 39.3Total 126.5 185.1 163.0

2018 © ADTRAN, Inc.G ener al Business
Business Outlook*
Q1 18
Revenue Flattish (QoQ)
Gross Margin 40% range
OpEx $64-$65M range
Tax Low-20% range
Guidance or Outlook with respect to Q118 is as of January 17, 2018, the date presented on the 4Q17 earnings call. Actual results may differ materially from these forward looking statements.
Going forward, all of our programs and opportunities remain unchanged and on track as we had
previously communicated, with the exception of the slowdown in the domestic tier one.

Summary
• Proven history and well positioned• Leader in fixed broadband access• Leader in SDN-Access
ü Open, scalable and standards-basedü Leading transition to software/service model
• Ramping broadband investment cycleü Emerging technologies in fiber & copperü Imperative for service agility & automation
25

2018 © ADTRAN, Inc.G ener al Business
ADTRAN IS BRINGING THE WORLD TOGETHER