need to have a client cover made - littleton public schools
TRANSCRIPT

Prepared by: Julie Kennedy
Need to have a Client Cover Made
PORTFOLIO REVIEW4th Quarter 2015
Wendy Dominguez, MBAElizabeth Stemper, AIF®,QPFC
Peter Mustian, MBA

INNOVEST AT A GLANCE
—
———
——
——
———
—
——
—
—
——
—
—
—
—
—
—
—
—
—
—
—
—
—
—
—
————
*As of December 2015
Privileged and Confidential
INTEGRITY. BALANCE. OBJECTIVITY.
2

1.38%
-4.41%
-0.81%
-14.92%
0.55%
-20.00%
-15.00%
-10.00%
-5.00%
0.00%
5.00%
10.00%
15.00%
S&P 500
Russell 2000
MSCI EAFE
MSCI EM
Barclays US Agg Bond
Year 4Q15
7.04%-0.57%
4.71%
3.59%
0.66%
THE MARKETS
Investment Returns2015
1st Quarter 2nd Quarter 3rd Quarter 4th Quarter
INTEGRITY. BALANCE. OBJECTIVITY.
3

GLOBAL ECONOMIC GROWTH: SLUGGISH• U.S. real GDP increased by an annual rate of 2.0% in the third
quarter. The long-run average is over 3%, and even higher after recessions.
• U.S. dollar strength has been a significant headwind for U.S. manufacturers and exporters.
• U.S. retail sales excluding gasoline were 3.9% higher in December versus a year ago.
• Of the expected $94 billion growth in all U.S. retail sales in 2015, Amazon took in $22 billion, according to Macquarie.
THE FEDERAL RESERVE: SLOWLY TIGHTENING• The real (after-inflation) Fed Funds rate is still negative,
suggesting that monetary policy remains accommodative.• In December the Federal Funds target was raised by 0.25% to
a range of 0.25%–0.50%, the first increase since 2006.• The Fed is expected to increase rates slowly, unless wages
increase more quickly than currently projected. • While the FOMC has forecasted four rate increases for 2016, at
year-end market participants expected two increases.
Fourth Quarter: GLOBAL ECONOMICS
The After-Inflation Fed Funds Rate
Shaded bands indicate recessions. Source: Capital Economics and Innovest. Reported 1/11/2016.
Economic Growth in the Developed Markets
Q1 2008 GDP = 100. Source: Capital Economics.
Real Rates Below 0% Usually Stimulate the Economy
Real Rates Above 2% Usually Restrict Economic Growth
INTEGRITY. BALANCE. OBJECTIVITY.
4

GLOBAL ECONOMICS, continued
CHINA: GROWING MORE SLOWLY• Chinese exports fell 1.8% in 2015, while imports declined
13.2%. The People’s Bank of China once again intervened to devalue the yuan to spur exports.
• Volatility in China’s currency and stock markets continued to impact investors’ sentiment throughout the world.
• Increasing labor costs have put downward pressure on Chinese corporate profits; however, higher wages boost consumption.
• China’s nominal level of GDP is now five times the size of what it was 10 years ago.
ENERGY: PRICES KEEP FALLING• Domestic oil production remained high, despite active drilling
rigs having declined by about 70% in the last 18 months.• West Texas Intermediate (WTI) started 2015 at $53 a barrel,
was near $60 at mid-year, and then collapsed to the mid-$30s at year-end.
• Global oil production is unlikely to decline soon, as OPEC has promised high production and Iran plans to pump aggressively.
• Lower gasoline prices in 2015 saved the average American driver about $540, as compared to 2014.
China’s Share of the Global Economy
Less Oil Drilling, Stubbornly High Production
Source: Capital Economics.
Reported 1/4/2016. For commodities, average of consumption of steel, copper, aluminum, zinc, tin, lead, nickel, oil, gas, coal, nuclear, cement, pork and rice. Sources: EIU, BP, World Steel Association, OECD, USGS and J.P. Morgan.
INTEGRITY. BALANCE. OBJECTIVITY.
5

STOCKS• In the six previous times that the Fed began to raise short-
term rates, subsequent one-year equity returns varied significantly.
• Developed international equity markets have tended to fare relatively well after the Fed’s previous initial rate hikes.
• The rising U.S. dollar in 2015 dragged down developed markets’ equity returns by 6.6%, and emerging markets equity returns by 9.3%.
• In the third quarter of 2015, S&P 500 earnings fell by 14.1% overall, but rose 3.5% excluding the energy sector.
BONDS• Bonds have provided mixed results subsequent to the six
previous times that the Fed began to raise short-term rates.• The year-end 2.59% yield on the Barclays Aggregate Index
provides little cushion if rates rise across the yield curve.• Taxable bonds in 2015 were challenged by the Fed liftoff,
falling energy prices, and a stronger dollar.• Energy issues pulled down returns on economically sensitive
high yield bonds and floating rate corporate loans.
Fourth Quarter: ASSET CLASS FUNDAMENTALS
Data are from the six rising Fed Funds rate cycles from 1983 to 2005. *The one-year municipal bond returns are based on the four most recent rising-rate periods; the one-year high-yield bond returns are based on the five most recent rising-rate periods; and the one-year floating rate corporate bond returns are based on the three most recent rising-rate periods. Past performance is no indication of future performance. Sources: Morningstar and Innovest.
Data are from the six rising Fed Funds rate cycles from 1983 to 2005. *The one-year emerging markets equity returns are based on the two most recent rising-rate periods. Past performance is no indication of future performance. Sources: Morningstar and Innovest.
Bonds: Average One-Year Returns After Initial Fed Rate Hikes
Stocks: Average One-Year Returns After Initial Fed Rate Hikes
5.4% 2.7%
20.8%22.2%
‐20.0%
‐10.0%
0.0%
10.0%
20.0%
30.0%
40.0%
Large Cap U.S.Stocks
Small Cap U.S.Stocks
InternationalDevelopedStocks
EmergingMarkets Stocks*
3.0% 2.7% 3.5%
6.1%
‐4.0%‐2.0%
0.0%2.0%4.0%6.0%
8.0%10.0%12.0%
Core Fixed Income Municipal FixedIncome*
High Yield FixedIncome*
Floating RateCorporate Loans*
INTEGRITY. BALANCE. OBJECTIVITY.
6
ASSET CLASS FUNDAMENTALS, continued
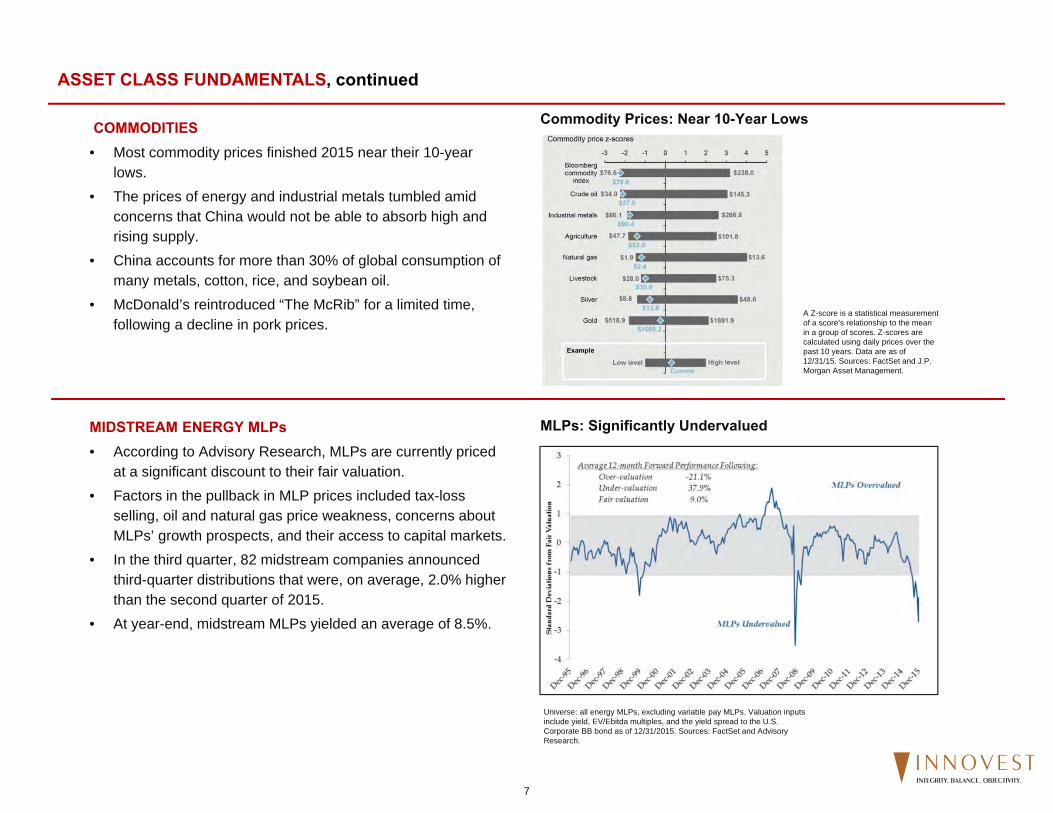
COMMODITIES• Most commodity prices finished 2015 near their 10-year
lows.• The prices of energy and industrial metals tumbled amid
concerns that China would not be able to absorb high and rising supply.
• China accounts for more than 30% of global consumption of many metals, cotton, rice, and soybean oil.
• McDonald’s reintroduced “The McRib” for a limited time, following a decline in pork prices.
MIDSTREAM ENERGY MLPs• According to Advisory Research, MLPs are currently priced
at a significant discount to their fair valuation.• Factors in the pullback in MLP prices included tax-loss
selling, oil and natural gas price weakness, concerns about MLPs’ growth prospects, and their access to capital markets.
• In the third quarter, 82 midstream companies announced third-quarter distributions that were, on average, 2.0% higher than the second quarter of 2015.
• At year-end, midstream MLPs yielded an average of 8.5%.
Commodity Prices: Near 10-Year Lows
A Z-score is a statistical measurement of a score’s relationship to the mean in a group of scores. Z-scores are calculated using daily prices over the past 10 years. Data are as of 12/31/15. Sources: FactSet and J.P. Morgan Asset Management.
Universe: all energy MLPs, excluding variable pay MLPs. Valuation inputs include yield, EV/Ebitda multiples, and the yield spread to the U.S. Corporate BB bond as of 12/31/2015. Sources: FactSet and Advisory Research.
MLPs: Significantly Undervalued
INTEGRITY. BALANCE. OBJECTIVITY.
7

US Market Indices Performance US Market Sector Performance
Source: Investment Metrics, LLC
Source: Investment Metrics, LLCSource: Investment Metrics, LLC
S&P 500 Index Russell 2000 Index MSCI EAFE Index MSCI Emerging Markets Index
Barclays Capital Aggregate BC Municipal Bond Barclays U.S. Corp: High Yield S&P/LSTA Leveraged Loan Index
Alerian MLP Infrastructure DJ-UBS Commodity Index HFRI FoF Composite Index
0.0
15.0
-15.0
-30.0
-45.0
Re
turn
(%)
1
Quarter
1
Year
0.6
-0.4
-10.5
-24.7
-1.6
-31.7
-2.1-0.7
-2.1-4.5
1.53.3
-0.6
0.50.7
-14.6
4.7
-0.4
3.6
-4.4
7.0
1.4
S&P 500 S&P 500 Growth S&P 500 Value
Russell Midcap Index Russell Midcap Growth Index Russell Midcap Value Index
Russell 2000 Index Russell 2000 Growth Index Russell 2000 Value Index
0.0
6.0
12.0
-6.0
-12.0
Re
turn
(%)
1
Quarter
1
Year
2.9
-7.5
4.3
-1.4
3.6
-4.4
3.1
-4.8
4.1
-0.2
3.6
-2.4
6.1
-3.1
7.9
5.5
7.0
1.4
S&P 500 Consumer Discretionary S&P 500 Consumer Staples S&P 500 Energy
S&P 500 Financials S&P 500 Health Care S&P 500 Industrials
S&P 500 Information Technology S&P 500 Materials S&P 500 Telecom Services
S&P 500 Utilities
0.0
15.0
30.0
-15.0
-30.0
Re
turn
(%)
1
Quarter
1
Year
1.1
-4.8
7.63.4
9.7
-8.4
9.25.9
8.0
-2.5
9.26.96.0
-1.5
0.2
-21.1
7.6 6.65.8
10.1
Quarterly Market Summary December 31, 2015
Copyright © 2015 Investment Metrics, LLC. All rights reserved.
INTEGRITY. BALANCE. OBJECTIVITY.
8

Intl Equity Region Performance Alternative Asset Class Performance
Fixed Income Market Sector Performance
Source: Investment Metrics, LLC
Source: Investment Metrics, LLCSource: Investment Metrics, LLC
Barclays U.S. Aggregate Barclays U.S. Treasury Barclays U.S. Credit Index Barclays U.S. Corp: High Yield
S&P/LSTA Leveraged Loan Barclays Global Aggregate JPM EMBI Global (USD)
0.0
3.0
-3.0
-6.0
Re
turn
(%)
1
Quarter
1
Year
1.51.2
-0.9
-3.2
-2.1
-0.7
-2.1
-4.5
-0.5-0.8-0.9
0.8
-0.6
0.5
HFRI Fund of Funds Composite Index S&P Developed Property
Bloomberg Commodity Index Total Return Alerian MLP Index
0.0
15.0
-15.0
-30.0
-45.0
Re
turn
(%)
1
Quarter
1
Year
-2.8
-32.6
-10.5
-24.7
4.70.90.6
-0.4
MSCI Japan MSCI Pacific ex Japan MSCI United Kingdom
MSCI Europe ex U.K. MSCI Emerging Markets
0.0
10.0
20.0
-10.0
-20.0
-30.0
Re
turn
(%)
1
Quarter
1
Year
0.7
-14.6
3.3
0.10.7
-7.5
8.3
-8.4
9.4 9.9
Quarterly Market Summary December 31, 2015
Copyright © 2015 Investment Metrics, LLC. All rights reserved.
INTEGRITY. BALANCE. OBJECTIVITY.
9

Alternative Asset Class Returns December 31, 2015
Source: Christenson Investment Parnters Source: Christenson Investment Parnters
Source: Christenson Investment Parnters Source: Standard & Poors
‐31.1
‐24.8‐22.0
‐8.7
‐15.5
‐9.2‐5.8 ‐5.5
‐9.5 ‐9.0‐3.9
10.6
‐13.7
2.9
‐10.5
‐5.2 ‐5.0
1.54.5
18.4
‐40.0
‐30.0
‐20.0
‐10.0
0.0
10.0
20.0
30.0
Heatin
g Oil
Crud
e Oil
Natural Gas
Gasoline
Nickel
Copp
er
Zinc
Alum
inum Corn
Whe
at
Soybeans
Soybean Oil
Hogs
Cattle
Bloo
mbe
rg Com
m Inde
x
Silver
Gold
Coffe
e
Cotton
Sugar
Commodity Sector Returns
‐22.7
‐10.5‐8.2 ‐7.7
‐5.1‐3.5
11.2
‐25.0
‐20.0
‐15.0
‐10.0
‐5.0
0.0
5.0
10.0
15.0
Energy BloombergComm Index
IndustrialMetals
Grains PreciousMetals
Livestock Softs
Commodity Broad Sector Returns
‐4.3‐2.3 ‐1.8 ‐1.1 ‐0.6
0.0 0.0 0.5 0.6 0.7 1.6
‐10.0
‐5.0
0.0
5.0
10.0
15.0
20.0
Dedicated Short B
ias
Even
t Driv
en
Distressed
Managed
Futures
Convertib
le Arbitrage
Fixed Income Arbitrage
Equity M
arket N
eutral
Multi‐Strategy
Globa
l Macro
HFRI FoF
Com
posite
Long/Sho
rt Equ
ity
Hedge Fund Strategy Returns
‐6.1 ‐6.0‐4.7
‐1.8
2.34.4
5.57.0
9.5 9.8
‐8.0‐6.0‐4.0‐2.00.02.04.06.08.0
10.012.0
Emerging
Markets
Canada
United Kingdo
m
Europe
Singap
ore
Japa
n
S&P De
velope
d RE
IT
U.S.
Hon
g Ko
ng
Australia
Global REIT Country and Regional Returns
INTEGRITY. BALANCE. OBJECTIVITY.
10

ASSET CLASS FUNDAMENTALS, continued
2006 2007 2008 2009 2010 2011 2012 2013 2014 2015
HighREITs 35.97 %
Commodities16.23 %
Fixed Income5.24 %
Int'l Stocks31.78 %
REITs 28.60 %
REITs 9.24 %
REITs 17.59 %
Smal l Cap Stocks38.82 %
REITs 31.78 %
REITs 4.23 %
REITs 7.31%
REITs 26.28%
High
Int'l Stocks26.34 %
Int'l Stocks11.17 %
Hedge Funds‐21.37 %
REITs 28.60 %
Smal l Cap Stocks26.85 %
Fixed Income7.84 %
Int'l Stocks17.32 %
Large Cap Stocks32.38 %
Large Cap Stocks13.69 %
Large Cap Stocks1.38 %
Large Cap Stocks7.31%
Smal l Cap Stocks19.70%
Smal l Cap Stocks18.37 %
Hedge Funds10.25 %
Divers i fed Portfol io‐24.23%
Smal l Cap Stocks27.17 %
Commodi es16.83 %
Large Cap Stocks2.11 %
Smal l Cap Stocks16.35 %
Int'l Stocks22.78%
Fixed Income5.97 %
Fixed Income0.55 %
Smal l Cap Stocks6.80%
Int'l Stocks18.41%
Large Cap Stocks15.79 %
Fixed Income6.97 %
Smal l Cap Stocks‐33.79 %
Large Cap Stocks26.46 %
Large Cap Stocks15.06 %
Divers i fied Portfol io‐0.50%
Large Cap Stocks16.00 %
Divers i fied Portfol io14.79%
Divers i fied Portfol io5.47%
Hedge Funds‐0.36%
Divers i fied Portfol io4.86%
Commodities18.09%
Divers i fied Portfol io13.25 %
Divers i fied Portfol io6.64 %
Commodities‐35.65 %
Divers i fied Portfol io19.48%
Divers i fied Portfol io12.25%
Smal l Cap Stocks‐4.18 %
Divers i fied Portfol io10.27%
Hedge Funds8.81 %
Smal l Cap Stocks4.89 %
Int'l Stocks‐0.81%
Fixed Income4.52%
Large Cap Stocks15.00%
Hedge Funds10.39 %
Large Cap Stocks5.49 %
Large Cap Stocks‐37.00 %
Commodi es18.91 %
Int'l Stocks7.75 %
Hedge Funds‐5.72 %
Hedge Funds5.28 %
REITs 1.86 %
Hedge Funds3.19%
Divers i fied Portfol io‐1.15%
Int'l Stocks3.03%
Divers i fied Portfol io9.59%
Fixed Income4.34 %
Smal l Cap Stocks‐1.57 %
REITs ‐39.20 %
Hedge Funds11.47 %
Fixed Income6.54 %
Int'l Stocks‐12.14 %
Fixed Income4.21 %
Fixed Income‐2.02 %
Int'l Stocks‐4.90%
Smal l Cap Stocks‐4.41%
Hedge Funds 2.26%
Hedge Funds5.45%
LowCommodi es
2.07 %REITs
‐17.55 %Int'l Stocks‐43.38 %
Fixed Income5.93 %
Hedge Funds5.70 %
Commodities‐13.32 %
Commodities‐1.06 %
Commodi es‐9.53 %
Commodi es‐17.01 %
Commodi es‐24.66%
Commodities ‐6.43%
Fixed Income3.21%
Low
Divers i fied Portfol io: 25% Large Cap Stocks , 10% Smal l Cap Stocks , 12% International Stocks , 25% Fixed Income, 3% REITs , 20% Hedge Funds , and 5% Commodities .
Periodic Table of Returns 2006 ‐ 2015
Avg Annual Returns '06‐'15
Avg Annual Risk
'06‐'15
Indices : Large Cap Stocks (S&P 500), Smal l Cap Stock (Russel l 2000), Int'l Stocks (MSCI EAFE), Fixed Income (Barclays Aggregate), REITs (DJ‐Wilshire REIT), Hedge Funds (HFRI Fund of Funds Compos ite), and Commodities (Bloomberg Commodity).
INTEGRITY. BALANCE. OBJECTIVITY.
11

Average Number Investment Options 19 Number Investment Options 19
Average Contribution Rate 5.2%/6.6% Average Contribution Rate NA
Average Account Balance $98,418 Average Account Balance $15,036
*Contribution rate for lower compensated/higher compensated employees as defined by ADP testsSource: PCSA's 56th Annual Survey of Profit Sharing and 401(k) Plans (2012)
Vanguard Target Retirement 2055
Self Directed Brokerage
Brokerage Window
Target Date Portfolios
Vanguard Target Retirement Income
Vanguard Target Retirement 2010
Vanguard Target Retirement 2015
Vanguard Target Retirement 2020
Vanguard Target Retirement 2025
Vanguard Target Retirement 2030
Vanguard Target Retirement 2035
Vanguard Target Retirement 2040
Vanguard Target Retirement 2045
Vanguard Target Retirement 2050
Mid BlackRock Mid Cap
Value Opportunities Janus Enterprise
Cash Equivalents
Vanguard Mid Cap Index
Vanguard Small Cap Index
TIAA-CREF Social Choice Equity
Vanguard Prime Money Market
TIAA Traditional Retirement Choice
International Equity
Smal
l
DFA U.S. Small Cap Value
Voya Small Cap Opportunities
Value Core Growth
American Beacon International
Vanguard Total International Stock
Index
American Funds Europacific
Value Core Growth
Metropolitan West Total Return Bond
Vanguard Total Bond Market Index La
rge
Dodge & Cox Stock Vanguard S&P 500 Index
Harbor Capital Appreciation
401(a) Retirement Plan Statistics and Menu Coverage
Industry Averages* Plan Averages
Menu Coverage
Fixed Income Domestic Equity Specialty
INTEGRITY. BALANCE. OBJECTIVITY.
12

Asset Allocation Asset Allocation
Sep-2015 Dec-2015
($) % ($) %
Large Cap Equity
Dodge & Cox Stock - - 76,885 3.50Vanguard S&P 500 - - 76,767 3.50Harbor Capital Appreciation Instl - - 124,848 5.69Total Large Cap Equity - - 278,500 12.69
Mid Cap Equity
BlackRock Mid Cap Value Opportunities - - - 0.00Vanguard Mid Cap Index - - - 0.00Janus Enterprise - - 35,861 1.63Total Mid Cap Equity - - 35,861 1.63
Small Cap Equity
DFA US Small Cap Value - - - 0.00Vanguard Small Cap Index - - 6,776 0.31Voya Small Cap Opportunities - - - 0.00Total Small Cap Equity - - 6,776 0.31
International Equity
American Beacon Intl Equity Instl - - 3,834 0.17Vanguard Total Intl Stock Index - - 82,391 3.75American Funds EuroPacific Gr - - - 0.00Total International Equity - - 86,225 3.93
Fixed Income
Met West Total Return - - 62,773 2.86Vanguard Total Bond Market Idx - - 5,982 0.27TIAA Traditional Retirement Choice - - - 0.00Total Fixed Income - - 68,755 3.13
LPS 401(a) Total Fund - - 2,195,183 100.00
Sep-2015 Dec-2015
($) % ($) %
Specialty
CREF Social Choice - - - 0.00
Cash & Equivalents
Vanguard Prime Money Market - - - 0.00
Target Date Funds
Vanguard Target Retirement Income - - - 0.00Vanguard Target Retirement 2010 - - 161,352 7.35Vanguard Target Retirement 2015 - - 172,472 7.86Vanguard Target Retirement 2020 - - 202,060 9.20Vanguard Target Retirement 2025 - - 386,162 17.59Vanguard Target Retirement 2030 - - 164,175 7.48Vanguard Target Retirement 2035 - - 406,036 18.50Vanguard Target Retirement 2040 - - 187,314 8.53Vanguard Target Retirement 2045 - - 30,666 1.40Vanguard Target Retirement 2050 - - 7,291 0.33Vanguard Target Retirement 2055 - - 1,537 0.07Total Target Date Funds - - 1,719,066 78.31
Self Directed Brokerage
Self Directed Account - - - 0.00
LPS 401(a) Total Fund - - 2,195,183 100.00
Asset Allocation - 401(a)
13

Average Number Investment Options 19 Number Investment Options 19
Average Contribution Rate 5.2%/6.6% Average Account Balance-403(b) $18,407
Average Account Balance $98,418 Average Account Balance-457 $32,903
*Contribution rate for lower compensated/higher compensated employees as defined by ADP testsSource: PCSA's 56th Annual Survey of Profit Sharing and 401(k) Plans (2012)
Vanguard Target Retirement 2035
Vanguard Target Retirement 2040
Vanguard Target Retirement 2045
Vanguard Target Retirement 2050
Vanguard Target Retirement 2055
Target Date Portfolios
Vanguard Target Retirement Income
Vanguard Target Retirement 2010
Vanguard Target Retirement 2015
Vanguard Target Retirement 2020
Vanguard Target Retirement 2025
Vanguard Target Retirement 2030
Vanguard Prime Money Market
Value Core GrowthBrokerage Window
American Beacon International
Vanguard Total International Stock
Index
American Funds Europacific
Smal
l
DFA U.S. Small Cap Value
Vanguard Small Cap Index
Voya Small Cap Opportunities
Cash Equivalents International Equity Self Directed Brokerage
TIAA-CREF Social Choice Equity
TIAA Traditional Retirement Social
Choice Plus
Mid BlackRock Mid Cap
Value OpportunitiesVanguard Mid Cap
Index Janus Enterprise
Value Core Growth
Metropolitan West Total Return Bond
Vanguard Total Bond Market Index La
rge
Dodge & Cox Stock Vanguard S&P 500 Index
Harbor Capital Appreciation
403(b) & 457 Retirement Plan Statistics and Menu Coverage
Industry Averages* Plan Averages
Menu Coverage
Fixed Income Domestic Equity Specialty
INTEGRITY. BALANCE. OBJECTIVITY.
14

Asset Allocation Asset Allocation
Sep-2015 Dec-2015
($) % ($) %
Large Cap Equity
Dodge & Cox Stock - - 99,016 3.16Vanguard S&P 500 - - 188,168 6.01Harbor Capital Appreciation Instl - - 152,750 4.88Total Large Cap Equity - - 439,933 14.06
Mid Cap Equity
BlackRock Mid Cap Value Opportunities - - - 0.00Vanguard Mid Cap Index - - 543 0.02Janus Enterprise - - 53,856 1.72Total Mid Cap Equity - - 54,399 1.74
Small Cap Equity
DFA US Small Cap Value - - 521 0.02Vanguard Small Cap Index - - 3,743 0.12Voya Small Cap Opportunities - - 237 0.01Total Small Cap Equity - - 4,500 0.14
International Equity
American Beacon Intl Equity Instl - - 311 0.01Vanguard Total Intl Stock Index - - 132,316 4.23American Funds EuroPacific Gr - - 159 0.01Total International Equity - - 132,785 4.24
Fixed Income
Met West Total Return - - 97,252 3.11Vanguard Total Bond Market Idx - - 7,175 0.23TIAA Traditional Retirement Choice Plus - - 201,531 6.44Total Fixed Income - - 305,958 9.78
Littleton Public Schools 403(b) - - 3,129,134 100.00
Sep-2015 Dec-2015
($) % ($) %
Specialty
CREF Social Choice - - 2,228 0.07
Cash & Equivalents
Vanguard Prime Money Market - - - 0.00
Target Date Funds
Vanguard Target Retirement Income - - 135,554 4.33Vanguard Target Retirement 2010 - - 140,706 4.50Vanguard Target Retirement 2015 - - 92,545 2.96Vanguard Target Retirement 2020 - - 344,519 11.01Vanguard Target Retirement 2025 - - 584,545 18.68Vanguard Target Retirement 2030 - - 50,930 1.63Vanguard Target Retirement 2035 - - 388,844 12.43Vanguard Target Retirement 2040 - - 364,604 11.65Vanguard Target Retirement 2045 - - 12,098 0.39Vanguard Target Retirement 2050 - - 74,483 2.38Vanguard Target Retirement 2055 - - 501 0.02Total Target Date Funds - - 2,189,330 69.97
Self Directed Brokerage
Self Directed Account - - - 0.00
LPS 403(b) Total Fund - - 3,129,134 100.00
Asset Allocation - 403(b)
15

Asset Allocation Asset Allocation
Sep-2015 Dec-2015
($) % ($) %
Large Cap Equity
Dodge & Cox Stock - - 47,851 2.97Vanguard S&P 500 - - 93,909 5.82Harbor Capital Appreciation Instl - - 432,650 26.84Total Large Cap Equity - - 574,411 35.63
Mid Cap Equity
BlackRock Mid Cap Value Opportunities - - - 0.00Vanguard Mid Cap Index - - 766 0.05Janus Enterprise - - 31,323 1.94Total Mid Cap Equity - - 32,089 1.99
Small Cap Equity
DFA US Small Cap Value - - - 0.00Vanguard Small Cap Index - - 10,398 0.64Voya Small Cap Opportunities - - - 0.00Total Small Cap Equity - - 10,398 0.64
International Equity
American Beacon Intl Equity Instl - - - 0.00Vanguard Total Intl Stock Index - - 81,840 5.08American Funds EuroPacific Gr - - - 0.00Total International Equity - - 81,840 5.08
Fixed Income
Met West Total Return - - 82,734 5.13Vanguard Total Bond Market Idx - - 1,497 0.09TIAA Traditional Retirement Choice Plus - - 4,927 0.31Total Fixed Income - - 89,158 5.53
LPS 457 Total Fund - - 1,612,241 100.00
Sep-2015 Dec-2015
($) % ($) %
Specialty
CREF Social Choice - - 50 0.00
Cash & Equivalents
Vanguard Prime Money Market - - 40 0.00
Target Date Funds
Vanguard Target Retirement Income - - - 0.00Vanguard Target Retirement 2010 - - 224,940 13.95Vanguard Target Retirement 2015 - - 231,170 14.34Vanguard Target Retirement 2020 - - 171,864 10.66Vanguard Target Retirement 2025 - - 29,627 1.84Vanguard Target Retirement 2030 - - 29,791 1.85Vanguard Target Retirement 2035 - - 8,972 0.56Vanguard Target Retirement 2040 - - 39,141 2.43Vanguard Target Retirement 2045 - - 41,112 2.55Vanguard Target Retirement 2050 - - 47,639 2.95Vanguard Target Retirement 2055 - - - 0.00Total Target Date Funds - - 824,256 51.12
LPS 457 Total Fund - - 1,612,241 100.00
Asset Allocation - 457
16

LastQuarter
20151
Year3
Years5
Years7
Years10
Years
Large Cap Equity
Dodge & Cox Stock 4.54 -4.49 -4.49 14.01 11.64 14.52 5.69S&P 500 Value 6.05 -3.13 -3.13 12.83 10.96 12.96 5.80
Vanguard S&P 500 7.04 1.36 1.36 15.09 12.53 14.81 7.30S&P 500 Index 7.04 1.38 1.38 15.13 12.57 14.81 7.31
Harbor Capital Appreciation Instl 8.09 10.99 10.99 18.87 14.35 17.52 8.38S&P 500 Growth 7.86 5.52 5.52 17.19 14.06 16.56 8.70
Mid Cap Equity
BlackRock Mid Cap Value 1.43 -6.69 -6.69 10.00 8.57 14.52 6.98Russell Midcap Value Index 3.12 -4.78 -4.78 13.40 11.25 16.16 7.61
Vanguard Mid Cap Index 3.44 -1.34 -1.34 14.90 11.52 17.23 7.90CRSP U.S. Mid Cap TR Index 3.46 -1.28 -1.28 14.98 11.74 17.04 8.01
Janus Enterprise 4.89 3.57 3.57 15.01 N/A N/A N/ARussell Midcap Growth Index 4.12 -0.20 -0.20 14.88 11.54 18.04 8.16
Small Cap Equity
DFA US Small Cap Value 1.89 -7.81 -7.81 10.75 8.86 15.08 6.25Russell 2000 Value Index 2.88 -7.47 -7.47 9.06 7.67 11.72 5.57
Vanguard Small Cap Index 3.11 -3.64 -3.64 12.60 10.43 16.22 7.95CRSP U.S. Small Cap TR Index 3.10 -3.68 -3.68 12.78 10.79 16.96 8.39
Voya Small Cap Opportunities 5.44 -1.09 -1.09 N/A N/A N/A N/ARussell 2000 Growth Index 4.32 -1.38 -1.38 14.28 10.67 16.33 7.95
Table of Returns
TIAA Traditional Annuity Returns show current quarter's credit rate.
INTEGRITY. BALANCE. OBJECTIVITY.
17

Table of ReturnsLast
Quarter2015
1Year
3Years
5Years
7Years
10Years
International Equity
American Beacon Intl Equity Instl 2.63 -1.78 -1.78 4.40 4.11 7.83 3.39MSCI EAFE Value Index (Net) 2.68 -5.68 -5.68 3.14 2.55 6.67 1.96
Vanguard Total Intl Stock Index 2.74 -4.26 -4.26 1.84 1.31 N/A N/AFTSE Global ex USA All Cap Index 3.65 -4.03 -4.03 2.52 1.78 8.71 3.90
American Funds EuroPacific Gr 2.97 -0.48 -0.48 5.45 3.99 N/A N/AMSCI EAFE Growth Index (Net) 6.67 4.09 4.09 6.83 4.60 8.92 4.03
Fixed Income
Met West Total Return -0.40 0.29 0.29 2.22 4.69 7.39 6.38Barclays Aggregate Index -0.57 0.55 0.55 1.44 3.25 4.09 4.52
Vanguard Total Bond Market Idx -0.60 0.40 0.40 1.33 3.13 4.03 4.47Barclays Aggregate Index -0.57 0.55 0.55 1.44 3.25 4.09 4.52
TIAA Traditional Annuity RC-401(a) 1.09 4.20 4.20 4.05 4.00 4.12 4.29Ryan 3 Yr GIC Master Index 0.31 1.16 1.16 1.09 1.43 2.16 2.82
TIAA Traditional Annuity RCP-403(b) & 457 0.90 3.42 3.42 3.27 3.22 3.31 N/ARyan 3 Yr GIC Master Index 0.31 1.16 1.16 1.09 1.43 2.16 2.82
Specialty
TIAA-CREF:Soc Ch Eq;Inst 5.67 -2.39 -2.39 13.41 10.70 14.32 6.84CREF Social Choice Hybrid Index 3.15 0.20 0.20 7.58 7.17 9.67 5.88
Cash & Equivalents
Vanguard Prime Money Market 0.05 0.11 0.11 0.08 0.09 0.19 1.4490 Day U.S. Treasury Bill 0.00 0.03 0.03 0.04 0.06 0.08 1.22
TIAA Traditional Annuity Returns show current quarter's credit rate.
INTEGRITY. BALANCE. OBJECTIVITY.
18

Table of ReturnsLast
Quarter2015
1Year
3Years
5Years
7Years
10Years
Target Date Funds
Vanguard Target Retirement Income 1.16 -0.17 -0.17 3.71 4.91 6.83 4.99Vanguard Target Income Composite Index 1.39 0.14 0.14 3.94 5.09 6.98 5.05
Vanguard Target Retirement 2010 1.42 -0.20 -0.20 4.87 5.60 8.28 N/AVanguard Target 2010 Composite Index 1.63 0.03 0.03 5.09 5.72 8.38 N/A
Vanguard Target Retirement 2015 2.14 -0.46 -0.46 6.22 6.31 9.20 5.36Vanguard Target 2015 Composite Index 2.42 -0.23 -0.23 6.46 6.44 9.30 5.39
Vanguard Target Retirement 2020 2.71 -0.68 -0.68 7.22 6.85 9.93 N/AVanguard Target 2020 Composite Index 3.00 -0.40 -0.40 7.51 7.14 10.18 N/A
Vanguard Target Retirement 2025 3.08 -0.85 -0.85 7.88 7.22 10.51 5.55Vanguard Target 2025 Composite Index 3.44 -0.58 -0.58 8.18 7.51 10.79 5.69
Vanguard Target Retirement 2030 3.49 -1.03 -1.03 8.52 7.59 11.11 N/AVanguard Target 2030 Composite Index 3.84 -0.79 -0.79 8.84 7.87 11.38 N/A
Vanguard Target Retirement 2035 3.93 -1.26 -1.26 9.16 7.92 11.64 5.75Vanguard Target 2035 Composite Index 4.26 -1.03 -1.03 9.49 8.22 11.92 5.89
Vanguard Target Retirement 2040 4.26 -1.59 -1.59 9.46 8.11 11.80 N/AVanguard Target 2040 Composite Index 4.67 -1.25 -1.25 9.86 8.45 12.11 N/A
Vanguard Target Retirement 2045 4.30 -1.57 -1.57 9.47 8.13 11.79 5.93Vanguard Target 2045 Composite Index 4.70 -1.26 -1.26 9.86 8.45 12.11 6.09
Vanguard Target Retirement 2050 4.31 -1.58 -1.58 9.47 8.12 11.81 N/AVanguard Target 2050 Composite Index 4.70 -1.26 -1.26 9.86 8.45 12.11 N/A
Vanguard Target Retirement 2055 4.28 -1.72 -1.72 9.41 8.15 N/A N/AVanguard Target 2055 Composite Index 4.70 -1.26 -1.26 9.86 8.45 N/A N/A
Vanguard Target Retirement 2060 4.31 -1.68 -1.68 9.42 N/A N/A N/AVanguard Target 2060 Composite Index 4.70 -1.26 -1.26 9.86 N/A N/A N/A
TIAA Traditional Annuity Returns show current quarter's credit rate.
INTEGRITY. BALANCE. OBJECTIVITY.
19

Sep-2015 Dec-2015
($) % ($) %
Large Cap Equity
CREF Equity Index - - 79,664 3.69CREF Growth - - 85,569 3.97Total Large Cap Equity - - 165,234 7.66
Global Equity
CREF Global Equities - - 194,227 9.00CREF Stock - - 587,854 27.25Total Global Equity - - 782,081 36.25
Fixed Income
CREF Bond Market - - 37,593 1.74CREF Inflation-Linked Bond - - 14,129 0.65Total Fixed Income - - 51,722 2.40
Fixed Account
TIAA Traditional GRA - - 715,368 33.16
Real Estate
TIAA Real Estate - - 150,427 6.97
Specialty Equity
CREF Social Choice - - 26,052 1.21
Cash
CREF Money Market - - 266,295 12.34
LPS 401(a) Legacy Total Fund - - 2,157,179 100.00
Asset Allocation - 401(a) Legacy
20

Sep-2015 Dec-2015
($) % ($) %
Large Cap Equity
CREF Equity Index - - 349,092 4.65CREF Growth - - 233,631 3.11Large Cap Equity - - 582,723 7.76
Global Equity
CREF Global Equities - - 328,447 4.37CREF Stock - - 1,830,235 24.37Global Equity - - 2,158,682 28.74
Fixed Income
CREF Bond Market - - 215,333 2.87CREF Inflation-Linked Bond - - 96,983 1.29Fixed Income - - 312,316 4.16
Fixed Account
TIAA Traditional GSRA - - 3,591,006 47.81
Real Estate
TIAA Real Estate - - 399,944 5.32
Specialty Equity
CREF Social Choice - - 219,114 2.92
Cash & Equivalents
CREF Money Market - - 240,671 3.20Loan Default Fund - - 7,033 0.09Cash & Equivalents - - 247,703 3.30
LPS 403(b) Legacy - - 7,511,489 100.00
Asset Allocation - 403(b) Legacy
21

Sep-2015 Dec-2015
($) % ($) %
Large Cap Equity
CREF Equity Index - - 66,772 2.56CREF Growth - - 64,958 2.49Total Large Cap Equity - - 131,730 5.05
Global Equity
CREF Global Equities - - 29,905 1.15CREF Stock - - 425,284 16.31Total Global Equity - - 455,189 17.46
Fixed Income
CREF Bond Market - - 91,969 3.53CREF Inflation-Linked Bond - - 58,173 2.23Total Fixed Income - - 150,141 5.76
Fixed Account
TIAA Traditional GSRA - - 1,559,763 59.82
Real Estate
TIAA Real Estate - - 111,308 4.27
Specialty Equity
CREF Social Choice - - 56,170 2.15
Cash
CREF Money Market - - 142,994 5.48
457(b) Legacy Total Fund - - 2,607,296 100.00
Asset Allocation - 457 Legacy
22

LastQuarter
20151
Year3
Years5
Years7
Years10
Years
Large Cap Equity
CREF Equity Index 6.18 0.17 0.17 14.28 11.74 14.59 6.94S&P 500 Index 7.04 1.38 1.38 15.13 12.57 14.81 7.31
CREF Growth 7.93 6.40 6.40 17.77 13.88 17.03 8.35S&P 500 Growth 7.86 5.52 5.52 17.19 14.06 16.56 8.70
Global Equity
CREF Global Equities 4.85 -0.40 -0.40 9.71 7.61 11.57 4.99MSCI World (net) 5.50 -0.87 -0.87 9.63 7.59 11.14 4.98
CREF Stock 4.96 -0.91 -0.91 10.46 8.48 12.61 5.77MSCI AC World IMI (Net) 4.91 -2.19 -2.19 7.86 6.11 11.17 4.99
Fixed Income
CREF Bond Market -0.58 0.43 0.43 1.27 3.18 4.22 4.09Barclays Aggregate Index -0.57 0.55 0.55 1.44 3.25 4.09 4.52
CREF Inflation-Linked Bond -0.94 -1.74 -1.74 -2.60 2.16 3.72 3.48Barclays U.S. Treasury: U.S. TIPS Index -0.64 -1.44 -1.44 -2.27 2.55 4.31 3.94
Fixed Account
TIAA Traditional GRA-401(a) 1.00 3.84 3.84 3.69 3.63 3.75 3.93Ryan 3 Yr GIC Master Index 0.31 1.16 1.16 1.09 1.43 2.16 2.82
TIAA Traditional GSRA-403(b) & 457 0.98 3.90 3.90 3.69 3.64 N/A N/ARyan 3 Yr GIC Master Index 0.31 1.16 1.16 1.09 1.43 2.16 2.82
Real Estate
TIAA Real Estate 1.63 8.16 8.16 11.97 11.80 5.26 4.78NCREIF ODCE 3.34 15.02 15.02 13.81 13.66 6.47 6.53
Specialty Equity
CREF Social Choice 2.97 -0.94 -0.94 7.28 6.89 9.70 5.3920%S&P500,20%S&P500V,60%BCAgg 2.44 0.83 0.83 6.83 7.06 8.56 6.03
Cash & Equivalents
CREF Money Market 0.02 0.02 0.02 0.01 0.03 0.11 1.3790 Day U.S. Treasury Bill 0.00 0.03 0.03 0.04 0.06 0.08 1.22
Table of Returns
TIAA Traditional Annuity Returns show current quarter's credit rate.
23

THIS PAGE LEFT INTENTIONALLY BLANK
INTEGRITY. BALANCE. OBJECTIVITY.
24

Criteria
Organization People Philosophy& Process
StyleConsistency Asset Base Performance Expenses Overall
Costs
Exp Ratio(%)
MedianExp Ratio
(%)
Ratio ofExp to
Median (%)Dodge & Cox Stock (DODGX) 0.52 1.07 48.60Vanguard 500 Index;Adm (VFIAX) 0.05 1.10 4.55Harbor:Cap Apprec;Inst (HACAX) 0.64 1.13 56.64BlackRock:MC Val Opp;I (MARFX) 0.90 1.25 72.00Vanguard Md-Cp Idx;Adm (VIMAX) 0.09 1.19 7.56Janus Enterprise;N (JDMNX) 0.67 1.30 51.54DFA US Small Cap Val;I (DFSVX) 0.52 1.28 40.63Vanguard Sm-Cp Idx;Adm (VSMAX) 0.09 1.22 7.38Voya:SmCp Opptys;R6 (ISOZX) 1.02 1.43 71.33Am Beacon:Intl Eq;Inst (AAIEX) 0.70 1.11 63.06Vanguard Tot I Stk;Adm (VTIAX) 0.12 1.18 10.17American Funds EuPc;R-6 (RERGX) 0.49 1.20 40.83Met West:Total Return;I (MWTIX) 0.44 0.76 57.89Vanguard Tot Bd;Adm (VBTLX) 0.07 0.76 9.21TIAA-Traditional 0.00 0.00 0.00TIAA-CREF:Soc Ch Eq;Inst (TISCX) 0.18 1.19 15.13Vanguard Prime MM;Adm (VMRXX) 0.10 0.55 18.18Vanguard Target Date Funds 0.15 1.00 15.00
Legend For Overall CriteriaNo/Minimum ConcernsMinor ConcernMajor ConcernUnder Review
New No/Minimum ConcernsUpgrade to Minor ConcernDowngrade to Minor ConcernNew Major Concern
Manager Score Factor CommentsTIAA-Traditional People Lead PM David Brown, responsible for the portfolio strategy, asset allocation and risk-adjusted targets of the TIAA General
Account, recently retired. Lisa Black, Co-PM and head of Global Public Markets, is acting CIO until a replacement can be found.The General Account has two additional Co-PMs. Heather Davis is responsible for the Global Private Markets and ThomasGarbutt runs the Global Real Estate.
TIAA-Traditional Exp Ratio (BasisPoints)
Expenses cannot be determined as it is a spread product.
Manager Score Card
INTEGRITY. BALANCE. OBJECTIVITY.
25

FUND INFORMATION
ROLLING 3 YEAR RETURN AND PERCENTILE RANKINGS
PEER GROUP ANALYSIS - IM U.S. Large Cap Value Equity (MF)
CALENDAR YEAR RETURNS AND PERCENTILE RANKINGS
RISK VS. RETURN (5 YEARS*)
*If less than 5 years, data is since inception of fund share class.
Firm and Management:The Stock Fund is managed by theInvestment Policy Committee. The ninemembers of this committee have anaverage tenure at Dodge & Cox of 26years. They have responsibility for thedevelopment and implementation of theinvestment strategy. The team issupported by a strong analyst team andvarious research assistants.
Investment Strategy:The Fund invests primarily in adiversified portfolio of common stocks.In selecting investments, the Fundinvests in companies that, in Dodge &Cox’s opinion, appear to be temporarilyundervalued by the stock market buthave a favorable outlook for long-termgrowth. The Fund focuses on theunderlying financial condition andprospects of individual companies,including future earnings, cash flow anddividends. Various other factors,including financial strength, economiccondition, competitive advantage,quality of the business franchise andthe reputation, experience andcompetence of a company'smanagement are weighed againstvaluation in selecting individualsecurities.
Innovest's Assessment:Dodge & Cox’s collaborative,fundamental research approach isexpected to generate shareholder valueover full market cycles and whenmarkets reward the firm’s contrarianstyle. Conversely, performance maysuffer during periods driven by moremacroeconomic events, or a disregardfor company specific valuation andfundamentals.
-16.0
-10.0
-4.0
2.0
8.0
14.0
20.0
Ret
urn
LastQuarter
YearTo Date
1Year
3Years
5Years
7Years
10Years
Dodge & Cox Stock 4.54 (71) -4.49 (62) -4.49 (62) 14.01 (13) 11.64 (12) 14.52 (6) 5.69 (44)
S&P 500 Value 6.05 (16) -3.13 (33) -3.13 (33) 12.83 (33) 10.96 (25) 12.96 (29) 5.80 (41)
Median 5.11 -3.81 -3.81 12.23 9.86 12.24 5.51
0.0
3.0
6.0
9.0
12.0
15.0
Ret
urn
(%)
3.0 6.0 9.0 12.0 15.0 18.0Risk (Standard Deviation %)
Return StandardDeviation
Dodge & Cox Stock 11.64 13.37
S&P 500 Value 10.96 12.19
Median 9.86 12.52
2014 2013 2012 2011 2010 2009 2008Dodge & Cox Stock 10.40 (63) 40.55 (3) 22.01 (2) -4.08 (71) 13.49 (38) 31.27 (16) -43.31 (91)S&P 500 Value 12.36 (20) 31.99 (58) 17.68 (20) -0.48 (32) 15.10 (23) 21.18 (64) -39.22 (67)IM U.S. Large Cap Value Equity (MF) Median 10.88 32.67 15.32 -2.32 12.64 24.10 -36.83
3Years
EndingDec-2015
3Years
EndingDec-2014
3Years
EndingDec-2013
3Years
EndingDec-2012
3Years
EndingDec-2011
3Years
EndingDec-2010
3Years
EndingDec-2009
Dodge & Cox Stock 14.01 (13) 23.71 (1) 18.04 (4) 9.92 (21) 12.63 (27) -5.48 (75) -9.34 (80)S&P 500 Value 12.83 (33) 20.40 (34) 15.62 (32) 10.47 (13) 11.55 (41) -5.36 (72) -9.10 (76)IM U.S. Large Cap Value Equity (MF) Median 12.23 19.52 14.62 8.38 11.13 -4.17 -7.18
Dodge & Cox Stock 12/31/15
INTEGRITY. BALANCE. OBJECTIVITY.
26

TOP 10 HOLDINGS
STYLE MAP (02/01/65 - 12/31/15)
SECTOR ALLOCATIONASSET ALLOCATION
PORTFOLIO CHARACTERISTICS
UP/DOWN CAPTURE (01/01/11 - 12/31/15)
Wells Fargo & Co ORD 4.16 %Capital One Financial Corp ORD 4.05 %HP Inc ORD 3.96 %Time Warner Cable Inc ORD 3.85 %Microsoft Corp ORD 3.66 %Bank of America Corp ORD 3.28 %Novartis AG DR 3.23 %Charles Schwab Corp ORD 3.11 %Time Warner Inc ORD 2.85 %Sanofi SA DR 2.81 %
Total Securities 69Avg. Market Cap $102,311 MillionP/E 20.57P/B 2.71Div. Yield 2.38%Annual EPS 7.095Yr EPS 11.343Yr EPS Growth 10.02
3 Years 5 Yearsvs. S&P 500 ValueBeta 1.06 1.07
Dodge & Cox Stock S&P 500 Value
0.0 6.0 12.0 18.0 24.0 30.0 36.0
UtilitiesTelecommunication Services
MaterialsInformation Technology
IndustrialsHealth Care
FinancialsEnergy
Consumer StaplesConsumer Discretionary
Other
0.0% 50.0% 100.0% 150.0%-50.0 %
Other
Fixed Income
Convertibles
Cash
Equities
-0.1 %
0.0%
0.0%
1.4%
98.6%
Style History Dec-2015
Average Style Exposure
Cap
italiz
atio
n
Manager Style
Large Cap Growth
Small Cap GrowthSmall Cap Value
Large Cap Value
Dodge & Cox Stock
50.0
75.0
100.0
125.0
150.0U
p C
aptu
re
50.0 70.0 90.0 110.0 130.0 150.0Down Capture
Dodge & Cox Stock 12/31/15
INTEGRITY. BALANCE. OBJECTIVITY.
27

FUND INFORMATION
ROLLING 3 YEAR RETURN AND PERCENTILE RANKINGS
PEER GROUP ANALYSIS - IM U.S. Large Cap Core Equity (MF)
CALENDAR YEAR RETURNS AND PERCENTILE RANKINGS
RISK VS. RETURN (5 YEARS*)
*If less than 5 years, data is since inception of fund share class.
Firm and Management:Michael Buek has been lead managerof this fund since the spring of 2005.Buek worked closely with previousmanager and current Vanguard chiefinvestment officer Gus Sauter on thisfund since 1991 and has been withVanguard since 1987.
Investment Strategy:The core of this Fund's strategy issimple: It buys and holds the stocksthat make up the S&P 500 Index. TheFund attempts to add value on themargins by opportunistically buyingfutures contracts, among othertechniques, and actively tries to reducetrading costs.
-10.0
-4.0
2.0
8.0
14.0
20.0
26.0
Ret
urn
LastQuarter
YearTo Date
1Year
3Years
5Years
7Years
10Years
Vanguard 500 Index 7.04 (23) 1.36 (27) 1.36 (27) 15.09 (17) 12.53 (16) 14.81 (22) 7.30 (23)
S&P 500 Index 7.04 (23) 1.38 (27) 1.38 (27) 15.13 (16) 12.57 (15) 14.81 (22) 7.31 (23)
Median 6.23 -0.48 -0.48 13.58 11.04 13.59 6.38
3.0
6.0
9.0
12.0
15.0
Ret
urn
(%)
6.0 9.0 12.0 15.0 18.0Risk (Standard Deviation %)
Return StandardDeviation
Vanguard 500 Index 12.53 11.59
S&P 500 Index 12.57 11.60
Median 11.04 12.07
2014 2013 2012 2011 2010 2009 2008Vanguard 500 Index 13.64 (17) 32.33 (42) 15.96 (41) 2.08 (24) 15.05 (26) 26.62 (50) -36.97 (48)S&P 500 Index 13.69 (17) 32.39 (40) 16.00 (39) 2.11 (24) 15.06 (25) 26.46 (51) -37.00 (48)IM U.S. Large Cap Core Equity (MF) Median 11.37 31.84 15.41 -0.40 13.18 26.47 -37.17
3Years
EndingDec-2015
3Years
EndingDec-2014
3Years
EndingDec-2013
3Years
EndingDec-2012
3Years
EndingDec-2011
3Years
EndingDec-2010
3Years
EndingDec-2009
Vanguard 500 Index 15.09 (17) 20.37 (28) 16.14 (27) 10.85 (18) 14.14 (26) -2.80 (41) -5.58 (53)S&P 500 Index 15.13 (16) 20.41 (27) 16.18 (27) 10.87 (18) 14.11 (26) -2.85 (42) -5.63 (53)IM U.S. Large Cap Core Equity (MF) Median 13.58 19.29 14.92 9.28 12.91 -3.27 -5.44
Vanguard 500 Index 12/31/15
INTEGRITY. BALANCE. OBJECTIVITY.
28

TOP 10 HOLDINGS
STYLE MAP (12/01/00 - 12/31/15)
SECTOR ALLOCATIONASSET ALLOCATION
PORTFOLIO CHARACTERISTICS
UP/DOWN CAPTURE (01/01/11 - 12/31/15)
Apple Inc ORD 3.70 %Microsoft Corp ORD 2.29 %Exxon Mobil Corp ORD 1.87 %General Electric Co ORD 1.59 %Johnson & Johnson ORD 1.52 %Wells Fargo & Co ORD 1.37 %Amazon.com Inc ORD 1.30 %JPMorgan Chase & Co ORD 1.29 %Berkshire Hathaway Inc ORD 1.29 %Facebook Inc ORD 1.25 %
Total Securities 512Avg. Market Cap $135,031 MillionP/E 24.94P/B 5.61Div. Yield 2.48%Annual EPS 10.065Yr EPS 14.413Yr EPS Growth 11.49
3 Years 5 Yearsvs. S&P 500 IndexBeta 1.00 1.00
Vanguard 500 Index S&P 500 Index
0.0 5.0 10.0 15.0 20.0 25.0 30.0
UtilitiesTelecommunication Services
MaterialsInformation Technology
IndustrialsHealth Care
FinancialsEnergy
Consumer StaplesConsumer Discretionary
Other
0.0% 25.0% 50.0% 75.0% 100.0% 125.0%
Convertibles
Cash
Fixed Income
Other
Equities
0.0%
0.0%
0.0%
0.4%
99.5%
Style History Dec-2015
Average Style Exposure
Cap
italiz
atio
n
Manager Style
Large Cap Growth
Small Cap GrowthSmall Cap Value
Large Cap Value
Vanguard 500 Index
50.0
75.0
100.0
125.0
150.0U
p C
aptu
re
50.0 70.0 90.0 110.0 130.0 150.0Down Capture
Vanguard 500 Index 12/31/15
INTEGRITY. BALANCE. OBJECTIVITY.
29

FUND INFORMATION
ROLLING 3 YEAR RETURN AND PERCENTILE RANKINGS
PEER GROUP ANALYSIS - IM U.S. Large Cap Growth Equity (MF)
CALENDAR YEAR RETURNS AND PERCENTILE RANKINGS
RISK VS. RETURN (5 YEARS*)
*If less than 5 years, data is since inception of fund share class.
Firm and Management:The fund is sub-advised by JennisonAssociates, which was co-founded bySig Segalas in 1969. Mr. Segalas co-manages the fund with KathleenMcCarragher, and they are supportedby three other portfolio managers, whohave an average tenure of 25 yearswith Jennison, and 11 growth equityanalysts, who have been with Jennisonfor an average of 11 years.
Investment Strategy:The fund seeks large cap companiesthat are growing revenues faster thanthe S&P 500 average and have durablegrowth prospects driven by strongbalance sheets, strong R&Dcapabilities, and defensible franchises.Mr. Segalas also prefers revenuegrowth resulting from strong increasesin unit sales. In addition, because Mr.Segalas is willing to pay a premium forstrong growth prospects, the fund'svaluation metrics tend to be aboveaverage.
Innovest's Assessment:The fund will tend to outperform duringperiods of average earnings growthbecause portfolio companies will bemore apt to experience earnings growththat exceeds the average. In contrast,during periods when earnings for mostcompanies are contracting, the fundmay underperform the benchmark.Likewise, the fund may underperformwhen strong fundamental value isrewarded and secondary growthmeasurements are overlooked.
-5.0
0.0
5.0
10.0
15.0
20.0
25.0
Ret
urn
LastQuarter
YearTo Date
1Year
3Years
5Years
7Years
10Years
Harbor Cap Apprec 8.09 (40) 10.99 (6) 10.99 (6) 18.87 (11) 14.35 (13) 17.52 (19) 8.38 (26)
S&P 500 Growth 7.86 (45) 5.52 (50) 5.52 (50) 17.19 (30) 14.06 (18) 16.56 (37) 8.70 (19)
Median 7.69 5.47 5.47 16.17 12.29 15.84 7.48
3.0
6.0
9.0
12.0
15.0
18.0
Ret
urn
(%)
6.0 9.0 12.0 15.0 18.0Risk (Standard Deviation %)
Return StandardDeviation
Harbor Cap Apprec 14.35 13.46
S&P 500 Growth 14.06 11.43
Median 12.29 13.05
2014 2013 2012 2011 2010 2009 2008Harbor Cap Apprec 9.93 (59) 37.66 (17) 15.69 (44) 0.61 (26) 11.61 (79) 41.88 (25) -37.13 (22)S&P 500 Growth 14.89 (6) 32.75 (65) 14.61 (56) 4.65 (4) 15.05 (51) 31.57 (73) -34.92 (7)IM U.S. Large Cap Growth Equity (MF) Median 10.54 34.12 14.95 -1.76 15.09 35.04 -39.82
3Years
EndingDec-2015
3Years
EndingDec-2014
3Years
EndingDec-2013
3Years
EndingDec-2012
3Years
EndingDec-2011
3Years
EndingDec-2010
3Years
EndingDec-2009
Harbor Cap Apprec 18.87 (11) 20.52 (35) 17.02 (18) 9.11 (50) 16.79 (30) -0.15 (22) 0.04 (19)S&P 500 Growth 17.19 (30) 20.46 (36) 16.77 (21) 11.33 (15) 16.57 (34) -0.50 (28) -2.24 (48)IM U.S. Large Cap Growth Equity (MF) Median 16.17 19.75 15.01 9.11 15.32 -2.15 -2.38
Harbor Cap Apprec 12/31/15
INTEGRITY. BALANCE. OBJECTIVITY.
30

TOP 10 HOLDINGS
STYLE MAP (01/01/88 - 12/31/15)
SECTOR ALLOCATIONASSET ALLOCATION
PORTFOLIO CHARACTERISTICS
UP/DOWN CAPTURE (01/01/11 - 12/31/15)
Apple Inc ORD 5.52 %Amazon.com Inc ORD 4.35 %Facebook Inc ORD 3.96 %MasterCard Inc ORD 3.39 %Nike Inc ORD 3.07 %Visa Inc ORD 3.05 %Alphabet Inc ORD 1 2.59 %Alphabet Inc ORD 2 2.58 %Netflix Inc ORD 2.56 %Starbucks Corp ORD 2.28 %
Total Securities 66Avg. Market Cap $123,485 MillionP/E 34.33P/B 9.83Div. Yield 1.44%Annual EPS 21.225Yr EPS 27.063Yr EPS Growth 22.97
3 Years 5 Yearsvs. S&P 500 GrowthBeta 1.03 1.11
Harbor Cap Apprec S&P 500 Growth
0.0 8.0 16.0 24.0 32.0 40.0
UtilitiesTelecommunication Services
MaterialsInformation Technology
IndustrialsHealth Care
FinancialsEnergy
Consumer StaplesConsumer Discretionary
Other
0.0% 25.0% 50.0% 75.0% 100.0% 125.0%
Other
Fixed Income
Convertibles
Cash
Equities
0.0%
0.0%
0.0%
3.0%
97.0%
Style History Dec-2015
Average Style Exposure
Cap
italiz
atio
n
Manager Style
Large Cap Growth
Small Cap GrowthSmall Cap Value
Large Cap Value
Harbor Cap Apprec
50.0
75.0
100.0
125.0
150.0U
p C
aptu
re
50.0 70.0 90.0 110.0 130.0 150.0Down Capture
Harbor Cap Apprec 12/31/15
INTEGRITY. BALANCE. OBJECTIVITY.
31

FUND INFORMATION
ROLLING 3 YEAR RETURN AND PERCENTILE RANKINGS
PEER GROUP ANALYSIS - IM U.S. Mid Cap Value Equity (MF)
CALENDAR YEAR RETURNS AND PERCENTILE RANKINGS
RISK VS. RETURN (5 YEARS*)
*If less than 5 years, data is since inception of fund share class.
Firm and Management:Murali Balaraman, CFA and JohnCoyle, CFA have been workingtogether for over 10 years. Both cameto BlackRock through the merger withMerrill Lynch Investment Managers in2005. The majority of their timemanaging together has been on a smallcap global equity strategy, however,they bring that global perspective to theU.S. market through their stockselection process.
Investment Strategy:The BlackRock Mid Cap ValueOpportunities Fund is a bottom-up,fundamental research focused teamthat seeks to identify out-of-favornames with strong upside potential.The team focuses on companiestrading at the low end of their historicalvaluations and draws on BlackRock'srobust pool of equity and fixed incomeresearch analysts as well as their ownteam's global small cap knowledge toaid them in their decision-makingprocess.
Innovest's Assessment:The strategy should be expected tooutperform when globally focusedcompanies and lesser capitalizedcompanies are doing well. It shouldunderperform in markets where moreregional firms in fragmented regionalmarkets are experiencing outsizedgrowth or when domestically focusedfirms are leading.
-20.0
-12.0
-4.0
4.0
12.0
20.0
28.0
Ret
urn
LastQuarter
YearTo Date
1Year
3Years
5Years
7Years
10Years
BlackRock:MC Val Opp 1.43 (73) -6.69 (69) -6.69 (69) 10.00 (83) 8.57 (70) 14.52 (72) 6.98 (40)
Russell Midcap Value Index 3.12 (40) -4.78 (55) -4.78 (55) 13.40 (36) 11.25 (22) 16.16 (33) 7.61 (20)
Median 2.73 -3.86 -3.86 12.69 9.97 15.68 6.61
4.0
6.0
8.0
10.0
12.0
14.0
Ret
urn
(%)
6.0 9.0 12.0 15.0 18.0 21.0Risk (Standard Deviation %)
Return StandardDeviation
BlackRock:MC Val Opp 8.57 14.16
Russell Midcap Value Index 11.25 12.54
Median 9.97 13.41
2014 2013 2012 2011 2010 2009 2008BlackRock:MC Val Opp 6.68 (81) 33.72 (73) 13.62 (86) -0.26 (13) 26.07 (25) 35.86 (55) -35.72 (26)Russell Midcap Value Index 14.75 (12) 33.46 (76) 18.51 (24) -1.38 (28) 24.75 (35) 34.21 (59) -38.44 (55)IM U.S. Mid Cap Value Equity (MF) Median 10.06 35.97 16.17 -3.91 22.33 36.85 -38.05
3Years
EndingDec-2015
3Years
EndingDec-2014
3Years
EndingDec-2013
3Years
EndingDec-2012
3Years
EndingDec-2011
3Years
EndingDec-2010
3Years
EndingDec-2009
BlackRock:MC Val Opp 10.00 (83) 17.46 (89) 14.86 (57) 12.63 (25) 19.54 (22) 3.26 (25) -3.09 (20)Russell Midcap Value Index 13.40 (36) 21.98 (22) 15.97 (31) 13.39 (16) 18.19 (35) 1.01 (54) -6.62 (67)IM U.S. Mid Cap Value Equity (MF) Median 12.69 20.33 15.16 11.15 17.56 1.24 -5.44
BlackRock:MC Val Opp 12/31/15
INTEGRITY. BALANCE. OBJECTIVITY.
32

TOP 10 HOLDINGS
STYLE MAP (03/01/95 - 12/31/15)
SECTOR ALLOCATIONASSET ALLOCATION
PORTFOLIO CHARACTERISTICS
UP/DOWN CAPTURE (01/01/11 - 12/31/15)
Owens & Minor Inc ORD 2.01 %Teleflex Inc ORD 1.91 %BlackRock Liquidity TempFund;Institutional 1.75 %Tanger Factory Outlet Centers Inc 1.67 %Albemarle Corp ORD 1.55 %Energen Corp ORD 1.53 %New York Community Bancorp Inc ORD 1.52 %Expeditors International of Washington Inc ORD 1.51 %Orbital ATK Inc ORD 1.43 %Alexander & Baldwin Inc ORD 1.41 %
Total Securities 121Avg. Market Cap $5,541 MillionP/E 24.85P/B 2.48Div. Yield 2.48%Annual EPS 12.855Yr EPS 9.533Yr EPS Growth 8.55
3 Years 5 Yearsvs. Russell Midcap Value IndexBeta 1.08 1.10
BlackRock:MC Val Opp Russell Midcap Value Index
0.0 8.0 16.0 24.0 32.0 40.0 48.0
UtilitiesTelecommunication Services
MaterialsInformation Technology
IndustrialsHealth Care
FinancialsEnergy
Consumer StaplesConsumer Discretionary
Other
0.0% 25.0% 50.0% 75.0% 100.0% 125.0%
Fixed Income
Convertibles
Other
Cash
Equities
0.0%
0.0%
0.8%
2.0%
97.2%
Style History Dec-2015
Average Style Exposure
Cap
italiz
atio
n
Manager Style
Large Cap Growth
Small Cap GrowthSmall Cap Value
Large Cap Value
BlackRock:MC Val Opp
50.0
75.0
100.0
125.0
150.0U
p C
aptu
re
50.0 70.0 90.0 110.0 130.0 150.0Down Capture
BlackRock:MC Val Opp 12/31/15
INTEGRITY. BALANCE. OBJECTIVITY.
33

FUND INFORMATION
ROLLING 3 YEAR RETURN AND PERCENTILE RANKINGS
PEER GROUP ANALYSIS - IM U.S. Mid Cap Core Equity (MF)
CALENDAR YEAR RETURNS AND PERCENTILE RANKINGS
RISK VS. RETURN (5 YEARS*)
*If less than 5 years, data is since inception of fund share class.
Firm and Management:Donald Butler is the manager here.Although he was only named leadmanager in April 2005, he has beenwith Vanguard since 1992 and hasworked on this fund since its May 1998inception. Butler also handles the day-to-day management of VanguardExtended Market Index VEXMX andVanguard Institutional Index VINIX.
Investment Strategy:The Fund tracks the CRSP US Mid CapIndex. The CRSP US Mid Cap Indextargets inclusion of the U.S. companiesthat fall between the top 70%-80% ofinvestable market capitalization. Theindex includes securities traded onNYSE, NYSE Market, NASDAQ orARCA. -20.0
-12.0
-4.0
4.0
12.0
20.0
28.0
Ret
urn
LastQuarter
YearTo Date
1Year
3Years
5Years
7Years
10Years
Vanguard Midcap Index 3.45 (30) -1.46 (25) -1.46 (25) 14.76 (10) 11.37 (14) 17.07 (6) 7.76 (17)
CRSP U.S. Mid Cap TR Index 3.46 (30) -1.28 (22) -1.28 (22) 14.98 (7) 11.74 (7) 17.04 (6) 8.01 (13)
Median 2.90 -3.54 -3.54 11.95 9.18 14.33 6.38
2.0
4.0
6.0
8.0
10.0
12.0
14.0
Ret
urn
(%)
6.0 9.0 12.0 15.0 18.0Risk (Standard Deviation %)
Return StandardDeviation
Vanguard Midcap Index 11.37 13.12
CRSP U.S. Mid Cap TR Index 11.74 12.82
Median 9.18 13.65
2014 2013 2012 2011 2010 2009 2008Vanguard Midcap Index 13.60 (10) 35.00 (44) 15.80 (54) -2.11 (34) 25.46 (19) 40.22 (18) -41.82 (70)CRSP U.S. Mid Cap TR Index 13.83 (8) 35.27 (39) 16.70 (44) -1.79 (31) 26.16 (12) 36.90 (29) -41.83 (70)IM U.S. Mid Cap Core Equity (MF) Median 9.18 34.28 16.03 -3.41 22.91 32.94 -38.81
3Years
EndingDec-2015
3Years
EndingDec-2014
3Years
EndingDec-2013
3Years
EndingDec-2012
3Years
EndingDec-2011
3Years
EndingDec-2010
3Years
EndingDec-2009
Vanguard Midcap Index 14.76 (10) 21.10 (18) 15.24 (36) 12.46 (21) 19.86 (14) 0.77 (43) -4.72 (45)CRSP U.S. Mid Cap TR Index 14.98 (7) 21.57 (9) 15.73 (27) 13.08 (10) 19.26 (17) 0.15 (52) -5.19 (52)IM U.S. Mid Cap Core Equity (MF) Median 11.95 19.32 14.43 11.13 16.15 0.30 -4.98
Vanguard Midcap Index 12/31/15
INTEGRITY. BALANCE. OBJECTIVITY.
34

TOP 10 HOLDINGS
STYLE MAP (06/01/98 - 12/31/15)
SECTOR ALLOCATIONASSET ALLOCATION
PORTFOLIO CHARACTERISTICS
UP/DOWN CAPTURE (01/01/11 - 12/31/15)
AvalonBay Communities Inc ORD 0.76 %Fiserv Inc ORD 0.71 %Ross Stores Inc ORD 0.67 %Electronic Arts Inc ORD 0.63 %Roper Technologies Inc ORD 0.61 %Hartford Financial Services Group Inc ORD 0.59 %Incyte Corp ORD 0.58 %Cerner Corp ORD 0.58 %Chipotle Mexican Grill Inc ORD 0.57 %M&T Bank Corp ORD 0.57 %
Total Securities 373Avg. Market Cap $11,977 MillionP/E 27.73P/B 5.09Div. Yield 2.21%Annual EPS 19.595Yr EPS 16.833Yr EPS Growth 15.94
3 Years 5 Yearsvs. CRSP U.S. Mid Cap TR IndexBeta 1.00 1.02
Vanguard Midcap Index CRSP U.S. Mid Cap TR Index
0.0 4.0 8.0 12.0 16.0 20.0 24.0
UtilitiesTelecommunication Services
MaterialsInformation Technology
IndustrialsHealth Care
FinancialsEnergy
Consumer StaplesConsumer Discretionary
Other
0.0% 25.0% 50.0% 75.0% 100.0% 125.0%
Convertibles
Cash
Fixed Income
Other
Equities
0.0%
0.0%
0.0%
0.3%
99.7%
Style History Dec-2015
Average Style Exposure
Cap
italiz
atio
n
Manager Style
Large Cap Growth
Small Cap GrowthSmall Cap Value
Large Cap Value
Vanguard Midcap Index
50.0
75.0
100.0
125.0
150.0U
p C
aptu
re
50.0 70.0 90.0 110.0 130.0 150.0Down Capture
Vanguard Midcap Index 12/31/15
INTEGRITY. BALANCE. OBJECTIVITY.
35

FUND INFORMATION
ROLLING 3 YEAR RETURN AND PERCENTILE RANKINGS
PEER GROUP ANALYSIS - IM U.S. Mid Cap Growth Equity (MF)
CALENDAR YEAR RETURNS AND PERCENTILE RANKINGS
RISK VS. RETURN (5 YEARS*)
*If less than 5 years, data is since inception of fund share class.
Firm and Management:Lead manager Chris McHugh has runthe fund successfully since its 1996inception. He started as an analyst withTurner Investment Partners in 1990and has been a member of itstechnology sector team since then.Longtime analysts Tara Hedlund andJason Schrotberger came aboard ascomanagers in September 2006. Agroup of sector-focused analystscontribute ideas to this and otherTurner funds.
Investment Strategy:This fund hunts for stocks that exhibitaccelerating earnings growth andpositive price trends. Management willpay a premium for its high-momentumpicks. That leads it to high-P/E stockswith sometimes stratospheric growthrates. It's pretty finicky about staying inmid-cap territory, and it keeps its sectorweightings in line with the RussellMidcap Growth Index's.
Innovest's Assessment:The strategy should be expected tooutperform during high growth rallieswhen momentum is driving stock priceshigher and when technology stocks areleading. The strategy should beexpected to underperform during downmarkets and when investors are beingpunished for positions that haveextended valuations.
-20.0
-12.0
-4.0
4.0
12.0
20.0
28.0
Ret
urn
LastQuarter
YearTo Date
1Year
3Years
5Years
7Years
10Years
Janus Enterprise;I 4.86 (13) 3.49 (13) 3.49 (13) 14.90 (25) 11.94 (15) N/A N/A¢£
Russell Midcap Growth Index 4.12 (33) -0.20 (49) -0.20 (49) 14.88 (25) 11.54 (21) 18.04 (9) 8.16 (29)��
Median 2.87 -0.49 -0.49 13.14 9.78 15.40 7.35
-5.0
0.0
5.0
10.0
15.0
Ret
urn
(%)
9.0 12.0 15.0 18.0 21.0Risk (Standard Deviation %)
Return StandardDeviation
Janus Enterprise;I 11.94 11.60¢£
Russell Midcap Growth Index 11.54 13.61��
Median 9.78 14.11¾
2014 2013 2012 2011 2010 2009 2008Janus Enterprise;I 12.01 (12) 30.86 (77) 17.83 (16) -1.65 (29) 26.06 (46) N/A N/ARussell Midcap Growth Index 11.90 (13) 35.74 (48) 15.81 (30) -1.65 (28) 26.38 (44) 46.29 (24) -44.32 (46)IM U.S. Mid Cap Growth Equity (MF) Median 7.40 35.50 14.18 -4.65 25.34 40.04 -45.01
3Years
EndingDec-2015
3Years
EndingDec-2014
3Years
EndingDec-2013
3Years
EndingDec-2012
3Years
EndingDec-2011
3Years
EndingDec-2010
3Years
EndingDec-2009
Janus Enterprise;I 14.90 (25) 19.98 (30) 14.89 (32) 13.47 (13) N/A N/A N/ARussell Midcap Growth Index 14.88 (25) 20.71 (19) 15.63 (22) 12.91 (20) 22.06 (16) 0.97 (37) -3.18 (53)IM U.S. Mid Cap Growth Equity (MF) Median 13.14 18.37 13.90 11.11 18.72 -0.79 -2.99
Janus Enterprise;I 12/31/15
INTEGRITY. BALANCE. OBJECTIVITY.
36

TOP 10 HOLDINGS
STYLE MAP (08/01/09 - 12/31/15)
SECTOR ALLOCATIONASSET ALLOCATION
PORTFOLIO CHARACTERISTICS
UP/DOWN CAPTURE (01/01/11 - 12/31/15)
Crown Castle International Corp 3.71 %Verisk Analytics Inc ORD 3.04 %Sensata Technologies Holding NV ORD 2.88 %Lamar Advertising Co ORD 2.37 %Boston Scientific Corp ORD 2.27 %Amdocs Ltd ORD 2.02 %Nice-Systems Ltd DR 1.96 %Jack Henry & Associates Inc ORD 1.94 %Cadence Design Systems Inc ORD 1.93 %Gildan Activewear Inc ORD 1.82 %
Total Securities 81Avg. Market Cap $11,642 MillionP/E 29.01P/B 6.08Div. Yield 2.07%Annual EPS 25.105Yr EPS 19.063Yr EPS Growth 19.62
3 Years 5 Yearsvs. Russell Midcap Growth IndexBeta 0.84 0.83
Janus Enterprise;I Russell Midcap Growth Index
0.0 8.0 16.0 24.0 32.0 40.0 48.0
UtilitiesTelecommunication Services
MaterialsInformation Technology
IndustrialsHealth Care
FinancialsEnergy
Consumer StaplesConsumer Discretionary
Other
0.0% 50.0% 100.0% 150.0%-50.0 %
Cash
Fixed Income
Convertibles
Other
Equities
-0.4 %
0.0%
0.0%
6.7%
93.8%
Style History Dec-2015
Average Style Exposure
Cap
italiz
atio
n
Manager Style
Large Cap Growth
Small Cap GrowthSmall Cap Value
Large Cap Value
Janus Enterprise;I
50.0
75.0
100.0
125.0
150.0U
p C
aptu
re
50.0 70.0 90.0 110.0 130.0 150.0Down Capture
Janus Enterprise;I 12/31/15
INTEGRITY. BALANCE. OBJECTIVITY.
37

FUND INFORMATION
ROLLING 3 YEAR RETURN AND PERCENTILE RANKINGS
PEER GROUP ANALYSIS - IM U.S. Small Cap Value Equity (MF)
CALENDAR YEAR RETURNS AND PERCENTILE RANKINGS
RISK VS. RETURN (5 YEARS*)
*If less than 5 years, data is since inception of fund share class.
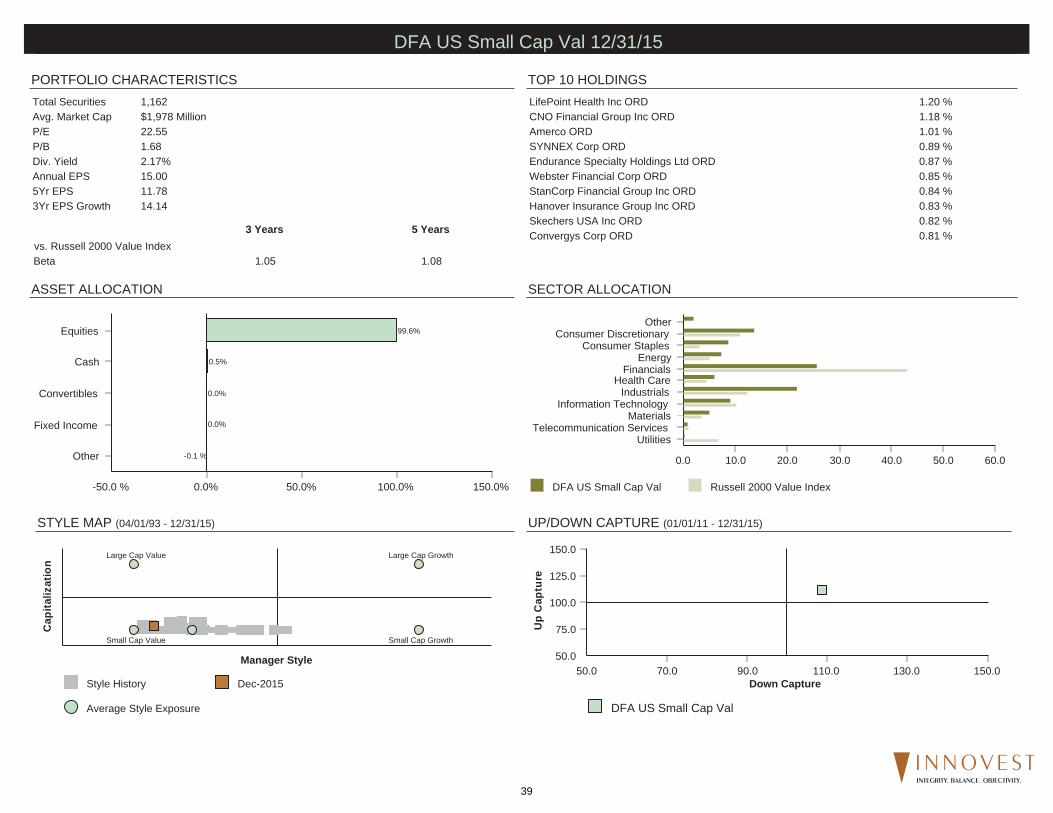
Firm and Management:DFA uses a team approach inmanaging clients' investments, whereno one individual is solely responsiblefor a strategy or account. StephenClark is Dimensional's Head of PortfolioManagement and Vice President and ischairman of the Investment Committee.He joined Dimensional in 2001 as ageneral portfolio manager in U.S.equities, became head of internationalequities trading in 2004 and assumedhis current position in 2006.
Investment Strategy:DFA uses a quantitative structuredapproach to asset class investing.Their investment philosophy is deeplyrooted in the belief that investors arerewarded for the levels of risk taken.Managers structure their portfolios todeliver the return premiums of the smallcap value asset class in a highlyefficient manner. DFA's philosophy inregard to the small cap risk factor hasremained consistent since inception.Refinements to the strategy areevaluated on an ongoing basis and areintroduced upon approval from theInvestment Committee.
Innovest's Assessment:Dimensional is likely to outperformwhen smaller capitalization securitiesare in vogue. Investors must endureperiods where risk has itsconsequences; however, causing thestrategy to underperform during periodswhen smaller companies are out-of-favor.
-30.0
-20.0
-10.0
0.0
10.0
20.0
30.0
Ret
urn
LastQuarter
YearTo Date
1Year
3Years
5Years
7Years
10Years
DFA US Small Cap Val 1.89 (67) -7.81 (62) -7.81 (62) 10.75 (23) 8.86 (23) 15.08 (21) 6.25 (31)
Russell 2000 Value Index 2.88 (44) -7.47 (56) -7.47 (56) 9.06 (50) 7.67 (52) 11.72 (79) 5.57 (50)
Median 2.52 -7.07 -7.07 9.05 7.81 13.27 5.51
-2.5
0.0
2.5
5.0
7.5
10.0
12.5
Ret
urn
(%)
0.0 6.0 12.0 18.0 24.0Risk (Standard Deviation %)
Return StandardDeviation
DFA US Small Cap Val 8.86 16.73
Russell 2000 Value Index 7.67 15.20
Median 7.81 15.27
2014 2013 2012 2011 2010 2009 2008DFA US Small Cap Val 3.48 (46) 42.38 (16) 21.72 (12) -7.55 (83) 30.90 (9) 33.62 (33) -36.79 (69)Russell 2000 Value Index 4.22 (34) 34.52 (56) 18.05 (33) -5.50 (64) 24.50 (60) 20.58 (80) -28.92 (25)IM U.S. Small Cap Value Equity (MF) Median 3.30 35.08 16.25 -3.78 24.99 28.27 -32.16
3Years
EndingDec-2015
3Years
EndingDec-2014
3Years
EndingDec-2013
3Years
EndingDec-2012
3Years
EndingDec-2011
3Years
EndingDec-2010
3Years
EndingDec-2009
DFA US Small Cap Val 10.75 (23) 21.50 (5) 17.02 (17) 13.78 (12) 17.38 (35) 3.41 (49) -8.99 (67)Russell 2000 Value Index 9.06 (50) 18.29 (43) 14.49 (55) 11.57 (49) 12.36 (95) 2.19 (65) -8.22 (55)IM U.S. Small Cap Value Equity (MF) Median 9.05 17.94 14.78 11.50 16.20 3.19 -7.52
DFA US Small Cap Val 12/31/15
INTEGRITY. BALANCE. OBJECTIVITY.
38
TOP 10 HOLDINGS
STYLE MAP (04/01/93 - 12/31/15)
SECTOR ALLOCATIONASSET ALLOCATION
PORTFOLIO CHARACTERISTICS
UP/DOWN CAPTURE (01/01/11 - 12/31/15)
LifePoint Health Inc ORD 1.20 %CNO Financial Group Inc ORD 1.18 %Amerco ORD 1.01 %SYNNEX Corp ORD 0.89 %Endurance Specialty Holdings Ltd ORD 0.87 %Webster Financial Corp ORD 0.85 %StanCorp Financial Group Inc ORD 0.84 %Hanover Insurance Group Inc ORD 0.83 %Skechers USA Inc ORD 0.82 %Convergys Corp ORD 0.81 %
Total Securities 1,162Avg. Market Cap $1,978 MillionP/E 22.55P/B 1.68Div. Yield 2.17%Annual EPS 15.005Yr EPS 11.783Yr EPS Growth 14.14
3 Years 5 Yearsvs. Russell 2000 Value IndexBeta 1.05 1.08
DFA US Small Cap Val Russell 2000 Value Index
0.0 10.0 20.0 30.0 40.0 50.0 60.0
UtilitiesTelecommunication Services
MaterialsInformation Technology
IndustrialsHealth Care
FinancialsEnergy
Consumer StaplesConsumer Discretionary
Other
0.0% 50.0% 100.0% 150.0%-50.0 %
Other
Fixed Income
Convertibles
Cash
Equities
-0.1 %
0.0%
0.0%
0.5%
99.6%
Style History Dec-2015
Average Style Exposure
Cap
italiz
atio
n
Manager Style
Large Cap Growth
Small Cap GrowthSmall Cap Value
Large Cap Value
DFA US Small Cap Val
50.0
75.0
100.0
125.0
150.0U
p C
aptu
re
50.0 70.0 90.0 110.0 130.0 150.0Down Capture
DFA US Small Cap Val 12/31/15
INTEGRITY. BALANCE. OBJECTIVITY.
39
FUND INFORMATION
ROLLING 3 YEAR RETURN AND PERCENTILE RANKINGS
PEER GROUP ANALYSIS - IM U.S. Small Cap Core Equity (MF)
CALENDAR YEAR RETURNS AND PERCENTILE RANKINGS
RISK VS. RETURN (5 YEARS*)
*If less than 5 years, data is since inception of fund share class.
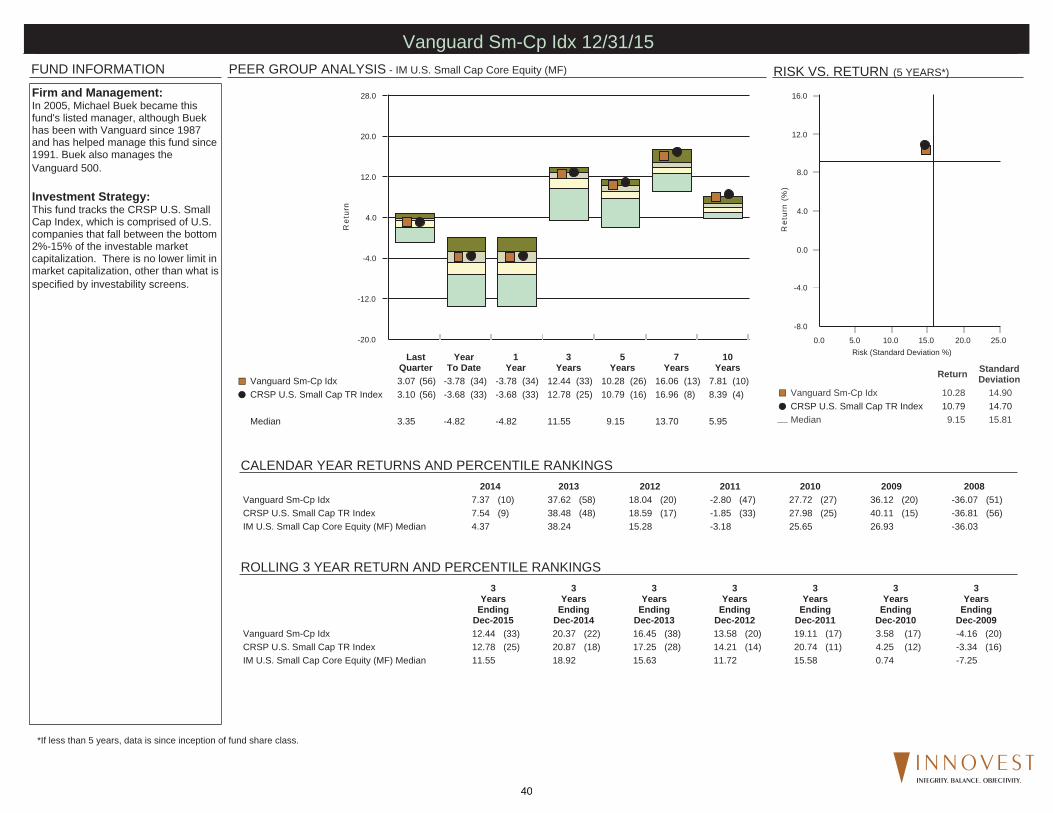
Firm and Management:In 2005, Michael Buek became thisfund's listed manager, although Buekhas been with Vanguard since 1987and has helped manage this fund since1991. Buek also manages theVanguard 500.
Investment Strategy:This fund tracks the CRSP U.S. SmallCap Index, which is comprised of U.S.companies that fall between the bottom2%-15% of the investable marketcapitalization. There is no lower limit inmarket capitalization, other than what isspecified by investability screens.
-20.0
-12.0
-4.0
4.0
12.0
20.0
28.0
Ret
urn
LastQuarter
YearTo Date
1Year
3Years
5Years
7Years
10Years
Vanguard Sm-Cp Idx 3.07 (56) -3.78 (34) -3.78 (34) 12.44 (33) 10.28 (26) 16.06 (13) 7.81 (10)
CRSP U.S. Small Cap TR Index 3.10 (56) -3.68 (33) -3.68 (33) 12.78 (25) 10.79 (16) 16.96 (8) 8.39 (4)
Median 3.35 -4.82 -4.82 11.55 9.15 13.70 5.95
-8.0
-4.0
0.0
4.0
8.0
12.0
16.0
Ret
urn
(%)
0.0 5.0 10.0 15.0 20.0 25.0Risk (Standard Deviation %)
Return StandardDeviation
Vanguard Sm-Cp Idx 10.28 14.90
CRSP U.S. Small Cap TR Index 10.79 14.70
Median 9.15 15.81
2014 2013 2012 2011 2010 2009 2008Vanguard Sm-Cp Idx 7.37 (10) 37.62 (58) 18.04 (20) -2.80 (47) 27.72 (27) 36.12 (20) -36.07 (51)CRSP U.S. Small Cap TR Index 7.54 (9) 38.48 (48) 18.59 (17) -1.85 (33) 27.98 (25) 40.11 (15) -36.81 (56)IM U.S. Small Cap Core Equity (MF) Median 4.37 38.24 15.28 -3.18 25.65 26.93 -36.03
3Years
EndingDec-2015
3Years
EndingDec-2014
3Years
EndingDec-2013
3Years
EndingDec-2012
3Years
EndingDec-2011
3Years
EndingDec-2010
3Years
EndingDec-2009
Vanguard Sm-Cp Idx 12.44 (33) 20.37 (22) 16.45 (38) 13.58 (20) 19.11 (17) 3.58 (17) -4.16 (20)CRSP U.S. Small Cap TR Index 12.78 (25) 20.87 (18) 17.25 (28) 14.21 (14) 20.74 (11) 4.25 (12) -3.34 (16)IM U.S. Small Cap Core Equity (MF) Median 11.55 18.92 15.63 11.72 15.58 0.74 -7.25
Vanguard Sm-Cp Idx 12/31/15
INTEGRITY. BALANCE. OBJECTIVITY.
40

TOP 10 HOLDINGS
STYLE MAP (02/01/68 - 12/31/15)
SECTOR ALLOCATIONASSET ALLOCATION
PORTFOLIO CHARACTERISTICS
UP/DOWN CAPTURE (01/01/11 - 12/31/15)
Vanguard Market Liquidity Fund 0.40 %Global Payments Inc ORD 0.32 %Goodyear Tire & Rubber Co ORD 0.32 %JetBlue Airways Corp ORD 0.28 %AGL Resources Inc ORD 0.27 %Spirit AeroSystems Holdings Inc ORD 0.27 %Arthur J Gallagher & Co ORD 0.26 %Duke Realty Corp 0.26 %Signature Bank ORD 0.26 %Broadridge Financial Solutions Inc ORD 0.25 %
Total Securities 1,501Avg. Market Cap $3,530 MillionP/E 28.11P/B 4.30Div. Yield 2.77%Annual EPS 19.645Yr EPS 15.213Yr EPS Growth 16.25
3 Years 5 Yearsvs. CRSP U.S. Small Cap TR IndexBeta 0.99 1.01
Vanguard Sm-Cp Idx CRSP U.S. Small Cap TR Index
0.0 6.0 12.0 18.0 24.0 30.0 36.0
UtilitiesTelecommunication Services
MaterialsInformation Technology
IndustrialsHealth Care
FinancialsEnergy
Consumer StaplesConsumer Discretionary
Other
0.0% 25.0% 50.0% 75.0% 100.0% 125.0%
Convertibles
Cash
Fixed Income
Other
Equities
0.0%
0.0%
0.0%
0.4%
99.6%
Style History Dec-2015
Average Style Exposure
Cap
italiz
atio
n
Manager Style
Large Cap Growth
Small Cap GrowthSmall Cap Value
Large Cap Value
Vanguard Sm-Cp Idx
50.0
75.0
100.0
125.0
150.0U
p C
aptu
re
50.0 70.0 90.0 110.0 130.0 150.0Down Capture
Vanguard Sm-Cp Idx 12/31/15
INTEGRITY. BALANCE. OBJECTIVITY.
41

FUND INFORMATION
ROLLING 3 YEAR RETURN AND PERCENTILE RANKINGS
PEER GROUP ANALYSIS - IM U.S. Small Cap Growth Equity (MF)
CALENDAR YEAR RETURNS AND PERCENTILE RANKINGS
RISK VS. RETURN (5 YEARS*)
*If less than 5 years, data is since inception of fund share class.
Firm and Management:Voya's investment team includes twoportfolio managers - James Hasso andJoseph Basset - and four careeranalysts. The team is located in NewYork. Both of the portfolio managershave sector research responsibilitiesalong with all of the analysts. Thehighly experienced analysts have theability to significantly influence stockselection, but the portfolio managershave ultimate decision-making authorityand responsibility for the strategy.
Investment Strategy:The Small Cap Opportunitiesinvestment team sees its mission asfinding unrecognized value before theconsensus does. The team engages infundamental research, leveraging eachmember's sector and industryexperience. At the same time, theyidentify secular and cyclical macro-economic themes that they expect todrive growth within different sectors.The investment team also emphasizesmeeting with the management teams ofinvestment candidates. Finally, theteam rigorously analyzes companycash flow statements, evaluating thecompany's ability to generate cash andreinvest in future growth opportunities.
Innovest's Assessment:Given that the portfolio is well-diversified and hues close to thebenchmark's sector weightings, relativeperformance should rarely fluctuatesignificantly. Still, the focus oncompanies that generate cash flows forreinvestment may result in some lagduring lower quality growth rallies. Thestrategy should also protect relativelywell in down markets.
-20.0
-12.0
-4.0
4.0
12.0
20.0
28.0
Ret
urn
LastQuarter
YearTo Date
1Year
3Years
5Years
7Years
10Years
Voya:SmCp Opptys;I 5.38 (13) -1.23 (45) -1.23 (45) 12.75 (56) 10.71 (34) 16.62 (34) 9.07 (2)
Russell 2000 Growth Index 4.32 (28) -1.38 (47) -1.38 (47) 14.28 (31) 10.67 (34) 16.33 (38) 7.95 (14)
Median 2.51 -2.27 -2.27 13.22 9.84 15.62 6.54
0.0
3.0
6.0
9.0
12.0
15.0
Ret
urn
(%)
12.0 15.0 18.0 21.0 24.0Risk (Standard Deviation %)
Return StandardDeviation
Voya:SmCp Opptys;I 10.71 15.27
Russell 2000 Growth Index 10.67 16.76
Median 9.84 17.32
2014 2013 2012 2011 2010 2009 2008Voya:SmCp Opptys;I 5.19 (17) 37.94 (78) 15.26 (25) 0.68 (10) 33.78 (11) 31.82 (59) -34.47 (4)Russell 2000 Growth Index 5.60 (15) 43.30 (49) 14.59 (26) -2.91 (32) 29.09 (30) 34.47 (43) -38.54 (15)IM U.S. Small Cap Growth Equity (MF) Median 1.81 43.22 12.12 -4.35 27.01 33.15 -42.69
3Years
EndingDec-2015
3Years
EndingDec-2014
3Years
EndingDec-2013
3Years
EndingDec-2012
3Years
EndingDec-2011
3Years
EndingDec-2010
3Years
EndingDec-2009
Voya:SmCp Opptys;I 12.75 (56) 18.70 (39) 16.98 (38) 15.79 (3) 21.09 (16) 4.94 (3) -1.76 (7)Russell 2000 Growth Index 14.28 (31) 20.14 (25) 16.82 (40) 12.82 (26) 19.00 (29) 2.18 (21) -4.00 (25)IM U.S. Small Cap Growth Equity (MF) Median 13.22 18.07 16.00 11.09 16.92 -1.22 -5.84
Voya:SmCp Opptys;I 12/31/15
INTEGRITY. BALANCE. OBJECTIVITY.
42

TOP 10 HOLDINGS
STYLE MAP (05/01/99 - 12/31/15)
SECTOR ALLOCATIONASSET ALLOCATION
PORTFOLIO CHARACTERISTICS
UP/DOWN CAPTURE (01/01/11 - 12/31/15)
BlackRock Liquidity TempFund;Institutional 1.96 %iShares Russell 2000 Growth ETF 1.52 %Vail Resorts Inc ORD 1.34 %TeamHealth Holdings Inc ORD 1.25 %STERIS Corp ORD 1.21 %J2 Global Inc ORD 1.18 %Dealertrack Technologies Inc ORD 1.16 %Qlik Technologies Inc ORD 1.16 %Tyler Technologies Inc ORD 1.16 %CLARCOR Inc ORD 1.15 %
Total Securities 160Avg. Market Cap $2,575 MillionP/E 31.84P/B 5.01Div. Yield 1.97%Annual EPS 19.025Yr EPS 18.973Yr EPS Growth 10.16
3 Years 5 Yearsvs. Russell 2000 Growth IndexBeta 0.89 0.89
Voya:SmCp Opptys;I Russell 2000 Growth Index
0.0 6.0 12.0 18.0 24.0 30.0 36.0
UtilitiesTelecommunication Services
MaterialsInformation Technology
IndustrialsHealth Care
FinancialsEnergy
Consumer StaplesConsumer Discretionary
Other
0.0% 25.0% 50.0% 75.0% 100.0% 125.0%
Other
Fixed Income
Convertibles
Cash
Equities
0.0%
0.0%
0.0%
1.4%
98.6%
Style History Dec-2015
Average Style Exposure
Cap
italiz
atio
n
Manager Style
Large Cap Growth
Small Cap GrowthSmall Cap Value
Large Cap Value
Voya:SmCp Opptys;I
50.0
75.0
100.0
125.0
150.0U
p C
aptu
re
50.0 70.0 90.0 110.0 130.0 150.0Down Capture
Voya:SmCp Opptys;I 12/31/15
INTEGRITY. BALANCE. OBJECTIVITY.
43

FUND INFORMATION
ROLLING 3 YEAR RETURN AND PERCENTILE RANKINGS
PEER GROUP ANALYSIS - IM International Large Cap Value Equity (MF)
CALENDAR YEAR RETURNS AND PERCENTILE RANKINGS
RISK VS. RETURN (5 YEARS*)
*If less than 5 years, data is since inception of fund share class.
Firm and Management:The Fund is managed by threesubadvisers; Causeway Capital Mgmt,Lazard Asset Mgmt, and TempletonInvestment Counsel. Causeway is aninternational and global equitymanagement firm that beganoperations in June 2001, based in LosAngeles, CA. Lazard is an SEC RIAproviding management services toclient discretionary accounts with AUMof $126.9 billion. Franklin TempletonInvestments provides global anddomestic investment managementservices with over 60 years ofinvestment experience and $643.7billion in AUM.
Investment Strategy:Assets are divided among three value-oriented subadvisors. Templeton'smanagement team seeks stocks thatare cheap relative to their assets orearnings. The Causeway Capital teamfocuses on dividend and earningsyields. A team from Lazard looks forattractive returns on equity and fetchingprices. American Beacon tightlyrestricts which emerging markets thefund's subadvisors can invest in, nowlimiting all buys in a developing nationto South Korea.
Innovest Assessment:Due to its strict value mandate, the fundgenerates its best return premium overa passive benchmark during slightlyrising, stable or declining markets. Thefund has a tendency to underperformversus its benchmark when emergingmarkets are in favor due to itsminimized emerging markets exposure.
-12.0
-8.0
-4.0
0.0
4.0
8.0
12.0
Ret
urn
LastQuarter
YearTo Date
1Year
3Years
5Years
7Years
10Years
Am Beacon Intl 2.63 (48) -1.78 (29) -1.78 (29) 4.40 (25) 4.11 (1) 7.83 (10) 3.39 (21)
MSCI EAFE Value Idx 2.68 (46) -5.68 (92) -5.68 (92) 3.14 (44) 2.55 (39) 6.67 (25) 1.96 (64)
Median 2.61 -2.64 -2.64 2.97 2.07 6.22 2.48
-1.5
0.0
1.5
3.0
4.5
6.0
Ret
urn
(%)
12.0 14.0 16.0 18.0Risk (Standard Deviation %)
Return StandardDeviation
Am Beacon Intl 4.11 15.34
MSCI EAFE Value Idx 2.55 15.68
Median 2.07 14.97
2014 2013 2012 2011 2010 2009 2008Am Beacon Intl -7.00 (31) 24.56 (7) 21.50 (2) -11.54 (27) 6.83 (33) 29.75 (34) -40.57 (21)MSCI EAFE Value Index (Net) -5.39 (25) 22.95 (9) 17.69 (44) -12.17 (34) 3.25 (77) 34.23 (25) -44.09 (48)IM International Large Cap Value Equity (MF) Median -8.37 21.25 17.18 -13.48 5.39 27.94 -44.32
3Years
EndingDec-2015
3Years
EndingDec-2014
3Years
EndingDec-2013
3Years
EndingDec-2012
3Years
EndingDec-2011
3Years
EndingDec-2010
3Years
EndingDec-2009
Am Beacon Intl 4.40 (25) 12.07 (1) 10.22 (1) 4.72 (7) 7.03 (20) -6.26 (9) -5.42 (13)MSCI EAFE Value Index (Net) 3.14 (44) 11.04 (1) 8.32 (18) 2.19 (55) 6.77 (25) -8.15 (33) -7.35 (42)IM International Large Cap Value Equity (MF) Median 2.97 9.35 7.14 2.49 6.07 -9.13 -7.40
Am Beacon Intl 12/31/15
INTEGRITY. BALANCE. OBJECTIVITY.
44

TOP 10 HOLDINGSPORTFOLIO CHARACTERISTICS
STYLE MAP (09/01/91 - 12/31/15)
SECTOR ALLOCATION
ASSET ALLOCATION
REGION ALLOCATION
TOP 5 COUNTRIES
UP/DOWN CAPTURE (01/01/11 - 12/31/15)
JPMorgan US Government Money Market Fund;Capital 4.63 %Novartis AG ORD 2.30 %British American Tobacco PLC ORD 1.88 %Bayer AG ORD 1.79 %Samsung Electronics Co Ltd ORD 1.46 %KDDI Corp ORD 1.46 %Lloyds Banking Group PLC ORD 1.45 %Total SA ORD 1.39 %Akzo Nobel NV ORD 1.32 %BNP Paribas SA ORD 1.31 %
Total Securities 169Avg. Market Cap $61,752 MillionP/E 21.15P/B 2.88Div. Yield 3.09%
0.0% 50.0% 100.0% 150.0%
Fixed Income
Convertibles
Cash
Other
Equities
0.0%
0.0%
5.0%
12.9%
82.1%
United Kingdom 17.98 %Unidentified 17.72 %Japan 11.95 %France 9.44 %Switzerland 8.08 %
3 Years 5 Yearsvs. MSCI EAFE Value Index (Net)Beta 0.88 0.95
Am Beacon Intl MSCI EAFE Value Index (Net)
0.0 8.0 16.0 24.0 32.0 40.0 48.0
UtilitiesTelecommunication Services
MaterialsInformation Technology
IndustrialsHealth Care
FinancialsEnergy
Consumer StaplesConsumer Discretionary
Other
Am Beacon Intl MSCI EAFE Value Index (Net)
0.0 8.0 16.0 24.0 32.0 40.0 48.0 56.0
OtherMiddle East
United KingdomEurope ex UK
JapanPacific ex Japan
North AmericaEM Asia
Style History Dec-2015
Average Style Exposure
Cap
italiz
atio
n
Manager Style
MSCI EAFE Growth Index
MSCI Emerging Markets IndexMSCI EAFE Small Cap
MSCI EAFE Value Index
Am Beacon Intl
50.0
75.0
100.0
125.0
150.0
Up
Cap
ture
50.0 70.0 90.0 110.0 130.0 150.0Down Capture
Am Beacon Intl 12/31/15
INTEGRITY. BALANCE. OBJECTIVITY.
45

FUND INFORMATION
ROLLING 3 YEAR RETURN AND PERCENTILE RANKINGS
PEER GROUP ANALYSIS - IM International Equity (MF)
CALENDAR YEAR RETURNS AND PERCENTILE RANKINGS
RISK VS. RETURN (5 YEARS*)
*If less than 5 years, data is since inception of fund share class.
Firm and Management:Until August 2008, this fund was madeup of three component Vanguard funds.Vanguard's indexing director GusSauter managed all three until 2005,when other Vanguard individualsstepped forward. In August 2008 thefund abandoned that structure and isgradually investing directly in stocksrather than funds. The current manageris long-time Vanguard employee,Michael Perre. However, Sauter, nowchief investment officer at Vanguard,still has oversight of the fund.
Investment Strategy:This fund aims to track the MSCI ACWIex USA IMI. Until August 2008, it was afund of funds made up of Vanguard'sthree regional index funds: VanguardEuropean Stock Index, VanguardPacific Stock Index and VanguardEmerging Markets Stock Index.However, it is gradually changing to amore typical format where it will investdirectly in stocks. It does not hedge itscurrency exposure.
-30.0
-20.0
-10.0
0.0
10.0
20.0
30.0
Ret
urn
LastQuarter
YearTo Date
1Year
3Years
5Years
7Years
10Years
Vanguard Tot Intl Stk 2.68 (61) -4.37 (56) -4.37 (56) 1.75 (62) 1.24 (64) 7.09 (65) 2.82 (59)
FTSE Global ex USA All Cap Index 3.65 (44) -4.03 (55) -4.03 (55) 2.52 (56) 1.78 (58) 8.71 (37) 3.90 (37)
Median 3.30 -2.78 -2.78 3.14 2.35 7.89 3.17
-24.0
-16.0
-8.0
0.0
8.0
16.0
Ret
urn
(%)
-10.0 0.0 10.0 20.0 30.0Risk (Standard Deviation %)
Return StandardDeviation
Vanguard Tot Intl Stk 1.24 14.80
FTSE Global ex USA All Cap Index 1.78 14.84
Median 2.35 15.00
2014 2013 2012 2011 2010 2009 2008Vanguard Tot Intl Stk -4.24 (47) 15.04 (57) 18.14 (56) -14.56 (48) 11.12 (61) 36.73 (50) -44.10 (38)FTSE Global ex USA All Cap Index -3.12 (36) 15.90 (54) 17.92 (58) -14.03 (43) 13.23 (49) 45.04 (36) -46.01 (51)IM International Equity (MF) Median -4.49 17.41 18.61 -14.93 12.88 36.38 -45.98
3Years
EndingDec-2015
3Years
EndingDec-2014
3Years
EndingDec-2013
3Years
EndingDec-2012
3Years
EndingDec-2011
3Years
EndingDec-2010
3Years
EndingDec-2009
Vanguard Tot Intl Stk 1.75 (62) 9.18 (55) 5.11 (61) 3.90 (57) 9.08 (57) -5.30 (48) -4.07 (42)FTSE Global ex USA All Cap Index 2.52 (56) 9.81 (48) 5.52 (58) 4.71 (45) 12.18 (39) -3.93 (37) -2.70 (32)IM International Equity (MF) Median 3.14 9.60 6.25 4.31 9.88 -5.58 -4.99
Vanguard Tot Intl Stk 12/31/15
INTEGRITY. BALANCE. OBJECTIVITY.
46

TOP 10 HOLDINGSPORTFOLIO CHARACTERISTICS
STYLE MAP (05/01/96 - 12/31/15)
SECTOR ALLOCATION
ASSET ALLOCATION
REGION ALLOCATION
TOP 5 COUNTRIES
UP/DOWN CAPTURE (01/01/11 - 12/31/15)
Nestle SA ORD 1.20 %Novartis AG ORD 0.97 %Roche Holding AG Par 0.96 %Toyota Motor Corp ORD 0.82 %HSBC Holdings PLC ORD 0.77 %Samsung Electronics Co Ltd ORD 0.61 %Sanofi SA ORD 0.57 %British American Tobacco PLC ORD 0.56 %Bayer AG ORD 0.55 %BP PLC ORD 0.54 %
Total Securities 5,933Avg. Market Cap $47,377 MillionP/E 21.43P/B 3.26Div. Yield 3.10%
0.0% 50.0% 100.0% 150.0%
Convertibles
Cash
Fixed Income
Other
Equities
0.0%
0.0%
0.1%
1.5%
98.4%
Japan 17.37 %United Kingdom 13.16 %France 6.42 %Switzerland 6.42 %Germany 6.15 %
3 Years 5 Yearsvs. FTSE Global ex USA All Cap IndexBeta 0.98 0.99
Vanguard Tot Intl Stk FTSE Global ex USA All Cap Index
0.0 6.0 12.0 18.0 24.0 30.0 36.0
OtherUtilities
Telecommunication ServicesMaterials
Information TechnologyIndustrials
Health CareFinancials
EnergyConsumer Staples
Consumer Discretionary
Vanguard Tot Intl Stk FTSE Global ex USA All Cap Index
0.0 8.0 16.0 24.0 32.0 40.0 48.0
OtherFrontier Markets
Middle EastUnited Kingdom
Europe ex UKJapan
Pacific ex JapanEM Mid East+Africa
North AmericaEM Latin America
EM EuropeEM Asia
Style History Dec-2015
Average Style Exposure
Cap
italiz
atio
n
Manager Style
MSCI EAFE Growth Index
MSCI Emerging Markets IndexMSCI EAFE Small Cap
MSCI EAFE Value Index
Vanguard Tot Intl Stk
50.0
75.0
100.0
125.0
150.0
Up
Cap
ture
50.0 70.0 90.0 110.0 130.0 150.0Down Capture
Vanguard Tot Intl Stk 12/31/15
INTEGRITY. BALANCE. OBJECTIVITY.
47

FUND INFORMATION
ROLLING 3 YEAR RETURN AND PERCENTILE RANKINGS
PEER GROUP ANALYSIS - IM International Large Cap Growth Equity (MF)
CALENDAR YEAR RETURNS AND PERCENTILE RANKINGS
RISK VS. RETURN (5 YEARS*)
*If less than 5 years, data is since inception of fund share class.
Firm and Management:Like all American Funds, this fundboasts many experienced managers,most of whom have been with thecompany for more than a decade. Thismultimanager system eases personneltransitions, like the June 2014departure of long-time manager RobertLovelace, who moved to an affiliate.Each of the fund's nine managers runsa portion of the fund's assetsindependently. In addition, a portion ofthe portfolio (less than 25% of assets)is run by the firm's analyst staff.
Investment Strategy:This fund's managers are focused onlong term capital growth. They primarilyinvest in common stocks of Europeanand Pacific Basin issuers that haveprospects of above average capitalappreciation. The managers may usecash to moderate volatility, typicallyholding 5-10% of fund assets in cash.The Fund usually has a stake inemerging-markets companies and willsometimes hold preferred stock andconvertibles debt.
Innovest's Assessment:The fund’s propensity to focus intenselyon bottom-up, fundamental factors canlead to periods of underperformancewhen the market is less concernedabout company fundamentals and moredriven by thematic and macroeconomicfactors. Additionally, the fund is likely tolag when highly cyclical stocks andgenerally lower quality companiessignificantly outperform the overallmarket. Finally, the fund’s immenseasset base is likely to present somechallenges in the fund’s ability to buildmeaningful positions in smallercompanies and opportunistically tradein less liquid markets.
-12.0
-8.0
-4.0
0.0
4.0
8.0
12.0
16.0
Ret
urn
LastQuarter
YearTo Date
1Year
3Years
5Years
7Years
10Years
American Funds EuPc 2.87 (78) -0.82 (59) -0.82 (59) 5.08 (22) 3.63 (41) 8.92 (36) 4.60 (36)¢£
MSCI EAFE Growth Index (Net) 6.67 (4) 4.09 (8) 4.09 (8) 6.83 (4) 4.60 (18) 8.92 (37) 4.03 (58)��
Median 4.40 -0.57 -0.57 4.15 3.31 8.58 4.21
-1.5
0.0
1.5
3.0
4.5
6.0
7.5
Ret
urn
(%)
10.0 12.0 14.0 16.0 18.0Risk (Standard Deviation %)
Return StandardDeviation
American Funds EuPc 3.63 13.70¢£
MSCI EAFE Growth Index (Net) 4.60 14.40��
Median 3.31 14.48¾
2014 2013 2012 2011 2010 2009 2008American Funds EuPc -2.64 (28) 20.15 (33) 19.21 (44) -13.58 (48) 9.40 (64) 39.10 (19) -40.53 (16)MSCI EAFE Growth Index (Net) -4.43 (43) 22.55 (13) 16.86 (70) -12.11 (31) 12.25 (37) 29.36 (71) -42.70 (45)IM International Large Cap Growth Equity (MF) Median -4.98 18.39 18.85 -13.61 11.10 33.27 -43.61
3Years
EndingDec-2015
3Years
EndingDec-2014
3Years
EndingDec-2013
3Years
EndingDec-2012
3Years
EndingDec-2011
3Years
EndingDec-2010
3Years
EndingDec-2009
American Funds EuPc 5.08 (22) 11.72 (20) 7.37 (45) 4.07 (58) 9.56 (41) -3.27 (12) -0.53 (5)MSCI EAFE Growth Index (Net) 6.83 (4) 11.03 (37) 7.97 (33) 4.85 (34) 8.47 (69) -5.94 (48) -4.78 (52)IM International Large Cap Growth Equity (MF) Median 4.15 10.65 7.32 4.32 9.31 -6.08 -4.75
American Funds EuPc 12/31/15
INTEGRITY. BALANCE. OBJECTIVITY.
48

TOP 10 HOLDINGSPORTFOLIO CHARACTERISTICS
STYLE MAP (05/01/84 - 12/31/15)
SECTOR ALLOCATION
ASSET ALLOCATION
REGION ALLOCATION
TOP 5 COUNTRIES
UP/DOWN CAPTURE (01/01/11 - 12/31/15)
Novo Nordisk A/S ORD 4.65 %Novartis AG ORD 2.46 %Barclays PLC ORD 2.29 %SoftBank Group Corp ORD 2.10 %Associated British Foods PLC ORD 1.80 %Prudential PLC ORD 1.78 %Bayer AG ORD 1.71 %HDFC Bank Ltd ORD 1.69 %Nintendo Co Ltd ORD 1.69 %Baidu Inc DR 1.40 %
Total Securities 466Avg. Market Cap $54,014 MillionP/E 24.23P/B 4.67Div. Yield 2.15%Annual EPS 21.595Yr EPS 18.143Yr EPS Growth 16.71
0.0% 50.0% 100.0% 150.0%
Convertibles
Other
Cash
Fixed Income
Equities
0.0%
0.2%
0.4%
11.1%
88.3%
Japan 13.67 %United Kingdom 12.80 %United States 9.73 %France 7.45 %India 7.04 %
3 Years 5 Yearsvs. MSCI EAFE Growth Index (Net)Beta 0.87 0.93
American Funds EuPc MSCI EAFE Growth Index (Net)
0.0 4.0 8.0 12.0 16.0 20.0 24.0
UtilitiesTelecommunication Services
MaterialsInformation Technology
IndustrialsHealth Care
FinancialsEnergy
Consumer StaplesConsumer Discretionary
Other
American Funds EuPc MSCI EAFE Growth Index (Net)
0.0 10.0 20.0 30.0 40.0 50.0 60.0 70.0
OtherFrontier Markets
Middle EastUnited Kingdom
Europe ex UKJapan
Pacific ex JapanEM Mid East+Africa
North AmericaEM Latin America
EM EuropeEM Asia
Style History Dec-2015
Average Style Exposure
Cap
italiz
atio
n
Manager Style
MSCI EAFE Growth Index
MSCI Emerging Markets IndexMSCI EAFE Small Cap
MSCI EAFE Value Index
American Funds EuPc
50.0
75.0
100.0
125.0
150.0
Up
Cap
ture
50.0 70.0 90.0 110.0 130.0 150.0Down Capture
American Funds EuPc 12/31/15
INTEGRITY. BALANCE. OBJECTIVITY.
49

FUND INFORMATION
ROLLING 3 YEAR RETURN AND PERCENTILE RANKINGS
PEER GROUP ANALYSIS - IM U.S. Broad Market Core Fixed Income (MF)
CALENDAR YEAR RETURNS AND PERCENTILE RANKINGS
RISK VS. RETURN (5 YEARS*)
*If less than 5 years, data is since inception of fund share class.
Firm and Management:Three of the fund’s portfolio managershave worked together for more thantwo decades. Steve Kane, CFA, LairdLandmann, and Tad Rivelle managedportfolios together at Hotchkis & Wileyin the early 1990s (Landmann andRivelle co-directed the fixed-incomedepartment there) before leaving tofound MetWest in 1996. Before that,the trio worked together at PIMCO.Bryan Whalen, CFA, joined MetWest in2004 and is a Generalist PortflioManager in the U.S. Fixed IncomeGroup.
Investment Strategy:The core tenant of MetWest’s fixedincome philosophy is a disciplinedimplementation of their value-basedprocess. The “value” concept is thatregardless of factor (duration, yieldcurve, sector selection, or issue) thestrategic decisions, and buy and selldecisions should be determined bywhether the factor or security is cheapor rich to fair value. Further, theirinvestment approach is designed totake advantage of the fact that fixedincome pricing is extremely volatile inthe short run, but over the long term thepricing risks tend to mean revert.Hence, they tend to only overweightinterest rates, yield curve, credit /spread risk when prices move out ofline with the long term fundamentals.
Innovest Assessment:The fund is expected to outperformwhen its sector allocation and securityselection in undervalued or undersponsored assets move towardmanagement’s view of intrinsic value.The strategy will underperform whenmarket psychology and investorsentiment cause temporary dislocationsleading to mispriced securities. Theseshort-term disruptions should lead tolong-term opportunities.
-4.0
-1.0
2.0
5.0
8.0
11.0
Ret
urn
LastQuarter
YearTo Date
1Year
3Years
5Years
7Years
10Years
Met West:Total Return;I -0.40 (17) 0.29 (36) 0.29 (36) 2.22 (4) 4.69 (2) 7.39 (3) 6.38 (1)
BC Aggregate Idx -0.57 (37) 0.55 (20) 0.55 (20) 1.44 (26) 3.25 (44) 4.09 (80) 4.52 (33)
Median -0.64 0.01 0.01 1.10 3.14 5.12 4.26
-1.5
0.0
1.5
3.0
4.5
6.0
Ret
urn
(%)
0.6 1.2 1.8 2.4 3.0 3.6 4.2Risk (Standard Deviation %)
Return StandardDeviation
Met West:Total Return;I 4.69 2.69
BC Aggregate Idx 3.25 2.68
Median 3.14 2.76
2014 2013 2012 2011 2010 2009 2008Met West:Total Return;I 5.99 (26) 0.50 (3) 11.55 (1) 5.52 (81) 11.66 (2) 17.30 (17) -1.27 (40)Barclays Aggregate Index 5.97 (27) -2.02 (54) 4.21 (80) 7.84 (11) 6.54 (69) 5.93 (90) 5.24 (11)IM U.S. Broad Market Core Fixed Income (MF) Median 5.54 -1.96 6.00 6.68 7.22 12.12 -3.43
3Years
EndingDec-2015
3Years
EndingDec-2014
3Years
EndingDec-2013
3Years
EndingDec-2012
3Years
EndingDec-2011
3Years
EndingDec-2010
3Years
EndingDec-2009
Met West:Total Return;I 2.22 (4) 5.92 (1) 5.76 (1) 9.54 (1) 11.39 (11) 8.95 (1) 7.23 (3)Barclays Aggregate Index 1.44 (26) 2.66 (67) 3.26 (60) 6.19 (67) 6.77 (82) 5.90 (48) 6.04 (25)IM U.S. Broad Market Core Fixed Income (MF) Median 1.10 3.08 3.47 6.69 8.78 5.79 5.15
Met West:Total Return;I 12/31/15
INTEGRITY. BALANCE. OBJECTIVITY.
50

TOP SECTOR ALLOCATIONSPORTFOLIO CHARACTERISTICS
STYLE MAP (04/01/00 - 12/31/15)
QUALITY ALLOCATION
ASSET ALLOCATION
MATURITY DISTRIBUTION
UP/DOWN CAPTURE (01/01/11 - 12/31/15)
GNMA and Other Mtg Backed 40.81 %Government Agency Securities 28.76 %Corporate Notes/Bonds 19.08 %Asset Backed Securities 8.21 %
Avg. Coupon 2.49 %Nominal Maturity 7.84 YearsEffective Maturity N/ADuration 4.81 YearsSEC 30 Day Yield 3.85Avg. Credit Quality AA
0.0% 50.0% 100.0% 150.0%
Convertibles
Equities
Other
Cash
Fixed Income
0.0%
0.0%
0.9%
2.2%
96.9%
0.0% 20.0% 40.0% 60.0% 80.0% 100.0%
Not RatedD Rated
Equities/OtherBB AND B Rated
CCC, CC AND C rated
AA RatedBBB Rated
A RatedGovernment/AAA
0.2%
0.2%
0.9%
2.5%
3.4%
3.9%
8.8%
10.6%
69.6%
0.0% 10.0% 20.0% 30.0% 40.0% 50.0%
>30Yrs
Other
<1Yr
10-20Yrs
20-30Yrs
3-5Yrs
1-3Yrs
5-10Yrs
0.0%
0.9%
6.9%
7.9%
9.3%
16.1%
19.4%
39.5%
Style History Dec-2015
Average Style Exposure
Cap
italiz
atio
n
Manager Style
Barclays Capital Long Term Govt Bond
Barclays Capital Long U.S. CreditBarclays Capital U.S. Credit 1-5 Year Index
Barclays Capital 1-5 Yr Gov
Met West:Total Return;I
50.0
75.0
100.0
125.0
150.0U
p C
aptu
re
50.0 70.0 90.0 110.0 130.0 150.0Down Capture
Met West:Total Return;I 12/31/15
INTEGRITY. BALANCE. OBJECTIVITY.
51

FUND INFORMATION
ROLLING 3 YEAR RETURN AND PERCENTILE RANKINGS
PEER GROUP ANALYSIS - IM U.S. Broad Market Core Fixed Income (MF)
CALENDAR YEAR RETURNS AND PERCENTILE RANKINGS
RISK VS. RETURN (5 YEARS*)
*If less than 5 years, data is since inception of fund share class.
Firm and Management:Kenneth Volpert is a principal andportfolio manager of the VanguardGroup. Volpert has been working forthe Vanguard Group since 1992.Volpert joined the company as anassistant vice president and seniorportfolio manager. Volpert is currentlythe head of Vanguard's Bond IndexGroup. Volpert's previous employersinclude Mellon Bond Associates andInvestment & Capital ManagementCorporation. He has worked ininvestment management since 1981.
Investment Strategy:The investment seeks to track theperformance of a broad, market-weighted bond index. The fund investsby sampling the index. It invests atleast 80% of assets in bonds held in theindex. The fund maintains a dollar-weighted average maturity consistentwith that of the index, ranging between5 and 10 years.
-4.0
-2.0
0.0
2.0
4.0
6.0
8.0
10.0
Ret
urn
LastQuarter
YearTo Date
1Year
3Years
5Years
7Years
10Years
Vanguard Tot Bd -0.63 (48) 0.30 (36) 0.30 (36) 1.21 (43) 3.02 (62) 3.91 (84) 4.36 (42)
BC Aggregate Idx -0.57 (37) 0.55 (20) 0.55 (20) 1.44 (26) 3.25 (44) 4.09 (80) 4.52 (33)
Median -0.64 0.01 0.01 1.10 3.14 5.12 4.26
-1.5
0.0
1.5
3.0
4.5
6.0
Ret
urn
(%)
0.6 1.2 1.8 2.4 3.0 3.6 4.2Risk (Standard Deviation %)
Return StandardDeviation
Vanguard Tot Bd 3.02 2.78
BC Aggregate Idx 3.25 2.68
Median 3.14 2.76
2014 2013 2012 2011 2010 2009 2008Vanguard Tot Bd 5.76 (38) -2.26 (67) 4.05 (83) 7.56 (20) 6.42 (74) 5.93 (90) 5.05 (12)Barclays Aggregate Index 5.97 (27) -2.02 (54) 4.21 (80) 7.84 (11) 6.54 (69) 5.93 (90) 5.24 (11)IM U.S. Broad Market Core Fixed Income (MF) Median 5.54 -1.96 6.00 6.68 7.22 12.12 -3.43
3Years
EndingDec-2015
3Years
EndingDec-2014
3Years
EndingDec-2013
3Years
EndingDec-2012
3Years
EndingDec-2011
3Years
EndingDec-2010
3Years
EndingDec-2009
Vanguard Tot Bd 1.21 (43) 2.46 (76) 3.03 (71) 6.00 (72) 6.64 (84) 5.80 (50) 5.97 (27)Barclays Aggregate Index 1.44 (26) 2.66 (67) 3.26 (60) 6.19 (67) 6.77 (82) 5.90 (48) 6.04 (25)IM U.S. Broad Market Core Fixed Income (MF) Median 1.10 3.08 3.47 6.69 8.78 5.79 5.15
Vanguard Tot Bd 12/31/15
INTEGRITY. BALANCE. OBJECTIVITY.
52
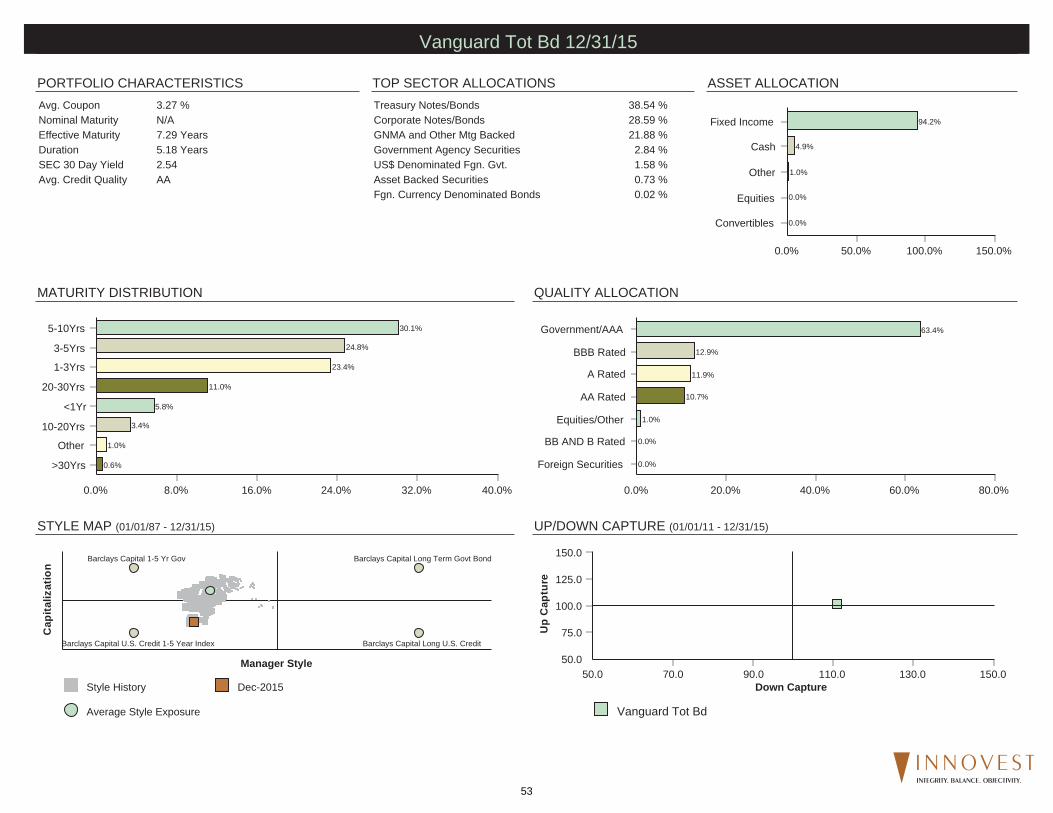
TOP SECTOR ALLOCATIONSPORTFOLIO CHARACTERISTICS
STYLE MAP (01/01/87 - 12/31/15)
QUALITY ALLOCATION
ASSET ALLOCATION
MATURITY DISTRIBUTION
UP/DOWN CAPTURE (01/01/11 - 12/31/15)
Treasury Notes/Bonds 38.54 %Corporate Notes/Bonds 28.59 %GNMA and Other Mtg Backed 21.88 %Government Agency Securities 2.84 %US$ Denominated Fgn. Gvt. 1.58 %Asset Backed Securities 0.73 %Fgn. Currency Denominated Bonds 0.02 %
Avg. Coupon 3.27 %Nominal Maturity N/AEffective Maturity 7.29 YearsDuration 5.18 YearsSEC 30 Day Yield 2.54Avg. Credit Quality AA
0.0% 50.0% 100.0% 150.0%
Convertibles
Equities
Other
Cash
Fixed Income
0.0%
0.0%
1.0%
4.9%
94.2%
0.0% 20.0% 40.0% 60.0% 80.0%
Foreign Securities
BB AND B Rated
Equities/Other
AA Rated
A Rated
BBB Rated
Government/AAA
0.0%
0.0%
1.0%
10.7%
11.9%
12.9%
63.4%
0.0% 8.0% 16.0% 24.0% 32.0% 40.0%
>30Yrs
Other
10-20Yrs
<1Yr
20-30Yrs
1-3Yrs
3-5Yrs
5-10Yrs
0.6%
1.0%
3.4%
5.8%
11.0%
23.4%
24.8%
30.1%
Style History Dec-2015
Average Style Exposure
Cap
italiz
atio
n
Manager Style
Barclays Capital Long Term Govt Bond
Barclays Capital Long U.S. CreditBarclays Capital U.S. Credit 1-5 Year Index
Barclays Capital 1-5 Yr Gov
Vanguard Tot Bd
50.0
75.0
100.0
125.0
150.0U
p C
aptu
re
50.0 70.0 90.0 110.0 130.0 150.0Down Capture
Vanguard Tot Bd 12/31/15
INTEGRITY. BALANCE. OBJECTIVITY.
53

THIS PAGE LEFT INTENTIONALLY BLANK
INTEGRITY. BALANCE. OBJECTIVITY.
54

Total Assets @9/30/14:
Total Liabilities: Net Capital
92.03%4.35%
High Yield 3 62%
Investment GradeMedium Grade
Corporate & Government Bonds and Structured Finance
Portfolio Quality:
TIAA Traditional Account
FitchFinancial Strength rating Standard & Poor'sMoody's A.M. Best Total Assets: $261.4 B
$227.6 B$33.8 B
AAA Aa1TIAA AA+ A++
Organization:TIAA (Teachers Insurance and Annuity Association of America) began in 1918 as a stock U.S. life insurance company to help meet the financial needs of plan sponsors and participants in the academic, medical, governmental, research and cultural fields. In 1952, a companion organization, the College Retirement Equities Fund was created to allow participants to invest in equities in order to diversify their retirement funds. Today, TIAA‐CREF is a financial services organization and leading private provider of retirement benefits nationwide.Product Description: The TIAA Traditional Annuity is a guaranteed annuity account providing participants crediting rates for accumulating and payout rates and guarrantees are supported by the TIAA General Account. The TIAA General Account invests in a broadly diversified portfolio to pursue superior long‐term returns for the account while providing the stability and liquididty needed to support the guaranteed annuity products.
37.26%6.96%
6.44%
5.77%3.04%
0.04%Corporate
Structured Finance
Government Bonds
Cash/other
l
TIAA General Account DiversificationManagement:Lead Portfolio Manager David Brown, who had been with TIAA since 2005, recently retired and Lisa Black, head of Global Public Markets is acting CIO until a replacement is found. The lead PM s responsible for the portfolio strategy, asset allocation and risk‐adjusted targets. Lisa has been with TIAA for 27 years and is supported by a team of 30 senior professionals. Heather Davis,
High Yield 3.62%
Expenses Expenses cannot be determined as it is a spread product
31.53%
8.96%
Commercial Mortgages
Equity/other
Real Estate
Preferred Stock
PM for the Global Private Markets, has 29 years of industry experience with TIAA for 19 years and is supported by a team of 12 senior professionals. And Thomas Garbutt, PM for Global Real Estate, has 33 years of experience with TIAA and is supported by 12 senior professionals. In addition, there is a deep pool of analysts.
0.00%
1.00%
2.00%
3.00%
4.00%
5.00%
6.00%
Retirement Choice
Retirement Choice Plus
RA‐GRA
GSRA
Crediting Rate History of Current Vintage
INTEGRITY. BALANCE. OBJECTIVITY.
55

FUND INFORMATION
ROLLING 3 YEAR RETURN AND PERCENTILE RANKINGS
PEER GROUP ANALYSIS - IM U.S. Multi-Cap Core Equity (MF)
CALENDAR YEAR RETURNS AND PERCENTILE RANKINGS
RISK VS. RETURN (5 YEARS*)
*If less than 5 years, data is since inception of fund share class.
Firm and Management:TIAA (Teachers Insurance and AnnuityAssociation of America) began in 1918as a stock U.S. life insurance companyto help meet the financial needs of plansponsors and participants in theacademic, medical, governmental,research and cultural fields. In 1952, acompanion organization, the CollegeRetirement Equities Fund was createdto allow participants to invest in equitiesin order to diversify their retirementfunds. Today, TIAA-CREF is a financialservices organization and leadingprivate provider of retirement benefitsnationwide. Jim Campagna, CFA,oversees the fund along with PMresponsibilities on all equity indexstrategies. Lei Liao is a director andequity index portfolio manager for theTIAA-CREF organization. Mr. Liao hasportfolio co-managementresponsibilities for all equity index fundsand socially screened portfolios.
Investment Style:The fund seeks a favorable long-termtotal return that reflects the investmentperformance of the overall U.S. stockmarket while giving specialconsideration to certain social criteria.The evaluation process favorscompanies that are strong stewards ofthe environment; devoted to servinglocal communities; committed to higherlabor standards; dedicated to producinghigh-quality and safe products; andthose managed in an exemplary orethical manner.
-20.0
-12.0
-4.0
4.0
12.0
20.0
28.0
Ret
urn
LastQuarter
YearTo Date
1Year
3Years
5Years
7Years
10Years
TIAA-CREF:Soc Ch Eq 5.67 (27) -2.39 (58) -2.39 (58) 13.41 (51) 10.70 (47) 14.32 (45) 6.84 (34)¢£
CREF Social Choice Hybrid Index 3.15 (79) 0.20 (30) 0.20 (30) 7.58 (94) 7.17 (90) 9.67 (97) 5.88 (63)��
Median 4.83 -1.52 -1.52 13.42 10.43 14.06 6.32
-5.0
0.0
5.0
10.0
15.0
20.0
Ret
urn
(%)
4.0 8.0 12.0 16.0 20.0Risk (Standard Deviation %)
Return StandardDeviation
TIAA-CREF:Soc Ch Eq 10.70 12.06¢£
CREF Social Choice Hybrid Index 7.17 7.39��
Median 10.43 12.54¾
2014 2013 2012 2011 2010 2009 2008TIAA-CREF:Soc Ch Eq 11.25 34.32 14.05 -0.05 15.91 32.38 -36.15CREF Social Choice Hybrid Index 6.91 16.23 11.75 1.62 11.97 20.57 -23.49
3Years
EndingDec-2015
3Years
EndingDec-2014
3Years
EndingDec-2013
3Years
EndingDec-2012
3Years
EndingDec-2011
3Years
EndingDec-2010
3Years
EndingDec-2009
TIAA-CREF:Soc Ch Eq 13.41 19.45 15.26 9.73 15.32 -0.68 -4.19CREF Social Choice Hybrid Index 7.58 11.56 9.69 8.34 11.11 1.08 -0.31
TIAA-CREF:Soc Ch Eq 12/31/15
INTEGRITY. BALANCE. OBJECTIVITY.
56

TOP 10 HOLDINGSPORTFOLIO CHARACTERISTICS
STYLE MAP (08/01/99 - 12/31/15)
SECTOR ALLOCATION
ASSET ALLOCATION
REGION ALLOCATION
TOP 5 COUNTRIES
UP/DOWN CAPTURE (01/01/11 - 12/31/15)
Johnson & Johnson ORD 1.73 %Berkshire Hathaway Inc ORD 1.59 %Procter & Gamble Co ORD 1.40 %Walt Disney Co ORD 1.34 %Verizon Communications Inc ORD 1.32 %Alphabet Inc ORD 1 1.19 %Intel Corp ORD 1.19 %Merck & Co Inc ORD 1.19 %Gilead Sciences Inc ORD 1.17 %Alphabet Inc ORD 2 1.17 %
Total Securities 882Avg. Market Cap $64,983 MillionP/E 24.99P/B 5.50Div. Yield 2.46%Annual EPS 16.475Yr EPS 15.243Yr EPS Growth 11.74
0.0% 50.0% 100.0% 150.0%-50.0 %
Other
Convertibles
Cash
Fixed Income
Equities
-2.0 %
0.0%
0.0%
2.3%
99.7%
No data found.
3 Years 5 Yearsvs. CREF Social Choice Hybrid IndexBeta 1.56 1.56
TIAA-CREF:Soc Ch Eq CREF Social Choice Hybrid Index
0.0 5.0 10.0 15.0 20.0 25.0 30.0
OtherUtilities
Telecommunication ServicesMaterials
Information TechnologyIndustrials
Health CareFinancials
EnergyConsumer Staples
Consumer Discretionary
TIAA-CREF:Soc Ch Eq CREF Social Choice Hybrid Index
0.0 50.0 100.0 150.0-50.0
Other
United Kingdom
Europe ex UK
North America
Style History Dec-2015
Average Style Exposure
Cap
italiz
atio
n
Manager Style
MSCI EAFE Growth Index
MSCI Emerging Markets IndexMSCI EAFE Small Cap
MSCI EAFE Value Index
TIAA-CREF:Soc Ch Eq
50.0
75.0
100.0
125.0
150.0
Up
Cap
ture
50.0 70.0 90.0 110.0 130.0 150.0Down Capture
TIAA-CREF:Soc Ch Eq 12/31/15
INTEGRITY. BALANCE. OBJECTIVITY.
57

*Glidpath generated from Morningstar Target‐Date Fund Series Report
Funds of
Funds
Number of Funds/ Holdings
Open Architecture
(%)
Sub‐Advisors Used
% Active Managers
Max % Equity
% Equity at Target‐Date
Min % Equity
Age at Glide Path End
Y 7 0% N N/A 90% 50% 30% 70
Vanguard Median Asset ClassIncome 0.16% 0.91% Large Blend2015 0.16% 0.89% Foreign Large Blend2020 0.16% 0.94% Intermediate‐Term Bond2025 0.17% 0.91% World Bond2030 0.17% 0.98% Inflation‐Protected Bond2035 0.18% 0.94% Inflation‐Protected Bond2040 0.18% 1.00% Money Market ‐ taxable2045 0.18% 0.96%2050 0.18% 1.01%2055 0.18% 0.95%2060 0.18% 0.95%
Vanguard Target Date Funds
Vanguard Inflation‐Protected Secs InvVanguard Prime Money Inv
•• Vanguard Total Intl Stock Index Inv
Vanguard Total Intl Bd Idx InvestorVanguard Shrt‐Term Infl‐Prot Sec Idx Inv
••••
FundVanguard Total Stock Mkt Idx Inv
Vanguard Total Bond Mkt II Idx Inv
GLIDE PATHCOMPOSITION
ASSET CLASS SUMMARYU.S. Large Cap
Top Holdings
International Equity
U.S. Fixed IncomeU.S. TIPS
REITsCommodities
•
• Emerging Markets Equity
High Yield Fixed Income Interna onal Fixed Income
Emerging Markets Debt
U.S. Mid CapU.S. Small Cap
EXPENSES•
Organization:Founded in 1975, Vanguard’s total AUM has eclipsed the $2 trillion mark across more than 240 mutual funds. The foundation of Vanguard’s investment methodology is based around low-cost indexed mutual funds. Vanguard made several changes to the management overseeing this target-date series in early 2013. Day-to-day activities are now overseen by veteran index-fund manager Michael Buek, who has worked in investment management since 1987, as well as William Coleman and Walter Nejman.
Glide Path Rationale: With approximately 50% equity exposure in the 2015 Target Retirement Fund, Vanguard’s target date suite is moderate in comparison to its peers (approximately ranges from 70% to 20% across the industry). Additionally, the allocation in this target date suite is managed until age 70, at which point the glide path becomes static with an allocation of 30% equity and 70% fixed income.
Composition of Funds: Each of the Vanguard Target Retirement Funds invests in a mix of the firm’s broadest proprietary index funds. 100% of the underlying funds are passively managed, predominantly across four index funds (Total Stock Market Index, Total International Stock Index, Total Bond Market Index, and Total International Bond Index), and the series introduces an allocation to the Vanguard Inflation Protected Securities Index five years prior to the target retirement date. The broad underlying index funds provide exposure to more than 9.500 equity securities and more than 4,000 fixed income securities.
INTEGRITY. BALANCE. OBJECTIVITY.
58

PEER GROUP ANALYSIS - IM Mixed-Asset Target 2010 (MF)
CALENDAR YEAR RETURNS AND PERCENTILE RANKINGS
RISK VS. RETURN (5 YEARS*)
ASSET ALLOCATION UP/DOWN CAPTURE (01/01/11 - 12/31/15)
*If less than 5 years, data is since inception of fund share class.
-8.0
-4.0
0.0
4.0
8.0
12.0
Ret
urn
LastQuarter
YearTo Date
1Year
3Years
5Years
7Years
10Years
Vanguard Target Ret 2010 1.42 (71) -0.20 (8) -0.20 (8) 4.87 (28) 5.60 (23) 8.28 (55) N/A¢£
Vanguard Target 2010 Composite Index 1.63 (51) 0.03 (4) 0.03 (4) 5.09 (22) 5.72 (17) 8.38 (51) N/A��
Median 1.66 -1.20 -1.20 4.29 4.87 8.39 3.82
0.0
2.0
4.0
6.0
8.0
Ret
urn
(%)
0.0 1.5 3.0 4.5 6.0 7.5 9.0Risk (Standard Deviation %)
ReturnStandardDeviation
Vanguard Target Ret 2010 5.60 5.37¢£
Vanguard Target 2010 Composite Index 5.72 5.38��
Median 4.87 6.41¾
2014 2013 2012 2011 2010 2009 2008
Vanguard Target Ret 2010 5.93 (7) 9.10 (50) 10.12 (46) 3.37 (6) 11.43 (35) 19.32 (81) -20.67 (21)Vanguard Target 2010 Composite Index 6.13 (4) 9.32 (47) 10.19 (42) 3.28 (10) 11.53 (32) 19.28 (81) -20.93 (22)IM Mixed-Asset Target 2010 (MF) Median 4.11 8.67 9.78 0.75 10.78 23.34 -25.97
0.0% 20.0% 40.0% 60.0% 80.0%
Convertibles
Cash
Other
Equities
Fixed Income
0.0%
0.2%
2.6%
34.7%
62.6%
Vanguard Target Ret 2010
50.0
75.0
100.0
125.0
150.0
Up
Ca
ptu
re
50.0 65.0 80.0 95.0 110.0 125.0 140.0 150.0Down Capture
Vanguard Target Ret 2010 12/31/15
INTEGRITY. BALANCE. OBJECTIVITY.
59

PEER GROUP ANALYSIS - IM Mixed-Asset Target 2020 (MF)
CALENDAR YEAR RETURNS AND PERCENTILE RANKINGS
RISK VS. RETURN (5 YEARS*)
ASSET ALLOCATION UP/DOWN CAPTURE (01/01/11 - 12/31/15)
*If less than 5 years, data is since inception of fund share class.
-10.0
-5.0
0.0
5.0
10.0
15.0
Ret
urn
LastQuarter
YearTo Date
1Year
3Years
5Years
7Years
10Years
Vanguard Target Ret 2020 2.71 (21) -0.68 (23) -0.68 (23) 7.22 (5) 6.85 (8) 9.93 (23) N/A¢£
Vanguard Target 2020 Composite Index 3.00 (5) -0.40 (14) -0.40 (14) 7.51 (4) 7.14 (3) 10.18 (16) N/A��
Median 2.14 -1.46 -1.46 4.93 5.09 8.76 4.09
0.0
2.0
4.0
6.0
8.0
10.0
Ret
urn
(%)
2.0 4.0 6.0 8.0 10.0 12.0Risk (Standard Deviation %)
ReturnStandardDeviation
Vanguard Target Ret 2020 6.85 7.81¢£
Vanguard Target 2020 Composite Index 7.14 7.81��
Median 5.09 7.11¾
2014 2013 2012 2011 2010 2009 2008
Vanguard Target Ret 2020 7.12 (1) 15.85 (18) 12.35 (37) 0.60 (33) 13.12 (36) 23.10 (71) -27.04 (22)Vanguard Target 2020 Composite Index 7.37 (1) 16.21 (14) 12.47 (36) 0.99 (26) 13.27 (34) 23.28 (69) -27.41 (25)IM Mixed-Asset Target 2020 (MF) Median 4.71 12.03 11.53 -0.51 12.27 25.92 -31.95
0.0% 20.0% 40.0% 60.0% 80.0%
Convertibles
Cash
Other
Fixed Income
Equities
0.0%
0.2%
1.9%
38.9%
59.0%
Vanguard Target Ret 2020
50.0
75.0
100.0
125.0
150.0
Up
Ca
ptu
re
50.0 65.0 80.0 95.0 110.0 125.0 140.0 150.0Down Capture
Vanguard Target Ret 2020 12/31/15
INTEGRITY. BALANCE. OBJECTIVITY.
60

PEER GROUP ANALYSIS - IM Mixed-Asset Target 2030 (MF)
CALENDAR YEAR RETURNS AND PERCENTILE RANKINGS
RISK VS. RETURN (5 YEARS*)
ASSET ALLOCATION UP/DOWN CAPTURE (01/01/11 - 12/31/15)
*If less than 5 years, data is since inception of fund share class.
-10.0
-5.0
0.0
5.0
10.0
15.0
20.0
Ret
urn
LastQuarter
YearTo Date
1Year
3Years
5Years
7Years
10Years
Vanguard Target Ret 2030 3.49 (28) -1.03 (30) -1.03 (30) 8.52 (11) 7.59 (13) 11.11 (28) N/A¢£
Vanguard Target 2030 Composite Index 3.84 (21) -0.79 (23) -0.79 (23) 8.84 (7) 7.87 (8) 11.38 (20) N/A��
Median 3.10 -1.62 -1.62 6.96 6.24 10.27 4.32
0.0
2.0
4.0
6.0
8.0
10.0
Ret
urn
(%)
4.0 6.0 8.0 10.0 12.0 14.0Risk (Standard Deviation %)
ReturnStandardDeviation
Vanguard Target Ret 2030 7.59 9.68¢£
Vanguard Target 2030 Composite Index 7.87 9.68��
Median 6.24 9.76¾
2014 2013 2012 2011 2010 2009 2008
Vanguard Target Ret 2030 7.17 (5) 20.49 (28) 14.24 (40) -1.27 (23) 14.43 (34) 26.72 (74) -32.91 (16)Vanguard Target 2030 Composite Index 7.51 (3) 20.88 (25) 14.31 (38) -0.89 (17) 14.58 (30) 27.02 (71) -33.27 (19)IM Mixed-Asset Target 2030 (MF) Median 5.16 18.02 13.66 -2.57 13.60 28.79 -36.49
0.0% 25.0% 50.0% 75.0% 100.0%
Convertibles
Cash
Other
Fixed Income
Equities
0.0%
0.1%
1.5%
24.3%
74.2%
Vanguard Target Ret 2030
50.0
75.0
100.0
125.0
150.0
Up
Ca
ptu
re
50.0 65.0 80.0 95.0 110.0 125.0 140.0 150.0Down Capture
Vanguard Target Ret 2030 12/31/15
INTEGRITY. BALANCE. OBJECTIVITY.
61
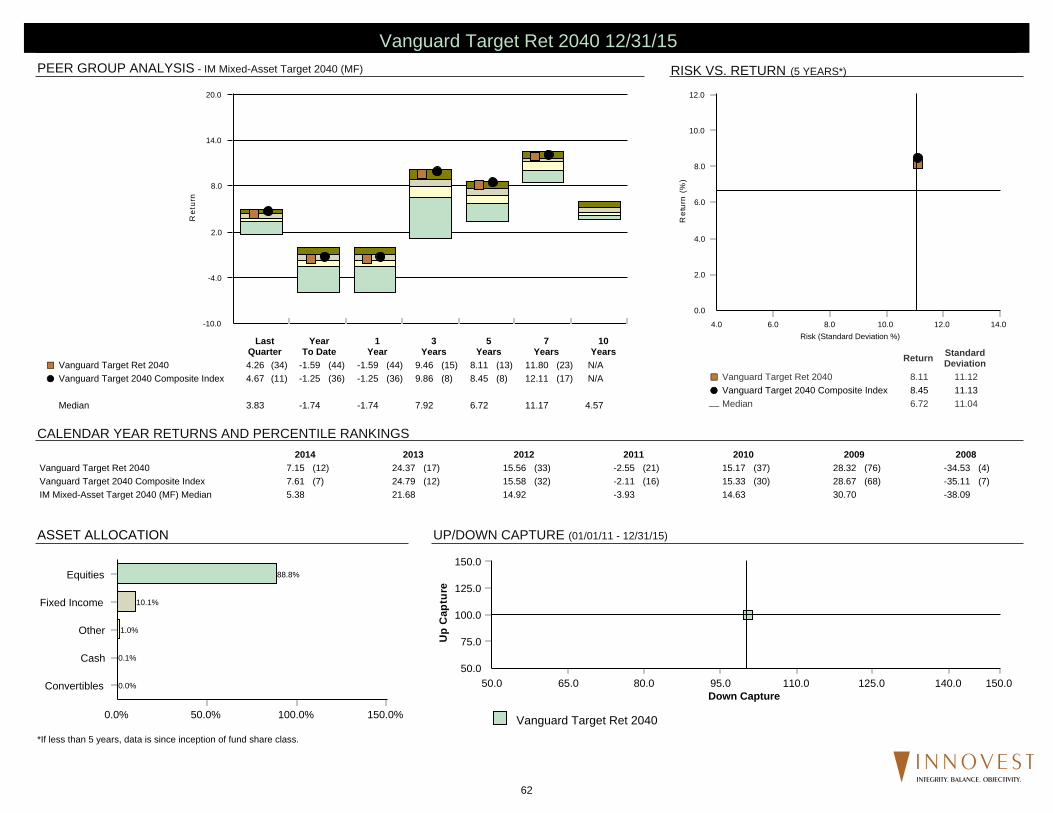
PEER GROUP ANALYSIS - IM Mixed-Asset Target 2040 (MF)
CALENDAR YEAR RETURNS AND PERCENTILE RANKINGS
RISK VS. RETURN (5 YEARS*)
ASSET ALLOCATION UP/DOWN CAPTURE (01/01/11 - 12/31/15)
*If less than 5 years, data is since inception of fund share class.
-10.0
-4.0
2.0
8.0
14.0
20.0
Ret
urn
LastQuarter
YearTo Date
1Year
3Years
5Years
7Years
10Years
Vanguard Target Ret 2040 4.26 (34) -1.59 (44) -1.59 (44) 9.46 (15) 8.11 (13) 11.80 (23) N/A¢£
Vanguard Target 2040 Composite Index 4.67 (11) -1.25 (36) -1.25 (36) 9.86 (8) 8.45 (8) 12.11 (17) N/A��
Median 3.83 -1.74 -1.74 7.92 6.72 11.17 4.57
0.0
2.0
4.0
6.0
8.0
10.0
12.0
Ret
urn
(%)
4.0 6.0 8.0 10.0 12.0 14.0Risk (Standard Deviation %)
ReturnStandardDeviation
Vanguard Target Ret 2040 8.11 11.12¢£
Vanguard Target 2040 Composite Index 8.45 11.13��
Median 6.72 11.04¾
2014 2013 2012 2011 2010 2009 2008
Vanguard Target Ret 2040 7.15 (12) 24.37 (17) 15.56 (33) -2.55 (21) 15.17 (37) 28.32 (76) -34.53 (4)Vanguard Target 2040 Composite Index 7.61 (7) 24.79 (12) 15.58 (32) -2.11 (16) 15.33 (30) 28.67 (68) -35.11 (7)IM Mixed-Asset Target 2040 (MF) Median 5.38 21.68 14.92 -3.93 14.63 30.70 -38.09
0.0% 50.0% 100.0% 150.0%
Convertibles
Cash
Other
Fixed Income
Equities
0.0%
0.1%
1.0%
10.1%
88.8%
Vanguard Target Ret 2040
50.0
75.0
100.0
125.0
150.0
Up
Ca
ptu
re
50.0 65.0 80.0 95.0 110.0 125.0 140.0 150.0Down Capture
Vanguard Target Ret 2040 12/31/15
INTEGRITY. BALANCE. OBJECTIVITY.
62

PEER GROUP ANALYSIS - IM Mixed-Asset Target 2050 (MF)
CALENDAR YEAR RETURNS AND PERCENTILE RANKINGS
RISK VS. RETURN (5 YEARS*)
ASSET ALLOCATION UP/DOWN CAPTURE (01/01/11 - 12/31/15)
*If less than 5 years, data is since inception of fund share class.
-16.0
-10.0
-4.0
2.0
8.0
14.0
20.0
Ret
urn
LastQuarter
YearTo Date
1Year
3Years
5Years
7Years
10Years
Vanguard Target Ret 2050 4.31 (41) -1.58 (46) -1.58 (46) 9.47 (19) 8.12 (20) 11.81 (26) N/A¢£
Vanguard Target 2050 Composite Index 4.70 (16) -1.26 (37) -1.26 (37) 9.86 (11) 8.45 (11) 12.11 (14) N/A��
Median 4.05 -1.76 -1.76 8.32 7.06 11.38 4.73
0.0
2.0
4.0
6.0
8.0
10.0
12.0
Ret
urn
(%)
6.0 8.0 10.0 12.0 14.0Risk (Standard Deviation %)
ReturnStandardDeviation
Vanguard Target Ret 2050 8.12 11.13¢£
Vanguard Target 2050 Composite Index 8.45 11.14��
Median 7.06 11.51¾
2014 2013 2012 2011 2010 2009 2008
Vanguard Target Ret 2050 7.18 (17) 24.34 (31) 15.58 (47) -2.54 (14) 15.20 (37) 28.31 (92) -34.62 (6)Vanguard Target 2050 Composite Index 7.61 (11) 24.79 (26) 15.58 (48) -2.11 (12) 15.33 (33) 28.67 (85) -35.11 (7)IM Mixed-Asset Target 2050 (MF) Median 5.61 23.08 15.47 -4.38 14.80 31.42 -39.08
0.0% 50.0% 100.0% 150.0%
Convertibles
Cash
Other
Fixed Income
Equities
0.0%
0.2%
1.0%
9.6%
89.2%
Vanguard Target Ret 2050
50.0
75.0
100.0
125.0
150.0
Up
Ca
ptu
re
50.0 65.0 80.0 95.0 110.0 125.0 140.0 150.0Down Capture
Vanguard Target Ret 2050 12/31/15
INTEGRITY. BALANCE. OBJECTIVITY.
63

PEER GROUP ANALYSIS - IM Mixed-Asset Target 2055+ (MF)
CALENDAR YEAR RETURNS AND PERCENTILE RANKINGS
RISK VS. RETURN (5 YEARS*)
ASSET ALLOCATION UP/DOWN CAPTURE (02/01/12 - 12/31/15)
*If less than 5 years, data is since inception of fund share class.
-10.0
-5.0
0.0
5.0
10.0
15.0
Ret
urn
LastQuarter
YearTo Date
1Year
3Years
5Years
7Years
10Years
Vanguard Target Ret 2060 4.31 (42) -1.68 (53) -1.68 (53) 9.42 (27) N/A N/A N/A¢£
Vanguard Target 2060 Composite Index 4.70 (21) -1.26 (39) -1.26 (39) 9.86 (14) N/A N/A N/A��
Median 4.24 -1.60 -1.60 8.58 7.48 N/A N/A
2.0
4.0
6.0
8.0
10.0
12.0
Ret
urn
(%)
7.8 8.4 9.0 9.6 10.2 10.8 11.4Risk (Standard Deviation %)
ReturnStandardDeviation
Vanguard Target Ret 2060 9.80 9.54¢£
Vanguard Target 2060 Composite Index 10.08 9.62��
Median 9.38 9.73¾
2014 2013 2012 2011 2010 2009 2008
Vanguard Target Ret 2060 7.16 (17) 24.35 (37) N/A N/A N/A N/A N/AVanguard Target 2060 Composite Index 7.61 (13) 24.79 (31) 15.58 (51) N/A N/A N/A N/AIM Mixed-Asset Target 2055+ (MF) Median 5.44 23.26 15.58 -4.66 14.78 30.80 -40.69
0.0% 50.0% 100.0% 150.0%-50.0 %
Cash
Convertibles
Other
Fixed Income
Equities
-0.9 %
0.0%
1.8%
10.2%
88.8%
Vanguard Target Ret 2060
50.0
75.0
100.0
125.0
150.0
Up
Ca
ptu
re
50.0 65.0 80.0 95.0 110.0 125.0 140.0 150.0Down Capture
Vanguard Target Ret 2060 12/31/15
INTEGRITY. BALANCE. OBJECTIVITY.
64
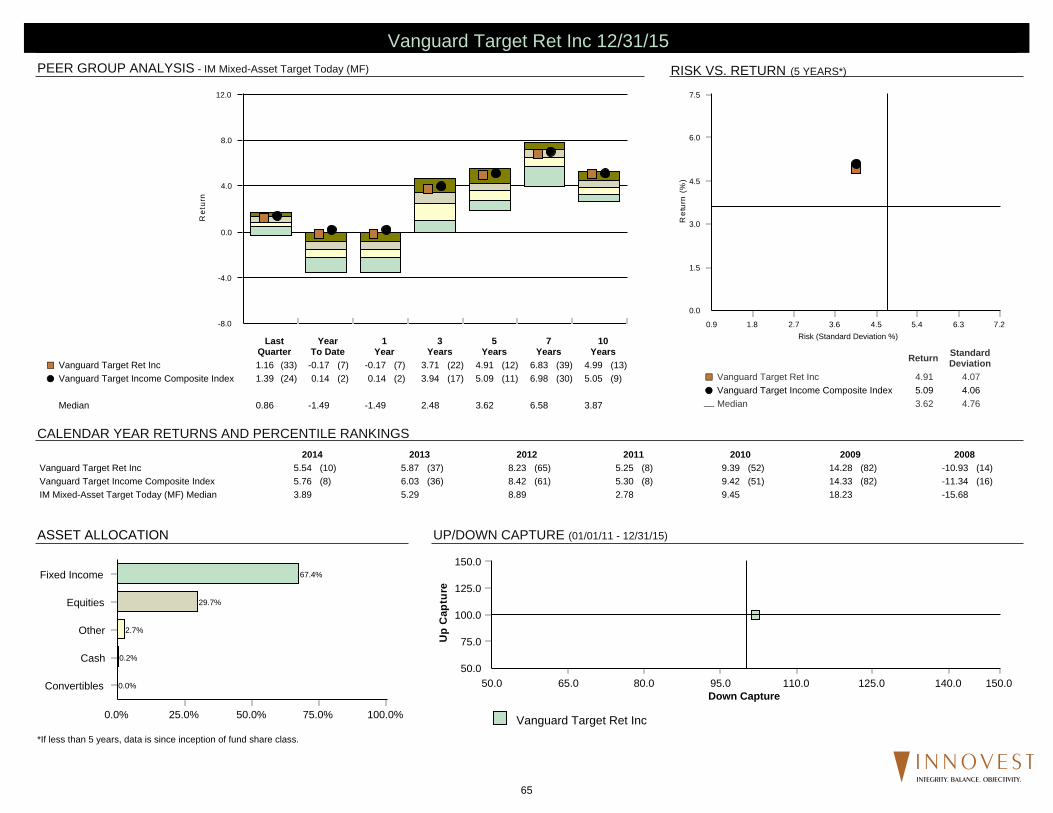
PEER GROUP ANALYSIS - IM Mixed-Asset Target Today (MF)
CALENDAR YEAR RETURNS AND PERCENTILE RANKINGS
RISK VS. RETURN (5 YEARS*)
ASSET ALLOCATION UP/DOWN CAPTURE (01/01/11 - 12/31/15)
*If less than 5 years, data is since inception of fund share class.
-8.0
-4.0
0.0
4.0
8.0
12.0
Ret
urn
LastQuarter
YearTo Date
1Year
3Years
5Years
7Years
10Years
Vanguard Target Ret Inc 1.16 (33) -0.17 (7) -0.17 (7) 3.71 (22) 4.91 (12) 6.83 (39) 4.99 (13)¢£
Vanguard Target Income Composite Index 1.39 (24) 0.14 (2) 0.14 (2) 3.94 (17) 5.09 (11) 6.98 (30) 5.05 (9)��
Median 0.86 -1.49 -1.49 2.48 3.62 6.58 3.87
0.0
1.5
3.0
4.5
6.0
7.5
Ret
urn
(%)
0.9 1.8 2.7 3.6 4.5 5.4 6.3 7.2Risk (Standard Deviation %)
ReturnStandardDeviation
Vanguard Target Ret Inc 4.91 4.07¢£
Vanguard Target Income Composite Index 5.09 4.06��
Median 3.62 4.76¾
2014 2013 2012 2011 2010 2009 2008
Vanguard Target Ret Inc 5.54 (10) 5.87 (37) 8.23 (65) 5.25 (8) 9.39 (52) 14.28 (82) -10.93 (14)Vanguard Target Income Composite Index 5.76 (8) 6.03 (36) 8.42 (61) 5.30 (8) 9.42 (51) 14.33 (82) -11.34 (16)IM Mixed-Asset Target Today (MF) Median 3.89 5.29 8.89 2.78 9.45 18.23 -15.68
0.0% 25.0% 50.0% 75.0% 100.0%
Convertibles
Cash
Other
Equities
Fixed Income
0.0%
0.2%
2.7%
29.7%
67.4%
Vanguard Target Ret Inc
50.0
75.0
100.0
125.0
150.0
Up
Ca
ptu
re
50.0 65.0 80.0 95.0 110.0 125.0 140.0 150.0Down Capture
Vanguard Target Ret Inc 12/31/15
INTEGRITY. BALANCE. OBJECTIVITY.
65

GlossaryAlpha measures a portfolio’s return in excess of the market return adjusted for risk. It is a measure of the manager’s contribution to performance with reference to security selection. A positive alpha indicates that a portfolio was positively rewarded for the residual risk that was taken for that level of market exposure.
Beta measures the sensitivity of rates of portfolio return to movements in the market. A portfolio’s beta measures the expected change in return per 1% change in the return on the market. If the beta of a portfolio is 1.5, a 1 percent increase in the return of the market will result, on average, in a 1.5 percent increase in the return on the portfolio. The converse would also be true.
Dividend Yield - The total amount of dividends paid out for a stock over the preceding twelve months divided by the closing price of a share of the common stock.
Down Capture Ratio - The Down Capture Ratio is a measure of the Investment’s compound return when the Benchmark was down divided by the Benchmark’s compound return when the Benchmark was down. The smaller the value, the better.
Duration - A time measure of a bond’s interest-rate sensitivity, based on the weighted average of the time periods over which a bond’s cash flows accrue to the bondholder.
Forecasted Long-Term Earnings Growth - This growth rate is a measure of a company’s expected long-term success in generating future year-over-year earnings growth. This growth rate is a market value weighted average of the consensus (mean) analysts’ long-term earnings growth rate forecast for each company in the portfolio. The definition of long-term varies by analyst but is limited to a 3-8 year range. This value is expressed as the expected average annual growth of earnings in percent.
Information Ratio measures the excess return per unit of residual “non market” risk in a portfolio. The ratio is equal to the Alpha divided by the Residual Risk.
Market Capitalization - The market value of a company’s outstanding shares of common stock at a specific point in time, computed as the product of the number of outstanding shares times the stock’s closing price per share.
P/E ratio relates the price of the stock to the per-share earnings of the company. A high P/E generally indicates that the market will pay more to obtain the company because it has confidence in the company’s ability to increase its earnings. Conversely, a low P/E indicates that the market has less confidence that the company’s earnings will increase, and therefore will not pay as much for its stock. In most cases a fund with a high average P/E ratio has paid a premium for stocks that have a high potential for increased earnings. If the fund’s average P/E ratio is low, the manager may believe that the stocks have an overlooked or undervalued potential for appreciation.
P/B ratio of a company relates the per-share market price of the company’s stock to its per-share book value, the historical accounting value of the company’s tangible assets. A high P/B ratio indicates that the price of the stock exceeds the actual worth of the company’s assets. A low P/B ratio would indicate that the stock is a bargain, priced below what the company’s assets could be worth if liquidated.
P/CF ratio compares the total market value of the portfolio to the portfolio’s share of the underlying stocks’ earnings (or book value, cash flow, sales or dividends).
Alpha measures a portfolio’s return in excess of the market return adjusted for risk. It is a measure of the manager’s contribution to performance with reference to security selection. A positive alpha indicates that a portfolio was positively rewarded for the residual risk that was taken for that level of market exposure.
Beta measures the sensitivity of rates of portfolio return to movements in the market. A portfolio’s beta measures the expected change in return per 1% change in the return on the market. If the beta of a portfolio is 1.5, a 1 percent increase in the return of the market will result, on average, in a 1.5 percent increase in the return on the portfolio. The converse would also be true.
Dividend Yield - The total amount of dividends paid out for a stock over the preceding twelve months divided by the closing price of a share of the common stock.
Down Capture Ratio - The Down Capture Ratio is a measure of the Investment’s compound return when the Benchmark was down divided by the Benchmark’s compound return when the Benchmark was down. The smaller the value, the better.
Duration - A time measure of a bond’s interest-rate sensitivity, based on the weighted average of the time periods over which a bond’s cash flows accrue to the bondholder.
Forecasted Long-Term Earnings Growth - This growth rate is a measure of a company’s expected long-term success in generating future year-over-year earnings growth. This growth rate is a market value weighted average of the consensus (mean) analysts’ long-term earnings growth rate forecast for each company in the portfolio. The definition of long-term varies by analyst but is limited to a 3-8 year range. This value is expressed as the expected average annual growth of earnings in percent.
Information Ratio measures the excess return per unit of residual “non market” risk in a portfolio. The ratio is equal to the Alpha divided by the Residual Risk.
Market Capitalization - The market value of a company’s outstanding shares of common stock at a specific point in time, computed as the product of the number of outstanding shares times the stock’s closing price per share.
P/E ratio relates the price of the stock to the per-share earnings of the company. A high P/E generally indicates that the market will pay more to obtain the company because it has confidence in the company’s ability to increase its earnings. Conversely, a low P/E indicates that the market has less confidence that the company’s earnings will increase, and therefore will not pay as much for its stock. In most cases a fund with a high average P/E ratio has paid a premium for stocks that have a high potential for increased earnings. If the fund’s average P/E ratio is low, the manager may believe that the stocks have an overlooked or undervalued potential for appreciation.
P/B ratio of a company relates the per-share market price of the company’s stock to its per-share book value, the historical accounting value of the company’s tangible assets. A high P/B ratio indicates that the price of the stock exceeds the actual worth of the company’s assets. A low P/B ratio would indicate that the stock is a bargain, priced below what the company’s assets could be worth if liquidated.
P/CF ratio compares the total market value of the portfolio to the portfolio’s share of the underlying stocks’ earnings (or book value, cash flow, sales or dividends).
R-Squared indicates the extent to which the variability of the portfolio returns is explained by market action. It can also be thought of as measuring the diversification relative to the appropriate benchmark. An R-Squared value of .75 indicates that 75% of the fluctuation in a portfolio return is explained by market action. An R-Squared of 1.0 indicates that a portfolio’s returns are entirely related to the market and it is not influenced by other factors. An R-Squared of zero indicates that no relationship exists between the portfolio’s return and the market.
Residual Risk is the unsystematic risk of a fund, or the portion of the total risk unique to the manager and not related to the overall market. This reflects the “bets” which the manager places in that particular asset class. These bets reflect emphasis in particular sectors, maturities (for bonds), or other issue specific factors which the manager considers a good investment opportunity. Diversification of the portfolio will reduce the residual risk of that portfolio.
Sharpe Ratio is a measure of risk-adjusted return. It is calculated by subtracting the risk-free return (90 day T-Bills) from the portfolio return and dividing the resulting “excess return” by the portfolio’s total risk level (standard deviation). The result is a measure of returned gained per unit of total risk taken.
Standard Deviation is a statistical measure of portfolio risk. It reflects the average deviation of observations from their sample mean. Standard Deviation is used as an estimate of risk since it measures how wide the range of returns typically is. The wider the typical range of returns, the higher the standard deviation of returns, and the higher the portfolio risk. If returns are normally distributed (i.e. as a bell shaped curve distribution) then approximately 66% of 2/3 of the returns would occur within plus or minus one standard deviation of the sample mean.
Style Exposure Chart indicates a portfolio’s exposure to a particular capitalization (large, medium or small) and style (value or growth). Based on Sharpe’s return based style analysis, a style map will attempt to correlate a manager to a particular style of investing (i.e. Large Cap Growth).
Turnover Ratio - This is a measure of the fund’s trading activity which is computed by taking the lesser of purchases or sales (excluding all securities with maturities of less than one year) and dividing by average monthly net assets.
Up Capture Ratio - The Up Capture Ratio is a measure of the Investment’s compound return when the Benchmark was up divided by the Benchmark’s compound return when the Benchmark was up. The greater the value, the better.
Down Capture Ratio - The Down Capture Ratio is a measure of the Investment’s compound return when the Benchmark was down divided by the Benchmark’s compound return when the Benchmark was down. The smaller the value, the better.
INTEGRITY. BALANCE. OBJECTIVITY.
66

Organization Asset BasePct. Owned by Employees CurrentBoutique vs. Institutional Growth of AUMRecent Changes in Ownership Capacity ConstraintsManagement Investment in Firm’s Products Soft ClosedSpecialized vs. All in One Re-opening of Products
People PerformanceSize of Team Short Term vs. Benchmark and Style GroupStructure of Team Long Term vs. Benchmark and Style GroupExperience of Team Consistency – Relative/Absolute/Risk AdjustedTurnover of Key MembersGrowth of Team with Assets
Philosophy/Process ExpensesStyle Consistency (Growth/Value, Market Cap) Cost vs. CompetitorsDomestic/Int’l drift
Examples of things that would cause concern resulting in a YELLOW or RED box include but not limited to:
6) EXPENSES - A fund or product that is substantially above the median expense ratio or management fee would be a cause for concern.
Fund Analysis Overview Key
1) ORGANIZATION - A change in ownership whereby it is unclear what the structure of the new organization will be, how will key personnel be compensated, and what type of employment contracts are in place to keep key decision makers.
2) PEOPLE - A change in portfolio manager would be a cause for concern. We would assess the new talent taking over. Is the new portfolio manager a current member of the team or is it someone new from outside the group or organization.
3) PHILOSOPHY/PROCESS - A change in portfolio characteristics would be a cause for concern. For example, if a growth style manager suddenly starts investing in value names during a value rally or if a small cap portfolio was migrating into midcap names due to asset growth.
4) ASSET BASE - A small cap fund with more than $3 billion in assets would be a cause for concern or a fund that continues to add assets as it becomes clear the portfolio management team can not handle the inflows. A sign of this would be a large increase in the cash position of the portfolio.
5) PERFORMANCE - A product that fails to outperform either the index and/or the median manager on a consistent basis (at least 50% of the time) would be a cause for concern. Short term and long term performance is considered both on an absolute basis and relative basis in addition to risk-adjusted measures.
Each of the 6 criteria are evaluated on an individual basis and subjective based on Innovest’s assessment. Below are examples of the many factors under each category we consider when making an assessment.
INTEGRITY. BALANCE. OBJECTIVITY.
67

Holdings Based Attribution Key
A. Buy and Hold Portfolio – Return for the portfolio assuming no securities were traded during the quarter B. Portfolio Trading = (C – A) or (Actual Return ‐ Buy and Hold Portfolio) C. Actual Return – return the client experienced D. Benchmark Return – return for benchmark E. Actual Active Return – (C – D) or ( Actual Return minus Benchmark Return ) F. Stock Selection – Is the contribution to return based upon the active stock selection by the manager with in a sector compared to the benchmark. G. Sector Selection – Is the contribution to return based upon the active overweight or underweight of a sector compared to the benchmark by the
manager. H. Interaction – Is the impact of contribution to return that are a combination of both Stock and Security selection also sometimes referred to as the
unexplained. I. Total Selection – Is the Sum of all the selection affects (F,G,H) J. Portfolio Trading – Same as B. K. Benchmark Trading – Benchmark B/H return – Actual Benchmark Return L. Total Trading – Portfolio Trading plus Benchmark Trading M. Buy & Hold Active Return – I + L
INTEGRITY. BALANCE. OBJECTIVITY.
68

Disclaimer The preceding statistical analysis was prepared by Innovest Portfolio Solutions LLC with data provided by Investment Metrics (IM), Lipper and Morningstar, Inc. All Rights Reserved. The investment products discussed are not insured by the FDIC and involve investment risk including the possible loss of all principal. The information contained herein: (1) is proprieta ry to the v endors listed above and/or its content providers; (2) may not be c opied or distributed; and (3) is not w arranted to be accurate, complete or timely. None of the vendors nor its content providers are respons ible for any damages or losses arising from any use of this information. Past performance is no guarantee of future results. Innovest compiles the information utilizing secondary data from statements provided by the plan trustee and/or custodian/ This report may also contain returns and valuations from outside sources as directed b y the client. Innovest assumes no respons ibility for the accuracy of these valuations or return methodologies. Reasonable care has been take n to assure the accuracy of the computer software and databases. Innovest disclaims responsibility, financial or ot herwise for t he accuracy and completeness of this report. Copyright 2015 by Innovest Portfolio Solutions LLC Inc. Note: Actual client mutual fund returns are reflected on the table of returns page. Fund pages subsequent to the table of returns reflect the representative mutual fund with the longest track record and may not be the actual share class held by the client. “Copyright 2015, Standard & Poor’s Financial Services LLC. Reproduction of S&P Index Services in any form is prohibited except with the prior written permission of S&P. S&P does not guarantee the accuracy, adequacy, completeness or availability of any information and is not responsible for an y errors or omissions, regardless of the cause or for the r esults obtained from the use of such information. S&P DISCLAIMS ANY AND ALL EXPRESS OR IMPLIED WARRANTIES, INCLUDING, BUT NOT LIMITED TO, ANY WARRANTIES OF MERCHANTABILITY OR FITNESS FOR A PAR TICULAR PURPOSE OR USE. In no event shall S&P be liable f or any direct, indirect, special or consequential damages, costs, expenses, legal fees, or losses (including lost income or lost profit and opportunity costs) in connection with subscriber’s or others’ use of S&P Index Services (2015) Copyright MSCI 2015. Unpublished. All Rights R eserved. This information may only be used for your internal use, may not be reproduced or re-disseminated in any form and m ay not be used to create any financial instruments or products or an y indices. This information is provided on an “as is” basis and the user of this informa tion assumes the entire risk of any use it ma y make or permit t o be made of thi s information. Neither MSCI, an y or its affiliates o r any other person involved in or related to compiling, computing or creating this information makes any express or implied warranties or representations with respect to such information or the results to be ob tained by the use thereof, and MSCI, its affiliates and each such other person hereby expressly disclaim all warr anties (including, without limitation, all warranties of o riginality, accuracy, completeness, timeliness, non-infringement, merchantability and fitness for a particular purpose) with respect to this information. Without lim iting any of the foregoing, in no ev ent shall MSCI, any of its affiliat es or any other person involved in or related to compiling, computing or creating this information have any liability for any direct, indirect, special, incidental, punit ive, consequential or an y other damages (including, without limitation, lost profits) even if notified of, or if it might otherwise have anticipated, the possibility of such damages.
INTEGRITY. BALANCE. OBJECTIVITY.
69

1
Professionally-Designed Custom
Model Portfolios:
Understand the Benefits
The concepts behind retirem
ent investing can be overw
helming for m
any American w
orkers, and retirem
ent itself may seem
so distant that workers
forego professional guidance until it is too late. It’s no secret that our nation is facing a retirem
ent savings crisis, and while
employers continually look for new
ways to offer investm
ent advice and increase participation w
ithin their retirement
plans, employees have generally rem
ained unresponsive.
Many Em
ployees Are Not Utilizing
Professionally-Managed Investm
ent Options
Offered Through Their Retirem
ent PlanResults of a 2012 study released by Charles Schw
ab:
• More than 54%
of employers reported that
participating employees do not take full advantage
of the investment options, features, and services
offered in connection with their retirem
ent plans.
• An astounding 73% of participants surveyed spend
less than eight hours per year managing their
retirement accounts.
• The vast majority of participants surveyed (83%
) say they are interested in receiving professional investm
ent managem
ent from their em
ployer. H
owever, a m
ere 10% of participants actually take
advantage of investment m
anagement advice w
hen it is offered.
Your employer has taken steps to help you sim
plify the investm
ent process. The Plan retains an independent
investment consultant, Innovest Portfolio Solutions, w
hich has created a series of m
odel portfolios that you can use as a guide for your investm
ents. The design of these m
odels and the suggested investm
ent funds are subject to ongoing
monitoring and evaluation by the Plan’s independent
investment professionals. By investing your retirem
ent assets in the sam
e manner as a m
odel portfolio, you will enjoy
benefits such as:
Asset AllocationAsset allocation is the process of dividing your savings across m
ajor asset classes (i.e. stocks, bonds, and cash). Each of these asset classes perform
s differently over time; therefore
appropriate asset allocation can help control volatility within
your retirement portfolio by insulating your assets from
extrem
e short-term m
arket swings. N
umerous studies have
shown that m
ore than 90% of your portfolio’s variability is
the direct result of asset allocation. Since a model portfolio
provides a specific suggested asset allocation for your account, the risk of having an im
proper allocation is imm
ediately reduced w
hen you invest your assets according to the model.
Diversification
Your retirement plan’s investm
ent menu not only offers
multiple asset classes (i.e. stocks, bonds, and cash), but also
different investment styles w
ithin the major asset classes.
Diversification looks to further sm
ooth out risk and volatility by spreading your savings across the different investm
ent styles. W
hile a novice or hands-off investor might understand
Continued on page 2
70

the need to spread their money across m
ultiple funds, without
a comprehensive understanding of the different styles they
may end up choosing a handful of investm
ents that are highly correlated. In other w
ords, your investments could have
similar objectives, causing all of them
to have similar reactions
to changing market conditions. Th
e model portfolios
provided for your plan have been designed using a wide array
of funds that have a low correlation to one another in order to
maxim
ize your potential for return and minim
ize volatility.
Best-in-Class FundsIt w
ould be impossible for an investm
ent firm (m
utual fund com
pany) to offer the best fund on the market for each
different asset class and strategy. In fact, it can be difficult
for an investment firm
to sustain peak performance w
ith one specific fund for an extended period of tim
e, let alone
an array of funds and strategies. Investment firm
s try to set them
selves apart from one another by taking vastly different
approaches to fund managem
ent, so while one fund m
ay have short-term
mom
entum, it w
ill likely fall out of favor w
ithin the next few years. U
nfortunately, it can be comm
on for investors to gravitate tow
ard individual funds with high
short-term perform
ance or fund families w
ith familiar nam
es that em
ploy extensive advertising campaigns. Furtherm
ore, it can be challenging for the average investor to access and understand qualitative details about an investm
ent firm’s
managem
ent style or structure that may give them
an edge in certain m
arket conditions. How
ever, the industry professionals w
ho oversee the model portfolios provided for
your retirement plan are dedicated to analyzing all of the
data, facts, and philosophies behind thousands of mutual
funds. As a result, each model is designed w
ith a best-in-class approach. Th
is means if you take advantage of a m
odel, your assets w
ill be diversified across numerous fund fam
ilies that are deem
ed to be some of the m
ost likely to succeed in the future. Furtherm
ore, the model portfolios are m
onitored on an ongoing basis, and the Plan’s investm
ent consultant (Innovest Portfolio Solutions) w
ill automatically replace a
fund in the model if it fails to m
eet their performance and/or
managem
ent standards.
Important N
ote About RebalancingO
ver the course of any given period (i.e. quarterly, annually, etc.) som
e of the investments in your portfolio w
ill grow
faster than others. In fact, some w
ill experience losses while
other investments produce gains. As a result, the w
eighting of each asset class w
ill change over the period and you will
end up with an allocation that m
ay be inappropriate for your tim
e horizon or tolerance for risk. Rebalancing is the process of realigning the w
eightings of the investments in
your portfolio. Since the more aggressive investm
ents in one’s portfolio generally produce greater returns over the long term
, your portfolio could becom
e considerably more aggressive
(risky) if rebalancing is not performed periodically. H
ands-off investors typically approach their retirem
ent accounts with
a “set it and forget it” mentality, and m
ay not restore their original allocations for m
any years, if at all, unnecessarily exposing their portfolio to m
arket risk. Make sure you sign up
for the automatic rebalancing feature if it is offered through
your plan. This feature w
ill restore your account’s allocation on a periodic basis and ensure your investm
ents remain
consistent with the m
odel portfolio’s allocations over time.
Continued on page 3
2
Professionally-Designed Custom
Model Portfolio: Understand the Benefits
Continued from cover
71
Published by Innovest Portfolio Solutions, LLC4643 S. Ulster Street, Suite 81040 | Denver, CO
80237 | 303.694.1900 | ww
w.innovestinc.com
Whom
do I call for help?
3
As you can see, a lot of time and thought needs to go into
establishing and maintaining suitable investm
ents within
your retirement account. Plan participants m
ust be honest w
ith themselves about their investm
ent knowledge and the
amount of tim
e they can dedicate to the managem
ent of their accounts. Fortunately, a lack of tim
e and knowledge are no
longer excuses for mism
anagement of your retirem
ent assets. Find the m
odel portfolio that you are most com
fortable with
(see the following pages); follow
the instructions below to
transfer your funds accordingly today; and then sit back and enjoy the benefits of professional portfolio design.
Instructions: Implem
enting the Model Portfolios
The m
odel portfolios presented in this newsletter are
intended to provide participants with a guideline for
creating an appropriate asset allocation. In order to invest your retirem
ent savings according to one of these custom
models, log into your account either through the m
icrosite at w
ww.tiaa-cref.org/lps or w
ww.tiaa-cref.org (public site).
Once logged in, select the M
anage My Portfolio tab at the
top of the page. Select the Change Investm
ents link. Select the retirem
ent plan. Select the effective date of the change. Enter the percentage, dollar am
ount or transfer all from
each fund. Enter the percentage per fund (destination fund). C
lick on the Preview change button to review
allocation requested. Finally, click on Subm
it.
For further assistance with this process, or if you need help
resetting the login information for your online account, you
may reach the T
IAA-CR
EF call center by calling 1(800) 842-2009 M
onday-Friday, 6:00am to 8:00pm
(MST
).
Professionally-Designed Custom
Model Portfolio: Understand the Benefits
Continued from page 2
Contact TIAA
-CREF for the follow
ing:> Balances> Investm
ent changes> Change personal info
800.842.2009w
ww
.tiaa-cref.org
The Plan’s Investment Consultant
Innovest Portfolio Solutions
4643 S. Ulster St., Suite 1040 D
enver, CO 80237
303.694.1900 | ww
w.innovestinc.com
72
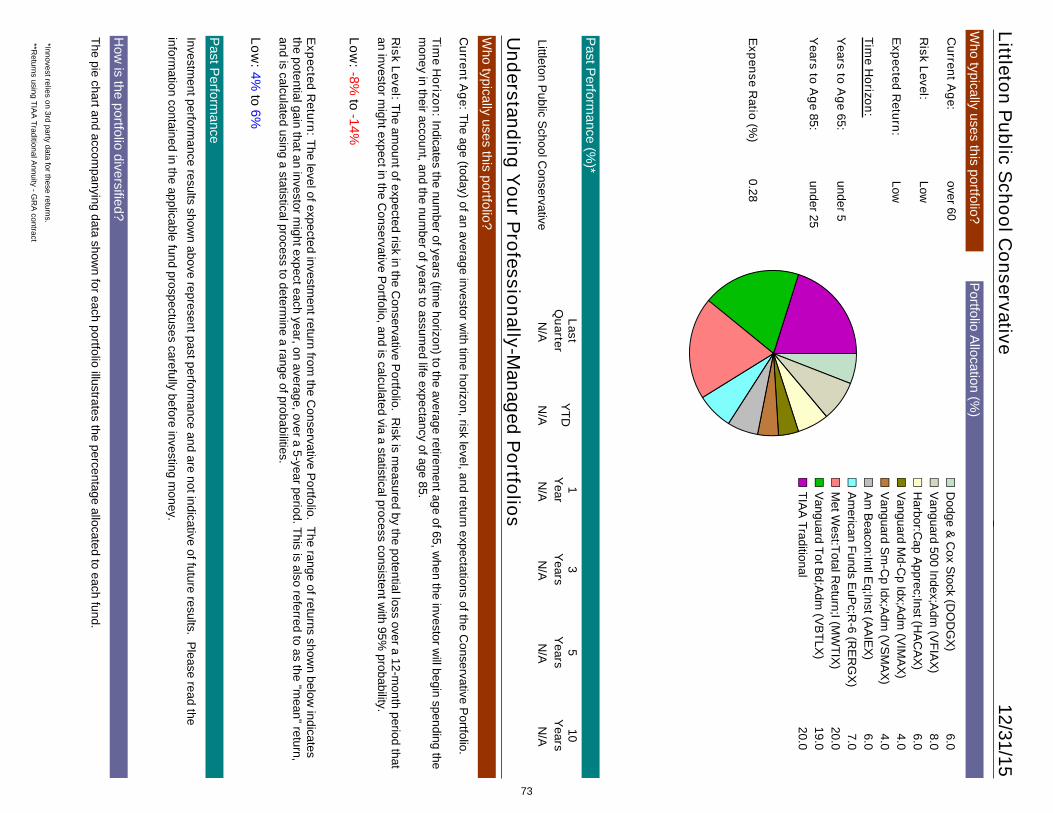
The pie chart and accompanying data show
n for each portfolio illustrates the percentage allocated to each fund.
How
is the portfolio diversified?
Investment perform
ance results shown above represent past perform
ance and are not indicative of future results. Please read the
information contained in the applicable fund prospectuses carefully before investing m
oney.
Past P
erformance
Current A
ge:The age (today) of an average investor with tim
e horizon, risk level, and return expectations of the Conservative P
ortfolio.
Time H
orizon: Indicates the number of years (tim
e horizon) to the average retirement age of 65, w
hen the investor will begin spending the
money in their account, and the num
ber of years to assumed life expectancy of age 85.
Risk Level:The am
ount of expected risk in the Conservative P
ortfolio. Risk is m
easured by the potential loss over a 12-month period that
an investor might expect in the C
onservative Portfolio, and is calculated via a statistical process consistent w
ith 95% probability.
Low:-8%
to-14%
Expected R
eturn:The level of expected investment return from
the Conservative P
ortfolio. The range of returns shown below
indicatesthe potential gain that an investor m
ight expect each year, on average, over a 5-year period. This is also referred to as the "mean" return,
and is calculated using a statistical process to determine a range of probabilities.
Low:4%
to6%
Who typically uses this portfolio?
Understanding Y
our Professionally-M
anaged Portfolios
Portfolio A
llocation (%)
Who typically uses this portfolio?
Current A
ge:over 60
Risk Level:
Low
Expected R
eturn:Low
Time H
orizon:
Years to A
ge 65:under 5
Years to A
ge 85:under 25
Expense R
atio (%) 0.28
Past P
erformance (%
)*
Decem
ber 31, 2015 : $100D
odge & C
ox Stock (D
OD
GX
)6.0
¢£
Vanguard 500 Index;A
dm (V
FIAX
)8.0
¢£
Harbor:C
ap Apprec;Inst (H
AC
AX
)6.0
¢£
Vanguard M
d-Cp Idx;A
dm (V
IMA
X)
4.0¢£
Vanguard S
m-C
p Idx;Adm
(VS
MA
X)
4.0¢£
Am
Beacon:Intl E
q;Inst (AA
IEX
)6.0
¢£
Am
erican Funds EuP
c;R-6 (R
ER
GX
)7.0
¢£
Met W
est:Total Return;I (M
WTIX
)20.0
¢£
Vanguard Tot B
d;Adm
(VB
TLX)
19.0¢£
TIAA
Traditional20.0
¢£
LastQ
uarterY
TD1
Year
3Y
ears5
Years
10Y
earsLittleton P
ublic School C
onservativeN
/AN
/AN
/AN
/AN
/AN
/A
Littleton Public S
chool Conservative
12/31/15
*Innovest relies on 3rd party data for these returns.
**Returns using TIA
A Traditional A
nnuity - GR
A contract
73
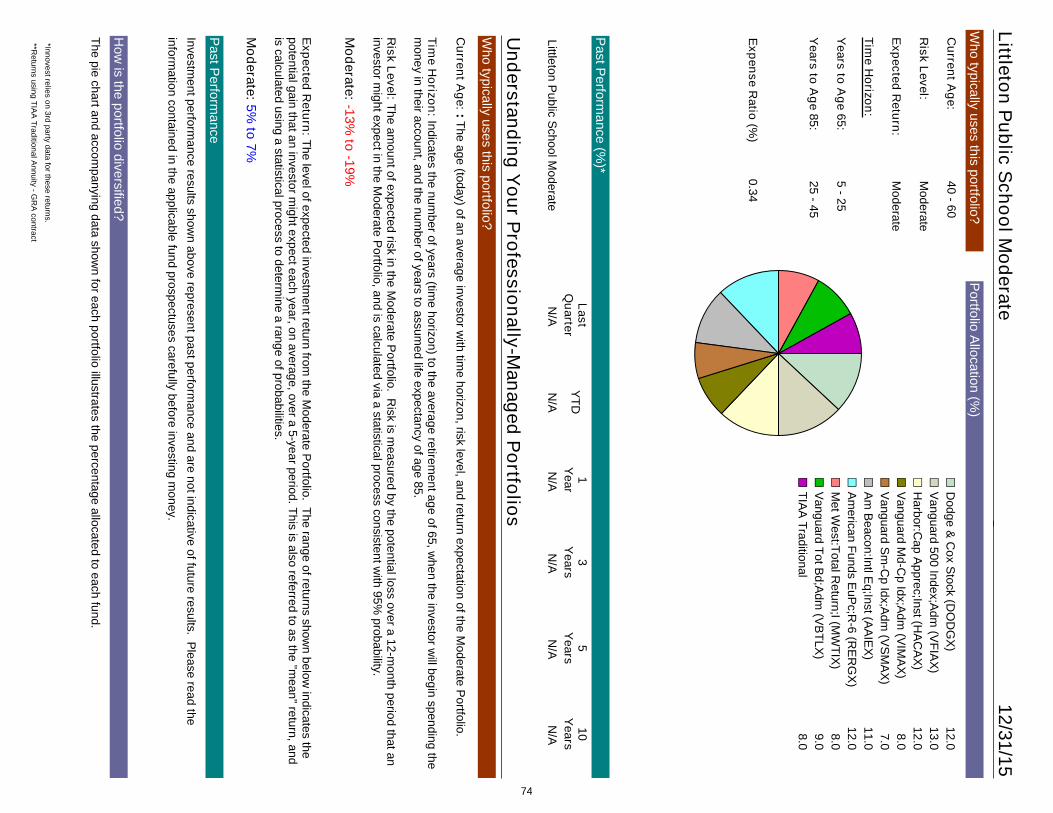
The pie chart and accompanying data show
n for each portfolio illustrates the percentage allocated to each fund.
How
is the portfolio diversified?
Investment perform
ance results shown above represent past perform
ance and are not indicative of future results. Please read the
information contained in the applicable fund prospectuses carefully before investing m
oney.
Past P
erformance
Current A
ge:: The age (today) of an average investor w
ith time horizon, risk level, and return expectation of the M
oderate Portfolio.
Time H
orizon: Indicates the number of years (tim
e horizon) to the average retirement age of 65, w
hen the investor will begin spending the
money in their account, and the num
ber of years to assumed life expectancy of age 85.
Risk Level:The am
ount of expected risk in the Moderate P
ortfolio. Risk is m
easured by the potential loss over a 12-month period that an
investor might expect in the M
oderate Portfolio, and is calculated via a statistical process consistent w
ith 95% probability.
Moderate:-13%
to -19%
Expected R
eturn: The level of expected investment return from
the Moderate P
ortfolio. The range of returns shown below
indicates thepotential gain that an investor m
ight expect each year, on average, over a 5-year period. This is also referred to as the "mean" return, and
is calculated using a statistical process to determine a range of probabilities.
Moderate:5%
to 7%
Who typically uses this portfolio?
Understanding Y
our Professionally-M
anaged Portfolios
Portfolio A
llocation (%)
Who typically uses this portfolio?
Current A
ge:40
- 60
Risk Level:
Moderate
Expected R
eturn:M
oderate
Time H
orizon:
Years to A
ge 65:5 - 25
Years to A
ge 85:25 - 45
Past P
erformance (%
)*
Expense R
atio (%) 0.34
Decem
ber 31, 2015 : $100D
odge & C
ox Stock (D
OD
GX
)12.0
¢£
Vanguard 500 Index;A
dm (V
FIAX
)13.0
¢£
Harbor:C
ap Apprec;Inst (H
AC
AX
)12.0
¢£
Vanguard M
d-Cp Idx;A
dm (V
IMA
X)
8.0¢£
Vanguard S
m-C
p Idx;Adm
(VS
MA
X)
7.0¢£
Am
Beacon:Intl E
q;Inst (AA
IEX
)11.0
¢£
Am
erican Funds EuP
c;R-6 (R
ER
GX
)12.0
¢£
Met W
est:Total Return;I (M
WTIX
)8.0
¢£
Vanguard Tot B
d;Adm
(VB
TLX)
9.0¢£
TIAA
Traditional8.0
¢£
LastQ
uarterY
TD1
Year
3Y
ears5
Years
10Y
earsLittleton P
ublic School M
oderateN
/AN
/AN
/AN
/AN
/AN
/A
Littleton Public S
chool Moderate
12/31/15
*Innovest relies on 3rd party data for these returns.
**Returns using TIA
A Traditional A
nnuity - GR
A contract
74

The pie chart and accompanying data show
n for each portfolio illustrates the percentage allocated to each fund.
How
is the portfolio diversified?
Investment perform
ance results shown above represent past perform
ance and are not indicative of future results. Please read the
information contained in the applicable fund prospectuses carefully before investing m
oney.
Past P
erformance
Current A
ge:: The age (today) of an average investor w
ith time horizon, risk level, and return expectation of the A
ggressive Portfolio.
Time H
orizon: Indicates the number of years (tim
e horizon) to the average retirement age of 65, w
hen the investor will begin spending the
money in their account, and the num
ber of years to assumed life expectancy of age 85.
Risk Level:The am
ount of expected risk in the Aggressive P
ortfolio. Risk is m
easured by the potential loss over a 12-month period that an
investor might expect in the A
ggressive Portfolio, and is calculated via a statistical process consistent w
ith 95% probability.
High:-17%
to -23%
Expected R
eturn: The level of expected investment return from
the Aggressive P
ortfolio. The range of returns shown below
indicates thepotential gain that an investor m
ight expect each year, on average, over a 5-year period. This is also referred to as the "mean" return, and
is calculated using a statistical process to determine a range of probabilities.
High:6%
to 8%
Who typically uses this portfolio?
Understanding Y
our Professionally-M
anaged Portfolios
Portfolio A
llocation (%)
Who typically uses this portfolio?
Current A
ge:30
- 50
Risk Level:
High
Expected R
eturn:H
igh
Time H
orizon:
Years to A
ge 65:15 - 35
Years to A
ge 85:35 - 55
Past P
erformance (%
)*
Expense R
atio (%) 0.38
Decem
ber 31, 2015 : $100D
odge & C
ox Stock (D
OD
GX
)15.0
¢£
Vanguard 500 Index;A
dm (V
FIAX
)15.0
¢£
Harbor:C
ap Apprec;Inst (H
AC
AX
)15.0
¢£
Vanguard M
d-Cp Idx;A
dm (V
IMA
X)
9.0¢£
Vanguard S
m-C
p Idx;Adm
(VS
MA
X)
9.0¢£
Am
Beacon:Intl E
q;Inst (AA
IEX
)14.0
¢£
Am
erican Funds EuP
c;R-6 (R
ER
GX
)14.0
¢£
Met W
est:Total Return;I (M
WTIX
)3.0
¢£
Vanguard Tot B
d;Adm
(VB
TLX)
3.0¢£
TIAA
Traditional3.0
¢£
LastQ
uarterY
TD1
Year
3Y
ears5
Years
10Y
earsLittleton P
ublic School A
ggressiveN
/AN
/AN
/AN
/AN
/AN
/A
Littleton Public S
chool Aggressive
12/31/15
*Innovest relies on 3rd party data for these returns.**R
eturns using TIAA
Traditional Annuity - G
RA
contract
75