nedo-10084-3 september 1984 c. strains in cladding by
TRANSCRIPT
NEDO-10084-3September 1984
c. Strains in Cladding by Bending Operation
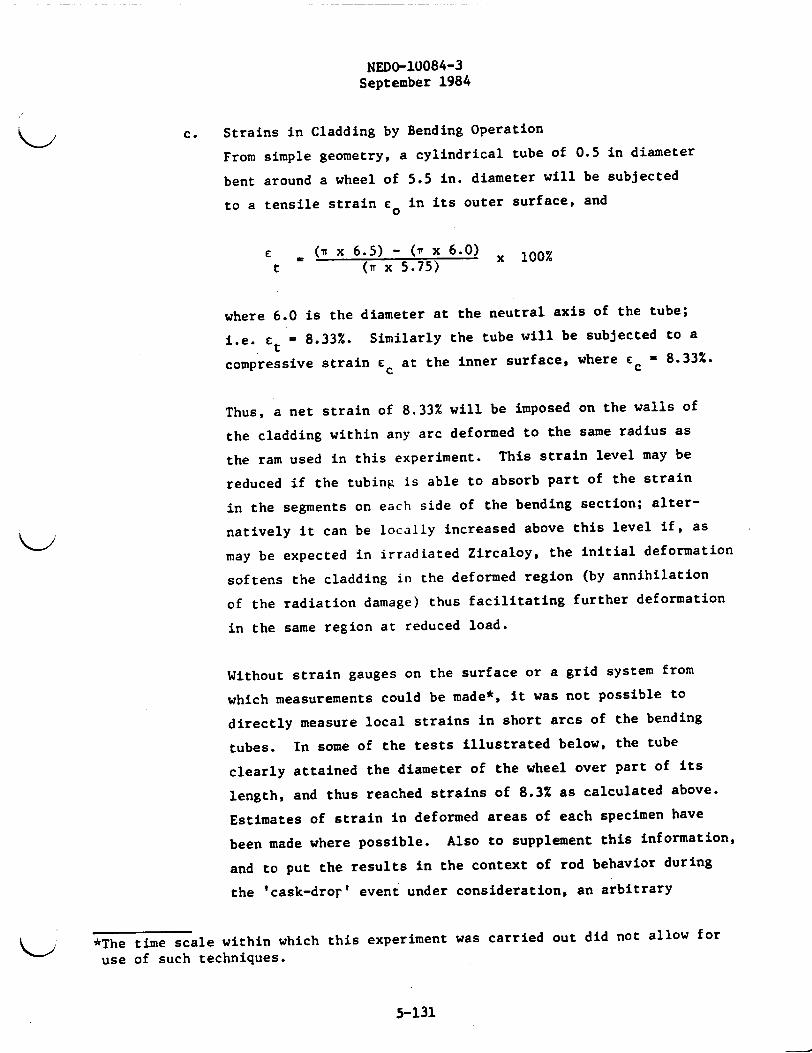
From simple geometry, a cylindrical tube of 0.5 in diameter
bent around a wheel of 5.5 in. diameter will be subjected
to a tensile strain E0 in its outer surface, and
C (w x 6.5) - (r x 6.0) x 100%t (iT x 5.75)
where 6.0 is the diameter at the neutral axis of the tube;
i.e. Et = 8.33%. Similarly the tube will be subjected to a
compressive strain c at the inner surface, where EC ' 8.33%.
Thus, a net strain of 8.33% will be imposed on the walls of
the cladding within any arc deformed to the same radius as
the ram used in this experiment. This strain level may be
reduced if the tubing is able to absorb part of the strain
in the segments on each side of the bending section; alter-
natively it can be locally increased above this level if, as
may be expected in irradiated Zircaloy, the initial deformation
softens the cladding in the deformed region (by annihilation
of the radiation damage) thus facilitating further deformation
in the same region at reduced load.
Without strain gauges on the surface or a grid system from
which measurements could be made*, it was not possible to
directly measure local strains in short arcs of the bending
tubes. In some of the tests illustrated below, the tube
clearly attained the diameter of the wheel over part of its
length, and thus reached strains of 8.3% as calculated above.
Estimates of strain in deformed areas of each specimen have
been made where possible. Also to supplement this information,
and to put the results in the context of rod behavior during
the 'cask-dror' event under consideration, an arbitrary
*The time scale within which this experiment was carried out did not allow for
use of such techniques.
5-131
NEDO-10084-3September 1984
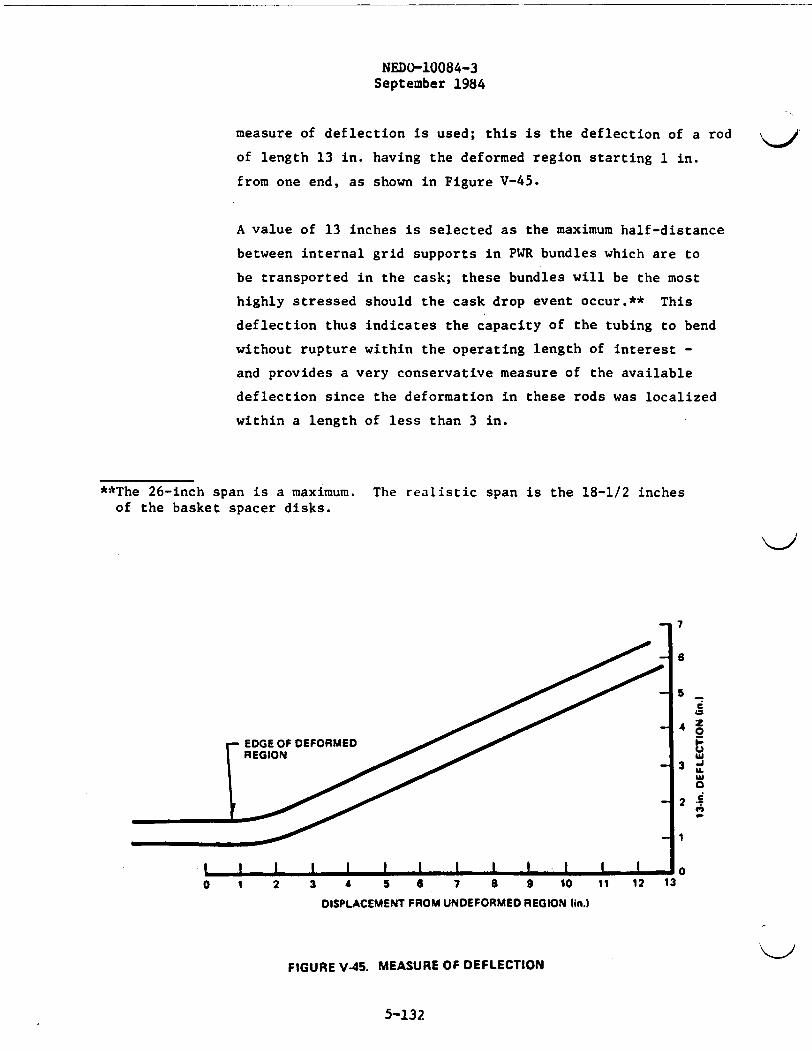
measure of deflection is used; this is the deflection of a rod
of length 13 in. having the deformed region starting 1 in.
from one end, as shown in Figure V-45.
A value of 13 inches is selected as the maximum half-distance
between internal grid supports in PWR bundles which are to
be transported in the cask; these bundles will be the most
highly stressed should the cask drop event occur.** This
deflection thus indicates the capacity of the tubing to bend
without rupture within the operating length of interest -
and provides a very conservative measure of the available
deflection since the deformation in these rods was localized
within a length of less than 3 in.
**The 26-inch span is a maximum.of the basket spacer disks.
The realistic span is the 18-1/2 inches
K'
.7
6
5-
U'.W
2 4
EDGE OF DEFORMEDREGION
IiI I I ;I I I II_ A L L-A0 1 2 3 4 5 6 7 a 9 10 11
DISPLACEMENT FROM UNDEFORMED REGION (in.)
12 11 U13
FIGURE V45. MEASURE OF DEFLECTION
5-132
NEDO-10084-3September 1984
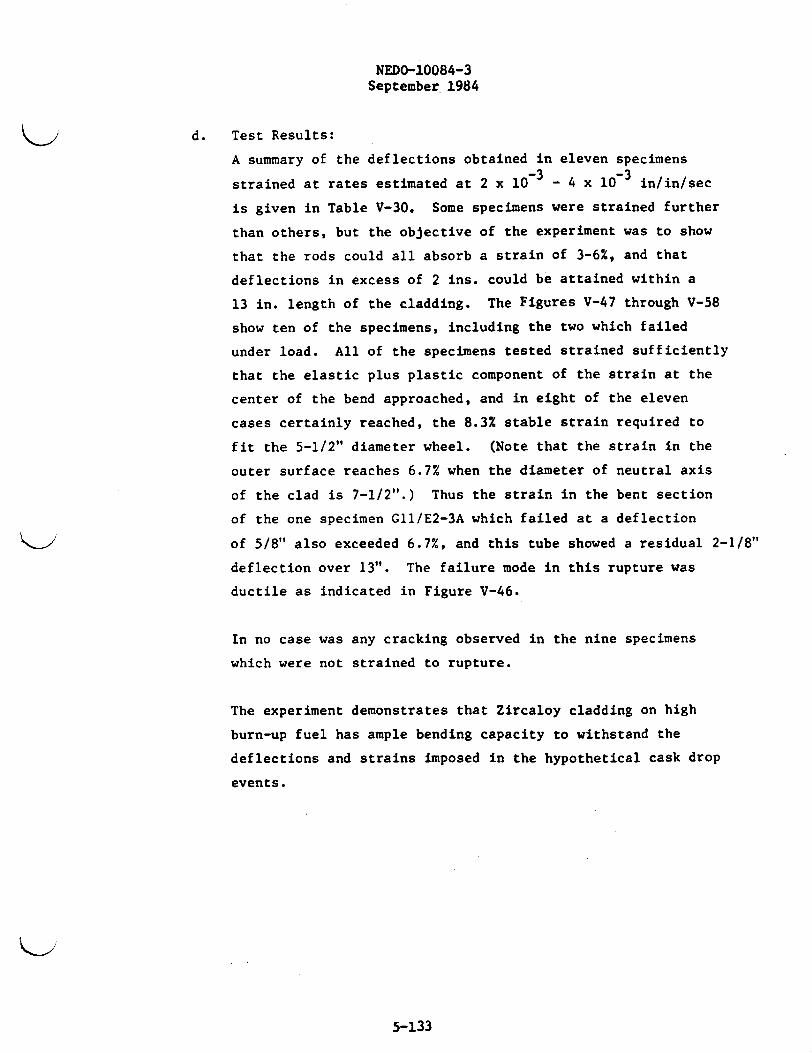
d. Test Results:
A summary of the deflections obtained in eleven specimens
strained at rates estimated at 2 x 10³ - 4 x 10³ in/in/sec
is given in Table V-30. Some specimens were strained further
than others, but the objective of the experiment was to show
that the rods could all absorb a strain of 3-6%, and that
deflections in excess of 2 ins. could be attained within a
13 in. length of the cladding. The Figures V-47 through V-58
show ten of the specimens, including the two which failed
under load. All of the specimens tested strained sufficiently
that the elastic plus plastic component of the strain at the
center of the bend approached, and in eight of the eleven
cases certainly reached, the 8.3% stable strain required to
fit the 5-1/2" diameter wheel. (Note that the strain in the
outer surface reaches 6.7% when the diameter of neutral axis
of the clad is 7-1/2".) Thus the strain in the bent section
of the one specimen Gll/E2-3A which failed at a deflection
of 5/8" also exceeded 6.7%, and this tube showed a residual 2-1/8"
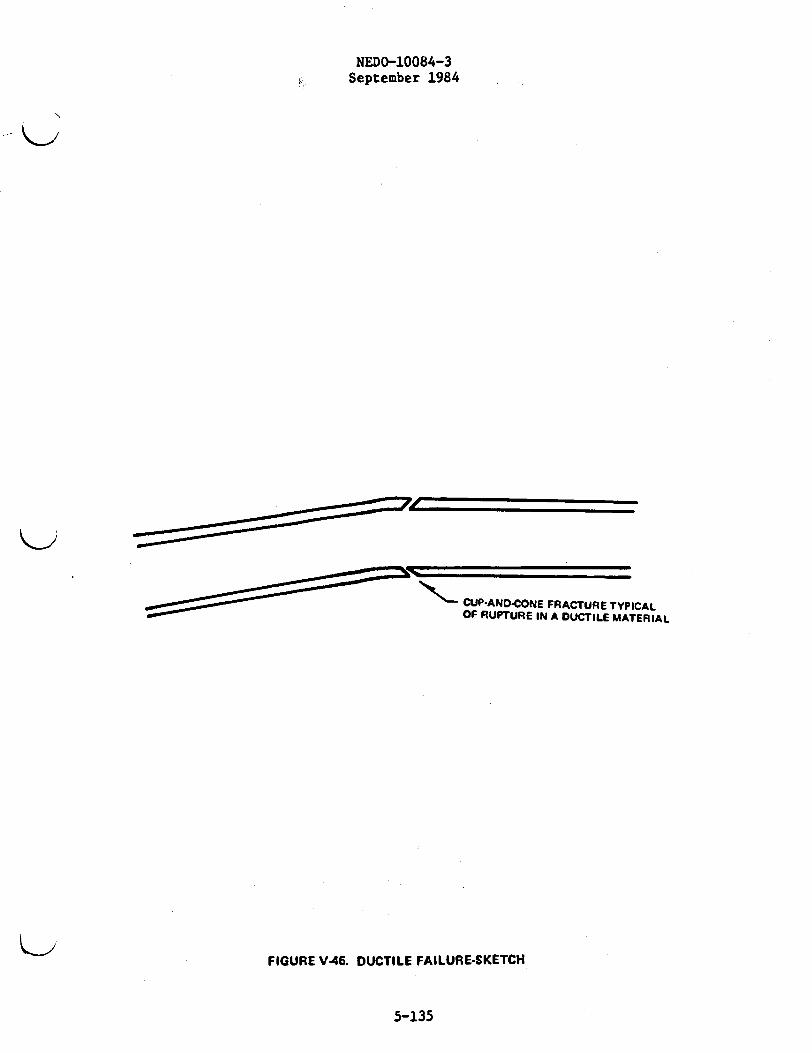
deflection over 13". The failure mode in this rupture was
ductile as indicated in Figure V-46.
In no case was any cracking observed in the nine specimens
which were not strained to rupture.
The experiment demonstrates that Zircaloy cladding on high
burn-up fuel has ample bending capacity to withstand the
deflections and strains imposed in the hypothetical cask drop
events.
5-133
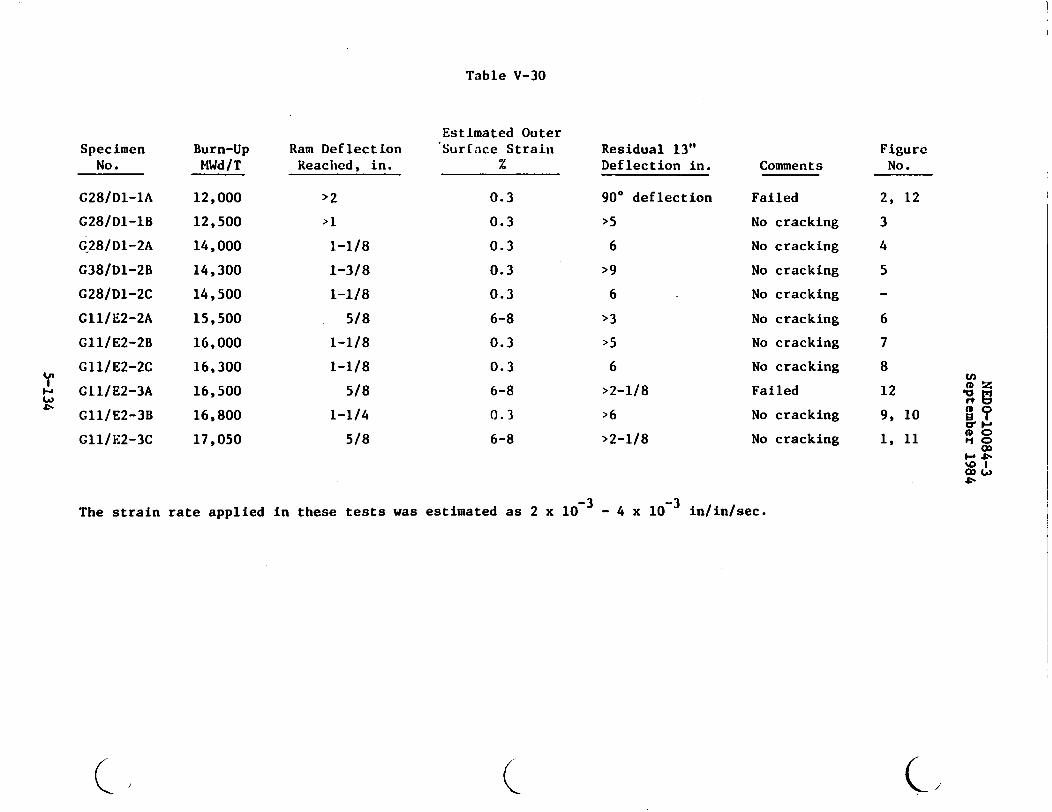
Table V-30
SpecimenNo.
Burn-UpMWd/T
Ram DeflectionReached, in.
Estimated OuterSurface Strain Residual 13"
Deflection in.FigureNo.Comments
G28/Dl-lA
G28/D1-lB
G28/Dl-2A
G38/Dl-2B
G28/D1-2C
Gll/E2-2A
Gll/E2-2B
Gll/E2-2C
Gll/E2-3A
Gll/E2-3B
Gll/H2-3C
12,000
12,500
14,000
14,300
14,500
15,500
16,000
16,300
16,500
16,800
17,050
>2
>1
1-1/8
1-3/8
1-1/8
5/8
1-1/8
1-1/8
5/8
1-1/4
5/8
0.3
0.3
0.3
0.3
0.3
6-8
0.3
0.3
6-8
0.3
6-8
900 deflection
>5
6
>9
6
>3
>5
6
>2-1/8
>6
>2-1/8
Failed
No cracking
No cracking
No cracking
No cracking
No cracking
No cracking
No cracking
Failed
No cracking
No cracking
2, 12
3
4
5
0.v'
6
7
8
12
9,
1,
10
11
mUTo z
0 Fly0 0rD 0'0
The strain rate applied in these tests was estimated as 2 x 10 - 4 x 10 3 in/in/sec.
C ( C I
NEDO-10084-3LI September 1984
, =A=74=- -
'< CUP-AND-CONE FRACTURE TYPICALOF RUPTURE IN A DUCTILE MATERIAL
FIGURE V46. DUCTILE FAILURE-SKETCH
5-135
NEDO-10084-3September 1984
VIA
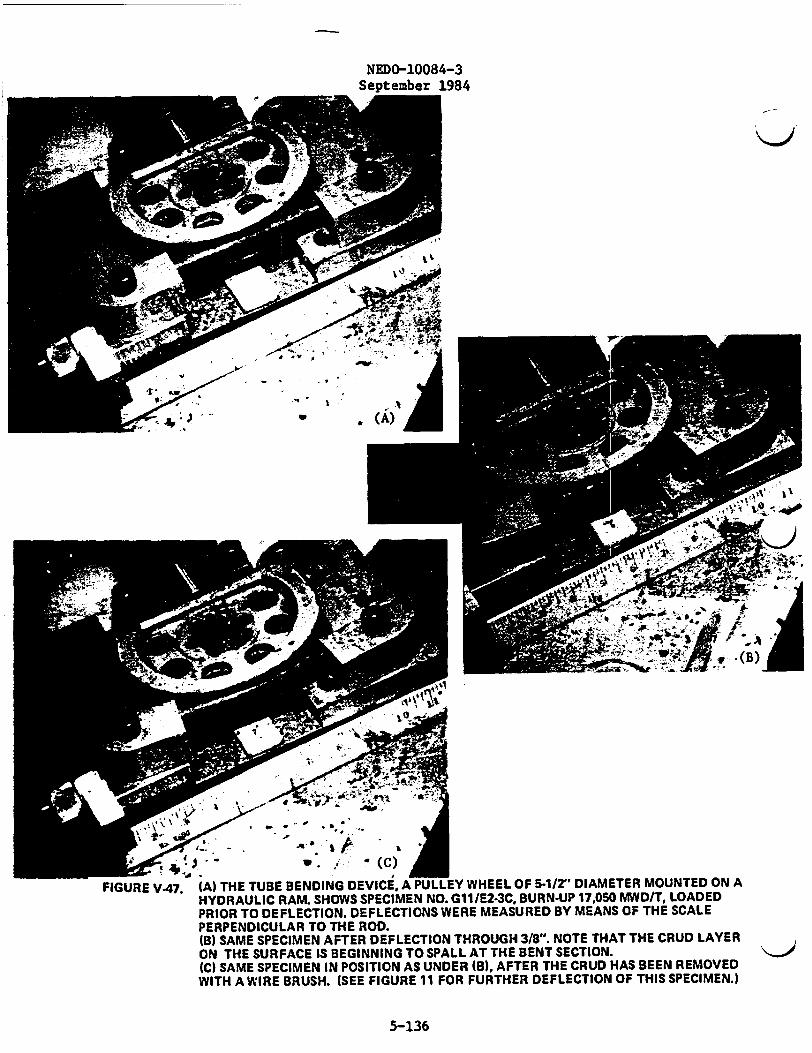
+ Jo w ' t' *(C)FIGURE V-47. (A) THE TUBE BENDING DEVICE, A PULLEY WHEEL OF 5-1/2" DIAMETER MOUNTED ON A
HYDRAULIC RAM. SHOWS SPECIMEN NO. GII/E2-3C, BURN-UP 17,050 MWD/T, LOADEDPRIOR TO DEFLECTION. DEFLECTIONS WERE MEASURED BY MEANS OF THE SCALEPERPENDICULAR TO THE ROD.(B) SAME SPECIMEN AFTER DEFLECTION THROUGH 3/8". NOTE THAT THE CRUD LAYERON THE SURFACE IS BEGINNING TO SPALL AT THE BENT SECTION.{C) SAME SPECIMEN IN POSITION AS UNDER (B). AFTER THE CRUD HAS BEEN REMOVEDWITH A WIRE BRUSH. (SEE FIGURE 11 FOR FURTHER DEFLECTION OF THIS SPECIMEN.)
5-136

NEDO-10084-3A.-*, September 1984wret
(A) .2
He_>
4-v r SW : it *4-
._ - -q.-
4S __(
(A) SPECIMEN NO.G28/Dl.IABURN-UP -12,000 MWD/T AS LOADED(B) SAME SPECIMEN DEFLECTED 1-1/6". THE SURFACE HAD BEENWIRE BRUSHED(C) CLOSE-UP OF BENT SURFACE UNDER LOAD, WITH STRAIN >8%(SEE TEXT).
5-137
NEDO-10084-3September 1984
K
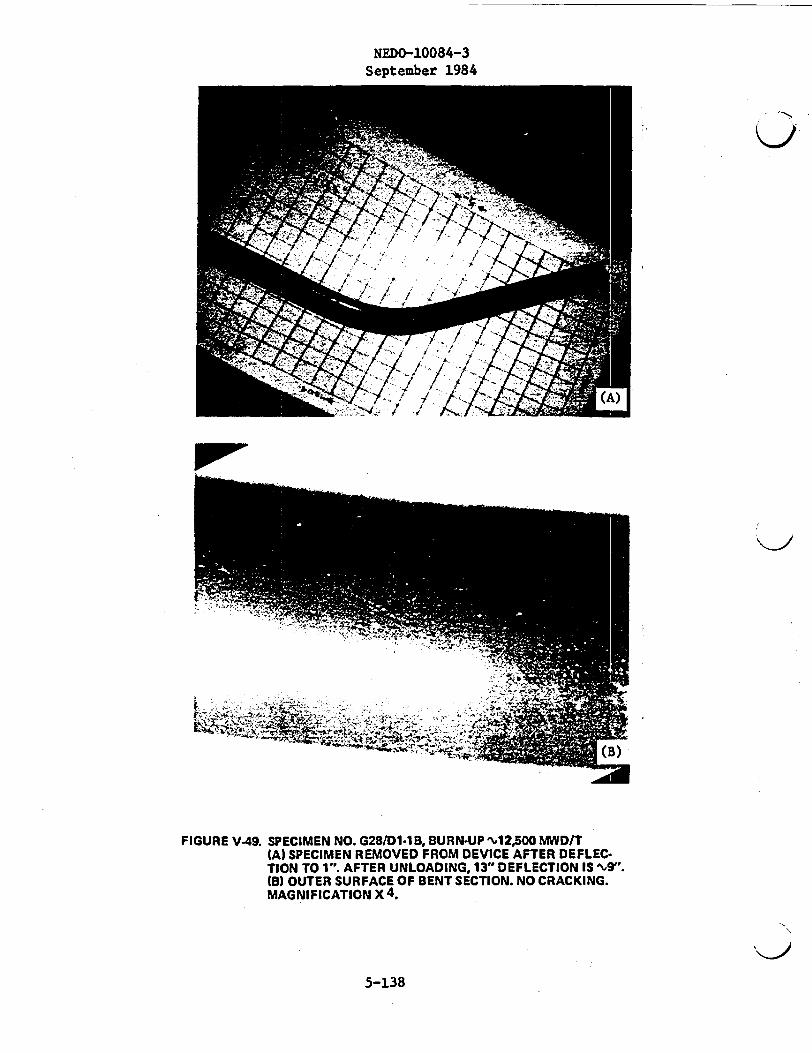
FIGURE V-49. SPECIMEN NO. G281D1-1B. BURN-UP M12,500 MWD/T(A) SPECIMEN REMOVED FROM DEVICE AFTER DEFLEC-TION TO 1". AFTER UNLOADING, 13" DEFLECTION IS A,9".IB) OUTER SURFACE OF BENT SECTION. NO CRACKING.MAGNIFICATION X 4.
I>
5-138

F ----1�1 "-� �f
NEDO-10084-3September 1984
FIGURE V-50. SPECIMEN NO. G28ID12A BURN-UP 14,000 MWD/T(A) SPECIMEN IN DEVICE DEFLECTED TO 1-1/8"(B) AFTER UNLOADING TO THIS DEFLECTION;RESIDUAL 13" DEFLECTION IS 71
5-139

NEDO-10084-3September 1984
I[
(B)
FIGURE V-51. SPECIMEN NO. G28/DI-2B BURN-UP 14,300 MWD/T(A) SPECIMEN UNLOADED AFTER DEFLECTION TO1-3/8". RESIDUAL 13" DEFLECTION "9"(B) OUTER SURFACE OF BENT SECTIONS. NOCRACKING. VISIBLE MARKS ARE RESIDUE FROMPROFILOMETRY. MAGNIFICATION x 3-1/2
5-140
NEDO-10084-3September 1984k_ .
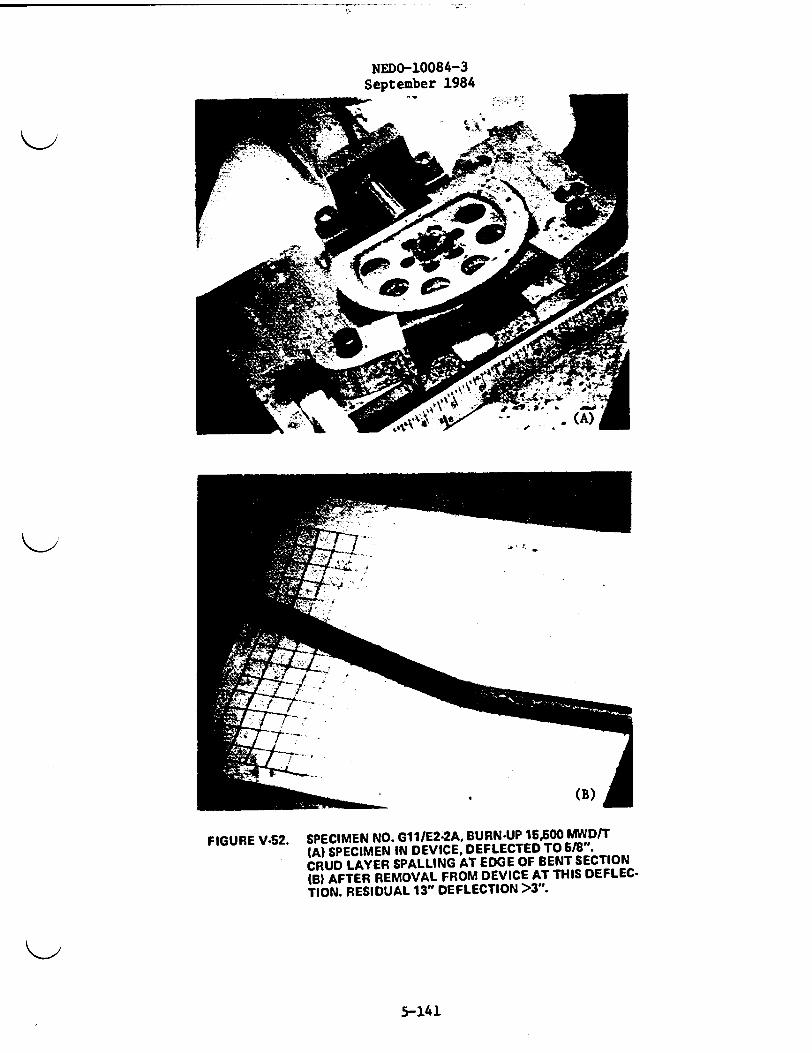
FIGURE V-52. SPECIMEN NO. Gll/E2-2A, BURN-UP 15.500 MWDIT(A) SPECIMEN IN DEVICE, DEFLECTED TO 61/8.CRUD LAYER SPALLING AT EDGE OF BENT SECTION(B) AFTER REMOVAL FROM DEVICE AT THIS DEFLEC-TION. RESIDUAL 13" DEFLECTION >3".
5-141
NEDO-10084-3September 1984
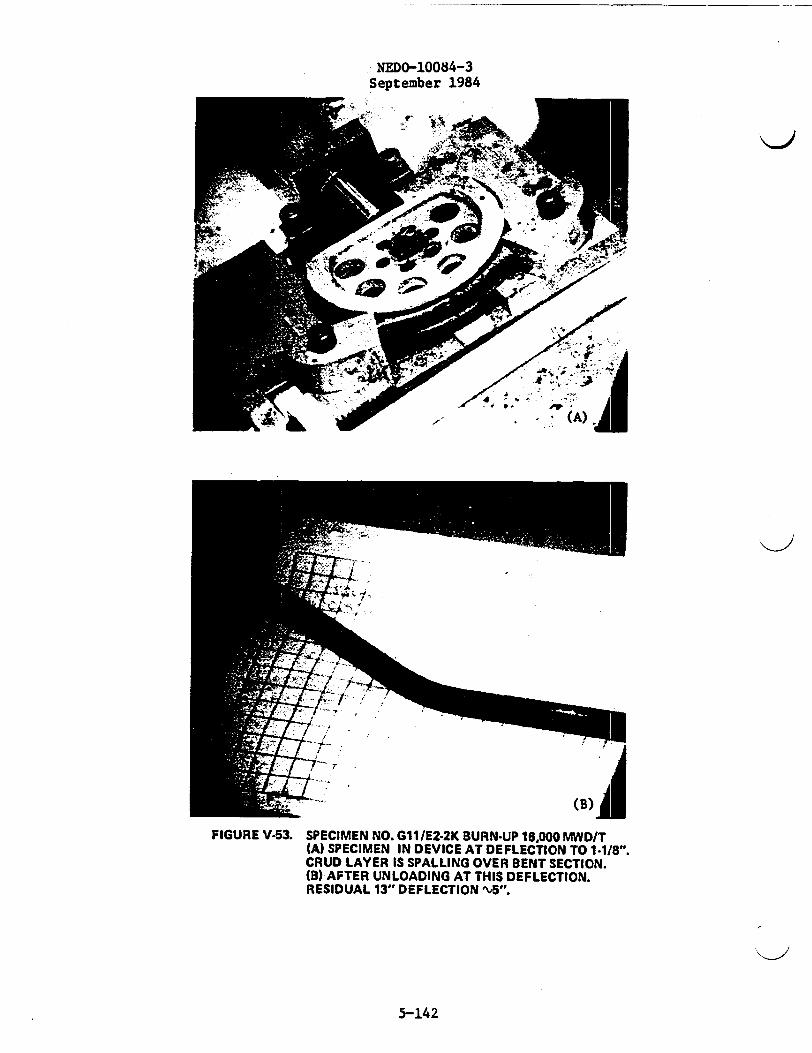
FIGURE V-53. SPECIMEN NO. G11/E2-2K BURN-UP 16,000 MWD/TIA) SPECIMEN IN DEVICE AT DEFLECTION TO 1.1/8".CRUD LAYER IS SPALLING OVER BENT SECTION.(B) AFTER UNLOADING AT THIS DEFLECTION.RESIDUAL 13" DEFLECTION v5".
5-142
NEDO-10084-3gentpmbpr 1984
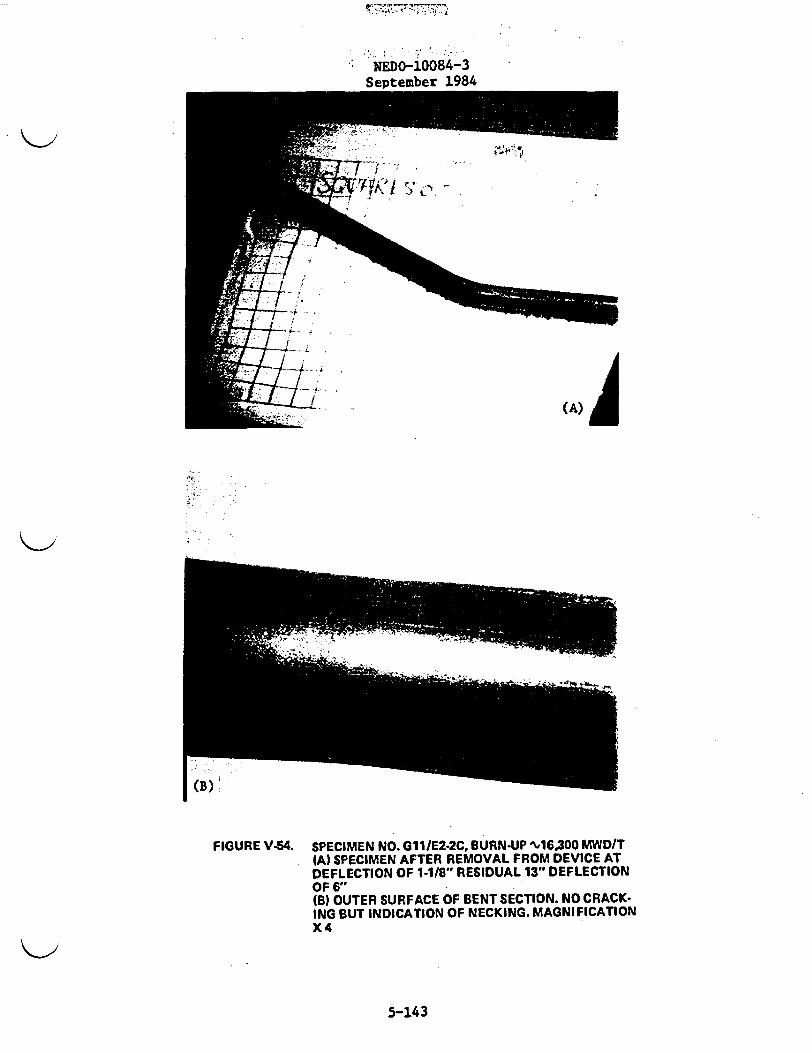
FIGURE V-54. SPECIMEN NO. Gll/E2-2C, BURN-UP M16,300 MWD/T(A) SPECIMEN AFTER REMOVAL FROM DEVICE ATDEFLECTION OF 1.1/8" RESIDUAL 13" DEFLECTIONOF 6"(B) OUTER SURFACE OF BENT SECTION. NO CRACK-ING BUT INDICATION OF NECKING. MAGNIFICATIONX4
5-143
NEDO-10084-3September 1984
' 7. Y. N> / .
''A1~~/ A- 7 ' '
k _l _(.B-)
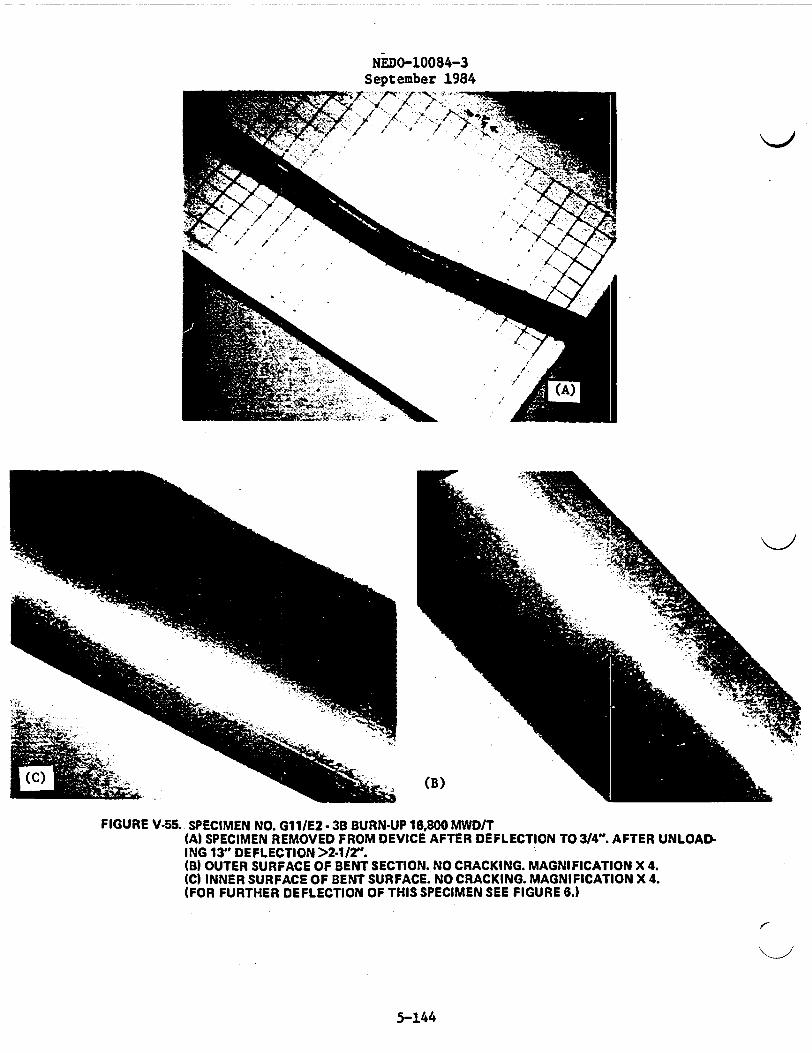
FIGURE V.55. SPECIMEN NO. GI-/E2-3B BURN-UP 18,800 MWD/T(A) SPECIMEN REMOVED FROM DEVICE AFTER DEFLECTION TO 3/4". AFTER UNLOAD-ING 13" DEFLECTION >2-1/2".(B) OUTER SURFACE OF BENT SECTION. NO CRACKING. MAGNIFICATION X 4.(C) INNER SURFACE OF BENT SURFACE. NO CRACKING. MAGNIFICATION X 4.(FOR FURTHER DEFLECTION OF THIS SPECIMEN SEE FIGURE 8.)
5-144

NEDO-10084-3September 1984
I'
(B)
FIGURE V.66. SPECIMEN G1I /E2-3B BURN-UP 16,800 MWD/T(A) SPECIMEN REMOVED FROM DEVICE AFTERDEFLECTION TO>141/4". AFTER UNLOADING 13"DEFLECTION IS >6".(B) OUTER SURFACE OF BENT SECTION. NOCRACKING. MAGNIFICATION X 3-1/2.
5-145
NEDO-10084-3September 1984
(C)
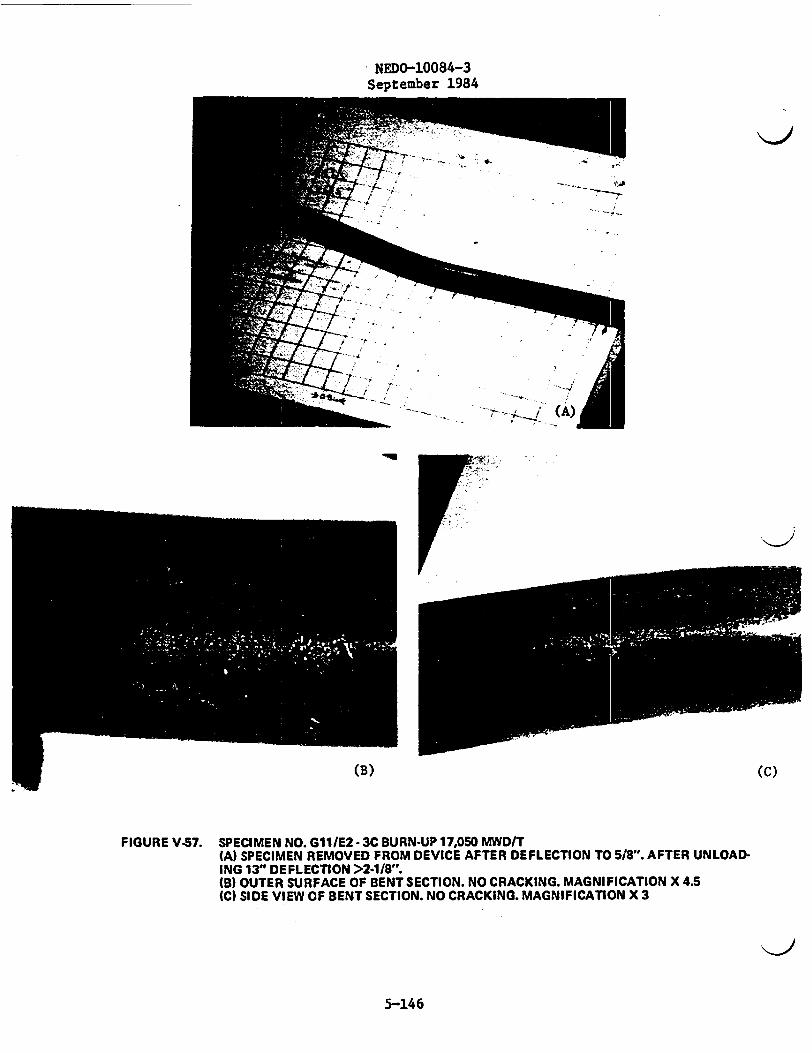
FIGURE V-57. SPECIMEN NO. Gll/E2- 3C BURN-UP 17,050 MWD/TIA) SPECIMEN REMOVED FROM DEVICE AFTER DEFLECTION TO 5/8". AFTER UNLOAD-ING 13" DEFLECTION >2-1/8".(B) OUTER SURFACE OF BENT SECTION. NO CRACKING. MAGNIFICATION X 4.5IC) SIDE VIEW OF BENT SECTION. NO CRACKING. MAGNIFICATION X 3
KU
5-146
I., I! -, f A ,fW
NEDO-100 8 4 - 3
September 1984
I"'" "/'(
roo
j I- "
I 1v i �
.i,4;
�.,A�, (B)
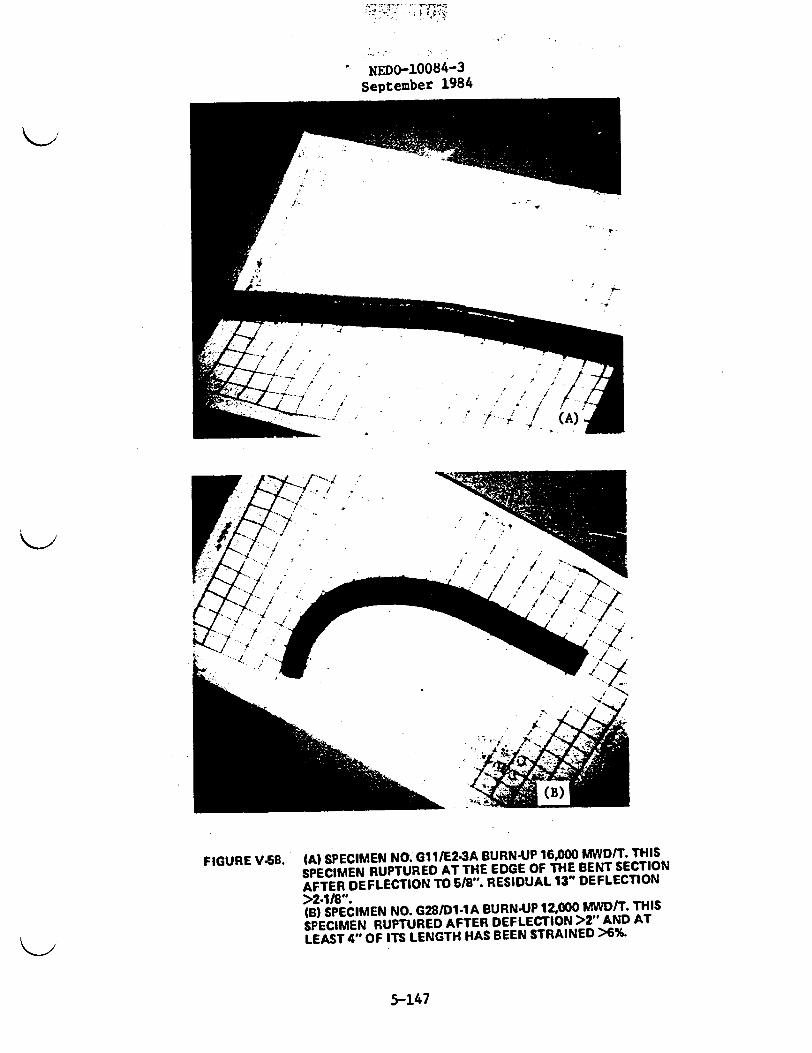
FIGURE V.68. {A) SPECIMEN NO. Gll/E24A BURN-UP 16,000 MWDIT. THIS
SPECIMEN RUPTURED AT THE EDGE OF THE BENT SECTIONAFTER DEFLECTION TO 5/8". RESIDUAL 13" DEFLECTION
>2-1/8".(B) SPECIMEN NO. G28/D14 A BURN-UP 12,000 MWD/T. THIS
SPECIMEN RUPTURED AFTER DEFLECTION >2" AND AT
LEAST 4" OF ITS LENGTH HAS BEEN STRAINED >6%.
5-147
NEDO-10084-3September 1984
5.6.5.A.4 Generic Side Drop Model - Group I Fuel
Table V-31 shows cladding and pellet parameters for a variety of
fuel bundle types. The most highly stressed fuel rod is that
described as the Point Beach 15 x 15 pressurized water reactor
bundle. The stress level is primarily a result of the 26 inch
span of the fuel rod between bundle grid spacers. This configura-
tion was chosen as the "worst case" for modeling purposes. In
addition the same fuel rod with an 18-1/2 inch span (typical of
fuel basket support disc spacing) was modeled to calculate its
reaction assuming it was unsupported between the basket support
discs.
a. Model Description
The single fuel rod is modeled by a series of short rigid
massless beams and concentrated weights connected by shear
and moment springs. Spring properties represent the geometric
and physical parameters of the fuel cladding (no credit is
taken for the supporting effect of the contained uranium pellets)~,
The mass terms represent the weight of the cladding plus the
weight of the fuel pellets. Subsection 5.6.5.A.5 contains a
detailed derivation of the bases for this dynamic model called
"DYREC" by its author at Stearns-Roger Corporation. The model
handles both elastic and plastic behavior of materials through
a bilinear analysis.
The functioning of the model is similar to that of an earth-
quake analysis whereby the supports are accelerated and the
structure examined for its response. After initial starting
conditions the problem proceeds at some time-step applying
the deceleration to the supports and examining the progressive
response of each spring-mass element. The predictor-corrector
routine takes the response parameters of the two preceeding
time steps and predicts the behavior of the system in the
succeeding time interval. It then enters the shear-shear
strain and moment-curvature plots to verify that the prediction
5-148
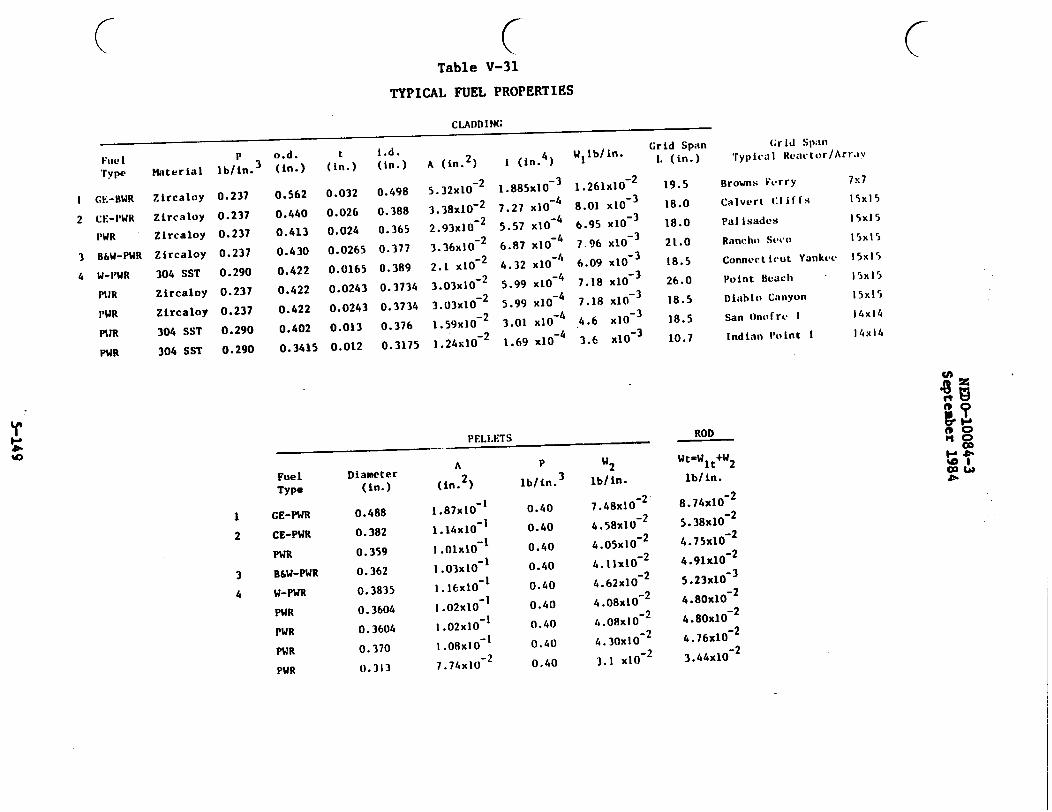
Table V-31
TYPICAL FUEL PROPERTIES
C
CLADDIN(
. ,I Grid Span
Fue I p o.d.
'rype Material Ilb/in.3 (in.)
t I.).(ln.) (in.) A (in. 2 ) I (in.4) WIWM. L (in.)
C;rid Span,ryp ita Kte.,attor/Arrav\
2
3
4
GE-BWR
CE-PWR
PWR
B&W-PWR
W-PWR
PUR
PWR
PJR
PWR
Z ircaloy
Zircaloy
Zircaloy
Zircaloy
304 SST
Zircaloy
Zircaloy
304 SST
304 SST
0.237
0.237
0.237
0.237
0.290
0.237
0.237
0.290
0.562
0.440
0.413
0.430
0.422
0.422
0.422
0.402
0.032
0.026
0.024
0.0265
0.0165
0.0243
0.0243
0.013
0.498 5.32xl0 2
0.388 3.38x10⁻²
0.365 2.93x10 2
0.377 3.36xlO 2
0.389 2.1 x10 2
0.3734 3.03x10 2
0.3734 3.03xlO02
0.376 1.59x10²
0.3175 1.24x10²
i.885x10 3
7.27 x10⁴
5.57 xlO4
6.87 x10⁴
4.32 xlO4
5.99 xlO
5.99 x10⁴
3.01 x10⁴
1.69 x10⁴
1.261xlO02
8.01 x10 3
6.95 x10³
7. 96 xlO3
6.09 xlO3
7.18 xlO0
7.18 x10
4.6 x10 3
3.6 x10 3
19.5
18.0
18.0
21.0
18.5
26.0
18.5
18.5
10.7
Browns Ferry
Calvert Cliffs
Pal isades
Rancho Sec o
Connect iut Yankee
Point Beach
Diablo Canyon
San Onorre I
Indian Point I
i 5xI 5
I 5x1 5
15xl5
14x14
IW4x
0.290 0.3415 0.012
FuelType
1
2
3
4
CE-PWR
CE-PWR
PWR
B6W-PWR
W-PWR
PWR
PWR
PUR
PWR
Diameter(in.)
0.488
0.382
0.359
0.362
0.3835
0. 3604
0. 3604
0.370
0.313
PEI.I.I
A
(in. 2)
1.87x10 I
1.14xtO I
I .03x 10 1
I . 16x10-
1.02xlO I
I .02xl0 1
I.08xI01
7 .74x102
0.40
0.40
0.40
0.40
0.40
0.40
0.40
0.40
0.40
ETS
P W2
lb/in .3 Wbin.
7.48xl102
4.58x10⁻²
4.05xl102
4. 1 X10⁻²
4. 62xl102
4 08X 10-2
4.08XI0-2
4. 30x 10-2
3.1 X0
ROD t !rt O00
Wt-W t+W2 tlb/in.
P
8.74xl0 2
5.38xl0 2
4.75xlO 2
4.91xl0 2
5.23xl0O3
4.80xlO02
4.80xlO02
4.76xlO02
3.44xlO 2

NEDO-10084-3September 1984
is consistent with the physical conditions. Corrections are
made to the projection based on this comparison.
b. Model Basis
The basic of the model is a single degree of freedom vibratory
system when the general equation of motion is given by:
a O
NX + CX + KX - F, sin wt.
For an undamped system such as this "C" - 0; "K" is the spring
constant term which is a measure of stiffness. The shear and
moment stiffnesses are given by the shear-shear strain and
moment-curvature relationships. The "K" value for the two
spring terms is the slope of the V-y, and M-¢ curves. In this
bilinear analysis there are two values of "K" bending, one for
the elastic portion and one for the plastic portion of the
material behavior. Since shear always remains elastic
(in this analysis), there is only one "K" value. The actual
values are shown in Subsection 5.6.5.A.7. Programs similar to
this have been used for nuclear power plant pipe-whip
analyses.
c. Exact Solution
If the assumption is made that the fuel rod response remains
elastic then an exact solution to the problem can be obtained
by model superposition. The derivation and results of this
model are contained in Subsection 5.6.5.A.6. Input to the exact
solution is in the form of a square-wave time-acceleration
plot applied to the rod supports.
5.6.5.A.5 Computer Program - "DYREC"
The following discussion of S-R Computer Program "Dyrec" will be
limited to a description of the program features relevant to the
problem at hand, i.e., beam vibration.
5-150

NEDO-10084-3September 1984
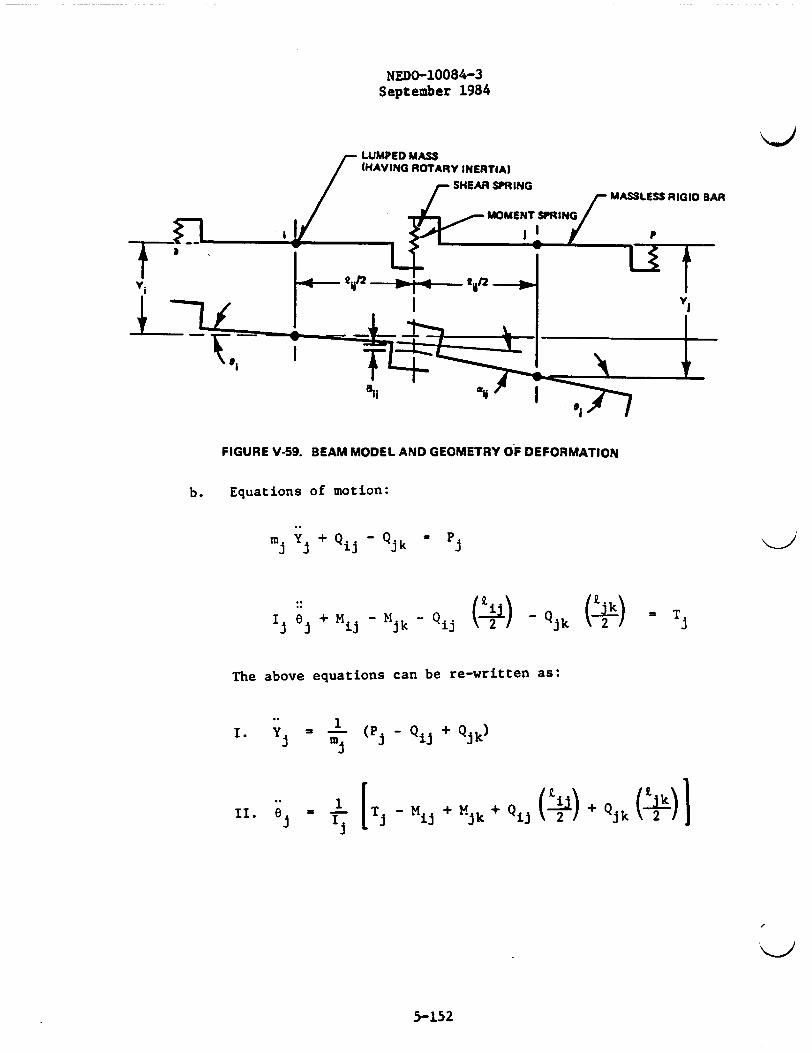
a. Model
"Timoshenko Beam" theory (Ref 20) is applied, i.e., the effects
of shear deformation and rotary inertia are considered. The
program uses a discrete model approach. The model used to
represent the beam consists of rigid bars connected by
"Moment Springs" and "Shear Springs." A diagrammatic represen-
tation of the model is shown in Figure V-59.
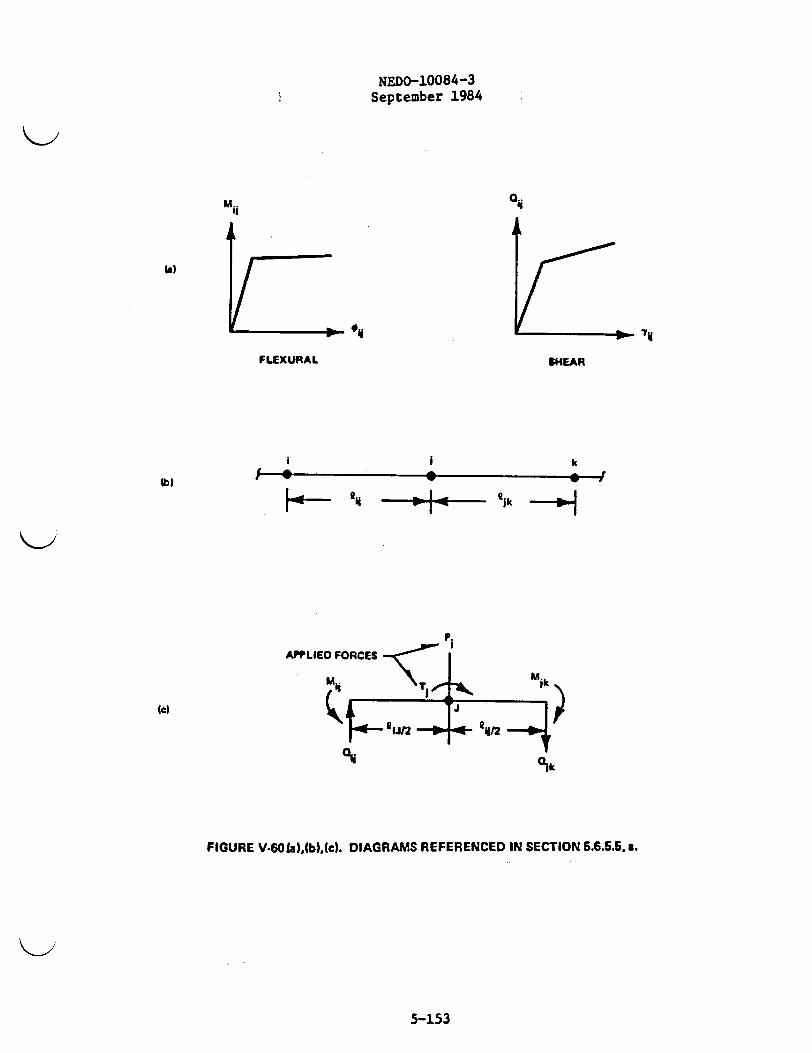
The program assumes bilinear hysteretic materials with
kinematic strain hardening. Knowing Yij and O1JI the shear
and moment in the springs can be determined from Figure V-60(a),
considering the loading history. Equation of motion for mass
"j" and forces acting on mass "j" are diagrammed in Figure V-60(b)
and (c), respectively.
Bij = Deformation of shear spring
~ -y - ij(+y Yi 2 ( i 2
aj = Rotation of moment spring
, o - ei
Yij - Shear strain
ijI it
ij ' Curvature
- aij/Aij
5-151
NEDO-10084-3September 1984
LUMPED MAS3(HAVING ROTARY INERTIA)
A-s SHEAR SPRING
FIGURE V-59. BEAM MODEL AND GEOMETRY OF DEFORMATION
b. Equations of motion:
m; yi + Qij - Qjk = Pi
(p)I; ei + Mij - tjk Qij - Qjk ( 2) = T
The above equations can be re-written as:
I. y ' m: (P Qij + Qjk)
II. 01
IjTj - ii +Mjk + Qi ( 2) + Qi (42k)l
5-152
NEDO-10084-3September 1984
M..II
0..a'
I
(a)
0- elM
FLEXURAL
74
SHEAR
lb)
I j k
I -I
P.
APPLIED FORCES
mi4
orf
M.
-k >Ic)
all~hik
FIGURE V-60~a1,fb),(c). DIAGRAMS REFERENCED IN SECTION 5.6.5.5, a.
5-153
NEDO-10084-3September 1984
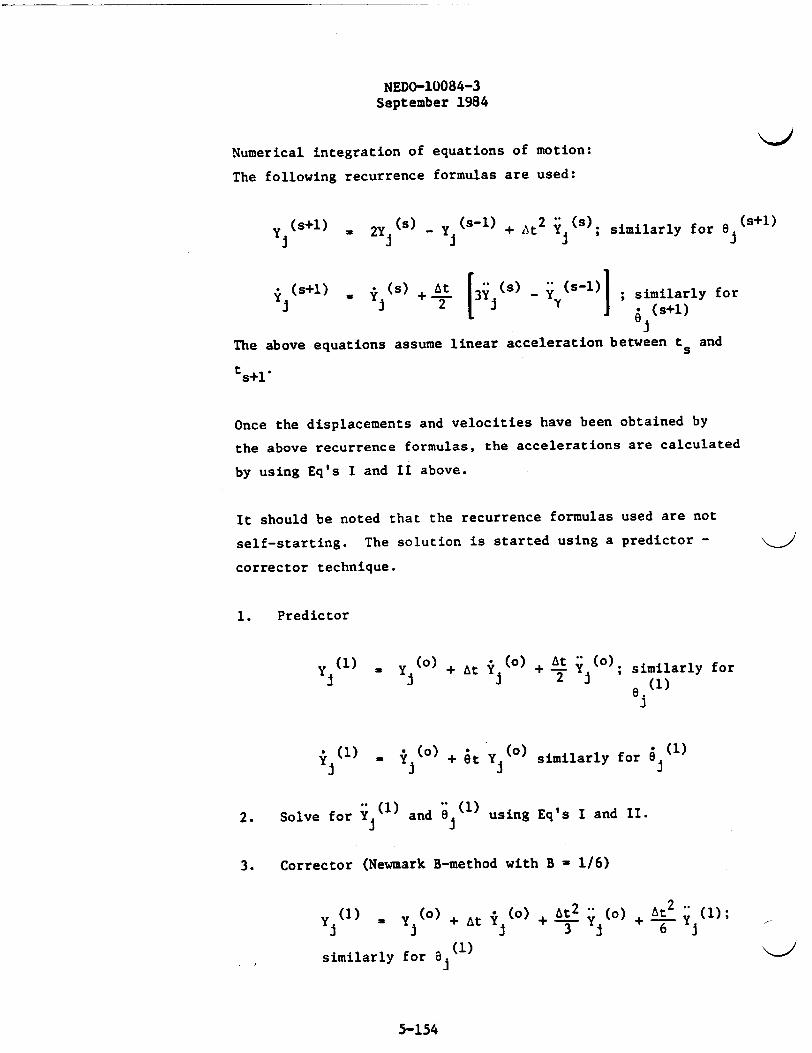
Numerical integration of equations of motion:
The following recurrence formulas are used:
(s+l) 2Y(s) - Y (s-i) + At 2 i (s); similarly for (s+l)
(s+l) (s) + at 4 5 -_ (s-l)1 ; similarly forii 2 Y j *(s+l)
The above equations assume linear acceleration between t and
tS+l
Once the displacements and velocities have been obtained by
the above recurrence formulas, the accelerations are calculated
by using Eq's I and II above.
It should be noted that the recurrence formulas used are not
self-starting. The solution is started using a predictor -
corrector technique.
1. Predictor
Y )- Y() + At Y() + 2 Y(o); similarly for
y(1) *y(o) + it Y(o) similarly for (1)
2. Solve for Y(1) and 8 (1) using Eq's I and II.
3. Corrector (Newmark B-method with B - 1/6)
(I) (o) + (o) + At 2 -- (o) + At, ()Yj , i + At 3 Y 6 Y
similarly for a(l) K
5-154
NEDO-10084-3September 1984
2() + At (°) + similarly for
Repeat steps (2) and (3) until solution has converged.
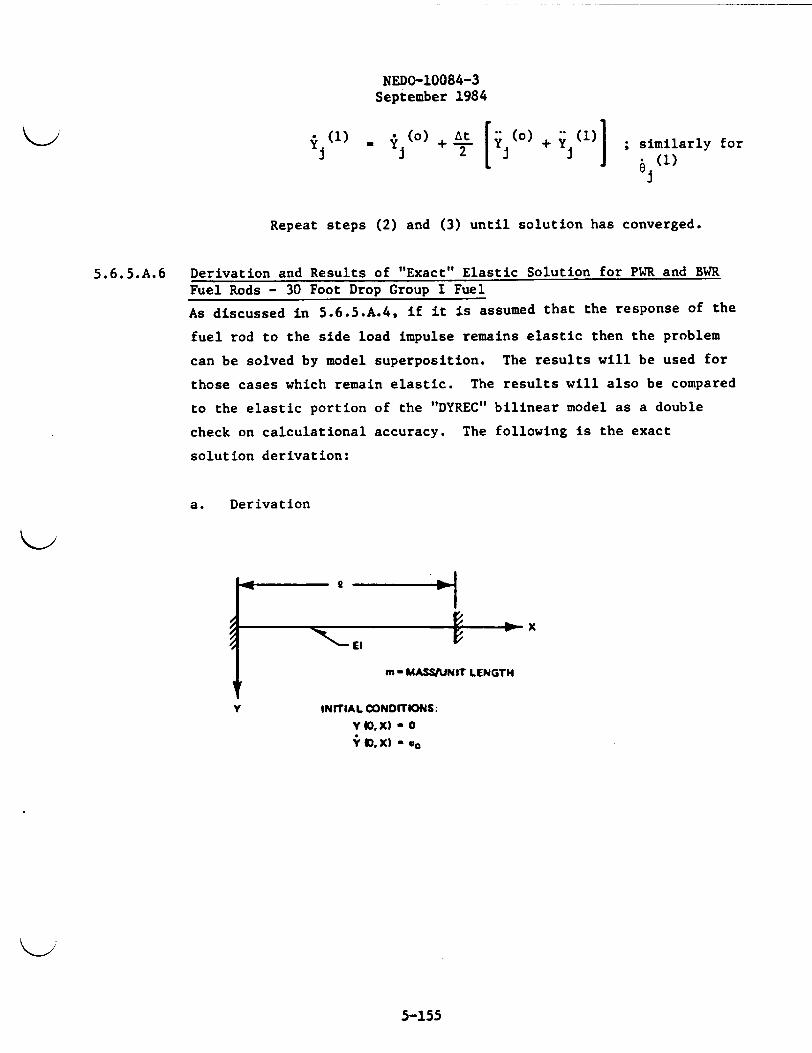
5.6.5.A.6 Derivation and Results of "Exact" Elastic Solution for PWR and BWRFuel Rods - 30 Foot Drop Group I Fuel
As discussed in 5.6.5.A.4, if it is assumed that the response of the
fuel rod to the side load impulse remains elastic then the problem
can be solved by model superposition. The results will be used for
those cases which remain elastic. The results will also be compared
to the elastic portion of the "DYREC" bilinear model as a double
check on calculational accuracy. The following is the exact
solution derivation:
a. Derivation
X
m - MASSIUNIT LENGTH
Y INITIAL CONDITIONS:
YED,X) - 0
Y I. X) -
5-155
NEDo-10084-3September 1984
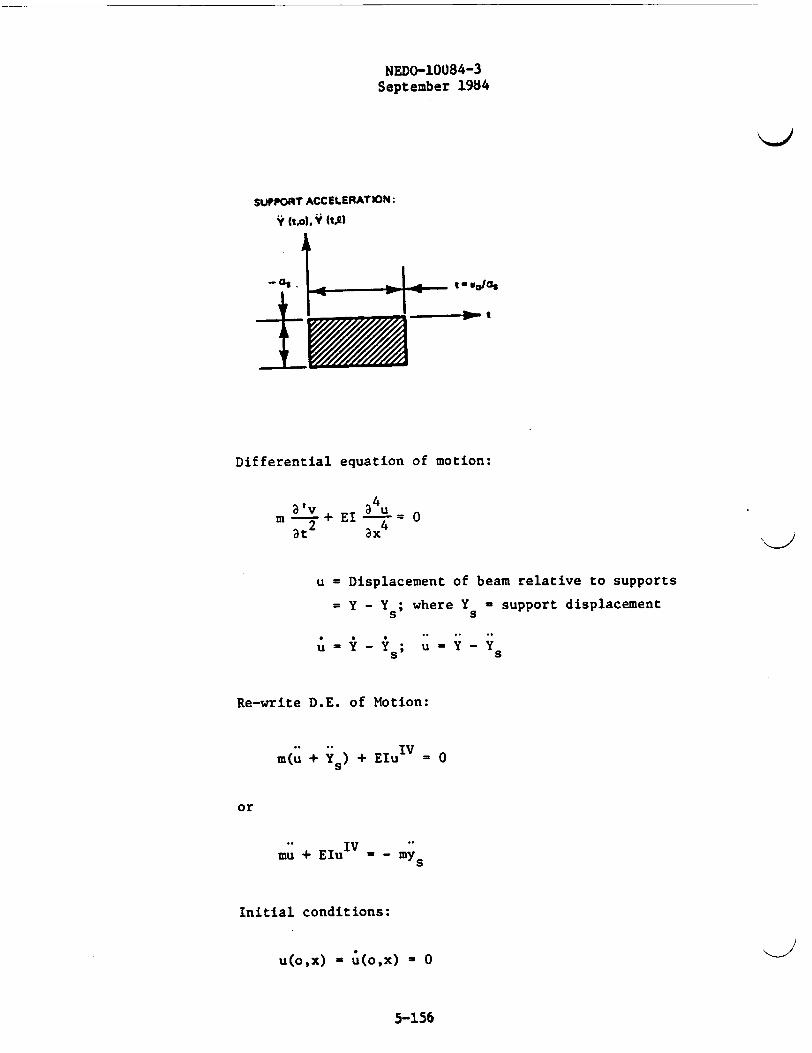
SUPPORT ACCELERATION:
Y (to0, V (t)
t' ias
lw Ft
Differential equation of motion:
m 2 +at2
EI -4 = 0ax4
u = Displacement of beam relative to supports
= Y - Y ; where Y = support displacement
u Y- Ys; u YY s
Re-write D.E. of Motion:
IVm(u +Y 5 ) +EHu = 0
or
IVmu +EHu = -MY
Initial conditions:
u(ox) i u(o,x) - 0
5-156
NEDO-10084-3September 1984
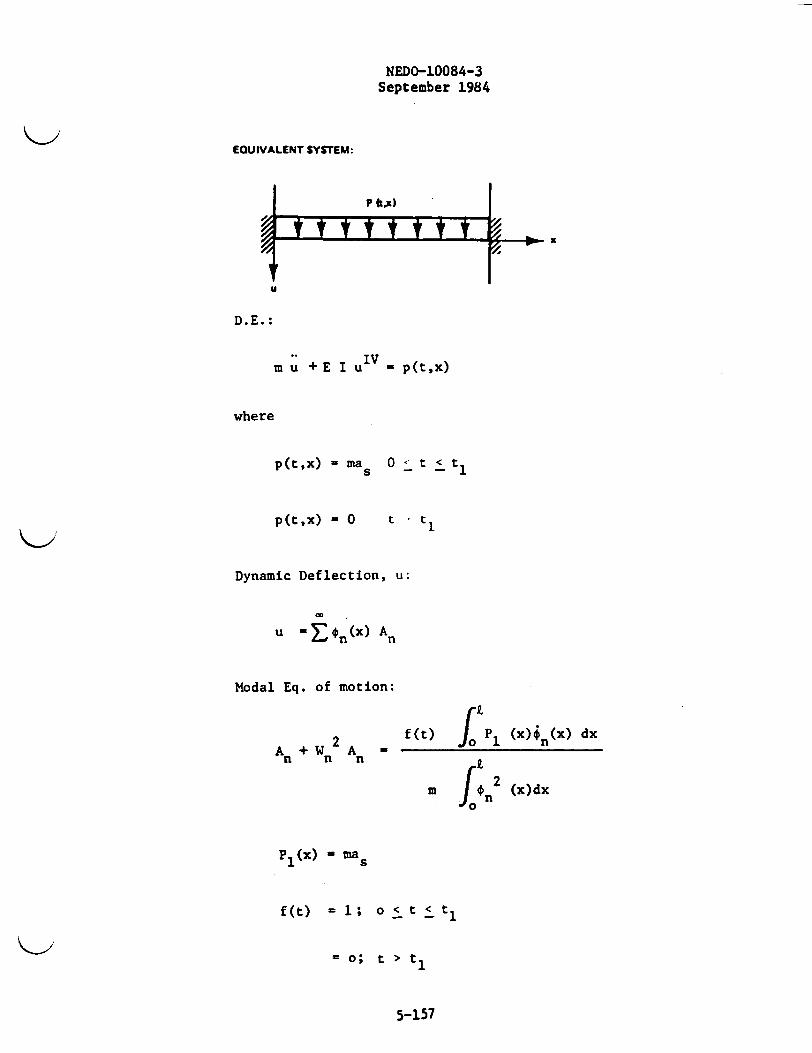
EQUIVALENT SYSTEM:
P kx_#,, - I
I t t t t * t t o7r'z'u N~ -- ---- .. , K
u
D.E.:
IVm u +E I u , p(t x)
where
p(tx) - maS
p(tx) = 0
0 - t < t
t- 1
Dynamic Deflection, u:
u ' = f(x) A
Modal Eq. of motion:
f (t) P1 (x)n(x) dxA +W An n n
m f2 (x)dx
P1(x) - mas
f(t) = 1; o < t < t
= o; t > ti
5-157

NEDO-10084-3
September 1984
Modal static deflection:
f P1(x)on (x)dx
Anst 2
W2 m | 2 (x) dxn jn
An ' A nst DLFn
Where DLFn = 1 - cos W nt; t < t
= cos w (t - t - cos W t; t > t
Mode shapes, n (x):
On (x) cosh Enx - cos nx + an(sinh 8n x -sin Snx)
Where
a (cosBn Q - cosh 8nL)/(sinh Bn - sin BRn
Frequencies, Wn
n ' n
Value of integrals:
L P 1 (x)on(x)dx - mas (Yu ) -Yn s
5-158
NEDO-10084-3September 1984
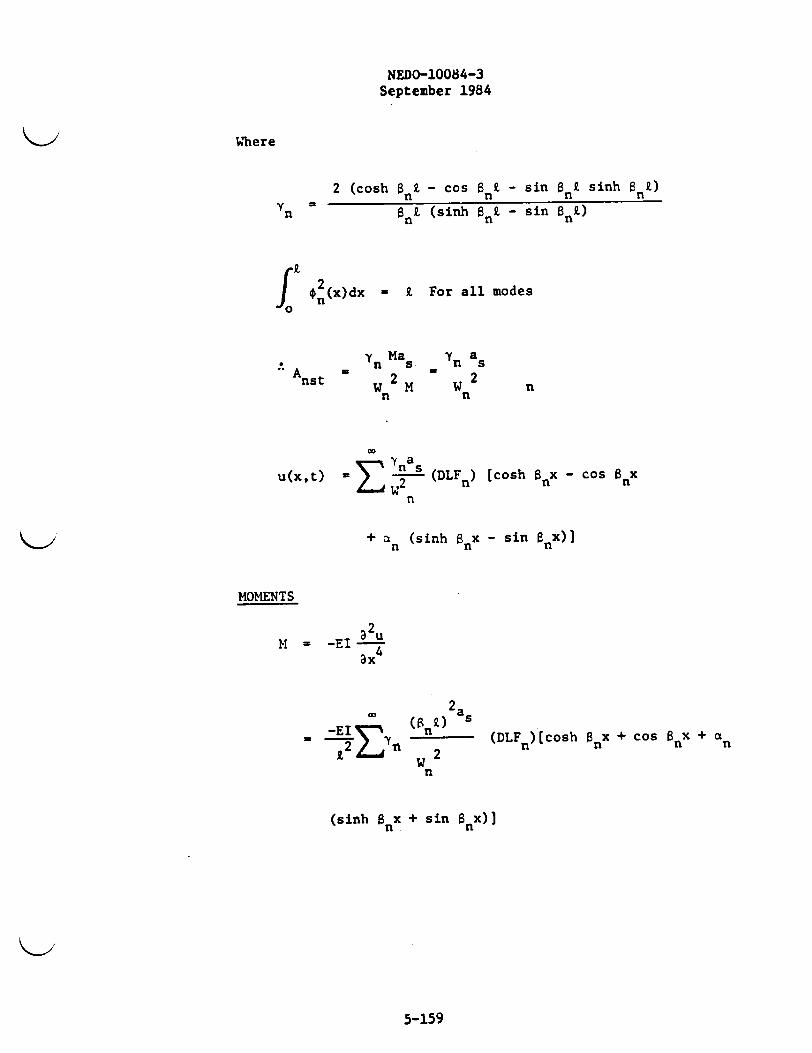
Where
2 (cosh BnL
Yn =Bnnn
I 2 (x)dx = 9
y Ma
Anst W 2W Mn
- cos B nQ - sin B nQ sinh BnZ)
(sinh Sn I - sin BnO
For all modes
Yn aS2
n n
u(x,t) -Z a
E 2n s(DLF ) [cosh B x - cos B x
n
+ an (sinh anx - sin BnX)]
MOMENTS
M = -El -ax4
-E= :7Q,2 :Y~n
(R i) S
n (DLF )[cosh B x + cos x + ann n n
n
(sinh Bnx + sin 8 nx)j
5-159

NEDO-10084-3September 1984
Values of B n:
nn anQ
1 4.7300408
2 7.8532046
3 10.9956078
4 14.1371655
5 17.2787596
n 5 anI - (n + 0.5)% to at least 7 decimal places.
For PWR Fuel Rod:
a 47257 "/sec2s
v = 527.45 "/sec0 -2
t, = v0/a = 1.1161 x 10 sec
El - 5.6484 k - in2
2 - 18.5" (unsupported span)
Mt , 18.5n(0.2112 - 0.1867 ) x 0.237 + 0.1802 x 0.41m2 386.4 x 1000
= 2.298187 x 10 6 k - sec2/in
For BWR Fuel Rod: (Browns Ferry fuel rod)
Cladding: Ro - 0.281" Ri 0.249" 0.237 #/in3
Pellets: R 0.244" 6 0.4 #/in
As, N0, and ti same as for PWR fuel
E ' ay '_ 75 9375 ksiEy 0.008
El - 9375rT (0.2814 0 .2494) /4 -17.6031 k - in 2
'J-
'
5-160
NEDO-10084-3September 1984
. - 19.5"
mt = 19.5n (0.2812 - 0.2492) x 0.237 + 0.2442 x 0.41/286400
- 4.412876 x 10⁻⁶ k - sec2/in
In the summation for u and M, the first 30 modes were used.
A short time-sharing computer program was written to perform
the calculations described above.
b. Results - Elastic Solution/30 Foot Side Drop
1. PWR Fuel Rod:
Unsupported span, Z - 18.5 in
Max. Moment = 0.3265"k @ t - 0.0068 sec (fixed end).
Referring to HI - : curve Figure V-61 this moment is only
very slightly above the calculated curve.
:. the assumption that the rod remains elastic is for all
intents and purposes valid.
* - 0.3265/5.6484 - 0.0578 in 1
Max. strain, c = 0.211 x 0.0578 - 0.0122
Max. center relative deflection - 0.637" @ t = 0.0072 sec.
The results of the 26 inch span exact solution showed the
rod to exceed its yield value; a non-linear analysis is
necessary for evaluation. See Section 5.6.5.A.7.
2. BWR Fuel Rod:
Unsupported span, 9 - 19.5 in.
Max. moment - 0 .6566,k @ t - 0.0056 sec (fixed end).
Max. strain, e - Ro - 0.281(0.6566)/17.6031 = 0.01048.
5-161
NEDO-10084-3September 1984
This exceeds Ey = 0.008 by only a slight amount and
therefore the assumption of elastic behavior is justified.
Max. center relative deflection - 0.459" @ t = 0.006 sec.
5.6.5.A.7 Side Drop Analysis - 30 Foot/Bi-Linear - Group I Fuel
The exact solution of the 26 inch span showed that permanent
deformation would occur therefore a non-linear dynamic analysiswas performed on the Point Beach fuel rods using the "DYREC" codedescribed in 5.6.5.A.5 (they have the lowest factor of safety ofall the Zircaloy clad fuels).
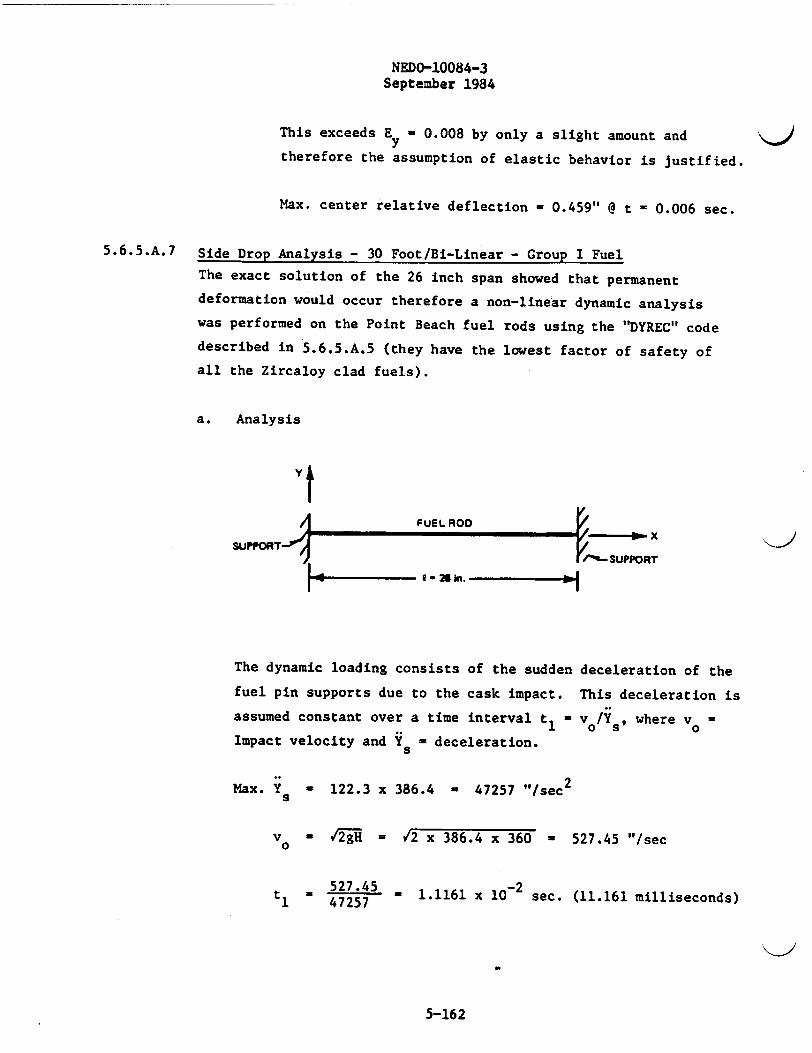
a. Analysis
V.
I1FUEL ROD
ISUPPORTI f
I -i e a n.
The dynamic loading consists of the sudden i
fuel pin supports due to the cask impact. '
assumed constant over a time interval t - ,
Impact velocity and Ys W deceleration.
x
SUPPORT
deceleration of the
rhis deceleration is
v0/YS, where v -
Max. Ys - 122.3 x 386.4 - 47257 "/sec2
vo W /2g = /2 x 386.4 x 360 - 527.45 "/sec
- 527.45 2 1.1161 x 1024725711 1 sec. (11.161 milliseconds)
5-162
NEDO-10084-3September 1984
47257 Injuc 2
0 1. 161 x 1Oo2 mc
PPORlT DECELERATION
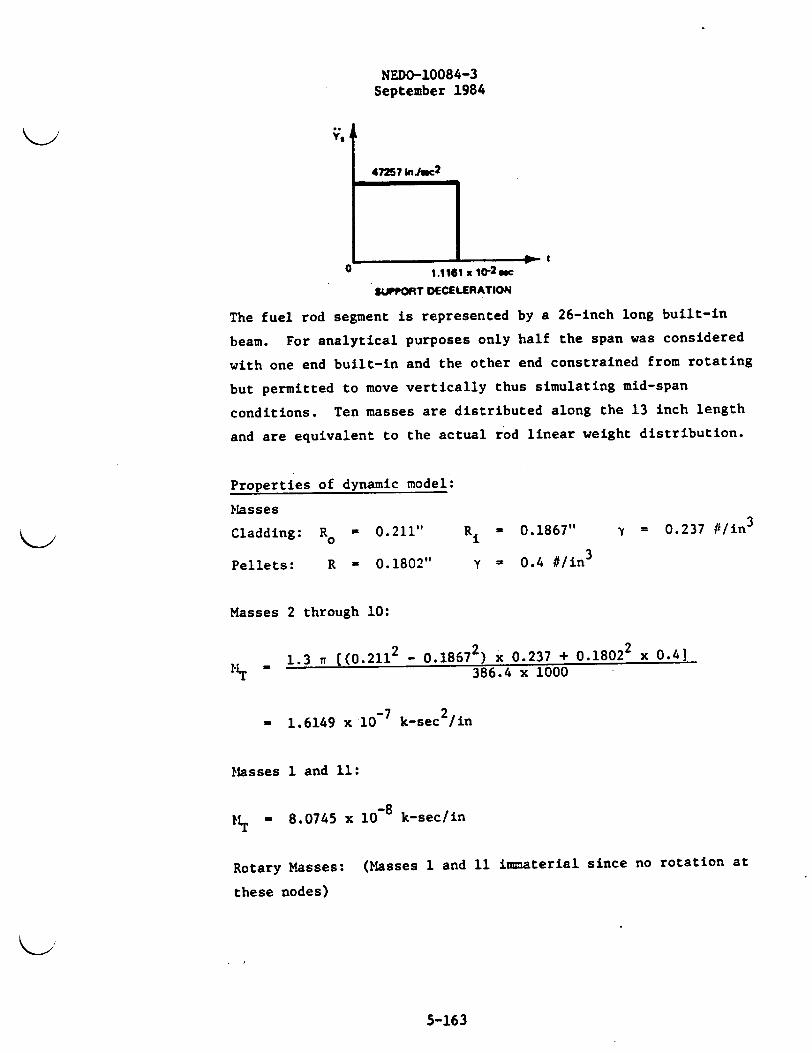
The fuel rod segment is represented by a 26-inch long built-in
beam. For analytical purposes only half the span was considered
with one end built-in and the other end constrained from rotating
but permitted to move vertically thus simulating mid-span
conditions. Ten masses are distributed along the 13 inch length
and are equivalent to the actual rod linear weight distribution.
Properties of dynamic model:
Masses
Cladding: R0 a 0.211"
Pellets: R - 0.1802"
Ri - 0.1867"
Y - 0.4 #/in3
e = 0.237 #/in3
Masses 2 through 10:
- 1.3 Tr [(0.2112 - 0.18672) x 0.237 + 0.18022 x 0.4
IT 386.4 x 1000
- 1.6149 x 10 7 k-sec2/in
Masses 1 and 11:
MT - 8.0745 x 10 8 k-sec/in
Rotary Masses: (Masses 1 and 11 immaterial since no rotation at
these nodes)
5-163

NEDO-10084-3September 1984
Masses 2 through 10:
M.R =EIP~x
1.3 v [(0.211 - 0.1867 ) x 0.237 + 0.18024 x 0.4]4 X 386.4 x 1000
- 1.5949 x 10 9 k-in-sec2
Y
+ ~ELEMENT NO.|
| Or NODE NO.
It A I3* 5 J 10 III
(D 4 _ NO ROTATION
|-- 10 SP AT 1.3 in. - 13in. Do
MULTI-MASS DYNAMIC MODEL
Shear Stiffness:
E - 75/0.008 - 9375 ksi
G - E/[2(1 + v)] = 9375/[2(1 + 0.3)] 3606 ksi
AsG - 0.01518 (3606) - 54.739 kips
ty - 0.577 x 75 - 43.275 ksiy k
Vy - 0.01518 (43.275) - 0.657 shear
My - 43.275/3606 - 0.012 shear strain
5-164
NEDO-10084-3
September 1984
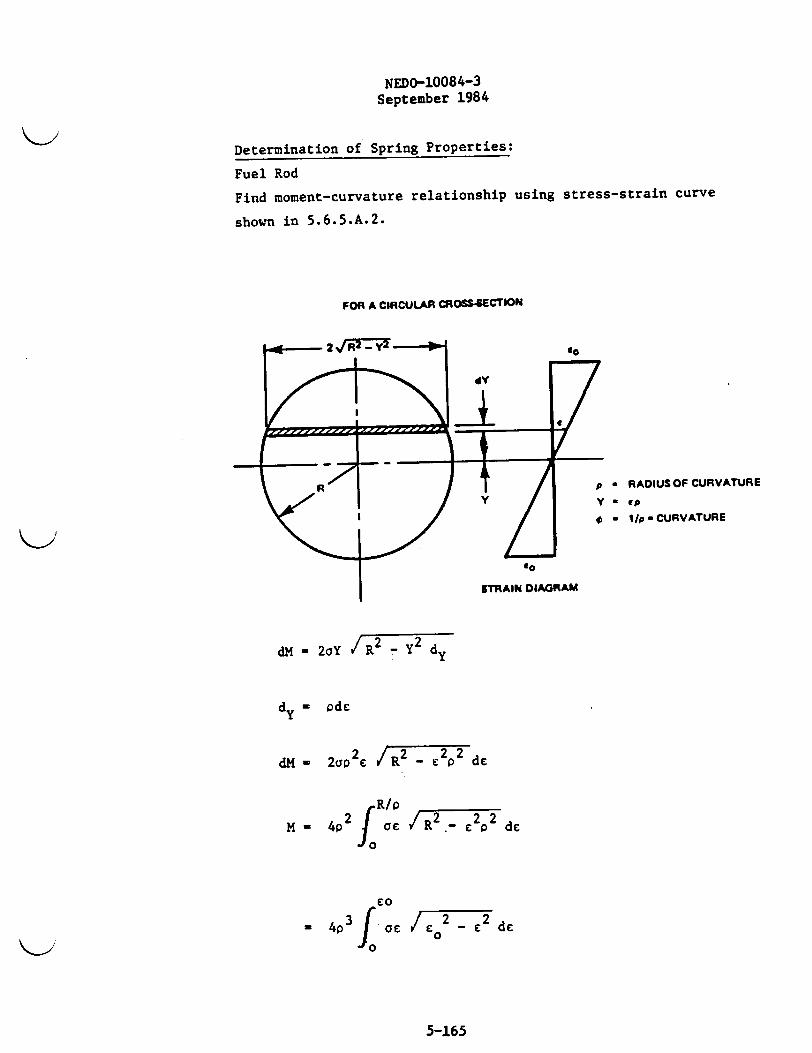
Determination of Spring Properties:
Fuel Rod
Find moment-curvature relationship using stress-strain curve
shown in 5.6.5.A.2.
FOR A CIRCULAR SS4ECTION
p - RADIUSOF CURVATURE
Y - to
0 = I1p-CURVATURE
dM - 2aY /R 2 _ y2d
yy
dy M odc
dM - 2fjp 2e /R 2 _-Y de
R/P
M - 4p Ic /Rc 2 2 de
co
M 4p IOE C0 do- E
5-165
NEDO-10084-3September 1984
cc a /-E 2 _ 2 de
E 4 £0 0
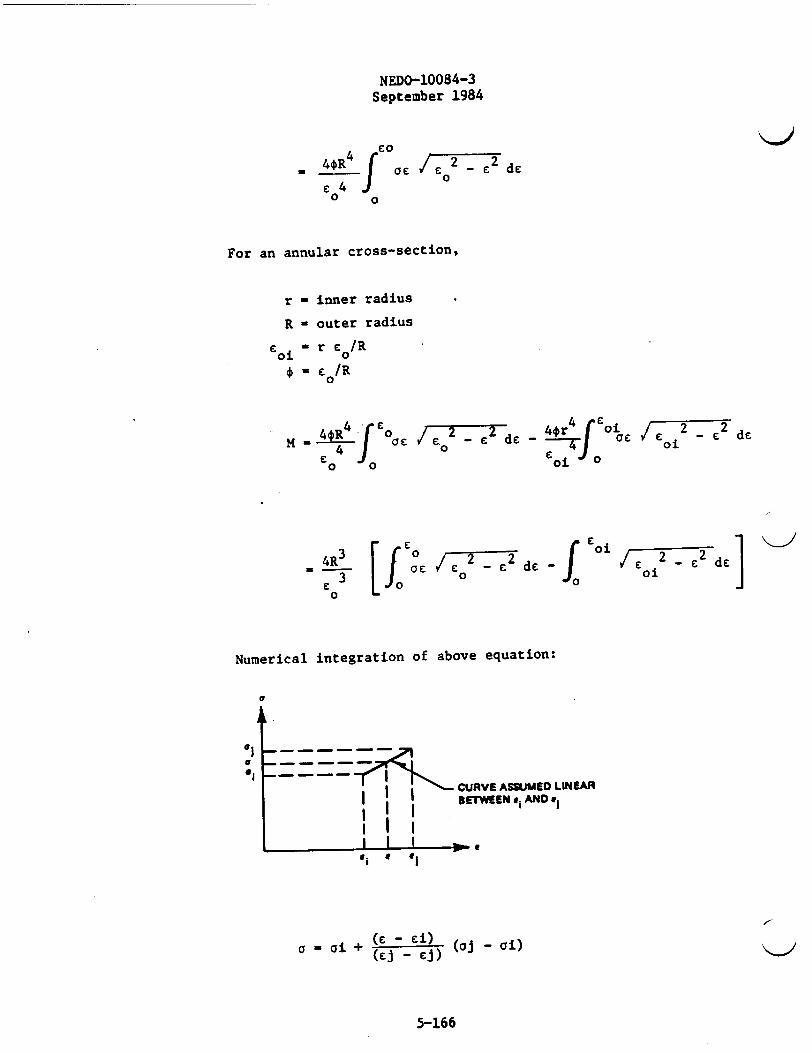
For an annular cross-section,
r - inner radius
R - outer radius
£ i ' r c0/R
0 ' C0/R
M 4 R | /2 _ E £ -
4 f 0
4or 4 oi
1 0£
2E - E d£oi
3 0JJC3 [R cca / CEo -CE de -J
00
Numerical integration of above equation:
el r
al ___- - - Z*1 -===
CURVE ASSUMED LINEARI BETWEEN .I AND e
I I
; w I
£E 2 _ -2 deoi ]
a - ci + (£j - £j) (oj - ai)
5-166
NEDO-10084-3September 1984
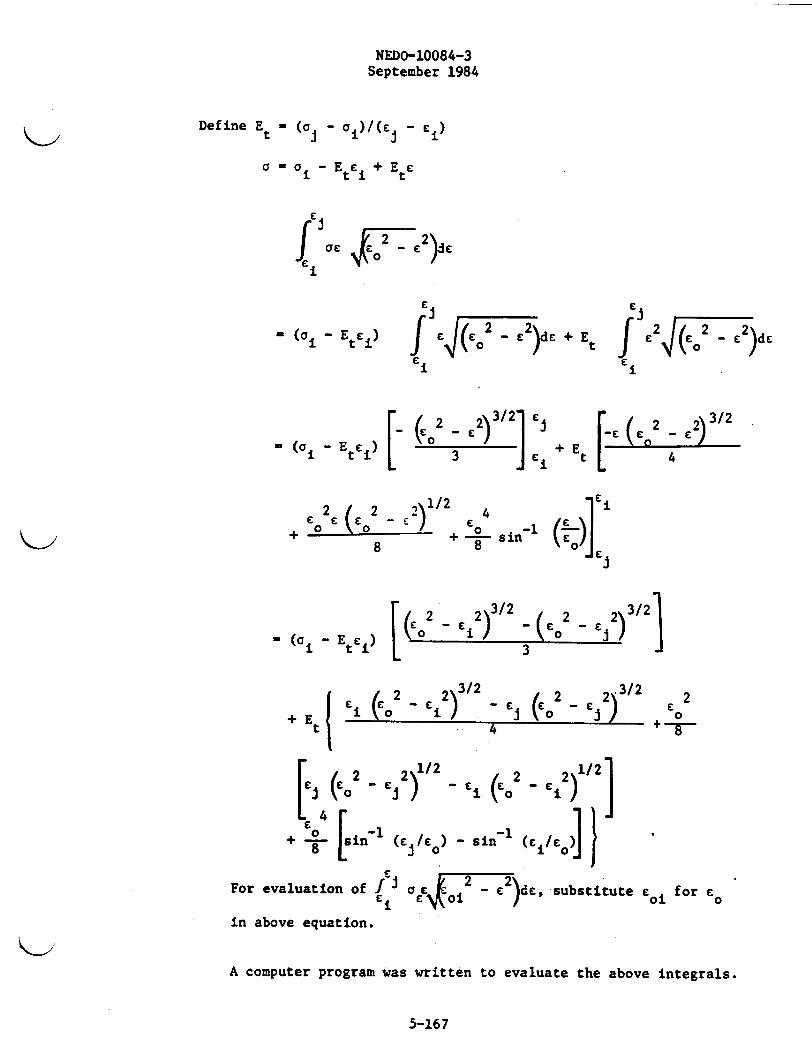
Define Et ' (ta - a)/(C I - Ei)
i t i t
1E
Li~~ ~
' (°i - EtCi) f (E 2 _ E )d + EtLi
fi (E - EL)dE
i
[...
- (C i - E £~i+Ei
2 2 2 1/2 4
+ 0 0 8 in ( £o)]
[ (a 2 2 ) ( 2 2) 3/2
+ Et l
i ( 2 E 2)3/2 - Ej (E 2 _ Lj2 ) 2.
4
( 2 2 )£C 0 1 - Ei (CO 2
For evaluation of jI j o 1 EdL. substitute E for cOEi N\ 0 1 i
in above equation.
A computer program was written to evaluate the above integrals.
5-167
NEDO-10084-3September 1984
b. Results - 30 Foot Side Drop/Bi-Linear Analysis
Summary of computer results for the 26 inch span using
M - 0 and V - y relationships derived from dynamic
stress-strain curve.
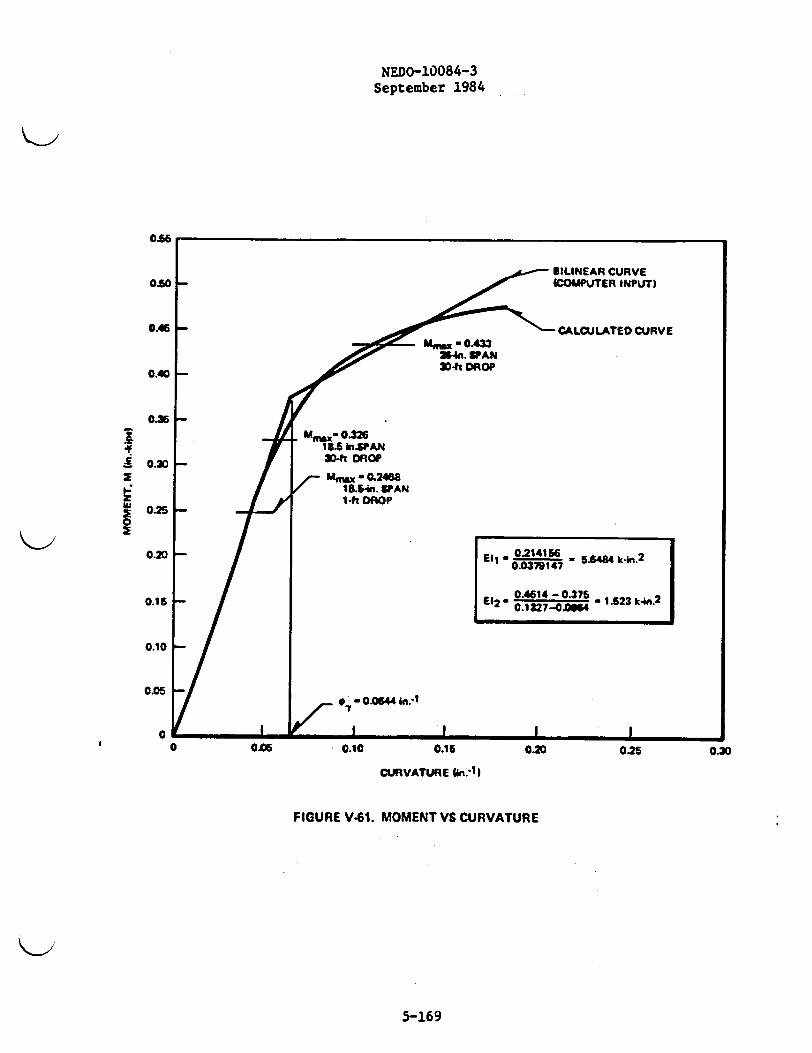
1. Max. moment 0.433" @ t = 0.012965 sec.
Curvature, 0 - 0.11709 in 1
Strain, G R0o - 0.211 x 0.11709 - 0.0247
Referring to Figure V-34, this strain corresponds to a
stress of 125 ksi. The above moment occurs at the fixed
end of the fuel rod.
2. Max. shear force - 0.1027 @ t - 0.012037 sec Q fixed end
of rod. Since 0.1027 < 0.657 , no yielding occurs.
3. Max. strain rate = 5.965 in/in/sec at fixed end of pin
@ t - 0.024807 sec.
These results are shown on Figure V-61. Also shown are the
exact solution results for the eighteen and one half inch
span PWR. Based on the exact solution, the BWR fuel was
determined to remain elastic under the 30 foot drop conditions,
therefore, a bi-linear analysis was considered unnecessary.
5.6.5.A.8 Confirmation of Model
Three separate evaluations were performed to assure that the model
selected and analyzed in 5.6.5.A.7 was correct and represented the
"worst" case.
The first analysis consists of demonstrating the stability of the
time step used in the numerical integration procedure for solving
the equations of motion for the model shown in 5.6.5.A.8. The
original time step used was 10-6 sec. The computer analysis was
re-run using a time step of 0.5 x 10 6 sec. A comparison of the
results of the first analysis with the results of the second
5-168
NEDO-10084-3September 1984
0.56
BILINEAR CURVE0.50 _ 4COPUTER INPUT}
0.ff - ~CALCULATED CURVE0-0.433
0.40 54n. VAN
A 0.30 -3-tOO
[ + O^; i.S hAN0.30 - |0aft DROP
:ESMm" - 0.24e8t / ./ 18S-in. SPAN
1-ft DROP3!0.25_ PluhDO
0.20 - l0.2141 560.2E0i _ =°3166 5.6484k-rn20.0379147 5 kI.
0.1 5 _ / El 0.4614 5 - 0.375 1.23k4n.20.15 El~~2 - 0.22-.06
0.10
0.050 '01X44In.-l
0 0.06 0.10 0.16 0.20 0.25 0.30
CURVATURE n.lnII
FIGURE V-61. MOMENTVS CURVATURE
5-169
NEDO-10084-3September 1984
analysis shows essentially no difference in the solution. This
verified that the model converged on the correct solution.
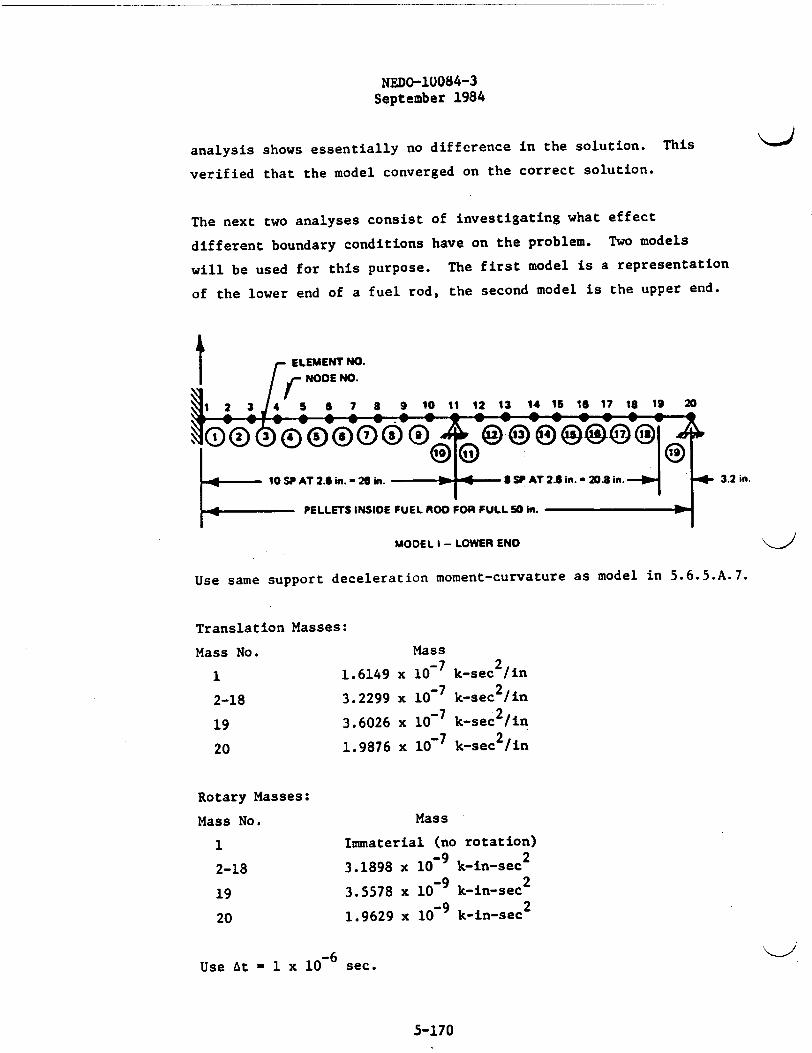
The next two analyses consist of investigating what effect
different boundary conditions have on the problem. Two models
will be used for this purpose. The first model is a representation
of the lower end of a fuel rod, the second model is the upper end.
1 ~ELEMIENT NllO.
Mr ODE NO.
@ 4 5 IS 7 8 9 10 t1 12 13 14 15 1E 17 13 19 20
10 lSP AT 2.Ein. - 28i. S lSPAT 2Ain. -20.8 in. - 3.2 in.
< ~PELLETS INSIDE FUEL ROO FOR FULL 50 in.
MODEL I - LOWER END
Use same support deceleration moment-curvature as model in 5.6.5.A.7.
Translation Masses:
Mass No. Mass
1 1.6149 x 10 7 k-sec 2/in
2-18 3.2299 x 10 7 k-sec 2/in
19 3.6026 x 10 7 k-sec2/in
20 1.9876 x 10f7 k-sec2/in
Rotary Masses:
Mass No. Mass
1 Immaterial (no rotation)
2-18 3.1898 x 10 9 k-in-sec2
19 3.5578 x 10 9 k-in-sec2
20 1.9629 x 10 9 k-in-sec2
Use At - 1 x 10 6 sec.
5-170

NEDO-10084-3September 1984
Max. moment = 0.3377 k in element 16 @ t - 0.013083 sec.
Curvature, * - 0.0831 in 1
Strain, C - R~o = 0.211 x 0.0831 = 0.01754
These results are less than those obtained for the fixed-end
model.
Y
ELEMENT NO.( NODE NO.
4 S £ 7 B 9 10 11 U12 12 U 15 16 17 18
2w
3.4 in.
MODEL II - UPPER END
Translational Masses:
Mass No.
1 1.6149
2-15 3.2299
16 1.8570
17 5.5866
18 3.1657
Mass
x 10 7
x 10 7
x 10i7
x 10 8
x 10 8
k-sec2/in
k-sec2/in
k-sec2/in
k-sec 2 /in
k-sec 2 /in
Rotary Masses:
Mass No.
1
2-15
16
17
18
Mass
Immaterial
3.1898 x 10 9 k-in-sec2
2.0753 x 10 9 k-in-sec2
1.1086 x 10 9 k-in-sec2
6.2822 x 10 10 k-in-sec2
Use At -1 x 10 6 sec.
5-171
NEDO-10084-3September 1984
Max. moment - 0.3207 in element 14 @ t - 0.02714 sec.
Curvature, * 0.0596 in 1
Strain, E - 0o - 0.211 x 0.0596 = 0.0126
These results are less than those obtained for the fixed-end model.
5.6.5.A.9 Summary of 30 Foot Side Drop Analyses and Discussion of Conservatism
a. Results Summary
1. The significant parameter in evaluating cladding under
these conditions is ductility. It is recognized that
under one-of-a-kind accident conditions such as this
that some degree of permanent fuel rod deformation may
occur. The real criterion for fuel acceptability under
such conditions is not the amount of deformation sustained
but rather, cladding integrity as a result of the loading.
This can only be determined through a comparison of model
results with cladding physical properties, particularly its
capacity for elongation.
2. The base-case model described in 5.6.5.A.7 was run under the
122.3 `g" loading with the resulting maximum strain of
2.47 percent (elastic plus plastic). This strain occurred
at the built-in end 12.965 milliseconds after cask impact.
Displacement of the mid-span is 2.35 inches relative to
the built-in ends.
3. The results of the two alternative fuel configuration cases
showed that maximum moments and strains were less than those
of the base case under similar loadings thus demonstrating
that the built-in assumption is the "worst" case.
4. The convergence check at one-half the time-step of the
initial convergence (0.5 microsecond vs. 1.0 microsecond)
showed essentially no difference between the two base case
runs thus establishing the validity of convergence.
5-172

NEDO-10084-3September 1984
5. Comparison to exact solution - to verify the functioning
of the spring-mass dynamic model, an exact solution time-
sharing program was written for the elastic portion of the
fuel rod behavior. A comparison of the results of the
two programs showed identical values to four decimal
places. The exact solution program will not function
beyond the elastic portion of the rod response. This
elastic response matching does, however, indicate the
correct functioning of the spring-mass system.
6. Exact solution output - the 18.5 inch span PWR cask where
basket restraint is considered and the 19.5 inch span
BWR case were found to be elastic under 30-foot side drop
conditions. The PWR case produced a maximum strain of 1.22%
while the BWR case produced a maximum strain of 1.048%.
The exact solution was also used to check on fuel rod
behavior under one-foot drop conditions. The 2 millisecond,
210 g input pulse resulted in a maximum strain of 0.922%
for the 18.5 inch span PWR case. This will be discussed in
a later section.
b. Discussion of Conservatism
1. As mentioned above, the fuel rod properties used in the
spring-mass and exact solution models took no credit for
the presence of the fuel pellets contained therein. Dis-
cussions with the fuel designers indicate that high-fired
pellets will in fact contribute quite a bit to the rigidity
of the rod, although it is difficult to quantify since
this is not a parameter usually associated with bundle
design.
5-173
NEDO-10084-3September 1984
2. Another conservative feature of this analysis is the
presence of water in the cask cavity during the drop
accident. Since all rods displace during the drop then
an equal volume of water must also be displaced. The
damping or resistance to movement provided by the surround-
ing water will reduce the displacements, moments and hence
strains in the cladding. As in 1., above, this term is
difficult to incorporate into the model but its presence
and effect cannot be ignored.
3. An examination of the fuel basket shows that there are
physical constraints provided by the basket spacer disks
and guide channels which prohibit any significant deflec-
tions on a large percentage of the fuel rods. Contact
will occur between the lowest row of rods and the guide
channel. Each subsequent row will deflect and contact the
row beneath it until the maximum deflection distance is
achieved. This action can be seen by envisioning the
bundle on a flat table top. The table represents the con-
straining effect of the basket. Clearly the row of rods
closest to the table top can only deflect a short distance
(0.223") until contact. The second row can deflect the
same amount as the first row plus the distance between the
two rows (0.141"). The third row deflection is the first
row deflection plus two row-to-row gaps. This process
continues through the bundle, with each row having an avail-
able deflection distance 0.141" greater than the previous
row before rod-to-rod contact. Once the available deflec-
tion reaches the maximum rod deflection based on the drop
model, then all remaining rows will deflect the full
amount (2.35 inches). A simple calculation shows that
none of the rows in the 15 x 15 bundle will deflect the
full 2.35". The maximum deflection of Row 15 is 2.197".
Considering some deflection in the channel, row 15 may be
strained the maximum amount.
5-174
NEDO-10084-3September 1984
4. At the large deflections experienced in this problem, the
bending analysis becomes quite conservative. The shape
of the fully deflected fuel rod is that of a catenary.
In fact whenever a rod is deflected more than six rod
depths, the restraining force becomes that of a catenary
(e.g. tension along the rod, not bending). The load under
these conditions is carried by the cladding mode in
tension than bending with a subsequent reduction in stress
level. Experiments conducted by Stearns-Roger stress
analyst at the University of Michigan demonstrated this
phenomenon. A hydrostatically loaded flat circular plate
obeyed the laws of bending mechanics until deflections were
such that the plate became a membrane in tension. Based on
a bending stress calculation the plate should have failed,
yet it did not due to the deflection-produced switch from
bending to tension for load carrying purposes. A similar
thing occurs with the fuel rod.
5. Based on the four discussed points of conservatism, it
is clear that the single PWR rod, 26 inch span, unrestricted
model is truly the "worst" case evaluation. The likely
case of a 18.5 inch span, as established by basket spacer
disc distances, shows that the cladding yield value is
not exceeded under 30 foot drop conditions. Likewise the
BWR fuel rod remains elastic during the 30 foot drop
loading.
5.6.5.A.10 Normal Conditions - 1 Foot Side Drop
Subsection 5.11.3 discusses the behavior of the cask, tiedowns
and skid when dropped a distance of one foot in the normal transport
orientation. This analysis shows that the cask model node #7
experiences a peak deceleration of 210 g's for a time duration of
approximately 1 millisecond. To check on the behavior of the PWR
fuel assembly under these conditions, the 18.5 inch span model
(exact solution) was run with a support deceleration of 210 g's
applied for two milliseconds.
5-175

NEDO-10084-3September 1984
a. Analysis
Due to the high peak acceleration of the cask (81288 "/sec2 -
210 g's) during the 1' drop, some estimate of the fuel rod
response must be calculated.
The actual acceleration vs. time graph of Node 7 of the cask
model is shown below. As an estimate of the fuel rod response,
the following support acceleration will be applied to the PWR
Fuel Rod:
61 238 iJSSC2
.N StFor results (@ fixed end):
Max. Moment - 0.2468"k @ t - 0.0042 sec.
Max. Strain - 0.211 (0.2468/5.6486 - 0.00922.
This strain is slightly higher than Ey - 0.008.
b. Conclusion
The maximum moment is less than that for the 30 foot drop
loading. Referring to Figure V-61, it can be seen that the
rod behaves elastically.
5-176
NEDO-10084-3September 1984
5.6.5.A.ll End Drop Analysis - 30 Foot Drop
As mentioned in 5.6.5.A.l, the fuel bundles are not totally restrained
in the axial direction to allow for some axial thermal expansion.
Since there is some small gap between the end of the bundle and the
end of the cask, there will be an impact once the gap is closed during
cask deceleration.
The stresses in the fuel pellet stack and the cladding are best evalu-
ated using a stress-wave propagation analysis. This analysis is
derived as follows:
a. Derivation
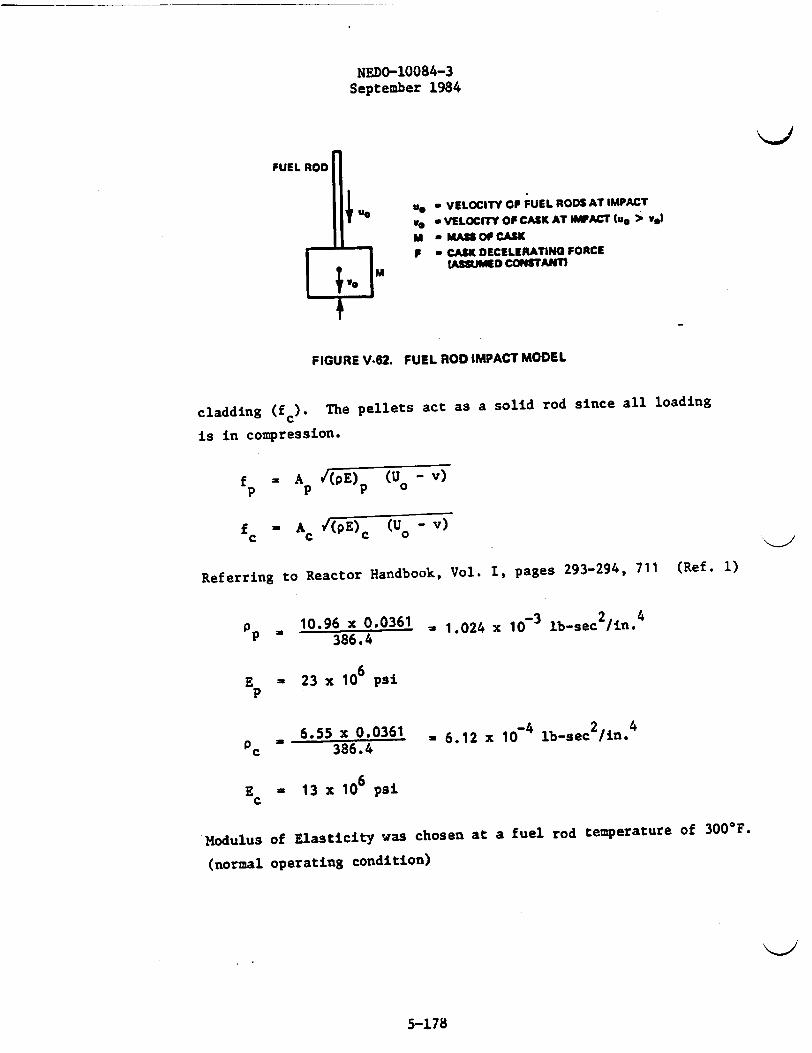
Figure V-62 shows a simplified model of the system.
1. Conditions at Impact
Due to impact, waves of stress will travel along the fuel rods at a
velocity, V - where E - Young's modulus and o - mass density.
If the cask is assumed to be infinitely rigid, the particles on the
end of the fuel rod will assume the velocity of the cask. Let the
cask velocity = v(t) which is seen to be time dependent because of
the forces acting on it. Velocity of particles on the end of the
fuel rod relative to the unstressed portion of the rod - UO - v(t).
Let f - Force on end of fuel rod due to relative particle velocity
- A VpE (UO - v) (Note: v - v(t))
The foregoing equations for V and f can be found in Timoshenko's
"Theory of Elasticity," Chapter 12, 1st Edition.
The fuel rods are comprised of UO2 pellet surrounded by a Zirconium
alloy tube. The total force acting on the fuel rod will be the
force acting on the pellets (f ) plus the force acting on thep
5-177
NEDO-10084-3September 1984
FUEL
U6
F
- VELOCITY OF FUEL RODS AT IMPACT
a VELOCITY OF CAsK AT iMAcT Noe> voA
- MASS Of CASK- CASK DECELERATING FORCE
IASCUMED CONSTANM
FIGURE V.62. FUEL ROD IMPACT MODEL
cladding (fd. The pellets act as a solid rod
is in compression.
since all loading
f , A /(pE) (U - v)p p p 0
f - A (p) ( -v)c C C 0
" . .
Referring to Reactor Handbook, Vol. I, pages 293-294, 711 (Ref. 1)
pp , 10.96 x 0.0361 - 1.024386.4
x 10-3 lb-sec2 /in.4
Ep= 23 x 106 psi
6.55 x 0.0361PC - 386.4
= 6.12 x 1074 lb-sec2 /in.
EC = 13 x 106 psi
Modulus of Elasticity was chosen at a fuel rod temperature of 3000F.
(normal operating condition)
5-178
NEDO-10084-3September 1984
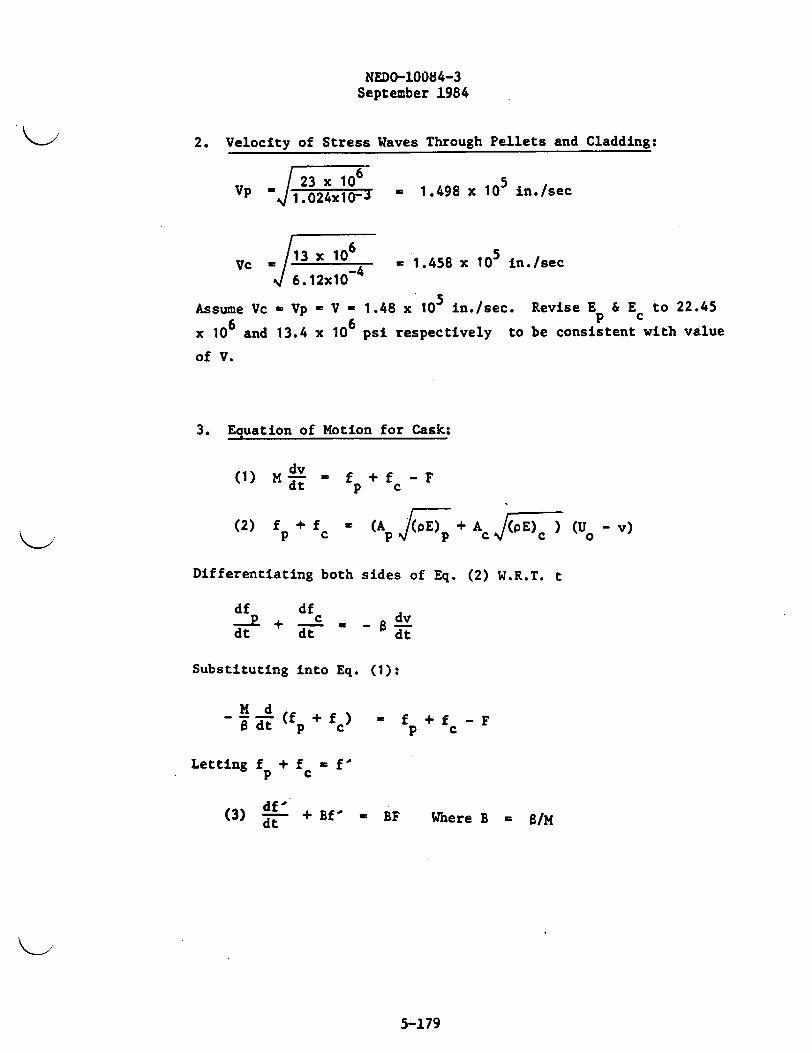
2. Velocity of Stress Waves Through Pellets and Cladding:
VP -j 23 x106 51_024x10 4 - 1.498 x 10 in./sec
Vc - x - 1.458 x 105 in./sec6.12x10 4
5Assume Vc - Vp - V - 1.48 x 10 in./sec. Revise Ep & Ec to 22.45
x 10 and 13.4 x 10 psi respectively to be consistent with value
of V.
3. Equation of Motion for Cask:
(1) M dv = f + f -F
(2) f + f (A (pE) + A E (U -v)p c p p c J~Ec o)(0 V
Differentiating both sides of Eq. (2) W.R.T. t
df df-I + c . B dv
dt dt dt
Substituting into Eq. (1):
M t ( P fc f -F
Letting fp + fc - V
dft(3) + Bf - BF Where B - H
5-179

NEDO-10084-3September 1984
4. Solution to Differential Equation:
-B
(4) f' - (f' F)e Bt + F0
Where f' (U - v)0 0 0
Let Q - length of fuel rod
Total time that fuel rod is in contact with cask
T - VQ - 1.352 x 10 5 Q.V
(5) f
A (pE)/C ()C
(6) fC C B
5. Determine Velocities of Fuel Rods and Cask at Any Time t:
(0 < t < T)
dv * - F - (fO - F)e Bt
f' - F ~
fttdt
dvj -Bt
dv (~f' - F~e d
V0
0
0 -BtM(v -v) (1 - a
t o B
fe-F -Bt(7) Vt v + MB (1-e )
6. Equation of Motion For Pellets:
dUMp dtt =- fp
M ptdU -(Ap ) ' )e + F dt
5-180
NEDO-10084-3September 1984
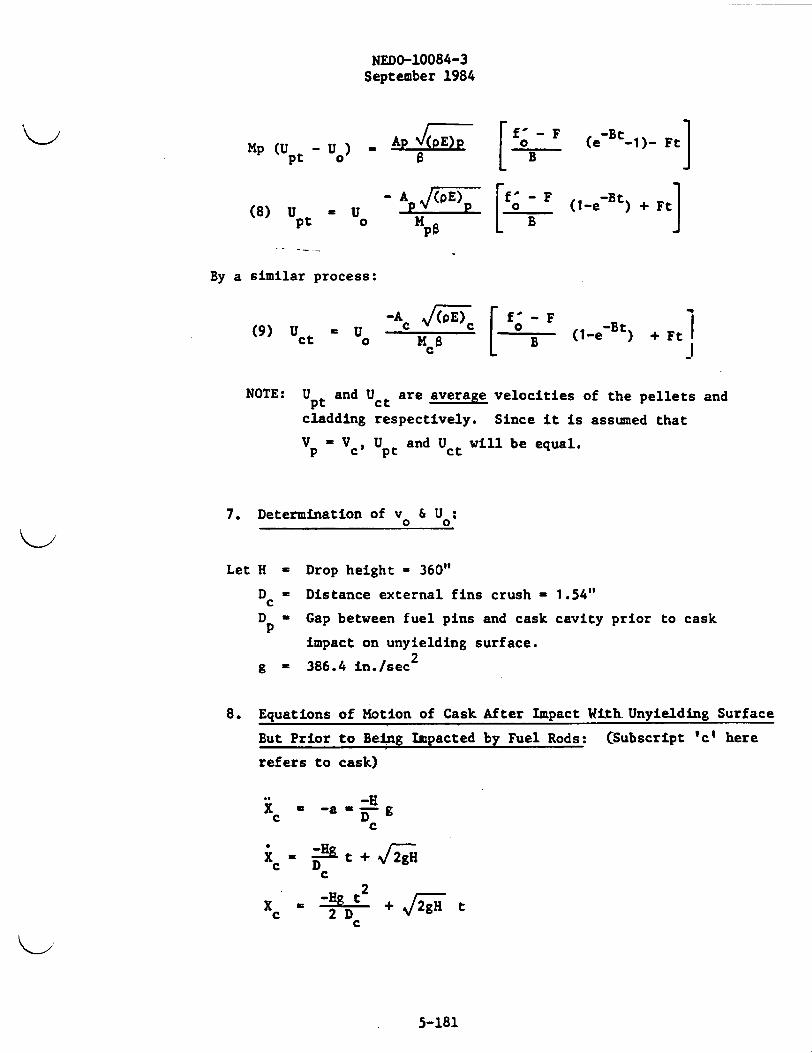
Mp (U - UO) ' EPt 0 a
F (e -1)- Ft]
[ - F (l-Bt) + Ft](8) UPt = U A p p
o HPO
By a similar process:
(9) Uct UO -AS pct 0 H8
[ - F
LB(t e-Bt) + Ft I
-i
NOTE: UPt and Uct are average velocities of the pellets and
cladding respectively. Since it is assumed that
Vp Vc Upt and Uct will be equal.
7. Determination of v & U0:
Let H - Drop height - 360"
D - Distance external fins crush - 1.54"C
Dp - Gap between fuel pins and cask cavity prior to cask
impact on unyielding surface.
g - 386.4 in./sec2
8. Equations of Hotion of Cask After Impact With. Unyielding Surface
But Prior to Being Impacted by Fuel Rods: (Subscript 'c' here
refers to cask)
ic -a ' gcc C
Xi t + 2gc D
c
Xc 2 D + /2gH tc
5-181
NEDO-10084-3September 1984
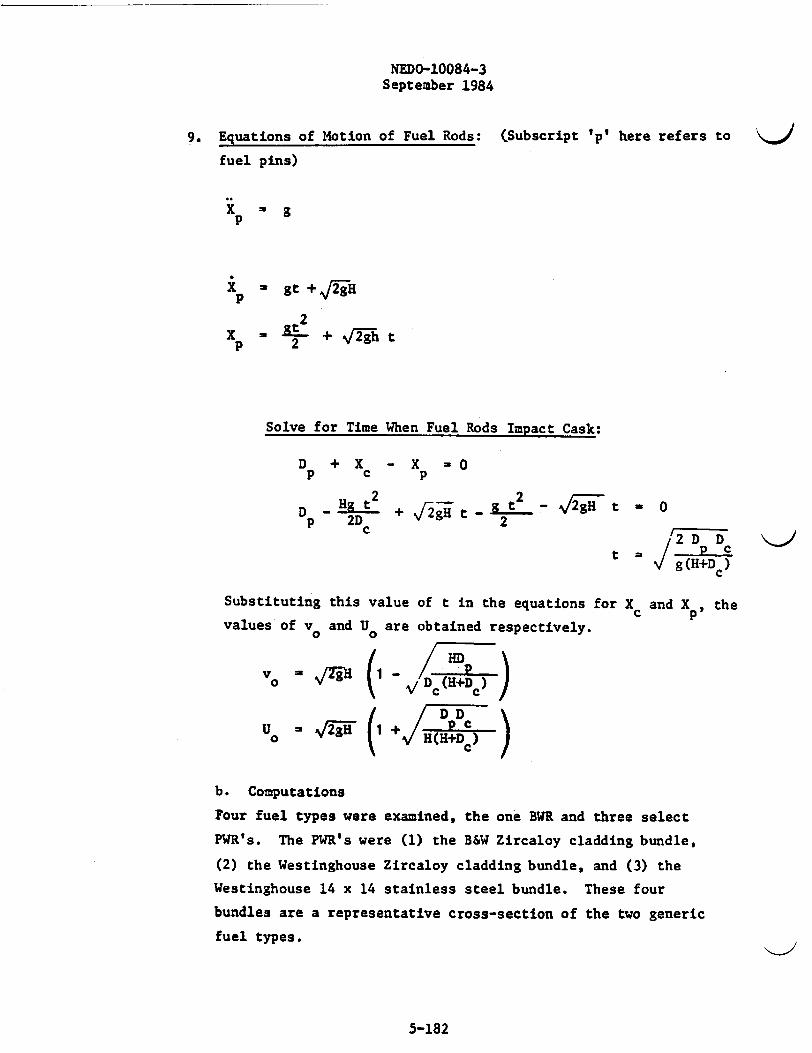
9. Equations of Motion of Fuel Rods:
fuel pins)
(Subscript 'p' here refers to
Xp
Xp
= t
- gt + ,r-,
X - 2 + h tp 2 Timp
Solve for Time When Fuel Rods Impact Cask:
D + X - X - 0p c P
Dp +/it&~ vg t - t-0
I- - -I2 D D
g (H+Dc)K>
Substituting this value
values of v0 and U0 are
vO ( f2'H 1 -
of t in the equations for Xc
obtained respectively.
'/ HD
/DH+D ) /H+DC )
H(H+D ) )
and Xp, the
U0 -v2 F (
b. Computations
Four fuel types were examined, the one BWR and three select
PWR's. The PWR's were (1) the B&W Zircaloy cladding bundle,
(2) the Westinghouse Zircaloy cladding bundle, and (3) the
Westinghouse 14 x 14 stainless steel bundle. These four
bundles are a representative cross-section of the two generic
fuel types.
5-182
NEDO-10084-3September 1984
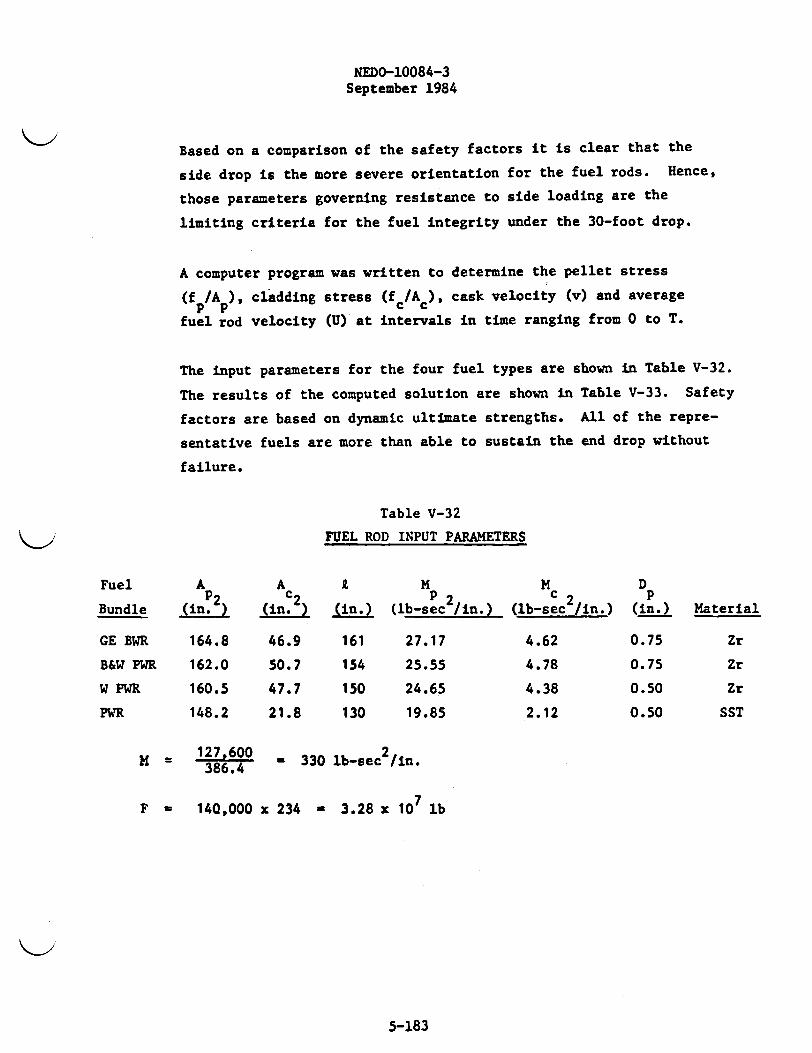
Based on a comparison of the safety factors it is clear that the
side drop is the more severe orientation for the fuel rods. Hence,
those parameters governing resistance to side loading are the
limiting criteria for the fuel integrity under the 30-foot drop.
A computer program was written to determine the pellet stress
(f /A ), cladding stress (f /A ), cask velocity (v) and averagep p c c
fuel rod velocity (U) at intervals in time ranging from 0 to T.
The input parameters for the four fuel types are shown in Table V-32.
The results of the computed solution are shown in Table V-33. Safety
factors are based on dynamic ultimate strengths. All of the repre-
sentative fuels are more than able to sustain the end drop without
failure.
Table V-32
FUEL ROD INPUT PARAMETERS
Fuel
Bundle
GE BWR
B&W PWR
W PWR
PWR
AP2
(in. )
164.8
162.0
160.5
148.2
Ac 2
(in. )
46.9
50.7
47.7
21.8
I
(in.)
161
154
150
130
MP 2
(lb-sec /in.)
27.17
25.55
24.65
19.85
Mc2q
(lb-sec /in.)
4.62
4.78
4.38
2.12
Dp
(in.) Material
0.75 Zr
0.75 Zr
0.50 Zr
0.50 SST
M = 127,600H 386.4 - 330 lb-sec2/in.
F - 140,000 x 234 - 3.28 x 10⁷ lb
5-183
NEDO-10084-3September 1984
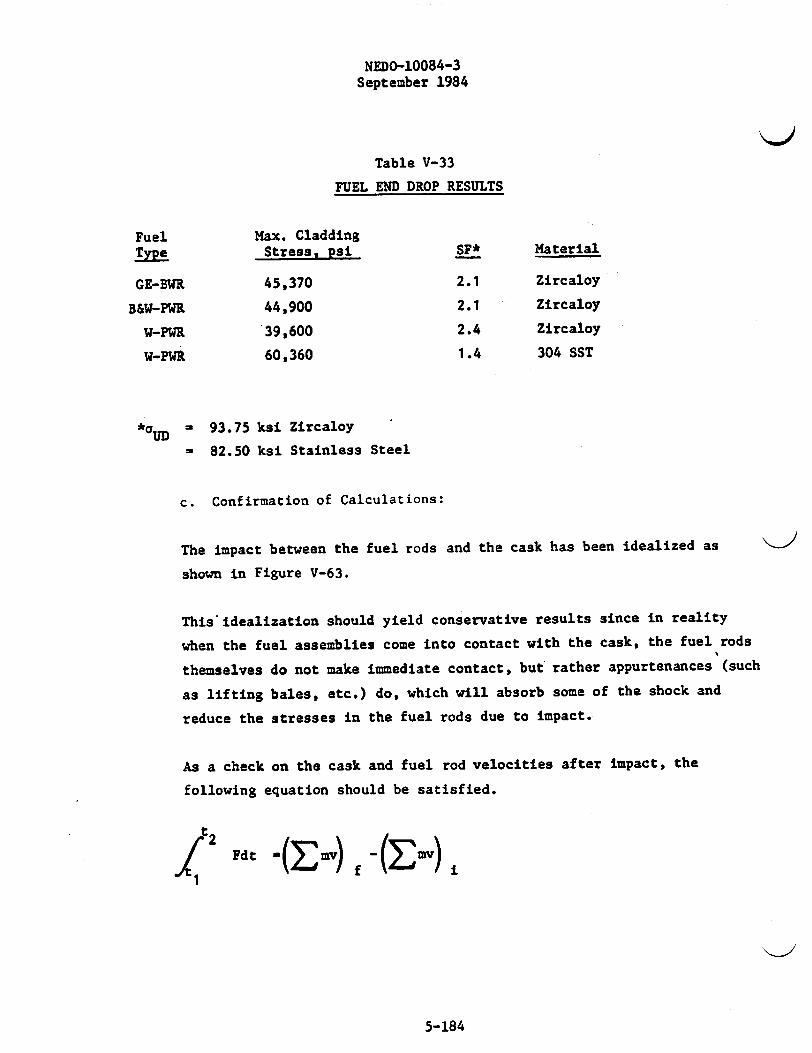
Table V-33
FUEL END DROP RESULTS
FuelType
GE-BWR
B&W-PWR
W-PWR
W-PWR
Max. CladdingStress, psi
45,370
44,900
39,600
60,360
SF*
2.1
2.1
2.4
1.4
Material
Zircaloy
Zircaloy
Zircaloy
304 SST
*a U M 93.75 ksi Zircaloy
- 82.50 ksi Stainless Steel
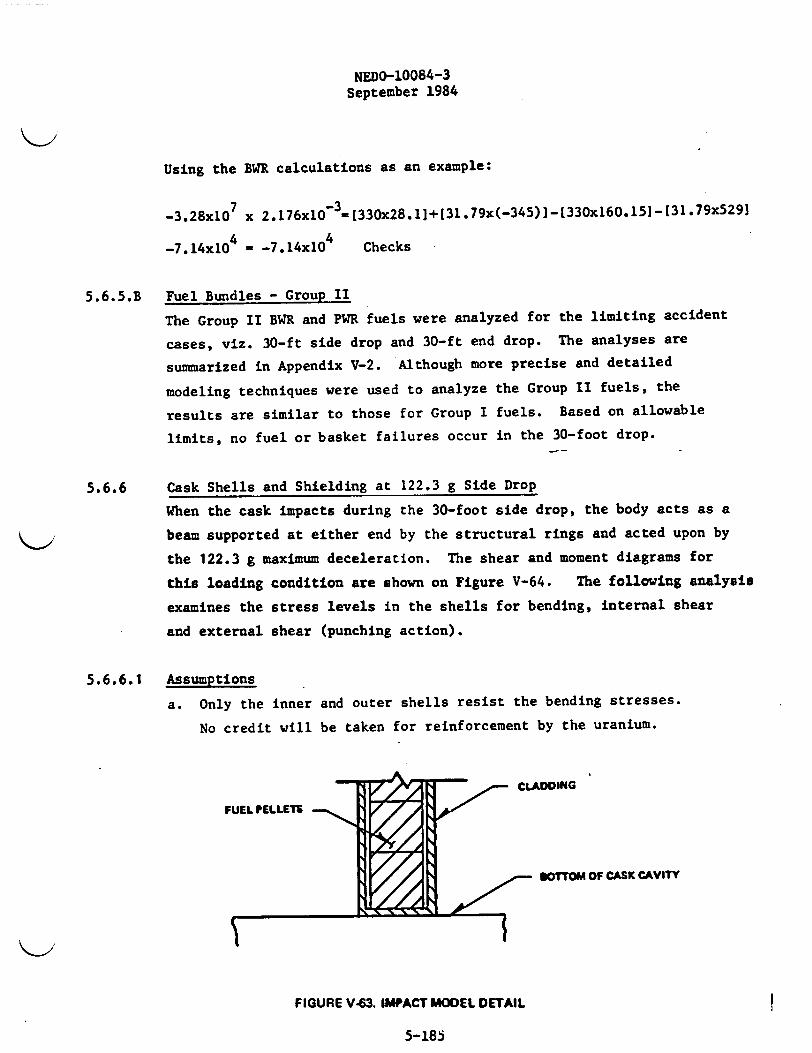
c. Confirmation of Calculations:
The impact between the fuel rods and the cask has been idealized as
shown in Figure V-63.
This idealization should yield conservative results since in reality
when the fuel assemblies come into contact with the cask, the fuel rods
themselves do not make immediate contact, but rather appurtenances (such
as lifting bales, etc.) do, which will absorb some of the shock and
reduce the stresses in the fuel rods due to impact.
As a check on the cask and fuel rod velocities after impact, the
following equation should be satisfied.
(dEI V-1
5-184
NEDO-10084-3
September 1984
Using the BWR calculations as an example:
-3.28x107 x 2.176x10 l3=330X28.11+[31.79x(-345)]133Ox160.15]-[31.79x5293
4 4-7.14xl0 - _7.14x10 Checks
5.6.5.B Fuel Bundles - Group II
The Group II BWR and PWR fuels were analyzed for the limiting accident
cases, viz. 30-ft side drop and 30-ft end drop. The analyses are
summarized in Appendix V-2. Although more precise and detailed
modeling techniques were used to analyze the Group II fuels, the
results are similar to those for Group I fuels. Based on allowable
limits, no fuel or basket failures occur in the 30-foot drop.
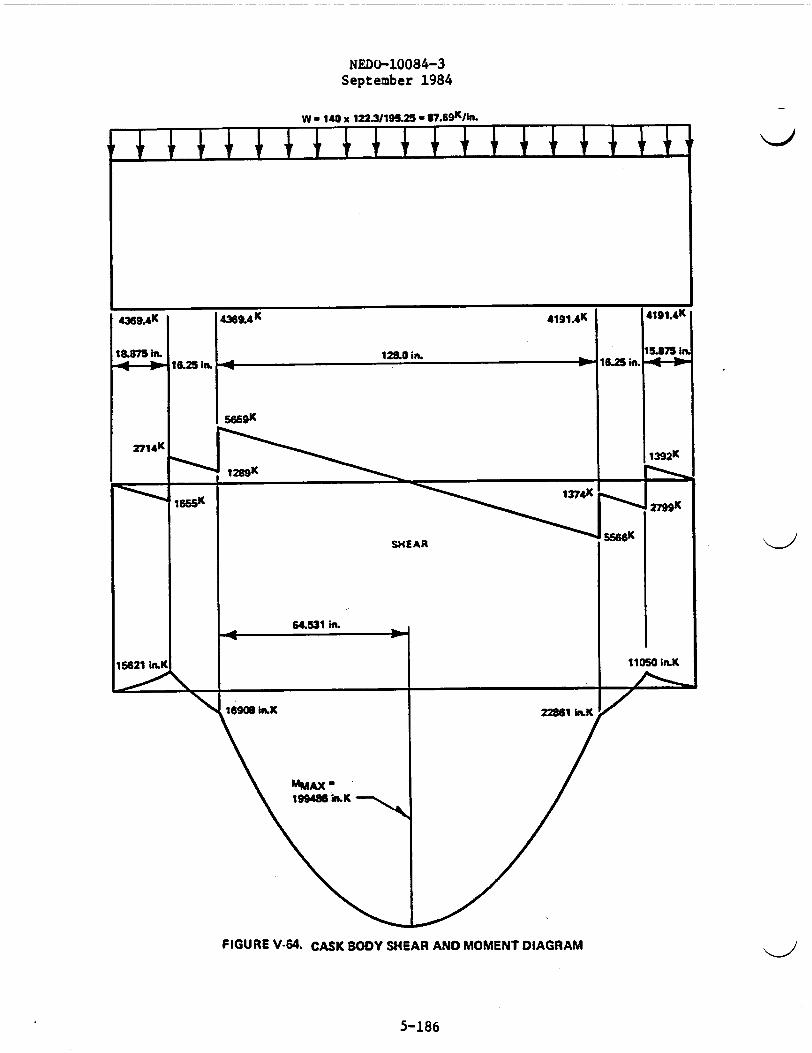
5.6.6 Cask Shells and Shielding at 122.3 g Side Drop
When the cask impacts during the 30-foot side drop, the body acts as a
beam supported at either end by the structural rings and acted upon by
the 122.3 g maximum deceleration. The shear and moment diagrams for
this loading condition are shown on Figure V-64. The following analysis
examines the stress levels in the shells for bending, internal shear
and external shear (punching action).
5.6.6.1 Assumptions
a. Only the inner
No credit will
and outer shells resist the bending stresses.
be taken for reinforcement by the uranium.
CLADDING
H -/ SOTTOM OF CASK CAVITY
FUEL PELLETS
FIGURE V63. IMPACT MODEL DETAIL
5-185
NEDO-10084-3September 1984
W a 140 x 122.3/195.25 - 87.9KJ.. .
.
r I 1 4 � I I � I -1 � � � � -4-- � � "- 4-1 J-1
U94 K4 43 6 9 *0 4_ 4e 4 191.4K
8M75 Iix 128.0 in. 15.875 in16&25 I. 4l * ism in.
SHEAR 5566K
04 64.531 In.
15821 K1 11050 in.K
N. 16906 iLK 22e61 IniK /
MMAX'
/
199486 InK
FIGURE V-64. CASK BODY SHEAR AND MOMENT DIAGRAM
5-186
NEDO-10084-3September 1984
b. The inner and outer shells will deflect the same under load.
Therefore, the load each carries will be proportional to its
moment of inertia.
c. Under high strain-rate conditions, the dynamic yield stresses
may be taken as 125% of the static yield value.
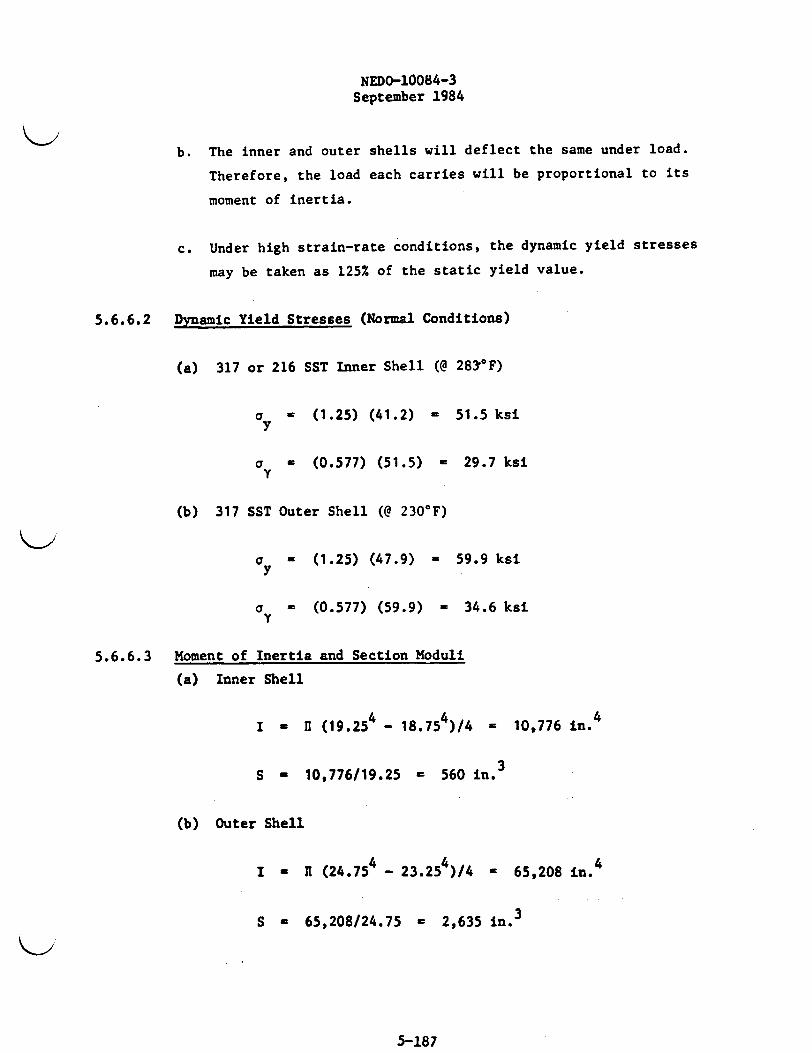
5.6.6.2 Dynamic Yield Stresses (Normal Conditions)
(a) 317 or 216 SST Inner Shell (@ 283rF)
ay D (1.25) (41.2) = 51.5 ksi
o a (0.577) (51.5) - 29.7 ksi
(b) 317 SST Outer Shell (@ 230'F)
oy - (1.25) (47.9) - 59.9 ksi
ay D (0.577) (59.9) - 34.6 ksi
5.6.6.3 Moment of Inertia and Section Moduli
(a) Inner Shell
I - R (19.254 - 18.754)/4 = 10,776 in.4
S - 10,776/19.25 - 560 in.3
(b) Outer Shell
I - n (24.754 - 23.25 )/4 - 65,208 in.4
S - 65,208/24.75 - 2,635 in. 3
5-187
NEDO-10084-3September 1984
Based on assumption (b):
Inner shell load % - 10,776/75,984 - 14.18%
Outer shell load % - 65,208/75,984 - 85.82%
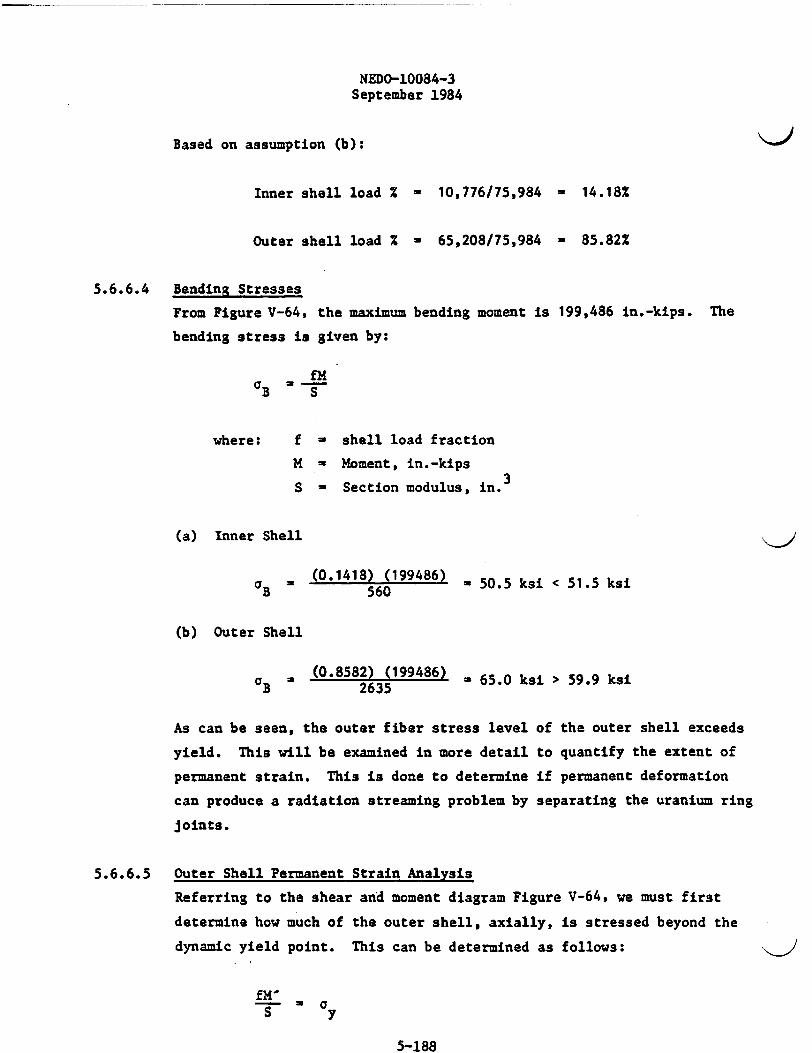
5.6.6.4 Bending Stresses
From Figure V-64, the maximum
bending stress is given by:
bending moment is 199,486 in.-kips. The
fH'B ' S
where: f
M
S
- shell load fraction
= Moment, in.-kips
- Section modulus, in.3
(a) Inner Shell
a B (0.1418) (199486) - 50.5 ksi < 51.5 ksiB 560
(b) Outer Shell
a B (0.8582) (199486) , 65.0 ksi > 59.9 ksiB 2635
As can be seen, the outer fiber stress level of the outer shell exceeds
yield. This will be examined in more detail to quantify the extent of
permanent strain. This is done to determine if permanent deformation
can produce a radiation streaming problem by separating the uranium ring
joints.
5.6.6.5 Outer Shall Permanent Strain Analysis
Referring to the shear and moment diagram Figure V-64, we must first
determine how much of the outer shell, axially, is stressed beyond the
dynamic yield point. This can be determined as follows:
S y
5-188
NEDO-10084-3September 1984
0.8582 M' -5992635
M' - 183,900 in.-kips
Thus, any outer shell section subjected to a bending moment less than
M' will remain elastic. The axial extent of the shell above the dynamic
yield value measured from the point of maximum moment is given by
X- 2HW)
/2(199,486 - 183,900)v 87.69
- 18.85 in. (above and below M max)
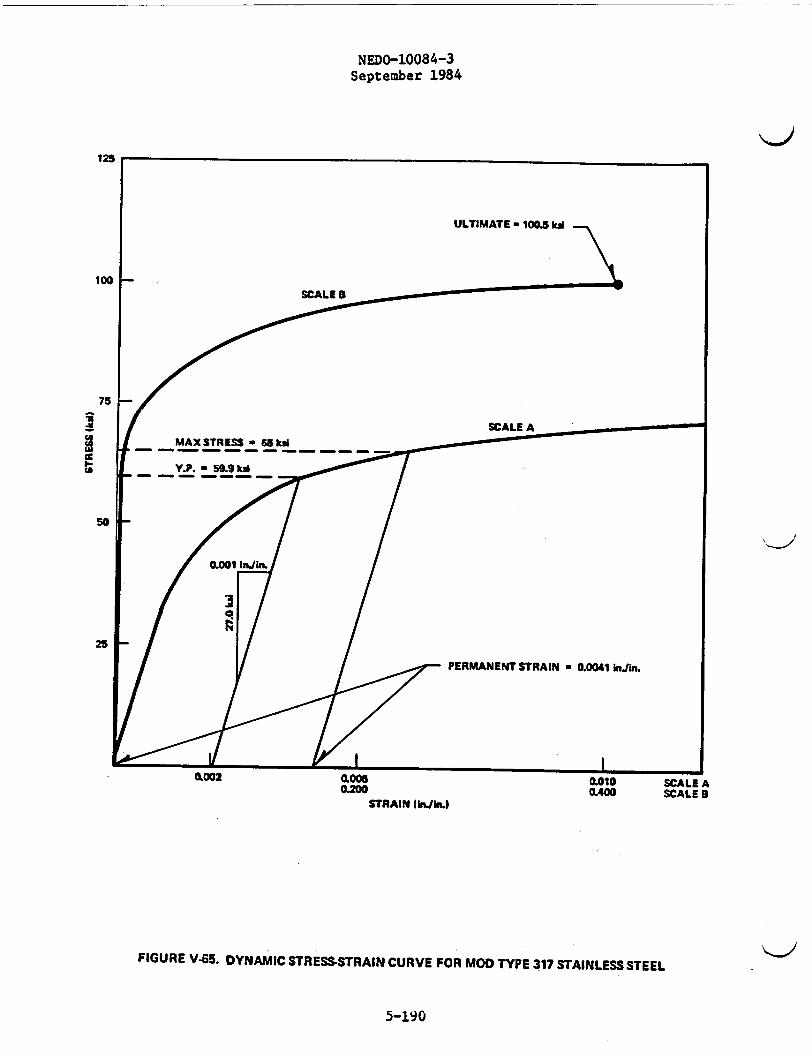
Figure V-65 is the stress-strain diagram for modified 317 stainless steel.
Scale B is the curve as normally seen extending to ultimate strength.
Scale A is an enlargement of that portion of Scale B around the yield
strength. From Scale A it can be seen that at a stress level of 65 ksi
the permanent strain is only 0.0041. This value is not significantly
different from 0.002 strain used to define yield point.
Using an average strain of 0.003 and applying it to the total affected
length of 2 x 18.85 - 37.7 inches yields a maximum elongation of
0.113 inches over that length. There is no uranium joint at the point of
maximum moment. The closest joint is 7-13/16 inches away which makes
the corresponding outer shell strain somewhat less than 0.0041. However,
using this maximum strain value and applying it to the effective
maximum uranium joint length of 1/2 inch (see Figure V-66) yields a
maximum uranium face separation of
S - (0.0041) (0.5) - 0.002 inch
Gamma probe measurements at various joint gaps using a Cobalt 60 source,
indicate that a 0.002-inch face separation has an insignificant affect on
radiation shielding.
5-189
NEDO-10084-3September 1984
12S
100
75
I!
50
25
0.002 0.000 Mai0.200 GAGS
STRAIN (Win.)
SCALE ASCALE 3
FIGURE V-65. DYNAMIC STRESS-STRAIN CURVE FOR MOD TYPE 317 STAINLESS STEEL
5-190
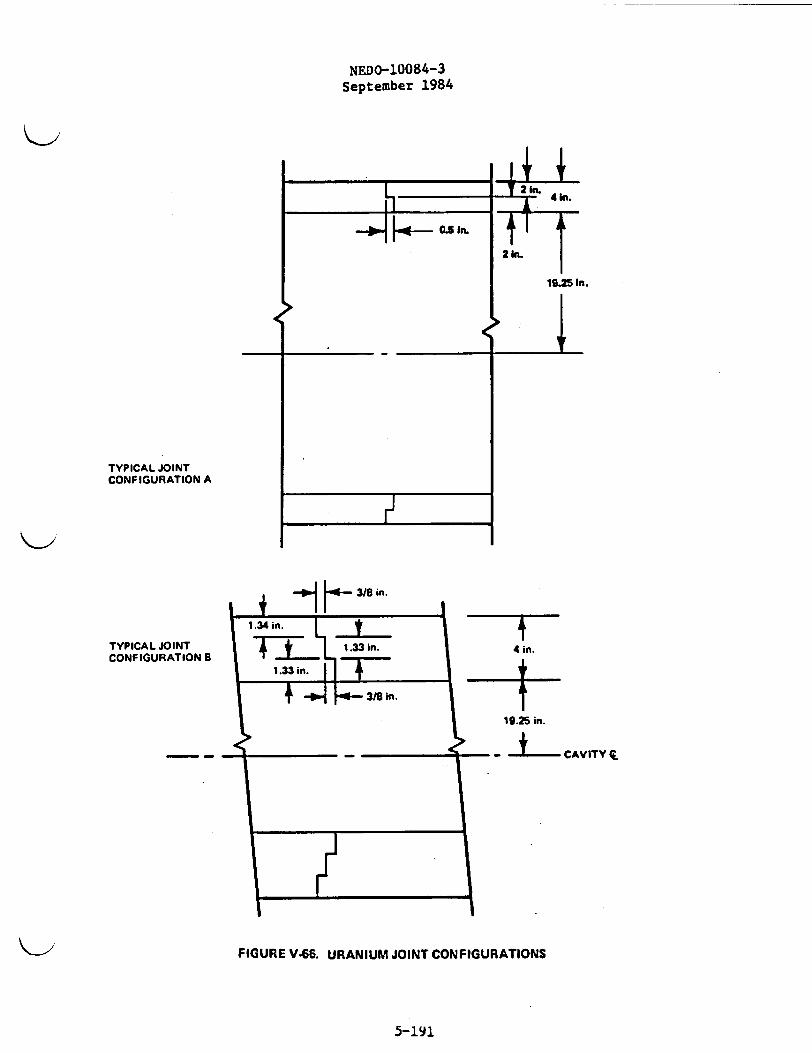
NEDo-1008 4-3September 1984
TYPICAL JOINTCONFIGURATION A
TYPICAL JOINTCONFIGURATION B
~1~4 in.
19.25 in.
_ t CAVITY 1
FIGURE V.66. URANIUM JOINT CONFIGURATIONS
5-191
NEDO-1008 4- 3
September 1984
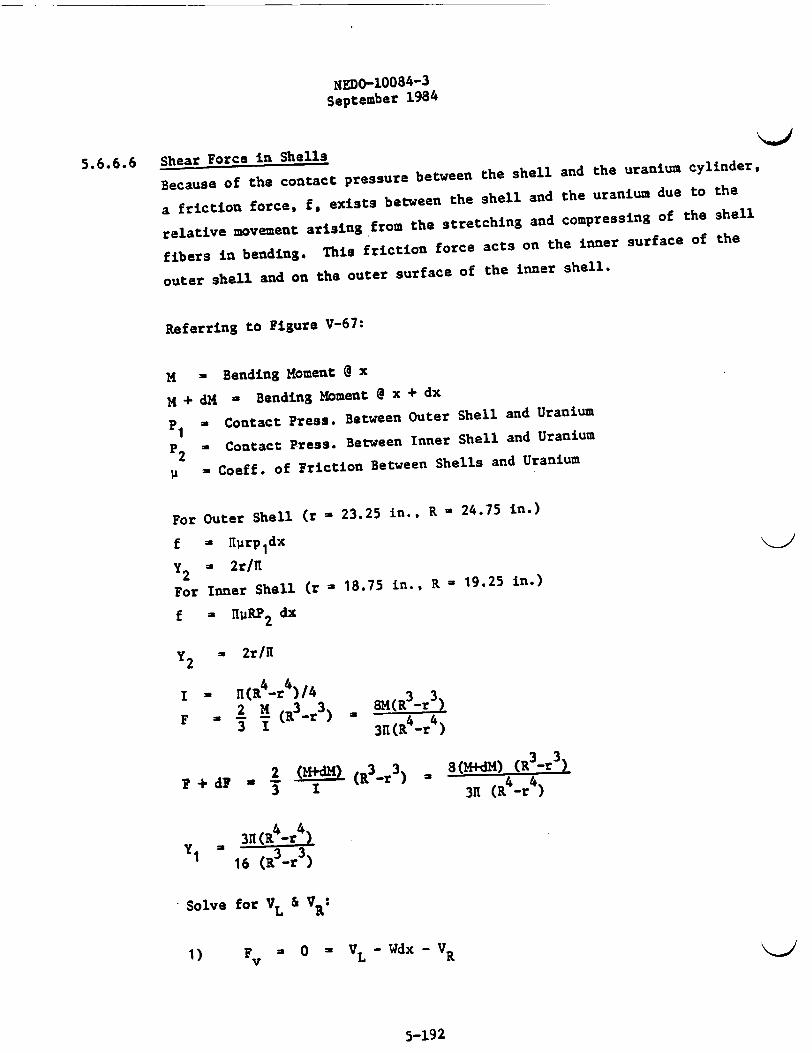
5.6.6.6 Shear Force in Shells
Because of the contact pressure between the shell and the uranium
cylinder,
a friction force, f, exists between the shell and the uranium due to
the
relative movement arising from the stretching and compressing
of the shell
fibers in bending. This friction force acts on the inner surface of the
outer shell and on the outer surface of the inner shell.
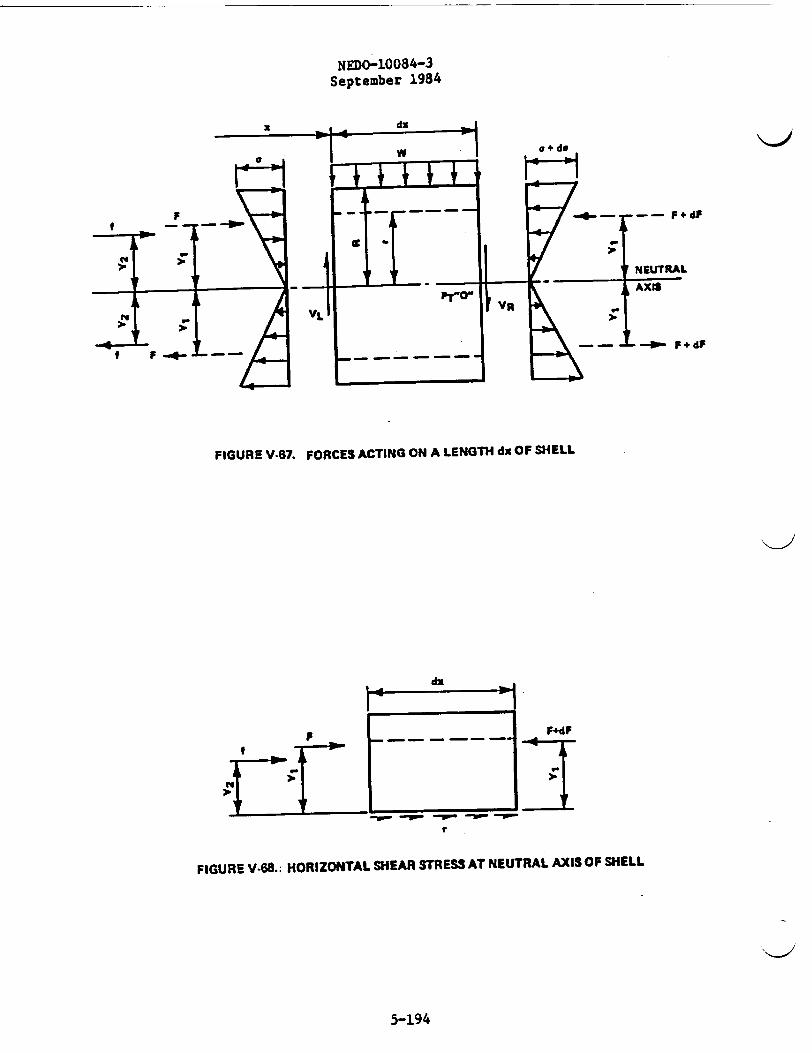
Referring to Figure V-67:
M - Bending Moment @ x
M + dX - Bending Moment @ x + dx
P1 W Contact Press. Between Outer Shell and Uranium
P2 - Contact Press. Between Inner Shell and Uranium
- Coeff. of Friction Between Shells and Uranium
For Outer Shell (r - 23.25 in., R - 24.75 in.)
f - flrp 1dx
Y2 '2r/n
For Inner Shell (r - 18.75 in., R - 19.25 in.)
f * HPRP2 dx
Y2 2r/II
I - H(R 4-r)/4 3)3
2 14 3 3 3 3-rF I(R -r ) - 44
31 3n1(R -r )
±~!~( 3r3 8(M*d1M) (R 3-r3
4 4
1 16 (R-r r)
Solve for VL & VR:
1) F = 0 VL Wdx VR
5-i92

NEDO-10084-3September 1984
22) Mtt , -O VL dx + 2FY + 2fy - W - 2 (F + dF)Y1
2 1 2 2
W t2 may be neglected because it is quite small.
Substituting in the appropriate values and solving for VL & VR. the
following is obtained:
Outer Shell:
VL dX - 4r2 Pi ' V- 4ur2 P1 Where V - shear @ x
VR - V - 4ur P1 Wdx
Inner Shell:
VL - V - 4yr P2
2
VR V - 4uR2 P2 Wdx
Referring to Figure V-68:
E FH - 0 - 2(R-r) T dx + F + f- (F + dF)
or, 2(R-r) T dx - dF - f
Solving for T:
Outer Shell:
T - V[ 4(R2 + Rr + 2 JIr 1L 3'[ (R4 - r4) J 2(R-r)
The first term in the expression for T is nothing more than V. Thus, thelb
shear stress is reduced by the friction between the shell and the uranium.
5-193
NEDO-1008 4-3September 1984
FIGURE V-67. FORCES ACTING ON A LENGTH dx OF SHELL
I -~dx 0
I4 - .
P i
2Il
N111111i1>
F+dFe P
FIGURE V.68.: HORIZONTAL SHEAR STRESS AT NEUTRAL AXIS OF SHELL
5-194

NEDO-10084-3
September 1984
Inner shell:
221 1u. R PT - V 4(R + Rr + r) 2
[3n(R4 -r4) J 2(R-r)
Contact pressures between shells and uranium: The minimum possible contact
pressures between the shells and the uranium for the normal operating
condition will be used. This corresponds to an internal pressure of 55 psi
and the minimum interference fits specified, i.e., zero inches between
inner shell and uranium and 0.005 inches between outer shell and uranium.
Solving the equations for the contact pressures:
P1 - 456 psi; P2 - 299 psi (see Section 5.4)
Coefficient of Friction, i:
The inner surface of the outer shell and the outer surface of the inner
shell are to be copper plated. Mark's "Mechanical Engineers' Handbook,"
6th Edition, pages 3-40, gives a coefficient of friction of 0.53 for copper
on mild steel. Since uranium exhibits properties similar to mild steel,
a value of u - 0.5 will be used.
Shear stress in Outer Shell:
V - 0.8582 x 5659 - 4857k
2 + 24.75 x 23.25 + 23.25 2 _ x 0.5 x 23.25 x 0.456
3 4857 (24.75k 4 23.254) ]2 (24.75 - 23.25)
- 43.0 - 5.55 - 37.45 ksi > 34.6
Shear Stress in Inner Shell:
V - 0.1418 x 5659 - 802k
5-195
NEDO-10084-3September 1984
- 802 409.25 + 19.25 x 18.75 + 18.- i x 50.5 x 19.25 x 0.299L 3 x (19.25 - 18.75 ) 2 (19.25 - 18.75)
- 26.9 - 9.04 - 17.86 ksi < 29.7
It can be seen that the shear stress in the outer shell (37.45 ksi) slightlyexceeds the shear yield stress (34.6 ksi). Again, as in the case of thebending stress at the center of the cask, only slight permanent sheardeformation will occur at the structural rings. This will cause no problemas far as radiation shielding integrity is concerned.
5.6.6.7 Shear Forces in Uranium
Based on the shell analysis of the previous subsection, there will be ashearing force carried by the uranium. This force is resisted by eithera uranium section or a uranium joint depending on the location of theforce. Referring to Figure V-69, the magnitude of the force is asfollows:
f1 n x 0.5 x 19.25 x 0.299 - 9.04kf2 ' n x 0.5 x 23.25 x 0.456 - 16.65k
V = 9.04 x 24.5 + 16.65 x 29.6 - 714k
If V is resisted by internal shear the stress level is very low
714T 2 2 ' 1.34 ksi1I(23.25 -19.25 )
The most highly stressed section is the uranium joint shown on Figure V-66and of the two joints shown, Configuration A has the smaller shear area.If V is resisted by the uranium joint:
Shear yield stress of uranium - 1.25 x 29 x 0.577 = 20.9 ksi
Min. shear area - 34.1 in.220.9
5-196
NEDo-10084-3
September 1984
Load must be resisted along an arc length 2 34.0 - 17.05 in.
Angle - 17.05/21.25 - 0.8025 rad - 460
It is reasonable to assume that the 714k force will spread out 23° each side
of the centerline.
5.6.6.8 Bending Stress in Uranium Jt:
M - 714 x 0.25 - 178.5 in. k
S - 17.05x22 in.3
6 -11.37in
1 , 178.5 - 15.7 ksi < 29 x 1.25 36.25
SF 36.25 . 2.3115.7
5.6.6.9 External Shear at Impact Rings
There is a "punching" action directly under each of the four impact
rings. (See Figure V-64) - Shear and Moment Diagram). Figure V-70
shows the conservatively assumed area which must resist the
4369.4 kip reaction in double shear.
Shear capacity of the shaded area:
W 27.16 (1.5 x 34.6 + 4 x 20.9 + 0.5 x 29.7) x 2
- 8170 kips
8170SF 4369°4 1.87
5.6.6.10 Conclusion
The above analyses have shown the cask inner shell, outer shell, and
uranium shielding pieces capable of sustaining the shear and bending
forces associated with the 122.3 g side drop deceleration without loss
of integrity or reduction of shielding ability.
5-197

NEDO-10084-3September 1984
f2
& IN
. 2,2 in. >J
1418 a 2 x 23.5112*5 - 2x19.Ms
L- 19.25 In.
,"W
FIGURE V.69. FORCES ACTING ON URANIUM
K-'FIGURE V.70.. EXTERNAL SHEAR RESISTANCE AREA
5-198
NEDO-10084-3September 1984
5.7 40-INCH DROP PUNCTURE
This analysis examines the cask outer shell and the cavity valve
box lid under the loading conditions imposed by a 40-inch. drop on
a 6-inch diameter pin.
5.7.1 Outer Shell
The significance of puncturing the outer shell on a uranium shielded
cask is minor compared to that of a lead shielded cask. A punctured
lead cask could result in shielding loss due to leakage during the
30-minute fire. This cannot occur with a uranium cask since the
shielding melting point is much greater than the fire temperature
(MP - 2071'F). Nevertheless, the determination of the outside shell
thickness is based on a formula developed for a lead-shielded cask,
and is therefore, considered to be quite conservative.
t - (W ) 0.71 (ref 21, page 12)au
where
W - Cask wt in kips
au W ultimate tensile strength of outside shell (ksi)
t - outside shell thickness (in.)
solving
t - 1.35 in.
The actual IF 300 outer shell is 1.5 inches thick resulting in a
puncture safety factor of 1.11.
5.7.2 Valve Box
Maximum damage to the valve box will occur when the 6-inch diameter
pin strikes the valve box as illustrated in Figure V-71 below.
5-199
NEDO-10084-3September 1984
5.7.2.1 Loss of KR and Impulsive Reaction
When the cask and pin contact, the resulting impact can be considered
"perfectly plastic." The KE analysis is as follows:
W
I ' Mass moment of inertia of cask about center of mass
V1 Linear velocity of CM before impact.
3 - 40 in.
V2 Linear velocity of CM after impact.
2= Angular velocity of CM after impact.
2 1K - A
Using the principle of impulse and momentum for a rigid body:
(System momenta)1 + (System Ext. Impulse) - (System Momenta)2
Figure V-72 shows graphically the above relationship:
Taking moments about CM:
0 + r (FAt) - I - MK2
considering vertical components:
MV1 FAt - 4V2
after impact vertical velocity at "A" must be zero.
Therefore, VA a O = V2 - rw
then,
V2w ,
r
5-200

NEDO-10084-3September 1984
15 In. , 16.5 . I6ln 7_a -n. - I-
I Ak CENTER OF MASSI
I dI
I -
9 in. I VALVE BOX
7 i. ENERGY ABSORBING FINS
EI '. A" I 6 In.# PISTON
FIGURE V-71. CONFIGURATION AT IMPACT L
LIV2 WM .
+40.75 In.
_ CENTER
ITOF MASS
MVI"A,
FAt
MV2
FIGURE V-72. IMPULSE AND MOMENTA
5-201
NEDO-10084-3September 1984
solving for Pat, V2 and a,
K2at - V1\+K2)
V2 ' V1
X 1 (r2+:2)
The difference between the
be dissipated in the valve
AXE - 1 MV12 _1 2
post-impact KE, and the pre-impact KE must
box.
I I( r
(E 2k
This AKE must be absorbed by crushing the fins on the valve box lid.
5.7.2.2 Mass Moment of Inertia of the Cask:
An inspection of the formulas for FAt and AKE, above, shows that the
higher the value of the radius of gyration, K, the higher also will be
the impulsive reaction and the change in KE. Therefore, in determining
K, the cask will conservatively be assumed to have all its mass concen-
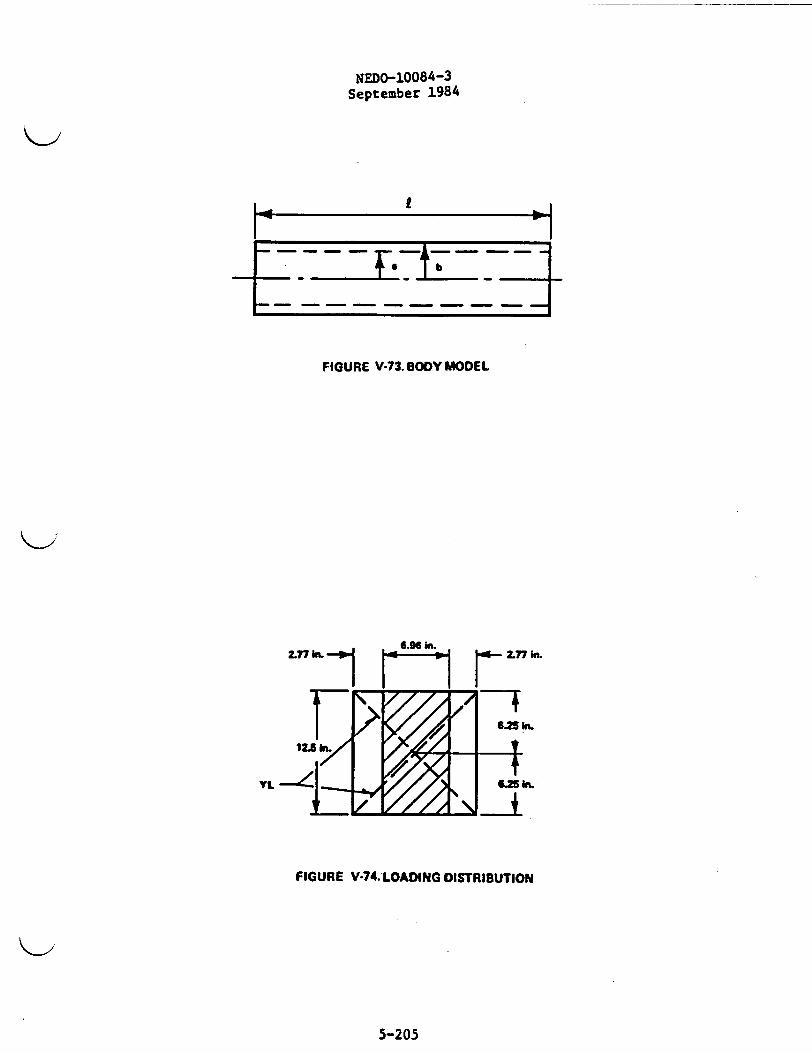
tration in a hollow cylinder with the following dimensions (Figure V-73):
a,b,
Z'
inside radius
outside radius
length
- 18.75 in.
- 24.75 in.
- 192.25 in.
I = M 3(b2 + a2) +t
121K2 .3(b 2 2) 121 2
20 3420 in.
M - 3864 - 0.362 k-sec2/in.
5-202
NEDO-10084-3September 1984
KE - 40 x 140 - 5600 in-k2 22r = 70.625 - 4990 in.2
AKE - 5600( 1 3420 )- 2275 in.-k
V1 - /2x386.4 x 40
- 175.8 in./sec
Ft- 0.362 (175.8) ( 3420)
W 25.9 kip-sec.
5.7.2.3 Fin Bending:
The 6 in. * piston could strike either two or three fins; both casesare examined. It is assumed that the fins bend along their
entire (14 in.) length.
a. Case I - Two Fins
AKE - 2275 in.-k - 2x55x14x0.56252 x S
Solving:
6 - 4.67 rad
Using the fin bending correlation
' - 0.67h
then, 6 - (7 in.) (0.67) - 4.69 in.
F - 2275 - 485 k4.69
At- 25.9 - 0.0534 sec485
Since this
condition,
lid and box loading
no further analysis
is
is
less than that of the 30-foot drop
required.
5-203
NEDO-10U84-3September 1984
b. Case II - Three Fins
2275 - 3 x 55 x 14 x 0.56252 x
9 - 3.11 rad
-' 0.335
then, 6 - 7 x 0.335 - 2.345 in.
F - 2275 - 970 k2.345
At-25.9 - 0.0267 sec.970
5.7.2.4 Component Stresses (Figure V-74)
Maximum stress in valve box lid occurs when the pin impacts fin
numbers 3, 4 and 5. Assuming that the 970 k load is uniformly distrib-
uted over an area of:
12.5 x 32.75 tan 120
yields a value:
( 970 ' 11.14 ksi(12. 5x6 .96)-
conservatively assuming that the lid is simply supported on all four
sides, find the value of Wu, the ultimate load the plate can carry.
Rotation of yield lines:
9 2 x( 8.84 ) 0.266
M - 58.4 in.-k/in. (from 30 ft drop analysis)
W, - 2 x 17.68 x 58.4 x 0.226
- 467 in.-k
5-204
NEDO-10084- 3
September 1984
II.F-- I
*1- -- J
FIGURE VY73. BODY MODEL
YL
FIGURE V-74. LOADING DISTRIBUTION
5-205
NEDO-10084-3September 1984
External Work:
W - 2 x W x 6.96 x 2.77 x 1.385/6.25a u 2
+ 4 x W x 3.48 x 3.93/6.25u
- 39.05 WU
Since, by virtual work theorem:
W - wi a
u 39.05 = 11.95 ksi
.".Lid SP - 11.95 - 1.07311.14
Checking stresses in wall #1:
P - 11.14 x (6.96 x 2.77 x 3.482) - 350k
350 - 28ksiW x2.5
SP 58 -2O28 2.07
Checking axial stresses in wall #3:
Assume: Pin certerline strikes directly over fin #1.
P - 970k
a 970 51.7 ksi1.5x12.5
SP- 58 =1.1351.7
5.7.2.5 Conclusion
The analyses of this section demonstrate that the cavity valve box
is capable of sustaining the 40-inch puncture without losing integrity
(SF > 1.0) or damaging the contents.
5-206
NEDO-10084-3September 1984
5.8 CASK TIEDOWN AND LIFTING
5.8.1 Materials
5.8.1.1 Saddle, cradle, cradle pedestals and tipping cradle trunnions are A516
GR 70 steel.
Min. Yield - 38.0 ksi
Ult. Tensile - 70.0 to 85.0 ksi
5.8.1.2 Block Pin AMSi 4340
Heat treated to Min. Yield - 125.0 ksi
5.8.1.3 Structural rings are Type 216 stainless steel
Yield - 58.4 ksi @ 70°F
5.8.1.4 Cask outer shell is CG-8M, modified 317 stainless steel:
Yield - 47.4 ksi @ 235°F
5.8.2 Cask-to-Skid Tiedown Properties and Stresses During Transport
Figure V-75 shows the cask in its horizontal shipment position.
The cask is supported at the front by a saddle and at the
rear by a pivot cradle held between two pedestals. Acting through the
cask center of gravity are the 10 g axial and 2 g vertical forces
prescribed in the regulations. Also acting through the CG but not
shown on the figure is the regulatory 5 g lateral force.
The reactions at the supports are given by:
R . 19.6H - 93.125V . 0.1197 H-0.569V - .059W163.75
R . 19.6H + 70.625V = -0.1197H -0.432V = -2.061Wc 163.75
`H - H - low
Solving for all combinations of H and V yields the data in Tahle V-34.
5-207

19625 in. O.A. CASK LGTH 8.0 in. fE+CI
I
0u4 1I.O
Xa Cin 0
NOTE: DIMENSIONS ARE AT AmBIENT TEMPERATURE CONDITION FOR CASK AS FABRICATEDE - CASK EXPANSION FROM AMBIENT TO NORMAL OPERATING TEMP - 0.125 In.C - CLEARANCE ALLOWED AFTER EXPANSION-E.- (MUST INCLUDE EXP DUE TO DRY CASUALTY) f 1.375 in.
FIGURE V-75. CASK IN TRANSPORT POSITION
( c (

NEDO-10084-3September 1984
Table V-34
SUPPORT REACTIONS
H
+1400.0
+1400.0
-1400.0
-1400.0
V
+280.0
-280.0
+280.0
-280.0
ALL LOADS IN KIPSR
S
+ 8.5
+ 326.9
- 326.9
- 8.5
Rc
-288.5
- 46.9
+ 46.9
+288.5
+H
+1400.0
+1400.0
-1400.0
-1440.0
The individual support components under
discussed in following sections.
the normal shipping loads are
5.8.2.1 Front Saddle - Transport
Figure V-76 is Section A-A of Figure V-75 and shows the front saddle
configuration. The CG of the bearing area is located as follows:
sin ay - R (1 - - a)
where R - 25.0 in.
a - 67.5° (1.178 rad)
y - 5.40 in.
Figure V-77 is Section C-C of Figure V-76 and shows the details of
the front saddle to cask interface.
Table V-35 shows the structural properties of the composite ring
section shown in Figure V-77.
Table V-35
PROPERTIES OF COMPOSITE RING SECTION
Part
Rings
Shell
Flg.
A
17.50
34.50
9.56
61.56
y
3.507.75
9.63
6.83
AY
61.3
267.4
92.1
420.8
AY2
215
2072
887
3174
Io-x
71.5
6.5
4.0
82.0
5-209

NEDO-10084-3September 1984
50 in. WIDE BROG C.. BRO AREAI "'~~~NA REA X1350
- _ _ _ _ _ _
_BRG AREA
l lt5In. IL l
'1 Iraw-
NOTE: WELD TO TRAILER STRUCT.MUST DEVELOP FULL STRENGTHOF SADDLE SIDE AS
FIGURE V-76 SADDLE CONFIGURATION
5-210
23.0 in. EFF SHELL WIDTH IN RING ACTION
ASSUMED 0.789f- , 4.69 in. USE 4.75 In.EPFF FLO. 42 n
r - 24.0 in.
R ~1.5 in.SHELL
7.0 In. RING
Y - 6.3I 2.0 In. ELD C
ICISHELL--c
.0Ion. O o
d a
DETAIL A
FIGURE V-77. SADDLE-CASK INTERFACE
NEDO-10084-3September 1984
24- 3174 + 82.0 - 61.56 x 6.83 - 380 in.
x
The following calculations define the section propert
saddle base:
33 3= 0.0833 (14 x 60 -11 x 57) - 82,400 in.
3 ~ 33a 0.0833 (60 x 143 - 57 x 11 ) - 7390 in.3
yy
A - (14 x 60) - (11 x 57) - 213 in.
Cx- 30.0 in., Cy 7.0 in.
Stress Analysis
Saddle lateral load = HS
WL - 5W - 5 x 140 = 700k
H - 0.569 WL - 398 kips
Saddle vertical load - RS
Rs 326.9 kips
Saddle longitudinal load - RH
RH - 1400 k
Moments:
Hx - 40 H - 40 x 398 - 15,920 in.-kips
Hy - 20.4 RH - 20.4 x 1400 - 28,560 in.-ki
ties of the
Ps
5-212
NEDo-10084-3September 1984
Bending stress:
R M C M Ca . 6 + XX +max A II x y
326.9 + 15920 x 30 + 28560 x 7213 82400 7390
- 1.53 + 5.80 + 27.03
- 34.36 ksi (combined stress at base)
and38.0
SF . 34.36 1.11
Bearing stress @ saddle from RH:
Length of bearing area, LB - 2%
- 2x 25.0 x 1.178
- 58.9 in.
L 5810 23.8 kips/in.L- 58.9
AB 0.50 in. 2/in.
Weld
Therefore:
aB 23.8 ' 47.6 ksi
andSP - 38.0 . 1.33
SF - 0.6x47.6
stresses - bearing element to vessel shell:
1.0 x 2.03 0.07 in.4fin,Weld 12 - .7i./n
c - 1.0 in.
A - 2.0 in 2 /in.w
5-213
NEDO-1008 4-3September 1984
M - 0.25 p 5.95 in.-kips/in.
then:
OB itg 5.95 x 1.0 - 8.88 ksiBaending 0.67
SFB =47.4 - 5.34S3 8.88
and
23.8 a 11.9 ksi2
SP (47.4) (0.577). - 2.4sg 11.9
Shell moment as a result of saddle bearinz forces:
The bearing surface is that region between the structural rings.
The solution follows case 15 of Reference 3, Table XIII.
14 1.0p - 1.0 x 23.8 - 23.8 in.-kips/in.
M4 - M/2 - 11.9 in.-kips/in.
Mx - M0e (cos Ax + sin Xx)
- (0O78 -t ) - 0.214
when: H 0
cos Ax ; sin xx - 0
Xx - 135° - 2.356 rad
.-356 11.0 in.
therefore influence of top flange on 1o can be neglected.
5-214

NEDO-10084-3September 1984
Shell bending stress
6o 6 x 11.9aB 2 2
t 1.5
- 31.75 ksi
SF - 34774 - 1.531.75
Note that outside of the bearing surface, MO is directly resisted by
the top flange with minimal effect on the shell.
5.8.2.2 Pivot Cradle - Transport
Figure V-75 shows the cradle in its shipping position. Figure V-78
below is the cradle cross-section. Table V-36 gives the properties
of this section.
Table V-36
PROPERTIES OF PIVOT CRADLE SECTION
Part A
Top Flg. 5.0
CTR. " 3.0
BTM. " 5.0
OutsideWeb 22.0
x
2.5
2.5
2.5
AX
12.5
7.5
12.5
AX2
31.25
18.75
31.25
5.50
I
10.42
2.25
10.42
y
23.5
15.0
0.5
AY
117.5
45.0
2.5
AY2
2761.25
675.00
1.25
IIo-x
0.42
0.25
0.42
0.5 11.0 1.83 12.0 264.0 3168.00 887.33
InsideWeb 22.0 &4. 99.0 445.50 1.83 12.0 264.0 3168.00 887.33
1775.75E 57.0 2.50 142.5 532.25 26.75 12.16 693.0 9773.50 1
I - 532.25 + 26.75 -y
- 9773.50 +1775.75 -
57.0 x 2.502 - 203 in. 4 Cy
- 2.50 in.
57.0 x 12.162 3125 in.4 C - 12.16 in.x
In the normal transport position, the pivot cradle is acted upon
by the 2g load as shown in Figure V-79. The value of 2p is Rc
which from Table V-34 is 288.5 kips.
5-215

IL6 im THK THRUS T PLATE
7A0 ' i
71.6bi. 00 1VOT CRDE
°W I% I 5. in. 10 PIVOT CRADLE� I -
v ALLt 1.In.THK
- -L _ _ _ _ _ I .. _
1 V -44/r
-~ ~1
t7A06 0 -_
A:2 4.01
_ |i- riIVOT FI__ l l .-
7(Ala en
'DC
a !vD Iazw
I I . diL
1M0ia
1x12.16 il
16 SUPPORT LUGS.a laWIDE
1LII3m10
I
. .- d - i - I �-*III-.I-I a
5ECTION "OF FIGURE V-7711 | i. _*57.5 6. ID SUPPORT LUGS
v 555 in. OA WIDTH AT PINS
FIGURE V-78. PMVOT CRADLE CROSS-SECTION
Q, C

NEDO-10084-3September 1984
,.II tenor
6.50 in. f O D.uu In.
t-- -___ ___
P I / i
/12p
FIGURE V-79. VERTICAL LOADING OF PIVOT CRADLE CASK IN HORIZONTAL POSITION)
5-217
NEDO-1008 4 - 3
September 1984
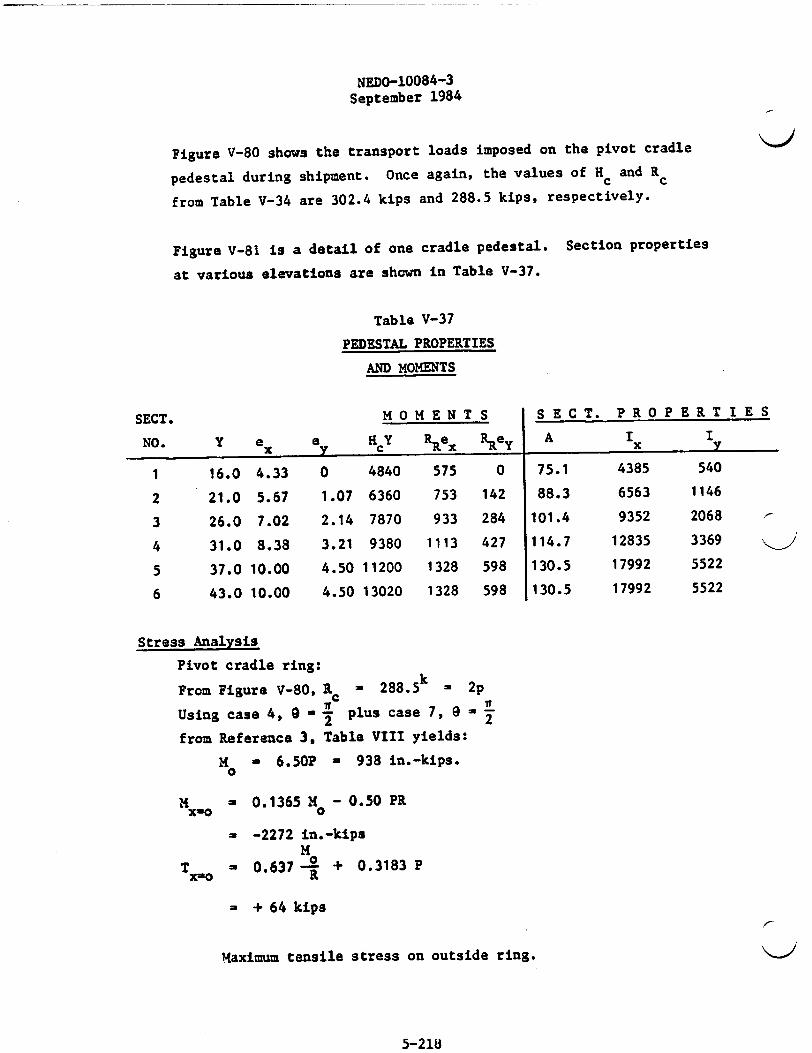
Figure V-80 shows the transport loads imposed on the pivot cradle
pedestal during shipment. Once again, the values of Hc and Rc
from Table V-34 are 302.4 kips and 288.5 kips, respectively.
Figure V-81 is a detail of one cradle pedestal. Section properties
at various elevations are shown in Table V-37.
Table V-37
PEDESTAL PROPERTIES
AND MOMENTS
SECT. M O M E N T S
NO. Y e a, HY Re_ R
S E C T.
A
P R O P E R T I E S
1
2
3
4
5
6
16.0
21.0
26.0
31.0
37.0
43.0
4.33
5.67
7.02
8.38
10.00
10.00
0
1.07
2.14
3.21
4.50
4.50
4840
6360
7870
9380
11200
13020
575
753
933
1113
1328
1328
0
142
284
427
598
598
75.1
88.3
101.4
114.7
130.5
130.5
4385
6563
9352
12835
17992
17992
540
1146
2068
3369
5522
5522
Stress Analysis
Pivot cradle ring:
From Figure V-80,
Using case 4, 9 =
from Reference 3,
M - 6.50P
kRc - 288.5 * 2p
T2 plus case 7, 9 2
Table VIII yields:
- 938 in.-kips.
MX=0 - 0.1365 MX - 0.50 PR
- -2272 in.-kipsH
T ' 0.637 R + 0.3183 P
= + 64 kips
i4aximum tensile stress on outside ring.
5-218

NEDO-10084-3September 1984
^~ 39.75 In. 39.75 in.
- -THRUSTIL
it PINS -
86.5 In. OUTSIDE PEDESTALS ,,
FIGURE V-80. PEDESTAL LOADS
5-219

I
un
a zn0 Um Co I-A(3 0*1 0
ccw Al
III IiJ.I I I ai
-- M_ --II-- w-- Z I- G 7= -_ ~
NOTE: WELD TO TRAILER STRUCTMUST DEVELOP FULL STRENGTHOF PEDESTAL SIDE PLATES
FIGURE V-81.PEDE'IL DETAILS
( C
NEDO-10084-3September 1984
Hxs X px=o PaT I Ay
2272 x 2.50 + 64203 57.0
= 29.07 ksi
Maximum compressive stress inside ring:
a 2272 x 2.50 64 26.83kia 203 57.0 =2.3k
Consider 90°,
M r = ±.50 M + 0.1818 PR
- 1342 in.-kips or 404 in.-kips
T i -0 + PXs.-
= 144.25 kips
Stress in ring is maximum at x = o
SF - 38.0 1.3129.07
Pivot cradle pedestals:
WL - 700 kips
Pedestal lateral load - Hc
Hc = 0.432 WL = 302.4 kips
Pedestal vertical loads - RL & RR
R - 288.5 kips
39.75 R - 3.0 HRR - . c = 132.8 kip
RL - 288.5 - 132.8 - 155.7 kips
.si
s
5-221
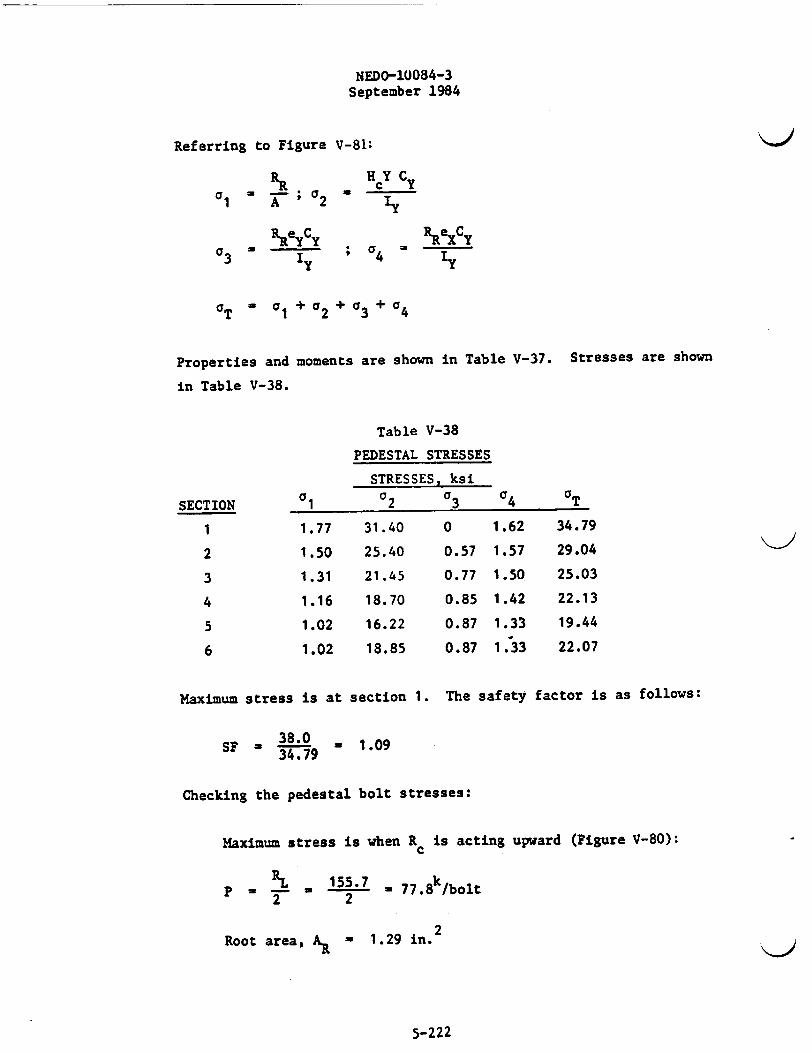
NEDO-10084-3September 1984
Referring to Figure V-81:
RR H cY CY
°1 A; '2 Iy
a a RR ;XCY3 I a4 I
T ' 1+ a2 3 + a4
Properties and moments are shown in Table V-37. Stresses are shown
in Table V-38.
Table V-38
PEDESTAL STRESSES
STRESSES, ksi
SECTION T°2 a3 a4 CT
1 1.77 31.40 0 1.62 34.79
2 1.50 25.40 0.57 1.57 29.04
3 1.31 21.45 0.77 1.50 25.03
4 1.16 18.70 0.85 1.42 22.13
5 1.02 16.22 0.87 1.33 19.44
6 1.02 18.85 0.87 1.33 22.07
Maximum stress is at section 1. The safety factor is as follows:
Sp 38.0 1.0934.79
Checking the pedestal bolt stresses:
Maximum stress is when Rc is acting upward (Figure V-80):
RL _155.7p , , . 77.8k/bolt
Root area, AR = 1.29 in. 2
J11
5-222

NEDO-10084-3September 1984
CYT ' A = 778 a 60.2 ksiAR 1.29
aYp 105.0 ksi (A320, Gr L7)
SF ' 105. - 1.7460.2
Pivot cradle trunnions:
These items will be evaluated in the lifting section where they are
in their most highly stressed condition.
5.8.2.3 Cask Body and Upper Structural Rings - Transport
The upper structural rings straddle and are pinned to the front
saddle. These members resist all of the axial and a portion of
the vertical and lateral forces.
The axial forces were examined in the front saddle analysis (sub-
section 5.8.2.1). The following will cover the vertical and
lateral forces imposed on the rings which in turn act on the cask
body.
Figure V-82 shows the computer model of the composite cask wall
consisting of a stainless steel ring linked to a uranium ring.
The forces (FXFY) are the reactions to Hc and Rc at the pin which
connects the structural rings to the front saddle.
This model was run for the following values:
R 326.9 kips
H - 398.0 kips6
R and H are transmitted around the stainless steel ring by6 5
tangential shear:
R SinG - H Cos 05 5
'FffR
5-223

NEDO-10084-3September 1984
Y
LINKS INDICATE ASSUMEDPOINTS OF CONTACT
611MERS 2M1. OM.41-42 AND 17.191
FIGURE V-82. SECTION MODEL
5-224
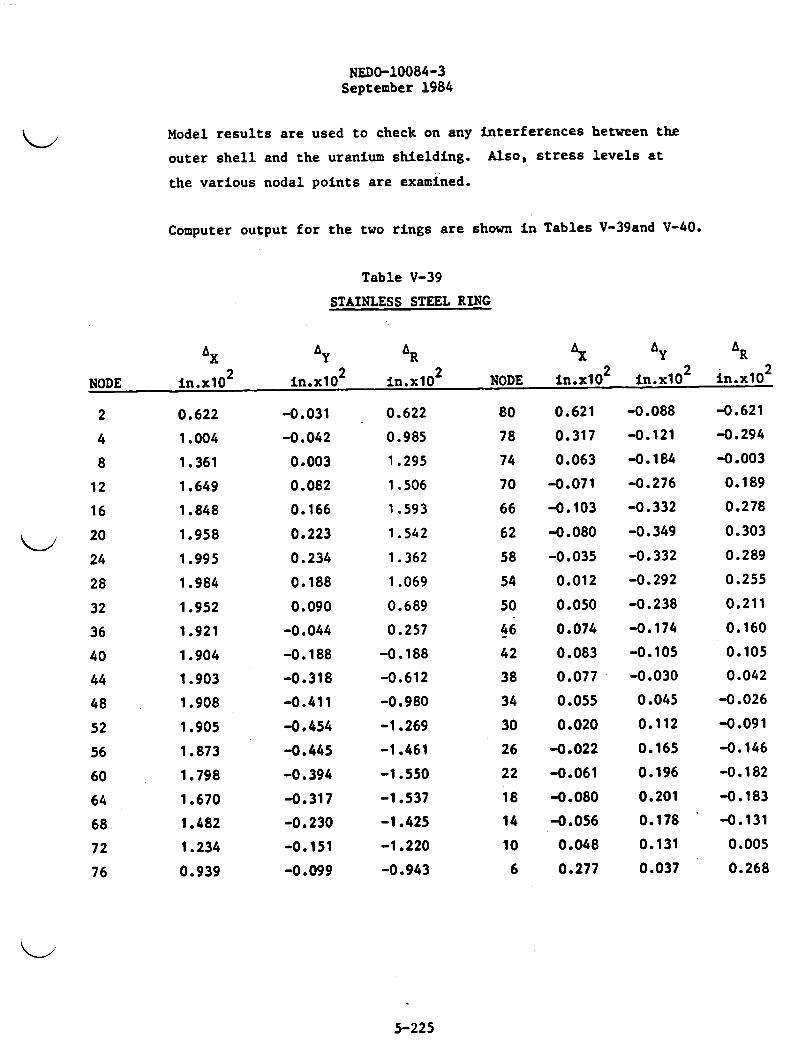
NEDO-10084-3September 1984
Model results are used to check on any interferences between the
outer shell and the uranium shielding. Also, stress levels at
the various nodal points are examined.
Computer output for the two rings are shown in Tables V-39and V-40.
Table V-39
STAINLESS STEEL RING
X &Y aR 1 AY AR
2 2 2 2 2 2NODE In.xlO in.x1O in.x1O NODE in.xlO in.x1O in.x1O
2 0.622 -0.031 0.622 80 0.621 -0.088 -0.621
4 1.004 -0.042 0.985 78 0.317 -0.121 -0.294
8 1.361 0.003 1.295 74 0.063 -0.184 -0.003
12 1.649 0.082 1.506 70 -0.071 -0.276 0.189
16 1.848 0.166 1.593 66 -0.103 -0.332 0.278
20 1.958 0.223 1.542 62 -0.080 -0.349 0.303
24 1.995 0.234 1.362 58 -0.035 -0.332 0.289
28 1.984 0.188 1.069 54 0.012 -0.292 0.255
32 1.952 0.090 0.689 50 0.050 -0.238 0.211
36 1.921 -0.044 0.257 46 0.074 -0.174 0.160
40 1.904 -0.188 -0.188 42 0.083 -0.105 0.105
44 1.903 -0.318 -0.612 38 0.077 -0.030 0.042
48 1.908 -0.411 -0.980 34 0.055 0.045 -0.026
52 1.905 -0.454 -1.269 30 0.020 0.112 -0.091
56 1.873 -0.445 -1.461 26 -0.022 0.165 -0.146
60 1.798 -0.394 -1.550 22 -0.061 0.196 -0.182
64 1.670 -0.317 -1.537 18 -0.080 0.201 -0.183
68 1.482 -0.230 -1.425 14 -0.056 0.178 -0.131
72 1.234 -0.151 -1.220 10 0.048 0.131 0.005
76 0.939 -0.099 -0.943 6 0.277 0.037 0.268
5-225
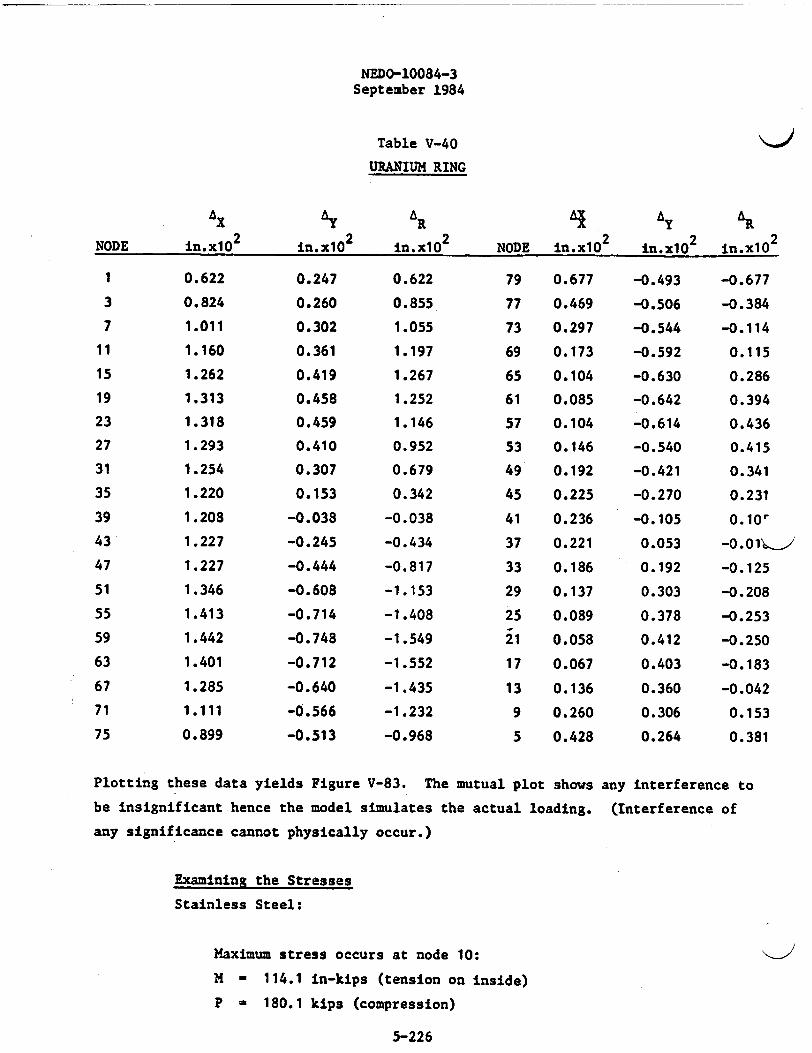
NEDO-10084-3September 1984
Table V-40
URANIUM RING
aX AY aR Y R
NODE in.x102 in.x102 in.x10 2 NODE in.x102 in.x102 in.x1O2
1 0.622 0.247 0.622 79 0.677 -0.493 -0.677
3 0.824 0.260 0.855 77 0.469 -0.506 -0.384
7 1.011 0.302 1.055 73 0.297 -0.544 -0.114
11 1.160 0.361 1.197 69 0.173 -0.592 0.115
15 1.262 0.419 1.267 65 0.104 -0.630 0.286
19 1.313 0.458 1.252 61 0.085 -0.642 0.394
23 1.318 0.459 1.146 57 0.104 -0.614 0.436
27 1.293 0.410 0.952 53 0.146 -0.540 0.415
31 1.254 0.307 0.679 49 0.192 -0.421 0.341
35 1.220 0.153 0.342 45 0.225 -0.270 0.231
39 1.208 -0.038 -0.038 41 0.236 -0.105 0.10'
43 1.227 -0.245 -0.434 37 0.221 0.053 -0.01\_,/
47 1.227 -0.444 -0.817 33 0.186 0.192 -0.125
51 1.346 -0.608 -1.153 29 0.137 0.303 -0.208
55 1.413 -0.714 -1.408 25 0.089 0.378 -0.253
59 1.442 -0.748 -1.549 21 0.058 0.412 -0.250
63 1.401 -0.712 -1.552 17 0.067 0.403 -0.183
67 1.285 -0.640 -1.435 13 0.136 0.360 -0.042
71 1.111 -0.566 -1.232 9 0.260 0.306 0.153
75 0.899 -0.513 -0.968 5 0.428 0.264 0.381
Plotting these data yields Figure V-83. The mutual plot shows any interference to
be insignificant hence the model simulates the actual loading. (Interference of
any significance cannot physically occur.)
Examining the Stresses
Stainless Steel:
Maximum stress occurs at node 10:
M - 114.1 in-kips (tension on inside)
P - 180.1 kips (compression)
5-226
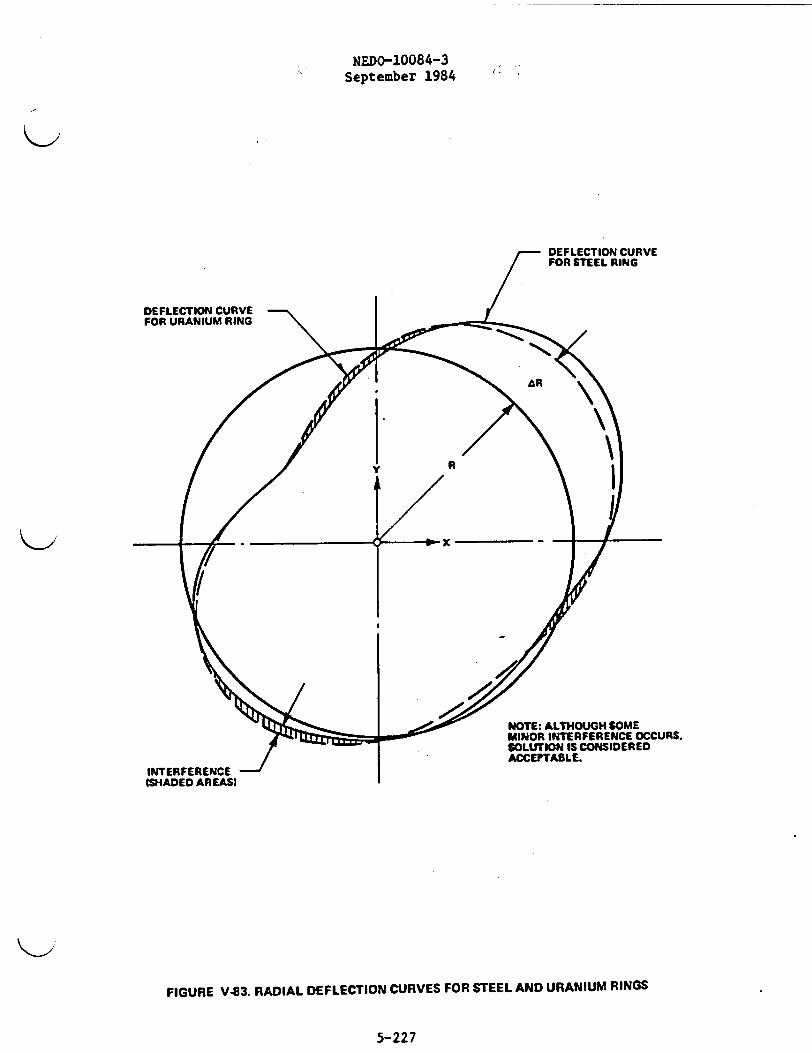
NEDO-10084-3September 1984
NOTE: ALTHOUGH SOMEMINOR INTERFERENCE OCCURS.SOLUTION IS CONSIDEREDACCEPTABLE.
FIGURE V-83. RADIAL DEFLECTION CURVES FOR STEEL AND URANIUM RINGS
5-227
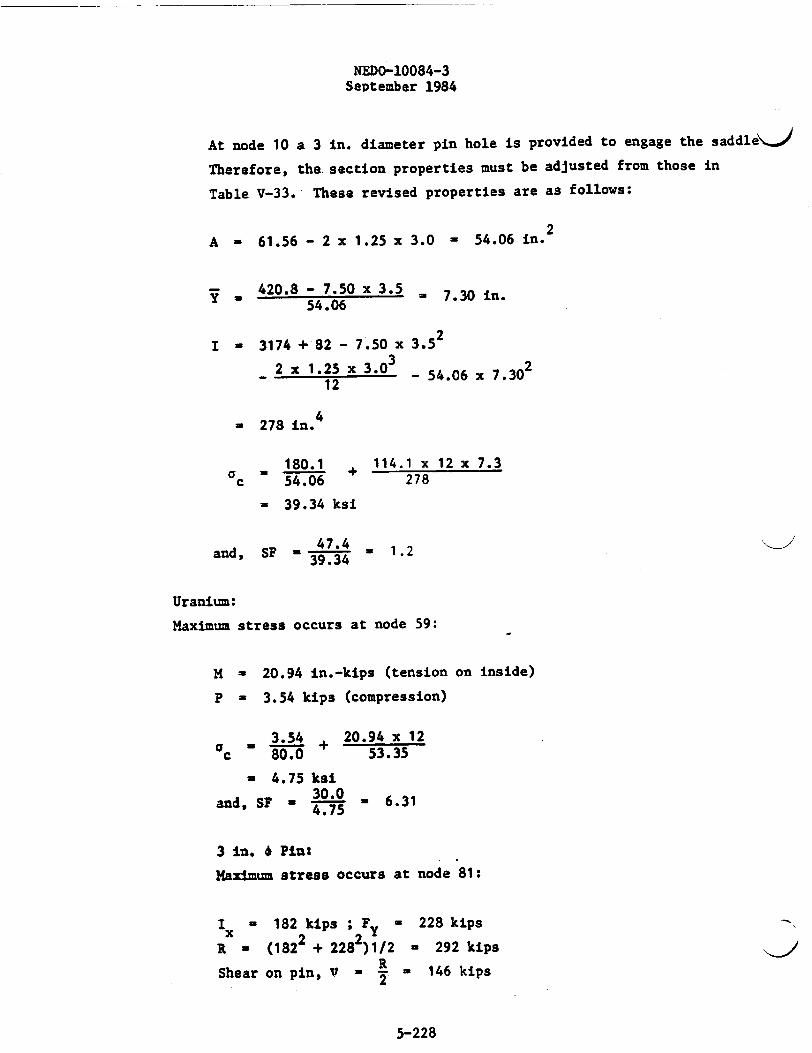
NEDO-10084-3September 1984
At node 10 a 3 in. diameter pin hole is provided to engage the saddle\ .
Therefore, the section properties must be adjusted from those in
Table V-33. These revised properties are as follows:
A - 61.56 - 2 x 1.25 x 3.0 - 54.06 in.
- 420.8 - 7.50 x 3.5 - 7.30 in.54.06
I - 3174 + 82 - 7.50 x 3.52
2 x 1.25 x 3.0 _ 5406 x 7.30212
4- 278 in.
180.1 + 114.1 x 12 x 7.3c 54.06 278
- 39.34 ksi
and, SF - -474 = 1.239.34
Uranium:
Maximum stress occurs at node 59:
M - 20.94 in.-kips (tension on inside)
P - 3.54 kips (compression)
3.54 20.94 x 12U 80.0+ 53.35
- 4.75 ksi
and, SF - 30.0 - 6.314.75
3 in. 0 Pin:
Maximum stress occurs at node 81:
I a 182 kips ; F -- 228 kips
R - (1822 + 228 )1/2 - 292 kips
Shear on pin, V - 2 146 kips2
5-228
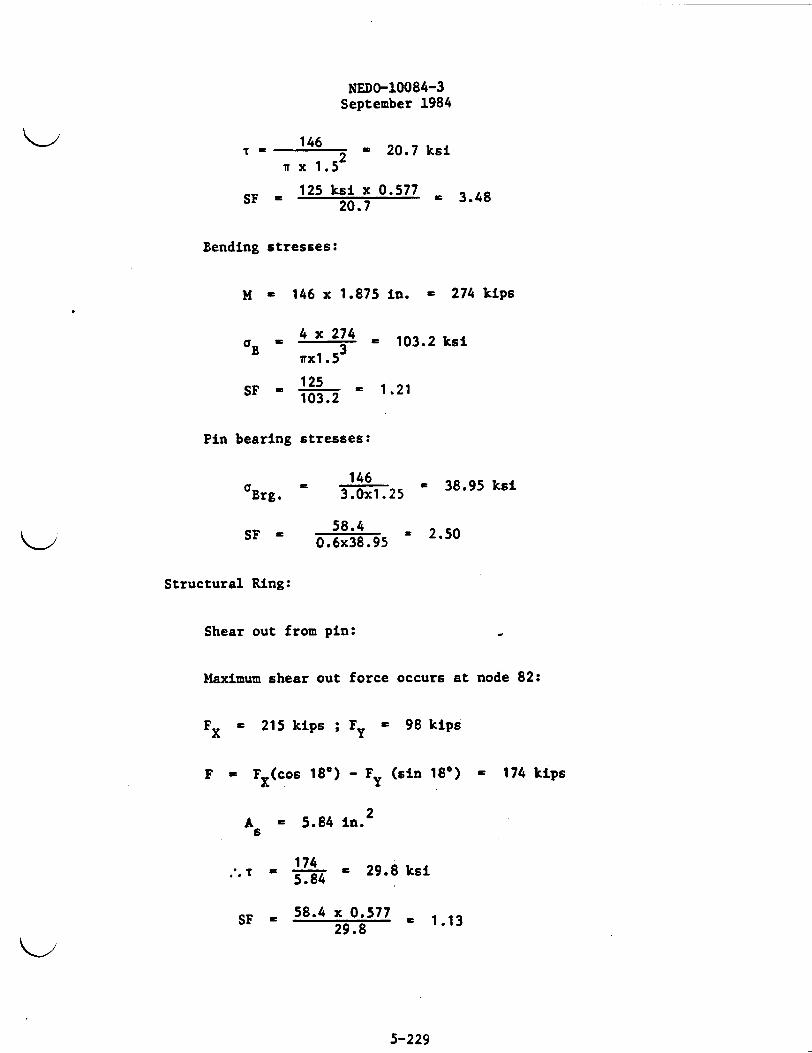
NEDO-10084-3September 1984
= 146 20.7 ksiT X 1.52
SF - 125 ksi x 0.577 3.48SF ~20.7 34
Bending stresses:
M - 146 x 1.875 in. - 274 kips
aB 4.x24 . 103.2 ksiwxl.5 3
SF 1032 ' 1.21
Pin bearing stresses:
aBrg. 314 38.95 ksiBrg. 3.Ox1.25
SF ~58.4 25SF - 0.6x38.95
Structural Ring:
Shear out from pin:
Maximum shear out force occurs at node 82:
FX = 215 kips ; Fy - 98 kips
F - FY(cos 18X) - Fy (sin 18') - 174 kips
A = 5.84 in.25
174= 5.84 = 29.8 ksi
SF . 58.4 x 0.577 , 1.1329.8
5-229
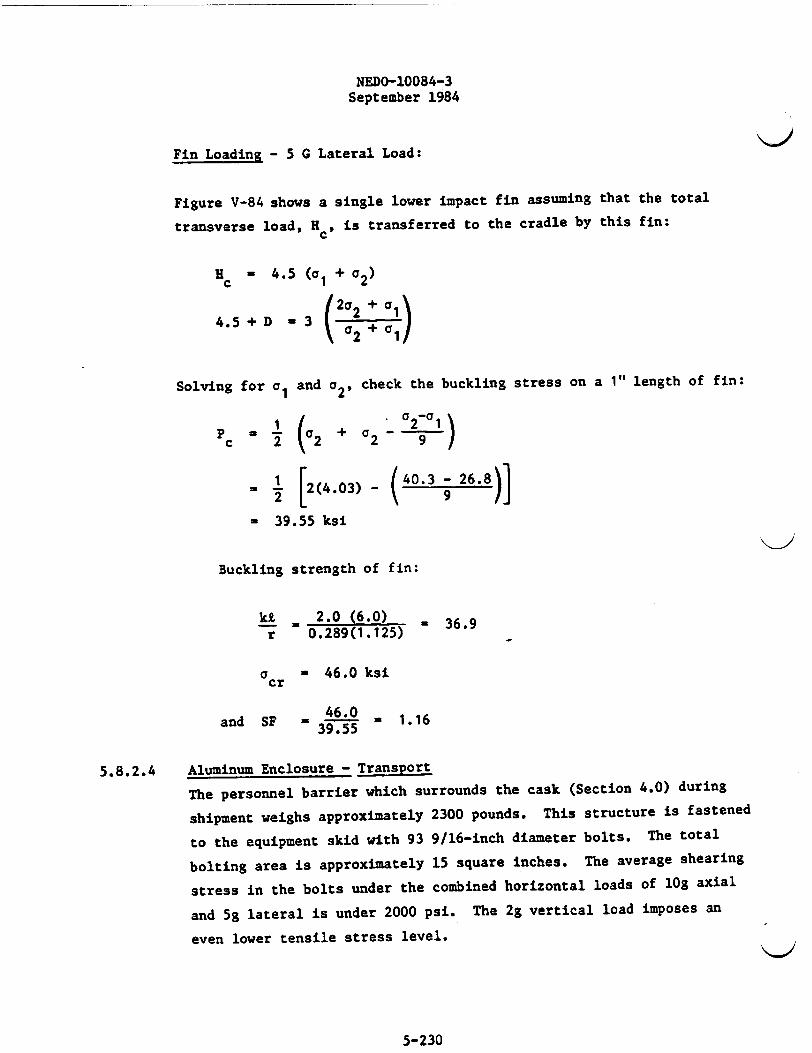
NEDO-10084-3September 1984
Fin Loading - 5 G Lateral Load:
Figure V-84 shows a single lower impact fin assuming that the total
transverse load, H , is transferred to the cradle by this fin:
H ' 4.5 (a1 + 2)
4.5 +D a-31 2 1a3 2 + c1/
Solving for a1and a2' check the buckling stress on a 1" length of fin:
P G2 -al
c 12 (02 + C2 9 )
- .1 [(4.03) - 40.3 - 26.8)]2 [( 9 )
a 39.55 ksi
K>
Buckling strength of fin:
kid 2.0 (6.0) -36.9
r .289(1.125)
a - 46.0 ksicr
and SF - 46 a 1.1639.55
5.8.2.4 Aluminum Enclosure - Transport
The personnel barrier which surrounds the cask (Section 4.0) during
shipment weighs approximately 2300 pounds. This structure is fastened
to the equipment skid with 93 9/16-inch diameter bolts. The total
bolting area is approximately 15 square inches. The average shearing
stress in the bolts under the combined horizontal loads of lOg axial
and 5g lateral is under 2000 psi. The 2g vertical load imposes an
even lower tensile stress level.
5-230
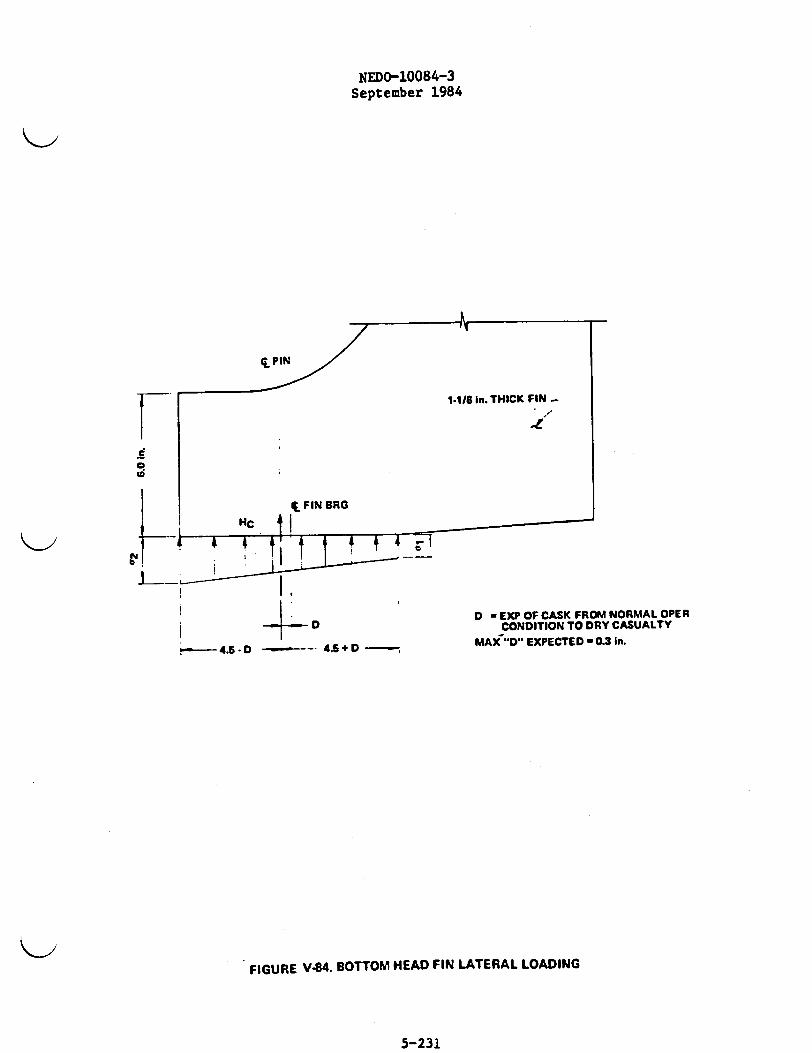
NEDO-10084-3September 1984
!~ I. II
Di t5
PII 4.5 D - -a 4S+D - ,
D - EXP OF CASK FROM NORMAL OPERCONDITION TO DRY CASUALTY
MAX"D EXPECTED -0.3 in.
FIGURE V-84. BOTTOM HEAD FIN LATERAL LOADING
5-231
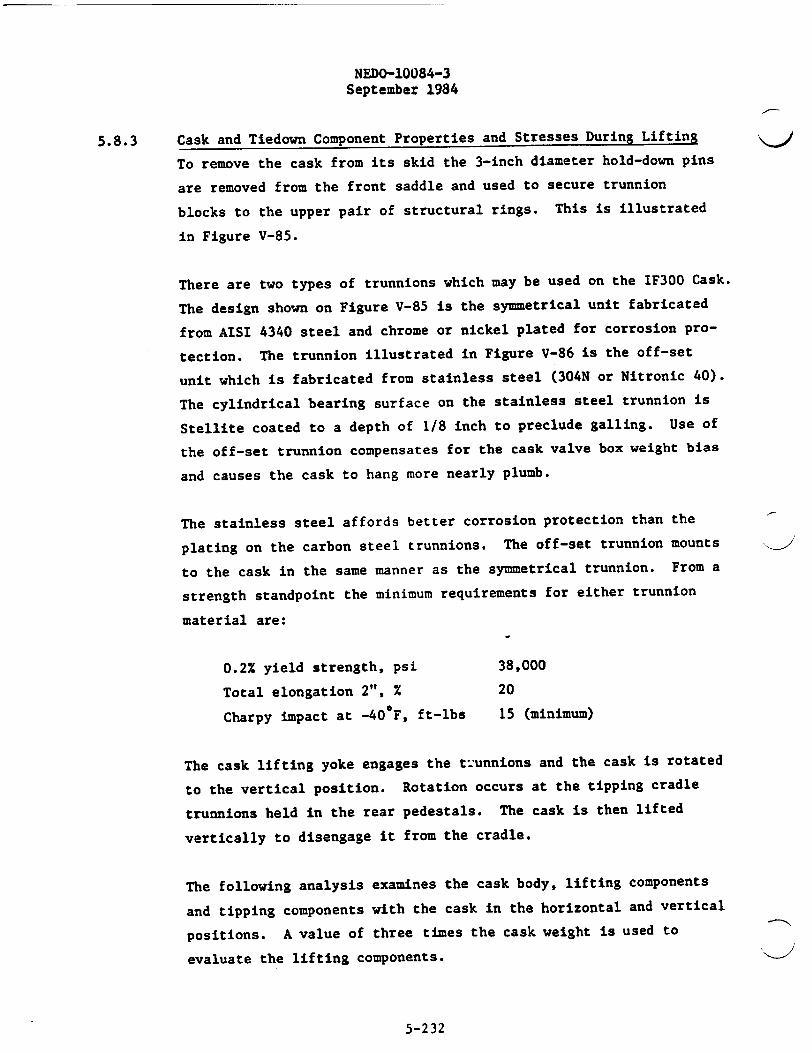
NEDO-10084-3September 1984
5.8.3 Cask and Tiedown Component Properties and Stresses During Lifting
To remove the cask from its skid the 3-inch diameter hold-down pins
are removed from the front saddle and used to secure trunnion
blocks to the upper pair of structural rings. This is illustrated
in Figure V-85.
There are two types of trunnions which may be used on the IF300 Cask.
The design shown on Figure V-85 is the symmetrical unit fabricated
from AISI 4340 steel and chrome or nickel plated for corrosion pro-
tection. The trunnion illustrated in Figure V-86 is the off-set
unit which is fabricated from stainless steel (304N or Nitronic 40).
The cylindrical bearing surface on the stainless steel trunnion is
Stellite coated to a depth of 1/8 inch to preclude galling. Use of
the off-set trunnion compensates for the cask valve box weight bias
and causes the cask to hang more nearly plumb.
The stainless steel affords better corrosion protection than the
plating on the carbon steel trunnions. The off-set trunnion mounts
to the cask in the same manner as the symmetrical trunnion. From a
strength standpoint the minimum requirements for either trunnion
material are:
0.2% yield strength, psi 38,000
Total elongation 2", % 20
Charpy impact at -40 F, ft-lbs 15 (minimum)
The cask lifting yoke engages the t-:unnions and the cask is rotated
to the vertical position. Rotation occurs at the tipping cradle
trunnions held in the rear pedestals. The cask is then lifted
vertically to disengage it from the cradle.
The following analysis examines the cask body, lifting components
and tipping components with the cask in the horizontal and vertical
positions. A value of three times the cask weight is used to
evaluate the lifting components.
5-2 32

C
;I
1 134.0 in.
4.0 in.
I
44
lN pH I PAtSI 4340
B
-URANIUM SHIELD l 0
5-1/2 in 0PIN %c I/'c'CD
TIGHT -SLIP-FIT' MACHINED FIT-iBLOCK TO SHELLDRILL AND REAM WITH BLOCK SECTION A-ACLAMPED IN PLACE
2.5 In.
2.5 ii.
3.5 h
3.5 In.
14 0.5 in.Sin.
SECTION B3BFIGURE V-85. CASK LIFTING BLOCK AND PIN

-4 tjl7 -
-- 14.162
Ad o
0 L
FIGURE V-86. OFF SET BLOCK
C ( C
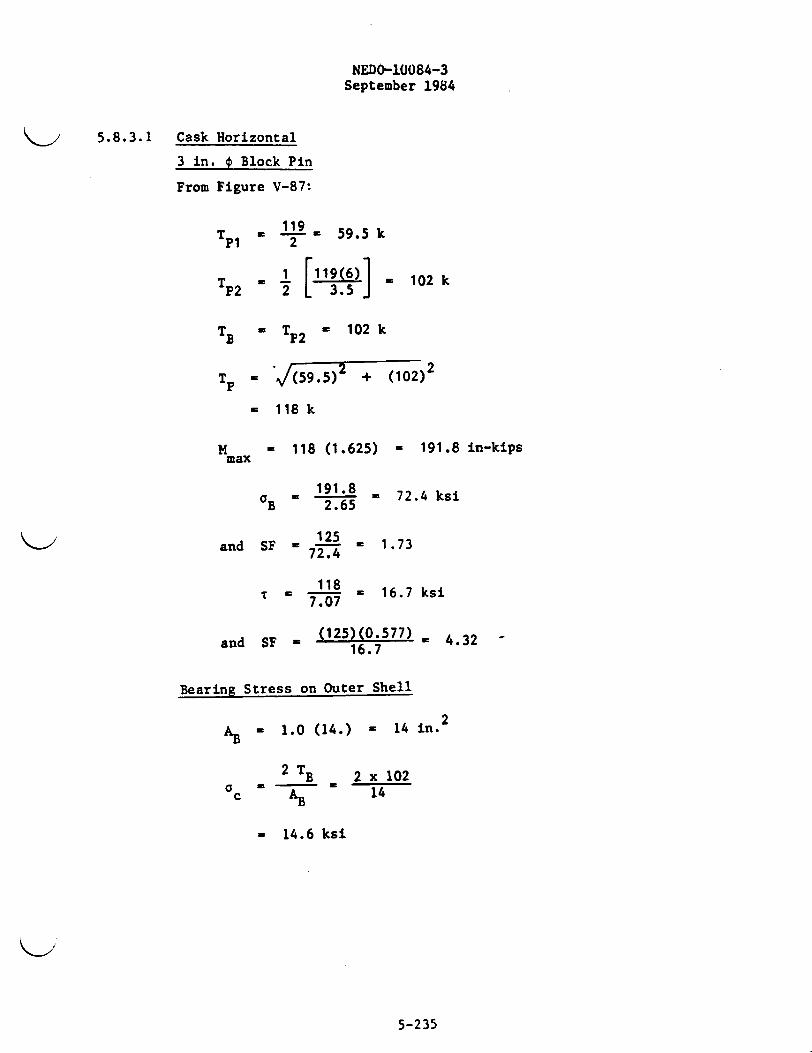
NED0-10084-3September 1984
5.8.3.1 Cask Horizontal
3 in. * Block PinFrom Figure V-87:
T 119 59.5 kPi 2
T 119(6 102 kP2 2 3.5]e10
TB TP2 = 102k
T = * (59.5) + (102)2
- 118 k
K x 118 (1.625) - 191.8 in-kipsmax
B 12.965 72.4 ksi
and SF = 125 - 1.7372.4
L 1 = 16.7 ksi
and SF - (125)(0.577) . 4.3216.7
Bearing Stress on Outer Shell
AB 1.0 (14.) = 14 in.2
2 TB 2 x 10²
ac A 14
=14.6 ksi
5-235
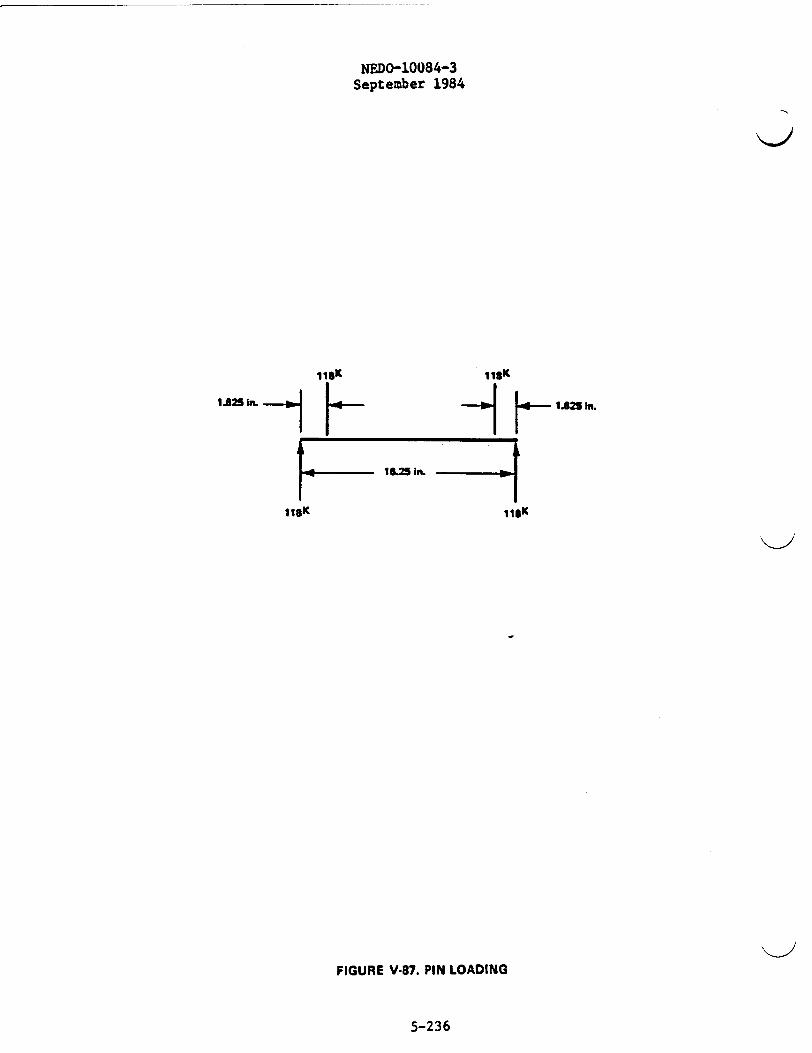
NEDO-10084-3September 1984
1 1 8 K 1 1K
1.825 l. --- _ i e 125 In.
16.25 in.
118K 1IS1C
FIGURE V-87. PIN LOADING
5-236
NEDO-10084-3September 1984
Assume: (a) - 79 ksic all: 0.6
SF 7 9L 6 5.4114.6
Stresses in Ring
Check shear stresses:
A = 5.84 in.2
102 - 17.5ksi5.84
S - 58.4 (0.577) 1.9217.5
Check bearing stresses:
118c (3.0)(1.25) 31.5 ksi
and SF - 3.131.5
Stresses in Outer Shell and Uranium
The structural model previously used for the tiedown analysis was rerun
with the loading scheme shown in Figure V-88.
The computer analysis provided the deflection profile shown in Figure
V-89. As before, the negligible interference of the shells demonstrates
compatibility of the model.
Stainless steel ring stresses are:
Maximum stress at node 26:
M - 196. in-k (tension on outside)
P - 37.0 k (tension)
5-237
NEDo-10084-3September 1984
y
STEEL RING1hiS SIN * KIU (TANGENTIAL SHEAR)
LINKS INDICATE ASSUMED POINTSOf CONTACT BETWEEN RINGS
EMERS 2-1.17-13,4142. AND 464)
1 0 2 K
. -. 1 x
URANIUM RING
4-
4'
FIGURE V-88. LIFT WITH CASK IN HORIZONTAL POSITION
5-2 38
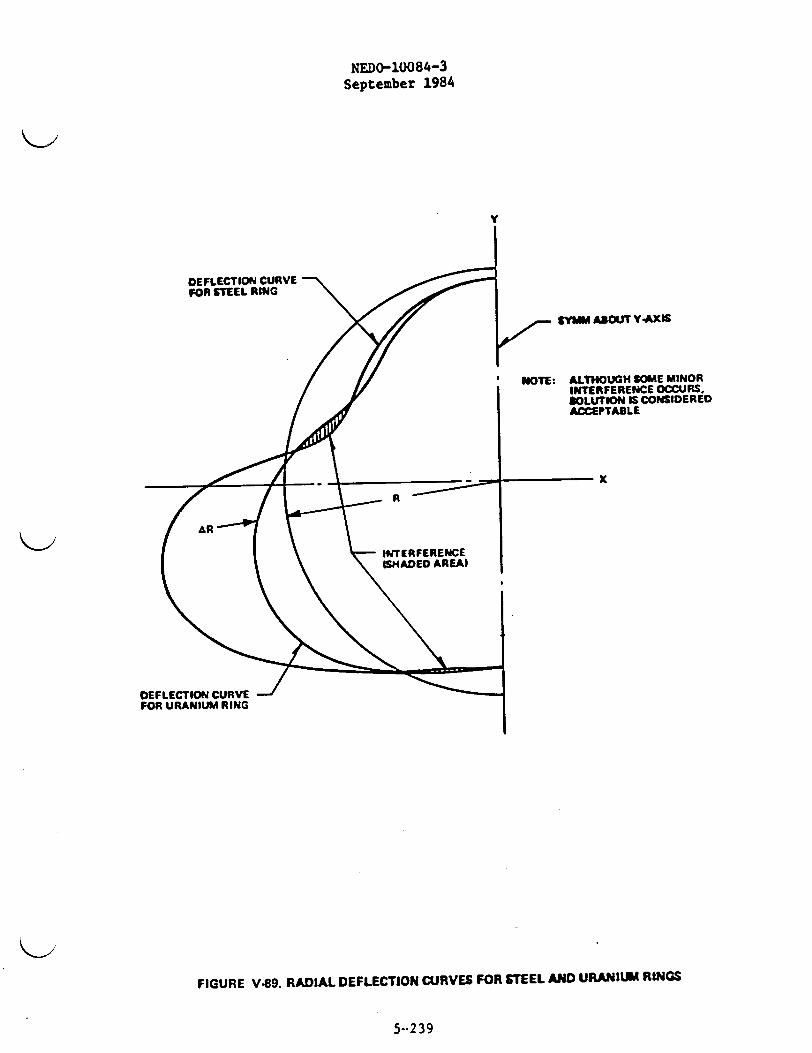
NEDO-10084-3September 1984
DEFLECTION CURVEFOR STEEL RING
nymm ASOUT YAXIS
INOTE: ALTOUGH SOME MINOR
INTERFERENCE OCCURS.SOLUTION IS CONSIDEREDACCEPTABLE
____ ____ ___ x
_ R
INTERFERENCEISNADED AREA)
DEFLECTION CURVEFOR URANIUM RING
FIGURE V.89. RADIAL DEFLECTION CURVES FOR STEEL AND URANIUM RINGS
5-*239
NEDO-10084-3September 1984
T S A
S - 15.6 in.3; A - 21.88 in.2min
= (19.6)(12) + 37.015.6 21.88
a 15.1 + 1.7 - 16.8 ksi
SF - 5 -4 ' 3.516.8
Uranium ring stresses are:
Maximum stress is at node 17:
M - 2.9 in-k (tension on inside)
P = 4.11 k (compression)
a 2.9 (12) + 4.11T 53.35 80
- 0.65 + 0.05 - 0.70 ksi
SF 30 - 42.90.70
5.8.3.2 Cask Vertical
Tipping Cradle
The tipping cradle cross-section
shows the reaction at the cradle
is shown in Figure V-78. Figure V-90
pivot.
Analyzing the beam action of the 1 in. rib plates:
To - 6.5 (1.5 W) - 1365 in-kips - torque on X-section
T0
'a 2_itA 'a1365)(4)(23
2(1)(4)(23) - 74 s
VI - TA - 7.42 x 4 - 29.68k
5-240
NEDO-10084- 3
September 1984
V TA 1.5 W2 2 2
- 7.42 x 23 - 105 - 65.5 k
V ' TA + 1.5 w3 3 3
= 7.42 x 23 + 105 - 275.5 k
Mm a 13.5 V1
- 13.5 x 29.68 - 401 in-kips
I of section - 100.25 in.4
401 x 2.5 1O.ksi0bending 100.25
and SF - 38-o - 3.8
Analyzing pivot pin stresses:
Figure V-91 below details the loading on one of the cradle pivot
pins:
Pin bending:
W = 140 k
M x 4.25 (1.5 W) - 893 in.-k
4M 4 x 893a = - -B R3 W. 3
- 26.5 ksi
and SF - 38.0 - 1.4326.5
5-241

NEDO-10084-3September 1984
ASBMED FLO WIDTH IN SAMACTION WITH I hi. I RIBS
A rro 31lI, MM
W - 140 MREP. FIG. 4£.1
SECTION 3-8VIEW A-A
FIGURE V-90. CRADLE SECTION<-IJ
I hi.
RI
........ l_.. M
415i. 4.5 i.
R2
FIGURE V.91. PIVOT PIN LOADING
NEDO-10084-3September 1984
Pin bearing:
Solving for reactions Ri and R2:
R1 - 8.5 (1.5 YI - 420 k41 4.25
R1 - RI -1.5 W - 210 k
then aBrgR1
AB4201. 5x7
40 ksi
and SF - 38.0an 0.6 x 40
Thrust plate weld:
RILoad 1a
3
1.58
140 k
140T AWeld AwW 140
- 10nx0. 375x0.707
- 16.8 ksi
and SF -38.0 x 0.577
16.81.31
Bearing on thrust plate:
Hc
aBrg = ABRG
H a 302.4 kC
aBrg
and SF
302.4
11(5.0 -3.5 )38.0
0.6x7.55
- 7.55 ksi
8.4
5-243
NEDO-10084-3September 1984
Circular loading of cradle:
Figure V-92 below shows the load applied to the cradle structure with
the cask in place in the vertical position:
Diameter of load circle - 59.0 in.
W - 140 k
W ' 40 ' 2.01 kips/in.66.5 nr
1 - we; e - 3.75 in.
m - 2.01 x 3.75 - 7.54 in.-k/in.
T - 6.50 (1.5 W)
- 6.50 x 210 - 1365 in-k
Using Reference 7:
T sine 2 7sno - 2 -wR (1.0 -- 2 ) + mR
(Max. at 8 I-)
- 2203 in.-kips
Using Table V-36 properties:
a 22031x 12.16 . 8.58 ksi
and SF P 38.0 - 4.438.58
Also:
T Cose 2T - 0 + wR (a + 1.5708 Cose - 1.5708)
8 2
dTT is max. when a,0 0e.d
T sine- 0° + wR2 (1-1.5708 Sine) - 0
5-244
NEDO-10084-3September 1984
Solving for Sine:
Sine - T wR2
° + 1.5708 wR2
- 0.532
e - 32.14e
Cose - 0.847
Then:
T = 1296 in-kips
and
To
T 2t8 7.05 ksia~ 2tA
V 3 2 . 14 . 90 (0.75 w) 67.5 k
V 67-5 1.8 ksi
SF = 38.0 (0.577) - 2.66(7.05 + 1.18)
Check on local bending in support lugs:
Figure V-93 is a detail of the lugs upon which the cask rests when
in the vertical position.
M = 26.25 x 1.75max
- 46 in-k
S 6 SX1'° . 1.333 in.3
5-245

NEDO-10084-3February 1985
Il5 ln.ITYPI
FIGURE V-92. VERTICAL LOADING OF PIVOT CRADLE CASK IN VERTICAL POSITION
.
,orALL I I hI. THICK
16 SL MRT LUoS x LS K6 WIDE
I1- 2 It
FIGURE V-93. SUPPORT LUGS
5-246
NEDO-10084-3September 1984
a ~46 3. s1.333
and SF 38-0 1.10
Cask Body and Trunnions
Section BB of Figure V-85 shows the trunnion loading with the cask
in the vertical position.
3 x 140P -=21O0k
V 2
Check trunnion pin stresses:
M14 2.5 Pv W 525 in-k~max
3 3S - 0.7854 x 2.753 - 16.3 in.
aB 525 - 32.2 ksi
aB 16.3
and SF = 38 2 1.1832.2
22A - rx 2.75 , 23.8 in.2
T 210 . 8.83 ksi23.8
and SF , 38.0 (0.577) . 2.488.83
Check 3 in. * block pin stresses for the symmetrical trunnion.
Figure V-94 shows the load on one of the pins.
Let: TP - Load on Pin
T = Bearing load on shellB
T =T W (210)(9.25) 14.kB P 13.0142k
5-2 47
NEDO-10084-3September 1984
M - 134.3 k (1.625) - 218 in-kmax
33S - 0.7854 (1.5) - 2.65 in.3
aB 218 = 82.3 ksi
and SF - 125 - 1.5282.3
A - (1.5)2 , 7.07 in.2
T ' 134.3 - 19.0 ksi7.07
and SF , 125(0-577) - 3.8019.0
Check bearing on outer shell:
AB ' 1.0(8.0) - 8.0 in.2
TB 149.2c AB 8.0
- 18.65 ksi
(a)ii 06= 79.0 ksi
79.0and SF 4.23
18.65
Check stresses in ring:
Figure V-95 below is a section of one structural ring.
b1 = 0.78 E
- 0.78 T(24.0)(1.5)
- 4.68 in. (use 5.0 in.)
5-248
NEDO-10084-3September 1984
b - 1.25 + 2(5.0) - 11.25 in.
- 16.88 (0.75) + 8.75 (5.0) = 2.2 in.= 25.63
I ' -, [(1.25) (7.0)3 + (11.25) (1.5) ]
+ 16.88 (1.45)2 + 8.75 (2.8)2
- 143 in. 4
A - 25.63 in.2
Shear:
Figure V-96 below is a view of the 3 in. * pin hole(Reference 22, Page 291)
Let *- Sin 1 [1.5 sin 40]
- 1 - 44.4-1
cos 0 - 0.99954
L - 31.75 cos * - (28.25 + 1.5 cos 40*)
- 2.336 in.
A - 2 Lt = 2(2.336) (1.25) - 5.84 in.2
134.3 23.0 ksi5.84 - 23.0 ksi
and SF 58.4 (0.577) 1.4723.0
5-249
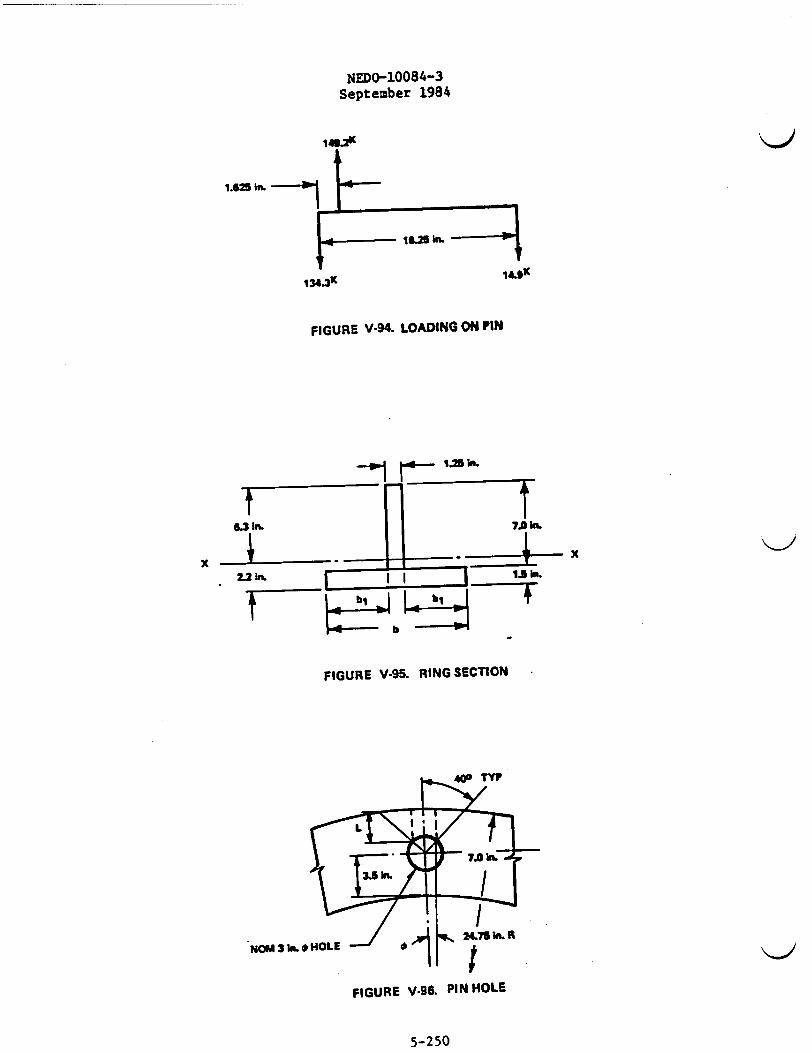
NEDo-10084-3September 1984
1G. N
1.625 in.
- II in
134.3K 14.6
FIGURE V-94. LOADING ON PIN
x
FIGURE V-95. RING SECTION
NOM2 3 I 0 HOLE
IGIFIGURE V.96. PIN HOLE
5-250
NEDO-10084-3September 1984
Bearing:
a 134.3 - 35.8 ksi= (3.0)(1.25)
=58.4 =9. s(ac)all. 0.6 97.3 ksi
and SF 97-38 ' 2.72
3" Block Pin stresses for the off-set trunnion.
The one (1) inch off-set of the lifting trunnion relative to the
3" pin iL produces a moment equal to 210,000 in-lbs (assuming 3W
for conservatism). This moment is resisted by the 3" dia pin react-
ing against the trunnion block and the upper pair of structural rings.
The direction of the off-set moment, and the reacting forces, is
normal to the moment and forces produced in lifting the cask with
the symmetrical trunnion as shown above.
Figure V-97 shows the forces on the 3" dia trunnion pin. Forces in
the X-X direction are due to the 1" off-set, those in the Y-Y are
due to cask lifting (see Figure V-94).
The new pin stresses as a result of the off-set can be determined by
examining the resultant of the two normal forces. Following the
method for the symmetrical trunnion:
2 2 1/2TB 0 T - [ (149.2-) + (1 6 .1 5 ) 150.1
k2 2 1/2Mmax * [ (134.3-) + (12.92=) ] (1.625")
k- (134.9-) (1.625") -219.2 in-k
5-251
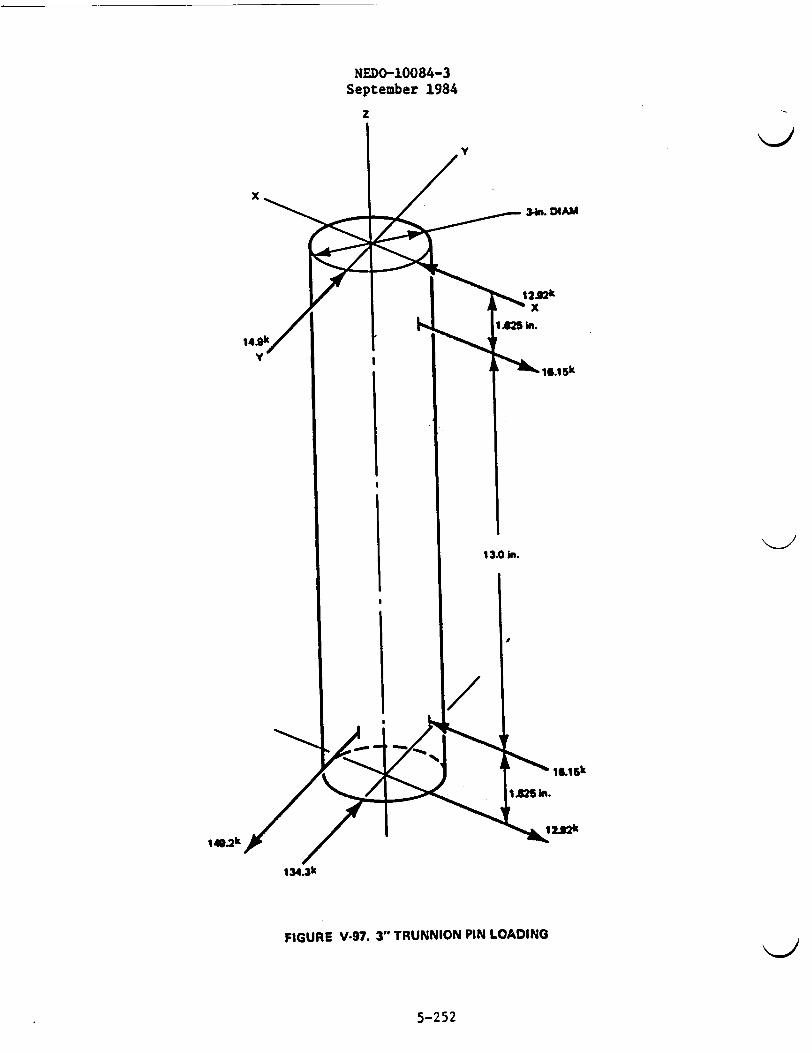
NEDO-10084-3September 1984
z
,40.2k
134.3k
FIGURE V-97. 3" TRUNNION PIN LOADING
5-252

NEDO-10084-3September 1984
And for the 3" pin
MB S
a19.2
219.2 = 82.72 ksi2.65
125 1.51SF 82.72
Considering shear
134.'1- 19.1 ksi- 7.07 1. s
S (125) (0.577) . 3.78
Comparing the above results with those for the symmetrical trunnion,
it can be seen that the one-inch trunnion off-set has an insignifi-
cant affect on the 3" trunnion pin stresses.
Check bearing stress between lifting block and structural ring:
- V 210 -5. sc A (0.5) (8.0) ' 52.5 ksi
and SF = 9573 = 1.85
Check stresses in outer shell and uranium:
Figure V-98 shows a cross-section of the two lifting rings and the
underlying uranium segments. The section properties of the rings
are shown in a previous section. The uranium section properties
are:
A = 20(4) = 80 in.2
1 (2 3I - T (20) (4) 106.7 in.4
5-253
G. LIFTING ASSEMBLYI
,8.125 in. 8.125 in.
--I
URANIUM RINGS
20 in. ,20 in. 20 in.
ASSUME 2 URANIUM RINGS ACT TO RESIST DEFORMATIONS OFTHE OUTER SHELL STRUCTURAL
FIGURE V-98. CASK LIFTING RINGS
(,K C I

NEDO-10084-3i, September 1984
S W 106.7 53.35 in.3S 12
E - 24 x 103 ksi
The previously described computer model was run with the appropriate
section properties and the loading shown in Figure V-99.
As in the previous models, the deflections of the two rings were
co-plotted. The insignificant amount of interference demonstrates
the compatibility of the model. The co-plotted results are shown
on Figure V-100.
Checking on stainless steel ring stresses:
M4ax stress is at Node 26
M - 65.02 in.-k (tension on outside)
P - 44.11 k (tension)
Figure V-101 below is the ring section at Node 26.
A - 4.0 (1.25) + 1.5 (11.25) - 21.875 in.2
y = (2.5)(7.5 + 2.5) + 16.875 (0.075)21.875
- 1.72 in.
2 1_25 (0.7 ] + 11.25 (1.5) + 2.5 (5.78)I 1125 12
2 24+ 2.5 (0.78) + 16.875 (0.97) - 105.74 in.4
s 1.74 ' 15.6 in.3min 6.78
= 0574= 61.5 in.3max 1.72
5-255
NEDO-10084-3September 1984
y
I- 4
aTL RING
.LINKtS INDICATE AWJED POINTSOF CONTACT BETWEEN RINGS
-x
URANIUM RING .,
I
/
I
I
FIGURE V.99. LIFT WITH CASK IN VERTICAL POSITIONK-/,
5-256
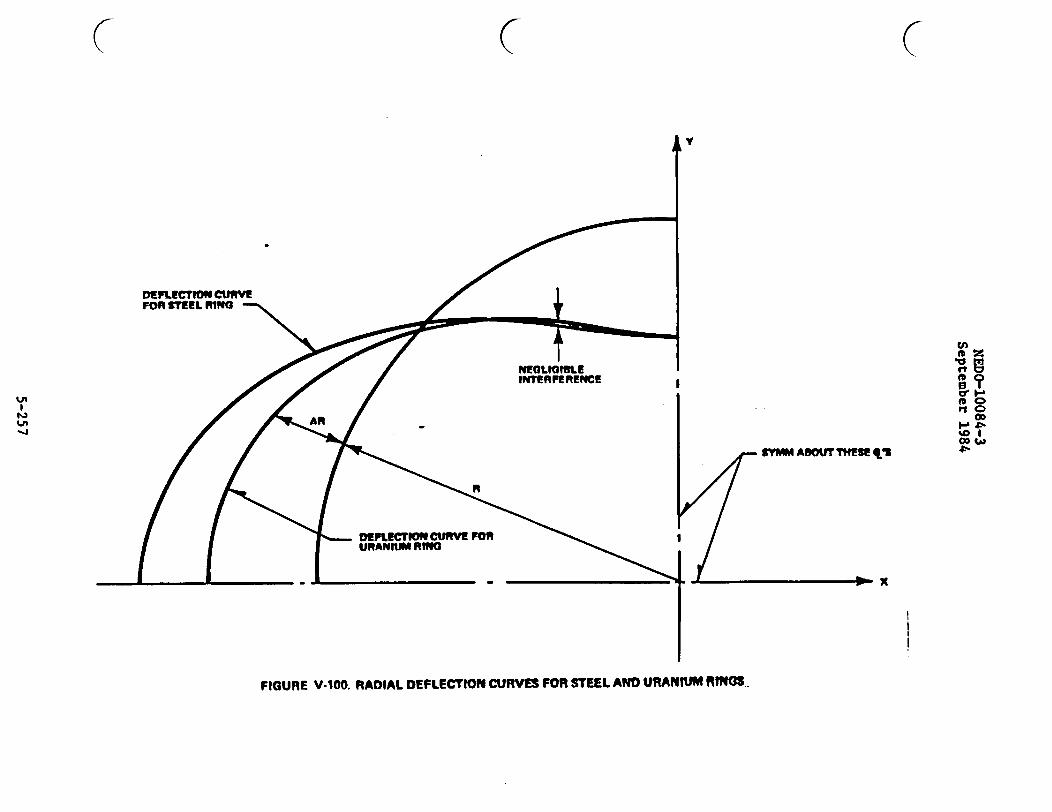
C (
Y
DEFLECTION CuRmFOR "EEL RING -
NEOLMOt3LEINTERFERENCE
l
cnm Af lt* 0
m o1 0
o,o0 Ico4Ai
BYMM Adff WINE 63
R
MPLECTION CURVE FORURAN^" RanE
I
FIGURE V-100. RADIAL DEFLECTION CURVES FOR STEEL AND URANIUM RNM.

NEDO-10084-3September 1984
172S hoL
2.0 In.
2. LOX ~ . -- .xIi~ hi.
1tM In.
FIGURE V-101. PIN HOLE SECTION
5-258
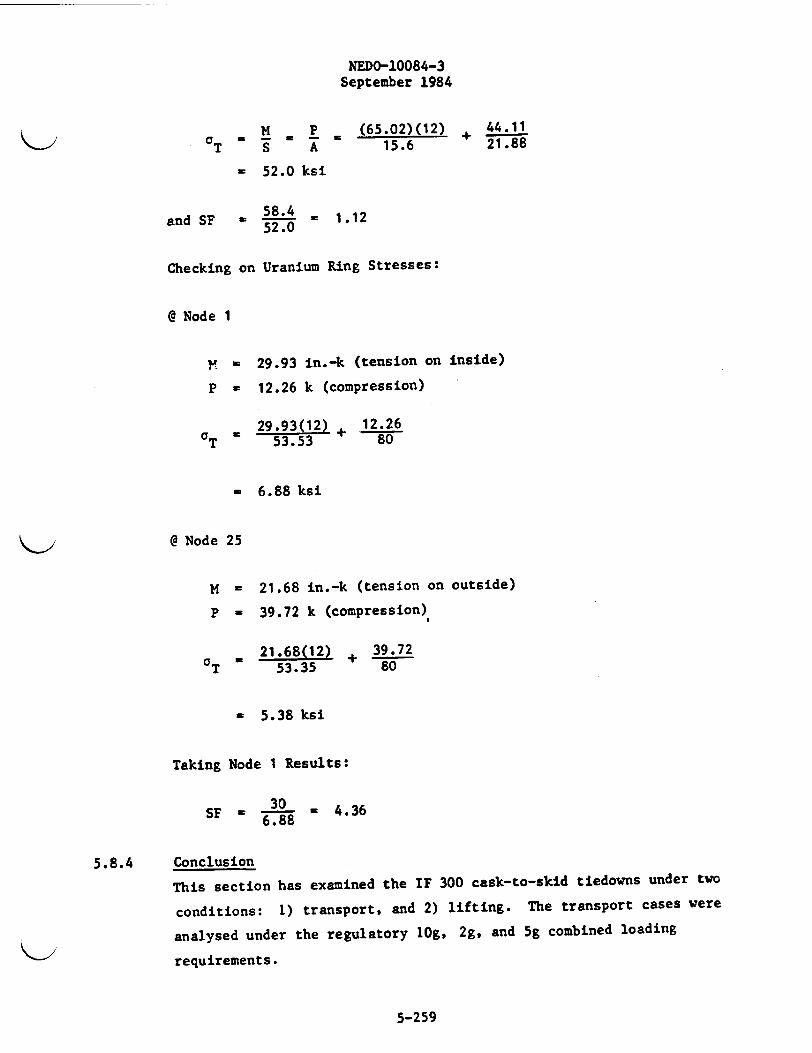
NEDO-10084-3September 1984
M P ,(65.02)(12) + 44.11a ~15.6 21.88
W 52.0 ksi
and SF W 58-4 - 1.1252.0
Checking on Uranium Ring Stresses:
@ Node 1
- 29.93 in.-k (tension on inside)
P - 12.26 k (compression)
29.93(12) 12.26aT ' 53.53 + 80
- 6.88 ksi
@ Node 25
M = 21.68 in.-k (tension on outside)
P - 39.72 k (compression)
21.68(12) + 39.72T 53.35 80
- 5.38 ksi
Taking Node 1 Results:
SF 30 4.366.88
5.8.4 Conclusion
This section has examined the IF 300 cask-to-skid tiedowns under two
conditions: 1) transport, and 2) lifting. The transport cases were
analysed under the regulatory lOg, 2g, and 5g combined loading
requirements.
5-259

NEDO-10084-3September 1984
The lifting cases were evaluated at 3 times the cask weight, againin compliance with regulations. In all cases, no component safety
factor (SF) was less than unity based on the yield strength of the
material.
5.9 ENGAGEMENT OF CASK AND TIEDOWNS
When the cask is lowered over the support saddle (Figure V-102), itmoves forward out of the pivot cradle to allow for thermal expansion
during shipment due to operating and loss-of-coolant conditions. Inorder for this movement to take place without over-stressing thebottom head fins, saddle ring and saddle lug, the bearing surfaces
at the pivot cradle will be coated with lubricant to reduce the coeffi-
cient of friction. In order to assure a conservative analysis, thecoefficient of friction will be assumed as 0.2 for the pivot cradle
and support shoe surfaces and 0.6 for the saddle and lifting ring
surfaces. The following equations can be written by the summation offorces 0 from statics:
R (sine + u cose) + R(cose - usinB) + P1 a W
R1 (U1sine - cosO) + R(sin8 + pcose) - 0
R (78.125v + 8.6 sece + 171.25 tan. -3) + R(3p - 93.125)
+ 70.625 P1 cos e - 0
solving the conservative case of a - 6°, u - 0.2 and -, ' 0.6
for R, R1, P1 and uR the saddle ring stress is:
Ma .dc - 7.03 ksiBed ending I
and the saddle lug bending stress is:
5-260
( C
- - --- 97.625 In.-- .
I---24.75 h.
24.75 In.
I 1- .
UC
soco
%o I
* - -, - - --- 3.125 - 33.75 p
FIGURE V.102. FREE-BODY DIAGRAM SHOWING FORCES ON CASK UPON ENGAGEMENT WITH SADDLE I
NEDO-10084-3September 1984
Ma I - 19.1 ksi
The maximum bearing stress at the pivot cradle support shoe
(Figure V-103) is conservatively calculated as:
aBrg = 12.15 ksi
where AB - 4 in. 2/in.
5.10 CORRUGATED EXTERIOR WATER CONTAINMENT
The corrugated cylindrical vessel which surrounds the IF-300 cask
exterior is designed to contain a liquid neutron shielding medium.
This containment is corrugated to increase the heat transfer area
of the cask exterior. These corrugations also strengthen the
structure from the effects of internal pressure. The containment
is subject to internal pressure and is equipped with pressure relief
valves. Filling and draining of the neutron shielding cavities is
accomplished through ports normally sealed by pipe plug, blind flange,
or valve.
Under normal cooling conditions the internal pressure is only 5 psig.
However, under conditions where the cooling system is inoperative
the pressure may increase to 157 psig. The containment is designed
to have a working pressure of 200 psig. The relief valve setting
is 200 psig.
The corrugation configuration is shown in Figure V-104. The structure
is comprised of two complete cylinders supported at the ends by
heavy structural rings (see Section IV). The material is ASTM A240
Type 304 stainless steel, having a nominal thickness of 1/8 inch.
Each cylindrical section has its own vent, drain and pressure relief
valve system.
5-262

( C
SHPG AND EXP CLEARANCE -7
EXTEND 3 BITM FINS TO THIS DIMENAND NOTCH TO RECEIVE SHOE tALL OTHER FINS SAME
FINISH ON SHOE AND450 X 18.0 in. AREA OFCRADLE INSIDE SURFACE
ADD 3 -1 in. t RIBSTO CRADLE
AREA TREATED WITH MOLYKOTE M W00
13.5 in. t - 8.0 in.r15 in. £-1ir-_
OUTLINEOF CASK
KA
//
IIiI,I
tn
f 00 Zla IOw
.. 1..'(A ~
12/ZS I t,, s i,,, 77"l -- / f11 //k~
I I_0 A
_,. - t.0. in. .LGTH OF SHOE.
309 WIDTH OF SHOE
/450
SECTION A-A SECTION B4B
FIGURE V-103. LOWER END OF CASK AT CRADLE SHOWING SUPPORT SHOE
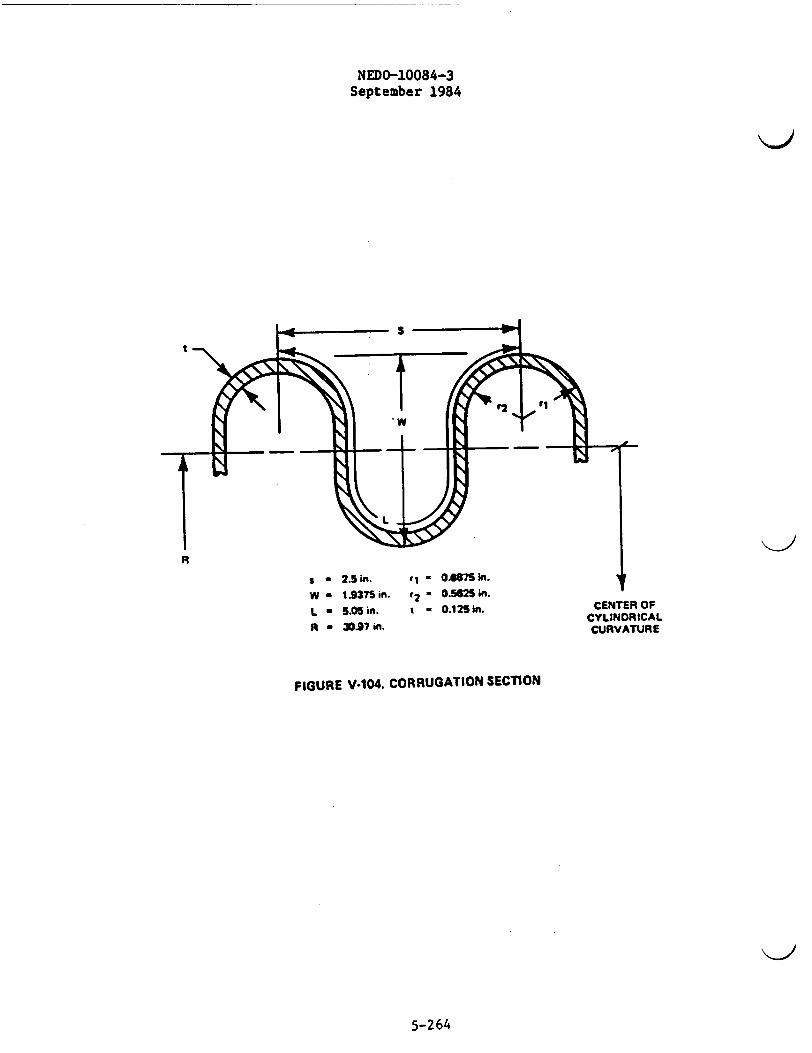
NEDO-10084-3September 1984
S
t
<-I,
R
* - 2.S in.
W - 19375 in.L - 5.05 in.
R - 3097 in.
ri - 065M in.
' 2 - 0.5625 in.t * 0.125in. CENTER OF
CYLINDRICALCURVATURE
FIGURE V.104. CORRUGATION SECTION
5-264
NEDO-10084-3September 1984
C 5.10.1 Analysis
The following development describes the stresses in the corrugated
containment under 200 psig internal pressure and 350'F conditions
(see Figure V-104).
5.10.1.1 Bulging Stress:
[a][ I ]P ] (Ref. 23)
where:
P
D0
Di
t.P
- Initial design pressure
- Number of plys
- Bellows outside diameter
- Bellows inside diameter
- Wall thickness
[2001 [63.875-60.01C 8x1 0.125 L
= 24,025 psi
From International Nickel Company for 304 stainless steel at 375°F,
ayield - 29,500 psi
SF - 29500 = 1.23
24025
5.10.1.2 Hoop Stress:-
P D0 (L + ME)a H = NE (Ref. 23)
where:
P
D0
- Internal pressure
= Bellows-outside diameter
5-265

NEDO-10084-3September 1984
N - No. of convolutions
LD - Developed length of one convolution
tP = Wall thickness
Np = Number of plys
Ej = Longitudinal weld joint efficiency
L - Free length of bellows
ME Movement of bellows in extension beyond free length.
H (200) (63.875) (180 + 0) 25,297 psiH (2)(72)(5.05)(0.125)(1) (1.0)
SF 29500 1.1725297 .1
5.10.2 Containment Reliability
This corrugated structure has been designed and analyzed following
the well-defined practices of expansion joint fabricators. Struc-
tures of this type are used in countless applications under high
temperature and pressure conditions. Their reliability and rugged-
ness are well known in the power generation, chemical processing
and aerospace industries. The manufacturing process used to form
these items have been thoroughly proven over many years.
Stresses generated in the external shielding containment structure under
normally encountered transportation and handling loads are only a fraction
of those experienced under the conditions above.
"Sloshing" of the shielding liquid is prevented by a number of baffles
within the containment. Even a sudden stop, such as encountered in
railroad coupling, could not result in significant (> 200 psig) impact-
induced pressures, due to this baffling.
5.10.3 30-Foot Drop (Barrel)
The cask has been analyzed in Section 5.4.6 for the effects of a 30-foot
free drop as required by federal regulation. The total kinetic energy6
of the falling cask is 4.2 x 10 foot-pounds. This energy is absorbed
by the bending of heavy steel structures, both on the cask ends and
sides.
5-266

NEDO-10084-3September 1984
In the case of the side drop, the presence of the thin-walled (0.125 in.)
external water containment has no effect in dissipating the cask kinetic
energy. The relative metal thickness and the lack of continuous support
at the base of the corrugations act to assure that the impact-energy
absorbing capability of this thin-walled structure is but a small
fraction of that provided by the circumferential rings and fins. Upon
impact the outer jacket is assumed to perforate and crumple. The water
will be vented; however, the structure will still remain in place
around the cask.
5.10.4 Conclusion
The above analyses have demonstrated the ability of the corrugated
containment to sustain internal pressures of 200 psig without
exceeding yield strength. It has also been shown that the corrugated
structure will not materially contribute to the 30-foot drop energy
dissipation. This light weight, rugged structure is ideally suited
as an external liquid shielding containment.
5-267

NEDO-10084-3September 1984
5.11 CASK RELIABILITY UNDER NORMAL CONDITIONS OF TRANSPORT
5.11.1 Introduction
Subsection 5.4 includes analyses of the cask for stresses and vibra-
tions under normal conditions of transport as defined in 10 CFR 71.
This subsection discusses the reliability of the cask components under
what could be termed as a broader category of "normal" transport con-
ditions. The one-foot drop criterion is discussed in this section in
terms of its applicability to large shipping casks. A discussion of
normal conditions of transport not specified in the regulations is also
presented.
The principal bases for preventing any release of radioactivity
and/or significant increase of external radiation are: (1) initial
provision and fabrication of high quality components; (2) inspection
and maintenance to assure proper operability for each shipment, and
(3) redundant systems, where appropriate, to assure that no single
mechanical failure could result in the release of radioactive
materials from the cask for conditions that may occur during transport.
5.11.2 Procedures
Procedures are relied upon to assure that the cask and components as
initially fabricated and installed meet the required quality criteria,
that the cask and components are maintained in good working condition
and that, prior to each use of the loaded cask, the cask and components
are in proper working order and functioning as intended. These
procedures provide a high degree of assurance that there will be no
mechanical failure of components during transit.
5.11.2.1 Fabrication and Acceptance Procedures
The fabrication of the IF 300 cask is in accordance with drawings
and procedures which provide a level of quality assurance comparable
to that required for other nuclear service applications. The pro-
cedures are described in a General Electric Company approved manu-
facturing document which specifies the level of quality control
required and forms the basis upon which the detailed quality assur-
ance program is evaluated.
5-268
NEDO-10084-3February 1985
The specification includes material, fabrication and equipment
specifications. This document, along with the fabrication drawings
forms a package which assures that the cask as fabricated and put
into service has the highest level of quality assurance. In addi-
tion, those items which can be classified as containment are fabri-
cated following a QA plan based on Appendix B of 10 CFR 50.
To provide further quality control, General Electric has an
inspector in the fabricator's shop. General Electric also supple-
ments the resident inspector with periodic audits conducted
by personnel from the San Jose, California and/or Morris, Illinois
facilities.
Prior to acceptance from the fabricator, the IF 300 cask is given
a thermal demonstration test at design basis heat load conditions.
These tests are used to verify the normal operating conditions
described in Section VI. T:e thermal demonstration test sequence
is described in Section VI. Each cask is functionally tested
prior to acceptance by Genera'l Electric.
5.11.2.2 Maintenance and Inspection Procedures
The key to maintaining the initial quality and reliability of a
system such as the IF 300 is periodic inspection and maintenance
of functional areas. In the IF 300 system, these functional areas
include:
a. Corrugated barrel and valving
b. Cavity closure flange and valving
c. Cask tiedown structure
The inspection and maintenance plan is discussed in Section X.
5-269
NEDO-10084-4March 1995
5.11.2.3 In-use Procedures
Section X discusses the activities which are performed prior to
cask usage. A detailed operating manual exists and is
periodically updated with emphasis on proper operation of the
items listed in Section 5.11.2.2
For VECTRA-owned casks, VECTRA provides training to all
individuals involved in the IF-300 handling operation. VECTRA
conducts periodic audits on the condition of the equipment, to
assure proper handling. Administrative controls such as sign-off
sheets and similar documentation are used to confirm equipment
functioning.
Specifically, these procedures require that prior to release to a
carrier, the cask and components: (1) are operating properly; (2)
temperatures and pressures are within limits for normal operation,
and; (3) radiation and contamination levels are within limits.
Further, where transshipments are performed, at the time of
release to a railroad, the procedures will require that: (1) the
mechanical cooling system, if desired, is operating properly, and
(2) no package damage has been sustained since leaving the reactor
site. These two criteria will assure that there has been no
inadvertent damage during the over-the-road portion of the
transport. It should be noted that no single failure of a
component, including failure due to vandalism, will result in any
release of radioactive material to the environment, and that the
cooling system is not required for the safe use of the cask.
5.11.3 One-Foot Dron
The regulations include a one-foot drop as part of the conditions
of normal transport. Since the IF-300 cask is transported solely
in a horizontal orientation, only an analysis of the package (cask
and skid) dropped one foot in horizontal orientation is necessary
to satisfy the intent of the regulations.
5-270
NEDO-10084-3September 1984
5.11.3.1 1-Foot Drop Analysis - Package
This analysis examines the cask front support, rear support, skid
framing, corrugated neutron shielding barrel, barrel water expansion
tanks, and the contained fuel rods under one-foot drop conditions.
The cask body, cask support, skid framing, and fuel rod were modeled
using a spring-mass system (for detailed description of program
derivation, see Section 5.6.5 fuel and behavior under 30-foot drop
conditions). The barrel was evaluated on a strain-energy basis, and
the expansion tanks were examined under the static application of the
peak cask deceleration. These calculations demonstrate that all of
these components are capable of sustaining this loading without losing
package effectiveness. On the cask outer shell some outer fiber strains
are slightly in excess of the strain value used to define the yield
point (0.002). However, an examination of the outer shell wall cross-
section shows this strain to be so small as to be immeasureable.
The shear strain in the cask cradle tipping trunnions is somewhat
greater than the yield value. However, the only function of these
components during shipping is to resist the 2 g vertical force at the
lower end of the cask. The trunnions are more than capable of providing
this restraint following the one-foot drop. The indication that some
slight yielding occurred in the skid is somewhat questionable because
it is loaded in compression and the elevated strength properties of
steel in compression over those in tension was not included in the
model. Nevertheless, the computed deformations are of the magnitude
5-271
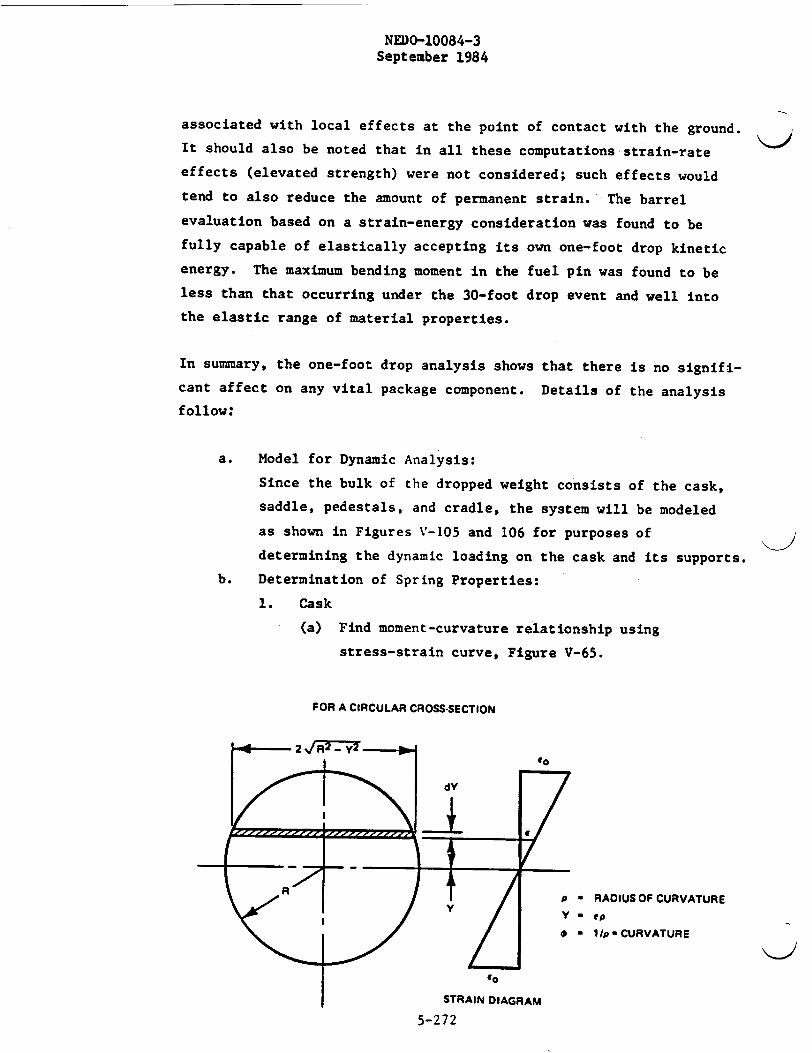
NEDO-10084-3September 1984
associated with local effects at the point of contact with the ground.
It should also be noted that in all these computations strain-rate
effects (elevated strength) were not considered; such effects would
tend to also reduce the amount of permanent strain. The barrel
evaluation based on a strain-energy consideration was found to be
fully capable of elastically accepting its own one-foot drop kinetic
energy. The maximum bending moment in the fuel pin was found to be
less than that occurring under the 30-foot drop event and well into
the elastic range of material properties.
In summary, the one-foot drop analysis shows that there is no signifi-
cant affect on any vital package component. Details of the analysis
follow:
a. Model for Dynamic Analysis:
Since the bulk of the dropped weight consists of the cask,
saddle, pedestals, and cradle, the system will be modeled
as shown in Figures v-105 and 106 for purposes of
determining the dynamic loading on the cask and its supports.
b. Determination of Spring Properties:
1. Cask
(a) Find moment-curvature relationship using
stress-strain curve, Figure V-65.
FOR A CIRCULAR CROSS-SECTION
-.-- 2 JR 2 - y2 lo
dY
R f
II
STI
eo
75-
Do
*RAIN DIAGRAM
p a RADIUSOF CURVATUREY * p C
O a 11p sCURVATURE
5-272
NEDO-10084-3September 1984
KJI_ 14 SPACES AT 13.5 on. - 10 in. _ I
Po
1 2 3 4 5 6 7 a 9 10 11 12 13 14-- X- * i .,
115a,_ _ . .
- 1 - - - w W W W W W
GIRDER *A- SADDLE
TRUNNION WPEDESTAL
7 7 m n m
FIGURE V.106. MULTI-MASS MODEL
5-274
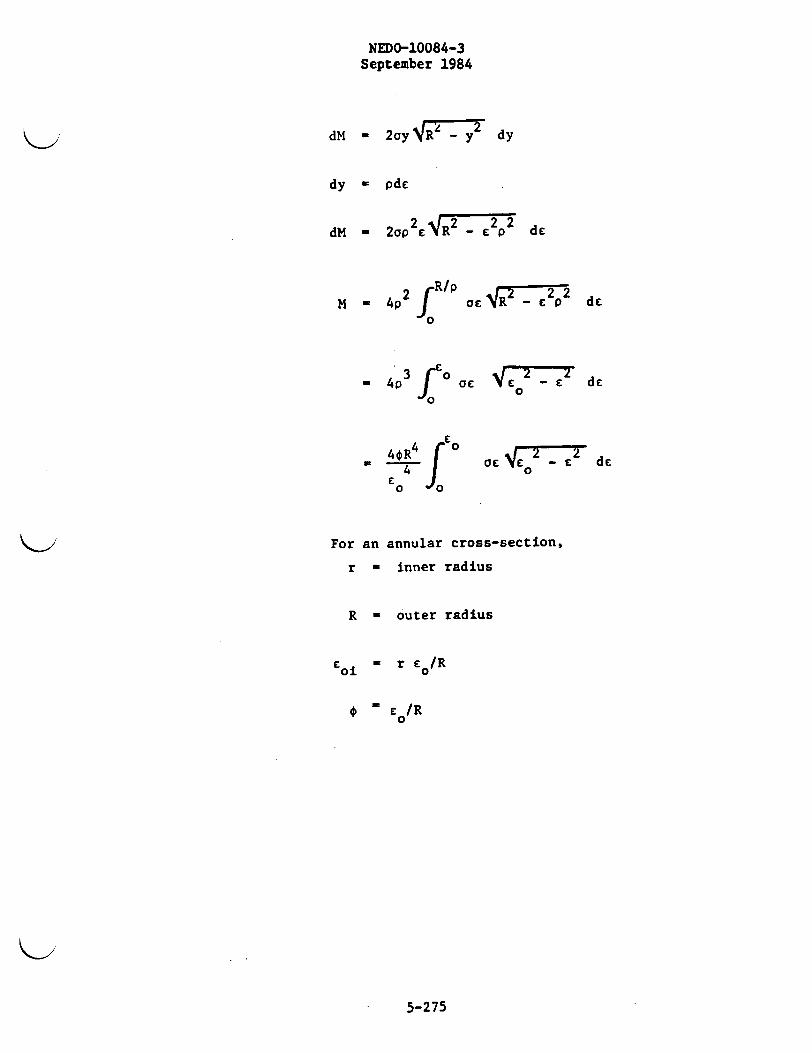
dM
dy
dM
NEDO-10084-3September 1984
- 2cy VR= _ y2 dy
- pdc
- 2op EAR 2 - c2p d2
M . 4p2 fR/p0
a 4_ p2 d2
- '3 fco cca 4P Nrc f tE - Ec d E
0
- 4 f £ Q0Iaf | CC Er~ 7E2 d E4 0
E
For an
r =
R =
oi
, '
annular cross-section,
inner radius
outer radius
r £ /R
C0/R
5-275
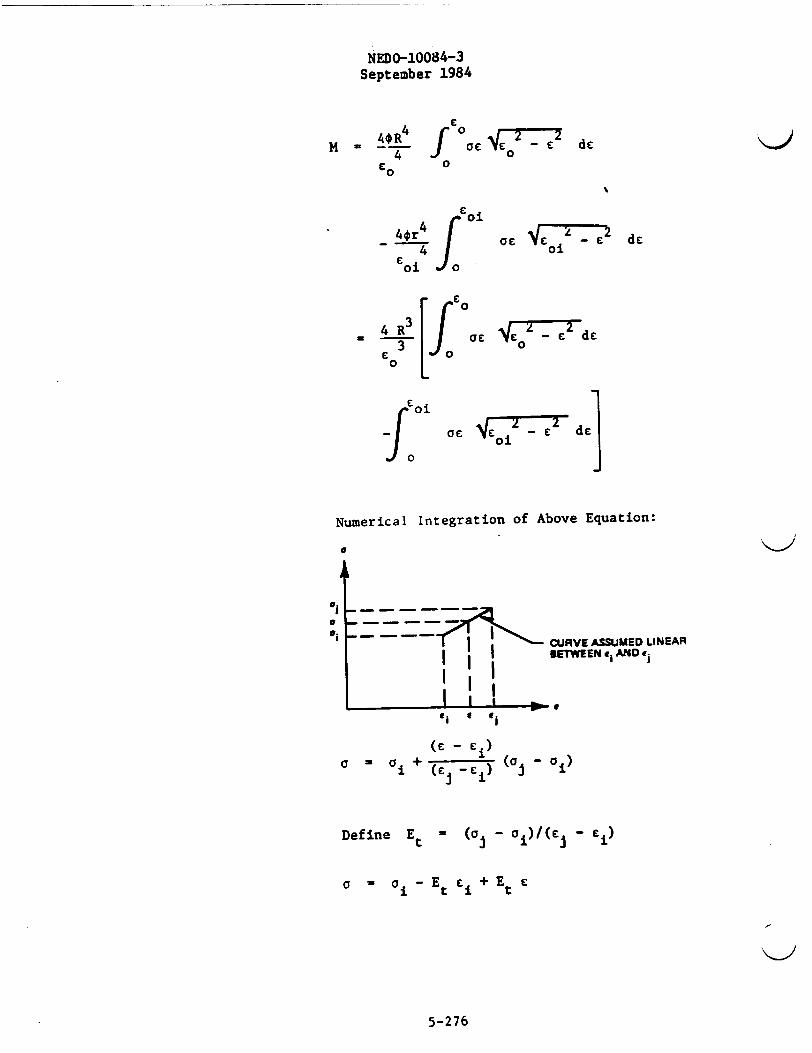
NEDo-10084-3September 1984
M4
co
4fr4
ofi J
4 R3J
3
E
J o
-C0
t oi
roo
r 0cc fE o - E d
0
0£ i 1 ~
Numerical Integration of Above Equation:
a
Il
eU'
CURVE ASSUMED LINEARBETWEEN ei AND fj
(E - cE)a a Cy+ ( _ (a
i (c i -ci) i - i)
Define Et a (a i - ai)/(C i = i)
a(o a-i t Oj)ci -t
5-276
NEDO-10084-3September 1984
J CI i
acE VE E dc - (ci - i )
_ dc + EtCi CI IV0 -C dc
' (ai -EtC i)
[- (CO2 E2)3/2] i
2 23/2
+ E -E (CO 2 E_ 2)t 4
L. -IC
2 / 2 2\1/2EO E EO _+0 0
4- 8
4 -
+ sin. (0j)
3I ..C
i
(a i -Et i L-
2)3/2 _ (C2 £2 )3/21
3
Ii ( 22)3/2 ( 2 2 3/2
- )
4
£02 [ ('£2 2)1/2- Ji
- E i ( E i )
4
+ 8 1sin (C /E ) - sin8 52 7
5-27 7
(Ci/C0)] I

NEDO-10084-3September 1984
For evaluation of fi
aslo,2 - e2 dc, substitut&.
C oi for EO. in above equation.
A computer program was written to evaluate the
above integrals for both the inner and outer shells.
(See Table V-46). See Figure V-107 for a plot of
the results.
M-¢ curve:
C a
o 0
0.002 60
0.01 71.0
0.02 75.0
0.03 77.3
0.04 79.3
0.08 87.0
The following data was used to generate
£
0.12
0.16
0.20
0.24
0.23
0.39
0.31
a
90.5
93.7
96.0
97.8
98.8
99.5
100.0
Outer
R I
Inner
R =
shell:
24.75"
shell:
19.25"
r - 23.25"
r = 18.75"
Table V-46
- INTEGRALCOMPUTER OUTPUT EVALUATION
2
3
4
5
6
7
8
9
10
11
12
13
14
15
8.08081E-5
4.0404E-4
8.08081E-4
1.21212E-3
1. 61616E-3
3.23232E-3
4.84848E-3
6.46465E-3
8.08081E-3
9.69697E-3
1. 13131E-2
1.29293E-2
1.45455E-2
1. 61616E-2
Mouter
158079.
232735.
250794
259723.
266215.
285757.
300230.
311068.
319370.
325939.
330925.
334595.
337404.
339370.
%-77R
Mi
26123.5
46851.1
51207.2
53196.6
54492.6
58073.6
60931.3
63138.8
64879.8
66304.
67480.2
68466.5
69223.2
69824.2
Mtotal
184203.
279586.
302001.
312919.
320708.
343831.
361162.
374207.
384250.
392243.
398405.
403061.
406627.
409194.
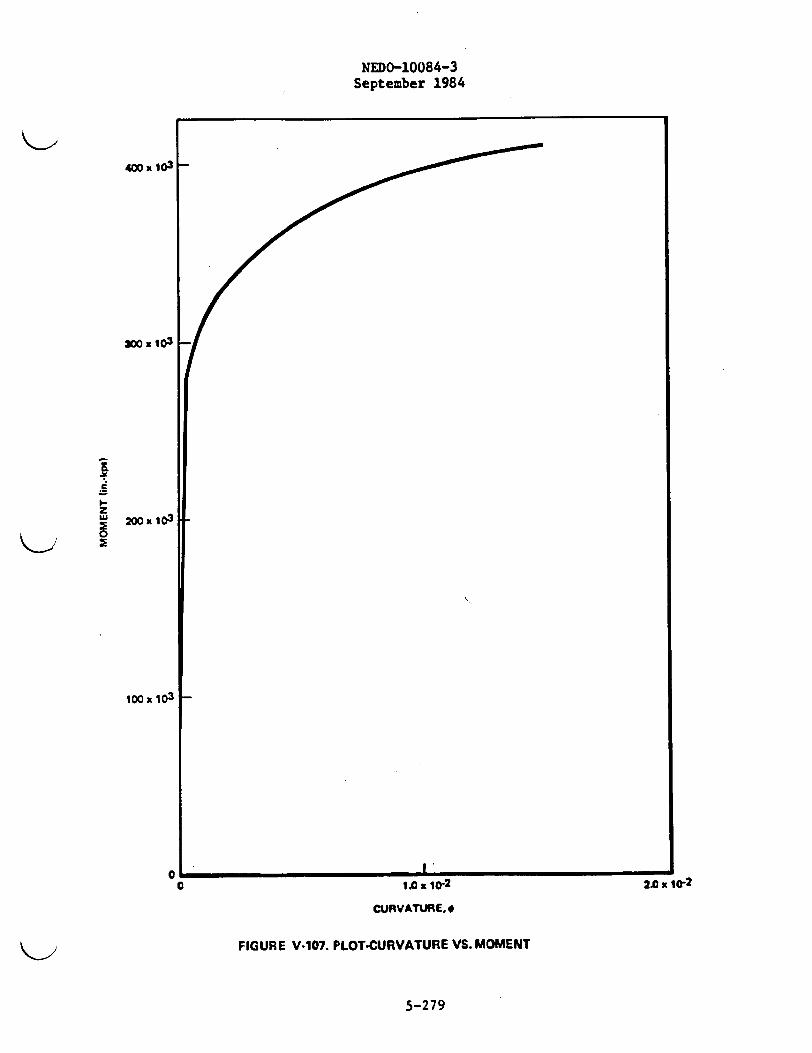
NEDO-10084-3September 1984
400 x 1o3
I-y
j 200x 103
0
100 x 103
aI.o xI2
CURVATURE. *
FIGURE V.107. PLOT-CURVATURE VS. MOMENT
2.0 x 1K-2
5-279

NEDO-10084-3September 1984
Use following bilinear curve:
M
2795856n. k
184203 in. k
Ell - 154203/8.080SxlO-S X 2.2795x1O9 k-in.E12 - (279568- 1842031- 2.9509x1O8 k-in.
14.0404 - o.SoOWSx o-4
(b) Shear stiffness.of cask:
s 2 s (24.752 _ 23.252 + 19.252 - 18.752)
= 142.94 in2
G = E 26500 10352 ksi& 2(1+y) 2(1+0.28)
A G = 142.94 x 10352 - 1.4797 x 10 kips
Load to cause yield:
T ' 0.577 x 60 - 34.62 ksiy
V = 34.62 x 142.94 - 4 9 4 8ky
Assume cask does not yield in shear during 1 ft
drop and use following curve:
V J1 /
//
4M4J k
'73.346x10O3
- 5-280
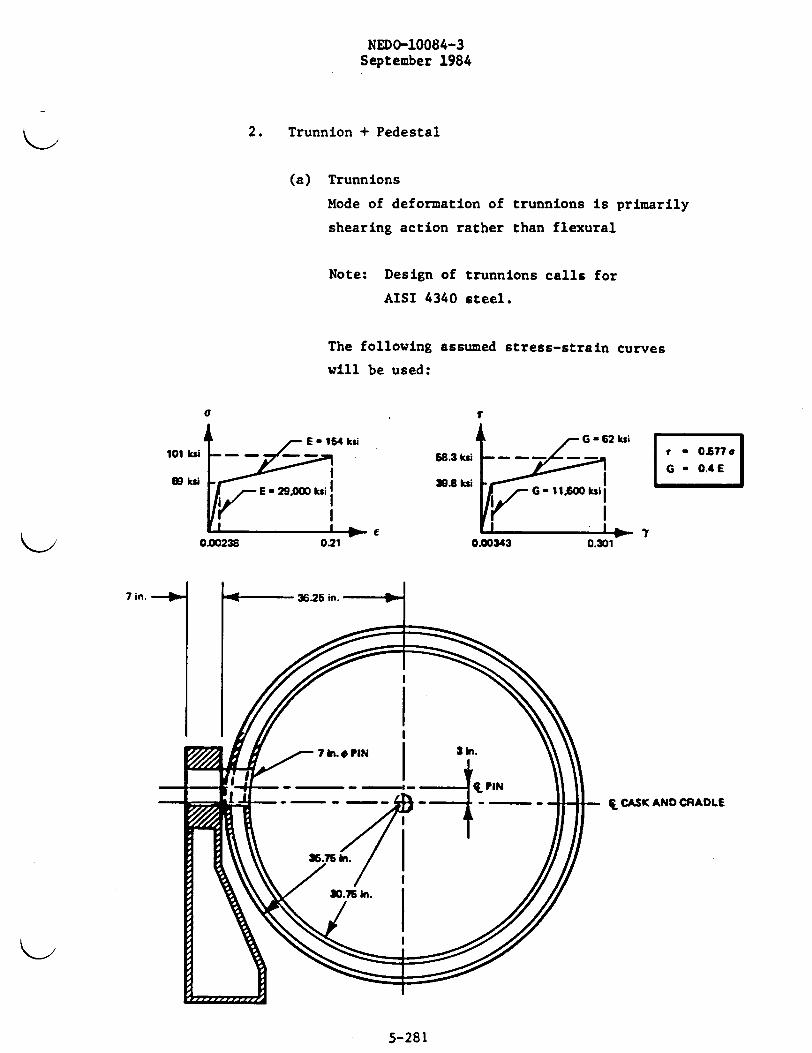
NEDO-10084-3September 1984
2. Trunnion + Pedestal
(a) Trunnions
Mode of deformation of trunnions is primarily
shearing action rather than flexural
Note: Design of trunnions calls for
AISI 4340 steel.
The following assumed stress-strain curves
will be used:
a V
101 kiW
09 kWi
68.3 ksi
39.8 kti
L G -62 kii
K-IG-OksiI
- , I
r - CA7, a|G - 0.4 E|
f I .0.00238 021 0.00343 0.3C
7 in.
q. CASK AND CRADLE
5-281
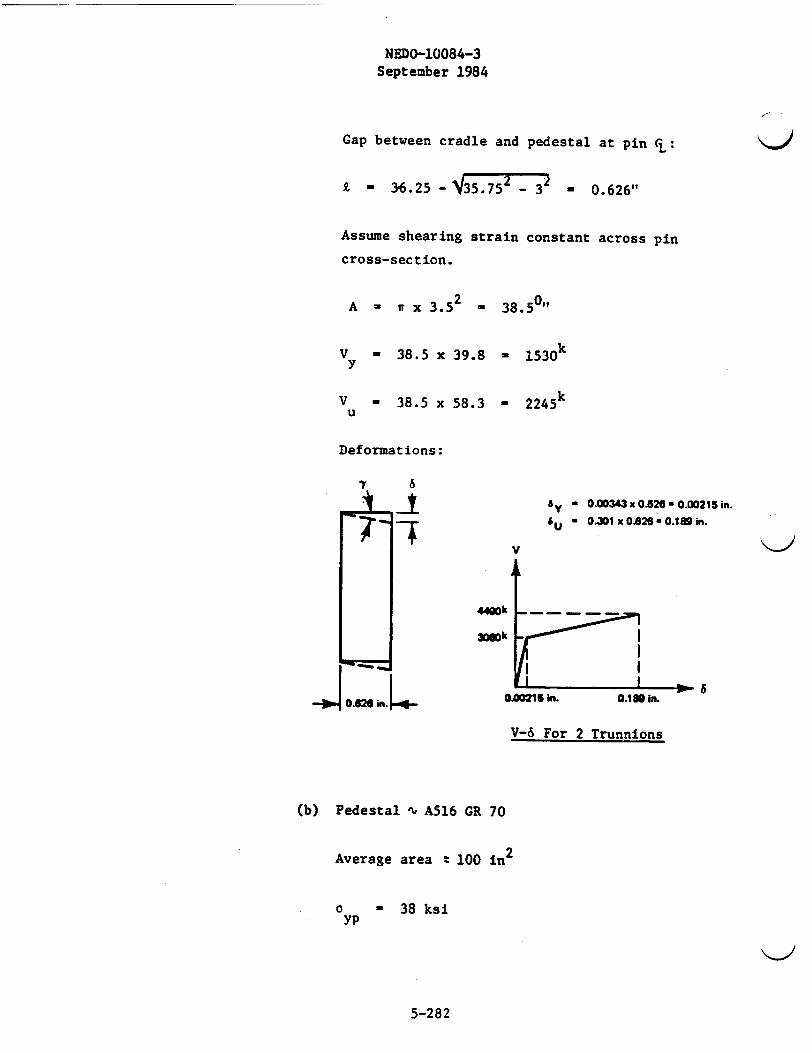
NEDO-10084-3September 1984
Gap between cradle and pedestal at pin CL:
9 = 36.2 5 -_ 35.75 _ 32 - 0.626"
Assume shearing strain constant across pin
cross-section.
A - r x 3.52 , 38.50t
V - 38.5 x 39.8 - 1530y
V = 38.5 x 58.3 - 2245u
Deformations:
7.1. 8.t. a O00343xO326-0.00215in.
Su 0.301x0626-0.189i.
V
4490k
O A21 in LC0X215 h. 0.110 in.
V-6 For 2 Trunnions
(b) Pedestal " A516 GR 70
Average area : 100 in2
a - 38 ksiyp
5-282

NEDO-10084-3September 1984
Ey - 38/29000 - 0.00131
Py
w 100 x 38 -
6 = 43" x 0.00131y
P
= 0.564"
II
OJDW in.
P-6 For 2 Pedestals
PFOR PURPOSES OF INPUT TOCO 01UTER PROGRAM, USE ALENGTH OF I in. FOR THIS SPRINGLe-&
EAj * 20a010.0249 - 1.228 x 10⁵ kips
EA 2 ' 1430/0.197 = 7.26 x 10³ kips
44o0 k
aIC)0.0249 n. .O2 in.
Composite SpringTrunnions + Pedestals
3. Girder Web Underneath Pedestal
A514 steel ayp
= 9O ksi
Web thickness. - 0.5"
Area @ mid-height = 60 x 0.5 - 30 in2
5-283
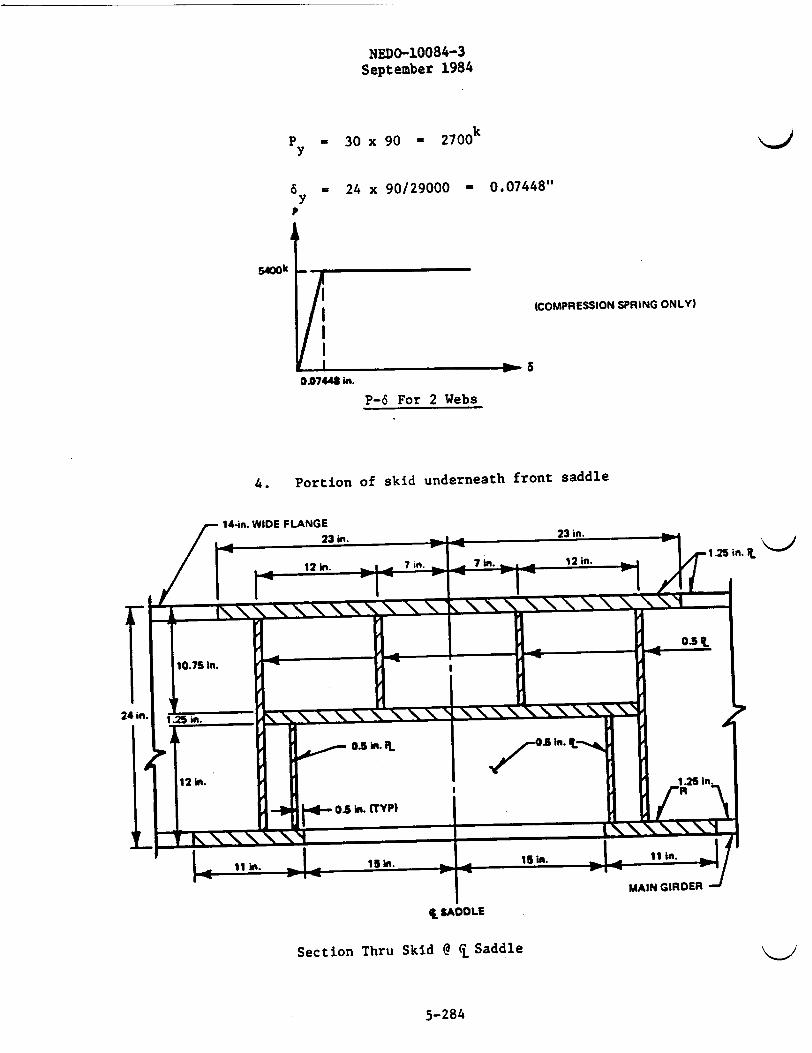
NEDO-10084 -3September 1984
30 x 90 - 2700P -
y
6yP
- 24 x 90/29000 M 0.07448"
(COMPRESSION SPRING ONLY)
/I/IrI -w a
0748 in.
P-6 For 2 Webs
4. Portion of skid underneath front saddle
144n. WIDE FLANGE
Section Thru Skid @ CL Saddle I'
5-284
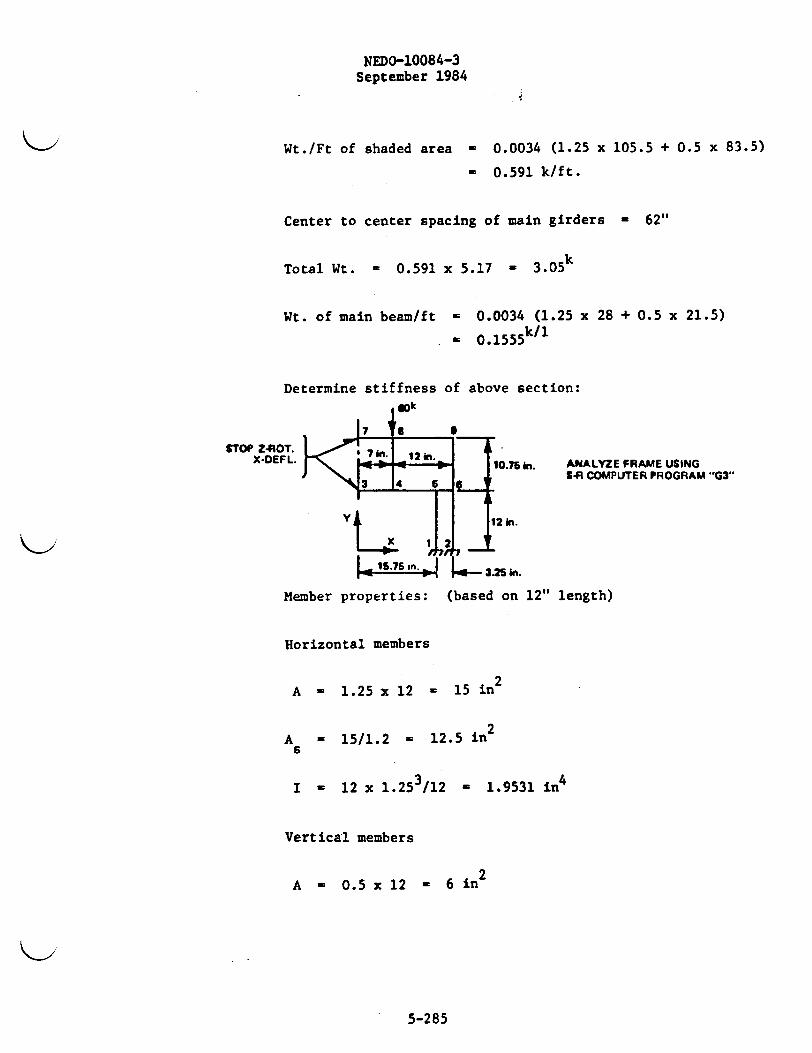
NEDO-10084-3September 1984
Wt./Ft of shaded area - 0.0034 (1.25 x 105.5 + 0.5 x 83.5)
- 0.591 k/ft.
Center to center spacing of main girders - 62"
Total Wt. - 0.591 x 5.17 - 3.05
Wt. of main beam/ft - 0.0034 (1.25 x 28 + 0.5 x 21.5)
a 0 .1555 k/1
Determine stiffness of above section:40k
STOP Z.AOT. 7 in 12 in.X-DEF L. 10.75 in. ANALYZE FRAME USING
3 14 11SR COMPUTER PROGRAM "G3"
1 12 in.
|< l .7S n >l3.25 in.
Member properties: (based on 12" length)
Horizontal members
A - 1.25 x 12 = 15 in2
A = 15/1.2 = 12.5 in2s
I - 12 x 1.253/12 - 1.9531 in4
Vertical members
A - 0.5 x 12 - 6 in2
5-285

NEDO-1008 4-3September 1984
As ' 6/1.2 - 5 in2
I - 12 x 0.5 3/12 - 0.125 in4
Stiffness, k- 2 - 3430 k/in.0.18067 \12/
Stiffness of girder web:
Area @ mid-height = 0.5 x 38 - 19 in2
k _ AE , 19 x 29000 , 22958 k/in.£ 24
Increase stiffness by 25% to account for 1/2" diaphragm
plates framing into web.
k - 1.25 x 22958 - 28700 k/in.
Total k - 2 x 28700 + 3430 - 60830 k/in.
Find equivalent area:
60830 - A x 2900024
A - 50.34 in2
P - 50.34 x 90 - 4530ky
6y - 4530/60830 - 0.07447'
5-286
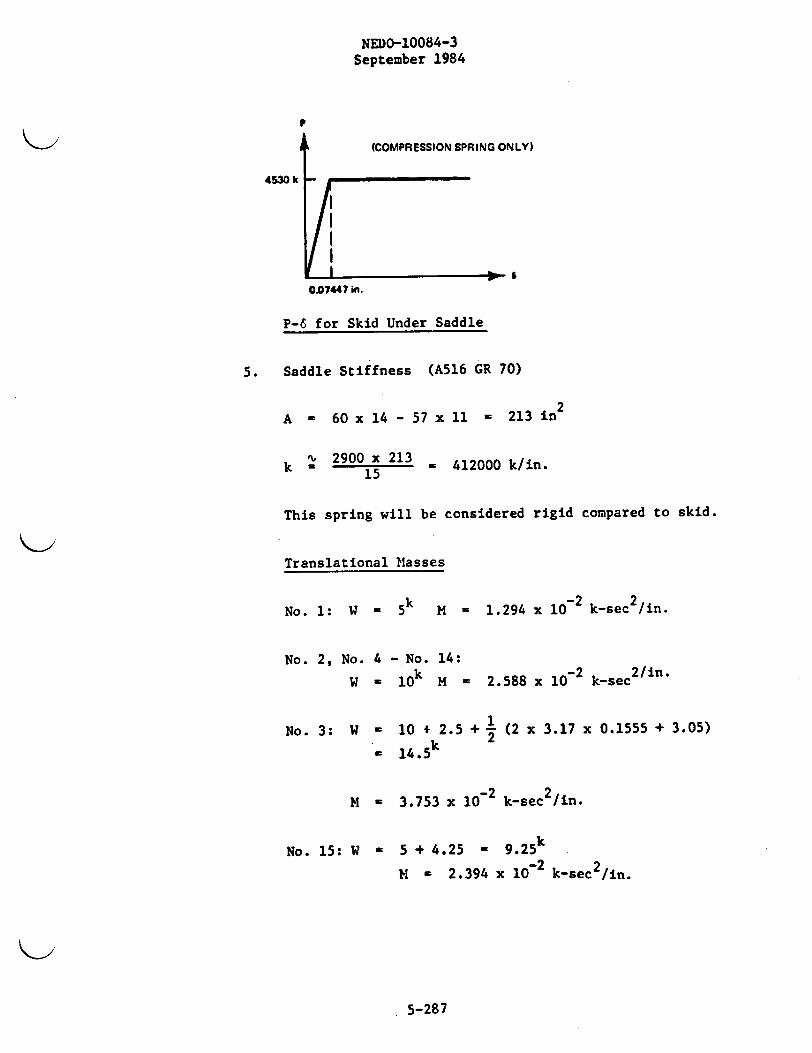
NED0-10084-3September 1984
(COMPRESSION SPRING ONLY)
4530 It
0.07447 in.
P-6 for Skid Under Saddle
5. Saddle Stiffness (A516 GR 70)
A = 60 x 14 - 57 x 11 - 213 in2
k " 29001x 213 = 412000 k/in.- 15
This spring will be considered rigid compared to skid.
Translational Masses
No. 1: W - 5k M - 1.294 x 10 2 k-sec2/in.
No. 2, No. 4 - No. 14:
W - 10k M - 2.588 x 10 2 k-sec2/in
No. 3: W - 10 * 2.5 + 2 (2 x 3.17 x 0.1555 + 3.05)k 2
- 14.5
M - 3.753 x 10 2 k-sec 2 /in.
kNo. 15: W - 5 + 4.25 - 9.25
M - 2.394 x 10⁻² k-sec2 /in.
5-287
NEDO-10084-3September 1984
No. 16: W - 4.25 + 2 (2 x 5 x 0.1555 + 1.25)
5.65
2\1
M - 1.462 x 10² k-sec2 /in.
Rotary Masses
M - IpAX
where I - moment of inertia
p = mass density
AX - spacing of masses
Outer Shell: I - 65208 in ; p =
Uranium : I - 121651 in4;p -
Inner Shell: I = 10776 in ; p -
of cross-section
0.284 lbs./in3
0.69 lbs./in3
0.284 lbs./in3
Masses #2 - #14:
M - [(65208 + 10776) x 2.84 x 10 + 121651 x 6.9 x 10
- 3.687 k-in-sec2
Masses # 1 and 15:
M - 1.8435 k-in-sec2
5-288
NEDo-10 0 8 4 -3September 1984
Impact Velocity of Cask:
V - r2gH - ,'2 x 386.4 x 12 - 96.3 in/sec
The dynamic analysis will be performed using S-R
computer program "Dyrec" which has been developed by
Dr. Garry Patterson of Stearns-Roger. See Section
5.6.5.
b. Su mmary of Results:
1. Cask Outer Shell
Max. moment = 0 . 9 8 3 9 3"k @ t - 0.00605 sec in members 7-8
1 - .289 x l0 4 in 1
-4E = RO - 24.75 x 1.289 x 10 = 0.00319
Some slight yielding has occurred on localized outermost
fibers. No cross-sectional wall effects.
Max. shear - 4 1 4 5 k@ t - 0.00554 sec in members 4-5.
Since 4145k < 4948 k, no yielding occurs.
2. Trunnion
Max. force - 3438 @ t - 0.00807 sec
3438/77 - 44.65 ksi
y - 0.00343 + (44.65 - 39.8)/62 - 0.0816
Some yielding has occurred.
5-289
NEDO-10084-3September 1984
3. Pedestal
Max. force - 3 4 38 k t - 0.00807 sec
Since 3438 < 7600 , no yielding occurs.
4. Girder Web Under Pedestal
Max. force - 3946 @ t - 0.00121 sec
Since 3946k < 5400k, no yielding occurs.
5. Skid Underneath Front Saddle
Max. force - 4530 @ t - 0.00094 sec
Skid yields at this force until t - 0.00368 sec
6 - 0.1742" small enough to be considered asmax
localized at point of contact
C ' 0.1742/24 - 0.06725
Although some yielding has occurred in the system, the
max. strains are seen to be small. The analysis was
performed for a time duration - 0.12 sec (20 millisec).
Within this time, the skid has impacted the unyielding
surface and rebounded upwards. Any subsequent impacts
will be less severe than the initial impact. For this
reason, the program was not continued further in time.
5-290
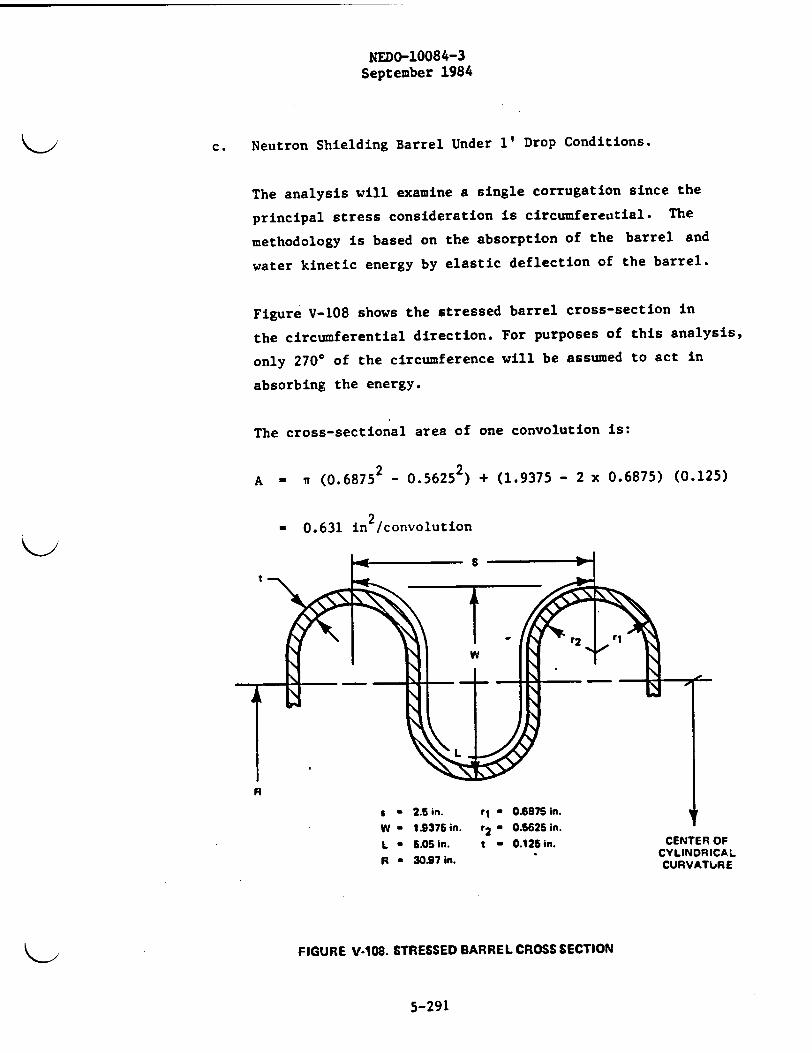
NEDO-10084-3September 1984
c. Neutron Shielding Barrel Under 1' Drop Conditions.
The analysis will examine a single corrugation since the
principal stress consideration is circumferential. The
methodology is based on the absorption of the barrel and
water kinetic energy by elastic deflection of the barrel.
Figure V-108 shows the stressed barrel cross-section in
the circumferential direction. For purposes of this analysis,
only 270' of the circumference will be assumed to act in
absorbing the energy.
The cross-sectional area of one convolution is:
A = r (0.6875 - 0.5625 ) + (1.9375 - 2 x 0.6875) (0.125)
- 0.631 in 2/convolution
t
R
s - 2.5 in. .l a S6875 in. i
W - 1.9375 in. r2 a 0.5625 in.
L - 6.06 in. t - 0.125 in. CENTER OFR 3057 in. 'CYLINDRICALR - 0.97in.CUR VATUjRE
FIGURE V-108. STRESSED BARREL CROSS SECTION
5-291
NEDO-10084-3September 1984
The outer fiber circumference is:
C- 2rR - 2w (30.97 + 1.9375)
- (31.94")2w
200.67 in.
Based on actual measurements, the water volume encompassedby one corrugation is:
V 25852 ain x 2.5 in/corr - (void vol/corr)
X 10.8 gal - 1.0
Yielding a water weight of:
Wt - (9.8) (8.64) - 75 lbs.
The barrel weight per corrugation is approximately 35 pounds.This weight will be added to that of the water, since, froma hydrostatic viewpoint, the water is "supporting" the barrel.
Therefore, total effective weight per corrugation length is:
W - 75 + 35 - 110#
Thus, the i' drop kinetic energy per corrugation is:
KE - 1 x 110# - 110 ft-lbs.
If the barrel can absorb this amount of kinetic energyelastically, thea vo reduction in effectiveness will occurdue to the 1' drop. The energy absorbing characteristicsof the barrel can be cbtained by examining the amount
5-292
NEDO-10084-3
September 1984
of circumferential elongation available before yield and
multiplying this by one-half the product of the stressed
area and the yield strength.
KE ' (l) x A x 6p) in-lbs.ABS C(
The Alc should be adjusted for any existing barrel strain
due to internal pressure.
Stress in barrel @ 200 psig - 24,025 psi
From this
6 2.4 x 10⁴
E 25 x 106
- 9.6 x 10 (0.00096)
For the portion of the barrel under consideration:
Yield point is defined at a strain of 0.002; therefore, the
elastic deformation is: -
( 200.67 x 270'Alc - (0.002 - 0.00096) ( 3600
= 0.157 in
Computing the energy absorbing capabilities
KEABS - (0.157) (2) (0.631) (29,500) 1 ft-lbs
- 122 ft-lbs
5-293

NEDO-10084-3September 1984
Thus, the barrel is capable of elastically absorbing the1' drop kinetic energy. The safety factor is
SF _ 122 _ 1.11110
d. IF-300 Cask Barrel Expansion Tanks Under 1-foot DropConditions
1. Discussion:
The descriptive drawings show the stainless steeltanks which are mounted on the IF-300 cask to accom-modate shielding water expansion. The barrel itselfhas been evaluated under 1-foot drop conditions andfound to be capable of sustaining such loads. Thisanalysis examines the expansion tanks under similarloading conditions.
Previous sections contain the details of a dynamicspring-mass model of the IF-300 cask. As discussed,the response of the cask under the 1-foot drop is bestdescribed as vibratory. The peak deceleration was210 g's with the total time from zero to peak and backto zero being about 0.0005 second this is shown onFigure V-11O for node 7. For simplicity in analysis,the barrels were examined assuming a static load of210 g's. Yield strength of the material will be usedas the basis of the safety factor. Figure V-109 isfrom the International Nickel Company Stainless SteelHandbook for 304 SST under Compressive Loading. Tensileyield of 304 SST is taken as 34000 psi.
5-294
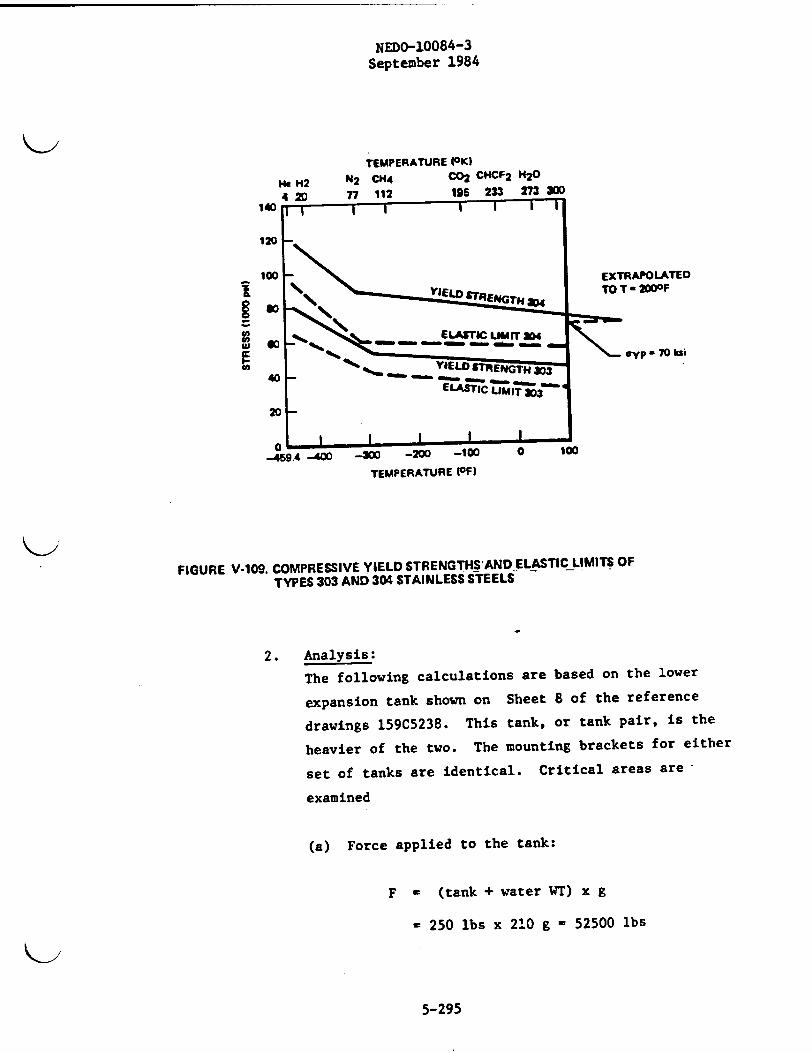
NEDo-1008 4 - 3
September 1984
TEMPERATURE (OK)
He H2 N2 CH4 C02 CHCF 2 H20
4 2D 77 112 196 233 273 300
120
100
I
Mi
EXTRAPOLATEDTOT - 2000F
*yp -70 ksi
-300 -200 -100
TEMPERATURE (OF)
FIGURE V.109. COMPRESSIVE YIELD STRENGTHS AND ELASTIC LIMITS OF
TYPES 303 AND 304 STAINLESS STEELS
2. Analysis:
The following calculations are based on the lower
expansion tank shown on Sheet 8 of the reference
drawings 159C5238. This tank, or tank pair, is the
heavier of the two. The mounting brackets for either
set of tanks are identical. Critical areas are-
examined
(a) Force applied to the tank:
F - (tank + water WT) x g
- 250 lbs x 210 g - 52500 lbs
5-295
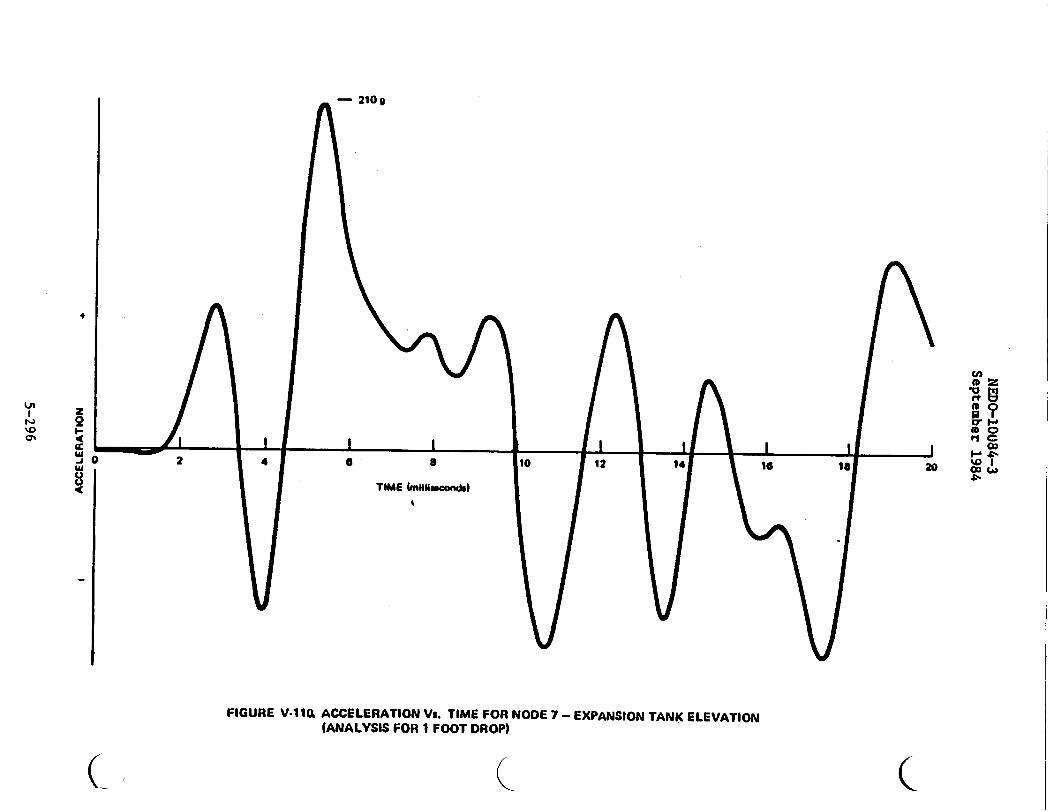
- 210g
z
21w-i 0w
CA
0 I-* 0
D C
20 F-M20" W
co-a a
TIME Imniasconds)
FIGURE V-.11Q ACCELERATION Vs. TIME FOR NODE 7- EXPANSION TANK ELEVATION(ANALYSIS FOR 1 FOOT DROP)
( (
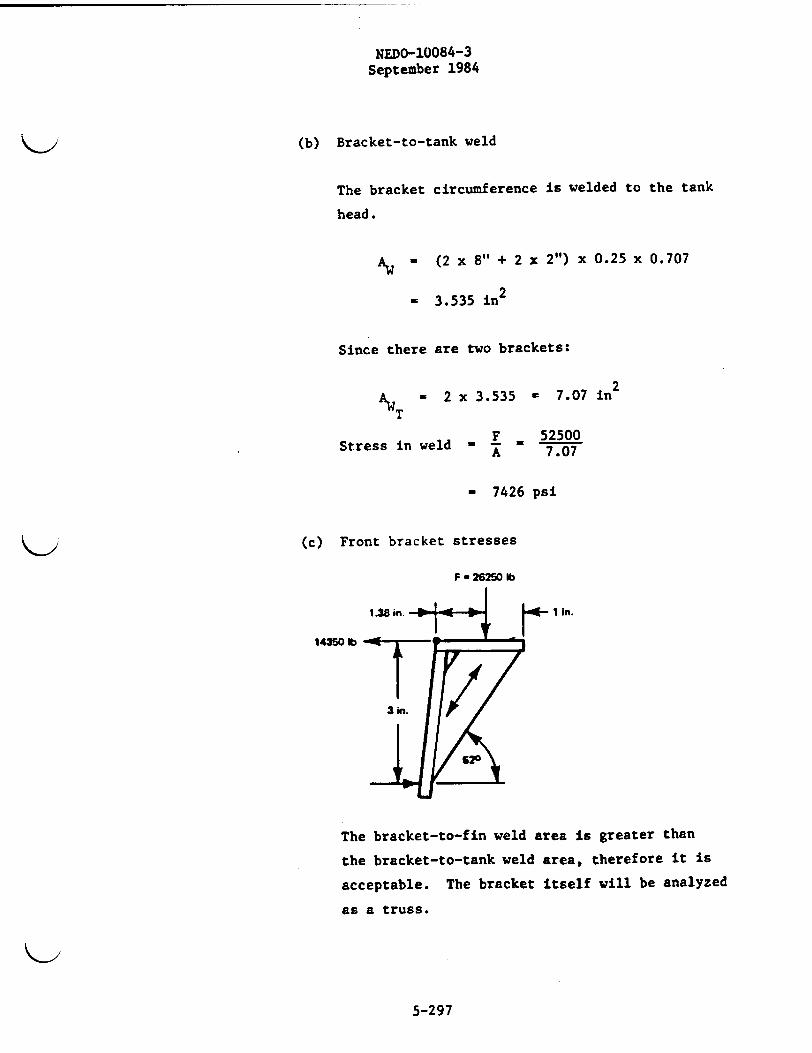
NEDO-10084-3
September 1984
(b) Bracket-to-tank weld
The bracket circumference is welded to the tank
head.
AW - (2 x 8" + 2 x 2") x 0.25 x 0.707
- 3.535 in2
Since there are two brackets:
- 2 x 3.535 W 7.07 in2
Stress in weld A = 7.07
- 7426 psi
(c) Front bracket stresses
F - 26250 lb
I in.
14350 lb
The bracket-to-fin weld area is greater than
the bracket-to-tank weld area, therefore it is
acceptable. The bracket itself will be analyzed
as a truss.
5-297
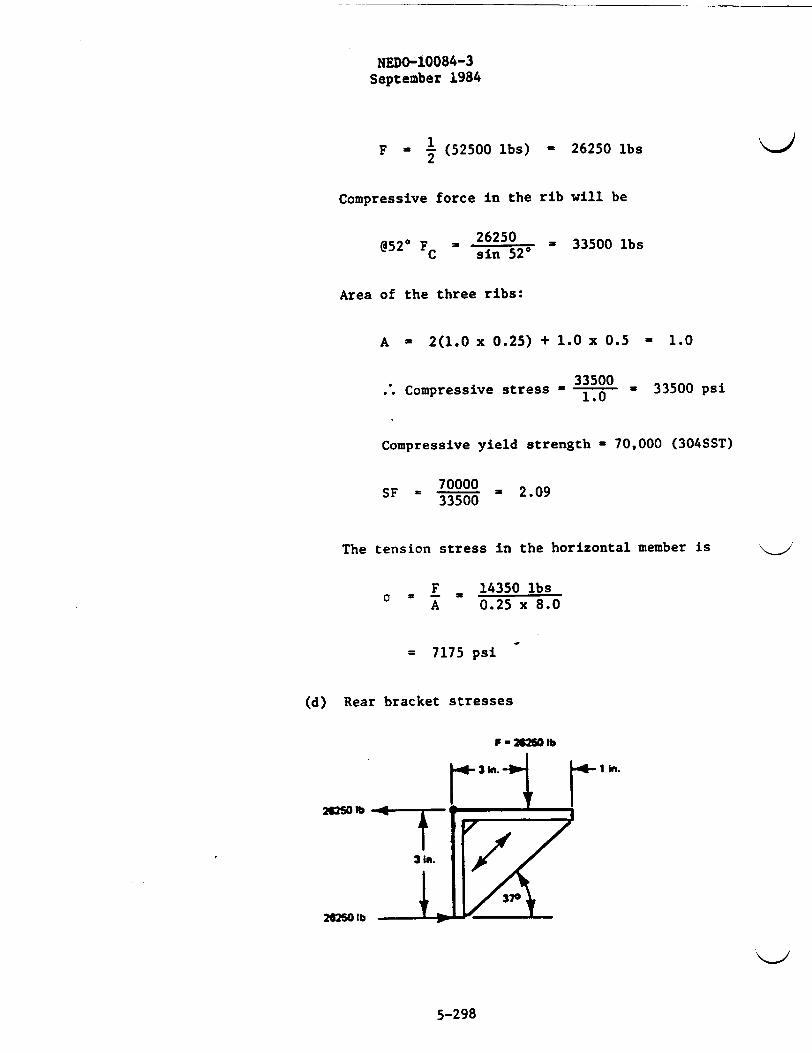
NEDO-10084-3September 1984
F 2 1 (52500 lbs) - 26250 lbs )
Compressive force in the rib will be
@520 F 26250 33500 lbsC sin 520
Area of the three ribs:
A - 2(1.0 x 0.25) + 1.0 x 0.5 - 1.0
.: Compressive stress - 33500 - 33500 psi1.0
Compressive yield strength - 70,000 (304SST)
SF = 70000 - 2.0933500
The tension stress in the horizontal member is
- F - 14350 lbsA 0.25 x 8.0
= 7175 psi
(d) Rear bracket stresses
F - 2161M lb
26260 lb
5-298

NEDO-10084-3September 1984
The bracket-to-valve box weld area is greater than
the bracket-to-tank weld area, therefore it is
acceptable. As with the front bracket, the rear
bracket will be treated as a truss.
F - 2 (52500) - 26250 lbs
Compressive force on rib is
F = 26250 = 43750 lbsC si 388is
Area of three ribs:
AR - 2 (1.5 x 0.25) + 1.5 x 0.5 - 1.5
Compressive stress in rib
1.0 . 29,167 psi
SF = 2.22. ' 2.429167
Tension in horizontal member
F 26250A (0.25 x 8) = 13125 psi
SF - 34000 2.613125
(e) Stress in the relief valve support bar
- PIPING
I.4-
114in. FILLETWELD ALL AROUND
5-299
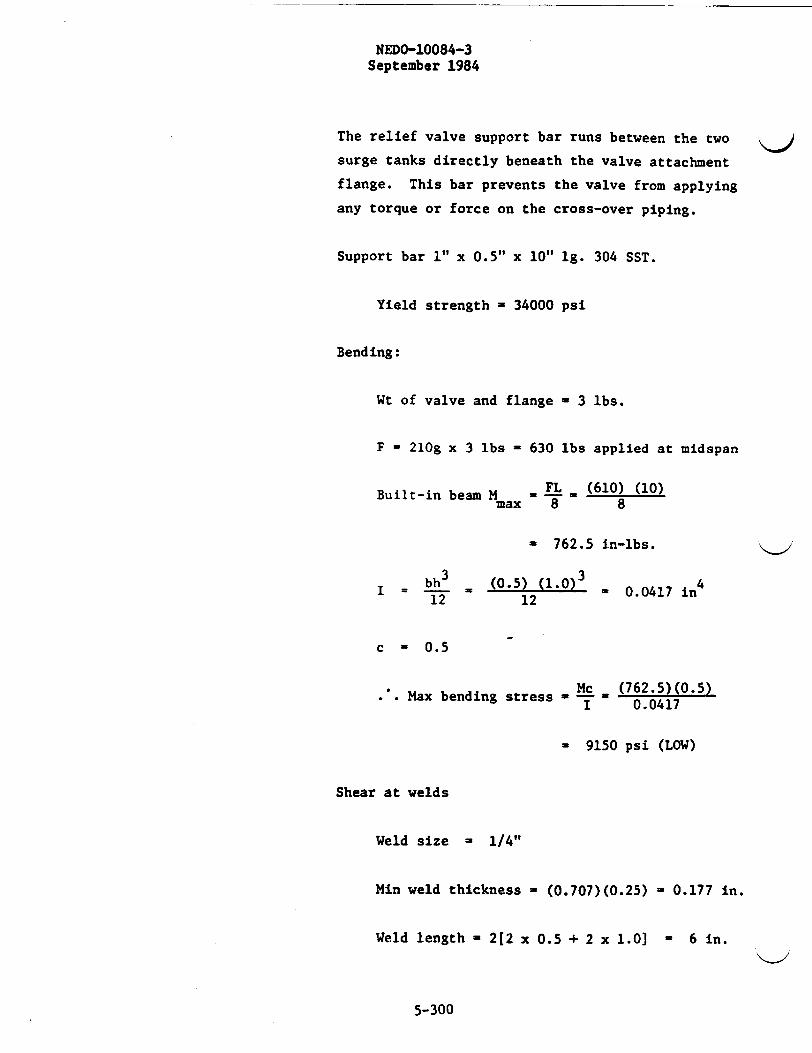
NEDO-10084-3September 1984
The relief valve support bar runs between the two
surge tanks directly beneath the valve attachment
flange. This bar prevents the valve from applying
any torque or force on the cross-over piping.
Support bar 1" x 0.5" x 10" 1g. 304 SST.
Yield strength - 34000 psi
Bending:
Wt of valve and flange - 3 lbs.
F = 210g x 3 lbs - 630 lbs applied at midspan
Built-in beam M ,FL (610) (10)max 8 8
- 762.5 in-lbs.
I = bh3 (0.5) (1.0)312 12
= 0.0417 in4
c - 0.5
. . Max bending stress - I (72504)71 0.0417
- 9150 psi (LOW)
Shear at welds
Weld size - 1/4"
Min weld thickness - (0.707)(0.25) - 0.177 in.
Weld length - 2[2 x 0.5 + 2 x 1.0] - 6 in.
5-300
NEDO-10084-3
September 1984
Weld area = 6 in x 0.177 in
a 1.06 in2
Shear in weld - AA
w- 106 594 psi (LOW)
Shear in bar
F = 610
A = 0.5 x 1.0 - 0.5
VB =. 1220 psi (LOW)B 0.5
The presence of the support bar prohibits movement
of the relief valve assembly and hence no loading
is transmitted to the cross-over piping. The
stress levels in the support bar and attachment
welds are low even under a static 210g
deceleration.
.e. Conclusion
This analysis under the very conservative assumption
of a 210g static loading of the tanks demonstrates
that the brackets and valve piping are more than
capable of sustaining the one-foot drop without
damage.
5-301
NEDO-10084-3September 1984
5.11.4 Penetration Protection
This section deals with the vulnerability of cask components to missiledamage. First the various missiles are defined, then the vulnerablecask areas are identified. Finally, the effects of missile damageare examined.
5.11.4.1 Missiles
There are three categories of missiles to be considered here, thosethrown from the side, those dropped from above, and those fired fromthe side.
a. Thrown Object
The thrown object would be a rock and might be considered as afive-inch diameter sphere of concrete weighing approximatelyfive pounds. This represents about the heaviest object whichan individual can throw a short distance. Several such objectscan be considered.
b. Dropped Object
The dropped object could be handled by two individuals and doesnot require propelling. The maximum weight of this object isassumed to be 150 pounds and is in the form of a six-inch dia-meter by 1-1/2-foot long steel cylinder. The six-inch diameterpin was chosen because it corresponds to the 40-inch drop puncturepeg of 10 CFR 71. The dropped height is considered to be 15 feet,yielding 2250 ft-lb of energy. A single such object can be con-sidered.
c. Fired Object
The fired object is quite difficult to define. An upper limit wouldappear to be a 30 caliber rifle as used for deer hunting, withsoft-nosed ammunition. A single such object can be considered.
It is assumed that the package is in motion when the objects areprojected at it. Furthermore, it is assumed that the incidents arerandom occurrences against a train rather than specific attacks
5-302

NEDO-10084-3September 1984
directed at the IF 300 cask. On this basis, the probability of
occurrence is quite low.
5.11.4.2 Protection Provided by Enclosure
The primary purpose of the enclosure is personnel exclusion. However,
with solid, braced ends and roof and braced, expanded metal sides,
penetration of the enclosure from side-thrown objects is virtually
impossible. Penetration is more probable from the dropped object.
The ductility of the panels and the braces will absorb some of the
kinetic energy and the mere presence of the roof will tend to deflect
the dropped object, particularly when the cask is in motion.
The enclosure offers little penetration protection from the fired
object. However, two events could occur, a deflection of the pro-
jectile and/or a deformation (flattening) of the projectile. Both of
these tend to protect the cask.
5.11.4.3 Vulnerability of Equipment
Before discussing the inherent ruggedness and redundancy of the
shipping cask and support equipment, it is necessary to identify
those areas which are the most vulnerable to damage by the missiles
defined in 5.11.4.1 above. From the argument of 5.11.4.2, there
are only two objects, dropped and fired, which are capable of
penetrating the screened enclosure.
The areas most vulnerable to penetration are the cask water Jacket
and the mechanical cooling system. The cooling system has no effect
on safety and is not discussed.
The corrugated water jack surrounding the cask provides neutron
shielding as well as heat removal area. The structure is 1/8-inch
thick 304 stainless steel. It is fabricated to ASME code specifications
and has a pressure rating of 200 psig. The corrugations which provide
5-303
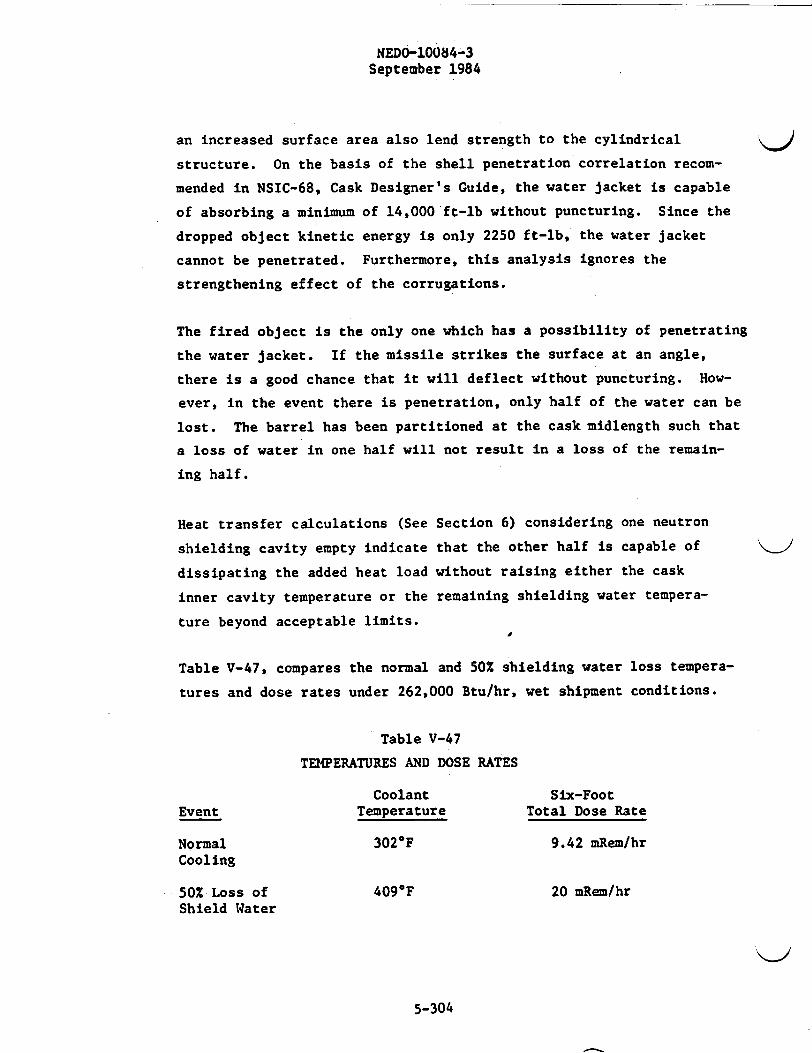
NEDO-10084-3September 1984
an increased surface area also lend strength to the cylindrical
structure. On the basis of the shell penetration correlation recom-
mended in NSIC-68, Cask Designer's Guide, the water jacket is capable
of absorbing a minimum of 14,000 ft-lb without puncturing. Since the
dropped object kinetic energy is only 2250 ft-lb, the water jacket
cannot be penetrated. Furthermore, this analysis ignores the
strengthening effect of the corrugations.
The fired object is the only one which has a possibility of penetrating
the water jacket. If the missile strikes the surface at an angle,
there is a good chance that it will deflect without puncturing. How-
ever, in the event there is penetration, only half of the water can be
lost. The barrel has been partitioned at the cask midlength such that
a loss of water in one half will not result in a loss of the remain-
ing half.
Heat transfer calculations (See Section 6) considering one neutron
shielding cavity empty indicate that the other half is capable of
dissipating the added heat load without raising either the cask
inner cavity temperature or the remaining shielding water tempera-
ture beyond acceptable limits.
Table V-47, compares the normal and 50X shielding water loss tempera-
tures and dose rates under 262,000 Btu/hr, wet shipment conditions.
Table V-47
TEMPERATURES AND DOSE RATES
Coolant Six-FootEvent Temperature Total Dose Rate
Normal 302°F 9.42 mRem/hrCooling
50% Loss of 409°F 20 mRem/hrShield Water
5-304
NEDO-10084-3September 1984
5.11.4.4 Integrity of Corrugated Water Jacket
The resistance of the corrugated water jacket to missile penetration
was discussed in Subsection 5.11.4.3. This section will outline the
fabrication quality assurance program pertaining to the barrel and the
in-service inspections which are instituted to check on integrity.
a. Design and Fabrication
The corrugated structure provides a significant amount of
additional strength and resistance to damage over a flat-
sided cylinder of comparable diameter, evidenced by applica-
tions in roofing, frameless trailers, culvert pipes and
other structural uses. Thus, the corrugated water jacket is
an extremely rugged structure. It is designed and fabricated
by an established expansion joint manufacturer to ASME spec-
ifications. Expansion joints of this size have been used
for years in chemical and power generation applications under
severe thermal conditions with an excellent record of
reliability. The structure is made of 304 stainless steel
having a wall thickness of 1/8 inch. The barrel is rated at
200 psig design pressure.
To assure the highest quality structure, the water jacket
fabrication is done using the ASME code, where applicable.
All material is certified as meeting minimum strength
requirements. Each weld is non-destructively tested by
accepted non-destructive testing methods. This includes
both barrel fabrication and barrel attachment welds. Once
the water containment is attached to the cask body, it is
hydrostatically tested to 200 psig as an acceptance test,
in addition to the other NDT methods.
5-305

NEDO-10084-3September 1984
b. In Service
Once in service, the barrel is hydrotested at least
annually at 80 psig. Visual inspection for leakage or
cracking is performed prior to every shipment. Repairs,
if required, are performed and inspected under the same
standards as the original fabrication.
The flexible nature of the expansion joint makes it less
susceptible to vibratory and handling-stresses than a flat-
sided cylinder under similar conditions. Flat-sided cylinders
of comparable size (tank cars, etc.) have been used for years
for the railroad transport of liquids with few failures. Thus,
there is only an exceedingly remote possibility that any leak
could develop in the barrels during the course of
transportation.
5.11.5 Summary on Reliability
The IF 300 spent fuel shipping package has been designed in full accordat&,>
with the intent of 10 CFR 71. All parts are of the highest quality and
the fabrication follows the strictest standards for workmanship.
The design has carefully considered all aspects of equipment performance.
The system is fully redundant, as no single event except the hypothetical
accident will result in any release of radioactive materials from the
cask. The events considered are:
1. 1 foot drop of the cask/skid in its normal transport
orientation
2. Fired missile penetration of the corrugated water jacket
or ducting
3. Dropped object penetration of the corrugated water jacket
or ducting
4. Thrown missiles
5-306
NEDO-i0084-3September 1984
The basis of the reliability of such a shipping package is the degree
of preventive maintenance and inspection performed in service. All
vital components of the system are periodically checked in accordance
with written procedures. Procedural controls are strictly enforced
to ensure that the equipment will be performing as designed each
time it is dispatched to a reactor site and each time a loaded
container is released to a carrier for transport.
In summary, the IF 300 shipping package will provide years of safe,
dependable service in the movement of irradiated fuel assemblies.
5.12 SECTION CONCLUSION
This section has examined the IF 300 shipping package design under
normal and accident conditions. Under even the most conservative
assumptions, the cask and associated equipment totally comply with
the requirements of 10 CFR 71.
5.13 REFERENCES
The references listed below, one through 20, are those referenced
in the text. Under Section 5.13.1 are listed other references that
have been used at various times throughout the history of the IF-300
cask.
1. "Reactor Handbook, Vol. I - Materials," 2nd Edition,
C.R. Tipton, Jr.
2. "Strength of Materials," Parts I and II, 3rd Edition, Timoshenko.
3. "Formulas for Stress and Strain," 4th Edition, Raymond J. Roark.
4. "Theory of Elastic Stability," S. Timoshenko, 1st Edition.
5. C.E. Coleman, D. Mills, J. Van Der Kuur. "Deformation Parameters
of Neutron-Irradiated Zircaloy-4 at 3006C", Canadian Met. Quart. 11
(1), 1972, p. 91.
5-307
NEDO-10084-3September 1984
6. A.A. Wells. "Application of Fracture Mechanics at and Beyond
General Yielding", British Welding Journal, November 1968, p. 563. u
7. R.C. Hoagland and R.G. Rowe, "Fracture of Irradiated Zircaloy-2",
J. Nucl. Mats. 30, 1969, p. 179.
8. H.T. Corten and A.K. Shoemaker. "Fracture Toughness of Structural
Steels as a Function of the Rate Parameters Tln (A/c)",
J. Basic Eng. Trans. ASME 89, 1967, p. 86.
9. J.M. Krafft and A.M. Sullivan. "Effects of Speed and Temperature
on Crack Toughness and Yield Strength in Mild Steel." Trans
ASM 56, 1963, p. 160.
10. B. Watkins, A. Cowan, G.W. Parry and B.W. Pickles. "Embrittle-
ment of Zircaloy-2 Pressure Tubes" ASTM-STP-458, 1968, p. 141.
11. A. Cowan and W.J. Langford. "Effects of Hydrogen and Neutron
Irradiation on the Fracture of Flawed Zircaloy-2 Pressure Tubes",
J. Nucl. Mats. 30, 1969, p. 271.
12. J.H. Schemel. "Tension Testing Variables in Zirconium",
ASTM-STP-458, 1968, p. 347.
13. J.B. Melehan. "Yankee Core Evaluation Program, Final Report",
WCAP-3017-6094, January 1971.
14. D. Lee. "The Strain Rate Dependant Plastic Flow Behavior of
Zirconium and Its Alloys, Met. Trans. 1, 1970, p. 1607.
15. D.S. Clark. "The Influence of Impact Velocity on the Tensile
Characteristics of Some Aircraft Metals and Alloys", NACA
Technical Note No. 868.
5-308
NEDO-10084-3February 1985
16. W.K. Anderson, C.J. Beck, A.R. Kephart and J.S. Theilacker.
"Reactor Structural Materials: Engineering Properties as
Affected by Nuclear Service", ASTM-STP-314 (1962). p. 62.
17. R.L. Knecht and P.J. Panakaskie. "Zircaloy-2 Pressure Tubing",
USAEC Report BNWL-746, Dec. 1968.
18. G.T. Hahn and A.R. Rosenfield. "Mechanics and Metallurgy of
Brittle Crack Extension", BMI Progress Report to Ship
Structure Committee, Project SR-165, September 12, 1966.
19. D.G. Hardy. "The Effect of Neutron Irradiation on the
Mechanical Properties of Zirconium Alloy Fuel Cladding on
Uniaxial and Biaxial Tests", ASTM-STP-484, 1979, p. 215.
20. "Elasto-Plastic Response of Timoshenko Beams", R.K. Wen and
N. Beylerian, Journal of the Structural Division, ASCE,
June, 1967.
21. "Irradiated Fuel Shipping Cask Design Guide," L.B. Shappert,
ORNL-TM-2410, January 1969.
22. "Aircraft Structures," David J. Perry, McGraw-Hill, 1950.
23. "Single Bellows Design Analysis," Pathway Bellows
Incorporated, June 22, 1971.
24. "Fundamentals of Earthquake Engineering", N.M. Newmark and
E. Rosenblueth, p. 109.
25. T. Ishizaki and K.J. Bathe. "On Finite Element Large
Displacement and Elastic-Plastic Dynamic Analysis of Shell
Structures", Computers and Structures, Vol. 12, pp. 309-318,
1980.
5-309
NEDO-10084-3September 1984
26. K.J. Bathe, E. Ramm and E.L. Wilson. "Finite Element
Formulations for Large Deformation Dynamic Analysis",
International Journal for Numerical Methods in Engineering,
Vol. 9, pp. 353-386, 1975.
27. K.J. Bathe and H. Ozdemir. "Elastic-Plastic Large Deformation
Static and Dynamic Analysis", Computers and Structures,
Vol. 6, pp. 81-92, 1976.
28. K.J. Bathe and S. Bolourchi. "Large Displacement Analysis of
Three-Dimensional Beam Structures", International Journal for
Numerical Methods in Engineering, Vol. 14, pp. 961-986, 1979.
5.13.1 Other References
The following references have also been used during design and
development of the IF-300, but are not specifically referenced in
this test.
* "ASME Boiler and Pressure Vessel Code," 1968, Section II and
Section III.
* "Elements of Strength of Materials,:" 4th Edition, Timoshenko
and Young.
* NRC "10 CFR Part 71."
* "General Notes," FRO 028, General Electric Company.
* "Rings and Arcuate Beams," Alexander Blake, Product Engineer-
ing, January 7, 1968.
* "Behavior of Stainless Steel Columns and Beams", A.L. Johnson
and C. Winter, Transactions, ASCE, Vol. 92, No. ST5, Oct. 1966,
Pages 97-118.
5-310
NEDO-10084-3September 1984
* "Structural Analysis of Shipping Casks, Vol. 6 - Impact Testing
of a Long Cylindrical Lead-Shielded Cask Model," B.B. Klima,
L.B. Shappert, and W.C.T. Stoddart, ORNL-TM-1312, March 1968.
* "Resistance of Materials," 4th Edition, Seely and Smith.
* "Pressure Vessel and Piping Design," Collected Papers of the
ASME, 1927-1959.
* "Design of Maching Elements," 3rd Edition, V.M. Faires.
* AISC "Manual of Steel Construction," 6th Edition.
* "Bulletin 06-158," April 1969; "Bulletin 06-065," December
1967; and "Selection Guide to Molycote Solid Film Lubricants,"
Form No. 06-144, Engineering Products Division, Dow-Corning
Corporation, Midland, Michigan.
* "Structural Design for Dynamic Loads," C.H. Norris, et al.
* "Demonstration Fuel Element Shipping Cask from Laminated
Uranium Metal-Testing Program," C.B. Clifford.
* "The Railroad Environment - A Guide to Shippers and Railroad
Personnel," Technical Research Department, New York Central
Railroad Company, 1966.
5-311