nedenef report - home | laboratory of applied...
TRANSCRIPT

1 Experimental1.1 Vehicles
Four different vehicles were used for the Particulates measurements, two diesel (a Renault Laguna and a VW Golf) ones and two gasoline (a Toyota Corolla and a BMW 318) ones. Laguna was measured with three different combinations of aftertreatment, one with its original two oxidation catalysts and the others with two additional different traps. The fuels used were D2, D3, D4 and D5 for the diesel vehicles and G1, G3 for the gasoline.
Table 1 provides the main specifications of the measured vehicles.
1.2 Driving Cycles
The driving cycles decided by the consortium have been driven. Gear changes have been arranged depending on vehicle specifications for the ARTEMIS cycles. Three proposed steady state conditions were also tested, at 50 km/h, 90 km/h and 120 km/h to cover the range from low load, low speed emission rate to high speed, high power operation. Sampling during steady state tests lasted for a few minutes each (typically some 500s) after exhaust gas temperature and emission levels are stabilised. Driving over the transient cycles has been conducted by human drivers. Steady state tests were run, arranging the vehicle throttle by an external potentiometer.
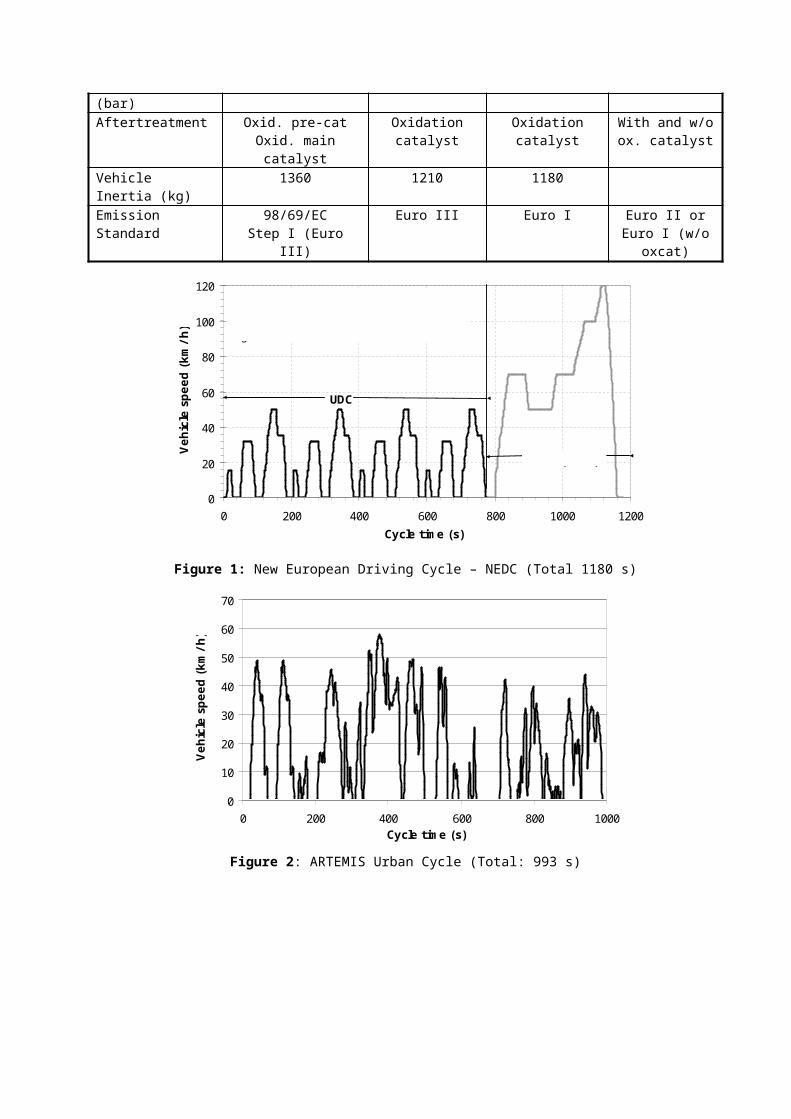
Table 1: Test vehicle specificationsVehicle Renault Laguna Toyota Corolla BMW 318i VW GolfEngine Type 1,9 dCi (F9Q718) 2ZZ-GECapacity (l) 1,87 1,79 1,79 1.89Cylinder number 4 4 4 4Max. Power (kW @ rpm)
79@4000 192@7800 85@5500 66@4000
Max. Torque(Nm @ rpm)
250@1750 180@6800 165@4250 182@2300
Engine concept Common rail (CR) direct injection
Variable timing-lift
valves, MPI
MPI Pump-line injection
CR pressure (bar) max 1350 - -Aftertreatment Oxid. pre-cat
Oxid. main catalystOxidation catalyst
Oxidationcatalyst
With and w/o ox. catalyst
Vehicle Inertia (kg)
1360 1210 1180
Emission Standard
98/69/EC Step I (Euro III)
Euro III Euro I Euro II or Euro I (w/o oxcat)
1
0
20
40
60
80
100
120
0 200 400 600 800 1000 1200Cycle time (s)
Vehi
cle
spee
d (k
m/h
)
UDC
EUDC (400s)
New European Driving Cycle(NEDC). Engine starts from ambient temperature. Sampling starts together with engine start.
Figure 1: New European Driving Cycle – NEDC (Total 1180 s)
0
10
20
30
40
50
60
70
0 200 400 600 800 1000Cycle time (s)
Vehi
cle
spee
d (k
m/h
)
Figure 2: ARTEMIS Urban Cycle (Total: 993 s)
0
20
40
60
80
100
120
0 100 200 300 400 500 600 700 800 900 1000 1100Cycle time (s)
Vehi
cle
spee
d (k
m/h
)
Figure 3: ARTEMIS Road Cycle (Total: 1082 s)

0
20
40
60
80
100
120
140
0 100 200 300 400 500 600 700 800 900 1000 1100Cycle time (s)
Vehi
cle
spee
d (k
m/h
)
Figure 4: ARTEMIS Motorway Cycle. Maximum speed 130 km/h (Total: 1068 s)
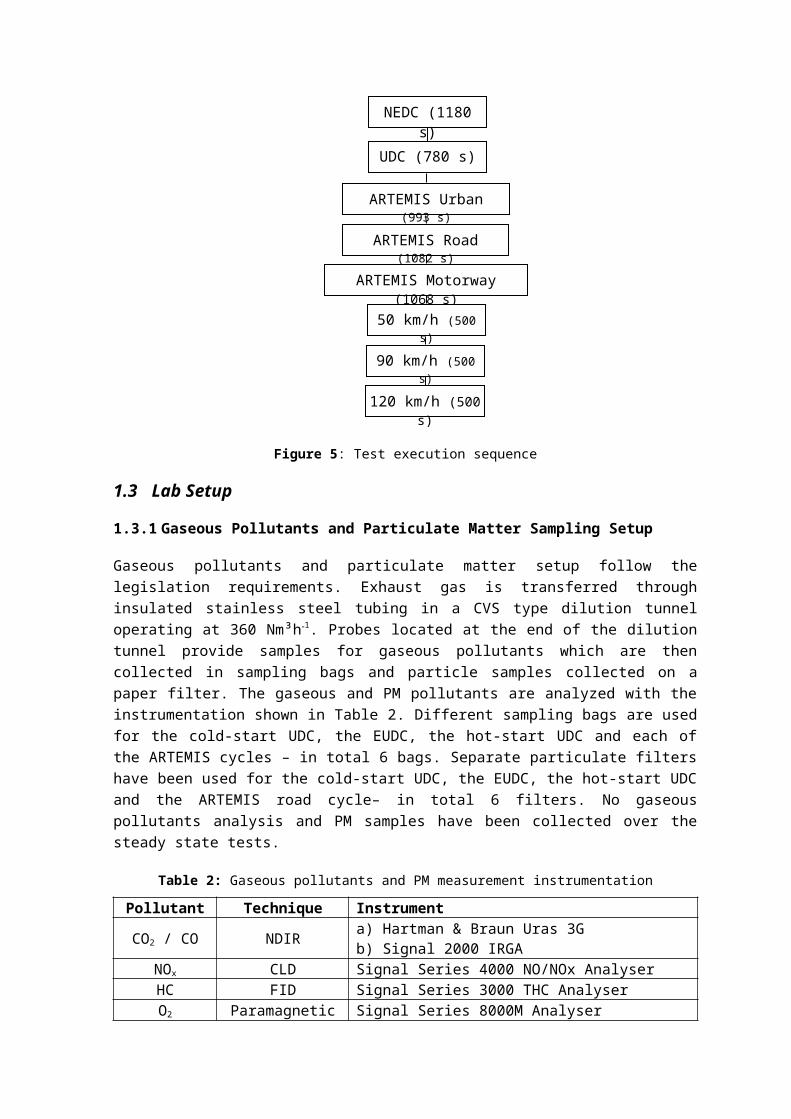
The following flow chart presents the driving cycle execution sequence for the measurement protocol. The initial cold-start NEDC is followed by a hot-start UDC and then the three ARTEMIS cycles follow. Testing ends with three steady-state speed tests. Test at 50 km/h is conducted with 3 rd gear engaged and power absorption 3,5 kW. The 90 km/h test is conducted with 5 th gear engaged and power absorption 10 kW. Finally, the 120 km/h is conducted with 5th gear engaged and power absorption 21 kW. The total sampling time only, equals 6600 s (~1,8 h).
Figure 5: Test execution sequence
NEDC (1180 s)
UDC (780 s)
ARTEMIS Urban (993 s)
ARTEMIS Road (1082 s)
ARTEMIS Motorway (1068 s)
50 km/h (500 s)
90 km/h (500 s)
120 km/h (500 s)
3
1.3 Lab Setup
1.3.1 Gaseous Pollutants and Particulate Matter Sampling Setup
Gaseous pollutants and particulate matter setup follow the legislation requirements. Exhaust gas is transferred through insulated stainless steel tubing in a CVS type dilution tunnel operating at 360 Nm³h 1. Probes located at the end of the dilution tunnel provide samples for gaseous pollutants which are then collected in sampling bags and particle samples collected on a paper filter. The gaseous and PM pollutants are analyzed with the instrumentation shown in Table 2. Different sampling bags are used for the cold-start UDC, the EUDC, the hot-start UDC and each of the ARTEMIS cycles – in total 6 bags. Separate particulate filters have been used for the cold-start UDC, the EUDC, the hot-start UDC and the ARTEMIS road cycle– in total 6 filters. No gaseous pollutants analysis and PM samples have been collected over the steady state tests.
Table 2: Gaseous pollutants and PM measurement instrumentationPollutant Technique InstrumentCO2 / CO NDIR a) Hartman & Braun Uras 3G
b) Signal 2000 IRGANOx CLD Signal Series 4000 NO/NOx AnalyserHC FID Signal Series 3000 THC AnalyserO2 Paramagnetic Signal Series 8000M Analyser
PM Filter weighingWeighing of Pallflex TX40 47 mm (Borosilicate microfibers reinforced with woven glass cloth and bonded with PTFE) filters on a Mettler Toledo UMX2 balance (sensitivity 10-7 g)
1.3.2 Particle Sampling Setup
Three different sampling setups were used during the measurements. The basic outline of those is the same. After primary dilution the gas stream is splitted in two fractions. One fraction of the diluted exhaust is drawn through the dry branch and the rest through the wet branch. The main difference between them is how the ejector dilutors were used. For the diesel vehicles without trap the two injectors were placed in a row with a mixing throttle placed between them. This was done in order to increase the total dilution ratio to avoid saturation of the CPC.
Block-diagrams of the sampling systems are given in Figure 6a for diesel vehicles, Figure 6b for the gasoline and in Figure 6c for the diesel vehicle equipped with the particle traps. A photo of the actual installation is shown in

Figure 7. The different parts of the sampling system are described in the following sections.
SecondaryD ilu tion
D iffusionC harger
SM PS orDM A/CPC
ELPI
AgingC ham ber
Heater
D enuder
3 bar3 bar
C oolingW aterInlet
Exhaust
M ass F lowC ontro lle r
S ilica G e l
C harcoa lH EPAFilte r
3 bar
W ater F lowon/o ff V a lve
D ilu tion A ir L ineSam ple L ine
F ilte r
F lowm eter
SecondaryD ilu tion
filter
m ixingthrottle
Figure 6a: Block diagram of particle sampling system for diesel vehicles
SecondaryDilution
DiffusionCharger CPC
ELPI
AgingChamber
Heater
Denuder
3 bar3 bar
CoolingWater Inlet
Exhaust
Mass FlowController
Silica Gel
CharcoalHEPAFilter
3 bar
Water Flowon/off Valve
Dilution Air LineSample Line
Filter
Flowmeter
SecondaryDilution
SMPS
Figure 6b: Block diagram of particle sampling system for gasoline vehicles
5

DiffusionCharger
SMPS orDMA/CPC
ELPI
AgingChamber
Heater
Denuder
3 bar3 bar
CoolingWaterInlet
Exhaust
Mass FlowController
Silica Gel
CharcoalHEPAFilter
Water Flowon/off Valve
Dilution Air LineSample Line
Filter
Flowmeter
SecondaryDilution
Figure 6c: Block diagram of particle sampling system for diesel vehicle with particle trap

Figure7: Actual vehicle and measurement system setup
1.3.2.1 Dry Branch
After primary dilution, the sample flow is split to two. One follows the so-called “dry” branch where particle sample is stripped from its volatile components. This is necessary to collect and analyse only solid particles. Separation of the volatile phase is made possible with the thermodenuder unit which is described in following paragraphs. Solid particles are analysed with an Electrical Low Pressure Impactor (ELPI), manufactured by Dekati Ltd., Finland. The convention “dry” comes from the fact that particles obtained in this branch do not contain volatile species. Thermodenuder was working at 250 oC during the measurements, with a period of half of hour before the beginning of measurements was at 300 oC.
1.3.2.2 Wet Branch
The “wet” branch starts with an ageing chamber where the particle phase is equilibrated with the dilution air. “Wet” in this case stands for the branch that allows both solid and volatile particles to be sampled. The wet-branch is further split to two. The larger fraction of the flow is led to a paper filter, used for quality control reasons by comparison with the CVS filter. A smaller fraction is further diluted appropriately by cascaded ejector dilutors and is sampled by
7
Denude
SMPS
ELPI
Connector & transducer
Dilutor controlle
r
Ageing Chambe
r
EjectorDilutors
Data Logging PC
To CVS

the instrumentation. The filter has been replaced (in the case of diesel vehicles) with a Gravimetric Impactor in some of the measurements to provide the relative mass-weighted distribution of the particle samples. The aerosol instruments used in the wet-branch for recording different particle properties include the Condensation Particle Counter (CPC TSI 3010) for number concentration recording and a Diffusion Charger for “active” surface. The CPC is replaced by a Scanning Mobility Particle Sizer (SMPS TSI 3936) in steady state tests to determine the number weighted size-distribution of particles.
1.3.2.3 Thermodenuder
The thermodenuder (Dekati, Inc.) is used to isolate the solid particle phase. The exhaust sample is heated to 250°C where most of the volatile species in the vehicle exhaust (hydrocarbons and sulphates) are volatilised. After heating, the sample flows through an adsorber section where it is cooled and the volatilised hydrocarbons are adsorbed onto active charcoal. The thermodenuder has an annular design. The adsorbing material is placed both sides of the sample flow. The inner cylinder is cooled by forced convection and the outer cylinder by natural convection. This kind of design was applied since the length of the tubular adsorber section for high flow rates would have been impracticably long. The adsorber material is fibrous active charcoal. This device removes approximately 90% of the volatile organic compounds in the sample flow. Because of the difference in diffusion speeds of the vapour molecules and particles, mainly the hydrocarbon and sulphate vapours are adsorbed onto the active charcoal. However, a fraction, especially of the smaller particles, is also lost by diffusion on the walls. These losses are estimated at about 30-40%. However, since these do not depend on fuel properties but on particle size, no correction has been applied to account for these losses.
1.3.2.4 Ejector Dilutors
Ejector dilutors (Dekati, Inc.) are utilised to decrease particle concentration and bring the total dilution ratio in the range met after a few seconds of emission in the atmosphere. The operation principle of Dekati dilutor is based in the underpressure developed when the dilution gas is accelerated in an annular nozzle formed in the peripheral of the ejector. This under pressure draws a sample flow through the ejector. If the dilution gas flow is increased the underpressure increases correspondingly and the sample flow also increases. Thus, the dilution ratio remains constant, if the pressure in exhaust pipe is constant (i.e. the pressure drop through the nozzle remains constant), which is practically the case in this sampling system. The dilution air flow is controlled using a critical orifice at the pressurized air inlet. The nominal dilution ratio of the ejector dilutor is 10 : 1. Two ejector dilutors are used in

series. In the case of diesel vehicles, In between, a mixing throttle valve has been placed where the once diluted sample is further mixed with dilution air. The total dilution ratio achieved in the “wet” branch is in the order of 10³:1. Taking also into account the primary dilutor, the total dilution ratio exceeds 104 : 1. For the gasoline cars this valve had been removed and the “wet” branch dilution ratio was an order of magnitude lower, about 102 : 1.
1.3.2.5 Electrical Low Pressure Impactor - ELPI
The principle of particle size classification of the ELPI is the inertial impaction of particles on the different stages of the impactor, according to their size. In that respect, ELPI works as a conventional mass collecting impactor. The sample flow through the impactor is calibrated by adjusting the underpressure achieved by the vacuum pump at the outlet of the instrument. The low absolute pressure at the lower stages of the instrument allows the collection of nanoparticles down to 25 nm aerodynamic equivalent diameter. Prior to their introduction to the impactor, particles are charged by a corona charger with a number of elementary charges according to their size. The charge is measured by an electrometer as particles are collected at the different stages in the impactor. In total, 12 stages in the impactor classify particles from 25 nm to 6,84 m aerodynamic diameter. In its latest version, ELPI is also equipped with an electrical insulated back-up absolute filter. The filter is placed at the outlet of the impactor to collect particles below 25 nm aerodynamic diameter. The charger has been also modified appropriately to increase the charging efficiency for very small particles. This extends the particle size range with an additional class at 7 nm – 25 nm. This version of ELPI was used for the experiments. Also, sintered collection plates have been used as collection material. Sintered plates have the advantage of decreasing particle bounce and increasing the quantity of particles collected on each stage. After the end of the measurements ELPI’s plates and charger were cleaned by ultra sonic bath. In the case of gasoline cars and the diesel with traps the cleaning procedure was repeated after three measuring days.
1.3.2.6 Scanning Mobility Particle Sizer - SMPS
SMPS comprises of the Differential Mobility Diameter (DMA) and the Condensation Particle Counter (CPC), both of which are manufactured by TSI Inc., USA.
The Long DMA (model TSI 3080) is the main component for sizing aerosols. Given a polydisperse aerosol at the inlet of the instrument, the output is a monodisperse aerosol of known particle size (based on particle electrical mobility). The instrument also comprises the controller unit to control flows and the high-voltage source. The internal high voltage controller produces a negative centre rod in the DMA. This control can be set from 0 to 10 kV. As the
9

voltage setting changes, the monodisperse particle diameter also changes. This is because prior to entering the DMA, particles are exposed to high concentrations of bipolar ions produced by a Kr-85 bipolar charger. The particles and ions undergo frequent collisions due to the random thermal motion of the ions. The particles quickly reach a state of equilibrium, in which the particles carry a bipolar charge distribution. Depending on their charge, some particle are attracted by the centre rod (positive charged ones), repelled from it (negative ones) or not influenced at all (neutral). Those with a certain charge and size enter a slot at the base of the central rod and leave the instrument forming a monodisperse flow. By scanning the voltage in the central rod, various particle sizes may be selected. Because of the small slot size, the size distribution of particles entering it for a given voltage is very narrow. Additionally, due to the scanning of the voltage, the instrument is only appropriate for steady state tests (constant particle distribution).
The number concentration of each particle size bin is determined by the CPC which is connected in the monodisperse outlet. Model 3010 CPC measures the number concentration of individual particles. All particles entering the instrument are detected by condensing alcohol vapour onto their surface, causing them to grow into droplets. Then, a simple optical particle detector counts these particles. The lower cut-point of the instrument can be adjusted by trimming the temperatures of two separate chambers in the instrument. One chamber is kept at relative high temperature to evaporate alcohol (saturator) and the other at low temperature to condense alcohol on the particles (condenser). Measurements will be conducted at a temperature of 25°C which brings the d50% cutpoint at 7 nm. If the CPC is directly connected in the ejector dilutor outlet, without the DMA intervening then the total number concentration can be recorded in real-time.
The impactor type used for the Particulate measurements was the 0.0508 cm and the sheath flow was set at 10.8 lpm, while the range of measured diameters was from 7.64 nm to 289 nm.
1.3.2.7 Diffusion Charger - DC
In the DC, a corona discharge forms in the periphery of a thin wire at high voltage. The corona generates positive ions that diffuse onto aerosol particles and charge them. The combination of the charger with an aerosol electrometer results in an electrical aerosol detector that is capable of measuring particle concentrations. If no special classifier is used before ASMO, the diffusion charger response is related to an integral value of surface that is generally known as “active” surface area. In a DC, a direct measurement of the “active” surface is based on using unipolar ions as trace compounds transferring into particle phase. In order to exclude interference from large particles, all

particles with aerodynamic diameter >1 μm are separated by an impactor. Particles <1 μm are collected on the filter stage (47 mm Pallflex). Those charged, produce an electrical current I, which is recorded, and according to instrument’s calibration this results to a direct reading of active particle surface in real time. The calibration has been performed in steady state tests by correlating the diffusion charger’s current with the surface calculated from SMPS mobility size distribution, assuming spherical particles. “Active” surface is an elegant particle property which corresponds to the diffusion-active particle surface. It is equal to the geometric particle surface area in the free molecular region and correlates with particle mobility diameter over all size ranges. Diffusion charger was being cleaned at the end of a period of three measuring days.
1.3.2.8 Gravimetric Impactor
A gravimetric impactor (Dekati Inc.) has been designed in place of the quality-control filter in some of the measurements. The gravimetric impactor provides the mass weighted size distribution and consists of a pre-separator at 10 μm, four impactor stages with d50% diameters at 2,5, 1, 0,5 and 0,2 μm and a filter stage to collect any particles below this point. This impactor is not a real-time instrument because it requires weighing of the impaction substrate before and after measurement to determine mass of particles collected on each stage. Given the low particle losses in the instrument, it can be used for determination of the emission rate at steady state conditions by summing the mass collected on each stage. Heating of the samples collected in inert atmosphere may also determine the volatile / non volatile fraction of the mass collected.
The gravimetric impactor had been utilised only in the case of diesel vehicles, while in the gasoline cars only a 70 mm TX40 filter used. The filter stages were also TX40 but with a diameter of 47 mm. Measurements with DGI or the filter only were conducted for the NEDC and Artemis Motorway cycles and the 50 km/h steady state. The flowrate through DGI was set to 70 lpm. It must be noted that in some NEDC cycles for the diesel vehicles the flowrate of DGI was adjusted constantly to 70 lpm. This had been done because filters were loaded gradually with a result of the DGI’s flowrate dropping up to 67 lpm. This reduction of flowrate had an impact on primer dilution ratio increasing it up to three units in the end of NEDC. So that it was necessary to make this adjustment. See table xx for details.
1.3.2.9 Particle information provided by the measurement set-up
Based on the sampling set-up and the instruments selected, the following particle properties have been recorded during measurements ([RT] stands for
11

Real Time, [CYCLE] for integrated results over a cycle, [SS] stands for Steady State):
Total active surface equivalent [RT] - wet branch with DC
Size segregated solid particle number [RT] - dry branch with ELPI
Total particle number [RT] - wet branch with CPC
Gaseous pollutants [RT] - with gas analysers
Number weighted size distribution [SS] - wet branch with SMPS
PM mass [CYCLE] – filter at CVS (not in all cycles)
Particle mass distribution [CYCLE] – Impactor at wet branch in selective cycles
Fuel consumption [RT] – fuel weighting
1.3.3 Primary Dilution Ratio measurement
Primer dilution ratio was measured for every cycle and also for the steady states measurements. The real time concentration of raw and diluted CO2 was recorded and their signals, after being synchronized, where used to calculate the primary dilution ratio with the following equation:
.
1.3.4 Ejector Dilutors Calibration
Ejector dilutors calibration was performed using pure NO diluted in N2. The dilution ratio was calculated from the following simple equation:
. This calibration was performed at the beginning and at
the end of every measurement period i.e. when changing the vehicle or its aftertreatment technology.

1.4 Fuel Matrix
Six fuel types available in the project have been used, four diesel (D2-D5) and two gasoline (G1 and G3). The main specifications of these fuels are presented in table 3 and table 4 respectively. The D1 to D4 diesel fuels differs only in the sulphur content, with the D4 having the lowest content. D5 is the Swedish Class 1 diesel fuel. Information on the fuels may be found in Deliverable 5.
2 Results2.1 Calculations Procedure
Calculations were done with the last partcalc.xls version available by LAT (6/9/03) and the results were transferred to LAexport.xls. An excel file (partcalc_results.xls) was used to visualize the results from LAT. Partcalc_results.xls is linked directly to LAexport.xls, so these two files must be placed in the same folder.
The names of the protocols files for each vehicle are presented in the next table.LA02 Laguna 16/4-9/5/03LA01 Corolla 15/5-20/5/03LA03 BMW 26/5-30/5/03LA04 Golf+CAT 5/6-12/6/03LA08 Golf NO CAT 13/6-17/6/03LA05 Laguna+trap1 1/7-4/7/03LA06 Laguna 8/7-9/7/03LA07 Laguna+trap2 EOLYS 11/7-14/7/03
Sequence of measurements
13

BranchΠρόγραμμα μετρήσεων PARTICULATES DA PDR SDR1 SDR1-2 ELPI DDC CPC SMPS DGI DGI
15/4/200316/4/2003 Laguna Euro III D2 33 12.5 7.6 820 dry wet wet wet wet 3*(1+4)17/4/2003 Laguna Euro III D2 33 12.5 7.6 820 dry wet wet wet wet 3*(1+4)18/4/2003 Laguna Euro III D3 33 12.5 7.6 820 dry wet wet wet wet 3*(1+4)21/4/2003 Laguna Euro III D3 33 12.5 7.6 820 dry wet wet wet wet 3*(1+4)
5/5/2003 Laguna Euro III D4 33 12.5 7.6 820 dry wet wet wet wet 3*(1+4)7/5/2003 Laguna Euro III D4 33 12.5 7.6 820 dry wet wet wet wet 3*(1+4)8/5/2003 Laguna Euro III D5 33 12.5 7.6 820 dry wet wet wet wet 3*(1+4)9/5/2003 Laguna Euro III D5 33 12.5 7.6 820 dry wet wet wet wet 3*(1+4)
14/4/2003 Μέτρηση αραιωτήρων, καθαρισμός συστήματος 15/5/2003 Corolla Euro III G3 33 12.5 7.3 85 dry wet wet wet wet 3*116/5/2003 Corolla Euro III G3 33 12.5 7.3 85 dry wet wet wet wet 3*119/5/2003 Corolla Euro III G1 33 12.5 7.3 85 dry wet wet wet wet 3*120/5/2003 Corolla Euro III G1 33 12.5 7.3 85 dry wet wet wet wet 3*121/5/2003 Peugeot 106 Δεν βόλευε η εξάτμιση του Peugeot, αντικατάσταση με BMW26/5/2003 BMW Euro I G1 33 12.5 7.3 85 dry wet wet wet wet 3*127/5/2003 BMW Euro I G1 33 12.5 7.3 85 dry wet wet wet wet 3*128/5/2003 Συντήρηση CVS29/5/2003 BMW Euro I G3 33 12.5 7.3 85 dry wet wet wet wet 3*130/5/2003 BMW Euro I G3 33 12.5 7.3 85 dry wet wet wet wet 3*1
2/6/2003 Μέτρηση αραιωτήρων, καθαρισμός συστήματος 3/6/20034/6/20035/6/2003 Golf+CAT Euro II D4 33 12.5 7.6 820 dry wet wet wet wet 3*(1+4)6/6/2003 Golf+CAT Euro II D4 33 12.5 7.6 820 dry wet wet wet wet 3*(1+4)9/6/2003 Golf+CAT Euro II D3 33 12.5 7.6 820 dry wet wet wet wet 3*(1+4)
10/6/2003 Golf+CAT Euro II D3 33 12.5 7.6 820 dry wet wet wet wet 3*(1+4)11/6/2003 Golf+CAT Euro II D2 33 12.5 7.6 820 dry wet wet wet wet 3*(1+4)12/6/2003 Golf+CAT Euro II D2 33 12.5 7.6 820 dry wet wet wet wet 3*(1+4)13/6/2003 Golf no cat Euro I D2 33 12.5 7.6 820 dry wet wet wet wet 3*(1+4)17/6/2003 Golf no cat Euro I D2 33 12.5 7.6 820 dry wet wet wet wet 3*(1+4)18/6/2003 Κλειστο το πανεπιστημιο λόγω της συνοδου κορυφης19/6/2003 Κλειστο το πανεπιστημιο λόγω της συνοδου κορυφης20/6/2003 Κλειστο το πανεπιστημιο λόγω της συνοδου κορυφης23/6/2003 Συναρμολόγηση εξοπλισμου που ειχε μεταφερθει εκτός πανεπιστημίου. Καθαρισμός συστήματος24/6/2003 Δέσιμο παγιδας στην Laguna25/6/2003 Μέτρηση αραιωτήρων και καθαρισμός τους26/6/2003 Δέσιμο Laguna, conditioning, καθαρισμός συστήματος 27/6/200330/6/2003 Τοποθέτηση παγιδας,Μέτρηση αραιωτήρων
1/7/2003 Laguna+TRAP1 Euro IV D4 D4+CSF --> Τin, Ττοτ,Δp +CO,Nox,Hcdil from CVS και πλήρες Particulates2/7/2003 Laguna+TRAP1 Euro IV D4 D4+CSF --> Τin, Ττοτ,Δp +CO,Nox,Hcdil from CVS και πλήρες Particulates3/7/2003 Laguna+TRAP1 Euro IV D3 D3+CSF --> Τin, Ττοτ,Δp +CO,Nox,Hcdil from CVS και πλήρες Particulates4/7/2003 Laguna+TRAP1 Euro IV D3 D3+CSF --> Τin, Ττοτ,Δp +CO,Nox,Hcdil from CVS και πλήρες Particulates7/7/2003 Τοποθέτηση παγιδας, αλλαγή καυσίμου και conditioning8/7/2003 Laguna NO TRAP Euro IV D4 Mόνο ΝEDC+hot UDC and SS9/7/2003 Laguna NO TRAP Euro IV D4 Mόνο ΝEDC+hot UDC and SS
10/7/2003 Τοποθέτηση παγιδας, αλλαγή καυσίμου και conditioning και μέτρηση αραιωήρων11/7/2003 Laguna+TRAP2 Euro IV D4 D4+NGK+Eolys 25 ppm
-->Τin, Ττοτ,Δp +CO,Nox,Hcdil from CVS και πλήρες πρωτόκολλο Particulates14/7/2003 Laguna+TRAP2 Euro IV D4 D4+NGK+Eolys 25 ppm
-->Τin, Ττοτ,Δp +CO,Nox,Hcdil from CVS και πλήρες πρωτόκολλο Particulates18/7/2003 Laguna Πρώτη μέτρηση με σκοπο την σύγκριση DGI και CVS. Μετρηση με καυσιμο από το ARTEMIS.
Το σύστημα μέτρησης βρισκεται πίσω από το όχημα (δηλ. μέτρηση όπως οι προηγούμενες)Κύκλοι δύο επαναλήψεις NEDC και 50 km/h
24/7/2003 Laguna Καύσιμο ARTEMIS. Μέτρηση μόνο με το DGI στο κανάλι24/7/2003 Laguna Καύσιμο ARTEMIS. Μέτρηση με ELPI, CPC, SMPS,denuder στο καναλι-ΔΕΝ μπήκε ο DGI
3*(1+4)--> τρεις φορες μπήκε ο DGI με ένα φιλτρο 70 mm και τα 4 stages (47mm)3*1-->tρεις φορες μπήκε ο DGI μoνο με ένα φιλτρο 70 mmΟ DGI χρησιμοποιηθηκε στους NEDC, Artemis Motorway kai 50 km/h
NOTE! The sequence of these files must be followed exactly as showed in the previous table in order to partcalc_results.xls will not misunderstand the vehicles and the visualized results will be erroneous. Every time that partcalc.xls is used you have to fill by hand the results of gaseous pollutants. So you have to back up the last data of LAexport.xls. The three mentioned files are stored in the same folder as the raw data (…particulates/calculations).
LAexport.xls contains results that include the correct efficiencies for ELPI and SMPS. ELPI’s sintered plates had been included in the calculations.
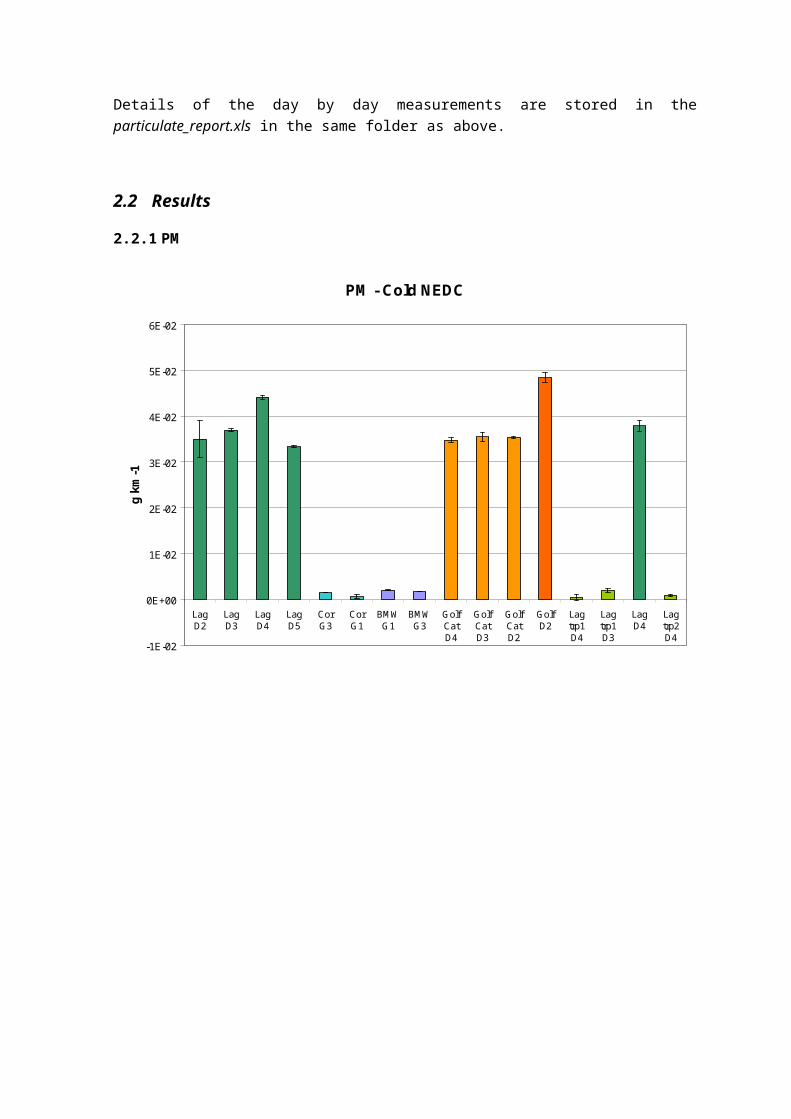
Details of the day by day measurements are stored in the particulate_report.xls in the same folder as above.

2.2 Results
2.2.1 PM
PM - Cold NEDC
-1E-02
0E+00
1E-02
2E-02
3E-02
4E-02
5E-02
6E-02
LagD2
LagD3
LagD4
LagD5
CorG3
CorG1
BMWG1
BMWG3
GolfCatD4
GolfCatD3
GolfCatD2
GolfD2
Lagtrp1D4
Lagtrp1D3
LagD4
Lagtrp2D4
g km
-1
15
2.2.2 “Wet” Branch
Active Surface Area - Cold NEDC
1.E+01
1.E+02
1.E+03
1.E+04
1.E+05
1.E+06
LagD2
LagD3
LagD4
LagD5
CorG3
CorG1
BMWG1
BMWG3
GolfCatD4
GolfCatD3
GolfCatD2
GolfD2
Lagtrp1D4
Lagtrp1D3
LagD4
Lagtrp2D4
cm2
km-1
CPC Total N - Cold NEDC
1.E+10
1.E+11
1.E+12
1.E+13
1.E+14
1.E+15
LagD2
LagD3
LagD4
LagD5
CorG3
CorG1
BMWG1
BMWG3
GolfCatD4
GolfCatD3
GolfCatD2
GolfD2
Lagtrp1D4
Lagtrp1D3
LagD4
Lagtrp2D4
km-1

SMPS distribution - 50 km/h
1.E+08
1.E+09
1.E+10
1.E+11
1.E+12
1.E+13
1.E+14
1.E+15
1 10 100 1000nm
dN/d
logd
p km
-1
Lag D2Lag D3Lag D4Lag D5Cor G3Cor G1BMW G1BMW G3Golf Cat D4Golf Cat D3Golf Cat D2Golf D2Lag trp1 D4Lag trp1 D3Lag D4Lag trp2 D4
SMPS distribution - 120 km/h
1.E+08
1.E+09
1.E+10
1.E+11
1.E+12
1.E+13
1.E+14
1.E+15
1.E+16
1 10 100 1000nm
dN/d
logd
p km
-1
Lag D2Lag D3Lag D4Lag D5Cor G3Cor G1BMW G1BMW G3Golf Cat D4Golf Cat D3Golf Cat D2Golf D2Lag trp1 D4Lag trp1 D3Lag D4Lag trp2 D4
17

2.2.3 “Dry” Branch
ELPI N Stages 1-7 - Cold NEDC
1.E+10
1.E+11
1.E+12
1.E+13
1.E+14
1.E+15
LagD2
LagD3
LagD4
LagD5
CorG3
CorG1
BMWG1
BMWG3
GolfCatD4
GolfCatD3
GolfCatD2
GolfD2
Lagtrp1D4
Lagtrp1D3
LagD4
Lagtrp2D4
km-1
ELPI Dg Stages 1-7 - Cold NEDC
0
10
20
30
40
50
60
70
LagD2
LagD3
LagD4
LagD5
CorG3
CorG1
BMWG1
BMWG3
GolfCatD4
GolfCatD3
GolfCatD2
GolfD2
Lagtrp1D4
Lagtrp1D3
LagD4
Lagtrp2D4
nm