nec global - consolidated financial results for the …press release - media contacts: seiichiro...
TRANSCRIPT

Press Release - Media Contacts: Seiichiro Toda/Joseph Jasper TEL: +81-3-3798-6511
***** For immediate use October 30, 2014
Consolidated Financial Results for the First Half of the Fiscal Year
Ending March 31, 2015 Consolidated Financial Results
Six Months ended
September 30, 2013
Six Months ended
September 30, 2014 Change
In billions of yen In billions of yen %
Net Sales 1,383.1 1,324.8 -4.2
Operating income (loss) 0.4 21.5 -
Ordinary income (loss) -14.5 16.7 -
Net income (loss) -26.2 12.5 -
Yen Yen Yen
Net income (loss) per share:
Basic -10.06 4.79 14.85
Diluted - - -
As of
March 31, 2014
As of
September 30, 2014 Change
In billions of yen In billions of yen %
Total assets 2,505.3 2,447.7 -2.3
Net assets 767.7 757.9 -1.3
(Notes)
Number of consolidated subsidiaries and affiliated companies accounted for by the equity method is as
follows:
As of
September 30, 2013
As of
September 30, 2014
As of
March 31, 2014
Consolidated subsidiaries 269 244 258
Affiliated companies accounted
for by the equity method 53 50 51
1

1. Consolidated Business Results
(1) Overview of the first half of the fiscal year ending March 31, 2015 (six months ended September
30, 2014)
The worldwide economy during the six months ended September 30, 2014 was characterized by
higher stock prices and low interest rates continuing in the United States due to monetary easing
policy, in addition to the country’s steady performance in consumer spending and corporate
performance in response to the improving employment situation. The European economy was
characterized by strong performance in the United Kingdom and a gradual recovery in Germany,
despite slow growth in France and Southern Europe. Moreover, economic growth slowed in some
emerging countries, such as China, Brazil and India.
As for the Japanese economy, consumer spending and housing investment decreased due to the
influence of raising the consumption tax rate. Moreover, despite steady investment in public services,
production and investing activity fell in some industries, such as retail and automotive.
Under this business environment, the NEC Group recorded consolidated net sales of 1,324.8
billion yen for the six months ended September 30, 2014, a decrease of 58.3 billion yen
(-4.2%) year-on-year. This decrease was mainly due to the Internet service business and the
mobile phone sales business from Others no longer being consolidated, despite increased
sales from the Public business.
Regarding profitability, operating income (loss) improved by 21.1 billion yen year-on-year,
to an operating income of 21.5 billion yen, mainly due to increased sales in the Public
business and improved mobile phone terminal business.
In terms of ordinary income (loss), the NEC Group recorded an income of 16.7 billion yen,
improving by 31.2 billion yen year-on-year, mainly due to the improving operating income
(loss).
Income (loss) before income taxes and minority interests was an income of 15.4 billion yen,
improving by 25.1 billion yen year-on-year. This was primarily due to improved ordinary
income (loss) and reduced business structure improvement expenses, despite the gain on sales
of subsidiaries and affiliates’ stocks that were recorded in the same period of the previous
fiscal year.
2

Net income (loss) for the first half was an income of 12.5 billion yen, a year-on-year improvement of
38.6 billion yen, primarily due to improved income (loss) before income taxes and minority interests
as well as acquiring minority shareholder interests from making NEC Fielding, Ltd. a wholly-owned
subsidiary.
(2) Results by main business segment
Sales by segment (sales to external customers):
Segments Six months ended
September 30, 2013
Six months ended
September 30, 2014 Change
Public
In billions of yen
303.3
In billions of yen
344.5
%
13.6
Enterprise 130.1 126.7 -2.6
Telecom Carrier 334.0 332.5 -0.5
System Platform 350.7 345.4 -1.5
Others 264.9 175.8 -33.6
Total 1,383.1 1,324.8 -4.2
Operating income (loss) by segment:
Segments Six months ended
September 30, 2013
Six months ended
September 30, 2014 Change
Public
In billions of yen
14.5
In billions of yen
21.9
In billions of yen
7.3
Enterprise 0.7 2.3 1.5
Telecom Carrier 19.4 16.6 -2.8
System Platform 1.8 8.7 6.9
Others -11.8 -2.7 9.1
Adjustment -24.3 -25.2 -0.9
Total 0.4 21.5 21.1
(Note) Amounts in this section “(2) Results by main business segment” are rounded to 0.1 billion
yen. Amounts in millions of yen are shown in section “Segment information” of this news release.
3

(Business segment figures in brackets below denote increases or decreases as compared with the
corresponding period of the previous fiscal year.)
Public Business
Sales: 344.5 billion yen (13.6%)
Operating Income (Loss): 21.9 billion yen (7.3 billion yen)
In the Public business, sales were 344.5 billion yen, an increase of 41.2 billion yen (13.6%)
year-on-year, mainly due to the steady sales for government offices and public services.
Operating income (loss) improved by 7.3 billion yen year-on-year, to an operating income of 21.9
billion yen, mainly owing to increased sales.
Enterprise Business
Sales: 126.7 billion yen (-2.6%)
Operating Income (Loss): 2.3 billion yen (1.5 billion yen)
In the Enterprise business, sales were 126.7 billion yen, a decrease of 3.4 billion yen (-2.6%)
year-on-year, mainly due to the decreased sales for the distribution and service industries.
Operating income (loss) improved by 1.5 billion yen year-on-year, to an operating income of 2.3
billion yen, mainly owing to cost efficiency.
Telecom Carrier Business
Sales: 332.5 billion yen (-0.5%)
Operating Income (Loss): 16.6 billion yen (-2.8 billion yen)
In the Telecom Carrier business, sales were 332.5 billion yen, a decrease of 1.6 billion yen (-0.5%)
year-on-year, mainly due to decreased domestic sales, despite increased international sales.
Operating income (loss) worsened by 2.8 billion yen year-on-year, to an operating income of 16.6
billion yen, mainly due to increased investment expenses related to Software-Defined Networking
(SDN), a next generation networking technology.
4

System Platform Business
Sales: 345.4 billion yen (-1.5%)
Operating Income (Loss): 8.7 billion yen (6.9 billion yen)
In the System Platform business, sales were 345.4 billion yen, a decrease of 5.3 billion yen (-1.5%)
year-on-year, mainly due to decreased sales in enterprise networks.
Operating income (loss) improved by 6.9 billion yen year-on-year, to an operating income of 8.7
billion yen, mainly due to increased profitability and cost efficiency.
Others
Sales: 175.8 billion yen (-33.6%)
Operating Income (Loss): -2.7 billion yen (9.1 billion yen)
In Others, sales were 175.8 billion yen, a decrease of 89.1 billion yen (-33.6%) year-on-year, mainly
due to a decline in mobile phone shipments as well as the Internet service business and the
mobile phone sales business no longer being consolidated.
Operating income (loss) improved by 9.1 billion yen year-on-year, to an operating loss of 2.7 billion
yen, mainly owing to improved mobile phone terminal business.
5

2. Consolidated Financial Condition
Analysis of the condition of assets, liabilities, net assets, and cash flows
Total assets were 2,447.7 billion yen as of September 30, 2014, a decrease of 57.6 billion yen as
compared with the end of the previous fiscal year. Current assets as of September 30, 2014
decreased by 84.0 billion yen compared with the end of the previous fiscal year, to 1,418.9 billion
yen, mainly due to the collection of accounts receivable-trade. Noncurrent assets as of September 30,
2014 increased by 26.4 billion yen compared with the end of the previous fiscal year to 1,028.8
billion yen.
Total liabilities as of September 30, 2014 decreased by 47.8 billion yen compared with the end of the
previous fiscal year, to 1,689.8 billion yen. This was mainly due to a decrease in notes and accounts
payable-trade. The balance of interest-bearing debt amounted to 570.6 billion yen, a decrease of 4.6
billion yen as compared with the end of the previous fiscal year. The debt-equity ratio as of
September 30, 2014 was 0.82 (an improvement of 0.01 points as compared with the end of the
previous fiscal year). The balance of net interest-bearing debt as of September 30, 2014, calculated
by offsetting the balance of interest-bearing debt with the balance of cash and cash equivalents,
amounted to 394.5 billion yen, an increase of 26.0 billion yen as compared with the end of the
previous fiscal year. The net debt-equity ratio as of September 30, 2014 was 0.57 (a worsening of
0.04 points as compared with the end of the previous fiscal year).
Total net assets were 757.9 billion yen as of September 30, 2014, a decrease of 9.8 billion yen as
compared with the end of the previous fiscal year, mainly due to the decrease in retained earnings
from the application of new accounting standards for retirement benefits.
As a result, the owner’s equity (total net assets less minority interests) as of September 30, 2014 was
695.8 billion yen and owner’s equity ratio was 28.4% (an improvement of 0.6 points as compared
with the end of the previous fiscal year).
Net cash inflows from operating activities for the six months ended September 30, 2014 were 27.8
billion yen, an improvement of 55.0 billion yen as compared with the same period of the previous
fiscal year, mainly due to improved income (loss) before income taxes and minority interests
and improved working capital.
Net cash outflows from investing activities for the six months ended September 30, 2014 were 41.1
6

billion yen, a decrease of 26.4 billion yen as compared with the same period of the previous fiscal
year. This was mainly due to cash outflows for the acquisition of trust beneficiary rights set to land
and buildings of the NEC Group’s Tamagawa business facilities recorded in the same period of
the previous fiscal year, despite increased outflows for business acquisitions.
As a result, free cash flows (the sum of cash flows from operating activities and investing activities)
for the six months ended September 30, 2014 totaled a cash outflow of 13.4 billion yen, an
improvement of 81.5 billion yen year-on-year.
Net cash flows from financing activities for the six months ended September 30, 2014 totaled a cash
outflow of 20.0 billion yen, despite financing through commercial papers, mainly due to outflow
from the redemption of bonds and the payment of dividends.
As a result, cash and cash equivalents as of September 30, 2014 amounted to 176.0 billion yen, a
decrease of 30.6 billion yen as compared with the end of the previous fiscal year.
3. Consolidated Financial Forecast
There is no change to the consolidated financial forecasts for the full fiscal year ending
March 31, 2015, as previously disclosed on July 30, 2014.
4. Others
(1) Application of accounting procedures specific to the preparation of quarterly consolidated
financial statements
Calculation of tax expenses:
After adjustment on individual significant items, tax expenses are calculated by multiplying income
before income taxes by effective tax rate, which is estimated using tax effect accounting, for the
fiscal year including this second quarter.
7

(2) Changes to accounting policies, changes in financial estimates and restatements
Change in accounting standard for retirement benefits:
From the beginning of the fiscal year ending March 31, 2015, the NEC Group has applied paragraph
35 of "Accounting Standard for Retirement Benefits" (ASBJ Statement No. 26 of May 17, 2012,
hereinafter “Retirement Benefits Standards”) and paragraph 67 of the "Guidance on Accounting
Standard for Retirement Benefits" (ASBJ Guidance No. 25 of May 17, 2012), and changed its
calculation methods of retirement benefit obligations and service costs. The attribution method for
projected retirement benefits was changed mainly from a point basis to a benefit formula basis and
determination of the discount rate was changed to a method that uses several discount rates which
are set at the time of each expected retirement benefit payment.
In accordance with the article 37 of “Retirement Benefits Standards”, the effect of the change in
calculation methods of retirement benefit obligations and service costs arising from initial
application has been recognized in retained earnings in the beginning balance of the fiscal year
ending March 31, 2015.
As a result, net defined benefit liability increased by 31,981 million yen and retained earnings
decreased by 22,458 million yen in the beginning balance of the fiscal year ending March 31, 2015.
The impact on operating income (loss), ordinary income (loss), and income (loss) before income
taxes and minority interests for the six months ended September 30, 2014 is immaterial.
8

CONSOLIDATED QUARTERLY BALANCE SHEETS
March 31,2014
September 30,2014
September 30,2014
Current assets JPY 1,502,909 JPY 1,418,897 $ 12,899
Cash and deposits 192,668 164,466 1,495
Notes and accounts receivable-trade 842,308 732,616 6,660
Short-term investment securities 16,291 18,804 171
Merchandise and finished goods 76,235 95,423 867
Work in process 83,922 123,209 1,120
Raw materials and supplies 54,238 54,153 492
Deferred tax assets 74,431 70,769 643
Other 167,626 164,086 1,493
Allowance for doubtful accounts (4,810) (4,629) (42)
Noncurrent assets 1,002,420 1,028,794 9,353
Property, plant and equipment 346,186 352,855 3,208
Buildings and structures, net 175,570 180,268 1,639
Machinery and equipment, net 17,878 20,899 190
Tools, furniture and fixtures, net 63,075 64,972 591
Land 63,585 63,699 579
Construction in progress 26,078 23,017 209
Intangible assets 198,781 202,727 1,843
Goodwill 76,203 76,563 696
Software 98,285 99,229 902
Other 24,293 26,935 245
Investments and other assets 457,453 473,212 4,302
Investment securities 147,170 154,487 1,404
Stocks of subsidiaries and affiliates 78,293 80,421 731
Long-term loans receivable 40,123 40,124 365
Deferred tax assets 108,398 118,025 1,073
Net defined benefit asset 10,404 7,807 71
Other 88,604 87,615 797
Allowance for doubtful accounts (15,539) (15,267) (139)
Total assets JPY 2,505,329 JPY 2,447,691 $ 22,252
(Note)
U.S. dollar amounts are translated from yen, for convenience only, at the rate of ¥110 = U.S.$1 .
(In millions of yen, millions of U.S. dollars)
9

CONSOLIDATED QUARTERLY BALANCE SHEETS (CONTINUED)
March 31,2014
September 30,2014
September 30,2014
Current liabilities JPY 985,585 JPY 969,543 $ 8,814
Notes and accounts payable-trade 446,494 401,262 3,648
Short-term loans payable 32,415 34,858 317
Commercial papers - 14,999 136
Current portion of long-term loans payable 44,284 44,527 405
Current portion of bonds payable 20,000 60,000 545
Accrued expenses 152,792 157,972 1,436
Advances received 128,601 134,082 1,219
Provision for product warranties 16,687 15,828 144
Provision for directors' bonuses 318 209 2
Provision for loss on construction contracts and others 11,342 5,761 52
Provision for business structure improvement 7,359 5,504 50
Provision for contingent loss 12,506 4,259 39
Other 112,787 90,282 821
Noncurrent liabilities 752,081 720,285 6,548
Bonds payable 140,000 80,000 727
Long-term loans payable 333,534 331,128 3,010
Deferred tax liabilities 2,213 2,938 27
Provision for product warranties 4,197 4,032 37
Provision for loss on repurchase of computers 6,909 6,965 63
Provision for business structure improvement 6,859 5,014 46
Provision for contingent loss 5,915 5,720 52
Net defined benefit liability 220,457 251,768 2,289
Other 31,997 32,720 297
Total liabilities 1,737,666 1,689,828 15,362
Shareholders' equity 725,195 705,065 6,410
Capital stock 397,199 397,199 3,611
Capital surplus 148,402 148,695 1,352
Retained earnings 182,570 162,174 1,474
Treasury stock (2,976) (3,003) (27)
Accumulated other comprehensive income (29,246) (9,308) (85)
Valuation difference on available-for-sale securities 34,292 39,654 360
Deferred gains or losses on hedges (1,359) (732) (7)
Foreign currency translation adjustments (1,521) 5,391 49
Remeasurements of defined benefit plans (60,658) (53,621) (487)
Minority interests 71,714 62,106 565
Total net assets 767,663 757,863 6,890
Total liabilities and net assets JPY 2,505,329 JPY 2,447,691 $ 22,252
(In millions of yen, millions of U.S. dollars)
10
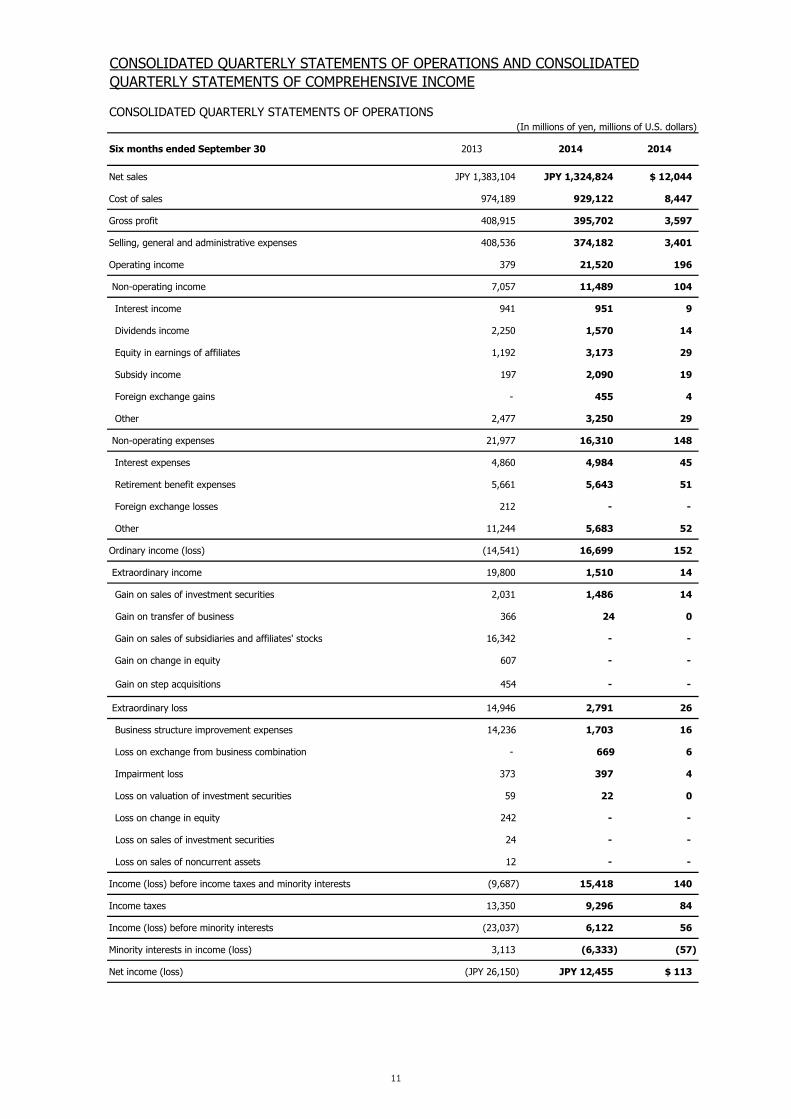
CONSOLIDATED QUARTERLY STATEMENTS OF OPERATIONS
Net sales JPY 1,383,104 JPY 1,324,824 $ 12,044
Cost of sales 974,189 929,122 8,447
Gross profit 408,915 395,702 3,597
Selling, general and administrative expenses 408,536 374,182 3,401
Operating income 379 21,520 196
Non-operating income 7,057 11,489 104
Interest income 941 951 9
Dividends income 2,250 1,570 14
Equity in earnings of affiliates 1,192 3,173 29
Subsidy income 197 2,090 19
Foreign exchange gains - 455 4
Other 2,477 3,250 29
Non-operating expenses 21,977 16,310 148
Interest expenses 4,860 4,984 45
Retirement benefit expenses 5,661 5,643 51
Foreign exchange losses 212 - -
Other 11,244 5,683 52
Ordinary income (loss) (14,541) 16,699 152
Extraordinary income 19,800 1,510 14
Gain on sales of investment securities 2,031 1,486 14
Gain on transfer of business 366 24 0
Gain on sales of subsidiaries and affiliates' stocks 16,342 - -
Gain on change in equity 607 - -
Gain on step acquisitions 454 - -
Extraordinary loss 14,946 2,791 26
Business structure improvement expenses 14,236 1,703 16
Loss on exchange from business combination - 669 6
Impairment loss 373 397 4
Loss on valuation of investment securities 59 22 0
Loss on change in equity 242 - -
Loss on sales of investment securities 24 - -
Loss on sales of noncurrent assets 12 - -
Income (loss) before income taxes and minority interests (9,687) 15,418 140
Income taxes 13,350 9,296 84
Income (loss) before minority interests (23,037) 6,122 56
Minority interests in income (loss) 3,113 (6,333) (57)
Net income (loss) (JPY 26,150) JPY 12,455 $ 113
CONSOLIDATED QUARTERLY STATEMENTS OF OPERATIONS AND CONSOLIDATEDQUARTERLY STATEMENTS OF COMPREHENSIVE INCOME
Six months ended September 30
(In millions of yen, millions of U.S. dollars)
2013 2014 2014
11

CONSOLIDATED QUARTERLY STATEMENTS OF COMPREHENSIVE INCOME
Income (loss) before minority interests (JPY 23,037) JPY 6,122 $ 56
Other comprehensive income 8,701 22,032 200
Valuation difference on available-for-sale securities 8,975 5,381 49
Deferred gains or losses on hedges (4) 624 6
Foreign currency translation adjustments (733) 5,825 53
Remeasurements of defined benefit plans - 8,809 79
Share of other comprehensive income of associates accounted for using equity method
463 1,393 13
Comprehensive income (JPY 14,336) JPY 28,154 $ 256
Breakdown:
Comprehensive income attributable to owners of the parent (JPY 17,653) JPY 32,393 $ 294
Comprehensive income attributable to minority interests 3,317 (4,239) (38)
2014
CONSOLIDATED QUARTERLY STATEMENTS OF OPERATIONS AND CONSOLIDATED QUARTERLYSTATEMENTS OF COMPREHENSIVE INCOME (CONTINUED)
(In millions of yen, millions of U.S. dollars)
Six months ended September 30 2013 2014
12

Six months ended September 30
Income (loss) before income taxes and minority interests (JPY 9,687) JPY 15,418 $140
Depreciation and amortization 37,321 38,675 352
Equity in earnings of affiliates (1,192) (3,173) (29)
Loss (gain) on change in equity (365) - -
Decrease in notes and accounts receivable-trade 110,872 114,042 1,037
Increase in inventories (27,464) (55,950) (509)
Decrease in notes and accounts payable-trade (84,108) (48,098) (437)
Income taxes paid (17,647) (17,200) (156)
Others, net (35,009) (15,945) (146)
Net cash provided by (used in) operating activities (27,279) 27,769 252
Net proceeds from (payments of) acquisitions and sales of property,plant and equipment (70,427) (23,312) (212)
Purchase of intangible assets (5,846) (3,418) (31)
Net proceeds from (payments of) purchases and sales of securities 8,655 (10,832) (98)
Others, net 50 (3,557) (33)
Net cash used in investing activities (67,568) (41,119) (374)
Net proceeds from (payments of) bonds and borrowings 82,264 (8,341) (76)
Cash dividends paid (10,357) (10,343) (94)
Others, net (2,288) (1,335) (12)
Net cash provided by (used in) financing activities 69,619 (20,019) (182)
Ⅳ.Effect of exchange rate changes on cash and cash equivalents 2,049 2,766 25
Ⅴ.Net decrease in cash and cash equivalents (23,179) (30,603) (279)
Ⅵ.Cash and cash equivalents at beginning of period 197,132 206,637 1,879
Ⅶ.Cash and cash equivalents at end of period JPY 173,953 JPY 176,034 $ 1,600
Ⅰ.Cash flows from operating activities:
Ⅱ.Cash flows from investing activities:
Ⅲ.Cash flows from financing activities:
CONDENSED CONSOLIDATED QUARTERLY STATEMENTS OF CASH FLOWS
2013 2014 2014
(In millions of yen, millions of U.S. dollars)
13

SEGMENT INFORMATION
[Segment information]
Information about sales and segment income (loss) by reportable segment
Six months ended September 30, 2013 (From April 1, 2013 to September 30, 2013) (In millions of yen)
Public EnterpriseTelecomCarrier
SystemPlatform
Total
Sales
1. Sales to customers 303,310 130,093 334,041 350,739 1,118,183 264,921 - 1,383,104
2. Intersegment sales and transfers 7,623 2,562 12,918 30,340 53,443 21,731 (75,174) -
Total sales 310,933 132,655 346,959 381,079 1,171,626 286,652 (75,174) 1,383,104
Segment income (loss) (Operating income (loss))
14,533 727 19,382 1,837 36,479 (11,828) (24,272) 379
Reportable Segments
Others AdjustmentConsolidated
total
Six months ended September 30, 2014 (From April 1, 2014 to September 30, 2014)
(In millions of yen)
Public EnterpriseTelecomCarrier
SystemPlatform
Total
Sales
1. Sales to customers 344,490 126,672 332,458 345,425 1,149,045 175,779 - 1,324,824
2. Intersegment sales and transfers 18,885 2,276 10,599 34,850 66,610 16,715 (83,325) -
Total sales 363,375 128,948 343,057 380,275 1,215,655 192,494 (83,325) 1,324,824
Segment income (loss) (Operating income (loss))
21,868 2,258 16,607 8,722 49,455 (2,720) (25,215) 21,520
Adjustment
Reportable Segments
OthersConsolidated
total
Six months ended September 30, 2014 (From April 1, 2014 to September 30, 2014) (In millions of U.S. dollars)
Public EnterpriseTelecomCarrier
SystemPlatform
Total
Sales
1. Sales to customers 3,132 1,152 3,022 3,140 10,446 1,598 - 12,044
2. Intersegment sales and transfers 171 20 97 317 605 152 (757) -
Total sales 3,303 1,172 3,119 3,457 11,051 1,750 (757) 12,044
Segment income (loss) (Operating income (loss))
199 21 151 79 450 (25) (229) 196
Adjustment
Reportable Segments
OthersConsolidated
total
14

SEGMENT INFORMATION (CONTINUED)
(Notes)
1. "Others" for the six months ended September 30, 2013 represents businesses such as Smart Energy
(Electrodes/Energy Storage System, Solutions for Utilities, etc.), Mobile Phones and “BIGLOBE” Internet
Services, which are not included in reportable segments. "Others" for the six months ended September 30, 2014
represents businesses such as Smart Energy (Electrodes/Energy Storage System, Solutions for Utilities, etc.) and
Mobile Phones, which are not included in reportable segments.
2. "Adjustment" of segment income (loss) for the six months ended September 30, 2013 includes corporate expenses
of (22,743) million yen and noncurrent assets related adjustment of 920 million yen, unallocated to each
reportable segment. "Adjustment" of segment income (loss) for the six months ended September 30, 2014
includes corporate expenses of (22,439) million yen ((204) million U.S. dollars) and noncurrent assets related
adjustment of (456) million yen ((4) million U.S. dollars), unallocated to each reportable segment. The corporate
expenses, unallocated to each reportable segment, are mainly general and administrative expenses incurred at
headquarters of NEC, and research and development expenses.
15

SEGMENT INFORMATION (CONTINUED)
[Related information]
Information about geographic areas
Sales
Six months ended September 30, 2013 (From April 1, 2013 to September 30, 2013)
(In millions of yen)
Japan
1,109,969
The Americas
102,195
Greater China, APAC
112,412 1,383,104
TotalEMEA
58,528
Six months ended September 30, 2014 (From April 1, 2014 to September 30, 2014)
(In millions of yen)
1,048,387
Japan The Americas
96,931
Greater China, APAC
115,577
Total
63,929
EMEA
1,324,824
Six months ended September 30, 2014 (From April 1, 2014 to September 30, 2014)
(In millions of U.S. dollars)
Total
581 12,044
EMEAJapan
9,531
Greater China, APAC
1,051881
The Americas
(Notes)
1. Sales are classified into country or region based on the locations of customers.
2. Major regions in segments other than Japan:
(1) The Americas: North America and Latin America
(2) Greater China, APAC: Greater China and Asia Pacific (Asia, Oceania)
(3) EMEA: Europe, Middle East and Africa
16

[THREE MONTHS PERIOD INFORMATION]
CONSOLIDATED QUARTERLY STATEMENTS OF OPERATIONS
Net sales JPY 742,958 JPY 726,123 $ 6,601
Cost of sales 518,734 506,664 4,606
Gross profit 224,224 219,459 1,995
Selling, general and administrative expenses 202,032 190,880 1,735
Operating income 22,192 28,579 260
Non-operating income 2,622 6,643 60
Interest income 468 526 5
Dividends income 229 32 0
Foreign exchange gains - 2,990 27
Equity in earnings of affiliates 478 1,632 15
Other 1,447 1,463 13
Non-operating expenses 11,188 8,532 77
Interest expenses 2,641 2,509 23
Retirement benefit expenses 2,831 2,828 25
Foreign exchange losses 961 - -
Other 4,755 3,195 29
Ordinary income 13,626 26,690 243
Extraordinary income 611 1,331 12
Gain on sales of investment securities 6 1,307 12
Gain on transfer of business - 24 0
Gain on change in equity 603 - -
Gain on sales of subsidiaries and affiliates' stocks 2 - -
Extraordinary loss 13,325 1,988 18
Business structure improvement expenses 13,053 1,267 12
Loss on exchange from business combination - 669 6
Impairment loss 266 45 0
Loss on valuation of investment securities 4 7 0
Loss on sales of investment securities 2 - -
Income before income taxes and minority interests 912 26,033 237
Income taxes 3,266 9,700 89
Income (loss) before minority interests (2,354) 16,333 148
Minority interests in income 2,320 (6,222) (57)
Net income (loss) (JPY 4,674) JPY 22,555 $ 205
(Note)
U.S. dollar amounts are translated from yen, for convenience only, at the rate of ¥110 = U.S.$1 .
CONSOLIDATED QUARTERLY STATEMENTS OF OPERATIONS AND CONSOLIDATEDQUARTERLY STATEMENTS OF COMPREHENSIVE INCOME
Three months ended September 30 2013 2014 2014
(In millions of yen, millions of U.S. dollars)
17

[THREE MONTHS PERIOD INFORMATION]
CONSOLIDATED QUARTERLY STATEMENTS OF COMPREHENSIVE INCOME
Income (loss) before minority interests (JPY 2,354) JPY 16,333 $ 148
Other comprehensive income 3,950 16,785 153
Valuation difference on available-for-sale securities 6,409 3,537 32
Deferred gains or losses on hedges 33 2 0
Foreign currency translation adjustments (2,322) 7,124 65
Remeasurements of defined benefit plans - 4,521 41
Share of other comprehensive income of associates accounted for using equity method
(170) 1,601 15
Comprehensive income JPY 1,596 JPY 33,118 $ 301
Breakdown:
Comprehensive income attributable to owners of the parent (JPY 739) JPY 38,132 $ 347
Comprehensive income attributable to minority interests 2,335 (5,014) (46)
2013 2014 2014
CONSOLIDATED QUARTERLY STATEMENTS OF OPERATIONS AND CONSOLIDATED QUARTERLYSTATEMENTS OF COMPREHENSIVE INCOME (CONTINUED)
(In millions of yen, millions of U.S. dollars)
Three months ended September 30
18
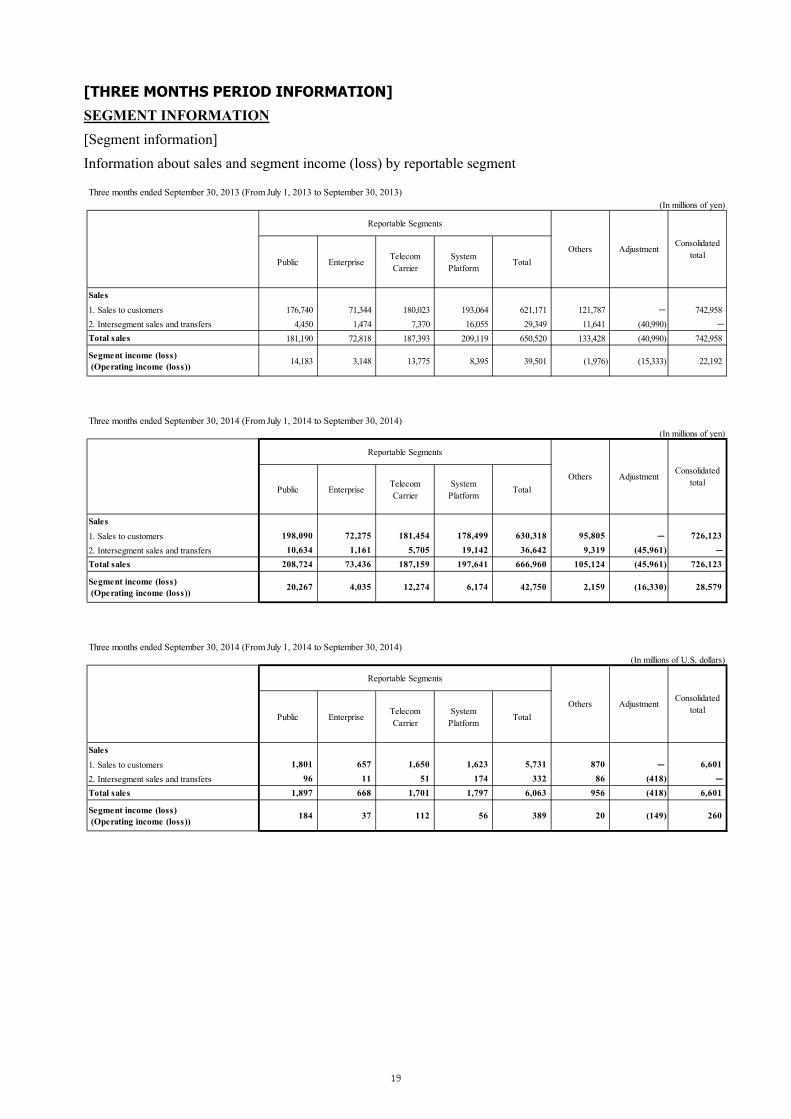
[THREE MONTHS PERIOD INFORMATION] SEGMENT INFORMATION
[Segment information]
Information about sales and segment income (loss) by reportable segment
Three months ended September 30, 2013 (From July 1, 2013 to September 30, 2013) (In millions of yen)
Public EnterpriseTelecomCarrier
SystemPlatform
Total
Sales
1. Sales to customers 176,740 71,344 180,023 193,064 621,171 121,787 - 742,958
2. Intersegment sales and transfers 4,450 1,474 7,370 16,055 29,349 11,641 (40,990) -
Total sales 181,190 72,818 187,393 209,119 650,520 133,428 (40,990) 742,958
Segment income (loss) (Operating income (loss))
14,183 3,148 13,775 8,395 39,501 (1,976) (15,333) 22,192
Reportable Segments
Others AdjustmentConsolidated
total
Three months ended September 30, 2014 (From July 1, 2014 to September 30, 2014)
(In millions of yen)
Public EnterpriseTelecomCarrier
SystemPlatform
Total
Sales
1. Sales to customers 198,090 72,275 181,454 178,499 630,318 95,805 - 726,123
2. Intersegment sales and transfers 10,634 1,161 5,705 19,142 36,642 9,319 (45,961) -
Total sales 208,724 73,436 187,159 197,641 666,960 105,124 (45,961) 726,123
Segment income (loss) (Operating income (loss))
20,267 4,035 12,274 6,174 42,750 2,159 (16,330) 28,579
Reportable Segments
OthersConsolidated
totalAdjustment
Three months ended September 30, 2014 (From July 1, 2014 to September 30, 2014)(In millions of U.S. dollars)
Public EnterpriseTelecomCarrier
SystemPlatform
Total
Sales
1. Sales to customers 1,801 657 1,650 1,623 5,731 870 - 6,601
2. Intersegment sales and transfers 96 11 51 174 332 86 (418) -
Total sales 1,897 668 1,701 1,797 6,063 956 (418) 6,601
Segment income (loss) (Operating income (loss))
184 37 112 56 389 20 (149) 260
Reportable Segments
OthersConsolidated
totalAdjustment
19

[THREE MONTHS PERIOD INFORMATION] SEGMENT INFORMATION (CONTINUED)
(Notes)
1. "Others" for the three months ended September 30, 2013 represents businesses such as Smart Energy
(Electrodes/Energy Storage System, Solutions for Utilities, etc.), Mobile Phones and “BIGLOBE” Internet
Services, which are not included in reportable segments. "Others" for the three months ended September 30, 2014
represents businesses such as Smart Energy (Electrodes/Energy Storage System, Solutions for Utilities, etc.),and
Mobile Phones, which are not included in reportable segments.
2. "Adjustment" of segment income (loss) for the three months ended September 30, 2013 includes corporate
expenses of (12,974) million yen and noncurrent assets related adjustment of (276) million yen, unallocated to
each reportable segment. "Adjustment" of segment income (loss) for the three months ended September 30, 2014
includes corporate expenses of (13,579) million yen ((123) million U.S. dollars) and noncurrent assets related
adjustment of (760) million yen ((7) million U.S. dollars), unallocated to each reportable segment. The corporate
expenses, unallocated to each reportable segment, are mainly general and administrative expenses incurred at
headquarters of NEC, and research and development expenses.
20

[THREE MONTHS PERIOD INFORMATION] SEGMENT INFORMATION (CONTINUED)
[Related information]
Information about geographic areas
Sales
Three months ended September 30, 2013 (From July 1, 2013 to September 30, 2013)
(In millions of yen)
742,958
TotalEMEA
33,892
Japan
590,631
The Americas
54,664
Greater China, APAC
63,771
Three months ended September 30, 2014 (From July 1, 2014 to September 30, 2014)
(In millions of yen)
Total
35,233
EMEA
726,123
The Americas
52,900575,010
Japan Greater China, APAC
62,980
Three months ended September 30, 2014 (From July 1, 2014 to September 30, 2014)
(In millions of U.S. dollars)
Total
320 6,601
EMEAGreater China, APAC
573
Japan
5,227 481
The Americas
(Notes)
1. Sales are classified into country or region based on the locations of customers.
2. Major regions in segments other than Japan:
(1) The Americas: North America and Latin America
(2) Greater China, APAC: Greater China and Asia Pacific (Asia, Oceania)
(3) EMEA: Europe, Middle East and Africa
21

CAUTIONARY STATEMENTS:
This material contains forward-looking statements pertaining to strategies, financial
targets, technology, products and services, and business performance of NEC
Corporation and its consolidated subsidiaries (collectively "NEC"). Written
forward-looking statements may appear in other documents that NEC files with stock
exchanges or regulatory authorities, such as the Director of the Kanto Finance Bureau,
and in reports to shareholders and other communications. NEC is relying on certain
safe-harbors for forward-looking statements in making these disclosures. Some of the
forward-looking statements can be identified by the use of forward-looking words
such as "believes," "expects," "may," "will," "should," "seeks," "intends," "plans,"
"estimates," "targets," "aims," or "anticipates," or the negative of those words, or
other comparable words or phrases. You can also identify forward-looking statements
by discussions of strategy, beliefs, plans, targets, or intentions. Forward-looking
statements necessarily depend on currently available assumptions, data, or methods
that may be incorrect or imprecise and NEC may not be able to realize the results
expected by them.
You should not place undue reliance on forward-looking statements, which reflect
NEC’s analysis and expectations only. Forward-looking statements are not
guarantees of future performance and involve inherent risks and uncertainties. A
number of important factors could cause actual results to differ materially from those
in the forward-looking statements. Among the factors that could cause actual results
to differ materially from such statements include (i) global economic conditions and
general economic conditions in NEC’s markets, (ii) fluctuating demand for, and
competitive pricing pressure on, NEC’s products and services, (iii) NEC’s ability to
continue to win acceptance of NEC’s products and services in highly competitive
markets, (iv) NEC’s ability to expand into foreign markets, such as China, (v)
regulatory change and uncertainty and potential legal liability relating to NEC’s
business and operations, (vi) NEC’s ability to restructure, or otherwise adjust, its
operations to reflect changing market conditions, (vii) movement of currency
exchange rates, particularly the rate between the yen and the U.S. dollar, (viii) the
impact of unfavorable conditions or developments, including share price declines, in
the equity markets which may result in losses from devaluation of listed securities
held by NEC, and (ix) impact of any regulatory action or legal proceeding against
NEC. Any forward-looking statements speak only as of the date on which they are
made. New risks and uncertainties come up from time to time, and it is impossible for
NEC to predict these events or how they may affect NEC. NEC does not undertake
22

any obligation to update or revise any of the forward-looking statements, whether as
a result of new information, future events, or otherwise.
The management targets included in this material are not projections, and do not
represent management’s current estimates of future performance. Rather, they
represent targets that management will strive to achieve through the successful
implementation of NEC’s business strategies.
Finally, NEC cautions you that the statements made in this material are not an offer
of securities for sale. Securities may not be offered or sold in any jurisdiction in
which required registration is absent or an exemption from registration under the
applicable securities laws is not granted.
***
23