near-infrared spectroscopy in agriculture · 2014-07-22 · foreword near-infrared (nir)...
TRANSCRIPT
Near-Infrared Spectroscopyin Agriculture
Co-EditorsCraig A. Roberts
Jerry Workman, Jr.James B. Reeves III
Managing Editor: Lisa Al-Amoodi
Editor-in-Chief ASA Publications: Kenneth A. BarbarickEditor-in-Chief CSSA Publications: Craig A. RobertsEditor-in-Chief SSSA Publications: Warren A. Dick
Number 44 in the seriesAGRONOMY
American Society of Agronomy, Inc.Crop Science Society of America, Inc.Soil Science Society of America, Inc.
PublishersMadison, Wisconsin, USA
2004
iii

Copyright © 2004 by the American Society of Agronomy, Inc.Crop Science Society of America, Inc.Soil Science Society of America, Inc.
ALL RIGHTS RESERVED UNDER THE U.S. COPYRIGHT ACT OF1976 (PL. 94-533).
Any and all uses beyond the limitations of the “fair use” provision of the lawrequire written permission from the publisher(s) and/or the author(s); not ap-plicable to contributions prepared by officers or employees of the U.S. Gov-ernment as part of their official duties.
The views expressed in this publication represent those of the individual Ed-itors and Authors. These views do not necessarily reflect endorsement by thePublisher(s). In addition, trade names are sometimes mentioned in this pub-lication. No endorsement of these products by the Publisher is intended, noris any criticism implied of similar products not mentioned.
American Society of Agronomy, Inc.Crop Science Society of America, Inc.Soil Science Society of America, Inc.677 South Segoe Road, Madison, WI 53711-1086 USA
ISBN: 0-89118-155-5
Library of Congress Control Number:
Printed in the United States of America.
CONTENTS
Dedication . . . . . . . . . . . . . . . . . . . . . . . . . . . . . . . . . . . . . . . . . . . . . . . . . . . ixForeword . . . . . . . . . . . . . . . . . . . . . . . . . . . . . . . . . . . . . . . . . . . . . . . . . . . . xiPreface. . . . . . . . . . . . . . . . . . . . . . . . . . . . . . . . . . . . . . . . . . . . . . . . . . . . . . xiiiContributors . . . . . . . . . . . . . . . . . . . . . . . . . . . . . . . . . . . . . . . . . . . . . . . . . xvConversion Factors for SI and Non-SI Units . . . . . . . . . . . . . . . . . . . . . . . . xvii
SECTION A—NEAR-INFRARED SPECTROSCOPY
1 Understanding and Using the Near-Infrared Spectrumas an Analytical Method . . . . . . . . . . . . . . . . . . . . . . . . . . . . . . . . 2
Jerome Workman and John Shenk
2 Near-Infrared Spectrophotometers. . . . . . . . . . . . . . . . . . . . . . . . . . 11Jerome Workman
3 Testing and Validating Instrument Performance. . . . . . . . . . . . . . . 33W.L. Cap Munday, Charles M. Zapf, and James Reeves
4 Network Design and Implementation . . . . . . . . . . . . . . . . . . . . . . . . 49Phil Williams and John Antoniszyn
5 Sample Preparation . . . . . . . . . . . . . . . . . . . . . . . . . . . . . . . . . . . . . . 75Ian Murray and Ian Cowe
SECTION B—CHEMOMETRICS FOR NEAR-INFRAREDSPECTROSCOPY
6 Mathematical Data Preprocessing . . . . . . . . . . . . . . . . . . . . . . . . . . 115James Duckworth
7 Quantitative Analysis . . . . . . . . . . . . . . . . . . . . . . . . . . . . . . . . . . . . . 133Mark Westerhaus, Jerome Workman, James Reeves,and Howard Mark
8 Qualitative Analysis . . . . . . . . . . . . . . . . . . . . . . . . . . . . . . . . . . . . . . 175Richard Kramer, Jerome Workman, and James Reeves
9 Standardization and Calibration Transfer. . . . . . . . . . . . . . . . . . . . 207John Shenk
v
SECTION C—NIR APPLICATIONS IN ANALYSIS OF FOOD CROPS
10 Analysis of Forages and Feedstuffs . . . . . . . . . . . . . . . . . . . . . . . . . . 231Craig Roberts, Jerry Stuth, and Peter Flinn
11 Analysis of Small Grain Crops . . . . . . . . . . . . . . . . . . . . . . . . . . . . . 269Stephen Delwiche
12 Analysis of Oilseeds and Coarse Grains . . . . . . . . . . . . . . . . . . . . . . 321Dan Dyer
13 Analysis of Coffee, Tea, Spices, Medicinal Plants andAromatic Plants, and Related Products . . . . . . . . . . . . . . . . . . . . 345
Hartwig Schulz
14 Analysis of Fruits and Vegetables . . . . . . . . . . . . . . . . . . . . . . . . . . . 377David Slaughter and Judy Abbott
15 Analysis of Sugarcane . . . . . . . . . . . . . . . . . . . . . . . . . . . . . . . . . . . . 399Reiji Sekiguchi, Masami Ueno, and Sumio Kawano
SECTION D—NIR APPLICATIONS IN ANALYSISOF PROCESSED FOODS
16 Analysis of Cereal Food Products . . . . . . . . . . . . . . . . . . . . . . . . . . . 411Sandra Kays
17 Analysis of Baking Products . . . . . . . . . . . . . . . . . . . . . . . . . . . . . . . 439Chris Scotter and Sam Millar
18 Analysis of Beverages and Brewing Products . . . . . . . . . . . . . . . . . 465Bob Dambergs, Michael Esler, and Mark Gishen
19 Analysis of Fats and Oils . . . . . . . . . . . . . . . . . . . . . . . . . . . . . . . . . . 487Ana Garrido-Varo, Juan García-Olmo, andMaria Delores Pérez-Marin
20 Analysis of Dairy and Eggs . . . . . . . . . . . . . . . . . . . . . . . . . . . . . . . . 559Roberto Giangiacomo and Tiziana M.P. Cattaneo
21 Analysis of Meats . . . . . . . . . . . . . . . . . . . . . . . . . . . . . . . . . . . . . . . . 599Gerard Downey and Kjell Ivar Hildrum
vi CONTENTS

SECTION E—NIR APPLICATIONS IN ANALYSISOF NON-FOOD AGRICULTURAL PRODUCTS
22 Analysis of Timber and Paper . . . . . . . . . . . . . . . . . . . . . . . . . . . . . . 635Jerry Workman and Laurie Schimleck
23 Analysis of Animal By-Products . . . . . . . . . . . . . . . . . . . . . . . . . . . . 647Daniel Cozzolino and Ian Murray
24 Analysis of Wool . . . . . . . . . . . . . . . . . . . . . . . . . . . . . . . . . . . . . . . . . 663Michael Hammersley and Trisha Townsend
25 Analysis of Cotton. . . . . . . . . . . . . . . . . . . . . . . . . . . . . . . . . . . . . . . . 671Joseph Montalvo and Terri Von Hoven
26 Analysis of Soils . . . . . . . . . . . . . . . . . . . . . . . . . . . . . . . . . . . . . . . . . 729Diane Malley, Paul Martin, and Eyal Ben-Dor
Subject Index. . . . . . . . . . . . . . . . . . . . . . . . . . . . . . . . . . . . . . . . . . . . . . . . . 785
CONTENTS vii

ix
DEDICATION
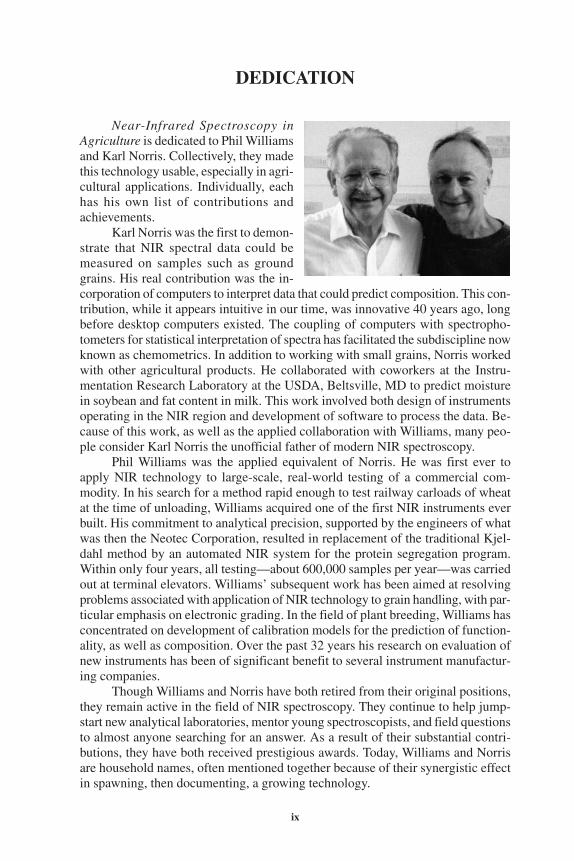
Near-Infrared Spectroscopy inAgriculture is dedicated to Phil Williamsand Karl Norris. Collectively, they madethis technology usable, especially in agri-cultural applications. Individually, eachhas his own list of contributions andachievements.
Karl Norris was the first to demon-strate that NIR spectral data could bemeasured on samples such as groundgrains. His real contribution was the in-corporation of computers to interpret data that could predict composition. This con-tribution, while it appears intuitive in our time, was innovative 40 years ago, longbefore desktop computers existed. The coupling of computers with spectropho-tometers for statistical interpretation of spectra has facilitated the subdiscipline nowknown as chemometrics. In addition to working with small grains, Norris workedwith other agricultural products. He collaborated with coworkers at the Instru-mentation Research Laboratory at the USDA, Beltsville, MD to predict moisturein soybean and fat content in milk. This work involved both design of instrumentsoperating in the NIR region and development of software to process the data. Be-cause of this work, as well as the applied collaboration with Williams, many peo-ple consider Karl Norris the unofficial father of modern NIR spectroscopy.
Phil Williams was the applied equivalent of Norris. He was first ever toapply NIR technology to large-scale, real-world testing of a commercial com-modity. In his search for a method rapid enough to test railway carloads of wheatat the time of unloading, Williams acquired one of the first NIR instruments everbuilt. His commitment to analytical precision, supported by the engineers of whatwas then the Neotec Corporation, resulted in replacement of the traditional Kjel-dahl method by an automated NIR system for the protein segregation program.Within only four years, all testing—about 600,000 samples per year—was carriedout at terminal elevators. Williams’ subsequent work has been aimed at resolvingproblems associated with application of NIR technology to grain handling, with par-ticular emphasis on electronic grading. In the field of plant breeding, Williams hasconcentrated on development of calibration models for the prediction of function-ality, as well as composition. Over the past 32 years his research on evaluation ofnew instruments has been of significant benefit to several instrument manufactur-ing companies.
Though Williams and Norris have both retired from their original positions,they remain active in the field of NIR spectroscopy. They continue to help jump-start new analytical laboratories, mentor young spectroscopists, and field questionsto almost anyone searching for an answer. As a result of their substantial contri-butions, they have both received prestigious awards. Today, Williams and Norrisare household names, often mentioned together because of their synergistic effectin spawning, then documenting, a growing technology.

x
FOREWORD
Near-infrared (NIR) spectroscopy is a remarkably versatile and robust ana-lytical methodology. Its nondestructive nature, fast analysis time, and relative easeof use has led to the development of many applications in a broad array of agri-cultural fields. The evolution and widespread application of NIR spectroscopy inthe past several decades is one of the great success stories in analytical technologydevelopment. From the humble beginnings of fixed-filter instruments and simplecalibrations to the scanning monochromators and advanced chemometrics of today,the technology has undergone an astonishing transformation. Key to this achieve-ment was the rapid development of the microprocessor and the advanced analyti-cal software it made possible. Today, NIR spectroscopy is widely used to detect andquantify an almost unending list of analytes in a host of agricultural and foodproducts.
This volume provides monographic coverage of the use of NIR spectroscopyin agriculture. It begins with a section on fundamental principles of NIR spec-troscopy, including chapters on instrumentation and sample preparation. This is fol-lowed by a comprehensive section on advanced chemometrics for qualitative andquantitative NIR analysis. The remaining three sections describe NIR applicationsfor analysis of food crops, processed foods, and other agricultural products andbyproducts. The chapters are authored by a who’s who list of the leading expertsin the design, calibration, and application of NIR spectroscopy. The book is trulyinternational in scope with contributing authors from around the world.
Our thanks to the feasibility committee, editors, authors, reviewers, and staffthat worked diligently to make this outstanding volume available. They have cre-ated an exceptional reference, that will serve as a leading source and definitive au-thority on NIR spectroscopy in agriculture for many years to come.
KENNETH J. MOOREPresident
Crop Science Society of America
LOWELL E. MOSERPresident
American Society of Agronomy
J. THOMAS SIMSPresident
Soil Science Society of America
xi

PREFACE
Near-infrared (NIR) spectroscopy is fast becoming a preferred method of rou-tine analysis, especially in agriculture. Its growing popularity is due to its accuracyand efficiency of process. As an empirical procedure, NIR spectroscopy differs fromstandard spectroscopy; it does not require a full understanding of the physical re-lationships between spectral data and chemical functional groups. Instead, NIR spec-troscopy is based on mathematical relationships between spectra and reference data.Once a mathematical relationship is established, the NIR spectrophotometer col-lects spectra and predicts analysis, thereby expediting rapid, large-scale process-ing of samples. The repeatability and accuracy of predicted data are monitoredthrough an array of blind validation protocols.
Because of its empirical approach and indirect analysis, NIR spectroscopysometimes attracts criticism. In many ways, it is a technology comparable to crypt-analysis during World War II—it “had an aura of sorcery, but the basis was highlyscientific.”1 Criticism of NIR spectroscopy as a bench-top analytical tool is mostcommon among theoretical researchers, who strain to understand the same princi-ples they readily accept in remote sensing. Among practitioners, however, criticismis rare. In fact, practitioners have come to appreciate the inherent advantages of NIRspectroscopy, such as nondestructive sampling, reduced dependence on chemicalreagents, and simultaneous quantification of constituents.
Near-Infrared Spectroscopy in Agriculture highlights the practical use of NIRtechnology during its first forty years in international agriculture. The book was re-quested by a feasibility committee of the Agronomy Society of America, who com-missioned the work and cosponsored it with the Crop Science Society of Americaand the Soil Science Society of America.
Near-Infrared Spectroscopy in Agriculture is organized into five sections. Thefirst two sections present the fundamentals of spectroscopy and chemometrics. Thesetwo sections were simplified as much as possible at the request of the editors be-cause this book targets a broad scientific audience rather than a narrow group ofspectroscopists and statisticians. The last three sections are applied and give thisbook a clear niche among other NIR publications. These applied sections detail theuse of NIR analysis in crop production, food processing, and non-food agriculture.Chapters in the applied sections are generally comprehensive, and they include stan-dardized tables of applications for ease of reference.
The editors would like to express their appreciation to all authors, reviewers,and editors of these chapters, as well as the editors of ASA, CSSA, and SSSA fortheir commitment and hard work in producing this book. We thank the ManagingEditor, Lisa Al-Amoodi. We would also like to thank certain colleagues who helpedus in the early stages of this work. Specifically, we are grateful to Ian Murray andChris Scotter, who helped us identify international authors with various special-izations in NIR application. We owe a special word of gratitude to authors RobertoGiangiacomo, Tiziana Cattaneo, Stephen Delwiche, Trish Townsend, and MichaelHammersley; these authors submitted their chapters early in the process and pro-
xiii
1 Stevenson, W. 1976. A man called intrepid. Harcourt, Brace, Jovanovich, New York.

vided their colleagues with excellent examples of content and composition. Finally,we are grateful to Jerry Nelson, who offered a steady stream of reliable advicethrough the entire publication process.
We hope this work will benefit all those interested in efficient analysis of agri-cultural products.
CRAIG A. ROBERTSUniversity of Missouri
Columbia, Missouri
JERRY WORKMAN, JR.Argose Inc.
Waltham, Massachusetts
JAMES B. REEVES IIIUSDA-ARS
Beltsville, Maryland
xiv PREFACE
CONTRIBUTORS
Judy Abbott USDA-ARS, Produce Quality and Safety Laboratory, BARC-West, 10300 Baltimore Ave., Beltsville, MD 20705, USA
John Antoniszyn Canadian Grain Commission, Grain Research Laboratory,1404 - 303 Main Street, Winnipeg, MB R3C 3G8, Canada
Eyal Ben-Dor Remote Sensing/GIS Laboratory, Dep. of Geography, Tel-Aviv University, P.O. Box 39040, Ramat Aviv, Tel-Aviv69978, Israel
Tiziana M.P. Cattaneo Istituto Sperimentale Lattiero Caseario, Via Lombardo, 11,26900 Lodi, Italy
Ian Cowe 37 Broughton Way, Osbaldwick, York YO10 3BG, UK
Daniel Cozzolino The Australian Wine Research Inst., Waite Road, Urrbrae, P.O.Box 197, Glen Osmond, SA 5064, Australia; formerly, INIALa Estanzuela, Animal Nutrition Laboratory, Colonia,Uruguay
Bob Dambergs The Australian Wine Research Inst., Waite Road, Urrbrae, P.O.Box 197, Glen Osmond, SA 5064, Australia
Stephen Delwiche USDA-ARS, Instrumentation & Sensing Laboratory, Bldg.303, BARC-East, 10300 Baltimore, Ave., Beltsville, MD20705-2350, USA
Gerard Downey Teagasc, The National Food Center, Astown, Dublin 15, Re-public of Ireland
James Duckworth Galactic Industries Corp., 395 Main Street, Salem, NH 03079,USA
Dan Dyer Renessen, LLC, 3000 Lakeside Drive, Suite 300S, Bannock-burn, IL 60015, USA
Michael Esler The Australian Wine Research Inst., Waite Road, Urrbrae, P.O.Box 197, Glen Osmond, SA 5064, Australia; currently: Bu-reau International des Poids et Mesures, Sevres, France
Peter Flinn Agriculture Victoria, Pastoral & Veterinary Institute, PrivateBag 105, Hamilton, Victoria 3300, Australia
Juan García-Olmo ETSIAM, University of Cordoba, Apdo. 3048, 14080 Cor-doba, Spain
Ana Garrido-Varo ETSIAM, University of Cordoba, Apdo. 3048, 14080 Cor-doba, Spain
Roberto Giangiacomo Istituto Sperimentale Lattiero Caseario, Via Lombardo, 11,26900 Lodi, Italy
xv
Mark Gishen The Australian Wine Research Inst., Waite Road, Urrbrae, P.O.Box 197, Glen Osmond, SA 5064, Australia
Michael Hammersley 2/19d Dyers Pass Road, Cashmere, Christchurch 2, NewZealand
Kjell Ivar Hildrum MATFORSK, Osloveien 1, N-1432 Ås, Norway
Sumio Kawano National Food Research Institute, 2-1-12 Kannondai, Tsukuba305-8642, Japan
Sandra Kays USDA-ARS, Quality Assessment Research Unit, Richard B.Russell Agric. Research Center, P.O. Box 5677, Athens, GA30604-5677, USA
Richard Kramer Applied Chemometrics, 77 Beach Street, Sharon, MA 02067,USA
Diane Malley PDK Projects, Inc., 365 Wildwood Park, Winnipeg, MB R3T0E7, Canada
Howard Mark Mark Electronics, 21 Terrace Avenue, Suffern, NY 10901,USA
Paul Martin #2-12 McGillivray Place, Winnipeg, MB R3T 1N4, Canada
Sam Millar Campden and Chorleywood Food Research Association,Chipping Campden, Gloucestershire, GL55 6LD, UK
Joseph Montalvo USDA-ARS Southern Regional Res Ctr, 1100 Robert E. LeeBoulevard, Bldg. 001, Rm. 3025, New Orleans, LA 70179-0687, USA
W.L. Cap Munday Sydco Technical Sales, 1706 Justin Drive, Gambrills, MD21054, USA
Ian Murray SAC, Ferguson Bldg., Craibstone Estate, Bucksburn, Ab-erdeen AB21 9YA, Scotland
Maria Dolores Pérez-Marín ETSIAM, University of Cordoba, Apdo. 3048, 14080 Cor-doba, Spain
Craig Roberts Agronomy Dep., 214 Waters Hall, University of Missouri, Co-lumbia, MO 65211, USA
James Reeves USDA-ARS, Animal & Natural Resources Institute, BARC-East, Bldg. 306, Rm. 101, Beltsville, MD 20705, USA
Laurence Schimleck D.B. Warnell School of Forest Resources, The University ofGeorgia, 4-330, Athens, GA, 30602-2152, USA
Hartwig Schulz Federal Centre for Breeding Research on Cultivated Plants, In-stitute of Plant Analysis, 22/23, D-06484 Quedlinburg, Ger-many
xvi CONTRIBUTORS

Chris Scotter Campden and Chorleywood Food Research Association,Chipping Campden, Gloucestershire, GL55 6LD, UK
Reiji Sekiguchi Japan Food Research Laboratory, Shibuya, Tokyo 151-0062,Japan
John Shenk Infrasoft International, 109 Sellers Lane, Port Matilda, PA16870, USA
David Slaughter Biological & Agric. Engineering, University of California,One Shields Ave., Davis, CA 95616, USA
Jerry Stuth Dep. of RLEM, Animal Industries Bldg., Texas A&M Uni-versity, College Station, TX 77843-2126, USA
Trisha Townsend 74 Greendale Avenue, Avonhead, Christchurch 8004, NewZealand
Masami Ueno University of the Ruykyus, Okinawa 903 -0213, Japan
Terri Von Hoven USDA-ARS Southern Regional Res Ctr, 1100 Robert E. LeeBoulevard, 001, Rm. 3025, New Orleans, LA 70179-0687,USA
Mark Westerhaus Infrasoft International, 109 Sellers Lane, Port Matilda, PA16870, USA
Phil Williams PDK Grain, 365 Wildwood Park, Winnipeg, MB R3T 0E7,Canada
Jerome Workman Argose Inc., 230 Second Avenue, Waltham, MA 02451, USA
Charles M. Zapf McCormick & Company, Inc., Technical Center, 202 WightAvenue, Hunt Valley, MD 21031-1066, USA
CONTRIBUTORS xvii

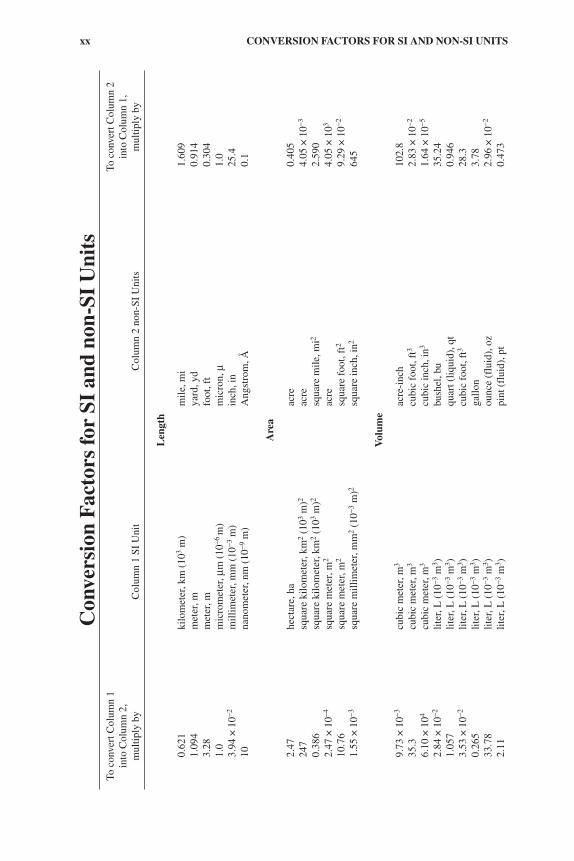
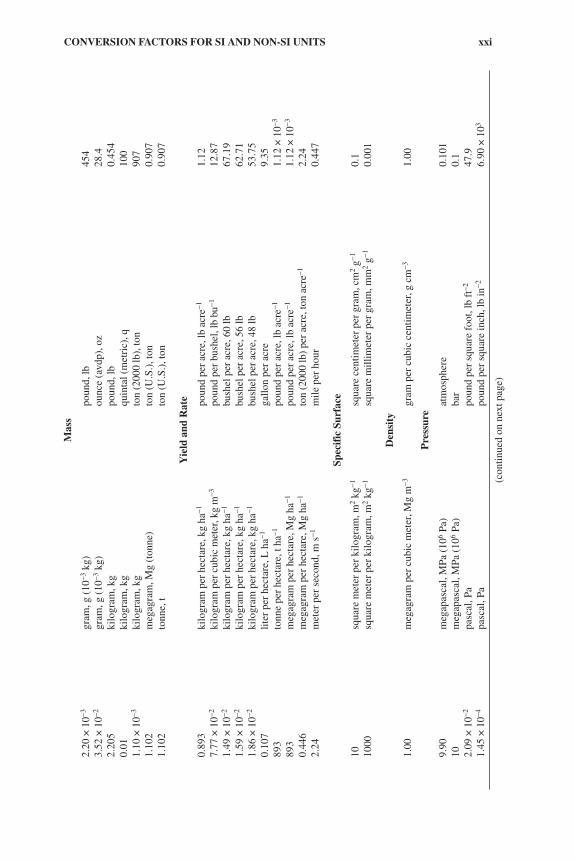
Conversion Factors for SI and non-SI Units
Con
vers
ion
Fac
tors
for
SI a
nd n
on-S
I U
nits
To c
onve
rt C
olum
n 1
To c
onve
rt C
olum
n 2
into
Col
umn
2,in
to C
olum
n 1,
mul
tiply
by
Col
umn
1 SI
Uni
tC
olum
n 2
non-
SI U
nits
mul
tiply
by
Len
gth
0.62
1ki
lom
eter
, km
(10
3m
)m
ile, m
i1.
609
1.09
4m
eter
, mya
rd, y
d0.
914
3.28
met
er, m
foot
, ft
0.30
41.
0m
icro
met
er, µ
m (
10−6
m)
mic
ron,
µ1.
03.
94 ×
10−2
mill
imet
er, m
m (
10−3
m)
inch
, in
25.4
10na
nom
eter
, nm
(10
−9m
)A
ngst
rom
, Å0.
1
Are
a
2.47
hect
are,
ha
acre
0.40
524
7sq
uare
kilo
met
er, k
m2
(103
m)2
acre
4.05
× 1
0−3
0.38
6sq
uare
kilo
met
er, k
m2
(103
m)2
squa
re m
ile, m
i22.
590
2.47
× 1
0−4sq
uare
met
er, m
2ac
re4.
05 ×
103
10.7
6sq
uare
met
er, m
2sq
uare
foo
t, ft
29.
29 ×
10−2
1.55
× 1
0−3sq
uare
mill
imet
er, m
m2
(10−3
m)2
squa
re in
ch, i
n264
5
Vol
ume
9.73
× 1
0−3cu
bic
met
er, m
3ac
re-i
nch
102.
835
.3cu
bic
met
er, m
3cu
bic
foot
, ft3
2.83
× 1
0−2
6.10
× 1
04cu
bic
met
er, m
3cu
bic
inch
, in3
1.64
× 1
0−5
2.84
× 1
0−2lit
er, L
(10
−3m
3 )bu
shel
, bu
35.2
41.
057
liter
, L (
10−3
m3 )
quar
t (liq
uid)
, qt
0.94
63.
53 ×
10−2
liter
, L (
10−3
m3 )
cubi
c fo
ot, f
t328
.30.
265
liter
, L (
10−3
m3 )
gallo
n3.
7833
.78
liter
, L (
10−3
m3 )
ounc
e (f
luid
), o
z2.
96 ×
10−2
2.11
liter
, L (
10−3
m3 )
pint
(fl
uid)
, pt
0.47
3
xx CONVERSION FACTORS FOR SI AND NON-SI UNITS
Mas
s
2.20
× 1
0−3gr
am, g
(10
−3kg
)po
und,
lb45
43.
52 ×
10−2
gram
, g (
10−3
kg)
ounc
e (a
vdp)
, oz
28.4
2.20
5ki
logr
am, k
gpo
und,
lb0.
454
0.01
kilo
gram
, kg
quin
tal (
met
ric)
, q10
01.
10 ×
10−3
kilo
gram
, kg
ton
(200
0 lb
), to
n90
71.
102
meg
agra
m, M
g (t
onne
)to
n (U
.S.)
, ton
0.90
71.
102
tonn
e, t
ton
(U.S
.), t
on0.
907
Yie
ld a
nd R
ate
0.89
3ki
logr
am p
er h
ecta
re, k
g ha
−1po
und
per
acre
, lb
acre
−11.
127.
77 ×
10−2
kilo
gram
per
cub
ic m
eter
, kg
m−3
poun
d pe
r bu
shel
, lb
bu−1
12.8
71.
49 ×
10−2
kilo
gram
per
hec
tare
, kg
ha−1
bush
el p
er a
cre,
60
lb67
.19
1.59
× 1
0−2ki
logr
am p
er h
ecta
re, k
g ha
−1bu
shel
per
acr
e, 5
6 lb
62.7
11.
86 ×
10−2
kilo
gram
per
hec
tare
, kg
ha−1
bush
el p
er a
cre,
48
lb53
.75
0.10
7lit
er p
er h
ecta
re, L
ha−1
gallo
n pe
r ac
re9.
3589
3to
nne
per
hect
are,
t ha
−1po
und
per
acre
, lb
acre
−11.
12 ×
10−3
893
meg
agra
m p
er h
ecta
re, M
g ha
−1po
und
per
acre
, lb
acre
−11.
12 ×
10−3
0.44
6m
egag
ram
per
hec
tare
, Mg
ha−1
ton
(200
0 lb
) pe
r ac
re, t
on a
cre−1
2.24
2.24
met
er p
er s
econ
d, m
s−1
mile
per
hou
r0.
447
Spec
ific
Sur
face
10sq
uare
met
er p
er k
ilogr
am, m
2kg
−1sq
uare
cen
timet
er p
er g
ram
, cm
2g−1
0.1
1000
squa
re m
eter
per
kilo
gram
, m2
kg−1
squa
re m
illim
eter
per
gra
m, m
m2
g−10.
001
Den
sity
1.00
meg
agra
m p
er c
ubic
met
er, M
g m
−3gr
am p
er c
ubic
cen
timet
er, g
cm
−31.
00
Pre
ssur
e
9.90
meg
apas
cal,
MPa
(10
6Pa
)at
mos
pher
e0.
101
10m
egap
asca
l, M
Pa (
106
Pa)
bar
0.1
2.09
× 1
0−2pa
scal
, Pa
poun
d pe
r sq
uare
foo
t, lb
ft−2
47.9
1.45
× 1
0−4pa
scal
, Pa
poun
d pe
r sq
uare
inch
, lb
in−2
6.90
× 1
03
(con
tinue
d on
nex
t pag
e)
CONVERSION FACTORS FOR SI AND NON-SI UNITS xxi

Con
vers
ion
Fac
tors
for
SI a
nd n
on-S
I U
nits
To c
onve
rt C
olum
n 1
To c
onve
rt C
olum
n 2
into
Col
umn
2,in
to C
olum
n 1,
mul
tiply
by
Col
umn
1 SI
Uni
tC
olum
n 2
non-
SI U
nits
mul
tiply
by
Tem
pera
ture
1.00
(K
−27
3)ke
lvin
, KC
elsi
us, °
C1.
00 (
°C +
273
)(9
/5 °
C)
+ 3
2C
elsi
us, °
CFa
hren
heit,
°F
5/9
(°F
−32
)
Ene
rgy,
Wor
k, Q
uant
ity
of H
eat
9.52
× 1
0−4jo
ule,
JB
ritis
h th
erm
al u
nit,
Btu
1.05
× 1
03
0.23
9jo
ule,
Jca
lori
e, c
al4.
1910
7jo
ule,
Jer
g10
−7
0.73
5jo
ule,
Jfo
ot-p
ound
1.36
2.38
7 ×
10−5
joul
e pe
r sq
uare
met
er, J
m−2
calo
rie
per
squa
re c
entim
eter
(la
ngle
y)4.
19 ×
104
105
new
ton,
Ndy
ne10
−5
1.43
× 1
0−3w
att p
er s
quar
e m
eter
, W m
−2ca
lori
e pe
r sq
uare
cen
timet
er69
8m
inut
e (i
rrad
ianc
e), c
al c
m−2
min
−1
Tra
nspi
rati
on a
nd P
hoto
synt
hesi
s
3.60
× 1
0−2m
illig
ram
per
squ
are
met
er s
econ
d,gr
am p
er s
quar
e de
cim
eter
hou
r,27
.8m
g m
−2s−1
g dm
−2h−1
5.56
× 1
0−3m
illig
ram
(H
2O)
per
squa
re m
eter
mic
rom
ole
(H2O
) pe
r sq
uare
cen
ti-18
0se
cond
, mg
m−2
s−1m
eter
sec
ond,
µm
ol c
m−2
s−1
10−4
mill
igra
m p
er s
quar
e m
eter
sec
ond,
mill
igra
m p
er s
quar
e ce
ntim
eter
104
mg
m−2
s−1se
cond
, mg
cm−2
s−1
35.9
7m
illig
ram
per
squ
are
met
er s
econ
d,m
illig
ram
per
squ
are
deci
met
er h
our,
2.78
× 1
0−2
mg
m−2
s−1m
g dm
−2h−1
Pla
ne A
ngle
57.3
radi
an, r
adde
gree
s (a
ngle
), °
1.75
× 1
0−2
xxii CONVERSION FACTORS FOR SI AND NON-SI UNITS

Ele
ctri
cal C
ondu
ctiv
ity,
Ele
ctri
city
, and
Mag
neti
sm
10si
emen
per
met
er, S
m−1
mill
imho
per
cen
timet
er, m
mho
cm
−10.
110
4te
sla,
Tga
uss,
G10
−4
Wat
er M
easu
rem
ent
9.73
× 1
0−3cu
bic
met
er, m
3ac
re-i
nch,
acr
e-in
102.
89.
81 ×
10−3
cubi
c m
eter
per
hou
r, m
3h−1
cubi
c fo
ot p
er s
econ
d, f
t3s−1
101.
94.
40cu
bic
met
er p
er h
our,
m3
h− 1U
.S. g
allo
n pe
r m
inut
e, g
al m
in−1
0.22
78.
11he
ctar
e m
eter
, ha
mac
re-f
oot,
acre
-ft
0.12
397
.28
hect
are
met
er, h
a m
acre
-inc
h, a
cre-
in1.
03 ×
10−2
8.1
× 1
0−2he
ctar
e ce
ntim
eter
, ha
cmac
re-f
oot,
acre
-ft
12.3
3
Con
cent
rati
ons
1ce
ntim
ole
per
kilo
gram
, cm
ol k
g−1m
illie
quiv
alen
t per
100
gra
ms,
meq
110
0 g−1
0.1
gram
per
kilo
gram
, g k
g−1pe
rcen
t, %
101
mill
igra
m p
er k
ilogr
am, m
g kg
−1pa
rts
per
mill
ion,
ppm
1
Rad
ioac
tivi
ty
2.7
× 1
0−11
becq
uere
l, B
qcu
rie,
Ci
3.7
× 1
010
2.7
× 1
0−2be
cque
rel p
er k
ilogr
am, B
q kg
−1pi
cocu
rie
per
gram
, pC
i g−1
3710
0gr
ay, G
y (a
bsor
bed
dose
)ra
d, r
d0.
0110
0si
ever
t, Sv
(eq
uiva
lent
dos
e)re
m (
roen
tgen
equ
ival
ent m
an)
0.01
Pla
nt N
utri
ent C
onve
rsio
n
Ele
men
tal
Oxi
de2.
29P
P 2O
50.
437
1.20
KK
2O0.
830
1.39
Ca
CaO
0.71
51.
66M
gM
gO0.
602
CONVERSION FACTORS FOR SI AND NON-SI UNITS xxiii
