near-infrared spectroscopic studies of ...eprints.qut.edu.au/30399/1/sarina_brandes_thesis.pdf3.6.2...
TRANSCRIPT

NEAR-INFRARED SPECTROSCOPIC STUDIES OF HUMAN SCALP HAIR IN A
FORENSIC CONTEXT
By Sarina Brandes B. App. Sc (Forensics)
This thesis is submitted in fulfilment of the requirements of the Masters of Applied Science
School of Physical and Chemical Sciences
Queensland University of Technology
2009


The work submitted in this thesis has not been previously submitted for a
degree or diploma at any other higher education institution. To the best of
my knowledge and belief, the thesis contains no material previously
published or written by any other person except where due reference is
made.
Signature: __________________ Date: __________________


i
Acknowledgements Firstly, I would like to thank my supervisor Dr. Serge Kokot for all his time and effort spent with me over the past years, and also his assistance and advice given to me on my path of knowledge. I would like to thank Dr. Llew Rintoul for his advice on the many aspects of Spectroscopy. The Queensland University of Technology for the opportunity to contribute to the world of science. Fellow graduate and postgrad students for their contribution and therapeutic help. I would like give many thanks to my family and friends for their kind support and for keeping me sane through the process. And finally, my pet cats for their company on the many late nights spent writing this thesis.


ii
Abstract
Human hair is a relatively inert biopolymer and can survive through natural disasters.
It is also found as trace evidence at crime scenes. Previous studies by FTIR-
Microspectroscopy and – Attenuated Total Reflectance (ATR) successfully showed
that hairs can be matched and discriminated on the basis of gender, race and hair
treatment, when interpreted by chemometrics. However, these spectroscopic
techniques are difficult to operate at- or on-field. On the other hand, some near
infrared spectroscopic (NIRS) instruments equipped with an optical probe, are
portable and thus, facilitate the on- or at –field measurements for potential application
directly at a crime or disaster scene.
This thesis is focused on bulk hair samples, which are free of their roots, and thus,
independent of potential DNA contribution for identification. It explores the
building of a profile of an individual with the use of the NIRS technique on the
basis of information on gender, race and treated hair, i.e. variables which can
match and discriminate individuals. The complex spectra collected may be
compared and interpreted with the use of chemometrics. These methods can then be
used as protocol for further investigations.
Water is a common substance present at forensic scenes e.g. at home in a bath, in the
swimming pool; it is also common outdoors in the sea, river, dam, puddles and
especially during DVI incidents at the seashore after a tsunami. For this reason, the
matching and discrimination of bulk hair samples after the water immersion
treatment was also explored.


iii
Through this research, it was found that Near Infrared Spectroscopy, with the use of
an optical probe, has successfully matched and discriminated bulk hair samples to
build a profile for the possible application to a crime or disaster scene. Through the
interpretation of Chemometrics, such characteristics included Gender and Race.
A novel approach was to measure the spectra not only in the usual NIR range (4000 –
7500 cm-1) but also in the Visible NIR (7500 – 12800 cm-1). This proved to be
particularly useful in exploring the discrimination of differently coloured hair, e.g.
naturally coloured, bleached or dyed. The NIR region is sensitive to molecular
vibrations of the hair fibre structure as well as that of the dyes and damage from
bleaching. But the Visible NIR region preferentially responds to the natural
colourants, the melanin, which involves electronic transitions. This approach was
shown to provide improved discrimination between dyed and untreated hair.
This thesis is an extensive study of the application of NIRS with the aid of
chemometrics, for matching and discrimination of bulk human scalp hair. The work
not only indicates the strong potential of this technique in this field but also breaks
new ground with the exploration of the use of the NIR and Visible NIR ranges for
spectral sampling. It also develops methods for measuring spectra from hair which
has been immersed in different water media (sea, river and dam)


iv
Table of Contents Acknowledgements i Abstract ii Table of Contents iv Appendix I – List of Figures ix Appendix II – List of Tables xii Chapter 1: Introduction 1
1.1 Trace Evidence 3
1.2 Human Hair 5
1.3 Bleaching and Colouring of Hair 11
1.4 Environmental Weathering of Hair 15
1.5 Forensic Investigation of Hair Traces 19
1.6 Disaster Victim Identification 25
1.7 Analysis of Fibres 29
1.8 Vibrational Spectroscopy 33
1.9 Near Infrared Spectroscopy 35
Chapter 2: Experimental Methodology 43 2.1 Samples 43
2.2 Near Infrared Spectroscopy 43
2.3 Hair Number Analysis 45
2.4 Spectral Sampling Methods 45
2.5 Treatment of Hair 47
2.5.1 Water Sample Collection 47
2.5.2 Drying Methods 49
2.5.3 Water Treatment 49
2.5.3 Cleaning Treatment 51
2.6 Chemometric Analysis 51


v
2.6.1 Data Treatment 53
2.6.2 Pre-treatment Methods for Raw Data Matrix 53
2.6.3 Principal Component Analysis 55
2.6.4 Fuzzy Clustering 57
2.6.5.1 MCDM Methods: PROMETHEE and GAIA 59
2.6.5.2 Application of PROMETHEE to a Dataset 65
Chapter 3: Preliminary Experimental Work 69
3.1 Raw Spectra 69
3.2 Size of Hair Bundles 69
3.3 Spectral Sampling Analysis 71
3.3.1 Sampling Method A Results 71
3.3.2 Sampling Method B Results 71
3.3.3 Sampling Method C Results 73
3.3.4 Sampling Method Conclusions 73
3.4 Peak Assignments 73
3.5 Comparison of Compounds to Structure 77
3.6 NIR Spectra and Wet Hair: Hair Drying 79
3.6.1 Isothermal Processes – Hair Drying: Spectral Results 79
3.6.2 Isothermal Processes – Hair Drying: Weight Loss Changes 83 3.6.3 Conclusions 85
Chapter 4: Matching and Discrimination of Hair -
Gender and Race 87 4.1 Analysis of Hair: Gender and Race Studies 89
4.2 Chemometric Analysis of Spectra 91


vi
Comparison of Hair - Race
4.3 Raw Spectra Analysis of Hair - Race 93
4.4 Chemometric Analysis of Male Spectra 95
4.4.1 Outlier Detection 95
4.4.2 PCA Analysis of Male Spectra 97
4.4.3 Loadings Plot of Male Spectra 97
4.5 Chemometric Analysis of Female Spectra 99
4.5.1 Outlier Detection 99
4.5.2 PCA Analysis of Female Spectra 101
4.5.3 Loadings Plot of Female Spectra 103
4.6 PROMETHEE of Race Spectral Objects 103
4.6.1 PROMETHEE Analysis of Male Spectral Objects 105
4.6.2 PROMETHEE Analysis of Female Spectral Objects 107
Comparison of Hair - Gender
4.7 Raw Spectra Analysis of Hair - Gender 109
4.8 Chemometric Analysis of Mongoloid Spectra 111
4.8.1 Outlier Detection 111
4.8.2 PCA Analysis of Mongoloid Spectra 113
4.8.3 Loadings Plot of Mongoloid Spectra 113
4.9 Chemometric Analysis of Caucasian Spectra 115
4.9.1 Outlier Detection 115
4.9.2 PCA Analysis of Caucasian Spectra 119
4.9.3 Loadings Plot of Caucasian Spectra 119
4.10 PROMETHEE of Gender Spectral Objects 121
4.10.1 PROMETHEE Analysis of Mongoloid Spectral Objects 121
4.10.2 PROMETHEE Analysis of Caucasian Spectral Objects 123
4.11 Conclusions: Gender and Race 127
Chapter 5: Matching and Discrimination of Treated Hair 129 5.1 Raw Spectra Analysis of Treated Hair 135
5.2 Chemometric Analysis of Differently Treated Spectral Objects 139


vii
5.3 Chemometric Analysis of Treated Hair 139
5.3.1 PCA Analysis of Treated Hair 139
5.3.2 Loadings of Treated Hair 145
5.3.3 Detection of Fuzzy Objects 147
5.4 PROMETHEE Analysis of Differently Treated Spectral Objects 151
5.4.1 PROMETHEE Ranking of Treated Hair 153
5.5 Conclusions: Treated Hair 161
Chapter 6: Matching and Discrimination of Hair - Samples Subjected to Water Medium Treatment 165 6.1 Experimental Design 169
6.2 Application of the Cleaning Treatment 173
6.2.1 Comparison of Raw Spectra Before and After the Application of IAEA Cleaning Method 173
6.2.2 PCA – Spectra from Hair Involving IAEA cleaning 177
6.2.3 PROMETHEE Analysis of Cleaned Samples 177
6.2.4 PROMETHEE Ranking Spectra Involving the Application of the IAEA Cleaning Method 179
6.3 Effect of Water on Bulk Hair Samples 181
6.3.1 Comparison of Raw Spectra of Hair Samples Immersed in Different Water Media 183
6.3.2 PCA – Hair Immersed in Different Waters 185
6.3.3 PROMETHEE Analysis of Samples 187
6.3.4 PROMETHEE Ranking of Spectra Related to Different Water Media 187
6.4 Effect of Immersion Time on Bulk Hair Samples 189
6.4.1 Comparison of Raw Spectra of Bulk Hair Immersed for Different Times in Different Waters 191
6.4.2 PCA - Effect of Immersion Time on Hair Treated in the
Three Water Media 193


viii
6.4.3 PROMETHEE Ranking of Immersion Times of Bulk Hair in All Water Mediums 195 6.5 Matching of Hair After Water Immersion 197
6.5.1.1 PCA – Identifying the Water Immersion Media 199
6.5.1.2 PROMETHEE Analysis of Reference Comparison 201
6.5.1.3 PROMETHEE Ranking – Identifying Water Immersion
Media 201
6.5.2.1 PCA – Identifying the Length of Time of Water Immersion 203
6.5.2.2 PROMETHEE Ranking - Identifying the Length of Time of Water Immersion 205
6.5.3.1 PCA – Identifying an Individual 207
6.5.3.2 PROMETHEE Ranking – Identifying an Individual 209
6.6 Conclusions: Studies of Immersed Hairs 211
Chapter 7: Conclusions 215


ix
Appendix I - List of Figures Figure 1.1: Condensation reaction of amino acids to polypeptides 8
Figure 1.2: Structure of Hair Follicle 10
Figure 2.1: Nicolet Nexus Near FT-IR Infrared Spectrometer 44 Figure 2.2: 360N Sabir Optical Fibre Probe 44 Figure 3.1: Spectral Comparison – Bundle Size 68 Figure 3.2: Spectral Derivative of Hair – Bundle Size 68 Figure 3.3: PC1/PC2 Scores plot - Spectral Sampling Method A 70 Figure 3.4: PC1/PC2 Scores plot - Spectral Sampling Method B 70 Figure 3.5: PC1/PC2 Scores plot - Spectral Sampling Method C 72
Figure 3.6: Comparison of Spectral Bands of Normal and 2nd Derivative Spectra 74
Figure 3.7: Spectral comparison - Drying of Hair 80 Figure 3.8: Spectral Derivative - Drying of Hair 80 Figure 3.9: Hair Drying as a Function of Time 82
Figure 4.1: Comparison of Spectra - Male Hair 92
Figure 4.2: Difference Spectrum - Male Hair 92 Figure 4.3: Comparison of Spectra - Female Hair 94 Figure 4.4: Difference Spectrum - Female Hair 94
Figure 4.5: PC1/PC2 Scores plot: Discrimination of Male Spectra 96 Figure 4.6: PC1 Loadings vs. Spectral Variables (Male Objects) 96 Figure 4.7: PC1/PC2 Scores plot: Discrimination of Female Hair 100 Figure 4.8: PC1 Loadings vs. Spectral Variables (Female Objects) 102 Figure 4.9: Comparison of Spectra - Mongoloid Hair 108
Figure 4.10: Difference Spectrum - Mongoloid Hair 108


x
Figure 4.11: Comparison of Spectra - Caucasian Hair 110
Figure 4.12: Difference Spectrum - Caucasian Hair 110
Figure 4.13: PC1/PC2 Scores plot: Discrimination of Mongoloid Spectra 112 Figure 4.14: PC1 Loadings vs. Spectral Variables (Mongoloid Objects) 112 Figure 4.15: PC1/PC2 Scores plot: Discrimination of Caucasian Male and Female Samples 118 Figure 5.1: Spectral Comparison of Bleached, Dyed and Untreated Treated Hair 134 Figure 5.2: Comparison of Spectra of Untreated and Dyed Samples (Untreated – Dyed) 136 Figure 5.3: Comparison of Spectra of Untreated and Bleached Samples (Untreated – Bleached) 136 Figure 5.4: PC1/PC2 scores plot: Discrimination of Differently Treated Hair Samples – Spectra in the 4000 – 7500 cm-1 NIR region 138 Figure 5.5: PC1/PC2 scores plot: Discrimination of Differently Treated Hair Spectra in the 4000 – 12800 cm-1 NIR/Visible NIR region 140 Figure 5.6: PC1/PC2 scores plot: Discrimination of Differently Treated Hair Spectra in the 7500 – 12800 cm-1 Visible NIR region 142 Figure 5.7: PC1 Loadings vs. Spectral Variables of Spectral Objects in the 7500 – 12800 cm-1 Visible NIR region 144 Figure 6.1: Spectral Comparison of the Effect of IAEA Cleaning Method Before and After Water Treatment 172 Figure 6.2: Difference Between Spectra of Before and After IAEA Cleaning Method (CO – TBIC, CO – TAIC) 172 Figure 6.3: PC1/PC2 Scores Plot: Comparison of Water Immersed Sample vs. Water and Cleaned Samples 174 Figure 6.4: Comparison of Spectra Between All Water Media 182
Figure 6.5: Difference Between Spectra From All Water Media (CO – Water (Dam, Sea, River) Spectrum) 180 Figure 6.6: PC1/PC2 Scores Plot: Comparison of All Water Mediums After Immersion for 24 Hours 182


xi
Figure 6.7: Comparison of Spectra Between Length of Time Hair is Immersed in All Water Media 190 Figure 6.8: Difference Between Spectra of Length of Time Hair is Immersed in Water (CO – Time (2 Hr, 24 Hr, 7 Day) Spectrum) 190 Figure 6.9: PC1/PC2 Scores Plot: Comparison of Immersion Times of Bulk Hair in All Water Media (Sea, River, Dam) 192 Figure 6.10: PC1/PC2 Scores Plot: Comparison of Unknown Sample to Reference Water Media 198 Figure 6.11: PC1/PC2 Scores Plot: Comparison of Unknown Sample to Reference Immersion Times 202 Figure 6.12: PC1/PC2 Scores Plot: Comparison of Unknown Sample to Reference Individuals 206


xii
Appendix II - List of Tables
Table 3.1: NIR spectral absorption bands present in human scalp hair 72
Table 3.2: Mass of the Hair During the Drying Process 82 Table 4.1: a) PROMETHEE Ranking of Male Hair (Caucasian and Mongoloid) b) Corresponding GAIA plot of Male Hair (Caucasian and Mongoloid) Ranking 104 Table 4.2: a) PROMETHEE Ranking of Female Samples (Caucasian and Mongoloid)
b) Corresponding GAIA plot of Female Hair (Caucasian and Mongoloid) Ranking 106 Table 4.3: 3 group (p = 2.5) Fuzzy Clustering Membership of Caucasian (Male and Female) Comparison 114 Table 4.4: a) PROMETHEE Ranking of Mongoloid Samples (Male and Female) b) Corresponding GAIA plot of Mongoloid Samples (Male and Female) Ranking 120 Table 4.5a: PROMETHEE Ranking of Caucasian Male and Female Samples 122 Table 4.5b: Corresponding GAIA plot of Caucasian (Male and Female) Ranking 124
Table 5.1: Sample Information of Treated Hair 130
Table 5.2: 3 group (p = 2.5) Fuzzy Clustering Membership of NIR Spectral Objects from Treated Hair 146 Table 5.3: 3 group (p = 2.5) Fuzzy Clustering of NIR/Visible NIR Spectral Objects from Treated Hair 148 Table 5.4: 3 group (p = 2.5) Fuzzy Clustering of Visible NIR Spectral Objects from Treated Hair 150 Table 5.5: a) PROMETHEE Ranking of Spectral Objects of Treated Hair, 4000 – 7500 cm-1 NIR region
b) Corresponding GAIA plot of the Treated Objects Ranking 152 Table 5.6: a) PROMETHEE Ranking of Spectral Objects of Treated Hair, 4000 – 12800 cm-1 NIR/Visible NIR region
b) Corresponding GAIA plot of the Treated Objects Ranking 154
Table 5.7: a) PROMETHEE Ranking of Spectral objects of Treated Hair, 7500 – 12800 cm-1 Visible NIR region b) Corresponding GAIA plot of the Treated Objects Ranking 156


xiii
Table 6.1: Water Immersion Factors of investigation 170
Table 6.2: a) PROMETHEE Ranking Spectral Objects from Immersed Hair Samples Before and After IAEA Cleaning Method
b) Corresponding GAIA plot of the Cleaning Treatment Ranking 176
Table 6.3: a) PROMETHEE Ranking of Comparison of Bulk Hair in All Water Media
b) Corresponding GAIA plot of the Water Media Ranking 186 Table 6.4: a) PROMETHEE Ranking of Immersion Times in All Water Media
b) Corresponding GAIA Plot of Immersion Times of All Water Media 194 Table 6.5: PROMETHEE Ranking Comparison of Unknown Sample to Reference Water Media:
a) Reference comparison without Unknown sample b) Reference comparison with Unknown sample c) Corresponding GAIA of water medium identification. 200
Table 6.6: PROMETHEE Ranking Comparison of Unknown Sample to Reference Immersion Times:
a) Reference comparison without Unknown sample b) Reference comparison with Unknown sample c) Corresponding GAIA of immersion length identification. 204 Table 6.7: PROMETHEE Ranking Comparison of an Unknown Sample to Reference Individual:
a) Reference comparison without Unknown sample b) Reference comparison with Unknown samples c) Corresponding GAIA of Individual identification. 208


1
Chapter 1: Introduction
Forensics and its development in science and the community have gained increasingly
more acceptance and use. This provides the opportunity to examine new techniques
and to push for their development to investigate crime. The growth in crime, terrorism
and Disaster Victim Identification (DVI), and the diverse circumstances from case to
case are a challenge for forensic examiners. Factors such as the various environments
in which the samples can be found, treatments and sampling must also be considered
and may cause problems in a case. However, research into new techniques can
provide the opportunity to overcome these aspects for more effective investigations.
Forensic scientists develop appropriate methodology to apply the most recent
scientific and technological innovations for the examination of forensic evidence in
criminal investigations [1]. Forensic science is based on the finding of evidence at a
scene and a single link made on the basis of forensic evidence could prove invaluable
in solving a case. This gives forensic science a very important role of not only
analysing the physical evidence but also delivering the interpreted findings in a court
of law for justice to be served [2].
A recent 2009 report from the US National Academy of Sciences [3] states the need
to change forensic comparative methods involving for example, samples of hair,
ballistics and fingerprints, from an opinion based observational science to one with
statistical robustness. With the exception of nuclear DNA analysis, no forensic
method has been rigorously shown able to consistently, and with a high degree of
certainty, demonstrate a connection between evidence and a specific individual or

2

3
source. This observation supports the need for forensic hair analysis to evolve into
reliable and validated methods of analysis able to be used in court.
1.1 Trace Evidence
Trace evidence left at a crime scene can be the crucial link in an investigation. It has
the potential to incriminate, exonerate and tell the story of an incident [4]. As
suggested by Edmond Locard, a forensic science pioneer, when two objects or people
come into contact with one another, a cross-transfer occurs. Locard’s Exchange
Principle governs the transfer of all trace evidence in forensic investigations [5]. This
facilitates the theory of human trace evidence transfer which attempts to link a person
directly to a scene.
Of all the common transferable human components, hair is the most plentiful, second
only to blood. The number of hairs per area of scalp varies from one individual to
another [6]. An average person has about 100,000 hairs on their scalp but this can
vary according to hair colour and other factors. For example, individuals with red hair
have on average approximately 90,000 hairs, blonde haired individuals about 140,000
while those with black and brunette hair are somewhere in between. Generally,
between 50 to 100 hairs are shed per day [6]. Although, an individual with red hair
shed less, the red colouring is less common in the general population and can
therefore be used as valuable evidence. The reverse is generally true for blonds.
Blonde haired people shed more, yet the colour is also more prevalent in the
population of most western countries and for intelligence purposes has less value [5].
In principle, hair can add to crime scene evidence in bulk or as single fibres, by its
physical and chemical properties. But the main aspect is the extraction of such

4

5
information preferably quickly and with ease. Traditional hair examination is tedious,
improvement of techniques and methods in this field are sorely required.
This thesis is concerned with the investigation of hair found as evidence at a crime
scene and retrieving the most information possible. This hair will be analysed by a
Near Infrared Spectrometer coupled with an optical probe and spectral results will
then be interpreted by chemometric analysis. By combining these techniques, a quick
and easy method of extracting information is devised while developing and expanding
scientific methodology available to the forensic science community.
1.2 Human Hair
Keratin proteins are a major constituent of human hair, animal fur, feathers and nails.
Human hair can be important forensic evidence at a crime scene because hair is often
found in trace form at such scenes. In addition, hair from disaster victims may be used
for identification [7]. However, the processes that affect chemical and physical
properties of keratin fibres must be studied in order to gain a further understanding to
identify fibres found not only intact, but also degraded by environmental factors at the
crime scene.
Hair is an appendage of the skin, and grows out of an organ known as the hair follicle.
The length of a hair extends from its root or bulb embedded in the follicle, continues
into a shaft and terminates at the tip end. The shaft is formed from three basic
components: the external cuticle, the inner cortex and the central axial medulla [8].

6
7
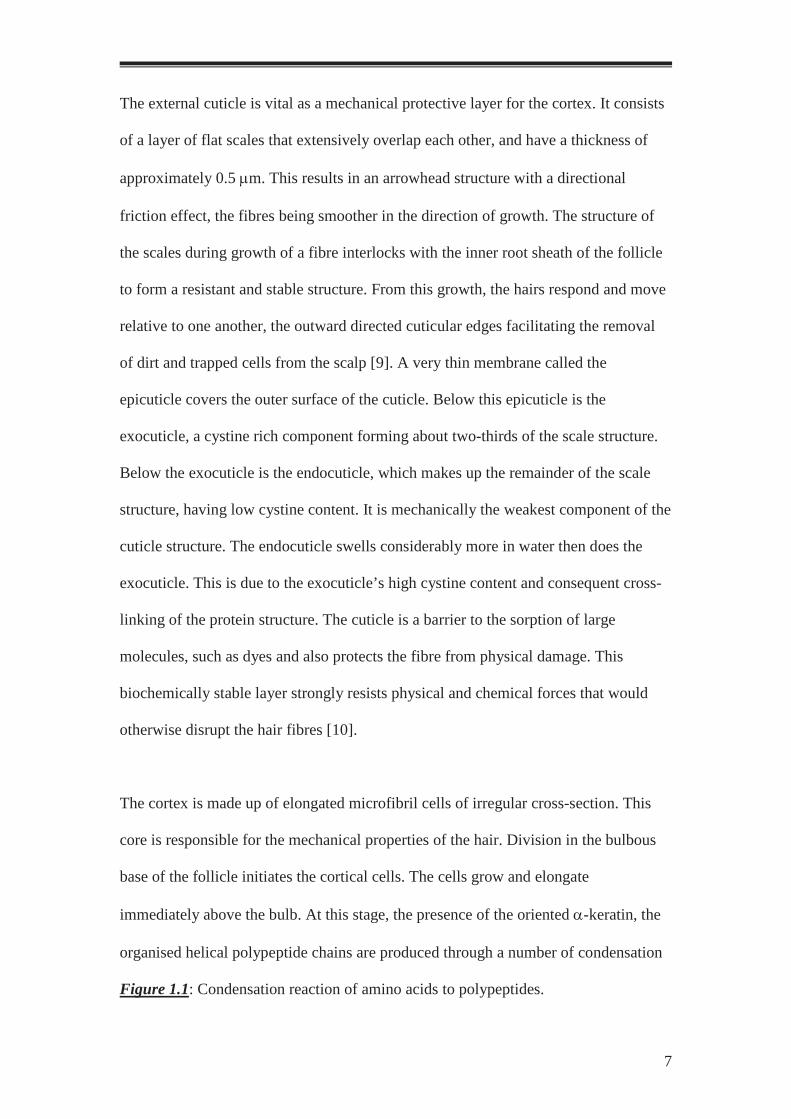
The external cuticle is vital as a mechanical protective layer for the cortex. It consists
of a layer of flat scales that extensively overlap each other, and have a thickness of
approximately 0.5 µm. This results in an arrowhead structure with a directional
friction effect, the fibres being smoother in the direction of growth. The structure of
the scales during growth of a fibre interlocks with the inner root sheath of the follicle
to form a resistant and stable structure. From this growth, the hairs respond and move
relative to one another, the outward directed cuticular edges facilitating the removal
of dirt and trapped cells from the scalp [9]. A very thin membrane called the
epicuticle covers the outer surface of the cuticle. Below this epicuticle is the
exocuticle, a cystine rich component forming about two-thirds of the scale structure.
Below the exocuticle is the endocuticle, which makes up the remainder of the scale
structure, having low cystine content. It is mechanically the weakest component of the
cuticle structure. The endocuticle swells considerably more in water then does the
exocuticle. This is due to the exocuticle’s high cystine content and consequent cross-
linking of the protein structure. The cuticle is a barrier to the sorption of large
molecules, such as dyes and also protects the fibre from physical damage. This
biochemically stable layer strongly resists physical and chemical forces that would
otherwise disrupt the hair fibres [10].
The cortex is made up of elongated microfibril cells of irregular cross-section. This
core is responsible for the mechanical properties of the hair. Division in the bulbous
base of the follicle initiates the cortical cells. The cells grow and elongate
immediately above the bulb. At this stage, the presence of the oriented α-keratin, the
organised helical polypeptide chains are produced through a number of condensation
Figure 1.1: Condensation reaction of amino acids to polypeptides.

8

9
reactions of L-amino acids leading to peptide bonds producing the polypeptide
(Figure 1.1 [11]). The α- helical keratin molecules bind via the hydrophobic bonds to
form the elongated strands called intermediate filaments. The stabilisation of the
material forming the cortical cells is called keratinisation. This keratinisation process
is a vital for growth and protection of hair. Hair becomes keratinised asymmetrically
along a fibre to give a bilateral effect to separate para-cortex and ortho-cortex regions
[12]. This process in the fibre consists primarily of the formation of links between the
long chains of protein via oxidation of the sulfhydril groups (-SH) [10]. This leads to
cell hardening. The S-S linkage of the cystine compound is the most important bond
as it not only stabilises the keratin molecule but is also the pivotal connection to all
other compounds within the keratin structure. This is a common characteristic among
the keratin structures of fibrous proteins [11]. The two carboxyl groups within the
cystine compound form the link between adjoining polypeptide chains. This is
achieved by the covalent bonds being formed via the disulfide bonds of the cystine
residue. These covalent cross-link’s create a helical structure to give a high degree of
physical and chemical stability in the fibre. The hydrogen bonding is also important as
the water and hydroxyl groups interact with the amide N-H and the carboxyl side
chains in order to stabilise the outer structure [7]. All these bonds and chemical
structures work together to form a stable structure.
The medulla component is a group of specialised cells which are vaculated and highly
resistant to alkali and other keratinolytic agents. During the keratinisation process, the
medullary cells do not elongate like the cortex but collapse to leave spaces. However
the main role of the medulla is as a space filler which can increase thermal insulation

10
Figure 1.2: Structure of Hair Follicle

11
of the cell [7] (Figure 1.2 [13]). If the fibre contains a medulla, it is physically coarser
and the medulla may be present at irregular intervals.
Through this description it is apparent that the structure of the keratin hair fibre has
naturally evolved protection such as the keratinisation, arrowhead structure of the
cuticle and a chemical composition which minimises degradation commonly found at
crime or disaster scenes. However factors affecting the keratin structure for forensic
purposes can include fire and extreme heat, which can very quickly destroy the trace
evidence. Chemical processes such as alkaline activity are also a major factor in
natural degradation breaking bond forces between molecules as well as the disulfide
bridges [14]. Hair burial damage can also include holes caused presumably by
microbes, in either the cuticle or right through the cortex of the fibre. Hair is also
susceptible to fungi and bacterial attack that involves enzymatic breakdown of the
disulfide bond followed by hydrolysis of the peptide links [15]. When a dead body is
found all of these factors may be affecting the overall condition of the hair fibre. Even
though the human hair is quite weather proof and durable, it will degrade at some
stage. These degradative processes are an important factor to consider when analysing
hair samples from reference to victim.
1.3 Bleaching and Colouring of Hair
A criminalist is particularly interested in colour, length and diameter when comparing
hair fibres in an investigation. A microscopic examination may also distinguish dyed
or bleached hair from natural hair [4]. This increases hair individualisation and thus
the reasonable statistical probability of a possible match [16]. The colour of hair
depends on melanin pigmentation, surface transparency, and reflectivity. Colour will

12

13
often be present in the cuticle as well as through the cortex with its distribution and
amount of pigment giving a critical comparative characteristic to the forensic
examiner [17]. As such the processes of colour dying and bleaching must be
understood so as to be able to compare coloured hair. Permanent hair dying is a hair
treatment that utilises precursors or primary intermediates which undergo oxidation
reactions for colour formations of the larger molecules containing the chromophores.
The precursor molecules are usually oxidised by hydrogen peroxide to active
intermediates, which are capable of condensing with unoxidised precursors or
coupling agents included in the formulation. The common couplers have strong
electron donating groups and as such react with the hydrophilic intermediates [18].
The colourants of the dye formulations contain preformed dye molecules that diffuse
and bind into the hair fibre with the help of the hydrogen peroxide for a permanent
effect. Temporary and semi-permanent dyes are not oxidised and do not bind
covalently. In addition to the presence of the dye molecules in the hair shaft, the
oxidative process of these hair products can cause changes in the keratins [10].
Bleaching is different to dying. The process does not contain dye molecules that bind
to the hair. Bleach lightens the hair or turns it blonde from its original colour as it
attacks the melanin pigments [19]. In addition, it attacks the cystyl residues in the hair
protein to give a sulphonic acid function as a final product [10]. Bleaching
formulations consist of solutions of up to 12% hydrogen peroxide, an ammonia
alkaliser and thickeners to give a final pH of around 10 [9].

14

15
1.4 Environmental Weathering of Hair
Environmental weathering plays an important role in the alteration and
biodeterioration of hair in regards to the potential evidential value of analytical results
[20]. Even though hair is one of the most resilient parts of the body, exposure to water
or burial conditions for prolonged periods increases the adverse affects. These
conditions may include hypertension of water, physical degradation by soil media,
microbial attack, and exposure to natural elements such as the sun, wind and rain [21].
There have been a number of studies on hairs subjected to burial media [21, 22, 23]
and the affects are well described. These degradation factors and conditions can be
applied to hairs subjected to water immersion as they differ only to a degree. Less soil
and mineral particles are present but they do contribute to the nature of the
deterioration. Their geographic location is the source of the specific type of
degradation that is caused. These factors may include the soil particles present in the
water, the type of microbial organisms and the subjection to natural elements with
varying amounts of sun, wind and rain which are linked to the location. The chance to
match hairs after a water treatment therefore decreases on physical examination. In
addition to water, hair is capable of absorbing a variety of aliphatic and aromatic
compounds, and their presence in the hair structure affects the mechanical properties
of the fibres.

16

17
Four main factors appear to play a role in determining whether or not a molecule
penetrates the hair structure [24]:
A. Molecular size
B. Electrical charges on the molecules
C. Ratio of hydrophobic to hydrophilic groups in the absorbent molecule
D. Presence or absence of highly polarised groups
Stability of a keratin fibre is the result of its structure and the three types of bonding
present: the disulfide bond, the hydrogen bond and the salt linkage. The disulfide
bond is broken only in the presence strong acids or alkalis, and the S-S bond is
converted to the sulfydryls. This rupture then promotes hair solubility [25]. Hydrogen
bonds stabilise the α-helix structure, but they dissociate readily in the presence of
water, and this explains a further water absorption - up to 35% by weight [26].
However, hydrogen bonding alone is not strong enough to solubilise keratin in water.
The attraction between the negative charges of the carboxyl group and the positive
charges of the amino groups in the polypeptide chain result in an ionic bond that
produces salt (polar) linkages. The uptake of charged molecules only occurs to the
extent that charged groups are available in the hair. Since the net charges are smaller
than the number of sites available for the binding of uncharged molecules, there is
very little modification to the internal structure. However, most of the water does bind
to these discrete sites. The highly alkaline media break down the salt linkages as well
as the disulfide bonds.

18

19
The external structure of the hair fibre is critical to the protection of its internal
structure against water. This is achieved by its cuticle outer layer and its high
contribution to the cystine content of hair. Due to its elasticity, hair tends to conserve
its natural shape and has an ability to stretch to 30% of its original length and 70%
when wet. It then reverts to its original shape after deformation [26]. The highly
cross-linked proteins and polymeric networks of the hair attribute to the exclusion of
the larger molecules. As water swells the hair, it allows for penetration of larger
molecules increasing the hair’s degradation process [24]. There are many structures
within a hair to protect it from deterioration by water, however the combination of
variables during prolonged immersion can increase the rates of degradation.
A subsequent technique must be capable of investigating bulk hair in its raw state to
obtain the most information possible. Environmental weathering of bulk hair samples
is explored as it plays an important role in the alteration and biodeterioration of hair in
regards to the potential evidential value of the analytical results. The matching and
discrimination of these samples after environmental treatment is vital in its
application to forensic investigations and the diverse situations that hairs are found in.
1.5 Forensic Investigation of Hair Traces
The science of hair comparison has been used in thousands of criminal cases all over
the world, because of the widespread presence of hair at crime scenes [10]. Hair has
evidentiary value in forensic science. Although a crime scene may be cleared of any
evidence such as personal possessions, fingerprints or footprints; hair fibres or strands

20
21
are much more difficult to remove because of poor visibility, persistence and their
shedable nature [27]. The forensic testing of hair strands dates back to as early as
1861, but did not gain scientific acceptance until after the turn of the century, and
public acceptance until the late 1950's. Since then the public acceptance of hair
examination has become widespread, and police receive enormous support for any
evidence involving hair strands [28]. The first Australian conviction resulting solely
on forensic evidence was based on hair. The rape/murder victim’s hair was found on a
blanket at the crime scene. Microscopic analysis of this hair showed it was of human
origin, and the degree of pigmentation suggested that it was similar to the victim’s.
The accused was found guilty and hanged at a Melbourne gaol in 1922. However,
when this case was reviewed in 1993, (some 70 years later), it was found that the
accused was wrongly convicted. The hair found at the scene was again examined and
compared to that of the victim. With the help of new technology, such as the SEM
Microscopy, the hairs were found to be of separate origins. The victim’s hair was dark
red and was compared to the trace evidence hairs which were light auburn. These new
results showed that the accused was mistakenly convicted due to inaccurate
interpretation of results and lack of experience [29]. Wrongful conviction is one
reason for the need for more advanced techniques with chemical as well as physical
analysis capabilities.
In general, it is known that a human hair may be used for identification of racial
origin and body or somatic location on the basis of its physical characteristics.
However, these few classifications are too broad to individualise a person over the
general population. Intermixing of racial origin adds an extra complication to the
exact origin of a person.

22

23
Misinterpretation can lead to false identifications and incorrect results, which are
costly to victims and accused alike. Consequently, there is a need for methods that can
be reliably tested and results subjected to QA scrutiny. Hopkins et al. [30] suggested
that FT-IR spectroscopy could be a useful tool to study hairs because it appeared that
there is a significant variation in the amino acid composition of human head hair
between individuals. These variations are due to factors such as genetic effects, race
and chemical treatment (age has not been found to influence the amino acid
composition). It has been suggested that there is a genetic influence on the cystine
content of human hair [30], i.e., higher levels of this amino acid have been reported in
hair from male individuals than females. Also the same study established that
chemical treatments can break down fibrous proteins to produce a relatively large
decrease in the whole-fibre content of human hair. It is therefore suggested that since
there is a variation in the composition of hair peptides, a variation in the infrared
spectra might also be expected due to the differences in the amide regions.
It is therefore suggested that the Near Infrared Spectroscopic approach may be a
solution for a method of human hair analysis for statistical rather than comparative
validation. This method may utilise the amino acid and chemical variability between
subjects for discrimination and profiling of an individual. This can potentially be
used to identify race and gender, and chemical treatments to hair, increasing
intelligence information that is currently unobtainable.

24

25
1.6 Disaster Victim Identification
In recent times, the use of human hair in forensic science has developed through
advancing scientific techniques. These techniques now allow a single strand of human
hair to identify race and age of the owner, drugs and narcotics the individual has
taken, and through DNA evaluation, sample comparisons to individualise from whose
head of hair it originated. The availability of these features has become important with
the increase of DVI requirements because of terrorist attacks and natural disasters.
Incidents where more than five deaths have occurred are noted as DVI scenes. DVI
facilitates the identification of the victims in part to give family members closure [31].
However, in some circumstances, examination of the victims can add to the account
of the events, eg. the 2001 New York World Trade Centre attacks [32]. The disaster
of the Boxing Day Asian Tsunami in 2004 also resulted in mass identification efforts
of over 100,000 corpses. The environmental factors made a severe impact on the
analysis, with bodies and body parts quickly decomposing in the harsh hot climate of
Asia.
International DVI teams collect, analyse and compare evidence such as DNA, from
relatives or personal items, physical attributes, fingerprints, dental and medical
records that build a profile for intelligence purpose for the process of identification
[33]. Of the 2319 bodies of the World Trade Centre disaster, human hair was the third
most used piece of evidence contributing to 1750 samples used for cross comparison
methods [32]. However, human hair is only evidence of value if it contains DNA
present in the root. This is the problem at present. Without extracting the DNA from
the hair, it is very difficult to use hair for identification and this is a major drawback.

26

27
Factors such as species, hair colour and somatic regions which are available through
microscopy are too broad to individualise a person over the general population i.e.
circumstantial evidence.
This is the challenge that will be addressed in this thesis, by exploring a different
technique to profile and possibly identify individuals from the matching and
discrimination of human scalp hair without resorting to DNA or microscopy.
Human hair has an extremely resilient outer coating, able to resist most environmental
degradation for prolonged periods of time. However, a hair fibre can be damaged
more quickly under extreme conditions such as the explosions of the Bali Bombings.
In such cases, hair is completely destroyed through fire damage and analysis
involving DNA or alternate identification methods become useless. The DNA
information from hair is destroyed quickly by normal environmental conditions and
even more so by extremities, whereas alternate comparative methods may still retrieve
information from damaged hair fibres [32]. In addition unusual features resulting from
either natural or environmental factors have the potential for greater evidential value
because the chance of a coincidental match is low and therefore the evidence becomes
more conclusive rather than circumstantial [34]. Another complication that may
occur, especially for airline passengers, is that items used for comparative analysis,
such as toothbrushes and hair brushes, may be lost or destroyed in an airline disaster.
Kinship samples may also be unavailable or scarce because some victims have few
living biological relatives or because the relatives are unable or choose not to
participate in the identification period. Families often travel together, and this limits
the availability of known kinship samples.

28

29
Given the many limitations for comparing hair, the need for an instrumental
technique which is able to perform repeatable, non-destructive measurements is
significant. In addition, the methods of identification at disaster scenes require a
quick throughput to limit the rate of degradation and also through minimal-error
analysis to minimise misinterpretations. This is a feature that the new proposed
method will utilise.
1.7 Analysis of Fibres
Routine techniques used in the forensic laboratory to identify a person are essentially
common comparative methods and include preliminary investigations with the use of
a stereomicroscope to identify the main features of the hair in question [1]. If
necessary the hair is then compared to known hairs from any victims or suspects [4].
A new simple method of discrimination of human hair that builds a profile on a
person with maximised accuracy could be of great importance to a forensic scientist.
Panayiotou and Kokot described a forensic investigation of human hair [35] and
found that people could be discriminated according to the infrared spectra of human
scalp hair by using chemometric methods. This study could be of major importance in
preliminary forensic investigations. FTIR-microspectroscopy was used to examine
single human scalp hair fibres. The spectra collected were subjected to chemometric
methods of analysis including PCA, SIMCA and Fuzzy Clustering. In the same study,
it was found that discriminations of the FT-IR spectra of hair fibres could be made
with the use of PCA and such discriminations included gender, race, chemical
treatment of single or multiple treatment detection [34].

30

31
An extension of this investigation involved the exposure of human hair to certain
environmental media to which a cadaver might be exposed. This research was also
performed through FT-IR Microscopy and chemometrics for single scalp hairs. The
factors included for example mud, soil or sand. Paris et al. [36] found that human
hairs could still be matched and discriminated after environmental exposure but the
results were not definitive.
The research from Panayiotou [35] and Paris [36] provided a successful foundation
of Spectroscopy coupled with chemometrics from which further methods could be
researched and developed. The ideas of this early work could now be taken further
to look for a technique which is able to investigate hair not only in its raw state but
also after exposure to the environment e.g. immersion in water. Thus, the general
hypothesis proposed in this thesis is that another Infrared technique coupled with
chemometrics for matching and discrimination of bulk hair samples, Near Infrared
Spectroscopy, is able to analyse human hair in its normal day-to-day condition as
well as after exposure to the environment. With the advantages of having a portable
NIR instrument capable of relatively quick, easy and non- destructive
measurements, the method can be applied to forensic and disaster scenes. The
coupling with chemometric methods will provide the change from current hair
analysis of an opinion based observational science to one of statistical robustness.

32

33
1.8 Vibrational Spectroscopy
Vibrational Spectroscopy has become an important versatile technique with
applications from forensic investigations to medical and chemical industries [37]. By
including quantitative and qualitative analyses the interpretations of the spectra can
reveal important identification indicators. Papers have shown that human scalp hair
and wool, both from the fibrous keratin protein family, also cotton and other natural
polymers from cellulosic material can be investigated. Infrared (IR) spectroscopy is
one of the most versatile techniques available for the measurement of molecular
species in an analytical laboratory. IR spectroscopy achieves this by utilising the
molecules which undergo energy transitions that absorb the IR radiation. IR
absorption spectra from molecular species arise from the transitions of molecules
from one vibrational or rotational energy state to another. This determines their
structure based on their absorption spectra [38]. Three primary regions make up the
IR spectrum. Near Infrared, which constitutes the 12800 to 4000 cm-1 region, Mid- IR
with the 4000 to 200 cm-1 region and Far Infrared with 200 to 10 cm-1 [37]. However,
the majority of the instrumental analyses of fibres both keratinous and cellulosic are
performed in the Mid-IR region. This region covers the fundamental vibrations of
most of the common chemical bonds featuring light to medium weight atoms [37].
Organic and protein compounds have been found to be particularly well represented
in this spectral region. Every region provides a spectral profile of a sample, which are
unique for the identification of the compounds within the structure. Such a profile
includes spectral bands such as first, second and third overtones, as well as
combination (summation of difference) bands due to stretching and bending
vibrations.

34

35
Fourier Transform Infrared spectroscopy is a technique that is common for the Mid IR
region. As this region contains the fundamental absorption bands, extensive
qualitative and quantitative analyses are possible in all states of matter. Thus, the
advantage of Mid-IR spectra is that the bands are clear, sharp and can be generally
readily assigned. This instrument forms the basis for another technique with minor
differences in the instrumentation; the FT-Near Infrared (FT-NIR) technique.
1.9 Near Infrared Spectroscopy
FT-NIR spectroscopy functions in conjunction with an interferometer to produce
spectra of the fibres in question. An interferometer operates with four so-called arms.
The first arm contains a source of infrared light, the second arm contains a stationary
mirror, the third arm contains a moving mirror and the fourth is the detector. At the
intersection of the four arms is a beamsplitter, which is designed to transmit half the
radiation that impinges upon it, and reflect the other half of it [39]. As a result, the
light transmitted by the beamsplitter strikes the fixed mirror, and the light reflected by
the beamsplitter strikes the moving mirror. The difference in distance between the
light beams is called optical retardation. After reflecting off their respective mirrors,
the two light beams recombine to be in or out of phase at the beamsplitter [39]. The
individual beams combine to either constructively or destructively interfere. If the
moving mirror is at constant velocity, the intensity of the infrared radiation increases
or decreases. As the light interacts with the sample fibres, the variation of light
intensity with optical path difference is measured by the detector. The initial output is
a time domain interferogram which is converted with the use of a Fourier transform to
the frequency domain spectra [40].

36
37
The major advantages of the FT-NIR method are described as the Jacquinot and
Multiplex advantage. The Jacquinot advantage is apparent when a higher energy
throughput in an interferometer is introduced while maintaining resolution, when
compared to dispersive instruments. As the interferometer has no spectral slits [41], it
provides increased in optical throughput with an enhanced signal at the detector
leading to improved signal to noise ratios. The Multiplex advantage is based on the
FT-NIR detecting all frequencies of light simultaneously whereas the original
dispersive spectrometers could only analyse one frequency at a time [41]. Therefore,
FT-NIR instruments complete the spectrum rapidly and multiple scans can be
acquired and averaged for accuracy and fast throughput. A further advantage of FT-
NIR is Connes’ advantage and gives reference to the enhanced photometric accuracy
developed from the built-in electronic calibration produced by the interaction of an
alignment laser with the beam splitter [41]. The calibration adds accuracy and
reproducibility limiting misalignment.
The NIR region has been applied for many different quantitative measurements for a
wide variety of solid and liquid samples. However, the overtone and combination
bands measured in this region are at least one to two orders of magnitude weaker than
the original fundamental absorptions in the Mid-IR range [37]. Typically NIR bands
are broad and are composites of many overlapping bands. This makes band
assignment difficult. Given the nature of NIR bands, it is common and normally an
advantage to use a bulk material or large sample sizes relative to those required for

38

39
FTIR. In this work, this problem was overcome by utilising bulk hair samples from a
person’s scalp sample, instead of single hairs as used in prior research [37].
The major advantage of the NIR instrument over other spectroscopic techniques is the
availability of a portable alternative. The instrument can be physically taken to a
crime scene for spectral collection of evidence. This limits possible contamination and
destruction of samples during collection. This also creates the possibility of
transporting spectra instead of hair samples in the case of inconvenient locations of
crime scenes or DVI situations where laboratories may be overflowing or nonexistent.
This also reduces the risk of mixing and the mislabeling of samples.
The NIR technique requires minimal sample handling, decreasing the possibility of
contamination and sample destruction, a critical point in forensic evidence.
Removable accessories have also minimised sample preparation leading to faster
measurements. As contamination creates a setback in crime scene and DVI protocol,
this feature can save time and also limit contamination where in other cases it may
create severe dilemmas. The fibre-optic probe is one such accessory which makes
immense contributions to the ease of spectral measurements as no spectral
compartments or cleaning methods have to be employed. Maneuvering the probe by
hand over the sample is all that is required to make such measurements. The probe
consists of a bifurcated, randomly mixed bundle of low-OH optical fibers mounted in
a stainless steel probe head with an angled sapphire window on the tip of the probe.
Half of the fibers bring the light from the spectrometer to the window and the second
half returns the reflected light back to the detector. The NIR instrument has

40

41
an optimised fiber optic port that focuses the light from the spectrometer onto a fiber
optic connector and then focuses the return near-infrared (NIR) signal onto a high
sensitivity InGaAs detector [42].
Nevertherless, another common problem in NIR is not only sample amounts but area
coverage of the optical sample point of the probe. This relates to the issue of
measuring a representative sample. In this work, the use of hair in bundles will
attempt to overcome this problem. But in doing so another issue arises, namely the
variability between strands of human scalp hair. It is said that no two specimens of
hair from one person are identical in every detail [1]. Therefore, consideration must
be taken into a specific sampling technique over a small area of the bundle so as to
represent the greater sample and also as an average. The Multiplex advantage
contributes to this as the spectra obtained can be averaged to obtain representative and
rapidly produced spectra.
The Near Infrared Spectroscopy is a possible technique able to investigate bulk hair
not only in its raw state but also after the application of an environmental treatment. It
has several advantages over previous techniques and offers new methodology to the
forensic sciences.
This thesis will focus on the matching and discrimination of bulk hair by Near-
Infrared spectroscopy coupled with chemometrics for interpretation.

42

43
Chapter 2: Experimental Design
2.1 Samples
Waste hair samples were collected from 25 male and female persons (Age: 15-50
years). Untreated hair was made up to bundles of approximately 150 fibres. The
bundles were bound by Tesa brown adhesive tape at the tip end and were acclimatised
in a desiccator, open to constant laboratory conditions (ca. 50% RH and 23° C). No
further treatment was applied to the hair bundles prior to analysis.
2.2 Near Infrared Spectroscopy
NIR spectra were recorded with the use of a Nicolet Nexus Fourier Transform Near-
Infrared spectrometer (FT-NIR) (Figure 2.1) fitted with a 360N SABIR Optical Fibre
probe accessory (Figure 2.2). The spectra were measured from 4000 - 12800 cm-1
region in the absorbance mode (log(R/R0)). The tied hair bundles were placed onto a
10 x 10 cm probe stand platform and analysed by a 1.6 cm diameter optical probe
with a 4mm active surface from below the stand. A Spectralon block (5 x 5 cm) was
used as a background reference to the hair fibres. The block was also used as a
weight and placed on top of the fibres to hold the bundles in position above the quartz
window. Background scans were recorded from the Spectralon between hair bundle
samples. The following parameters were applied:
Number of Scans: 256 Resolution (cm-1): 16
Gain: 8 Aperture (μm): 89 Velocity (cm.s-1): 1.2659 Source: White Light Detector: TEC NIR InGaAs (12800 - 4000 cm-1) Beamsplitter: Quartz (15000 - 2000 cm-1)

44
Figure 2.1: Nicolet Nexus Near FT-IR Infrared Spectrometer
Figure 2.2: 260N Sabir Optical Fibre Probe

45
The spectra were individually saved as .SPA files with the use of the OMNIC E.S.P
5.2a Spectral Software Program.
2.3 Hair Number analysis Sample preparation is an important issue in regard to spectroscopy so as to optimise
the quality of the spectra produced. Near Infrared Spectroscopy requires significantly
larger sample sizes to measure comparable levels of light absorption. Previous
research in infrared spectroscopy used fibre flattening as a method of overcoming the
problem of aperture sampling size [11, 36]. However, as the NIR analyses utilises an
optical probe, the methodology must be changed. For this reason hair fibre bundles
were used for spectral measurements. However, the minimum number of hairs per
bundle actually needed for a measurement had to be determined.
Test samples of 1 to 10, 15, 20, 25 and 30 hairs were prepared. Each bundle was
placed over the optical probe (Fig 2.2) for spectral collection and the resulting
spectrum was compared with other measurements (See Chap 3, Section 2).
2.4 Spectral Sampling Methods The NIR instrument requires significantly larger sample sizes, such as bulk hair, to
measure comparable levels of light absorption. However, the variability between
individual strands of hair becomes an issue. An average representation of the fibre
bundle could resolve the problem. Several sampling methods were trialled for bulk
hair analysis with the use of the NIR probe. The preferred method was one that could
discriminate spectral samples from different persons but reduce the separation
between repeated spectral scans.

46
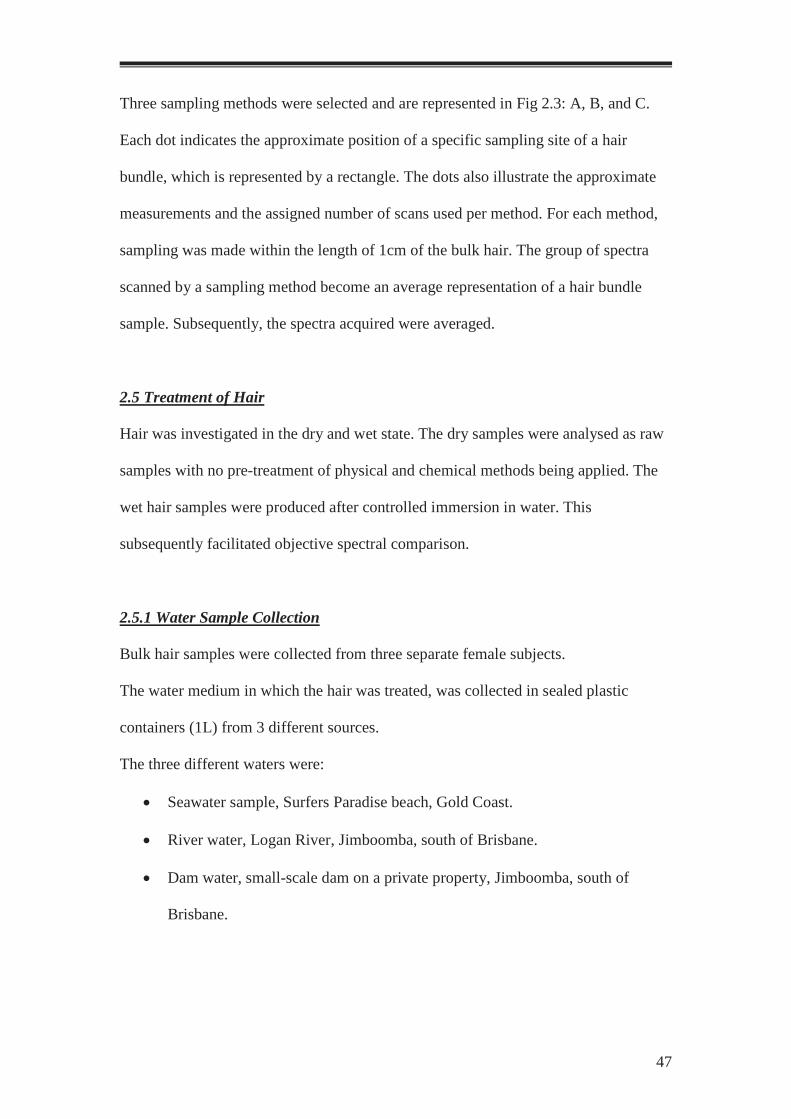
Figure 2.3: Spectral Sampling
Method A Method B Method C
Flip side
47
Three sampling methods were selected and are represented in Fig 2.3: A, B, and C.
Each dot indicates the approximate position of a specific sampling site of a hair
bundle, which is represented by a rectangle. The dots also illustrate the approximate
measurements and the assigned number of scans used per method. For each method,
sampling was made within the length of 1cm of the bulk hair. The group of spectra
scanned by a sampling method become an average representation of a hair bundle
sample. Subsequently, the spectra acquired were averaged.
2.5 Treatment of Hair
Hair was investigated in the dry and wet state. The dry samples were analysed as raw
samples with no pre-treatment of physical and chemical methods being applied. The
wet hair samples were produced after controlled immersion in water. This
subsequently facilitated objective spectral comparison.
2.5.1 Water Sample Collection
Bulk hair samples were collected from three separate female subjects.
The water medium in which the hair was treated, was collected in sealed plastic
containers (1L) from 3 different sources.
The three different waters were:
• Seawater sample, Surfers Paradise beach, Gold Coast.
• River water, Logan River, Jimboomba, south of Brisbane.
• Dam water, small-scale dam on a private property, Jimboomba, south of
Brisbane.

48

49
Prior to collection, the plastic containers were rinsed twice with the particular water
medium. Approximately 800mL of water was then collected from its designated
location. Suspended solids were not included in the waters collected. The water was
not filtered to maintain its environmental conditions.
2.5.2 Drying Methods
A hair bundle was weighed before the investigation. This sample was then immersed
in a river water medium for 2 hours. The hair sample was then removed and weighed
on an analytical balance. The sample was then vertically pinned between two clamps
of a retort stand. A 50Hz hair dryer was positioned from the retort stand 25 cm from
hair bundles. The hair was dried for 1 minute, weighed and a spectrum was recorded.
This was repeated each minute for 10 min. Measurements were then taken every 2
min for a further 20 min, then every 5 min for a further 40 min, and finally 10 min
until a total of 60 min.
2.5.3 Water Treatment
Each hair sample was separated into 9 subsets of 3 samples each of approximately 30
hairs per sample.
• The first subset served as a control and was therefore not immersed in the
water.
• The second subset was immersed in a container of seawater for 2 hours.
• The third set was immersed in seawater for 24 hours.
• The fourth set was immersed in seawater for 7 days
• The fifth set underwent a cleaning method but was not treated by water

50

51
A cleaning method was applied to sets 2 to 5 after immersion (Section 2.5.4)
The hairs were sealed in the containers and retrieved from the media according to
each treatment. After removal, the hairs were placed in labelled bags ready to be
cleaned in preparation for analysis. This was then repeated for each water medium
and each hair sample.
2.5.4 Cleaning Treatment
A modified IAEA (International Atomic Energy Agency) cleaning method of hair was
applied in this work [43, 44]. After the water treatment, the wet hairs were placed in
sample vials for cleaning procedures. Acetone (Merck, 99% purity) was added to
these vials for washing. The sample vials were then placed in a 250ml beaker and
placed into a sonication water bath with 50Hz sonic intensity. The vials were
sonicated for 10 minutes.
The samples were then rinsed in HPLC-grade water, decanted and rinsed once more
with HPLC-grade water and sonicated for a further 10 min. The process was then
finished by rinsing the sample with de-ionised water.
The hair samples were then dried using a hair dryer for 15 minutes. Once dried, the
hair samples were placed in an open labelled clip seal bag and acclimatised in an open
desiccator for 2 days (ca. 50% RH and 23° C). The samples were then analysed via
NIR spectroscopy.
2.6 Chemometric Analysis
The field of chemometrics is a useful mathematical approach for pattern recognition
in the data, its classification and prediction. It is particularly useful in identifying

52

53
relationships between objects and the variables affecting them. Thus, the measured
NIR spectra were imported into Sirius (Version 6.0, Pattern Recognition Systems,
1998) for chemometric analysis by Principal Component Analysis (PCA) and by
utilising data classification methods such as Fuzzy Clustering (FC).
2.6.1 Data treatment
The collected spectra were transferred and converted into ASCII format by importing
the Omnic .SPA files into GRAMS/32AT 6.0 files. The new spectra were then
converted with the use of a macro available in GRAMS. A dataset was created and
subjected to the 2nd derivative transformation and truncation. Truncation involves the
removal of the outer ranges of a wavelength region. The same raw dataset was
separately converted only by truncation. The spectral region of 4000-7500 cm-1 was
selected for investigation as it contains the majority of typical NIR absorption bands
for human hair. Therefore, all spectra were truncated to this region (except those used
in Chapter 5, p131). The spectral variable data matrices from the ASCII file were
imported into an .XLS spreadsheet of Microsoft EXCEL 6.0 (256 column limit) via
the command prompt available through Windows XP.
2.6.2 Pre-treatment Methods for Raw data matrix
A data pre-treatment method can correct differences in size and range of spectra
acquired from an instrument. It places data on the same scale for analysis. Pre-
treatments include mean centring, double mean centring, standardisation or
normalisation [45].

54

55
Mean centring, or y-mean scaling, is the procedure whereby each individual variable
is subtracted from the total mean of all variables.
yim = xim – x.m
where yim = column centred datum
xim = datum in row i and column m before centring
x.m = mean of column m = ∑ xim/I i
Standardisation is a weighting technique that either reduces or enhances the individual
influence of each individual variable to give it equal importance. This is achieved by
dividing the variable by its standard deviation yim = (xim – x.m)/sm. The standardisation
method is often combined with the mean centring pre-treatment and is called
autoscaling [45].
CH2 normalisation is a method that utilises the CH2 band (5777 cm-1 or to the nearest
wavenumber) as an internal standard. Each value of the variables or spectral
measurements is scaled to the reference [46].
2.6.3 Principal Component Analysis
PCA is a mathematical approach, applied in order to gain more insight to the data
structure [47]. PCA reduces the number of dimensions of the multivariate data. It
takes the original variables from the data and transforms them into orthogonal
Principal Components (PC’s). The PC’s are determined such that the greatest amount
of data variance is explained by the first PC. Each subsequent PC then explains a
decreased amount of variance independent of other PC’s [47].

56

57
The transformation of the data into PC’s is given by [48]:
u1 = a11x1 + a12x2 + … + a1nxn
Where u = new variables or PC’s x = measured values a = variable weights or loadings n = number of original variables
In this equation, the weights or loadings values (a) indicate the contribution of the
original parameters to a particular PC. The projections of the experimental points onto
the new variables are known as scores [47]. A PC scores plot provides a visual aid for
the interpretation of relationships between objects, while a loadings plot illustrates the
contribution of the corresponding variables to a particular PC. Combining the scores
and loadings generates a biplot in order to explain the relationships between them.
PCA, loadings vs. variables plots and biplots provide data verification techniques for
further data extraction and visualisation of the NIR spectra acquired from the
investigation.
2.6.4 Fuzzy Clustering
Fuzzy clustering (FC) is a non-hierarchical unsupervised classification method [49].
The user nominates the number of classes. However, the objects are not allocated to
classes. The class allocation is achieved by a membership function. The user then
nominates the type of classification to be used. The classification ranges from hard to
soft, and this is determined by varying an index, p associated with the membership
function [49]. The index values vary between 1 and 3. Hard classification is used by
choosing a low p value close to 1 while choosing a high p value between 2 and 3
produces soft classification. The class membership limit is defined as 1/n where n is
the number of classes. An example of a common membership function below

58

59
indicates the influence of the p value upon the equation.
m(x) = 1-c[x – a]p
(a, c and p are constants).
When the data is processed, a membership value of 1/n or less is assigned to each
object. A membership value of > than 1/n indicates strong belonging to a class,
whereas a value of less than 1/n has no association with the class. Conversely, if an
object's membership is spread over several classes, then the object has fuzzy class
membership, i.e. the object has properties of several classes. In contrast to PCA,
where a statistically significant number of objects are required for robust modelling,
FC can compare as few as two objects.
2.6.5.1 MCDM Methods: PROMETHEE and GAIA
PROMETHEE is a non-parametric method that rank orders objects or actions on the
basis of a range of variables or criteria. The ranking is modelled according to
preferences and weighting conditions, which are designated by the user, and then
applied to the criteria in the case of human hair, PC’s from the PCA and used as
variables [50].
The details of the algorithm have been previously presented [50], and only a summary
is provided here.
Step 1: The raw data matrix is transformed into a difference matrix.
For each criterion, the column entries, y, of the raw data matrix are subtracted from
each other in all possible combinations to create a difference, d, matrix.

60
61
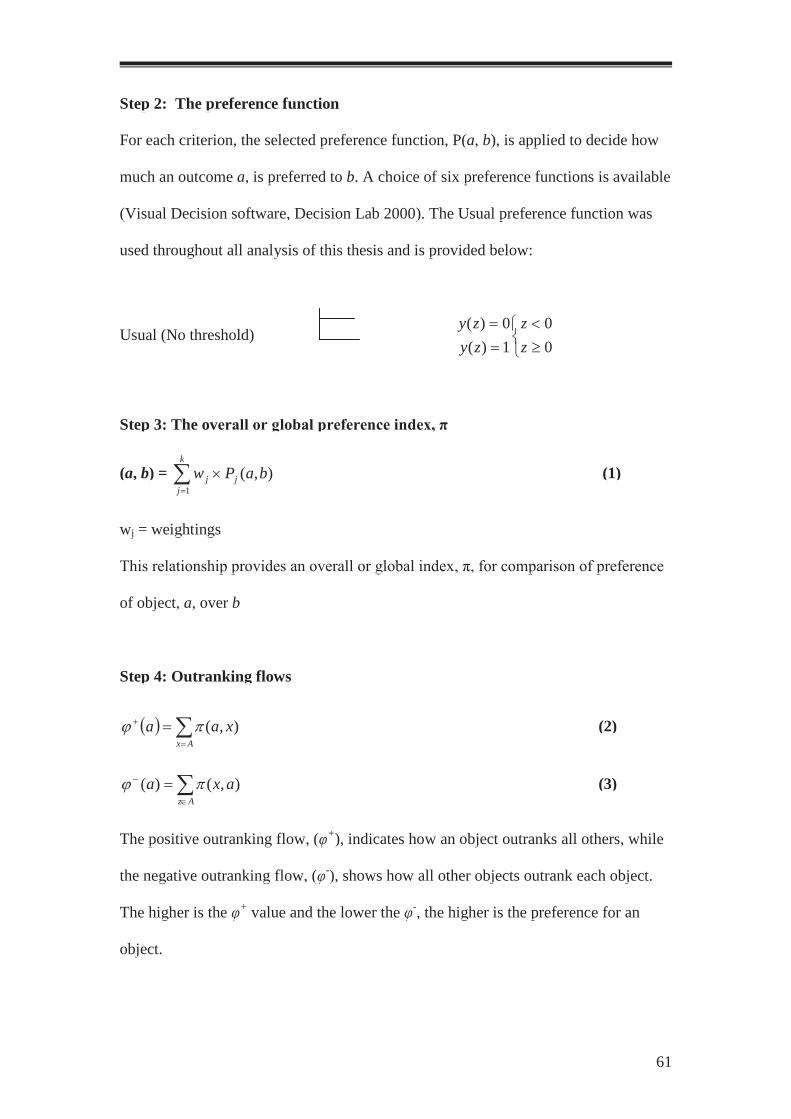
Step 2: The preference function
For each criterion, the selected preference function, P(a, b), is applied to decide how
much an outcome a, is preferred to b. A choice of six preference functions is available
(Visual Decision software, Decision Lab 2000). The Usual preference function was
used throughout all analysis of this thesis and is provided below:
Usual (No threshold)
≥<
==
00
1)(0)(
zz
zyzy
Step 3: The overall or global preference index, π
(a, b) = ),(1
baPw j
k
jj ×∑
=
(1)
wj = weightings
This relationship provides an overall or global index, π, for comparison of preference
of object, a, over b
Step 4: Outranking flows
( ) ∑=
+ =Ax
xaa ),(πϕ (2)
∑∈
− =Az
axa ),()( πϕ (3)
The positive outranking flow, (φ+), indicates how an object outranks all others, while
the negative outranking flow, (φ-), shows how all other objects outrank each object.
The higher is the φ+ value and the lower the φ-, the higher is the preference for an
object.

62

63
Step 5: Comparison of outranking flows.
Application of the rules below for pair wise comparisons (of a and b) of all results
produces a partial ranking or partial pre-order of the objects:
i. a outranks b if:
)()( ba ++ > ϕϕ and )()( ba −− < ϕϕ (4)
or
)()( ba ++ > ϕϕ and )()( ba −− = ϕϕ (5)
or
)()( ba ++ = ϕϕ and )()( ba −− < ϕϕ (6)
ii. a is indifferent to b if:
)()( ba ++ = ϕϕ and )()( ba −− < ϕϕ (7)
iii. a cannot be compared with b
From this analysis one can obtain PROMETHEE I partial ranking flows i.e. an order
of objects which not only includes rank ordering as described by equations 4 - 6
above but also which acknowledges equation 7. This model (Equations 4 - 7) includes
the option, which indicates the objects that have attained the same rank but on the
basis of different variables i.e. there may be alternative objects on the same rank. In
some scenarios such knowledge may be useful. However, in general, the
PROMETHEE II full ranking is sufficient, and is computed as shown in Step 6.
Step 6: Net outranking flow, ϕ
)()()( aaa −+ −= ϕϕϕ (8)

64
65
This relationship eliminates the rule (Equation 7) where an object, a, cannot be
compared to b, thus removing the partial pre-order; the expression of net outranking
flow,ϕ, is intuitively more convenient but the information is less reliable.
The GAIA method is a PCA biplot which is generated from the PROMETHEE
ranking results. These are decomposed into a matrix as described elsewhere in detail
[51], and then submitted to the PCA algorithm to produce a new PC1 versus PC2
bilpot. This plot is interpreted in a similar manner to a conventional biplot. In
addition, a vector, pi, is displayed and is intended show the quality of the decision.
When pi is long, the best performing objects are closely associated with pi.
Conversely, objects well removed from the pi vector are poor performers.
2.6.5.2 Application of PROMETHEE to a Dataset
In principle, there are at least two ways to construct a data matrix for the MCDM
method: i. use the original multivariate data matrix or ii. use the compressed data
matrix containing the PCA scores. The advantage of the second method is that the
data matrix constructed from the PCA scores excludes the residuals. The modelling of
the scores for this MCDM application has been previously described [52]. The three
main requirements for each variable for PROMETHEE modelling are: nomination of
the ranking sense i.e. maximise or minimise; selection of the preference function, and
the weighting. Normally, when the data matrix contains different chemical or physical
variables, it is not difficult to decide the preferred ranking sense, but in the present
case PC scores are relative numbers and their signs may readily change with the
addition of even a single similar object to the matrix. Thus, there has to be a rule

66

67
for selecting the preferred ranking sense. In the reference noted above, a spectral
object was collected from a certain sugarcane variety (labelled Q90) [52]. This Q90
variety was known to perform well and hence, was selected as a reference to decide
whether to maximise or minimise each PC variable in the PROMETHEE scores
matrix, i.e., Q90 had high positive PC1 and moderately negative PC2 scores, and thus
the PC1 and PC2 criteria were set to maximise and minimise respectively such that
the objects were ranked individually on each orthogonal PC relative to the score of the
best preforming sample. However, in the present cases, there are no particular hair
samples, which could be similarly identified as well preforming. On the other hand,
an average derived from a hair group cluster may represent the natural starting point
for comparison to all other objects. The reference point taken from each
PROMETHEE data matrix will be mentioned in each case. The Usual preference
function, P (a,b), was selected as there is no threshold value needed and therefore
reflects the PC scores and loadings and the spread of the scores on each PC, and thus,
the NIR measurements of human hair bundles. The criteria weights were uniformly
set to 1. These parameters were applied to each PROMETHEE analysis in the
subsequent chapters of this thesis.
These instrumental and chemometric methods were used and applied for the matching
and discrimination of human scalp hair in a forensic context.

68
Figure 3.1: Spectral Comparison of Hair – Bundle Size
Figure 3.2: Spectral Derivative of Hair – Bundle Size

69
Chapter 3: Preliminary Experimental Work
3.1 Raw Spectra
The NIR spectra obtained from the 20 untreated hair samples were interpreted prior to
further analysis. Spectral band assignments were made according to papers by Ozaki
and Zoccola [53, 54, 55]. Un-pretreated Raw NIR spectra collected from the human
scalp hair samples were compared with their 2nd derivative profiles. The spectra were
analysed over the 4000 – 7500 cm-1 spectral region because it contained the typical
NIR absorption bands for human hair. The NIR spectra from all hair samples were
quite similar although the raw spectra did show significant differences in absorbance.
Derivate spectral analysis was not performed on the main analysis as it did not
improve the separation of samples. The CH2 normalisation pretreatment method acted
as an alternative method.
NIR bands in the 4000 - 7500 cm-1 presented relatively well resolved bands.
However, over the 6000 - 9000 cm-1 range, the bands were quite broad and
overlapped significantly. Bands distinguished in the 9000 – 12800 cm-1 region were
attributed more to the electronic rather then the vibrational transitions [55]. The peak
positions were recorded in Table 3.1.
3.2 Size of Hair Bundles
NIR analyses utilise bulk hair sample sizes in order to simplify spectral collection.
However it is important to estimate the number of hairs needed to obtain an
acceptable spectrum for analytical and forensic purposes. The spectra displayed in
Figure 3.1

70
Figure 3.3: PC1/PC2 Scores plot - Spectral Sampling Method A
Figure 3.4: PC1/PC2 Scores plot - Spectral Sampling Method B

71
show that a spectrum can be collected from a single human hair, but it has very poor
signal-to-noise characteristics. Increasing the number of fibres to 10 and ultimately 30
shows that the signal-to-noise improves significantly. Transforming the raw spectra
into 2nd derivatives (Figure 3.2), supports the identification of true peaks from the
poor signal-to-noise. The combined spectral profile suggests that under the conditions
of spectral collection, it is better to use about 30 hairs/bundle.
3.3 Spectral sampling analysis
NIR spectra of hair were collected in three different patterns from the same hair
bundles. To assist with the identification of the preferred spectral sampling method,
PCA was utilised. The preferred sampling method should show:
1. Close clustering of spectral sampling objects from a given hair bundle
2. Best discrimination between the individual hair bundle clusters.
3.3.1 Sampling Method A Results
Autoscaled spectra obtained from each spectral sampling method (Chapter 2, Section
4) were subjected to PCA analysis. A scores plot was produced from spectral objects
sampled from fibres by Method A (Figure 3.3). PC1 explained 62.5% variance with
samples forming three general clusters. PC2 explained 12.5% variance and effectively
formed one group on this PC.
3.3.2 Sampling Method B Results
A scores plot was produced with Method B (Figure 3.4). PC1 explained 55% variance
and a trend formed on this PC separating most individual clusters. PC2 accounts for
15%

72
Figure 3.5: PC1/PC2 Scores plot - Spectral Sampling Method C
Table 3.1: NIR spectral absorption bands present in human scalp hair
Wavenumbers (cm-1) Literature Comparisons (cm-1) Band Assignments
4600 4600 [53] Amide B + II combination 4870 4900 [53] Amide A + I combination 5200 5250 [53], 5200 [55] O-H str. + bend. (H2O) 5570 - CH str. 1st overtone 5750 5750 [53] CH2 str. 1st overtone 5915 5900 [53] CH3 str.1st overtone 6686 6700 [53] Amide B + II 2nd overtone 7021 7000 [53], [54], [55] O-H combination anti-sym
and sym. str. (H2O) 7825 - CH str. 2nd overtone 8430 8400 [55] CH2 str. 2nd overtone 8790 - CH3 str. 2nd overtone
7500 - 12800 7300 - 10000 [55] Electronic Transitions due to Colour Pigmentation (VIS)

73
of data variance and showed the formation of 3 clusters. The spectral objects
displayed quite tight group clustering.
3.3.3 Sampling Method C Results
A scores plot was produced utilising sampling Method C (Figure 3.5). PC1 explained
48% variance and there was little separation on PC1. PC2 explained 17% variance
and equally, there was more separation of bundle groups. Spectral objects did not
cluster in tight groups.
3.3.4 Conclusions: Spectral Sampling Method
Sampling Method B produced the best within–bundle clustering of spectral objects
and a reasonable spread of bundle groups on each PC. Together, this method
produced the best object-group discrimination and hence, was retained as the bundle
sampling method.
3.4 Peak Assignments
Peak assignments and their literature comparisons are listed in Table 3.1 and are
discussed below. Analysis of the normal and 2nd derivative spectra (Figure 3.6)
showed that the two sharpest absorption peaks were observed in the characteristic
combination region of 4500 – 5000 cm-1. The first band at 4600 cm-1 is represented by
the combination of Amide B and II while the second band is attributed to the
combination of Amide A and I at 4870 cm-1 [53]. Another significant peak present at
5200 cm-1, is the O-H stretching plus bending vibrations associated with the water in
hair [53, 55]. However, this peak has an overlapping shoulder at 5100 cm-1.

74
Figure 3.6: Comparison of Spectral Bands of Normal and 2nd Derivative Spectra

75
The 2nd derivative provides large, distinct bands in this region reaffirming the
presence of the Amide combinations and the O-H vibrations.
Bands at higher wavenumbers of the combination region become relatively broader,
and increasingly overlapped. These broad bands are a characteristic of the human hair
spectra for the 1st overtone region at 5400 – 7500 cm-1. A set of three peaks is
observed within this region in the range or 5400 - 6100 cm-1. These bands are
associated with the 1st overtone of the CH, CH2 and CH3 stretch bands [53]. However,
the CH and CH3 bands overlap with the CH2 to form shoulders. These peaks are
present at 5570, 5750 and 5900 cm-1, respectively [53]. However, Ozaki [53] has
identified the 5570 cm-1 as an SH band and it would appear that the CH and SH are
close to each other. A pattern in the spectra is observed which repeats peaks in the
subsequent overtones. The 1st overtone bands formed by this repeat pattern from the
combination region attributed to the Amide B + II band and also, from the O-H
combination of the anti-symmetric and symmetrical stretching. These peaks are found
at 6640 and 7000 cm-1, respectively. The 2nd derivative provides a more detailed
spectral profile. From this profile the CH and CH3 shoulder bands clearly separate and
become evident.
The remaining bands in the characteristic 2nd overtone region of 7500 – 9000 cm-1 are
relatively indistinct as they are broad and overlap [55]. However, some repeat band
patterns of CH, CH2 and CH3 are still observed in the 2nd derivative. These bands are
found at 8275, 8430 and 8790 cm-1 [55].

76
77
3.5 Comparison of Compounds to Structure
The assigned bands revealed the key components of the structure of a human hair
when analysed by NIR. The spectra confirm the contribution of the three major CHn
groups, as well as Amide and OH. Thus any changes in the chemical composition
involving these groups can be monitored by variations in band shifts or intensities.
The key component of hair is the oriented α-keratin - the organised helical
polypeptide chains. The peptide bonds a part of the peptide chain. The vibrations
found in the NIR spectra are a result of the CH, CH2 and CH3 compounds found
within the helical backbone of this keratin structure. The Amide A and Amide B
bands originate from a Fermi resonance between the first overtone of Amide II and
the N-H stretching vibration. Amide I and Amide II bands are two major bands of the
protein infrared spectrum [56]. The Amide I band is mainly associated with the C=O
stretching vibration and is directly related to the backbone conformation. Amide II
results from the N-H bending vibration and from the C-N stretching vibration. The
strong absorption of NIR radiation from these molecular fragments is due to the
stretching and compression of the highly polarized C=O within the carbonyl group
which leads to a large oscillating dipole moment [56]. The symmetric and
antisymmetric combination of the amides is considered as being generated by the
fundamental energy levels to the higher-energy π orbits [55]. These structures are
repeated as overtones along the spectrum however, detection of these forms become
weaker with decreasing vibration. The electronic absorptions are present in the UV
region all the way into the Near Infrared. These become more dominant over the
weakening vibrational spectrum. These electronic transitions will be discussed in
greater detail in Chapter 5.

78

79
3.6 NIR Spectra and Wet Hair: Hair Drying
NIR analyses of human hair bundles in the application of a water treatment require a
drying process. If analyses were to be performed directly after immersion into a water
medium, the acquired hair spectrum would be dominated by water bands, and
therefore mask other bands in the spectral profile. Therefore, the bulk water has to be
removed from the hair bundle by a drying process. Such drying can be carried out in
different ways. Thus, a reference method was developed for this work and for future
research on this or similar projects. In addition, this approach offered a possibility to
investigate the change of the NIR spectrum of hair during drying under standard
conditions.
As previously outlined in Chapter 2.5.1, different time periods were employed in
order to determine the optimum drying time to produce spectra suitable for analysis.
The optimum time would then be used to dry the hair for further comparative spectral
studies. Figure 3.7 and 3.8 show the changes in the spectra over the time of the drying
process as the hair changes from ‘wet’ to dry’.
During the hair drying investigation, the masses of the bundles were also measured at
various time intervals. The results provided an indication of when the hair was dried
to constant weight. The results of these measurements (Table 3.2) were presented in
graphical format in Figure 3.9. The initial mass of the fibre bundle was 0.246g and
obtained after equilibration at 55% RH, 23°C. The wet hair bundle attained a very
similar mass after about 10 minutes of drying under the specified drying condition
(Chapter 2,

80
Figure 3.7: Spectral comparison –Drying of Hair
Figure 3.8: Spectral Derivative – Drying of Hair

81
Section 5.2).Thus we chose approximately 12-15 min drying time in this work.
Interestingly, the fibre equilibrated to approximately its original mass after 2 days
under standard conditions [55].
3.6.1 Isothermal Processes - Hair Drying: Spectral Results
The ‘wet’ state of the hair bundle can be best represented at approximately 0 minutes
when no significant drying has taken place. Two major bands are seen at 5200 and
7000 cm-1 which can be attributed to a broad O-H stretching and bending combination
and to a broad O-H anti-symmetric and symmetric stretching respectively. Although,
a very small Amide B + II combination can be seen at 4600 cm-1. These water bands
have completely masked most of the bands in the spectrum, which suggest that such
spectra are unsuitable for use in further investigations. However, when a second
derivative spectrum is taken, the situation has improved. This spectrum reveals not
only the two large water bands but also some bands that were previously masked in
the normal spectra, for example, the amide and CHn peaks. The area between 6000
and 7000 cm-1 remains unresolved when compared to an untreated control spectrum,
when in fact a repeat sequence of CH overtones should be present. This indicates that
although the bands cannot be distinguished in the normal raw spectrum, some can be
observed by using the 2nd derivative profile. However, such spectra remain unreliable
for interpretation, as water is clearly an important interfering factor in this analysis.
As time progresses, the spectral bands begin to become sharper. However, the water
band at 5200 cm-1 has split to reveal the Amide combination A + I shoulder band on
the lower wavenumber side of the water. This indicates that the water that was
previously masking these Amides are now drying

82
Figure 3.9: Hair Drying as a Function of Time
0
0.1
0.2
0.3
0.4
0.5
0.6
0 10 20 30 40 50 60 70
Time (minutes)
Wei
ght (
g)
Table 3.2: Mass of the Hair During the Drying Process.
Weight (g) Time (min) 0.246 0 Initial weight before treatment 0.532 0 Weight after treatment, before drying 0.460 1 Weight after treatment, after drying 0.390 2 0.333 3 0.300 4 0.267 5 0.249 6 0.244 7 0.244 8 0.244 9 0.244 10 0.240 12 0.238 14 0.239 16 0.240 18 0.240 20 0.239 25 0.240 30 0.235 35 0.235 40 0.235 60 0.244 2 days After placement under standard conditions

83
within the internal structure of the hair. In the 5400 – 6000 cm-1 region, two small
bands have also developed contributing to the CH2 and CH bands respectively.
However as water still compromises the interpretation of the spectra, the hair bundle
must be dried further. Continued drying results in the water band at 7000 cm-1 to be
reduced to its previous normal state. The spectrum taken at of 8 min resembles the
normal spectrum as shown in Figure 3.6. All bands can be readily identified and the
water no longer masks the spectra. Therefore, this drying time may be sufficient and
could be used as a reference point for a dried hair bundle. Further drying to 60
minutes produces no further change to the spectrum and is similar to the original
spectrum (Figure 3.6). No major differences are observed between the 8min and
60min spectrum.
3.6.2 Isothermal Processes - Hair Drying: Weight Results
The initial mass before water treatment was recorded as 0.246g (Table 3.2). This
acted as a control. After the water treatment was applied the weight of the bulk hair
increased to 0.532g. This indicates that the hair absorbed 0.286g of water into its
internal structure; i.e. more water than the original bulk hair weight. Upon drying the
hair, the weight decreased exponentially until levelling out at 7 minutes, as observed
in Figure
3.9. This signifies that standard conditions are at equilibrium at 7 minutes drying. The
results of the measurements of mass over time therefore support the previous spectral
investigation of 8 minutes. The hair was then placed in a plastic container for two
days under standard conditions (55% RH, 23°C) and the hairs water weight was
returned to its original value due to standard humidity and temperature conditions.

84

85
3.6.3 Conclusions: Hair Drying
Spectral and gravimetric analysis has supported the application of a drying process to
water treatments. Even though the weight comparison and spectral analysis suggests 7
minutes to be the point of standard conditions, it is recommended that a 15-minute
drying process is undertaken to ensure complete drying.

86

87
Chapter 4: Matching and Discrimination of Hair - Gender and Race
It has been difficult to find a way to isolate the physical and chemical properties of
hair that could serve as individual characteristics of identity. Other than DNA, hair is
characterised by its colour, structure and morphology [4]. Nevertheless, there has
been difficulty in analysing hair fibres in investigations. Hair trace fibre evidence is
an important aspect of crime scenes, as it can provide strong corroborative evidence
for placing an individual at the scene. For crime scene investigation and disaster
victim identification, a profile of either the victim or the perpetrator of a crime would
be even more valuable. This work explores how Near Infrared Spectroscopy and
Chemometrics can assist in the building of a profile of an individual based on the
chemical properties of the hair fibre. This profile could possibly include gender, race
and treatment characteristics attained from the matching and discrimination of hair
fibres by NIR and chemometric methods such as PCA, Fuzzy Clustering and
PROMETHEE.
The objectives for this NIR study (Chapter 4) are:
• To discriminate individuals based on gender
• To discriminate individuals based on race
Twenty bulk hair samples were collected from Male and Female subjects of both
Caucasian and Mongoloid race. The hairs were left untreated to prevent interference
of hair colour treatments in the analysis. Prior to NIR analysis no pretreatment or

88

89
cleaning methodologies were applied. In part, this was carried out to simulate hair
fibre trace evidence found at crime and disaster scenes in their natural state when
sampled from an individual.
4.1 Analysis of Hair: Gender and Race Studies
The experimental factors affecting the investigation include:
• The Gender of the person from which the hair was obtained
• The Race of the person from which the hair was obtained
The hairs were not cleaned or altered. This is an important consideration for crime
scene or DVI investigation because the natural state of the sample is minimally
affected. In this work, the hair samples are classified as belonging to the Caucasian
and Mongoloid racial groups. At present, hair discrimination is based on physical
characteristics such as shape, mechanical properties, moisture content, colour and
morphology. However, the analysis of hair based on these characteristics is not fool
proof. As racial mixes become more prevalent, the physical characteristics become
more poorly defined and therefore, make discrimination more difficult [4]. A forensic
examiner would also need considerable experience to recognise the racial differences
in hair. For this reason, the chemical composition is a valuable supporting factor for
the discrimination of hair on the basis of race. As previously mentioned (Chapter 1,
Section 5) Hopkins et al. [30] suggested that there is a significant variation in the
amino acid composition of human head hair between individuals. These variations are
due to factors such as genetic effects, race and chemical treatment. It has been
suggested that there is a genetic influence on the cystine content of human hair, i.e.,

90

91
higher levels of this amino acid have been reported in hair from male individuals than
females. It is therefore suggested that a variation in the infrared spectra might also be
expected due to the differences in the amide regions [30].
A study by Wolfram [57] also found that the intra-chain hydrogen bonding between
amide groups along the polypeptide chain is an essential element in the stability of the
α-helical structure. The high content of acidic and basic chains as well as the presence
of disulphide bonds of cystine contribute to the inert nature and selective reactivity of
hair. These amide proportions between individuals could be used to discriminate
gender and race. As such, it is not the differences in race and gender samples that
contribute to the analysis but rather the chemical proportions that will discriminate
and match persons according to their race and sex origin.
The human hair samples will not be analysed by microscopy or SEM as this research
aims to statistically validate the results and change the current type of hair analysis
from comparative and objective opinions.
4.2 Chemometric Analysis of Spectra
Chemometrics was applied to further identify the chemical structures responsible for
the difference in intensities and for visual interpretation of the matching and
discrimination of the race and genders.
The fourteen Caucasian samples (7 male/7 female) and eight Mongoloid (4 male/4
female) samples in the region of 4000 – 7500 cm-1 were used for the analysis. The
data matrix consisted of 22 spectral objects and was transformed by CH2

92
Figure 4.1: Comparison of Spectra - Male Hair (Caucasian and Mongoloid)
0.6
0.8
1
1.2
1.4
1.6
1.8
2
40004500500055006000650070007500Wavenumber (cm-1)
Inte
nsity
Mongoloid
Caucasian
Figure 4.2: Difference Spectrum - Male Hair (Mongoloid - Caucasian)
-0.04
-0.03
-0.02
-0.01
0
0.01
0.02
40004500500055006000650070007500Wavenumber (cm-1)
Inte
nsity

93
normalisation and mean centring before being imported into Sirius. The data matrix
for this study was 114 x 145 (21 Mongoloid Female, 21 Mongoloid Male, 36
Caucasian Female and 36 Caucasian Male Spectral Scans including averages).
Sample names have been shortened to a 4 letter acronym for simplification. The key
for the letters and positions are as follows:
Position Abbreviation Meaning First Letter Position F, M Female, Male Second Letter Position U, I Caucasian, Mongoloid Third Letter Position A to G Individual’s ID Fourth Letter Position 1 to 5 Repeat Scan Number
Comparison of Hair - Race
4.3 Raw Spectra Analysis of Hair - Race
The spectral objects of the Caucasian and Mongoloid samples could not be
discriminated from the raw spectra. No spectral shifts were observed and all bands as
previously identified from the NIR raw spectra were present in both races. Frequency
similarities can be seen throughout the racial profile for both the Male and Female
race while the intensity profiles differed between each spectral scan. This finding is
consistent with Wolfram’s research [57] and it implies that the differences are due to
intensity rather than frequency shifts. To compare the chemical proportions of
Caucasian and Mongoloid samples, the spectra were averaged and the differences
were visually analysed within each gender. Figure 4.1 illustrates the Females average
spectrum for each race and Figure 4.3 for Male samples, while the differences in
spectra are portrayed in Figure 4.2 and 4.4 respectively. The difference spectrum is an
indicative representation of the differences between spectra. The differences are small
as can be seen by the small ∆Intensity values.

94
Figure 4.3: Comparison of Spectra - Female Hair (Caucasian and Mongoloid)
0.6
0.8
1.0
1.2
1.4
1.6
1.8
2.0
40004500500055006000650070007500Wavenumber (cm-1)
Inte
nsity
Mongoloid
Caucasian
Figure 4.4: Difference Spectrum - Female Hair (Mongoloid - Caucasian)
-0.05
-0.04
-0.03
-0.02
-0.01
0.00
0.01
0.02
0.03
0.04
40004500500055006000650070007500Wavenumber (cm-1)
Inte
nsity

95
The racial spectral intensities are similar to those of the genders spectral profile. Race
cannot be discriminated within the Female samples, as both remain generally
consistent throughout all bands of the NIR region. The race samples of the Male
dataset on the other hand showed a significant difference. The main intensity
difference occurs in the Mongoloid male spectra occurs in the 4000 – 5500 cm-1
Amide region. The spectral comparisons of the Males therefore imply that
Mongoloids have lesser proportions of some chemical species within their keratin and
Amide structures of the hair and therefore can be differentiated by using the chemical
composition. On the other hand, Female spectra show a greater intensity in the Amide
region and lesser intensity in the OH str + bend at 5200 cm-1 and OH str. at 7000 cm-1.
Chemometrics was applied to further identify the chemical structures responsible for
the difference in intensities and for visual interpretation for the matching and
discrimination of hair on the basis of race.
4.4 Chemometric Analysis of Male Spectra (Caucasian and Mongoloid)
This analysis utilises Male samples from 4 Caucasians and 4 Mongoloids.
4.4.1 Outlier Detection
An RSD vs. Leverage plot was produced in order to identify atypical samples
negatively influencing the PCA. Fuzzy clustering data classification was also used to
check the data for further outlying fuzzy samples. However when the identified
outliers were removed and a new PCA plot was produced, there appeared to be no
improvement or significant changes. The outlier detection was therefore discarded and
the previous PCA was used for further analysis.

96
Figure 4.5: PC1/PC2 Scores plot: Discrimination of Male Spectra (Caucasian and Mongoloid)
= Caucasian Male = Mongoloid Male
Figure 4.6: PC1 Loadings vs. Spectral Variables of Male Objects (Caucasian and Mongoloid)
CH3
Comb. Amide A + I
Comb. Amide B + II OH bend.
OH str.
CH CH2 Amide

97
4.4.2 PCA Analysis of Male Spectra (Caucasian and Mongoloid)
The PCA scores plot of the Male (Caucasian and Mongoloid) spectral objects is
shown in Figure 4.5. PC1 explained 93.1% of the variance and separated Caucasian
(negative) and Mongoloid (positive scores) objects into two clear distinct groups. PC2
mixed race on both positive and negative scores with an explained variance of 5.5%.
Two races have been recognised and separated by the PCA analysis. The groups are
well separated from one another, indicating a clear difference between them. The
formation of these two groups represents an idealised dataset, whereby no overlapping
has occurred and all objects have grouped themselves according to one variable; race.
The PCA represents the similarities and differences in race. However, on the PCA, the
spread of spectral objects between racial groups showed different characteristics. The
Mongoloid grouping of objects was very tight with little variation between individual
objects while the Caucasian objects showed more spread between samples and
objects. Nevertheless, the subject groups of Male Mongoloid and Caucasian samples
have successfully been discriminated by NIR and chemometrics based on the
chemical proportions within the hair structure.
4.4.3 Loadings Plot of Male Spectra (Caucasian and Mongoloid)
The associated PC1 Loadings vs. Variables plot (Figure 4.6) of the NIR were used to
interpret the differences between spectra. The loadings plot can be directly compared
to the original spectra as the profiles are very similar and band assignment can
therefore be made accordingly. The positive Mongoloid spectral objects corresponded
to positive loadings and revealed the 5400 – 7500 cm-1 NIR region to be responsible

98
99
for the difference. This region contains the previously recognised OH symmetric
stretch mode of vibration at 7000 cm-1 and also the CHn bands in the 5400 - 5750 cm-
1 region. The negative loadings contributed to the spectral region of 4000 – 5400 cm-1
of the Caucasian samples. This region contains the combination Amide structures at
4250 - 4850 cm-1and the OH bend + str. vibration mode at 5200 cm-1. This indicates
that Caucasian spectra separate based upon differences in the OH and combination
Amide bands while Mongoloid separate based upon differences in the OH and CHn
bands. These loadings are considerably large in value, indicating that the differences
observed in the scores plot are considerably large. The analysis also confirms the
large spectral differences between races from the previous spectral comparison
(Figure 4.3, 4.4). It supports Wolfram’s research [57] that these differences are due to
intensity rather than frequency shifts.
4.5 Chemometric Analysis of Female Spectra (Caucasian and Mongoloid)
This analysis utilised Female samples from 4 Caucasians and 4 Mongoloids.
4.5.1 Outlier Detection
An RSD vs. Leverage plot was produced in order to identify atypical samples
negatively influencing the PCA. Fuzzy clustering data classification was also used to
check the data for further outlying fuzzy samples. However when the identified
outliers were removed and a new PCA plot was produced, there appeared to be no
improvement or significant change the PCA. In addition, half of the dataset was
identified as being fuzzy even though two major groups formed through the PCA
analysis. To retain a qualitative method, the outliers were kept in the dataset to

100
Figure 4.7: PC1/PC2 Scores plot: Discrimination of Female Hair (Caucasian and Mongoloid)
= Mongoloid Female = Caucasian Female

101
provide an appropriate amount of information to maintain the accuracy of the
analysis. The outlier detection was therefore discarded and the original PCA was used
for further analysis.
4.4.2 PCA Analysis of Male Spectra (Caucasian and Mongoloid)
The PCA scores plot of the Female (Caucasian and Mongoloid) spectral objects is
shown in Figure 4.7. PC1 explained 74.3% of the variance and separated Caucasian
(positive scores) and Mongoloid (negative scores) spectral objects into two main
groupings. PC2 accounts for 23.0% but has mixed racial objects on both positive and
negative scores of the PC. Slightly less variance was explained by PC1 when
compared to the Male spectra (Caucasian and Mongoloid) while PC2 on the other
hand has a greater variance. The variance is spread over more dimensions of the PCA
and therefore contributes to the wide spread of spectral objects. Two racial groups
formed from the Female spectral objects with slight overlapping of groups occurring.
As the bulk hairs were collected as waste samples, the history of the individual was
not gathered and can therefore not be cross validated with the PCA data. The
overlapping may be due to inter-racial mixing or possibly be attributed to untreated
hair samples having been previously subjected to a dyeing/ bleaching treatment which
was not revealed by the individual. Others factors may also include differing
shampoos and conditioners used by the donors, however this will not be further
discussed in this thesis. This PCA represents the difference between the Caucasian
and Mongoloid race. This shows that PCA can be used to discriminate between races
based on their chemical structure.

102
Figure 4.8: PC1 Loadings vs. Spectral Variables of Female Objects (Caucasian and Mongoloid)
Amide OH str. CH CH2 CH3
Comb. Amide A + I
Comb. Amide B + II
OH bend.
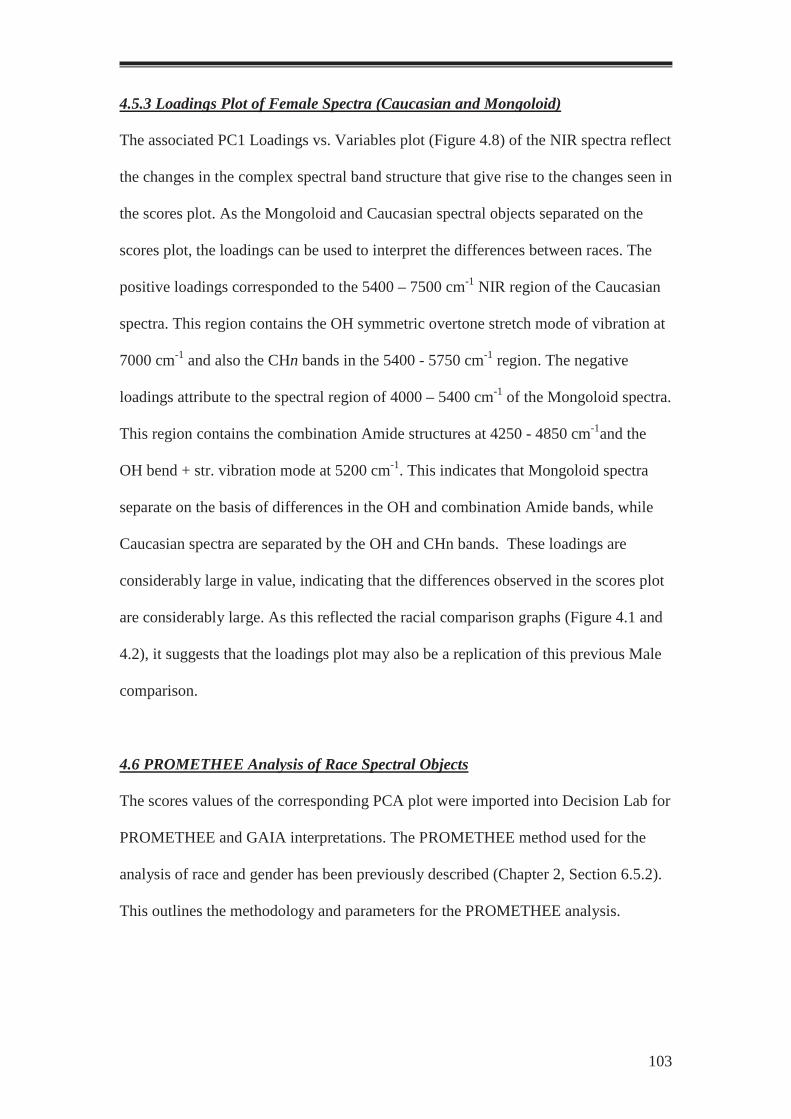
103
4.5.3 Loadings Plot of Female Spectra (Caucasian and Mongoloid)
The associated PC1 Loadings vs. Variables plot (Figure 4.8) of the NIR spectra reflect
the changes in the complex spectral band structure that give rise to the changes seen in
the scores plot. As the Mongoloid and Caucasian spectral objects separated on the
scores plot, the loadings can be used to interpret the differences between races. The
positive loadings corresponded to the 5400 – 7500 cm-1 NIR region of the Caucasian
spectra. This region contains the OH symmetric overtone stretch mode of vibration at
7000 cm-1 and also the CHn bands in the 5400 - 5750 cm-1 region. The negative
loadings attribute to the spectral region of 4000 – 5400 cm-1 of the Mongoloid spectra.
This region contains the combination Amide structures at 4250 - 4850 cm-1and the
OH bend + str. vibration mode at 5200 cm-1. This indicates that Mongoloid spectra
separate on the basis of differences in the OH and combination Amide bands, while
Caucasian spectra are separated by the OH and CHn bands. These loadings are
considerably large in value, indicating that the differences observed in the scores plot
are considerably large. As this reflected the racial comparison graphs (Figure 4.1 and
4.2), it suggests that the loadings plot may also be a replication of this previous Male
comparison.
4.6 PROMETHEE Analysis of Race Spectral Objects
The scores values of the corresponding PCA plot were imported into Decision Lab for
PROMETHEE and GAIA interpretations. The PROMETHEE method used for the
analysis of race and gender has been previously described (Chapter 2, Section 6.5.2).
This outlines the methodology and parameters for the PROMETHEE analysis.
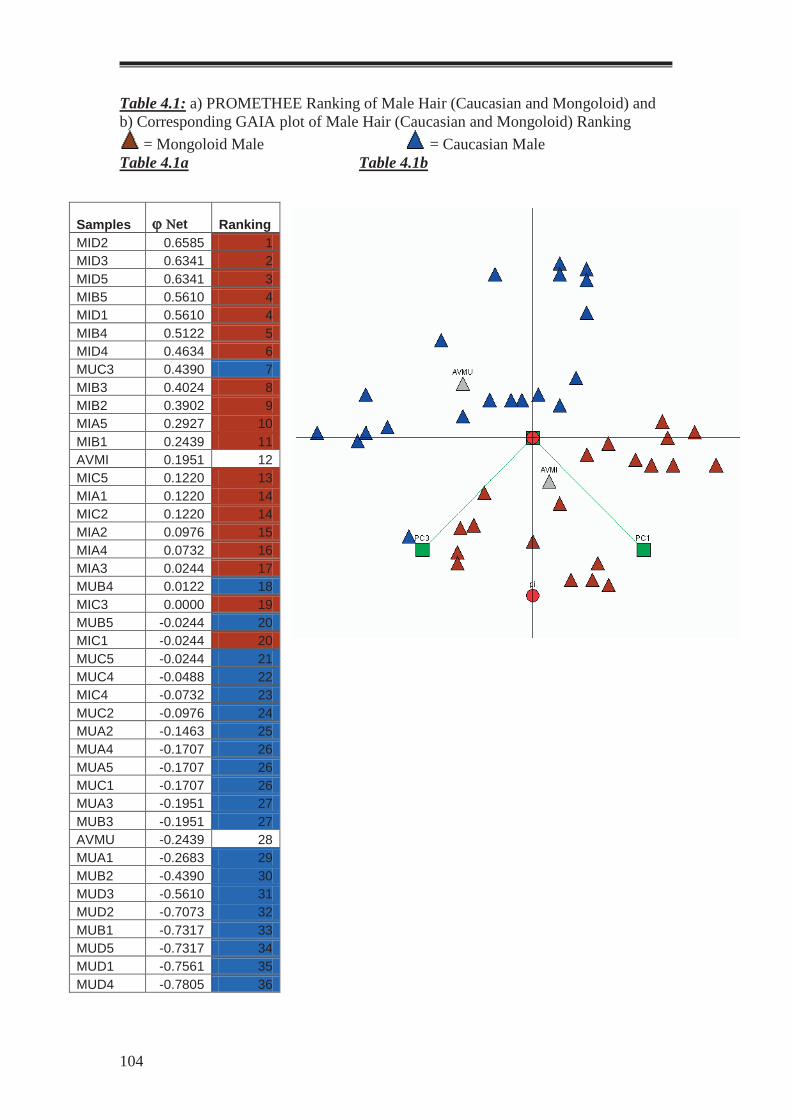
104
Table 4.1: a) PROMETHEE Ranking of Male Hair (Caucasian and Mongoloid) and b) Corresponding GAIA plot of Male Hair (Caucasian and Mongoloid) Ranking
= Mongoloid Male = Caucasian Male Table 4.1a Table 4.1b
Samples ϕ Νet Ranking MID2 0.6585 1 MID3 0.6341 2 MID5 0.6341 3 MIB5 0.5610 4 MID1 0.5610 4 MIB4 0.5122 5 MID4 0.4634 6 MUC3 0.4390 7 MIB3 0.4024 8 MIB2 0.3902 9 MIA5 0.2927 10 MIB1 0.2439 11 AVMI 0.1951 12 MIC5 0.1220 13 MIA1 0.1220 14 MIC2 0.1220 14 MIA2 0.0976 15 MIA4 0.0732 16 MIA3 0.0244 17 MUB4 0.0122 18 MIC3 0.0000 19 MUB5 -0.0244 20 MIC1 -0.0244 20 MUC5 -0.0244 21 MUC4 -0.0488 22 MIC4 -0.0732 23 MUC2 -0.0976 24 MUA2 -0.1463 25 MUA4 -0.1707 26 MUA5 -0.1707 26 MUC1 -0.1707 26 MUA3 -0.1951 27 MUB3 -0.1951 27 AVMU -0.2439 28 MUA1 -0.2683 29 MUB2 -0.4390 30 MUD3 -0.5610 31 MUD2 -0.7073 32 MUB1 -0.7317 33 MUD5 -0.7317 34 MUD1 -0.7561 35 MUD4 -0.7805 36

105
4.6.1 PROMETHEE Analysis of Male Spectral Objects (Caucasian and Mongoloid)
For the comparison of Male spectral objects (Caucasian and Mongoloid), the AVMI
(Average Male Mongoloid) sample was chosen as the reference for the sample set, as
it was an average sample representing one of the two main groupings. PC1 was
Minimised, PC2 - Minimised and PC3 – Maximised according to the corresponding
PCA (Figure 4.5). A PROMETHEE complete ranking (Table 4.1a) was then
generated using these parameters. The PROMETHEE results have produced similar
results to the Male (Caucasian and Mongoloid) objects PCA scores plot. The
separation of racial groups in the PCA has provided clear separation along the
PROMETHEE ranking. Mongoloid spectral objects ranked at the top end of the
rankings, whereas the Caucasians ranked at the lower end. The majority of objects
separated based on race. However, a few Caucasian objects did mix into the
Mongoloid ranking order. The PCA had previously provided a clear separation along
the PC1 axis. To remove the influence of the PC2 mixing, this PC was removed to see
if the ranking would improve. By repeating the ranking, the clusters became clearer
and less sample mixing occurred. The majority of Male (Caucasian) spectral objects
ranked between the φ net values -0.02 and -0.78, while the Male (Mongoloid) spectral
objects ranked mostly between the φ net values of 0.65 and 0.02. These two clusters
are quite distinct and little mixing has occurred within these sample blocks. The two
objects (MUB4 and 5) which intermixed can be seen in the 0.01 and 0.02 φ net region
between these two major groups. This again confirms that race can be separated based
on the chemical composition of hair from NIR spectra and chemometric analysis.
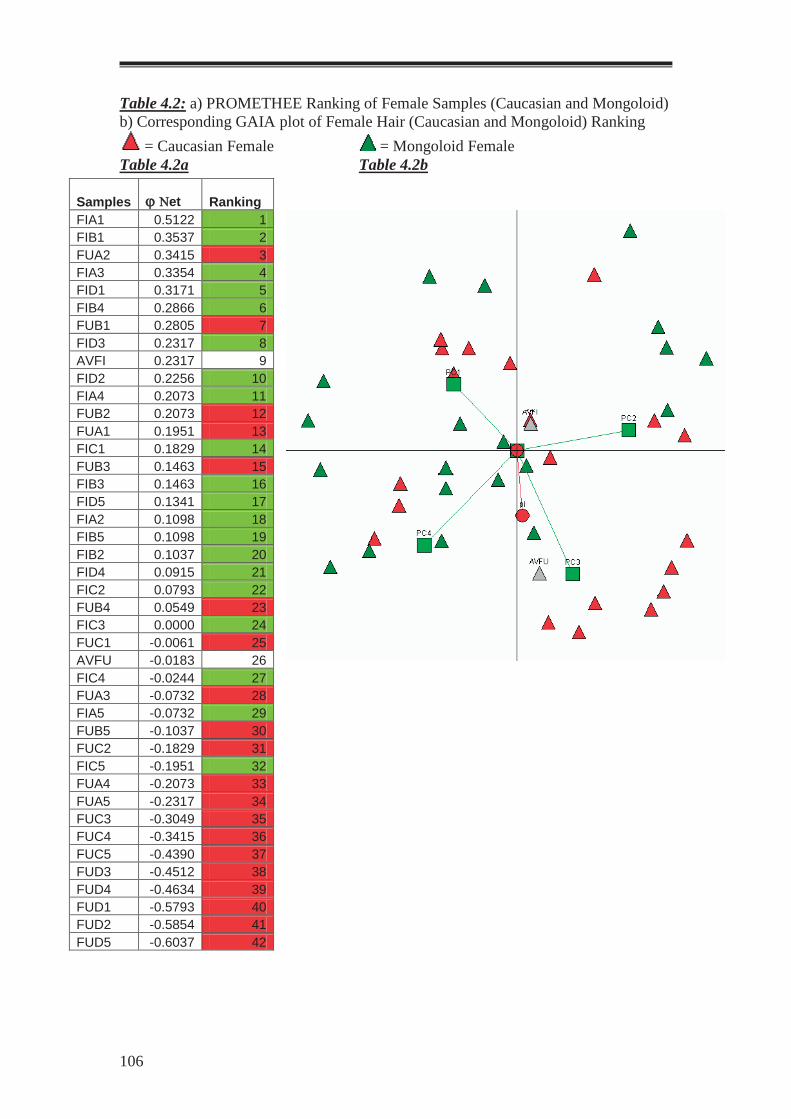
106
Table 4.2: a) PROMETHEE Ranking of Female Samples (Caucasian and Mongoloid) b) Corresponding GAIA plot of Female Hair (Caucasian and Mongoloid) Ranking
= Caucasian Female = Mongoloid Female Table 4.2a Table 4.2b
Samples ϕ Νet Ranking FIA1 0.5122 1 FIB1 0.3537 2 FUA2 0.3415 3 FIA3 0.3354 4 FID1 0.3171 5 FIB4 0.2866 6 FUB1 0.2805 7 FID3 0.2317 8 AVFI 0.2317 9 FID2 0.2256 10 FIA4 0.2073 11 FUB2 0.2073 12 FUA1 0.1951 13 FIC1 0.1829 14 FUB3 0.1463 15 FIB3 0.1463 16 FID5 0.1341 17 FIA2 0.1098 18 FIB5 0.1098 19 FIB2 0.1037 20 FID4 0.0915 21 FIC2 0.0793 22 FUB4 0.0549 23 FIC3 0.0000 24 FUC1 -0.0061 25 AVFU -0.0183 26 FIC4 -0.0244 27 FUA3 -0.0732 28 FIA5 -0.0732 29 FUB5 -0.1037 30 FUC2 -0.1829 31 FIC5 -0.1951 32 FUA4 -0.2073 33 FUA5 -0.2317 34 FUC3 -0.3049 35 FUC4 -0.3415 36 FUC5 -0.4390 37 FUD3 -0.4512 38 FUD4 -0.4634 39 FUD1 -0.5793 40 FUD2 -0.5854 41 FUD5 -0.6037 42

107
The GAIA plot (Table 4.1b) directly reflected the PROMETHEE ranking by the
separation of genders into two main groups. It also shows the direct transition of PCA
scores values to GAIA values by giving a very similar plot. As PC1 and PC3 lie at a
right angle, this indicates their independence to one another. Their contribution to the
plot is near to equal as the pi axis lies in between both of the PC1/PC3 axis. The
GAIA gave a 100% ∆ value and thus the plot has accounted for all data variance over
two PC’s. By importing the PCA scores values into GAIA, a clear improvement has
occurred in the separation of genders without the manipulation of data. This confirms
that genders can be separated based on the NIR and chemometric analysis of the
chemical composition of hair. It justifies the discrimination of samples based on race
for this idealised dataset.
4.6.2 PROMETHEE of Female Spectral Objects (Caucasian and Mongoloid)
For the comparison of Female Race samples, the AVFU (Average Female Caucasian)
sample was chosen as the reference for the sample set, as it was an average sample
representing one of the two main groupings. PC1 was Maximised, PC2 - Maximised,
PC3 – Minimised and PC4 – Maximised according to the corresponding PCA (Figure
4.7). PROMETHEE results (Table 4.2a) have produced similar results to the Female
(Caucasian and Mongoloid) spectral objects PCA plot. The separate groupings of race
in the PCA have provided a separation along the PROMETHEE ranking. Mongoloid
objects ranked at the top end of the rankings, whereas the Caucasians ranked at the
lower end. The majority of spectral objects separated based on race. However, the
objects did not separate as clearly as the previous Male PROMETHEE rankings.
Some Mongoloid and Caucasian objects mixed throughout the ranking order

108
Figure 4.9: Comparison of Spectra - Mongoloid Hair (Male and Female)
0.6
0.8
1
1.2
1.4
1.6
1.8
2
40004500500055006000650070007500Wavenumber (cm-1)
Inte
nsity
Female
Male
Figure 4.10: Difference Spectrum - Mongoloid Hair (Female – Male)
-0.12
-0.1
-0.08
-0.06
-0.04
-0.02
0
0.02
0.04
0.06
0.08
40004500500055006000650070007500Wavenumber (cm-1)
Inte
nsity

109
indicating that the PROMETHEE method would not be an ideal comparison method
in this case. The majority of Female (Mongoloid) spectral objects ranked between the
φ net values 0.50 and 0.54, while the Female (Caucasian) objects ranked mostly
between the φ net values -0.54 and -0.60. However, the mixing of the two groups can
be seen largely throughout both groups. This could be due to the previous
identification of fuzzy samples, which might have interfered with the analysis. As a
separation of race could still be made it still confirmed the separation of race but not
as clearly. Although the PROMETHEE ranking has largely separated the
PROMETHEE into two main groups this has not been reflected in the GAIA (Table
4.2b). The GAIA has intermixed spectral objects across both PC’s so that racial
objects cannot be distinguished from one another. PC1 and PC3, PC2 and PC4 lie at
right angles to one another indicating their independence as a variable. The GAIA
gave a 59.16% ∆ value.
Comparison of Hair - Gender
4.7 Raw Spectra of Hair - Gender
NIR raw spectra from Male and Female subjects were very similar visually for both
racial groups. Spectra were averaged and the differences observed. No spectral shifts
were visibly present and all bands as previously identified from the NIR raw spectra,
were present in all cases. Similarities can be seen throughout the gender profile for
both Caucasian and Mongoloid races. This confirms the previous research made by
Wolfram [57] which implies that the differences are due to band intensity rather than
frequency shifts. This suggests differences in proportions of the chemical species
present in hair. To compare the chemical proportions of Male and Female hair
samples, the spectra were averaged and the differences in the average spectra were

110
Figure 4.11: Comparison of Spectra - Caucasian Hair (Male and Female)
0.6
0.8
1
1.2
1.4
1.6
1.8
2
40004500500055006000650070007500Wavenumber (cm-1)
Inte
nsity
Female
Male
Figure 4.12: Difference Spectrum - Caucasian Hair (Female – Male)
-0.07
-0.06
-0.05
-0.04
-0.03
-0.02
-0.01
0
0.01
0.02
40004500500055006000650070007500Wavenumber (cm-1)
Inte
nsity

111
visually analysed within the racial samples of Caucasian and Mongoloid cohorts.
Figure 4.9 compares the spectra from hairs of Mongoloid subjects of both genders and
Figure 4.10 shows the difference spectrum from the Male and Female Mongoloid hair
samples. This spectral analysis was again repeated for the Caucasian spectra in
Figure’s 4.11 and 4.12. The difference spectrum is an indicative representation of the
differences between spectra. The differences are small as can be seen by the small
∆Intensity values. The intensity of the hair spectra from Males was slightly higher
than that from Females in both types of race related hairs. When visually inspected,
the intensity of spectra from Males and Females hairs show very similar profiles in
the 5400 – 7500 cm-1 region. The difference in the Mongoloid Female spectra
observed lower intensity than the Male in the 4000 – 5400 cm-1 region of the spectra.
Large differences occur in the OH str. + bend at 5200 cm-1. In the 5400 – 7500 cm-1
region, the intensity of the Female spectra is greater than that of the Male spectra.
This is consistent with the Caucasian spectral comparison. The Caucasian spectra
show a difference in intensity between the Amide and CHn region. It can be seen that
bulk hair can be differentiated by gender based on their chemical composition.
4.8 Chemometric Analysis of Spectra from Mongoloid Hair (Male and Female)
This analysis utilised Mongoloid hair samples from 4 males and 4 females.
4.8.1 Outlier Detection
An RSD vs. Leverage plot was produced in order to identify atypical samples. Fuzzy
clustering data classification was also used to check the data for further outlying fuzzy
samples. However when the identified outliers were removed and a new PCA plot
was produced, there did not appear to be an improvement or significant change. The
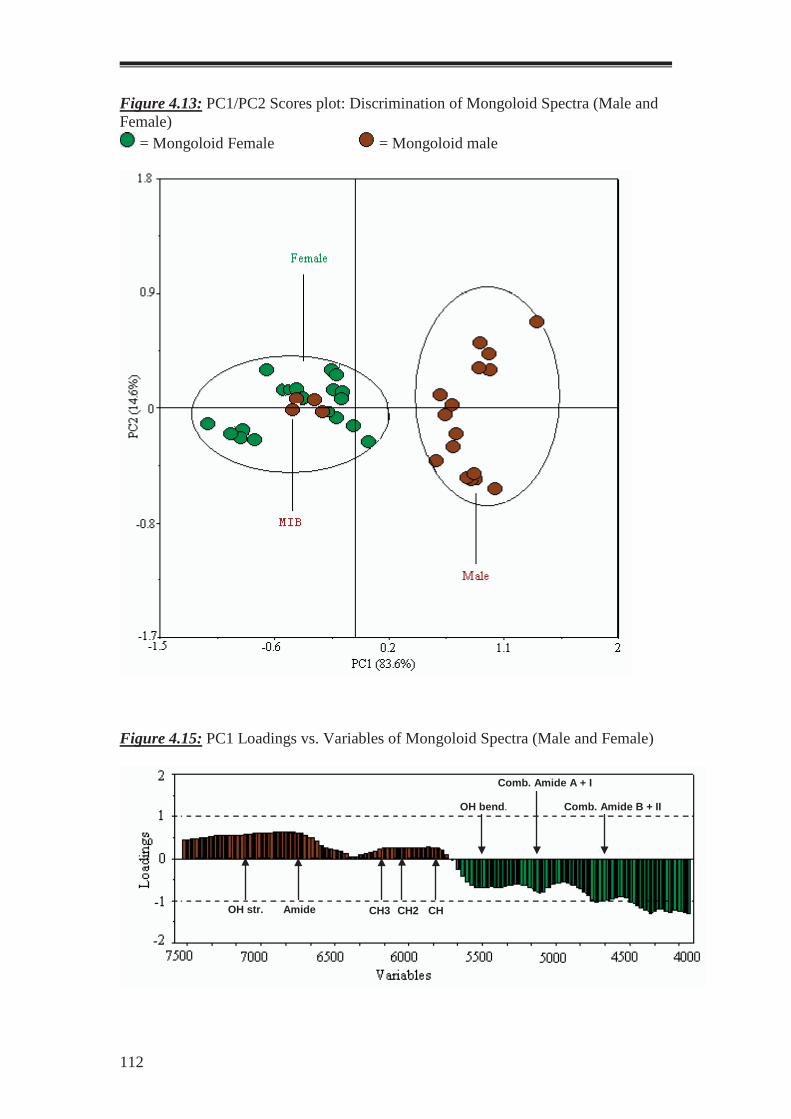
112
Figure 4.13: PC1/PC2 Scores plot: Discrimination of Mongoloid Spectra (Male and Female)
= Mongoloid Female = Mongoloid male
Figure 4.15: PC1 Loadings vs. Variables of Mongoloid Spectra (Male and Female)
Comb. Amide A + I
Comb. Amide B + II
OH bend.
CH3 CH2 CH Amide OH str.

113
outlier detection was therefore discarded and the previous PCA was used for further
analysis.
4.8.2 PCA Analysis of Mongoloid Hair (Male and Female) Spectra
The resulting scores plot of the Mongoloid hair spectra (Figure 4.13) explains 88.6%
of data variance on PC1. Male (positive scores on PC1) and Female spectral objects
(negative scores on PC1) generally were distinguished by the two main groupings.
PC2 accounts for 14.6% of the data variance and does not separate the Male and
Female objects as well as the PC1 samples along this axis. The two groups are also
well separated, thus indicating a clear difference between them. Only one sample
(MIB) is performing atypically by not appearing in its corresponding group. In a small
and discrete dataset, samples are more likely to give a good separation, as the degree
of variability between spectral objects has been kept small. A larger dataset would
challenge this notion and the affect of further outlier. This could be investigated in
future studies. The PCA illustrates the ability to discriminate genders showing that the
use of NIR spectroscopy coupled with chemometrics is a viable method of analysing
samples based on their physical and chemical nature.
4.8.3 Loadings Plot of Mongoloid Spectra (Male and Female)
The associated PC1 Loadings vs. Variables plot (Figure 4.14) of the NIR spectra
replicate the changes in the band structure that can be seen in the scores plot. As the
Males and Females have successfully separated (except for one object) along the PC1
axis of the scores plot, a loadings plot would be able assign differences to spectral
objects in this case. The positive loadings (Male) contributed to the spectral region of
5400 – 7500 cm-1. This region contains the OH symmetric stretch overtone mode of

114
Table 4.3: 3 group (p = 2.5) Fuzzy Clustering Membership of Caucasian (Male and Female) Comparison
Sample (Female) Cluster 1 Cluster 2 Cluster 3 Fuzzy
Sample (Male) Cluster 1 Cluster 2 Cluster 3 Fuzzy
FUA1 0.734 0.094 0.172 MUA1 0.201 0.056 0.743 FUA2 0.84 0.064 0.095 MUA2 0.117 0.036 0.846 FUA3 0.761 0.093 0.146 MUA3 0.392 0.081 0.528 Fuzzy FUA4 0.332 0.097 0.571 MUA4 0.509 0.087 0.404 Fuzzy FUA5 0.797 0.094 0.109 MUA5 0.927 0.026 0.047 FUB1 0.809 0.058 0.133 MUB1 0.328 0.525 0.147 FUB2 0.626 0.09 0.285 MUB2 0.302 0.567 0.132 FUB3 0.915 0.033 0.051 MUB3 0.268 0.612 0.119 FUB4 0.886 0.047 0.067 MUB4 0.294 0.579 0.127 FUB5 0.699 0.169 0.132 MUB5 0.164 0.753 0.083 FUC1 0.174 0.064 0.761 MUC1 0.888 0.042 0.07 FUC2 0.307 0.086 0.607 MUC2 0.891 0.042 0.067 FUC3 0.58 0.254 0.166 MUC3 0.366 0.168 0.466 Fuzzy FUC4 0.137 0.795 0.067 MUC4 0.274 0.626 0.1 FUC5 0.392 0.453 0.154 Fuzzy MUC5 0.075 0.891 0.034 FUD1 0.333 0.156 0.511 MUD1 0.607 0.188 0.205 FUD2 0.332 0.156 0.512 MUD2 0.661 0.124 0.215 FUD3 0.366 0.166 0.468 Fuzzy MUD3 0.646 0.121 0.234 FUD4 0.406 0.193 0.401 Fuzzy MUD4 0.513 0.323 0.165 FUD5 0.366 0.168 0.466 Fuzzy MUD5 0.576 0.264 0.16 FUE1 0.27 0.075 0.655 MUE1 0.353 0.095 0.552 Fuzzy FUE2 0.198 0.057 0.746 MUE2 0.434 0.101 0.465 Fuzzy FUE3 0.087 0.031 0.882 MUE3 0.429 0.097 0.474 Fuzzy FUE4 0.192 0.086 0.722 MUE4 0.118 0.039 0.843 FUE5 0.496 0.336 0.167 Fuzzy MUE5 0.432 0.091 0.478 Fuzzy FUF1 0.234 0.117 0.649 MUF1 0.254 0.583 0.163 FUF2 0.192 0.084 0.725 MUF2 0.312 0.502 0.186 FUF3 0.31 0.202 0.488 RSD MUF3 0.275 0.558 0.166 FUF4 0.247 0.129 0.624 MUF4 0.277 0.554 0.169 FUF5 0.272 0.152 0.576 MUF5 0.254 0.58 0.166 FUG1 0.11 0.833 0.057 MUG1 0.588 0.26 0.152 FUG2 0.163 0.744 0.092 MUG2 0.494 0.355 0.15 Fuzzy FUG3 0.219 0.644 0.137 MUG3 0.472 0.384 0.144 Fuzzy FUG4 0.233 0.616 0.151 MUG4 0.225 0.684 0.091 FUG5 0.209 0.662 0.129 MUG5 0.471 0.391 0.137 Fuzzy AVFU 0.683 0.092 0.224 AVMU 0.724 0.163 0.113

115
vibration at 7000 cm-1 and also the CHn bands in the 5400 - 5750 cm-1 region. The
negative loadings (Female) contribute to the spectral region of 4000 - 5400 cm-1. This
region contains the combination Amide structures at 4250 - 4850 cm-1and the OH
bend + str. vibration mode at 5200 cm-1. These loadings are considerably large in
value, indicating that the differences observed in the scores plot are considerably
large. As this reflected the gender comparison graphs (Figure 4.9 and 4.10), it
suggests that the loadings plot may also be a replication of this previous comparison.
The Female samples contribute to gender differences in the spectral region of 4000 –
5400 cm-1. The Male spectral objects contribute to the spectral region of 5400 – 7500
cm-1. This region contains the OH symmetric stretch overtone mode of vibration at
7000 cm-1 and also the CHn bands in the 5400 - 5750 cm-1 region.
4.9 Chemometric Analysis of Caucasian Spectra (Male and Female)
This analysis utilised fourteen Caucasian samples from 7 males and 7 females.
4.9.1 Outlier Detection
An RSD vs. Leverage plot was produced in order to identify atypical samples
negatively influencing the PCA. When objects are projected high on both RSD and
Leverage axes, then a sample is considered and outlier. Caucasian (Male and Female)
spectral object FUF3 was identified as an outlier from the RSD vs. Leverage plots.
Fuzzy clustering data classification was used to check the data for further outlying
fuzzy samples. A three group cluster with a soft clustering exponent of p = 2.5 was
used to identify fuzzy samples. Group membership is assigned by comparison with
the value n > 0.33. Fuzzy clustering identified FUC5, FUD3-5, FUE5, MUA3-4,
MUC3, MUE1-3, 5, and MUG2-3, 5 as fuzzy samples (Table 4.3).

116
117
The three group cluster was used in order to identify the fuzzy samples from the
dataset. In doing so, fuzzy clustering identified a third viable cluster of samples,
which lies between the Female and Male groups. Three Female samples were
identified as belonging to this characteristic group. Two Males samples show a shared
relationship with this and another cluster. It suggests that the hair is notably different
and does not fit to either group. This may be due to incorrect identification of
“untreated” hair. When the original survey was taken, the donor may have selected
untreated hair but not considering variables such as:
• Having treated their hair in the months prior to collection even if it is
no longer visible
• Having temporary treatments and not regarding them as permanent
If a fair to moderate treatment has affected the third group, this is a possible
justification for the difference that is occurring between the groups. Previous ATR
research [58] of human scalp hair in the MID-IR has shown similar results of
“untreated” hair which had been proven to actually have undergone a dying or
bleaching process by cross validation. These results were interpreted by chemometrics
and found support for the theory. These results may be compared to this NIR study.
The three Female spectral objects that are positively identified by this third group
would fit the profile of having treated hair. In modern Caucasian society, there is a
higher likelihood of Females receiving hair treatments than Males [12, 59]. It is also
more likely for a Caucasian sample to be treated then a Mongoloid. This is due to the
darker hair pigmentation present in Mongoloid samples, limiting the effectiveness of
hair treatments [59]. The difference in thickness and density also limits the ease of

118
Figure 4.15: PC1/PC2 Scores plot: Discrimination of Caucasian Male and Female Samples
= Caucasian Male = Caucasian Female
119
treatments and so generally Mongoloids tend to treat hair less. Although fewer
Mongoloid samples were able to be collected for comparison for this anomaly to
appear, it may also explain the lack of treated samples present in the Mongoloid
dataset. These variations in hair collection and sampling must be considered with a
larger dataset as more variables come into effect. As this is a recurring issue in the
Female datasets, the inconsistency will be further investigated in the next chapter.
4.9.2 PCA Analysis of Caucasian Spectra (Male and Female)
The resulting scores plot (Figure 4.15) explains 83.6% of data variance on PC1. No
trend is observed that separates Male and Female spectra along this PC. A similar
separation was previously recognised on PC2 of the Mongoloid (gender) and racial
spectral objects PCA, This again indicates that a separate possible variable may be
interfering and is the most important component of the analysis as it is contributing to
the PC1 axis rather than PC2. PC2 accounts for 14.2% of data variance. Along this
axis, there is some overlap between Caucasian (Male and Female) spectral groups.
This overlap has been identified as the third group containing the outliers as identified
by fuzzy clustering. A possible explanation for this has been discussed in the previous
outlier section. Nevertheless, a slight separation of the two groups has occurred
resulting from the different proportions of internal chemical structures of the hair
samples. This PCA reflects the previous graph of gender comparisons, which showed
the difference and similarities of the spectra.
4.9.3 Loadings Plot of Caucasian Gender
The associated loadings plot could not be interpreted due to the intermixing of
spectral objects across both PC1 and PC2 axis. Therefore, the spectral comparison

120
Table 4.4: a) PROMETHEE Ranking of Mongoloid Samples (Male and Female) and b) Corresponding GAIA plot of Mongoloid Samples (Male and Female) Ranking
= Mongoloid Female = Mongoloid Male
Table 4.4a Table 4.4b
Samples ϕ Net Ranking FIC1 0.8780 1 FIC2 0.8293 2 FIC3 0.8293 3 FIC4 0.7439 4 FIA1 0.6098 5 FIA3 0.4634 6 FIC5 0.4634 7 FIA4 0.4146 8 AVFI 0.4146 8 FIA2 0.3415 9 FIB1 0.2561 10 FID3 0.2439 11 FIA5 0.2195 12 FID1 0.1951 13 FID2 0.1220 14 FID4 0.0488 15 FID5 0.0244 16 MIA1 0.0244 16 FIB2 0.0000 17 MIC1 -0.0244 18 MIB1 -0.0976 19 MIA3 -0.0976 20 MIC3 -0.1220 21 FIB3 -0.1220 22 FIB4 -0.1220 22 MIA2 -0.1220 22 MIC4 -0.1707 23 MIB3 -0.1707 24 MIA4 -0.1951 25 MIB2 -0.2683 26 FIB5 -0.3171 27 MIB4 -0.3171 27 AVMI -0.3659 28 MIC5 -0.3659 29 MIB5 -0.4146 30 MIC2 -0.4878 31 MID4 -0.5122 32 MIA5 -0.5366 33 MID2 -0.5366 33 MID1 -0.5366 34 MID5 -0.5854 35 MID3 -0.6341 36

121
would prove as an alternative method which would be able to produce accurate and
reliable results as discussed in Section 4.4.3 and 4.8.3 of this chapter. The Caucasian
(Male and Female) spectral objects overlapped on PC1 and PC2, but produced a very
similar difference spectrum in comparison to the Mongoloid samples. It can therefore
be assumed that the same chemical compounds are responsible for the separation of
the Caucasian spectral objects.
4.10 PROMETHEE Analysis of Gender Samples
The scores values of the corresponding PCA plot were imported into Decision Lab for
PROMETHEE and GAIA interpretations. The PROMETHEE method used for the
analysis of race and gender has been previously described in Chapter 2, Section 6.5.2.
4.10.1 PROMETHEE Analysis of Mongoloid Spectral Objects (Male and Female)
For the comparison of Mongoloid gender spectral objects, the AVFI (Average
Mongoloid Female) sample was chosen as the reference for the sample set, as it was
an average sample representing one of the two major groupings. PC1 was Minimised,
PC2 - Maximised and PC3 – Minimised according to the corresponding PCA (Figure
4.13). A PROMETHEE complete ranking (Table 4.4a) was then generated using these
parameters. The PROMETHEE results have produced similar results to the
Mongoloid (Male and Female) spectral objects PCA scores plot. The groupings of
gender by PCA have been clearly separated according to PROMETHEE rankings.
Mongoloid Females ranked at the top end of the rankings, whereas the Males ranked
at the lower end. The majority of objects separated according to genders. However, a
few Female objects did mix into the Male ranking order. The PCA had previously
provided a clear separation along the PC1 axis. To remove the influence of the PC2
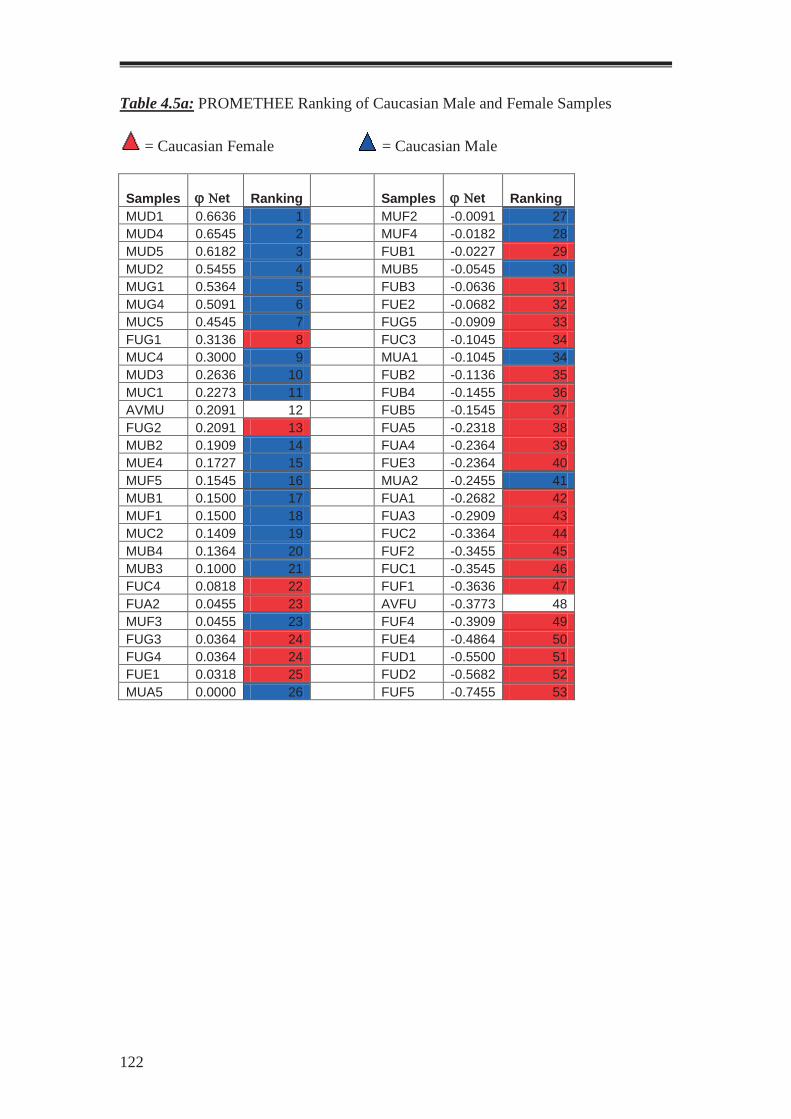
122
Table 4.5a: PROMETHEE Ranking of Caucasian Male and Female Samples
= Caucasian Female = Caucasian Male
Samples ϕ Νet Ranking Samples ϕ Νet Ranking MUD1 0.6636 1 MUF2 -0.0091 27 MUD4 0.6545 2 MUF4 -0.0182 28 MUD5 0.6182 3 FUB1 -0.0227 29 MUD2 0.5455 4 MUB5 -0.0545 30 MUG1 0.5364 5 FUB3 -0.0636 31 MUG4 0.5091 6 FUE2 -0.0682 32 MUC5 0.4545 7 FUG5 -0.0909 33 FUG1 0.3136 8 FUC3 -0.1045 34 MUC4 0.3000 9 MUA1 -0.1045 34 MUD3 0.2636 10 FUB2 -0.1136 35 MUC1 0.2273 11 FUB4 -0.1455 36 AVMU 0.2091 12 FUB5 -0.1545 37 FUG2 0.2091 13 FUA5 -0.2318 38 MUB2 0.1909 14 FUA4 -0.2364 39 MUE4 0.1727 15 FUE3 -0.2364 40 MUF5 0.1545 16 MUA2 -0.2455 41 MUB1 0.1500 17 FUA1 -0.2682 42 MUF1 0.1500 18 FUA3 -0.2909 43 MUC2 0.1409 19 FUC2 -0.3364 44 MUB4 0.1364 20 FUF2 -0.3455 45 MUB3 0.1000 21 FUC1 -0.3545 46 FUC4 0.0818 22 FUF1 -0.3636 47 FUA2 0.0455 23 AVFU -0.3773 48 MUF3 0.0455 23 FUF4 -0.3909 49 FUG3 0.0364 24 FUE4 -0.4864 50 FUG4 0.0364 24 FUD1 -0.5500 51 FUE1 0.0318 25 FUD2 -0.5682 52 MUA5 0.0000 26 FUF5 -0.7455 53
123
mixing, this PC was removed to see if the ranking would improve. By repeating the
ranking, the clusters became clearer and less sample mixing occurred. The majority of
Mongoloid (Female) spectral objects ranked between the φ net values of 0.87 and
0.02, while the Mongoloid (Male) objects ranked between the φ net values -0.12 and -
0.63. These two clusters are quite distinct and little mixing has occurred within these
sample blocks. The mixing of objects can be seen in the 0.02 and -0.12 φ net indices
between these two groups. The GAIA plot (Table 4.4b) directly reflected the
PROMETHEE ranking by the separation of genders into two main groups. It also
shows the direct transition of PCA scores values to GAIA values by giving a very
similar plot. Yet there is one main difference between the original PCA and GAIA in
the sample analysis. In the PCA scores plot, the sample MIB was previously
recognised as an atypical sample as it was clustered with the Female samples.
However in the GAIA plot, this sample has successfully shifted to the correct Male
grouping. As PC1 and PC3 lie at a right angle, this indicates their independence to
one another. Their contribution to the plot is near to equal as the pi axis lies in
between both of the PC1/PC3 axis. The GAIA gave a 100% ∆ value. This indicates
that the GAIA has explained all variance in two PC’s. By importing the PCA scores
values into GAIA, a clear improvement has occurred in the separation of genders.
This again confirms that genders can be separated based on the NIR spectra and
chemometric analysis of the chemical composition of hair. It confirms also that the
combination of PCA and PROMETHEE provides a viable method for matching and
discrimination of samples based on gender for this idealised dataset.
4.10.2 PROMETHEE Analysis of Caucasian Spectral Objects (Male and Female)
For the comparison of Caucasian gender spectral objects, the AVMU (Average

124
Table 4.5b: Corresponding GAIA plot of Caucasian (Male and Female) Ranking
= Caucasian Female = Caucasian Male

125
Caucasian Male) was chosen as the reference for the sample set, as it was an average
sample representing one of the two major groupings. PC1 was Maximised, PC2 -
Minimised, PC3 – Maximised and PC4 – Maximised according to the corresponding
PCA (Figure 4.15). A PROMETHEE complete ranking was then generated (Table
4.5a) using these parameters. The PROMETHEE results have produced similar results
to the samples PCA scores plot. The mixed groupings of the genders in the PCA have
provided unclear separation along the PROMETHEE ranking. Caucasian Female
objects ranked at the top and bottom end of the rankings, whereas the Males showed
minor grouping in the middle ranks. The majority of Caucasian (Male) spectral
objects ranked between the φ net values of 0.66 and 0.1, while the Caucasian
(Female) objects ranked between φ net values the -0.06 and -0.75. These two clusters
are quite distinct and little mixing has occurred within these sample blocks. The
mixing of objects can be seen in the 0.08 and -0.06 φ net indices between these two
groups.
The GAIA plot (Table 4.5b) directly reflected the PROMETHEE ranking by
separating genders into two main groups. It again shows the transition of PCA
scores values to GAIA values by giving a similar plot to the previous PCA. The
GAIA plot has slightly improved the separation of genders along the GAIA PC2 axis,
which previously ran through both Male and Female groups on the PCA plot.
However, the previously identified outlying samples from both gender groupings are
still intermixing to create the third cluster. As PC1 and PC3, PC2 and PC4 lie at right
angles to one another, indicating their independence as a variable. The GAIA gave a
54.66% ∆ value. By importing the PCA scores values into GAIA, a clear

126

127
improvement has occurred in the separation of genders without the manipulation of
data.
This again confirms that genders can be separated based on the NIR spectra and
chemometric analysis of the chemical composition of hair and shows that the
combination provides a viable method for matching and discrimination of samples
based on gender analysis for this dataset.
4.11 Conclusions: Race and Gender
For the analysis of gender and race, PCA can successfully match and discriminate
samples to identify their origins. When coupled with MCDM methods such as
PROMETHEE and GAIA, it not only improves quality of visual aid but also the
discriminatory factor between clusters. However, caution must be taken with dataset
sizes and the interferences they may cause. Previous hair treatments may cause data
deviations and anomalies to give an unreliable dataset. However this may also give an
advantage in providing information to a profile which was not given by the donor.
This type of information can be verified by cross checking samples against hair dye
and bleach treatments.
This analysis has also confirmed Wolframs study [57] that the amide proportions
between individuals can be used to discriminate gender and race. As such, it is not the
differences in race and gender samples that contribute to the analysis but rather the
chemical proportions that will discriminate and match persons according to their race
and sex origin. With the use of Near Infrared Spectroscopy and Chemometrics, human
scalp hair can successfully be matched and discriminated based on Race and Gender.

128

129
Chapter 5: Matching and Discrimination of Treated Hair
Hair colour is one of the discriminating factors of trace hair fiber evidence currently
being used in forensic science. It is combined with other physical characteristics such
as morphology and mechanical properties to yield a profile of the hair that may be of
value to criminal and disaster investigations. The difficulty with this process of
identification is the analysis time needed for examination and also the actual
examination of a fibre with hindering variables such as a hairs condition e.g.
weathering. Natural and treated hair colour will fade or change with time through
environmental variables. Thus, comparing two hair samples becomes even more
problematic if physical characteristics are dissimilar. However, this physical aspect
could provide much more information, if not be replaced, by combining it with the
chemical analysis of a hairs composition.
It is proposed that through NIR Spectroscopy and Chemometrics, a profile of a treated
hair can be built based on its chemical properties. The objectives in this investigation
were:
• to investigate the combination of NIR and Visible NIR spectra of coloured
bulk hair samples
• to discriminate individuals on the basis of treated hair profiles i.e. bleached,
dyed and untreated, with the use of NIR and chemometric methods such as
PCA, Fuzzy Clustering and PROMETHEE
A total of nine samples from bleached, dyed and untreated hair were collected from
female subjects. Prior to NIR analysis no pretreatment or cleaning methodologies

130
Table 5.1: Sample Information of Treated Hair
Sample Treatment Colour FUA Untreated Dark Brown FUB Untreated Light Brown FUC Untreated Brown FUD Untreated Black FUE Untreated Brown FUF Untreated Black FUG Untreated Light Brown FBA Bleached Cream FBB Bleached White FBC Bleached Cream FDA Dyed Brown FDB Dyed Brown/Red FDC Dyed Brown FDD Dyed Dark Brown

131
were applied. This was carried out to ensure that any useful evidence in hair fibres
would not be lost by any laboratory treatment. For this research, the NIR region is
defined as the 4000 - 7500 cm-1 range and the spectral profile is predominantly the
result of the vibrational energy transitions. The Visible NIR region is defined as the
7500 – 12800 cm-1 range [60] and predominantly consists of electronic energy
transitions. The combined NIR/Visible NIR is defined as the 4000 - 12800 cm-1 range
and the spectral profile is predominantly the result of a combination of the vibrational
and electronic transitions. Spectra were truncated according to these regions.
Colour can be the most critical comparative characteristic available to a forensic
examiner [4]. Lengthy amounts of time are needed for colour comparisons such as
pigmentation distribution, microscopic investigations and background analysis. As
well, a hair profile that is unique in the variation of pigment content of melanin
between individuals represents an almost continuous colour spectrum of human hair
[61]. For this reason, chemical composition is valuable as a supporting factor to
discriminate between treated, and indeed some untreated hairs and can decrease the
amount of analyses that have to be performed.
Human hair fibres derive their natural colour from the melanin pigment. Unlike
synthetic hair colours that are mixtures of small molecules dispersed throughout the
fibre and including the surface, the natural pigment is polymeric and exists as discrete
granules only in the hair cortex [62]. This structural difference between these two
types of colouring matter has a profound influence on their optical properties.
Conventionally the NIR utilises the vibrational energy states of the absorbing
molecules. However, the vibrational energy associated with the transition reflected by

132

133
NIRS is relatively weak when compared to the electronic transitions. The hair
pigment melanin is unusual in this regard, and it has been suggested [62] that its
absorption does not fit the classical definition of chromophoric absorption and is more
similar to that of a semiconductor. Semiconductors display optical properties, such as
the conductivity of the transferable electrons between electrical intermediates which
allow for easier absorption, and these facilitate the absorption of radiation from the
UV and into the Near Infrared region [62]. The depth of penetration of the NIR
radiation into the melanin depends on the wavelength and it is greater than the depth
of penetration of UV-Visible radiation at shorter wavelengths [55].
Pande et al’s research [62] on NIR hair application, established that synthetic hair
dyes do not affect the reflectance properties of hair above 750nm while the natural
pigment absorbs the NIR radiation. The difference in the radiation absorption
characteristics of the natural pigment and synthetic dyes can be exploited with the use
of NIRS, to measure bleaching without interference from the deposited dyes. This
indicates that natural hair pigmentation can be discriminated in the NIR region, while
the hair treatment type can by discriminated by combining the NIR and Visible NIR
regions. In a related study, Zoccola [55] found that absorption of NIR radiation by
melanin is not masked by the absorption of functional groups of the hair protein and
this absorption is correlated with the melanin content of hair. Therefore, a spectral
profile of the melanin in hair is purely due to the different energy transitions
occurring, being either vibrational or electronic.
Pande et al [62] mentioned that the conventional UV/Visible reflectance
measurements would be more sensitive than the NIR methodology for monitoring

134
Figure 5.1: Spectral Comparison of Bleached, Dyed and Untreated Treated Hair
0
0.5
1
1.5
2
2.5
3
40005000600070008000900010000110001200013000Wavenumber (cm-1)
Inte
nsity
UntreatedDyedBleached

135
chemical and photochemical bleaching, due to higher excitation in this region,
however this instrumentation cannot distinguish between natural pigment and
synthetic colours. Ozaki [53] also expressed a need for a simple and non-destructive
method of analysis in order to assess the degree of damage caused by cosmetic
treatments without further damaging the sample. If such an instrument can be realised,
then the identity profile of a person can be extended beyond Gender and Race to
include hair treatment, if any, all in the one analysis. This would provide a rapid,
simple and non-destructive method of profiling and possibly identification.
The combination of the NIR and Visible NIR regions could provide more chemical
information on hair fibres to potentially individualise a profile of hair samples and
by identifying any applied treatments such as dyeing and bleaching. This can be
efficiently provided by a composite NIR instrument such as the Nicolet Nexus FT-
NIR, which utilises both the NIR and Visible NIR regions simultaneously (Chapter 2,
Section 2).
5.1 Raw Spectra Analysis of Treated Hair
NIR spectra from different coloured hair could not be discriminated by visual
observation either in raw or 2nd derivative forms (Figure 5.1). No spectral shifts were
observed and all bands as previously identified from the NIR raw spectra, were
present for all treated hair. Similarities were noted between spectra of treated hairs
e.g. from bleached, dyed and untreated samples. If Wolfram’s theory [57] is
further applied to the treated hair, then spectral intensity should be the discriminating
factor in this analysis rather then frequency shifts i.e. the composition rather than
changes in the structure of hair is an important variable.

136
Figure 5.2: Comparison of Spectra of Untreated and Dyed Hair (Untreated – Dyed)
-0.5
0
0.5
1
1.5
2
2.5
40005000600070008000900010000110001200013000Wavenumber (cm-1)
Inte
nsity
UntreatedDyedDifference
Figure 5.3: Comparison of Spectra of Untreated and Bleached Hair (Untreated – Bleached)
-1
-0.5
0
0.5
1
1.5
2
2.5
3
40005000600070008000900010000110001200013000Wavenumber (cm-1)
Inte
nsity
UntreatedBleachedDifference

137
To compare the chemical proportions of treatment, the spectra were averaged and the
differences in spectra were visually analysed. Figure 5.2 compares spectra of
Untreated and Dyed samples and Figure 5.3 compares spectra of Untreated and
Bleached samples. A difference spectrum is also taken of each and acts as an
indicative representation of the differences between spectra. The differences are small
as can be seen by the small ∆Intensity values.
The intensity difference in the Untreated spectra (Fig 5.2) is rather smaller than that
from the Dyed hair spectra in the 4000 – 5400 cm-1 region. This region contains the
Amide combination modes of vibration at 4250 - 4850 cm-1and the OH bending and
stretching mode of vibration at 5200 cm-1. In the 5400 – 7500 cm-1 region, the spectral
intensity of the Dyed spectra is somewhat higher than that of the Untreated spectra.
This region contains the OH symmetric stretch overtone at 7000 cm-1 and also the
CHn bands in the 5400-5750 cm-1 region. There is a fairly intense broad band which
occurs over the 7000 – 12800 cm-1 region. This band also has a small shoulder at
8400 cm-1 which is attributed to the 2nd overtone CH2. This observation is similar to
the band pattern from the Bleached spectrum (Figure 5.3) but the effect is more
pronounced. However there is a gradual increase in intensity over the 7000 – 12800
cm-1 region. This slope is due to the loss of melanin pigment as a result of the
bleaching. It reveals that the darker the natural hair colour, the higher the absorption
in this region. From this it can be seen that bulk hair samples can be differentiated on
the basis of their treatment and chemical composition.
These observations appear to confirm Wolfram’s work [57], which was previously
mentioned (Chapter 4), and suggested that spectral differences between hair from
different treated samples was due to band intensities rather than frequency shifts.

138
Figure 5.4: PC1/PC2 scores plot: Discrimination of Differently Treated Hair Samples - Spectra in the 4000 – 7500 cm-1 NIR region
= Untreated = Dyed = Bleached

139
5.2 Chemometric Analysis of Differently Treated Hairs
The female hair spectral objects were selected for further analysis because they
revealed the presence of unexpected hairs treated with a light dye application as well
as the Untreated objects (see Chapter 4, Section 3). The female hair was selected for
this analysis because these spectral objects showed the biggest uncertainty of
treatment identification as noted from the previous chapter. Three bleached, four dyed
and seven untreated hair samples collected from Caucasian females were analysed
with the use of three separate spectral regions. The frequency ranges chosen for the
study included the NIR region between 4000 – 7500 cm-1, the combination of the NIR
and Visible NIR region of 4000 – 12800 cm-1 and finally, the Visible NIR region only
between 7500 – 12800 cm-1. The whole spectral dataset was normalised against the
CH2 band (5777 cm-1) and mean centred. This matrix (73 x 218) was imported into
Sirius. Subsets of each region were used for separate analyses and comprised of 17
bleached, 21 dyed and 36 untreated female spectral scans including averages.
Sample names have been shortened to a 4 letter acronym for simplification. The key
for the letters and positions is as follows:
Position Abbreviation Meaning First Letter Position F Female Second Letter Position U, D, B Untreated, Dyed, Bleached Third Letter Position A to G Individual’s ID Fourth Letter Position 1 to 5 Repeat Spectral Number
5.3 Chemometric Analysis of Differently Treated Spectral Objects (Female)
5.3.1 PCA Analysis of Treated Hair (Female)
The resulting PCA scores plot of the spectral objects from the 4000 – 7500 cm-1 NIR
region (Figure 5.4) explains 92.6% of data variance with PC1. A trend can be seen
along the PC1 axis with Bleached spectral objects having positive scores on PC1 and
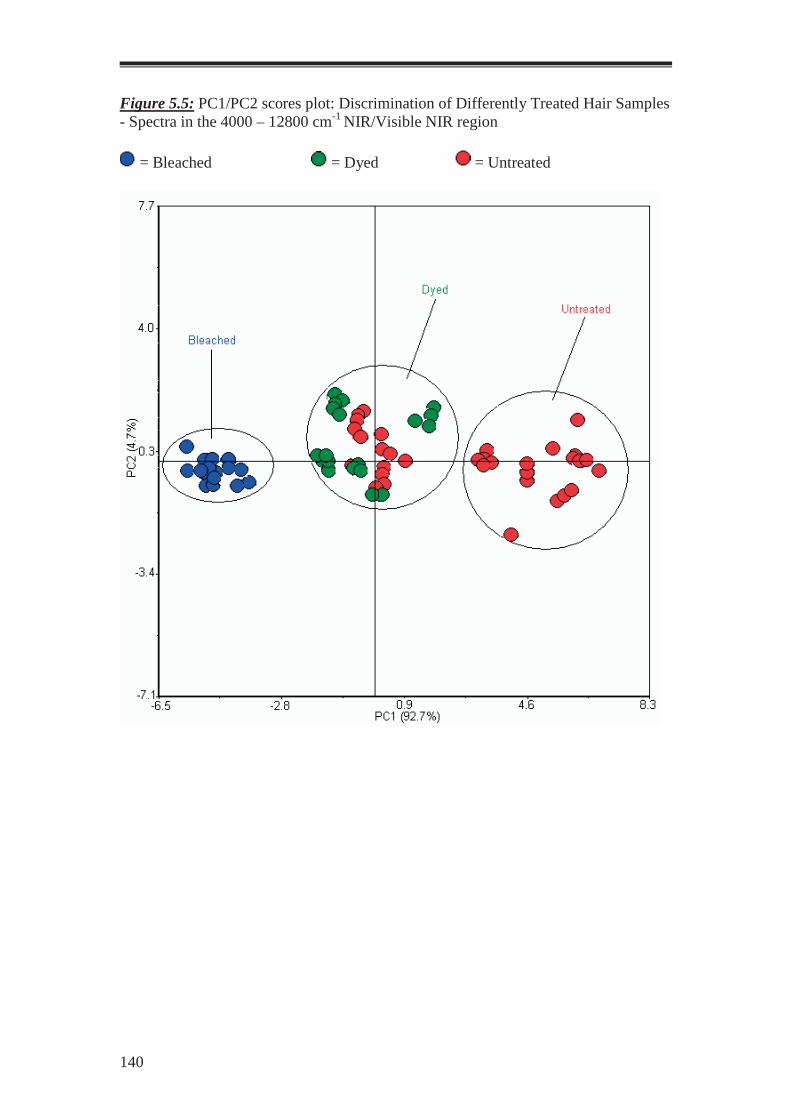
140
Figure 5.5: PC1/PC2 scores plot: Discrimination of Differently Treated Hair Samples - Spectra in the 4000 – 12800 cm-1 NIR/Visible NIR region
= Bleached = Dyed = Untreated

141
negative scores for Untreated objects. This sequence may reflect the damage to the
fibre structure i.e. the treatment with dyes causes less change and damage than
bleaching. PC2 accounts for 5.5% of data variance and all data points overlap along
this axis. The PCA represents the chemical changes, which result from the hair
treatment processes. Some discrimination has occurred between the treatment
methods of hairs indicating that spectral differences are due to chemical structural
proportions rather than proportions of absorption of the melanin content. If the
analysis is based solely on the NIR region then the spectral objects are discriminated
by the dominating vibrational energy states of the protein present in human hair. The
three groups formed in the PCA plot are a result of the vibrations of the functional
groups within the keratin protein. However, as the overtone band formation becomes
weaker in the higher wavelength region, the spectrum becomes more
indistinguishable between the treated hair samples. As such, the three groups have not
been completely separated on the PCA plot and remained overlapped. This supports
Pande’s paper [62] that the natural hair pigmentation can be discriminated with the
use of the NIR region while the hair treatment type can be discriminated by
combining the NIR and Visible NIR regions.
The PCA scores plot in the 4000 – 12800 cm-1 NIR/Visible NIR region is shown in
Figure 5.5. PC1 accounts for 92.7% of the variance and PC2 accounts for 4.7% of the
variance. Bleached spectral objects have negative scores on PC1 while the Untreated
objects have positive scores. Dyed objects remain centred on the origin. All objects
formed separate groups according to treatment. In this PCA, the separation of spectral
objects has clearly improved by utilising the entire spectral range rather than

142
Figure 5.6: PC1/PC2 scores plot: Discrimination of Differently Treated Hair Samples - Spectra in the 7500 – 12800 cm-1 Visible NIR region = Bleached = Dyed = Untreated

143
the 4000 - 7500 cm-1 alone. The middle group of dye treated hairs is particularly
interesting because it contains not only the Dyed spectral objects but also the
‘untreated’ objects, which postulated as being treated hair. This has been discussed at
length elsewhere (Chapter 4, Section 9.1). As previously mentioned, the absorptions
due to overtones and combinations are relatively weak. As the NIR overtone
absorption becomes weaker above 7500 cm-1 wavelength region, the electronic energy
absorptions begin to dominate, resulting in better separation of spectral objects on the
PCA. This indicates that the electronic energy transitions have a much greater affect
on the separation of objects than the vibrational transition region. However, the
vibrational energy transitions are more dominant in the lower wavenumber region.
When compared to the NIR only region, the combination of NIR and Visible NIR
regions greatly improves the method for analysing treated hair as it was discriminated
over a greater region. This supports Pande’s paper [62] that the natural hair
pigmentation can be discriminated with the use of the NIR region while the hair
treatment type can by discriminated by combining the NIR and Visible NIR regions.
The PCA scores plot in the 7500 – 12800 cm-1 Visible NIR region as shown in Figure
5.6. PC1 accounts for 96.2% of variance. The Bleached spectral objects (negative
scores) are separated from the Untreated (positive scores) along this PC. PC2
accounts for 3.5% of variance and largely separates Bleached and Untreated (positive
scores) from Dyed spectral objects (negative scores) along this PC. This PCA
illustrates a further improvement from the NIR/ Visible NIR region by forming
distinct groupings of individuals for each treatment. The most marked differences

144
Figure 5.7: PC1 Loadings vs. Spectral Variables of Objects in the 7500 – 12800 cm-1 Visible NIR region

145
between the spectra can be seen in the tails of the Visible NIR region, where the
melanin absorption is not masked by the absorption of functional groups from the
protein matrix. The absorption in this region is qualitatively correlated with the
content of melanin in the hair. In particular, the depigmented objects (bleached) do
not show absorption bands in this spectral region. The exception is a band of weak
intensity at 8400, due to the protein backbone which is masked by the absorption of
melanin in the pigmented objects. It reveals that the darker the natural hair colour, the
higher the absorption in this region.
5.3.2 Loadings Plot of Treated Hair (Female)
The PC1 loadings of the Visible NIR region of 7500 – 12800 cm-1 (Figure 5.13)
confirm that the positive Untreated and Dyed spectral objects (positive scores) are
influenced by colour, as this was the only difference observed in this region.
Furthermore, the loadings of the Visible NIR region confirm that colour heavily
influences the data and separates the groups based on this factor when included. When
only the Visible NIR region is analysed, it gives very little detail as to what other
factors separate the groups.
It confirms the previous conclusion that the combined NIR/ Visible NIR region
provides the most information for the analysis and gives the best separation.

146
Table 5.2: 3 group (p = 2.5) Fuzzy Clustering Membership of NIR Spectral Objects from Treated Hair
Sample Cluster 1 (Bleached)
Cluster 2 (Dyed)
Cluster 3 (Untreated) Fuzzy Sample
Cluster 1 (Bleached)
Cluster 2 (Dyed)
Cluster 3 (Untreated) Fuzzy
FBA1 0.888 0.071 0.041 FUA3 0.064 0.713 0.223 FBA2 0.943 0.036 0.02 FUA4 0.066 0.296 0.639 FBA3 0.795 0.126 0.079 FUA1 0.07 0.66 0.27 FBA4 0.795 0.127 0.079 FUA2 0.058 0.744 0.198 FBA5 0.635 0.215 0.15 FUA5 0.044 0.829 0.127 FBB1 0.761 0.147 0.092 FUB1 0.071 0.584 0.346 Fuzzy FBB2 0.797 0.13 0.072 FUB2 0.071 0.454 0.475 Fuzzy FBB3 0.779 0.143 0.078 FUB3 0.065 0.694 0.241 FBB4 0.754 0.151 0.095 FUB4 0.064 0.71 0.227 FBB5 0.77 0.143 0.088 FUB5 0.064 0.786 0.151 FBC1 0.266 0.565 0.169 FUC1 0.03 0.109 0.86 FBC2 0.268 0.566 0.166 FUC2 0.05 0.228 0.722 FBC3 0.564 0.307 0.13 FUC3 0.076 0.767 0.158 FBC4 0.821 0.119 0.06 FUC4 0.281 0.537 0.181 FBC5 0.847 0.102 0.052 FUC5 0.133 0.687 0.18 FBAV 0.98 0.013 0.007 FUD1 0.087 0.27 0.643 FDA1 0.798 0.136 0.066 FUD2 0.088 0.269 0.643 FDA2 0.895 0.068 0.036 FUD3 0.095 0.308 0.597 FDA3 0.898 0.066 0.036 FUD4 0.111 0.37 0.52 Fuzzy FDA4 0.903 0.062 0.035 FUD5 0.095 0.31 0.595 FDA5 0.842 0.099 0.059 FUE1 0.056 0.237 0.707 FDB1 0.323 0.509 0.167 FUE2 0.045 0.19 0.765 FDB2 0.463 0.386 0.151 Fuzzy FUE3 0.026 0.093 0.881 FDB3 0.468 0.382 0.15 Fuzzy FUE4 0.049 0.143 0.808 FDB4 0.505 0.351 0.144 Fuzzy FUE5 0.12 0.68 0.2 FDB5 0.599 0.279 0.122 FUF1 0.074 0.19 0.736 FDC1 0.058 0.229 0.713 FUF2 0.047 0.138 0.815 FDC2 0.054 0.806 0.14 FUF3 0.154 0.296 0.55 FDC3 0.057 0.804 0.138 FUF4 0.082 0.203 0.715 FDC4 0.053 0.835 0.112 FUF5 0.103 0.237 0.661 FDC5 0.053 0.837 0.109 FUG1 0.412 0.435 0.152 Fuzzy FDD1 0.105 0.746 0.149 FUG2 0.583 0.295 0.122 FDD2 0.093 0.776 0.131 FUG3 0.842 0.106 0.052 FDD3 0.101 0.764 0.135 FUG4 0.926 0.049 0.025 FDD4 0.073 0.733 0.194 FUG5 0.794 0.139 0.067 FDD5 0.13 0.735 0.135 FUAV 0.074 0.52 0.406 Fuzzy FDAV 0.276 0.566 0.158
147
5.3.3 Detection of Fuzzy Objects
Fuzzy clustering data classification was used to identify any outlying intermixing
spectral objects from the original PCA analysis. Fuzzy Clustering was also analysed
as a cross reference to identify the true nature of the intermixing objects of the PCA
and also the ‘untreated’ and fuzzy spectral objects from the previous Gender/Race
analysis. Four atypical objects were identified as fuzzy and it was suggested that they
may have been subjected to a hair treatment but not recorded by the donor. These
samples included all spectral scans of FUA, FUC and FUG. In this analysis, all like
spectral objects would theoretically cluster together and any fuzzy objects will also be
identified. The true nature of any treated objects will then cluster with the
representative group.
A three group cluster model with a soft cluster exponent of p = 2.5 was used to
represent the three different classes Untreated, Dyed and Bleached. Hence, the class
membership threshold is 1/n classes = 0.33.
A fuzzy clustering analysis of the NIR only region (Table 5.2) was produced. The
analysis revealed three major groups, discriminated by the treatment method that was
used on the sample hairs. The intermixing of spectral objects that was seen in the PCA
is reflected in the fuzzy clustering analysis. The objects that were located between
groups on the PCA have been identified as fuzzy spectral outliers. Eight fuzzy objects
were identified in the analysis including three Bleached objects (FDB2, 3, 4) and five
Untreated objects (FUB1, 2, FUD4, FUG1 and FUAV). These spectral objects
presented n values of > 0.33 over two or more groups and were therefore identified
with more than one representative treatment group. By using only the NIR region of

148
Table 5.3: 3 group (p = 2.5) Fuzzy Clustering of NIR/Visible NIR Spectral Objects from Treated Hair
Sample Cluster 1 (Untreated)
Cluster 2 (Dyed)
Cluster 3 (Bleached) Fuzzy
Sample (Continued)
Cluster 1 (Untreated)
Cluster 2 (Dyed)
Cluster 3 (Bleached)
FBA1 0.008 0.021 0.972 FUA1 0.093 0.823 0.084 FBA2 0.012 0.031 0.957 FUA2 0.149 0.754 0.097 FBA3 0.017 0.044 0.938 FUA3 0.08 0.841 0.079 FBA4 0.015 0.038 0.947 FUA4 0.12 0.751 0.128 FBA5 0.051 0.12 0.829 FUA5 0.075 0.856 0.069 FBB1 0.035 0.083 0.882 FUB1 0.634 0.273 0.092 FBB2 0.018 0.047 0.935 FUB2 0.708 0.215 0.077 FBB3 0.02 0.051 0.929 FUB3 0.643 0.266 0.09 FBB4 0.023 0.057 0.92 FUB4 0.628 0.278 0.093 FBB5 0.021 0.052 0.928 FUB5 0.65 0.261 0.089 FBC1 0.062 0.199 0.739 FUC1 0.147 0.716 0.137 FBC2 0.054 0.162 0.785 FUC2 0.118 0.769 0.113 FBC3 0.044 0.137 0.819 FUC3 0.079 0.853 0.068 FBC4 0.017 0.049 0.934 FUC4 0.071 0.861 0.068 FBC5 0.026 0.076 0.898 FUC5 0.062 0.879 0.059 FBAV 0.001 0.004 0.995 FUD1 0.864 0.09 0.045 FDA1 0.085 0.775 0.14 FUD2 0.847 0.101 0.051 FDA2 0.103 0.703 0.194 FUD3 0.878 0.082 0.041 FDA3 0.109 0.699 0.192 FUD4 0.868 0.088 0.044 FDA4 0.113 0.695 0.192 FUD5 0.868 0.088 0.044 FDA5 0.122 0.658 0.221 FUE1 0.915 0.059 0.027 FDB1 0.273 0.6 0.127 FUE2 0.916 0.059 0.025 FDB2 0.206 0.672 0.122 FUE3 0.92 0.056 0.024 FDB3 0.287 0.581 0.133 FUE4 0.892 0.076 0.032 FDB4 0.567 0.317 0.116 FUE5 0.794 0.138 0.068 FDB5 0.303 0.558 0.138 FUF1 0.877 0.083 0.041 FDC1 0.125 0.736 0.139 FUF2 0.813 0.122 0.064 FDC2 0.056 0.867 0.077 FUF3 0.648 0.242 0.11 FDC3 0.059 0.852 0.089 FUF4 0.877 0.083 0.041 FDC4 0.053 0.869 0.078 FUF5 0.859 0.095 0.046 FDC5 0.051 0.873 0.076 FUG1 0.031 0.926 0.042 FDD1 0.091 0.697 0.212 FUG2 0.053 0.872 0.076 FDD2 0.085 0.729 0.186 FUG3 0.081 0.81 0.109 FDD3 0.092 0.691 0.218 FUG4 0.094 0.786 0.12 FDD4 0.094 0.709 0.197 FUG5 0.073 0.823 0.104 FDD5 0.09 0.691 0.219 FUAV 0.561 0.333 0.106 FDAV 0.022 0.952 0.027
149
the spectrum, treatment groups remain overlapped and spectral objects intermix
between them.
The PCA of the NIR/Visible NIR region showed the best separation between the
characteristic Untreated, Dyed and Bleached groups, and this result was reflected in
the fuzzy clustering analysis. The FC analysis (Table 5.3) identified three distinct
groups within the dataset. All Bleached objects corresponded to one group and the
Dyed objects to a second. As expected, the Untreated spectral objects mixed between
the groups represented by the Dyed and Untreated objects. The treated ‘untreated’
objects present in the Dyed object cluster included FUA, FUC and FUG. These were
previously identified as fuzzy spectral objects in the Gender/Race analysis (Chapter 4,
Section 9.1). The object FUB has remained with the Untreated cluster and may be
identified as a legitimate outlying object from the dataset. Regardless of the
‘untreated’ hairs with a light dye application, all objects corresponded to the correct
treatment group. This analysis suggests that samples can not only be used to build a
profile of a person by distinguishing Untreated samples from treated ones but also the
type of treatment process a sample has undergone i.e. Bleached, mild to full dying.
Samples that have been incorrectly labeled by the donor can also be discriminated by
NIR/Visible NIR and Chemometrics. This shows the extensive analyses that the NIR
instrumentation can provide while producing a reliable and accurate method.
The fuzzy clustering analysis of the Visible NIR only region (Table 5.4) produced a
very similar result to the previous NIR/Visible NIR analysis. Only one spectral object
was identified as an outlier from the analysis but was not an ‘untreated’ dyed object
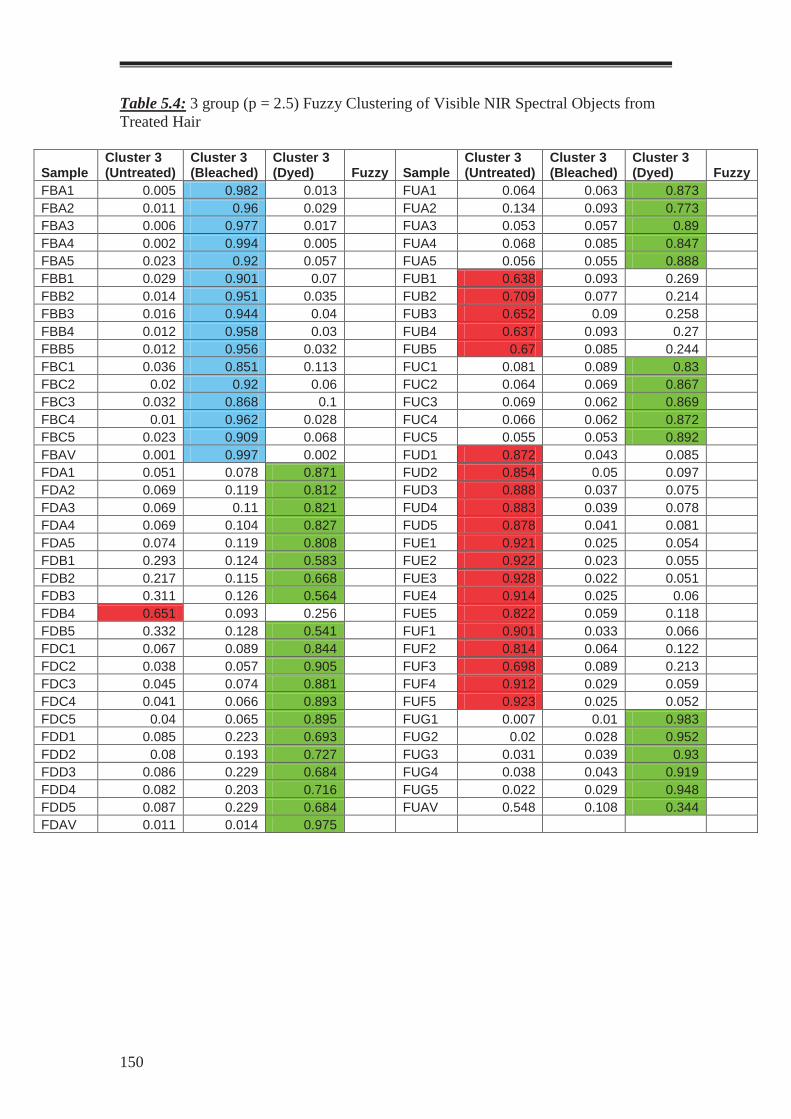
150
Table 5.4: 3 group (p = 2.5) Fuzzy Clustering of Visible NIR Spectral Objects from Treated Hair
Sample Cluster 3 (Untreated)
Cluster 3 (Bleached)
Cluster 3 (Dyed) Fuzzy Sample
Cluster 3 (Untreated)
Cluster 3 (Bleached)
Cluster 3 (Dyed) Fuzzy
FBA1 0.005 0.982 0.013 FUA1 0.064 0.063 0.873 FBA2 0.011 0.96 0.029 FUA2 0.134 0.093 0.773 FBA3 0.006 0.977 0.017 FUA3 0.053 0.057 0.89 FBA4 0.002 0.994 0.005 FUA4 0.068 0.085 0.847 FBA5 0.023 0.92 0.057 FUA5 0.056 0.055 0.888 FBB1 0.029 0.901 0.07 FUB1 0.638 0.093 0.269 FBB2 0.014 0.951 0.035 FUB2 0.709 0.077 0.214 FBB3 0.016 0.944 0.04 FUB3 0.652 0.09 0.258 FBB4 0.012 0.958 0.03 FUB4 0.637 0.093 0.27 FBB5 0.012 0.956 0.032 FUB5 0.67 0.085 0.244 FBC1 0.036 0.851 0.113 FUC1 0.081 0.089 0.83 FBC2 0.02 0.92 0.06 FUC2 0.064 0.069 0.867 FBC3 0.032 0.868 0.1 FUC3 0.069 0.062 0.869 FBC4 0.01 0.962 0.028 FUC4 0.066 0.062 0.872 FBC5 0.023 0.909 0.068 FUC5 0.055 0.053 0.892 FBAV 0.001 0.997 0.002 FUD1 0.872 0.043 0.085 FDA1 0.051 0.078 0.871 FUD2 0.854 0.05 0.097 FDA2 0.069 0.119 0.812 FUD3 0.888 0.037 0.075 FDA3 0.069 0.11 0.821 FUD4 0.883 0.039 0.078 FDA4 0.069 0.104 0.827 FUD5 0.878 0.041 0.081 FDA5 0.074 0.119 0.808 FUE1 0.921 0.025 0.054 FDB1 0.293 0.124 0.583 FUE2 0.922 0.023 0.055 FDB2 0.217 0.115 0.668 FUE3 0.928 0.022 0.051 FDB3 0.311 0.126 0.564 FUE4 0.914 0.025 0.06 FDB4 0.651 0.093 0.256 FUE5 0.822 0.059 0.118 FDB5 0.332 0.128 0.541 FUF1 0.901 0.033 0.066 FDC1 0.067 0.089 0.844 FUF2 0.814 0.064 0.122 FDC2 0.038 0.057 0.905 FUF3 0.698 0.089 0.213 FDC3 0.045 0.074 0.881 FUF4 0.912 0.029 0.059 FDC4 0.041 0.066 0.893 FUF5 0.923 0.025 0.052 FDC5 0.04 0.065 0.895 FUG1 0.007 0.01 0.983 FDD1 0.085 0.223 0.693 FUG2 0.02 0.028 0.952 FDD2 0.08 0.193 0.727 FUG3 0.031 0.039 0.93 FDD3 0.086 0.229 0.684 FUG4 0.038 0.043 0.919 FDD4 0.082 0.203 0.716 FUG5 0.022 0.029 0.948 FDD5 0.087 0.229 0.684 FUAV 0.548 0.108 0.344 FDAV 0.011 0.014 0.975
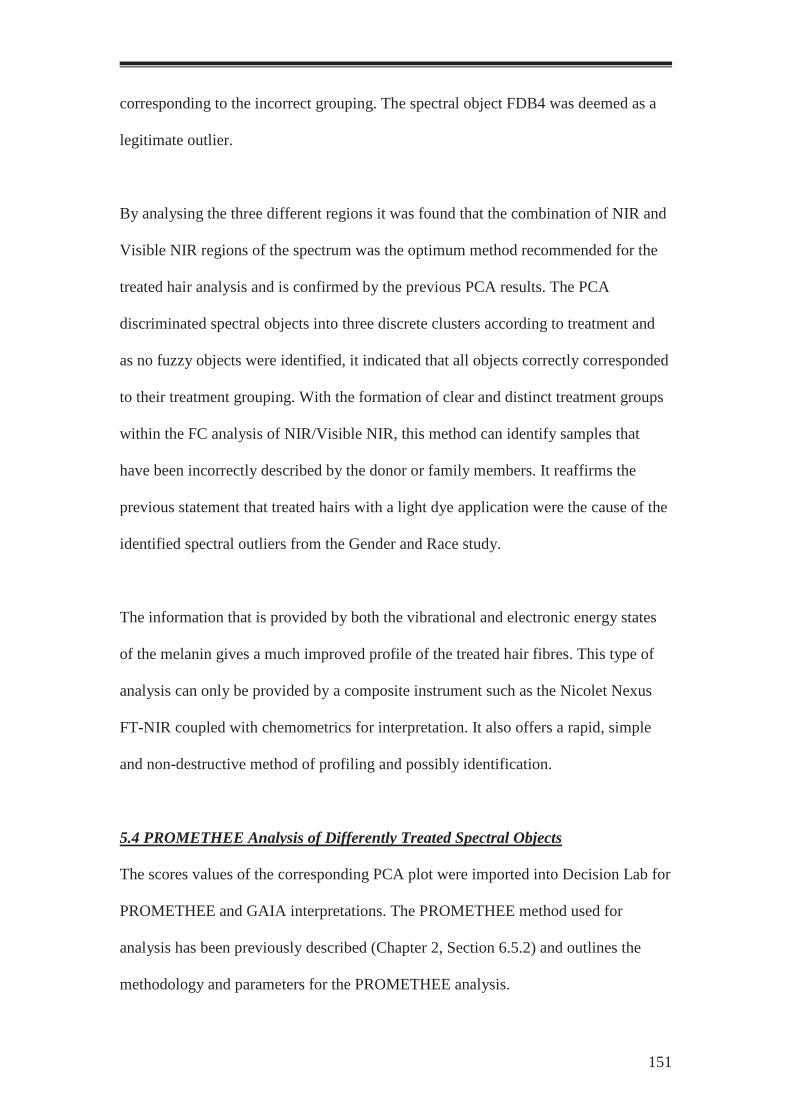
151
corresponding to the incorrect grouping. The spectral object FDB4 was deemed as a
legitimate outlier.
By analysing the three different regions it was found that the combination of NIR and
Visible NIR regions of the spectrum was the optimum method recommended for the
treated hair analysis and is confirmed by the previous PCA results. The PCA
discriminated spectral objects into three discrete clusters according to treatment and
as no fuzzy objects were identified, it indicated that all objects correctly corresponded
to their treatment grouping. With the formation of clear and distinct treatment groups
within the FC analysis of NIR/Visible NIR, this method can identify samples that
have been incorrectly described by the donor or family members. It reaffirms the
previous statement that treated hairs with a light dye application were the cause of the
identified spectral outliers from the Gender and Race study.
The information that is provided by both the vibrational and electronic energy states
of the melanin gives a much improved profile of the treated hair fibres. This type of
analysis can only be provided by a composite instrument such as the Nicolet Nexus
FT-NIR coupled with chemometrics for interpretation. It also offers a rapid, simple
and non-destructive method of profiling and possibly identification.
5.4 PROMETHEE Analysis of Differently Treated Spectral Objects
The scores values of the corresponding PCA plot were imported into Decision Lab for
PROMETHEE and GAIA interpretations. The PROMETHEE method used for
analysis has been previously described (Chapter 2, Section 6.5.2) and outlines the
methodology and parameters for the PROMETHEE analysis.

152
Table 5.5: a) PROMETHEE Ranking of Spectral Objects of Treated Hair, 4000 – 7500 cm-1 NIR region and b) Corresponding GAIA plot of the Treated Objects Ranking, = Bleached = Dyed = Untreated Table 5.5a
Sample φ Net Ranking Samples
(continued) φ Net Ranking FBB1 0.8438 1 FBC4 -0.2083 52 FBB4 0.5833 2 FUC2 -0.2222 53 FBA5 0.5347 3 FUA3 -0.2292 54 FBA4 0.4931 4 FDA3 -0.2569 55 FUH5 0.4375 5 FBC3 -0.2604 56 FBA3 0.434 6 FUC4 -0.2674 57 FBAV 0.4306 7 FUB2 -0.2674 58 FBB5 0.4028 8 FBC1 -0.2847 59 FBB2 0.3681 9 FUF5 -0.2917 60 FBA2 0.3611 10 FUF4 -0.316 61 FDC4 0.3333 11 FUC3 -0.3264 62 FUH4 0.3194 12 FDB1 -0.3299 63 FUH3 0.3125 13 FDB2 -0.3333 64 FBB3 0.3056 14 FUF2 -0.3403 65 FBA1 0.2882 15 FUF1 -0.3472 66 FDC5 0.2708 16 FUC1 -0.3611 67 FDC2 0.2222 17 FDB5 -0.4097 68 FDC3 0.2188 18 FDB3 -0.4201 69 FUD5 0.1667 19 FDB4 -0.4306 70 FUH2 0.1493 20 FUF3 -0.4688 71
Table 5.5b:
FUD2 0.1319 21 FUD4 0.0972 22 FUD3 0.0938 23 FUH1 0.0903 24 FUG3 0.0799 25 FUA4 0.0694 26 FUB3 0.0556 27 FUD1 0.0347 28 FUB5 0.0347 29 FUB1 0.0104 30 FUAV 0.0104 30 FUG5 0.0069 31 FDC1 0 32 FBC5 -0.0035 33 FUE1 -0.0139 34 FUE5 -0.0139 35 FUA1 -0.0243 36 FUE2 -0.0382 37 FUE3 -0.0625 38 FDAV -0.066 39 FUA2 -0.066 39 FDA5 -0.0694 40 FUE4 -0.0799 41 FUA5 -0.0903 42 FUG1 -0.1146 43 FUC5 -0.1181 44 FBC2 -0.1181 45 FUB4 -0.125 46 FUG2 -0.1389 47 FDA4 -0.1424 48 FUG4 -0.1458 49 FDA2 -0.191 50 FDA1 -0.1979 51

153
5.4.1 PROMETHEE Ranking of Treated Hair (Female)
For comparison of treated spectral objects for the NIR region, the FBAV object was
chosen as the reference for the sample set, as it was the average object representing
one of the three major groupings. PC1 was Maximised, PC2 - Maximised, PC3 –
Minimised and PC4 – Maximised according to the corresponding PCA (Figure 5.4). A
PROMETHEE complete ranking was then generated (Table 5.5a) using these
parameters. The PROMETHEE results have produced similar results to the spectral
objects (female, treated) PCA scores plot. Three overall groupings have formed.
However, all objects have intermixed within each treatment group providing an
unclear separation. Bleached objects ranked mainly at the top end of the rankings,
while Dyed and Untreated objects mixed throughout the lower half of the rankings.
The GAIA plot (Table 5.5b) directly reflected the PROMETHEE ranking by
separation of treated hairs into three main groups. It again shows the transition of
PCA scores values to GAIA values by giving a similar plot to the previous PCA one.
The GAIA plot has slightly improved the separation of treated hairs. The GAIA plot
indicated that the PC1 axis was responsible for the separation between both Bleached
and Dyed spectral objects from the Untreated ones. However in comparison to the
original PCA scores plot, this GAIA has not identified the ‘untreated’ objects with a
light dye application from the Gender/Race study (Chapter 4, Section 9.1). It has
instead identified sample FDC as Untreated spectral objects. All PC’s lie at right
angles to one another, indicating their independence. The GAIA gave a 54.84% ∆
value.

154
Table 5.6: a) PROMETHEE Ranking of Spectral Objects of Treated Hair, 4000 – 12800 cm-1 NIR/Visible NIR region and b) Corresponding GAIA plot of the Treated Object Ranking, = Bleached = Dyed = Untreated Table 5.6a
Samples φ Net Ranking Samples φ Net Ranking FBA2 0.6597 1 FUA5 -0.2014 50 FBA1 0.5278 2 FDA1 -0.2257 51 FBC4 0.5208 3 FDA3 -0.2361 52 FBC2 0.5069 4 FUE4 -0.2431 53 FBB1 0.4792 5 FUD1 -0.2431 54 FBAV 0.4792 6 FUE5 -0.2569 55 FBC1 0.4792 7 FUH1 -0.2569 55 FBA3 0.4514 8 FUE1 -0.2569 56 FBB3 0.4306 9 FDA5 -0.2778 57 FBC3 0.4306 9 FUD2 -0.2778 58 FBB5 0.4097 10 FDA4 -0.2847 59 FBB2 0.4028 11 FUA4 -0.2917 60 FBC5 0.4028 11 FUH2 -0.2917 61 FBB4 0.3889 12 FUH5 -0.2986 62 FBA4 0.3194 13 FUH3 -0.3194 63 FBA5 0.3056 14 FUH4 -0.3472 64 FUG1 0.2847 15 FUE2 -0.3472 65 FUG4 0.2222 16 FUD4 -0.5417 66 FUC1 0.1806 17 FUD5 -0.5486 67 FUF3 0.1667 18 FUD3 -0.5764 68
Table 5.6b
FUG2 0.125 19 FUG5 0.1007 20 FUB3 0.0972 21 FUC4 0.0764 22 FUB4 0.0625 23 FUC3 0.0625 24 FUB1 0.0486 25 FUF2 0.0278 26 FUF4 -0.0139 27 FDB2 -0.0208 28 FDC3 -0.0243 29 FUC2 -0.0347 30 FDAV -0.0347 31 FUG3 -0.0417 32 FUB5 -0.0417 33 FUC5 -0.0417 33 FDB1 -0.0486 34 FDC2 -0.0556 35 FDB3 -0.0694 36 FDC1 -0.0764 37 FDB4 -0.0972 38 FDB5 -0.1111 39 FDC5 -0.1111 40 FDC4 -0.1111 41 FUA3 -0.125 42 FUAV -0.1319 43 FUF5 -0.1319 44 FUB2 -0.1458 45 FDA2 -0.1458 46 FUA1 -0.1701 47 FUE3 -0.1736 48 FUF1 -0.1736 48 FUA2 -0.1944 49

155
For the comparison of the NIR/Visible NIR region, the FBAV spectral object was
chosen as the reference for the sample set. PC1 was Minimised, PC2 - Minimised,
PC3 – Maximised and PC4 – Minimised according to the corresponding PCA (Figure
5.5).A PROMETHEE complete ranking was then generated (Table 5.6a) using these
parameters. The PROMETHEE results have produced similar results to the original
PCA scores plot. This ranking provided a much improved result by presenting three
clearly separated groups associated with treated hairs. Little intermixing occurred and
this is attributed to the ‘untreated’ spectral objects with a light dye application ranking
higher than the Dyed ones. The majority of the Bleached objects ranked between the
φ net values of 0.66 and 0.30. The Untreated objects showed segregated ranking
between the φ net values 0.28 and -0.01 and also -0.12 and -0.57. The first cluster of
the Untreated group was identified as a mix of the ‘untreated’ spectral objects and a
few true Untreated, while the second cluster was assigned as the grouping for the true
Untreated objects. The Dyed spectral group ranked between the φ net values of -0.02
and -0.12 in between the two Untreated object clusters. Little mixing occurred within
these two object blocks. However a separation can be distinguished from the
PROMETHEE analysis identifying the three treatment types.
The GAIA plot (Table 5.6b) directly reflected the PROMETHEE ranking by
separation of treated hairs into three main groups. The GAIA plot has slightly
improved their separation of treated hairs. It indicated that the PC1 and PC2 were
mostly responsible for the separation between both Bleached and Dyed spectral
objects from the Untreated ones. However, in comparison to the original PCA scores
plot, this GAIA has not identified the ‘untreated’ objects with a light dye application

156
Table 5.7: a) PROMETHEE Ranking of Spectral objects of Treated Hair, 7500 – 12800 cm-1 Visible NIR region and b) Corresponding GAIA plot of the Treated Spectral Objects Ranking, = Bleached = Dyed = Untreated Table 5.7a
Samples φ Net Ranking Samples φ Net Ranking FUG3 0.8056 1 FBA2 -0.1991 50 FUG5 0.787 2 FBA3 -0.2083 51 FUG4 0.7639 3 FUH5 -0.2407 52 FUG1 0.6944 4 FUH3 -0.25 53 FUG2 0.5833 5 FUH4 -0.2685 54 FUE1 0.5648 6 FBB1 -0.2685 55 FUE2 0.5556 7 FBC4 -0.2963 56 FUF4 0.5093 8 FBC3 -0.3519 57 FUE3 0.4722 9 FDB1 -0.3796 58 FUE5 0.4444 10 FDB2 -0.3889 59 FUD1 0.3981 11 FDB4 -0.3981 60 FUE4 0.3704 12 FBC5 -0.4167 61 FUD2 0.3241 13 FDB3 -0.4259 62 FUAV 0.3148 14 FDA1 -0.4352 63 FUB4 0.287 15 FBA5 -0.4352 64 FUC2 0.2824 16 FDB5 -0.4722 65 FDC1 0.2778 17 FDA3 -0.662 66 FUF3 0.2407 18 FDA5 -0.6667 67 FUD3 0.2407 19 FDA4 -0.6713 68 FUD5 0.2083 20 FDA2 -0.7037 69
Table 5.7b:
FUB1 0.2037 21 FUB2 0.1898 22 FUF1 0.1852 23 FUB3 0.1759 24 FUF2 0.1481 25 FUD4 0.1296 26 FUB5 0.1296 27 FUC1 0.0741 28 FBB2 0.0185 29 FUA3 0.0093 30 FUC4 -0.0046 31 FDC2 -0.0093 32 FDC4 -0.0185 33 FUC3 -0.0231 34 FUA1 -0.037 35 FUH1 -0.037 35 FDAV -0.0556 36 FBA4 -0.0741 37 FUA2 -0.0787 38 FUC5 -0.1019 39 FDC5 -0.1157 40 FBB3 -0.1204 41 FBC1 -0.1204 42 FBA1 -0.1204 43 FBB4 -0.1204 43 FUF5 -0.1204 43 FDC3 -0.1296 44 FBC2 -0.1389 45 FUA4 -0.1481 46 FUA5 -0.1481 46 FBAV -0.162 47 FBB5 -0.1806 48 FUH2 -0.1852 49

157
from the Gender/Race study (Chapter 4, Section 9.1). It has instead identified FDA
and FDB as Untreated spectral objects. As all PC’s lie at right angles to one another,
indicating their independence as a variable. The GAIA gave a 53.54% ∆ value. PCA
remains the optimum method for this analysis of treated hair samples.
For the comparison of the NIR/ Visible NIR region, the FUAV object was chosen as
the reference for the sample set. PC1 was Maximised PC2 - Maximised and PC3 –
Maximised according to the corresponding PCA (Figure 5.6). A PROMETHEE
complete ranking was then generated (Table 5.7a) using these parameters. These
PROMETHEE rankings have very little similarity to the original PCA scores plot.
There is an improvement from the ranking of the NIR region in regards to the
formation of the three main groupings of treated spectral objects. The majority of
Untreated objects ranked between the φ net values 0.80 and -0.03, while the Bleached
objects ranked mostly between the φ net values -0.07 and -0.60. However, the
Bleached group has intermixed at the lower ranking of the Untreated object block.
The Dyed objects formed a more cohesive cluster at the lower rankings between the φ
net values -0.38 and -0.70. Few Dyed objects have appeared in the other treatment
groups. Yet the spectral objects did not separate as clearly as the NIR/ Visible NIR
ranking. The Untreated spectral objects spread throughout the rankings of both treated
objects. The separation between treated objects is again replicated using this region.
The GAIA plot (Table 5.7b) directly reflected the PROMETHEE ranking by
separation of genders into two main groups. It also shows the direct transition of PCA

158

159
scores values to GAIA values by giving a very similar plot. PC1 and PC3 are
correlated and both contribute to the separation of the Untreated objects. On the other
hand, PC2 lies at a right angle to PC1 and 3, indicate its independence, and
discriminates the Bleached objects Their contribution to the plot is near to equal as the
pi axis lies in between both of the PC1/PC3 axis. The GAIA gave a 71.21% ∆ value.
In comparison, this value is higher than the NIR and NIR/Visible NIR GAIA ∆
values. The improvement in separation between spectral clusters of treated hair is a
result of this increase in variance as it describes more information with the same
number of samples. It has identified FDA and FDB as Untreated spectral objects. By
importing the PCA scores values into GAIA, a clear improvement has occurred in the
separation of treated hairs. This confirmed that treated hairs can be separated on the
basis of NIR spectra and chemometric analysis of the chemical composition of hair.
This analysis indicates that PROMETHEE provides a successful analysis of
separation of treatments when applied to bulk hair. The Visible NIR only region was
found to be the best overall method by providing three clear groups of treated spectral
objects to reflect the separation that occurred on the original PCA. However, some
treated Dyed objects were mistakenly grouped with other Untreated objects while the
previously identified dyed ‘untreated’ spectral objects did not.

160

161
5.5 Conclusions: Treated Hair
It can be seen from the PCA that the results have been heavily influenced by the
inclusion of the Visible NIR region. It not only gave the best separation but also
provided structural information on the hair as a result of the treatment process. Upon
visual inspection of the samples it was noted that Dyed and Untreated samples (Table
5.1) were diverse in colour yet they could still be separated according to treatment.
This indicates that the absorption differences of the melanin content resulted in the
grouping of the spectral objects and that the colour of the hair samples showed no
effect on the analysis. This method would be able to identify a treatment that has been
applied to a hair sample.
By analysing the three different spectral regions, it was found that the combination of
NIR and Visible NIR regions produced the best result for matching and discrimination
of treated hair. This type of analysis can only be provided by an instrument such as
the Nicolet Nexus FT-NIR which could sample the two regions sequentially and the
result be interpreted by chemometrics. It also offers a rapid, simple and non-
destructive method of profiling and possibly identification.
The analysis supports both Pande and Zoccola’s [62, 55] work that the natural hair
pigmentation can be discriminated with the use of the NIR region while the hair
treatment type can by discriminated by combining the NIR and Visible NIR regions
and the discrimination of the melanin in hair occurs as a result of the different energy
transitions occurring, being either vibrational or electronic. This can then be later
utilised to build a profile of a sample collected from evidence at a crime or disaster
scene. This analysis can discriminate treated hairs according to treatment processes.

162

163
With the formation of clear and distinct treatment groups within the PCA scores plot,
this method can also identify samples that have been incorrectly described by the
donor or family members. It reaffirms the previous statement that treated hairs with a
light dye application were the cause of the atypical identified samples from the
Gender and Race study.
The combined methods of PCA, Fuzzy clustering and PROMETHEE each contribute
to an accurate and reliable method by cross checking each others results.

164

165
Chapter 6: Matching and Discrimination of Hair - Samples Subjected to Water Medium Treatment In Chapter 3, comparison of spectra of wet hair fibres (Figure 3.7) showed that the
water bands dominated the spectral profiles, and masked most other bands. As the
fibres were dried with a hair dryer (15min, Section 3.6), spectral sub-structures were
progressively revealed until samples produced a consistent spectrum with constant
band intensities (on average). Previous literature [7] indicated that water is absorbed
onto the hydrophilic sites present on the surface of the keratin protein and also on the
surfaces of the microfibrils therein. The interaction of water with fibrous keratin was
discussed in Chapter 1, Section 4. Essentially, hair fibres naturally absorb water from
the atmosphere up to about 30% and in general have a level of 16 – 20%, subject to
temperature and humidity conditions. On immersion into an aqueous solution, water
is absorbed by the fibre, which swells and permits the entry of water and solutes such
as dyes and ionic salts into the body of the fibre [7]. Thus, water in a fibre may be
grouped into roughly three classes:
i) the primary molecular water which interacts with the keratin surfaces in the
fibre and the hydrophilic groups,
ii) the molecular water clusters or layers which interact with these primary
surfaces,
iii) the free water which is effectively similar to the bulk water.
The drying process in this work aimed to dehydrate the protein structure to

166

167
approximately a control level. This was intended to minimise the effect of the water
spectrum on further analysis, as well as to simplify any cleaning process, and make
any adhering soil particles become dry and thus easier to remove. From the work of
Paris [36], it was expected that the surface of a hair fibre would be different from its
original state after an IAEA cleaning treatment (Chapter 2, Section 5.4). But if a
sample that has undergone an immersion and cleaning process were to be compared to
a control, a better match could be achieved. It is anticipated that the cleaning
procedure would remove the loose particulates and some of the natural fatty layer and
liquids from the hair. Thereafter, as previously indicated, the hair would be dried so as
to remove the NIR spectral interference of water.
Water is a common substance present at forensic scenes e.g. at home in a bath,
spillage on the floor, or in the swimming pool; it is also common outdoors in the sea,
river, canal, pipelines, puddles and especially during DVI incidents at the seashore
after a tsunami. For forensic and analytical reasons, the effect of water on NIR spectra
of hair was investigated.
The three main objectives of this work were:
• to analyse the effect of the application of the IAEA cleaning method on the
NIR spectra of water treated and untreated hair.
• to analyse the effects of water and time on the NIR spectra of human hair
fibres.
• to match and discriminate the NIR spectra of untreated hairs from the same
person before and after water treatment.

168

169
Three bulk hair samples were collected from three different donors. These samples
were then subjected to immersion in three separate water media. The hairs were
placed in Sea, River and Dam water as these represented the most likely water media
in which a victims remains could be found. Whilst water was collected from sources
without waterbed particles, floating soil particles still heavily contaminated the
sampled water.
The treated hairs were then subjected to cleaning and drying processes (Chapter 2,
Section 5) and analysed by NIR spectroscopy. The spectral data obtained was
interpreted by chemometrics. The samples will not be analysed by microscopy or
SEM as this research aims to statistically validate the results and change the current
type of hair analysis from comparative and objective opinions.
6.1 Experimental Design
The main factors affecting the investigation included:
• the individual from whom the hair was obtained,
• the medium in which the hair was immersed,
• the time period for which the hair was immersed,
• the time period for which the hair was dried,
• the method used to clean the hair after water treatment and before NIR
analysis (Table 6.1).
The decay of a deceased persons from a natural disaster scene often limits the
identification as the evidence needed to ID them becomes lost with the decomposing
process. However, as bulk hair generally remains intact and survives through the

170
Table 6.1: Factors of investigation
Factors Donor Medium Time Period Drying Time Cleaning Individual 1
Sea 2 Hours 15 minutes Modified IAEA
Individual 2
River 24 Hours
Individual 3
Dam 7 Days
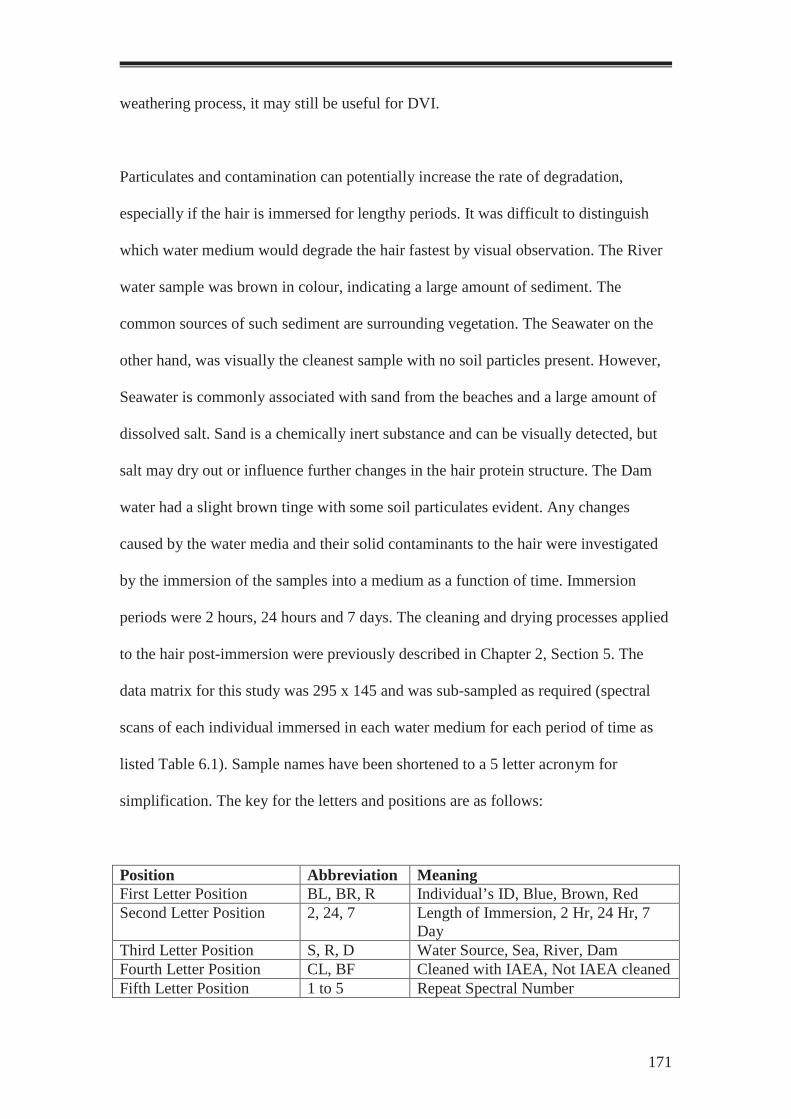
171
weathering process, it may still be useful for DVI.
Particulates and contamination can potentially increase the rate of degradation,
especially if the hair is immersed for lengthy periods. It was difficult to distinguish
which water medium would degrade the hair fastest by visual observation. The River
water sample was brown in colour, indicating a large amount of sediment. The
common sources of such sediment are surrounding vegetation. The Seawater on the
other hand, was visually the cleanest sample with no soil particles present. However,
Seawater is commonly associated with sand from the beaches and a large amount of
dissolved salt. Sand is a chemically inert substance and can be visually detected, but
salt may dry out or influence further changes in the hair protein structure. The Dam
water had a slight brown tinge with some soil particulates evident. Any changes
caused by the water media and their solid contaminants to the hair were investigated
by the immersion of the samples into a medium as a function of time. Immersion
periods were 2 hours, 24 hours and 7 days. The cleaning and drying processes applied
to the hair post-immersion were previously described in Chapter 2, Section 5. The
data matrix for this study was 295 x 145 and was sub-sampled as required (spectral
scans of each individual immersed in each water medium for each period of time as
listed Table 6.1). Sample names have been shortened to a 5 letter acronym for
simplification. The key for the letters and positions are as follows:
Position Abbreviation Meaning First Letter Position BL, BR, R Individual’s ID, Blue, Brown, Red Second Letter Position 2, 24, 7 Length of Immersion, 2 Hr, 24 Hr, 7
Day Third Letter Position S, R, D Water Source, Sea, River, Dam Fourth Letter Position CL, BF Cleaned with IAEA, Not IAEA cleaned Fifth Letter Position 1 to 5 Repeat Spectral Number
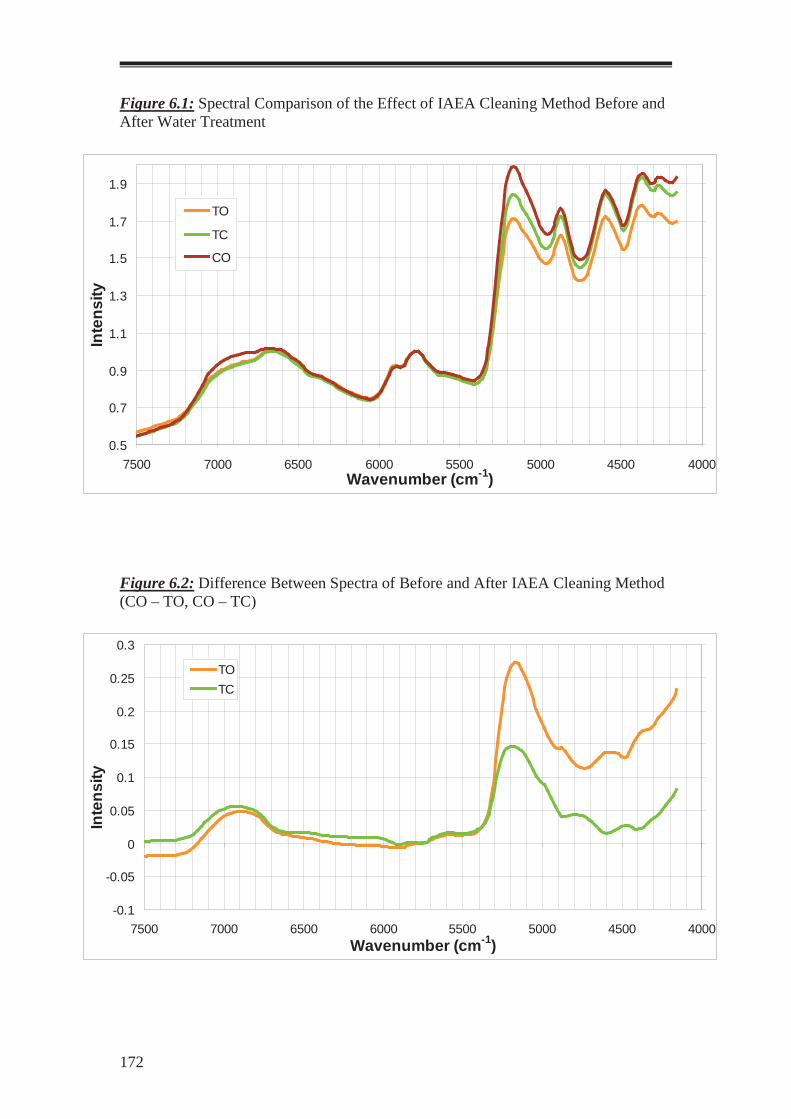
172
Figure 6.1: Spectral Comparison of the Effect of IAEA Cleaning Method Before and After Water Treatment
0.5
0.7
0.9
1.1
1.3
1.5
1.7
1.9
40004500500055006000650070007500Wavenumber (cm-1)
Inte
nsity
TO
TC
CO
Figure 6.2: Difference Between Spectra of Before and After IAEA Cleaning Method (CO – TO, CO – TC)
-0.1
-0.05
0
0.05
0.1
0.15
0.2
0.25
0.3
40004500500055006000650070007500Wavenumber (cm-1)
Inte
nsity
TOTC

173
6.2 Application of the Cleaning Treatment
The first aim of applying the cleaning treatment was to remove any debris such as
sand, mud, or soil, from the hair after immersion in water. The untreated original hairs
which were used as a reference for the immersed hairs, were also treated by the IAEA
method to keep each sample at the same level of experimental methodology for
comparison. Thus, samples used for this analysis comprised of 3 sets. The first
included bulk hairs treated by a water medium, the second, treated by a water medium
followed by the IAEA cleaning method, and the third included a cleaned only set. For
this analysis, bulk hairs were taken from Individual 1, and the selected water medium
was from the River source for all time periods (2 hr, 24 hr, 7 days). Samples from
only one individual and one water source were taken to simplify the methodology by
minimising the number of variables of water and donor sources.
6.2.1 Comparison of Raw Spectra Before and After the Application of IAEA Cleaning Method To compare the effects of the IAEA cleaning treatment on samples which have been
immersed in a water medium, the spectra were averaged and the differences between
the spectra were visually analysed. Figure 6.1 compares the spectra of treated only by
immersion/ before IAEA cleaning (TO), treated by immersion/ after IAEA cleaning
(TC) and the cleaned only (CO) hair samples. Figure 6.2 shows the difference spectra
between the TC and TO samples. The intensity of the CO spectrum provides a
reference for spectral comparisons. Thus, the larger the difference between a spectrum
from a sample, which had been immersed in water and the corresponding reference,
the more affected was the hair sample by the immersion process.

174
Figure 6.3: PC1/PC2 Scores Plot: Comparison of Water Immersed Sample vs. Water and Cleaned Samples
= TO = TC = CO

175
The difference spectrum is an indicative representation of the differences between
spectra. The differences are small as can be seen by the small ∆Intensity values.
When the spectra in this work were compared, all followed the same general pattern
and no spectral band shifts were observed (Figure 6.1). In the CO spectrum, the
combination Amide bands at 4600 and 4850 cm-1 were compared with those of the TC
spectrum and revealed that the band intensities at 4600 cm-1 were effectively the
same, while those at 4850 cm-1 were clearly lower. Similar differences were noted
with the TO spectrum. However, in this case, both the 4600 and 4850 cm-1 bands had
much lower intensities and hence, were most different from the reference sample.
However, the water band at 5200 cm-1 differed with each sample in order from the
highest intensity to lowest – CO, TC and TO. Overall, in the 5400 – 7500 cm-1
spectral range, most differences were observed between the 4250 – 5400 cm-1, and
also in this range, the three spectra displayed broad overlapping bands at 6560 and
6950 cm-1. Only the CO (OH (str)) band at 7000 cm-1 was slightly more intense.
Difference spectra (Figure 6.2) highlighted the major differences between the
references in the 4000 - 5400 cm-1 region. They showed that the TC and TO spectra
were quite different from the CO reference and also from each other. Minor changes
in intensity were observed in the remaining regions of the spectra but did not indicate
any substantial effects as a result of the cleaning process. It is clear that the spectrum
from the TC sample resembles the CO and reflects the effectiveness of the IAEA cleaning.

176
Table 6.2: a) PROMETHEE Ranking Spectral Objects from Immersed Hair Samples Before and After IAEA Cleaning Method b) Corresponding GAIA plot of the Cleaning Treatment Ranking
= TC = TO = CO
Table 6.2a Table 6.2b
Samples φ Net Ranking BL2BFR3 0.5882 1 BL2BFR4 0.5441 2 BL2BFR2 0.5221 3 BL2BFR1 0.3971 4 BL2BFR5 0.3824 5 BLCLO2 0.3309 6 BL24BFR3 0.2941 7 BL24BFR4 0.2647 8 BL24BFR2 0.2353 9 BLCLO1 0.1912 10 BL24CLR1 0.1029 11 BL24CLR4 0.0882 12 BL7BFR4 0.0735 13 BLCLO5 0.0662 14 BL7BFR2 0.0662 15 BL7CLR4 0.0588 16 BL7BFR3 0.0294 17 BL7BFR1 0.0294 18 BL7BFR5 0.0221 19 BL24CLR2 -0.0294 20 BL24BFR1 -0.0809 21 BL24BFR5 -0.0882 22 BL7CLR2 -0.0882 23 BLCLO3 -0.0956 24 BL24CLR3 -0.1029 25 BL2CLR3 -0.2132 26 BL7CLR5 -0.2132 27 BLCLO4 -0.2206 28 BL2CLR2 -0.2794 29 BL2CLR1 -0.3456 30 BL24CLR5 -0.375 31 BL7CLR1 -0.4265 32 BL2CLR5 -0.5294 33 BL7CLR3 -0.5882 34 BL2CLR4 -0.6103 35

177
6.2.2 PCA – Spectra from Hair Involving IAEA cleaning
A PCA plot was generated to further demonstrate the effectiveness of the IAEA
cleaning when applied to treated samples. The PCA scores plot (Figure 6.3) illustrates
the separation of the samples based on the different treatments. PC1 accounts for
88.9% of total variance in the data while PC2 describes 6.8% of data variance. PC1
had the most influence upon the data as CO objects (positive scores) were separated
from the objects obtained from TO samples (negative scores) along this axis. The TO
samples are the furthest from the CO; thus, the TO samples are most dissimilar to the
CO ones. PC2 separates the CO sample (positive scores) from the TC samples (mostly
negative scores). However there is little separation between them when compared to
the TO. The PCA has also confirmed the initial results of the raw spectral
comparisons. From this it can be seen that the application of the IAEA cleaning
method to the treated hairs has successfully improved the samples for analysis.
6.2.3 PROMETHEE Analysis of Samples
The scores values of the corresponding PCA plot were imported into Decision Lab for
PROMETHEE and GAIA interpretations. The PROMETHEE method used for
analysis has been previously described (Chapter 2, Section 6.5.2) and outlines of the
methodology and parameters for the PROMETHEE analysis were provided therein as
well.

178

179
6.2.4 PROMETHEE Ranking Spectra Involving the IAEA Cleaning Method
A PROMETHEE Ranking was generated in order to explore the classification of the
spectral objects. For the comparison of treated samples, the BFAV sample was chosen
as the reference for the sample set, as it was the average sample representing one of
the two major groupings. The ranking matrix contained the scores from four PC’s
from the original PCA (Figure 5.2). PC1 was Minimised, PC2 - Maximised, PC3 –
Maximised and PC4 – Minimised according to position of the BFAV reference. A
PROMETHEE complete ranking was then generated (Table 6.2a) using this model.
The PROMETHEE results have supported the interpretation of the PCA scores plot
(Figure 6.3). Two overall groupings have formed, representing the separation of TO
and TC treatments. This indicates a clear improvement to the samples condition,
having been cleaned of debris. The majority of TO samples ranked between the φ net
values of 0.58 and -0.08, while the TC samples ranked between the φ net values -0.08
and -0.61. These two clusters are quite distinct and little mixing has occurred within
these sample blocks. The mixing of samples between these two groups is due to the
four TC samples which clustered with the TO grouping on the PC1 (negative scores)
of the corresponding PCA (Figure 6.3). The CO samples were spread evenly
throughout both cleaning treatments (positive and negative φ net values) of the
PROMETHEE ranking. This is a reflection of the CO sample mixing with the TC
sample across the PC2 axis and also with the TO samples on the PC1 axis of the
corresponding PCA. This analysis indicates that PROMETHEE can successfully
discriminate the spectra of cleaned or uncleaned bulk hair samples.

180

181
The GAIA plot (Table 6.2b) reflected the PROMETHEE ranking by separating
samples into two main groups according to cleaned and uncleaned samples. However,
these two groups did not separate according to treatment, the samples intermixed
within both clusters. The GAIA did not produce clear and distinct clusters. All PC
variables lie at approximate right angles, indicating their independence to one another.
The GAIA described 57.97% (∆ value) data variance. However, the corresponding
original PCA explained 95.7% variance over 2 PC’s. When imported into GAIA,
approximately over 35% of this variance was lost and therefore more PC’s (4) from
the original PCA were incorporated in an attempt to explain more information.
6.3 Effect of Water on Bulk Hair Samples
This analysis was performed in order to investigate the effect of immersion in
different water media in the resulting hair fibres. In regard to forensic significance,
the changes caused to hair by immersion in different waters adds to the evidence by
establishing the hair history. It is preferable that few changes occur to maintain the
quality and reliability of information that can be derived from the hairs found. Less
change also assures a higher possibility of matches to its original source. Even though
the medium cannot be chosen in a real life case, it is still is important to know what to
expect from such a situation. Thus, if this research succeeds then SEM analyses of the
hair fibres becomes less important for such work. The chemometric analysis of the
NIR spectra becomes a vital source of information in the discrimination of hair.

182
Figure 6.4: Comparison of Spectra Between All Water Media
0.5
0.7
0.9
1.1
1.3
1.5
1.7
1.9
40004500500055006000650070007500Wavenumber (cm-1)
Inte
nsity
Dam
Sea
River
CO
Figure 6.5: Difference Between Spectra From All Water Media (CO – Water (Dam, Sea, River) Spectrum)
-0.05
0
0.05
0.1
0.15
0.2
0.25
40004500500055006000650070007500Wavenumber (cm-1)
Inte
nsity
DamSeaRiver

183
6.3.1 Comparison of Raw Spectra of Hair Samples Immersed in Different Water Media To compare the effects of the different types of water, samples were immersed for a
standard time period of 24 hr and then cleaned using the modified IAEA method.
Spectra were averaged and the differences were visually analysed. Figure 6.4
illustrates the comparison in spectra between Sea, River and Dam water types and
their relation to the CO sample. Figure 6.5 shows the difference spectra of hair after
immersion in different types of water. Spectral intensity of the CO sample set the
benchmark as a reference. Therefore, the more similar a spectrum is to the CO
spectrum, the better the matching is between hair types with the original hair samples.
The difference spectrum is an indicative representation of the differences between
spectra. The differences are small as can be seen by the small ∆Intensity values.
When the spectra were compared, all followed the same general pattern with no
spectral shifts being observed (Figure 6.4). Spectral intensities were very similar
throughout the entire NIR spectral set for hair treated in different water media. Only
the CO spectrum showed some variation, as this sample was not immersed. The
largest differences in intensity were again the combination bands at 4600 and 4850
cm-1 in the Amide region respectively. However, in this analysis the samples could
not be visually discriminated. But, the intensity values of the water band at 5200 cm-1
showed a larger intensity difference between samples. In the 5400 – 7500 cm-1 region,
spectra effectively appeared to overlap. Difference spectra (Figure 6.5) highlight the
differences between spectra not recognised by visual comparison. Spectral differences
associated with the immersion into Dam, River and Sea water and the reference CO in

184
Figure 6.6: PC1/PC2 Scores Plot: Comparison of All Water Media After Immersion for 24 hr
= River Water = Sea Water = Dam Water = CO
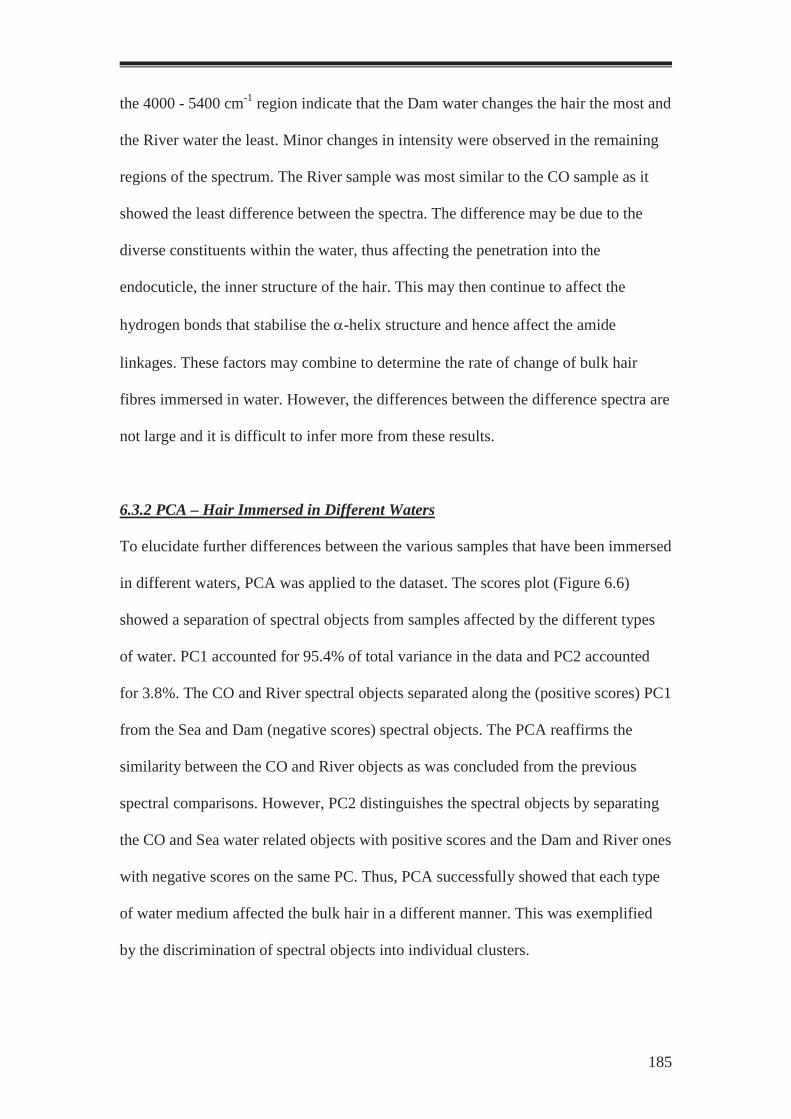
185
the 4000 - 5400 cm-1 region indicate that the Dam water changes the hair the most and
the River water the least. Minor changes in intensity were observed in the remaining
regions of the spectrum. The River sample was most similar to the CO sample as it
showed the least difference between the spectra. The difference may be due to the
diverse constituents within the water, thus affecting the penetration into the
endocuticle, the inner structure of the hair. This may then continue to affect the
hydrogen bonds that stabilise the α-helix structure and hence affect the amide
linkages. These factors may combine to determine the rate of change of bulk hair
fibres immersed in water. However, the differences between the difference spectra are
not large and it is difficult to infer more from these results.
6.3.2 PCA – Hair Immersed in Different Waters
To elucidate further differences between the various samples that have been immersed
in different waters, PCA was applied to the dataset. The scores plot (Figure 6.6)
showed a separation of spectral objects from samples affected by the different types
of water. PC1 accounted for 95.4% of total variance in the data and PC2 accounted
for 3.8%. The CO and River spectral objects separated along the (positive scores) PC1
from the Sea and Dam (negative scores) spectral objects. The PCA reaffirms the
similarity between the CO and River objects as was concluded from the previous
spectral comparisons. However, PC2 distinguishes the spectral objects by separating
the CO and Sea water related objects with positive scores and the Dam and River ones
with negative scores on the same PC. Thus, PCA successfully showed that each type
of water medium affected the bulk hair in a different manner. This was exemplified
by the discrimination of spectral objects into individual clusters.
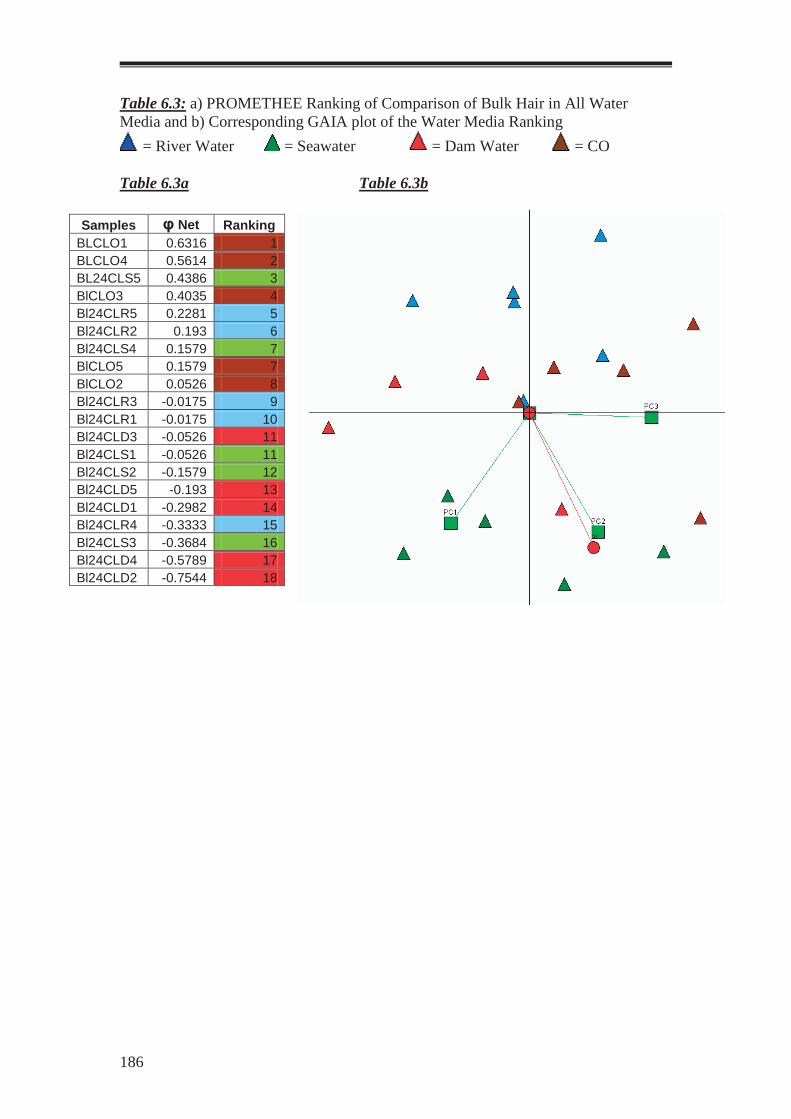
186
Table 6.3: a) PROMETHEE Ranking of Comparison of Bulk Hair in All Water Media and b) Corresponding GAIA plot of the Water Media Ranking
= River Water = Seawater = Dam Water = CO
Table 6.3a Table 6.3b
Samples φ Net Ranking BLCLO1 0.6316 1 BLCLO4 0.5614 2 BL24CLS5 0.4386 3 BlCLO3 0.4035 4 Bl24CLR5 0.2281 5 Bl24CLR2 0.193 6 Bl24CLS4 0.1579 7 BlCLO5 0.1579 7 BlCLO2 0.0526 8 Bl24CLR3 -0.0175 9 Bl24CLR1 -0.0175 10 Bl24CLD3 -0.0526 11 Bl24CLS1 -0.0526 11 Bl24CLS2 -0.1579 12 Bl24CLD5 -0.193 13 Bl24CLD1 -0.2982 14 Bl24CLR4 -0.3333 15 Bl24CLS3 -0.3684 16 Bl24CLD4 -0.5789 17 Bl24CLD2 -0.7544 18

187
6.3.3 PROMETHEE Analysis of Samples
The scores values of the corresponding PCA plot were imported into Decision Lab for
PROMETHEE and GAIA interpretations. The PROMETHEE method used for
analysis has been previously described (Chapter 2, Section 6.5.2) and outlines of the
methodology and parameters for the PROMETHEE analysis were provided therein as
well.
6.3.4 PROMETHEE Ranking of Spectra Related to Different Water Media
For the comparison of water samples, the SAV sample was chosen as the reference, as
it was the average sample representing the Sea objects group. PC1 was Minimised,
PC2 - Maximised, PC3 and Maximised according to their scores on the corresponding
original PCA (Figure 6.6) (3 PC’s were the maximum number available for this
analysis). A PROMETHEE complete ranking was then generated (Table 6.3a). The
PROMETHEE results have not supported the original PCA of spectral objects
immersed in different water media. A ranking was obtained of spectral objects with
very little separation occurring between groups. An approximate order of spectral
objects could be distinguished from the ranking, CO having the highest φ net values,
then River, Seawater, and Dam having the least. However, objects remain heavily
mixed throughout the PROMETHEE ranking. The previous spectral comparison
(Figure 6.5) of hair treated in water media revealed that the River objects were the
most similar to the CO objects as it showed the least difference between the spectra.
The PROMETHEE supports these results as the CO and River objects ranked highest
on the ranking. The waters are characterised by their soil and vegetable matter,

188

189
dissolved salt content and suspended solids; these differences could affect the fibres
differently and hence, result in the clustering of different spectral objects.
The GAIA plot (Table 6.3b) reflected the PROMETHEE ranking by separating the
water media into three main groups. The GAIA produced clusters with considerable
overlap between them. The GAIA shows that on PC1 the objects are quite intermixed
which, supports the PROMETHEE analysis. Whereas PC2 separates Seawater, CO
and Dam water objects (positive scores) from the River objects (negative scores). The
GAIA gave a 68.09% ∆ value. However, the corresponding original PCA explained
92.2% variance over 2 PC’s.
6.4 Effect of Immersion Time on Bulk Hair Samples
In practice, hair samples may remain immersed in a water medium for different
periods of time, and in this section of research, the effects of the immersion time are
discussed.
It is anticipated that the different compositions of water will cause different changes
in the hair fibre owing to their different salt and suspended solids content. The longer
the fibres are immersed, the more change should occur in the hairs. Such changes
could be monitored by the NIRS.

190
Figure 6.7: Comparison of Spectra Between Length of Time Hair is Immersed in All Water Media
0.5
0.7
0.9
1.1
1.3
1.5
1.7
1.9
40004500500055006000650070007500Wavenumber (cm-1)
Inte
nsity
2 Hours24 Hours7 DaysCO
Figure 6.8: Difference Between Spectra of Length of Time Hair is Immersed in Water (CO – Time (2 hr, 24 hr, 7 day) Spectrum)
-0.1
-0.05
0
0.05
0.1
0.15
0.2
0.25
0.3
0.35
40004500500055006000650070007500Wavenumber (cm-1)
Inte
nsity
2 Hours24 Hours7 Days

191
6.4.1 Comparison of Raw Spectra of Bulk Hair Immersed for Different Times in Different Waters For the immersion time comparison, the spectra of Individual 1 were averaged and the
differences between the spectra were visually analysed. Figure 6.7 illustrates spectra
obtained after 2 hr, 24 hr and 7 days of immersion in each water media of the CO
samples. A spectrum of the CO is included for comparison purposes. Figure 6.8
shows the difference spectra for samples immersed for different times. The intensity
of the CO sample sets the benchmark for the reference samples. The difference
spectrum is an indicative representation of the differences between spectra. The
differences are small as can be seen by the small ∆Intensity values.
When the spectra were compared, the profile followed the same general pattern with
no spectral shifts being observed (Figure 6.7). The progression in the length of
immersion time has led to an inverse trend in the spectra. As the length of immersion
time increased, the spectral intensity decreased. The band at 4600 cm-1 (Amide
combination) showed that the CO and 2 hr immersion spectral objects were equally
intense but the 24 hr and 7 day objects were of somewhat lower intensity. The
intensity values of the water band at 5200 cm-1 showed larger changes with CO
having the largest, then 2 hr, 24 hr and 7 days having the smallest. The 4250 – 5400
cm-1 showed the greatest spectral difference but the spectra in the 5400 – 7500 cm-1
region showed almost all profiles overlapping with practically no intensity
differences. The 2 hr objects showed the least changes due to the

192
Figure 6.9: PC1/PC2 Scores Plot: Comparison of Immersion Times of Bulk Hair in All Water Media (Sea, River, Dam)
= 2 Hours = 24 Hours = 7 Days = CO
193
effects of the immersion in a water medium. The smaller the difference was between a
spectrum from a sample which has been immersed in water in comparison to the
reference (CO), the less affected the hair sample was by the immersion process.
The difference spectra (Figure 6.8) highlight the major change in intensity between
the spectra in the 4000 - 5400 cm-1 region. The difference in intensity between 2 and
24 hr was smaller than that between 24 hr and 7 days in the 5200 cm-1 water band
region. This pattern of change was supported by the 7000 cm-1 OH str on a smaller
scale. Minor changes in intensity were observed in the remaining regions of the
spectrum. It was revealed that the 2 hr objects were the most similar to the CO ones as
they showed the least difference between spectra.
6.4.2 PCA - Effect of Immersion Time on Hair Treated in the Three Water Media
A PCA scores plot of the spectral objects from hair samples immersed in the three
water media is shown in Figure 6.9. The spectral objects generally occurred in groups
according to the immersion time of hair. The CO and 7 day spectral objects were well
separated. The CO objects were positive on PC1 and 2 whereas the 7 day objects were
negative on PC1 and 2. The 2 hr and 24 hr were somewhat overlapped and occurred
somewhere between the CO and 7 day groups, thus forming a general trend according
to immersion time.

194
Table 6.4: a) PROMETHEE Ranking of Immersion Times in All Water Media and b) Corresponding GAIA Plot of Immersion Times of All Water Media
= 2 Hours = 24 Hours = 7 Days = CO Table 6.4a Table 6.4b
Samples Phi Net Ranking BL7CLS2 0.5816 1 BL7CLD2 0.5459 2 BL7CLD3 0.5255 3 BL7CLR2 0.4439 4 BL7CLS3 0.4286 5 BL7CLS4 0.4286 6 BL7CLD1 0.3724 7 BL7CLR5 0.3316 8 BL7CLR4 0.3214 9 BL24CLR4 0.2959 10 BL7CLD4 0.2908 11 BL7CLS5 0.2704 12 BL7CLD5 0.2653 13 BL7CLS1 0.2551 14 BL24CLR3 0.1735 15 BL2CLS2 0.148 16 BL7CLR1 0.1122 17 BL24CLR5 0.1071 18 BLCLO2 0.0918 19 BL7CLR3 0.0255 20 BL24CLS2 0.0204 21 BL2CLS1 0.0102 22 BL24CLS3 0.0051 23 BL24CLD2 0 24 BL24CLR1 -0.0102 25 BL24CLS1 -0.0408 26 BLCLO5 -0.051 27 BL24CLR2 -0.0663 28 BL2CLS3 -0.0714 29 BL2CLR3 -0.0867 30 BL24CLD4 -0.0969 31 BL2CLR2 -0.1327 32 BLCLO4 -0.1327 33 BL2CLD4 -0.1531 34 BL2CLR1 -0.1582 35 BLCLO3 -0.1582 36 BL24CLD5 -0.199 37 BL24CLD1 -0.2398 38 BL2CLD2 -0.2449 39 BL24CLS4 -0.2551 40 BLCLO1 -0.3112 41 BL2CLD1 -0.3214 42 BL24CLD3 -0.3316 43 BL2CLR5 -0.3469 44 BL24CLS5 -0.3878 45 BL2CLS4 -0.4184 46 BL2CLD3 -0.4286 47 BL2CLR4 -0.4337 48 BL2CLD5 -0.4643 49 BL2CLS5 -0.5102 50

195
6.4.3 PROMETHEE Ranking of Immersion Times of Bulk Hair in All Water Media For the comparison of Immersion Times, the 7DAV sample was chosen as the
reference, as it was an average sample representing one of the three major groupings.
The ranking sense for the four PC variables was: PC1 was Minimised, PC2 was
Minimised, PC3 – Maximised and PC4 – Minimised. A PROMETHEE complete
ranking was then generated (Table 6.4a) using these parameters. The PROMETHEE
ranking produced similar results to the PCA scores plot of immersion times. Three
overall groupings have formed. The 7 day spectral objects ranked highest with the
most positive φ values and were generally well separated from the other objects.
However, the 2 and 24 hr objects have intermixed (φ = 0.17 to -0.38). The 2 hr
samples tended to rank lowest. Thus, the spectral objects showed a ranking trend of
chronological order of hair immersion time. The previous spectral comparison (Figure
6.8) relating to immersion time revealed that the 2 hr and 24hr objects were the most
similar to the CO ones as they showed the least difference between spectra.
The GAIA plot supported and explained the PROMETHEE ranking. It showed that
the CO group of objects has positive scores on PC1 as do apparently several 24 hr
spectral objects, which appear to be affected by the immersion. This again confirms
that the NIR spectra can be separated based on length of time and the chemometric
analysis of the chemical composition of hair.

196

197
This analysis suggests that PROMETHEE provides a successful analysis of separation
of treatments when applied to bulk hair. The combined methods of PCA and
PROMETHEE/GAIA each contribute to a useful method by cross checking each
others results.
6.5 Matching of Hair After Water Immersion
Previous experiments (Sections 6.4, 6.5 and 6.6) indicated that it may be possible to
match samples of collected hair which have been immersed in a water medium to its
origin. If this is indeed possible, then there are grounds for broader future research to
develop proof-of-concept for matching and discrimination of hair from DVI victims
and forensic crime scenes. In this part of the work, the matching and discrimination of
human hair after immersion in water is explored.
A sample from Individual 3 was randomly selected and treated by immersion in
Seawater for 24 hours. This immersion time period affected the hair in some way and
hence, it was chosen for this trial.
The protocol proposed in this work for matching of immersed hair is based on the
following argument:
1. Water is a constant variable throughout all analyses and is also the easiest to
identify in practice when presented with a cadaver. It could indicate location.
Therefore this variable was investigated first, while keeping the other factors
constant.

198
Figure 6.10: PC1/PC2 Scores Plot: Comparison of Unknown Sample to Reference Water Media
= River water = Seawater = Dam water = Unknown

199
2. The next question was the length of time the hair (and cadaver) was floating or
immersed in the water. With these known, an environmental profile and the
conditions of the hairs could be assessed.
3. Finally, the identification of the individual may then be attempted with the use
of appropriate reference hairs.
6.5.1.1 PCA – Identifying the Water Immersion Media
If the previous hypothesis of matching samples is accepted, it is expected that the
Unknown sample will group with the most likely reference group. In this work, the
randomly selected verification sample belonged to the hair immersed in Seawater.
PC1 accounted for 90.2% of total variance in the data and PC2 accounted for 6.8% of
data variance (Figure 6.10). The River water objects were separated (positive scores)
from the Unknown, Sea and Dam water spectral objects (negative scores) on PC1.
PC2 showed a trend with the Unknown, Sea and River objects (positive scores) and
then the Dam objects (negative scores) along this axis. This indicated that the three
types of water have been clearly discriminated and the Unknown was matched with
the correct reference group i.e. the spectral objects from hair samples treated in
Seawater. This suggests that the NIRS approach enables the matching of hair samples
which have been immersed in a water medium. As it is possible to match bulk hair
samples and successfully compare them to reference samples, this could indicate a
water media and location from which a cadaver was found and therefore could still be
potentially used for profiling an individual.

200
Table 6.5: PROMETHEE Ranking Comparison of Unknown Sample to Reference Water Media. a) Reference comparison without Unknown sample, b) Reference comparison with Unknown sample and c) Corresponding GAIA of water medium identification.
= River Water = Seawater = Dam Water = Unknown
Table 6.5a Table 6.5b
Table 6.5c
Sea Water Reference
Unknown Sample
Sample Phi Net RankingBR24CLS1 0.7143 1BR24CLS2 0.625 2BR24CLS3 0.5714 3BR24CLS4 0.2857 4BR24CLS5 0.25 5BR24CLR5 0.0357 6BR24CLR4 -0.1429 7BR24CLR2 -0.1786 8BR24CLD4 -0.2143 9BR24CLD3 -0.2321 10BR24CLR1 -0.3036 11BR24CLD5 -0.3214 12BR24CLR3 -0.3214 13BR24CLD1 -0.375 14BR24CLD2 -0.3929 15
Sample Phi Net RankingBR24CLS1 0.6579 1BR24CLS2 0.5395 2BR24CLS3 0.4211 3REFCL2 0.3421 4BR24CLS4 0.1316 5REFCL1 0.1316 6REFCL5 0.1053 7REFCL3 0.0921 8BR24CLS5 0.0526 9BR24CLR5 0.0263 10REFCL4 -0.0658 11BR24CLR4 -0.1053 12BR24CLD3 -0.1711 13BR24CLD4 -0.2105 14BR24CLR2 -0.2368 15BR24CLD5 -0.2895 16BR24CLD1 -0.3289 17BR24CLR1 -0.3553 18BR24CLD2 -0.3684 19BR24CLR3 -0.3684 19

201
6.5.1.2 PROMETHEE Analysis of Reference Comparison
The scores values of the corresponding PCA plot were imported into Decision Lab for
PROMETHEE and GAIA interpretations. The PROMETHEE method used for the
analysis of race and gender has been previously described (Chapter 2, Section 6.5.2)
and outlines of the methodology and parameters for the PROMETHEE analysis were
provided therein as well.
6.5.1.3 PROMETHEE Ranking – Identifying Water Immersion Media The spectral data matrix was analysed by PROMETHEE and GAIA. The PC variables
were modelled as previously described (Chapter 2, Section 6.5.2) but according to the
chosen reference sample, SAV, PC1 was set to Minimise, PC2 – Maximise, PC3 -
Maximise and PC4 – Maximise. Initially, PROMETHEE modelling involved only the
three reference sets of objects i.e. spectra from hair immersed in River, Sea and Dam
waters and then the Unknown sample was added to produce a comparative ranking.
A PROMETHEE ranking was produced to see the group separation between water
types without the interference of an Unknown sample (Table 6.5a). In this ranking,
three overall groupings have formed. This PROMETHEE gave an improved ranking
as compared to the immersion times investigation, with only slight mixing occurring.
The Seawater spectral objects ranked highest in the rankings between the φ net values
of 0.71 and 0.25.The River objects ranked between the φ net values 0.32 and -0.32
while the Dam objects ranked lowest between the φ net values of -0.21 and -0.39.
These three clusters were quite distinct and only two River objects have intermixed

202
Figure 6.11: PC1/PC2 Scores Plot: Comparison of Unknown Sample to Reference Immersion Times
= 2 Hours = 24 Hours = 7 Days = Unknown

203
with the Dam grouping. This ranking was then compared to a PROMETHEE ranking
including the Unknown objects (Table 6.5b). The placement of this Unknown into the
PROMETHEE ranking will identify the most similar grouping in regard to the
reference objects. When the Unknown was inserted, they intermixed between objects
of the Seawater object cluster. This indicates that the Unknown objects were most
similar to the Seawater reference. When cross-checked to the original data for
treatment of the Unknown, a correct match was found by both the PROMETHEE and
the original PCA (Figure 6.10).
The GAIA plot (Table 6.5c) reflected the PROMETHEE ranking by separating
spectral objects into three main groups and explaining 54.8% data variance.
6.5.2.1 PCA – Identifying the Length of Time of Water Immersion
The PC1/PC2 scores plot (Figure 6.11) of the reference analysis showed a clear
separation of the original reference spectral objects of 2 hr, 24 hr and 7 days. Separate
groupings were formed corresponding to the immersion times of the bulk hair.
When the Unknown sample was compared to the reference time samples, it was found
to overlap the 24 hr objects. This indicates a close similarity between the two objects.
PC1 accounts for 94.4% of total variance in the data and PC2 for 3.3%. The
Unknown, 2 and 24 hr spectral objects were separated (positive scores) from the 7 day
objects (negative scores) along the PC1 axis. PC2 then discriminated the Unknown
and 24 hr objects (negative scores) from the 2 hr objects along this axis. This
indicated a clear advantage as the PCA provides a viable method for the matching and
discrimination of spectral objects. 97.7% of data variance was described by PC1 and
PC2.When cross-checked to the original data, the Unknown was found to be a correct
match.

204
Table 6.6: PROMETHEE Ranking Comparison of Unknown Sample to Reference Immersion Times. a) Reference comparison without Unknown sample b) Reference comparison with Unknown sample and c) Corresponding GAIA of immersion length identification.
= 2 Hour = 24 Hour = 7 Day = Unknown
Table 6.6a Table 6.6b
Table 6.6c
24 Hour Reference
Unknown Sample
Samples Phi Net RankingBR24CLS5 0.7857 1BR24CLS3 0.4286 2BR24CLS4 0.4286 2BR24CLS2 0.2857 3BR24CLS1 0.2143 4BR7CLS4 -0.0357 5BR7CLS3 -0.0714 6BR2CLS3 -0.0893 7BR7CLS5 -0.1429 8BR2CLS5 -0.2143 9BR7CLS1 -0.25 10BR2CLS2 -0.2857 11BR2CLS4 -0.3036 12BR2CLS1 -0.3571 13BR7CLS2 -0.3929 14
Samples Phi Net RankingBR24CLS5 0.6842 1REFCL3 0.3421 2BR24CLS3 0.3421 3BR24CLS4 0.3158 4BR24CLS2 0.2105 5REFCL2 0.2105 5REFCL4 0.1711 6BR24CLS1 0.1579 7REFCL5 -0.0526 8REFCL1 -0.0789 9BR7CLS4 -0.0789 10BR2CLS3 -0.1447 11BR7CLS3 -0.1579 12BR7CLS5 -0.1579 12BR2CLS5 -0.2105 13BR7CLS1 -0.25 14BR2CLS2 -0.2632 15BR2CLS4 -0.3289 16BR2CLS1 -0.3421 17BR7CLS2 -0.3684 18

205
This analysis could potentially be applied to real crime or disaster scenarios, as it is
possible to match bulk hair samples with the to reference samples. This could indicate
the length of time for which a cadaver has been immersed in water.
6.5.2.2 PROMETHEE Ranking - Identifying the Length of Time of Water Immersion For the comparison of reference immersion times to an Unknown sample, the 24AV
sample was chosen as the reference, as it was an average sample representing one of
the three major groupings. The ranking contained four PC’s from the corresponding
PCA (Figure 6.12). PC1 was Maximised, PC2 was Minimised, PC3 – Maximised and
PC4 – Maximised. The PROMETHEE ranking was generated using these parameters.
A PROMETHEE ranking was produced to see the group separation of objects with
different immersion times without the interference of an Unknown sample (Table
6.6a). In this ranking, three overall groupings have formed. The 24 hr spectral objects
ranked highest in the rankings between the φ net values of 0.78 and 0.21. The 7 day
objects ranked mostly between the φ net values -0.03 and -0.25 while the 2 hr objects
ranked lowest between the φ net values of -0.08 and -0.35. These three clusters show
some intermixing of objects.
This ranking was then compared to a PROMETHEE ranking including the Unknown
objects (Table 6.6b). The placement of this Unknown into the PROMETHEE ranking
will identify which sample is the most similar in regard to the reference samples.
When the Unknown was inserted, they mixed between objects of the 24 hr cluster.

206
Figure 6.12: PC1/PC2 Scores Plot: Comparison of Unknown Sample to Reference Individuals
= Individual 1 = Individual 2 = Individual 3 = Unknown
207
This indicates that the Unknown sample is closest to the 24 hr reference. When cross-
checked with the original data, it was found that a correct match was achieved
through the use of PROMETHEE.
The GAIA plot (Table 6.6c) reflected the PROMETHEE ranking by separating
individuals into three more or less main groups. The GAIA plot accounted for 64.7%
data variance. This analysis indicates that PROMETHEE can match and discriminate
spectral objects of hair samples immersed for different time periods.
6.5.3.1 PCA – Identifying an Individual
The PC1/PC2 scores plot (Figure 6.12) showed a clear separation of the original
reference samples of Individuals 1, 2 and 3. When the Unknown spectral objects were
compared to the reference Individuals spectral objects, they were found to overlap
with Individual 3. This indicates close similarity between the two samples. PC1
accounted for 95.7% of total variance in the data and PC2 accounted for 3.3%. The
discrimination of spectral objects was mainly along the PC1 axis. Spectral objects
from Individuals 1 and 2 were separated (positive scores) from the Unknown and
Individual 3 objects (negative scores, PC1) along this axis. When cross-checked with
the original data of treatment to the Unknown object, it was found to be a correct
match. This analysis could potentially be applied to real crime or disaster scenarios, as
it is possible to match bulk hair samples and successfully compare them to reference
samples. If a reference sample could be retrieved from an individual’s home and used
as a reference, then this sample could be compared to the trace evidence found at a
crime or disaster scene. This implies that a hair could potentially be matched back to
an individual without the use of DNA.

208
Table 6.7: PROMETHEE Ranking Comparison of Unknown Sample to Reference Individuals. a) Reference comparison without Unknown sample b) Reference comparison with Unknown sample and c) Corresponding GAIA of Individual identification.
= Individual 1 = Individual 3 = Individual 2 = Unknown
Table 6.7a Table 6.7b
Table 6.7c:
Individual Reference
Unknown Sample
Sample Phi Net RankingBLCLO3 0.5714 1BLCLO4 0.5357 2BLCLO5 0.3929 3RCLO4 0.2857 4BLCLO2 0.2143 5BLCLO1 0.0714 6RCLO1 0.0714 6RCLO2 -0.0714 7RCLO3 -0.1429 8RCLO5 -0.1429 9BRCLO5 -0.2143 10BRCLO2 -0.2143 11BRCLO1 -0.3571 12BRCLO3 -0.5 13BRCLO4 -0.5 13
Sample Phi Net RankingBLCLO3 0.6842 1BLCLO4 0.6579 2BLCLO5 0.5526 3BLCLO2 0.4211 4BLCLO1 0.3158 5RCLO4 0.3158 6RCLO1 0.0526 7RCLO2 -0.0526 8BRCLO5 -0.1053 9RCLO3 -0.1053 9REFCL2 -0.1053 9BRCLO2 -0.1053 10RCLO5 -0.1053 10BRCLO1 -0.2632 11REFCL5 -0.2632 11REFCL3 -0.3158 12REFCL4 -0.3158 12BRCLO3 -0.4211 13BRCLO4 -0.4211 13REFCL1 -0.4211 13

209
6.5.3.2 PROMETHEE Ranking – Identifying an Individual For the comparison of reference spectral objects from different Individuals to an
Unknown sample, the BLAV spectral object was chosen as the reference, as it was an
average sample representing one of the three major spectral object groupings. The
data matrix consisted of three PC’s from the corresponding original PCA (Figure
6.13). PC1 was Maximised, PC2 – Maximised. PC3 was found to interfere with the
discrimination of samples and was therefore removed for this analysis. The
PROMETHEE ranking was generated using these parameters.
A PROMETHEE ranking was produced to facilitate the group separation of spectral
objects of different individuals (Table 6.7a). In this ranking, three generally well
formed groups were produced, and each distinct group represented an individual. The
spectral objects of Individual 1 ranked highest between the φ net values of 0.57 and
0.07; for Individual 2 the φ net values were between 0.07 and -0.14, while Individual
3 ranked lowest with the φ net values between -0.21 and -0.50. Only one object from
Individual 2 was out of order. When the Unknown spectral object was included for
ranking, it was generally located with the Individual 3 spectral objects cluster (Table
6.7b). This was found to be the correct match and was highlighted by the
PROMETHEE and PCA methods.
The GAIA plot (Table 6.7b) reflected the PROMETHEE ranking by separating
individuals into three main groups; this was similar to the result of the original PCA.
The GAIA plot described about a 100% ∆ value. The Unknown spectral objects again

210
211
overlapped with the Individual 3 hair spectra indicating their close similarity. The
GAIA plot indicates that Individuals can be discriminated on the basis of their NIR
spectra, and shows once more that the method is useful for matching and
discrimination of hair samples.
6.6 Conclusions: Studies of Immersed Hairs
Water is an important factor to consider in forensic science as it is a common
substance present at crime and disaster scenes e.g. at home and is also common
outdoors in the sea, river, canal, puddles and especially during crime and DVI
incidents. Therefore the effect of water upon samples and spectra was a vital
component to the analysis.
It was established that the surface of a hair fibre is different from its original state
after an IAEA cleaning treatment. However, if a treatment method were compared to
a control sample, that has only undergone the cleaning process, a better match could
be achieved. After the IAEA cleaning procedure was applied to the samples which
have been immersed in water, they showed more comparable spectral profiles than the
samples that were not cleaned. This indicated that a cleaning treatment was an
important part of the methodology for comparing hair fibres after immersion in water.
An optimised hair bundle drying method was also an essential component for this
procedure.
The spectral analysis of human hair involving different water sources and immersion
times revealed that each variable contributed to differences in spectra. This was a
result of the various water sources being characterised by its soil and vegetable

212

213
matter, dissolved salt content and suspended solids. These different compositions
caused different changes in the hair fibre, and the chemometric analysis of the spectral
object was able to highlight the differences in relation to appropriate reference
samples.
From the previous experiments (Sections 6.4, 6.5 and 6.6) the results indicated that it
may be possible to match samples of collected hair to its origin after the hair has been
immersed in a water medium. This allowed for the development of hair research for
proof-of-concept in a forensic context. A protocol was therefore developed which
indicated that after a sample had been immersed in a water medium, the sample was
thereafter able to be matched to reference field samples. The chemometric analysis
successfully identified the water source, length of immersion time and the individual
from which the sample was derived after the water treatment.
The combined methods of PCA, Fuzzy clustering and PROMETHEE each contribute
to an accurate and reliable method by cross checking the result that each has given.
This method can provide information such as treatment of hair which have been
applied to the hair sample.

214

215
Chapter 7: Concluding Remarks This novel NIRS study showed there is high potential for the matching and
discrimination of human hair from Forensics and Disaster Victim Identification
scenarios. It was found that Near Infrared Spectroscopy, with the use of an optical
probe and chemometrics, can successfully match and discriminate bulk hair samples
to build a profile for the possible application at a crime or disaster scene.
Preliminary analyses were required in order to optimise the experimental conditions
and showed that:
• 15-30 hairs per bundle were required to produce a useful spectrum
• a suitable sampling method was required to achieve spectral repeatability to
represent a human hair sample.
Investigation of hair spectra and Chemometrics data from Gender and Race studies
showed that:
• spectral differences are due to intensity differences rather than frequency shifts
• Mongoloid samples can be discriminated from Caucasian ones
• males can be discriminated from females
• the identification of untreated samples that have actually undergone a light
dyeing process can interfere with the analysis.

216

217
Spectral work on treated hair showed that:
• the combination of different spectral regions, NIR (fibre protein structure) and
Visible NIR (melanin pigmentation) provided new information and a novel
approach to such hair studies
• the two regions can discriminate samples of Dyed, Bleaching and Untreated
hair
• the combination of two regions is facilitated by using a composite instrument
such as the Nicolet Nexus which measures scans simultaneously.
Importantly, in the DVI context, an NIRS method was developed which allowed for
matching and discrimination hair samples that have been immersed in water.
For improved comparable methods between field and references samples, preliminary
methods were developed such as:
• the application of a modified IAEA cleaning process to remove debris and
oils.
• a 15min drying process to remove excess water from the hair bundle post-
immersion
Environmental factors affecting a hair bundle in a disaster situation must be identified
and discriminated in order to build a story of what occurred at a crime or disaster
scene. The research successfully discriminated factors such as:
• water from three separate sources, Sea, River and Dam
• length of time a hair bundle has been immersed in the water, 2 hours, 24 hours
and 7 days

218

219
Immersed hair bundles can still be matched and discriminated to an unknown field
reference sample based on factors such as:
• type of water
• length of time a sample has been immersed
• matching of hair back to its original source subject
There are many factors in the analysis of human scalp hair which are still open to
investigation for future work. These factors must also be acknowledged for their
potential to influence the data and/or change a hair’s physical or chemical structure.
Their influence may therefore lead to further data anomalies in the spectral and
chemometric analyses. For future work, it is also vital that the bearing of these factors
and anomalies be recognised for further reliability and validation of the NIR and
chemometric analysis of human scalp hair. Some of the factors may be caused by
natural occurrences such as the affects of sun bleaching to alter the colour of only
specific parts of the hairs. Others may be chemical, such as shampoos and
conditioners with their differing ability to penetrate into the hair and also the affects
of the hundreds of different brands available for store purchase.
The NIR region coupled with the UV also shows great potential which may also be
further explored for its capabilities when applied to human scalp hair. The capabilities
of Near Infrared Spectroscopy in regard to environmental media may also be further
investigated by immersing hairs into different media such as soil, sediments, diverse
vegetation and varying time increments. A larger database of samples would also
reaffirm the results. This would reaffirm the methods discriminating ability even after

220

221
an immersion process. A larger database would also test the limits of matching
individuals as a form of identification for statistical robustness.
This is a novel investigation of human scalp hair in forensic context. It has the
potential for analysis on or at crime and disaster scenes with the use of a portable NIR
instrument and optical probe. It is especially useful in Disaster Victim Identification
and the building of a profile of a person. The spectral interpretation by chemometrics
can provide characteristics such as Gender, Race, hair treatment either dyed or
bleached. The technique can identify a water source and length of immersion time in a
water medium and importantly discriminate human hair bundles after immersion in
water. Having said this, it is recognised that the studies are indicative only although in
many instances they provide a sound foundation upon which specific forensic
applications may be developed.

222

223
References 1. Josefi, M., Handbook of Forensic Science, U.S. Government Printing Office, Washington D.C., 1994. 2. Saferstein, R., Forensic Science Handbook Vol III, Prentice Hall, New Jersey, 2002. 3. National Research Council, US National Academy of Sciences Report, Washington DC, 18 Feb 2009 4. Saferstein, R., Criminalistics – An introduction to Forensic Science, Prentice Hall, New Jersey, 1995 5. Phillips, J.H., Bowen, J.K., Forensics and the Expert Witness, The Law Book Company, North Ryde, 1989 6. Deedrick, D., Hairs, Fibres, Crime, and Evidence, Forensic Science Communications, Vol 2, 3, 2000. 7. Feughelman, M. Mechanical Properties and Structure of Alpha-Keratin Fibres: Wool, Hair and Related Fibres, Sydney, UNSW Press, 1997, 1-27. 8. Kokot, S., Keratin, Encyclopedia of Materials: Science and Technology, Elsevier, 2001 4363 - 4368 9. Valkovic, V., Human Hair: Volume 1, Fundamentals and Methods for Measurement of Elemental Composition, CRC Press, Florida, 1988, 39 - 58. 10. Robertson, J., Forensic Examination of Hair, London, Taylor and Francis, 1991 11. Zviek, C., The Science of Hair Care, Marcel Dekker Inc, Basel, 1986, 15 12. Johnson, D., Hair and Hair Care, Helen Curtis Inc, New York, 1997, 1 - 31. 13. Jones, L., Hair Structure Anatomy and Comparative Anatomy, Clinics in Dermatology, Elsevier, 2001, 19, 95 - 103 14. Rowe, W., Biodegredation of Hairs and Fibers, CRC Press, 1997, LLC 15. Daniels, G., Digestion of Human Hair Keratin by Microsporum Canis Bodin, Journal of Mircrobiology 8, 289 - 294. 16. Zonderman, J., Beyond the Crime Lab, John Wiley & Sons, New York, 1999,45 - 49

224

225
17. Bisbing, R., Forensic Identification and Association of Human Hair, Vol I, Prentice Hall, New Jersey, 2002, 204 – 208 18. Robbins, C.R., Chemical and Physical Behaviour of Human Hair, Springer Verlag, New York, 1994 19. Hopkins, J., Brenner, L., Turmosa, C.S., Forensic Science International, 1991, 50, 61 - 65 20. Wilson, A.S., Edwards, H.G.M., Farwell, D.W., Janaway, R., Evaluation as a Non-desructive Technique for Studying the Degradation of Human Hair From Archaelogical and Forensic Environements, J. Raman Spectroscopy, 1999, 30, 367 – 373 21. Serowik, J.M., Rowe, W.F., Biodeterioration of Hair in a Soil Environment, In Biodeterioration Research 4. Llewellyn, G.C., Dashek, W.V., O’Rear, C.E, Plenum Press, New York, 87 - 93 22. Kupferschmid, T.D., Van Dyke, R., Rowe, W.F., Scanning Electron Microscope Studies of the Biodeterioration of Human Hair Buried in Soil and Immersed in Water, In Biodeterioration Research 4. Llewellyn, G.C., Dashek, W.V., O’Rear, C.E, Plenum Press, New York, 479 - 491
23. Wilson, A.S., Janaway, R.C., Pollard, A.M. Dixon R.A., Tobin D.J., Survival of Human Hair - The Impact of the Burial Environment. Proceedings Human Remains, Conservation, Retrieval and Analysis, Colonial Williamsburg, Virginia
24. Orfanos, C.E., Montagna, W., Stuettgen, G., Hair Research, Springer Verlag, Germany, 1981, 101 – 107 25. Spearman R.I.C., The Physiology and Pathophysiology of the Skin, The Hair Follicle, Acedemic Press, London, 4, 1418 – 1456 26. Ryder, M.L., Hair, Institute of Studies in Biology No. 41, Edward Arnold Publishers, London, 1973, 24 - 26 27. Evans, C., The Casebook of Forensic Detection, John Wiley and Sons, New York, 1996. 28. Block, E. B., Science vs. Crime: The Evolution of the Police Lab, Cragmont Publications, 1979. 29. Pinkney, J., Great Australian Mysteries, The Five Mile Press, Australia, 2003. 30. Hopkins, J., Brenner, L., Tumosa C.S., Forensic Science International 50, 1991, 61-65

226

227
31. Kvaal, S.I., Collection of Post Mortem Data: DVI protocols and quality assurance’, Forensic Science International Short Communication, 159S, 12 - 14. 32. Bailey-Wilson, J., Ballantyne, J., Baum H., DNA Identification in Mass Fatality Incidents, National Institute of Criminal Justice, 2006. 33. De Valck, E., Short Communication Major Incident Response: Collecting ante-mortem data, Forensic Science International, 2006, 159, 15 - 19 34. Houck, M., Trace Evidence Analysis, Elsevier, 2004, Italy, 124 - 157 35. Panayiotou, H. & S. Kokot, Matching and discrimination of single human-scalp hairs by FT-IR micro-spectroscopy and chemometrics, Analytica Chimica Acta, 1999, 392(2-3), 223 - 235. 36. Paris, B., Vibrational Spectroscopy of Human Hair with Forensic Application. School of Physical and Chemical Sciences, Queensland University of Technology, Brisbane, 1998 37. Cazes, J., Ewings Analytical Instrumentation Handbook 3rd edition, Marcel Dakker, NY, 2005, 163 - 238. 38. Skoog. D, Holler. J, Crouch. S, Principles of Instrumental Analysis, 6th Edition, Thomson, 2007, 430- 433, 481 - 497. 39. Smith, B., Fundamentals of Fourier Transform Infrared Spectroscopy, CRC Press, 1996, 15- 53. 40. Suetaka, W., Surface Infrared and Raman Spectroscopy, Plenum Press, 1995, 117-137, 187 – 197. 41. Vickerman, J.C., Surface Analysis; The Principle Techniques, Chichester, John Wiley and Sons, 1997 42. Lowry, S., McCarthy, B., Magnuson, E., Verifying the Performance of the Fiber Optic Reflectance Probe on the Antaris™ FT-NIR Analyzer, Thermo Nicolet Industrial Solutions, Madison, WI, USA, 9/01 43. Ryabukhin, Y.R., Report of the Advisory Group on the Applications of Nuclear Methods in Environmental Research, IAEA, 1976 44. Sullivan, R.W., The Effects of Acetone Sonication On Human Hair Fibres, PCB604 Project, QUT, 2005 45. Meloun, M., Militky, J., Forina, M., Chemometrics for analytical chemistry, Ellis Horwood, New York, 1992, 213 – 225

228

229
46. Signori, V., Lewis, D.M., FTIR Investigation of the Damage Produced on Human Hair by Weathering and Bleaching Processes: Implementation of Different Sampling Techniques and Data Processing, International Journal of Cosmetic Science, 1997, 19, 1 – 13 47. Thielemans, A., Massart D.L., The use of principal component analysis as a display method in the interpretation of analytical chemical, biochemical, environmental and epidemiological data, Chimica 1985, 39, 236-242. 48. Gilbert, C., Kokot, S., Meyer, U., Application of DRIFT Spectroscopy and Chemometrics for the Comparison of Cotton Fabrics, Applied Spectroscopy, 1993, 47, 741 - 747 49. Adams, M.J. Chemometrics in Analytical Spectroscopy, Royal Society of Chemistry, Cambridge, 2004 50. Keller, H.R., Massart, D.L., Brans, J.P., Multicriteria Decision Making: A Case Study, Chemometrics and Intelligent Laboratory Systems, 1991, 11, 175 - 189 51. Kokot, S., Ayoko, G.A., Multicriteria Decision Making, Elsevier, 2005, 40 -45
52. Purcell, D.E., Leonard, G.J., O’Shea, M.G., Kokot, S., A Chemometrics Investigation of Sugarcane Plant Properties Based on the Molecular Composition of Epicuticular Wax, Chemom. Intel. Lab. Syst. 2005, 76, 135 – 147
53. Miyamae, Y., Yamakawa, Y., Ozaki, Y., Evaluation of Physical Properties of Human Hair by Diffuse Reflectance Near Infrared Spectroscopy, Applied Spectroscopy, 2007, 61, 212 - 217 54. Ozaki, Y., Miura, T., Sakurai, K., Matsunaga, T., Nondestructive Analysis of Water Structure and Content in Animal Tissues by FT-NIR Spectroscopy with Light Fiber Optics. Part 1: Human Hair, Applied Spectroscopy, 1992, 46, 875 - 878 55. Zoccola, M. Mossotti, R. et al, Near Infrared Spectroscopy as a Tool for the Determination of Eumelanin in Human Hair, Pigment Cell res, 2004, 17, 379 – 385 56. Greenberg, A., Breneman, C.M., Liebman, J.F., The Amide Linkage: Structural Significance in Chemistry, Biochemistry, and Materials Science, Wiley-IEEE, 2002 57. Wolfram, L., Journal of Acad Dermatology, 2003, 48, S106 – S114 58. Barton, P., PHD, Queensland University of Technology, 2009 59. Søsted, H., Hesse, U., Menné, T., Andersen, K.E., Johansen, J.D, Contact dermatitis to hair dyes in a Danish adult population: an interview-based study, British Journal of Dermatology, 2005, 153, 1, 132 - 135

230

231
60. Shenk, J.S., Workman, J.J., Westerhaus, M. O., Application of NIR Spectroscopy to Agriculture Products, In: Burns DA, Ciurczak EW, eds, Handbook of Near Infrared Analysis, Marcel Dekker, New York, 1972 61. Valkovic, V., Human Hair: Volume 2, Trace Element Levels, CRC Press, Florida, 1989, 139 – 143 62. Pande, C., Yang, B., Near Infrared Spectroscopy: Applications in hair research, J. Cosmet. Sci., 51, 183 – 192.
