ne - dbs bank | singapore ne 10 sector b beyond the hype ... streaming movies and tv shows. ... (vc)...
TRANSCRIPT
DBS Group Research • March 2015DBS Asian Insights10n
um
ber
SECTOR BRIEFING
Beyond the Hype Digital Start-Ups:
Key Questions, Trends, Metrics, and Business Models

DBS Asian Insights SECTOR BRIEFING 1002
0304
07
1719
25
Introduction
Three Digital Business Models Direct Monetisation Model Indirect Monetisation Model Freemium model
Seven Key Metrics For Would-Be Investors Is the Virality Coefficient Above 1?
Are Operating Metrics Indicating High User Engagement?
How is the Progress On Mobile Monetisation?
Is the Conversion Rate High?
How Much is the Customer Churn Rate?
How Much is the Customer Acquisition Cost?
Is the Company Differentiated Enough to Become a Category Leader?
How to Value Digital Companies Traditional Metrics for Companies Monetising User Base
Three Singapore-Born Start-UpsTheir Monetisation Strategies and How the Seven Metrics Apply
TradeHero Paktor Chope
Conclusion

Introduction ow long should a new digital company take to turn a profit? Most do not face the massive upfront costs that burden traditional enterprises, such as manufacturing or logistics. So, it is tempting to expect any digital start-up worth its salt to start churning out profits instantly. After all, who hasn’t heard tales of geeky college dropouts
becoming overnight tycoons after writing breakthrough software codes or devising killer apps in their suburban bedrooms and garages?
But look beyond the hype, and you will see most digital start-ups fail. Often it is because the sector’s low-cost entry barriers act as a double-edged sword. Almost anyone with a “good” idea can get into the game, and optimistic would-be digital entrepreneurs launch new enterprises all the time. But while it is easy to launch, it can often be easier to crash and burn. And, with so many players out there, the competition for clicks and cash can be fierce.
Those who succeed are those who can beat out their rivals by building huge subscriber or user bases on their proprietary platforms. The need for this type of scale is very high and often cuts across national boundaries. The more users or subscribers that a digital company amasses, the more chance it has of fending off potential rivals. For this reason, the pursuit of monetisation, at least in the early stages, is often sacrificed in the chase for bigger audience share.
Take for example the social media giant, Twitter. It dominates the global market with almost 300 million monthly active users. Yet it took almost eight years to turn its first profit. Monetisation can also be fleeting when fashions and habits change, or when a “copycat” rival takes your great idea and makes it even better. Audiences can be fickle, shunning a once favourite platform and clicking on competing providers.
As a new digital company navigates across all these challenges it must balance growth and revenue over time. True, the digital world is fast-paced. But, as in most investment environments, profitability needs perseverance and a strong business model.
DBS Asian Insights SECTOR BRIEFING 10
03
Beyond the Hype Digital Start-Ups:
Key Questions, Trends, Metrics, and Business Models
H
Sachin MittalSenior Vice PresidentEquity [email protected]
Produced by:Asian Insights Office DBS Group [email protected]

Three Digital Business Models
Direct Monetisation Model
Here users must pay for using the product. This model is generally built around proven solutions for customers who are happy to subscribe to gain access to the benefits. When a new product is launched, many companies might offer it free of cost for an initial and limited period so that customers can first understand the product’s benefits.
Online content players, such as Netflix, charge a fixed monthly subscription fee for streaming movies and TV shows. In other cases, e-commerce player eBay charges sellers, and cloud computing players like Amazon charge users on the basis of volume. In a third variant, mobile messaging player LINE and social gaming player Zynga sell virtual goods to their users.
DBS Asian Insights SECTOR BRIEFING 1004
IndirectMonetisation
YouTube:Online Video
Alibaba: Online Marketplace
FaceBook:Social Network
Amazon WebServices: CloudComputing
Skype: InternetMessenger
Dropbox: Cloud Storage
LinkedIn: Professional Network
Rakuten: Online Retail
Netflix:Online Video
Users do not have topay for product/service
Free + PremiumFree basic services +
pay for premium featuresUsers have to
pay for product/service
Freemium DirectMonetisation
Indirect Monetisation Model
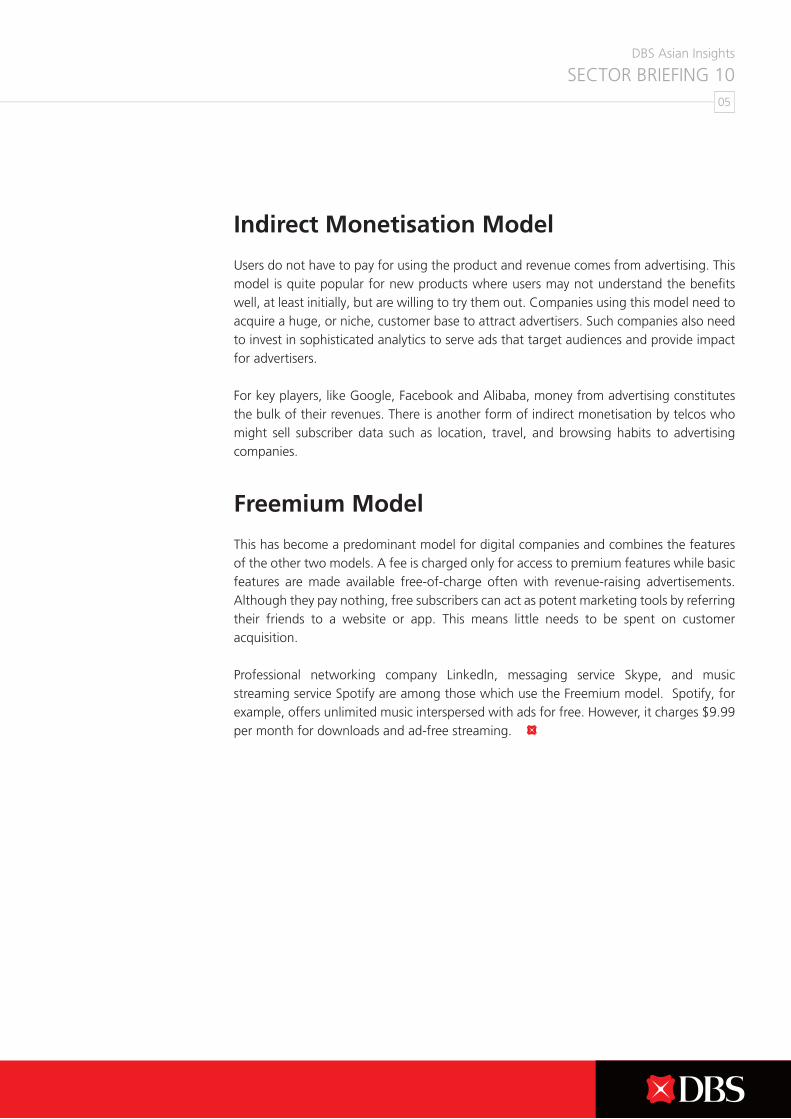
Users do not have to pay for using the product and revenue comes from advertising. This model is quite popular for new products where users may not understand the benefits well, at least initially, but are willing to try them out. Companies using this model need to acquire a huge, or niche, customer base to attract advertisers. Such companies also need to invest in sophisticated analytics to serve ads that target audiences and provide impact for advertisers.
For key players, like Google, Facebook and Alibaba, money from advertising constitutes the bulk of their revenues. There is another form of indirect monetisation by telcos who might sell subscriber data such as location, travel, and browsing habits to advertising companies.
Freemium Model
This has become a predominant model for digital companies and combines the features of the other two models. A fee is charged only for access to premium features while basic features are made available free-of-charge often with revenue-raising advertisements. Although they pay nothing, free subscribers can act as potent marketing tools by referring their friends to a website or app. This means little needs to be spent on customer acquisition.
Professional networking company Linkedln, messaging service Skype, and music streaming service Spotify are among those which use the Freemium model. Spotify, for example, offers unlimited music interspersed with ads for free. However, it charges $9.99 per month for downloads and ad-free streaming.
DBS Asian Insights SECTOR BRIEFING 10
05

DBS Asian Insights SECTOR BRIEFING 1006
Seven Key Metrics For Investors
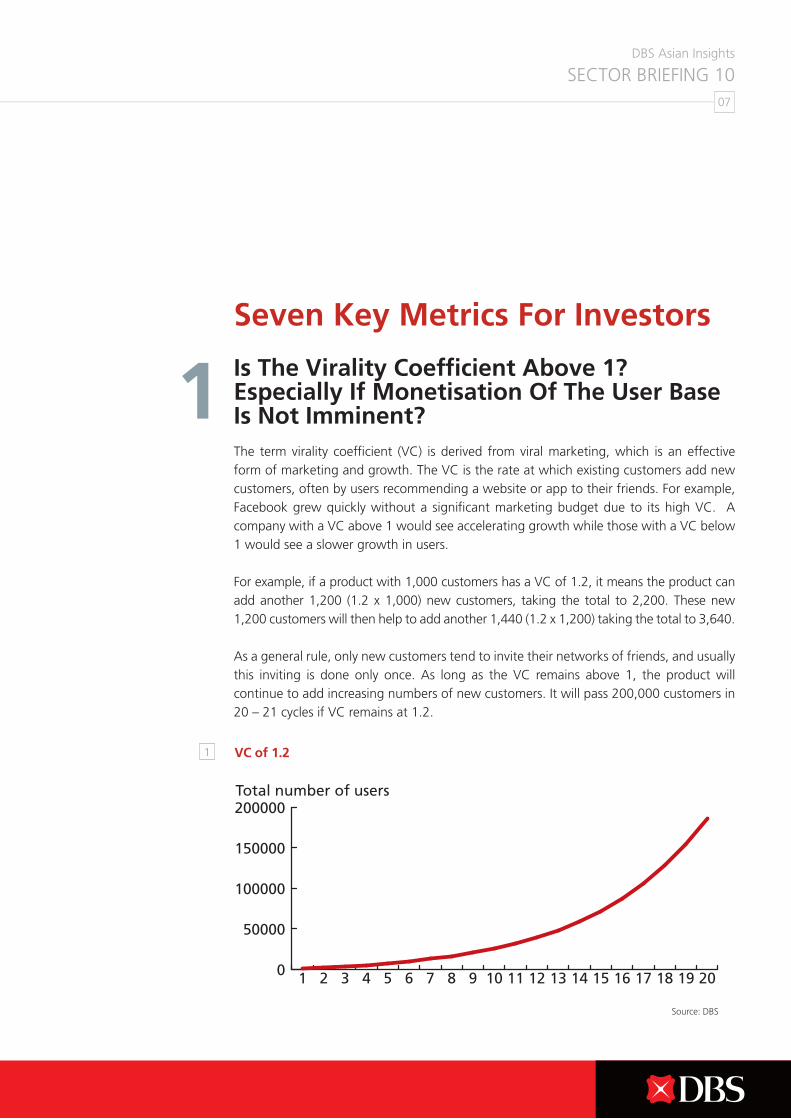
Is The Virality Coefficient Above 1? Especially If Monetisation Of The User Base Is Not Imminent?The term virality coefficient (VC) is derived from viral marketing, which is an effective form of marketing and growth. The VC is the rate at which existing customers add new customers, often by users recommending a website or app to their friends. For example, Facebook grew quickly without a significant marketing budget due to its high VC. A company with a VC above 1 would see accelerating growth while those with a VC below 1 would see a slower growth in users.
For example, if a product with 1,000 customers has a VC of 1.2, it means the product can add another 1,200 (1.2 x 1,000) new customers, taking the total to 2,200. These new 1,200 customers will then help to add another 1,440 (1.2 x 1,200) taking the total to 3,640.
As a general rule, only new customers tend to invite their networks of friends, and usually this inviting is done only once. As long as the VC remains above 1, the product will continue to add increasing numbers of new customers. It will pass 200,000 customers in 20 – 21 cycles if VC remains at 1.2.
DBS Asian Insights SECTOR BRIEFING 10
07
0
5000
10000
15000 VC of 0.9
5045403530252015105
0
0
5000
10000
5000
-5000
10000
-10000
0
-6000
-5000
-4000
-3000
-2000
-1000
1000
15000
15000
5045403530252015105
0
50000
100000
150000
200000Total number of users
Total number of users
$
$
Time
Customer Aquisition Cost
Customer Aquisition Cost
License Revenue
Subscription Revenue
Time
Month 2Month 1
Mo
nth
1
Mo
nth
2
Mo
nth
3
Mo
nth
4
Mo
nth
5
Mo
nth
6
Mo
nth
7
Mo
nth
8
Mo
nth
9
Mo
nth
10
Mo
nth
11
Mo
nth
12
2019181716151413121110987654321
1 VC of 1.2
1
Source: DBS
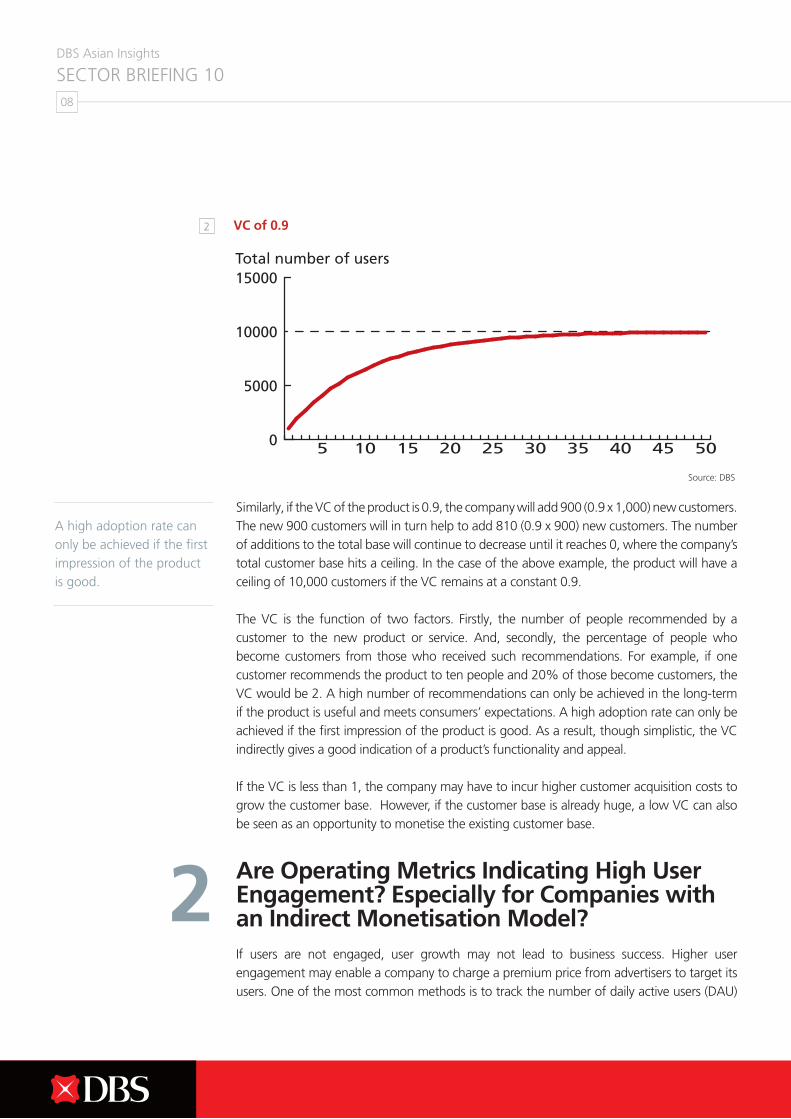
Similarly, if the VC of the product is 0.9, the company will add 900 (0.9 x 1,000) new customers. The new 900 customers will in turn help to add 810 (0.9 x 900) new customers. The number of additions to the total base will continue to decrease until it reaches 0, where the company’s total customer base hits a ceiling. In the case of the above example, the product will have a ceiling of 10,000 customers if the VC remains at a constant 0.9.
The VC is the function of two factors. Firstly, the number of people recommended by a customer to the new product or service. And, secondly, the percentage of people who become customers from those who received such recommendations. For example, if one customer recommends the product to ten people and 20% of those become customers, the VC would be 2. A high number of recommendations can only be achieved in the long-term if the product is useful and meets consumers’ expectations. A high adoption rate can only be achieved if the first impression of the product is good. As a result, though simplistic, the VC indirectly gives a good indication of a product’s functionality and appeal.
If the VC is less than 1, the company may have to incur higher customer acquisition costs to grow the customer base. However, if the customer base is already huge, a low VC can also be seen as an opportunity to monetise the existing customer base.
Are Operating Metrics Indicating High User Engagement? Especially for Companies with an Indirect Monetisation Model?If users are not engaged, user growth may not lead to business success. Higher user engagement may enable a company to charge a premium price from advertisers to target its users. One of the most common methods is to track the number of daily active users (DAU)
DBS Asian Insights SECTOR BRIEFING 1008
2
0
5000
10000
15000 VC of 0.9
5045403530252015105
0
0
5000
10000
5000
-5000
10000
-10000
0
-6000
-5000
-4000
-3000
-2000
-1000
1000
15000
15000
5045403530252015105
0
50000
100000
150000
200000Total number of users
Total number of users
$
$
Time
Customer Aquisition Cost
Customer Aquisition Cost
License Revenue
Subscription Revenue
Time
Month 2Month 1
Mo
nth
1
Mo
nth
2
Mo
nth
3
Mo
nth
4
Mo
nth
5
Mo
nth
6
Mo
nth
7
Mo
nth
8
Mo
nth
9
Mo
nth
10
Mo
nth
11
Mo
nth
12
2019181716151413121110987654321
2 VC of 0.9
Source: DBS
A high adoption rate can only be achieved if the first impression of the product is good.
DBS Asian Insights SECTOR BRIEFING 10
09
divided by monthly active users (MAU). For example, DAU to MAU for Facebook has been reported to be over 60%. This indicates that over 60% of its users access Facebook every day.
There is also a need to track industry-specific operating metrics. A social networking site needs to know if its users are spending more time on the site, and which activities they like to spend more time on. Both factors can determine what related ads should be displayed. For an internet radio service, such as Pandora, user listening hours can help determine ad revenue. For an internet video streaming service, such as Netflix, the amount of new content added each month will help determine if users will want to pay ongoing subscription fees.
YouTube, a leader in online video, benefits from advertising revenues. The company earned more than US$5 billion in ad revenues in 2013 and this is growing strongly. It has more than 1 billion unique visitors per month, making it one of the digital world’s most engaged viewer communities. Viewing time increased from 4 billion hours in September 2012 to 6 billion hours by mid-2014. These types of operating metrics shed key insights on these companies.
How is the Progress on Mobile Monetisation? Especially for Companies with an Indirect Monetisation Model?People are spending more time on their smartphones nowadays, and that means more ads can be served on such mobile devices. This has led to intense competition among Google, Facebook and Yahoo. Each is trying to extend its reach into third party mobile apps. However, the big challenge is that mobile’s CPM is the lowest among all online advertising formats.
CPM stands for “Cost per Mille”, which simply put, is the price a client pays to get a thousand views of its advertisement. Average CPMs in traditional media tend to be well above US$10, while online CPMs tend to be below US$5. Mobile CPMs can be even lower at around US$1. Programmatic buying is being increasingly used by publishers to sell not just remnant inventory, but also premium inventory. Automation means buyers of inventory are able to achieve access to premium placements rapidly, and without the need to commit to large amounts of spend. This makes inventory-buyers more powerful due to their superior reach.
Due to the shift to mobile and programmatic buying, the transition from desktop to mobile ad revenues may be painful for companies with high reliance on desktop ad dollars.
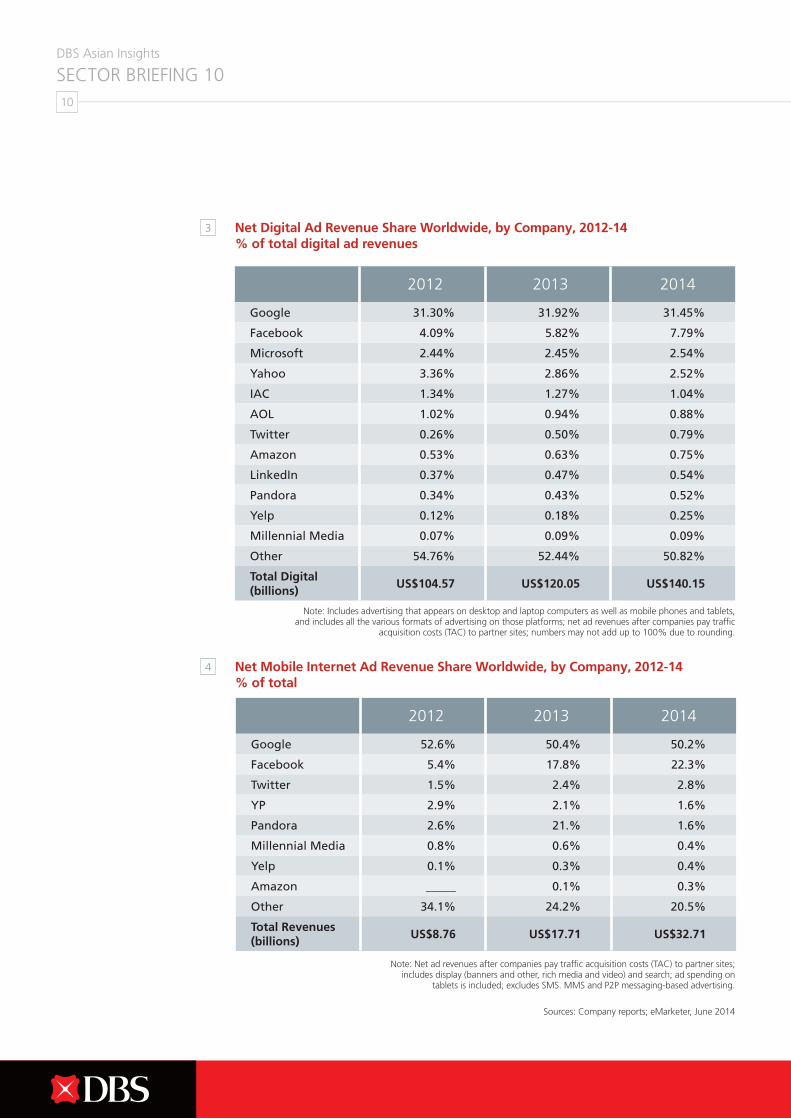
According to the data from eMarketer, Facebook has been quite successful in gaining share in the mobile ad-revenue at the cost of smaller players, as evident in the chart below. A big part of the growth has come from so called click-to-download ads from other mobile apps. Increasing dominance of big players could become an issue for smaller players reliant on advertising dollars.
3
People are spending more time on their smartphones nowadays, and that means more ads can be served on such mobile devices.
DBS Asian Insights SECTOR BRIEFING 1010
2012 2013 2014
Google 52.6% 50.4% 50.2%
Facebook 5.4% 17.8% 22.3%
Twitter 1.5% 2.4% 2.8%
YP 2.9% 2.1% 1.6%
Pandora 2.6% 21.% 1.6%
Millennial Media 0.8% 0.6% 0.4%
Yelp 0.1% 0.3% 0.4%
Amazon _____ 0.1% 0.3%
Other 34.1% 24.2% 20.5%
Total Revenues (billions)
US$8.76 US$17.71 US$32.71
2012 2013 2014
Google 31.30% 31.92% 31.45%
Facebook 4.09% 5.82% 7.79%
Microsoft 2.44% 2.45% 2.54%
Yahoo 3.36% 2.86% 2.52%
IAC 1.34% 1.27% 1.04%
AOL 1.02% 0.94% 0.88%
Twitter 0.26% 0.50% 0.79%
Amazon 0.53% 0.63% 0.75%
LinkedIn 0.37% 0.47% 0.54%
Pandora 0.34% 0.43% 0.52%
Yelp 0.12% 0.18% 0.25%
Millennial Media 0.07% 0.09% 0.09%
Other 54.76% 52.44% 50.82%
Total Digital (billions)
US$104.57 US$120.05 US$140.15
3
4
Net Digital Ad Revenue Share Worldwide, by Company, 2012-14 % of total digital ad revenues
Net Mobile Internet Ad Revenue Share Worldwide, by Company, 2012-14 % of total
Note: Includes advertising that appears on desktop and laptop computers as well as mobile phones and tablets, and includes all the various formats of advertising on those platforms; net ad revenues after companies pay traffic
acquisition costs (TAC) to partner sites; numbers may not add up to 100% due to rounding.
Note: Net ad revenues after companies pay traffic acquisition costs (TAC) to partner sites; includes display (banners and other, rich media and video) and search; ad spending on
tablets is included; excludes SMS. MMS and P2P messaging-based advertising.
Sources: Company reports; eMarketer, June 2014

DBS Asian Insights SECTOR BRIEFING 10
11
Is the Conversion Rate High? Especially for the Companies with a Freemium Model? The conversion rate is often used as a measure of the effectiveness of Freemium products.
The metric gauges the number of free users who eventually become paying subscribers. A low conversion rate is reflective of a small number of paying subscribers compared with the number of free users. This results in lower margins for the company or higher charges for paying subscribers, making premium features less attractive. Generally a low conversion rate is indicative of too many free-of-charge features in the overall product. This lowers the need to pay for additional features.
Although a high conversion rate can signal better revenue generation, it can also signal problems, especially if the overall growth rate is low. Free features generally act as the main marketing tool for Freemium products. A low level of free features increases the overall conversion rate while hampering the customer acquisitions. For example, a company would be better off monetising 5% of 1,000,000 users, than 20% of 100,000 subscribers. Ongoing research by the Harvard Business School has found that a free user is typically worth 15% to 25% as much as a premium subscriber, with significant value stemming from referrals.
According to an article published in Harvard Business Review by Assistant Professor Vineet Kumar, many companies typically have a conversion rate of between 2% and 5%. The optimal conversion rate for a company would depend on its target market. The larger the target market, the smaller the conversion rate can be, with an underlying assumption that the incremental cost of adding new subscribers is negligible. For example, Skype’s conversion rate was around 7% in 2011, while Dropbox has current conversion rates of below 5%. The acceptable conversion rate varies depending on the stage of the company’s lifecycle and type of product.
How Much is the Customer Churn Rate? Especially for Companies with a Direct Monetisation Model? Cloud companies are the biggest proponents of the direct monetisation model. In its simplest form, the cloud refers to the sharing of IT resources so that data can be stored and accessed from anywhere. As such, there is no need to invest in IT infrastructure and personnel for the client.
Traditionally, software companies sell a “perpetual” licence for their software and then later sell upgrades. Under this model, customers pay for the software licence upfront and then typically pay a recurring annual maintenance fee. However, under the cloud model, the customer signs up to use the software on an ongoing basis, via a service-based
4
5
Although a high conversion rate can signal better revenue generation, it can also signal problems.

DBS Asian Insights SECTOR BRIEFING 1012
arrangement. There are no upfront licensing revenues to cover customer acquisition costs. The company incurs almost all its costs to acquire customers in the first place – sales and marketing, developing and maintaining the software, hosting infrastructure – upfront. Typically, the cloud provider will recognise monthly revenue from customers, which is not enough to even cover customer acquisition costs.
For example, let us look at a traditional software business that sells a licensed product for US$12,000, and has a cost of acquiring a customer of US$5,000. Assuming 100% gross margins, the upfront licence fee more than pays for the cost to acquire that customer and cash flow is immediately positive. Here is how the cash flow would look:
Now let’s look at what happens if this same business switches to a subscription model. To be competitive, they can charge US$12,000 over two years. That means US$6,000 per year, or US$500 per month. As such, whenever the company adds a new customer, it could hurt the bottom-line due to the customer acquisition cost in that month.
0
5000
10000
15000 VC of 0.9
5045403530252015105
0
0
5000
10000
5000
-5000
10000
-10000
0
-6000
-5000
-4000
-3000
-2000
-1000
1000
15000
15000
5045403530252015105
0
50000
100000
150000
200000Total number of users
Total number of users
$
$
Time
Customer Aquisition Cost
Customer Aquisition Cost
License Revenue
Subscription Revenue
Time
Month 2Month 1
Mo
nth
1
Mo
nth
2
Mo
nth
3
Mo
nth
4
Mo
nth
5
Mo
nth
6
Mo
nth
7
Mo
nth
8
Mo
nth
9
Mo
nth
10
Mo
nth
11
Mo
nth
12
2019181716151413121110987654321
0
5000
10000
15000 VC of 0.9
5045403530252015105
0
0
5000
10000
5000
-5000
10000
-10000
0
-6000
-5000
-4000
-3000
-2000
-1000
1000
15000
15000
5045403530252015105
0
50000
100000
150000
200000Total number of users
Total number of users
$
$
Time
Customer Aquisition Cost
Customer Aquisition Cost
License Revenue
Subscription Revenue
Time
Month 2Month 1
Mo
nth
1
Mo
nth
2
Mo
nth
3
Mo
nth
4
Mo
nth
5
Mo
nth
6
Mo
nth
7
Mo
nth
8
Mo
nth
9
Mo
nth
10
Mo
nth
11
Mo
nth
12
2019181716151413121110987654321
5
6
Cash Flows Under License Model
Cash Flows Under License Model
Source: DBS
Source: DBS
The churn rate becomes one of the most important parameters to measure the health of a business.

DBS Asian Insights SECTOR BRIEFING 10
13
The churn rate becomes one of the most important parameters to measure the health of such businesses. The churn rate is the percentage of existing customers who stop doing business with an organisation over a specific time period. Typically, successful software-as-a-service (SaaS) companies report annual churn rates of between 5% and 7%. If a company is able to keep the churn rate low, most of the future revenues from the customer will flow to the future bottom-line, which is a good indication for investors in the company.
How Much is the Customer Acquisition Cost? Especially for Companies with a Direct Monetisation Model? Scale is a critical success factor in a digital business. Delayed monetisation means a company must bear the cost of every new customer addition for a prolonged period of time. The cost of servicing each new client, or the marginal cost of each customer, plays a critical part.
If the marginal cost for each new customer is high, the exponentially growing customer base means operating costs will also increase exponentially. A low marginal cost, on the other hand, would also be an incentive to add as many customers as possible before entering the monetising phase, as it increases the effects of operating leverage when money starts to flow in.
In the case of a company with a direct monetisation model, it is easier to estimate an acceptable customer acquisition cost (CAC). Firstly, one needs to look at the lifetime expected earnings of that customer, or customer lifetime value (LTV). The LTV is the present value of the projected profits from a customer to the firm over an entire relationship period. In its simplified form, the LTV is calculated by (Annual Recurring Revenue x Gross Margin) ÷ (Churn Rate + Discount Rate).
As a general rule the LTV should be multiple times of the CAC, at least 3 times. The higher the multiple, the better it is for the business. However, if the LTV is similar to the CAC, then it suggests that the firm may not be profitable in the future.
Is the Company Differentiated Enough to Become a Category Leader?
Due to the relative ease of starting a new digital company and the attraction of large pay-offs, there are likely to be a lot of new players in the digital space. The lack of an established player in the segment can be a big factor for new players to gain market share
6
7
DBS Asian Insights SECTOR BRIEFING 1014
and become leaders in a new vertical. Eventually, one player will gain a dominant market share, leaving little space for others.
It makes sense to move into market spaces that have not directly seen competition from established players. For example, social networks have grown in leaps and bounds over the past decade with many players emerging, but ultimately failing. Facebook, the undisputed leader in the segment with more than 1.3 billion users has pushed out competitors, such as MySpace and Hi5. However, through that same time period, LinkedIn emerged.
LinkedIn positioned itself as a professional, rather than social, network and so avoided directly competing with Facebook. LinkedIn created tools that are functional in a professional networking setting rather than social tools and trivia, such as the chat interfaces and relationship status indicators that are seen on a Facebook page. For example, LinkedIn pages made available space for professional backgrounds and endorsements. It also offered premium access to paying recruiters and has over time morphed in to a digital age job bank.
Similarly, while YouTube dominates the landscape of online video, companies such as Vimeo and Vine have carved out certain niche market segments. Vimeo, which has around 100 million unique visitors, has branded itself as a premium alternative to YouTube by catering to professional filmmakers. It encourages users to pay for video content and is aggressively pursuing content providers to create exclusive on-demand premium content.
Vine targets a totally different market segment by being primarily a smartphone app carrying videos which are only around six seconds long. The company was acquired by Twitter for US$30 million within a few months of its inception in 2012. By late 2014, it had 100 million unique monthly viewers.

DBS Asian Insights SECTOR BRIEFING 10
15

DBS Asian Insights SECTOR BRIEFING 1016

DBS Asian Insights SECTOR BRIEFING 10
17
How to Value Digital Companiesany digital businesses out there are still in an early stage of growth, that is, the business model is not yet finalised. Valuing early growth companies can be a challenge in itself. A case in point was the February 2014 acquisition of Whatsapp for US$19 billion – regarded then as expensive price for a
company with 450 million monthly active users (MAUs). Whatsapp was adding about 1 million users each day, implying that it could reach 1 billion MAU within one and a half years. Based on this number, the price translates to US$19 per MAU. While this is big, the number does not look expensive compared with Facebook’s current valuation of US$131 per MAU based on Wall Street’s 2016 projections. However, presently Whatsapp does not monetise its MAUs and charges only US$0.99 annually per user and that too after one year of free service. On a positive note, Whatsapp plans to monetise its MAUs fully after reaching the 1 billion mark.
So, the question is whether each Whatsapp user will be worth 15% of Facebook’s user in the future. The answer lies in the profile and the engagement of MAUs with the company. These can be gauged through specific operating metrics. Suffice to say, there is no rule of thumb as revenue per MAU and margins may vary widely among various companies.
Traditional Metrics for Companies Monetising User BaseLet’s look at two commonly used valuation metrics: enterprise value (EV) and earnings before interest, taxes, depreciation and amortization (EBITDA). EV to EBITDA is a proxy for free cash flows. However, EV to sales is also useful as EBITDA margins may have room to expand with bigger scale. Listed internet peers in the US, for example, are trading at an average of about 16.5 times EBITDA projections for financial year 2015 and offer compounded annual EBITDA growth of 28% from 2014 to 2016.
However, if a company offers higher EBITDA growth, then it may trade at a higher EV to EBITDA multiple. For example, LinkedIn is currently trading at 29 times EV to EBITDA and offers 41% annual EBITDA growth. Meanwhile, the average EV to sales for listed peers in the US is around 5.1 times for 2015. However, there is a big variance as the market could mainly be looking at EV to EBITDA, except for companies which are not expected to have positive EBITDA soon or those which have current margins with a lot of room to expand.
MValuing early-growth companies can be a challenge in itself

DBS Asian Insights SECTOR BRIEFING 1018
DBS Asian Insights SECTOR BRIEFING 10
19
Three Singapore-Born Start-UpsTheir Monetisation Strategies and How the Seven Metrics Apply
TradeHeroTradeHero is an integrated mobile app through which users simulate risk-free trading based on real-world stock market data across 28 exchanges. Users are able to learn about the markets via various features, such as bite-size financial trading educational videos, games and also from content supplied by partners, such as Motley Fool. TradeHero offers investment enthusiasts a social community where intelligent information and validated financial trading strategies are available for them to learn and replicate in real-life trading.
Monetisation Model: Freemium
TradeHero’s monetisation model is ingenious. Users who want to follow someone as a “hero” on a leader board (to replicate trading in real life) can pay a fee starting from US$1.99 per month to receive their “hero’s” stock trades via push notifications. To make it to the leaderboard, users need to conduct smart trades over a long period of time to rank consistently among the best. Trades that are done based purely on luck will be weeded out. From the US$1.99 fee each user pays to follow a particular trade “hero”, 30% goes to the app store, 35% to the company, and the remaining 35% to the trade “hero” himself. The opportunity to make real money incentivises the “hero” to trade on this platform seriously.
Remarkably, TradeHero also serves as the “ground floor lobby” for financial institutions (FIs) to reach out to a ready pool of retail investors. Hence, TradeHero can charge FIs a fee for reaching out to TradeHero users. An example is the Singapore Stock Exchange’s StockWhiz, which is a three-month-long trading competition that engages 15,000 traders and non-traders.
User Growth
Trade Hero launched its app in China in November 2014 and within two months gained 500,000 Chinese users. Today, it boasts a user base of more than 2 million. TradeHero is aiming for 5 million users by the end of 2015 and 30 million by 2017.
How is TradeHero Different from its Competitors?One of TradeHero’s rivals is E-Toro, which is the world’s leading social investment network. It enables traders and investors to connect with each other to make smarter investment decisions. The key difference is that E-Toro does real live trading whereas TradeHero does
DBS Asian Insights SECTOR BRIEFING 1020
not. This actually makes TradeHero stand out as a partner, rather than a competitor, to the FIs. This provides TradeHero with another important and smart way to monetise. Also, TradeHero does it differently by using gamification to incentivise learning.
Growth StrategyExpand user base in China and leverage its networksTradeHero is currently at the critical stage of building up its user base and it aims to build a community of 30 million financial uses by 2017. Its priority markets are China and the US. Another of TradeHero’s priorities is to further leverage FIs to provide it with an expanded user network.
Key Metrics
Category leader: Yes; there are no clear winners in the gamified learning trading space.
Virality coefficient: Likely to be above 1; TradeHero focuses a great deal on creating viral campaigns via both online and offline platforms. The majority of its Chinese users are solicited via its own viral campaigns. An example is an offline campaign that was conducted for business students from China’s top 50 universities. Here students were incentivised to pick up the app and become a trade “hero” themselves. This was propagated via WeChat, the most prolific social networking platform in China.
User engagement (DAU/MAU): Approximately 15%, which is considered a respectable success for any app.
Conversion rate: Between 2% and 3% of all follows that are paid follows. There is a hook for TradeHero users to convert as US$2 is cheap for avid investors and investor-wannabes to get validated trading strategies that they can replicate in real life.
Costs of acquisition: Estimated to be US$3 per customer; this is derived from total funding used for marketing divided by the number of customers.
Remarks: TradeHero houses a valuable user base, made up of potentially important customers for financial institutions. Banks and brokerages have shown keen interest in collaborating with TradeHero to tap its pool of earnest would-be investors. TradeHero will be able to wow investors with its monetisation model that is innovative and robust.
Key challenge: It is common for “copycat” apps to be created in China. Think Xiaomi, an iPhone copycat that has emerged as a leader in many countries. However, TradeHero is ahead of the curve and Chinese players do not have the international network to become truly global.
DBS Asian Insights SECTOR BRIEFING 10
21
PaktorPaktor was founded in 2013. Its name means dating in Hokkien and is, in effect, the Tinder for much of Asia. It allows singles to anonymously “like” each other with a simple swipe of the finger based on user profiles (swiping right indicates interest and left indicates otherwise). When one user swipes right, the other user is notified. Both then have the opportunity to respond and chat with one another. Paktor has a strong presence in Singapore, Vietnam, Thailand, and Taiwan, which is its dominant market. It offers cross-country matching features, such as auto-translation that enables users to reach out to users in other countries.
Monetisation Model: Freemium
Paktor rolled out its first revenue model last July. Here users can purchase credits to connect directly with one another. In Singapore, it has also launched an offline matchmaking service called Gaigai, which aims to bring users together through its one-to-one matchmaking services and social dating events.
User Growth
Paktor has experienced exponential growth across the Southeast Asia region. Over the last two months, Paktor registered users grew over 30% to cross the mark of 2 million registered users (1.5 million in December 2014 and 1 million in July 2014). Every day Paktor matches more than 100,000 people with one another. With solid plans to enter Indonesia, Paktor is confident it will grow faster going forward. It is targeting to have 5 million registered users by June 2015.
How is Paktor Different from its Competitors?
There are no clear leaders in the mobile dating space in Singapore, or Southeast Asia. Tinder is big but is not currently targeting Southeast Asians as neatly as Paktor. Paktor prides itself in understanding the Asian culture and qualities Asians look out for when choosing a partner. Apart from a mere photo and age, Paktor gives average looking people other factors to stand out. For example, users are able to filter potential matches via criterions such as height, job and education – something Tinder has not adopted to suit a typical Asian.
Growth StrategyExpansion in Southeast Asia and acquiring new usersCurrently, Paktor’s strategic focus is on growing their user base and network in Southeast Asia, less on monetisation. Recently, it has broken into new grounds like Malaysia. It envisions Indonesia as their “next big market”. Additionally, Paktor is expanding product offerings to provide more offline events and premium personal services.

DBS Asian Insights SECTOR BRIEFING 1022
To complete its suite of services in the dating space, future plans include “breakup assistance” which helps users get out of the pain after ending a relationship.
Key Metrics
Category leader: Yes; Paktor is the dating app leader in Singapore, Vietnam, Malaysia and Thailand, and comes in close second behind the top player iPart (ten years in the industry) in Taiwan. The next best player in Southeast Asia has less than a tenth of Paktor’s user activity and growth.
Virality coefficient: Likely to be more than 1; There will always be people looking for love and dates, and an app like Paktor makes it simple. Given Paktor’s user growth, it is justifiable to say the virality coefficient is more than 1.
User engagement (DAU/MAU): More than industry average of over 20%.
Conversion rate: Estimated 2%.
Churn rate: Relatively much lower than industry averages.
Customer acquisition costs: Not applicable.
Remarks: Paktor has a strong user base and has tailored itself to meet the needs of its Southeast Asian target market. It has solid plans to enter and capture users in Indonesia, which has the largest number of young people in Southeast Asia.
Key challenge: The key challenge for dating apps like Paktor is the need to keep attracting new users as users in general do not continue using the app once they find their partner. Hence, becoming viral via user recommendations is key to attract and build a substantial user base.
Chope
Chope is a Singapore slang word for “reserving” an empty seat or table in a fast food restaurant or food court by placing a tissue packet on it. As its name suggests, Chope enables diners to make instant reservations across over 600 restaurants in Singapore, Hong Kong, Shanghai and Beijing: 24 hours a day, seven days a week. Chope sees itself as a provider of a hassle-free dining experience. It also promotes itself as a one-stop shop for restaurants looking to improve their guest experience via seating and queue management technologies.
Last November, Chope acquired TickTok, a queue management system start-up, which Chope recognises as a “perfect adjacent product complement” to its seating technologies.
DBS Asian Insights SECTOR BRIEFING 10
23
Restaurants using Chope can now monitor both queues and reservations easily on an iPad app. Similarly, customers can check the number of people ahead of them and receive a notification when their turn arrives.
Monetisation Model: Direct
Chope’s revenue is mainly derived from their 600 participating restaurants. They each pay a monthly subscription fee for using Chope’s table management system, and a booking fee for each diner coming through their platform. These two revenue streams contribute equally to the company’s income.
User Growth
Chope’s 600 restaurant partners today represent twice the number they had just a year ago, and quadruple of what they had soon after their inception in 2011. Last July, Chope had more than 250,000 registered users across Singapore and Hong Kong and achieved its 10 millionth diner milestone. Since then, the figures are expected to have grown significantly with its expansion into Shanghai and Beijing.
How is Chope Different from its Competitors?
In the restaurant reservation space, the biggest global player is Opentable whose valuation is worth over US$2 billion. However, it is not a competitor in Chope’s view as their geographic focus is entirely different. In Singapore, Chope boasts a listing of over 300 restaurants whereas Opentable only has one.
In Singapore, the closest competitor is HungryGoWhere, which was acquired by SingTel back in 2012 for S$12 million. The difference as we identified is that Chope has loftier regional expansion plans whereas HungryGoWhere is largely Singapore-focused.
Additionally, Chope’s investment in table and queue management technologies has set it apart from its competitors. These systems enable restaurateurs to know what is going on in real time so they can optimise their seating and turnover. These tools require some customisation, a deep understanding of restaurant operations, and how group sizes work.
Growth StrategyBuild a user base and expand regionally via partnershipsWithout a substantial user base, restaurants will be reluctant to sign up to Chope’s services. So, the first pillar of growth is to extend its geographic reach into Southeast Asian cities like Bangkok and Jakarta, where a strong food culture prevails. Chope is currently in four cities and is aiming to be operating in seven cities by its fourth birthday.

DBS Asian Insights SECTOR BRIEFING 1024
The second pillar of growth comes from “product adjacency”, which means selling different products to the same customers. An example is its acquisition of TickTok.
Chope also uses partnership building as a key growth strategy. In China, Chope partners with City Weekend. Chope is currently in Beijing and Shanghai, but it also has set its sights on other cities, like Guangzhou and Suzhou. Recently, Chope also tied up with travel website, TripAdvisor, to combine its booking engine with TripAdvisor’s user provided rankings.
Key Metrics
Category leader: Not the clear leader. There are competing apps like HungryGoWhere.
Virality coefficient: Likely to be more than 1; based on its user growth numbers and extensive partnerships.
User engagement (DAU/MAU): Chope claims its customers are “extremely sticky and that repeat rates are constant, with no significant signs of decay.”
Conversion rate: Industry conversion rates are in the teens for web-based reservations (from unique visitors to bookings). Exact figures for mobile based reservations have not been revealed.
Churn rate: Relatively low. The churn mainly comes from the closures of participating restaurants. Every year in Singapore, for example, 20%-25% of restaurants cease operations.
Customer acquisition costs: Chope is willing to pay up to three years of customer lifetime value (revenue that client will bring over three years).
Remarks: Chope has lots of potential in its quest to help restaurants attract diners. It recognises that it is sitting on valuable dining data, which can be mined and analysed to provide useful insights for food and beverage players.
Key challenge: The key challenge is to overcome the many obstacles that arise with an expansion outside of the home country. In general, many players end up as marginal players in other countries.

DBS Asian Insights SECTOR BRIEFING 10
25
ConclusionDigital companies adopt very different business models than those followed by traditional enterprises. User growth is the most important aspect for digital players, especially in the early stages of a company. The more users a digital player amasses, the more chance it has of fending off potential rivals. In essence, it becomes an entry barrier for competitors.
But business is ultimately about making money. To succeed a company must work out how big its audience must be for it to become the dominant player in its particular digital space. Determining and reaching that sweet spot is a huge challenge. Once it does this, a company can shift gears and make monetisation its prime focus.

DBS Asian Insights SECTOR BRIEFING 1026

DBS Asian Insights SECTOR BRIEFING 09
27
Disclaimers and Important Notices
The information herein is published by DBS Bank Ltd (the “Company”). It is based on information obtained from sources believed to be reliable, but the Company does not make any representation or warranty, express or implied, as to its accuracy, completeness, timeliness or correctness for any particular purpose. Opinions expressed are subject to change without notice. Any recommendation contained herein does not have regard to the specific investment objectives, financial situation and the particular needs of any specific addressee. The information herein is published for the information of addressees only and is not to be taken in substitution for the exercise of judgement by addressees, who should obtain separate legal or financial advice. The Company, or any of its related companies or any individuals connected with the group accepts no liability for any direct, special, indirect, consequential, incidental damages or any other loss or damages of any kind arising from any use of the information herein (including any error, omission or misstatement herein, negligent or otherwise) or further communication thereof, even if the Company or any other person has been advised of the possibility thereof. The information herein is not to be construed as an offer or a solicitation of an offer to buy or sell any securities, futures, options or other financial instruments or to provide any investment advice or services. The Company and its associates, their directors, officers and/or employees may have positions or other interests in, and may effect transactions in securities mentioned herein and may also perform or seek to perform broking, investment banking and other banking or financial services for these companies. The information herein is not intended for distribution to, or use by, any person or entity in any jurisdiction or country where such distribution or use would be contrary to law or regulation.

www.dbs.com
Living, Breathing Asia