nd quarter fy18 results · stbs/odus are owned by astro, and are capitalised stbs/odus are...
TRANSCRIPT

2nd Quarter FY18 Results
14th September 2017

This document contains certain forward-looking statements with respect to Astro Malaysia Holdings Berhad’s (“Astro”) financial condition,
results of operations and business, and management’s strategy, plans and objectives for Astro. These statements include, without
limitation, those that express forecasts, expectations and projections such as forecasts, expectations and projections in relation to new
products and services, revenue, profit, cash flow, operational metrics etc.
These statements (and all other forward-looking statements contained in this document) are not guarantees of future performance and are
subject to risks, uncertainties and other factors, some of which are beyond Astro’s control, are difficult to predict and could cause actual
results to differ materially from those expressed or implied or forecast in the forward-looking statements. These factors include, but are
not limited to, the fact that Astro operates in a competitive environment that is subject to rapid change, the effects of laws and
government regulation upon Astro’s activities, its reliance on technology which is subject to risk of failure, change and development, the
fact that Astro is reliant on encryption and other technologies to restrict unauthorised access to its services, failure of key suppliers, risks
inherent in the implementation of large-scale capital expenditure projects, and the fact that Astro relies on intellectual property and
proprietary rights which may not be adequately protected under current laws or which may be subject to unauthorised use.
All forward-looking statements in this presentation are based on information known to Astro on the date hereof. Astro undertakes no
obligation publicly to update or revise any forward-looking statements, whether as a result of new information, future events or otherwise.
This presentation has been prepared by Astro. The information in this presentation, including forward-looking statements, has not been
independently verified. Without limiting any of the foregoing in this disclaimer, no representation or warranty, express or implied, is made
as to, and no reliance should be placed on, the fairness, accuracy or completeness of such information. Astro and its subsidiaries,
affiliates, representatives and advisers shall have no liability whatsoever (whether in negligence or otherwise) for any loss, damage, costs
or expenses howsoever arising out of or in connection with this presentation.
Disclaimer
1 | 2QFY18 results
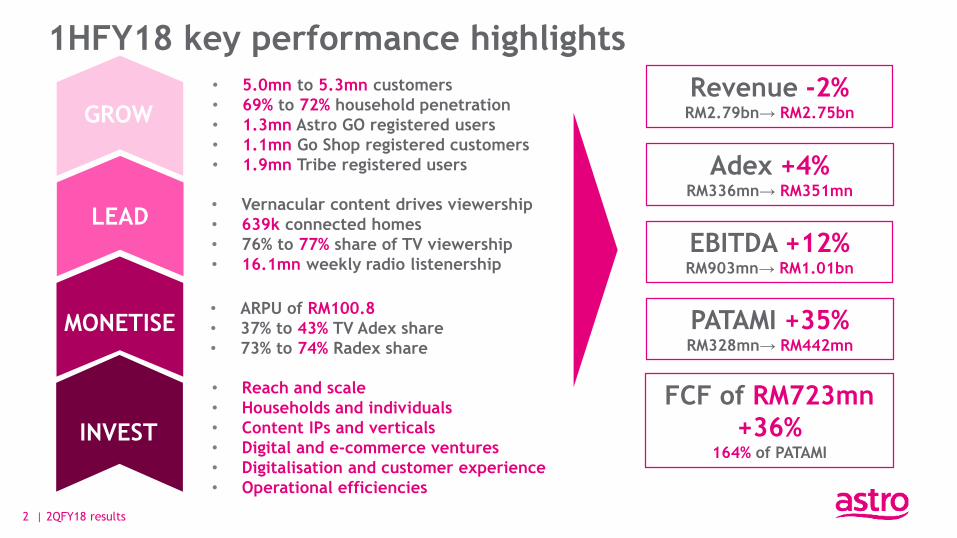
• ARPU of RM100.8
• 37% to 43% TV Adex share
• 73% to 74% Radex share
• 5.0mn to 5.3mn customers
• 69% to 72% household penetration
• 1.3mn Astro GO registered users
• 1.1mn Go Shop registered customers
• 1.9mn Tribe registered users
• Reach and scale
• Households and individuals
• Content IPs and verticals
• Digital and e-commerce ventures
• Digitalisation and customer experience
• Operational efficiencies
Revenue -2%RM2.79bn→ RM2.75bn
FCF of RM723mn
+36%164% of PATAMI
Adex +4%RM336mn→ RM351mn
GROW
MONETISE
LEAD
INVEST
PATAMI +35%RM328mn→ RM442mn
• Vernacular content drives viewership
• 639k connected homes
• 76% to 77% share of TV viewership
• 16.1mn weekly radio listenershipEBITDA +12%RM903mn→ RM1.01bn
2 | 2QFY18 results
1HFY18 key performance highlights

Highlights 1H FY17 1H FY18 Growth
TV households (000s)(1) 7,162 7,261 1%
TV household penetration(2) 69% 72% 3pp
TV customer base (000s) 4,974 5,262 6%
ARPU (RM) 99.2 100.8 2%
Astro TV viewership share(3) 76% 77% 1pp
Radio listenership (mn)(4) 12.8 16.1 26%
Monthly unique visitors (mn)(5) 4.9 6.7 37%
Connected boxes (000s) 395 639 62%
Revenue (RM mn) 2,791 2,746 (2%)
EBITDA (RM mn) 903 1,011 12%
EBITDA margin 32% 37% 4.4pp
PATAMI (RM mn) 328 442 35%
FCF (RM mn) 531 723 36%
EPS (RM sen) 6.3 8.5 35%
NB
(1) TV household data sourced from the
Department of Statistics Malaysia and
Media Partners Asia
(2) Household penetration comprises
residential Pay-TV customers and NJOI
customers
(3) Viewership share is based on DTAM
deployed by Kantar Media.
(4) There was a change in audience
measurement partner for the radio
industry in Malaysia commencing
H2FY17. The ratings prior to the change
were provided by Nielsen whereas it is
now being provided by GfK. Share of
radex is based on internal estimates
(5) Monthly unique visitors are end of
period figures (as at 31 July) referring
to visitors to Astro’s digital platforms as
sourced from ComScore
(6) Data presented are for the 6 months
ended 31 July
(7) Numbers may not add up due to
rounding differences
1HFY18 year-on-year overview
3 | 2QFY18 results

Connected Boxes (000s)
Serving 5.3mn households with 639k connected homes
and 6.7mn monthly visitors to our digital platforms
395
639
1HFY17 1HFY18
Households (000s)
4,974 5,262
1HFY17 1HFY18
ARPU (RM)
99.2100.8
1HFY17 1HFY18
72%69%
Household Penetration
NB
(1) Monthly unique visitors are end of period figures (as at 31 July) referring to visitors to Astro’s digital platforms as sourced from ComScore
Monthly Unique Visitors (1) (mn)
4.9
6.7
1HFY17 1HFY18
4 | 2QFY18 results
+37%+2%
+62%

23%
77%
TV Viewership Share
3:48 3:49
2:03 2:06
1HFY17 1HFY18
Avg. Time Spent/Day
13.8 13.4
8.17.4
1HFY17 1HFY18
Avg. Daily Viewers (mn)
Astro FTA
TV viewership share and time spent on the rise
+1pp
189channels
73Astro-branded
channels
61HD channels
28channels
NB
(1) Number of channels as at 31 July
(2) Target Audience: Kantar Media, Dynamic TV Audience Measurement (DTAM). All Astro viewers.
-2.6%
-8.6%
+0.4%
+2.4%
Pay-TV NJOI
5 | 2QFY18 results

1,148 1,168 1,174 1,155 1,121 1,140
150 186 188 181
143 208
64
74 62 61
62
70
1QFY17 2QFY17 3QFY17 4QFY17 1QFY18 2QFY18
Go Shop
Adex
Subscription/Others
Revenues resilient in a challenging environment
(4%)
4%
(2%)
(RM mn)Total revenue YoY growth(2)
NB
(1) Disclosed as Subscription revenue and Other revenue in our financial statements, includes revenue streams such as TV
subscription, licensing income, programme sales, NJOI revenue and theatrical revenue
(2) YoY refers to 1HFY17 vs. 1HFY18
(3) Numbers may not add up due to rounding differences
(2%)
(1)
1,4241,428 1,397
1,326
1,4201,363
6 | 2QFY18 results
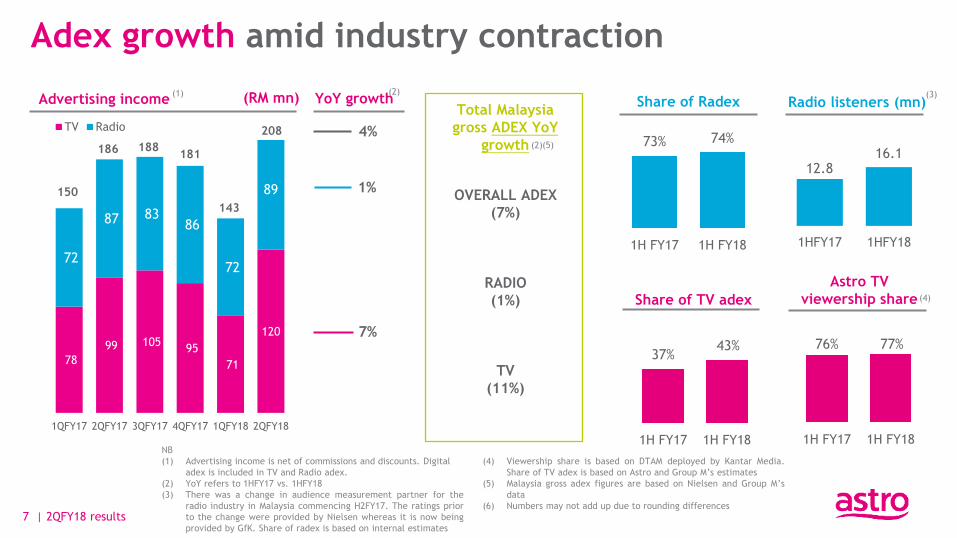
78
99 105 95
71
120
72
87 83 86
72
89
1QFY17 2QFY17 3QFY17 4QFY17 1QFY18 2QFY18
TV Radio
1HFY17 1HFY18
Adex growth amid industry contraction
Advertising income (RM mn) YoY growth(2)
1%
7%
(1)
Total Malaysia
gross ADEX YoY
growth
OVERALL ADEX
(7%)
RADIO
(1%)
TV
(11%)
(2)(5) 73% 74%
1H FY17 1H FY18
Share of Radex
Share of TV adex
Radio listeners (mn)
76% 77%
1H FY17 1H FY18
Astro TV
viewership share
(3)
(4)
NB
(1) Advertising income is net of commissions and discounts. Digital
adex is included in TV and Radio adex.
(2) YoY refers to 1HFY17 vs. 1HFY18
(3) There was a change in audience measurement partner for the
radio industry in Malaysia commencing H2FY17. The ratings prior
to the change were provided by Nielsen whereas it is now being
provided by GfK. Share of radex is based on internal estimates
(4) Viewership share is based on DTAM deployed by Kantar Media.
Share of TV adex is based on Astro and Group M’s estimates
(5) Malaysia gross adex figures are based on Nielsen and Group M’s
data
(6) Numbers may not add up due to rounding differences
12.8
4%
16.1186 188181
143
37%43%
1H FY17 1H FY18
150
7 | 2QFY18 results
208

409 497 471 434 405 353
676
687 665 695
624 690
1QFY17 2QFY17 3QFY17 4QFY17 1QFY18 2Q FY18
Content costs Other expenses
Cost optimisation remains a key focus
(RM mn)Total operating expenditure
35%
NB
(1) Content costs are disclosed as part of cost of sales in our financial statements
(2) Other expenses include marketing and distribution costs, administrative expenses, STB installation and smartcard costs,
depreciation and amortisation, as well as maintenance costs
(3) Numbers may not add up due to rounding differences
34%39% 37%Content cost as %
of TV revenues
1,0851,136 1,129
1,029 1,043
28%
1,184
33%
8 | 2QFY18 results

20 26
46 36
4 14
1HFY17 1HFY18
Revenue Growth Digitalisation Capital Maintenance
NB
(1) Data presented are for the 6 months ended 31 July
(2) Numbers may not add up due to rounding differences
Applying ROI discipline in capex spend
3% 3%as % of
revenue
(RM mn)
62
103
1HFY17 1HFY18
2% 4%as % of
revenue
(RM mn)
Key capex investments in 1HFY18 include:
▪ Product and service upgrading
▪ Technology infrastructure
▪ Customer experience
Cash capex Capitalised capex
▪ STBs/ODUs are owned by Astro, and are capitalised
▪ STBs/ODUs are conservatively amortised over 3 years;
note that actual useful life is typically greater than 5
years
▪ Discretionary 36 month bullet payment vendor
financing is available for Astro for STB/ODU purchases
▪ RM745mn of vendor financing recorded in payables, of
which RM182mn is current and RM563mn is non-
current
7671
9 | 2QFY18 results

Strong cash generation consistently exceeds PATAMI…
771979
240
256
531
723
Cash fromoperations
Cash frominvesting
Free cash flow Cash fromoperations
Cash frominvesting
Free cash flow(2) (3) (3)(2)
162% 162%as % of PATAMI
(RM mn)
1HFY17 1HFY18
Free cash flow
…enabling significant flexibility on capital management and dividend policy
NB
(1) Data presented are for the 6 months ended 31 July
(2) Excludes investments, disposals and maturities of unit trust and money market funds
(3) Excludes repayments of vendor financing and payments of finance leases, which are categorised as cash from financing
for consistency with Bursa disclosure
(4) Numbers may not add up due to rounding differences
10 | 2QFY18 results

▪ Leveraging on invested capital, AMH continues to be highly cash generative
▪ The Board of Directors of AMH has declared a quarterly dividend of 3.00 sen per share for 2QFY18
▪ Quarterly dividend entitlement and payment dates: 3 October 2017 and 13 October 2017,
respectively
Quarterly dividend announcement
11 | 2QFY18 results

Pushing connected homes to drive engagement
Vernacular|Kids Korean | Genres Exclusives Latest
• Full box sets for binge watching
• Never miss TV with Catch Up
62% increase in
connected homes YoY
1 in 3 connected
homes are multi-
screened
2x viewing hours for
OD homes vs linear
homes• Latest content | Day/Date
• Seamless access on PVR & Astro Go
12 | 2QFY18 results NB
(1) Data presented are for the 6 months ended 31 July sourced from Astro internal numbers

1.01.3
1HFY17 1HFY18
2.5
3.8
1HFY17 1HFY18
138
235
1HFY17 1HFY18
NB
(1) As sourced from iTunes, Google Play Store & App Annie (Aug 2017)
(2) Downloads are cumulative
Average Weekly Viewing (mins)App Downloads(2) (mn)Registered Users (mn)
Take your TV everywhere.
For Free.
Entertainment app in
Malaysia on iTunes and
Google Play Store (1)#1
Positioning Astro Go as the go to OTT for Astro subs..
13 | 2QFY18 results
• Personalised content offerings
covering linear, VOD and live
• Strong focus on vernaculars
including exclusive content
• Differentiated features including
Kids Mode and Sport Control

Provides flexibility for
customers who are
commitment averse
18 channels free with options
for in-app purchases, driven by
existing Astro vernaculars and
VOD content
Mobility and OD extension to
our NJOI customer base
..and NJOI Now as the go to OTT for the freemium
segment
14 | 2QFY18 results
Entertainment app in
Malaysia on Google
Play Store (1)#3
NB
(1) As sourced from Google Play Store & App Annie (Aug 2017)
…as we pivot to be a digital first, mobile-first
entertainment and lifestyle company

633kmobile downloads
4X daily
LIVE SHOWSLaunch of ‘Brand of
the Day’ Program
777
1,127
1HFY17 1HFY18
Net Revenue
Registered Customers (000s)
15 | 2QFY18 results
Go Shop priority on growing customer numbers
via differentiated offerings
633k app
downloads(1)
• Celebrity endorsed products
• 4x daily live show
• Launch of ‘Brand Day’ programme
1HFY18
Revenue
132mn
45%
NB
(1) Cumulative as at end July 2017

Registered Users (mn)
1.3
1.9
1QFY18 2QFY18
Average Time Spent (mins/week)
125 mins
160 mins
1QFY18 2QFY18
Tribe continues to expand regionally
16 | 2QFY18 results
Thailand
Soft launch
August 2017
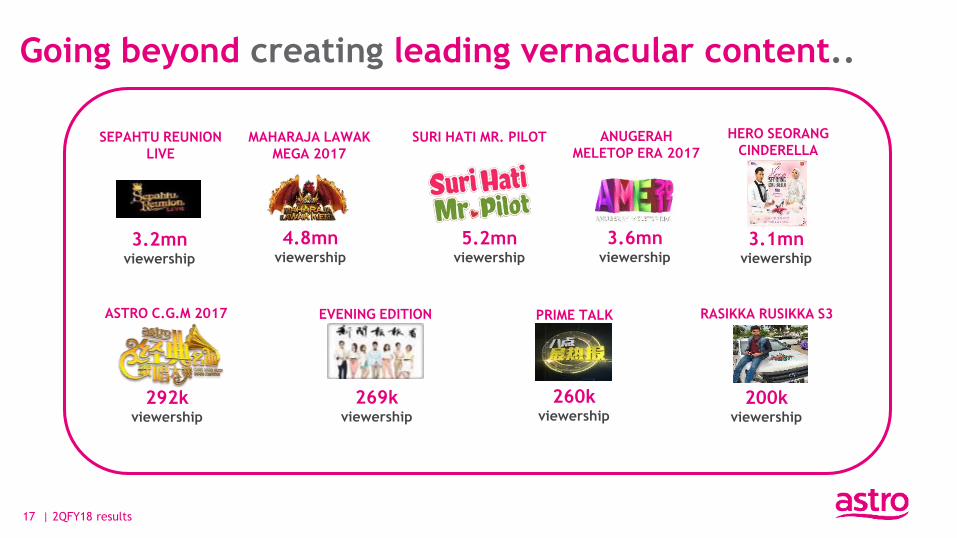
4.8mnviewership
MAHARAJA LAWAK
MEGA 2017
ANUGERAH
MELETOP ERA 2017SEPAHTU REUNION
LIVE
3.6mnviewership
3.2mnviewership
RASIKKA RUSIKKA S3
200kviewership
ASTRO C.G.M 2017 EVENING EDITION PRIME TALK
260kviewership
269kviewership
292kviewership
Going beyond creating leading vernacular content..
HERO SEORANG
CINDERELLA
3.1mnviewership
5.2mnviewership
17 | 2QFY18 results
SURI HATI MR. PILOT

..to harnessing our digital assets and social media reach
Multi-channel touchpoint engagements across various platforms
Entertainment
Education
Shop
OTT
Streaming
Kids &
Animation
SportsListen
Social
Media Reach
30mnFacebook
Followers
8mnInstagram
Followers
4mnTwitter
Followers
3mnYouTube
subscribers
Viewership Product Reach Digital
13.4mn
daily average viewers
6.7mn
monthly unique visits
4.3mn
registered users(1)
.com.my
NB
(1) Total registered users/ customers of Astro Go, Go Shop and Tribe18 | 2QFY18 results

Viewership
2.6mn 3mn+
Across All Gempak Platforms
Digital Views
Keyword
Most SearchedKeywords within Gempak (Apr 17 – May17)
TrendedEvery Week
Conversations
146k+On Social Media
Social Media Reach
14mn+
Average Per Week
..to generate buzz for new signature IPs
#1 Islamic IP on Astro
19 | 2QFY18 results
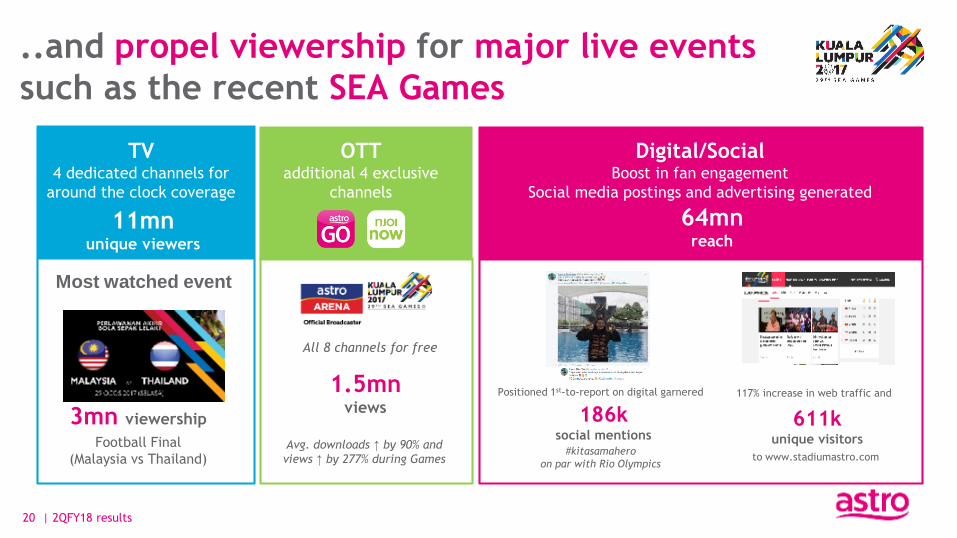
Positioned 1st-to-report on digital garnered
#kitasamahero
on par with Rio Olympics
117% increase in web traffic and
to www.stadiumastro.com
20 | 2QFY18 results
..and propel viewership for major live events
such as the recent SEA Games
20 |
TV4 dedicated channels for
around the clock coverage
OTTadditional 4 exclusive
channels
Digital/SocialBoost in fan engagement
Social media postings and advertising generated
All 8 channels for free
1.5mnviews
11mnunique viewers
64mnreach
186ksocial mentions
611kunique visitorsAvg. downloads ↑ by 90% and
views ↑ by 277% during Games
3mn viewership
Football Final
(Malaysia vs Thailand)
Most watched event
20 | 2QFY18 results
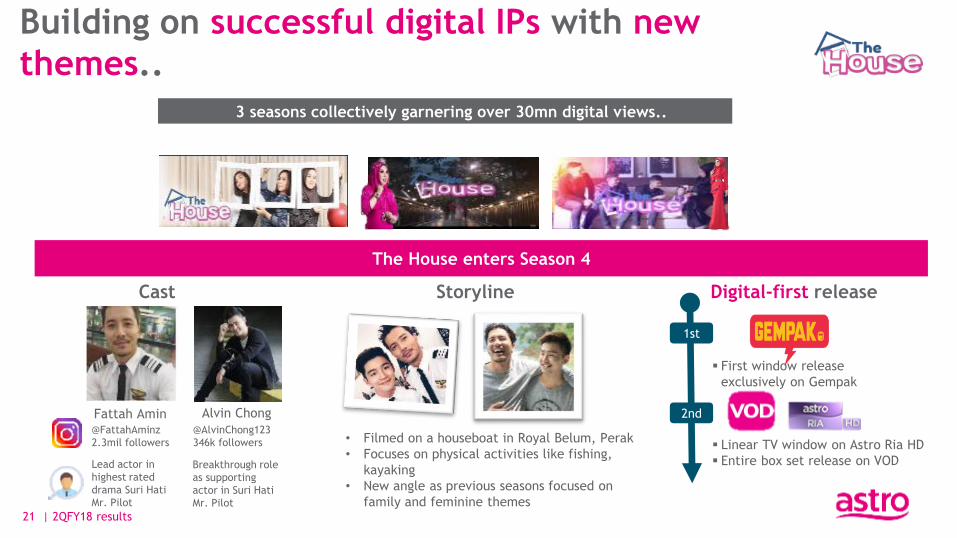
Building on successful digital IPs with new
themes..
3 seasons collectively garnering over 30mn digital views..
• Filmed on a houseboat in Royal Belum, Perak
• Focuses on physical activities like fishing,
kayaking
• New angle as previous seasons focused on
family and feminine themes
Cast Storyline Digital-first release
Fattah Amin@FattahAminz
2.3mil followers
@AlvinChong123
346k followers
Alvin Chong
Lead actor in
highest rated
drama Suri Hati
Mr. Pilot
Breakthrough role
as supporting
actor in Suri Hati
Mr. Pilot
2nd
1st
▪ Linear TV window on Astro Ria HD
▪ Entire box set release on VOD
▪ First window release
exclusively on Gempak
The House enters Season 4
21 | 2QFY18 results

Nusantara Kids IslamicHorror
eSports
Premium Nusantara
series
Transmedia kids and
animation content with
Asian values
Islamic content and
interactive digital
engagementAsian horror original
series and movies
The next wave of sports
for millennials
Horror
Asian horror original
series and movies
..and championing content which can travel regionally
22 | 2QFY18 results

..to ultimately leverage on 360O fandom for IP
monetisation
68K buys
600m views;
600k subs
Top 3 Malaysian
channel
VOD
Top 10
in-flight videos
MeadJohnson Tesco
15 Categories | 200+ SKUs in >200 retail stores
FTA
#4 app in
Google Play Singapore
(ticketed)Malaysia
Brand ambassadorshipsCDs & DVDsSingapore
FREE PAID
Mall rides Concept store
Events Licensing & MerchandisingIn-flightCinema
screeningsVOD
23 | 2QFY18 results

Appendix

(RM mn) 1HFY17 1HFY18
EBITDA 903 1,011
Margin % 32% 37%
Depreciation and amortisation (374) (329)
EBIT 530 682
Margin % 19% 25%
Finance income 39 33
Finance cost (122) (106)
Share of post tax results from investments 3 0
PBT 449 609
Tax expense (124) (171)
Tax rate % 28% 28%
PAT 325 438
PATAMI 328 442
Margin % 12% 16%
Normalised PATAMI 320 430
Margin % 11% 16%
NB
(1) Depreciation and amortisation
excludes the amortisation of film
library and programme rights which is
expensed as part of content costs (cost
of sales)
(2) Normalised PATAMI excludes post-tax
impact of unrealised forex gain
(1HFY18: RM11.7m, 1HFY17: RM7.9m)
due to MTM revaluation of M3B
transponder lease liability
(3) Numbers may not add up due to
rounding differences
(2)
(1)
PAT reconciliation
25 | 2QFY18 results

(RM mn) FY17 1HFY18
Non-current assets 4,559 4,944
Property, plant and equipment 1,818 2,498
Other non-current assets 2,741 2,446
Current assets 1,707 1,716
Receivables and prepayments 859 1,017
Cash and bank balances(1) 647 603
Other current assets 202 97
6,266 6,660
(RM mn) FY17 1HFY18
Non-current liabilities 3,356 3,847
Payables 490 563
Borrowings 2,776 3,197
Other non-current liabilities 90 87
Current liabilities 2,280 2,133
Payables 1,627 1,314
Borrowings 629 747
Other current liabilities 24 73
Shareholders’ equity 630 680
6,266 6,660
Net debt / LTM EBITDA: 1.7x
NB
(1) Includes money market unit trusts
(2) Comparative data presented is as of 31 Jan 2017
(3) Numbers may not add up due to rounding differences
Balance sheet overview
26 | 2QFY18 results

1,802
90
1,203
850
FY18
Finance lease Revolving credit
RM term loan USD term loan USD term
loan
RM term
loan
Finance lease
(primarily
satellite
transponders)
3,944
(RM mn)Total borrowings Details of borrowings
Total borrowings is net of debt
issuance costs (RM10.2 mn)
▪ As at 31 July 2017, outstanding principal US dollar term loan stood at
US$198.0mn. The ninth principal repayment of USD24.75mn
(RM74.72mn) is scheduled to be paid on 8 December 2017
▪ Fully hedged via cross currency interest rate swap at an exchange rate of
USD/RM3.0189 and an all-in interest rate of 4.19% p.a.
▪ Back ended amortisation schedule. With first drawdown date of 8 June
2011, average life is 7 years with final maturity date of 8 June 2021
▪ As at 31 July 2017, total outstanding principal RM term loan stood at
RM1,200mn. The ninth principal repayment of RM150mn is scheduled to be
paid on 20 November 2017
▪ All-in interest rate (post-hedging) for the hedged portion of RM900mn is
5.4404% p.a. while balance unhedged of RM300mn stood at 4.8331% p.a.
(variable floating rate based on cost of funds)
▪ Back ended amortisation schedule. With first drawdown date of 19 May
2011, average life is 7 years with final maturity date of 19 May 2021
▪ Finance lease related to lease of Ku-band transponders on MEASAT-3,
MEASAT-3A and MEASAT-3B. Payment arrangement for the remaining
contractual years for M3 and M3A have been redenominated into Ringgit
at USD/RM3.0445 w.e.f. 21 May 2013. The unhedged portion of the
finance lease related to M3B is USD301m.
▪ Effective interest rate: 6.2%, 4.6%, 12.5% and 5.56% p.a. for M3, M3-T11,
M3A and M3B respectively
▪ Average life: 15 years
Revolving
credit
▪ A total of RM90mn drawn from revolving credit facility on 5 July 2017 at
4.03% p.a. (floating rate based on cost of funds). Repayment on 5
September 2017
Debt profile
27 | 2QFY18 results

Thank you