nd annual report 2012 - whitepages on this review, ... mauritius morocco. 9 russian ... agenda to...
TRANSCRIPT

62nd annual report2012

The Annual General Meeting of Murray Goulburn Co-operative Co. Limited will be held at 1.30pm on Wednesday 28 November 2012 in ‘The Royal Block’, Melbourne Showgrounds, Epsom Road, Ascot Vale (Enter via Gate 5, Lang’s Road)
Registered office & principal place of business 140 Dawson Street, Brunswick Victoria 3056, ACN 004 277 089, ABN 23 004 277 089
AuditorDeloitte Touche Tohmatsu
This publication is produced on ecoStar Coated that contains 100% recycled post consumer waste & is produed at an FSC certified, process chlorine free paper mill under an ISO 14001 environmental management system. ecoStar coated is certified carbon neutral.Printing by Complete Colour, an ISO 14001 environmental management system & ISO 9001 quality management system certifiedprinter with FSC (Chain of Custody) certification & Sustainability Victoria Wastewise Gold certification.This publication is fully recyclable, please dispose of wisely.
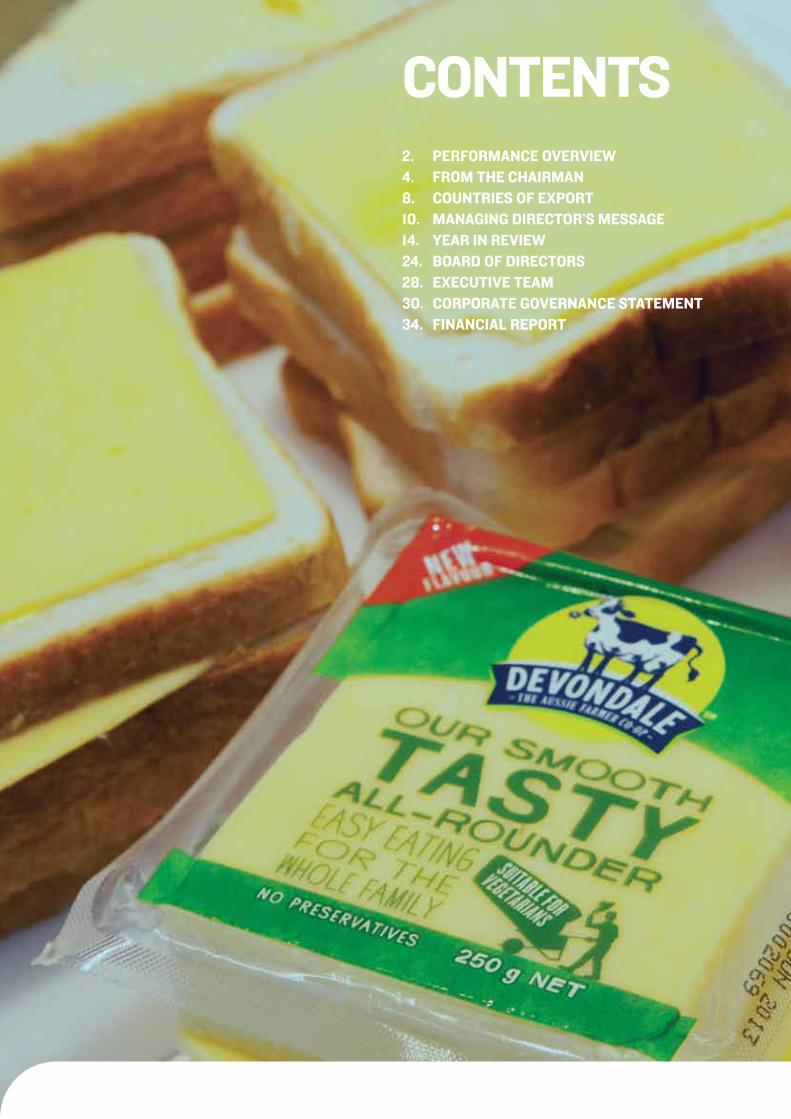
2. performance overview4. from the chairman8. countries of export10. managing director’s message14. year in review24. board of directors28. executive team30. corporate governance statement34. financial report
contents

2
MU
RR
AY G
OU
LBU
RN
AN
NU
AL R
EPO
RT
2
012
performance overview
milk intake (MiLLiON LiTRES)
2002/2003
2003/2004
2004/2005
2005/2006
2006/2007
2007/2008
2008/2009
2009/2010
2010/2011
2011/2012
3,635
3,506
3,548
3,599
3,335
3,250
3,261
2,864
2,827
2,936
sales revenue($AUD 000)
1,628,299
1,596,749
1,827,375
1,982,377
2,119,342
2,571,863
2,329,285
2,163,441
2,287,492
2,367,231
2002/2003
2003/2004
2004/2005
2005/2006
2006/2007
2007/2008
2008/2009
2009/2010
2010/2011
2011/2012
murray goulburn at a glance
Year Ended 30 June 2012
Year Ended 30 June 2011
Change (%)
Final Average Milk Price ($/kg MS) 5.44 5.64 -3.5
Ordinary Dividend Declared or Paid – per share (cents) 12 12 –
Ordinary Dividend Declared or Paid – total value ($million) 27.4 26.2 4.6
Sales Revenue ($million) 2,367 2,287 3.5
Underlying Net Profit after Tax ($million) 37.7 37.3 1.1
Reported Statutory Net Profit after Tax ($million) 14.5 36.3 -60.2

3
MU
RR
AY G
OU
LBU
RN
AN
NU
AL R
EPO
RT
2
012
“ we delivered a final weighted-average farmgate milk price of $5.44 per kilogram of milk solids – third highest on record – while simultaneously implementing a number of strategic and structural changes across the business” gary Helou, managing Director
production (TONNES)
616,699
612,128
637,331
644,715
641,348
668,526
746,411
718,542
690,836
739,545
2002/2003
2003/2004
2004/2005
2005/2006
2006/2007
2007/2008
2008/2009
2009/2010
2010/2011
2011/2012
equity($AUD 000)
506,501
516,820
575,105
615,102
657,355
758,524
727,040
719,003
788,469
759,035
2002/2003
2003/2004
2004/2005
2005/2006
2006/2007
2007/2008
2008/2009
2009/2010
2010/2011
2011/2012
total assets($AUD 000)
1,187,756
1,293,345
1,404,937
1,585,540
1,482,774
1,790,157
1,577,529
1,519,281
1,530,134
1,632,228
2002/2003
2003/2004
2004/2005
2005/2006
2006/2007
2007/2008
2008/2009
2009/2010
2010/2011
2011/2012

4
MU
RR
AY G
OU
LBU
RN
AN
NU
AL R
EPO
RT
2
012
This year we have witnessed a period of extraordinary change for Murray Goulburn (“MG”) as the organisation evolves rapidly to embrace the new thinking that is required to prepare MG for an exciting future, in a world demanding more dairy foods.
Our new Managing Director, Gary Helou, took up his role in October 2011 and quickly set about transforming the business, supported by the Board and a new senior management team.
During the year, the Board and management developed a change agenda that targeted delivery of $100 million in savings from operations, with the clear intention that this will be passed on to suppliers in improved farmgate prices. Approximately $50 million in forward savings were delivered in the six months to 30 June 2012, which were factored into the new season’s opening price.
it was pleasing that MG could deliver a weighted-average farm gate price of $5.44 per kilogram of milk solids – the third highest on record, and at the same time covering the significant one-off costs associated with business transformation.
Our profit before tax was $37.7 million before significant one-off items and we declared a dividend of 12 per cent. The Board also declared a 1 for 10 bonus issue. This is the third bonus issue in recent years. it recognises the commitment shown by MG suppliers through what has been a very difficult period for the whole Australian dairy industry. As shareholders, we should be proud to own our Co-op.
Milk supply grew by 3.9 per cent ex farm – a pleasing return to growth after a decade of decline in Australian and MG milk production. Seasonal conditions in 2011–12 were generally favourable, punctuated by periods of severe flooding in some areas.
With more favourable economic and climatic conditions, MG needs to lead the industry back to a growth outlook. This will be achieved through cost leadership, innovation and increasing our focus on key customers, particularly in Australia, Asia and the Middle East.
The persistent strength of the Australian dollar has affected our competitiveness internationally. The strategic investment of capital, to achieve operating excellence, is critical to maximising our returns to suppliers. We must continue to invest in automation, with carefully targeted capital expenditure, aimed at improving both the efficiency and productivity of our plants.
The strategic importance of getting closer to our customer cannot be understated. Through innovation, we must target products
for chosen premium markets. This year we announced plans to open offices in Singapore, Vietnam and Dubai, to complement the office in Japan and the China operations.
Your Board is aware that MG will play a vital role in returning the dairy industry to growth and this is fundamentally about improved business performance and higher farmgate returns.
The way we pay our farmers is also important. The Board supported the establishment of a major review of milk pricing structures for delivery in 2012–13. The equity and fairness of the payment system is critical. The goal is to develop a milk pricing system that maximises the profitability of MG suppliers by maximising returns through the farm, processing and marketing chain of MG. All co-operative members will benefit by getting the balance right.
Commitment to governanceSince becoming MG Chairman in November 2011, my focus has been on implementation of leading corporate governance practices.
The Board has completed an update of Board and Board Committee Charters which now clearly set out the role of the Board, Board Committees and management. Key policies have been formally adopted and are now available online at www.mgc.com.au. We have also enacted an enterprise-wide risk management framework and appointed a new internal audit
function. More information on this can be found on pages 30–33 under Corporate Governance Statement.
The Board has listened to feedback regarding MG’s director elections process and re-introduced the ‘first past the post’ voting method that was recommended following an independent review. We have also outsourced the director election administration process and published the Director Election Procedure on MG’s website.
Constitutional reviewDuring 2011–12 the Board commenced a detailed review of the constitution to ensure it was consistent with the Corporations Act and that it provided for the appropriate governance and operation of MG.
Based on this review, the Board commenced a dialogue with shareholders regarding possible changes and undertook to bring proposals forward for shareholder consideration with the appropriate background information. All ordinary shareholders will have an opportunity to vote on these proposed amendments at the forthcoming 2012 Annual General Meeting.
from the chairman
“ the strategic importance of getting closer to our customer, cannot be understated. through innovation, we must target products for chosen premium markets.”

5
MU
RR
AY G
OU
LBU
RN
AN
NU
AL R
EPO
RT
2
012

6
MU
RR
AY G
OU
LBU
RN
AN
NU
AL R
EPO
RT
2
012
from the chairman (continued)
Welcome new directorsSince i joined the board in 2009 we have seen a period of rapid change at both the Board, and senior management level.
Following the 2012 Gippsland region election, all but two directors will have joined the board in the past four years. Last year Grant Davies and Stephen Mills retired after long periods of service and we thank them for their commitment to MG. We welcomed Natalie Akers to the Board as MG’s first female Director.
i must pay tribute to John Vardy, who steps down from the Board after 15 years of service. John is passionate about the co-operative and the dairy industry. He has always been determined to provide dairy farmers with a farmgate price that allowed them to grow their businesses and to attract young people to the industry. Although John is retiring from the Board, we know he will never lose this passion and will always be the strongest advocate for co-operatives and higher returns for farmers.
Thank you to all the Directors for their support during 2011–12, my inaugural year as Chairman. Thank you also to the shareholders that have supported the revitalisation of MG.
The pace of change at MG has been challenging for employees and there has been an incredible amount of work conducted behind the scenes supporting our change agenda. Thank you to Managing Director Gary Helou, the management team and to all the staff from head office and across our regional network for their exceptional efforts this year.
All shareholders, large and small, contribute to the co-operative and we all benefit by being part of MG. This is an exciting time in the history of our great organisation and i look forward to welcoming you to the AGM on 28 November 2012.
Philip Tracy Chairman

7
MU
RR
AY G
OU
LBU
RN
AN
NU
AL R
EPO
RT
2
012

8
MU
RR
AY G
OU
LBU
RN
AN
NU
AL R
EPO
RT
2
012
countries of export
FranCegermany
great brItaIn (uK)IrelanD
netHerlanDSSpaIn
SWItZerlanD
CoSta rICaDomInICan republIC
el SalVaDorguatemala
meXICopanama
perupuerto rICo
trInIDaD anD tobago
CanaDaunIteD StateS
gHanaIVory CoaStmaurItIuSmoroCCo

9
MU
RR
AY G
OU
LBU
RN
AN
NU
AL R
EPO
RT
2
012
ruSSIan FeDeratIon
FIJIguam
neW CaleDonIaneW ZealanD
Solomon ISlanDStonga
VanuatuWeStern Samoa
aZerbaIJanbanglaDeSH
egyptIran
paKIStanSauDI arabIa
SrI lanKaunIteD arab emIrateS
yemen
bruneICHIna
Hong KongInDoneSIa
JapanmalaySIa
papua neW guIneapHIlIppIneSSIngapore
SoutH KoreataIWan
tHaIlanDVIetnam
gHanaIVory CoaStmaurItIuSmoroCCo
2011–12 eXport Volume total Volume 304k tonnes
Asia (77%)
Middle East/ Africa (10%)
The Americas
(6%)
Other (7%)
Domestic (51%)
Export (49%)
2011–12 SaleS reVenuetotal revenue $2.4 billion (incl. MG Trading Stores)

10
MU
RR
AY G
OU
LBU
RN
AN
NU
AL R
EPO
RT
2
012
managing director’s messageMurray Goulburn (MG) is Australia’s largest dairy food company and is the “Aussie Farmer Co-op”. Accordingly, MG holds a unique leadership position in the Australian dairy industry. A rich mix of dairy ingredients, retail foods, food service and farm trading stores provides MG with a balanced portfolio of dairy food products that we can proudly sell to Australia and the world.
Since my commencement as Managing Director in October 2011, the Board and Executive team have established an exciting change agenda to return MG and the Australian dairy industry to growth. Growth in production, markets and supplier farmgate returns.
The MG team was able to deliver our dairy farmer – shareholders a final weighted average farmgate price of $5.44 per kilogram of milk solids – the third highest on record – while simultaneously delivering a number of strategic and structural changes across the business.
The farmgate milk price was delivered against a backdrop of falling dairy commodity prices in the latter half of 2011–12. Despite continued strong demand for dairy foods in Southeast Asia, China and the Middle East, dairy ingredient prices declined on the back of record growth in supply from the major exporting regions, the United States of America, Australia, the European Union and New Zealand. The Australian dollar also continued to trade at historically high levels reducing returns for MG and its dairy farmers.
MG’s milk intake ex-farm grew by 3.9 per cent to 2.94 billion litres. This included significant growth in northern Victoria and southern Riverina as these regions recovered from several years of difficult seasonal conditions.
Underlying profit after tax was $37.7 million before significant one-off costs were taken into account. After one-off costs, which included staff redundancies, the reported statutory net profit after tax was $14.5 million. The Board declared a dividend of 12 per cent as well as 1 for 10 bonus issue. Total revenue increased by 3.5 per cent to $2.4 billion, including $1.2 billion from export sales.
mg’s change agendaimportantly, the MG team wasted little time in 2011–12 to lay the foundations for an exciting future built on profitable growth, operating excellence and innovation. We put in place an immediate change agenda focused on simplifying our organisational structure, upgrading people’s skills, significantly lowering our costs, removing idle assets and balancing our business portfolio.
We undertook a review of the company’s cost base with the goal of reducing MG’s operating costs by $100 million and returning these savings to dairy farmer – shareholders. Consequently many areas of the business were identified for rationalisation and consolidation and the total workforce was reduced significantly. This rationalisation incurred a significant level of one-off costs which were taken to account in 2011–12. These initiatives delivered approximately $50 million savings in the 2012–13 year budget and factored into the new season’s opening price.
A review of other costs including procurement and supply chain efficiencies were instigated and further significant potential savings were identified for delivery in the coming year. We expect more than $50 million additional savings will be delivered during the course of the 2012–13 year.
marketingDairy Foods is an attractive business sector that is underpinned by significant growth in many emerging markets around the globe. MG’s strategic focus lies in our immediate regions of Asia, Pacific and the Middle East. These are exciting markets with large populations and growing spending power
and importantly increasing per capita dairy foods consumption.
in order to capitalise on these emerging market opportunities, MG needs to be better connected to consumers and customers. Market proximity and customer connectivity are key enablers. ZThis year we announced plans to establish an office in Dubai to service the Middle East and North Africa; a regional headquarters for Asia in Singapore and a representative office also in Vietnam. These offices will complement our existing presence in Japan and China. This will enable MG to better understand consumer requirements and deliver superior products and services as we chart long lasting relationships in these exciting future markets.
in the domestic market, our Devondale brand will be revamped, refreshed and relaunched during the course of 2012–13 to capitalise on its deep heritage with Australian consumers and wide presence across many segments within the dairy foods cabinet.
The strategic investment of capital to achieve operating excellence and innovation is critical to remain competitive and meet consumers’ changing expectations around product taste and convenience. During the next 12 months, the Board will consider plans for investment of approximately $200 million to provide leading-edge cheese, UHT milk and butter/spreads manufacturing facilities that will generate global cost leadership and innovation to consumers in our chosen markets.
our peopleMG people are key to our transformational growth plans. We have an expansionist view of the Dairy Foods markets, which will only be fuelled by energetic and entrepreneurial dairy people. A formal people and culture function was established within the business for the first time to drive best-practice development of our human resources and the fostering of an enterprising and growth culture. Talent attraction, development and retention are cornerstone enablers in our journey to Dairy Foods leadership.

11
MU
RR
AY G
OU
LBU
RN
AN
NU
AL R
EPO
RT
2
012
the futureMG is one of Australia’s biggest and most exciting food businesses. it has enormous growth and prosperity potential in the domestic and international markets. Our future is both bright and promising given our unique industry position, the strength of our brands, market growth outlook and relationships in key markets. Our people will exhibit the creativity and flexibility needed to deliver our ambition of becoming the First Choice Dairy Foods Company.
i would like to sincerely thank my Chairman Phil Tracy and the Board of Directors for their leadership and support. i also thank my Executive Management Team and all employees for their commitment and hard work.
MG is well placed to take advantage of an exciting future that will return MG and the Australian dairy industry back to profitable growth.
Gary Helou Managing Director

12
MU
RR
AY G
OU
LBU
RN
AN
NU
AL R
EPO
RT
2
012

13
MU
RR
AY G
OU
LBU
RN
AN
NU
AL R
EPO
RT
2
012
“ mg is well placed to take advantage of an exciting future that will return mg and the australian dairy industry back to profitable growth.”

14
MU
RR
AY G
OU
LBU
RN
AN
NU
AL R
EPO
RT
2
012
During 2011–12, total Australian product sales for MG’s retail and food service business reached $830 million, with growth of 10 per cent compared to the previous year.
MG’s retail business is an important and growing sector which covers a wide range of products for the Australian consumer. They now represent more than 35 per cent of company sales.
MG’s marketing campaigns, television commercials and Facebook pages, ensured its products were top of mind for Australian consumers.
DeVonDaleAs one of the top grocery brands in Australia, Devondale is the only major national brand to span the key dairy categories of milk, butters, spreads and cheese.
Devondale long-life milk performed strongly and continued to lead the market. in 2011–12 MG’s long life milk sales volume grew 4.4 per cent in a market that grew 3.4 per cent. Devondale dairy blends and Devondale block cheese also increased market share, with block cheese becoming the market-leading brand in Woolworths.
Television commercials demonstrated Devondale’s unique claim as a company owned by the largest community of Aussie farming families and the advantages of long life milk – ensuring household milk supplies never run out. The Devondale website was refreshed and a Facebook page for Devondale generated more than 11,000 likes.
To revitalise MG’s presence in the Australian retail market and to prepare for increased international sales, a redesign of the Devondale brand was established with a relaunch ready for 2012–13.
lIDDellSThe lactose-free LiDDELLS brand continued to perform strongly, increasing its range in supermarkets with sales revenue growing by 17.7 per cent.
KIeWa mIlKThe Kiewa brand performed well, sales revenue grew by 3.9 per cent and expanded into new categories of flavoured milk.
Corporate branDSMG’s corporate brands business manufactures and distributes private label retail products to all major supermarket chains throughout Australia. MG is a leading supplier to this specialised market segment, developed through long-term retail relationships and a history of working closely with customers to meet their requirements.
in 2011–12, MG continued to strengthen its relationships with all major retailers through regular meetings and collaboration on business plans.
FooD SerVICeThe food service division supplies restaurant kitchens and food outlets throughout Australia. in 2011–12 it achieved sales revenue growth of 10.4 per cent in a very competitive market. This year, the focus was on consolidating customer engagement, service levels and relationships and these efforts were rewarded by a NAFDA Chairman’s Award for excellence in the food service industry.
mg nutrItIonalSMG Nutritionals markets and sells specialised nutritional products backed by research and clinical trials. in 2011–12, MG Nutritionals achieved sales revenue growth in the retail Ascend and Proform segment of the business. Ascend expanded into petrol and convenience channels and sponsored athletes including Olympic marathon runner Lisa Weightman, the Melbourne Heart Football Club, and the Sydney University Football Club.
MG Nutritionals’ range of infant nutrition powders, “NatraStart” continued to be marketed into China via our business in Qingdao.
MG Nutritionals also supports a portfolio of research programs, from human clinical trials through to participation in the dairy Health & Nutrition Consortium. Research partners include universities from across the country and the Victorian Department of Primary industries.
retail and Food Service businessDuring 2011–12, total Australian sales for MG’s retail and food service business reached $830 million, with growth of 10 per cent compared to the previous year.
$830 million retail and food service business revenue 10%
growth in sales across most products 7 new products launched this year
year in review

15
MU
RR
AY G
OU
LBU
RN
AN
NU
AL R
EPO
RT
2
012

“ today, food ingredients represent the single largest contribution to mg’s annual revenue.”

17
MU
RR
AY G
OU
LBU
RN
AN
NU
AL R
EPO
RT
2
012
Since the formation of MG in 1950, the co-operative has been committed to establishing and maintaining a leading position as a global supplier of food ingredients. Today, food ingredients represent the single largest contribution to MG’s annual revenue.
ingredients sales for the year totalled $1.3 billion and this result is 1.1 per cent higher than the previous year. Sales volumes for the year totalled 350,535 tonnes, an increase of 15,721 tonnes.
Value-aDD rangeDuring the year, MG achieved sales growth in its value-add range of ingredients, particularly specialty fats and specialty powders. increased production of speciality ingredients provided higher margins and reduced MG’s exposure to the more price volatile markets.
MG grew the value-add powders category by 51 per cent, with most significant growth in the Growing Up Milk Powder (GUMPS) category. The specialty fats category grew by 11 per cent. The growth in specialty fats is expected to continue which will underpin a planned investment to further increase cream cheese capacity at our Kiewa site.
traDIng ConDItIonSOn the global market, trading conditions were tough due to increased milk production in almost all of the main dairy trading countries. Prices gradually eased throughout the first half of 2011–12 and then strongly declined in the second half. At the end of the financial year, prices were above historic averages but were not sustainable in today’s operating environment.
New Zealand had almost perfect seasonal conditions and recorded a massive increase in milk production of more than 10 per cent. A long shoulder of production toward the end of the season contributed to the over-supply to the market and led to a strong decline in prices. Australia recorded 4 per cent growth, while the European Union (EU), the United States of America (US) and Argentina grew 1 per cent, 2.7 per cent and 11 per cent respectively. The combined mlk supply growth of New Zealand, EU and the US during 2011–12 was 6.65 billion litres.
international demand for dairy remained relatively strong, although domestic demand in the USA and Europe was down due to economic hardship.
Demand in our major market, Japan, provided modest growth as a result of milk production decline in Japan of around 3.2 per cent. Growth in south-east Asian and Middle Eastern markets remained strong.
negotIatIng toWarDS Free traDeThe lack of progress in free trade negotiations during 2011–12 was disappointing. Despite having reached agreement, the free trade discussions with Korea were placed on the back burner and remained stalled. This is despite Korea successfully completing negotiations with the EU and the US.
The lack of progress on a Free Trade Agreement (FTA) with China means the Australian dairy industry loses ground annually to New Zealand, which successfully negotiated a FTA with China in 2008. Each year New Zealand’s advantage over Australia grows as duty free allowances increase and tariffs decrease relative to Australia. By 2019, New Zealand will enjoy tariff free trading with China across the dairy category. We encourage the Australian government to make more progress in this important growth market during the next financial year.
tHe FutureLooking ahead, the medium to long-term prospects continue to appear favourable for the dairy sector. Global demand is expected to continue growing strongly as the middle classes in developing regions expand in terms of wealth and dietary requirements. Given our extensive range of ingredients products and global network of relationships, MG is well positioned to serve these emerging markets.
year in review (continued)
Ingredients An increase of global milk supply caused a weakening of dairy ingredient prices during the latter part of 2011–12. Despite this MG ingredients achieved growth including in key value-add areas.
$1.3 billiontotal sales value 1.1%
Increase in ingredients sales revenue
350,535 tonnes ingredient sales volume

18
MU
RR
AY G
OU
LBU
RN
AN
NU
AL R
EPO
RT
2
012
The Operations division oversees the operational success of MG’s business. it ensures its workplaces are safe, the quality of its produce is high and its environmental practices are first-class.
As part of MG’s overall business restructure, cost improvement programs, focussing on productivity gains, operational efficiencies, yield improvement and waste minimisation, commenced implementation across the division. Our capital program has ensured our factories are in good working condition for the future.
The new direction has also increased MG’s focus on the safety of its most important asset: our people.
KeepIng our people SaFeMG’s ongoing commitment to occupational health and safety (OH&S) has introduced further cultural transformation and driven improved OH&S leadership across MG’s operations.
MG pro-actively identified and addressed high risk activities in 2011–12, to ensure safety controls were in place to prevent workplace injuries. Monthly workplace inspections exceeded targets and safety plans were tailored to every site and all site managers participated in a safety leadership coaching program to ensure appropriate skills were developed.
MG participated in a number of comprehensive audits at major MG sites which identified actions that were later addressed during 2011–12. MG participated in both employee and suppliers health assessment programs at MG’s trading stores and operational sites.
enSurIng our FooD SaFety IS FIrSt-ClaSSMG’s increased focus on quality assurance lifted its food safety standards even further, with a 17 per cent reduction in customer complaints. Alongside the appointment of dedicated food safety staff, the MG Nutritionals brand gained accreditation during the year with BRC Global Standards, a leading global safety and quality certification program.
DrIVIng proDuCtIon anD ImproVIng eFFICIenCyProduction output for the year was 740,000 tonnes, which was 7.1 per cent higher than last year. This comprised a larger volume of value-added products.
The placement of the Rochester dryers into a care and maintenance program did not impact on MG’s ability to process 2011–12 milk volumes and meet product mix requirements. Other operational changes this year included the closure of the Kiewa garage, improved transport efficiencies and process optimisation at its cheese plants.
enVIronmental CommItmentin 2011–12, MG began systematically analysing the environmental risks that its operations posed. As the co-operative grows, it will strengthen its methods for managing risk and broaden its scope of responsibility for the benefit of its farmer – shareholders and the communities in which it operates.
MG reports on its environmental impact with the same diligence and focus as its financial performance. in 2011–12, the co-operative reported on its environmental performance to a variety of Federal and State government programs and authorities.
Some of MG’s environmental commitments also bring financial savings to the business. For instance, MG’s Environmental Resource Efficiency Programs have grown to a portfolio of 226 and were projected to deliver an annual bottom line benefit of approximately $11 million, through water, energy, greenhouse gas and waste savings, and improvements in milk solids yield.
The Federal Government’s carbon tax will pose an additional cost of $14.1m to MG. MG’s energy reduction programs enable it to lower its carbon emissions, reducing the overall carbon cost to the business and its dairy farmer-shareholders. MG is currently developing a three-year plan to build a dairy foods manufacturing footprint to acheive global standards of operating excellence.
year in review (continued)
operations Murray Goulburn’s operational focus was on achieving a safe workplace, productivity gains, financial efficiencies, yield improvement and waste minimisation.
7processing sites
740,000tonnes of dairy production

19
MU
RR
AY G
OU
LBU
RN
AN
NU
AL R
EPO
RT
2
012

20
MU
RR
AY G
OU
LBU
RN
AN
NU
AL R
EPO
RT
2
012
year in review (continued)
MG remains 100 per cent controlled by its dairy farmer-shareholders.The co-operative plays a vital part in the daily lives of dairy farming families via milk pricing, on-farm collection, on-farm services, MG Trading Stores, information services, finance and the share office.
The Shareholder Relations division was formed in November 2011 under the restructure driven by Gary Helou, with the aim of providing an outstanding level of integrated services to MG suppliers and shareholders.
The division was established with four departments covering: milk supply and field services; MG Trading Stores; corporate affairs and shareholder information; and credit (including the share office). Combined, the division managed more than $1.35 billion in milk payments and trading store revenues.
SerVICIng DaIry FarmerSin 2011–12, the milk supply and field services division serviced 2,497 MG suppliers who supplied 2.94 billion litres of milk – 3.9 per cent up on the previous year. Milk supply from northern Victoria and the southern Riverina increased more than 13 per cent on the back of improved water availability, while supplies from the western and Gippsland regions remained steady.
Regionally-located field service teams maintained strong relationships with dairy farmer – suppliers and supported queries relating to farm income estimates, finance, milk quality and share matters.
The milk supply unit also managed our commercial milk supply business, selling bulk raw milk to other dairy businesses. This included substantial sales in South Australia and sales to a number of smaller niche-market players in areas such as specialty cheese.
Our information and credit unit successfully managed almost $1.2 billion in milk receipts and serviced more than 15,432 ordinary and preference shareholders, who hold more than 275 million MG shares.
MG Trading revenue grew 10 per cent to $185 million and the business provided a solid profit result and return on capital. in addition, MG Trading rebated $3.97 million to shareholders. Non-core stores in Barham and Myrtleford were successfully sold and the Nathalia store was closed to be redeveloped as a fuel asset. New stores or redevelopments commenced in Foster, Numurkah, Wonthaggi, Corryong and Eskdale.
MG celebrated the graduation of the inaugural group of suppliers from the Supplier Development Program. The program provided suppliers with a detailed overview of the MG business and the grounding for future shareholder participation and leadership.
The corporate affairs team supported a higher level of shareholder communications including the MD’s quarterly update, the Devondaler newspaper, several major company announcements and the formation of the inaugural supplier consultative groups.
SupportIng tHe CommunItyMG is proud to support national and local charities and community groups across Australia. in 2011–12, this included a major donation of $110,000 to Foodbank Australia in a combined effort from Australia’s major dairy companies to provide a million litres of milk to 18,000 Victorians experiencing hardship. MG provided sponsorship to the Australian Dairy Conference, South Gippsland Dairy Expo and to numerous local sporting clubs and events.
tHe FutureThe shareholder relations team will be leading the review of MG’s milk pricing mechanism to underpin a sustainable farm sector and the provision of other services that are highly valued by shareholders. We also aim to grow the MG Trading business and improve all aspects of service and communication.
Shareholder relationsin 2011–12, the shareholder relations division managed more than $1.35 billion in milk payments and trading store revenues
$185 millionmg trading revenue grew 10 per cent to 2.94 billion
litres milk supplied ex-farm
$1.35 billion milk payments and trading store revenues managed

21
MU
RR
AY G
OU
LBU
RN
AN
NU
AL R
EPO
RT
2
012

22
MU
RR
AY G
OU
LBU
RN
AN
NU
AL R
EPO
RT
2
012
“ the people and culture strategy is guided by the overall goal to attract high-calibre employees with strong leadership skills and diverse experience to work with existing talent to build a high-performance organisation.”

23
MU
RR
AY G
OU
LBU
RN
AN
NU
AL R
EPO
RT
2
012
year in review (continued)
eStablISHIng tHe teamThe People and Culture function was created in May 2012 following a full review by Deloitte of MG’s human resource systems and practices. Managing Director Gary Helou, along with his newly established executive team, recognised the need to refocus this area to attract, retain and develop the best people to MG and to create a safe, smart, streamlined work environment.
The People and Culture team is building presence across all areas of our business, including our manufacturing sites, and working with functional leadership teams to align people and culture programs with business imperatives.
The People and Culture strategy is guided by the overall goal to attract high-calibre employees with strong leadership skills and diverse experience to work with existing talent to build a high-performance organisation. The combination of technical knowledge and a deep understanding of the industry combined with new capabilities and insights will be a key foundation of Murray Goulburn’s success going forward.
DeSIgnIng tHe FounDatIonSWe have commenced development of our values as a business – the non negotiable attributes of Murray Goulburn that we want all of our employees to ‘sign up to’.
We also commenced a performance management process for all employees that will bring rigour and alignment in goal-setting and creating clear accountabilities. We have begun to work with managers to build their capability in all aspects of performance management.
people and CultureThe new People and Culture team is driving best-practice people management and increased efficiencies.

24
MU
RR
AY G
OU
LBU
RN
AN
NU
AL R
EPO
RT
2
012
board of directors
Gary Helou was appointed as Managing Director in October 2011.
Gary brings experience from a broad range of roles encompassing the international and domestic food and agricultural industries. Prior to joining Murray Goulburn, he was Chief Executive Officer of SunRice for 11 years. He has a Chemical Engineering Degree and a Master of Commerce (Marketing) from the University of New South Wales.
Natalie Akers was elected to the Board in 2011. She sits on the Compliance and Supplier Relations Committees.
Natalie is a dairyfarmer, milking 600 cows at Tallygaroopna, in northern Victoria. She has a Bachelor of Public Policy and Management with honours, a Bachelor of Arts and has completed the Fairley Leadership Program. Natalie was Chief Executive of Murray Dairy from 2008 to 2010 and is a member of the Australian institute of Company Directors.
Philip W. Tracy was elected to the Board in 2009 and elected Chairman in 2011. He is also Chairman of the Remuneration and Nominations Committee.
Philip is a dairyfarmer, milking 800 cows at Yanakie in Gippsland, Victoria. He is a chartered accountant and has a Bachelor of Economics and Commerce and is a graduate of the Australian institute of Company Directors.
gary HeloumanagIng DIreCtor
philip W. tracyCHaIrman
natalie akersComplIanCe anD SupplIer relatIonS CommItteeS
John T. Vardy was elected to the Board in 1998 and was Deputy Chairman from 2009 to 2011. He sits on the Finance, Risk and Audit Committee and the Supplier Relations Committee. He was Chairman of the Supplier Relations Committee for six years.
John is a dairyfarmer, milking 2,000 cows on three farms in the Maffra district. He also runs a large-scale hay and silage business for three farms and contracting business for 2,000 crossbred lambs on crop in the summer. He has a diploma from Company Directors (ANU).
John t. VardyFInanCe, rISK anD auDIt anD SupplIer relatIonS CommItteeS

25
MU
RR
AY G
OU
LBU
RN
AN
NU
AL R
EPO
RT
2
012
William T. Bodman was elected to the Board in 2009 and elected joint Deputy Chairman in 2011. He also sits on the Compliance, Supplier Relations and Remuneration and Nominations Committees.
William (Bill) is a dairyfarmer, milking 250 cows at Won Wron in Gippsland, Victoria. He has a Bachelor of Agricultural Science Degree from La Trobe University and is a member and graduate of the Australian institute of Company Directors.
Donald F. Howard was elected to the Board in 1997. He is Chairman of the Compliance Committee and also sits on the Supplier Relations Committee.
Donald (Don) is a dairyfarmer, milking 330 cows at Tandarook in western Victoria. He has a diploma from Company Directors (ANU) and is a Member of the Australian institute of Company Directors. He is also a Director of Cobden & Districts Community Finance Limited.
Kenneth W. Jones was elected to the Board in 2008 and elected joint Deputy Chairman in 2011. He sits on the Finance, Risk and Audit, Supplier Relations and Remuneration and Nominations Committees.
Kenneth (Ken) is a dairyfarmer, milking 340 cows at Kergunyah in north east Victoria. He has an Advanced Diploma in Agriculture and is a Member of the Australian institute of Company Directors.
Graham N. Munzel was elected to the Board in 2008. He sits on the Finance, Risk and Audit Committee and the Supplier Relations Committee.
Graham is a dairyfarmer, milking 270 cows at Gunbower in northern Victoria. He is a graduate of the Australian institute of Company Directors.
William t. bodmanJoInt Deputy CHaIrman
Kenneth W. JonesJoInt Deputy CHaIrman
Donald F. HowardCHaIrman oF tHe ComplIanCe CommIttee
graham n. munzelFInanCe, rISK anD auDIt anD SupplIer relatIonS CommItteeS

26
MU
RR
AY G
OU
LBU
RN
AN
NU
AL R
EPO
RT
2
012
board of directors (continued)
John P. Pye was elected to the Board in 2005. He is Chairman of the Supplier Relations Committee and a member of the Compliance Committee.
John is a dairyfarmer, milking 400 cows at Bessiebelle in western Victoria. He has an Advanced Diploma of Agriculture and is a member of the Australian institute of Company Directors. He is a member of Powercor’s customer consultative committee and a former director of Southern Rural Water Authority (2002 to 2010).
Martin J. Van de Wouw was elected to the Board in 2010. He sits on the Finance, Risk and Audit Committee and the Supplier Relations Committee.
Martin is a dairyfarmer, milking 280 cows at Princetown in western Victoria. He has supplied Murray Goulburn for 36 years. Martin has completed numerous farm management courses and is involved with the West Vic Dairy Board and the United Dairyfarmers of Victoria.
John p. pyeCHaIrman oF tHe SupplIer relatIonS CommIttee
martin J. Van de WouwFInanCe, rISK anD auDIt anD SupplIer relatIonS CommItteeS
Peter J.O. Hawkins (BCA (Hons) FAiCD SFFin FAiM ACA (NZ)) was elected to the Board in 2009 as a Special Director. He is Chairman of the Finance, Risk and Audit Committee and also sits on the Remuneration and Nominations Committee.
Peter has had a 41-year career in the banking and financial services industry in Australia and overseas at the highest levels of management and directorship of major organisations. He held various senior management and directorship positions with Australia and New Zealand Banking Group Limited from 1971 to 2005, including Managing Director of ANZ Banking Group (NZ) Ltd from 1992 to 1995 and was also a Director of BHP (NZ) Steel Limited from 1990 to 1991, iNG Australia Limited from 2002 to 2005 and Esanda Finance Corporation from 2002 to 2005.
He is currently a Director of Westpac Banking Corporation, Mirvac Limited Group, Liberty Financial Pty Limited, Treasury Corporation of Victoria and Clayton Utz.
peter J.o. HawkinsCHaIrman oF tHe FInanCe, rISK anD auDIt CommIttee

27
MU
RR
AY G
OU
LBU
RN
AN
NU
AL R
EPO
RT
2
012

28
MU
RR
AY G
OU
LBU
RN
AN
NU
AL R
EPO
RT
2
012
executive team
Gary Helou was appointed as Managing Director in October 2011.
Gary brings experience from a broad range of roles encompassing the international and domestic food and agricultural industries. Prior to joining Murray Goulburn, he was Chief Executive Officer of SunRice for 11 years. Gary held senior leadership roles in Hong Kong, Singapore and indonesia with Pacific Brands Food Group and indofood. He has a Chemical Engineering Degree and a Master of Commerce (Marketing) from the University of New South Wales.
Fiona Smith was appointed Company Secretary and General Counsel in January 2012.
Prior to joining Murray Goulburn, Fiona was Deputy Company Secretary at BHP Billiton Limited for four years. She has also been employed as General Counsel/Company Secretary of Gasnet Australia, an ASX listed company for seven years and has held a number of senior legal positions including principal solicitor with the Australian Government Solicitor. She has over 25 years’ legal experience and is a Fellow of the institute of Chartered Secretaries.
David Noonan was appointed Chief Financial Officer on 23 March 2012.
Prior to joining Murray Goulburn, David was the CFO of the Laminex Group within Fletcher Building. David also held senior finance roles at OneSteel, Smorgon Steel and Amcor.
David started his career at Price Waterhouse where he worked for 7 years, including a 2 year secondment in Philadelphia USA. David is a member of the institute of Chartered Accountants.
Neil Longstaff has served as a senior executive at Murray Goulburn for over 13 years, and was appointed to lead the Commercial Group, including the international and domestic sales, marketing and innovation teams, in December 2011. Neil was appointed interim CEO for the period July 2011 to September 2011. Previously he carried out the role of General Manager Consumer Marketing and Sales.
Prior to joining MG, Neil’s career encompassed a number of high profile brands, including SPC, Heinz, Nabisco and Kiwi shoe polish. Neil’s qualifications also include a graduate Certificate in Management, Monash Mt Eliza Business School.
gary Helou, be (Hons), mComm, FaICD, FaImmanagIng DIreCtor
Fiona Smith, bSc, llb, gDipgovCompany SeCretary anD general CounSel
David noonan, bec, aCaCHIeF FInanCIal oFFICer
neil longstaff – bachelor of business (marketing), monash universitygeneral manager – CommerCIal group

29
MU
RR
AY G
OU
LBU
RN
AN
NU
AL R
EPO
RT
2
012
Robert Poole was appointed General Manager Shareholder Relations in November 2011. Prior to this appointment Robert was MG’s General Manager industry and Government Affairs for three years. Robert has held a number of senior roles throughout his career including Deputy Chief Executive Officer of Australian Dairy Farmers’ Federation, general manager of the Australian Dairy Herd improvement Scheme and a regional manager with Rural Finance Corporation. in 2011 – 12 Robert also held leadership roles within the dairy industry including President of the Australian Dairy Products Federation and Deputy Chairman of the Australian Dairy industry Council. Robert studied science (Agriculture) at Melbourne University and was inducted as a Master of Business Leadership at RMiT University in 2004.
Keith Mentiplay was appointed General Manager Operations in December 2011.
Prior to joining Murray Goulburn, Keith spent 14 years at National Foods in a variety of general management, national and international operations roles with eight years as an executive team member.
Before National Foods he worked with Nestle, Pacific Dunlop, Dairy Farmers Milk Co-operative and Southern Farmers. Keith has worked in the Australian dairy industry for over 35 years and over that time has been active in industry representation.
He attained an MBA from Macquarie University in 1992.
robert poole, bagSci (melb), master of business leadership (rmIt)general manager – SHareHolDer relatIonS
Keith mentiplay, Dip Dairy tech, mbageneral manager operatIonS

30
MU
RR
AY G
OU
LBU
RN
AN
NU
AL R
EPO
RT
2
012
IntroductionThis section of the Annual Report outlines Murray Goulburn’s governance framework.
Murray Goulburn is committed to ensuring that its policies and practices reflect a high standard of corporate governance. The Directors consider that Murray Goulburn’s governance framework and adherence to that framework are fundamental in demonstrating that the Directors are accountable to shareholders and are appropriately overseeing the management of risk and the future direction of the Company. Although as an unlisted company Murray Goulburn is not required to comply with the ASX Corporate Governance Principles and Recommendations, this year the Directors have decided to release a Corporate Governance Statement to enhance transparency and communication with stakeholders in relation to the Company’s corporate governance practices.
This year has seen a strengthening of corporate governance throughout the Company with the introduction of Board and Committee Charters and Board policies. Copies of all these documents, including a copy of the Constitution can be found at www.mgc.com.au/aboutus/corporategoverance.
responsibilities of the board and managementtHe boarDDirectors are accountable to the shareholders for the Company’s performance and governance. Management is responsible for implementing the Company’s strategy and objectives, and for carrying out the day-to-day management and control of the Company’s affairs.
The Board has adopted a Board Charter which sets out those functions reserved for the Board and those delegated to management. The Board’s responsibilities, as set out in the Board Charter, include:
• the appointment, remuneration and succession planning of the Managing Director and his direct reports;
• approval of the overall corporate strategy, including setting corporate objectives, performance objectives and approving the annual budget;
• overseeing risk management, internal control and ethical and legal compliance which includes the identification of the main risks associated with the Company’s businesses and the implementation of appropriate systems to manage these risks;
• monitoring corporate performance and implementation of corporate objectives, strategy and policy;
• approving major capital expenditure, acquisitions and divestitures, and monitoring capital management;
• monitoring and reviewing management processes aimed at ensuring the integrity of financial and other reporting;
• developing the Company’s corporate governance principles and policies; and
• determining matters that are required by the Constitution or prescribed by law.
DelegatIon to managementThe Board has delegated to the Managing Director and, through the Managing Director, to other senior executives, responsibility for the day-to-day management of the Company’s affairs and implementation of the Company’s strategy and policy initiatives. The Managing Director and senior executives operate in accordance with Board approved policies and delegated limits of authority.
Structure of the boardThe Board currently has 11 Directors. Of these, nine (including the Chairman) are elected from the shareholder base (Supplier Directors), one is the Managing Director and one is a Special Director.
The Special Director is selected by taking into account the skills and competencies that the Board considers are necessary to augment the direct industry knowledge and other expertise provided by the Supplier Directors.
The Supplier Directors must be current suppliers to the Company and hold 10,000 shares to be eligible for election.
Details of the number of meetings attended by each Director are set out on page 38 of the Directors’ Report.
The qualifications of each Committee member are set out on pages 28–29.
CommItteeSTo assist the Board to carry out its responsibilities, the Board has established a Finance, Risk and Audit Committee, a Remuneration and Nominations Committee, a Compliance Committee and a Supplier Relations Committee.
These Committees review matters on behalf of the Board and, as determined by the relevant Charter:
• refer matters to the Board for decision, with a recommendation from the Committee; or
• determine matters (where the Committee acts with delegated authority), which the Committee then reports to the Board.
Each of these Committees has a Committee Charter which sets out the membership structure, roles and responsibilities and meeting procedures.The Company Secretary provides secretarial support for each Committee.
Finance, risk and Audit Committee
The Finance, Risk and Audit Committee assists the Board in fulfilling its responsibilities in respect of the Company’s external audit functions, internal audit functions, risk management and identification, preparation of financial statements and reporting systems, and internal accounting and control systems.
The Committee consists of:
• a minimum of 3 members of the Board, all of whom are non-executive directors;
• a majority of independent directors; and
• an independent chair, who is not chair of the Board.
The Finance, Risk and Audit Committee replaced the separate Finance and Audit Committees of the Board and has met twice since its inception in January 2012. The members of the Finance, Risk and
corporate governance statement

31
MU
RR
AY G
OU
LBU
RN
AN
NU
AL R
EPO
RT
2
012
corporate governance statement Audit Committee during the relevant period were:
• Peter Hawkins, Chairman
• Ken Jones, Deputy Chairman
• Graham Munzel
• Martin Van de Wouw
• John Vardy
Non-committee members, including members of management and the external auditor, may attend meetings of the Committee at the invitation of the Committee chair.
The Committee’s key responsibilities and functions are:
• appointment, independence and remuneration of the internal and external auditors;
• overseeing the internal audit functions generally and approving the annual internal audit plan;
• to assist the Board in relation to the reporting of financial information;
• to assist the Board in relation to the approval,application and amendment of accounting policies;
• to manage the process of identification and management of material risk;
• to review the draft annual budget before it is submitted to the Board for approval; and
• oversee any other financial review matters delegated to the Committee by the Board from time to time.
risk Management
The Board has adopted the Risk Management Policy which sets out the objectives regarding risk management and outlines the approach to managing risks.
The Policy recognises that the effective identification and management of risk reduces the uncertainty associated in executing the Company’s business strategies.The Board plays a key role in the oversight of key risks by providing strategic guidance on all aspects of risk management across the Company, approving annually the Company risk profile, reviewing, ratifying and monitoring systems of risk management and setting the risk management tone and expectations across the Company.
The Board is supported in this role by the Finance, Risk and Audit Committee who review the ongoing risk management programme, procedures, auditing and operational risk management as well as evaluating the adequacy and effectiveness of the management reporting and control systems associated with financial and operational risk management.
remuneration and Nominations Committee
The primary role of the Remuneration and Nominations Committee is to represent the Board and assist the Board to perform its functions in relation to all key management personnel remuneration issues and the Company’s human resources strategy generally.
A secondary role of the Committee is to develop and recommend to the Board a process for identifying and selecting Special Directors from time to time, and overseeing the director induction and training programs.
The Committee must consist of:
• a minimum of 3 members of the Board, all of whom are non-executive directors;
• a majority of independent directors (as defined in the Board Charter); and
• an independent director as chair.
The Remuneration and Nominations Committee met three times since its inception in January 2012.The members of the Committee during the relevant period were:
• Philip Tracy, Chairman
• Ken Jones, Deputy Chairman
• Bill Bodman, Deputy Chairman
• Peter Hawkins
The Committee’s key responsibilities and functions are to:
• oversee the Company’s remuneration, recruitment, retention and termination policy and procedures and its application to the MD and the MD’s direct reports, and its general application to all Company employees;
• assess the performance of the MD and assist the Chair with reviews of the MD’s performance;
• review and recommend arrangements for the executive directors and the MD’s direct reports, including contract terms, annual remuneration and participation in the Company short and long term incentive plans;
• review and recommend to the Board executive succession plans, including the succession of the MD;
• oversee the Company’s human resources strategy with a view to confirming to the Board that appropriately talented and trained people are available to achieve the corporate objectives;
• make recommendations to the Board regarding the appointment of Special Directors from time to time, including the identification and selection of potential candidates; and
• oversee the directors’ induction and training programs.
Compliance Committee
The role of the Compliance Committee is to assist the Board to oversee and monitor the performance of the procedures and processes implemented by management to ensure the Company’s compliance with key legislative and regulatory requirements relevant to the Company’s operations and business.
The Committee must consist of:
• a minimum of 3 members of the Board, all of whom are non-executive directors;
• a majority of independent directors; and
• an independent chair, who is not chair of the Board.
The Board can appoint an individual who is not a director to be a member of a Committee where it considers such an appointment to be appropriate to enhance the relevant skills and experience on the Committee.
The Compliance Committee met three times during the relevant period. The members of the Committee are:
• Don Howard, Chairman
• Natalie Akers
• Bill Bodman, Deputy Chairman
• John Pye

32
MU
RR
AY G
OU
LBU
RN
AN
NU
AL R
EPO
RT
2
012
The Committee’s key responsibilities and functions include:
• reviewing, assessing and monitoring the Company’s activities and overall performance having regard to the Company’s compliance with key legislative and regulatory requirements;
• overseeing and monitoring management’s implementation of procedures and processes to ensure the Company’s compliance with key legislative and regulatory requirements relevant to the Company’s operations and business; and
• advising the Board and the Finance Risk and Audit Committee on the overall performance of the Company having regard to the Company’s compliance with key legislative and regulatory requirements.
Supplier relations Committee
The primary role of the Supplier Relations Committee is to review and monitor the Company’s effectiveness in engaging with suppliers and its relationship with suppliers generally, and to provide advice and guidance for management with regard to the Company’s communication strategy with suppliers, including the Company’s provision of regular updates of major Company developments.
All Supplier Directors are members of the Committee with the Special Director and Managing Director having a standing invitation to join the meeting. The Chairman of the Committee is John Pye.
The Supplier Relations Committee met 6 times during the relevant period.
The Committee’s key responsibilities include:
• approving the overall strategy for communication with shareholders developed by management;
• reviewing and monitoring the interface between the Company and suppliers and reviewing matters that are likely to affect that interface, including significant corporate communications;
• reviewing the standard terms and conditions for the supply of milk to the Company and make recommendations to management or the Board as appropriate;
• reviewing parameters for the variation by management of the standard terms and conditions for the supply of milk to the Company and make recommendations to the Board;
• where information relating to suppliers or milk supply is to be materially relied upon by the Board, to consider and advise the Board on the reasonableness of this information;
• receiving and considering reports from the Field Services Group in relation to their interactions with and services provided to suppliers;
• receiving and considering reports relating to the Murray Goulburn Trading Stores in relation to their interactions with and services provided to suppliers;
• reviewing any proposed amendments to Company policies or procedures which could affect the Company’s relationship with its suppliers, and making recommendations to the Board;
• providing advice and guidance for management with regard to management’s processes for managing questions and complaints lodged with the Company by suppliers; and
• providing advice and guidance for management in relation to any complaints lodged by suppliers.
Independence, performance evaluation and remunerationInDepenDenCe anD ConFlICtS oF IntereStAs all Supplier Directors have a supply relationship with the Company, they will generally not be classified as independent if the usual best practice definitions are applied.The Board has however adopted guidelines, similar to an ASX listed company to assist in considering independence.The Board only considers Directors to be independent of management where they are free from any business or other relationship that can materially interfere with, or could reasonably be perceived to interfere with, the exercise of unfettered and independent judgement. A copy of the guidelines can be found at Attachment 1 to the Board Charter at www.mgc.com.au/aboutus/corporategovernance.
Under the Corporations Act and general law, Directors must avoid situations where their interests and those of the Company conflict. The Board has adopted the Related Party and Conflicts of interest Policy to provide guidelines to Directors in complying with their obligations.
As Supplier Directors are constitutionally required to be suppliers of the Company there is an acknowledged inherent conflict of interest when the Board is required to consider setting the milk price. o manage this conflict, the Board has adopted a set of protocols to use in this scenario, as follows:
• each Director acknowledging that the interests of the Company as a whole must take priority over any personal interest they have and they must not favour one group of suppliers over another group unless to do so is fair and in the best interests of the Company as a whole;
• proposals for both the opening milk price and changes to that milk price are to be initiated and developed by management who then submit this to the whole Board for approval;
• such proposals are only submitted to the Board, if management is of the opinion that the proposal is in the best interests of the Company as a whole (recognising the Co-operative nature of the Company) and management must include the reasons for supporting the change;
corporate governance statement (continued)

33
MU
RR
AY G
OU
LBU
RN
AN
NU
AL R
EPO
RT
2
012
• to avoid perceived or actual interference by Directors in management’s initiation and development of milk price proposals the Directors agree that they will:
– refrain from discussing the milk price with management outside formal Board processes;
– all queries from suppliers in relation to milk price are to be directed to management within Shareholder Relations; and
– refrain from discussing with suppliers any proposals to change the milk price.
perFormanCe eValuatIonDuring the year, an externally facilitated evaluation of the Board was undertaken.in conducting the review the external facilitator carried out interviews with all Board members and the executive management team.The review covered the areas of the role and responsibility of the Board, composition and development of the Board and Board planning and processes.The review highlighted a number of improvement opportunities which have been implemented during the year.
remuneratIonDetails of the Company’s remuneration policy and practices and the remuneration paid to Directors and key executives are set out in the Remuneration Report on pages 39–42 of this Annual Report.
Conduct and ethicsThe Board has approved a Code of Conduct that applies to all Directors, employees, contractors, agents and representatives of the Company.
The key values underpinning the Code of Conduct are:
• the highest standards of integrity and fairness;
• all decisions must be made in accordance with the spirit and letter of applicable law; and
• business must be conducted honestly and ethically, with skill and the best judgment, and for the benefit of customers, employees, shareholders and the Company alike.
The Code provides clear direction and advice on general workplace behaviour and how to conduct business both domestically and internationally, interacting with shareholders, business partners and the communities in which we operate.
Continuous DisclosureThe Company appreciates the importance of timely and adequate disclosure to its shareholders, and is committed to making timely and balanced disclosure of all material matters and to effective communication with its shareholders so as to give them ready access to balanced and understandable information.
As an unlisted public company the Company has continuous disclosure obligations under the Corporations Act and has put in place mechanisms designed to ensure compliance with those requirements, including the Public Disclosure Policy adopted by the Board. These mechanisms also ensure accountability at a senior executive level for that compliance.
Communications with shareholders The Company is committed to effectively communicating with its shareholders. One of the Company’s key communication tools is the Company website.The website contains details of the Company’s Constitution, Board and Board Committee Charters, core governance policies, press announcements and communications to shareholders and financial information about the Company. All shareholders are encouraged to access the website on a regular basis and provide relevant feedback.
in addition, the Company regularly communicates with its shareholders through quarterly updates and through supplier meetings that are held throughout south eastern Australia twice a year.
Suppliers are encouraged to make their views known and raise with management directly any issues of concern.

34
MU
RR
AY G
OU
LBU
RN
AN
NU
AL R
EPO
RT
2
012
financial report

35
MU
RR
AY G
OU
LBU
RN
AN
NU
AL R
EPO
RT
2
012
financial report

36
MU
RR
AY G
OU
LBU
RN
AN
NU
AL R
EPO
RT
2
012
DirectorsThe directors listed on page 38 each held office as a director of the company during or since the end of the financial year except for:
• SJ O’Rourke – resigned 29 July 2011
• G Helou – appointed 3 October 2011
• GJ Davies and ST Mills – resigned 30 November 2011
• N Akers – appointed 30 November 2011
Company Secretary• Fiona Smith (BSC / LLB, Grad Dip Applied Governance, FCiS),
company secretary, joined the company in January 2012. She has experience in company secretarial roles arising from time spent in such roles in listed companies.
• D Page (B. Bus., CA), company secretary, joined the company in 2003.
principal activitiesThe principal activities of the consolidated entity constituted by the company and the entities it controlled during the year have been:
• The processing of the whole milk of its shareholder suppliers and the manufacture, marketing and distribution of dairy products.
• The operation of retail stores as a service to the suppliers.
No significant change in the nature of these activities occurred during the year.
Dividends paid or recommendedThe following dividends were paid or recommended during or since the financial year end:
a) in respect of the financial year ended 30 June 2011 as paid or recommended in the 2011 financial report:
Final dividend paid in october 2011 $000
On ordinary shares at $0.12 per share unfranked
26,168
On A class preference shares at $0.08 per share unfranked
1,244
On B class preference shares at $0.05 per share unfranked
570
On C class preference shares at $0.08 per share unfranked
1,955
total 29,937
b) in respect of the financial year ended 30 June 2012:
Final dividend recommended for payment during october 2012 (dividends declared subsequent to 30 June 2012 and therefore not recognised) $000
On ordinary shares at $0.12 per share unfranked
27,447
On A class preference shares at $0.08 per share unfranked
1,214
On B class preference shares at $0.05 per share unfranked
505
On C class preference shares at $0.08 per share unfranked
2,116
total 31,282
review of operationsThe consolidated entity reported profit after income tax of $14,467,000 (2011: $36,319,000 profit) for the financial year ended 30 June 2012.
The underlying net profit after tax(i) of the consolidated entity is $37,655,000 (2011: $37,338,000) for the financial year ended 30 June 2012. This financial information is provided to assist readers to better understand the financial performance of the underlying business.
Note2012
($000)2011
($000)
Reported profit after tax 14,467 36,319
Restructuring costs 1 18,419 –
Non-current asset impairments and inventory writedowns
2 10,631 1,456
Provisioning for historical environmental liabilities
3 4,076 –
income tax relating to components above
(9,938) (437)
underlying profit after tax 37,655 37,338
Your Directors present the following report for the financial year ended 30 June 2012.
(i) The use of the terms ‘reported’ refers to iFRS financial information and ‘underlying’ to non-iFRS financial information. Underlying earnings are categorised as non-iFRS financial information prepared in accordance with ASiC Regulatory Guide 230 – Disclosing non-iFRS financial information, issued in December 2011. Underlying adjustments have been adjusted from the reported information to assist readers to better understand the financial performance of the underlying business in each financial year. The non-iFRS financial information, whilst not subject to an audit or review, has been extracted from the financial report which has been subject to audit by our external auditors. The Reported profit after tax in each year includes depreciation expense calculated in accordance with Note 1(w).
directors’ report
37
MU
RR
AY G
OU
LBU
RN
AN
NU
AL R
EPO
RT
2
012
Underlying adjustments have been adjusted from the reported information to assist readers to better understand the financial performance of the underlying business in each financial year.
1. Restructuring costs reflect redundancy costs resulting from the announced cost reduction program.
2. Non current asset impairments relate to the write down in value of land and buildings and plant and equipment to their estimated fair value. These assets are not currently, or expected to be, utilised in the operations of the business. inventories and spares associated with assets impaired have also been written off.
3. Reflects provisioning for historical environmental remediation costs at Murray Goulburn manufacturing sites.
Future DevelopmentsDisclosure of information regarding likely developments in the operations of the consolidated entity in future financial years and the expected results of those operations is likely to result in unreasonable prejudice to the consolidated entity. Accordingly, this information has not been disclosed in this report.
Significant Changes in the State of affairsNo significant change in the state of affairs of the consolidated entity occurred during the financial year.
events Subsequent to balance DateSince 30 June 2012, the company has announced a 1 for 10 bonus issue of ordinary shares based on shareholdings as at 30 September 2012.
With the exception of the bonus issue and the declaration of dividends detailed in Note 7 ‘Unrecognised Amounts’, no matters or circumstances have arisen since the end of the financial year which significantly affected or may significantly affect the operations of the consolidated entity, the results of those operations, or the state of affairs of the consolidated entity in financial years subsequent to the financial year ended 30 June 2012.
environmental regulationsMurray Goulburn is Licensed by EPA in relation to the operation of its eight manufacturing sites throughout Victoria and one site in Tasmania pursuant to each State’s relevant Environment Protection Act. The company has continued its policy of
maintaining programs and systems, which will impact positively on reducing the environmental footprint of its manufacturing and logistical operations, through the reduction in emissions, energy use and product losses, and the maximising of re-use and recycling initiatives.
During the 2012 financial year the company has continued to further develop its Environmental Management System to improve environmental performance, increasing the scope across the organisation and improving procedures, monitoring programs, and internal reporting processes.
in line with standard EPA processes & procedures, the company did receive a number of Pollution Abatement Notices in relation to the implementation of environmental management improvements at the Cobram, Kiewa and Leongatha manufacturing sites. The company has complied with the requirements of the improvement notices in accordance with timelines agreed with EPA.
remunerationThe remuneration report containing the remuneration of key management personnel is provided on pages 39–43.
Insurance of officersDuring the financial year the company paid a premium to insure the directors and senior managers of the company. The liabilities insured include costs and expenses that may be incurred in defending civil or criminal proceedings that may be brought against the officers in their capacity as officers of the consolidated entity.
auditor’s Independence DeclarationOur auditors have provided the Board of Directors with a signed independence Declaration in accordance with section 307C of the Corporations Act 2001. This declaration is included at page 88 of this financial report.
rounding of amounts to the nearest thousand DollarsThe company is of the kind referred to in ASiC Class Order 98/0100 dated 10 July 1998, and in accordance with that Class Order amounts in the directors’ report and the financial report have been rounded off to the nearest thousand dollars.
directors’ report

38
MU
RR
AY G
OU
LBU
RN
AN
NU
AL R
EPO
RT
2
012
director’s name, position and location
Qualifications and Experience
Meetings Attended
Full Meetings
of directors (19 held)
Meetings of Committees
Finance, risk &
Audit (2 held)
Audit (2 held)
Finance (1 held)
Com-pliance
(3 held)
remun- eration &
Nominations (4 held)
Supplier relations
(6 held)
Meetings attended (Meetings held whilst a member of the Board/Committee)
PW Tracy, Chairman, Yanakie
Dairyfarmer. B. Ec & Comm, CA, SiA, GAiCD. Director since 2009.
19 * * 1 2 (2) 4 6
G Helou, Managing Director, Sydney
BE (Hons) MComm, FAiCD, FAiM. Director since 2011.
12 (12) * * * * * *
WT Bodman, Deputy Chairman, Won Wron
Dairyfarmer. B. Agr. SC., MAiCD, GAiCD. Director since 2009.
19 * * * 2 (2) 4 6
KW Jones, Deputy Chairman, Gundowring
Dairyfarmer. Advanced Diploma Agr., MAiCD. Director since 2008.
19 2 2 * * 4 6
N Akers, Tallygaroopna
Dairyfarmer. B (Hons) Public Policy and Mgt, B. Arts, MAiCD. Director since 2011.
9 (9) * * * 2 (2) * 3 (3)
GJ Davies, Former Chairman, Fish Point via Swan Hill
Dairyfarmer. MAiCD. Director since 2004.
10 (10) * * * 1 (1) * 2 (3)
PJO Hawkins, South Yarra
Special Director. BCA (Hons), FAiCD, SFFiN, FAiM,ACA (NZ). Director since 2009.
17 (19) 2 2 1 * 4 3 (3)
DF Howard, Camperdown
Dairyfarmer. Dip. Company Directors (ANU), MAiCD. Director since 1997.
19 * * 1 3 * 6
ST Mills, Numurkah
Dairyfarmer. FAiCD. Director since 2001.
10 (10) * * 1 1 (1) * 3 (3)
GN Munzel, Gunbower
Dairyfarmer. GAiCD. Director since 2008.
19 2 2 * * * 6
SJ O’Rourke, Former Managing Director, Gisborne
B.Comm, ACA. Director since 1993.
1 (1) * * 1 (1) * * *
JP Pye, Bessiebelle
Dairyfarmer. Advanced Diploma Agr., MAiCD. Director since 2005.
19 * 2 * 2 (2) * 6
MJ Van de Wouw, Timboon
Dairyfarmer. Director since 2010.
19 2 * * * * 6
JT Vardy, Maffra
Dairyfarmer. Dip. Company Directors (ANU). Director since 1998.
19 2 * 1 1 (1) * 6
Directors’ meetings
Notes, The Audit and Finance committees were merged into the Finance, Risk and Audit Committee during the year.
* Not a member of the relevant committee
The managing director attends both the Finance, Risk & Audit Committee and the Remuneration and Nominations Committee by invitation.
directors’ report
39
MU
RR
AY G
OU
LBU
RN
AN
NU
AL R
EPO
RT
2
012
remuneration report (audited)This report, which forms part of the Directors’ Report, outlines the Board’s policy for determining the nature and amount of remuneration of the key management personnel (KMP) of the Group and the relationship between this policy and the Group’s performance. The key management personnel covered by this report comprise the Directors of the Company and those senior executives within the Group that during the relevant period either had or have the authority and responsibility for planning, directing and controlling the activities of the Group. Details of these key management personnel are set out in the tables on pages 40 and 42.
During 2012 there has been significant change within the company, both from a remuneration framework and also governance perspective. The highlights were:
• the appointment of a new Managing Director, Gary Helou;
• the appointment of a new Senior Executive Team;
• a review of the remuneration structure for the new Managing Director and his direct reports which included the introduction of short term incentives underpinned by Key Performance indicators; and
• the formalisation of remuneration governance including the adoption of a Board Charter and Remuneration and Nominations Committee Charter.
remuneratIon polICyThe overall remuneration policy is adopted by the Board on the recommendation of the Remuneration and Nominations Committee. The objective of the remuneration policy is to ensure
that there is a framework of reward that aligns executive pay with the overall Company’s objective to return the maximum returns to shareholders through the combination of milk price and dividends.
in setting the appropriate remuneration for the Managing Director and his direct reports appropriate benchmarking is obtained for comparable Australian companies on the basis of revenue, industry sector and employee numbers. Further details on the remuneration structure for executives can be found below.
remuneratIon goVernanCeThe Remuneration and Nominations Committee of the Board is responsible for overseeing the Company’s remuneration policy and its application to the Managing Director and his direct reports. The remuneration arrangements for all other executives are determined by the Managing Director or relevant managers.
non-eXeCutIVe DIreCtor remuneratIonThe Company treats the remuneration structure for non-executive Directors separately from those of the executives. The non-executive Director remuneration is set by shareholders at the Annual General Meeting. This was last approved in 2011 when a base fee pool of $780,000 was approved. in addition to this base, non-executive Directors receive superannuation, retirement benefits and reimbursement for expenses incurred in undertaking their non-executive Director responsibilities. The retirement benefit is equivalent to total emoluments received in the preceding 3 years for more than 10 years continuous board service or pro rata after 6 years continuous board service until the full benefit becomes payable. The company provides for retirement benefits on an accrual basis.
directors’ report

40
MU
RR
AY G
OU
LBU
RN
NO
TiC
E O
F AG
M
201
2
Short term Post Employment
Non-executive directors
Fees & Salary
($)
Sti Cash Bonus
($)
Non Mone- tary (v)
($)
retirement Benefit
($)Superannuation
($)total
($)
Proportion of remun-eration performance
related (%)
2012
PW Tracy (i)
116,875 –
1,673 –
10,519
129,067 –
GJ Davies (ii) 62,500 – 3,371 – 5,625 71,496 –
JT Vardy 74,250 – – 10,500 6,683 91,433 –
WT Bodman 70,938 – – – 6,384 77,322 –
PJO Hawkins 66,417 – – – 5,978 72,395 –
DF Howard 66,417 – – 18,500 5,978 90,895 –
KW Jones 70,938 – – – 6,384 77,322 –
ST Mills (iii) 25,000 – – – 2,250 27,250 –
GN Munzel 61,750 – – – 5,558 67,308 –
JP Pye 66,417 – – 29,450 5,978 101,845 –
M Van de Wouw 61,750 – – – 5,558 67,308 –
N Akers (iv) 36,989 – – – 3,329 40,318 –
total 780,241 – 5,044 58,450 70,224 913,959
2011
PW Tracy 56,875 – – – 5,119 61,994 –
GJ Davies 142,187 – 12,000 88,500 12,797 255,484 –
JT Vardy 85,312 – – 40,000 7,678 132,990 –
WT Bodman 56,875 – – – 5,119 61,994 –
PJO Hawkins 56,875 – – – 5,119 61,994 –
DF Howard 56,875 – – (2,500)* 5,119 59,494 –
KW Jones 56,875 – – – 5,119 61,994 –
ST Mills 56,875 – – 25,500 5,119 87,494 –
GN Munzel 56,875 – – – 5,119 61,994 –
JP Pye 56,875 – – 99,000 5,119 160,994 –
M Van de Wouw 36,136 – – – 3,252 39,388 –
total 718,635 – 12,000 250,500 64,679 1,045,814
Details of the Non-Executive Director Remuneration are as follows:
*Negative remuneration represents a reversal of previous allocations to directors for which retirement benefit will not / has not been paid.
(i) PW Tracy was appointed Chairperson of the Board of Directors on 30 November 2011.
(ii) GJ Davies resigned from the Board of Directors on 30 November 2011. He held the position of Chairperson of the Board of Directors until that date.
(iii) ST Mills resigned from the Board of Directors on 30 November 2011.
(iv) N Akers was appointed to the Board of Directors on 30 November 2011.
(v) Non Monetary compensation includes provision of a motor vehicle to the chairperson.
directors’ report

41
MU
RR
AY G
OU
LBU
RN
NO
TiC
E O
F AG
M
201
2
eXeCutIVe remuneratIonExecutive Remuneration is made up of a mix of fixed remuneration and short-term incentives. At this time, the Company does not have any long-term incentives but this will be considered during 2013.
Fixed remuneration is determined relative to similar roles in other companies of a similar size and comprises base salary, superannuation and other benefits such as novated vehicle lease payments.
Short term incentives are performance based and are cash payments which are at the discretion of the Board. They are awarded on the achievement of performance against set key performance indicators that are set towards the beginning of the financial year and measured over the course of the year. The measures include both financial and non-financial performance criteria.
For the 2012 financial year, the Managing Director’s financial performance included delivery on financial targets including maximising milk price and non-financial performance included targets around corporate governance and development of strategic plans.
The relative proportion of executives total remuneration is set out in the table below:
roleFixed
remunerationPerformance Based remuneration (Sti)
CEO 75% 25%
Direct Reports 75% 25%
During the year the Company entered into employment contracts with the Managing Director, Gary Helou, and his direct reports. The employment contracts have no fixed term and outline the components of remuneration to be paid. All employment contracts are capable of termination by the Company or the executive on either 6 months’ written notice (for the Managing Director) or 3 months’ notice (other executives). The details of the date of those contracts with the relevant KMP can be seen in the table below. All other executives have common law employment contracts.
Name title date of Contract
Gary Helou Managing Director 3 Oct 2011
Keith Mentiplay General Manager, Operations
12 Dec 2011
David Noonan Chief Financial Officer 23 Mar 2012
Fiona Smith Company Secretary/ General Counsel
9 Jan 2012
Robert Poole General Manager, Shareholder Relations
16 Nov 2011
directors’ report

42
MU
RR
AY G
OU
LBU
RN
AN
NU
AL R
EPO
RT
2
012
Remuneration disclosed relates to the period during which each Executive Officer qualified as a Key Management Person.
Short term Long term Post Employment
Executive officers
Salary and Allowances
($)
Sti Cash Bonus
($)
Non Monetary (xi)
($)
Long Service
Leave Accrued ($)
Super-annuation
($)
termination Benefit (xii)
($)total
($)
Proportion of remuneration performance
related (%)
2012
G Helou (i) 1,227,063 226,500 – 17,311 11,832 – 1,482,706 15.3
K Mentiplay (ii) 266,494 58,969 – 4,423 9,860 – 339,746 17.4
D Noonan (iii) 118,424 – – 1,979 5,258 – 125,661 –
N Longstaff (iv) (x) 491,564 60,759 20,736 25,053 156,216 – 754,328 8.1
F Smith (v) 184,835 50,000 – 3,045 7,888 – 245,768 20.3
R Poole (vi) 172,992 52,958 9,507 2,736 12,158 – 250,351 21.2
D Page (vii) 110,228 11,475 6,454 1,837 4,526 – 134,520 8.5
SJ O’Rourke (viii) (x)
146,585 – 11,326 2,344 – 93,551 253,806 –
P Kerr (ix) (x) 236,111 – 36,785 3,479 10,205 470,000 756,580 –
total 2,954,296 460,661 84,808 62,207 217,943 563,551 4,343,466
2011
SJ O’Rourke (x) 1,709,665 – 147,482 128,353 939,630 – 2,925,130 –
P Kerr (x) 450,526 – 60,901 21,539 106,370 – 639,336 –
N Longstaff (x) 326,729 – 56,822 15,016 79,045 – 477,612 –
M Beniston 300,522 – 54,499 8,156 29,550 – 392,727 –
P Hobman 291,361 – 50,000 8,877 32,079 – 382,317 –
R Greenaway (x) 237,443 – 22,723 11,805 67,808 – 339,779 –
total 3,316,246 – 392,427 193,746 1,254,482 – 5,156,901
Details of the Executive Remuneration are as follows:
(i) G Helou was appointed Managing Director on 3rd October 2011.
(ii) K Mentiplay was appointed General Manager – Operations on 12 December 2011.
(iii) D Noonan was appointed Chief Financial Officer on 23 March 2012.
(iv) N Longstaff held the position of General Manager-Retail, Marketing, Sales until appointed General Manager – Commercial Group on 30 November 2011. He also held the position of Acting Chief Executive Officer for the period from 1 August 2011 to 2 October 2011. He has resigned subsequent to the end of the reporting period, effective 31 August 2012.
(v) F Smith was appointed Company Secretary and General Counsel on 9 January 2012.
(vi) R Poole was appointed General Manager Shareholder Relations on 16 November 2011.
(vii) D Page was appointed Acting Chief Financial Officer on 9 December 2011 and ceased in this role on 22 March 2012.
(viii) SJ O’Rourke resigned as Managing Director on 31 July 2011.
(ix) P Kerr resigned as Chief Operating Officer on 16 December 2011.
(x) SJ O’Rourke, P Kerr, N Longstaff and R Greenaway were all members of a Defined Benefit Superannuation plan during the reporting period (refer Note 27).
(xi) Non monetary compensation includes the provision of a motor vehicle, health insurance, and notional interest on interest free loans provided to employees participating in the Employees Profits Participation Scheme as disclosed in Note 31(c).
(xii) Termination benefits do not include payments of superannuation entitlements to key management personnel from the Defined Benefits Superannuation Plan. Refer to Note 27 for further information in relation to the Defined Benefits Superannuation Plan.
directors’ report
43
MU
RR
AY G
OU
LBU
RN
AN
NU
AL R
EPO
RT
2
012
The following table outlines the consolidated entity’s earnings and dividends paid in respect of the financial year over the past five years:
Net sales revenue ($000)
Profit after tax ($000)
dividends paid in respect of
($000)
Financial year ended 30 June 2012 2,367,231 14,467 31,282
Financial year ended 30 June 2011 2,287,492 36,319 29,937
Financial year ended 30 June 2010 2,163,441 28,041 26,077
Financial year ended 30 June 2009 2,329,285 1,050 17,813
Financial year ended 30 June 2008 2,571,863 93,183 26,391
All shares in the company are traded at a fixed $1.00 per share. A bonus issue of one for every ten shares held by members holding ordinary shares was made during the financial years ended 30 June 2008 and 30 June 2011.
Signed in accordance with a resolution of the Board of Directors.
PW Tracy Director Melbourne, 26 September 2012
directors’ report

44
MU
RR
AY G
OU
LBU
RN
AN
NU
AL R
EPO
RT
2
012
Note2012
($000)2011
($000)
Sales revenue 2 2,367,231 2,287,492
Cost of sales (2,054,152) (1,971,145)
Gross profit 313,079 316,347
Other income 2 4,451 4,885
Share of profit of associates 13 (4,660) (3,583)
Distribution expenses (147,668) (135,098)
Marketing expenses (23,194) (20,717)
Administration expenses (66,859) (69,722)
Finance costs 3 (25,623) (24,073)
Other expenses (41,424) (28,012)
Profit / (Loss) before income tax 8,102 40,027
income tax (expense) / benefit 4 6,365 (3,708)
Profit for the year 14,467 36,319
Attributable to
Equity holders of the parent 11,085 28,457
Minority interest 3,382 7,862
Profit for the year 14,467 36,319
The accompanying Notes form part of these Financial Statements.
consolidated income statement for the financial year ended 30 June 2012

45
MU
RR
AY G
OU
LBU
RN
AN
NU
AL R
EPO
RT
2
012
The accompanying Notes form part of these Financial Statements.
Note2012
($000)2011
($000)
Profit for the year 14,467 36,319
other Comprehensive income
increment (decrement) on revaluation of land and buildings 23 – 21,894
Transfer to income statement on cash flow hedges 23 (19,168) 1,742
Gain (Loss) on cashflow hedges taken to equity 23 (4,132) 46,374
Net change in fair value of equity instruments measured at fair value through other comprehensive income
23 (7,531) 7,809
Exchange differences arising on translation of foreign operations 23 412 117
income tax relating to components of other comprehensive income 4 7,952 (22,124)
total comprehensive income for the year (8,000) 92,131
Attributable to
Equity holders of the parent (11,382) 84,269
Minority interest 3,382 7,862
total (8,000) 92,131
consolidated statement of comprehensive income for the financial year ended 30 June 2012

46
MU
RR
AY G
OU
LBU
RN
AN
NU
AL R
EPO
RT
2
012
consolidated balance sheet as at 30 June 2012
Note2012
($000)2011
($000)
Current Assets
Cash 34,193 5,697
Receivables 8 396,778 355,345
inventories 9 364,893 389,158
Other 10 5,207 4,833
Total Current Assets 801,071 755,033
Non Current Assets
Receivables 8 35,795 45,792
investments accounted for using the Equity Method 13 14,316 15,354
Other Financial Assets 11 22,268 29,799
Property, Plant & Equipment 14 736,164 666,044
intangible Assets 15 16,121 9,359
Other 10 6,493 8,753
Total Non Current Assets 831,157 775,101
total Assets 1,632,228 1,530,134
Current Liabilities
Payables 16 329,479 288,356
Borrowings 17 114,013 68,657
Current Tax Payable 18 832 –
Provisions 19 41,993 43,183
Total Current Liabilities 486,317 400,196
Non Current Liabilities
Payables 16 5,503 2,451
Borrowings 17 343,639 287,452
Provisions 19 7,712 6,381
Deferred Tax Liabilities 20 30,022 45,185
Total Non Current Liabilities 386,876 341,469
total Liabilities 873,193 741,665
Net Assets 759,035 788,469
Equity
issued Capital 22 248,271 235,240
Reserves 23 179,174 200,407
Retained Earnings 24 233,724 252,197
Parent Entity interest 661,169 687,844
Minority interest 25 97,866 100,625
total Equity 759,035 788,469
The accompanying Notes form part of these Financial Statements.

47
MU
RR
AY G
OU
LBU
RN
AN
NU
AL R
EPO
RT
2
012
The accompanying Notes form part of these Financial Statements.
Note2012
($000)2011
($000)
Cash flows from operating activities
Receipts from customers 2,389,271 2,346,439
Payments to suppliers and employees (2,264,197) (2,132,737)
125,074 213,702
Dividends received 1,360 1,120
interest received 3,428 4,185
interest paid (26,381) (24,736)
income taxes paid (845) (2,961)
Net cash inflow from operating activities 32(b) 102,636 191,310
Cash flows from investing activities
Payments for property, plant and equipment (134,138) (53,847)
investment in associated company 13 (4,000) (5,500)
Payments to acquire financial assets – (7,969)
Proceeds from the sale of property, plant, equipment and vehicles
2,050 733
Proceeds on disposal of partial interest in a subsidiary 10,509 –
Net cash (outflow) from investing activities (125,579) (66,583)
Cash flows from financing activities
Buyback of shares in minority interests (8,252) –
Dividends paid (25,651) (25,955)
Proceeds from the issue of ordinary shares 8,745 1,978
Repayment of lease liabilities – (509)
Proceeds from borrowings 106,597 –
Repayment of borrowings (30,000) (105,299)
Net cash inflow (outflow) from financing activities 51,439 (129,785)
Net increase (decrease) in cash 28,496 (5,058)
Cash at the beginning of the year 5,697 10,755
Cash at the end of the year 32(a) 34,193 5,697
consolidated statement of cash flows for the financial year ended 30 June 2012

48
MU
RR
AY G
OU
LBU
RN
AN
NU
AL R
EPO
RT
2
012
issued Capital ($000)
Capital reserve
($000)
Asset revaluation
reserve ($000)
General reserve
($000)
Hedge reserve
($000)
investment revaluation
reserve ($000)
Share Allotment
reserve ($000)
transactions with Minority interests
reserve ($000)
Foreign Currency translation
reserve ($000)
retained Earnings
($000)
Attributable to owners of
the parent ($000)
Minority interests
($000) total
($000)
Balance at 1 July 2010 233,140 36,916 102,873 5,257 92 (4,188) 3,622 – (67) 249,817 627,462 91,541 719,003
Profit or (Loss) for the year – – – – – – – – – 28,457 28,457 7,862 36,319
Other comprehensive income – – 15,326 – 33,681 6,723 – – 82 – 55,812 – 55,812
Total comprehensive income – – 15,326 – 33,681 6,723 – – 82 28,457 84,269 7,862 92,131
Payment of dividends – – – – – – – – – (26,077) (26,077) – (26,077)
issue of ordinary shares to milk suppliers
1,978 – – – – – – – – – 1,978 – 1,978
Dividend reinvestment plan issues
122 – – – – – – – – – 122 – 122
issue of share capital – – – – – – – – – – – 1,109 1,109
Allotment of shares to suppliers – – – – – – (3,622) – – – (3,622) – (3,622)
Shares to be issued in lieu of milk payments
– – – – – – 3,712 – – – 3,712 – 3,712
Other – – – – – – – – – – – 113 113
Balance at 30 June 2011 235,240 36,916 118,199 5,257 33,773 2,535 3,712 – 15 252,197 687,844 100,625 788,469
Profit or (Loss) for the year – – – – – – – – – 11,085 11,085 3,382 14,467
Other comprehensive income – – – – (16,310) (6,445) – – 288 – (22,467) – (22,467)
Total comprehensive income – – – – (16,310) (6,445) – – 288 11,085 (11,382) 3,382 (8,000)
Payment of dividends – – – – – – – – – (29,937) (29,937) – (29,937)
issue of ordinary shares to milk suppliers
8,745 – – – – – – – – – 8,745 – 8,745
Dividend reinvestment plan issues
4,286 – – – – – – – – – 4,286 – 4,286
Establishment of share buy back reserve
– – – – – – – – – – – (21,019) (21,019)
Transferred to retained earnings (net of tax)
– – (379) – – – – – – 379 – – –
Allotment of shares to suppliers – – – – – – (3,712) – – – (3,712) – (3,712)
Shares to be issued in lieu of milk payments
– – – – – – 2,971 – – – 2,971 – 2,971
Minority interest in subsidiaries acquired
– – – – – – – – – – – 14,917 14,917
Sale of investment in associate to minority interest
– – – – – – – 2,354 – – 2,354 – 2,354
Other – – – – – – – – – – – (39) (39)
Balance at 30 June 2012 248,271 36,916 117,820 5,257 17,463 (3,910) 2,971 2,354 303 233,724 661,169 97,866 759,035
The accompanying Notes form part of these Financial Statements.
consolidated statement of changes in equityfor the financial year ended 30 June 2012

49
MU
RR
AY G
OU
LBU
RN
AN
NU
AL R
EPO
RT
2
012
issued Capital ($000)
Capital reserve
($000)
Asset revaluation
reserve ($000)
General reserve
($000)
Hedge reserve
($000)
investment revaluation
reserve ($000)
Share Allotment
reserve ($000)
transactions with Minority interests
reserve ($000)
Foreign Currency translation
reserve ($000)
retained Earnings
($000)
Attributable to owners of
the parent ($000)
Minority interests
($000) total
($000)
Balance at 1 July 2010 233,140 36,916 102,873 5,257 92 (4,188) 3,622 – (67) 249,817 627,462 91,541 719,003
Profit or (Loss) for the year – – – – – – – – – 28,457 28,457 7,862 36,319
Other comprehensive income – – 15,326 – 33,681 6,723 – – 82 – 55,812 – 55,812
Total comprehensive income – – 15,326 – 33,681 6,723 – – 82 28,457 84,269 7,862 92,131
Payment of dividends – – – – – – – – – (26,077) (26,077) – (26,077)
issue of ordinary shares to milk suppliers
1,978 – – – – – – – – – 1,978 – 1,978
Dividend reinvestment plan issues
122 – – – – – – – – – 122 – 122
issue of share capital – – – – – – – – – – – 1,109 1,109
Allotment of shares to suppliers – – – – – – (3,622) – – – (3,622) – (3,622)
Shares to be issued in lieu of milk payments
– – – – – – 3,712 – – – 3,712 – 3,712
Other – – – – – – – – – – – 113 113
Balance at 30 June 2011 235,240 36,916 118,199 5,257 33,773 2,535 3,712 – 15 252,197 687,844 100,625 788,469
Profit or (Loss) for the year – – – – – – – – – 11,085 11,085 3,382 14,467
Other comprehensive income – – – – (16,310) (6,445) – – 288 – (22,467) – (22,467)
Total comprehensive income – – – – (16,310) (6,445) – – 288 11,085 (11,382) 3,382 (8,000)
Payment of dividends – – – – – – – – – (29,937) (29,937) – (29,937)
issue of ordinary shares to milk suppliers
8,745 – – – – – – – – – 8,745 – 8,745
Dividend reinvestment plan issues
4,286 – – – – – – – – – 4,286 – 4,286
Establishment of share buy back reserve
– – – – – – – – – – – (21,019) (21,019)
Transferred to retained earnings (net of tax)
– – (379) – – – – – – 379 – – –
Allotment of shares to suppliers – – – – – – (3,712) – – – (3,712) – (3,712)
Shares to be issued in lieu of milk payments
– – – – – – 2,971 – – – 2,971 – 2,971
Minority interest in subsidiaries acquired
– – – – – – – – – – – 14,917 14,917
Sale of investment in associate to minority interest
– – – – – – – 2,354 – – 2,354 – 2,354
Other – – – – – – – – – – – (39) (39)
Balance at 30 June 2012 248,271 36,916 117,820 5,257 17,463 (3,910) 2,971 2,354 303 233,724 661,169 97,866 759,035

50
MU
RR
AY G
OU
LBU
RN
AN
NU
AL R
EPO
RT
2
012
note 1: Summary of Significant accounting policiesThis general purpose financial report has been prepared in accordance with the Corporations Act 2001, Accounting Standards and interpretations, and complies with other requirements of the law. Accounting Standards include Australian equivalents to international Financial Reporting Standards (‘A-iFRS’) which ensure that the consolidated financial statements and accompanying notes comply with international Financial Reporting Standards (‘iFRS’).
The financial statements were authorised for issue by the directors on 26 September 2012.
The financial report has been prepared on the basis of historical cost, except for the revaluation of certain non current assets and financial instruments.
The financial report is presented in Australian dollars and all values are rounded to the nearest thousand dollars ($000), unless otherwise indicated, in accordance with ASiC Class Order 98/0100 which does apply to the consolidated entity.
in applying the consolidated entity’s accounting policies, below, management continually evaluates judgments, estimates and assumptions based on experience and other factors, including expectations of future events that may have an impact on the consolidated entity. All judgments, estimates and assumptions made are believed to be reasonable based on the most current set of circumstances available to management. Actual results may differ from the judgments, estimates and assumptions.
a) prInCIpleS oF ConSolIDatIonThe consolidated financial statements incorporate the assets and liabilities of all entities controlled by Murray Goulburn Co-Operative Co. Limited (“company”) as at 30 June 2012 and the results of all controlled entities for the year then ended from the date on which the company obtained control. The effects of all transactions between entities in the consolidated entity are eliminated in full. The company and its controlled entities together are referred to in this financial report as the consolidated entity.
On acquisition, the assets, liabilities and contingent liabilities of a subsidiary are measured at their fair values at the date of acquisition. Any excess of the cost of acquisition over the fair values of the identifiable net assets acquired is recognised as goodwill. if, after reassessment, the fair values of the identifiable net assets acquired exceed the cost of acquisition, the deficiency is credited to profit and loss in the period of acquisition.
The interest of minority shareholders in the equity of controlled entities is shown separately in the consolidated balance sheet.
b) InCome taXCurrent tax represents income taxes payable or recoverable in respect of the taxable profit or loss for the period. Current tax is recognised in the income statement, except when it relates to items credited or debited directly to equity, and is calculated based on tax rates and tax laws current as at reporting date.
Deferred tax is accounted for using the comprehensive balance sheet liability method in respect of temporary differences arising from differences between the carrying amount of assets and liabilities in the financial statements and the corresponding tax base of those items. Deferred tax is recognised in the income
statement except (i) when it relates to items credited or debited directly to equity, in which case the deferred tax is also recognised directly in equity or (ii) where it relates to items arising from the initial recognition of assets and liabilities, other than as a result of business combinations, which affects neither taxable income or accounting profit. Furthermore, a deferred tax liability is not recognised in relation to taxable temporary differences arising from goodwill.
Deferred tax assets are recognised to the extent that it is probable that sufficient taxable amounts will be available against which deductible temporary differences or unused tax losses can be utilised.
Deferred tax is measured at the rate of income tax expected to apply in the period in which the benefit will be received or the liability will become payable based on applicable tax rates and tax laws.
Deferred tax assets and liabilities are offset as the consolidated entity intends to settle its current tax assets and liabilities on a net basis.
The company and its wholly-owned entities are part of a tax-consolidated group. Murray Goulburn Co-operative Co. Limited is the head entity in the tax consolidated group. Tax expense/income, deferred tax assets and deferred tax liabilities arising from temporary differences of the members of the tax consolidated group are recognised in the separate financial statements of the members of the tax consolidated group using a ‘group allocation’ approach. Under this approach each entity prepares a notional taxable income or loss as if it were a taxpayer in its own right except that distributions made and received, capital gains and losses, gains or losses from intra-group debt forgiveness and similar items arising on transactions within the tax consolidated group are treated as having no tax consequence. The tax expense/income, deferred tax assets and deferred tax liabilities arising from temporary differences of the members of the tax consolidated group is allocated to each entity with reference to the individual entities notional tax calculation.
Current tax liabilities and assets and deferred tax assets arising from unused tax losses and tax credits of the members of the tax consolidated group are recognised by the company (as head entity in the tax consolidated group).
Due to the existence of a tax funding arrangement between the entities in the tax consolidated group, amounts are recognised as payable to or receivable by the company and each member of the group in relation to the tax contribution amounts paid or payable between the parent entity and the other members of the tax consolidated group in accordance with the arrangement. Further information about the tax funding arrangement is detailed in Note 4 to the financial statements.
Where the tax contribution amount recognised by each member of the tax-consolidated group for a particular period is different to the aggregate of the current tax liability or asset and any deferred tax asset arising from unused tax losses and tax credits in respect of that period, the difference is recognised as a contribution from (or distribution to) equity participants.
C) DerIVatIVe FInanCIal InStrumentSThe consolidated entity enters into a variety of derivative financial instruments to manage its exposure to foreign exchange and interest rate risk, including forward exchange contracts, currency options and interest rate swaps. Further details of derivative financial instruments are disclosed in Note 30.
notes to the financial statements for the financial year ended 30 June 2012

51
MU
RR
AY G
OU
LBU
RN
AN
NU
AL R
EPO
RT
2
012
Derivatives are initially recognised at fair value at the time of entering a derivative contract and are subsequently remeasured to fair value at each reporting date. The fair value calculation of derivative financial instruments is measured by using valuation techniques based on observable market prices or rates. The resulting gain or loss is recognised in profit or loss immediately unless the derivative is designated and effective as a hedging instrument, in which event, the timing of the recognition in profit or loss depends on the nature of the hedge relationship. The consolidated entity designates certain derivatives as either fair value hedges when they hedge the exposure to changes in the fair value of recognised assets, liabilities or firm commitments or cash flow hedges when they hedge exposure to variability in cash flows of highly probable forecast transactions.
Fair Value Hedge:
Changes in the fair value of derivatives that are designated and qualify as fair value hedges are recorded in profit or loss together with any changes in the fair value of the hedged asset or liability that is attributable to the hedged risk.
Hedge accounting is discontinued when the hedge instrument expires or is sold, terminated, exercised, no longer qualifies for hedge accounting or the consolidated entity revokes the hedge relationship. The adjustment to the carrying amount of the hedged item arising from the hedged risk is amortised to profit or loss from that date.
Cash Flow Hedge:
The effective portion of changes in the fair value of derivatives that are designated and qualify as cash flow hedges are deferred in equity. The gain or loss relating to the ineffective portion is recognised in profit or loss. Amounts deferred in equity are transferred to profit or loss in the period when the hedged item is recognised in profit or loss.
Hedge accounting is discontinued when the hedge instrument expires or is sold, terminated, exercised, no longer qualifies for hedge accounting or the consolidated entity revokes the hedge relationship. At that time, any cumulative gain or loss deferred in equity at that time remains in equity and is recognised when the forecast transaction is ultimately recognised in profit or loss. When a forecast transaction is no longer expected to occur, the cumulative gain or loss that was deferred in equity is recognised immediately in profit or loss.
Changes in the fair value of any derivative instruments that do not qualify for hedge accounting are recognised immediately in profit or loss.
D) ForeIgn CurrenCIeSForeign currency transactions during the year are converted to Australian currency at the exchange rate ruling at the date of the transaction. Foreign currency monetary items at balance date are translated at the exchange rate ruling at that date. Exchange differences are recognised in the income statement in the period in which they arise except for differences on transactions entered into to hedge certain foreign currency risks – refer Note 1 (c) above.
e) property, plant anD equIpmentLand and buildings are measured at fair value. Plant and equipment are included at cost being the purchase consideration determined as at the date of acquisition plus costs incidental to the acquisition less impairment. The cost of fixed assets constructed within the consolidated entity includes the cost of materials and direct labour. All fixed assets including buildings and capitalised leasehold assets, but excluding freehold land, are depreciated over their estimated useful lives commencing from the time the asset is held ready for use.
Any revaluation increase arising on the revaluation of land and buildings is credited to the asset revaluation reserve, except to the extent that it reverses a revaluation decrease for the same asset previously recognised as an expense in profit or loss, in which case the increase is credited to the income statement to the extent of the decrease previously charged. A decrease in carrying amount arising on the revaluation of land and buildings is charged as an expense in profit or loss to the extent that it exceeds the balance, if any, held in the asset revaluation reserve relating to a previous revaluation of that asset.
When an item of land and buildings is revalued, any accumulated depreciation at the date of the revaluation is eliminated against the gross carrying amount of the asset and the net amount restated to the revalued amount of the asset. The amount of the adjustment arising on the restatement or elimination of accumulated depreciation forms part of the increase or decrease in carrying amount.
The gain or loss on disposal of all fixed assets, including revalued assets, is determined as the difference between the carrying amount of the asset at the time of disposal and the proceeds of disposal, and is included in the income statement of the group in the year of disposal. Any realised revaluation increment relating to the disposed asset which is included in the asset revaluation reserve is transferred to retained earnings.
F) DepreCIatIon oF property, plant anD equIpmentDepreciation is calculated using the straight line method (2011: diminishing value method) to write off the net cost or revalued amount of each item of property, plant and equipment (excluding land) over its expected useful life to the consolidated entity.
Refer note 1(w) below for further disclosures around the change in accounting estimate in the current year.
The expected useful lives are as follows:
Buildings – 25 to 50 years (2011: 30 to 40 years)
Vehicles – 3 to 8 years (2011: 3 to 8 years)
Plant & Equipment – 5 to 25 years (2011: 5 to 15 years)
Tankers – 10 to 20 years (2011: 10 to 20 years)
notes to the financial statements for the financial year ended 30 June 2012

52
MU
RR
AY G
OU
LBU
RN
AN
NU
AL R
EPO
RT
2
012
Note 1: Summary of Significant Accounting Policies (continued)
g) ImpaIrment oF aSSetSThe carrying amount of assets is reviewed each balance date to identify any indication that those assets have suffered an impairment loss. if any such indication exists, the recoverable amount of the asset is estimated in order to determine the extent of the impairment loss (if any). Where the asset does not generate cash flows that are independent from other assets, the consolidated entity estimates the recoverable amount of the cash-generating unit to which the asset belongs.
The recoverable amount is the greater of fair value less costs to sell and value in use. in assessing value in use, the estimated future cash flows are discounted to their present value using a pre-tax discount rate that reflects current market assessments of the time value of money and the risks specific to the asset. if the recoverable amount of an asset (or cash-generating unit) is estimated to be less than its carrying amount, the carrying amount of the asset (or cash-generating unit) is reduced to its recoverable amount. impairment losses are recognised in the income statement unless the asset is carried at valuation in which case the impairment loss is recognised as a revaluation decrease to the extent of any previous increase.
Where an impairment loss subsequently reverses, the carrying amount of the asset (or cash-generating unit) is increased to the revised estimate of its recoverable amount, but only to the extent that the increased carrying amount does not exceed the carrying amount that would have been determined had no impairment loss been recognised for the asset (or cash-generating unit) in prior years. A reversal of an impairment loss is recognised in profit or loss immediately.
H) FInanCIal aSSetSinvestments in associated companies are accounted for under the equity method in the consolidated financial statements.
Trade receivables, loans and other receivables are recorded at amortised cost, using the effective interest method, less impairment through the allowance account. The adjustment to employee loans has been capitalised as an asset to the extent that it relates to future employee services.
The effective interest method is a method of calculating the amortised cost of a financial asset and of allocating interest income over the relevant period. The effective interest rate is the rate that exactly discounts estimated future cash receipts (including fees and transaction costs) through the expected life of the financial asset, or, where appropriate, a shorter period.
Listed shares held by the consolidated entity that are traded in an active market are stated at fair value. Gains and losses arising from changes in fair value are recognised in other comprehensive income and accumulated in the investments revaluation reserve. Where the investment is disposed of the cumulative gain or loss previously accumulated in the investments revaluation reserve is transferred to retained earnings. Dividends are recognised in profit or loss when the consolidated entity’s right to receive the dividends is established.
I) gooDS anD SerVICeS taXRevenues, expenses and assets are recognised net of the amount of goods and services tax (GST), except:
i) where the amount of GST incurred is not recoverable from the taxation authority. in this case the GST is recognised as part of the cost of acquisition of an asset or as part of an item of expense; or
ii) for receivables and payables which are recognised inclusive of GST.
The net amount of GST recoverable from, or payable to, the taxation authority is included as part of receivables or payables. Cash flows are included in the cash flow statement on a gross basis. The GST component of cash flows arising from investing and financing activities which is recoverable from, or payable to, the taxation authority is classified as operating cash flows.
J) IntangIble aSSetSintangible assets are recorded at cost less impairment. All potential intangible assets acquired in a business combination are identified and recognised separately from goodwill where they satisfy the definition of an intangible asset and their fair value can be measured reliably.
K) leaSeD aSSetSLeased assets classified as finance leases are capitalised as fixed assets. A finance lease effectively transfers from the lessor to the lessee substantially all the risks and benefits incidental to the ownership of the leased asset. The amount initially brought to account is the fair value or, if lower, the present value of minimum lease payments. Capitalised leased assets are amortised on a reducing balance basis over the estimated useful life of the asset. Finance lease payments are allocated between interest expense and reduction of lease liability over the term of the lease. The interest expense is determined by applying the interest rate implicit in the lease to the outstanding lease liability at the beginning of each lease payment period.
Operating lease payments are recognised as an expense in the periods in which they are incurred, as this represents the pattern of benefits derived from the leased assets.
l) InVentorIeSDairy produce stocks are valued at the lower of cost and net realisable value. Cost comprises direct materials, direct labour, maturation costs and an allocation of fixed factory overheads.
Stores, packing materials and Murray Goulburn Trading stocks, have been valued at the lower of cost and net realisable value. Costs have been allocated on the first in first out basis.
Net realisable value represents the estimated selling price less selling, marketing and distribution costs.
m) InVeStment In aSSoCIateSAn associate is an entity over which the consolidated entity has significant influence and that is neither a subsidiary nor an interest in a joint venture. Significant influence is the power to participate in the financial and operating policy decisions of the investee but has no control or joint control over those policies. The results and assets and liabilities of associates are incorporated in these financial statements using the equity method of accounting. Under the equity method, investments in associates are carried in the consolidated
notes to the financial statements for the financial year ended 30 June 2012

53
MU
RR
AY G
OU
LBU
RN
AN
NU
AL R
EPO
RT
2
012
balance sheet at cost as adjusted for post-acquisition changes in the consolidated entity’s share of the net assets of the associate, less any impairment in the value of individual investments. Any excess of the cost of acquisition over the consolidated entity’s share of the net fair value of the identifiable assets, liabilities and contingent liabilities of the associate recognised at the date of acquisition is recognised as goodwill. The goodwill is included within the carrying amount of the investment and is assessed for impairment as part of that investment. Any excess of the consolidated entity’s share of the net fair value of the identifiable assets, liabilities and contingent liabilities over the cost of acquisition, after reassessment, is recognised immediately in profit or loss.
n) gooDWIllGoodwill, representing the excess of the cost of acquisition over the fair value of the assets and liabilities acquired, is recognised as an asset and, for the purpose of impairment testing, is allocated to the cash generating unit to which it relates. Goodwill is tested for impairment annually or where an indicator of impairment is identified. Goodwill is not amortised however, any impairment is recognised immediately in profit or loss.
o) aCCountS payableTrade payables and other accounts payable are recognised when the consolidated entity becomes obliged to make future payments resulting from the purchase of goods and services. Payables are initially measured at fair value and subsequent to initial recognition are measured at amortised cost using the effective interest method with interest expense recognised on an effective yield basis.
The effective interest method is a method of calculating the amortised cost of a financial liability and of allocating interest expense over the relevant period. The effective interest rate is the rate that exactly discounts estimated future cash payments through the expected life of the financial liability, or, where appropriate, a shorter period.
p) proVISIonSProvisions are recognised when the consolidated entity has a present obligation, the future sacrifice of economic benefits is probable and the amount of the provision can be measured reliably. The amount recognised as a provision is the best estimate of the consideration required to settle the present obligation at reporting date. Where a provision is measured using the cash flows estimated to settle the present obligation, its carrying amount is the present value of those cash flows.
q) employee beneFItSProvision is made for benefits accruing to employees in respect of wages and salaries, annual leave, long service leave and sick leave when it is probable that settlement will be required and they are capable of being measured reliably.
Provisions are measured at their nominal values using the remuneration rate expected to apply at the time of settlement where they are expected to be settled within twelve months. Provisions not expected to be settled within twelve months are measured at the present value of the estimated future cash outflows in respect of services provided up to balance date.
For defined benefit superannuation plans, the cost of providing benefits is determined using the projected unit credit method, with actuarial valuations being carried out at each reporting date.
Actuarial gains and losses are recognised immediately in profit or loss in the year in which they occur.
Past service cost is recognised immediately to the extent that the benefits are already vested, and otherwise is amortised on a straight-line basis over the average period until the benefits become vested.
The defined benefit obligation recognised in the balance sheet represents the present value of the defined benefit obligation, adjusted for unrecognised past service cost, net of the fair value of the plan assets. Any asset resulting from this calculation is limited to past service cost, plus the present value of available refunds and reductions in future contributions to the plan.
r) borroWIngSBorrowings are recorded initially at fair value, net of transaction costs. Subsequent to initial recognition, borrowings are measured at amortised cost with any difference between the initial recognised amount and the redemption value being recognised in profit and loss over the period of the borrowing using the effective interest rate method.
S) borroWIng CoStSinterest expense is recognised using the effective interest rate method. Borrowing costs attributable to qualifying assets are capitalised as part of the cost of those assets.
t) reVenue reCognItIonRevenue from the sale of goods and disposal of assets is recognised when the consolidated entity has transferred to the buyer the significant risks and rewards of ownership of the goods. interest revenue is recognised on a time proportion basis using the effective interest method. Dividend revenue is recognised when the consolidated entity’s right to receive the dividends is established.
u) CrItICal aCCountIng eStImateS anD JuDgementSFollowing are the critical estimates and judgements made by management in the process of applying the consolidated entity’s accounting policies:
inventories – the net realisable value of inventories is the estimated selling price in the ordinary course of business less estimated costs to sell. Key assumptions, including the expected selling price, require the use of management judgement and are reviewed semi-annually.
notes to the financial statements for the financial year ended 30 June 2012

54
MU
RR
AY G
OU
LBU
RN
AN
NU
AL R
EPO
RT
2
012
Note 1: Summary of Significant Accounting Policies (continued)
V) aDoptIon oF neW anD reVISeD StanDarDSin the current year, the consolidated entity adopted all of the new and revised standards and interpretations issued by the Australian Accounting Standards Board effective for the current annual reporting period. The adoption of these new and revised standards and interpretations did not have any material impact on the financial statements of the consolidated entity.
The consolidated entity has elected to early adopt AASB 9 ‘Financial instruments’, as issued in December 2009, from 1 July 2010. AASB 9 specifies the basis for classifying and measuring financial assets. Classification is determined based on the contractual cash flow characteristics of the consolidated entity’s financial assets. Financial assets will be classified as either measured at amortised cost or fair value. AASB 9 replaces the classification and measurement requirements relating to financial assets in AASB 139 ‘Financial instruments: Recognition and Measurement’. Under AASB 9 only equity instruments that are not held for trading are able to be classified as fair value through other comprehensive income rather than fair value through profit and loss. On disposal, in contrast to AASB 139, the cumulative gains or losses recognised in equity over the period the consolidated entity held the equity instrument are transferred directly to retained earnings and are not permitted to be recognised in profit and loss. The consolidated entity elected to designate its equity investments measured at fair value through other comprehensive income on adoption of AASB 9.
The adoption of this standard has not impacted on the consolidated entity’s current financial statements or comparatives as the accounting outcomes on the consolidated entity are consistent with those previously recognised under AASB 139 (on the basis that any diminution in the value of investments held for sale are not significant or prolonged).
Except for AASB 9 ‘Financial instruments’, which the consolidated entity has early adopted, Australian Accounting Standards and interpretations that have recently been issued or amended but are not yet effective have not been adopted by the consolidated entity for the annual reporting period ended 30 June 2012.
in particular, the following relevant standards and interpretations were issued but not yet effective:
Effective for annual reporting periods beginning on or after 1 January 2012
• AASB 2010–8 Deferred Tax: Recovery of Underlying Assets (AASB 112)
Effective for annual reporting periods beginning on or after 1 July 2012
• AASB 2011–9 Presentation of items of OCi (AASB 101)
Effective for annual reporting periods beginning on or after 1 January 2013
• AASB 9 Financial instruments – Classification and Measurement
• AASB 10 Consolidated Financial Statements
• AASB 11 Joint Arrangements
• AASB 12 Disclosure of interests in Other Entities
• AASB 13 Fair Value Measurement
• AASB 19 Employee Benefits (2011)
• AASB 127 Separate Financial Statements (2011)
• AASB 128 investments in Associates and Joint Ventures (2011)
• AASB 2011–7 Amendments to Australian Accounting Standards arising from the Consolidation and Joint Arrangements Standards
• AASB 2012–2 Amendments to Australian Accounting Standards – Disclsoures – Offsetting Financial Assets and Financial Liabilities
• AASB 2012–5 Amendments to Australian Accounting Standards arising from Annual improvements 2009–2011 Cycle
Effective for annual reporting periods beginning on or after 1 January 2014
• AASB 2012–3 Amendments to Australian Accounting Standards – Offsetting Financial Assets and Financial Liabilities
The directors are yet to finalise their assessment and anticipate that the adoption of these Standards and interpretation in future periods will have no material impact on the financial statements of the consolidated entity.
W) CHange In aCCountIng eStImateThe consolidated entity undertook a review during the year of the residual values, useful lives and depreciation method applied to its fixed assets. The useful lives of fixed assets have been updated where appropriate based on the age and condition of the assets. The consolidated entity changed its depreciation method from diminishing value to straight line so as to more accurately align depreciation expense with the consumption of the assets’ future economic benefits. The financial impact of these changes took effect from 1 July 2011 and has been accounted for prospectively as a change in accounting estimate. As a result of these changes, depreciation expense for the consolidated entity in the current financial year decreased $12,124,000.
Total depreciation expense recognised during the financial year ended 30 June 2012 was $52,863,000 (2011: $58,353,000).
The consolidated entity has not disclosed the effect of the change in accounting estimates in future periods as it is impracticable to estimate the effect.
notes to the financial statements for the financial year ended 30 June 2012

55
MU
RR
AY G
OU
LBU
RN
AN
NU
AL R
EPO
RT
2
012
notes to the financial statements for the financial year ended 30 June 2012
note 2: revenue
Note2012
($000)2011
($000)
revenue
Sales revenue 2,367,231 2,287,492
2,367,231 2,287,492
other income
interest received or receivable from:
– other persons 3,469 4,302
Dividends received from other corporations 982 583
4,451 4,885
Sales and other income 2,371,682 2,292,377

56
MU
RR
AY G
OU
LBU
RN
AN
NU
AL R
EPO
RT
2
012
notes to the financial statements for the financial year ended 30 June 2012
Note2012
($000)2011
($000)
Borrowing Costs:
interest paid or payable to:
– other persons 25,623 24,056
– finance charges on finance leases – 17
Total borrowing costs expensed 25,623 24,073
Depreciation of:
– buildings 8,464 7,174
– plant and equipment and vehicles 44,399 51,179
14 52,863 58,353
Amortisation of:
– capitalised leases – 156
14 – 156
impairment of non current land and buildings 9,580 1,456
Net (gain) loss on sale and scrapping of non-current assets
(469) 265
impairment of intangible assets – 1,244
Write down of inventories to net realisable value 14,576 10,511
Rental expense on operating leases 19,990 21,217
Research and development expenditure 3,731 5,640
Employee benefits (including restructuring costs; excluding impact of defined benefit in Note 27)
225,807 194,479
Environmental remediation expense 4,076 –
note 3: profit from operations before Income tax expense has been determined after crediting / charging as gains and losses

57
MU
RR
AY G
OU
LBU
RN
AN
NU
AL R
EPO
RT
2
012
Note2012
($000)2011
($000)
tax (benefit) / expense comprises:
Current tax expense 683 2,961
Deferred tax expense (benefit) (7,048) 747
income tax expense (benefit) (6,365) 3,708
the prima facie income tax expense on pre-tax accounting profit reconciles to the income tax expense in the financial statements as follows:
Profit / (Loss) before income tax expense 8,102 40,027
income tax calculated at the Australian statutory tax rate of 30% 2,431 12,008
Dividends as a co-operative (i) (8,981) (7,823)
Sundry items 27 50
Under/(over) provision for income tax in prior year 158 (527)
income tax benefit (6,365) 3,708
note 4: Income tax (benefit) / expense a) income tax recognised in profit or loss
(i) A tax deduction is obtained for unfranked dividends paid by the company. This amount does not include the benefit of tax deductions for dividends declared but not recognised, as disclosed in Note 7 below (the tax benefit of approximately $9,385,000 (2011: $7,971,000) at the corporate tax rate of 30% will be recognised in the financial year ending 30 June 2013 (30 June 2012)).
notes to the financial statements for the financial year ended 30 June 2012

58
MU
RR
AY G
OU
LBU
RN
AN
NU
AL R
EPO
RT
2
012
opening balance
($000)
Charged to income ($000)
transfer from Equity
to income ($000)
Charged to Equity ($000)
Closing Balance
($000)
2012
Gross deferred tax Liabilities
Property, plant and equipment (61,661) 1,890 – 162 (59,609)
Consumables (8,004) 385 – – (7,619)
investments (1,086) – – 1,086 –
Cash flow hedges (14,475) – 5,750 1,240 (7,485)
Other (72) (196) – (123) (391)
(85,298) 2,079 5,750 2,365 (75,104)
Gross deferred tax Assets
Provisions 15,930 2,970 – – 18,900
Tax losses 22,720 2,782 – – 25,502
Other 1,463 (783) – – 680
40,113 4,969 – – 45,082
Net deferred tax Liability (45,185) 7,048 5,750 2,365 (30,022)
2011
Gross deferred tax Liabilities
Property, plant and equipment (57,573) 2,480 – (6,568) (61,661)
Consumables (7,855) (149) – – (8,004)
investments – – – (1,086) (1,086)
Cash flow hedges (40) – (523) (13,912) (14,475)
Other (71) 5 – (6) (72)
(65,539) 2,336 (523) (21,572) (85,298)
Gross deferred tax Assets
Provisions 15,483 447 – – 15,930
Tax losses 26,885 (4,165) – – 22,720
Other 857 635 – (29) 1,463
43,225 (3,083) – (29) 40,113
Net deferred tax Liability (22,314) (747) (523) (21,601) (45,185)
Note 4: income tax (Benefit) / Expense (continued)
b) Deferred income tax at 30 June relates to the following:
notes to the financial statements for the financial year ended 30 June 2012

59
MU
RR
AY G
OU
LBU
RN
AN
NU
AL R
EPO
RT
2
012
With the exception of pre tax-consolidation losses of $215,715 ($64,715 tax effected), all available tax losses have been brought to account and are included in the net deferred tax liability.
The company and its wholly-owned entities are part of a tax-consolidated group. The head entity within the tax-consolidated group is Murray Goulburn Co-operative Co. Limited. The members of the tax-consolidated group are identified in Note 12.
Entities within the tax-consolidated group have entered into a tax funding arrangement and a tax sharing agreement with the head entity.
Under the terms of the tax funding arrangement, each of the entities in the tax-consolidated group has agreed to pay a tax equivalent payment to or from the head entity, based on the current tax liability or current tax asset of the entity. Such amounts are reflected in amounts receivable from or payable to other entities in the tax-consolidated group.
note 5: Compensation of Key management personnelCompensation of key management personnel is included in the Remuneration Report within the Directors’ Report.
Total short term employee benefits for key management personnel of the consolidated entity is $4,285,050 (2011: $4,439,308).
Total long term employee benefits for key management personnel of the consolidated entity is $62,207 (2011: $193,746).
Total post employment employee benefits for key management personnel of the consolidated entity is $346,617 (2011: $1,569,661).
Total termination benefits for key management personnel of the consolidated entity is $563,551 (2011: $nil).
note 6: remuneration of auditors
Note2012
($)2011
($)
Auditor of the parent entity
– auditing or reviewing the financial reports 342,000 342,000
– corporate finance services 95,490 –
– assurance related 25,460 79,710
– other consulting services 133,860 664,412
596,810 1,086,122
Related practice of the parent entity auditor
– corporate finance services 235,953 –
832,763 1,086,122
The auditor of the parent entity is Deloitte Touche Tohmatsu.
notes to the financial statements for the financial year ended 30 June 2012

60
MU
RR
AY G
OU
LBU
RN
AN
NU
AL R
EPO
RT
2
012
notes to the financial statements for the financial year ended 30 June 2012
note 7: Dividends paid or proposed
Note2012
($000)2011
($000)
recognised amounts
dividends in relation to the 2011 financial year (2010 financial year)
Fully Paid Ordinary Shares: Final dividend of 12 cents (2010: 12 cents) per share unfranked 26,168 22,210
Fully Paid A Class Non Cumulative Non-Redeemable Preference Shares: Final dividend of 8 cents (2010: 8 cents) per share unfranked
1,244 1,300
Fully Paid B Class Non Cumulative Non-Redeemable Preference Shares: Final dividend of 5 cents (2010: 5 cents) per share unfranked
570 753
Fully Paid C Class Non Cumulative Non-Redeemable Preference Shares: Final dividend of 8 cents (2010: 8 cents) per share unfranked
1,955 1,814
total dividends recognised 24 29,937 26,077
Dividends recognised during the current year differ to unrecognised amounts in the prior year below due to movements in issued capital during the period between 30 June 2011 and the actual payment of the dividend.
Note2012
($000)2011
($000)
unrecognised amounts
dividends in relation to the 2012 financial year (2011 financial year)
Fully Paid Ordinary Shares: Final dividend of 12 cents (2011: 12 cents) per share unfranked
27,447 26,366
Fully Paid A Class Non Cumulative Non-Redeemable Preference Shares: Final dividend of 8 cents (2011: nil cents) per share unfranked
1,214 –
Fully Paid B Class Non Cumulative Non-Redeemable Preference Shares: Final dividend of 5 cents (2011: nil cents) per share unfranked
505 –
Fully Paid C Class Non Cumulative Non-Redeemable Preference Shares: Final dividend of 8 cents (2011: nil cents) per share unfranked
2,116 –
31,282 26,366
Adjusted franking account balance
10,552 9,676
The final dividends for Ordinary and A, B and C class preference shares, in respect of the financial year, were declared by the Board subsequent to the financial year end and have therefore not been recognised as a liability at 30 June.
The value of the unrecognised dividends disclosed above are based on the respective dividend rates declared and the total of shares outstanding at 30 June and shares to be issued out of the share allotment reserve. The final value of the unrecognised dividends may change when paid dependent on movements in shareholdings between 30 June and the date of payment.
Unrecognised dividends are unfranked and therefore do not impact on the adjusted franking account balance.

61
MU
RR
AY G
OU
LBU
RN
AN
NU
AL R
EPO
RT
2
012
notes to the financial statements for the financial year ended 30 June 2012
note 8: receivables
Note2012
($000)2011
($000)
Current
Trade receivables 331,859 279,962
Less : allowance for doubtful debts (1,643) (2,699)
330,216 277,263
Other receivables 61,866 66,939
Employee loans within MGEE 28 1,606 2,038
Foreign currency derivatives (i) 3,090 9,105
396,778 355,345
Non Current
Employee loans within MGEE 28 35,795 45,792
35,795 45,792
(i) Foreign currency derivatives represent unrealised gains on foreign exchange contracts that are hedges against sales. Unrealised gains and losses on foreign currency hedge contracts are deferred in equity or recognised in profit or loss as appropriate.
Foreign currency derivatives are Level 2 financial instruments recorded at fair value using observable market inputs.
All receivables are recorded at amortised cost except for derivatives at (i) which are recorded at fair value.
Credit risk associated with these receivables is addressed in Note 30(c). The fair value of receivables is documented in Note 30(d).
The consolidated entity reviews the recoverability of receivables by reference to internal credit assessment and historical and ongoing customer payment trends. Trade receivables of $1,643,000 (2011: $2,699,000) in the consolidated entity have been assessed as impaired and provided for in the allowance for doubtful debts.
Movements in the allowance for doubtful debts Note
2012 ($000)
2011 ($000)
Balance at the beginning of the year 2,699 3,107
impairment losses recognised on receivables 7 –
impairment losses reversed – (241)
Amounts written off as uncollectible (1,063) (167)
Balance at the end of the year 1,643 2,699
Trade receivables of customers past due but considered recoverable are not provided for in the allowance for doubtful debts. The consolidated entity does not hold any collateral over these balances. Ageing of past due but not impaired trade receivables:
days Note2012
($000)2011
($000)
0 – 30 10,304 7,269
30 – 60 4,243 4,093
60 – 90 3,493 2,201
90+ 4,189 4,741
total 22,229 18,304

62
MU
RR
AY G
OU
LBU
RN
AN
NU
AL R
EPO
RT
2
012
note 9: Inventories
Note2012
($000)2011
($000)
Finished goods
– at cost 153,954 260,702
– at net realisable value 165,114 79,667
Raw materials and stores – at cost 45,825 48,789
364,893 389,158
note 10: other assets
Note2012
($000)2011
($000)
Current
Prepayments 5,207 4,833
5,207 4,833
Non Current
Other 6,493 8,753
6,493 8,753
notes to the financial statements for the financial year ended 30 June 2012
note 11: other non Current Financial assets
Note2012
($000)2011
($000)
investments
Shares in quoted corporations at fair value 22,268 29,799
22,268 29,799
Shares in quoted corporations are Level 1 financial instruments recorded at fair value using quoted prices.
The consolidated entity’s sensitivity to a $0.50 increase or decrease to the share price in Warrnambool Cheese and Butter Factory Company Holdings Limited, representing management’s assessment of the possible change in share price, holding all other variables constant would be a decrease / increase in other equity and net assets of $3,275,000 (2011: $2,292,000 increase / decrease).

63
MU
RR
AY G
OU
LBU
RN
NO
TiC
E O
F AG
M
201
2
Entity Note Class of Share
Parent Entity: Murray Goulburn Co-operative Co. Limited
(a)
Controlled Entities of Murray Goulburn Co-operative Co. Limited: Murray Goulburn Trading Pty Ltd
(b) (e)
Ordinary
Murray Goulburn investment Limited
MG Nutritionals Pty Ltd (b) (c)
Ordinary
Ordinary
Meiji-MGC Dairy Co Pty Ltd (b) (c) Ordinary
Lavery international Pty Ltd (b) (c) Ordinary
Classic Food Holdings Pty Ltd (b) (c) Ordinary
Murray Goulburn Dairy (Qingdao) Co., Ltd (d) n/a
Murray Goulburn Nutritional (Qingdao) Co., Ltd. (d) n/a
Provico Pty Ltd (c) Ordinary
MG Agrilink Pty Ltd (b) (c) Ordinary
Murray Goulburn iFiS Pty Ltd (c) Ordinary
Murray Goulburn international Pty Ltd (c) Ordinary
Tasmanian Dairy Products Co Ltd (c) Class A
Controlled Entities of Classic Food Holdings Pty Ltd: Classic Foods Pty Ltd
(b) (c)
Ordinary
(a) Murray Goulburn Co-operative Co. Limited is the head entity within the tax-consolidated group.
(b) These wholly-owned entities are members of the tax-consolidated group.
(c) These entities are small proprietary companies pursuant to the Corporations Act 2001 and consequently are relieved from the requirement to prepare audited financial reports.
(d) incorporated in China.
(e) This wholly-owned entity has entered into a deed of cross guarantee with Murray Goulburn Co-operative Co. Limited pursuant to ASiC Class Order 98/1418 and is relieved from the requirement to prepare and lodge an audited financial report.
notes to the financial statements for the financial year ended 30 June 2012
note 12: Controlled entitiesAll controlled entities, except for Murray Goulburn investment Ltd, Murray Goulburn Dairy (Qingdao) Co., Ltd, Provico Pty Ltd, Murray Goulburn iFiS Pty Ltd, and Tasmanian Dairy Products Co Ltd, are wholly owned.
Control of all voting shares in Murray Goulburn investment Ltd vests in Murray Goulburn Co-operative Co. Limited.
Murray Goulburn Co-operative Co. Limited holds 51% of all voting shares in Murray Goulburn Dairy (Qingdao) Co., Ltd, Provico Pty Ltd and Murray Goulburn iFiS Pty Ltd.
Murray Goulburn Co-operative Co. Limited holds 56.1% of all voting shares in Tasmanian Dairy Products Co Ltd.
All controlled entities are incorporated in Victoria with the exception of Murray Goulburn Dairy (Qingdao) Co., Ltd (incorporated in China) and Tasmanian Dairy Products Co Ltd (incorporated in Tasmania).
Murray Goulburn Nominees Pty Ltd and Murray Goulburn Superannuation Pty Ltd are beneficially owned.

64
MU
RR
AY G
OU
LBU
RN
NO
TiC
E O
F AG
M
201
2
Note2012
($000)2011
($000)
Balance Sheet
Current Assets
Cash 17,744 119
Receivables 397,015 357,316
inventories 361,411 382,662
Other 3,301 3,996
Total Current Assets 779,471 744,093
Non Current Assets
Receivables 45,422 53,738
Other Financial Assets 78,816 53,896
Property, Plant & Equipment 658,814 651,573
intangible Assets 4,155 4,155
Other 6,415 8,753
Total Non Current Assets 793,622 772,115
total Assets 1,573,093 1,516,208
Current Liabilities
Payables 311,967 281,556
Borrowings 114,013 68,657
Provisions 41,955 43,136
Total Current Liabilities 467,935 393,349
Non Current Liabilities
Payables 4,631 1,699
Borrowings 412,155 391,663
Provisions 7,695 6,381
Deferred Tax Liabilities 30,420 45,827
Total Non Current Liabilities 454,901 445,570
total Liabilities 922,836 838,919
Net Assets 650,257 677,289
Equity
issued Capital 248,271 235,240
Reserves 129,657 153,531
Retained Earnings (i) 272,329 288,518
Parent Entity interest 650,257 677,289
Minority interest – –
total Equity 650,257 677,289
(i) Movement in retained Earnings
Balance at the beginning of the financial year 288,518 281,350
Net profit 13,369 33,245
Dividends provided for or paid (29,937) (26,077)
Transfer from asset revaluation reserve 379 –
Balance at the end of the financial year 272,329 288,518
notes to the financial statements for the financial year ended 30 June 2012NotE 12: Controlled Entities (continued)
The consolidated balance sheet of entities which are party to the deed of cross guarantee is:
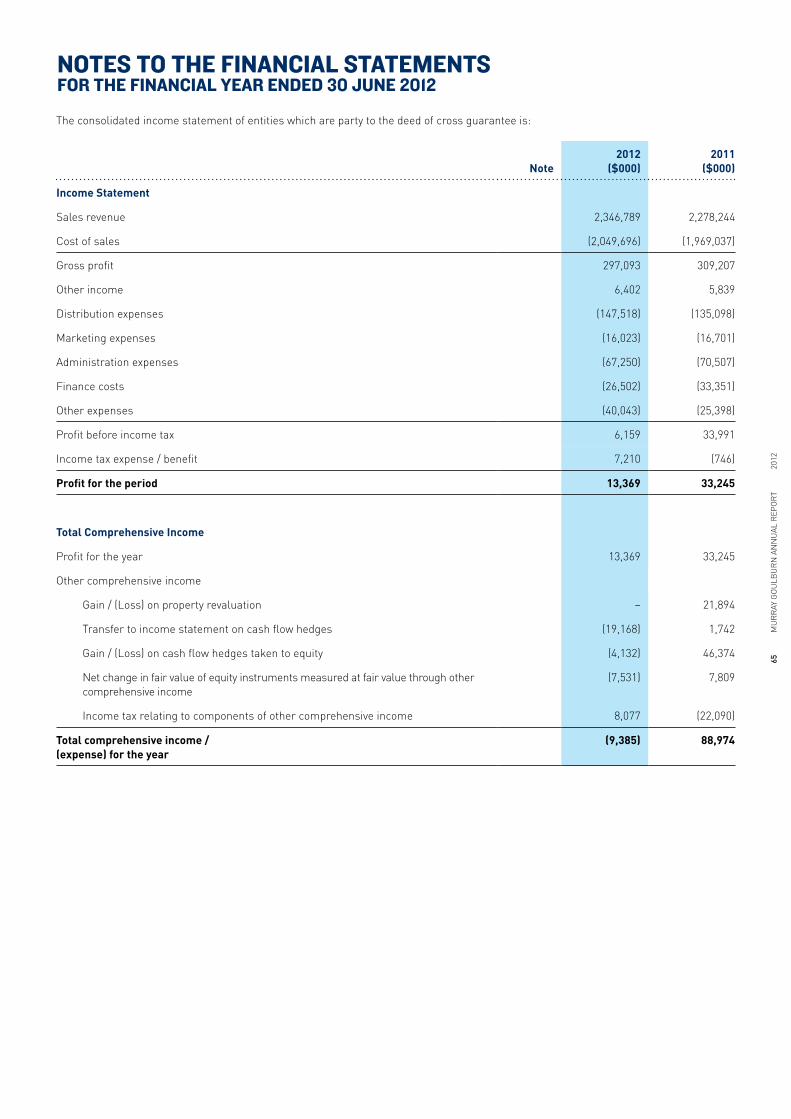
65
MU
RR
AY G
OU
LBU
RN
AN
NU
AL R
EPO
RT
2
012
Note2012
($000)2011
($000)
income Statement
Sales revenue 2,346,789 2,278,244
Cost of sales (2,049,696) (1,969,037)
Gross profit 297,093 309,207
Other income 6,402 5,839
Distribution expenses (147,518) (135,098)
Marketing expenses (16,023) (16,701)
Administration expenses (67,250) (70,507)
Finance costs (26,502) (33,351)
Other expenses (40,043) (25,398)
Profit before income tax 6,159 33,991
income tax expense / benefit 7,210 (746)
Profit for the period 13,369 33,245
total Comprehensive income
Profit for the year 13,369 33,245
Other comprehensive income
Gain / (Loss) on property revaluation – 21,894
Transfer to income statement on cash flow hedges (19,168) 1,742
Gain / (Loss) on cash flow hedges taken to equity (4,132) 46,374
Net change in fair value of equity instruments measured at fair value through other comprehensive income
(7,531) 7,809
income tax relating to components of other comprehensive income 8,077 (22,090)
total comprehensive income / (expense) for the year
(9,385) 88,974
The consolidated income statement of entities which are party to the deed of cross guarantee is:
notes to the financial statements for the financial year ended 30 June 2012

66
MU
RR
AY G
OU
LBU
RN
AN
NU
AL R
EPO
RT
2
012
Movement in investments in Associated Companies Note2012
($000)2011
($000)
Equity accounted amount at the beginning of the financial year 15,354 13,975
Acquisition of interests in associates 4,000 5,500
Share of (loss) / profit after income tax (4,660) (3,583)
Dividends received from associates (378) (538)
Equity accounted amount at the end of the financial year 14,316 15,354
The consolidated entity does not share any commitments or contingent liabilities of its associates.
• Aggregate assets of associates is $89,069,000.
• Aggregate liabilities of associates is $54,269,000.
• Aggregate revenue of associates is $155,297,000.
• Aggregate profit / (loss) of associates is ($4,781,000).
notes to the financial statements for the financial year ended 30 June 2012
Note2012
($000)2011
($000)
investments in Associated Companies 14,316 15,354
note 13: Investments accounted for using the equity method
All Associates are incorporated in Australia. investments in associated companies are accounted for in the consolidated financial statements using the equity method of accounting.
Name of Associate Principal activity Note
2012 ownership
(%)
2011 ownership
(%)
intermix Australia Pty Ltd Food ingredient processing 33.3 33.3
Dairy Technical Services Ltd Dairy analytical and technical services 25.3 25.3
Australian Milk Products Pty Ltd Exporter of dairy products 50.0 50.0
MGM (Aust) Pty Ltd Retail of dairy products 50.0 50.0
Progenex Pty Ltd Retail of dairy products 50.0 50.0
Nedfarm Milk production – dairy cattle 40.0 40.0
Danone Murray Goulburn Pty Ltd Retail of dairy products 50.0 50.0

67
MU
RR
AY G
OU
LBU
RN
NO
TiC
E O
F AG
M
201
2
note 14: property, plant and equipment
Note2012
($000)2011
($000)
Land and Buildings
Freehold land at fair value (i) 73,255 73,427
Buildings at fair value (i) 264,169 257,552
less accumulated depreciation and impairment losses (9,377) (296)
254,792 257,256
total Land and Buildings 328,047 330,683
Plant and Equipment
At cost 1,075,468 1,019,382
less accumulated depreciation and impairment losses (779,420) (730,581)
total Plant and Equipment 296,048 288,801
Vehicles
At cost 60,012 33,209
less accumulated depreciation (22,957) (20,929)
total Vehicles 37,055 12,280
Buildings and Plant in the course of construction 75,014 34,280
total Property, Plant and Equipment 736,164 666,044
(i) Valuations of Land and Buildings:
The basis of valuation of land and buildings is fair value being the market value for existing use of all freehold land and buildings. Directors have assessed the carrying value of land and buildings as at 30 June 2012 and are satisfied that it is not materially different from its fair value. Revaluations as at 30 June 2011 were based on independent assessments. This is in accordance with a policy of revaluing property progressively to ensure that the carrying value of land and buildings does not differ materially from their fair value.
notes to the financial statements for the financial year ended 30 June 2012

68
MU
RR
AY G
OU
LBU
RN
NO
TiC
E O
F AG
M
201
2
NotE 14: Property, Plant and Equipment (continued)
reconciliations
Reconciliations of the carrying amounts of each class of property, plant and equipment are set out below.
Consolidated
Land and Buildings
($000)
Plant and Equipment
($000)Vehicles
($000)
in course of construction
($000)total
($000)
Carrying amount at 1 July 2010
297,413 284,146 12,840 56,664 651,063
Additions (including transfers from capital work in progress)
20,006 51,983 4,446 (22,384) 54,051
Net revaluations through asset revaluation reserve
21,894 – – – 21,894
impairment of non current assets (i)
(1,456) – – – (1,456)
Disposals – (494) (505) – (999)
Depreciation (7,174) (46,834) (4,345) – (58,353)
Amortisation – – (156) – (156)
Carrying amount at 30 June 2011
330,683 288,801 12,280 34,280 666,044
Additions (including transfers from capital work in progress)
7,187 56,497 29,726 40,734 134,144
Net revaluations through asset revaluation reserve
– – – – –
impairment of non current assets (i)
(717) (8,863) – – (9,580)
Disposals (642) (143) (796) – (1,581)
Depreciation (8,464) (40,244) (4,155) – (52,863)
Carrying amount at 30 June 2012
328,047 296,048 37,055 75,014 736,164
Note2012
($000)2011
($000)
Goodwill at cost 12,121 5,359
Brandnames at cost 4,000 4,000
total intangible Assets 16,121 9,359
intangible assets recognised by the consolidated entity have an indefinite useful life.
note 15: Intangible assets
notes to the financial statements for the financial year ended 30 June 2012
(i) The impairment of non current assets relates to the write down in value of assets to fair value less costs to sell. These assets are not currently, or expected to be, utilised in the operations of the business. The fair value less costs to sell has been based on independent assessments by relevant experts.
reconciliations
The consolidated entity acquired goodwill of $6,762,000 during the year in relation to its investment in Tasmanian
Dairy Products Co Ltd, refer note 33 below. There was no movement in brandnames at cost during 2012 or 2011.
in considering impairment, management have considered relevant forecasted cash flow projections.

69
MU
RR
AY G
OU
LBU
RN
AN
NU
AL R
EPO
RT
2
012
note 16: payables
Note2012
($000)2011
($000)
Current
Trade payables 112,760 62,114
Payable to suppliers 134,470 184,201
Sundry payables and accrued expenses 82,021 42,025
Foreign currency derivatives (i) 228 16
329,479 288,356
Non Current
Net defined benefit superannuation fund liability 27 3,631 699
Other 1,872 1,752
5,503 2,451
notes to the financial statements for the financial year ended 30 June 2012
(i) Foreign currency derivatives represent unrealised losses on foreign exchange contracts that are hedges against sales. Unrealised gains and losses on foreign currency hedge contracts are deferred in equity or recognised in profit or loss as appropriate. Foreign currency derivatives are Level 2 financial instruments recorded at fair value using observable market inputs.
All payables are recorded at amortised cost except for derivatives at (i) and the net defined benefit superannuation fund liability which are recorded at fair value. The fair value of payables is documented in Note 30(d).
note 17: borrowings
Note2012
($000)2011
($000)
Current
Bank loans 96,350 16,309
Private placement senior notes 17,663 22,348
Domestic note issue – 30,000
114,013 68,657
Non Current
Bank loans 184,675 119,839
Private placement senior notes 158,964 167,613
343,639 287,452
The bank loans, private placement senior and domestic notes are covered by negative pledge agreements between the parent entity and its financiers.
All borrowings are recorded at amortised cost. Private placement notes are designated in effective cash flow hedge relationships with the exception of $49,063,000 (2011: $46,559,000).
The fair value of borrowings is documented in Note 30(d).

70
MU
RR
AY G
OU
LBU
RN
AN
NU
AL R
EPO
RT
2
012
note 18: Current tax payable
Note2012
($000)2011
($000)
income tax payable 832 –
note 19: provisions
Note2012
($000)2011
($000)
Current
Other 1 2
Employee benefits 41,992 43,181
41,993 43,183
Non Current
Employee benefits 7,712 6,381
7,712 6,381
note 20: Deferred tax liabilities
Note2012
($000)2011
($000)
Deferred tax liability 4 30,022 45,185
note 21: Contingent liabilitiesThe consolidated entity is not aware of any contingent liabilities.
notes to the financial statements for the financial year ended 30 June 2012

71
MU
RR
AY G
OU
LBU
RN
AN
NU
AL R
EPO
RT
2
012
Changes to the then Corporations Law abolished the par value concept in relation to share capital from 1 July 1998. Therefore, the company does not have a limited amount of authorised capital and issued shares do not have a par value. All shares are fully paid.
a) Ordinary Shares:
Ordinary shares entitle the holder to participate in dividends and the proceeds on winding up of the company in proportion to the number of shares held. On a show of hands every holder of ordinary shares present at a meeting in person or by proxy, is entitled to one vote and upon a poll each share is entitled to one vote. Upon ceasing supply of milk to the company, shareholders’ ordinary shares are converted into a class of non cumulative, non redeemable preference shares as determined by the board.
b) A class 8% Non Cumulative Non-redeemable Preference Shares:
A class 8% non cumulative, non redeemable preference shares entitle holders to receive, out of profits available for dividend, a preferential dividend at a rate of 8% per annum. These holders have no voting rights at a general meeting of the company but can convert their shares into ordinary shares, by resolution of the directors, if any holder becomes a supplier to the company.
c) B class Non Cumulative Non-redeemable Preference Shares:
B class non cumulative, non redeemable preference shares entitle holders to receive, out of profits available for dividend, a preferential dividend at a variable rate. These holders have no voting rights at a general meeting of the company but can convert their shares into ordinary shares, by resolution of the directors, if any holder becomes a supplier to the company.
d) C class Non Cumulative Non-redeemable Preference Shares:
C class non cumulative, non redeemable preference shares entitle holders to receive, out of profits available for dividend, a preferential dividend at a variable rate. These holders have no voting rights at a general meeting of the company but can convert their shares into ordinary shares, by resolution of the directors, if any holder becomes a supplier to the company.
note 22: Issued Capital
Number of shares
Movements in issued Capital
ordinary Shares (a)
A Class Preference Shares (b)
B Class Preference Shares (c)
C Class Preference Shares (d) total
Balance at 30 June 2010 186,745,537 16,389,868 18,296,009 21,282,499 242,713,913
Shares issued 1,977,682 – – – 1,977,682
Bonus shares issued 19,611,000 – – – 19,611,000
Dividend reinvestment plan issues
98,149 23,304 417 12 121,882
Transfers 7,572,620 (590,710) (7,659,177) 677,267 –
Balance at 30 June 2011 216,004,988 15,822,462 10,637,249 21,959,778 264,424,477
Shares issued 8,771,637 – – – 8,771,637
Net Dividend reinvestment plan issues
4,264,053 21,905 464 14 4,286,436
Transfers (3,283,113) (669,534) (534,126) 4,486,773 –
Balance at 30 June 2012 225,757,565 15,174,833 10,103,587 26,446,565 277,482,550
Notes2012
($000)2011
($000)
issued Capital 248,271 235,240
notes to the financial statements for the financial year ended 30 June 2012
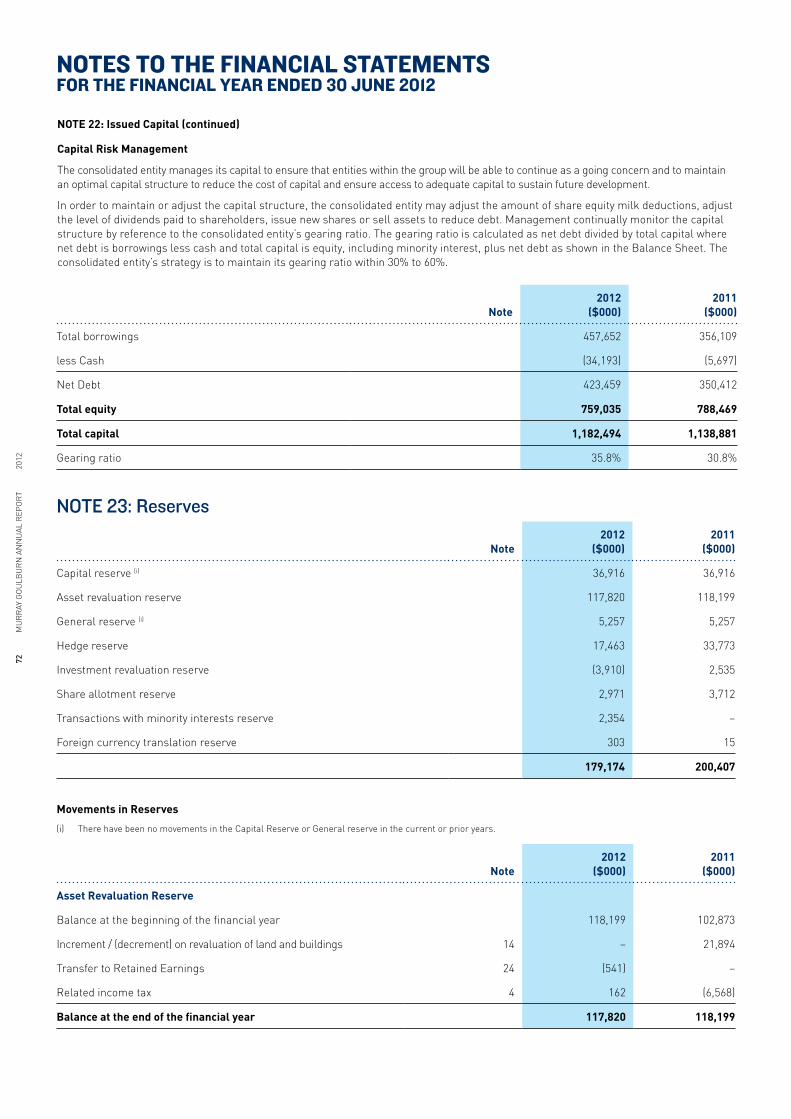
72
MU
RR
AY G
OU
LBU
RN
AN
NU
AL R
EPO
RT
2
012
Note2012
($000)2011
($000)
Total borrowings 457,652 356,109
less Cash (34,193) (5,697)
Net Debt 423,459 350,412
total equity 759,035 788,469
total capital 1,182,494 1,138,881
Gearing ratio 35.8% 30.8%
note 23: reserves
Note2012
($000)2011
($000)
Capital reserve (i) 36,916 36,916
Asset revaluation reserve 117,820 118,199
General reserve (i) 5,257 5,257
Hedge reserve 17,463 33,773
investment revaluation reserve (3,910) 2,535
Share allotment reserve 2,971 3,712
Transactions with minority interests reserve 2,354 –
Foreign currency translation reserve 303 15
179,174 200,407
Movements in reserves
(i) There have been no movements in the Capital Reserve or General reserve in the current or prior years.
Note2012
($000)2011
($000)
Asset revaluation reserve
Balance at the beginning of the financial year 118,199 102,873
increment / (decrement) on revaluation of land and buildings 14 – 21,894
Transfer to Retained Earnings 24 (541) –
Related income tax 4 162 (6,568)
Balance at the end of the financial year 117,820 118,199
notes to the financial statements for the financial year ended 30 June 2012
NotE 22: issued Capital (continued)
Capital risk Management
The consolidated entity manages its capital to ensure that entities within the group will be able to continue as a going concern and to maintain an optimal capital structure to reduce the cost of capital and ensure access to adequate capital to sustain future development.
in order to maintain or adjust the capital structure, the consolidated entity may adjust the amount of share equity milk deductions, adjust the level of dividends paid to shareholders, issue new shares or sell assets to reduce debt. Management continually monitor the capital structure by reference to the consolidated entity’s gearing ratio. The gearing ratio is calculated as net debt divided by total capital where net debt is borrowings less cash and total capital is equity, including minority interest, plus net debt as shown in the Balance Sheet. The consolidated entity’s strategy is to maintain its gearing ratio within 30% to 60%.

73
MU
RR
AY G
OU
LBU
RN
AN
NU
AL R
EPO
RT
2
012
Note2012
($000)2011
($000)
Hedge reserve
Balance at the beginning of the financial year
33,773 92
Transferred to income Statement (19,168) 1,742
Related income tax 4 5,750 (523)
Gains / (losses) on cash flow hedges (4,132) 46,374
Related income tax 4 1,240 (13,912)
Balance at the end of the financial year 17,463 33,773
investment revaluation reserve
Balance at the beginning of the financial year 2,535 (4,188)
Net change in fair value of equity instruments measured at fair value through other comprehensive income
(7,531) 7,809
Related income tax 4 1,086 (1,086)
Balance at the end of the financial year (3,910) 2,535
Share Allotment reserve
Balance at the beginning of the financial year
3,712 3,622
Allotment of shares to suppliers (3,712) (3,622)
Shares to be issued in lieu of milk payments
2,971 3,712
Balance at the end of the financial year 2,971 3,712
At 30 June 2012 an amount of $2,971,000 (2011: $3,712,000) was due to suppliers, being deductions made from milk payments during the year. This was satisfied by the allotment of fully paid shares in September 2012 (September 2011).
notes to the financial statements for the financial year ended 30 June 2012
Note2012
($000)2011
($000)
transactions with minority interests reserve
Balance at the beginning of the financial year – –
Sale of investment in subsidiary to minority interest 2,354 –
Balance at the end of the financial year 2,354 –
Foreign Currency translation reserve
Balance at the beginning of the financial year 15 (67)
Translation of foreign operations 412 117
Related income tax 4 (124) (35)
Balance at the end of the financial year 303 15

74
MU
RR
AY G
OU
LBU
RN
AN
NU
AL R
EPO
RT
2
012
NotE 23: reserves (continued)
nature anD purpoSe oF reSerVeS
Capital reserve
The capital reserve is used to accumulate realised capital profits.
Asset revaluation reserve
The asset revaluation reserve is used to record increments and decrements on the revaluation of non-current assets.
General reserve
The general reserve is used from time to time to transfer profits from retained earnings. There is no policy of regular transfer.
Hedge reserve
The hedge reserve represents hedging gains and losses recognised on the effective portion of cash flow hedges. The cumulative deferred gain or loss on the hedge is recognised in profit or loss when the hedged transaction impacts the profit or loss.
investment revaluation reserve
The investment revaluation reserve represents accumulated gains and losses arising on the revaluation of investments that have been recognised through other comprehensive income.
Share Allotment reserve
The share allotment reserve reflects the value of shares to be allotted to suppliers. The allotments arise from deductions made from milk payments during the year.
transactions with Minority interests reserve
This reserve is used to account for transactions with minority interests in accordance with accounting standards.
Foreign Currency translation reserve
The foreign currency translation reserve represents exchange differences relating to the translation from the functional currencies of the Group’s foreign controlled entities into Australian dollars.
notes to the financial statements for the financial year ended 30 June 2012
Note2012
($000)2011
($000)
Balance at the beginning of the financial year 252,197 249,817
Net profit attributable to members of the parent entity 11,085 28,457
Dividends provided for or paid 7 (29,937) (26,077)
Transfer from reserves 379 –
Balance at the end of the financial year 233,724 252,197
note 24: retained earnings
note 25: minority Interests
Note2012
($000)2011
($000)
Minority interests comprises:
99,264,468 fully paid Employees Profits Participation Units (2011: 99,264,468) and 5 (2011: 5) fully paid ordinary shares in MG Employees Equity Ltd
28 78,245 99,264
980,000 ordinary shares in Qingdao Murray Goulburn Dairy Co., Ltd (2011: 980,000) 3,895 832
49 ordinary shares in Provico Pty Ltd (2011: 49) 806 529
221 Class A shares in Tasmanian Dairy Products Co Ltd (2011: nil) 14,920 –
97,866 100,625

75
MU
RR
AY G
OU
LBU
RN
AN
NU
AL R
EPO
RT
2
012
note 26: Capital and leasing Commitments
Note2012
($000)2011
($000)
a) operating Lease Commitments
Due within 1 year 6,372 18,822
Due within 1–5 years 15,918 10,755
Due longer than 5 years 13,073 1,217
35,363 30,794
Operating leases relate to Trading stores, warehousing facilities, office space, and vehicles, with lease terms of between 1 to 31 years. Some leases have an option to extend the lease term. The consolidated entity does not have an option to purchase the leased assets at the expiry of the lease period.
Note2012
($000)2011
($000)
b) Capital Expenditure Commitments
Contracted capital expenditure commitments due within one year 61,066 40,756
note 27: Defined benefit Superannuation planThe Company participates in a defined benefit superannuation plan, the MGC Superannuation Fund, which has been established and sponsored by the parent entity. This plan is a funded plan and provides a lump sum benefit on retirement, death, disablement and withdrawal. The defined benefit section of the plan is closed to new members.
Contributions are made by employees and the consolidated entity as percentages of salary. The consolidated entity is obliged to make contributions as specified in the rules of the fund.
The consolidated entity expects to make a contribution of $487,000 (2011: $666,000) to the plan during the next financial year.
The method used to determine the employer contribution recommendations at the last actuarial review was the Target Funding method. The method adopted affects the timing of the cost to the consolidated entity.
The consolidated entity has recognised a liability in the balance sheet in respect of its defined benefit superannuation arrangements.
if a surplus exists in the plan, the consolidated entity may be able to take advantage of it in the form of a reduction in the required contribution rate, depending on the advice of the plan’s actuary.
The consolidated entity may at any time by notice to the Trustee terminate its contributions. The consolidated entity has a liability to pay the contributions due prior to the effective date of the notice, but there is no requirement for the consolidated entity to pay any further contributions, irrespective of the financial condition of the plan.
Note2012
($000)2011
($000)
reconciliation of the Fair Value of Plan Assets
Fair value of plan assets at beginning of the year 28,829 27,018
Expected return on plan assets 1,130 1,783
Actuarial gains / (losses) (2,273) 154
Employer contributions 954 2,860
Contributions by plan participants 221 320
Benefits paid (17,320) (2,785)
Taxes, premiums and expenses paid (217) (521)
Transfers (out) / in – –
Fair value of plan assets at end of the year 11,324 28,829
The fair value of plan assets includes no amounts relating to any of the consolidated entity’s own financial instruments or any property occupied by, or other assets used by, the consolidated entity.
The actual loss on plan assets was $1,143,000 (2011: $1,937,000 gain on plan assets).
notes to the financial statements for the financial year ended 30 June 2012

76
MU
RR
AY G
OU
LBU
RN
AN
NU
AL R
EPO
RT
2
012
Note2012
($000)2011
($000)
reconciliation of the Present Value of the defined Benefit obligation
Present value of the defined benefit obligations at beginning of the year
29,528 29,470
Current service cost 819 690
interest cost 724 1,137
Contributions by plan participants 221 320
Actuarial (gains) / losses 1,200 1,217
Benefits paid (17,320) (2,785)
Taxes, premiums and expenses paid (217) (521)
Transfers (out) / in – –
Present value of the defined benefit obligations at end of the year
14,955 29,528
Net superannuation (liability) / asset included in other Non Current Payables / Assets
(3,631) (699)
Expense recognised in income Statement
Service cost 819 690
interest cost 724 1,137
Expected return on assets (1,130) (1,783)
Actuarial loss 3,473 1,063
Superannuation expense 3,886 1,107
Superannuation expense is allocated to cost of sales (70%) and administration expenses (30%).
Historical information Note2012
($000)2011
($000)
Experience adjustments (gain) / loss on plan assets 2,273 (154)
Experience adjustments (gain) / loss on plan liabilities (101) 3,022
in determining the expected rate of return on assets, the actuary has considered the expected future investment returns for each major asset class net of investment tax and investment fees.
Note2012
(%)2011
(%)
Principal actuarial assumptions used
Discount rate 2.3 4.3
Expected rate of return on plan assets 6.8 6.8
Expected salary increase rate 4.0 4.0
the percentage invested in each asset class at the balance date:
Australian equity 25 27
international equity 29 27
Fixed income 18 14
Property 16 10
Other 12 22
notes to the financial statements for the financial year ended 30 June 2012
NotE 27: defined Benefit Superannuation Plan (continued)

77
MU
RR
AY G
OU
LBU
RN
AN
NU
AL R
EPO
RT
2
012
the history of experience adjustments are as follows
2012 ($000)
2011 ($000)
2010 ($000)
2009 ($000)
2008 ($000)
Fair value of plan assets at end of the year
11,324 28,829 27,018 25,570 30,212
Present value of the defined benefit obligations at end of the year
14,955 29,528 29,470 30,606 27,559
Surplus / (Deficit) (3,631) (699) (2,452) (5,036) 2,653
Experience adjustments (gain) / loss on plan assets
2,273 (154) (467) 5,713 4,922
Experience adjustments (gain) / loss on plan liabilities
(101) 3,022 (359) 840 1,828
note 28: murray goulburn group employees profits participation Schemein 1993 Murray Goulburn established an Employees Profits Participation Scheme under which employees of the Murray Goulburn Group with 12 months or more work experience with the Murray Goulburn Group could choose to invest in Employees Profits Participation Units in MG Employees Equity Limited (“MGEE”). MGEE invests the employees’ contributions in A class participating non-cumulative non redeemable preference shares in Murray Goulburn investment Limited.
Eligible employees must borrow all monies required to pay for the MGEE Employees Profits Participation Units either from MGEE or Murray Goulburn. The maximum amount each employee is entitled to borrow is equivalent to one year’s salary, rounded up to the nearest $10,000. MGEE funds the employee loans by borrowing from Murray Goulburn. All borrowings are interest free and employees repay their loans at 3% per annum or in full on withdrawal from the scheme. Loans receivable from employees are recorded at amortised cost.
The adjustment to employee loans has been capitalised as an asset to the extent that it relates to future employee services.
Loans receivable from employees are effectively secured by the Employees Profits Participation Units held by the employees.
At 30th June 2012, 1,122 employees had been issued with 99,264,468 $1.00 Employees Profits Participation Units.
The value of Employees Profits Participation Units issued by MG Employees Equity Limited to employees of the consolidated entity is recognised as a Minority interest. Loans owing by employees are included in other receivables in Note 8 above.
Amounts recognised are as follows 2012 ($000)
2011 ($000)
Minority interest 78,245 99,264
Employee loans (current and non current) 37,401 47,830
notes to the financial statements for the financial year ended 30 June 2012
note 29: events Subsequent to balance DateSince 30 June 2012, the company has announced a 1 for 10 bonus issue of ordinary shares based on shareholdings as at 30 September 2012.
With the exception of the bonus issue and the declaration of dividends detailed in Note 7 ‘Unrecognised Amounts’, no matters or circumstances have arisen since the end of the financial year which significantly affected or may significantly affect the operations of the consolidated entity, the results of those operations, or the state of affairs of the consolidated entity in financial years subsequent to the financial year ended 30 June 2012.

78
MU
RR
AY G
OU
LBU
RN
AN
NU
AL R
EPO
RT
2
012
note 30: Financial InstrumentsRisk management is carried out by the treasury and finance departments under policies approved by the Board of Directors.
Financial risks are managed in accordance with written policies overseen by the board.
The consolidated entity does not enter into or trade financial instruments, including derivative financial instruments, for speculative purposes. The use of financial derivatives is governed by the consolidated entity’s policy approved by the board of directors which provides written principles on the use of financial derivatives. Compliance with policy and exposure limits is reviewed continuously by senior management and by the board of directors on a quarterly basis.
a) marKet rISK The consolidated entity’s activities expose it primarily to the financial risks of changes in foreign currency exchange rates and interest rates. The consolidated entity enters into a variety of derivative financial instruments to manage its exposure to foreign currency and interest rate risk, including:
• Forward foreign currency and foreign currency option contracts to hedge the exchange rate risk arising on the sale of exported dairy goods in $US; and
• interest rate swaps to hedge the fair value risk associated with fluctuating interest rates.
Details of the significant accounting policies and methods adopted, including the criteria for recognition, the basis of measurement and the basis on which income and expenses are recognised, in respect of financial instruments are disclosed in Note 1 to the financial statements and below.
Foreign Currency risk Management
The group undertakes transactions denominated in foreign currencies, hence exposures to exchange rate fluctuations arise.
Exchange rate exposures are managed within approved policy parameters utilising forward foreign exchange contracts and foreign exchange options.
Forward Foreign Exchange Contracts
The consolidated entity maintains a policy of matching anticipated future cash flows in foreign currencies, ie. highly probable sales, for cash flow hedge accounting purposes, with forward exchange contracts in the same currency and with closely corresponding settlement dates.
At balance date, the entity has $US320 million (2011: $US180 million) forward exchange contracts outstanding with maturity dates not exceeding one year, of which $US39 million (2011: $USnil million) relate to receivables at balance date and $US281 million (2011: $US180 million) to future transactions. The fair value of these contracts at balance date is $2.9 million (2011: $9.1 million).
Unrealised gains or losses at year end on specific hedges in the form of forward exchange contracts, in respect of unsettled sales transactions, are deferred and recognised in the hedge reserve to match against the underlying hedge transaction.
Forward exchange contracts are classified as Level 2 financial instruments, as their fair value measurement is derived from inputs other than quoted prices that are observable for the asset or liability.
Currency options
During the year the consolidated entity entered into a range of US Dollar currency options with varying maturities and strike rates.
By simultaneously purchasing and selling options in barrier type structures, the entity has effectively capped an exchange rate should the AUD strengthen whilst maintaining the flexibility to improve the exchange rate should the AUD trade at more favourable levels.
At balance date, the entity had bought call options to the value of $US nil (2011: $US nil) with varying strike rates and sold call options to the value of $US nil (2011: $US nil). These were taken in conjunction with forward exchange contracts as part of the overall hedging strategy. All currency options have expiry dates not exceeding one year and were purchased or sold strictly as a means of reducing foreign exchange risk associated with hedging future sales denominated in $US. The fair value of these contracts at balance date is $nil (2011: $nil).
Private Placement Senior Notes
The private placement is designated in a cash flow hedge relationship and is hedging highly probable forecast sales denominated in USD to be invoiced at the time of each loan repayment. The effective portion of changes in the fair value of the Private Placement due to foreign currency changes is recognised directly in equity via the Hedge Reserve.
Foreign Currency Sensitivity
The consolidated entity is exposed to US dollars (USD). The following table details the consolidated entity’s sensitivity to a 1% increase and decrease in the Australian dollar (AUD) against the USD as at balance date. The sensitivity includes outstanding foreign currency derivatives and foreign currency denominated monetary items and adjusts their translation at the period end for a 1% change in foreign currency rates.
notes to the financial statements for the financial year ended 30 June 2012

79
MU
RR
AY G
OU
LBU
RN
AN
NU
AL R
EPO
RT
2
012
2012 ($000)
2011 ($000)
other Equity
AUD strengthens 1% – increase / (decrease) 2,794 2,156
AUD weakens 1% – increase / (decrease) (2,850) (2,199)
Profit or Loss
AUD strengthens 1% – increase / (decrease) (32) (55)
AUD weakens 1% – increase / (decrease) 33 56
b) IntereSt rate rISKTrade and other receivables, trade payables and accruals and loans from the state government of Victoria are non-interest bearing.
The AUD bank overdraft bears interest at a floating rate based on the targeted cash rate of the Reserve Bank of Australia. The USD bank overdraft bears interest at a floating rate based on the London interbank Offered Rate. USD cash on hand yields interest at the US interbank Bid Rate. AUD cash on hand bears interest at a floating rate based on the targeted cash rate of the Reserve Bank of Australia.
Bank loans consist of short term and long term USD and AUD revolving loan facilities, on which interest is payable at floating rates.
Rates on US Dollar loans are based on LiBOR. Rates on AUD loans are based on BBR.
The 2003 Private Placement bears interest at a fixed rate of 4.98%. The Private Placement will be repaid as follows: $US18.0 million (18 October 2012) and $US12.0 million (18 October 2013).
The 2009 Private Placement will be repaid as follows and bears interest at the following fixed rates: $US30.0 million, 4.83%
(29 October 2014), $US17.0 million, 5.44% (29 October 2016), $US89.0 million, 5.81% (29 October 2019), $US14.0 million, 5.96% (29 October 2021).
An analysis of borrowings by maturities is provided in paragraph (e) below.
interest rate Sensitivity
The consolidated entity’s sensitivity to a 50 basis point increase or decrease, representing management’s assessment of the possible change in interest rates, holding all other variables constant would be a decrease / increase in net profit of $984,000
(2011: $533,000 decrease / increase).
C) CreDIt rISK eXpoSureSThe maximum exposure to credit risk at balance date in relation to financial assets is the carrying amount, net of any allowances, of those assets as indicated in the balance sheet. The consolidated entity has adopted a policy of dealing with creditworthy counterparties assessed by reference to their financial position, internal and external credit assessment and historical trading experience. Concentrations of credit risk is minimised by undertaking transactions with a large number of customers and counterparties in various countries.
Other receivables current include amounts receivable from suppliers and from GST paid.
Other receivables non current represent loans to employees and are effectively secured by employees’ minority interest.
D) FaIr ValueThe fair value of other financial assets and financial liabilities, excluding derivative instruments, are determined in accordance with generally accepted pricing models based on discounted cash flow analysis using prices from observable current market transactions.
To calculate the fair value of derivative instruments, use is made of discounted cash flow analysis using the applicable yield curve for the duration of the instruments for non-optional derivatives and option pricing models for optional derivatives.
The carrying amount recorded in the financial statements represents the fair value of all assets and liabilities, determined in accordance with the accounting policies in Note 1 to the financial statements, except for those mentioned below. The fair value is derived by discounting the expected future cash flows by the current interest rates for assets and liabilities with similar risk profiles.
The fair value of non current Other Receivables at balance date is $35.7 million (2011: $44.8 million).
The fair value of the Private Placement at balance date is $218.1 million (2011: $204.2 million).
The fair value of a government loan of $1.0 million at balance date is $0.8 million (2011: $0.6 million).
e) lIquIDIty rISK managementLiquidity risk is managed by maintaining adequate borrowing facilities, by continuously monitoring forecast and actual cash flows and matching the maturity profiles of financial assets and liabilities. included in Note 32(c) is a listing of additional undrawn facilities that are available to reduce liquidity risk.
notes to the financial statements for the financial year ended 30 June 2012
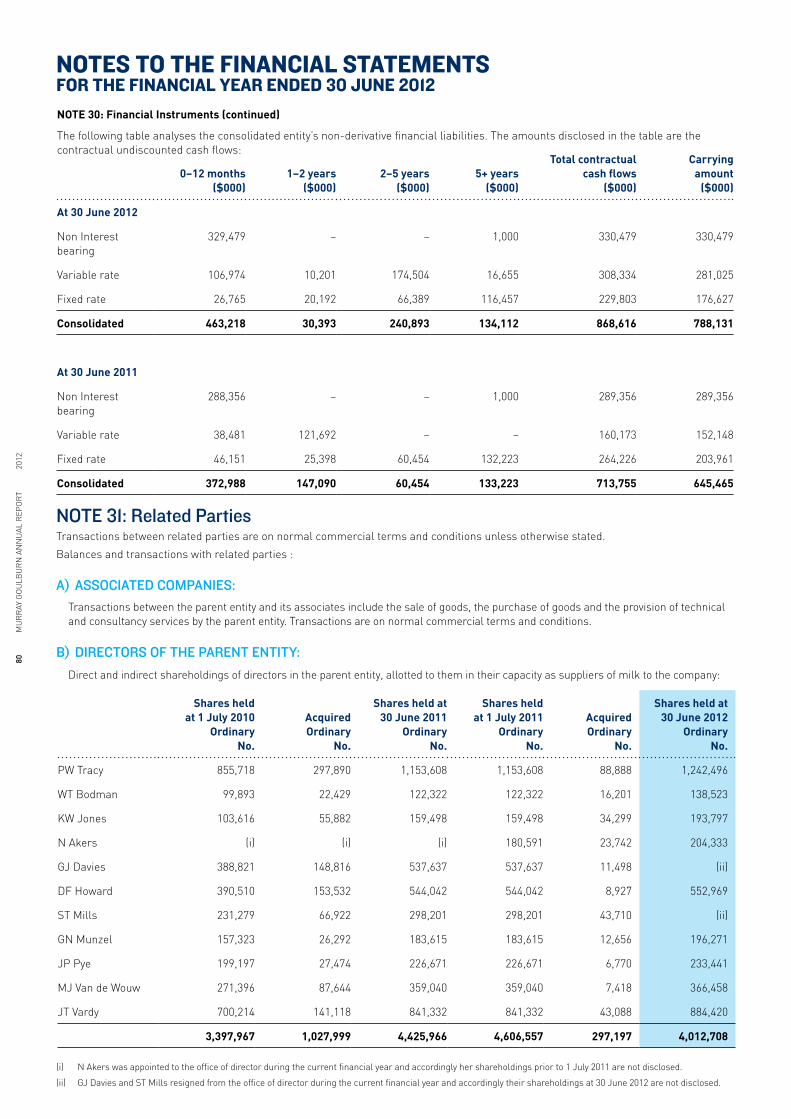
80
MU
RR
AY G
OU
LBU
RN
AN
NU
AL R
EPO
RT
2
012
0–12 months ($000)
1–2 years ($000)
2–5 years ($000)
5+ years ($000)
total contractual cash flows
($000)
Carrying amount
($000)
At 30 June 2012
Non interest bearing
329,479 – – 1,000 330,479 330,479
Variable rate 106,974 10,201 174,504 16,655 308,334 281,025
Fixed rate 26,765 20,192 66,389 116,457 229,803 176,627
Consolidated 463,218 30,393 240,893 134,112 868,616 788,131
At 30 June 2011
Non interest bearing
288,356 – – 1,000 289,356 289,356
Variable rate 38,481 121,692 – – 160,173 152,148
Fixed rate 46,151 25,398 60,454 132,223 264,226 203,961
Consolidated 372,988 147,090 60,454 133,223 713,755 645,465
note 31: related partiesTransactions between related parties are on normal commercial terms and conditions unless otherwise stated.
Balances and transactions with related parties :
a) aSSoCIateD CompanIeS: Transactions between the parent entity and its associates include the sale of goods, the purchase of goods and the provision of technical
and consultancy services by the parent entity. Transactions are on normal commercial terms and conditions.
b) DIreCtorS oF tHe parent entIty: Direct and indirect shareholdings of directors in the parent entity, allotted to them in their capacity as suppliers of milk to the company:
Shares held at 1 July 2010
ordinary No.
Acquired ordinary
No.
Shares held at 30 June 2011
ordinary No.
Shares held at 1 July 2011
ordinary No.
Acquired ordinary
No.
Shares held at 30 June 2012
ordinary No.
PW Tracy 855,718 297,890 1,153,608 1,153,608 88,888 1,242,496
WT Bodman 99,893 22,429 122,322 122,322 16,201 138,523
KW Jones 103,616 55,882 159,498 159,498 34,299 193,797
N Akers (i) (i) (i) 180,591 23,742 204,333
GJ Davies 388,821 148,816 537,637 537,637 11,498 (ii)
DF Howard 390,510 153,532 544,042 544,042 8,927 552,969
ST Mills 231,279 66,922 298,201 298,201 43,710 (ii)
GN Munzel 157,323 26,292 183,615 183,615 12,656 196,271
JP Pye 199,197 27,474 226,671 226,671 6,770 233,441
MJ Van de Wouw 271,396 87,644 359,040 359,040 7,418 366,458
JT Vardy 700,214 141,118 841,332 841,332 43,088 884,420
3,397,967 1,027,999 4,425,966 4,606,557 297,197 4,012,708
(i) N Akers was appointed to the office of director during the current financial year and accordingly her shareholdings prior to 1 July 2011 are not disclosed.
(ii) GJ Davies and ST Mills resigned from the office of director during the current financial year and accordingly their shareholdings at 30 June 2012 are not disclosed.
notes to the financial statements for the financial year ended 30 June 2012NotE 30: Financial instruments (continued)
The following table analyses the consolidated entity’s non-derivative financial liabilities. The amounts disclosed in the table are the contractual undiscounted cash flows:

81
MU
RR
AY G
OU
LBU
RN
AN
NU
AL R
EPO
RT
2
012
Directors of the parent company supply milk to the consolidated entity, are able to purchase goods at Murray Goulburn Trading Pty Ltd stores at commercial prices and can obtain loans from the consolidated entity in the same manner as all other suppliers.
PW Tracy holds an interest in Southern Stockfeeds, which has provided products to Murray Goulburn Trading Pty Ltd at normal commercial terms and conditions. The total amount purchased was $523,201 (2011: $813,802), with a balance outstanding at financial yearend of $34,296 (2011: $49,725).
Aggregate of loans to 4 (2011: 5) directors as at financial year end: $189,291 (2011: $458,050).
Total interest paid by directors: $4,947 (2011: $16,321).
Details regarding loans outstanding at the reporting date to directors and their related parties, where the individual’s aggregate loan balance exceeded $100,000 at any time in the reporting period, are as follows:
ST Mills: total loan at financial year end: $nil (2011: $114,932); peak loan balance during the year: $114,932; interest paid $3,831
GJ Davies: total loan at financial year end: $45,500 (2011: $112,569); peak loan balance during the year: $112,569; interest paid $nil
JT Vardy: total loan at financial year end: $131,759 (2011: $157,033); peak loan balance during the year: $302,987; interest paid $nil
PJO Hawkins is a director of Westpac Banking Corporation, which is one of the banks on the consolidated entity’s banking panel. All transactions with Westpac Banking Corporation are on normal terms and conditions.
S O’Rourke received $174,000 during the financial year for consultancy and transitioning services provided after the termination of his employment on 31 July 2011. These services ceased prior to June 2012.
C) Key management perSonnel:Key management personnel of the consolidated entity participate in the Employees Profits Participation Scheme under the same terms and conditions available to all employees (refer Note 28). All loans are interest free and repayable at 3.0% per annum.
Key management personnel hold the following number of Employees Profits Participation Units in MG Employees Equity Limited:
Shares held 1 July 2010
No.
Net other Change
No.
Shares held 30 June 2011
No.
Shares held 1 July 2011
No.
Net other Change
No.
Shares held 30 June 2012
No.
SJ O’Rourke 2,321,210 440,684 2,761,894 2,761,894 (2,761,894) –
P Kerr 680,141 111,809 791,950 791,950 (791,950) –
N Longstaff 423,667 29,656 453,323 453,323 – 453,323
M Beniston 273,420 83,339 356,759 (i) (i) (i)
P Hobman 369,186 57,943 427,129 (ii) (ii) (ii)
R Greenaway – 64,200 64,200 (iii) (iii) (iii)
Balance at 1 July 2010 ($)
Balance at 30 June
2011 ($)
Balance at 30 June
2012 ($)
Highest in Period 2011 ($)
Highest in Period 2012 ($)
Notional interest 2011 ($)
Notional interest 2012 ($)
SJ O’Rourke 1,054,650 1,272,650 – 1,276,150 1,272,650 73,826 5,435
P Kerr 293,825 341,825 – 342,825 341,825 20,568 7,917
N Longstaff 207,300 199,200 191,100 207,300 199,200 14,511 9,855
M Beniston 225,000 277,800 (i) 278,400 (i) 15,750 (i)
P Hobman 225,275 247,175 (ii) 247,850 (ii) 15,769 (ii)
R Greenaway – 60,000 (iii) 60,000 (iii) 4,200 (iii)
interest free loans to key management personnel, the terms of which are disclosed in Note 28, via the Employees Profits Participation Scheme:
(i) M Beniston ceased to qualify as a key management person at the end of the prior year and accordingly his unit holdings and interest free loan details are disclosed only to that date.
(ii) P Hobman ceased to qualify as a key management person for 2012 and accordingly his unit holdings and interest free loan to 30 June 2012 are not disclosed.
(iii) R Greenaway ceased to qualify as a key management person for 2012 and accordingly his unit holdings and interest free loan to 30 June 2012 are not disclosed.
P Kerr holds nil (2011: 1,068) A Class 8% Non Cumulative Non-redeemable Preference Shares in the company.
R Poole holds an interest in 62,098 (16 Nov 2011: 58,762) ordinary shares in the company. He acquired 3,336 shares whilst qualifying as a key management person between 16 November 2011 and 30 June 2012.
D Page was a key management person during the period 11 December 2011 to 22 March 2012. During this period he held 290,210 shares with a highest loan balance of $188,000 and notional interest of $2,716.
Notional interest is included in non monetary compensation of key management personnel.
notes to the financial statements for the financial year ended 30 June 2012

82
MU
RR
AY G
OU
LBU
RN
AN
NU
AL R
EPO
RT
2
012
note 32: notes to the Statement of Cash Flowsa) reConCIlIatIon oF CaSH For the purposes of the statement of cash flows, cash includes cash on hand, deposits on call and investments in money market instruments, net of bank overdrafts.
Cash at the end of the year as shown in the statement of cash flows is reconciled to cash in the balance sheet as follows:
Note2012
($000)2011
($000)
Cash per balance sheet 34,193 5,697
Cash per statement of cash flows 34,193 5,697
b) reConCIlIatIon oF proFIt For tHe perIoD to net CaSH FloW From operatIng aCtIVItIeS
Note2012
($000)2011
($000)
Profit for the Period 14,467 36,319
Depreciation 52,863 58,353
Amortisation – 156
Movement in doubful debts provision (1,057) (407)
impairment of non current assets 9,580 1,456
impairment of intangible assets – 1,244
Loss (Gain) on disposal of fixed assets (469) 265
Share of (profit) loss of associated company 5,039 4,121
(Gain) Loss from defined benefit superannuation fund 2,932 (1,753)
Change in operating assets and liabilities
Decrease (increase) in trade receivables (38,291) 18,682
Decrease (increase) in other receivables and prepayments (1,486) 1,946
Decrease (increase) in inventories 24,265 (11,179)
increase (decrease) in trade payables and amounts due to suppliers 40,671 77,730
increase (decrease) in provisions 1,332 3,630
increase (decrease) in deferred tax liability (7,210) 747
Net cash inflow (outflow) from operating activities 102,636 191,310
C) FInanCIng arrangementS
Note2012
($000)2011
($000)
Credit facility 584,437 722,936
Amount utilised 281,025 137,195
unused credit facility 303,412 585,741
The major facilities consist of a bank overdraft facility repayable at call, and loan facilities which are subject to yearly review to ensure that the required financial ratios are met.
D) non-CaSH FInanCIng anD InVeStIng aCtIVItIeS Nil.
notes to the financial statements for the financial year ended 30 June 2012

83
MU
RR
AY G
OU
LBU
RN
AN
NU
AL R
EPO
RT
2
012
notes to the financial statements for the financial year ended 30 June 2012
note 33: business Combinationsin respect of the financial year ended 30 June 2012:
Tasmanian Dairy Products Co Limited (“TDP”) was established to faciliate the construction of a new milk processing facility in Smithton, northwest Tasmania, and the sale of manufactured dairy products.
On 5 September 2011, the company injected $35,000,000 into TDP as consideration for 403 Class A shares. The investment in TDP represented 80.1% of total share capital in TDP immediately following the issue and receipt of the 403 Class A shares.
The fair value of the indentifiable assets and liabilities at the date of investment:
$000
Cash 95
Property, plant and equipment 844
Trade and other payables (841)
Net Assets 98
At the time of investment, TDP’s revenue was $nil as the company was in the establishment phase and yet to commence revenue-generating operations. The consolidated entity recognised goodwill of $6,762,000 in relation to this investment.
in June 2012, the company subsequently sold 121 Class A shares, or 24.0% shareholding, in TDP for $10,509,000. This shareholding was sold at cost.
The consolidated entity recognises a minority interest of $14,920,000 after the sale of this shareholding.
The company continues to maintain control of TDP with a 56.1% shareholding. The consolidated entity incorporates the results of TDP from 5 September 2011, the date on which the company obtained control, and the assets and liabilities of TDP as at 30 June 2012.
in respect of the financial year ended 30 June 2011:
No business combinations.

84
MU
RR
AY G
OU
LBU
RN
AN
NU
AL R
EPO
RT
2
012
Note2012
($000)2011
($000)
a) Financial Position
Total current assets 742,318 709,904
Total non current assets 789,382 767,880
total Assets 1,531,700 1,477,784
Total current liabilities 441,291 378,295
Total non current liabilities 476,116 454,916
total Liabilities 917,407 833,211
Net Assets 614,293 644,573
issued capital 248,271 235,240
Retained earnings 238,919 258,356
Reserves
– Capital reserve 24,290 24,290
– Asset revaluation reserve 83,641 84,018
– General reserve 2,648 2,648
– Hedge reserve 17,462 33,773
– investment revaluation reserve (3,910) 2,535
– Share allotment reserve 2,972 3,713
total Equity 614,293 644,573
b) Financial Performance for the year
Profit for the year 10,122 30,513
Total comprehensive income (42,712) 86,212
c) Guarantees entered into by the parent entity in relation to the debts of its subsidiaries
Guarantee provided under the deed of cross guarantee 26,018 14,451
d) the company is not aware of any contingent liabilities.
e) Commitments for the acquisition of property plant and equipment
Plant and equipment 31,389 40,659
note 34: parent entity
note 35: additional InformationMurray Goulburn Co-operative Co. Limited is a company limited by shares, incorporated and domiciled in Australia.
its registered office and principal place of business is: Murray Goulburn Co-operative Co. Limited, 140 Dawson Street, Brunswick, Victoria, 3056
notes to the financial statements for the financial year ended 30 June 2012

85
MU
RR
AY G
OU
LBU
RN
AN
NU
AL R
EPO
RT
2
012
directors’ declaration

86
MU
RR
AY G
OU
LBU
RN
AN
NU
AL R
EPO
RT
2
012
independent auditors report to the members of murray goulburn co-operative co. limited

87
MU
RR
AY G
OU
LBU
RN
NO
TiC
E O
F AG
M
201
2

88
MU
RR
AY G
OU
LBU
RN
NO
TiC
E O
F AG
M
201
2
audit independence declaration


90
MU
RR
AY G
OU
LBU
RN
AN
NU
AL R
EPO
RT
2
012
mgC.Com.au