ncs: health and retirement plan provisions in … compensation survey: health and retirement plan...
TRANSCRIPT
National Compensation Survey: Health and Retirement Plan Provisions in Private Industry in the United States, 2015
U.S. Department of Labor
Thomas E. Perez, Secretary
U.S. Bureau of Labor Statistics
Erica L. Groshen, Commissioner
April 2016
Bulletin 2784
Contents
Overview
Health Tables
Retirement Tables
Technical note
Appendix table 1: Survey establishment response
Appendix table 2: Number of workers represented
Overview
The National Compensation Survey (NCS) provides comprehensive measures of compensation
cost trends, the incidence of benefits, and detailed benefit provisions for private industry, state
and local government, and the total of these two sectors, civilian workers. Agricultural and
household workers, federal government employees, the military, and the self-employed are
excluded. This bulletin presents estimates of the detailed provisions of employer-provided health
and retirement plans in private industry in 2015. Estimates presented are on employee benefits
by various employee and employer characteristics.
For more information on these data and recent and historical NCS benefits data, call the
information line at (202) 691–6199, use the contact EBS link to send email, or visit the benefits
home page at www.bls.gov/ebs. Information is made available to sensory-impaired individuals
upon request (Voice phone: (202) 691–5200; Federal Relay Service: 1 (800) 877–8339). Data
requests also may be sent to U.S. Bureau of Labor Statistics, Division of Compensation Data
Analysis and Planning, 2 Massachusetts Avenue NE, Room 4175, Washington, DC 20212.
Material in this publication is in the public domain and, with appropriate credit, may be
reproduced without permission.
U. S. Bureau of Labor Statistics (BLS) field economists collected and reviewed the survey data.
The Office of Compensation and Working Conditions, in cooperation with the Office of Field
Operations and the Office of Technology and Survey Processing (all in the BLS National
Office), designed the survey, processed the data, and prepared the survey for publication. The
survey could not have been conducted without the cooperation of the many private businesses
and state and local government agencies and jurisdictions that provided benefits data included in
this bulletin. BLS thanks these respondents for their cooperation.
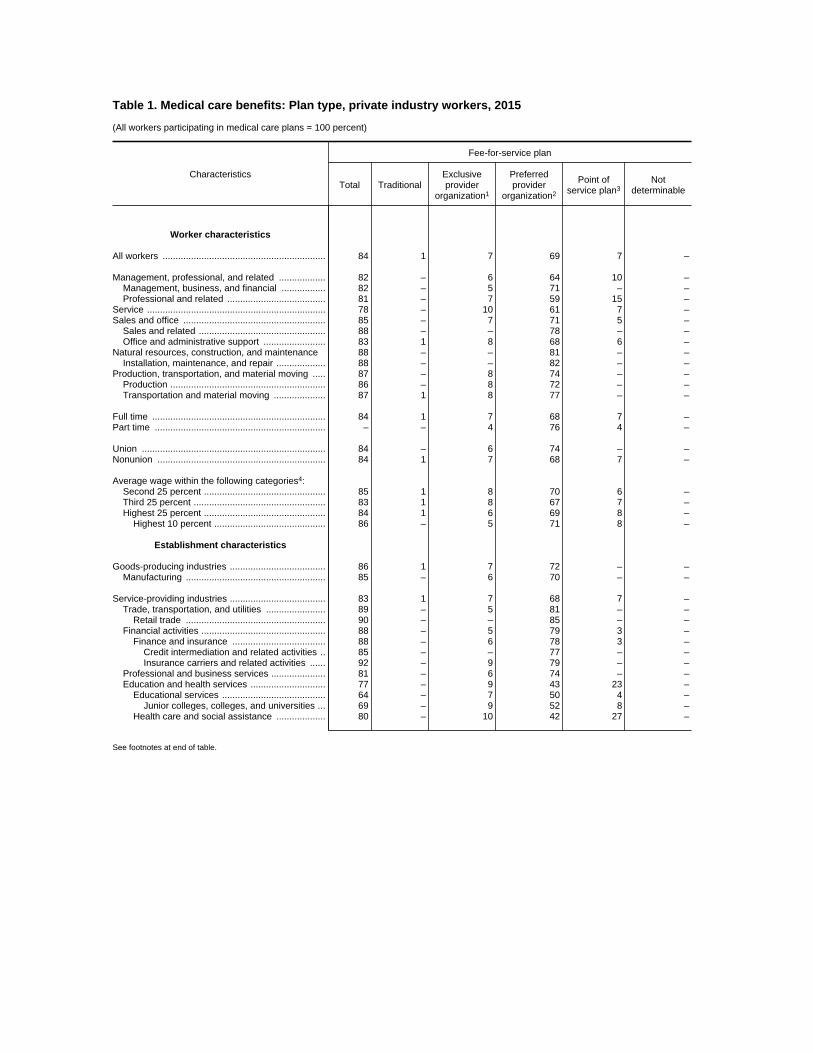
Table 1. Medical care benefits: Plan type, private industry workers, 2015
(All workers participating in medical care plans = 100 percent)
Characteristics
Fee-for-service plan
Total TraditionalExclusiveprovider
organization1
Preferredprovider
organization2
Point ofservice plan3
Notdeterminable
Worker characteristics
All workers ............................................................... 84 1 7 69 7 –
Management, professional, and related .................. 82 – 6 64 10 –Management, business, and financial ................. 82 – 5 71 – –Professional and related ...................................... 81 – 7 59 15 –
Service ..................................................................... 78 – 10 61 7 –Sales and office ....................................................... 85 – 7 71 5 –
Sales and related ................................................. 88 – – 78 – –Office and administrative support ........................ 83 1 8 68 6 –
Natural resources, construction, and maintenance 88 – – 81 – –Installation, maintenance, and repair ................... 88 – – 82 – –
Production, transportation, and material moving ..... 87 – 8 74 – –Production ............................................................ 86 – 8 72 – –Transportation and material moving .................... 87 1 8 77 – –
Full time ................................................................... 84 1 7 68 7 –Part time .................................................................. – – 4 76 4 –
Union ....................................................................... 84 – 6 74 – –Nonunion ................................................................. 84 1 7 68 7 –
Average wage within the following categories4:Second 25 percent ............................................... 85 1 8 70 6 –Third 25 percent ................................................... 83 1 8 67 7 –Highest 25 percent ............................................... 84 1 6 69 8 –
Highest 10 percent ........................................... 86 – 5 71 8 –
Establishment characteristics
Goods-producing industries ..................................... 86 1 7 72 – –Manufacturing ...................................................... 85 – 6 70 – –
Service-providing industries ..................................... 83 1 7 68 7 –Trade, transportation, and utilities ....................... 89 – 5 81 – –
Retail trade ...................................................... 90 – – 85 – –Financial activities ................................................ 88 – 5 79 3 –
Finance and insurance .................................... 88 – 6 78 3 –Credit intermediation and related activities .. 85 – – 77 – –Insurance carriers and related activities ...... 92 – 9 79 – –
Professional and business services ..................... 81 – 6 74 – –Education and health services ............................. 77 – 9 43 23 –
Educational services ........................................ 64 – 7 50 4 –Junior colleges, colleges, and universities ... 69 – 9 52 8 –
Health care and social assistance ................... 80 – 10 42 27 –
See footnotes at end of table.
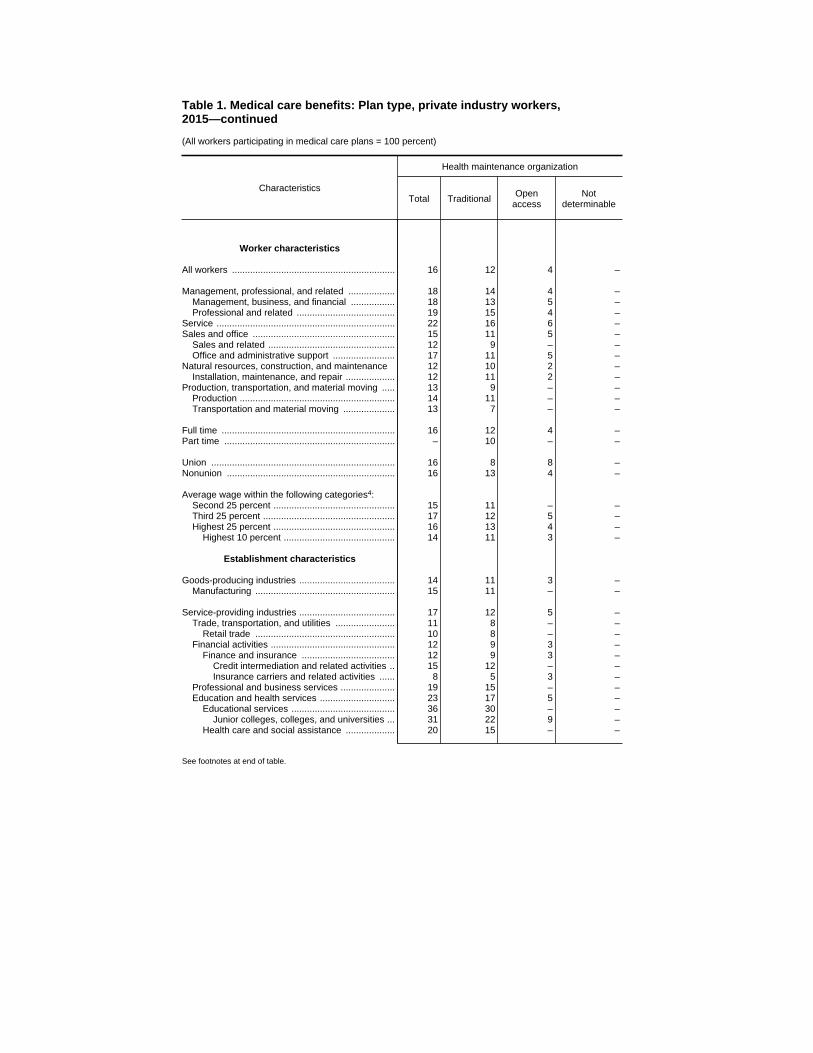
Table 1. Medical care benefits: Plan type, private industry workers,2015—continued
(All workers participating in medical care plans = 100 percent)
Characteristics
Health maintenance organization
Total Traditional Openaccess
Notdeterminable
Worker characteristics
All workers ............................................................... 16 12 4 –
Management, professional, and related .................. 18 14 4 –Management, business, and financial ................. 18 13 5 –Professional and related ...................................... 19 15 4 –
Service ..................................................................... 22 16 6 –Sales and office ....................................................... 15 11 5 –
Sales and related ................................................. 12 9 – –Office and administrative support ........................ 17 11 5 –
Natural resources, construction, and maintenance 12 10 2 –Installation, maintenance, and repair ................... 12 11 2 –
Production, transportation, and material moving ..... 13 9 – –Production ............................................................ 14 11 – –Transportation and material moving .................... 13 7 – –
Full time ................................................................... 16 12 4 –Part time .................................................................. – 10 – –
Union ....................................................................... 16 8 8 –Nonunion ................................................................. 16 13 4 –
Average wage within the following categories4:Second 25 percent ............................................... 15 11 – –Third 25 percent ................................................... 17 12 5 –Highest 25 percent ............................................... 16 13 4 –
Highest 10 percent ........................................... 14 11 3 –
Establishment characteristics
Goods-producing industries ..................................... 14 11 3 –Manufacturing ...................................................... 15 11 – –
Service-providing industries ..................................... 17 12 5 –Trade, transportation, and utilities ....................... 11 8 – –
Retail trade ...................................................... 10 8 – –Financial activities ................................................ 12 9 3 –
Finance and insurance .................................... 12 9 3 –Credit intermediation and related activities .. 15 12 – –Insurance carriers and related activities ...... 8 5 3 –
Professional and business services ..................... 19 15 – –Education and health services ............................. 23 17 5 –
Educational services ........................................ 36 30 – –Junior colleges, colleges, and universities ... 31 22 9 –
Health care and social assistance ................... 20 15 – –
See footnotes at end of table.
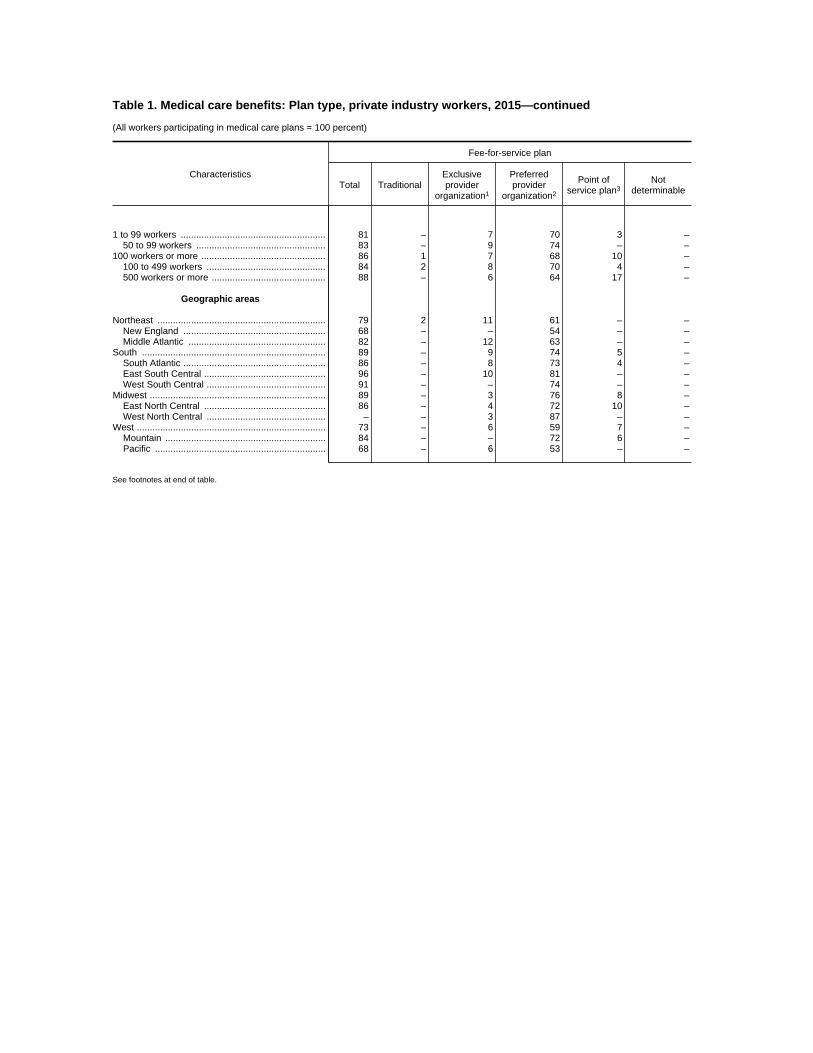
Table 1. Medical care benefits: Plan type, private industry workers, 2015—continued
(All workers participating in medical care plans = 100 percent)
Characteristics
Fee-for-service plan
Total TraditionalExclusiveprovider
organization1
Preferredprovider
organization2
Point ofservice plan3
Notdeterminable
1 to 99 workers ........................................................ 81 – 7 70 3 –50 to 99 workers .................................................. 83 – 9 74 – –
100 workers or more ................................................ 86 1 7 68 10 –100 to 499 workers .............................................. 84 2 8 70 4 –500 workers or more ............................................ 88 – 6 64 17 –
Geographic areas
Northeast ................................................................. 79 2 11 61 – –New England ....................................................... 68 – – 54 – –Middle Atlantic ..................................................... 82 – 12 63 – –
South ....................................................................... 89 – 9 74 5 –South Atlantic ....................................................... 86 – 8 73 4 –East South Central ............................................... 96 – 10 81 – –West South Central .............................................. 91 – – 74 – –
Midwest .................................................................... 89 – 3 76 8 –East North Central ............................................... 86 – 4 72 10 –West North Central .............................................. – – 3 87 – –
West ......................................................................... 73 – 6 59 7 –Mountain .............................................................. 84 – – 72 6 –Pacific .................................................................. 68 – 6 53 – –
See footnotes at end of table.
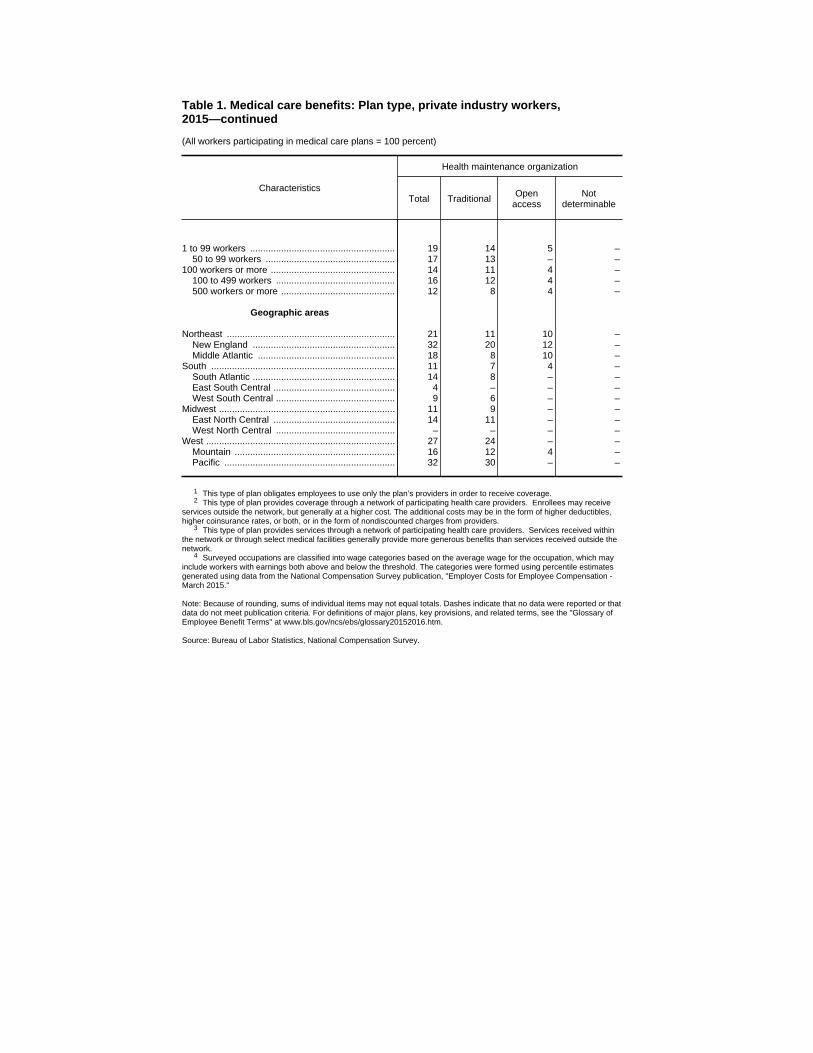
Table 1. Medical care benefits: Plan type, private industry workers,2015—continued
(All workers participating in medical care plans = 100 percent)
Characteristics
Health maintenance organization
Total Traditional Openaccess
Notdeterminable
1 to 99 workers ........................................................ 19 14 5 –50 to 99 workers .................................................. 17 13 – –
100 workers or more ................................................ 14 11 4 –100 to 499 workers .............................................. 16 12 4 –500 workers or more ............................................ 12 8 4 –
Geographic areas
Northeast ................................................................. 21 11 10 –New England ....................................................... 32 20 12 –Middle Atlantic ..................................................... 18 8 10 –
South ....................................................................... 11 7 4 –South Atlantic ....................................................... 14 8 – –East South Central ............................................... 4 – – –West South Central .............................................. 9 6 – –
Midwest .................................................................... 11 9 – –East North Central ............................................... 14 11 – –West North Central .............................................. – – – –
West ......................................................................... 27 24 – –Mountain .............................................................. 16 12 4 –Pacific .................................................................. 32 30 – –
1 This type of plan obligates employees to use only the plan’s providers in order to receive coverage.2 This type of plan provides coverage through a network of participating health care providers. Enrollees may receive
services outside the network, but generally at a higher cost. The additional costs may be in the form of higher deductibles,higher coinsurance rates, or both, or in the form of nondiscounted charges from providers.
3 This type of plan provides services through a network of participating health care providers. Services received withinthe network or through select medical facilities generally provide more generous benefits than services received outside thenetwork.
4 Surveyed occupations are classified into wage categories based on the average wage for the occupation, which mayinclude workers with earnings both above and below the threshold. The categories were formed using percentile estimatesgenerated using data from the National Compensation Survey publication, "Employer Costs for Employee Compensation -March 2015."
Note: Because of rounding, sums of individual items may not equal totals. Dashes indicate that no data were reported or thatdata do not meet publication criteria. For definitions of major plans, key provisions, and related terms, see the "Glossary ofEmployee Benefit Terms" at www.bls.gov/ncs/ebs/glossary20152016.htm.
Source: Bureau of Labor Statistics, National Compensation Survey.

Table 1. Standard errors for medical care benefits: Plan type, private industry workers, 2015
Characteristics
Fee-for-service plan
Total TraditionalExclusiveprovider
organization1
Preferredprovider
organization2
Point ofservice plan3
Notdeterminable
Worker characteristics
All workers ............................................................... 0.7 0.2 0.6 1.1 0.8 –
Management, professional, and related .................. 1.5 – 0.8 1.9 1.5 –Management, business, and financial ................. 1.9 – 0.9 2.4 – –Professional and related ...................................... 2.1 – 1.2 2.6 2.0 –
Service ..................................................................... 3.9 – 2.1 3.8 1.7 –Sales and office ....................................................... 1.7 – 0.9 2.0 1.0 –
Sales and related ................................................. 2.1 – – 2.5 – –Office and administrative support ........................ 2.2 0.4 1.0 2.4 1.1 –
Natural resources, construction, and maintenance 2.1 – – 3.3 – –Installation, maintenance, and repair ................... 2.8 – – 3.2 – –
Production, transportation, and material moving ..... 1.7 – 1.3 2.7 – –Production ............................................................ 2.0 – 1.4 3.3 – –Transportation and material moving .................... 2.8 0.2 2.2 4.1 – –
Full time ................................................................... 0.8 0.2 0.6 1.1 0.8 –Part time .................................................................. – – 1.0 5.4 1.0 –
Union ....................................................................... 1.8 – 1.5 3.2 – –Nonunion ................................................................. 0.8 0.3 0.7 1.2 0.9 –
Average wage within the following categories4:Second 25 percent ............................................... 2.3 0.3 1.5 2.3 1.2 –Third 25 percent ................................................... 1.3 0.2 0.9 1.8 1.0 –Highest 25 percent ............................................... 1.3 0.4 0.8 1.7 1.4 –
Highest 10 percent ........................................... 1.5 – 1.1 2.4 2.2 –
Establishment characteristics
Goods-producing industries ..................................... 1.7 0.4 1.7 3.0 – –Manufacturing ...................................................... 2.3 – 1.1 3.4 – –
Service-providing industries ..................................... 0.8 0.3 0.6 1.1 0.9 –Trade, transportation, and utilities ....................... 1.1 – 1.2 1.5 – –
Retail trade ...................................................... 1.9 – – 1.8 – –Financial activities ................................................ 1.7 – 0.7 1.9 0.9 –
Finance and insurance .................................... 1.5 – 0.9 1.5 0.6 –Credit intermediation and related activities .. 2.2 – – 2.4 – –Insurance carriers and related activities ...... 1.1 – 1.5 2.1 – –
Professional and business services ..................... 3.1 – 1.4 3.4 – –Education and health services ............................. 2.1 – 1.8 2.9 2.7 –
Educational services ........................................ 5.2 – 2.0 4.2 0.9 –Junior colleges, colleges, and universities ... 3.1 – 2.2 3.5 1.6 –
Health care and social assistance ................... 2.2 – 2.1 3.3 3.2 –
See footnotes at end of table.

Table 1. Standard errors for medical care benefits: Plan type, private industryworkers, 2015—continued
Characteristics
Health maintenance organization
Total Traditional Openaccess
Notdeterminable
Worker characteristics
All workers ............................................................... 0.7 0.7 0.5 –
Management, professional, and related .................. 1.5 1.5 0.7 –Management, business, and financial ................. 1.9 1.8 1.1 –Professional and related ...................................... 2.1 1.9 1.0 –
Service ..................................................................... 3.9 4.0 1.6 –Sales and office ....................................................... 1.7 1.2 0.9 –
Sales and related ................................................. 2.1 1.6 – –Office and administrative support ........................ 2.2 1.5 1.2 –
Natural resources, construction, and maintenance 2.1 2.1 0.4 –Installation, maintenance, and repair ................... 2.8 2.7 0.5 –
Production, transportation, and material moving ..... 1.7 1.2 – –Production ............................................................ 2.0 1.7 – –Transportation and material moving .................... 2.8 1.1 – –
Full time ................................................................... 0.8 0.7 0.5 –Part time .................................................................. – 3.0 – –
Union ....................................................................... 1.8 1.2 2.0 –Nonunion ................................................................. 0.8 0.7 0.5 –
Average wage within the following categories4:Second 25 percent ............................................... 2.3 1.4 – –Third 25 percent ................................................... 1.3 1.3 0.9 –Highest 25 percent ............................................... 1.3 1.3 0.6 –
Highest 10 percent ........................................... 1.5 1.4 0.6 –
Establishment characteristics
Goods-producing industries ..................................... 1.7 1.5 0.8 –Manufacturing ...................................................... 2.3 1.9 – –
Service-providing industries ..................................... 0.8 0.8 0.7 –Trade, transportation, and utilities ....................... 1.1 0.8 – –
Retail trade ...................................................... 1.9 1.6 – –Financial activities ................................................ 1.7 1.4 0.8 –
Finance and insurance .................................... 1.5 1.1 0.8 –Credit intermediation and related activities .. 2.2 1.9 – –Insurance carriers and related activities ...... 1.1 0.8 0.9 –
Professional and business services ..................... 3.1 2.8 – –Education and health services ............................. 2.1 1.9 1.6 –
Educational services ........................................ 5.2 4.9 – –Junior colleges, colleges, and universities ... 3.1 3.0 1.9 –
Health care and social assistance ................... 2.2 2.0 – –
See footnotes at end of table.
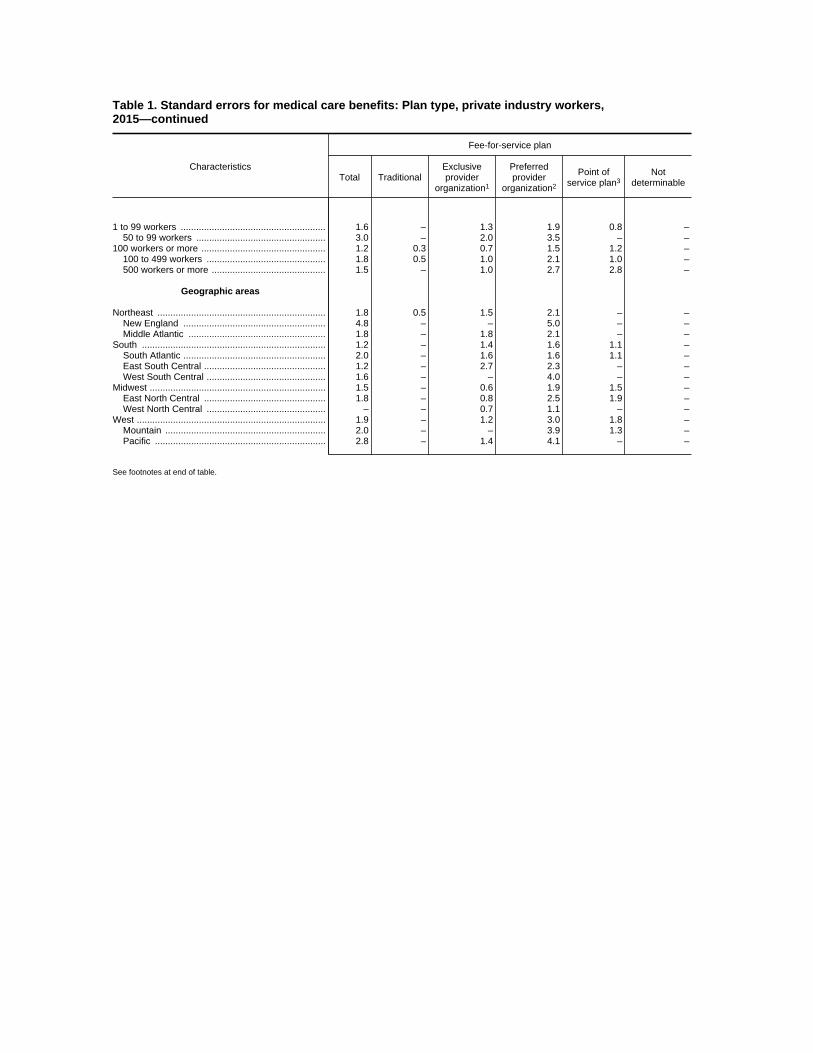
Table 1. Standard errors for medical care benefits: Plan type, private industry workers,2015—continued
Characteristics
Fee-for-service plan
Total TraditionalExclusiveprovider
organization1
Preferredprovider
organization2
Point ofservice plan3
Notdeterminable
1 to 99 workers ........................................................ 1.6 – 1.3 1.9 0.8 –50 to 99 workers .................................................. 3.0 – 2.0 3.5 – –
100 workers or more ................................................ 1.2 0.3 0.7 1.5 1.2 –100 to 499 workers .............................................. 1.8 0.5 1.0 2.1 1.0 –500 workers or more ............................................ 1.5 – 1.0 2.7 2.8 –
Geographic areas
Northeast ................................................................. 1.8 0.5 1.5 2.1 – –New England ....................................................... 4.8 – – 5.0 – –Middle Atlantic ..................................................... 1.8 – 1.8 2.1 – –
South ....................................................................... 1.2 – 1.4 1.6 1.1 –South Atlantic ....................................................... 2.0 – 1.6 1.6 1.1 –East South Central ............................................... 1.2 – 2.7 2.3 – –West South Central .............................................. 1.6 – – 4.0 – –
Midwest .................................................................... 1.5 – 0.6 1.9 1.5 –East North Central ............................................... 1.8 – 0.8 2.5 1.9 –West North Central .............................................. – – 0.7 1.1 – –
West ......................................................................... 1.9 – 1.2 3.0 1.8 –Mountain .............................................................. 2.0 – – 3.9 1.3 –Pacific .................................................................. 2.8 – 1.4 4.1 – –
See footnotes at end of table.
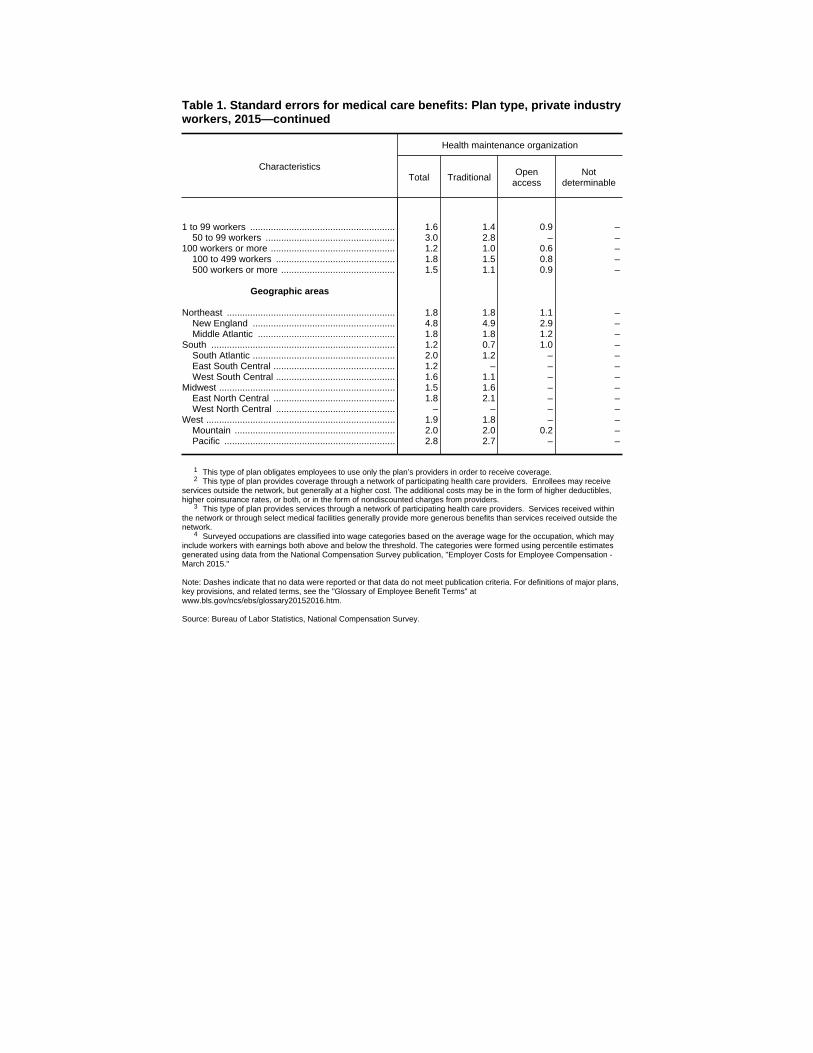
Table 1. Standard errors for medical care benefits: Plan type, private industryworkers, 2015—continued
Characteristics
Health maintenance organization
Total Traditional Openaccess
Notdeterminable
1 to 99 workers ........................................................ 1.6 1.4 0.9 –50 to 99 workers .................................................. 3.0 2.8 – –
100 workers or more ................................................ 1.2 1.0 0.6 –100 to 499 workers .............................................. 1.8 1.5 0.8 –500 workers or more ............................................ 1.5 1.1 0.9 –
Geographic areas
Northeast ................................................................. 1.8 1.8 1.1 –New England ....................................................... 4.8 4.9 2.9 –Middle Atlantic ..................................................... 1.8 1.8 1.2 –
South ....................................................................... 1.2 0.7 1.0 –South Atlantic ....................................................... 2.0 1.2 – –East South Central ............................................... 1.2 – – –West South Central .............................................. 1.6 1.1 – –
Midwest .................................................................... 1.5 1.6 – –East North Central ............................................... 1.8 2.1 – –West North Central .............................................. – – – –
West ......................................................................... 1.9 1.8 – –Mountain .............................................................. 2.0 2.0 0.2 –Pacific .................................................................. 2.8 2.7 – –
1 This type of plan obligates employees to use only the plan’s providers in order to receive coverage.2 This type of plan provides coverage through a network of participating health care providers. Enrollees may receive
services outside the network, but generally at a higher cost. The additional costs may be in the form of higher deductibles,higher coinsurance rates, or both, or in the form of nondiscounted charges from providers.
3 This type of plan provides services through a network of participating health care providers. Services received withinthe network or through select medical facilities generally provide more generous benefits than services received outside thenetwork.
4 Surveyed occupations are classified into wage categories based on the average wage for the occupation, which mayinclude workers with earnings both above and below the threshold. The categories were formed using percentile estimatesgenerated using data from the National Compensation Survey publication, "Employer Costs for Employee Compensation -March 2015."
Note: Dashes indicate that no data were reported or that data do not meet publication criteria. For definitions of major plans,key provisions, and related terms, see the "Glossary of Employee Benefit Terms" atwww.bls.gov/ncs/ebs/glossary20152016.htm.
Source: Bureau of Labor Statistics, National Compensation Survey.
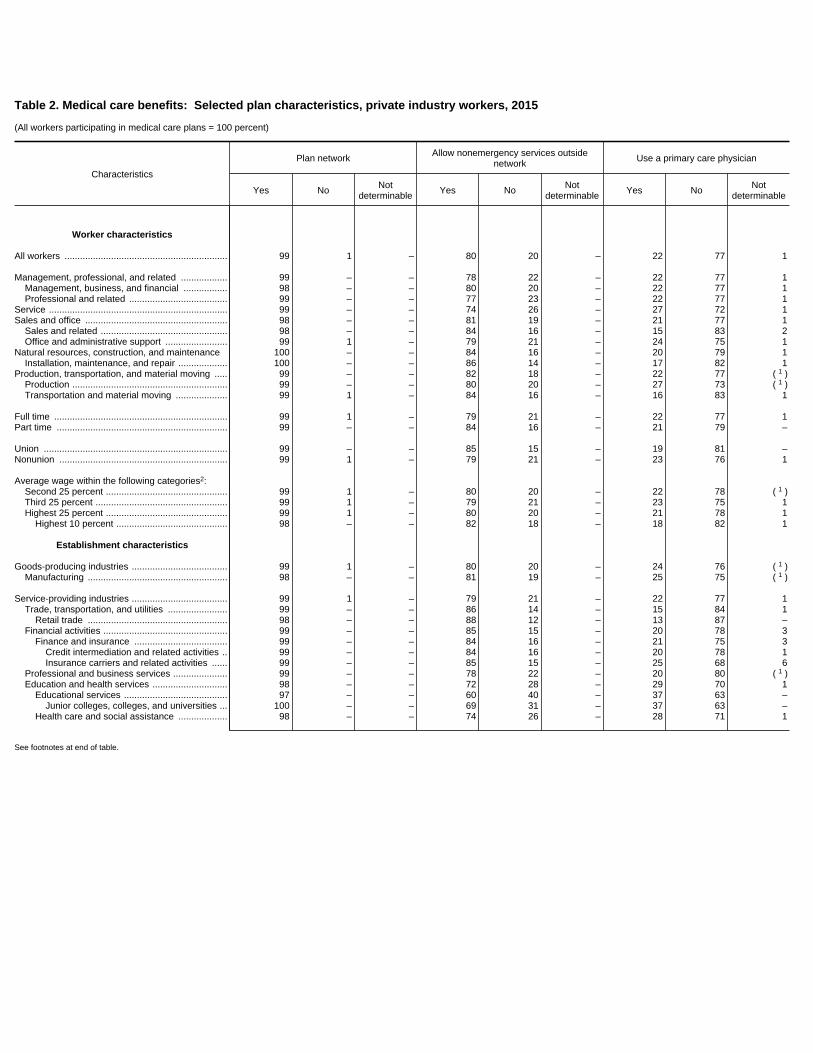
Table 2. Medical care benefits: Selected plan characteristics, private industry workers, 2015
(All workers participating in medical care plans = 100 percent)
Characteristics
Plan network Allow nonemergency services outsidenetwork Use a primary care physician
Yes No Notdeterminable Yes No Not
determinable Yes No Notdeterminable
Worker characteristics
All workers ............................................................... 99 1 – 80 20 – 22 77 1
Management, professional, and related .................. 99 – – 78 22 – 22 77 1Management, business, and financial ................. 98 – – 80 20 – 22 77 1Professional and related ...................................... 99 – – 77 23 – 22 77 1
Service ..................................................................... 99 – – 74 26 – 27 72 1Sales and office ....................................................... 98 – – 81 19 – 21 77 1
Sales and related ................................................. 98 – – 84 16 – 15 83 2Office and administrative support ........................ 99 1 – 79 21 – 24 75 1
Natural resources, construction, and maintenance 100 – – 84 16 – 20 79 1Installation, maintenance, and repair ................... 100 – – 86 14 – 17 82 1
Production, transportation, and material moving ..... 99 – – 82 18 – 22 77 1( )Production ............................................................ 99 – – 80 20 – 27 73 1( )Transportation and material moving .................... 99 1 – 84 16 – 16 83 1
Full time ................................................................... 99 1 – 79 21 – 22 77 1Part time .................................................................. 99 – – 84 16 – 21 79 –
Union ....................................................................... 99 – – 85 15 – 19 81 –Nonunion ................................................................. 99 1 – 79 21 – 23 76 1
Average wage within the following categories2:Second 25 percent ............................................... 99 1 – 80 20 – 22 78 1( )Third 25 percent ................................................... 99 1 – 79 21 – 23 75 1Highest 25 percent ............................................... 99 1 – 80 20 – 21 78 1
Highest 10 percent ........................................... 98 – – 82 18 – 18 82 1
Establishment characteristics
Goods-producing industries ..................................... 99 1 – 80 20 – 24 76 1( )Manufacturing ...................................................... 98 – – 81 19 – 25 75 1( )
Service-providing industries ..................................... 99 1 – 79 21 – 22 77 1Trade, transportation, and utilities ....................... 99 – – 86 14 – 15 84 1
Retail trade ...................................................... 98 – – 88 12 – 13 87 –Financial activities ................................................ 99 – – 85 15 – 20 78 3
Finance and insurance .................................... 99 – – 84 16 – 21 75 3Credit intermediation and related activities .. 99 – – 84 16 – 20 78 1Insurance carriers and related activities ...... 99 – – 85 15 – 25 68 6
Professional and business services ..................... 99 – – 78 22 – 20 80 1( )Education and health services ............................. 98 – – 72 28 – 29 70 1
Educational services ........................................ 97 – – 60 40 – 37 63 –Junior colleges, colleges, and universities ... 100 – – 69 31 – 37 63 –
Health care and social assistance ................... 98 – – 74 26 – 28 71 1
See footnotes at end of table.
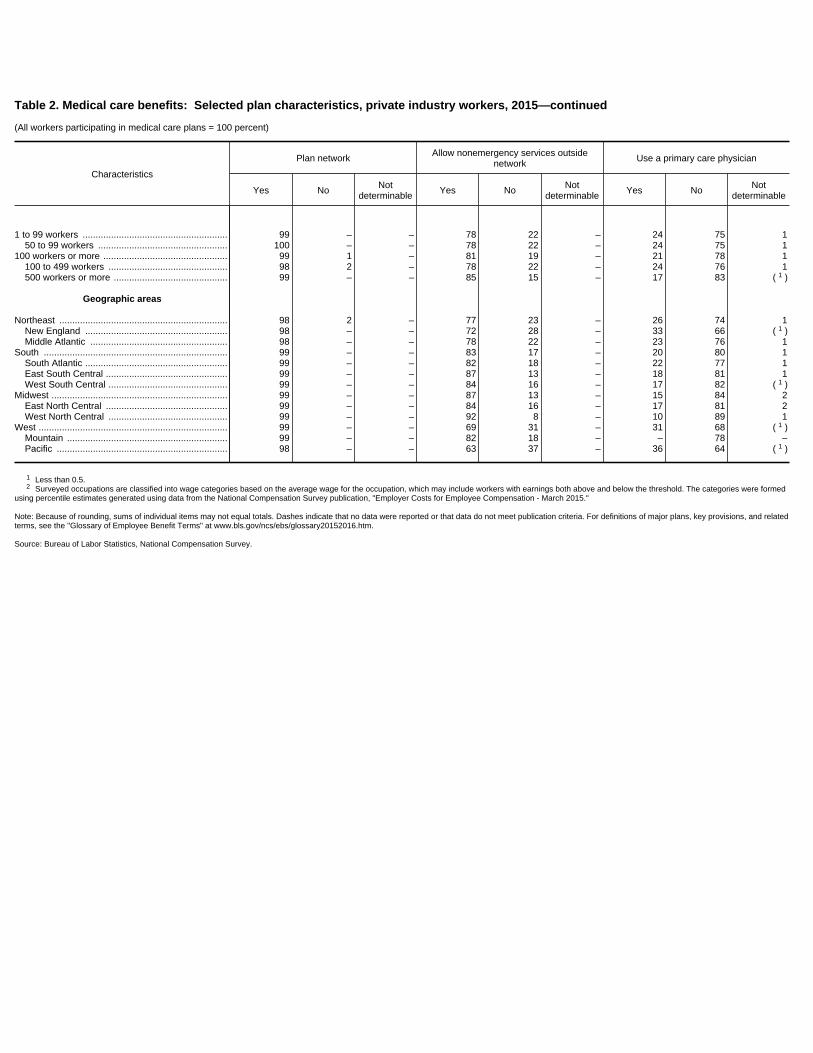
Table 2. Medical care benefits: Selected plan characteristics, private industry workers, 2015—continued
(All workers participating in medical care plans = 100 percent)
Characteristics
Plan network Allow nonemergency services outsidenetwork Use a primary care physician
Yes No Notdeterminable Yes No Not
determinable Yes No Notdeterminable
1 to 99 workers ........................................................ 99 – – 78 22 – 24 75 150 to 99 workers .................................................. 100 – – 78 22 – 24 75 1
100 workers or more ................................................ 99 1 – 81 19 – 21 78 1100 to 499 workers .............................................. 98 2 – 78 22 – 24 76 1500 workers or more ............................................ 99 – – 85 15 – 17 83 1( )
Geographic areas
Northeast ................................................................. 98 2 – 77 23 – 26 74 1New England ....................................................... 98 – – 72 28 – 33 66 1( )Middle Atlantic ..................................................... 98 – – 78 22 – 23 76 1
South ....................................................................... 99 – – 83 17 – 20 80 1South Atlantic ....................................................... 99 – – 82 18 – 22 77 1East South Central ............................................... 99 – – 87 13 – 18 81 1West South Central .............................................. 99 – – 84 16 – 17 82 1( )
Midwest .................................................................... 99 – – 87 13 – 15 84 2East North Central ............................................... 99 – – 84 16 – 17 81 2West North Central .............................................. 99 – – 92 8 – 10 89 1
West ......................................................................... 99 – – 69 31 – 31 68 1( )Mountain .............................................................. 99 – – 82 18 – – 78 –Pacific .................................................................. 98 – – 63 37 – 36 64 1( )
1 Less than 0.5.2 Surveyed occupations are classified into wage categories based on the average wage for the occupation, which may include workers with earnings both above and below the threshold. The categories were formed
using percentile estimates generated using data from the National Compensation Survey publication, "Employer Costs for Employee Compensation - March 2015."
Note: Because of rounding, sums of individual items may not equal totals. Dashes indicate that no data were reported or that data do not meet publication criteria. For definitions of major plans, key provisions, and relatedterms, see the "Glossary of Employee Benefit Terms" at www.bls.gov/ncs/ebs/glossary20152016.htm.
Source: Bureau of Labor Statistics, National Compensation Survey.

Table 2. Standard errors for medical care benefits: Selected plan characteristics, private industry workers, 2015
Characteristics
Plan network Allow nonemergency services outsidenetwork Use a primary care physician
Yes No Notdeterminable Yes No Not
determinable Yes No Notdeterminable
Worker characteristics
All workers ............................................................... 0.2 0.2 – 0.9 0.9 – 1.2 1.2 0.2
Management, professional, and related .................. 0.4 – – 1.6 1.6 – 1.9 1.9 0.2Management, business, and financial ................. 0.7 – – 2.1 2.1 – 2.4 2.5 0.3Professional and related ...................................... 0.4 – – 2.3 2.3 – 2.5 2.5 0.3
Service ..................................................................... 0.5 – – 4.0 4.0 – 4.3 4.4 0.4Sales and office ....................................................... 0.5 – – 1.5 1.5 – 1.9 2.0 0.3
Sales and related ................................................. 1.3 – – 2.4 2.4 – 2.1 2.3 0.7Office and administrative support ........................ 0.4 0.4 – 1.7 1.7 – 2.5 2.6 0.3
Natural resources, construction, and maintenance 0.2 – – 3.3 3.3 – 2.6 2.7 0.5Installation, maintenance, and repair ................... 0.2 – – 3.0 3.0 – 3.1 3.2 1.0
Production, transportation, and material moving ..... 0.3 – – 1.8 1.8 – 2.2 2.2 0.2Production ............................................................ 0.5 – – 2.2 2.2 – 2.5 2.5 0.2Transportation and material moving .................... 0.2 0.2 – 2.5 2.5 – 3.5 3.5 0.5
Full time ................................................................... 0.2 0.2 – 1.0 1.0 – 1.2 1.2 0.2Part time .................................................................. 0.6 – – 3.2 3.2 – 4.8 4.8 –
Union ....................................................................... 0.3 – – 2.1 2.1 – 2.5 2.5 –Nonunion ................................................................. 0.3 0.3 – 1.0 1.0 – 1.3 1.3 0.2
Average wage within the following categories1:Second 25 percent ............................................... 0.3 0.3 – 1.9 1.9 – 2.5 2.5 0.2Third 25 percent ................................................... 0.2 0.2 – 1.6 1.6 – 1.9 1.9 0.4Highest 25 percent ............................................... 0.4 0.4 – 1.5 1.5 – 1.6 1.7 0.2
Highest 10 percent ........................................... 0.7 – – 1.8 1.8 – 1.9 2.0 0.2
Establishment characteristics
Goods-producing industries ..................................... 0.4 0.4 – 2.3 2.3 – 1.8 1.8 0.1Manufacturing ...................................................... 0.6 – – 2.4 2.4 – 2.6 2.6 0.1
Service-providing industries ..................................... 0.3 0.3 – 1.0 1.0 – 1.4 1.4 0.2Trade, transportation, and utilities ....................... 0.5 – – 1.2 1.2 – 1.4 1.3 0.5
Retail trade ...................................................... 0.7 – – 1.4 1.4 – 1.5 1.5 –Financial activities ................................................ 0.4 – – 1.3 1.3 – 1.7 1.6 0.7
Finance and insurance .................................... 0.5 – – 1.1 1.1 – 1.8 2.0 1.0Credit intermediation and related activities .. 0.9 – – 1.8 1.8 – 2.9 3.0 0.6Insurance carriers and related activities ...... 0.6 – – 1.9 1.9 – 3.4 3.9 2.2
Professional and business services ..................... 0.4 – – 3.2 3.2 – 3.8 3.8 0.3Education and health services ............................. 0.9 – – 3.1 3.1 – 3.3 3.6 0.4
Educational services ........................................ 2.6 – – 4.0 4.0 – 5.0 5.0 –Junior colleges, colleges, and universities ... 0.2 – – 3.1 3.1 – 2.9 2.9 –
Health care and social assistance ................... 0.9 – – 3.4 3.4 – 3.8 4.1 0.4
See footnotes at end of table.

Table 2. Standard errors for medical care benefits: Selected plan characteristics, private industry workers, 2015—continued
Characteristics
Plan network Allow nonemergency services outsidenetwork Use a primary care physician
Yes No Notdeterminable Yes No Not
determinable Yes No Notdeterminable
1 to 99 workers ........................................................ 0.3 – – 1.7 1.7 – 2.2 2.2 0.350 to 99 workers .................................................. 0.2 – – 3.3 3.3 – 3.9 4.0 0.4
100 workers or more ................................................ 0.3 0.3 – 1.2 1.2 – 1.5 1.5 0.2100 to 499 workers .............................................. 0.5 0.5 – 1.7 1.7 – 2.2 2.2 0.2500 workers or more ............................................ 0.4 – – 1.5 1.5 – 1.3 1.4 0.2
Geographic areas
Northeast ................................................................. 0.5 0.5 – 2.4 2.4 – 1.9 1.9 0.3New England ....................................................... 0.9 – – 3.9 3.9 – 4.2 4.2 0.3Middle Atlantic ..................................................... 0.5 – – 2.9 2.9 – 2.2 2.2 0.4
South ....................................................................... 0.4 – – 1.7 1.7 – 1.4 1.6 0.3South Atlantic ....................................................... 0.5 – – 2.2 2.2 – 2.0 2.4 0.5East South Central ............................................... 0.5 – – 3.4 3.4 – 3.2 3.1 0.3West South Central .............................................. 1.0 – – 3.5 3.5 – 2.6 2.6 0.2
Midwest .................................................................... 0.5 – – 1.7 1.7 – 3.0 3.0 0.5East North Central ............................................... 0.6 – – 2.2 2.2 – 4.1 4.2 0.7West North Central .............................................. 1.1 – – 2.1 2.1 – 2.1 2.2 0.5
West ......................................................................... 0.4 – – 1.7 1.7 – 2.9 2.9 0.1Mountain .............................................................. 0.5 – – 3.1 3.1 – – 7.4 –Pacific .................................................................. 0.6 – – 2.2 2.2 – 2.9 2.9 0.1
1 Surveyed occupations are classified into wage categories based on the average wage for the occupation, which may include workers with earnings both above and below the threshold. Thecategories were formed using percentile estimates generated using data from the National Compensation Survey publication, "Employer Costs for Employee Compensation - March 2015."
Note: Dashes indicate that no data were reported or that data do not meet publication criteria. For definitions of major plans, key provisions, and related terms, see the "Glossary of Employee BenefitTerms" at www.bls.gov/ncs/ebs/glossary20152016.htm.
Source: Bureau of Labor Statistics, National Compensation Survey.

Table 3. Medical care benefits: Eligibility requirements, private industry workers, 2015
(All workers participating in medical care plans = 100 percent)
Characteristics With servicerequirement
Service requirement
With no servicerequirement
Notdeterminable1 month 2 months 3 months
Greaterthan 3months
Notdeterminable
Medianservice
requirement(in months)
Worker characteristics
All workers ............................................................... 53 20 11 17 5 – 2 29 19
Management, professional, and related .................. 46 25 9 11 1 – 1 36 18Management, business, and financial ................. 54 28 9 15 – – – 33 13
Sales and office ....................................................... 55 20 10 19 6 – 2 28 16Office and administrative support ........................ 54 24 10 15 4 – 2 32 14
Natural resources, construction, and maintenance 63 17 14 21 11 – – 21 17Installation, maintenance, and repair ................... 59 15 14 27 4 – – 27 13
Full time ................................................................... 52 20 11 17 4 – 2 30 19Part time .................................................................. 69 14 11 16 27 – 3 13 18
Nonunion ................................................................. 53 22 11 17 4 – 2 28 19
Average wage within the following categories1:Second 25 percent ............................................... 58 20 11 21 6 – 2 24 18Highest 25 percent ............................................... 45 23 9 11 3 – – 36 19
Establishment characteristics
Goods-producing industries ..................................... 55 23 11 15 6 – 2 25 19Manufacturing ...................................................... 53 25 – 15 – – – 28 19
Service-providing industries ..................................... 52 19 11 17 5 – 2 30 19Trade, transportation, and utilities:
Retail trade ..................................................... 71 5 8 41 17 – 3 10 19Financial activities ................................................ 52 33 12 6 – – 1 35 13
Finance and insurance .................................... 49 40 4 5 – – 1 36 15Credit intermediation and related activities .. 57 48 – – – – 1 29 14Insurance carriers and related activities ...... 44 34 – – – – 1 38 18
Education and health services ............................. 52 26 14 10 – – – 33 16Educational services ........................................ 29 21 – 4 – – 1 58 13
Junior colleges, colleges, and universities ... 30 21 – 5 – – 1 56 14Health care and social assistance ................... 56 27 16 11 – – – 28 16
100 workers or more ................................................ 52 17 12 17 6 – 2 32 15100 to 499 workers .............................................. 58 16 13 21 8 – – 29 13500 workers or more ............................................ 45 18 10 12 5 – 2 36 19
Geographic areas
South ....................................................................... 56 19 13 18 6 – 2 30 14South Atlantic ....................................................... 51 16 13 17 5 – 2 34 14East South Central ............................................... 61 17 12 23 9 – 3 25 14West South Central .............................................. 61 24 13 17 6 – 2 27 13
Midwest:West North Central .............................................. 57 20 15 18 5 – 2 28 15
West:Mountain .............................................................. 67 37 8 20 – – 1 16 18
1 Surveyed occupations are classified into wage categories based on the average wage for the occupation, which may include workers with earnings both above and below the threshold. The categorieswere formed using percentile estimates generated using data from the National Compensation Survey publication, "Employer Costs for Employee Compensation - March 2015."
Note: Because of rounding, sums of individual items may not equal totals. Dashes indicate that no data were reported or that data do not meet publication criteria. For definitions of major plans, key provisions,and related terms, see the "Glossary of Employee Benefit Terms" at www.bls.gov/ncs/ebs/glossary20152016.htm.
Source: Bureau of Labor Statistics, National Compensation Survey.

Table 3. Standard errors for medical care benefits: Eligibility requirements, private industry workers, 2015
Characteristics With servicerequirement
Service requirement
With noservice
requirement
Notdeterminable1 month 2 months 3 months
Greaterthan 3months
Notdeterminable
Medianservice
requirement(in months)
Worker characteristics
All workers ............................................................... 1.5 1.0 0.9 1.0 0.4 – 0.0 1.3 1.1
Management, professional, and related .................. 2.5 2.0 1.1 1.7 0.4 – 0.3 2.3 1.6Management, business, and financial ................. 3.7 2.7 2.2 3.2 – – – 3.3 1.3
Sales and office ....................................................... 2.1 1.9 1.5 1.6 0.5 – 0.2 2.3 1.5Office and administrative support ........................ 2.2 2.4 1.8 1.3 0.7 – 0.0 2.2 1.6
Natural resources, construction, and maintenance 3.0 3.1 2.1 2.7 2.1 – – 2.3 2.2Installation, maintenance, and repair ................... 4.4 2.4 3.4 3.7 1.2 – – 3.8 2.5
Full time ................................................................... 1.5 1.1 0.9 1.1 0.5 – 0.0 1.3 1.2Part time .................................................................. 3.8 3.8 3.2 3.3 3.3 – 0.0 2.9 3.5
Nonunion ................................................................. 1.5 1.2 0.9 1.1 0.3 – 0.0 1.4 1.3
Average wage within the following categories1:Second 25 percent ............................................... 1.9 2.1 1.6 1.9 0.8 – 0.4 2.3 1.8Highest 25 percent ............................................... 2.6 2.0 1.2 1.4 0.6 – – 2.2 1.8
Establishment characteristics
Goods-producing industries ..................................... 2.6 2.6 2.2 2.1 1.3 – 0.0 2.0 2.1Manufacturing ...................................................... 3.4 3.3 – 2.7 – – – 3.0 2.5
Service-providing industries ..................................... 1.7 1.1 1.0 1.1 0.4 – 0.0 1.5 1.3Trade, transportation, and utilities:
Retail trade ..................................................... 2.6 0.9 1.6 2.6 2.1 – 0.0 2.5 1.8Financial activities ................................................ 2.0 2.6 2.7 1.5 – – 0.0 2.1 1.6
Finance and insurance .................................... 2.1 2.4 1.0 1.5 – – 0.0 1.9 1.7Credit intermediation and related activities .. 3.6 4.3 – – – – 0.0 3.2 2.7Insurance carriers and related activities ...... 4.2 4.2 – – – – 0.0 5.0 2.4
Education and health services ............................. 3.4 2.8 2.1 2.6 – – – 3.4 2.3Educational services ........................................ 6.4 6.2 – 1.1 – – 0.0 7.1 3.9
Junior colleges, colleges, and universities ... 4.5 4.1 – 1.4 – – 0.0 5.3 3.8Health care and social assistance ................... 3.8 3.1 2.4 3.0 – – – 3.9 2.7
100 workers or more ................................................ 1.8 1.2 1.5 1.4 0.6 – 0.0 1.9 1.2100 to 499 workers .............................................. 2.1 1.5 1.9 2.0 0.9 – – 2.3 1.1500 workers or more ............................................ 2.9 1.8 1.9 1.8 1.0 – 0.0 2.8 2.3
Geographic areas
South ....................................................................... 2.3 1.4 1.5 2.2 0.7 – 0.0 2.1 1.6South Atlantic ....................................................... 2.7 1.6 2.0 3.6 0.8 – 0.0 3.1 1.2East South Central ............................................... 4.5 3.0 3.1 2.7 2.5 – 0.6 5.1 1.5West South Central .............................................. 4.9 3.1 3.1 3.5 1.1 – 0.0 3.2 4.2
Midwest:West North Central .............................................. 5.9 2.9 3.7 0.9 0.9 – 0.0 4.1 4.0
West:Mountain .............................................................. 2.6 3.3 0.7 3.9 – – 0.0 4.3 3.8
1 Surveyed occupations are classified into wage categories based on the average wage for the occupation, which may include workers with earnings both above and below the threshold. The categorieswere formed using percentile estimates generated using data from the National Compensation Survey publication, "Employer Costs for Employee Compensation - March 2015."
Note: Dashes indicate that no data were reported or that data do not meet publication criteria. For definitions of major plans, key provisions, and related terms, see the "Glossary of Employee Benefit Terms" atwww.bls.gov/ncs/ebs/glossary20152016.htm.
Source: Bureau of Labor Statistics, National Compensation Survey.

Table 4. Medical care benefits: High deductible and nonhighdeductible health plans,1 private industry workers, 2015
(All workers participating in medical care plans = 100 percent)
Characteristics High deductiblehealth plans
Nonhighdeductible health
plans
Worker characteristics
All workers ............................................................... 38 61
Management, professional, and related .................. 35 63Management, business, and financial ................. 36 62Professional and related ...................................... 35 63
Service ..................................................................... 34 65Sales and office ....................................................... 45 54
Sales and related ................................................. 50 49Office and administrative support ........................ 43 57
Natural resources, construction, and maintenance 31 69Installation, maintenance, and repair ................... 39 61
Production, transportation, and material moving ..... 38 61Production ............................................................ 43 56Transportation and material moving .................... 31 68
Full time ................................................................... 38 61Part time .................................................................. 37 63
Union ....................................................................... 17 82Nonunion ................................................................. 41 58
Average wage within the following categories2:Second 25 percent ............................................... 42 57Third 25 percent ................................................... 37 62Highest 25 percent ............................................... 33 65
Highest 10 percent ........................................... 32 65
Establishment characteristics
Goods-producing industries ..................................... 37 62Manufacturing ...................................................... 41 58
Service-providing industries ..................................... 38 61Trade, transportation, and utilities ....................... 43 57
Retail trade ...................................................... 53 47Financial activities ................................................ 45 54
Finance and insurance .................................... 47 53Credit intermediation and related activities .. 50 49Insurance carriers and related activities ...... 44 56
Professional and business services ..................... 45 54Education and health services ............................. 29 68
Educational services ........................................ 21 79Junior colleges, colleges, and universities ... 18 82
Health care and social assistance ................... 31 66
See footnotes at end of table.

Table 4. Medical care benefits: High deductible and nonhighdeductible health plans,1 private industry workers,2015—continued
(All workers participating in medical care plans = 100 percent)
Characteristics High deductiblehealth plans
Nonhighdeductible health
plans
1 to 99 workers ........................................................ 39 6050 to 99 workers .................................................. 37 62
100 workers or more ................................................ 36 62100 to 499 workers .............................................. 42 58500 workers or more ............................................ 28 69
Geographic areas
Northeast ................................................................. 33 65New England ....................................................... 28 71Middle Atlantic ..................................................... 34 64
South ....................................................................... 41 57South Atlantic ....................................................... 40 59East South Central ............................................... 41 58West South Central .............................................. 43 55
Midwest .................................................................... 45 54East North Central ............................................... 47 52West North Central .............................................. 40 59
West ......................................................................... 29 71Mountain .............................................................. 33 67Pacific .................................................................. 27 73
1 The sum of the columns may not equal 100 since only plans with fixed, variable, or no deductiblesare included. Plans with other deductible formulas are not included. A high deductible health plan (HDHP)is a health plan which typically has a higher deductible and lower premium than a traditional health plan. Anindividual plan must have a minimum deductible of $1,300 to be classified as a HDHP. Normally the planincludes catastrophic coverage to protect against large medical expenses, but the insured is responsiblefor routine out-of-pocket expenses.
2 Surveyed occupations are classified into wage categories based on the average wage for theoccupation, which may include workers with earnings both above and below the threshold. The categorieswere formed using percentile estimates generated using data from the National Compensation Surveypublication, "Employer Costs for Employee Compensation - March 2015."
Note: Dashes indicate that no data were reported or that data do not meet publication criteria. Fordefinitions of major plans, key provisions, and related terms, see the "Glossary of Employee Benefit Terms"at www.bls.gov/ncs/ebs/glossary20152016.htm.
Source: Bureau of Labor Statistics, National Compensation Survey.
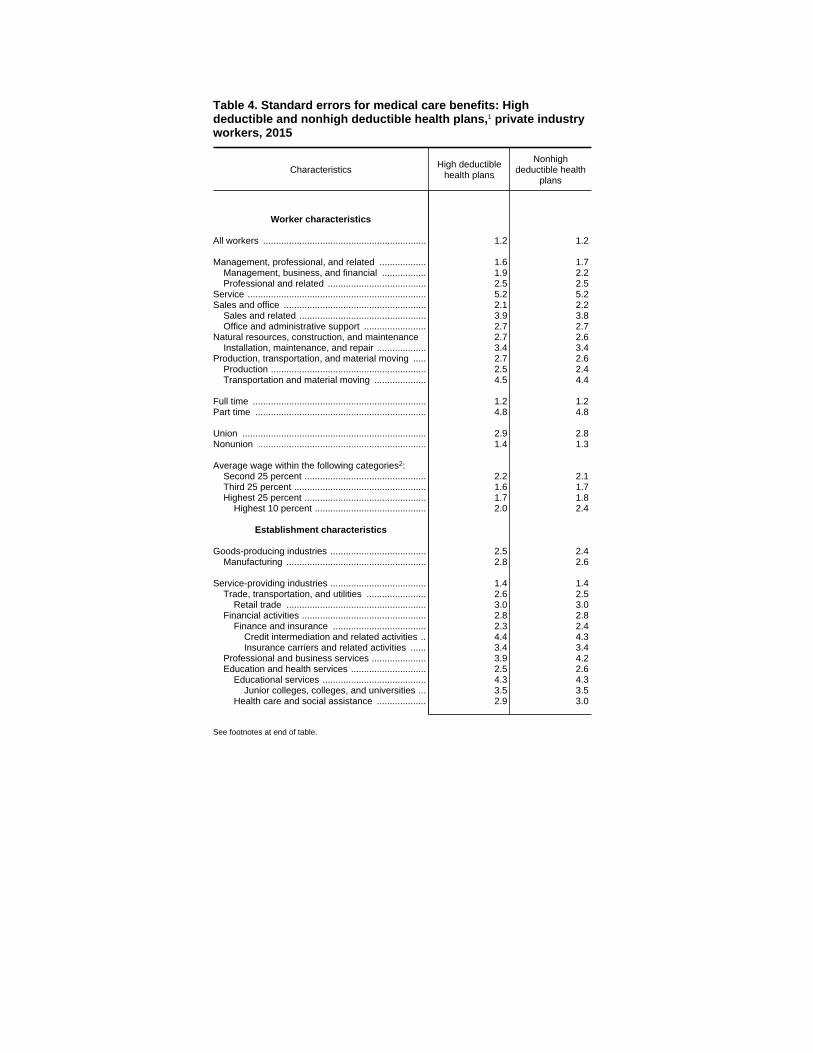
Table 4. Standard errors for medical care benefits: Highdeductible and nonhigh deductible health plans,1 private industryworkers, 2015
Characteristics High deductiblehealth plans
Nonhighdeductible health
plans
Worker characteristics
All workers ............................................................... 1.2 1.2
Management, professional, and related .................. 1.6 1.7Management, business, and financial ................. 1.9 2.2Professional and related ...................................... 2.5 2.5
Service ..................................................................... 5.2 5.2Sales and office ....................................................... 2.1 2.2
Sales and related ................................................. 3.9 3.8Office and administrative support ........................ 2.7 2.7
Natural resources, construction, and maintenance 2.7 2.6Installation, maintenance, and repair ................... 3.4 3.4
Production, transportation, and material moving ..... 2.7 2.6Production ............................................................ 2.5 2.4Transportation and material moving .................... 4.5 4.4
Full time ................................................................... 1.2 1.2Part time .................................................................. 4.8 4.8
Union ....................................................................... 2.9 2.8Nonunion ................................................................. 1.4 1.3
Average wage within the following categories2:Second 25 percent ............................................... 2.2 2.1Third 25 percent ................................................... 1.6 1.7Highest 25 percent ............................................... 1.7 1.8
Highest 10 percent ........................................... 2.0 2.4
Establishment characteristics
Goods-producing industries ..................................... 2.5 2.4Manufacturing ...................................................... 2.8 2.6
Service-providing industries ..................................... 1.4 1.4Trade, transportation, and utilities ....................... 2.6 2.5
Retail trade ...................................................... 3.0 3.0Financial activities ................................................ 2.8 2.8
Finance and insurance .................................... 2.3 2.4Credit intermediation and related activities .. 4.4 4.3Insurance carriers and related activities ...... 3.4 3.4
Professional and business services ..................... 3.9 4.2Education and health services ............................. 2.5 2.6
Educational services ........................................ 4.3 4.3Junior colleges, colleges, and universities ... 3.5 3.5
Health care and social assistance ................... 2.9 3.0
See footnotes at end of table.
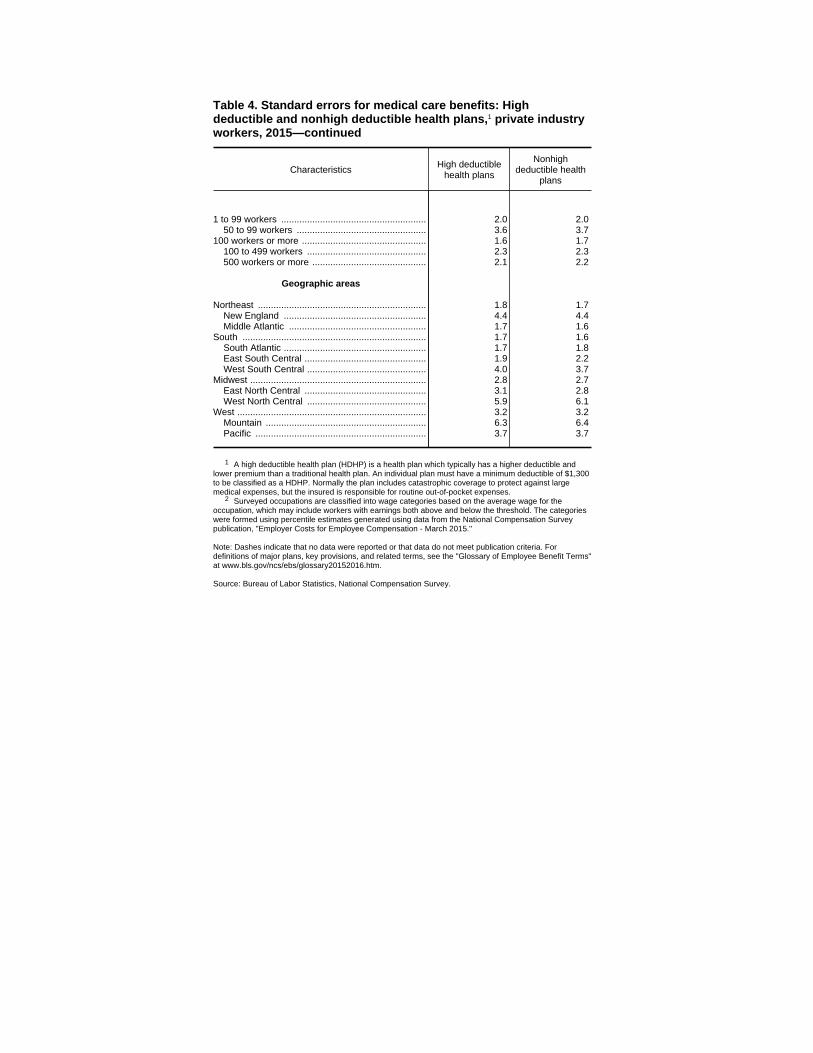
Table 4. Standard errors for medical care benefits: Highdeductible and nonhigh deductible health plans,1 private industryworkers, 2015—continued
Characteristics High deductiblehealth plans
Nonhighdeductible health
plans
1 to 99 workers ........................................................ 2.0 2.050 to 99 workers .................................................. 3.6 3.7
100 workers or more ................................................ 1.6 1.7100 to 499 workers .............................................. 2.3 2.3500 workers or more ............................................ 2.1 2.2
Geographic areas
Northeast ................................................................. 1.8 1.7New England ....................................................... 4.4 4.4Middle Atlantic ..................................................... 1.7 1.6
South ....................................................................... 1.7 1.6South Atlantic ....................................................... 1.7 1.8East South Central ............................................... 1.9 2.2West South Central .............................................. 4.0 3.7
Midwest .................................................................... 2.8 2.7East North Central ............................................... 3.1 2.8West North Central .............................................. 5.9 6.1
West ......................................................................... 3.2 3.2Mountain .............................................................. 6.3 6.4Pacific .................................................................. 3.7 3.7
1 A high deductible health plan (HDHP) is a health plan which typically has a higher deductible andlower premium than a traditional health plan. An individual plan must have a minimum deductible of $1,300to be classified as a HDHP. Normally the plan includes catastrophic coverage to protect against largemedical expenses, but the insured is responsible for routine out-of-pocket expenses.
2 Surveyed occupations are classified into wage categories based on the average wage for theoccupation, which may include workers with earnings both above and below the threshold. The categorieswere formed using percentile estimates generated using data from the National Compensation Surveypublication, "Employer Costs for Employee Compensation - March 2015."
Note: Dashes indicate that no data were reported or that data do not meet publication criteria. Fordefinitions of major plans, key provisions, and related terms, see the "Glossary of Employee Benefit Terms"at www.bls.gov/ncs/ebs/glossary20152016.htm.
Source: Bureau of Labor Statistics, National Compensation Survey.

Table 5. High deductible health plans:1 Summary of selected tax-favoredaccounts,2 private industry workers, 2015
(All workers participating in high deductible health plans = 100 percent)
Characteristics Health savingsaccount3
Healthreimbursementarrangement4
Flexible spendingaccount5
Worker characteristics
All workers ............................................................... 43 17 39
Management, professional, and related .................. 52 14 43Management, business, and financial ................. 55 16 48Professional and related ...................................... 50 13 39
Service ..................................................................... 33 16 39Sales and office ....................................................... 38 27 38
Sales and related ................................................. 26 36 24Office and administrative support ........................ 45 23 46
Natural resources, construction, and maintenance 30 – 23Installation, maintenance, and repair ................... 34 – 24
Production, transportation, and material moving ..... 45 10 39Production ............................................................ 41 – 40Transportation and material moving .................... 50 18 38
Full time ................................................................... 44 15 39Part time .................................................................. 26 49 31
Union ....................................................................... – 12 41Nonunion ................................................................. 43 17 38
Average wage within the following categories6:Second 25 percent ............................................... 34 20 42Third 25 percent ................................................... 46 13 41Highest 25 percent ............................................... 51 14 39
Highest 10 percent ........................................... 54 16 44
Establishment characteristics
Goods-producing industries ..................................... 41 8 39Manufacturing ...................................................... 41 9 46
Service-providing industries ..................................... 43 20 38Trade, transportation, and utilities ....................... 35 32 26
Retail trade ...................................................... 19 47 24Transportation and warehousing ..................... 65 – –
Information ........................................................... 59 – 49Financial activities ................................................ 45 31 59
Finance and insurance .................................... 47 37 62Credit intermediation and related activities .. 36 45 62Insurance carriers and related activities ...... 61 25 58
Professional and business services ..................... 46 – 37Professional and technical services ................. 39 – 31
Education and health services ............................. 42 10 46Educational services ........................................ 29 – –
Junior colleges, colleges, and universities ... 49 – –Health care and social assistance ................... 44 11 46
See footnotes at end of table.

Table 5. High deductible health plans:1 Summary of selected tax-favoredaccounts,2 private industry workers, 2015—continued
(All workers participating in high deductible health plans = 100 percent)
Characteristics Health savingsaccount3
Healthreimbursementarrangement4
Flexible spendingaccount5
1 to 99 workers ........................................................ 42 8 3350 to 99 workers .................................................. 37 – 38
100 workers or more ................................................ 43 24 43100 to 499 workers .............................................. 39 22 34500 workers or more ............................................ 53 29 62
Geographic areas
Northeast ................................................................. 44 19 43New England ....................................................... 45 27 –Middle Atlantic ..................................................... 44 – 44
South ....................................................................... 40 15 28South Atlantic ....................................................... 38 14 29East South Central ............................................... 35 – –West South Central .............................................. 46 13 34
Midwest .................................................................... 45 19 45East North Central ............................................... 41 18 45West North Central .............................................. 54 21 44
West ......................................................................... 44 18 46Mountain .............................................................. 41 – 52Pacific .................................................................. 45 16 43
1 A high deductible health plan (HDHP) is a health plan which typically has a higher deductible and lower premium than atraditional health plan. An individual plan must have a minimum deductible of $1,300 to be classified as a HDHP. Normally theplan includes catastrophic coverage to protect against large medical expenses, but the insured is responsible for routineout-of-pocket expenses.
2 The sum of the columns may not equal 100 since workers may participate in more than one tax-favored account.3 Health savings accounts (HSA) are used in combination with high deductible health plans to pay for current and future
medical expenses. HSAs are controlled by the employee, although both employees and employers may contribute to the account.Accounts can accumulate tax-deferred interest.
4 Health reimbursement arrangements (HRAs) are funded solely by the employer to reimburse employees for any qualifiedmedical expenses. HRAs may be offered with any medical plan.
5 Flexible spending accounts (FSAs) allow an employee to set aside a portion of earnings to pay for qualified medicalexpenses. Money is deducted from an employee’s earnings and is not subject to payroll taxes. Any funds not used by the end ofthe plan year are forfeited by the employee.
6 Surveyed occupations are classified into wage categories based on the average wage for the occupation, which may includeworkers with earnings both above and below the threshold. The categories were formed using percentile estimates generatedusing data from the National Compensation Survey publication, "Employer Costs for Employee Compensation - March 2015."
Note: Dashes indicate that no data were reported or that data do not meet publication criteria. For definitions of major plans, keyprovisions, and related terms, see the "Glossary of Employee Benefit Terms" at www.bls.gov/ncs/ebs/glossary20152016.htm.
Source: Bureau of Labor Statistics, National Compensation Survey.
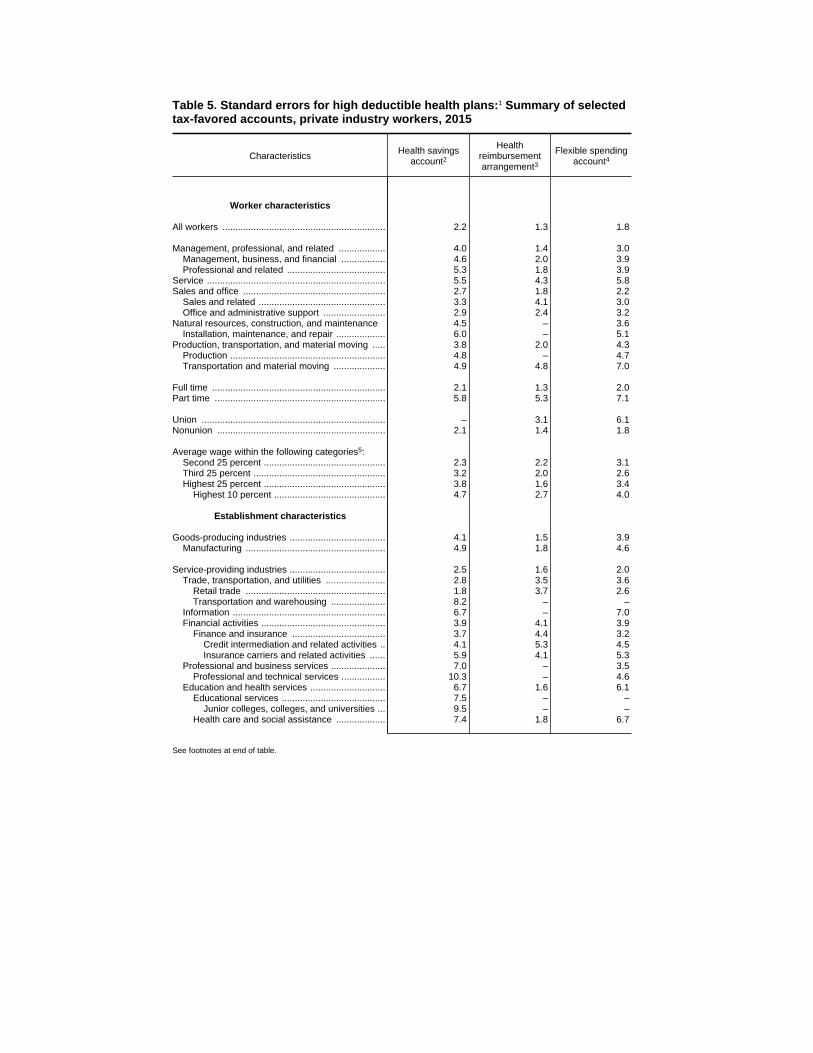
Table 5. Standard errors for high deductible health plans:1 Summary of selectedtax-favored accounts, private industry workers, 2015
Characteristics Health savingsaccount2
Healthreimbursementarrangement3
Flexible spendingaccount4
Worker characteristics
All workers ............................................................... 2.2 1.3 1.8
Management, professional, and related .................. 4.0 1.4 3.0Management, business, and financial ................. 4.6 2.0 3.9Professional and related ...................................... 5.3 1.8 3.9
Service ..................................................................... 5.5 4.3 5.8Sales and office ....................................................... 2.7 1.8 2.2
Sales and related ................................................. 3.3 4.1 3.0Office and administrative support ........................ 2.9 2.4 3.2
Natural resources, construction, and maintenance 4.5 – 3.6Installation, maintenance, and repair ................... 6.0 – 5.1
Production, transportation, and material moving ..... 3.8 2.0 4.3Production ............................................................ 4.8 – 4.7Transportation and material moving .................... 4.9 4.8 7.0
Full time ................................................................... 2.1 1.3 2.0Part time .................................................................. 5.8 5.3 7.1
Union ....................................................................... – 3.1 6.1Nonunion ................................................................. 2.1 1.4 1.8
Average wage within the following categories5:Second 25 percent ............................................... 2.3 2.2 3.1Third 25 percent ................................................... 3.2 2.0 2.6Highest 25 percent ............................................... 3.8 1.6 3.4
Highest 10 percent ........................................... 4.7 2.7 4.0
Establishment characteristics
Goods-producing industries ..................................... 4.1 1.5 3.9Manufacturing ...................................................... 4.9 1.8 4.6
Service-providing industries ..................................... 2.5 1.6 2.0Trade, transportation, and utilities ....................... 2.8 3.5 3.6
Retail trade ...................................................... 1.8 3.7 2.6Transportation and warehousing ..................... 8.2 – –
Information ........................................................... 6.7 – 7.0Financial activities ................................................ 3.9 4.1 3.9
Finance and insurance .................................... 3.7 4.4 3.2Credit intermediation and related activities .. 4.1 5.3 4.5Insurance carriers and related activities ...... 5.9 4.1 5.3
Professional and business services ..................... 7.0 – 3.5Professional and technical services ................. 10.3 – 4.6
Education and health services ............................. 6.7 1.6 6.1Educational services ........................................ 7.5 – –
Junior colleges, colleges, and universities ... 9.5 – –Health care and social assistance ................... 7.4 1.8 6.7
See footnotes at end of table.
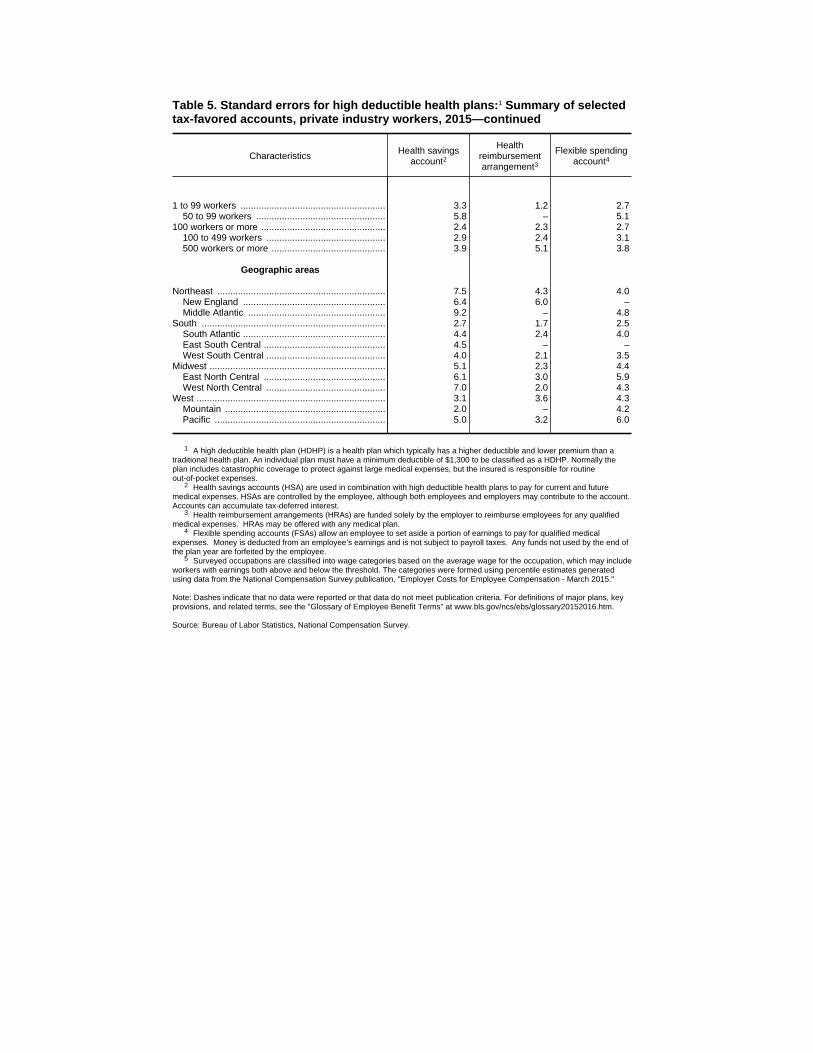
Table 5. Standard errors for high deductible health plans:1 Summary of selectedtax-favored accounts, private industry workers, 2015—continued
Characteristics Health savingsaccount2
Healthreimbursementarrangement3
Flexible spendingaccount4
1 to 99 workers ........................................................ 3.3 1.2 2.750 to 99 workers .................................................. 5.8 – 5.1
100 workers or more ................................................ 2.4 2.3 2.7100 to 499 workers .............................................. 2.9 2.4 3.1500 workers or more ............................................ 3.9 5.1 3.8
Geographic areas
Northeast ................................................................. 7.5 4.3 4.0New England ....................................................... 6.4 6.0 –Middle Atlantic ..................................................... 9.2 – 4.8
South ....................................................................... 2.7 1.7 2.5South Atlantic ....................................................... 4.4 2.4 4.0East South Central ............................................... 4.5 – –West South Central .............................................. 4.0 2.1 3.5
Midwest .................................................................... 5.1 2.3 4.4East North Central ............................................... 6.1 3.0 5.9West North Central .............................................. 7.0 2.0 4.3
West ......................................................................... 3.1 3.6 4.3Mountain .............................................................. 2.0 – 4.2Pacific .................................................................. 5.0 3.2 6.0
1 A high deductible health plan (HDHP) is a health plan which typically has a higher deductible and lower premium than atraditional health plan. An individual plan must have a minimum deductible of $1,300 to be classified as a HDHP. Normally theplan includes catastrophic coverage to protect against large medical expenses, but the insured is responsible for routineout-of-pocket expenses.
2 Health savings accounts (HSA) are used in combination with high deductible health plans to pay for current and futuremedical expenses. HSAs are controlled by the employee, although both employees and employers may contribute to the account.Accounts can accumulate tax-deferred interest.
3 Health reimbursement arrangements (HRAs) are funded solely by the employer to reimburse employees for any qualifiedmedical expenses. HRAs may be offered with any medical plan.
4 Flexible spending accounts (FSAs) allow an employee to set aside a portion of earnings to pay for qualified medicalexpenses. Money is deducted from an employee’s earnings and is not subject to payroll taxes. Any funds not used by the end ofthe plan year are forfeited by the employee.
5 Surveyed occupations are classified into wage categories based on the average wage for the occupation, which may includeworkers with earnings both above and below the threshold. The categories were formed using percentile estimates generatedusing data from the National Compensation Survey publication, "Employer Costs for Employee Compensation - March 2015."
Note: Dashes indicate that no data were reported or that data do not meet publication criteria. For definitions of major plans, keyprovisions, and related terms, see the "Glossary of Employee Benefit Terms" at www.bls.gov/ncs/ebs/glossary20152016.htm.
Source: Bureau of Labor Statistics, National Compensation Survey.

Table 6. High deductible health plans:1 Amount of annual individual deductible, privateindustry workers, 2015
(Includes workers participating in high deductible health plans)
Characteristics
Amount of annual deductible
10thpercentile
25thpercentile
50thpercentile(median)
75thpercentile
90thpercentile
Worker characteristics
All workers ............................................................... $1,500 $1,500 $2,000 $2,750 $4,000
Management, professional, and related .................. 1,500 1,500 2,000 2,500 3,000Management, business, and financial ................. 1,500 1,500 2,000 2,500 4,000Professional and related ...................................... 1,500 1,500 2,000 2,500 3,000
Service ..................................................................... 1,500 1,500 2,000 2,750 4,000Sales and office ....................................................... 1,500 1,750 2,000 2,750 4,000
Sales and related ................................................. 1,500 1,800 2,750 3,000 5,000Office and administrative support ........................ 1,500 1,600 2,000 2,650 3,000
Natural resources, construction, and maintenance 1,500 1,500 2,000 3,000 4,000Installation, maintenance, and repair ................... 1,500 1,500 2,000 3,000 5,000
Production, transportation, and material moving ..... 1,500 1,500 2,000 3,000 5,000Production ............................................................ 1,500 1,500 2,000 3,500 5,000Transportation and material moving .................... 1,500 1,750 2,000 3,000 –
Full time ................................................................... 1,500 1,500 2,000 2,750 4,000Part time .................................................................. 1,500 1,750 2,500 2,750 3,000
Union ....................................................................... 1,500 1,500 2,000 3,000 3,500Nonunion ................................................................. 1,500 1,500 2,000 2,750 4,000
Average wage within the following categories2:Second 25 percent ............................................... 1,500 1,500 2,000 2,750 5,000Third 25 percent ................................................... 1,500 1,500 2,000 2,850 4,000Highest 25 percent ............................................... 1,500 1,500 2,000 2,500 3,500
Highest 10 percent ........................................... 1,500 1,500 1,850 2,500 3,000
Establishment characteristics
Goods-producing industries ..................................... 1,500 1,500 2,000 3,000 5,000Manufacturing ...................................................... 1,500 1,500 2,000 3,000 5,000
Service-providing industries ..................................... 1,500 1,500 2,000 2,750 3,300Trade, transportation, and utilities ....................... 1,500 1,750 2,500 3,000 4,000
Retail trade ...................................................... 1,500 1,750 2,750 3,000 4,000Financial activities ................................................ 1,500 1,500 2,000 2,500 3,000
Finance and insurance .................................... 1,500 1,500 2,000 2,500 3,000Credit intermediation and related activities .. 1,500 1,500 2,000 2,500 3,000Insurance carriers and related activities ...... 1,500 1,500 2,000 2,500 3,000
Professional and business services ..................... 1,500 1,500 2,000 2,500 4,000Education and health services ............................. 1,500 1,500 2,000 2,500 3,000
Educational services ........................................ 1,500 2,000 – 3,000 3,000Junior colleges, colleges, and universities ... 1,500 – 2,000 2,500 –
Health care and social assistance ................... 1,500 1,500 2,000 2,500 3,000
See footnotes at end of table.

Table 6. High deductible health plans:1 Amount of annual individual deductible, privateindustry workers, 2015—continued
(Includes workers participating in high deductible health plans)
Characteristics
Amount of annual deductible
10thpercentile
25thpercentile
50thpercentile(median)
75thpercentile
90thpercentile
1 to 99 workers ........................................................ $1,500 $1,500 $2,000 $3,000 $5,00050 to 99 workers .................................................. 1,500 1,750 2,500 4,000 5,000
100 workers or more ................................................ 1,500 1,500 2,000 2,750 3,000100 to 499 workers .............................................. 1,500 1,500 2,000 2,750 3,500500 workers or more ............................................ 1,300 1,500 1,600 2,000 2,750
Geographic areas
Northeast ................................................................. 1,500 1,500 2,000 2,500 3,000New England ....................................................... 1,500 1,500 2,000 2,500 3,000Middle Atlantic ..................................................... 1,500 1,500 2,000 2,000 3,000
South ....................................................................... 1,500 1,750 2,250 3,000 5,000South Atlantic ....................................................... 1,500 1,750 2,500 3,000 5,000East South Central ............................................... 1,500 – 2,500 3,000 5,000West South Central .............................................. 1,500 1,750 2,000 3,000 5,000
Midwest .................................................................... 1,500 1,500 2,000 2,500 3,000East North Central ............................................... 1,500 1,500 2,000 2,750 –West North Central .............................................. 1,500 1,500 2,000 2,500 3,000
West ......................................................................... 1,500 1,500 2,000 2,750 3,500Mountain .............................................................. 1,500 1,500 1,750 2,500 3,000Pacific .................................................................. 1,500 1,500 2,000 3,000 4,000
1 A high deductible health plan (HDHP) is a health plan which typically has a higher deductible and lower premium than a traditional healthplan. An individual plan must have a minimum deductible of $1,300 to be classified as a HDHP. Normally the plan includes catastrophiccoverage to protect against large medical expenses, but the insured is responsible for routine out-of-pocket expenses.
2 Surveyed occupations are classified into wage categories based on the average wage for the occupation, which may include workerswith earnings both above and below the threshold. The categories were formed using percentile estimates generated using data from theNational Compensation Survey publication, "Employer Costs for Employee Compensation - March 2015."
Note: Dashes indicate that no data were reported or that data do not meet publication criteria. For definitions of major plans, key provisions,and related terms, see the "Glossary of Employee Benefit Terms" at www.bls.gov/ncs/ebs/glossary20152016.htm.
Source: Bureau of Labor Statistics, National Compensation Survey.

Table 6. Standard errors for high deductible health plans:1 Amount of annual individualdeductible, private industry workers, 2015
Characteristics
Amount of annual deductible
10thpercentile
25thpercentile
50thpercentile(median)
75thpercentile
90thpercentile
Worker characteristics
All workers ............................................................... $0 $0 $0 $0 $428
Management, professional, and related .................. 9 0 0 0 0Management, business, and financial ................. 0 0 0 142 1,049Professional and related ...................................... 104 0 72 39 84
Service ..................................................................... 45 0 321 334 970Sales and office ....................................................... 0 0 0 0 795
Sales and related ................................................. 0 236 314 201 258Office and administrative support ........................ 0 211 0 102 0
Natural resources, construction, and maintenance 0 0 117 95 695Installation, maintenance, and repair ................... 0 0 125 199 1,268
Production, transportation, and material moving ..... 0 65 241 383 0Production ............................................................ 0 0 193 794 0Transportation and material moving .................... 0 353 459 223 –
Full time ................................................................... 0 0 0 35 289Part time .................................................................. 163 0 0 0 0
Union ....................................................................... 9 0 91 79 129Nonunion ................................................................. 0 0 0 9 341
Average wage within the following categories2:Second 25 percent ............................................... 0 9 0 289 353Third 25 percent ................................................... 0 0 0 197 341Highest 25 percent ............................................... 0 0 99 0 717
Highest 10 percent ........................................... 13 0 203 91 49
Establishment characteristics
Goods-producing industries ..................................... 0 0 0 364 0Manufacturing ...................................................... 0 0 0 678 0
Service-providing industries ..................................... 0 0 0 56 560Trade, transportation, and utilities ....................... 0 0 18 102 826
Retail trade ...................................................... 16 0 0 341 1,168Financial activities ................................................ 0 0 0 0 0
Finance and insurance .................................... 0 0 0 0 0Credit intermediation and related activities .. 0 0 0 0 0Insurance carriers and related activities ...... 0 0 39 61 0
Professional and business services ..................... 0 0 55 0 1,048Education and health services ............................. 0 32 0 163 474
Educational services ........................................ 0 194 – 513 0Junior colleges, colleges, and universities ... 0 – 438 526 –
Health care and social assistance ................... 0 26 26 85 758
See footnotes at end of table.

Table 6. Standard errors for high deductible health plans:1 Amount of annual individualdeductible, private industry workers, 2015—continued
Characteristics
Amount of annual deductible
10thpercentile
25thpercentile
50thpercentile(median)
75thpercentile
90thpercentile
1 to 99 workers ........................................................ $0 $46 $0 $295 $81650 to 99 workers .................................................. 0 328 376 562 0
100 workers or more ................................................ 0 0 0 35 454100 to 499 workers .............................................. 0 64 36 209 274500 workers or more ............................................ 22 0 143 332 113
Geographic areas
Northeast ................................................................. 0 0 103 497 160New England ....................................................... 0 0 386 0 400Middle Atlantic ..................................................... 0 0 109 337 243
South ....................................................................... 0 9 455 72 0South Atlantic ....................................................... 0 109 278 418 0East South Central ............................................... 0 – 702 0 1,499West South Central .............................................. 0 308 46 223 447
Midwest .................................................................... 0 0 0 235 182East North Central ............................................... 0 0 0 273 –West North Central .............................................. 0 244 0 0 121
West ......................................................................... 0 0 87 298 727Mountain .............................................................. 0 0 248 309 367Pacific .................................................................. 0 0 32 319 624
1 A high deductible health plan (HDHP) is a health plan which typically has a higher deductible and lower premium than a traditional healthplan. An individual plan must have a minimum deductible of $1,300 to be classified as a HDHP. Normally the plan includes catastrophiccoverage to protect against large medical expenses, but the insured is responsible for routine out-of-pocket expenses.
2 Surveyed occupations are classified into wage categories based on the average wage for the occupation, which may include workerswith earnings both above and below the threshold. The categories were formed using percentile estimates generated using data from theNational Compensation Survey publication, "Employer Costs for Employee Compensation - March 2015."
Note: Dashes indicate that no data were reported or that data do not meet publication criteria. For definitions of major plans, key provisions,and related terms, see the "Glossary of Employee Benefit Terms" at www.bls.gov/ncs/ebs/glossary20152016.htm.
Source: Bureau of Labor Statistics, National Compensation Survey.

Table 7. Nonhigh deductible health plans: Summary of selectedtax-favored accounts,1 private industry workers, 2015
(All workers participating in nonhigh deductible health plans = 100 percent)
CharacteristicsHealth
reimbursementarrangement2
Flexible spendingaccount3
Worker characteristics
All workers ............................................................... 8 59
Management, professional, and related .................. 10 67Management, business, and financial ................. 7 67Professional and related ...................................... 12 68
Service ..................................................................... – 55Sales and office ....................................................... 6 57
Sales and related ................................................. 7 –Office and administrative support ........................ 6 61
Natural resources, construction, and maintenance 14 37Installation, maintenance, and repair ................... – 49
Production, transportation, and material moving ..... – 64Production ............................................................ – 58Transportation and material moving .................... – 70
Full time ................................................................... 8 60Part time .................................................................. 10 –
Union ....................................................................... 16 55Nonunion ................................................................. 6 60
Average wage within the following categories4:Second 25 percent ............................................... 7 55Third 25 percent ................................................... 7 58Highest 25 percent ............................................... 10 67
Highest 10 percent ........................................... 8 70
Establishment characteristics
Goods-producing industries ..................................... 8 49Manufacturing ...................................................... – 62
Service-providing industries ..................................... 8 63Trade, transportation, and utilities ....................... 11 58
Retail trade ...................................................... 11 –Transportation and warehousing ..................... – 78
Information ........................................................... – 88Financial activities ................................................ 7 67
Finance and insurance .................................... 9 79Credit intermediation and related activities .. – 73Insurance carriers and related activities ...... 9 82
Professional and business services ..................... – 66Professional and technical services ................. – 75
Education and health services ............................. 12 66Educational services ........................................ – 73
Junior colleges, colleges, and universities ... – 85Health care and social assistance ................... 14 65
Other services ...................................................... – 42
See footnotes at end of table.
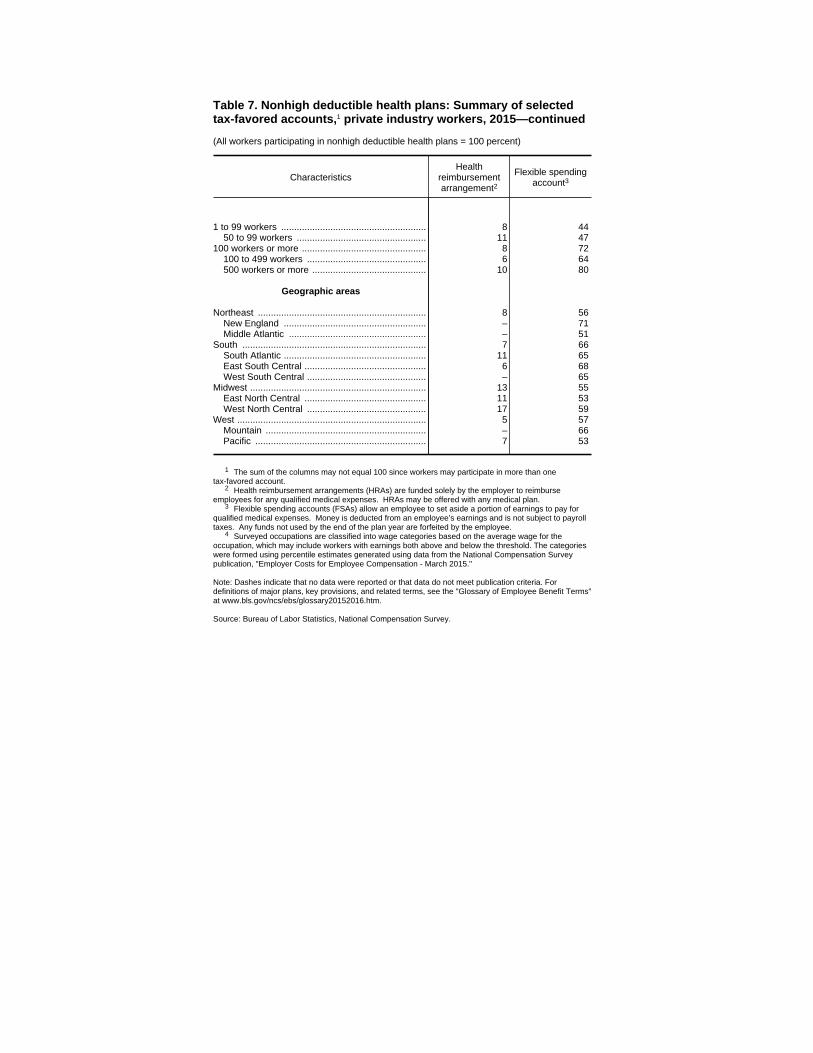
Table 7. Nonhigh deductible health plans: Summary of selectedtax-favored accounts,1 private industry workers, 2015—continued
(All workers participating in nonhigh deductible health plans = 100 percent)
CharacteristicsHealth
reimbursementarrangement2
Flexible spendingaccount3
1 to 99 workers ........................................................ 8 4450 to 99 workers .................................................. 11 47
100 workers or more ................................................ 8 72100 to 499 workers .............................................. 6 64500 workers or more ............................................ 10 80
Geographic areas
Northeast ................................................................. 8 56New England ....................................................... – 71Middle Atlantic ..................................................... – 51
South ....................................................................... 7 66South Atlantic ....................................................... 11 65East South Central ............................................... 6 68West South Central .............................................. – 65
Midwest .................................................................... 13 55East North Central ............................................... 11 53West North Central .............................................. 17 59
West ......................................................................... 5 57Mountain .............................................................. – 66Pacific .................................................................. 7 53
1 The sum of the columns may not equal 100 since workers may participate in more than onetax-favored account.
2 Health reimbursement arrangements (HRAs) are funded solely by the employer to reimburseemployees for any qualified medical expenses. HRAs may be offered with any medical plan.
3 Flexible spending accounts (FSAs) allow an employee to set aside a portion of earnings to pay forqualified medical expenses. Money is deducted from an employee’s earnings and is not subject to payrolltaxes. Any funds not used by the end of the plan year are forfeited by the employee.
4 Surveyed occupations are classified into wage categories based on the average wage for theoccupation, which may include workers with earnings both above and below the threshold. The categorieswere formed using percentile estimates generated using data from the National Compensation Surveypublication, "Employer Costs for Employee Compensation - March 2015."
Note: Dashes indicate that no data were reported or that data do not meet publication criteria. Fordefinitions of major plans, key provisions, and related terms, see the "Glossary of Employee Benefit Terms"at www.bls.gov/ncs/ebs/glossary20152016.htm.
Source: Bureau of Labor Statistics, National Compensation Survey.
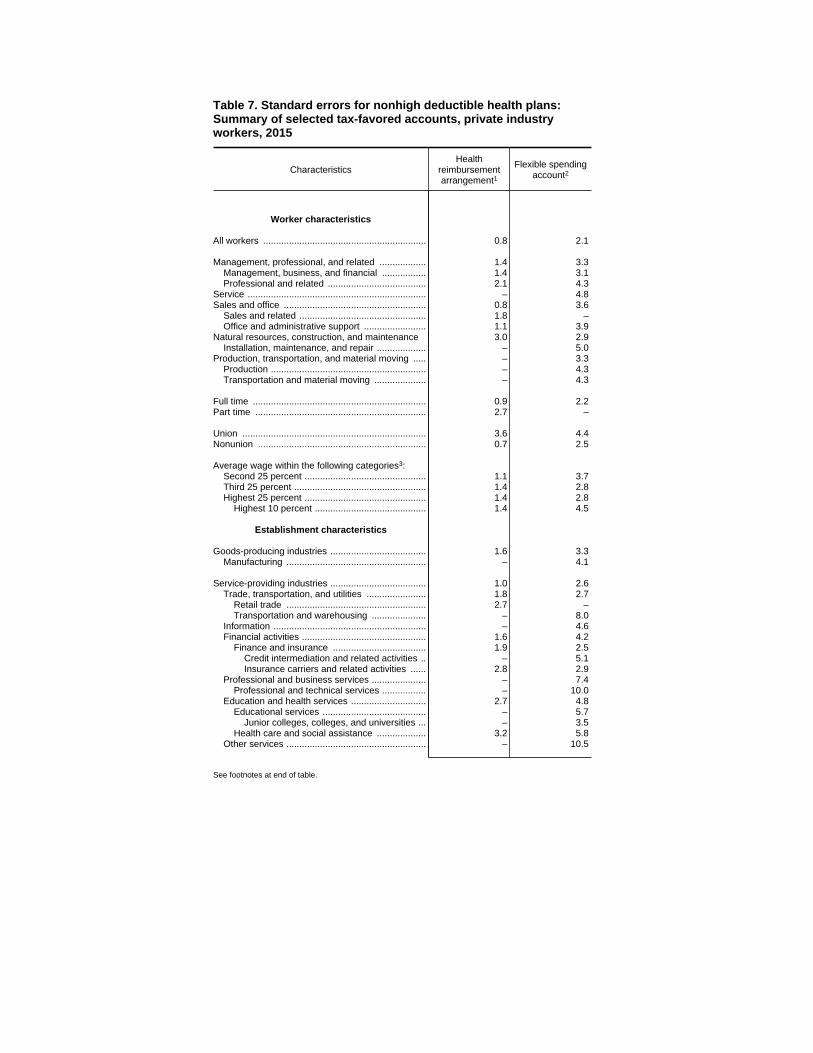
Table 7. Standard errors for nonhigh deductible health plans:Summary of selected tax-favored accounts, private industryworkers, 2015
CharacteristicsHealth
reimbursementarrangement1
Flexible spendingaccount2
Worker characteristics
All workers ............................................................... 0.8 2.1
Management, professional, and related .................. 1.4 3.3Management, business, and financial ................. 1.4 3.1Professional and related ...................................... 2.1 4.3
Service ..................................................................... – 4.8Sales and office ....................................................... 0.8 3.6
Sales and related ................................................. 1.8 –Office and administrative support ........................ 1.1 3.9
Natural resources, construction, and maintenance 3.0 2.9Installation, maintenance, and repair ................... – 5.0
Production, transportation, and material moving ..... – 3.3Production ............................................................ – 4.3Transportation and material moving .................... – 4.3
Full time ................................................................... 0.9 2.2Part time .................................................................. 2.7 –
Union ....................................................................... 3.6 4.4Nonunion ................................................................. 0.7 2.5
Average wage within the following categories3:Second 25 percent ............................................... 1.1 3.7Third 25 percent ................................................... 1.4 2.8Highest 25 percent ............................................... 1.4 2.8
Highest 10 percent ........................................... 1.4 4.5
Establishment characteristics
Goods-producing industries ..................................... 1.6 3.3Manufacturing ...................................................... – 4.1
Service-providing industries ..................................... 1.0 2.6Trade, transportation, and utilities ....................... 1.8 2.7
Retail trade ...................................................... 2.7 –Transportation and warehousing ..................... – 8.0
Information ........................................................... – 4.6Financial activities ................................................ 1.6 4.2
Finance and insurance .................................... 1.9 2.5Credit intermediation and related activities .. – 5.1Insurance carriers and related activities ...... 2.8 2.9
Professional and business services ..................... – 7.4Professional and technical services ................. – 10.0
Education and health services ............................. 2.7 4.8Educational services ........................................ – 5.7
Junior colleges, colleges, and universities ... – 3.5Health care and social assistance ................... 3.2 5.8
Other services ...................................................... – 10.5
See footnotes at end of table.

Table 7. Standard errors for nonhigh deductible health plans:Summary of selected tax-favored accounts, private industryworkers, 2015—continued
CharacteristicsHealth
reimbursementarrangement1
Flexible spendingaccount2
1 to 99 workers ........................................................ 1.2 3.750 to 99 workers .................................................. 2.1 7.4
100 workers or more ................................................ 1.2 1.9100 to 499 workers .............................................. 1.8 2.6500 workers or more ............................................ 1.7 2.8
Geographic areas
Northeast ................................................................. 2.0 5.5New England ....................................................... – 8.3Middle Atlantic ..................................................... – 6.8
South ....................................................................... 1.4 2.8South Atlantic ....................................................... 2.6 3.2East South Central ............................................... 0.8 7.0West South Central .............................................. – 5.9
Midwest .................................................................... 2.4 4.2East North Central ............................................... 3.2 5.2West North Central .............................................. 3.1 6.9
West ......................................................................... 0.9 5.1Mountain .............................................................. – 5.4Pacific .................................................................. 1.2 6.8
1 Health reimbursement arrangements (HRAs) are funded solely by the employer to reimburseemployees for any qualified medical expenses. HRAs may be offered with any medical plan.
2 Flexible spending accounts (FSAs) allow an employee to set aside a portion of earnings to pay forqualified medical expenses. Money is deducted from an employee’s earnings and is not subject to payrolltaxes. Any funds not used by the end of the plan year are forfeited by the employee.
3 Surveyed occupations are classified into wage categories based on the average wage for theoccupation, which may include workers with earnings both above and below the threshold. The categorieswere formed using percentile estimates generated using data from the National Compensation Surveypublication, "Employer Costs for Employee Compensation - March 2015."
Note: Dashes indicate that no data were reported or that data do not meet publication criteria. Fordefinitions of major plans, key provisions, and related terms, see the "Glossary of Employee Benefit Terms"at www.bls.gov/ncs/ebs/glossary20152016.htm.
Source: Bureau of Labor Statistics, National Compensation Survey.

Table 8. Nonhigh deductible health plans: Amount of annual individual deductible, private industry workers, 2015
(All workers participating in nonhigh deductible health plans = 100 percent)
Characteristics Withdeductible
Amount of annual deductible
With nodeductible10th
percentile25th
percentile
50thpercentile(median)
75thpercentile
90thpercentile
Worker characteristics
All workers ............................................................... 79 $250 $300 $500 $1,000 $1,000 21
Management, professional, and related .................. 80 250 300 500 1,000 1,000 20Management, business, and financial ................. 82 – 350 500 1,000 1,000 18Professional and related ...................................... 79 250 300 500 1,000 1,000 21
Service ..................................................................... 74 – 250 500 1,000 1,000 26Sales and office ....................................................... 81 250 350 600 1,000 1,100 19
Sales and related ................................................. 77 – – 750 1,000 1,100 23Office and administrative support ........................ 83 250 350 500 1,000 1,100 17
Natural resources, construction, and maintenance 81 200 250 450 – 1,000 19Installation, maintenance, and repair ................... 82 250 300 500 – 1,000 18
Production, transportation, and material moving ..... 78 250 300 500 – 1,000 22Production ............................................................ 83 250 – 500 – 1,000 17Transportation and material moving .................... 73 – 250 500 750 1,000 27
Full time ................................................................... 80 – 300 500 1,000 1,000 20Part time .................................................................. 71 250 300 500 1,000 1,000 29
Union ....................................................................... 77 – 200 300 – 1,000 23Nonunion ................................................................. 80 250 350 500 1,000 1,000 20
Average wage within the following categories1:Second 25 percent ............................................... 78 200 300 500 1,000 1,000 22Third 25 percent ................................................... 81 250 300 500 1,000 1,000 19Highest 25 percent ............................................... 80 – 300 500 1,000 1,000 20
Highest 10 percent ........................................... 79 250 300 500 1,000 1,000 21
Establishment characteristics
Goods-producing industries ..................................... 82 250 300 500 – 1,000 18Manufacturing ...................................................... 84 250 – 500 1,000 1,000 16
Service-providing industries ..................................... 79 200 300 500 1,000 1,000 21Trade, transportation, and utilities ....................... 80 200 – 500 800 1,000 20
Retail trade ...................................................... 81 – 350 500 950 1,000 19Transportation and warehousing ..................... 74 – 250 – 500 1,000 26
Information ........................................................... 80 200 – 500 600 1,100 20Financial activities ................................................ 90 300 500 700 1,000 1,100 10
Finance and insurance .................................... 89 250 500 600 1,000 1,100 11Credit intermediation and related activities .. 90 300 450 – 1,000 1,200 10Insurance carriers and related activities ...... 91 250 500 750 1,000 1,100 9
Professional and business services ..................... 76 250 – – 1,000 1,200 24Professional and technical services ................. 70 250 – – 1,000 1,100 30
Education and health services ............................. 74 250 300 500 1,000 1,000 26Educational services ........................................ 69 250 250 – – – 31
Junior colleges, colleges, and universities ... 72 200 250 – – 1,000 28Health care and social assistance ................... 75 250 – – 1,000 1,000 25
See footnotes at end of table.
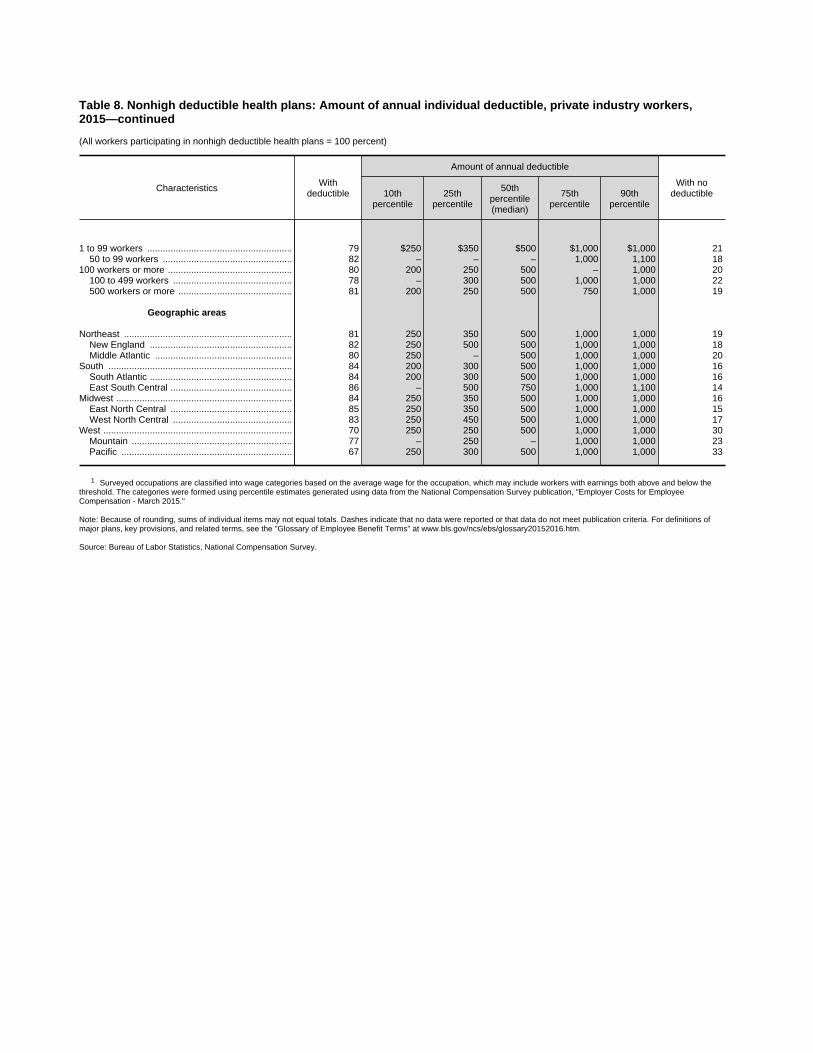
Table 8. Nonhigh deductible health plans: Amount of annual individual deductible, private industry workers,2015—continued
(All workers participating in nonhigh deductible health plans = 100 percent)
Characteristics Withdeductible
Amount of annual deductible
With nodeductible10th
percentile25th
percentile
50thpercentile(median)
75thpercentile
90thpercentile
1 to 99 workers ........................................................ 79 $250 $350 $500 $1,000 $1,000 2150 to 99 workers .................................................. 82 – – – 1,000 1,100 18
100 workers or more ................................................ 80 200 250 500 – 1,000 20100 to 499 workers .............................................. 78 – 300 500 1,000 1,000 22500 workers or more ............................................ 81 200 250 500 750 1,000 19
Geographic areas
Northeast ................................................................. 81 250 350 500 1,000 1,000 19New England ....................................................... 82 250 500 500 1,000 1,000 18Middle Atlantic ..................................................... 80 250 – 500 1,000 1,000 20
South ....................................................................... 84 200 300 500 1,000 1,000 16South Atlantic ....................................................... 84 200 300 500 1,000 1,000 16East South Central ............................................... 86 – 500 750 1,000 1,100 14
Midwest .................................................................... 84 250 350 500 1,000 1,000 16East North Central ............................................... 85 250 350 500 1,000 1,000 15West North Central .............................................. 83 250 450 500 1,000 1,000 17
West ......................................................................... 70 250 250 500 1,000 1,000 30Mountain .............................................................. 77 – 250 – 1,000 1,000 23Pacific .................................................................. 67 250 300 500 1,000 1,000 33
1 Surveyed occupations are classified into wage categories based on the average wage for the occupation, which may include workers with earnings both above and below thethreshold. The categories were formed using percentile estimates generated using data from the National Compensation Survey publication, "Employer Costs for EmployeeCompensation - March 2015."
Note: Because of rounding, sums of individual items may not equal totals. Dashes indicate that no data were reported or that data do not meet publication criteria. For definitions ofmajor plans, key provisions, and related terms, see the "Glossary of Employee Benefit Terms" at www.bls.gov/ncs/ebs/glossary20152016.htm.
Source: Bureau of Labor Statistics, National Compensation Survey.
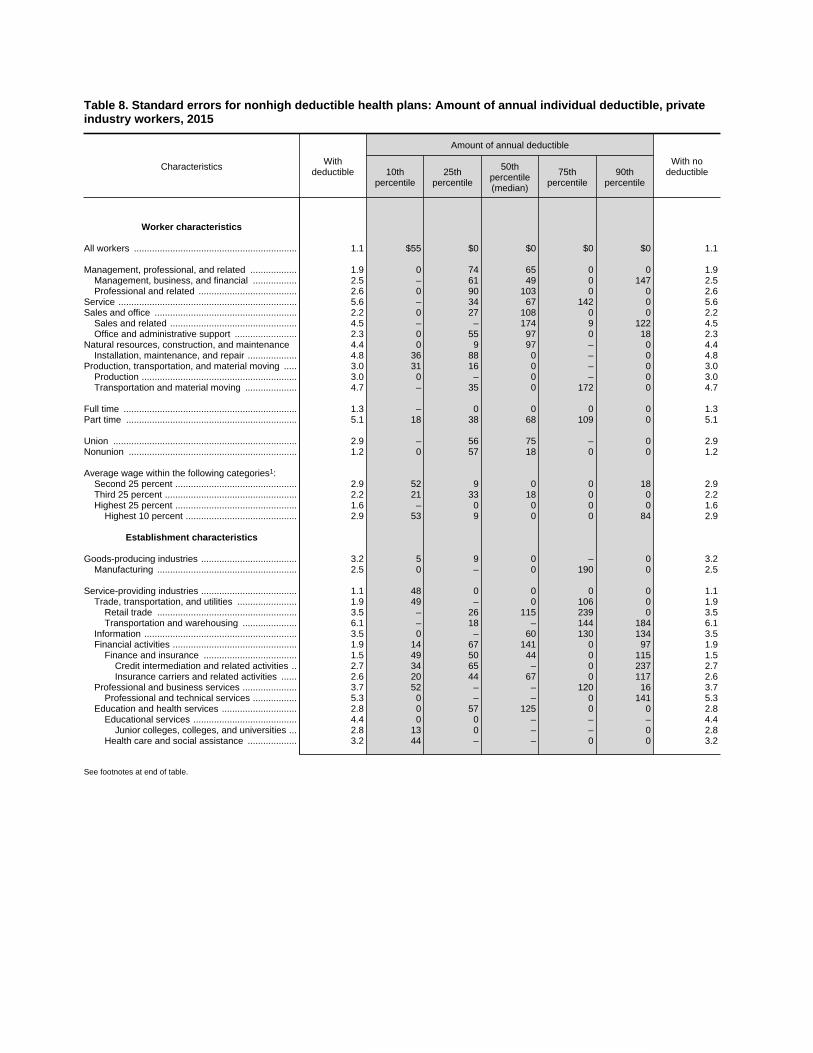
Table 8. Standard errors for nonhigh deductible health plans: Amount of annual individual deductible, privateindustry workers, 2015
Characteristics Withdeductible
Amount of annual deductible
With nodeductible10th
percentile25th
percentile
50thpercentile(median)
75thpercentile
90thpercentile
Worker characteristics
All workers ............................................................... 1.1 $55 $0 $0 $0 $0 1.1
Management, professional, and related .................. 1.9 0 74 65 0 0 1.9Management, business, and financial ................. 2.5 – 61 49 0 147 2.5Professional and related ...................................... 2.6 0 90 103 0 0 2.6
Service ..................................................................... 5.6 – 34 67 142 0 5.6Sales and office ....................................................... 2.2 0 27 108 0 0 2.2
Sales and related ................................................. 4.5 – – 174 9 122 4.5Office and administrative support ........................ 2.3 0 55 97 0 18 2.3
Natural resources, construction, and maintenance 4.4 0 9 97 – 0 4.4Installation, maintenance, and repair ................... 4.8 36 88 0 – 0 4.8
Production, transportation, and material moving ..... 3.0 31 16 0 – 0 3.0Production ............................................................ 3.0 0 – 0 – 0 3.0Transportation and material moving .................... 4.7 – 35 0 172 0 4.7
Full time ................................................................... 1.3 – 0 0 0 0 1.3Part time .................................................................. 5.1 18 38 68 109 0 5.1
Union ....................................................................... 2.9 – 56 75 – 0 2.9Nonunion ................................................................. 1.2 0 57 18 0 0 1.2
Average wage within the following categories1:Second 25 percent ............................................... 2.9 52 9 0 0 18 2.9Third 25 percent ................................................... 2.2 21 33 18 0 0 2.2Highest 25 percent ............................................... 1.6 – 0 0 0 0 1.6
Highest 10 percent ........................................... 2.9 53 9 0 0 84 2.9
Establishment characteristics
Goods-producing industries ..................................... 3.2 5 9 0 – 0 3.2Manufacturing ...................................................... 2.5 0 – 0 190 0 2.5
Service-providing industries ..................................... 1.1 48 0 0 0 0 1.1Trade, transportation, and utilities ....................... 1.9 49 – 0 106 0 1.9
Retail trade ...................................................... 3.5 – 26 115 239 0 3.5Transportation and warehousing ..................... 6.1 – 18 – 144 184 6.1
Information ........................................................... 3.5 0 – 60 130 134 3.5Financial activities ................................................ 1.9 14 67 141 0 97 1.9
Finance and insurance .................................... 1.5 49 50 44 0 115 1.5Credit intermediation and related activities .. 2.7 34 65 – 0 237 2.7Insurance carriers and related activities ...... 2.6 20 44 67 0 117 2.6
Professional and business services ..................... 3.7 52 – – 120 16 3.7Professional and technical services ................. 5.3 0 – – 0 141 5.3
Education and health services ............................. 2.8 0 57 125 0 0 2.8Educational services ........................................ 4.4 0 0 – – – 4.4
Junior colleges, colleges, and universities ... 2.8 13 0 – – 0 2.8Health care and social assistance ................... 3.2 44 – – 0 0 3.2
See footnotes at end of table.
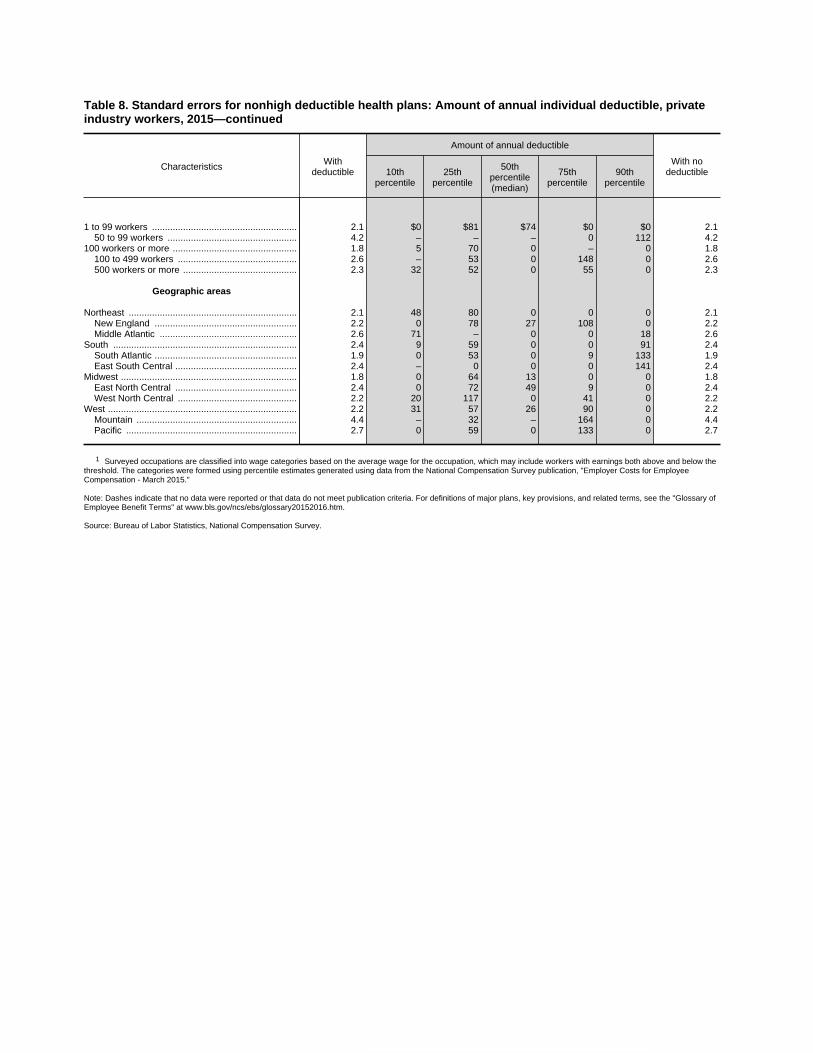
Table 8. Standard errors for nonhigh deductible health plans: Amount of annual individual deductible, privateindustry workers, 2015—continued
Characteristics Withdeductible
Amount of annual deductible
With nodeductible10th
percentile25th
percentile
50thpercentile(median)
75thpercentile
90thpercentile
1 to 99 workers ........................................................ 2.1 $0 $81 $74 $0 $0 2.150 to 99 workers .................................................. 4.2 – – – 0 112 4.2
100 workers or more ................................................ 1.8 5 70 0 – 0 1.8100 to 499 workers .............................................. 2.6 – 53 0 148 0 2.6500 workers or more ............................................ 2.3 32 52 0 55 0 2.3
Geographic areas
Northeast ................................................................. 2.1 48 80 0 0 0 2.1New England ....................................................... 2.2 0 78 27 108 0 2.2Middle Atlantic ..................................................... 2.6 71 – 0 0 18 2.6
South ....................................................................... 2.4 9 59 0 0 91 2.4South Atlantic ....................................................... 1.9 0 53 0 9 133 1.9East South Central ............................................... 2.4 – 0 0 0 141 2.4
Midwest .................................................................... 1.8 0 64 13 0 0 1.8East North Central ............................................... 2.4 0 72 49 9 0 2.4West North Central .............................................. 2.2 20 117 0 41 0 2.2
West ......................................................................... 2.2 31 57 26 90 0 2.2Mountain .............................................................. 4.4 – 32 – 164 0 4.4Pacific .................................................................. 2.7 0 59 0 133 0 2.7
1 Surveyed occupations are classified into wage categories based on the average wage for the occupation, which may include workers with earnings both above and below thethreshold. The categories were formed using percentile estimates generated using data from the National Compensation Survey publication, "Employer Costs for EmployeeCompensation - March 2015."
Note: Dashes indicate that no data were reported or that data do not meet publication criteria. For definitions of major plans, key provisions, and related terms, see the "Glossary ofEmployee Benefit Terms" at www.bls.gov/ncs/ebs/glossary20152016.htm.
Source: Bureau of Labor Statistics, National Compensation Survey.

Table 9. Mental health care treatment benefits: Coveragefor selected services,1 private industry workers, 2015
(All workers participating in medical care plans = 100 percent)
CharacteristicsInpatient
mental healthcare
Outpatientmental health
care
Worker characteristics
All workers ............................................................... 81 80
Service ..................................................................... 82 80Sales and office ....................................................... 80 80
Sales and related ................................................. 82 82Natural resources, construction, and maintenance 82 84
Installation, maintenance, and repair ................... – 83Production, transportation, and material moving ..... 83 83
Production ............................................................ 81 81Transportation and material moving .................... 86 86
Full time ................................................................... 80 –Part time .................................................................. 88 89
Union ....................................................................... 85 85
Average wage within the following categories2:Second 25 percent ............................................... 81 81Third 25 percent ................................................... 81 82Highest 25 percent:
Highest 10 percent ......................................... 81 –
Establishment characteristics
Service-providing industries ..................................... 82 81Trade, transportation, and utilities ....................... 84 85
Retail trade ...................................................... 81 81Financial activities:
Finance and insurance:Insurance carriers and related activities .... 82 –
Professional and business services ..................... 90 90Education and health services:
Educational services ...................................... 85 82Junior colleges, colleges, and universities ... 91 90
1 to 99 workers ........................................................ 82 81100 workers or more:
500 workers or more .......................................... 81 81
Geographic areas
Northeast ................................................................. 84 82New England ....................................................... 82 –Middle Atlantic ..................................................... 84 83
South ....................................................................... 81 –East South Central ............................................... 84 84West South Central .............................................. 83 82
Midwest:West North Central .............................................. 82 82
West ......................................................................... 81 81Mountain .............................................................. 86 84
1 The remaining workers include both workers not receiving the benefit and workers forwhom the availability of the benefit could not be determined.
2 Surveyed occupations are classified into wage categories based on the average wage forthe occupation, which may include workers with earnings both above and below the threshold.The categories were formed using percentile estimates generated using data from the NationalCompensation Survey publication, "Employer Costs for Employee Compensation - March 2015."
Note: Dashes indicate that no data were reported or that data do not meet publication criteria.For definitions of major plans, key provisions, and related terms, see the "Glossary of EmployeeBenefit Terms" at www.bls.gov/ncs/ebs/glossary20152016.htm.
Source: Bureau of Labor Statistics, National Compensation Survey.
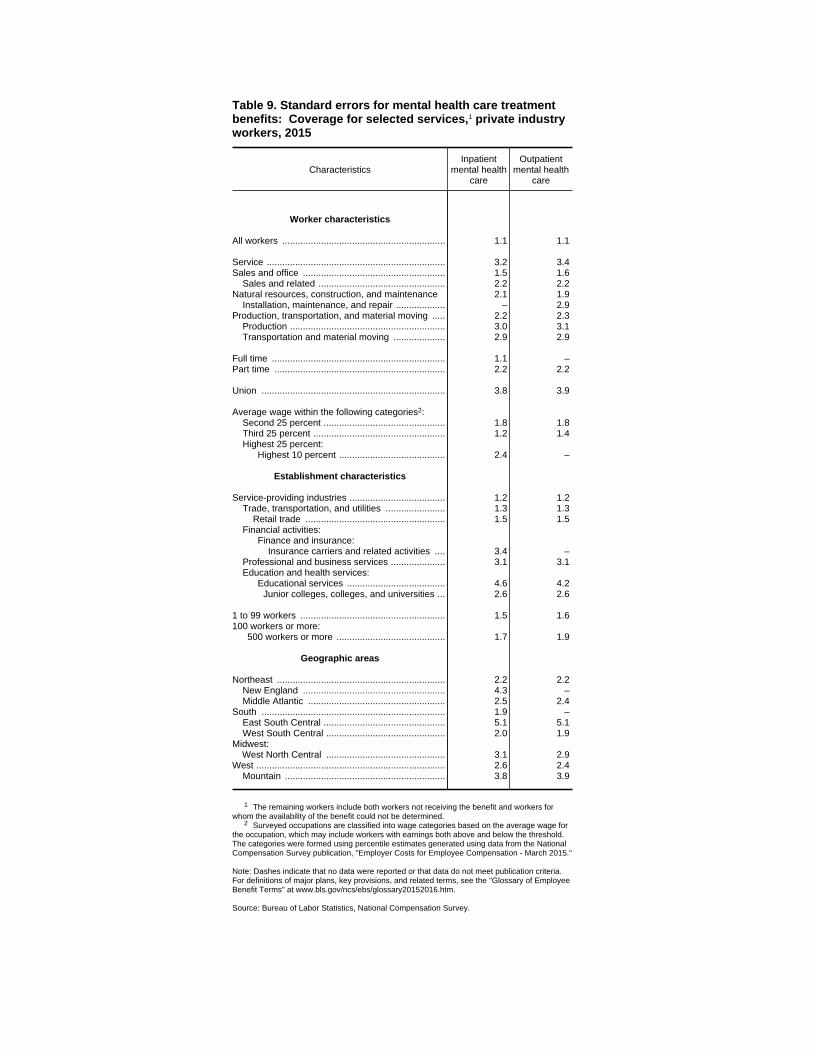
Table 9. Standard errors for mental health care treatmentbenefits: Coverage for selected services,1 private industryworkers, 2015
CharacteristicsInpatient
mental healthcare
Outpatientmental health
care
Worker characteristics
All workers ............................................................... 1.1 1.1
Service ..................................................................... 3.2 3.4Sales and office ....................................................... 1.5 1.6
Sales and related ................................................. 2.2 2.2Natural resources, construction, and maintenance 2.1 1.9
Installation, maintenance, and repair ................... – 2.9Production, transportation, and material moving ..... 2.2 2.3
Production ............................................................ 3.0 3.1Transportation and material moving .................... 2.9 2.9
Full time ................................................................... 1.1 –Part time .................................................................. 2.2 2.2
Union ....................................................................... 3.8 3.9
Average wage within the following categories2:Second 25 percent ............................................... 1.8 1.8Third 25 percent ................................................... 1.2 1.4Highest 25 percent:
Highest 10 percent ......................................... 2.4 –
Establishment characteristics
Service-providing industries ..................................... 1.2 1.2Trade, transportation, and utilities ....................... 1.3 1.3
Retail trade ...................................................... 1.5 1.5Financial activities:
Finance and insurance:Insurance carriers and related activities .... 3.4 –
Professional and business services ..................... 3.1 3.1Education and health services:
Educational services ...................................... 4.6 4.2Junior colleges, colleges, and universities ... 2.6 2.6
1 to 99 workers ........................................................ 1.5 1.6100 workers or more:
500 workers or more .......................................... 1.7 1.9
Geographic areas
Northeast ................................................................. 2.2 2.2New England ....................................................... 4.3 –Middle Atlantic ..................................................... 2.5 2.4
South ....................................................................... 1.9 –East South Central ............................................... 5.1 5.1West South Central .............................................. 2.0 1.9
Midwest:West North Central .............................................. 3.1 2.9
West ......................................................................... 2.6 2.4Mountain .............................................................. 3.8 3.9
1 The remaining workers include both workers not receiving the benefit and workers forwhom the availability of the benefit could not be determined.
2 Surveyed occupations are classified into wage categories based on the average wage forthe occupation, which may include workers with earnings both above and below the threshold.The categories were formed using percentile estimates generated using data from the NationalCompensation Survey publication, "Employer Costs for Employee Compensation - March 2015."
Note: Dashes indicate that no data were reported or that data do not meet publication criteria.For definitions of major plans, key provisions, and related terms, see the "Glossary of EmployeeBenefit Terms" at www.bls.gov/ncs/ebs/glossary20152016.htm.
Source: Bureau of Labor Statistics, National Compensation Survey.

Table 10. Medical care benefits: Coverage for selected services,1 private industryworkers, 2015
(All workers participating in medical care plans = 100 percent)
CharacteristicsHospital
room andboard
Inpatientsurgery
Outpatientsurgery
Physicianoffice visit
Worker characteristics
All workers ............................................................... 97 93 93 100
Management, professional, and related .................. 97 93 93 100Management, business, and financial ................. 96 92 92 100Professional and related ...................................... 98 93 93 100
Service ..................................................................... 95 94 94 99Sales and office ....................................................... 96 91 92 100
Sales and related ................................................. 96 94 95 100Office and administrative support ........................ 97 90 90 100
Natural resources, construction, and maintenance 99 94 94 100Installation, maintenance, and repair ................... 100 92 92 100
Production, transportation, and material moving ..... 98 95 95 100Production ............................................................ 98 94 94 100Transportation and material moving .................... 98 95 96 100
Full time ................................................................... 97 93 93 100Part time .................................................................. 99 97 97 99
Union ....................................................................... 98 96 96 99Nonunion ................................................................. 97 92 93 100
Average wage within the following categories2:Second 25 percent ............................................... 97 94 94 100Third 25 percent ................................................... 98 92 92 100Highest 25 percent ............................................... 97 93 93 100
Highest 10 percent ........................................... 98 94 94 99
Establishment characteristics
Goods-producing industries ..................................... 96 90 90 100Manufacturing ...................................................... 95 90 90 100
Service-providing industries ..................................... 97 94 94 100Trade, transportation, and utilities ....................... 98 95 96 100
Retail trade ...................................................... 98 95 96 100Financial activities ................................................ 98 90 90 100
Finance and insurance .................................... 98 87 87 100Credit intermediation and related activities .. 99 84 84 100Insurance carriers and related activities ...... 99 96 96 99
Professional and business services ..................... 99 95 94 100Education and health services ............................. 96 94 94 99
Educational services ........................................ 100 98 99 100Junior colleges, colleges, and universities ... 99 96 98 100
Health care and social assistance ................... 95 93 93 99
See footnotes at end of table.

Table 10. Medical care benefits: Coverage for selected services,1 private industryworkers, 2015—continued
(All workers participating in medical care plans = 100 percent)
CharacteristicsHospital
room andboard
Inpatientsurgery
Outpatientsurgery
Physicianoffice visit
1 to 99 workers ........................................................ 98 91 92 10050 to 99 workers .................................................. 98 88 89 100
100 workers or more ................................................ 96 94 94 100100 to 499 workers .............................................. 97 95 95 100500 workers or more ............................................ 96 93 92 99
Geographic areas
Northeast ................................................................. 98 94 94 99New England ....................................................... 99 97 98 100Middle Atlantic ..................................................... 98 93 92 99
South ....................................................................... 98 93 94 100South Atlantic ....................................................... 97 94 94 100East South Central ............................................... 97 92 92 100West South Central .............................................. 99 93 94 100
Midwest .................................................................... 95 92 92 100East North Central ............................................... 95 91 92 100West North Central .............................................. 97 93 93 100
West ......................................................................... 97 92 93 100Mountain .............................................................. 97 96 96 100Pacific .................................................................. 96 91 92 99
1 The remaining workers include both workers not receiving the benefit and workers for whom the availability of the benefitcould not be determined.
2 Surveyed occupations are classified into wage categories based on the average wage for the occupation, which may includeworkers with earnings both above and below the threshold. The categories were formed using percentile estimates generated usingdata from the National Compensation Survey publication, "Employer Costs for Employee Compensation - March 2015."
Source: Bureau of Labor Statistics, National Compensation Survey.

Table 10. Standard errors for medical care benefits: Coverage for selectedservices,1 private industry workers, 2015
CharacteristicsHospital
room andboard
Inpatientsurgery
Outpatientsurgery
Physicianoffice visit
Worker characteristics
All workers ............................................................... 0.5 0.7 0.7 0.1
Management, professional, and related .................. 0.8 1.3 1.3 0.2Management, business, and financial ................. 1.2 1.3 1.3 0.2Professional and related ...................................... 0.7 1.9 1.9 0.2
Service ..................................................................... 1.6 1.7 1.6 0.3Sales and office ....................................................... 0.8 1.1 1.1 0.1
Sales and related ................................................. 1.6 1.7 1.6 0.1Office and administrative support ........................ 0.9 1.4 1.4 0.1
Natural resources, construction, and maintenance 0.6 1.4 1.4 0.1Installation, maintenance, and repair ................... 0.1 2.4 2.3 0.1
Production, transportation, and material moving ..... 1.0 1.3 1.3 2( )Production ............................................................ 1.2 1.8 1.8 2( )Transportation and material moving .................... 1.0 1.8 1.8 2( )
Full time ................................................................... 0.5 0.7 0.7 0.1Part time .................................................................. 0.4 0.8 0.8 0.4
Union ....................................................................... 0.9 1.3 1.2 0.5Nonunion ................................................................. 0.5 0.8 0.8 0.1
Average wage within the following categories3:Second 25 percent ............................................... 0.8 0.9 1.0 0.1Third 25 percent ................................................... 0.5 1.1 1.0 0.1Highest 25 percent ............................................... 0.8 1.3 1.3 0.2
Highest 10 percent ........................................... 0.7 1.9 1.9 0.4
Establishment characteristics
Goods-producing industries ..................................... 1.3 1.4 1.4 0.2Manufacturing ...................................................... 1.7 1.7 1.8 0.2
Service-providing industries ..................................... 0.5 0.8 0.8 0.1Trade, transportation, and utilities ....................... 0.6 1.0 0.9 2( )
Retail trade ...................................................... 1.1 0.7 0.8 2( )Financial activities ................................................ 0.5 1.6 1.6 0.3
Finance and insurance .................................... 0.6 1.8 1.8 0.4Credit intermediation and related activities .. 0.3 3.1 3.1 2( )Insurance carriers and related activities ...... 0.5 1.6 1.6 1.1
Professional and business services ..................... 0.7 2.7 2.6 2( )Education and health services ............................. 1.2 1.2 1.4 0.4
Educational services ........................................ 0.1 1.3 0.5 2( )Junior colleges, colleges, and universities ... 0.2 2.5 0.9 2( )
Health care and social assistance ................... 1.4 1.4 1.6 0.5
See footnotes at end of table.

Table 10. Standard errors for medical care benefits: Coverage for selectedservices,1 private industry workers, 2015—continued
CharacteristicsHospital
room andboard
Inpatientsurgery
Outpatientsurgery
Physicianoffice visit
1 to 99 workers ........................................................ 0.7 1.3 1.3 2( )50 to 99 workers .................................................. 1.7 3.1 3.0 2( )
100 workers or more ................................................ 0.6 0.7 0.7 0.2100 to 499 workers .............................................. 0.7 0.9 0.9 0.2500 workers or more ............................................ 0.7 1.2 1.3 0.3
Geographic areas
Northeast ................................................................. 0.4 1.4 1.3 0.3New England ....................................................... 0.9 1.0 1.0 2( )Middle Atlantic ..................................................... 0.4 1.9 1.7 0.4
South ....................................................................... 0.7 1.1 1.1 0.1South Atlantic ....................................................... 1.0 1.4 1.4 2( )East South Central ............................................... 3.0 3.6 3.6 0.2West South Central .............................................. 0.4 1.9 1.9 0.1
Midwest .................................................................... 1.3 1.1 1.0 2( )East North Central ............................................... 1.8 1.5 1.4 2( )West North Central .............................................. 1.4 1.5 1.3 2( )
West ......................................................................... 1.0 1.9 2.0 0.3Mountain .............................................................. 1.7 1.9 1.9 2( )Pacific .................................................................. 1.3 2.7 2.8 0.4
1 The remaining workers include both workers not receiving the benefit and workers for whom the availability of the benefitcould not be determined.
2 Less than 0.05.3 Surveyed occupations are classified into wage categories based on the average wage for the occupation, which may include
workers with earnings both above and below the threshold. The categories were formed using percentile estimates generated usingdata from the National Compensation Survey publication, "Employer Costs for Employee Compensation - March 2015."
Source: Bureau of Labor Statistics, National Compensation Survey.
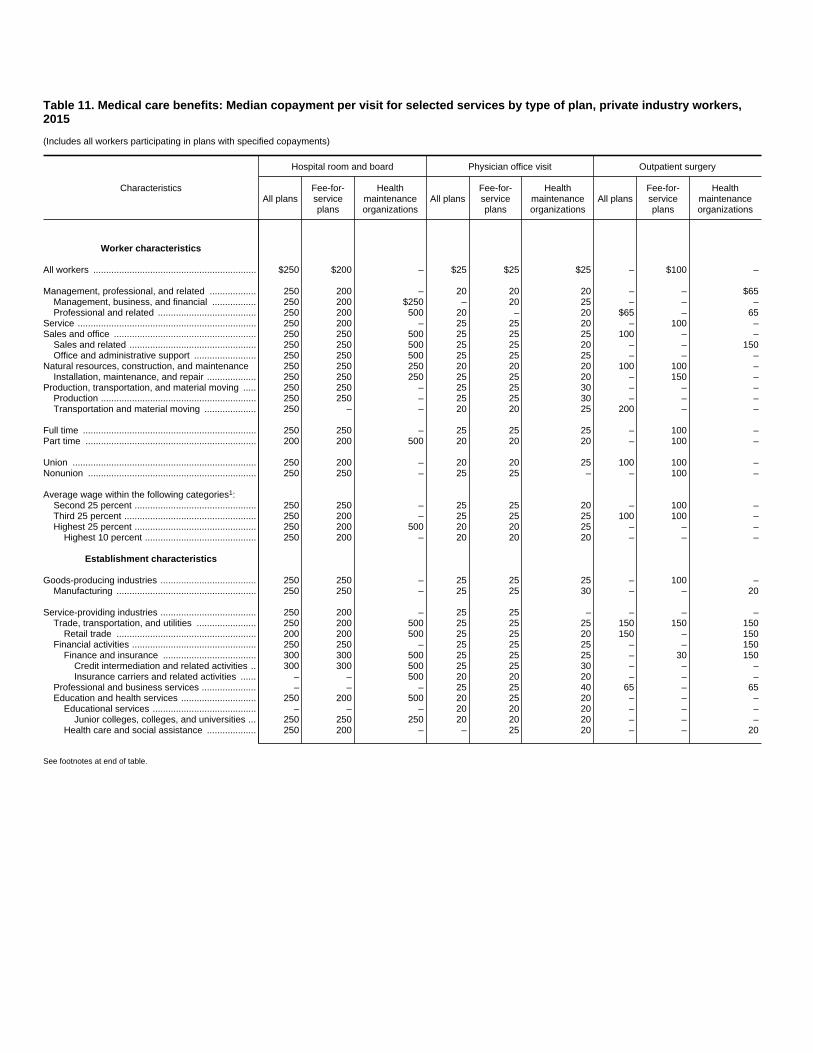
Table 11. Medical care benefits: Median copayment per visit for selected services by type of plan, private industry workers,2015
(Includes all workers participating in plans with specified copayments)
Characteristics
Hospital room and board Physician office visit Outpatient surgery
All plansFee-for-serviceplans
Healthmaintenanceorganizations
All plansFee-for-serviceplans
Healthmaintenanceorganizations
All plansFee-for-serviceplans
Healthmaintenanceorganizations
Worker characteristics
All workers ............................................................... $250 $200 – $25 $25 $25 – $100 –
Management, professional, and related .................. 250 200 – 20 20 20 – – $65Management, business, and financial ................. 250 200 $250 – 20 25 – – –Professional and related ...................................... 250 200 500 20 – 20 $65 – 65
Service ..................................................................... 250 200 – 25 25 20 – 100 –Sales and office ....................................................... 250 250 500 25 25 25 100 – –
Sales and related ................................................. 250 250 500 25 25 20 – – 150Office and administrative support ........................ 250 250 500 25 25 25 – – –
Natural resources, construction, and maintenance 250 250 250 20 20 20 100 100 –Installation, maintenance, and repair ................... 250 250 250 25 25 20 – 150 –
Production, transportation, and material moving ..... 250 250 – 25 25 30 – – –Production ............................................................ 250 250 – 25 25 30 – – –Transportation and material moving .................... 250 – – 20 20 25 200 – –
Full time ................................................................... 250 250 – 25 25 25 – 100 –Part time .................................................................. 200 200 500 20 20 20 – 100 –
Union ....................................................................... 250 200 – 20 20 25 100 100 –Nonunion ................................................................. 250 250 – 25 25 – – 100 –
Average wage within the following categories1:Second 25 percent ............................................... 250 250 – 25 25 20 – 100 –Third 25 percent ................................................... 250 200 – 25 25 25 100 100 –Highest 25 percent ............................................... 250 200 500 20 20 25 – – –
Highest 10 percent ........................................... 250 200 – 20 20 20 – – –
Establishment characteristics
Goods-producing industries ..................................... 250 250 – 25 25 25 – 100 –Manufacturing ...................................................... 250 250 – 25 25 30 – – 20
Service-providing industries ..................................... 250 200 – 25 25 – – – –Trade, transportation, and utilities ....................... 250 200 500 25 25 25 150 150 150
Retail trade ...................................................... 200 200 500 25 25 20 150 – 150Financial activities ................................................ 250 250 – 25 25 25 – – 150
Finance and insurance .................................... 300 300 500 25 25 25 – 30 150Credit intermediation and related activities .. 300 300 500 25 25 30 – – –Insurance carriers and related activities ...... – – 500 20 20 20 – – –
Professional and business services ..................... – – – 25 25 40 65 – 65Education and health services ............................. 250 200 500 20 25 20 – – –
Educational services ........................................ – – – 20 20 20 – – –Junior colleges, colleges, and universities ... 250 250 250 20 20 20 – – –
Health care and social assistance ................... 250 200 – – 25 20 – – 20
See footnotes at end of table.

Table 11. Medical care benefits: Median copayment per visit for selected services by type of plan, private industry workers,2015—continued
(Includes all workers participating in plans with specified copayments)
Characteristics
Hospital room and board Physician office visit Outpatient surgery
All plansFee-for-serviceplans
Healthmaintenanceorganizations
All plansFee-for-serviceplans
Healthmaintenanceorganizations
All plansFee-for-serviceplans
Healthmaintenanceorganizations
1 to 99 workers ........................................................ $250 $200 – $25 $25 $25 – – $6550 to 99 workers .................................................. 250 250 – 25 25 25 – – –
100 workers or more ................................................ 250 – – 20 20 – – – 100100 to 499 workers .............................................. 250 250 – 25 25 25 $100 – 100500 workers or more ............................................ 250 – – 20 20 20 50 – –
Geographic areas
Northeast ................................................................. 250 250 $500 20 20 25 100 – 125New England ....................................................... – 250 500 20 20 25 – – –Middle Atlantic ..................................................... 250 250 500 20 20 25 100 – 125
South ....................................................................... 250 250 – 25 25 25 100 $100 –South Atlantic ....................................................... 250 – – 25 25 20 – – 65East South Central ............................................... 250 250 – 25 25 25 – – –West South Central .............................................. 250 300 – 25 25 25 100 100 –
Midwest .................................................................... 250 250 500 25 25 30 – – –East North Central ............................................... 250 250 500 25 25 35 – – –West North Central .............................................. 250 250 – 25 25 – – – 150
West ......................................................................... 250 – – 20 20 20 20 – –Mountain .............................................................. – – – 25 25 20 – – –Pacific .................................................................. 250 200 – 20 20 20 20 20 –
1 Surveyed occupations are classified into wage categories based on the average wage for the occupation, which may include workers with earnings both above and below the threshold. Thecategories were formed using percentile estimates generated using data from the National Compensation Survey publication, "Employer Costs for Employee Compensation - March 2015."
Note: Dashes indicate that no data were reported or that data do not meet publication criteria. For definitions of major plans, key provisions, and related terms, see the "Glossary of Employee BenefitTerms" at www.bls.gov/ncs/ebs/glossary20152016.htm.
Source: Bureau of Labor Statistics, National Compensation Survey.

Table 11. Standard errors for medical care benefits: Median copayment per visit for selected services by type of plan, privateindustry workers, 2015
Characteristics
Hospital room and board Physician office visit Outpatient surgery
All plansFee-for-serviceplans
Healthmaintenanceorganizations
All plansFee-for-serviceplans
Healthmaintenanceorganizations
All plansFee-for-serviceplans
Healthmaintenanceorganizations
Worker characteristics
All workers ............................................................... $0 $53 – $1 $1 $5 – $19 –
Management, professional, and related .................. 0 0 – 5 6 6 – – $18Management, business, and financial ................. 55 16 $0 – 4 3 – – –Professional and related ...................................... 0 9 0 5 – 2 $19 – 15
Service ..................................................................... 18 33 – 4 2 5 – 16 –Sales and office ....................................................... 16 30 0 0 0 6 29 – –
Sales and related ................................................. 34 51 0 0 0 1 – – 36Office and administrative support ........................ 34 34 0 0 0 2 – – –
Natural resources, construction, and maintenance 13 13 30 4 5 5 20 0 –Installation, maintenance, and repair ................... 9 0 65 1 0 6 – 29 –
Production, transportation, and material moving ..... 0 13 – 0 2 5 – – –Production ............................................................ 0 0 – 1 0 2 – – –Transportation and material moving .................... 0 – – 0 0 4 59 – –
Full time ................................................................... 0 61 – 0 1 1 – 24 –Part time .................................................................. 9 0 129 0 3 1 – 0 –
Union ....................................................................... 54 52 – 0 0 6 16 25 –Nonunion ................................................................. 0 66 – 0 0 – – 25 –
Average wage within the following categories1:Second 25 percent ............................................... 0 0 – 0 0 6 – 22 –Third 25 percent ................................................... 0 56 – 0 0 0 5 20 –Highest 25 percent ............................................... 0 0 100 3 1 0 – – –
Highest 10 percent ........................................... 42 13 – 0 0 1 – – –
Establishment characteristics
Goods-producing industries ..................................... 0 0 – 0 0 1 – 28 –Manufacturing ...................................................... 0 0 – 0 0 4 – – 6
Service-providing industries ..................................... 0 0 – 3 2 – – – –Trade, transportation, and utilities ....................... 0 44 36 0 0 0 0 0 0
Retail trade ...................................................... 38 9 0 0 0 2 0 – 42Financial activities ................................................ 0 0 – 0 0 5 – – 30
Finance and insurance .................................... 53 55 65 1 3 0 – 7 16Credit intermediation and related activities .. 24 64 65 0 0 4 – – –Insurance carriers and related activities ...... – – 0 3 4 2 – – –
Professional and business services ..................... – – – 0 0 11 13 – 17Education and health services ............................. 0 39 133 5 6 0 – – –
Educational services ........................................ – – – 0 0 0 – – –Junior colleges, colleges, and universities ... 13 0 39 0 0 0 – – –
Health care and social assistance ................... 39 36 – – 5 0 – – 0
See footnotes at end of table.
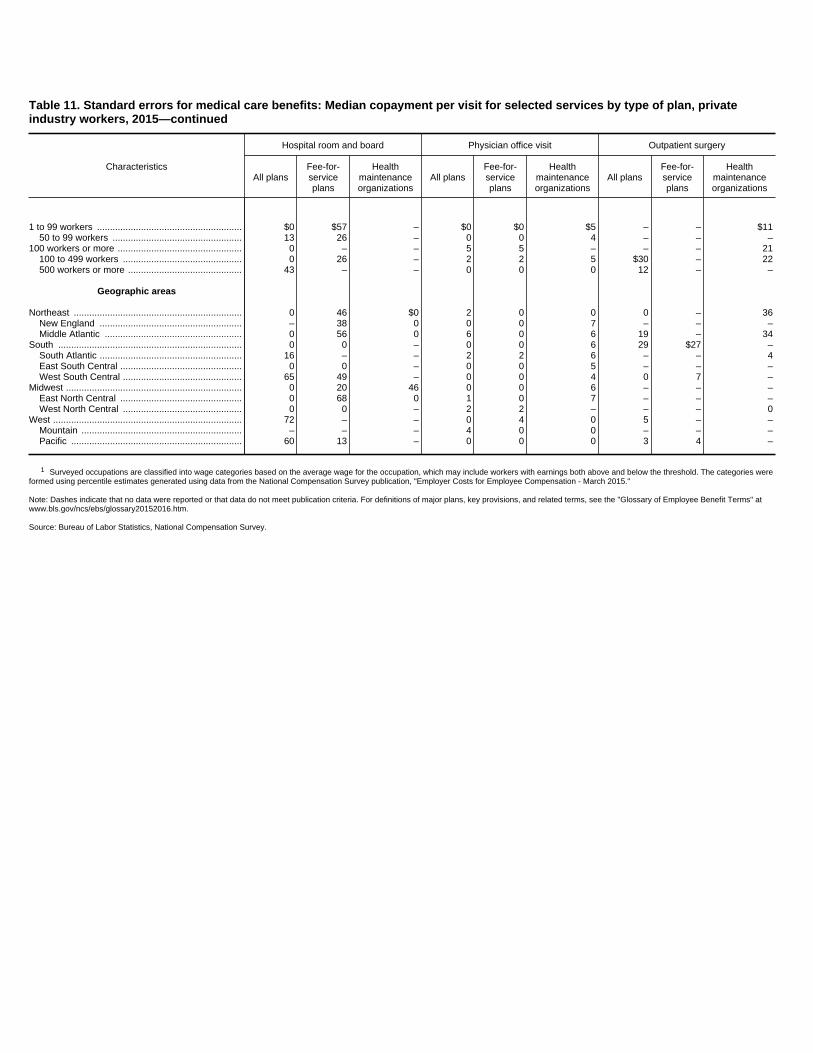
Table 11. Standard errors for medical care benefits: Median copayment per visit for selected services by type of plan, privateindustry workers, 2015—continued
Characteristics
Hospital room and board Physician office visit Outpatient surgery
All plansFee-for-serviceplans
Healthmaintenanceorganizations
All plansFee-for-serviceplans
Healthmaintenanceorganizations
All plansFee-for-serviceplans
Healthmaintenanceorganizations
1 to 99 workers ........................................................ $0 $57 – $0 $0 $5 – – $1150 to 99 workers .................................................. 13 26 – 0 0 4 – – –
100 workers or more ................................................ 0 – – 5 5 – – – 21100 to 499 workers .............................................. 0 26 – 2 2 5 $30 – 22500 workers or more ............................................ 43 – – 0 0 0 12 – –
Geographic areas
Northeast ................................................................. 0 46 $0 2 0 0 0 – 36New England ....................................................... – 38 0 0 0 7 – – –Middle Atlantic ..................................................... 0 56 0 6 0 6 19 – 34
South ....................................................................... 0 0 – 0 0 6 29 $27 –South Atlantic ....................................................... 16 – – 2 2 6 – – 4East South Central ............................................... 0 0 – 0 0 5 – – –West South Central .............................................. 65 49 – 0 0 4 0 7 –
Midwest .................................................................... 0 20 46 0 0 6 – – –East North Central ............................................... 0 68 0 1 0 7 – – –West North Central .............................................. 0 0 – 2 2 – – – 0
West ......................................................................... 72 – – 0 4 0 5 – –Mountain .............................................................. – – – 4 0 0 – – –Pacific .................................................................. 60 13 – 0 0 0 3 4 –
1 Surveyed occupations are classified into wage categories based on the average wage for the occupation, which may include workers with earnings both above and below the threshold. The categories wereformed using percentile estimates generated using data from the National Compensation Survey publication, "Employer Costs for Employee Compensation - March 2015."
Note: Dashes indicate that no data were reported or that data do not meet publication criteria. For definitions of major plans, key provisions, and related terms, see the "Glossary of Employee Benefit Terms" atwww.bls.gov/ncs/ebs/glossary20152016.htm.
Source: Bureau of Labor Statistics, National Compensation Survey.

Table 12. Hospital room and board benefits: Extent of coverage by type ofplan, private industry workers, 2015
(All workers participating in medical care plans = 100 percent)
Characteristics
All plans
Fullcoverage
Coveragewith limits1
Nocoverage
Notdeterminable
Worker characteristics
All workers ............................................................... 6 91 – –
Management, professional, and related .................. 8 89 – –Management, business, and financial ................. 4 92 – –Professional and related ...................................... 11 87 – 2
Service ..................................................................... – 83 – 5Sales and office ....................................................... 3 93 – –
Sales and related ................................................. – 95 – 4Office and administrative support ........................ 4 92 – –
Natural resources, construction, and maintenance – 95 – 1Installation, maintenance, and repair ................... – 95 – 2( )
Production, transportation, and material moving ..... 3 95 – –Production ............................................................ – 96 – 2Transportation and material moving .................... – 94 – 2
Full time ................................................................... 6 91 – –Part time .................................................................. – 90 – 1
Union ....................................................................... 10 88 – –Nonunion ................................................................. 6 91 – –
Average wage within the following categories3:Second 25 percent ............................................... 6 91 – –Third 25 percent ................................................... 5 93 – –Highest 25 percent ............................................... 8 89 – –
Highest 10 percent ........................................... 7 90 – –
Establishment characteristics
Goods-producing industries ..................................... 3 93 – 4Manufacturing ...................................................... – 92 – 5
Service-providing industries ..................................... 7 90 – –Trade, transportation, and utilities ....................... 2 96 – –
Retail trade ...................................................... – 95 – 2Financial activities ................................................ 4 94 – 2
Finance and insurance .................................... 4 94 – 2Credit intermediation and related activities .. – 96 – 1Insurance carriers and related activities ...... – 93 – 1
Professional and business services ..................... – 97 – 1Education and health services ............................. 19 77 – 4
Educational services ........................................ 6 93 – 2( )Junior colleges, colleges, and universities ... 9 91 – 1
Health care and social assistance ................... 21 74 – 5
See footnotes at end of table.

Table 12. Hospital room and board benefits: Extent of coverage by type of plan, private industry workers,2015—continued
(All workers participating in medical care plans = 100 percent)
Characteristics
Fee-for-service plan Health maintenance organization
Fullcoverage
Coveragewith limits1
Nocoverage
Notdeterminable
Fullcoverage
Coveragewith limits1
Nocoverage
Notdeterminable
Worker characteristics
All workers ............................................................... 5 93 – – 14 82 – 4
Management, professional, and related .................. 7 91 – – 15 80 – 5Management, business, and financial ................. – 94 – 3 10 81 – 9Professional and related ...................................... 9 89 – 3 19 79 – 2
Service ..................................................................... – 85 – 5 – 74 – 4Sales and office ....................................................... 2 95 – – – 81 – 7
Sales and related ................................................. – 97 – 2 – 78 – 13Office and administrative support ........................ 3 94 – – – 82 – 5
Natural resources, construction, and maintenance – 95 – 1 – 94 – 2( )Installation, maintenance, and repair ................... – 95 – 2( ) – 94 – 1
Production, transportation, and material moving ..... – 95 – 2 – 92 – 2( )Production ............................................................ – 96 – 2 – 96 – 2( )Transportation and material moving .................... – 95 – 2 – 87 – –
Full time ................................................................... 5 92 – – 12 83 – 4Part time .................................................................. 5 94 – 1 – 63 – 2( )
Union ....................................................................... 10 89 – – 14 81 – 5Nonunion ................................................................. 4 93 – – 14 82 – 4
Average wage within the following categories3:Second 25 percent ............................................... 4 93 – – – 82 – 2Third 25 percent ................................................... 4 93 – – 8 90 – 2Highest 25 percent ............................................... 6 91 – – 16 79 – 6
Highest 10 percent ........................................... 5 93 – – – 75 – 1
Establishment characteristics
Goods-producing industries ..................................... – 94 – 4 11 82 – 7Manufacturing ...................................................... – 94 – 4 – 82 – 10
Service-providing industries ..................................... 5 92 – – 15 82 – 3Trade, transportation, and utilities ....................... – 97 – 1 – 86 – 6
Retail trade ...................................................... – 97 – 1 – 81 – 12Financial activities ................................................ 3 95 – 2 – 90 – 4
Finance and insurance .................................... 3 95 – 2 – 90 – 2Credit intermediation and related activities .. – 97 – 1 – 93 – –Insurance carriers and related activities ...... – 93 – 1 – 84 – 1
Professional and business services ..................... – 98 – 1 – 93 – –Education and health services ............................. 17 80 – 3 26 68 – 6
Educational services ........................................ 4 96 – – – 89 – 1Junior colleges, colleges, and universities ... 7 93 – – 13 85 – 2
Health care and social assistance ................... 18 78 – 4 32 60 – 8
See footnotes at end of table.

Table 12. Hospital room and board benefits: Extent of coverage by type ofplan, private industry workers, 2015—continued
(All workers participating in medical care plans = 100 percent)
Characteristics
All plans
Fullcoverage
Coveragewith limits1
Nocoverage
Notdeterminable
1 to 99 workers ........................................................ 5 92 – 250 to 99 workers .................................................. – 94 – 2
100 workers or more ................................................ 7 90 – –100 to 499 workers .............................................. – 92 – 3500 workers or more ............................................ 10 86 – 4
Geographic areas
Northeast ................................................................. 10 88 – 2New England ....................................................... – 90 – 1Middle Atlantic ..................................................... 11 88 – 2
South ....................................................................... – 96 – 2South Atlantic ....................................................... 2 95 – 3East South Central ............................................... – 96 – 3West South Central .............................................. – 96 – 1
Midwest .................................................................... 4 91 – –East North Central ............................................... – 91 – 5West North Central .............................................. – 92 – 3
West ......................................................................... 11 85 – 3Mountain .............................................................. – 93 – 3Pacific .................................................................. 15 82 – 4
See footnotes at end of table.

Table 12. Hospital room and board benefits: Extent of coverage by type of plan, private industry workers,2015—continued
(All workers participating in medical care plans = 100 percent)
Characteristics
Fee-for-service plan Health maintenance organization
Fullcoverage
Coveragewith limits1
Nocoverage
Notdeterminable
Fullcoverage
Coveragewith limits1
Nocoverage
Notdeterminable
1 to 99 workers ........................................................ 4 95 – 2 13 82 – 550 to 99 workers .................................................. – 97 – 1 – 77 – 10
100 workers or more ................................................ 5 91 – – 15 82 – 4100 to 499 workers .............................................. 3 93 – – – 86 – 4500 workers or more ............................................ 8 87 – 4 23 75 – 2
Geographic areas
Northeast ................................................................. 10 88 – 2 – 90 – 1New England ....................................................... – 88 – 2 – 94 – –Middle Atlantic ..................................................... 11 88 – 2 – 87 – 2
South ....................................................................... – 97 – 2 3 89 – 8South Atlantic ....................................................... – 97 – 1 – 86 – 10East South Central ............................................... – 96 – 3 – 96 – 1West South Central .............................................. – 97 – 1 – 94 – 4
Midwest .................................................................... – 91 – 5 – 92 – 3East North Central ............................................... – 90 – 6 – 93 – 4West North Central .............................................. – 93 – 3 – 84 – –
West ......................................................................... 6 91 – 3 26 70 – 4Mountain .............................................................. – 93 – 3 – 90 – –Pacific .................................................................. – 89 – 3 30 65 – 5
1 Limits may be set in terms of dollar or day ceiling on benefits, a requirement that the participant pay a percentage of costs (coinsurance), or a requirement that the participant pay aspecific amount (deductible or copayment) before reimbursement begins or services are rendered.
2 Less than 0.5.3 Surveyed occupations are classified into wage categories based on the average wage for the occupation, which may include workers with earnings both above and below the threshold.
The categories were formed using percentile estimates generated using data from the National Compensation Survey publication, "Employer Costs for Employee Compensation - March2015."
Note: Because of rounding, sums of individual items may not equal totals. Dashes indicate that no data were reported or that data do not meet publication criteria. For definitions of majorplans, key provisions, and related terms, see the "Glossary of Employee Benefit Terms" at www.bls.gov/ncs/ebs/glossary20152016.htm.
Source: Bureau of Labor Statistics, National Compensation Survey.
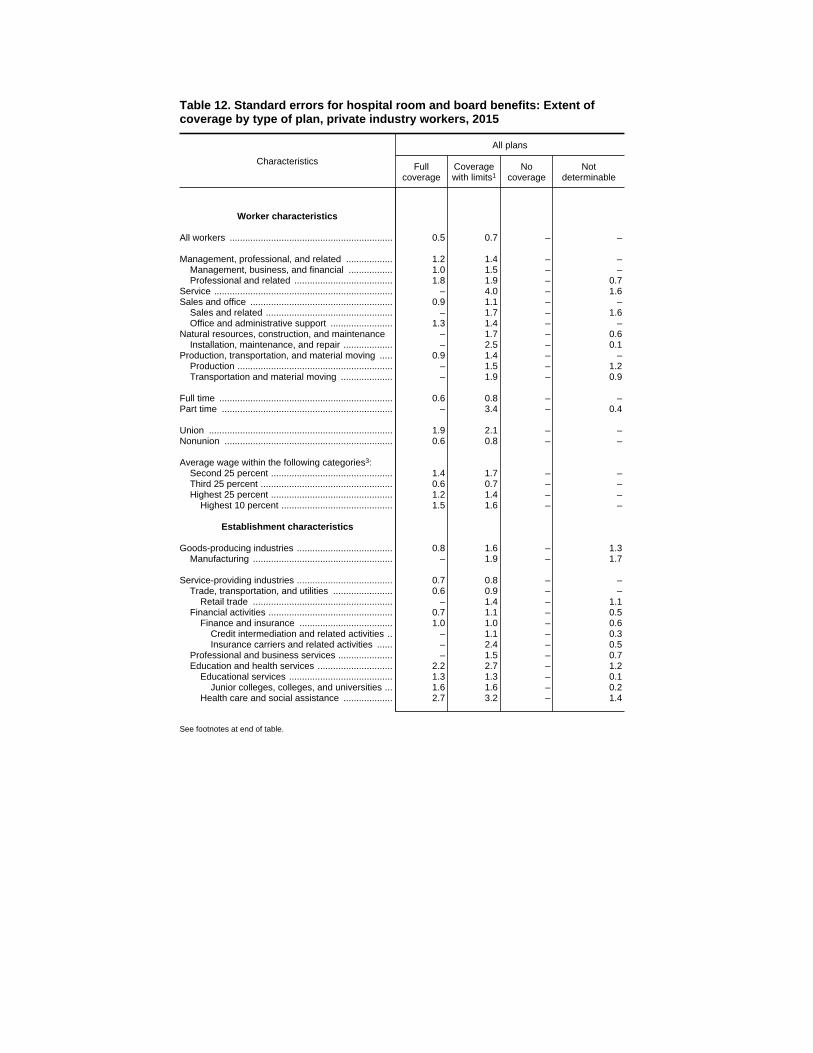
Table 12. Standard errors for hospital room and board benefits: Extent ofcoverage by type of plan, private industry workers, 2015
Characteristics
All plans
Fullcoverage
Coveragewith limits1
Nocoverage
Notdeterminable
Worker characteristics
All workers ............................................................... 0.5 0.7 – –
Management, professional, and related .................. 1.2 1.4 – –Management, business, and financial ................. 1.0 1.5 – –Professional and related ...................................... 1.8 1.9 – 0.7
Service ..................................................................... – 4.0 – 1.6Sales and office ....................................................... 0.9 1.1 – –
Sales and related ................................................. – 1.7 – 1.6Office and administrative support ........................ 1.3 1.4 – –
Natural resources, construction, and maintenance – 1.7 – 0.6Installation, maintenance, and repair ................... – 2.5 – 0.1
Production, transportation, and material moving ..... 0.9 1.4 – –Production ............................................................ – 1.5 – 1.2Transportation and material moving .................... – 1.9 – 0.9
Full time ................................................................... 0.6 0.8 – –Part time .................................................................. – 3.4 – 0.4
Union ....................................................................... 1.9 2.1 – –Nonunion ................................................................. 0.6 0.8 – –
Average wage within the following categories3:Second 25 percent ............................................... 1.4 1.7 – –Third 25 percent ................................................... 0.6 0.7 – –Highest 25 percent ............................................... 1.2 1.4 – –
Highest 10 percent ........................................... 1.5 1.6 – –
Establishment characteristics
Goods-producing industries ..................................... 0.8 1.6 – 1.3Manufacturing ...................................................... – 1.9 – 1.7
Service-providing industries ..................................... 0.7 0.8 – –Trade, transportation, and utilities ....................... 0.6 0.9 – –
Retail trade ...................................................... – 1.4 – 1.1Financial activities ................................................ 0.7 1.1 – 0.5
Finance and insurance .................................... 1.0 1.0 – 0.6Credit intermediation and related activities .. – 1.1 – 0.3Insurance carriers and related activities ...... – 2.4 – 0.5
Professional and business services ..................... – 1.5 – 0.7Education and health services ............................. 2.2 2.7 – 1.2
Educational services ........................................ 1.3 1.3 – 0.1Junior colleges, colleges, and universities ... 1.6 1.6 – 0.2
Health care and social assistance ................... 2.7 3.2 – 1.4
See footnotes at end of table.
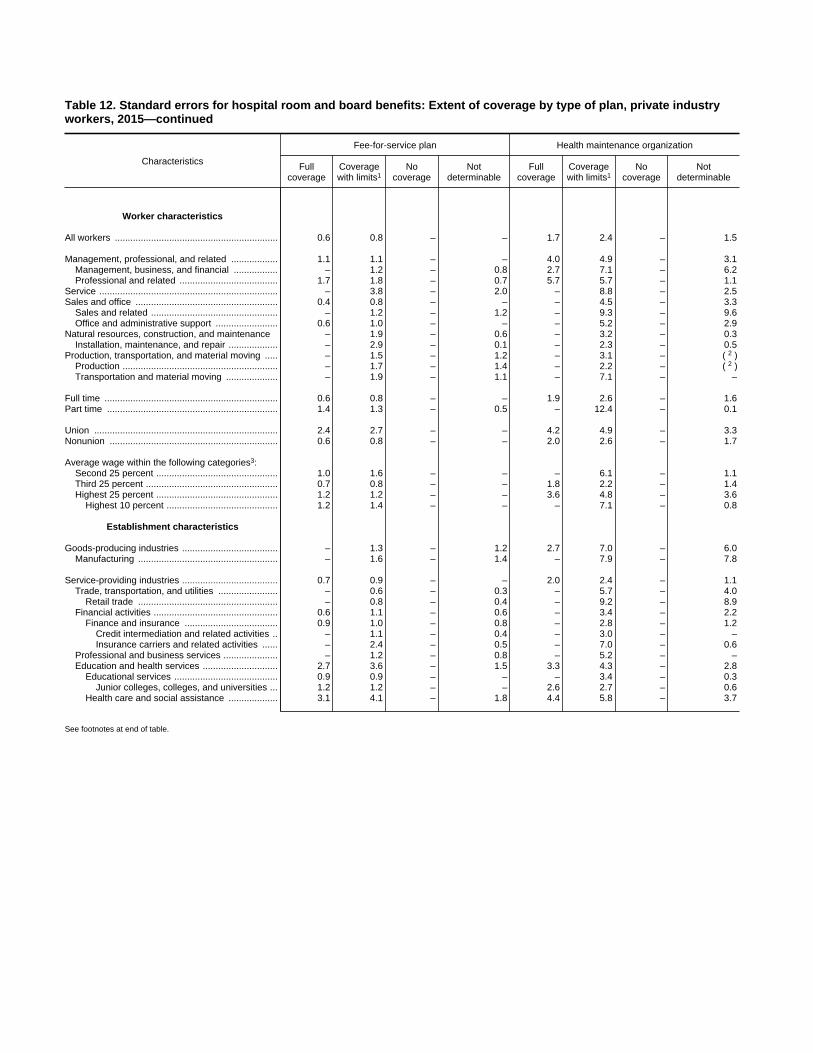
Table 12. Standard errors for hospital room and board benefits: Extent of coverage by type of plan, private industryworkers, 2015—continued
Characteristics
Fee-for-service plan Health maintenance organization
Fullcoverage
Coveragewith limits1
Nocoverage
Notdeterminable
Fullcoverage
Coveragewith limits1
Nocoverage
Notdeterminable
Worker characteristics
All workers ............................................................... 0.6 0.8 – – 1.7 2.4 – 1.5
Management, professional, and related .................. 1.1 1.1 – – 4.0 4.9 – 3.1Management, business, and financial ................. – 1.2 – 0.8 2.7 7.1 – 6.2Professional and related ...................................... 1.7 1.8 – 0.7 5.7 5.7 – 1.1
Service ..................................................................... – 3.8 – 2.0 – 8.8 – 2.5Sales and office ....................................................... 0.4 0.8 – – – 4.5 – 3.3
Sales and related ................................................. – 1.2 – 1.2 – 9.3 – 9.6Office and administrative support ........................ 0.6 1.0 – – – 5.2 – 2.9
Natural resources, construction, and maintenance – 1.9 – 0.6 – 3.2 – 0.3Installation, maintenance, and repair ................... – 2.9 – 0.1 – 2.3 – 0.5
Production, transportation, and material moving ..... – 1.5 – 1.2 – 3.1 – 2( )Production ............................................................ – 1.7 – 1.4 – 2.2 – 2( )Transportation and material moving .................... – 1.9 – 1.1 – 7.1 – –
Full time ................................................................... 0.6 0.8 – – 1.9 2.6 – 1.6Part time .................................................................. 1.4 1.3 – 0.5 – 12.4 – 0.1
Union ....................................................................... 2.4 2.7 – – 4.2 4.9 – 3.3Nonunion ................................................................. 0.6 0.8 – – 2.0 2.6 – 1.7
Average wage within the following categories3:Second 25 percent ............................................... 1.0 1.6 – – – 6.1 – 1.1Third 25 percent ................................................... 0.7 0.8 – – 1.8 2.2 – 1.4Highest 25 percent ............................................... 1.2 1.2 – – 3.6 4.8 – 3.6
Highest 10 percent ........................................... 1.2 1.4 – – – 7.1 – 0.8
Establishment characteristics
Goods-producing industries ..................................... – 1.3 – 1.2 2.7 7.0 – 6.0Manufacturing ...................................................... – 1.6 – 1.4 – 7.9 – 7.8
Service-providing industries ..................................... 0.7 0.9 – – 2.0 2.4 – 1.1Trade, transportation, and utilities ....................... – 0.6 – 0.3 – 5.7 – 4.0
Retail trade ...................................................... – 0.8 – 0.4 – 9.2 – 8.9Financial activities ................................................ 0.6 1.1 – 0.6 – 3.4 – 2.2
Finance and insurance .................................... 0.9 1.0 – 0.8 – 2.8 – 1.2Credit intermediation and related activities .. – 1.1 – 0.4 – 3.0 – –Insurance carriers and related activities ...... – 2.4 – 0.5 – 7.0 – 0.6
Professional and business services ..................... – 1.2 – 0.8 – 5.2 – –Education and health services ............................. 2.7 3.6 – 1.5 3.3 4.3 – 2.8
Educational services ........................................ 0.9 0.9 – – – 3.4 – 0.3Junior colleges, colleges, and universities ... 1.2 1.2 – – 2.6 2.7 – 0.6
Health care and social assistance ................... 3.1 4.1 – 1.8 4.4 5.8 – 3.7
See footnotes at end of table.

Table 12. Standard errors for hospital room and board benefits: Extent ofcoverage by type of plan, private industry workers, 2015—continued
Characteristics
All plans
Fullcoverage
Coveragewith limits1
Nocoverage
Notdeterminable
1 to 99 workers ........................................................ 1.1 1.3 – 0.750 to 99 workers .................................................. – 2.2 – 1.7
100 workers or more ................................................ 1.0 1.1 – –100 to 499 workers .............................................. – 1.5 – 0.7500 workers or more ............................................ 1.6 1.7 – 0.7
Geographic areas
Northeast ................................................................. 1.2 1.1 – 0.4New England ....................................................... – 3.0 – 0.9Middle Atlantic ..................................................... 1.2 1.2 – 0.4
South ....................................................................... – 0.8 – 0.7South Atlantic ....................................................... 0.6 0.9 – 1.0East South Central ............................................... – 3.0 – 3.0West South Central .............................................. – 1.3 – 0.5
Midwest .................................................................... 1.2 1.7 – –East North Central ............................................... – 2.3 – 1.8West North Central .............................................. – 2.2 – 1.4
West ......................................................................... 1.6 2.1 – 1.0Mountain .............................................................. – 2.9 – 1.7Pacific .................................................................. 1.9 2.5 – 1.3
See footnotes at end of table.
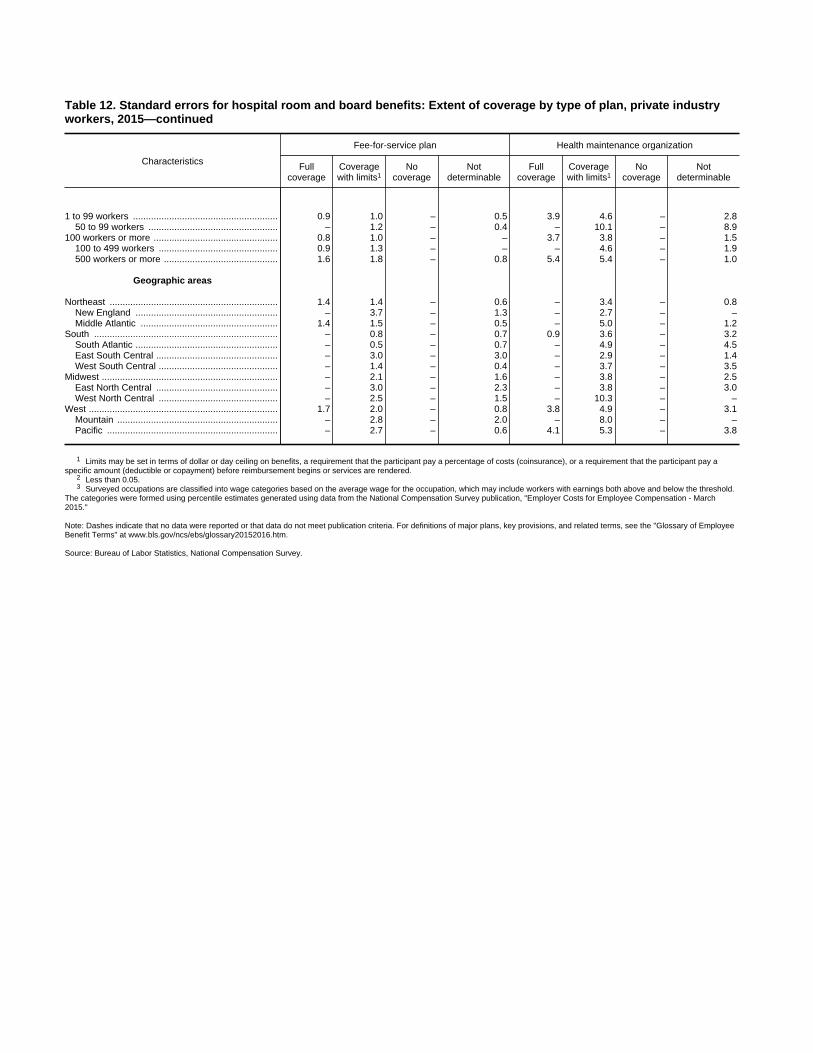
Table 12. Standard errors for hospital room and board benefits: Extent of coverage by type of plan, private industryworkers, 2015—continued
Characteristics
Fee-for-service plan Health maintenance organization
Fullcoverage
Coveragewith limits1
Nocoverage
Notdeterminable
Fullcoverage
Coveragewith limits1
Nocoverage
Notdeterminable
1 to 99 workers ........................................................ 0.9 1.0 – 0.5 3.9 4.6 – 2.850 to 99 workers .................................................. – 1.2 – 0.4 – 10.1 – 8.9
100 workers or more ................................................ 0.8 1.0 – – 3.7 3.8 – 1.5100 to 499 workers .............................................. 0.9 1.3 – – – 4.6 – 1.9500 workers or more ............................................ 1.6 1.8 – 0.8 5.4 5.4 – 1.0
Geographic areas
Northeast ................................................................. 1.4 1.4 – 0.6 – 3.4 – 0.8New England ....................................................... – 3.7 – 1.3 – 2.7 – –Middle Atlantic ..................................................... 1.4 1.5 – 0.5 – 5.0 – 1.2
South ....................................................................... – 0.8 – 0.7 0.9 3.6 – 3.2South Atlantic ....................................................... – 0.5 – 0.7 – 4.9 – 4.5East South Central ............................................... – 3.0 – 3.0 – 2.9 – 1.4West South Central .............................................. – 1.4 – 0.4 – 3.7 – 3.5
Midwest .................................................................... – 2.1 – 1.6 – 3.8 – 2.5East North Central ............................................... – 3.0 – 2.3 – 3.8 – 3.0West North Central .............................................. – 2.5 – 1.5 – 10.3 – –
West ......................................................................... 1.7 2.0 – 0.8 3.8 4.9 – 3.1Mountain .............................................................. – 2.8 – 2.0 – 8.0 – –Pacific .................................................................. – 2.7 – 0.6 4.1 5.3 – 3.8
1 Limits may be set in terms of dollar or day ceiling on benefits, a requirement that the participant pay a percentage of costs (coinsurance), or a requirement that the participant pay aspecific amount (deductible or copayment) before reimbursement begins or services are rendered.
2 Less than 0.05.3 Surveyed occupations are classified into wage categories based on the average wage for the occupation, which may include workers with earnings both above and below the threshold.
The categories were formed using percentile estimates generated using data from the National Compensation Survey publication, "Employer Costs for Employee Compensation - March2015."
Note: Dashes indicate that no data were reported or that data do not meet publication criteria. For definitions of major plans, key provisions, and related terms, see the "Glossary of EmployeeBenefit Terms" at www.bls.gov/ncs/ebs/glossary20152016.htm.
Source: Bureau of Labor Statistics, National Compensation Survey.
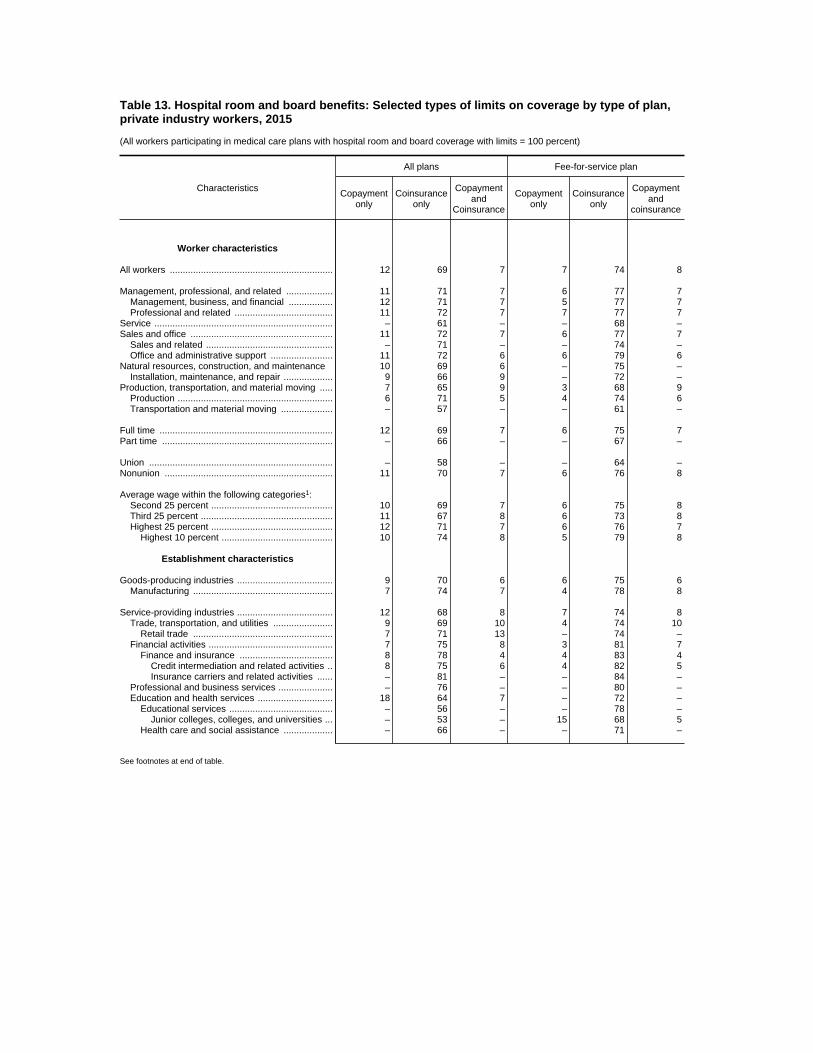
Table 13. Hospital room and board benefits: Selected types of limits on coverage by type of plan,private industry workers, 2015
(All workers participating in medical care plans with hospital room and board coverage with limits = 100 percent)
Characteristics
All plans Fee-for-service plan
Copaymentonly
Coinsuranceonly
Copaymentand
Coinsurance
Copaymentonly
Coinsuranceonly
Copaymentand
coinsurance
Worker characteristics
All workers ............................................................... 12 69 7 7 74 8
Management, professional, and related .................. 11 71 7 6 77 7Management, business, and financial ................. 12 71 7 5 77 7Professional and related ...................................... 11 72 7 7 77 7
Service ..................................................................... – 61 – – 68 –Sales and office ....................................................... 11 72 7 6 77 7
Sales and related ................................................. – 71 – – 74 –Office and administrative support ........................ 11 72 6 6 79 6
Natural resources, construction, and maintenance 10 69 6 – 75 –Installation, maintenance, and repair ................... 9 66 9 – 72 –
Production, transportation, and material moving ..... 7 65 9 3 68 9Production ............................................................ 6 71 5 4 74 6Transportation and material moving .................... – 57 – – 61 –
Full time ................................................................... 12 69 7 6 75 7Part time .................................................................. – 66 – – 67 –
Union ....................................................................... – 58 – – 64 –Nonunion ................................................................. 11 70 7 6 76 8
Average wage within the following categories1:Second 25 percent ............................................... 10 69 7 6 75 8Third 25 percent ................................................... 11 67 8 6 73 8Highest 25 percent ............................................... 12 71 7 6 76 7
Highest 10 percent ........................................... 10 74 8 5 79 8
Establishment characteristics
Goods-producing industries ..................................... 9 70 6 6 75 6Manufacturing ...................................................... 7 74 7 4 78 8
Service-providing industries ..................................... 12 68 8 7 74 8Trade, transportation, and utilities ....................... 9 69 10 4 74 10
Retail trade ...................................................... 7 71 13 – 74 –Financial activities ................................................ 7 75 8 3 81 7
Finance and insurance .................................... 8 78 4 4 83 4Credit intermediation and related activities .. 8 75 6 4 82 5Insurance carriers and related activities ...... – 81 – – 84 –
Professional and business services ..................... – 76 – – 80 –Education and health services ............................. 18 64 7 – 72 –
Educational services ........................................ – 56 – – 78 –Junior colleges, colleges, and universities ... – 53 – 15 68 5
Health care and social assistance ................... – 66 – – 71 –
See footnotes at end of table.

Table 13. Hospital room and board benefits: Selected types of limitson coverage by type of plan, private industry workers,2015—continued
(All workers participating in medical care plans with hospital room and board coverage withlimits = 100 percent)
Characteristics
Health maintenance organization
Copaymentonly
Coinsuranceonly
Copaymentand
coinsurance
Worker characteristics
All workers ............................................................... 39 37 6
Management, professional, and related .................. – 41 –Management, business, and financial ................. 44 – –Professional and related ...................................... – 43 –
Service ..................................................................... 54 – –Sales and office ....................................................... 41 35 4
Sales and related ................................................. 49 – –Office and administrative support ........................ 39 – –
Natural resources, construction, and maintenance 28 – –Installation, maintenance, and repair ................... – – –
Production, transportation, and material moving ..... – 42 –Production ............................................................ – 55 –Transportation and material moving .................... 53 – –
Full time ................................................................... 40 36 6Part time .................................................................. – 54 –
Union ....................................................................... 58 – –Nonunion ................................................................. 37 38 6
Average wage within the following categories1:Second 25 percent ............................................... – 36 –Third 25 percent ................................................... 37 – –Highest 25 percent ............................................... 43 39 6
Highest 10 percent ........................................... 48 – –
Establishment characteristics
Goods-producing industries ..................................... – 41 –Manufacturing ...................................................... – 48 –
Service-providing industries ..................................... 43 36 6Trade, transportation, and utilities ....................... 53 – –
Retail trade ...................................................... 51 – –Financial activities ................................................ 37 – –
Finance and insurance .................................... 42 – –Credit intermediation and related activities .. – 35 –Insurance carriers and related activities ...... 52 43 –
Professional and business services ..................... – – –Education and health services ............................. 38 – –
Educational services ........................................ 61 – –Junior colleges, colleges, and universities ... 66 – –
Health care and social assistance ................... – 42 –
See footnotes at end of table.

Table 13. Hospital room and board benefits: Selected types of limits on coverage by type of plan,private industry workers, 2015—continued
(All workers participating in medical care plans with hospital room and board coverage with limits = 100 percent)
Characteristics
All plans Fee-for-service plan
Copaymentonly
Coinsuranceonly
Copaymentand
Coinsurance
Copaymentonly
Coinsuranceonly
Copaymentand
coinsurance
1 to 99 workers ........................................................ 11 69 6 6 74 650 to 99 workers .................................................. 10 70 8 – 76 –
100 workers or more ................................................ 12 69 9 7 75 9100 to 499 workers .............................................. 13 67 9 8 72 9500 workers or more ............................................ 12 72 8 – 78 –
Geographic areas
Northeast ................................................................. 19 60 6 11 71 7New England ....................................................... – 49 – – 65 –Middle Atlantic ..................................................... 17 63 6 10 73 6
South ....................................................................... 12 68 7 9 72 7South Atlantic ....................................................... 15 65 7 11 71 6East South Central ............................................... – 64 – – 64 –West South Central .............................................. – 73 – – 77 –
Midwest .................................................................... 6 74 7 – 77 –East North Central ............................................... 8 75 8 – 77 –West North Central .............................................. – 72 – – 75 –
West ......................................................................... 11 72 9 – 79 –Mountain .............................................................. – 71 – – 73 –Pacific .................................................................. 12 73 7 – 83 –
See footnotes at end of table.
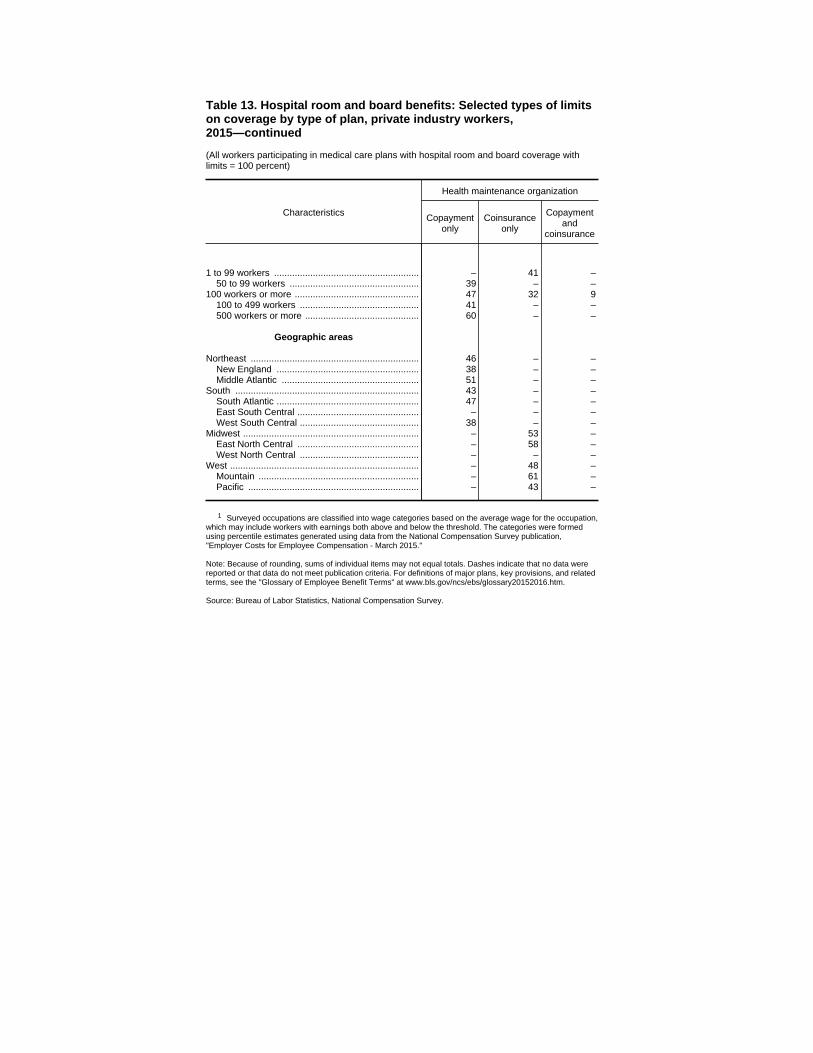
Table 13. Hospital room and board benefits: Selected types of limitson coverage by type of plan, private industry workers,2015—continued
(All workers participating in medical care plans with hospital room and board coverage withlimits = 100 percent)
Characteristics
Health maintenance organization
Copaymentonly
Coinsuranceonly
Copaymentand
coinsurance
1 to 99 workers ........................................................ – 41 –50 to 99 workers .................................................. 39 – –
100 workers or more ................................................ 47 32 9100 to 499 workers .............................................. 41 – –500 workers or more ............................................ 60 – –
Geographic areas
Northeast ................................................................. 46 – –New England ....................................................... 38 – –Middle Atlantic ..................................................... 51 – –
South ....................................................................... 43 – –South Atlantic ....................................................... 47 – –East South Central ............................................... – – –West South Central .............................................. 38 – –
Midwest .................................................................... – 53 –East North Central ............................................... – 58 –West North Central .............................................. – – –
West ......................................................................... – 48 –Mountain .............................................................. – 61 –Pacific .................................................................. – 43 –
1 Surveyed occupations are classified into wage categories based on the average wage for the occupation,which may include workers with earnings both above and below the threshold. The categories were formedusing percentile estimates generated using data from the National Compensation Survey publication,"Employer Costs for Employee Compensation - March 2015."
Note: Because of rounding, sums of individual items may not equal totals. Dashes indicate that no data werereported or that data do not meet publication criteria. For definitions of major plans, key provisions, and relatedterms, see the "Glossary of Employee Benefit Terms" at www.bls.gov/ncs/ebs/glossary20152016.htm.
Source: Bureau of Labor Statistics, National Compensation Survey.

Table 13. Standard errors for hospital room and board benefits: Selected types of limits oncoverage by type of plan, private industry workers, 2015
Characteristics
All plans Fee-for-service plan
Copaymentonly
Coinsuranceonly
Copaymentand
Coinsurance
Copaymentonly
Coinsuranceonly
Copaymentand
coinsurance
Worker characteristics
All workers ............................................................... 0.8 1.0 0.7 0.9 1.1 0.8
Management, professional, and related .................. 1.1 1.7 1.2 1.1 1.9 1.3Management, business, and financial ................. 1.3 1.7 1.0 1.2 1.9 1.2Professional and related ...................................... 1.7 2.5 1.8 1.5 2.8 2.1
Service ..................................................................... – 3.7 – – 3.7 –Sales and office ....................................................... 1.0 1.6 1.4 1.0 1.8 1.6
Sales and related ................................................. – 3.2 – – 3.5 –Office and administrative support ........................ 1.4 1.9 1.0 1.3 2.1 1.2
Natural resources, construction, and maintenance 2.9 4.0 0.8 – 4.6 –Installation, maintenance, and repair ................... 2.3 4.4 1.7 – 4.6 –
Production, transportation, and material moving ..... 1.3 2.7 1.6 0.7 2.8 1.6Production ............................................................ 1.2 2.3 1.5 0.8 2.5 1.7Transportation and material moving .................... – 4.9 – – 5.0 –
Full time ................................................................... 0.8 1.1 0.6 0.8 1.2 0.7Part time .................................................................. – 4.3 – – 4.5 –
Union ....................................................................... – 4.4 – – 5.1 –Nonunion ................................................................. 0.8 1.0 0.7 0.8 1.1 0.8
Average wage within the following categories1:Second 25 percent ............................................... 1.5 2.1 1.0 1.8 2.2 1.2Third 25 percent ................................................... 1.1 1.8 0.9 1.0 1.8 1.0Highest 25 percent ............................................... 1.1 1.7 1.1 1.0 1.9 1.3
Highest 10 percent ........................................... 1.4 2.4 1.9 1.2 2.5 2.2
Establishment characteristics
Goods-producing industries ..................................... 1.6 2.3 1.1 1.8 2.6 1.3Manufacturing ...................................................... 1.2 2.3 1.5 1.0 2.2 1.6
Service-providing industries ..................................... 0.9 1.1 0.8 1.0 1.2 1.0Trade, transportation, and utilities ....................... 0.9 2.2 1.6 1.0 2.2 1.5
Retail trade ...................................................... 1.2 1.9 2.3 – 1.8 –Financial activities ................................................ 1.0 1.9 1.4 0.7 1.9 1.2
Finance and insurance .................................... 1.3 1.8 0.8 0.8 1.6 0.8Credit intermediation and related activities .. 1.7 2.6 1.3 1.0 2.3 1.3Insurance carriers and related activities ...... – 3.1 – – 3.2 –
Professional and business services ..................... – 3.1 – – 2.7 –Education and health services ............................. 2.8 3.7 2.0 – 4.6 –
Educational services ........................................ – 5.0 – – 3.3 –Junior colleges, colleges, and universities ... – 3.4 – 3.6 4.8 1.2
Health care and social assistance ................... – 4.4 – – 5.5 –
See footnotes at end of table.

Table 13. Standard errors for hospital room and board benefits:Selected types of limits on coverage by type of plan, private industryworkers, 2015—continued
Characteristics
Health maintenance organization
Copaymentonly
Coinsuranceonly
Copaymentand
coinsurance
Worker characteristics
All workers ............................................................... 2.9 3.3 1.3
Management, professional, and related .................. – 5.4 –Management, business, and financial ................. 7.6 – –Professional and related ...................................... – 6.7 –
Service ..................................................................... 11.7 – –Sales and office ....................................................... 4.5 5.8 1.3
Sales and related ................................................. 9.8 – –Office and administrative support ........................ 5.4 – –
Natural resources, construction, and maintenance 6.9 – –Installation, maintenance, and repair ................... – – –
Production, transportation, and material moving ..... – 7.2 –Production ............................................................ – 8.7 –Transportation and material moving .................... 13.9 – –
Full time ................................................................... 2.9 3.3 1.3Part time .................................................................. – 14.7 –
Union ....................................................................... 8.3 – –Nonunion ................................................................. 3.1 3.6 1.4
Average wage within the following categories1:Second 25 percent ............................................... – 6.8 –Third 25 percent ................................................... 4.5 – –Highest 25 percent ............................................... 4.2 5.4 1.5
Highest 10 percent ........................................... 6.2 – –
Establishment characteristics
Goods-producing industries ..................................... – 6.2 –Manufacturing ...................................................... – 6.9 –
Service-providing industries ..................................... 3.4 3.8 1.5Trade, transportation, and utilities ....................... 3.9 – –
Retail trade ...................................................... 7.3 – –Financial activities ................................................ 6.6 – –
Finance and insurance .................................... 6.9 – –Credit intermediation and related activities .. – 7.5 –Insurance carriers and related activities ...... 8.9 9.4 –
Professional and business services ..................... – – –Education and health services ............................. 5.1 – –
Educational services ........................................ 7.1 – –Junior colleges, colleges, and universities ... 5.8 – –
Health care and social assistance ................... – 7.5 –
See footnotes at end of table.
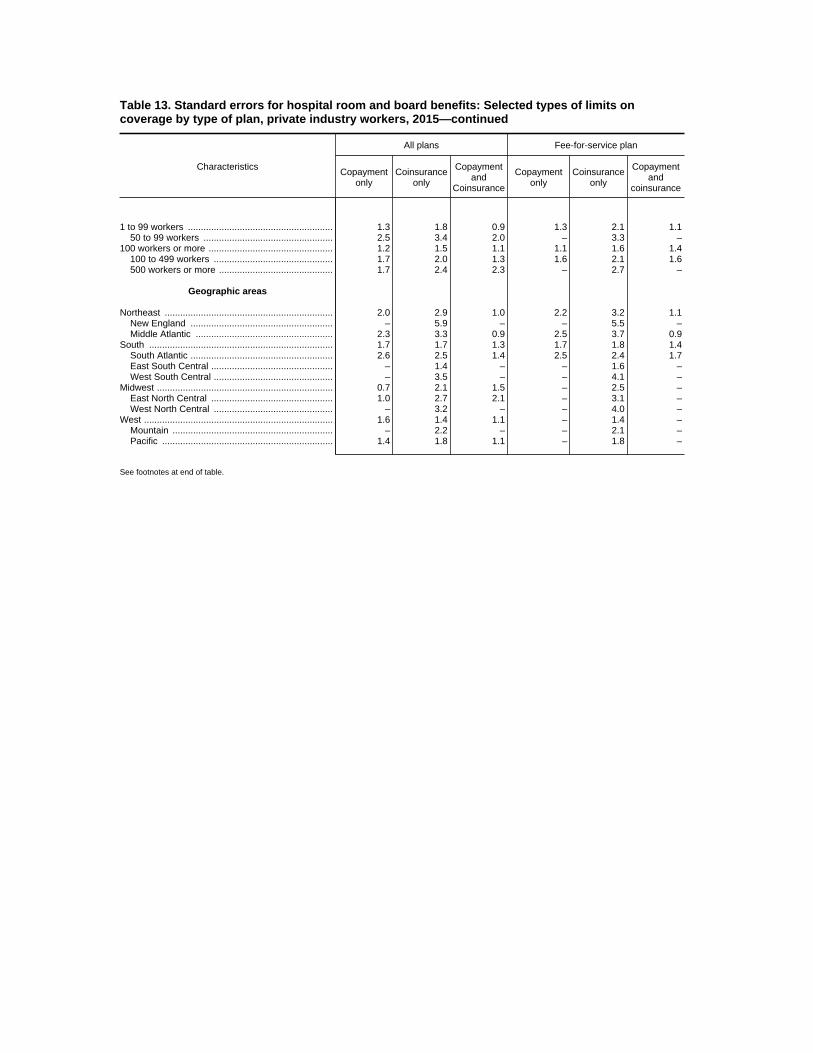
Table 13. Standard errors for hospital room and board benefits: Selected types of limits oncoverage by type of plan, private industry workers, 2015—continued
Characteristics
All plans Fee-for-service plan
Copaymentonly
Coinsuranceonly
Copaymentand
Coinsurance
Copaymentonly
Coinsuranceonly
Copaymentand
coinsurance
1 to 99 workers ........................................................ 1.3 1.8 0.9 1.3 2.1 1.150 to 99 workers .................................................. 2.5 3.4 2.0 – 3.3 –
100 workers or more ................................................ 1.2 1.5 1.1 1.1 1.6 1.4100 to 499 workers .............................................. 1.7 2.0 1.3 1.6 2.1 1.6500 workers or more ............................................ 1.7 2.4 2.3 – 2.7 –
Geographic areas
Northeast ................................................................. 2.0 2.9 1.0 2.2 3.2 1.1New England ....................................................... – 5.9 – – 5.5 –Middle Atlantic ..................................................... 2.3 3.3 0.9 2.5 3.7 0.9
South ....................................................................... 1.7 1.7 1.3 1.7 1.8 1.4South Atlantic ....................................................... 2.6 2.5 1.4 2.5 2.4 1.7East South Central ............................................... – 1.4 – – 1.6 –West South Central .............................................. – 3.5 – – 4.1 –
Midwest .................................................................... 0.7 2.1 1.5 – 2.5 –East North Central ............................................... 1.0 2.7 2.1 – 3.1 –West North Central .............................................. – 3.2 – – 4.0 –
West ......................................................................... 1.6 1.4 1.1 – 1.4 –Mountain .............................................................. – 2.2 – – 2.1 –Pacific .................................................................. 1.4 1.8 1.1 – 1.8 –
See footnotes at end of table.

Table 13. Standard errors for hospital room and board benefits:Selected types of limits on coverage by type of plan, private industryworkers, 2015—continued
Characteristics
Health maintenance organization
Copaymentonly
Coinsuranceonly
Copaymentand
coinsurance
1 to 99 workers ........................................................ – 5.6 –50 to 99 workers .................................................. 11.5 – –
100 workers or more ................................................ 4.7 4.5 2.4100 to 499 workers .............................................. 5.9 – –500 workers or more ............................................ 7.1 – –
Geographic areas
Northeast ................................................................. 5.3 – –New England ....................................................... 6.0 – –Middle Atlantic ..................................................... 7.3 – –
South ....................................................................... 6.0 – –South Atlantic ....................................................... 8.4 – –East South Central ............................................... – – –West South Central .............................................. 7.6 – –
Midwest .................................................................... – 10.2 –East North Central ............................................... – 10.6 –West North Central .............................................. – – –
West ......................................................................... – 5.1 –Mountain .............................................................. – 5.2 –Pacific .................................................................. – 6.5 –
1 Surveyed occupations are classified into wage categories based on the average wage for the occupation,which may include workers with earnings both above and below the threshold. The categories were formedusing percentile estimates generated using data from the National Compensation Survey publication,"Employer Costs for Employee Compensation - March 2015."
Note: Dashes indicate that no data were reported or that data do not meet publication criteria. For definitions ofmajor plans, key provisions, and related terms, see the "Glossary of Employee Benefit Terms" atwww.bls.gov/ncs/ebs/glossary20152016.htm.
Source: Bureau of Labor Statistics, National Compensation Survey.

Table 14. Inpatient surgery benefits: Extent of coverage by type of plan,private industry workers, 2015
(All workers participating in medical care plans = 100 percent)
Characteristics
All plans
Fullcoverage
Coveragewith limits1
Nocoverage
Notdeterminable
Worker characteristics
All workers ............................................................... 10 83 – –
Management, professional, and related .................. 11 82 – –Management, business, and financial ................. 9 84 – –Professional and related ...................................... 12 81 – 7
Service ..................................................................... 21 72 – 6Sales and office ....................................................... 6 85 – –
Sales and related ................................................. 5 89 – –Office and administrative support ........................ 6 84 – –
Natural resources, construction, and maintenance – 84 – 6Installation, maintenance, and repair ................... – 83 – 8
Production, transportation, and material moving ..... 6 88 – –Production ............................................................ 5 89 – 6Transportation and material moving .................... – 88 – 5
Full time ................................................................... 10 83 – –Part time .................................................................. 11 86 – 3
Union ....................................................................... 21 75 – –Nonunion ................................................................. 8 84 – –
Average wage within the following categories2:Second 25 percent ............................................... 10 84 – –Third 25 percent ................................................... 8 83 – –Highest 25 percent ............................................... 10 82 – –
Highest 10 percent ........................................... 9 85 – –
Establishment characteristics
Goods-producing industries ..................................... 7 83 – 10Manufacturing ...................................................... 5 85 – 10
Service-providing industries ..................................... 11 83 – –Trade, transportation, and utilities ....................... 4 90 – –
Retail trade ...................................................... – 92 – 4Financial activities ................................................ 6 84 – 10
Finance and insurance .................................... 6 81 – 13Credit intermediation and related activities .. 5 79 – 16Insurance carriers and related activities ...... 8 88 – 4
Professional and business services ..................... 7 88 – 5Education and health services ............................. 22 72 – 6
Educational services ........................................ 14 84 – 2Junior colleges, colleges, and universities ... 16 80 – 4
Health care and social assistance ................... 23 70 – 7
See footnotes at end of table.

Table 14. Inpatient surgery benefits: Extent of coverage by type of plan, private industry workers, 2015—continued
(All workers participating in medical care plans = 100 percent)
Characteristics
Fee-for-service plan Health maintenance organization
Fullcoverage
Coveragewith limits1
Nocoverage
Notdeterminable
Fullcoverage
Coveragewith limits1
Nocoverage
Notdeterminable
Worker characteristics
All workers ............................................................... 7 87 – – 27 64 – 8
Management, professional, and related .................. 8 85 – – 24 66 – 9Management, business, and financial ................. 5 88 – – 28 63 – 9Professional and related ...................................... 10 83 – 7 22 69 – 9
Service ..................................................................... 14 80 – 6 47 45 – 8Sales and office ....................................................... 3 89 – – 23 65 – 11
Sales and related ................................................. – 94 – 4 29 54 – 17Office and administrative support ........................ 3 86 – – 22 69 – 9
Natural resources, construction, and maintenance – 86 – 7 – 70 – 3Installation, maintenance, and repair ................... – 86 – 9 – 55 – 5
Production, transportation, and material moving ..... 4 90 – – – 76 – 4Production ............................................................ 5 88 – 7 – 91 – –Transportation and material moving .................... – 92 – 4 – 55 – 9
Full time ................................................................... 7 86 – – 26 65 – 9Part time .................................................................. 6 91 – 2 41 55 – 4
Union ....................................................................... 16 81 – – 48 42 – 10Nonunion ................................................................. 5 88 – – 24 68 – 8
Average wage within the following categories2:Second 25 percent ............................................... 7 87 – – 29 67 – 4Third 25 percent ................................................... 6 86 – – 21 69 – 10Highest 25 percent ............................................... 8 86 – – 25 64 – 11
Highest 10 percent ........................................... 5 89 – – 30 60 – 9
Establishment characteristics
Goods-producing industries ..................................... 6 84 – 10 16 74 – 10Manufacturing ...................................................... 4 87 – 10 16 73 – 11
Service-providing industries ..................................... 7 87 – – 30 62 – 8Trade, transportation, and utilities ....................... – 93 – 5 25 66 – 9
Retail trade ...................................................... – 95 – 4 – 65 – 9Financial activities ................................................ 5 84 – 11 – 88 – 3
Finance and insurance .................................... 5 81 – 14 11 85 – 4Credit intermediation and related activities .. – 77 – 19 – 90 – –Insurance carriers and related activities ...... – 89 – 4 19 80 – 1
Professional and business services ..................... – 93 – 4 – 66 – 11Education and health services ............................. 17 77 – 5 36 56 – 8
Educational services ........................................ 5 91 – 4 28 72 – –Junior colleges, colleges, and universities ... 8 85 – 6 33 67 – –
Health care and social assistance ................... 19 75 – 6 38 51 – 11
See footnotes at end of table.

Table 14. Inpatient surgery benefits: Extent of coverage by type of plan,private industry workers, 2015—continued
(All workers participating in medical care plans = 100 percent)
Characteristics
All plans
Fullcoverage
Coveragewith limits1
Nocoverage
Notdeterminable
1 to 99 workers ........................................................ 7 84 – 950 to 99 workers .................................................. 4 84 – 12
100 workers or more ................................................ 12 82 – –100 to 499 workers .............................................. 10 86 – –500 workers or more ............................................ 15 77 – 7
Geographic areas
Northeast ................................................................. 15 79 – 6New England ....................................................... – 83 – 3Middle Atlantic ..................................................... 16 77 – 7
South ....................................................................... 8 85 – –South Atlantic ....................................................... 11 83 – 6East South Central ............................................... – 88 – 8West South Central .............................................. – 87 – 7
Midwest .................................................................... 6 86 – –East North Central ............................................... 7 85 – –West North Central .............................................. – 90 – 7
West ......................................................................... 12 80 – 8Mountain .............................................................. – 90 – 4Pacific .................................................................. 16 75 – 9
See footnotes at end of table.
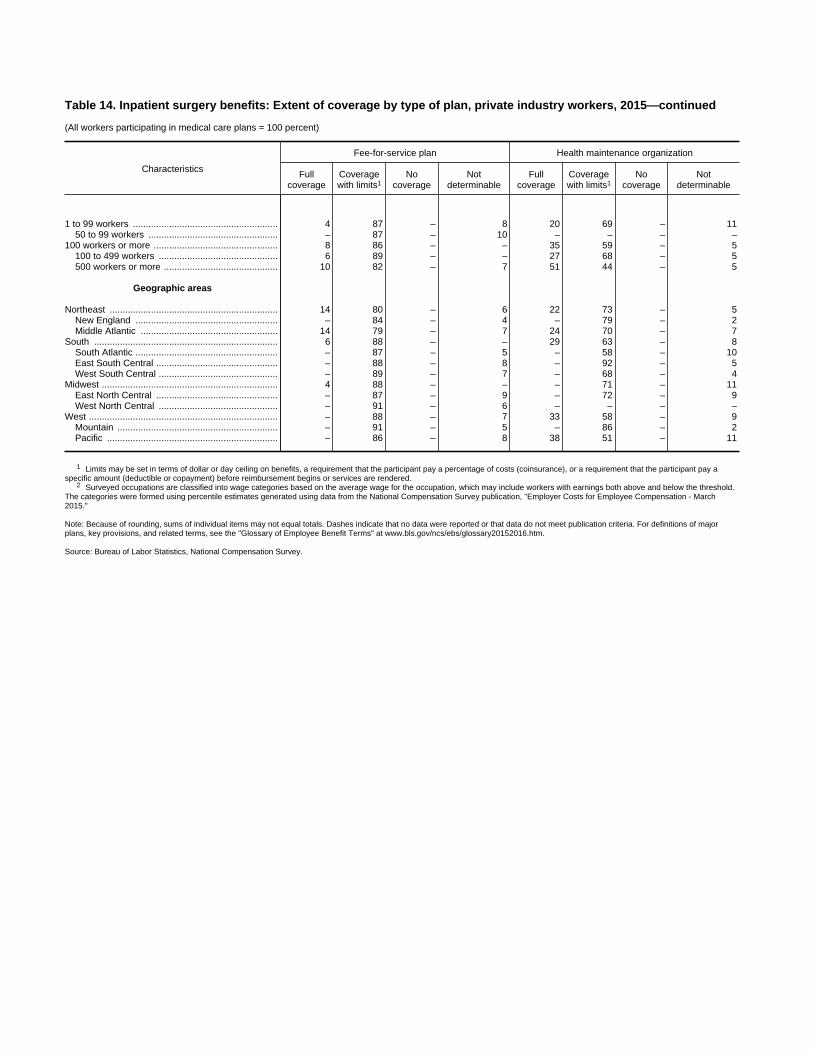
Table 14. Inpatient surgery benefits: Extent of coverage by type of plan, private industry workers, 2015—continued
(All workers participating in medical care plans = 100 percent)
Characteristics
Fee-for-service plan Health maintenance organization
Fullcoverage
Coveragewith limits1
Nocoverage
Notdeterminable
Fullcoverage
Coveragewith limits1
Nocoverage
Notdeterminable
1 to 99 workers ........................................................ 4 87 – 8 20 69 – 1150 to 99 workers .................................................. – 87 – 10 – – – –
100 workers or more ................................................ 8 86 – – 35 59 – 5100 to 499 workers .............................................. 6 89 – – 27 68 – 5500 workers or more ............................................ 10 82 – 7 51 44 – 5
Geographic areas
Northeast ................................................................. 14 80 – 6 22 73 – 5New England ....................................................... – 84 – 4 – 79 – 2Middle Atlantic ..................................................... 14 79 – 7 24 70 – 7
South ....................................................................... 6 88 – – 29 63 – 8South Atlantic ....................................................... – 87 – 5 – 58 – 10East South Central ............................................... – 88 – 8 – 92 – 5West South Central .............................................. – 89 – 7 – 68 – 4
Midwest .................................................................... 4 88 – – – 71 – 11East North Central ............................................... – 87 – 9 – 72 – 9West North Central .............................................. – 91 – 6 – – – –
West ......................................................................... – 88 – 7 33 58 – 9Mountain .............................................................. – 91 – 5 – 86 – 2Pacific .................................................................. – 86 – 8 38 51 – 11
1 Limits may be set in terms of dollar or day ceiling on benefits, a requirement that the participant pay a percentage of costs (coinsurance), or a requirement that the participant pay aspecific amount (deductible or copayment) before reimbursement begins or services are rendered.
2 Surveyed occupations are classified into wage categories based on the average wage for the occupation, which may include workers with earnings both above and below the threshold.The categories were formed using percentile estimates generated using data from the National Compensation Survey publication, "Employer Costs for Employee Compensation - March2015."
Note: Because of rounding, sums of individual items may not equal totals. Dashes indicate that no data were reported or that data do not meet publication criteria. For definitions of majorplans, key provisions, and related terms, see the "Glossary of Employee Benefit Terms" at www.bls.gov/ncs/ebs/glossary20152016.htm.
Source: Bureau of Labor Statistics, National Compensation Survey.
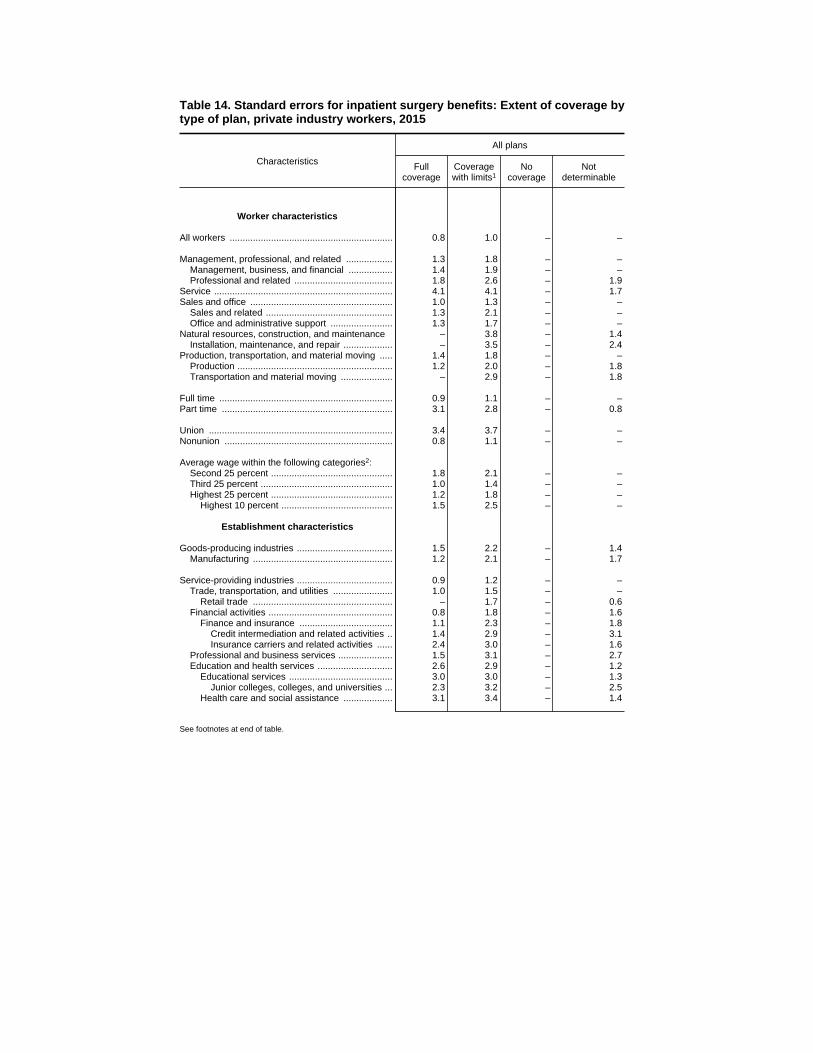
Table 14. Standard errors for inpatient surgery benefits: Extent of coverage bytype of plan, private industry workers, 2015
Characteristics
All plans
Fullcoverage
Coveragewith limits1
Nocoverage
Notdeterminable
Worker characteristics
All workers ............................................................... 0.8 1.0 – –
Management, professional, and related .................. 1.3 1.8 – –Management, business, and financial ................. 1.4 1.9 – –Professional and related ...................................... 1.8 2.6 – 1.9
Service ..................................................................... 4.1 4.1 – 1.7Sales and office ....................................................... 1.0 1.3 – –
Sales and related ................................................. 1.3 2.1 – –Office and administrative support ........................ 1.3 1.7 – –
Natural resources, construction, and maintenance – 3.8 – 1.4Installation, maintenance, and repair ................... – 3.5 – 2.4
Production, transportation, and material moving ..... 1.4 1.8 – –Production ............................................................ 1.2 2.0 – 1.8Transportation and material moving .................... – 2.9 – 1.8
Full time ................................................................... 0.9 1.1 – –Part time .................................................................. 3.1 2.8 – 0.8
Union ....................................................................... 3.4 3.7 – –Nonunion ................................................................. 0.8 1.1 – –
Average wage within the following categories2:Second 25 percent ............................................... 1.8 2.1 – –Third 25 percent ................................................... 1.0 1.4 – –Highest 25 percent ............................................... 1.2 1.8 – –
Highest 10 percent ........................................... 1.5 2.5 – –
Establishment characteristics
Goods-producing industries ..................................... 1.5 2.2 – 1.4Manufacturing ...................................................... 1.2 2.1 – 1.7
Service-providing industries ..................................... 0.9 1.2 – –Trade, transportation, and utilities ....................... 1.0 1.5 – –
Retail trade ...................................................... – 1.7 – 0.6Financial activities ................................................ 0.8 1.8 – 1.6
Finance and insurance .................................... 1.1 2.3 – 1.8Credit intermediation and related activities .. 1.4 2.9 – 3.1Insurance carriers and related activities ...... 2.4 3.0 – 1.6
Professional and business services ..................... 1.5 3.1 – 2.7Education and health services ............................. 2.6 2.9 – 1.2
Educational services ........................................ 3.0 3.0 – 1.3Junior colleges, colleges, and universities ... 2.3 3.2 – 2.5
Health care and social assistance ................... 3.1 3.4 – 1.4
See footnotes at end of table.
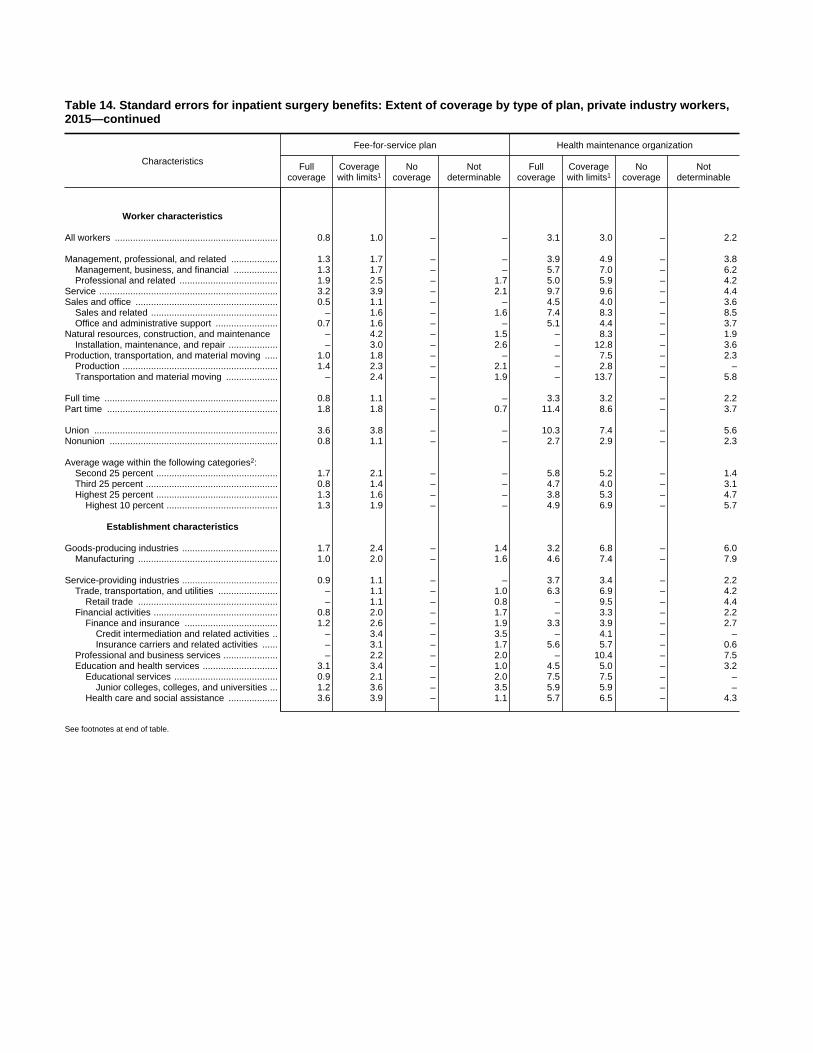
Table 14. Standard errors for inpatient surgery benefits: Extent of coverage by type of plan, private industry workers,2015—continued
Characteristics
Fee-for-service plan Health maintenance organization
Fullcoverage
Coveragewith limits1
Nocoverage
Notdeterminable
Fullcoverage
Coveragewith limits1
Nocoverage
Notdeterminable
Worker characteristics
All workers ............................................................... 0.8 1.0 – – 3.1 3.0 – 2.2
Management, professional, and related .................. 1.3 1.7 – – 3.9 4.9 – 3.8Management, business, and financial ................. 1.3 1.7 – – 5.7 7.0 – 6.2Professional and related ...................................... 1.9 2.5 – 1.7 5.0 5.9 – 4.2
Service ..................................................................... 3.2 3.9 – 2.1 9.7 9.6 – 4.4Sales and office ....................................................... 0.5 1.1 – – 4.5 4.0 – 3.6
Sales and related ................................................. – 1.6 – 1.6 7.4 8.3 – 8.5Office and administrative support ........................ 0.7 1.6 – – 5.1 4.4 – 3.7
Natural resources, construction, and maintenance – 4.2 – 1.5 – 8.3 – 1.9Installation, maintenance, and repair ................... – 3.0 – 2.6 – 12.8 – 3.6
Production, transportation, and material moving ..... 1.0 1.8 – – – 7.5 – 2.3Production ............................................................ 1.4 2.3 – 2.1 – 2.8 – –Transportation and material moving .................... – 2.4 – 1.9 – 13.7 – 5.8
Full time ................................................................... 0.8 1.1 – – 3.3 3.2 – 2.2Part time .................................................................. 1.8 1.8 – 0.7 11.4 8.6 – 3.7
Union ....................................................................... 3.6 3.8 – – 10.3 7.4 – 5.6Nonunion ................................................................. 0.8 1.1 – – 2.7 2.9 – 2.3
Average wage within the following categories2:Second 25 percent ............................................... 1.7 2.1 – – 5.8 5.2 – 1.4Third 25 percent ................................................... 0.8 1.4 – – 4.7 4.0 – 3.1Highest 25 percent ............................................... 1.3 1.6 – – 3.8 5.3 – 4.7
Highest 10 percent ........................................... 1.3 1.9 – – 4.9 6.9 – 5.7
Establishment characteristics
Goods-producing industries ..................................... 1.7 2.4 – 1.4 3.2 6.8 – 6.0Manufacturing ...................................................... 1.0 2.0 – 1.6 4.6 7.4 – 7.9
Service-providing industries ..................................... 0.9 1.1 – – 3.7 3.4 – 2.2Trade, transportation, and utilities ....................... – 1.1 – 1.0 6.3 6.9 – 4.2
Retail trade ...................................................... – 1.1 – 0.8 – 9.5 – 4.4Financial activities ................................................ 0.8 2.0 – 1.7 – 3.3 – 2.2
Finance and insurance .................................... 1.2 2.6 – 1.9 3.3 3.9 – 2.7Credit intermediation and related activities .. – 3.4 – 3.5 – 4.1 – –Insurance carriers and related activities ...... – 3.1 – 1.7 5.6 5.7 – 0.6
Professional and business services ..................... – 2.2 – 2.0 – 10.4 – 7.5Education and health services ............................. 3.1 3.4 – 1.0 4.5 5.0 – 3.2
Educational services ........................................ 0.9 2.1 – 2.0 7.5 7.5 – –Junior colleges, colleges, and universities ... 1.2 3.6 – 3.5 5.9 5.9 – –
Health care and social assistance ................... 3.6 3.9 – 1.1 5.7 6.5 – 4.3
See footnotes at end of table.

Table 14. Standard errors for inpatient surgery benefits: Extent of coverage bytype of plan, private industry workers, 2015—continued
Characteristics
All plans
Fullcoverage
Coveragewith limits1
Nocoverage
Notdeterminable
1 to 99 workers ........................................................ 1.2 1.9 – 1.350 to 99 workers .................................................. 0.9 3.3 – 3.1
100 workers or more ................................................ 1.4 1.5 – –100 to 499 workers .............................................. 1.9 2.1 – –500 workers or more ............................................ 1.9 2.2 – 1.2
Geographic areas
Northeast ................................................................. 1.5 2.2 – 1.4New England ....................................................... – 5.1 – 1.0Middle Atlantic ..................................................... 1.4 2.5 – 1.9
South ....................................................................... 1.7 2.3 – –South Atlantic ....................................................... 2.7 3.5 – 1.4East South Central ............................................... – 4.3 – 3.6West South Central .............................................. – 3.6 – 1.8
Midwest .................................................................... 1.0 1.0 – –East North Central ............................................... 1.3 1.3 – –West North Central .............................................. – 1.5 – 1.5
West ......................................................................... 1.7 2.0 – 1.9Mountain .............................................................. – 2.9 – 1.9Pacific .................................................................. 2.4 2.5 – 2.7
See footnotes at end of table.

Table 14. Standard errors for inpatient surgery benefits: Extent of coverage by type of plan, private industry workers,2015—continued
Characteristics
Fee-for-service plan Health maintenance organization
Fullcoverage
Coveragewith limits1
Nocoverage
Notdeterminable
Fullcoverage
Coveragewith limits1
Nocoverage
Notdeterminable
1 to 99 workers ........................................................ 1.1 1.7 – 1.2 3.8 4.7 – 3.850 to 99 workers .................................................. – 2.8 – 2.4 – – – –
100 workers or more ................................................ 1.1 1.3 – – 4.5 4.3 – 1.8100 to 499 workers .............................................. 1.6 1.9 – – 5.6 5.3 – 2.0500 workers or more ............................................ 1.8 2.2 – 1.3 6.3 6.3 – 2.7
Geographic areas
Northeast ................................................................. 1.5 1.9 – 1.5 4.7 6.3 – 2.7New England ....................................................... – 4.2 – 1.5 – 8.6 – 1.6Middle Atlantic ..................................................... 1.4 2.2 – 1.9 6.1 8.7 – 4.1
South ....................................................................... 1.5 2.0 – – 7.5 7.1 – 3.6South Atlantic ....................................................... – 2.5 – 1.4 – 10.1 – 5.2East South Central ............................................... – 4.4 – 3.7 – 4.9 – 4.7West South Central .............................................. – 3.9 – 2.0 – 6.4 – 3.6
Midwest .................................................................... 1.2 1.3 – – – 7.9 – 5.4East North Central ............................................... – 1.8 – 1.4 – 8.6 – 5.6West North Central .............................................. – 1.8 – 1.6 – – – –
West ......................................................................... – 2.6 – 1.7 4.9 4.2 – 4.3Mountain .............................................................. – 3.6 – 2.3 – 7.9 – 0.4Pacific .................................................................. – 3.5 – 2.3 5.4 4.3 – 5.3
1 Limits may be set in terms of dollar or day ceiling on benefits, a requirement that the participant pay a percentage of costs (coinsurance), or a requirement that the participant pay aspecific amount (deductible or copayment) before reimbursement begins or services are rendered.
2 Surveyed occupations are classified into wage categories based on the average wage for the occupation, which may include workers with earnings both above and below the threshold.The categories were formed using percentile estimates generated using data from the National Compensation Survey publication, "Employer Costs for Employee Compensation - March2015."
Note: Dashes indicate that no data were reported or that data do not meet publication criteria. For definitions of major plans, key provisions, and related terms, see the "Glossary of EmployeeBenefit Terms" at www.bls.gov/ncs/ebs/glossary20152016.htm.
Source: Bureau of Labor Statistics, National Compensation Survey.
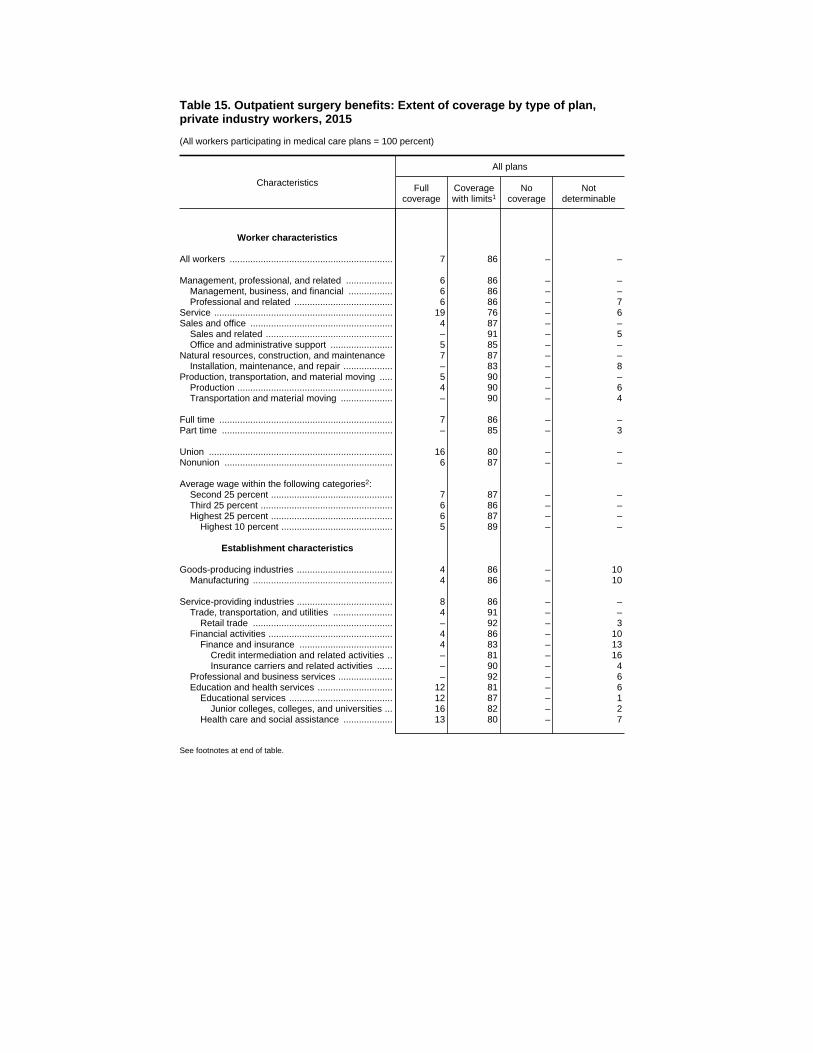
Table 15. Outpatient surgery benefits: Extent of coverage by type of plan,private industry workers, 2015
(All workers participating in medical care plans = 100 percent)
Characteristics
All plans
Fullcoverage
Coveragewith limits1
Nocoverage
Notdeterminable
Worker characteristics
All workers ............................................................... 7 86 – –
Management, professional, and related .................. 6 86 – –Management, business, and financial ................. 6 86 – –Professional and related ...................................... 6 86 – 7
Service ..................................................................... 19 76 – 6Sales and office ....................................................... 4 87 – –
Sales and related ................................................. – 91 – 5Office and administrative support ........................ 5 85 – –
Natural resources, construction, and maintenance 7 87 – –Installation, maintenance, and repair ................... – 83 – 8
Production, transportation, and material moving ..... 5 90 – –Production ............................................................ 4 90 – 6Transportation and material moving .................... – 90 – 4
Full time ................................................................... 7 86 – –Part time .................................................................. – 85 – 3
Union ....................................................................... 16 80 – –Nonunion ................................................................. 6 87 – –
Average wage within the following categories2:Second 25 percent ............................................... 7 87 – –Third 25 percent ................................................... 6 86 – –Highest 25 percent ............................................... 6 87 – –
Highest 10 percent ........................................... 5 89 – –
Establishment characteristics
Goods-producing industries ..................................... 4 86 – 10Manufacturing ...................................................... 4 86 – 10
Service-providing industries ..................................... 8 86 – –Trade, transportation, and utilities ....................... 4 91 – –
Retail trade ...................................................... – 92 – 3Financial activities ................................................ 4 86 – 10
Finance and insurance .................................... 4 83 – 13Credit intermediation and related activities .. – 81 – 16Insurance carriers and related activities ...... – 90 – 4
Professional and business services ..................... – 92 – 6Education and health services ............................. 12 81 – 6
Educational services ........................................ 12 87 – 1Junior colleges, colleges, and universities ... 16 82 – 2
Health care and social assistance ................... 13 80 – 7
See footnotes at end of table.

Table 15. Outpatient surgery benefits: Extent of coverage by type of plan, private industry workers, 2015—continued
(All workers participating in medical care plans = 100 percent)
Characteristics
Fee-for-service plan Health maintenance organization
Fullcoverage
Coveragewith limits1
Nocoverage
Notdeterminable
Fullcoverage
Coveragewith limits1
Nocoverage
Notdeterminable
Worker characteristics
All workers ............................................................... 5 88 – – 17 77 – 5
Management, professional, and related .................. 5 88 – – 14 78 – 7Management, business, and financial ................. – 89 – 7 17 75 – 9Professional and related ...................................... 5 88 – 7 – 81 – 6
Service ..................................................................... 16 78 – 6 – 67 – 4Sales and office ....................................................... 2 89 – – 16 76 – 7
Sales and related ................................................. 1 94 – – – 70 – 8Office and administrative support ........................ 3 87 – – 14 79 – 7
Natural resources, construction, and maintenance – 88 – 7 – 77 – 1Installation, maintenance, and repair ................... – 86 – 9 – 62 – 2
Production, transportation, and material moving ..... 4 91 – – 12 86 – 2Production ............................................................ 4 89 – 7 – 93 – –Transportation and material moving .................... – 92 – 4 – 76 – 4
Full time ................................................................... 5 88 – – 17 77 – 6Part time .................................................................. – 87 – 3 – 76 – 1
Union ....................................................................... 13 83 – – 31 64 – 5Nonunion ................................................................. 4 88 – – 15 79 – 6
Average wage within the following categories2:Second 25 percent ............................................... 5 88 – – 19 79 – 2Third 25 percent ................................................... 5 87 – – 14 81 – 5Highest 25 percent ............................................... 5 88 – – 14 77 – 9
Highest 10 percent ........................................... 3 90 – – 14 78 – 7
Establishment characteristics
Goods-producing industries ..................................... 4 86 – 10 6 86 – 8Manufacturing ...................................................... 3 87 – 10 8 82 – 10
Service-providing industries ..................................... 5 88 – – 20 75 – 5Trade, transportation, and utilities ....................... 2 93 – – 22 78 – 3( )
Retail trade ...................................................... – 94 – 4 – 80 – 3( )Financial activities ................................................ 4 85 – 11 – 92 – 3
Finance and insurance .................................... 4 82 – 14 – 90 – 4Credit intermediation and related activities .. – 78 – 19 – 95 – –Insurance carriers and related activities ...... – 90 – 4 – 89 – 1
Professional and business services ..................... – 94 – 4 – 81 – 11Education and health services ............................. 10 83 – 6 20 74 – 6
Educational services ........................................ 4 95 – 1 26 74 – –Junior colleges, colleges, and universities ... 6 91 – 2 37 63 – –
Health care and social assistance ................... 11 82 – 7 – 74 – 8
See footnotes at end of table.

Table 15. Outpatient surgery benefits: Extent of coverage by type of plan,private industry workers, 2015—continued
(All workers participating in medical care plans = 100 percent)
Characteristics
All plans
Fullcoverage
Coveragewith limits1
Nocoverage
Notdeterminable
1 to 99 workers ........................................................ 6 86 – 850 to 99 workers .................................................. 4 85 – 11
100 workers or more ................................................ 8 86 – –100 to 499 workers .............................................. 5 90 – –500 workers or more ............................................ 11 81 – 8
Geographic areas
Northeast ................................................................. 13 80 – 6New England ....................................................... – 84 – 2Middle Atlantic ..................................................... 13 79 – 8
South ....................................................................... 5 89 – –South Atlantic ....................................................... – 88 – 6East South Central ............................................... – 88 – 8West South Central .............................................. 3 91 – –
Midwest .................................................................... 5 87 – –East North Central ............................................... 6 86 – –West North Central .............................................. – 90 – 7
West ......................................................................... 8 85 – 7Mountain .............................................................. – 89 – 4Pacific .................................................................. 8 83 – 8
See footnotes at end of table.

Table 15. Outpatient surgery benefits: Extent of coverage by type of plan, private industry workers, 2015—continued
(All workers participating in medical care plans = 100 percent)
Characteristics
Fee-for-service plan Health maintenance organization
Fullcoverage
Coveragewith limits1
Nocoverage
Notdeterminable
Fullcoverage
Coveragewith limits1
Nocoverage
Notdeterminable
1 to 99 workers ........................................................ 4 87 – 8 13 79 – 750 to 99 workers .................................................. – 88 – 10 – 73 – 19
100 workers or more ................................................ 6 88 – – 21 75 – 4100 to 499 workers .............................................. 4 91 – – – 84 – 5500 workers or more ............................................ 7 84 – 9 40 59 – 1
Geographic areas
Northeast ................................................................. 12 80 – 8 18 81 – 1New England ....................................................... – 84 – 4 – 85 – –Middle Atlantic ..................................................... 12 79 – 9 – 78 – 1
South ....................................................................... – 92 – 6 27 65 – 8South Atlantic ....................................................... – 92 – 5 30 60 – 10East South Central ............................................... – 88 – 8 – 100 – –West South Central .............................................. – 93 – 6 – 69 – 4
Midwest .................................................................... – 87 – 8 – 85 – 5East North Central ............................................... – 86 – 9 – 86 – 4West North Central .............................................. – 91 – 6 – 77 – 12
West ......................................................................... – 88 – 7 14 79 – 7Mountain .............................................................. – 89 – 5 – 90 – 3( )Pacific .................................................................. – 87 – 9 15 76 – 8
1 Limits may be set in terms of dollar or day ceiling on benefits, a requirement that the participant pay a percentage of costs (coinsurance), or a requirement that the participant pay aspecific amount (deductible or copayment) before reimbursement begins or services are rendered.
2 Surveyed occupations are classified into wage categories based on the average wage for the occupation, which may include workers with earnings both above and below the threshold.The categories were formed using percentile estimates generated using data from the National Compensation Survey publication, "Employer Costs for Employee Compensation - March2015."
3 Less than 0.5.
Note: Because of rounding, sums of individual items may not equal totals. Dashes indicate that no data were reported or that data do not meet publication criteria. For definitions of majorplans, key provisions, and related terms, see the "Glossary of Employee Benefit Terms" at www.bls.gov/ncs/ebs/glossary20152016.htm.
Source: Bureau of Labor Statistics, National Compensation Survey.

Table 15. Standard errors for outpatient surgery benefits: Extent of coverageby type of plan, private industry workers, 2015
Characteristics
All plans
Fullcoverage
Coveragewith limits1
Nocoverage
Notdeterminable
Worker characteristics
All workers ............................................................... 0.7 1.0 – –
Management, professional, and related .................. 0.8 1.6 – –Management, business, and financial ................. 1.3 1.8 – –Professional and related ...................................... 1.0 2.2 – 1.9
Service ..................................................................... 3.6 3.7 – 1.6Sales and office ....................................................... 0.7 1.3 – –
Sales and related ................................................. – 2.0 – 1.6Office and administrative support ........................ 0.9 1.6 – –
Natural resources, construction, and maintenance 1.8 2.1 – –Installation, maintenance, and repair ................... – 3.4 – 2.3
Production, transportation, and material moving ..... 0.9 1.5 – –Production ............................................................ 0.9 1.7 – 1.8Transportation and material moving .................... – 2.4 – 1.8
Full time ................................................................... 0.7 1.0 – –Part time .................................................................. – 4.5 – 0.8
Union ....................................................................... 2.5 2.7 – –Nonunion ................................................................. 0.7 1.0 – –
Average wage within the following categories2:Second 25 percent ............................................... 1.1 1.7 – –Third 25 percent ................................................... 0.8 1.3 – –Highest 25 percent ............................................... 0.8 1.5 – –
Highest 10 percent ........................................... 0.9 2.3 – –
Establishment characteristics
Goods-producing industries ..................................... 0.6 1.5 – 1.4Manufacturing ...................................................... 0.7 1.9 – 1.8
Service-providing industries ..................................... 0.9 1.2 – –Trade, transportation, and utilities ....................... 0.9 1.6 – –
Retail trade ...................................................... – 1.6 – 0.7Financial activities ................................................ 0.6 1.7 – 1.6
Finance and insurance .................................... 0.9 2.2 – 1.8Credit intermediation and related activities .. – 3.1 – 3.1Insurance carriers and related activities ...... – 2.7 – 1.6
Professional and business services ..................... – 2.8 – 2.6Education and health services ............................. 2.1 2.4 – 1.4
Educational services ........................................ 3.1 3.1 – 0.5Junior colleges, colleges, and universities ... 2.6 2.6 – 0.9
Health care and social assistance ................... 2.4 2.8 – 1.6
See footnotes at end of table.
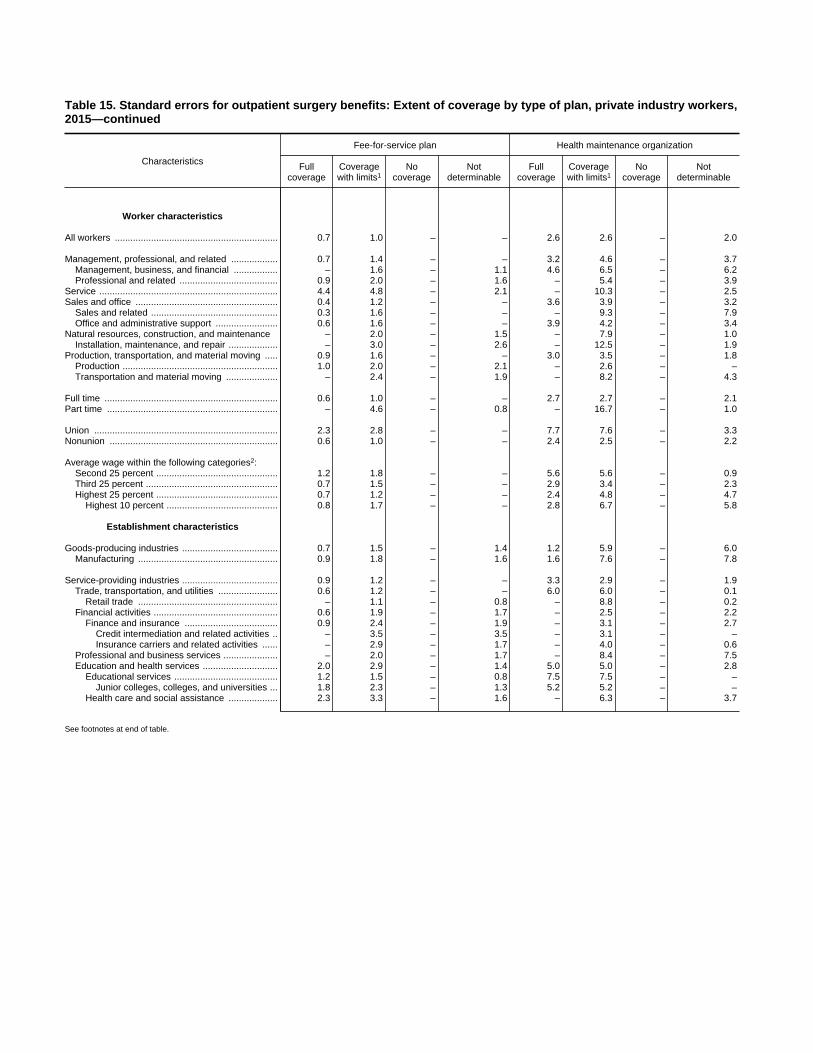
Table 15. Standard errors for outpatient surgery benefits: Extent of coverage by type of plan, private industry workers,2015—continued
Characteristics
Fee-for-service plan Health maintenance organization
Fullcoverage
Coveragewith limits1
Nocoverage
Notdeterminable
Fullcoverage
Coveragewith limits1
Nocoverage
Notdeterminable
Worker characteristics
All workers ............................................................... 0.7 1.0 – – 2.6 2.6 – 2.0
Management, professional, and related .................. 0.7 1.4 – – 3.2 4.6 – 3.7Management, business, and financial ................. – 1.6 – 1.1 4.6 6.5 – 6.2Professional and related ...................................... 0.9 2.0 – 1.6 – 5.4 – 3.9
Service ..................................................................... 4.4 4.8 – 2.1 – 10.3 – 2.5Sales and office ....................................................... 0.4 1.2 – – 3.6 3.9 – 3.2
Sales and related ................................................. 0.3 1.6 – – – 9.3 – 7.9Office and administrative support ........................ 0.6 1.6 – – 3.9 4.2 – 3.4
Natural resources, construction, and maintenance – 2.0 – 1.5 – 7.9 – 1.0Installation, maintenance, and repair ................... – 3.0 – 2.6 – 12.5 – 1.9
Production, transportation, and material moving ..... 0.9 1.6 – – 3.0 3.5 – 1.8Production ............................................................ 1.0 2.0 – 2.1 – 2.6 – –Transportation and material moving .................... – 2.4 – 1.9 – 8.2 – 4.3
Full time ................................................................... 0.6 1.0 – – 2.7 2.7 – 2.1Part time .................................................................. – 4.6 – 0.8 – 16.7 – 1.0
Union ....................................................................... 2.3 2.8 – – 7.7 7.6 – 3.3Nonunion ................................................................. 0.6 1.0 – – 2.4 2.5 – 2.2
Average wage within the following categories2:Second 25 percent ............................................... 1.2 1.8 – – 5.6 5.6 – 0.9Third 25 percent ................................................... 0.7 1.5 – – 2.9 3.4 – 2.3Highest 25 percent ............................................... 0.7 1.2 – – 2.4 4.8 – 4.7
Highest 10 percent ........................................... 0.8 1.7 – – 2.8 6.7 – 5.8
Establishment characteristics
Goods-producing industries ..................................... 0.7 1.5 – 1.4 1.2 5.9 – 6.0Manufacturing ...................................................... 0.9 1.8 – 1.6 1.6 7.6 – 7.8
Service-providing industries ..................................... 0.9 1.2 – – 3.3 2.9 – 1.9Trade, transportation, and utilities ....................... 0.6 1.2 – – 6.0 6.0 – 0.1
Retail trade ...................................................... – 1.1 – 0.8 – 8.8 – 0.2Financial activities ................................................ 0.6 1.9 – 1.7 – 2.5 – 2.2
Finance and insurance .................................... 0.9 2.4 – 1.9 – 3.1 – 2.7Credit intermediation and related activities .. – 3.5 – 3.5 – 3.1 – –Insurance carriers and related activities ...... – 2.9 – 1.7 – 4.0 – 0.6
Professional and business services ..................... – 2.0 – 1.7 – 8.4 – 7.5Education and health services ............................. 2.0 2.9 – 1.4 5.0 5.0 – 2.8
Educational services ........................................ 1.2 1.5 – 0.8 7.5 7.5 – –Junior colleges, colleges, and universities ... 1.8 2.3 – 1.3 5.2 5.2 – –
Health care and social assistance ................... 2.3 3.3 – 1.6 – 6.3 – 3.7
See footnotes at end of table.
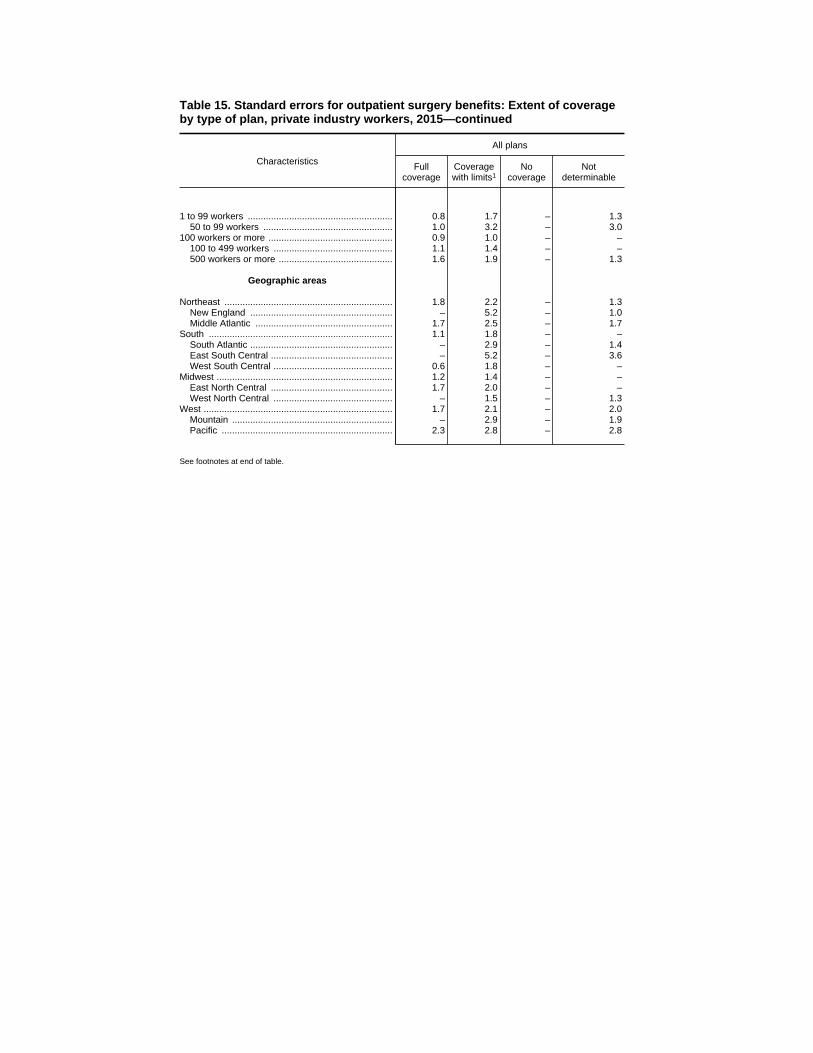
Table 15. Standard errors for outpatient surgery benefits: Extent of coverageby type of plan, private industry workers, 2015—continued
Characteristics
All plans
Fullcoverage
Coveragewith limits1
Nocoverage
Notdeterminable
1 to 99 workers ........................................................ 0.8 1.7 – 1.350 to 99 workers .................................................. 1.0 3.2 – 3.0
100 workers or more ................................................ 0.9 1.0 – –100 to 499 workers .............................................. 1.1 1.4 – –500 workers or more ............................................ 1.6 1.9 – 1.3
Geographic areas
Northeast ................................................................. 1.8 2.2 – 1.3New England ....................................................... – 5.2 – 1.0Middle Atlantic ..................................................... 1.7 2.5 – 1.7
South ....................................................................... 1.1 1.8 – –South Atlantic ....................................................... – 2.9 – 1.4East South Central ............................................... – 5.2 – 3.6West South Central .............................................. 0.6 1.8 – –
Midwest .................................................................... 1.2 1.4 – –East North Central ............................................... 1.7 2.0 – –West North Central .............................................. – 1.5 – 1.3
West ......................................................................... 1.7 2.1 – 2.0Mountain .............................................................. – 2.9 – 1.9Pacific .................................................................. 2.3 2.8 – 2.8
See footnotes at end of table.

Table 15. Standard errors for outpatient surgery benefits: Extent of coverage by type of plan, private industry workers,2015—continued
Characteristics
Fee-for-service plan Health maintenance organization
Fullcoverage
Coveragewith limits1
Nocoverage
Notdeterminable
Fullcoverage
Coveragewith limits1
Nocoverage
Notdeterminable
1 to 99 workers ........................................................ 1.0 1.6 – 1.2 2.9 4.6 – 3.650 to 99 workers .................................................. – 2.7 – 2.4 – 10.2 – 10.3
100 workers or more ................................................ 0.8 1.1 – – 3.5 3.5 – 1.5100 to 499 workers .............................................. 1.0 1.6 – – – 4.1 – 2.0500 workers or more ............................................ 1.3 1.9 – 1.5 5.7 5.7 – 1.0
Geographic areas
Northeast ................................................................. 1.5 2.4 – 1.6 4.9 4.8 – 0.5New England ....................................................... – 5.0 – 1.5 – 6.9 – –Middle Atlantic ..................................................... 1.5 2.8 – 2.0 – 6.4 – 0.7
South ....................................................................... – 1.5 – 1.2 6.4 6.0 – 3.5South Atlantic ....................................................... – 2.0 – 1.4 8.8 8.3 – 5.2East South Central ............................................... – 5.3 – 3.7 – 3( ) – –West South Central .............................................. – 1.9 – 2.0 – 6.2 – 3.5
Midwest .................................................................... – 1.6 – 1.1 – 6.3 – 3.2East North Central ............................................... – 2.2 – 1.4 – 6.7 – 3.0West North Central .............................................. – 1.9 – 1.6 – 14.0 – 11.2
West ......................................................................... – 2.6 – 1.7 4.0 3.7 – 4.3Mountain .............................................................. – 4.7 – 2.3 – 8.6 – 0.2Pacific .................................................................. – 3.2 – 2.3 4.5 3.8 – 5.2
1 Limits may be set in terms of dollar or day ceiling on benefits, a requirement that the participant pay a percentage of costs (coinsurance), or a requirement that the participant pay aspecific amount (deductible or copayment) before reimbursement begins or services are rendered.
2 Surveyed occupations are classified into wage categories based on the average wage for the occupation, which may include workers with earnings both above and below the threshold.The categories were formed using percentile estimates generated using data from the National Compensation Survey publication, "Employer Costs for Employee Compensation - March2015."
3 Less than 0.05.
Note: Dashes indicate that no data were reported or that data do not meet publication criteria. For definitions of major plans, key provisions, and related terms, see the "Glossary of EmployeeBenefit Terms" at www.bls.gov/ncs/ebs/glossary20152016.htm.
Source: Bureau of Labor Statistics, National Compensation Survey.

Table 16. Physician office visit benefits: Extent of coverage by type of plan,private industry workers, 2015
(All workers participating in medical care plans = 100 percent)
Characteristics
All plans
Fullcoverage
Coveragewith limits1
Nocoverage
Notdeterminable
Worker characteristics
All workers ............................................................... 2 98 – 2( )
Management, professional, and related .................. 3 97 – 2( )Management, business, and financial ................. – 98 – 2( )Professional and related ...................................... 4 96 – 2( )
Service ..................................................................... – 95 – 1Sales and office ....................................................... – 99 – 2( )
Sales and related ................................................. – 99 – 2( )Office and administrative support ........................ – 99 – 2( )
Natural resources, construction, and maintenance – 100 – 2( )Installation, maintenance, and repair ................... – 99 – 2( )
Production, transportation, and material moving ..... – 99 – –Production ............................................................ – 100 – –Transportation and material moving .................... – 99 – –
Full time ................................................................... 2 98 – 2( )Part time .................................................................. – 98 – 1
Union ....................................................................... – 95 – 1Nonunion ................................................................. 2 98 – 2( )
Average wage within the following categories3:Second 25 percent ............................................... – 98 – 2( )Third 25 percent ................................................... – 98 – 2( )Highest 25 percent ............................................... 3 97 – 2( )
Highest 10 percent ........................................... – 97 – 1
Establishment characteristics
Goods-producing industries ..................................... – 99 – 2( )Manufacturing ...................................................... – 99 – 2( )
Service-providing industries ..................................... 2 97 – 2( )Trade, transportation, and utilities ....................... – 99 – –
Retail trade ...................................................... – 100 – –Financial activities ................................................ – 99 – 2( )
Finance and insurance .................................... – 99 – 2( )Credit intermediation and related activities .. – 99 – –Insurance carriers and related activities ...... – 99 – 1
Professional and business services ..................... – 96 – –Education and health services ............................. 5 95 – 1
Educational services ........................................ – 99 – –Junior colleges, colleges, and universities ... – 99 – –
Health care and social assistance ................... 5 94 – 1
See footnotes at end of table.
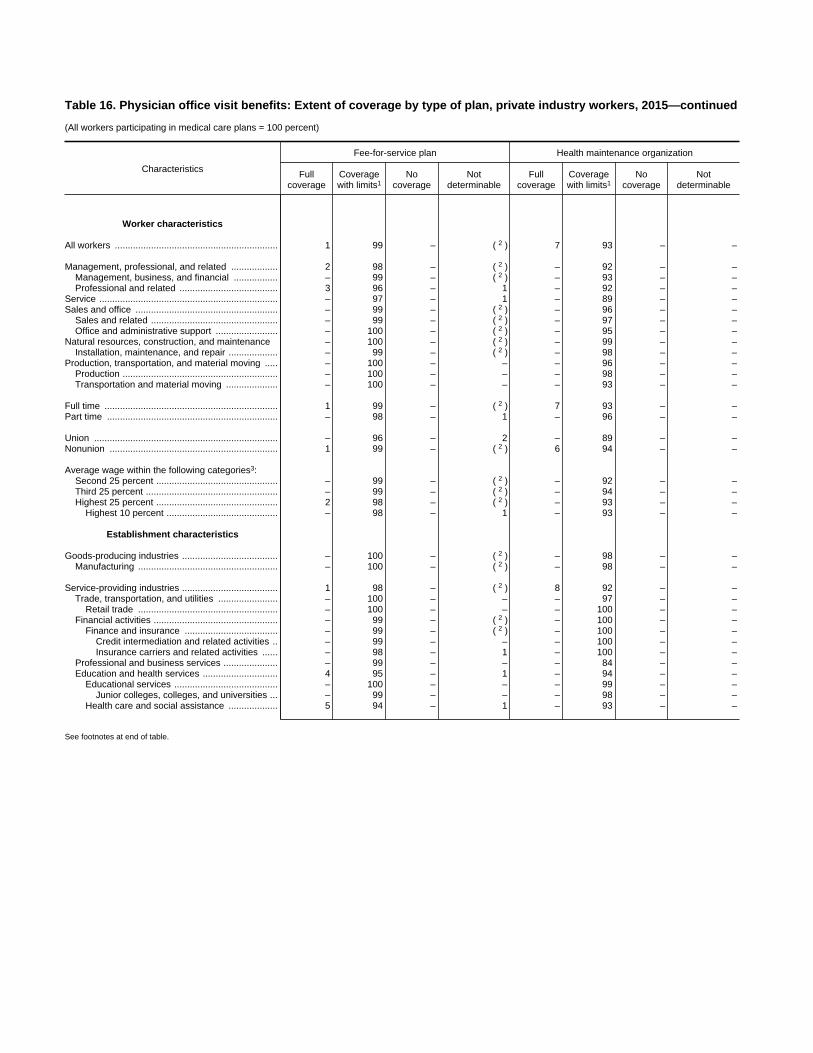
Table 16. Physician office visit benefits: Extent of coverage by type of plan, private industry workers, 2015—continued
(All workers participating in medical care plans = 100 percent)
Characteristics
Fee-for-service plan Health maintenance organization
Fullcoverage
Coveragewith limits1
Nocoverage
Notdeterminable
Fullcoverage
Coveragewith limits1
Nocoverage
Notdeterminable
Worker characteristics
All workers ............................................................... 1 99 – 2( ) 7 93 – –
Management, professional, and related .................. 2 98 – 2( ) – 92 – –Management, business, and financial ................. – 99 – 2( ) – 93 – –Professional and related ...................................... 3 96 – 1 – 92 – –
Service ..................................................................... – 97 – 1 – 89 – –Sales and office ....................................................... – 99 – 2( ) – 96 – –
Sales and related ................................................. – 99 – 2( ) – 97 – –Office and administrative support ........................ – 100 – 2( ) – 95 – –
Natural resources, construction, and maintenance – 100 – 2( ) – 99 – –Installation, maintenance, and repair ................... – 99 – 2( ) – 98 – –
Production, transportation, and material moving ..... – 100 – – – 96 – –Production ............................................................ – 100 – – – 98 – –Transportation and material moving .................... – 100 – – – 93 – –
Full time ................................................................... 1 99 – 2( ) 7 93 – –Part time .................................................................. – 98 – 1 – 96 – –
Union ....................................................................... – 96 – 2 – 89 – –Nonunion ................................................................. 1 99 – 2( ) 6 94 – –
Average wage within the following categories3:Second 25 percent ............................................... – 99 – 2( ) – 92 – –Third 25 percent ................................................... – 99 – 2( ) – 94 – –Highest 25 percent ............................................... 2 98 – 2( ) – 93 – –
Highest 10 percent ........................................... – 98 – 1 – 93 – –
Establishment characteristics
Goods-producing industries ..................................... – 100 – 2( ) – 98 – –Manufacturing ...................................................... – 100 – 2( ) – 98 – –
Service-providing industries ..................................... 1 98 – 2( ) 8 92 – –Trade, transportation, and utilities ....................... – 100 – – – 97 – –
Retail trade ...................................................... – 100 – – – 100 – –Financial activities ................................................ – 99 – 2( ) – 100 – –
Finance and insurance .................................... – 99 – 2( ) – 100 – –Credit intermediation and related activities .. – 99 – – – 100 – –Insurance carriers and related activities ...... – 98 – 1 – 100 – –
Professional and business services ..................... – 99 – – – 84 – –Education and health services ............................. 4 95 – 1 – 94 – –
Educational services ........................................ – 100 – – – 99 – –Junior colleges, colleges, and universities ... – 99 – – – 98 – –
Health care and social assistance ................... 5 94 – 1 – 93 – –
See footnotes at end of table.

Table 16. Physician office visit benefits: Extent of coverage by type of plan,private industry workers, 2015—continued
(All workers participating in medical care plans = 100 percent)
Characteristics
All plans
Fullcoverage
Coveragewith limits1
Nocoverage
Notdeterminable
1 to 99 workers ........................................................ 2 98 – –50 to 99 workers .................................................. – 98 – –
100 workers or more ................................................ 2 97 – 2( )100 to 499 workers .............................................. – 98 – 2( )500 workers or more ............................................ – 97 – 1
Geographic areas
Northeast ................................................................. – 95 – 1New England ....................................................... – 96 – –Middle Atlantic ..................................................... – 95 – 1
South ....................................................................... 2 98 – 2( )South Atlantic ....................................................... 4 96 – 2( )East South Central ............................................... – 99 – 2( )West South Central .............................................. – 100 – 2( )
Midwest .................................................................... – 99 – –East North Central ............................................... – 99 – –West North Central .............................................. – 99 – –
West ......................................................................... – 99 – 2( )Mountain .............................................................. – 100 – –Pacific .................................................................. – 98 – 1
See footnotes at end of table.

Table 16. Physician office visit benefits: Extent of coverage by type of plan, private industry workers, 2015—continued
(All workers participating in medical care plans = 100 percent)
Characteristics
Fee-for-service plan Health maintenance organization
Fullcoverage
Coveragewith limits1
Nocoverage
Notdeterminable
Fullcoverage
Coveragewith limits1
Nocoverage
Notdeterminable
1 to 99 workers ........................................................ – 99 – – – 93 – –50 to 99 workers .................................................. – 99 – – – 92 – –
100 workers or more ................................................ 1 98 – 1 – 94 – –100 to 499 workers .............................................. – 98 – 1 – 97 – –500 workers or more ............................................ 2 98 – 1 – 89 – –
Geographic areas
Northeast ................................................................. – 97 – 1 – 90 – –New England ....................................................... – 99 – – – 90 – –Middle Atlantic ..................................................... – 96 – 1 – 89 – –
South ....................................................................... 1 99 – 2( ) – 87 – –South Atlantic ....................................................... – 98 – 2( ) – 81 – –East South Central ............................................... – 99 – 2( ) – 84 – –West South Central .............................................. – 100 – 2( ) – 100 – –
Midwest .................................................................... – 99 – – – 99 – –East North Central ............................................... – 99 – – – 99 – –West North Central .............................................. – 99 – – – 100 – –
West ......................................................................... – 99 – 1 – 97 – –Mountain .............................................................. – 100 – – – 100 – –Pacific .................................................................. – 98 – 1 – 97 – –
1 Limits may be set in terms of dollar or day ceiling on benefits, a requirement that the participant pay a percentage of costs (coinsurance), or a requirement that the participant pay aspecific amount (deductible or copayment) before reimbursement begins or services are rendered.
2 Less than 0.5.3 Surveyed occupations are classified into wage categories based on the average wage for the occupation, which may include workers with earnings both above and below the threshold.
The categories were formed using percentile estimates generated using data from the National Compensation Survey publication, "Employer Costs for Employee Compensation - March2015."
Note: Because of rounding, sums of individual items may not equal totals. Dashes indicate that no data were reported or that data do not meet publication criteria. For definitions of majorplans, key provisions, and related terms, see the "Glossary of Employee Benefit Terms" at www.bls.gov/ncs/ebs/glossary20152016.htm.
Source: Bureau of Labor Statistics, National Compensation Survey.
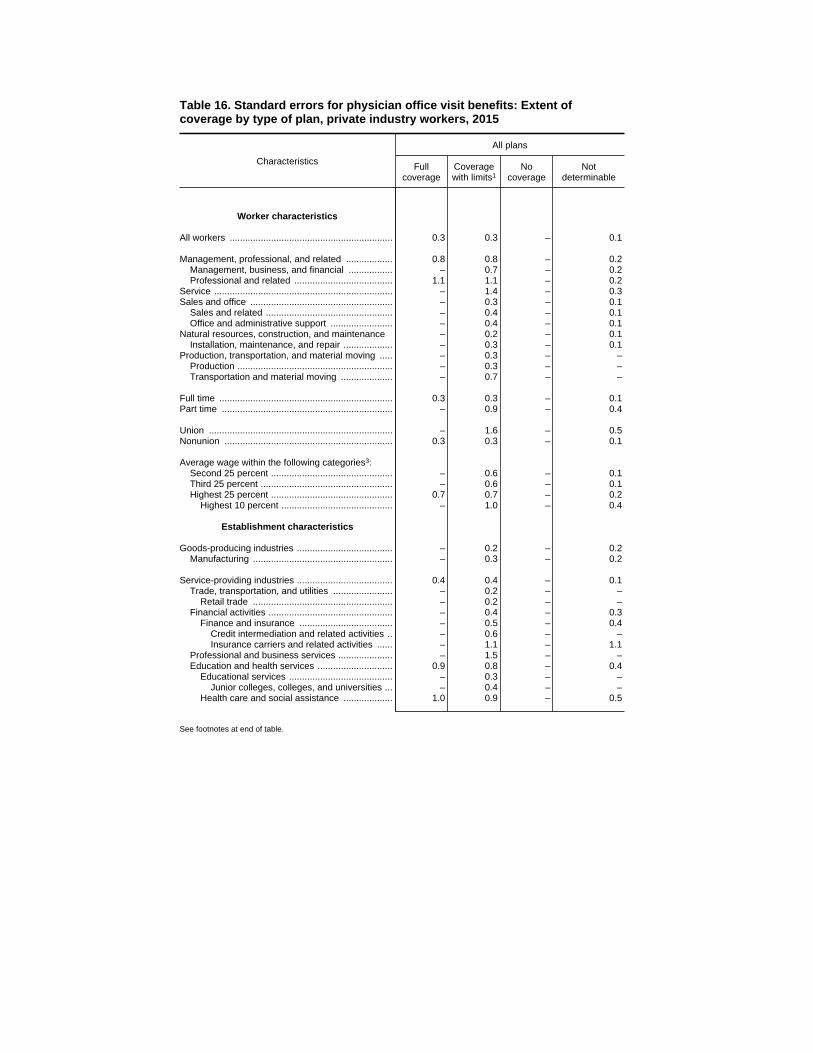
Table 16. Standard errors for physician office visit benefits: Extent ofcoverage by type of plan, private industry workers, 2015
Characteristics
All plans
Fullcoverage
Coveragewith limits1
Nocoverage
Notdeterminable
Worker characteristics
All workers ............................................................... 0.3 0.3 – 0.1
Management, professional, and related .................. 0.8 0.8 – 0.2Management, business, and financial ................. – 0.7 – 0.2Professional and related ...................................... 1.1 1.1 – 0.2
Service ..................................................................... – 1.4 – 0.3Sales and office ....................................................... – 0.3 – 0.1
Sales and related ................................................. – 0.4 – 0.1Office and administrative support ........................ – 0.4 – 0.1
Natural resources, construction, and maintenance – 0.2 – 0.1Installation, maintenance, and repair ................... – 0.3 – 0.1
Production, transportation, and material moving ..... – 0.3 – –Production ............................................................ – 0.3 – –Transportation and material moving .................... – 0.7 – –
Full time ................................................................... 0.3 0.3 – 0.1Part time .................................................................. – 0.9 – 0.4
Union ....................................................................... – 1.6 – 0.5Nonunion ................................................................. 0.3 0.3 – 0.1
Average wage within the following categories3:Second 25 percent ............................................... – 0.6 – 0.1Third 25 percent ................................................... – 0.6 – 0.1Highest 25 percent ............................................... 0.7 0.7 – 0.2
Highest 10 percent ........................................... – 1.0 – 0.4
Establishment characteristics
Goods-producing industries ..................................... – 0.2 – 0.2Manufacturing ...................................................... – 0.3 – 0.2
Service-providing industries ..................................... 0.4 0.4 – 0.1Trade, transportation, and utilities ....................... – 0.2 – –
Retail trade ...................................................... – 0.2 – –Financial activities ................................................ – 0.4 – 0.3
Finance and insurance .................................... – 0.5 – 0.4Credit intermediation and related activities .. – 0.6 – –Insurance carriers and related activities ...... – 1.1 – 1.1
Professional and business services ..................... – 1.5 – –Education and health services ............................. 0.9 0.8 – 0.4
Educational services ........................................ – 0.3 – –Junior colleges, colleges, and universities ... – 0.4 – –
Health care and social assistance ................... 1.0 0.9 – 0.5
See footnotes at end of table.
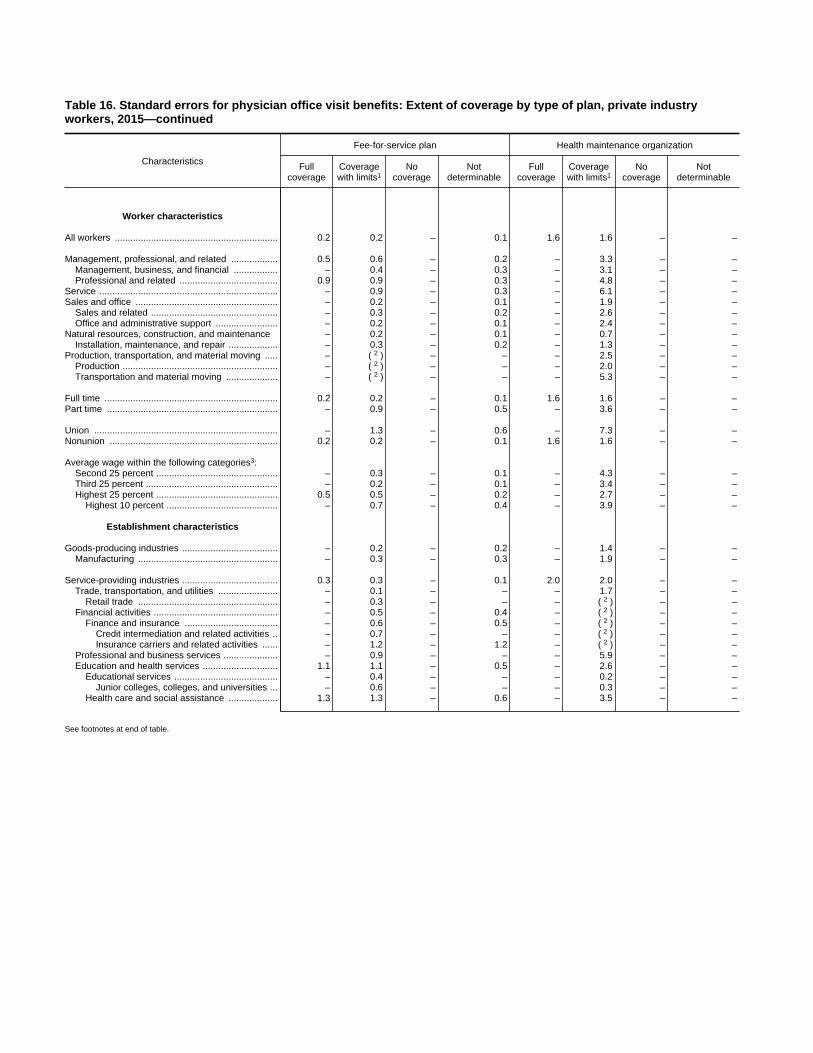
Table 16. Standard errors for physician office visit benefits: Extent of coverage by type of plan, private industryworkers, 2015—continued
Characteristics
Fee-for-service plan Health maintenance organization
Fullcoverage
Coveragewith limits1
Nocoverage
Notdeterminable
Fullcoverage
Coveragewith limits1
Nocoverage
Notdeterminable
Worker characteristics
All workers ............................................................... 0.2 0.2 – 0.1 1.6 1.6 – –
Management, professional, and related .................. 0.5 0.6 – 0.2 – 3.3 – –Management, business, and financial ................. – 0.4 – 0.3 – 3.1 – –Professional and related ...................................... 0.9 0.9 – 0.3 – 4.8 – –
Service ..................................................................... – 0.9 – 0.3 – 6.1 – –Sales and office ....................................................... – 0.2 – 0.1 – 1.9 – –
Sales and related ................................................. – 0.3 – 0.2 – 2.6 – –Office and administrative support ........................ – 0.2 – 0.1 – 2.4 – –
Natural resources, construction, and maintenance – 0.2 – 0.1 – 0.7 – –Installation, maintenance, and repair ................... – 0.3 – 0.2 – 1.3 – –
Production, transportation, and material moving ..... – 2( ) – – – 2.5 – –Production ............................................................ – 2( ) – – – 2.0 – –Transportation and material moving .................... – 2( ) – – – 5.3 – –
Full time ................................................................... 0.2 0.2 – 0.1 1.6 1.6 – –Part time .................................................................. – 0.9 – 0.5 – 3.6 – –
Union ....................................................................... – 1.3 – 0.6 – 7.3 – –Nonunion ................................................................. 0.2 0.2 – 0.1 1.6 1.6 – –
Average wage within the following categories3:Second 25 percent ............................................... – 0.3 – 0.1 – 4.3 – –Third 25 percent ................................................... – 0.2 – 0.1 – 3.4 – –Highest 25 percent ............................................... 0.5 0.5 – 0.2 – 2.7 – –
Highest 10 percent ........................................... – 0.7 – 0.4 – 3.9 – –
Establishment characteristics
Goods-producing industries ..................................... – 0.2 – 0.2 – 1.4 – –Manufacturing ...................................................... – 0.3 – 0.3 – 1.9 – –
Service-providing industries ..................................... 0.3 0.3 – 0.1 2.0 2.0 – –Trade, transportation, and utilities ....................... – 0.1 – – – 1.7 – –
Retail trade ...................................................... – 0.3 – – – 2( ) – –Financial activities ................................................ – 0.5 – 0.4 – 2( ) – –
Finance and insurance .................................... – 0.6 – 0.5 – 2( ) – –Credit intermediation and related activities .. – 0.7 – – – 2( ) – –Insurance carriers and related activities ...... – 1.2 – 1.2 – 2( ) – –
Professional and business services ..................... – 0.9 – – – 5.9 – –Education and health services ............................. 1.1 1.1 – 0.5 – 2.6 – –
Educational services ........................................ – 0.4 – – – 0.2 – –Junior colleges, colleges, and universities ... – 0.6 – – – 0.3 – –
Health care and social assistance ................... 1.3 1.3 – 0.6 – 3.5 – –
See footnotes at end of table.

Table 16. Standard errors for physician office visit benefits: Extent ofcoverage by type of plan, private industry workers, 2015—continued
Characteristics
All plans
Fullcoverage
Coveragewith limits1
Nocoverage
Notdeterminable
1 to 99 workers ........................................................ 0.4 0.4 – –50 to 99 workers .................................................. – 1.0 – –
100 workers or more ................................................ 0.5 0.5 – 0.2100 to 499 workers .............................................. – 0.6 – 0.2500 workers or more ............................................ – 0.9 – 0.3
Geographic areas
Northeast ................................................................. – 1.3 – 0.3New England ....................................................... – 3.7 – –Middle Atlantic ..................................................... – 1.2 – 0.4
South ....................................................................... 0.6 0.6 – 0.1South Atlantic ....................................................... 1.1 1.1 – 2( )East South Central ............................................... – 0.7 – 0.2West South Central .............................................. – 0.1 – 0.1
Midwest .................................................................... – 0.3 – –East North Central ............................................... – 0.3 – –West North Central .............................................. – 0.7 – –
West ......................................................................... – 0.4 – 0.3Mountain .............................................................. – 0.1 – –Pacific .................................................................. – 0.6 – 0.4
See footnotes at end of table.

Table 16. Standard errors for physician office visit benefits: Extent of coverage by type of plan, private industryworkers, 2015—continued
Characteristics
Fee-for-service plan Health maintenance organization
Fullcoverage
Coveragewith limits1
Nocoverage
Notdeterminable
Fullcoverage
Coveragewith limits1
Nocoverage
Notdeterminable
1 to 99 workers ........................................................ – 0.3 – – – 2.1 – –50 to 99 workers .................................................. – 0.9 – – – 3.9 – –
100 workers or more ................................................ 0.3 0.3 – 0.2 – 2.4 – –100 to 499 workers .............................................. – 0.5 – 0.3 – 2.3 – –500 workers or more ............................................ 0.5 0.6 – 0.3 – 5.3 – –
Geographic areas
Northeast ................................................................. – 0.8 – 0.4 – 4.9 – –New England ....................................................... – 0.8 – – – 9.6 – –Middle Atlantic ..................................................... – 1.0 – 0.5 – 5.5 – –
South ....................................................................... 0.3 0.3 – 0.1 – 4.6 – –South Atlantic ....................................................... – 0.6 – 0.1 – 6.3 – –East South Central ............................................... – 0.4 – 0.2 – 14.1 – –West South Central .............................................. – 0.2 – 0.1 – 2( ) – –
Midwest .................................................................... – 0.4 – – – 0.6 – –East North Central ............................................... – 0.5 – – – 0.7 – –West North Central .............................................. – 0.7 – – – 2( ) – –
West ......................................................................... – 0.5 – 0.4 – 1.1 – –Mountain .............................................................. – 0.1 – – – 2( ) – –Pacific .................................................................. – 0.9 – 0.6 – 1.3 – –
1 Limits may be set in terms of dollar or day ceiling on benefits, a requirement that the participant pay a percentage of costs (coinsurance), or a requirement that the participant pay aspecific amount (deductible or copayment) before reimbursement begins or services are rendered.
2 Less than 0.05.3 Surveyed occupations are classified into wage categories based on the average wage for the occupation, which may include workers with earnings both above and below the threshold.
The categories were formed using percentile estimates generated using data from the National Compensation Survey publication, "Employer Costs for Employee Compensation - March2015."
Note: Dashes indicate that no data were reported or that data do not meet publication criteria. For definitions of major plans, key provisions, and related terms, see the "Glossary of EmployeeBenefit Terms" at www.bls.gov/ncs/ebs/glossary20152016.htm.
Source: Bureau of Labor Statistics, National Compensation Survey.
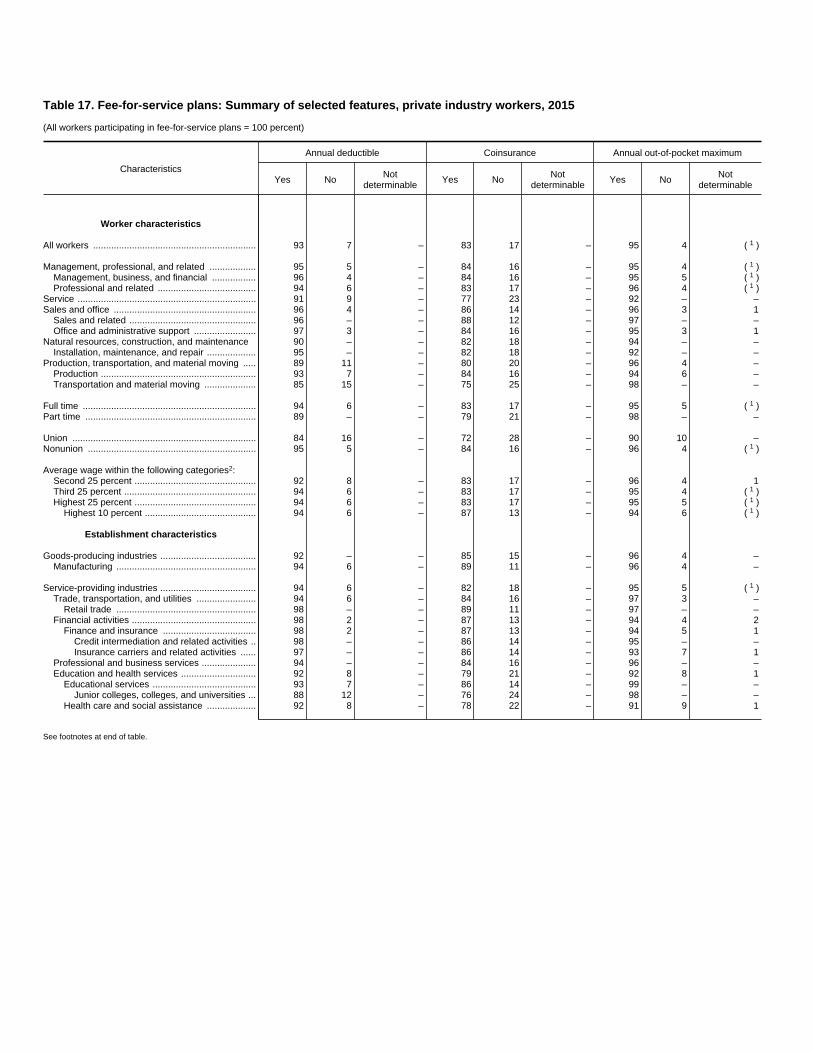
Table 17. Fee-for-service plans: Summary of selected features, private industry workers, 2015
(All workers participating in fee-for-service plans = 100 percent)
Characteristics
Annual deductible Coinsurance Annual out-of-pocket maximum
Yes No Notdeterminable Yes No Not
determinable Yes No Notdeterminable
Worker characteristics
All workers ............................................................... 93 7 – 83 17 – 95 4 1( )
Management, professional, and related .................. 95 5 – 84 16 – 95 4 1( )Management, business, and financial ................. 96 4 – 84 16 – 95 5 1( )Professional and related ...................................... 94 6 – 83 17 – 96 4 1( )
Service ..................................................................... 91 9 – 77 23 – 92 – –Sales and office ....................................................... 96 4 – 86 14 – 96 3 1
Sales and related ................................................. 96 – – 88 12 – 97 – –Office and administrative support ........................ 97 3 – 84 16 – 95 3 1
Natural resources, construction, and maintenance 90 – – 82 18 – 94 – –Installation, maintenance, and repair ................... 95 – – 82 18 – 92 – –
Production, transportation, and material moving ..... 89 11 – 80 20 – 96 4 –Production ............................................................ 93 7 – 84 16 – 94 6 –Transportation and material moving .................... 85 15 – 75 25 – 98 – –
Full time ................................................................... 94 6 – 83 17 – 95 5 1( )Part time .................................................................. 89 – – 79 21 – 98 – –
Union ....................................................................... 84 16 – 72 28 – 90 10 –Nonunion ................................................................. 95 5 – 84 16 – 96 4 1( )
Average wage within the following categories2:Second 25 percent ............................................... 92 8 – 83 17 – 96 4 1Third 25 percent ................................................... 94 6 – 83 17 – 95 4 1( )Highest 25 percent ............................................... 94 6 – 83 17 – 95 5 1( )
Highest 10 percent ........................................... 94 6 – 87 13 – 94 6 1( )
Establishment characteristics
Goods-producing industries ..................................... 92 – – 85 15 – 96 4 –Manufacturing ...................................................... 94 6 – 89 11 – 96 4 –
Service-providing industries ..................................... 94 6 – 82 18 – 95 5 1( )Trade, transportation, and utilities ....................... 94 6 – 84 16 – 97 3 –
Retail trade ...................................................... 98 – – 89 11 – 97 – –Financial activities ................................................ 98 2 – 87 13 – 94 4 2
Finance and insurance .................................... 98 2 – 87 13 – 94 5 1Credit intermediation and related activities .. 98 – – 86 14 – 95 – –Insurance carriers and related activities ...... 97 – – 86 14 – 93 7 1
Professional and business services ..................... 94 – – 84 16 – 96 – –Education and health services ............................. 92 8 – 79 21 – 92 8 1
Educational services ........................................ 93 7 – 86 14 – 99 – –Junior colleges, colleges, and universities ... 88 12 – 76 24 – 98 – –
Health care and social assistance ................... 92 8 – 78 22 – 91 9 1
See footnotes at end of table.

Table 17. Fee-for-service plans: Summary of selected features, private industry workers, 2015—continued
(All workers participating in fee-for-service plans = 100 percent)
Characteristics
Annual deductible Coinsurance Annual out-of-pocket maximum
Yes No Notdeterminable Yes No Not
determinable Yes No Notdeterminable
1 to 99 workers ........................................................ 95 5 – 80 20 – 95 4 1( )50 to 99 workers .................................................. 96 – – 82 18 – 97 – –
100 workers or more ................................................ 92 8 – 85 15 – 95 5 1( )100 to 499 workers .............................................. 92 8 – 83 17 – 95 5 1( )500 workers or more ............................................ 92 8 – 87 13 – 95 4 1( )
Geographic areas
Northeast ................................................................. 92 8 – 73 27 – 89 11 –New England ....................................................... 93 – – 68 32 – 87 – –Middle Atlantic ..................................................... 92 8 – 75 25 – 90 10 –
South ....................................................................... 94 6 – 82 18 – 96 4 1South Atlantic ....................................................... 95 5 – 82 18 – 96 3 1East South Central ............................................... 92 8 – 80 – – 97 – –West South Central .............................................. 93 – – 82 18 – 95 – –
Midwest .................................................................... 94 6 – 85 15 – 96 4 1East North Central ............................................... 94 6 – 87 13 – 95 5 1( )West North Central .............................................. 94 6 – 82 18 – 98 – –
West ......................................................................... 93 7 – 88 12 – 98 – –Mountain .............................................................. 93 – – 87 – – 100 – –Pacific .................................................................. 93 – – 88 12 – 96 – –
1 Less than 0.5.2 Surveyed occupations are classified into wage categories based on the average wage for the occupation, which may include workers with earnings both above and below the threshold. The
categories were formed using percentile estimates generated using data from the National Compensation Survey publication, "Employer Costs for Employee Compensation - March 2015."
Note: Because of rounding, sums of individual items may not equal totals. Dashes indicate that no data were reported or that data do not meet publication criteria. For definitions of major plans, keyprovisions, and related terms, see the "Glossary of Employee Benefit Terms" at www.bls.gov/ncs/ebs/glossary20152016.htm.
Source: Bureau of Labor Statistics, National Compensation Survey.

Table 17. Standard errors for fee-for-service plans: Summary of selected features, private industry workers, 2015
Characteristics
Annual deductible Coinsurance Annual out-of-pocket maximum
Yes No Notdeterminable Yes No Not
determinable Yes No Notdeterminable
Worker characteristics
All workers ............................................................... 0.8 0.8 – 1.3 1.3 – 0.6 0.6 0.1
Management, professional, and related .................. 0.8 0.8 – 1.8 1.8 – 0.8 0.7 0.1Management, business, and financial ................. 1.0 1.0 – 2.0 2.0 – 1.3 1.2 0.2Professional and related ...................................... 1.3 1.3 – 2.5 2.5 – 0.8 0.8 0.1
Service ..................................................................... 2.6 2.6 – 4.8 4.8 – 2.5 – –Sales and office ....................................................... 0.9 0.9 – 1.5 1.5 – 0.9 0.7 0.4
Sales and related ................................................. 2.2 – – 2.3 2.3 – 1.5 – –Office and administrative support ........................ 0.6 0.6 – 1.8 1.8 – 1.0 0.8 0.5
Natural resources, construction, and maintenance 3.4 – – 4.3 4.3 – 2.0 – –Installation, maintenance, and repair ................... 2.2 – – 4.0 4.0 – 3.1 – –
Production, transportation, and material moving ..... 2.2 2.2 – 2.5 2.5 – 1.0 1.0 –Production ............................................................ 2.0 2.0 – 2.0 2.0 – 1.8 1.8 –Transportation and material moving .................... 3.8 3.8 – 5.1 5.1 – 0.3 – –
Full time ................................................................... 0.8 0.8 – 1.3 1.3 – 0.6 0.6 0.2Part time .................................................................. 3.4 – – 5.5 5.5 – 0.9 – –
Union ....................................................................... 2.5 2.5 – 3.5 3.5 – 2.5 2.5 –Nonunion ................................................................. 0.8 0.8 – 1.3 1.3 – 0.5 0.5 0.2
Average wage within the following categories1:Second 25 percent ............................................... 1.8 1.8 – 2.3 2.3 – 0.8 0.7 0.3Third 25 percent ................................................... 1.1 1.1 – 1.7 1.7 – 1.1 1.0 0.2Highest 25 percent ............................................... 1.0 1.0 – 1.6 1.6 – 0.8 0.8 0.1
Highest 10 percent ........................................... 1.6 1.6 – 2.1 2.1 – 1.3 1.3 0.1
Establishment characteristics
Goods-producing industries ..................................... 2.4 – – 2.5 2.5 – 0.8 0.8 –Manufacturing ...................................................... 1.5 1.5 – 1.7 1.7 – 1.2 1.2 –
Service-providing industries ..................................... 0.7 0.7 – 1.6 1.6 – 0.7 0.7 0.2Trade, transportation, and utilities ....................... 1.4 1.4 – 2.3 2.3 – 0.5 0.5 –
Retail trade ...................................................... 1.0 – – 2.1 2.1 – 1.0 – –Financial activities ................................................ 0.5 0.5 – 1.5 1.5 – 1.8 1.2 1.0
Finance and insurance .................................... 0.6 0.6 – 1.7 1.7 – 2.1 1.2 1.2Credit intermediation and related activities .. 1.0 – – 2.3 2.3 – 2.9 – –Insurance carriers and related activities ...... 1.3 – – 2.9 2.9 – 2.1 2.0 0.3
Professional and business services ..................... 2.2 – – 3.2 3.2 – 1.5 – –Education and health services ............................. 2.1 2.1 – 3.7 3.7 – 1.9 1.8 0.3
Educational services ........................................ 1.7 1.7 – 2.7 2.7 – 0.4 – –Junior colleges, colleges, and universities ... 2.7 2.7 – 4.0 4.0 – 0.7 – –
Health care and social assistance ................... 2.4 2.4 – 4.3 4.3 – 2.2 2.1 0.4
See footnotes at end of table.
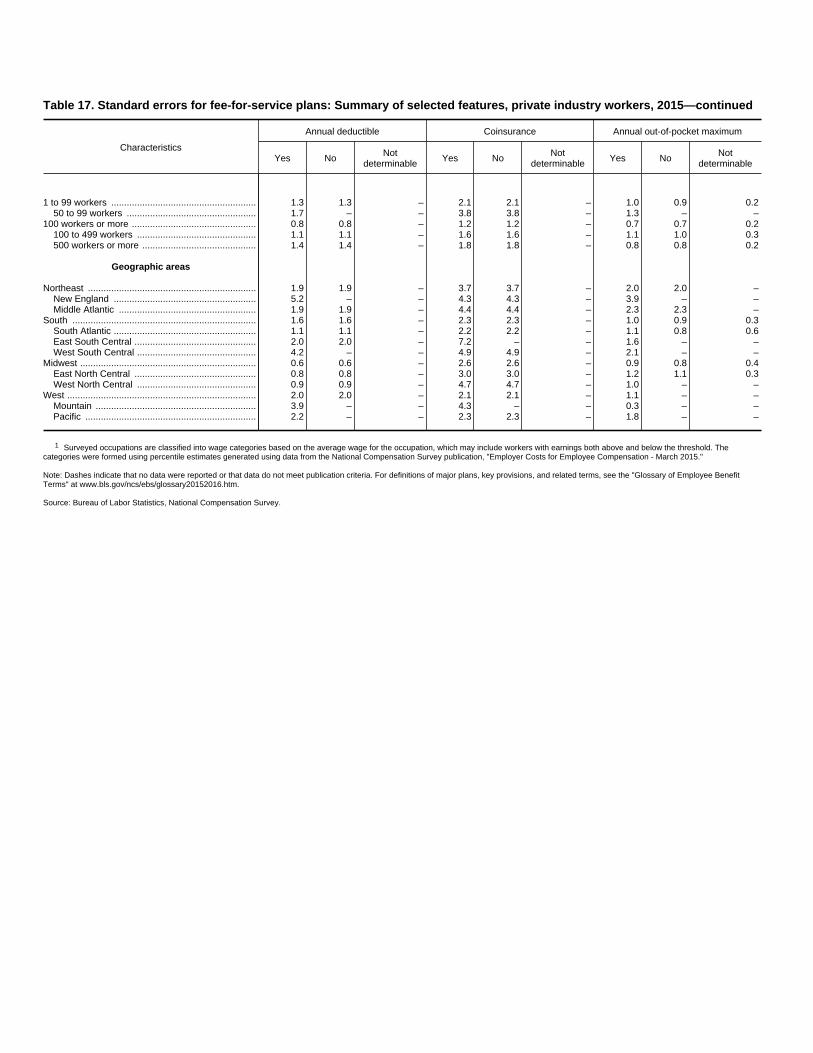
Table 17. Standard errors for fee-for-service plans: Summary of selected features, private industry workers, 2015—continued
Characteristics
Annual deductible Coinsurance Annual out-of-pocket maximum
Yes No Notdeterminable Yes No Not
determinable Yes No Notdeterminable
1 to 99 workers ........................................................ 1.3 1.3 – 2.1 2.1 – 1.0 0.9 0.250 to 99 workers .................................................. 1.7 – – 3.8 3.8 – 1.3 – –
100 workers or more ................................................ 0.8 0.8 – 1.2 1.2 – 0.7 0.7 0.2100 to 499 workers .............................................. 1.1 1.1 – 1.6 1.6 – 1.1 1.0 0.3500 workers or more ............................................ 1.4 1.4 – 1.8 1.8 – 0.8 0.8 0.2
Geographic areas
Northeast ................................................................. 1.9 1.9 – 3.7 3.7 – 2.0 2.0 –New England ....................................................... 5.2 – – 4.3 4.3 – 3.9 – –Middle Atlantic ..................................................... 1.9 1.9 – 4.4 4.4 – 2.3 2.3 –
South ....................................................................... 1.6 1.6 – 2.3 2.3 – 1.0 0.9 0.3South Atlantic ....................................................... 1.1 1.1 – 2.2 2.2 – 1.1 0.8 0.6East South Central ............................................... 2.0 2.0 – 7.2 – – 1.6 – –West South Central .............................................. 4.2 – – 4.9 4.9 – 2.1 – –
Midwest .................................................................... 0.6 0.6 – 2.6 2.6 – 0.9 0.8 0.4East North Central ............................................... 0.8 0.8 – 3.0 3.0 – 1.2 1.1 0.3West North Central .............................................. 0.9 0.9 – 4.7 4.7 – 1.0 – –
West ......................................................................... 2.0 2.0 – 2.1 2.1 – 1.1 – –Mountain .............................................................. 3.9 – – 4.3 – – 0.3 – –Pacific .................................................................. 2.2 – – 2.3 2.3 – 1.8 – –
1 Surveyed occupations are classified into wage categories based on the average wage for the occupation, which may include workers with earnings both above and below the threshold. Thecategories were formed using percentile estimates generated using data from the National Compensation Survey publication, "Employer Costs for Employee Compensation - March 2015."
Note: Dashes indicate that no data were reported or that data do not meet publication criteria. For definitions of major plans, key provisions, and related terms, see the "Glossary of Employee BenefitTerms" at www.bls.gov/ncs/ebs/glossary20152016.htm.
Source: Bureau of Labor Statistics, National Compensation Survey.
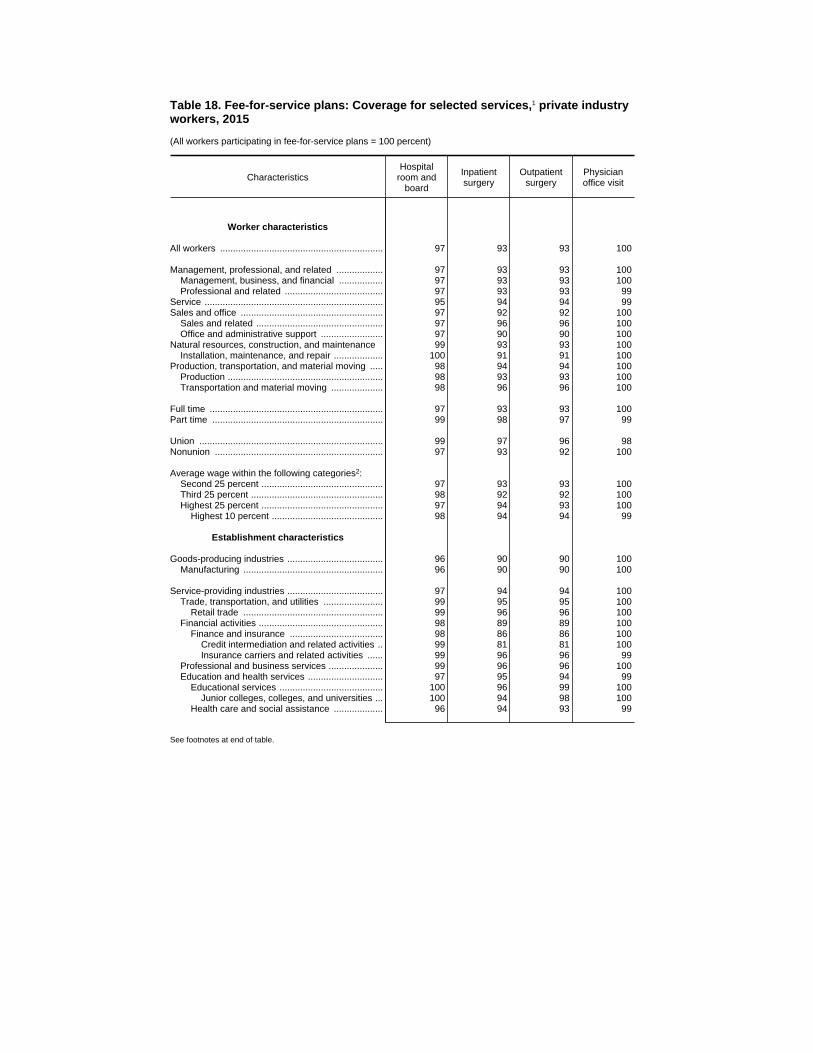
Table 18. Fee-for-service plans: Coverage for selected services,1 private industryworkers, 2015
(All workers participating in fee-for-service plans = 100 percent)
CharacteristicsHospital
room andboard
Inpatientsurgery
Outpatientsurgery
Physicianoffice visit
Worker characteristics
All workers ............................................................... 97 93 93 100
Management, professional, and related .................. 97 93 93 100Management, business, and financial ................. 97 93 93 100Professional and related ...................................... 97 93 93 99
Service ..................................................................... 95 94 94 99Sales and office ....................................................... 97 92 92 100
Sales and related ................................................. 97 96 96 100Office and administrative support ........................ 97 90 90 100
Natural resources, construction, and maintenance 99 93 93 100Installation, maintenance, and repair ................... 100 91 91 100
Production, transportation, and material moving ..... 98 94 94 100Production ............................................................ 98 93 93 100Transportation and material moving .................... 98 96 96 100
Full time ................................................................... 97 93 93 100Part time .................................................................. 99 98 97 99
Union ....................................................................... 99 97 96 98Nonunion ................................................................. 97 93 92 100
Average wage within the following categories2:Second 25 percent ............................................... 97 93 93 100Third 25 percent ................................................... 98 92 92 100Highest 25 percent ............................................... 97 94 93 100
Highest 10 percent ........................................... 98 94 94 99
Establishment characteristics
Goods-producing industries ..................................... 96 90 90 100Manufacturing ...................................................... 96 90 90 100
Service-providing industries ..................................... 97 94 94 100Trade, transportation, and utilities ....................... 99 95 95 100
Retail trade ...................................................... 99 96 96 100Financial activities ................................................ 98 89 89 100
Finance and insurance .................................... 98 86 86 100Credit intermediation and related activities .. 99 81 81 100Insurance carriers and related activities ...... 99 96 96 99
Professional and business services ..................... 99 96 96 100Education and health services ............................. 97 95 94 99
Educational services ........................................ 100 96 99 100Junior colleges, colleges, and universities ... 100 94 98 100
Health care and social assistance ................... 96 94 93 99
See footnotes at end of table.
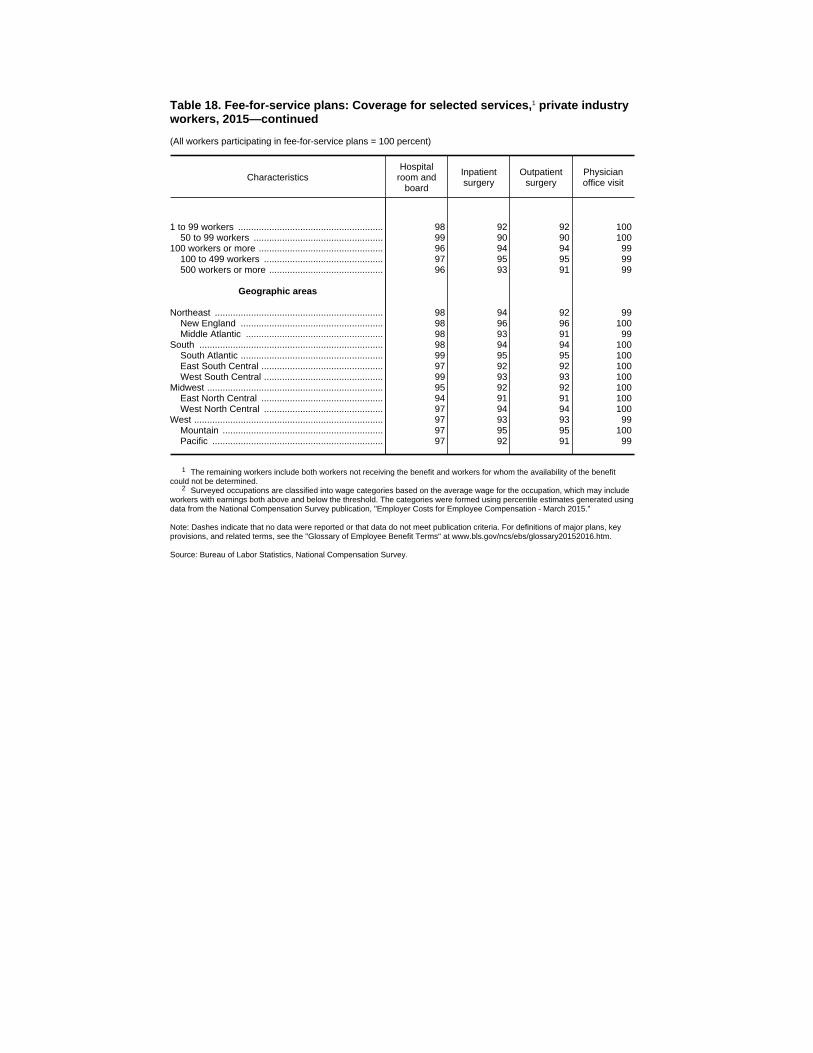
Table 18. Fee-for-service plans: Coverage for selected services,1 private industryworkers, 2015—continued
(All workers participating in fee-for-service plans = 100 percent)
CharacteristicsHospital
room andboard
Inpatientsurgery
Outpatientsurgery
Physicianoffice visit
1 to 99 workers ........................................................ 98 92 92 10050 to 99 workers .................................................. 99 90 90 100
100 workers or more ................................................ 96 94 94 99100 to 499 workers .............................................. 97 95 95 99500 workers or more ............................................ 96 93 91 99
Geographic areas
Northeast ................................................................. 98 94 92 99New England ....................................................... 98 96 96 100Middle Atlantic ..................................................... 98 93 91 99
South ....................................................................... 98 94 94 100South Atlantic ....................................................... 99 95 95 100East South Central ............................................... 97 92 92 100West South Central .............................................. 99 93 93 100
Midwest .................................................................... 95 92 92 100East North Central ............................................... 94 91 91 100West North Central .............................................. 97 94 94 100
West ......................................................................... 97 93 93 99Mountain .............................................................. 97 95 95 100Pacific .................................................................. 97 92 91 99
1 The remaining workers include both workers not receiving the benefit and workers for whom the availability of the benefitcould not be determined.
2 Surveyed occupations are classified into wage categories based on the average wage for the occupation, which may includeworkers with earnings both above and below the threshold. The categories were formed using percentile estimates generated usingdata from the National Compensation Survey publication, "Employer Costs for Employee Compensation - March 2015."
Note: Dashes indicate that no data were reported or that data do not meet publication criteria. For definitions of major plans, keyprovisions, and related terms, see the "Glossary of Employee Benefit Terms" at www.bls.gov/ncs/ebs/glossary20152016.htm.
Source: Bureau of Labor Statistics, National Compensation Survey.

Table 18. Standard errors for fee-for-service plans: Coverage for selectedservices,1 private industry workers, 2015
CharacteristicsHospital
room andboard
Inpatientsurgery
Outpatientsurgery
Physicianoffice visit
Worker characteristics
All workers ............................................................... 0.5 0.7 0.7 0.1
Management, professional, and related .................. 0.5 1.1 1.1 0.2Management, business, and financial ................. 0.8 1.1 1.1 0.3Professional and related ...................................... 0.7 1.7 1.6 0.3
Service ..................................................................... 2.0 2.1 2.1 0.3Sales and office ....................................................... 0.7 1.1 1.1 0.1
Sales and related ................................................. 1.2 1.6 1.6 0.2Office and administrative support ........................ 0.9 1.5 1.5 0.1
Natural resources, construction, and maintenance 0.6 1.5 1.5 0.1Installation, maintenance, and repair ................... 0.1 2.6 2.6 0.2
Production, transportation, and material moving ..... 1.2 1.4 1.4 2( )Production ............................................................ 1.4 2.1 2.1 2( )Transportation and material moving .................... 1.1 1.9 1.9 2( )
Full time ................................................................... 0.5 0.7 0.7 0.1Part time .................................................................. 0.5 0.7 0.8 0.5
Union ....................................................................... 0.9 1.2 1.4 0.6Nonunion ................................................................. 0.5 0.8 0.8 0.1
Average wage within the following categories3:Second 25 percent ............................................... 1.0 1.1 1.1 0.1Third 25 percent ................................................... 0.5 1.2 1.2 0.1Highest 25 percent ............................................... 0.5 0.9 0.9 0.2
Highest 10 percent ........................................... 0.8 1.4 1.4 0.4
Establishment characteristics
Goods-producing industries ..................................... 1.2 1.4 1.4 0.2Manufacturing ...................................................... 1.4 1.6 1.6 0.3
Service-providing industries ..................................... 0.6 0.8 0.8 0.1Trade, transportation, and utilities ....................... 0.4 1.1 1.1 2( )
Retail trade ...................................................... 0.5 0.8 0.8 2( )Financial activities ................................................ 0.6 1.7 1.7 0.4
Finance and insurance .................................... 0.8 1.9 1.9 0.5Credit intermediation and related activities .. 0.4 3.5 3.5 2( )Insurance carriers and related activities ...... 0.5 1.7 1.7 1.2
Professional and business services ..................... 0.8 2.0 1.7 2( )Education and health services ............................. 1.5 1.0 1.4 0.5
Educational services ........................................ 2( ) 2.0 0.8 2( )Junior colleges, colleges, and universities ... 2( ) 3.5 1.3 2( )
Health care and social assistance ................... 1.8 1.1 1.6 0.6
See footnotes at end of table.

Table 18. Standard errors for fee-for-service plans: Coverage for selectedservices,1 private industry workers, 2015—continued
CharacteristicsHospital
room andboard
Inpatientsurgery
Outpatientsurgery
Physicianoffice visit
1 to 99 workers ........................................................ 0.5 1.2 1.2 2( )50 to 99 workers .................................................. 0.4 2.4 2.4 2( )
100 workers or more ................................................ 0.7 0.7 0.8 0.2100 to 499 workers .............................................. 0.9 1.1 1.1 0.3500 workers or more ............................................ 0.8 1.3 1.5 0.3
Geographic areas
Northeast ................................................................. 0.6 1.5 1.6 0.4New England ....................................................... 1.3 1.5 1.5 2( )Middle Atlantic ..................................................... 0.5 1.9 2.0 0.5
South ....................................................................... 0.6 1.2 1.2 0.1South Atlantic ....................................................... 0.7 1.4 1.4 0.1East South Central ............................................... 3.0 3.7 3.7 0.2West South Central .............................................. 0.3 2.1 2.1 0.1
Midwest .................................................................... 1.6 1.1 1.1 2( )East North Central ............................................... 2.3 1.4 1.4 2( )West North Central .............................................. 1.5 1.6 1.6 2( )
West ......................................................................... 0.8 1.7 1.7 0.4Mountain .............................................................. 2.0 2.3 2.3 2( )Pacific .................................................................. 0.6 2.3 2.3 0.6
1 The remaining workers include both workers not receiving the benefit and workers for whom the availability of the benefitcould not be determined.
2 Less than 0.05.3 Surveyed occupations are classified into wage categories based on the average wage for the occupation, which may include
workers with earnings both above and below the threshold. The categories were formed using percentile estimates generated usingdata from the National Compensation Survey publication, "Employer Costs for Employee Compensation - March 2015."
Note: Dashes indicate that no data were reported or that data do not meet publication criteria. For definitions of major plans, keyprovisions, and related terms, see the "Glossary of Employee Benefit Terms" at www.bls.gov/ncs/ebs/glossary20152016.htm.
Source: Bureau of Labor Statistics, National Compensation Survey.
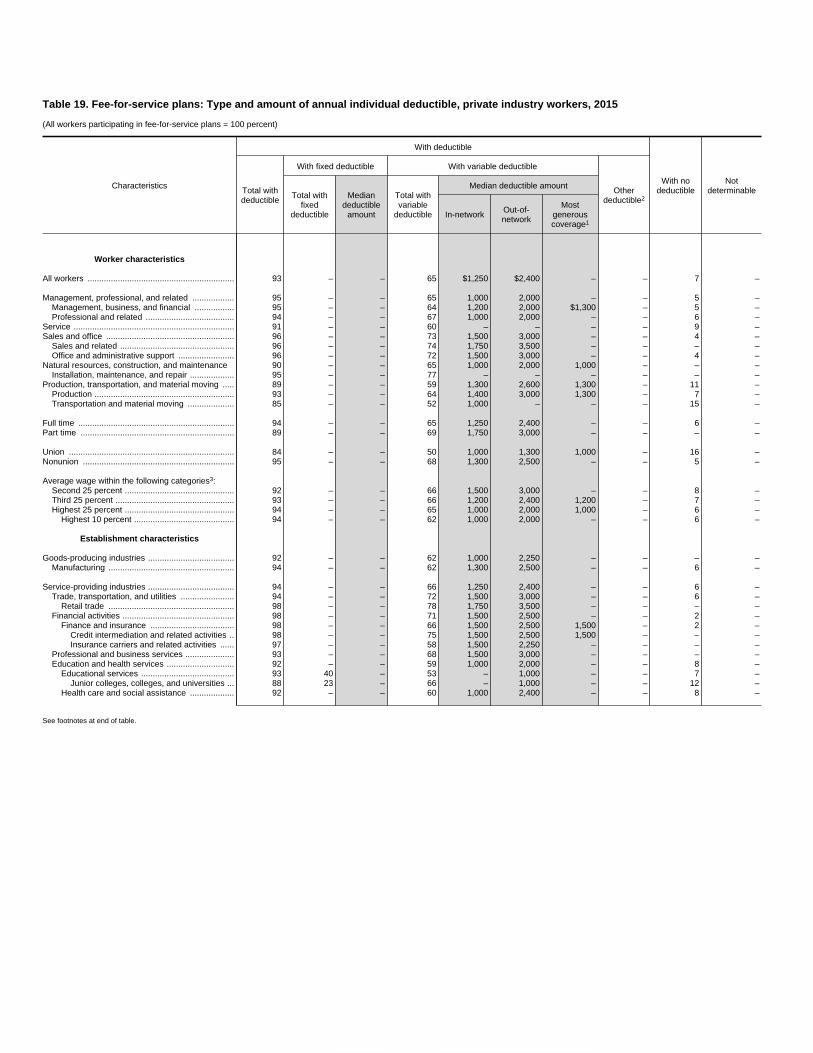
Table 19. Fee-for-service plans: Type and amount of annual individual deductible, private industry workers, 2015
(All workers participating in fee-for-service plans = 100 percent)
Characteristics
With deductible
With nodeductible
NotdeterminableTotal with
deductible
With fixed deductible With variable deductible
Otherdeductible2Total with
fixeddeductible
Mediandeductible
amount
Total withvariable
deductible
Median deductible amount
In-network Out-of-network
Mostgenerouscoverage1
Worker characteristics
All workers ............................................................... 93 – – 65 $1,250 $2,400 – – 7 –
Management, professional, and related .................. 95 – – 65 1,000 2,000 – – 5 –Management, business, and financial ................. 95 – – 64 1,200 2,000 $1,300 – 5 –Professional and related ...................................... 94 – – 67 1,000 2,000 – – 6 –
Service ..................................................................... 91 – – 60 – – – – 9 –Sales and office ....................................................... 96 – – 73 1,500 3,000 – – 4 –
Sales and related ................................................. 96 – – 74 1,750 3,500 – – – –Office and administrative support ........................ 96 – – 72 1,500 3,000 – – 4 –
Natural resources, construction, and maintenance 90 – – 65 1,000 2,000 1,000 – – –Installation, maintenance, and repair ................... 95 – – 77 – – – – – –
Production, transportation, and material moving ..... 89 – – 59 1,300 2,600 1,300 – 11 –Production ............................................................ 93 – – 64 1,400 3,000 1,300 – 7 –Transportation and material moving .................... 85 – – 52 1,000 – – – 15 –
Full time ................................................................... 94 – – 65 1,250 2,400 – – 6 –Part time .................................................................. 89 – – 69 1,750 3,000 – – – –
Union ....................................................................... 84 – – 50 1,000 1,300 1,000 – 16 –Nonunion ................................................................. 95 – – 68 1,300 2,500 – – 5 –
Average wage within the following categories3:Second 25 percent ............................................... 92 – – 66 1,500 3,000 – – 8 –Third 25 percent ................................................... 93 – – 66 1,200 2,400 1,200 – 7 –Highest 25 percent ............................................... 94 – – 65 1,000 2,000 1,000 – 6 –
Highest 10 percent ........................................... 94 – – 62 1,000 2,000 – – 6 –
Establishment characteristics
Goods-producing industries ..................................... 92 – – 62 1,000 2,250 – – – –Manufacturing ...................................................... 94 – – 62 1,300 2,500 – – 6 –
Service-providing industries ..................................... 94 – – 66 1,250 2,400 – – 6 –Trade, transportation, and utilities ....................... 94 – – 72 1,500 3,000 – – 6 –
Retail trade ...................................................... 98 – – 78 1,750 3,500 – – – –Financial activities ................................................ 98 – – 71 1,500 2,500 – – 2 –
Finance and insurance .................................... 98 – – 66 1,500 2,500 1,500 – 2 –Credit intermediation and related activities .. 98 – – 75 1,500 2,500 1,500 – – –Insurance carriers and related activities ...... 97 – – 58 1,500 2,250 – – – –
Professional and business services ..................... 93 – – 68 1,500 3,000 – – – –Education and health services ............................. 92 – – 59 1,000 2,000 – – 8 –
Educational services ........................................ 93 40 – 53 – 1,000 – – 7 –Junior colleges, colleges, and universities ... 88 23 – 66 – 1,000 – – 12 –
Health care and social assistance ................... 92 – – 60 1,000 2,400 – – 8 –
See footnotes at end of table.

Table 19. Fee-for-service plans: Type and amount of annual individual deductible, private industry workers, 2015—continued
(All workers participating in fee-for-service plans = 100 percent)
Characteristics
With deductible
With nodeductible
NotdeterminableTotal with
deductible
With fixed deductible With variable deductible
Otherdeductible2Total with
fixeddeductible
Mediandeductible
amount
Total withvariable
deductible
Median deductible amount
In-network Out-of-network
Mostgenerouscoverage1
1 to 99 workers ........................................................ 94 – – 65 $1,500 $2,600 $2,750 – 6 –50 to 99 workers .................................................. 96 – – 65 1,250 – – – – –
100 workers or more ................................................ 92 – – 65 1,150 2,250 – – 8 –100 to 499 workers .............................................. 92 – – 68 1,500 3,000 1,500 – 8 –500 workers or more ............................................ 92 – – 62 1,000 2,000 – – 8 –
Geographic areas
Northeast ................................................................. 92 – – 61 1,000 2,000 – – 8 –New England ....................................................... 93 – – 65 1,000 – – – – –Middle Atlantic ..................................................... 92 – – 60 1,000 2,000 1,000 – 8 –
South ....................................................................... 94 – – 67 1,500 3,000 – – 6 –South Atlantic ....................................................... 95 – – 69 1,500 2,500 – – 5 –East South Central ............................................... 92 – – 64 1,500 3,000 – – 8 –West South Central .............................................. 93 – – 66 1,500 3,000 – – – –
Midwest .................................................................... 94 – – 71 1,500 3,000 1,300 – 6 –East North Central ............................................... 94 – – 75 1,500 3,000 1,300 – 6 –West North Central .............................................. 93 – – 63 1,250 2,500 1,500 – 7 –
West ......................................................................... 93 – – 59 1,000 2,000 – – 7 –Mountain .............................................................. 93 – – 70 – – – – – –Pacific .................................................................. 93 – – 53 1,000 2,000 – – – –
1 Refers to deductible or coinsurance amounts for the most generous benefits received in Point-of-Service plans.2 Deductible amount vary by additional factors such as employee length of service, salary range, or age of enrollee.3 Surveyed occupations are classified into wage categories based on the average wage for the occupation, which may include workers with earnings both above and below the threshold. The categories were formed using
percentile estimates generated using data from the National Compensation Survey publication, "Employer Costs for Employee Compensation - March 2015."
Note: Because of rounding, sums of individual items may not equal totals. Dashes indicate that no data were reported or that data do not meet publication criteria. For definitions of major plans, key provisions, and related terms,see the "Glossary of Employee Benefit Terms" at www.bls.gov/ncs/ebs/glossary20152016.htm.
Source: Bureau of Labor Statistics, National Compensation Survey.
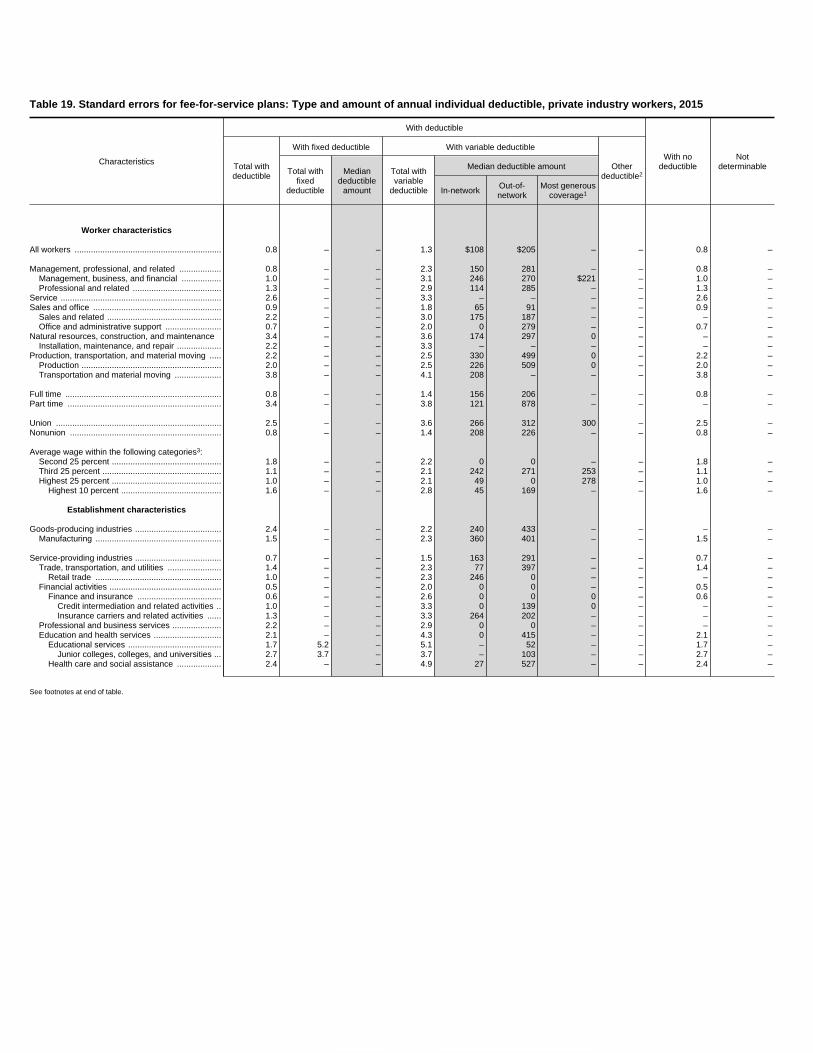
Table 19. Standard errors for fee-for-service plans: Type and amount of annual individual deductible, private industry workers, 2015
Characteristics
With deductible
With nodeductible
NotdeterminableTotal with
deductible
With fixed deductible With variable deductible
Otherdeductible2Total with
fixeddeductible
Mediandeductible
amount
Total withvariable
deductible
Median deductible amount
In-network Out-of-network
Most generouscoverage1
Worker characteristics
All workers ............................................................... 0.8 – – 1.3 $108 $205 – – 0.8 –
Management, professional, and related .................. 0.8 – – 2.3 150 281 – – 0.8 –Management, business, and financial ................. 1.0 – – 3.1 246 270 $221 – 1.0 –Professional and related ...................................... 1.3 – – 2.9 114 285 – – 1.3 –
Service ..................................................................... 2.6 – – 3.3 – – – – 2.6 –Sales and office ....................................................... 0.9 – – 1.8 65 91 – – 0.9 –
Sales and related ................................................. 2.2 – – 3.0 175 187 – – – –Office and administrative support ........................ 0.7 – – 2.0 0 279 – – 0.7 –
Natural resources, construction, and maintenance 3.4 – – 3.6 174 297 0 – – –Installation, maintenance, and repair ................... 2.2 – – 3.3 – – – – – –
Production, transportation, and material moving ..... 2.2 – – 2.5 330 499 0 – 2.2 –Production ............................................................ 2.0 – – 2.5 226 509 0 – 2.0 –Transportation and material moving .................... 3.8 – – 4.1 208 – – – 3.8 –
Full time ................................................................... 0.8 – – 1.4 156 206 – – 0.8 –Part time .................................................................. 3.4 – – 3.8 121 878 – – – –
Union ....................................................................... 2.5 – – 3.6 266 312 300 – 2.5 –Nonunion ................................................................. 0.8 – – 1.4 208 226 – – 0.8 –
Average wage within the following categories3:Second 25 percent ............................................... 1.8 – – 2.2 0 0 – – 1.8 –Third 25 percent ................................................... 1.1 – – 2.1 242 271 253 – 1.1 –Highest 25 percent ............................................... 1.0 – – 2.1 49 0 278 – 1.0 –
Highest 10 percent ........................................... 1.6 – – 2.8 45 169 – – 1.6 –
Establishment characteristics
Goods-producing industries ..................................... 2.4 – – 2.2 240 433 – – – –Manufacturing ...................................................... 1.5 – – 2.3 360 401 – – 1.5 –
Service-providing industries ..................................... 0.7 – – 1.5 163 291 – – 0.7 –Trade, transportation, and utilities ....................... 1.4 – – 2.3 77 397 – – 1.4 –
Retail trade ...................................................... 1.0 – – 2.3 246 0 – – – –Financial activities ................................................ 0.5 – – 2.0 0 0 – – 0.5 –
Finance and insurance .................................... 0.6 – – 2.6 0 0 0 – 0.6 –Credit intermediation and related activities .. 1.0 – – 3.3 0 139 0 – – –Insurance carriers and related activities ...... 1.3 – – 3.3 264 202 – – – –
Professional and business services ..................... 2.2 – – 2.9 0 0 – – – –Education and health services ............................. 2.1 – – 4.3 0 415 – – 2.1 –
Educational services ........................................ 1.7 5.2 – 5.1 – 52 – – 1.7 –Junior colleges, colleges, and universities ... 2.7 3.7 – 3.7 – 103 – – 2.7 –
Health care and social assistance ................... 2.4 – – 4.9 27 527 – – 2.4 –
See footnotes at end of table.
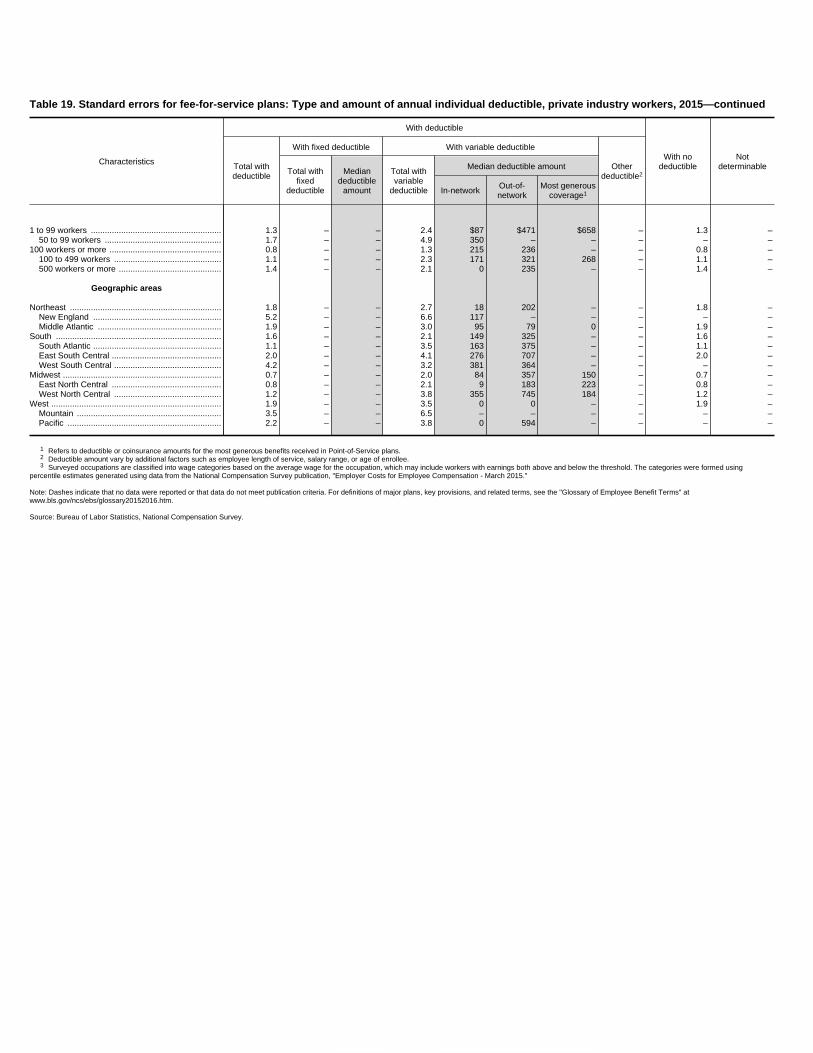
Table 19. Standard errors for fee-for-service plans: Type and amount of annual individual deductible, private industry workers, 2015—continued
Characteristics
With deductible
With nodeductible
NotdeterminableTotal with
deductible
With fixed deductible With variable deductible
Otherdeductible2Total with
fixeddeductible
Mediandeductible
amount
Total withvariable
deductible
Median deductible amount
In-network Out-of-network
Most generouscoverage1
1 to 99 workers ........................................................ 1.3 – – 2.4 $87 $471 $658 – 1.3 –50 to 99 workers .................................................. 1.7 – – 4.9 350 – – – – –
100 workers or more ................................................ 0.8 – – 1.3 215 236 – – 0.8 –100 to 499 workers .............................................. 1.1 – – 2.3 171 321 268 – 1.1 –500 workers or more ............................................ 1.4 – – 2.1 0 235 – – 1.4 –
Geographic areas
Northeast ................................................................. 1.8 – – 2.7 18 202 – – 1.8 –New England ....................................................... 5.2 – – 6.6 117 – – – – –Middle Atlantic ..................................................... 1.9 – – 3.0 95 79 0 – 1.9 –
South ....................................................................... 1.6 – – 2.1 149 325 – – 1.6 –South Atlantic ....................................................... 1.1 – – 3.5 163 375 – – 1.1 –East South Central ............................................... 2.0 – – 4.1 276 707 – – 2.0 –West South Central .............................................. 4.2 – – 3.2 381 364 – – – –
Midwest .................................................................... 0.7 – – 2.0 84 357 150 – 0.7 –East North Central ............................................... 0.8 – – 2.1 9 183 223 – 0.8 –West North Central .............................................. 1.2 – – 3.8 355 745 184 – 1.2 –
West ......................................................................... 1.9 – – 3.5 0 0 – – 1.9 –Mountain .............................................................. 3.5 – – 6.5 – – – – – –Pacific .................................................................. 2.2 – – 3.8 0 594 – – – –
1 Refers to deductible or coinsurance amounts for the most generous benefits received in Point-of-Service plans.2 Deductible amount vary by additional factors such as employee length of service, salary range, or age of enrollee.3 Surveyed occupations are classified into wage categories based on the average wage for the occupation, which may include workers with earnings both above and below the threshold. The categories were formed using
percentile estimates generated using data from the National Compensation Survey publication, "Employer Costs for Employee Compensation - March 2015."
Note: Dashes indicate that no data were reported or that data do not meet publication criteria. For definitions of major plans, key provisions, and related terms, see the "Glossary of Employee Benefit Terms" atwww.bls.gov/ncs/ebs/glossary20152016.htm.
Source: Bureau of Labor Statistics, National Compensation Survey.

Table 20. Fee-for-service plans: Type and amount of annual family deductible, private industry workers, 2015
(All workers participating in fee-for-service plans = 100 percent)
Characteristics
With deductible
With nodeductible
NotdeterminableTotal with
deductible
With fixed deductible With variable deductible
Otherdeductible2Total with
fixeddeductible
Mediandeductible
amount
Total withvariable
deductible
Median deductible amount
In-network Out-of-network
Mostgenerouscoverage1
Worker characteristics
All workers ............................................................... 93 – – 65 $3,000 $5,800 – – 7 –
Management, professional, and related .................. 95 – – 65 2,600 5,000 – – 5 –Management, business, and financial ................. 95 – – 64 2,600 4,800 $2,700 – 5 –Professional and related ...................................... 94 – – 66 2,600 5,000 – – 6 –
Service ..................................................................... 91 – – 59 – – – – 9 –Sales and office ....................................................... 96 – – 73 3,200 6,000 3,600 – 4 –
Sales and related ................................................. 95 – – 73 4,000 7,600 – – – –Office and administrative support ........................ 97 – – 72 3,000 6,000 – – 3 –
Natural resources, construction, and maintenance 90 – – 65 2,400 4,000 2,000 – – –Installation, maintenance, and repair ................... 94 – – 77 3,000 4,500 – – – –
Production, transportation, and material moving ..... 87 – – 57 3,000 6,000 3,000 – 13 –Production ............................................................ 93 – – 64 3,000 6,000 3,000 – 7 –Transportation and material moving .................... 81 – – 48 – 4,500 – – 19 –
Full time ................................................................... 93 – – 65 3,000 5,500 – – 7 –Part time .................................................................. 88 – – 68 3,500 – 3,000 – 12 –
Union ....................................................................... 83 – – 50 2,000 2,600 3,000 – 17 –Nonunion ................................................................. 94 – – 67 3,000 6,000 – – 6 –
Average wage within the following categories3:Second 25 percent ............................................... 91 – – 65 3,000 6,000 – – 9 –Third 25 percent ................................................... 93 – – 65 3,000 6,000 2,600 – 7 –Highest 25 percent ............................................... 93 – – 64 2,500 4,800 – – 7 –
Highest 10 percent ........................................... 94 – – 62 2,800 5,000 – – 6 –
Establishment characteristics
Goods-producing industries ..................................... 92 – – 62 3,000 6,000 – – 8 –Manufacturing ...................................................... 94 – – 62 3,000 6,000 – – 6 –
Service-providing industries ..................................... 93 – – 66 3,000 5,000 – – 7 –Trade, transportation, and utilities ....................... 93 – – 71 3,000 6,000 – – 7 –
Retail trade ...................................................... 95 – – 76 3,500 7,000 – – – –Financial activities ................................................ 98 – – 71 3,000 5,000 – – 2 –
Finance and insurance .................................... 97 – – 65 3,000 5,000 2,600 – 3 –Credit intermediation and related activities .. 97 – – 74 3,000 5,000 2,600 – – –Insurance carriers and related activities ...... 97 – – 58 3,000 5,000 – – – –
Professional and business services ..................... 94 – – 69 3,600 7,000 – – – –Education and health services ............................. 91 – – 58 2,100 5,000 – – 9 –
Educational services ........................................ 93 40 – 53 1,500 2,500 2,000 – 7 –Junior colleges, colleges, and universities ... 88 23 $2,000 65 1,800 3,000 2,000 – 12 –
Health care and social assistance ................... 91 – – 59 2,300 5,000 – – 9 –
See footnotes at end of table.

Table 20. Fee-for-service plans: Type and amount of annual family deductible, private industry workers, 2015—continued
(All workers participating in fee-for-service plans = 100 percent)
Characteristics
With deductible
With nodeductible
NotdeterminableTotal with
deductible
With fixed deductible With variable deductible
Otherdeductible2Total with
fixeddeductible
Mediandeductible
amount
Total withvariable
deductible
Median deductible amount
In-network Out-of-network
Mostgenerouscoverage1
1 to 99 workers ........................................................ 94 – – 65 $3,000 $6,000 $4,500 – 6 –50 to 99 workers .................................................. 95 – – 64 2,500 5,500 – – – –
100 workers or more ................................................ 92 – – 65 3,000 5,000 – – 8 –100 to 499 workers .............................................. 92 – – 67 3,000 6,000 3,000 – 8 –500 workers or more ............................................ 92 – – 62 2,250 4,000 1,500 – 8 –
Geographic areas
Northeast ................................................................. 92 – – 61 2,600 4,800 – – 8 –New England ....................................................... 93 – – 65 – – – – – –Middle Atlantic ..................................................... 91 – – 60 3,000 5,000 3,000 – 9 –
South ....................................................................... 93 – – 66 3,000 6,000 – – 7 –South Atlantic ....................................................... 94 – – 68 3,000 5,000 – – 6 –East South Central ............................................... 91 – – 63 3,000 7,000 4,000 – 9 –West South Central .............................................. 93 – – 66 3,000 6,750 – – – –
Midwest .................................................................... 93 – – 71 3,000 6,000 3,000 – 7 –East North Central ............................................... 93 – – 74 3,000 6,000 3,000 – 7 –West North Central .............................................. 93 – – 63 3,000 6,000 3,000 – 7 –
West ......................................................................... 92 – – 58 2,000 4,000 – – 8 –Mountain .............................................................. 92 – – 69 – – – – – –Pacific .................................................................. 92 – – 52 2,250 – – – 8 –
1 Refers to deductible or coinsurance amounts for the most generous benefits received in Point-of-Service plans.2 Deductible amount vary by additional factors such as employee length of service, salary range, or age of enrollee.3 Surveyed occupations are classified into wage categories based on the average wage for the occupation, which may include workers with earnings both above and below the threshold. The categories were formed
using percentile estimates generated using data from the National Compensation Survey publication, "Employer Costs for Employee Compensation - March 2015."
Note: Because of rounding, sums of individual items may not equal totals. Dashes indicate that no data were reported or that data do not meet publication criteria. For definitions of major plans, key provisions, and relatedterms, see the "Glossary of Employee Benefit Terms" at www.bls.gov/ncs/ebs/glossary20152016.htm.
Source: Bureau of Labor Statistics, National Compensation Survey.
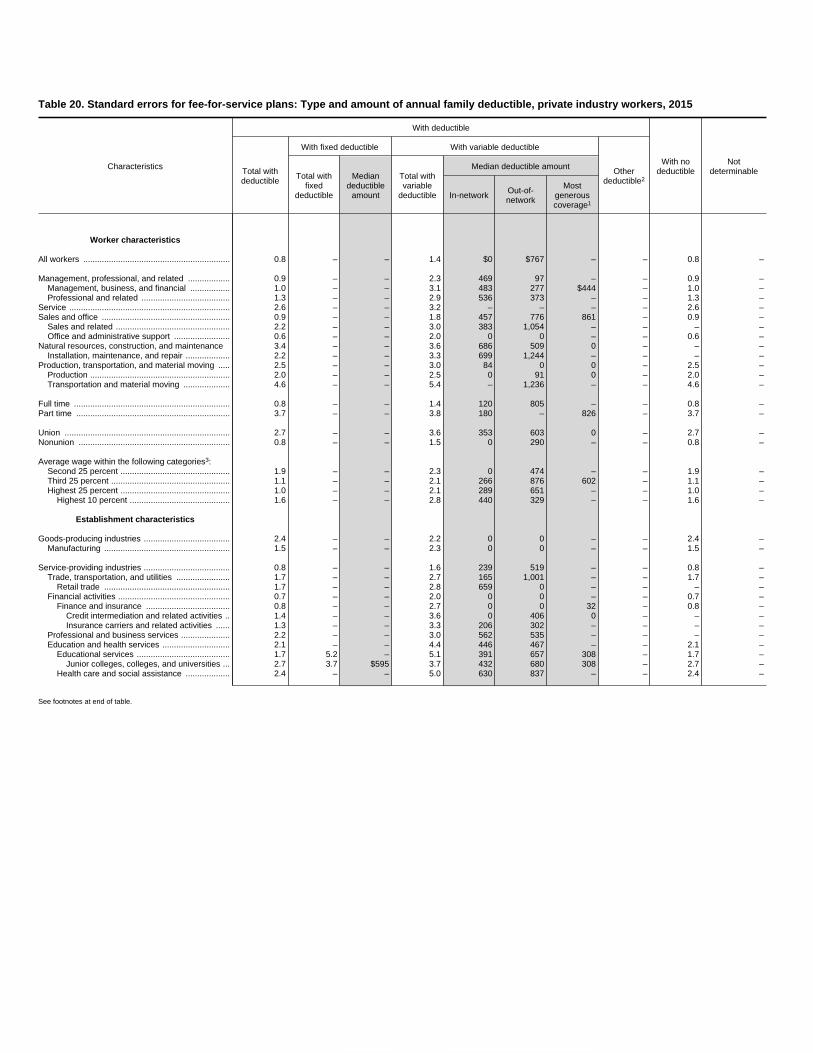
Table 20. Standard errors for fee-for-service plans: Type and amount of annual family deductible, private industry workers, 2015
Characteristics
With deductible
With nodeductible
NotdeterminableTotal with
deductible
With fixed deductible With variable deductible
Otherdeductible2Total with
fixeddeductible
Mediandeductible
amount
Total withvariable
deductible
Median deductible amount
In-network Out-of-network
Mostgenerouscoverage1
Worker characteristics
All workers ............................................................... 0.8 – – 1.4 $0 $767 – – 0.8 –
Management, professional, and related .................. 0.9 – – 2.3 469 97 – – 0.9 –Management, business, and financial ................. 1.0 – – 3.1 483 277 $444 – 1.0 –Professional and related ...................................... 1.3 – – 2.9 536 373 – – 1.3 –
Service ..................................................................... 2.6 – – 3.2 – – – – 2.6 –Sales and office ....................................................... 0.9 – – 1.8 457 776 861 – 0.9 –
Sales and related ................................................. 2.2 – – 3.0 383 1,054 – – – –Office and administrative support ........................ 0.6 – – 2.0 0 0 – – 0.6 –
Natural resources, construction, and maintenance 3.4 – – 3.6 686 509 0 – – –Installation, maintenance, and repair ................... 2.2 – – 3.3 699 1,244 – – – –
Production, transportation, and material moving ..... 2.5 – – 3.0 84 0 0 – 2.5 –Production ............................................................ 2.0 – – 2.5 0 91 0 – 2.0 –Transportation and material moving .................... 4.6 – – 5.4 – 1,236 – – 4.6 –
Full time ................................................................... 0.8 – – 1.4 120 805 – – 0.8 –Part time .................................................................. 3.7 – – 3.8 180 – 826 – 3.7 –
Union ....................................................................... 2.7 – – 3.6 353 603 0 – 2.7 –Nonunion ................................................................. 0.8 – – 1.5 0 290 – – 0.8 –
Average wage within the following categories3:Second 25 percent ............................................... 1.9 – – 2.3 0 474 – – 1.9 –Third 25 percent ................................................... 1.1 – – 2.1 266 876 602 – 1.1 –Highest 25 percent ............................................... 1.0 – – 2.1 289 651 – – 1.0 –
Highest 10 percent ........................................... 1.6 – – 2.8 440 329 – – 1.6 –
Establishment characteristics
Goods-producing industries ..................................... 2.4 – – 2.2 0 0 – – 2.4 –Manufacturing ...................................................... 1.5 – – 2.3 0 0 – – 1.5 –
Service-providing industries ..................................... 0.8 – – 1.6 239 519 – – 0.8 –Trade, transportation, and utilities ....................... 1.7 – – 2.7 165 1,001 – – 1.7 –
Retail trade ...................................................... 1.7 – – 2.8 659 0 – – – –Financial activities ................................................ 0.7 – – 2.0 0 0 – – 0.7 –
Finance and insurance .................................... 0.8 – – 2.7 0 0 32 – 0.8 –Credit intermediation and related activities .. 1.4 – – 3.6 0 406 0 – – –Insurance carriers and related activities ...... 1.3 – – 3.3 206 302 – – – –
Professional and business services ..................... 2.2 – – 3.0 562 535 – – – –Education and health services ............................. 2.1 – – 4.4 446 467 – – 2.1 –
Educational services ........................................ 1.7 5.2 – 5.1 391 657 308 – 1.7 –Junior colleges, colleges, and universities ... 2.7 3.7 $595 3.7 432 680 308 – 2.7 –
Health care and social assistance ................... 2.4 – – 5.0 630 837 – – 2.4 –
See footnotes at end of table.
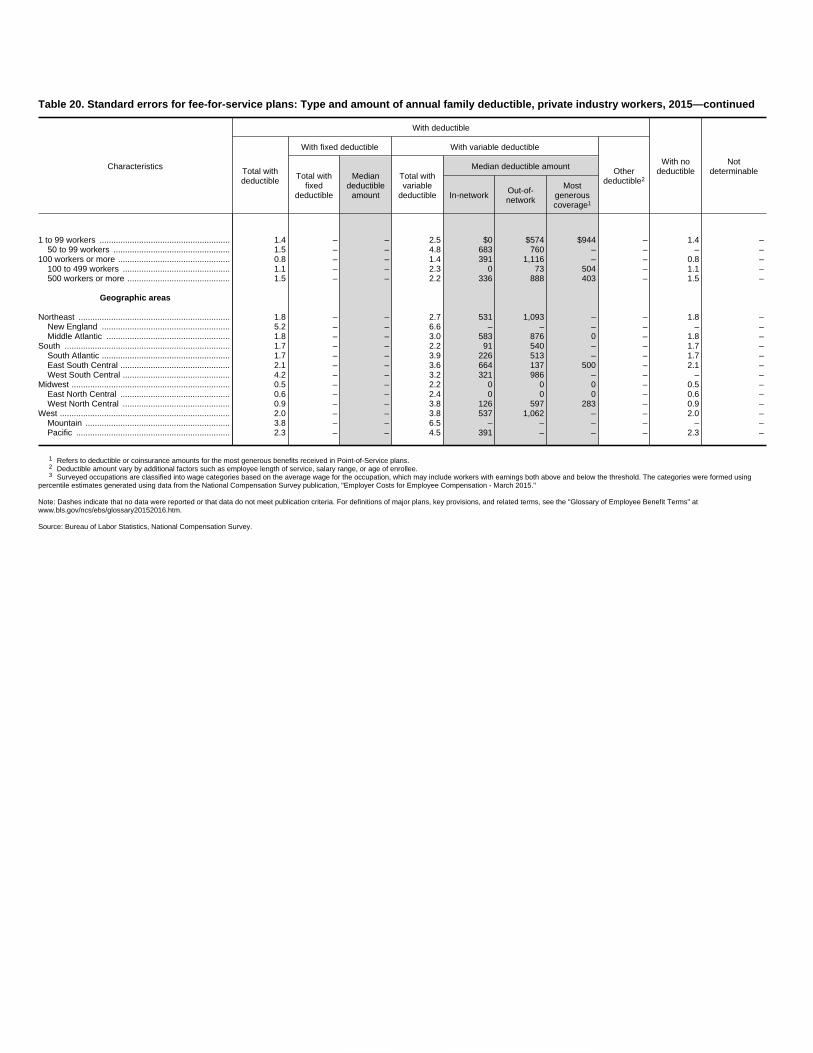
Table 20. Standard errors for fee-for-service plans: Type and amount of annual family deductible, private industry workers, 2015—continued
Characteristics
With deductible
With nodeductible
NotdeterminableTotal with
deductible
With fixed deductible With variable deductible
Otherdeductible2Total with
fixeddeductible
Mediandeductible
amount
Total withvariable
deductible
Median deductible amount
In-network Out-of-network
Mostgenerouscoverage1
1 to 99 workers ........................................................ 1.4 – – 2.5 $0 $574 $944 – 1.4 –50 to 99 workers .................................................. 1.5 – – 4.8 683 760 – – – –
100 workers or more ................................................ 0.8 – – 1.4 391 1,116 – – 0.8 –100 to 499 workers .............................................. 1.1 – – 2.3 0 73 504 – 1.1 –500 workers or more ............................................ 1.5 – – 2.2 336 888 403 – 1.5 –
Geographic areas
Northeast ................................................................. 1.8 – – 2.7 531 1,093 – – 1.8 –New England ....................................................... 5.2 – – 6.6 – – – – – –Middle Atlantic ..................................................... 1.8 – – 3.0 583 876 0 – 1.8 –
South ....................................................................... 1.7 – – 2.2 91 540 – – 1.7 –South Atlantic ....................................................... 1.7 – – 3.9 226 513 – – 1.7 –East South Central ............................................... 2.1 – – 3.6 664 137 500 – 2.1 –West South Central .............................................. 4.2 – – 3.2 321 986 – – – –
Midwest .................................................................... 0.5 – – 2.2 0 0 0 – 0.5 –East North Central ............................................... 0.6 – – 2.4 0 0 0 – 0.6 –West North Central .............................................. 0.9 – – 3.8 126 597 283 – 0.9 –
West ......................................................................... 2.0 – – 3.8 537 1,062 – – 2.0 –Mountain .............................................................. 3.8 – – 6.5 – – – – – –Pacific .................................................................. 2.3 – – 4.5 391 – – – 2.3 –
1 Refers to deductible or coinsurance amounts for the most generous benefits received in Point-of-Service plans.2 Deductible amount vary by additional factors such as employee length of service, salary range, or age of enrollee.3 Surveyed occupations are classified into wage categories based on the average wage for the occupation, which may include workers with earnings both above and below the threshold. The categories were formed using
percentile estimates generated using data from the National Compensation Survey publication, "Employer Costs for Employee Compensation - March 2015."
Note: Dashes indicate that no data were reported or that data do not meet publication criteria. For definitions of major plans, key provisions, and related terms, see the "Glossary of Employee Benefit Terms" atwww.bls.gov/ncs/ebs/glossary20152016.htm.
Source: Bureau of Labor Statistics, National Compensation Survey.
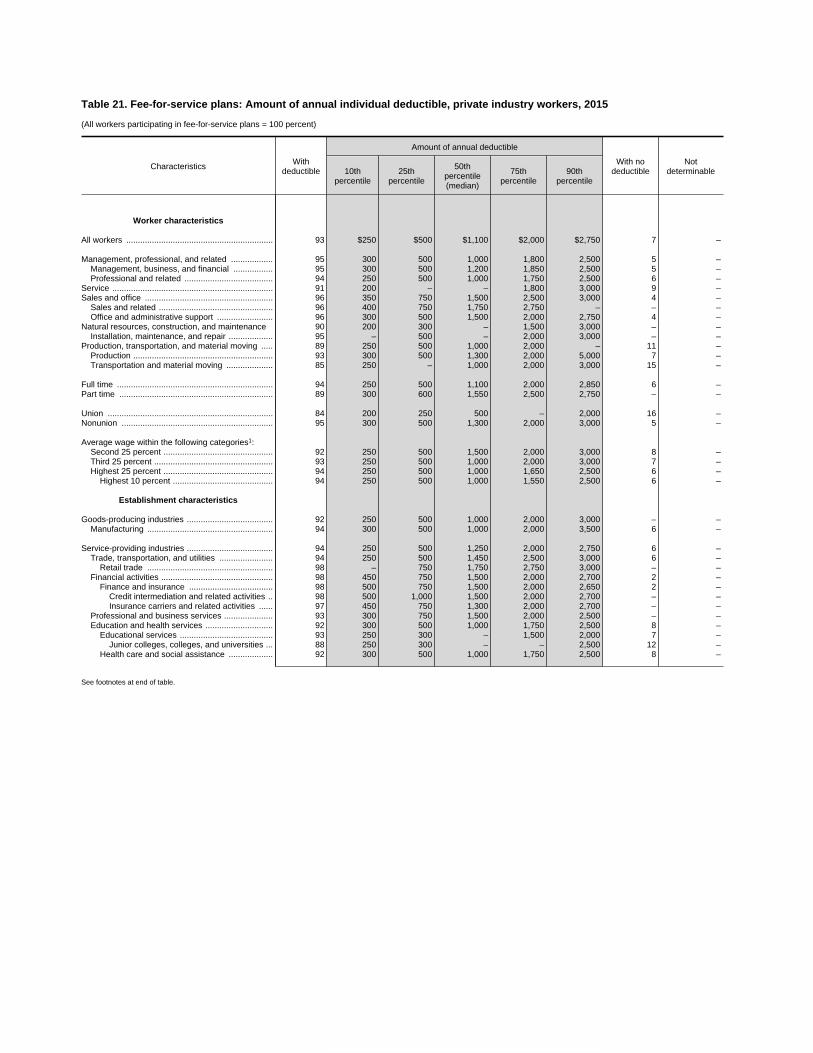
Table 21. Fee-for-service plans: Amount of annual individual deductible, private industry workers, 2015
(All workers participating in fee-for-service plans = 100 percent)
Characteristics Withdeductible
Amount of annual deductible
With nodeductible
Notdeterminable10th
percentile25th
percentile
50thpercentile(median)
75thpercentile
90thpercentile
Worker characteristics
All workers ............................................................... 93 $250 $500 $1,100 $2,000 $2,750 7 –
Management, professional, and related .................. 95 300 500 1,000 1,800 2,500 5 –Management, business, and financial ................. 95 300 500 1,200 1,850 2,500 5 –Professional and related ...................................... 94 250 500 1,000 1,750 2,500 6 –
Service ..................................................................... 91 200 – – 1,800 3,000 9 –Sales and office ....................................................... 96 350 750 1,500 2,500 3,000 4 –
Sales and related ................................................. 96 400 750 1,750 2,750 – – –Office and administrative support ........................ 96 300 500 1,500 2,000 2,750 4 –
Natural resources, construction, and maintenance 90 200 300 – 1,500 3,000 – –Installation, maintenance, and repair ................... 95 – 500 – 2,000 3,000 – –
Production, transportation, and material moving ..... 89 250 500 1,000 2,000 – 11 –Production ............................................................ 93 300 500 1,300 2,000 5,000 7 –Transportation and material moving .................... 85 250 – 1,000 2,000 3,000 15 –
Full time ................................................................... 94 250 500 1,100 2,000 2,850 6 –Part time .................................................................. 89 300 600 1,550 2,500 2,750 – –
Union ....................................................................... 84 200 250 500 – 2,000 16 –Nonunion ................................................................. 95 300 500 1,300 2,000 3,000 5 –
Average wage within the following categories1:Second 25 percent ............................................... 92 250 500 1,500 2,000 3,000 8 –Third 25 percent ................................................... 93 250 500 1,000 2,000 3,000 7 –Highest 25 percent ............................................... 94 250 500 1,000 1,650 2,500 6 –
Highest 10 percent ........................................... 94 250 500 1,000 1,550 2,500 6 –
Establishment characteristics
Goods-producing industries ..................................... 92 250 500 1,000 2,000 3,000 – –Manufacturing ...................................................... 94 300 500 1,000 2,000 3,500 6 –
Service-providing industries ..................................... 94 250 500 1,250 2,000 2,750 6 –Trade, transportation, and utilities ....................... 94 250 500 1,450 2,500 3,000 6 –
Retail trade ...................................................... 98 – 750 1,750 2,750 3,000 – –Financial activities ................................................ 98 450 750 1,500 2,000 2,700 2 –
Finance and insurance .................................... 98 500 750 1,500 2,000 2,650 2 –Credit intermediation and related activities .. 98 500 1,000 1,500 2,000 2,700 – –Insurance carriers and related activities ...... 97 450 750 1,300 2,000 2,700 – –
Professional and business services ..................... 93 300 750 1,500 2,000 2,500 – –Education and health services ............................. 92 300 500 1,000 1,750 2,500 8 –
Educational services ........................................ 93 250 300 – 1,500 2,000 7 –Junior colleges, colleges, and universities ... 88 250 300 – – 2,500 12 –
Health care and social assistance ................... 92 300 500 1,000 1,750 2,500 8 –
See footnotes at end of table.

Table 21. Fee-for-service plans: Amount of annual individual deductible, private industry workers, 2015—continued
(All workers participating in fee-for-service plans = 100 percent)
Characteristics Withdeductible
Amount of annual deductible
With nodeductible
Notdeterminable10th
percentile25th
percentile
50thpercentile(median)
75thpercentile
90thpercentile
1 to 99 workers ........................................................ 94 $300 $500 $1,250 $2,000 $3,000 6 –50 to 99 workers .................................................. 96 250 500 1,000 2,000 4,000 – –
100 workers or more ................................................ 92 250 500 1,000 1,900 2,750 8 –100 to 499 workers .............................................. 92 250 500 1,300 2,000 3,000 8 –500 workers or more ............................................ 92 250 400 1,000 1,500 2,000 8 –
Geographic areas
Northeast ................................................................. 92 250 500 1,150 1,800 2,500 8 –New England ....................................................... 93 – 500 – 1,500 2,500 – –Middle Atlantic ..................................................... 92 250 500 1,250 2,000 – 8 –
South ....................................................................... 94 250 500 1,250 2,250 3,000 6 –South Atlantic ....................................................... 95 250 500 1,250 2,500 3,500 5 –East South Central ............................................... 92 500 750 1,100 – 3,000 8 –West South Central .............................................. 93 250 500 1,300 2,000 3,000 – –
Midwest .................................................................... 94 300 500 1,300 2,000 2,750 6 –East North Central ............................................... 94 300 600 1,500 2,000 2,750 6 –West North Central .............................................. 93 350 500 – 2,000 2,500 7 –
West ......................................................................... 93 250 300 1,000 1,500 2,500 7 –Mountain .............................................................. 93 200 – 1,000 1,500 2,500 – –Pacific .................................................................. 93 250 300 1,000 1,500 2,500 – –
1 Surveyed occupations are classified into wage categories based on the average wage for the occupation, which may include workers with earnings both above and below the threshold. Thecategories were formed using percentile estimates generated using data from the National Compensation Survey publication, "Employer Costs for Employee Compensation - March 2015."
Note: Because of rounding, sums of individual items may not equal totals. Dashes indicate that no data were reported or that data do not meet publication criteria. For definitions of major plans, keyprovisions, and related terms, see the "Glossary of Employee Benefit Terms" at www.bls.gov/ncs/ebs/glossary20152016.htm.
Source: Bureau of Labor Statistics, National Compensation Survey.

Table 21. Standard errors for fee-for-service plans: Amount of annual individual deductible, private industry workers, 2015
Characteristics Withdeductible
Amount of annual deductible
With nodeductible
Notdeterminable10th
percentile25th
percentile
50thpercentile(median)
75thpercentile
90thpercentile
Worker characteristics
All workers ............................................................... 0.8 $0 $0 $130 $0 $229 0.8 –
Management, professional, and related .................. 0.8 62 0 55 143 0 0.8 –Management, business, and financial ................. 1.0 47 0 190 174 61 1.0 –Professional and related ...................................... 1.3 63 0 36 221 168 1.3 –
Service ..................................................................... 2.6 58 – – 260 293 2.6 –Sales and office ....................................................... 0.9 64 118 0 421 66 0.9 –
Sales and related ................................................. 2.2 87 164 307 0 – – –Office and administrative support ........................ 0.7 30 122 179 0 49 0.7 –
Natural resources, construction, and maintenance 3.4 55 64 – 243 164 – –Installation, maintenance, and repair ................... 2.2 – 47 – 204 848 – –
Production, transportation, and material moving ..... 2.2 16 0 163 0 – 2.2 –Production ............................................................ 2.0 34 0 309 463 1,012 2.0 –Transportation and material moving .................... 3.8 54 – 149 0 223 3.8 –
Full time ................................................................... 0.8 0 0 139 0 220 0.8 –Part time .................................................................. 3.4 54 151 253 267 0 – –
Union ....................................................................... 2.5 22 12 28 – 258 2.5 –Nonunion ................................................................. 0.8 10 18 76 0 248 0.8 –
Average wage within the following categories1:Second 25 percent ............................................... 1.8 29 0 111 271 0 1.8 –Third 25 percent ................................................... 1.1 22 0 18 0 226 1.1 –Highest 25 percent ............................................... 1.0 0 26 0 205 0 1.0 –
Highest 10 percent ........................................... 1.6 0 66 52 221 73 1.6 –
Establishment characteristics
Goods-producing industries ..................................... 2.4 13 61 0 442 534 – –Manufacturing ...................................................... 1.5 24 0 174 295 961 1.5 –
Service-providing industries ..................................... 0.7 9 0 118 0 0 0.7 –Trade, transportation, and utilities ....................... 1.4 9 0 296 332 0 1.4 –
Retail trade ...................................................... 1.0 – 201 0 0 220 – –Financial activities ................................................ 0.5 75 163 52 0 265 0.5 –
Finance and insurance .................................... 0.6 74 102 0 0 143 0.6 –Credit intermediation and related activities .. 1.0 61 292 0 65 351 – –Insurance carriers and related activities ...... 1.3 102 103 296 65 114 – –
Professional and business services ..................... 2.2 68 202 63 0 237 – –Education and health services ............................. 2.1 26 0 0 222 163 2.1 –
Educational services ........................................ 1.7 0 48 – 403 491 1.7 –Junior colleges, colleges, and universities ... 2.7 26 34 – – 0 2.7 –
Health care and social assistance ................... 2.4 0 47 0 231 105 2.4 –
See footnotes at end of table.
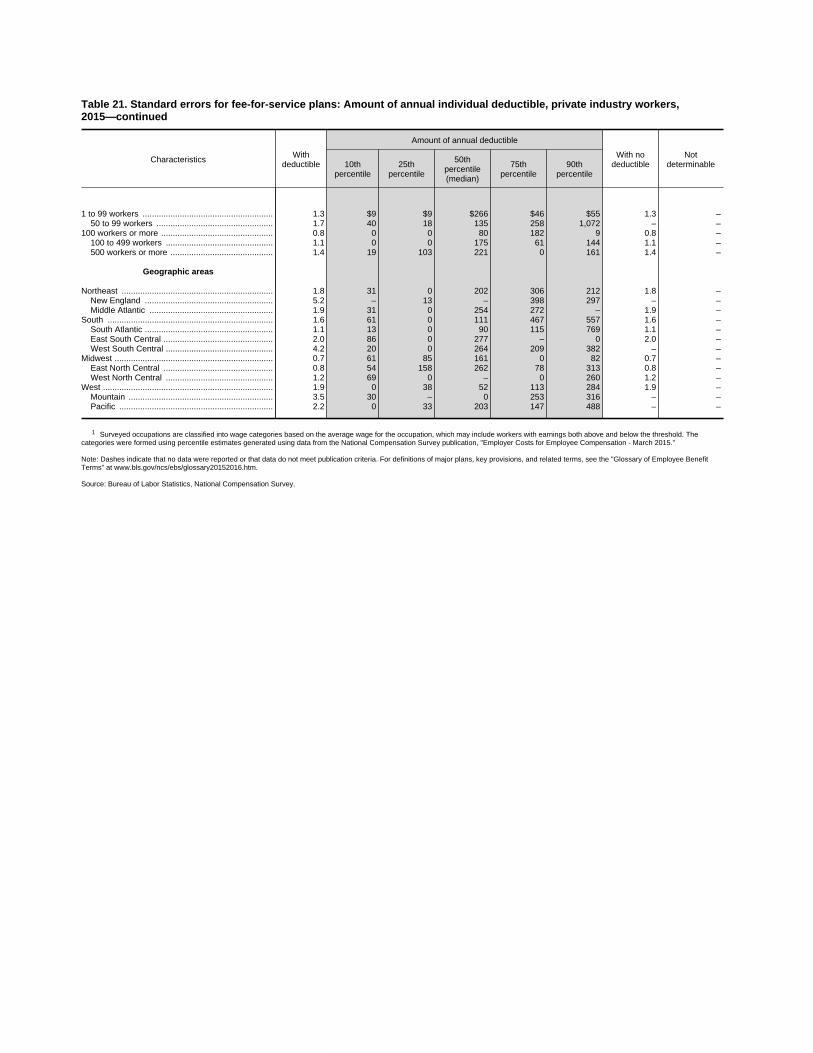
Table 21. Standard errors for fee-for-service plans: Amount of annual individual deductible, private industry workers,2015—continued
Characteristics Withdeductible
Amount of annual deductible
With nodeductible
Notdeterminable10th
percentile25th
percentile
50thpercentile(median)
75thpercentile
90thpercentile
1 to 99 workers ........................................................ 1.3 $9 $9 $266 $46 $55 1.3 –50 to 99 workers .................................................. 1.7 40 18 135 258 1,072 – –
100 workers or more ................................................ 0.8 0 0 80 182 9 0.8 –100 to 499 workers .............................................. 1.1 0 0 175 61 144 1.1 –500 workers or more ............................................ 1.4 19 103 221 0 161 1.4 –
Geographic areas
Northeast ................................................................. 1.8 31 0 202 306 212 1.8 –New England ....................................................... 5.2 – 13 – 398 297 – –Middle Atlantic ..................................................... 1.9 31 0 254 272 – 1.9 –
South ....................................................................... 1.6 61 0 111 467 557 1.6 –South Atlantic ....................................................... 1.1 13 0 90 115 769 1.1 –East South Central ............................................... 2.0 86 0 277 – 0 2.0 –West South Central .............................................. 4.2 20 0 264 209 382 – –
Midwest .................................................................... 0.7 61 85 161 0 82 0.7 –East North Central ............................................... 0.8 54 158 262 78 313 0.8 –West North Central .............................................. 1.2 69 0 – 0 260 1.2 –
West ......................................................................... 1.9 0 38 52 113 284 1.9 –Mountain .............................................................. 3.5 30 – 0 253 316 – –Pacific .................................................................. 2.2 0 33 203 147 488 – –
1 Surveyed occupations are classified into wage categories based on the average wage for the occupation, which may include workers with earnings both above and below the threshold. Thecategories were formed using percentile estimates generated using data from the National Compensation Survey publication, "Employer Costs for Employee Compensation - March 2015."
Note: Dashes indicate that no data were reported or that data do not meet publication criteria. For definitions of major plans, key provisions, and related terms, see the "Glossary of Employee BenefitTerms" at www.bls.gov/ncs/ebs/glossary20152016.htm.
Source: Bureau of Labor Statistics, National Compensation Survey.

Table 22. Fee-for-service plans: Amount of annual family deductible, private industry workers, 2015
(All workers participating in fee-for-service plans = 100 percent)
Characteristics Withdeductible
Amount of annual deductible
With nodeductible
Notdeterminable10th
percentile25th
percentile
50thpercentile(median)
75thpercentile
90thpercentile
Worker characteristics
All workers ............................................................... 93 $600 $1,000 $2,600 $4,000 $6,000 7 –
Management, professional, and related .................. 95 600 1,100 2,500 4,000 5,000 5 –Management, business, and financial ................. 95 700 1,200 2,600 4,000 5,000 5 –Professional and related ...................................... 94 600 1,000 2,500 3,800 5,000 6 –
Service ..................................................................... 91 – 1,000 – 3,750 7,000 9 –Sales and office ....................................................... 96 750 1,500 3,000 5,000 6,000 4 –
Sales and related ................................................. 95 1,000 2,250 3,600 5,500 – – –Office and administrative support ........................ 97 700 1,500 3,000 4,000 5,500 3 –
Natural resources, construction, and maintenance 90 600 800 1,800 4,000 6,000 – –Installation, maintenance, and repair ................... 94 – 1,000 – 4,500 7,500 – –
Production, transportation, and material moving ..... 87 500 1,000 2,500 4,500 7,000 13 –Production ............................................................ 93 – – 3,000 4,550 10,000 7 –Transportation and material moving .................... 81 500 1,000 2,000 4,000 5,500 19 –
Full time ................................................................... 93 600 1,000 2,600 4,000 6,000 7 –Part time .................................................................. 88 700 1,400 3,500 5,500 – 12 –
Union ....................................................................... 83 400 600 1,000 3,000 4,500 17 –Nonunion ................................................................. 94 700 1,200 3,000 4,000 6,000 6 –
Average wage within the following categories1:Second 25 percent ............................................... 91 600 1,200 3,000 4,500 6,000 9 –Third 25 percent ................................................... 93 600 1,000 2,500 4,000 6,000 7 –Highest 25 percent ............................................... 93 600 1,000 2,500 3,750 5,000 7 –
Highest 10 percent ........................................... 94 – 1,000 2,600 3,600 5,000 6 –
Establishment characteristics
Goods-producing industries ..................................... 92 600 1,000 2,600 4,000 7,000 8 –Manufacturing ...................................................... 94 600 1,000 3,000 4,000 7,000 6 –
Service-providing industries ..................................... 93 600 – 2,900 4,000 5,500 7 –Trade, transportation, and utilities ....................... 93 600 1,000 2,600 5,250 6,000 7 –
Retail trade ...................................................... 95 – 2,000 3,500 5,500 6,000 – –Financial activities ................................................ 98 1,000 1,800 3,000 4,000 5,300 2 –
Finance and insurance .................................... 97 1,000 1,600 3,000 4,000 5,300 3 –Credit intermediation and related activities .. 97 1,000 2,000 3,000 4,000 5,450 – –Insurance carriers and related activities ...... 97 1,000 1,800 3,000 4,000 5,450 – –
Professional and business services ..................... 94 750 1,500 3,000 4,500 – – –Education and health services ............................. 91 700 – 2,000 3,500 5,000 9 –
Educational services ........................................ 93 500 750 – 3,000 5,000 7 –Junior colleges, colleges, and universities ... 88 500 750 1,800 3,000 5,000 12 –
Health care and social assistance ................... 91 800 – – 3,600 5,000 9 –
See footnotes at end of table.

Table 22. Fee-for-service plans: Amount of annual family deductible, private industry workers, 2015—continued
(All workers participating in fee-for-service plans = 100 percent)
Characteristics Withdeductible
Amount of annual deductible
With nodeductible
Notdeterminable10th
percentile25th
percentile
50thpercentile(median)
75thpercentile
90thpercentile
1 to 99 workers ........................................................ 94 $700 – $3,000 $4,500 $6,000 6 –50 to 99 workers .................................................. 95 600 – 2,500 4,500 8,000 – –
100 workers or more ................................................ 92 – $1,000 2,500 4,000 5,500 8 –100 to 499 workers .............................................. 92 600 – 3,000 4,500 6,000 8 –500 workers or more ............................................ 92 500 1,000 2,000 3,000 4,500 8 –
Geographic areas
Northeast ................................................................. 92 500 1,000 3,000 4,000 5,000 8 –New England ....................................................... 93 – – 2,500 – 5,000 – –Middle Atlantic ..................................................... 91 500 1,000 3,000 4,000 5,000 9 –
South ....................................................................... 93 600 1,200 3,000 4,500 7,000 7 –South Atlantic ....................................................... 94 600 1,100 2,800 5,000 7,500 6 –East South Central ............................................... 91 1,000 1,650 3,000 4,500 7,000 9 –West South Central .............................................. 93 – – 3,000 4,500 6,000 – –
Midwest .................................................................... 93 750 1,400 3,000 4,500 5,500 7 –East North Central ............................................... 93 750 1,500 3,000 4,500 6,000 7 –West North Central .............................................. 93 – – – 4,000 5,000 7 –
West ......................................................................... 92 500 750 2,000 3,000 5,400 8 –Mountain .............................................................. 92 500 900 2,000 3,000 5,500 – –Pacific .................................................................. 92 500 750 2,000 3,000 5,000 8 –
1 Surveyed occupations are classified into wage categories based on the average wage for the occupation, which may include workers with earnings both above and below the threshold. Thecategories were formed using percentile estimates generated using data from the National Compensation Survey publication, "Employer Costs for Employee Compensation - March 2015."
Note: Because of rounding, sums of individual items may not equal totals. Dashes indicate that no data were reported or that data do not meet publication criteria. For definitions of major plans, keyprovisions, and related terms, see the "Glossary of Employee Benefit Terms" at www.bls.gov/ncs/ebs/glossary20152016.htm.
Source: Bureau of Labor Statistics, National Compensation Survey.

Table 22. Standard errors for fee-for-service plans: Amount of annual family deductible, private industry workers, 2015
Characteristics Withdeductible
Amount of annual deductible
With nodeductible
Notdeterminable10th
percentile25th
percentile
50thpercentile(median)
75thpercentile
90thpercentile
Worker characteristics
All workers ............................................................... 0.8 $0 $90 $416 $0 $247 0.8 –
Management, professional, and related .................. 0.9 111 191 177 302 0 0.9 –Management, business, and financial ................. 1.0 111 245 293 212 206 1.0 –Professional and related ...................................... 1.3 80 213 378 344 129 1.3 –
Service ..................................................................... 2.6 – 235 – 413 1,048 2.6 –Sales and office ....................................................... 0.9 84 120 71 551 122 0.9 –
Sales and related ................................................. 2.2 143 323 359 0 – – –Office and administrative support ........................ 0.6 78 61 0 0 381 0.6 –
Natural resources, construction, and maintenance 3.4 58 108 486 468 795 – –Installation, maintenance, and repair ................... 2.2 – 85 – 223 1,591 – –
Production, transportation, and material moving ..... 2.5 137 9 630 419 707 2.5 –Production ............................................................ 2.0 – – 82 450 1,809 2.0 –Transportation and material moving .................... 4.6 18 237 397 0 705 4.6 –
Full time ................................................................... 0.8 36 65 275 0 236 0.8 –Part time .................................................................. 3.7 104 314 604 191 – 3.7 –
Union ....................................................................... 2.7 65 18 140 745 547 2.7 –Nonunion ................................................................. 0.8 80 245 18 279 122 0.8 –
Average wage within the following categories1:Second 25 percent ............................................... 1.9 26 282 0 260 705 1.9 –Third 25 percent ................................................... 1.1 86 193 251 0 231 1.1 –Highest 25 percent ............................................... 1.0 42 0 299 265 0 1.0 –
Highest 10 percent ........................................... 1.6 – 18 239 268 91 1.6 –
Establishment characteristics
Goods-producing industries ..................................... 2.4 0 18 452 182 1,056 2.4 –Manufacturing ...................................................... 1.5 69 91 118 182 1,137 1.5 –
Service-providing industries ..................................... 0.8 49 – 404 0 465 0.8 –Trade, transportation, and utilities ....................... 1.7 117 107 570 489 0 1.7 –
Retail trade ...................................................... 1.7 – 313 158 0 447 – –Financial activities ................................................ 0.7 0 277 0 261 338 0.7 –
Finance and insurance .................................... 0.8 0 302 0 36 282 0.8 –Credit intermediation and related activities .. 1.4 0 389 0 685 521 – –Insurance carriers and related activities ...... 1.3 125 364 445 157 246 – –
Professional and business services ..................... 2.2 147 419 379 677 – – –Education and health services ............................. 2.1 147 – 547 236 223 2.1 –
Educational services ........................................ 1.7 26 51 – 516 1,183 1.7 –Junior colleges, colleges, and universities ... 2.7 0 13 393 886 1,239 2.7 –
Health care and social assistance ................... 2.4 214 – – 341 226 2.4 –
See footnotes at end of table.

Table 22. Standard errors for fee-for-service plans: Amount of annual family deductible, private industry workers,2015—continued
Characteristics Withdeductible
Amount of annual deductible
With nodeductible
Notdeterminable10th
percentile25th
percentile
50thpercentile(median)
75thpercentile
90thpercentile
1 to 99 workers ........................................................ 1.4 $134 – $103 $303 $1,428 1.4 –50 to 99 workers .................................................. 1.5 77 – 513 524 1,158 – –
100 workers or more ................................................ 0.8 – $0 165 176 0 0.8 –100 to 499 workers .............................................. 1.1 127 – 18 358 0 1.1 –500 workers or more ............................................ 1.5 0 134 257 52 613 1.5 –
Geographic areas
Northeast ................................................................. 1.8 130 86 468 332 133 1.8 –New England ....................................................... 5.2 – – 559 – 881 – –Middle Atlantic ..................................................... 1.8 132 68 343 272 769 1.8 –
South ....................................................................... 1.7 114 276 143 520 701 1.7 –South Atlantic ....................................................... 1.7 126 177 433 241 891 1.7 –East South Central ............................................... 2.1 83 245 104 562 1,576 2.1 –West South Central .............................................. 4.2 – – 419 329 899 – –
Midwest .................................................................... 0.5 71 208 0 388 702 0.5 –East North Central ............................................... 0.6 110 230 0 274 481 0.6 –West North Central .............................................. 0.9 – – – 607 610 0.9 –
West ......................................................................... 2.0 29 146 136 406 624 2.0 –Mountain .............................................................. 3.8 143 227 250 566 798 – –Pacific .................................................................. 2.3 0 114 250 494 867 2.3 –
1 Surveyed occupations are classified into wage categories based on the average wage for the occupation, which may include workers with earnings both above and below the threshold. Thecategories were formed using percentile estimates generated using data from the National Compensation Survey publication, "Employer Costs for Employee Compensation - March 2015."
Note: Dashes indicate that no data were reported or that data do not meet publication criteria. For definitions of major plans, key provisions, and related terms, see the "Glossary of Employee BenefitTerms" at www.bls.gov/ncs/ebs/glossary20152016.htm.
Source: Bureau of Labor Statistics, National Compensation Survey.

Table 23. Fee-for-service plans: Coinsurance percentage, private industry workers, 2015
(All workers participating in fee-for-service plans with coinsurance = 100 percent)
Characteristics
Fixed coinsurance Variable coinsurance
With othercoinsuranceWith fixed
coinsurance
Mediancoinsurancepercentage
With variablecoinsurance
Median coinsurance percentage
In-network Out-of-network
Mostgenerouscoverage1
Worker characteristics
All workers ............................................................... – – 88 80 60 90 –
Management, professional, and related .................. – – 89 80 60 90 –Management, business, and financial ................. – – 87 80 60 90 –Professional and related ...................................... – – 91 80 60 90 –
Service ..................................................................... – – 83 80 60 90 –Sales and office ....................................................... – – 89 80 60 80 –
Sales and related ................................................. 9 80 91 80 60 75 –Office and administrative support ........................ – – 88 80 60 80 –
Natural resources, construction, and maintenance 13 80 87 80 60 90 –Installation, maintenance, and repair ................... – – 89 80 60 90 –
Production, transportation, and material moving ..... 11 80 89 80 60 80 –Production ............................................................ 7 80 93 80 60 80 –Transportation and material moving .................... 16 80 84 80 60 90 –
Full time ................................................................... – – 88 80 60 90 –Part time .................................................................. – – 90 80 60 90 –
Union ....................................................................... – – 87 80 60 90 –Nonunion ................................................................. – – 88 80 60 90 –
Average wage within the following categories2:Second 25 percent ............................................... – – 89 80 60 80 –Third 25 percent ................................................... – – 89 80 60 90 –Highest 25 percent ............................................... – – 89 80 60 90 –
Highest 10 percent ........................................... – – 88 80 60 90 –
Establishment characteristics
Goods-producing industries ..................................... 9 80 91 80 60 80 –Manufacturing ...................................................... 8 80 92 80 60 80 –
Service-providing industries ..................................... – – 87 80 60 90 –Trade, transportation, and utilities ....................... 11 80 89 80 60 90 –
Retail trade ...................................................... 10 80 90 80 50 – –Financial activities ................................................ 10 80 90 80 60 75 –
Finance and insurance .................................... 9 80 91 80 60 80 –Credit intermediation and related activities .. – – 94 80 60 75 –Insurance carriers and related activities ...... 12 80 88 80 60 80 –
Professional and business services ..................... 13 80 87 80 60 – –Education and health services ............................. – – 85 80 60 90 –
Educational services ........................................ – – 86 80 60 90 –Junior colleges, colleges, and universities ... 9 90 91 90 70 90 –
Health care and social assistance ................... – – 85 80 60 90 –
See footnotes at end of table.

Table 23. Fee-for-service plans: Coinsurance percentage, private industry workers, 2015—continued
(All workers participating in fee-for-service plans with coinsurance = 100 percent)
Characteristics
Fixed coinsurance Variable coinsurance
With othercoinsuranceWith fixed
coinsurance
Mediancoinsurancepercentage
With variablecoinsurance
Median coinsurance percentage
In-network Out-of-network
Mostgenerouscoverage1
1 to 99 workers ........................................................ 13 80 87 80 60 80 –50 to 99 workers .................................................. 11 80 89 80 60 – –
100 workers or more ................................................ – – 89 80 60 90 –100 to 499 workers .............................................. – – 89 80 60 85 –500 workers or more ............................................ – – 89 80 60 90 –
Geographic areas
Northeast ................................................................. – – 84 80 60 100 –New England ....................................................... – – 82 80 60 80 –Middle Atlantic ..................................................... 15 80 85 80 60 100 –
South ....................................................................... – – 85 80 60 85 –South Atlantic ....................................................... – – 86 80 60 90 –East South Central ............................................... – – 80 80 60 70 –West South Central .............................................. – – 88 80 60 85 –
Midwest .................................................................... – – 94 80 60 90 –East North Central ............................................... 5 80 95 80 60 90 –West North Central .............................................. – – 93 80 60 90 –
West ......................................................................... – – 89 80 60 90 –Mountain .............................................................. – – 89 80 60 90 –Pacific .................................................................. 11 80 89 80 60 90 –
1 Refers to deductible or coinsurance amounts for the most generous benefits received in Point-of-Service plans.2 Surveyed occupations are classified into wage categories based on the average wage for the occupation, which may include workers with earnings both above and below the threshold.
The categories were formed using percentile estimates generated using data from the National Compensation Survey publication, "Employer Costs for Employee Compensation - March2015."
Note: Because of rounding, sums of individual items may not equal totals. Dashes indicate that no data were reported or that data do not meet publication criteria. For definitions of majorplans, key provisions, and related terms, see the "Glossary of Employee Benefit Terms" at www.bls.gov/ncs/ebs/glossary20152016.htm.
Source: Bureau of Labor Statistics, National Compensation Survey.
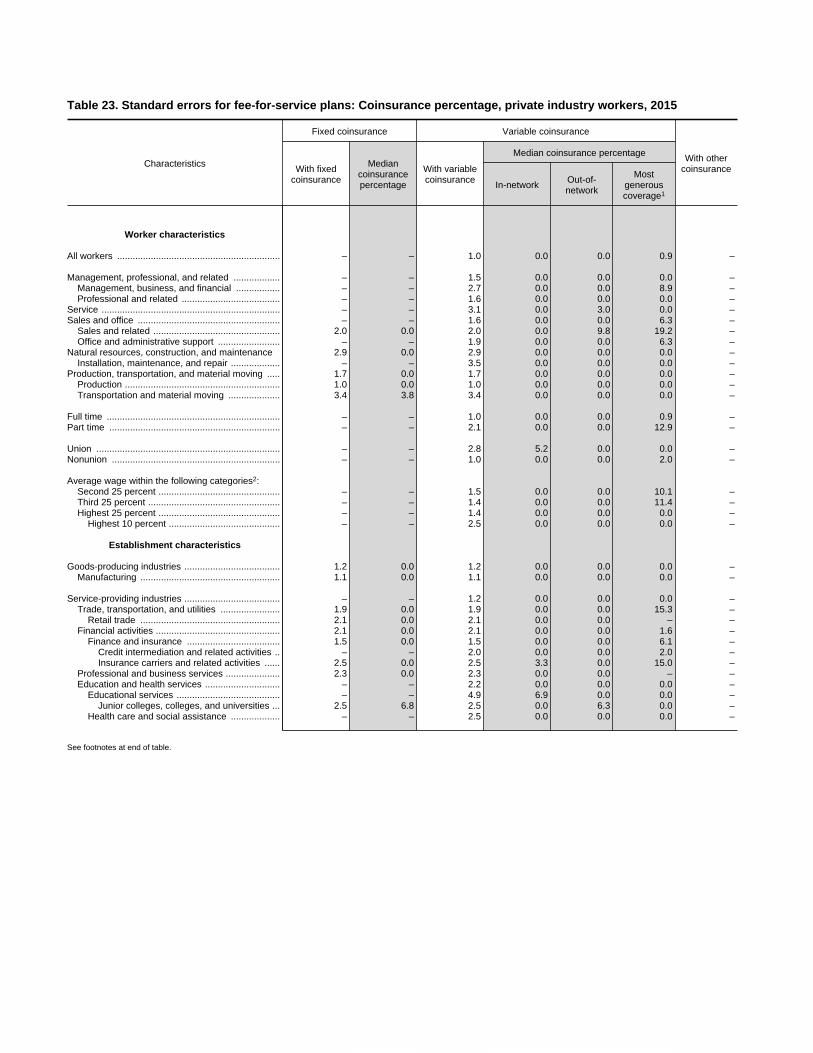
Table 23. Standard errors for fee-for-service plans: Coinsurance percentage, private industry workers, 2015
Characteristics
Fixed coinsurance Variable coinsurance
With othercoinsuranceWith fixed
coinsurance
Mediancoinsurancepercentage
With variablecoinsurance
Median coinsurance percentage
In-network Out-of-network
Mostgenerouscoverage1
Worker characteristics
All workers ............................................................... – – 1.0 0.0 0.0 0.9 –
Management, professional, and related .................. – – 1.5 0.0 0.0 0.0 –Management, business, and financial ................. – – 2.7 0.0 0.0 8.9 –Professional and related ...................................... – – 1.6 0.0 0.0 0.0 –
Service ..................................................................... – – 3.1 0.0 3.0 0.0 –Sales and office ....................................................... – – 1.6 0.0 0.0 6.3 –
Sales and related ................................................. 2.0 0.0 2.0 0.0 9.8 19.2 –Office and administrative support ........................ – – 1.9 0.0 0.0 6.3 –
Natural resources, construction, and maintenance 2.9 0.0 2.9 0.0 0.0 0.0 –Installation, maintenance, and repair ................... – – 3.5 0.0 0.0 0.0 –
Production, transportation, and material moving ..... 1.7 0.0 1.7 0.0 0.0 0.0 –Production ............................................................ 1.0 0.0 1.0 0.0 0.0 0.0 –Transportation and material moving .................... 3.4 3.8 3.4 0.0 0.0 0.0 –
Full time ................................................................... – – 1.0 0.0 0.0 0.9 –Part time .................................................................. – – 2.1 0.0 0.0 12.9 –
Union ....................................................................... – – 2.8 5.2 0.0 0.0 –Nonunion ................................................................. – – 1.0 0.0 0.0 2.0 –
Average wage within the following categories2:Second 25 percent ............................................... – – 1.5 0.0 0.0 10.1 –Third 25 percent ................................................... – – 1.4 0.0 0.0 11.4 –Highest 25 percent ............................................... – – 1.4 0.0 0.0 0.0 –
Highest 10 percent ........................................... – – 2.5 0.0 0.0 0.0 –
Establishment characteristics
Goods-producing industries ..................................... 1.2 0.0 1.2 0.0 0.0 0.0 –Manufacturing ...................................................... 1.1 0.0 1.1 0.0 0.0 0.0 –
Service-providing industries ..................................... – – 1.2 0.0 0.0 0.0 –Trade, transportation, and utilities ....................... 1.9 0.0 1.9 0.0 0.0 15.3 –
Retail trade ...................................................... 2.1 0.0 2.1 0.0 0.0 – –Financial activities ................................................ 2.1 0.0 2.1 0.0 0.0 1.6 –
Finance and insurance .................................... 1.5 0.0 1.5 0.0 0.0 6.1 –Credit intermediation and related activities .. – – 2.0 0.0 0.0 2.0 –Insurance carriers and related activities ...... 2.5 0.0 2.5 3.3 0.0 15.0 –
Professional and business services ..................... 2.3 0.0 2.3 0.0 0.0 – –Education and health services ............................. – – 2.2 0.0 0.0 0.0 –
Educational services ........................................ – – 4.9 6.9 0.0 0.0 –Junior colleges, colleges, and universities ... 2.5 6.8 2.5 0.0 6.3 0.0 –
Health care and social assistance ................... – – 2.5 0.0 0.0 0.0 –
See footnotes at end of table.

Table 23. Standard errors for fee-for-service plans: Coinsurance percentage, private industry workers,2015—continued
Characteristics
Fixed coinsurance Variable coinsurance
With othercoinsuranceWith fixed
coinsurance
Mediancoinsurancepercentage
With variablecoinsurance
Median coinsurance percentage
In-network Out-of-network
Mostgenerouscoverage1
1 to 99 workers ........................................................ 1.5 0.0 1.5 0.0 0.0 10.0 –50 to 99 workers .................................................. 2.3 1.6 2.3 0.0 0.0 – –
100 workers or more ................................................ – – 1.1 0.0 0.0 0.0 –100 to 499 workers .............................................. – – 1.7 0.0 0.0 6.1 –500 workers or more ............................................ – – 1.8 0.0 0.0 0.0 –
Geographic areas
Northeast ................................................................. – – 2.6 0.0 0.0 6.6 –New England ....................................................... – – 9.0 4.8 0.0 9.5 –Middle Atlantic ..................................................... 2.5 0.0 2.5 0.0 0.0 0.0 –
South ....................................................................... – – 2.1 0.0 0.0 7.0 –South Atlantic ....................................................... – – 3.5 0.0 0.0 5.8 –East South Central ............................................... – – 2.4 0.0 0.0 0.0 –West South Central .............................................. – – 3.5 0.0 0.0 7.1 –
Midwest .................................................................... – – 1.1 0.0 0.0 3.6 –East North Central ............................................... 1.3 0.0 1.3 0.0 0.0 7.6 –West North Central .............................................. – – 1.9 0.0 0.0 14.5 –
West ......................................................................... – – 1.4 0.0 0.0 0.0 –Mountain .............................................................. – – 1.9 0.0 0.0 0.0 –Pacific .................................................................. 1.9 0.0 1.9 0.0 0.0 9.3 –
1 Refers to deductible or coinsurance amounts for the most generous benefits received in Point-of-Service plans.2 Surveyed occupations are classified into wage categories based on the average wage for the occupation, which may include workers with earnings both above and below the threshold.
The categories were formed using percentile estimates generated using data from the National Compensation Survey publication, "Employer Costs for Employee Compensation - March2015."
Note: Dashes indicate that no data were reported or that data do not meet publication criteria. For definitions of major plans, key provisions, and related terms, see the "Glossary of EmployeeBenefit Terms" at www.bls.gov/ncs/ebs/glossary20152016.htm.
Source: Bureau of Labor Statistics, National Compensation Survey.

Table 24. Fee-for-service plans: Amount of annual individual out-of-pocket maximum,1 private industry workers, 2015
(All workers participating in fee-for-service plans = 100 percent)
CharacteristicsWith out-of-
pocketmaximum
Amount of out-of-pocket maximum With noout-of-pocket
maximum
Notdeterminable10th percentile 25th
percentile
50thpercentile(median)
75thpercentile
90thpercentile
Worker characteristics
All workers ............................................................... 95 $1,000 $1,500 $2,200 $3,000 $4,500 5 2( )
Management, professional, and related .................. 95 1,000 1,500 2,000 3,000 4,350 4 2( )Management, business, and financial ................. 94 1,000 1,500 2,000 3,000 4,700 5 2( )Professional and related ...................................... 96 1,000 1,500 2,000 3,000 4,000 4 2( )
Service ..................................................................... 92 1,000 1,600 2,250 3,750 4,950 – –Sales and office ....................................................... 96 1,100 1,750 2,400 3,050 4,350 4 1
Sales and related ................................................. 97 1,100 1,700 2,350 3,350 4,500 – –Office and administrative support ........................ 95 1,250 1,800 2,500 3,000 4,250 4 1
Natural resources, construction, and maintenance 93 1,000 1,500 2,500 3,600 4,850 – –Installation, maintenance, and repair ................... 92 1,000 1,700 2,250 3,500 4,250 – –
Production, transportation, and material moving ..... 95 1,000 1,350 2,000 3,000 4,250 5 –Production ............................................................ 94 1,000 1,500 2,000 3,000 4,650 6 –Transportation and material moving .................... 97 900 1,000 2,000 3,000 3,700 – –
Full time ................................................................... 95 1,000 1,500 2,150 3,000 4,500 5 2( )Part time .................................................................. 96 1,000 1,800 2,250 3,250 4,700 – –
Union ....................................................................... 88 900 1,000 1,700 2,750 4,500 12 –Nonunion ................................................................. 96 1,000 1,500 2,250 3,050 4,500 4 2( )
Average wage within the following categories3:Second 25 percent ............................................... 96 1,000 1,500 2,300 3,350 4,750 4 1Third 25 percent ................................................... 95 1,000 1,500 2,200 3,000 4,350 5 2( )Highest 25 percent ............................................... 95 1,000 1,500 2,000 3,000 4,350 5 2( )
Highest 10 percent ........................................... 94 1,000 1,500 2,000 3,000 4,500 6 2( )
Establishment characteristics
Goods-producing industries ..................................... 96 1,000 1,500 2,000 3,050 4,850 4 –Manufacturing ...................................................... 96 1,000 1,500 2,000 3,000 4,200 4 –
Service-providing industries ..................................... 95 1,000 1,500 2,250 3,000 4,500 5 2( )Trade, transportation, and utilities ....................... 97 1,000 1,500 2,250 3,250 4,250 3 –
Retail trade ...................................................... 97 1,400 2,000 2,500 3,350 4,250 – –Financial activities ................................................ 94 1,000 1,500 2,000 3,000 3,750 4 2
Finance and insurance .................................... 94 1,000 1,500 2,000 2,500 3,500 5 1Credit intermediation and related activities .. 95 1,000 1,500 2,000 2,500 4,000 – –Insurance carriers and related activities ...... 93 1,000 1,500 2,000 2,500 3,500 7 1
Professional and business services ..................... 96 1,350 1,750 2,200 3,050 4,350 – –Education and health services ............................. 92 1,000 1,500 2,500 3,500 4,600 8 1
Educational services ........................................ 99 1,000 1,000 1,500 2,400 3,000 – –Junior colleges, colleges, and universities ... 98 – 1,000 1,600 2,300 3,000 – –
Health care and social assistance ................... 91 1,000 1,750 2,500 3,900 4,700 9 1
See footnotes at end of table.

Table 24. Fee-for-service plans: Amount of annual individual out-of-pocket maximum,1 private industry workers,2015—continued
(All workers participating in fee-for-service plans = 100 percent)
CharacteristicsWith out-of-
pocketmaximum
Amount of out-of-pocket maximum With noout-of-pocket
maximum
Notdeterminable10th percentile 25th
percentile
50thpercentile(median)
75thpercentile
90thpercentile
1 to 99 workers ........................................................ 95 $1,000 $1,500 $2,400 $3,500 $4,700 5 2( )50 to 99 workers .................................................. 97 1,000 1,500 2,250 3,000 4,250 – –
100 workers or more ................................................ 95 1,000 1,500 2,000 3,000 4,200 5 2( )100 to 499 workers .............................................. 95 1,000 1,500 2,250 3,000 4,250 5 2( )500 workers or more ............................................ 95 1,000 1,500 2,000 2,700 4,200 5 2( )
Geographic areas
Northeast ................................................................. 89 1,000 1,500 2,000 3,000 4,850 11 –New England ....................................................... 87 600 1,500 2,000 2,500 4,000 – –Middle Atlantic ..................................................... 90 1,000 1,500 2,000 3,000 5,080 10 –
South ....................................................................... 96 1,000 1,500 2,250 3,250 4,500 4 1South Atlantic ....................................................... 95 1,000 1,500 2,250 3,150 4,450 4 1East South Central ............................................... 97 1,000 1,500 2,250 3,350 4,350 – –West South Central .............................................. 95 1,000 1,500 2,200 3,300 4,600 – –
Midwest .................................................................... 95 1,000 1,500 2,200 3,000 4,000 4 1East North Central ............................................... 94 1,000 1,500 2,250 3,000 4,000 5 2( )West North Central .............................................. 98 1,000 1,500 2,000 3,000 3,750 – –
West ......................................................................... 97 1,000 1,500 2,250 3,000 4,700 – –Mountain .............................................................. 99 1,500 1,750 2,500 4,000 4,850 – –Pacific .................................................................. 96 1,000 1,500 2,000 2,750 4,400 – –
1 The out-of-pocket maximum is the annual limit on the amount of covered expenses that a participant or a family must pay after the deductible has been satisfied. Once reached, coveredexpenses are fully reimbursed for the rest of the year.
2 Less than 0.5.3 Surveyed occupations are classified into wage categories based on the average wage for the occupation, which may include workers with earnings both above and below the threshold. The
categories were formed using percentile estimates generated using data from the National Compensation Survey publication, "Employer Costs for Employee Compensation - March 2015."
Note: Because of rounding, sums of individual items may not equal totals. Dashes indicate that no data were reported or that data do not meet publication criteria. For definitions of major plans, keyprovisions, and related terms, see the "Glossary of Employee Benefit Terms" at www.bls.gov/ncs/ebs/glossary20152016.htm.
Source: Bureau of Labor Statistics, National Compensation Survey.
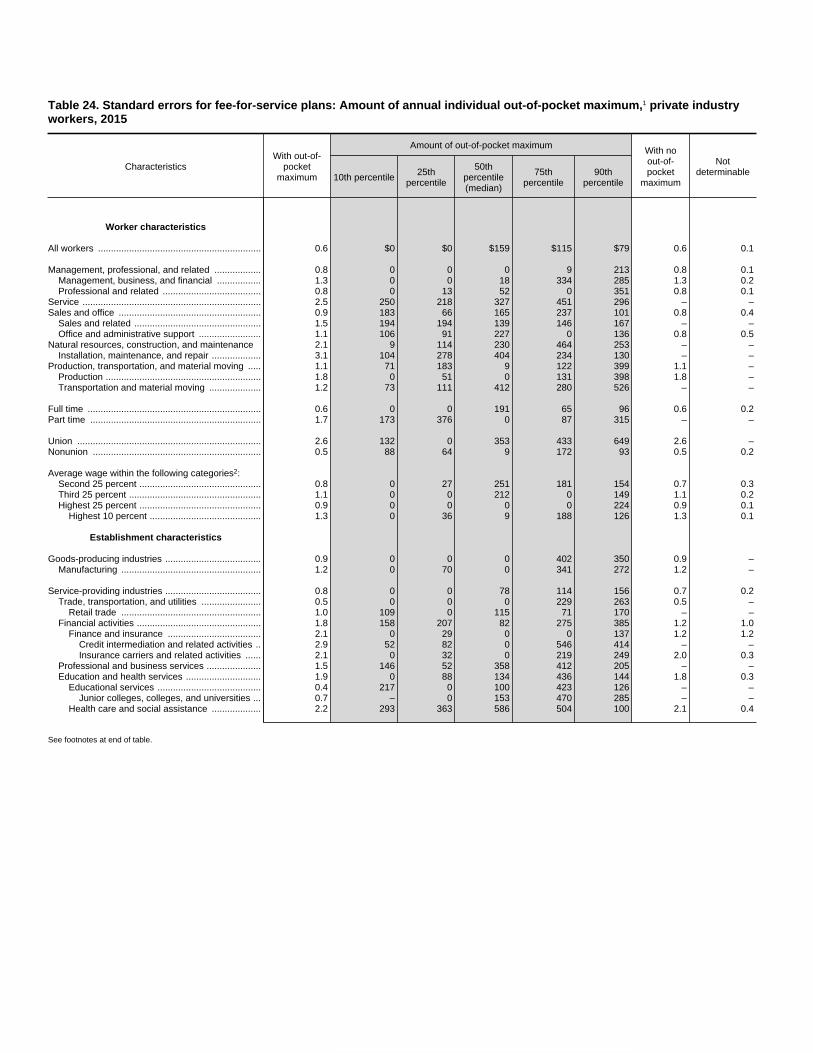
Table 24. Standard errors for fee-for-service plans: Amount of annual individual out-of-pocket maximum,1 private industryworkers, 2015
CharacteristicsWith out-of-
pocketmaximum
Amount of out-of-pocket maximum With noout-of-pocket
maximum
Notdeterminable10th percentile 25th
percentile
50thpercentile(median)
75thpercentile
90thpercentile
Worker characteristics
All workers ............................................................... 0.6 $0 $0 $159 $115 $79 0.6 0.1
Management, professional, and related .................. 0.8 0 0 0 9 213 0.8 0.1Management, business, and financial ................. 1.3 0 0 18 334 285 1.3 0.2Professional and related ...................................... 0.8 0 13 52 0 351 0.8 0.1
Service ..................................................................... 2.5 250 218 327 451 296 – –Sales and office ....................................................... 0.9 183 66 165 237 101 0.8 0.4
Sales and related ................................................. 1.5 194 194 139 146 167 – –Office and administrative support ........................ 1.1 106 91 227 0 136 0.8 0.5
Natural resources, construction, and maintenance 2.1 9 114 230 464 253 – –Installation, maintenance, and repair ................... 3.1 104 278 404 234 130 – –
Production, transportation, and material moving ..... 1.1 71 183 9 122 399 1.1 –Production ............................................................ 1.8 0 51 0 131 398 1.8 –Transportation and material moving .................... 1.2 73 111 412 280 526 – –
Full time ................................................................... 0.6 0 0 191 65 96 0.6 0.2Part time .................................................................. 1.7 173 376 0 87 315 – –
Union ....................................................................... 2.6 132 0 353 433 649 2.6 –Nonunion ................................................................. 0.5 88 64 9 172 93 0.5 0.2
Average wage within the following categories2:Second 25 percent ............................................... 0.8 0 27 251 181 154 0.7 0.3Third 25 percent ................................................... 1.1 0 0 212 0 149 1.1 0.2Highest 25 percent ............................................... 0.9 0 0 0 0 224 0.9 0.1
Highest 10 percent ........................................... 1.3 0 36 9 188 126 1.3 0.1
Establishment characteristics
Goods-producing industries ..................................... 0.9 0 0 0 402 350 0.9 –Manufacturing ...................................................... 1.2 0 70 0 341 272 1.2 –
Service-providing industries ..................................... 0.8 0 0 78 114 156 0.7 0.2Trade, transportation, and utilities ....................... 0.5 0 0 0 229 263 0.5 –
Retail trade ...................................................... 1.0 109 0 115 71 170 – –Financial activities ................................................ 1.8 158 207 82 275 385 1.2 1.0
Finance and insurance .................................... 2.1 0 29 0 0 137 1.2 1.2Credit intermediation and related activities .. 2.9 52 82 0 546 414 – –Insurance carriers and related activities ...... 2.1 0 32 0 219 249 2.0 0.3
Professional and business services ..................... 1.5 146 52 358 412 205 – –Education and health services ............................. 1.9 0 88 134 436 144 1.8 0.3
Educational services ........................................ 0.4 217 0 100 423 126 – –Junior colleges, colleges, and universities ... 0.7 – 0 153 470 285 – –
Health care and social assistance ................... 2.2 293 363 586 504 100 2.1 0.4
See footnotes at end of table.

Table 24. Standard errors for fee-for-service plans: Amount of annual individual out-of-pocket maximum,1 private industryworkers, 2015—continued
CharacteristicsWith out-of-
pocketmaximum
Amount of out-of-pocket maximum With noout-of-pocket
maximum
Notdeterminable10th percentile 25th
percentile
50thpercentile(median)
75thpercentile
90thpercentile
1 to 99 workers ........................................................ 1.0 $0 $20 $193 $260 $71 0.9 0.250 to 99 workers .................................................. 1.3 0 0 225 0 384 – –
100 workers or more ................................................ 0.7 0 0 106 0 166 0.7 0.2100 to 499 workers .............................................. 1.1 55 97 0 147 259 1.0 0.3500 workers or more ............................................ 0.9 0 0 0 224 241 0.9 0.2
Geographic areas
Northeast ................................................................. 2.0 0 0 0 90 416 2.0 –New England ....................................................... 3.9 93 32 0 252 252 – –Middle Atlantic ..................................................... 2.2 0 0 102 218 291 2.2 –
South ....................................................................... 1.0 0 0 126 194 108 0.9 0.3South Atlantic ....................................................... 1.2 0 76 139 236 205 0.9 0.6East South Central ............................................... 1.6 0 0 56 211 197 – –West South Central .............................................. 2.1 209 245 376 433 279 – –
Midwest .................................................................... 1.0 0 0 228 0 29 0.8 0.4East North Central ............................................... 1.3 0 144 141 95 310 1.2 0.3West North Central .............................................. 1.2 0 64 216 151 181 – –
West ......................................................................... 1.3 59 46 250 223 55 – –Mountain .............................................................. 0.7 227 164 449 522 124 – –Pacific .................................................................. 2.1 0 0 93 361 387 – –
1 The out-of-pocket maximum is the annual limit on the amount of covered expenses that a participant or a family must pay after the deductible has been satisfied. Once reached, coveredexpenses are fully reimbursed for the rest of the year.
2 Surveyed occupations are classified into wage categories based on the average wage for the occupation, which may include workers with earnings both above and below the threshold. Thecategories were formed using percentile estimates generated using data from the National Compensation Survey publication, "Employer Costs for Employee Compensation - March 2015."
Note: Dashes indicate that no data were reported or that data do not meet publication criteria. For definitions of major plans, key provisions, and related terms, see the "Glossary of Employee BenefitTerms" at www.bls.gov/ncs/ebs/glossary20152016.htm.
Source: Bureau of Labor Statistics, National Compensation Survey.
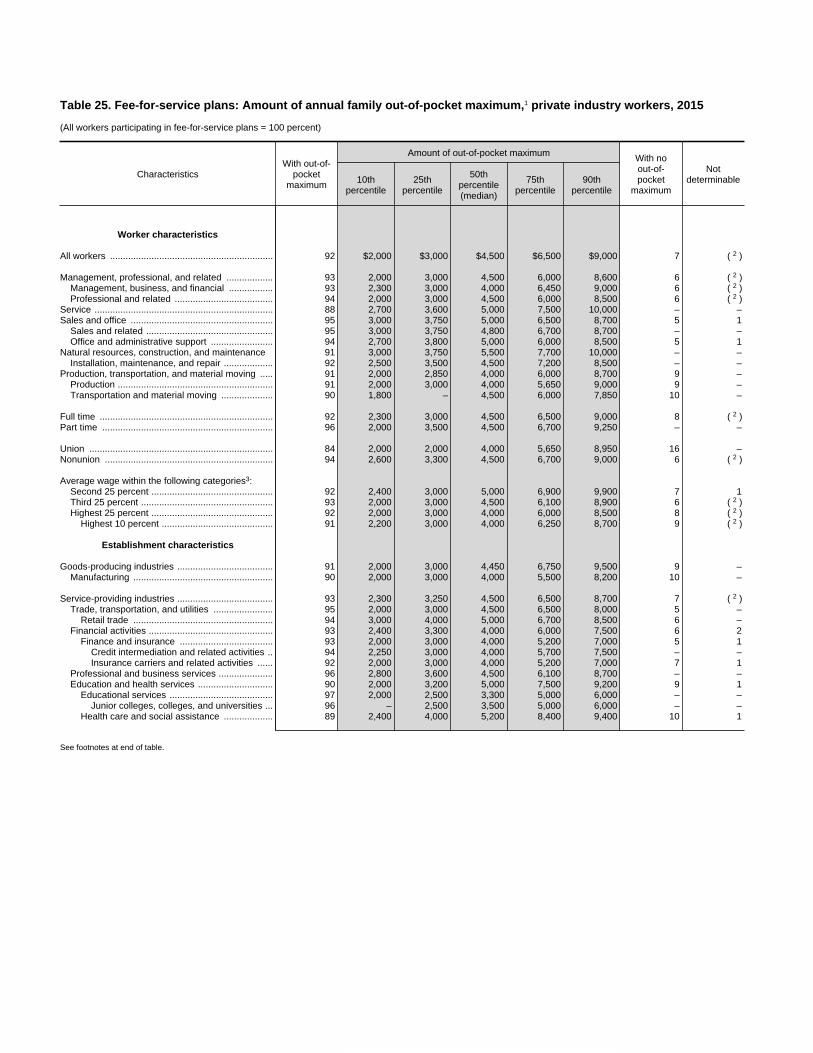
Table 25. Fee-for-service plans: Amount of annual family out-of-pocket maximum,1 private industry workers, 2015
(All workers participating in fee-for-service plans = 100 percent)
CharacteristicsWith out-of-
pocketmaximum
Amount of out-of-pocket maximum With noout-of-pocket
maximum
Notdeterminable10th
percentile25th
percentile
50thpercentile(median)
75thpercentile
90thpercentile
Worker characteristics
All workers ............................................................... 92 $2,000 $3,000 $4,500 $6,500 $9,000 7 2( )
Management, professional, and related .................. 93 2,000 3,000 4,500 6,000 8,600 6 2( )Management, business, and financial ................. 93 2,300 3,000 4,000 6,450 9,000 6 2( )Professional and related ...................................... 94 2,000 3,000 4,500 6,000 8,500 6 2( )
Service ..................................................................... 88 2,700 3,600 5,000 7,500 10,000 – –Sales and office ....................................................... 95 3,000 3,750 5,000 6,500 8,700 5 1
Sales and related ................................................. 95 3,000 3,750 4,800 6,700 8,700 – –Office and administrative support ........................ 94 2,700 3,800 5,000 6,000 8,500 5 1
Natural resources, construction, and maintenance 91 3,000 3,750 5,500 7,700 10,000 – –Installation, maintenance, and repair ................... 92 2,500 3,500 4,500 7,200 8,500 – –
Production, transportation, and material moving ..... 91 2,000 2,850 4,000 6,000 8,700 9 –Production ............................................................ 91 2,000 3,000 4,000 5,650 9,000 9 –Transportation and material moving .................... 90 1,800 – 4,500 6,000 7,850 10 –
Full time ................................................................... 92 2,300 3,000 4,500 6,500 9,000 8 2( )Part time .................................................................. 96 2,000 3,500 4,500 6,700 9,250 – –
Union ....................................................................... 84 2,000 2,000 4,000 5,650 8,950 16 –Nonunion ................................................................. 94 2,600 3,300 4,500 6,700 9,000 6 2( )
Average wage within the following categories3:Second 25 percent ............................................... 92 2,400 3,000 5,000 6,900 9,900 7 1Third 25 percent ................................................... 93 2,000 3,000 4,500 6,100 8,900 6 2( )Highest 25 percent ............................................... 92 2,000 3,000 4,000 6,000 8,500 8 2( )
Highest 10 percent ........................................... 91 2,200 3,000 4,000 6,250 8,700 9 2( )
Establishment characteristics
Goods-producing industries ..................................... 91 2,000 3,000 4,450 6,750 9,500 9 –Manufacturing ...................................................... 90 2,000 3,000 4,000 5,500 8,200 10 –
Service-providing industries ..................................... 93 2,300 3,250 4,500 6,500 8,700 7 2( )Trade, transportation, and utilities ....................... 95 2,000 3,000 4,500 6,500 8,000 5 –
Retail trade ...................................................... 94 3,000 4,000 5,000 6,700 8,500 6 –Financial activities ................................................ 93 2,400 3,300 4,000 6,000 7,500 6 2
Finance and insurance .................................... 93 2,000 3,000 4,000 5,200 7,000 5 1Credit intermediation and related activities .. 94 2,250 3,000 4,000 5,700 7,500 – –Insurance carriers and related activities ...... 92 2,000 3,000 4,000 5,200 7,000 7 1
Professional and business services ..................... 96 2,800 3,600 4,500 6,100 8,700 – –Education and health services ............................. 90 2,000 3,200 5,000 7,500 9,200 9 1
Educational services ........................................ 97 2,000 2,500 3,300 5,000 6,000 – –Junior colleges, colleges, and universities ... 96 – 2,500 3,500 5,000 6,000 – –
Health care and social assistance ................... 89 2,400 4,000 5,200 8,400 9,400 10 1
See footnotes at end of table.
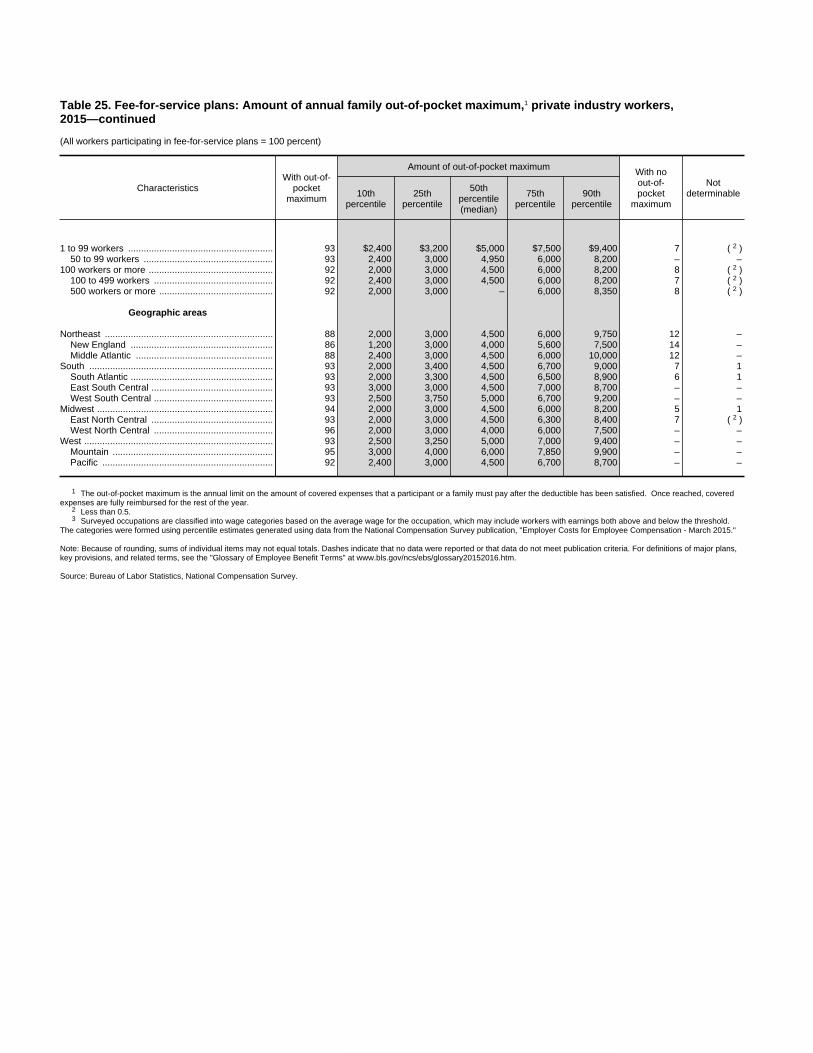
Table 25. Fee-for-service plans: Amount of annual family out-of-pocket maximum,1 private industry workers,2015—continued
(All workers participating in fee-for-service plans = 100 percent)
CharacteristicsWith out-of-
pocketmaximum
Amount of out-of-pocket maximum With noout-of-pocket
maximum
Notdeterminable10th
percentile25th
percentile
50thpercentile(median)
75thpercentile
90thpercentile
1 to 99 workers ........................................................ 93 $2,400 $3,200 $5,000 $7,500 $9,400 7 2( )50 to 99 workers .................................................. 93 2,400 3,000 4,950 6,000 8,200 – –
100 workers or more ................................................ 92 2,000 3,000 4,500 6,000 8,200 8 2( )100 to 499 workers .............................................. 92 2,400 3,000 4,500 6,000 8,200 7 2( )500 workers or more ............................................ 92 2,000 3,000 – 6,000 8,350 8 2( )
Geographic areas
Northeast ................................................................. 88 2,000 3,000 4,500 6,000 9,750 12 –New England ....................................................... 86 1,200 3,000 4,000 5,600 7,500 14 –Middle Atlantic ..................................................... 88 2,400 3,000 4,500 6,000 10,000 12 –
South ....................................................................... 93 2,000 3,400 4,500 6,700 9,000 7 1South Atlantic ....................................................... 93 2,000 3,300 4,500 6,500 8,900 6 1East South Central ............................................... 93 3,000 3,000 4,500 7,000 8,700 – –West South Central .............................................. 93 2,500 3,750 5,000 6,700 9,200 – –
Midwest .................................................................... 94 2,000 3,000 4,500 6,000 8,200 5 1East North Central ............................................... 93 2,000 3,000 4,500 6,300 8,400 7 2( )West North Central .............................................. 96 2,000 3,000 4,000 6,000 7,500 – –
West ......................................................................... 93 2,500 3,250 5,000 7,000 9,400 – –Mountain .............................................................. 95 3,000 4,000 6,000 7,850 9,900 – –Pacific .................................................................. 92 2,400 3,000 4,500 6,700 8,700 – –
1 The out-of-pocket maximum is the annual limit on the amount of covered expenses that a participant or a family must pay after the deductible has been satisfied. Once reached, coveredexpenses are fully reimbursed for the rest of the year.
2 Less than 0.5.3 Surveyed occupations are classified into wage categories based on the average wage for the occupation, which may include workers with earnings both above and below the threshold.
The categories were formed using percentile estimates generated using data from the National Compensation Survey publication, "Employer Costs for Employee Compensation - March 2015."
Note: Because of rounding, sums of individual items may not equal totals. Dashes indicate that no data were reported or that data do not meet publication criteria. For definitions of major plans,key provisions, and related terms, see the "Glossary of Employee Benefit Terms" at www.bls.gov/ncs/ebs/glossary20152016.htm.
Source: Bureau of Labor Statistics, National Compensation Survey.
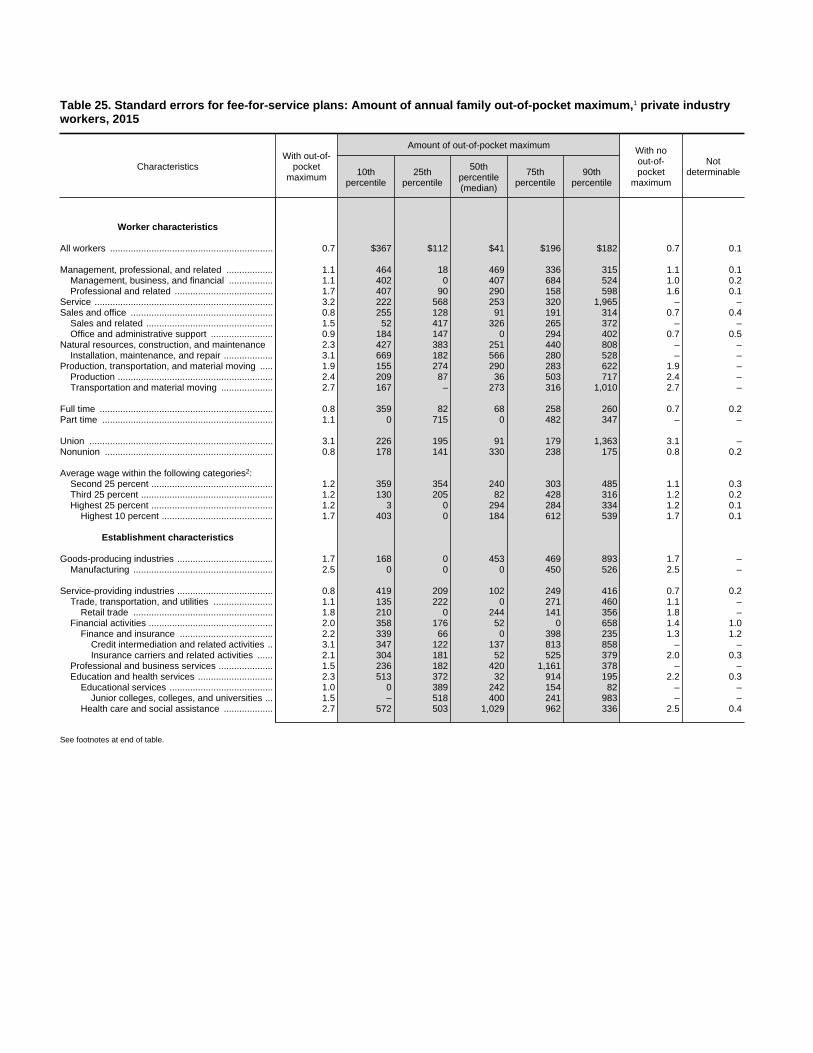
Table 25. Standard errors for fee-for-service plans: Amount of annual family out-of-pocket maximum,1 private industryworkers, 2015
CharacteristicsWith out-of-
pocketmaximum
Amount of out-of-pocket maximum With noout-of-pocket
maximum
Notdeterminable10th
percentile25th
percentile
50thpercentile(median)
75thpercentile
90thpercentile
Worker characteristics
All workers ............................................................... 0.7 $367 $112 $41 $196 $182 0.7 0.1
Management, professional, and related .................. 1.1 464 18 469 336 315 1.1 0.1Management, business, and financial ................. 1.1 402 0 407 684 524 1.0 0.2Professional and related ...................................... 1.7 407 90 290 158 598 1.6 0.1
Service ..................................................................... 3.2 222 568 253 320 1,965 – –Sales and office ....................................................... 0.8 255 128 91 191 314 0.7 0.4
Sales and related ................................................. 1.5 52 417 326 265 372 – –Office and administrative support ........................ 0.9 184 147 0 294 402 0.7 0.5
Natural resources, construction, and maintenance 2.3 427 383 251 440 808 – –Installation, maintenance, and repair ................... 3.1 669 182 566 280 528 – –
Production, transportation, and material moving ..... 1.9 155 274 290 283 622 1.9 –Production ............................................................ 2.4 209 87 36 503 717 2.4 –Transportation and material moving .................... 2.7 167 – 273 316 1,010 2.7 –
Full time ................................................................... 0.8 359 82 68 258 260 0.7 0.2Part time .................................................................. 1.1 0 715 0 482 347 – –
Union ....................................................................... 3.1 226 195 91 179 1,363 3.1 –Nonunion ................................................................. 0.8 178 141 330 238 175 0.8 0.2
Average wage within the following categories2:Second 25 percent ............................................... 1.2 359 354 240 303 485 1.1 0.3Third 25 percent ................................................... 1.2 130 205 82 428 316 1.2 0.2Highest 25 percent ............................................... 1.2 3 0 294 284 334 1.2 0.1
Highest 10 percent ........................................... 1.7 403 0 184 612 539 1.7 0.1
Establishment characteristics
Goods-producing industries ..................................... 1.7 168 0 453 469 893 1.7 –Manufacturing ...................................................... 2.5 0 0 0 450 526 2.5 –
Service-providing industries ..................................... 0.8 419 209 102 249 416 0.7 0.2Trade, transportation, and utilities ....................... 1.1 135 222 0 271 460 1.1 –
Retail trade ...................................................... 1.8 210 0 244 141 356 1.8 –Financial activities ................................................ 2.0 358 176 52 0 658 1.4 1.0
Finance and insurance .................................... 2.2 339 66 0 398 235 1.3 1.2Credit intermediation and related activities .. 3.1 347 122 137 813 858 – –Insurance carriers and related activities ...... 2.1 304 181 52 525 379 2.0 0.3
Professional and business services ..................... 1.5 236 182 420 1,161 378 – –Education and health services ............................. 2.3 513 372 32 914 195 2.2 0.3
Educational services ........................................ 1.0 0 389 242 154 82 – –Junior colleges, colleges, and universities ... 1.5 – 518 400 241 983 – –
Health care and social assistance ................... 2.7 572 503 1,029 962 336 2.5 0.4
See footnotes at end of table.
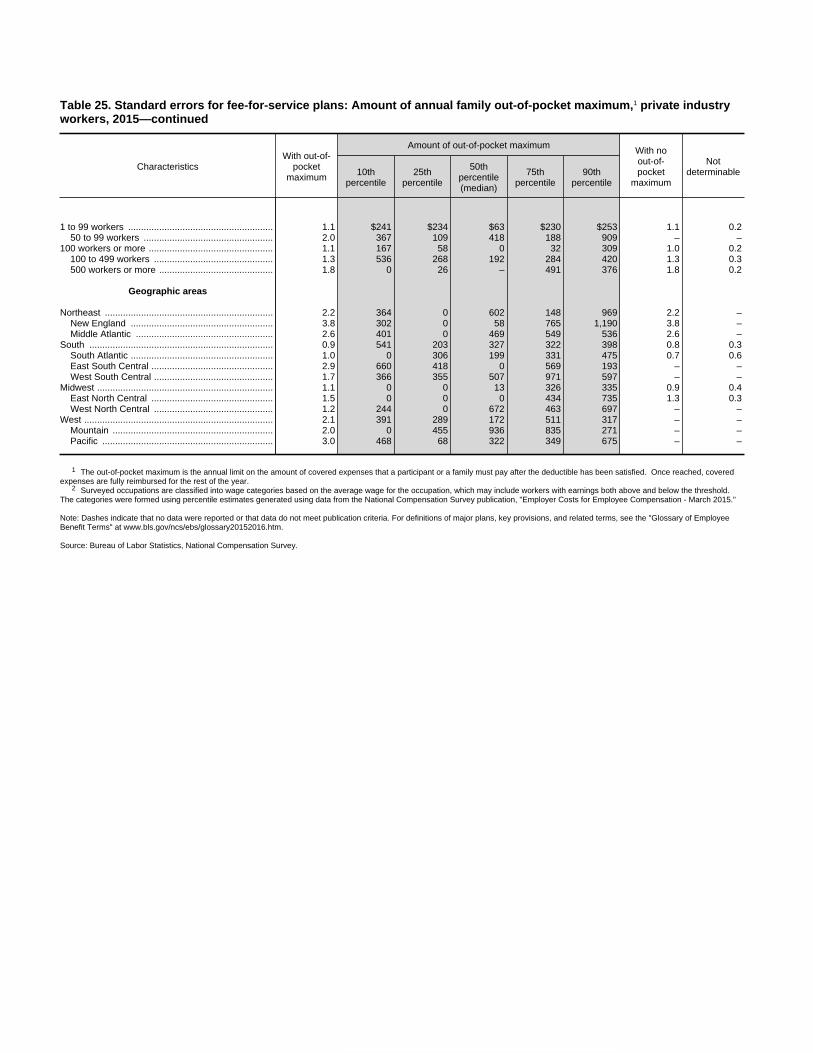
Table 25. Standard errors for fee-for-service plans: Amount of annual family out-of-pocket maximum,1 private industryworkers, 2015—continued
CharacteristicsWith out-of-
pocketmaximum
Amount of out-of-pocket maximum With noout-of-pocket
maximum
Notdeterminable10th
percentile25th
percentile
50thpercentile(median)
75thpercentile
90thpercentile
1 to 99 workers ........................................................ 1.1 $241 $234 $63 $230 $253 1.1 0.250 to 99 workers .................................................. 2.0 367 109 418 188 909 – –
100 workers or more ................................................ 1.1 167 58 0 32 309 1.0 0.2100 to 499 workers .............................................. 1.3 536 268 192 284 420 1.3 0.3500 workers or more ............................................ 1.8 0 26 – 491 376 1.8 0.2
Geographic areas
Northeast ................................................................. 2.2 364 0 602 148 969 2.2 –New England ....................................................... 3.8 302 0 58 765 1,190 3.8 –Middle Atlantic ..................................................... 2.6 401 0 469 549 536 2.6 –
South ....................................................................... 0.9 541 203 327 322 398 0.8 0.3South Atlantic ....................................................... 1.0 0 306 199 331 475 0.7 0.6East South Central ............................................... 2.9 660 418 0 569 193 – –West South Central .............................................. 1.7 366 355 507 971 597 – –
Midwest .................................................................... 1.1 0 0 13 326 335 0.9 0.4East North Central ............................................... 1.5 0 0 0 434 735 1.3 0.3West North Central .............................................. 1.2 244 0 672 463 697 – –
West ......................................................................... 2.1 391 289 172 511 317 – –Mountain .............................................................. 2.0 0 455 936 835 271 – –Pacific .................................................................. 3.0 468 68 322 349 675 – –
1 The out-of-pocket maximum is the annual limit on the amount of covered expenses that a participant or a family must pay after the deductible has been satisfied. Once reached, coveredexpenses are fully reimbursed for the rest of the year.
2 Surveyed occupations are classified into wage categories based on the average wage for the occupation, which may include workers with earnings both above and below the threshold.The categories were formed using percentile estimates generated using data from the National Compensation Survey publication, "Employer Costs for Employee Compensation - March 2015."
Note: Dashes indicate that no data were reported or that data do not meet publication criteria. For definitions of major plans, key provisions, and related terms, see the "Glossary of EmployeeBenefit Terms" at www.bls.gov/ncs/ebs/glossary20152016.htm.
Source: Bureau of Labor Statistics, National Compensation Survey.
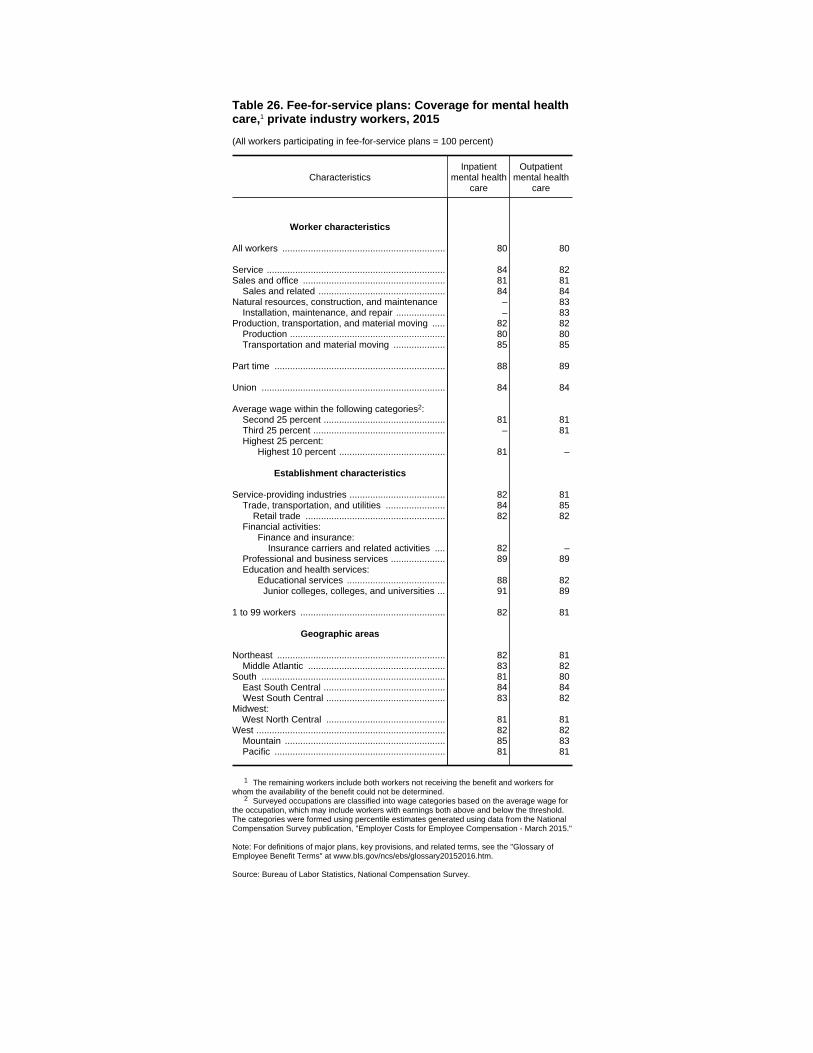
Table 26. Fee-for-service plans: Coverage for mental healthcare,1 private industry workers, 2015
(All workers participating in fee-for-service plans = 100 percent)
CharacteristicsInpatient
mental healthcare
Outpatientmental health
care
Worker characteristics
All workers ............................................................... 80 80
Service ..................................................................... 84 82Sales and office ....................................................... 81 81
Sales and related ................................................. 84 84Natural resources, construction, and maintenance – 83
Installation, maintenance, and repair ................... – 83Production, transportation, and material moving ..... 82 82
Production ............................................................ 80 80Transportation and material moving .................... 85 85
Part time .................................................................. 88 89
Union ....................................................................... 84 84
Average wage within the following categories2:Second 25 percent ............................................... 81 81Third 25 percent ................................................... – 81Highest 25 percent:
Highest 10 percent ......................................... 81 –
Establishment characteristics
Service-providing industries ..................................... 82 81Trade, transportation, and utilities ....................... 84 85
Retail trade ...................................................... 82 82Financial activities:
Finance and insurance:Insurance carriers and related activities .... 82 –
Professional and business services ..................... 89 89Education and health services:
Educational services ...................................... 88 82Junior colleges, colleges, and universities ... 91 89
1 to 99 workers ........................................................ 82 81
Geographic areas
Northeast ................................................................. 82 81Middle Atlantic ..................................................... 83 82
South ....................................................................... 81 80East South Central ............................................... 84 84West South Central .............................................. 83 82
Midwest:West North Central .............................................. 81 81
West ......................................................................... 82 82Mountain .............................................................. 85 83Pacific .................................................................. 81 81
1 The remaining workers include both workers not receiving the benefit and workers forwhom the availability of the benefit could not be determined.
2 Surveyed occupations are classified into wage categories based on the average wage forthe occupation, which may include workers with earnings both above and below the threshold.The categories were formed using percentile estimates generated using data from the NationalCompensation Survey publication, "Employer Costs for Employee Compensation - March 2015."
Note: For definitions of major plans, key provisions, and related terms, see the "Glossary ofEmployee Benefit Terms" at www.bls.gov/ncs/ebs/glossary20152016.htm.
Source: Bureau of Labor Statistics, National Compensation Survey.
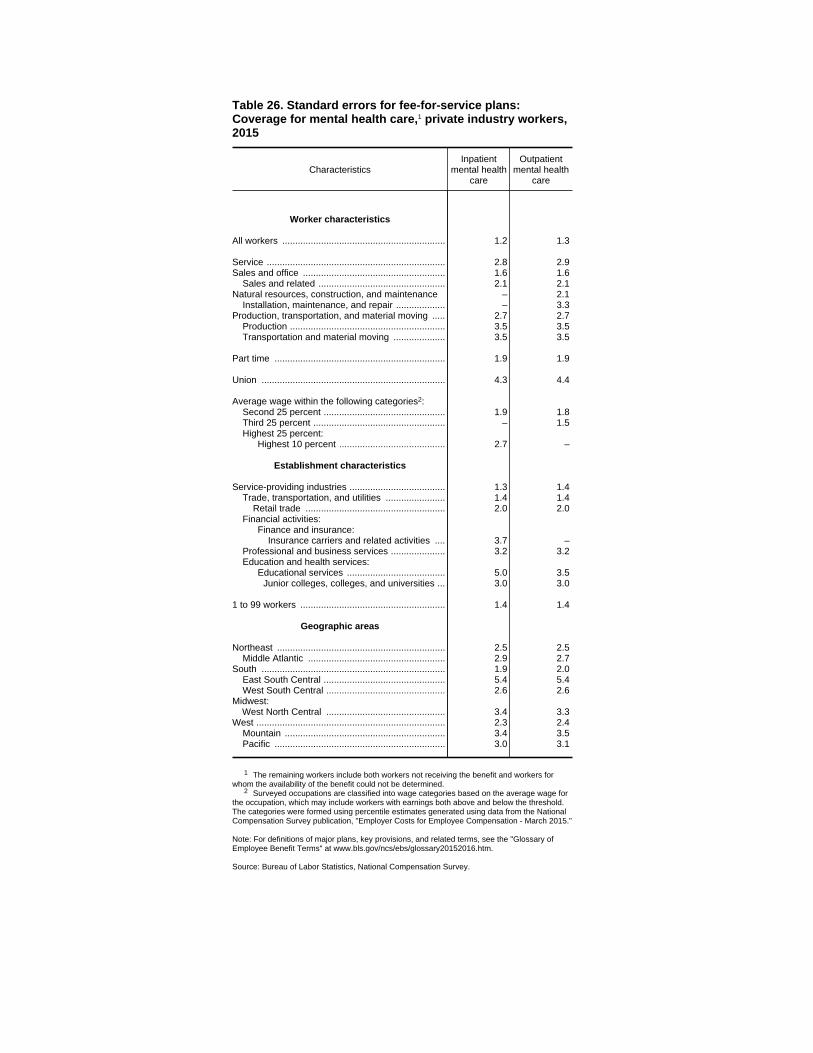
Table 26. Standard errors for fee-for-service plans:Coverage for mental health care,1 private industry workers,2015
CharacteristicsInpatient
mental healthcare
Outpatientmental health
care
Worker characteristics
All workers ............................................................... 1.2 1.3
Service ..................................................................... 2.8 2.9Sales and office ....................................................... 1.6 1.6
Sales and related ................................................. 2.1 2.1Natural resources, construction, and maintenance – 2.1
Installation, maintenance, and repair ................... – 3.3Production, transportation, and material moving ..... 2.7 2.7
Production ............................................................ 3.5 3.5Transportation and material moving .................... 3.5 3.5
Part time .................................................................. 1.9 1.9
Union ....................................................................... 4.3 4.4
Average wage within the following categories2:Second 25 percent ............................................... 1.9 1.8Third 25 percent ................................................... – 1.5Highest 25 percent:
Highest 10 percent ......................................... 2.7 –
Establishment characteristics
Service-providing industries ..................................... 1.3 1.4Trade, transportation, and utilities ....................... 1.4 1.4
Retail trade ...................................................... 2.0 2.0Financial activities:
Finance and insurance:Insurance carriers and related activities .... 3.7 –
Professional and business services ..................... 3.2 3.2Education and health services:
Educational services ...................................... 5.0 3.5Junior colleges, colleges, and universities ... 3.0 3.0
1 to 99 workers ........................................................ 1.4 1.4
Geographic areas
Northeast ................................................................. 2.5 2.5Middle Atlantic ..................................................... 2.9 2.7
South ....................................................................... 1.9 2.0East South Central ............................................... 5.4 5.4West South Central .............................................. 2.6 2.6
Midwest:West North Central .............................................. 3.4 3.3
West ......................................................................... 2.3 2.4Mountain .............................................................. 3.4 3.5Pacific .................................................................. 3.0 3.1
1 The remaining workers include both workers not receiving the benefit and workers forwhom the availability of the benefit could not be determined.
2 Surveyed occupations are classified into wage categories based on the average wage forthe occupation, which may include workers with earnings both above and below the threshold.The categories were formed using percentile estimates generated using data from the NationalCompensation Survey publication, "Employer Costs for Employee Compensation - March 2015."
Note: For definitions of major plans, key provisions, and related terms, see the "Glossary ofEmployee Benefit Terms" at www.bls.gov/ncs/ebs/glossary20152016.htm.
Source: Bureau of Labor Statistics, National Compensation Survey.

Table 27. Health maintenance organizations: Summary of selected features, private industry workers, 2015
(All workers participating in health maintenance organizations = 100 percent)
Characteristics
Annual deductible Coinsurance Annual out-of-pocket maximum
Yes No Notdeterminable Yes No Not
determinable Yes No Notdeterminable
Worker characteristics
All workers ............................................................... 57 43 – 33 67 – 92 8 –
Management, professional, and related .................. 55 45 – 38 62 – 91 9 –Management, business, and financial ................. 57 43 – 40 60 – 91 9 –Professional and related ...................................... 53 47 – 37 63 – 92 – –
Service ..................................................................... 54 46 – – 72 – 88 – –Sales and office ....................................................... 55 45 – 27 73 – 88 – –
Sales and related ................................................. 39 61 – – – – 87 – –Office and administrative support ........................ 61 39 – 28 72 – 88 – –
Natural resources, construction, and maintenance 60 40 – 24 76 – 98 – –Installation, maintenance, and repair ................... 51 49 – 16 84 – 97 – –
Production, transportation, and material moving ..... 70 30 – 37 63 – 98 – –Production ............................................................ 78 22 – 44 56 – 98 – –Transportation and material moving .................... 59 41 – – 73 – 97 – –
Full time ................................................................... 58 42 – 33 67 – 92 8 –Part time .................................................................. 38 62 – 34 66 – 91 – –
Union ....................................................................... 68 32 – 23 77 – 87 – –Nonunion ................................................................. 56 44 – 34 66 – 92 8 –
Average wage within the following categories1:Second 25 percent ............................................... 59 41 – 33 67 – 94 – –Third 25 percent ................................................... 63 37 – 31 69 – 91 9 –Highest 25 percent ............................................... 54 46 – 36 64 – 90 10 –
Highest 10 percent ........................................... 40 60 – 27 73 – 91 9 –
Establishment characteristics
Goods-producing industries ..................................... 69 31 – 41 59 – – – –Manufacturing ...................................................... 72 28 – 46 54 – 98 – –
Service-providing industries ..................................... 54 46 – 31 69 – 91 9 –Trade, transportation, and utilities ....................... 44 56 – 23 77 – 89 – –
Retail trade ...................................................... – – – – – – 86 – –Financial activities ................................................ 69 31 – 40 60 – 91 – –
Finance and insurance .................................... 72 28 – 42 58 – 91 – –Credit intermediation and related activities .. 78 – – 48 52 – 94 – –Insurance carriers and related activities ...... 67 33 – 37 63 – 88 – –
Professional and business services ..................... 63 37 – – 60 – 99 – –Education and health services ............................. 49 51 – 28 72 – 82 18 –
Educational services ........................................ 46 54 – 30 70 – 88 12 –Junior colleges, colleges, and universities ... 51 49 – 24 76 – 80 20 –
Health care and social assistance ................... 50 50 – 27 73 – 81 19 –
See footnotes at end of table.
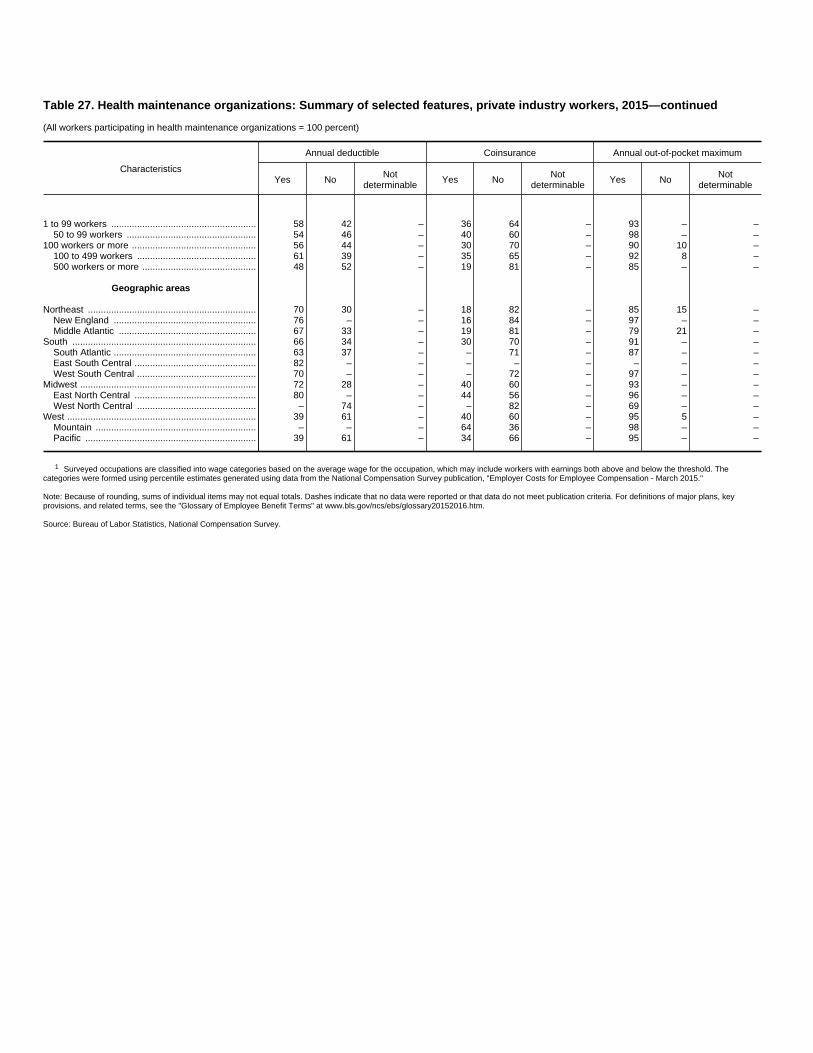
Table 27. Health maintenance organizations: Summary of selected features, private industry workers, 2015—continued
(All workers participating in health maintenance organizations = 100 percent)
Characteristics
Annual deductible Coinsurance Annual out-of-pocket maximum
Yes No Notdeterminable Yes No Not
determinable Yes No Notdeterminable
1 to 99 workers ........................................................ 58 42 – 36 64 – 93 – –50 to 99 workers .................................................. 54 46 – 40 60 – 98 – –
100 workers or more ................................................ 56 44 – 30 70 – 90 10 –100 to 499 workers .............................................. 61 39 – 35 65 – 92 8 –500 workers or more ............................................ 48 52 – 19 81 – 85 – –
Geographic areas
Northeast ................................................................. 70 30 – 18 82 – 85 15 –New England ....................................................... 76 – – 16 84 – 97 – –Middle Atlantic ..................................................... 67 33 – 19 81 – 79 21 –
South ....................................................................... 66 34 – 30 70 – 91 – –South Atlantic ....................................................... 63 37 – – 71 – 87 – –East South Central ............................................... 82 – – – – – – – –West South Central .............................................. 70 – – – 72 – 97 – –
Midwest .................................................................... 72 28 – 40 60 – 93 – –East North Central ............................................... 80 – – 44 56 – 96 – –West North Central .............................................. – 74 – – 82 – 69 – –
West ......................................................................... 39 61 – 40 60 – 95 5 –Mountain .............................................................. – – – 64 36 – 98 – –Pacific .................................................................. 39 61 – 34 66 – 95 – –
1 Surveyed occupations are classified into wage categories based on the average wage for the occupation, which may include workers with earnings both above and below the threshold. Thecategories were formed using percentile estimates generated using data from the National Compensation Survey publication, "Employer Costs for Employee Compensation - March 2015."
Note: Because of rounding, sums of individual items may not equal totals. Dashes indicate that no data were reported or that data do not meet publication criteria. For definitions of major plans, keyprovisions, and related terms, see the "Glossary of Employee Benefit Terms" at www.bls.gov/ncs/ebs/glossary20152016.htm.
Source: Bureau of Labor Statistics, National Compensation Survey.
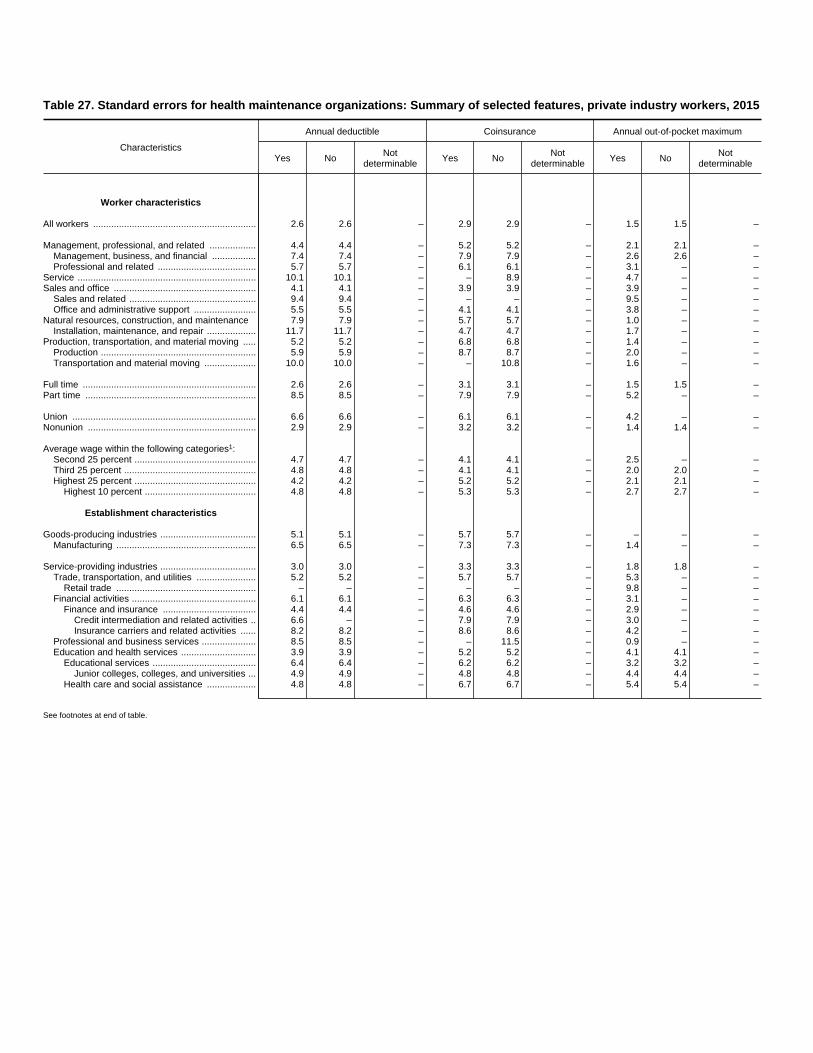
Table 27. Standard errors for health maintenance organizations: Summary of selected features, private industry workers, 2015
Characteristics
Annual deductible Coinsurance Annual out-of-pocket maximum
Yes No Notdeterminable Yes No Not
determinable Yes No Notdeterminable
Worker characteristics
All workers ............................................................... 2.6 2.6 – 2.9 2.9 – 1.5 1.5 –
Management, professional, and related .................. 4.4 4.4 – 5.2 5.2 – 2.1 2.1 –Management, business, and financial ................. 7.4 7.4 – 7.9 7.9 – 2.6 2.6 –Professional and related ...................................... 5.7 5.7 – 6.1 6.1 – 3.1 – –
Service ..................................................................... 10.1 10.1 – – 8.9 – 4.7 – –Sales and office ....................................................... 4.1 4.1 – 3.9 3.9 – 3.9 – –
Sales and related ................................................. 9.4 9.4 – – – – 9.5 – –Office and administrative support ........................ 5.5 5.5 – 4.1 4.1 – 3.8 – –
Natural resources, construction, and maintenance 7.9 7.9 – 5.7 5.7 – 1.0 – –Installation, maintenance, and repair ................... 11.7 11.7 – 4.7 4.7 – 1.7 – –
Production, transportation, and material moving ..... 5.2 5.2 – 6.8 6.8 – 1.4 – –Production ............................................................ 5.9 5.9 – 8.7 8.7 – 2.0 – –Transportation and material moving .................... 10.0 10.0 – – 10.8 – 1.6 – –
Full time ................................................................... 2.6 2.6 – 3.1 3.1 – 1.5 1.5 –Part time .................................................................. 8.5 8.5 – 7.9 7.9 – 5.2 – –
Union ....................................................................... 6.6 6.6 – 6.1 6.1 – 4.2 – –Nonunion ................................................................. 2.9 2.9 – 3.2 3.2 – 1.4 1.4 –
Average wage within the following categories1:Second 25 percent ............................................... 4.7 4.7 – 4.1 4.1 – 2.5 – –Third 25 percent ................................................... 4.8 4.8 – 4.1 4.1 – 2.0 2.0 –Highest 25 percent ............................................... 4.2 4.2 – 5.2 5.2 – 2.1 2.1 –
Highest 10 percent ........................................... 4.8 4.8 – 5.3 5.3 – 2.7 2.7 –
Establishment characteristics
Goods-producing industries ..................................... 5.1 5.1 – 5.7 5.7 – – – –Manufacturing ...................................................... 6.5 6.5 – 7.3 7.3 – 1.4 – –
Service-providing industries ..................................... 3.0 3.0 – 3.3 3.3 – 1.8 1.8 –Trade, transportation, and utilities ....................... 5.2 5.2 – 5.7 5.7 – 5.3 – –
Retail trade ...................................................... – – – – – – 9.8 – –Financial activities ................................................ 6.1 6.1 – 6.3 6.3 – 3.1 – –
Finance and insurance .................................... 4.4 4.4 – 4.6 4.6 – 2.9 – –Credit intermediation and related activities .. 6.6 – – 7.9 7.9 – 3.0 – –Insurance carriers and related activities ...... 8.2 8.2 – 8.6 8.6 – 4.2 – –
Professional and business services ..................... 8.5 8.5 – – 11.5 – 0.9 – –Education and health services ............................. 3.9 3.9 – 5.2 5.2 – 4.1 4.1 –
Educational services ........................................ 6.4 6.4 – 6.2 6.2 – 3.2 3.2 –Junior colleges, colleges, and universities ... 4.9 4.9 – 4.8 4.8 – 4.4 4.4 –
Health care and social assistance ................... 4.8 4.8 – 6.7 6.7 – 5.4 5.4 –
See footnotes at end of table.
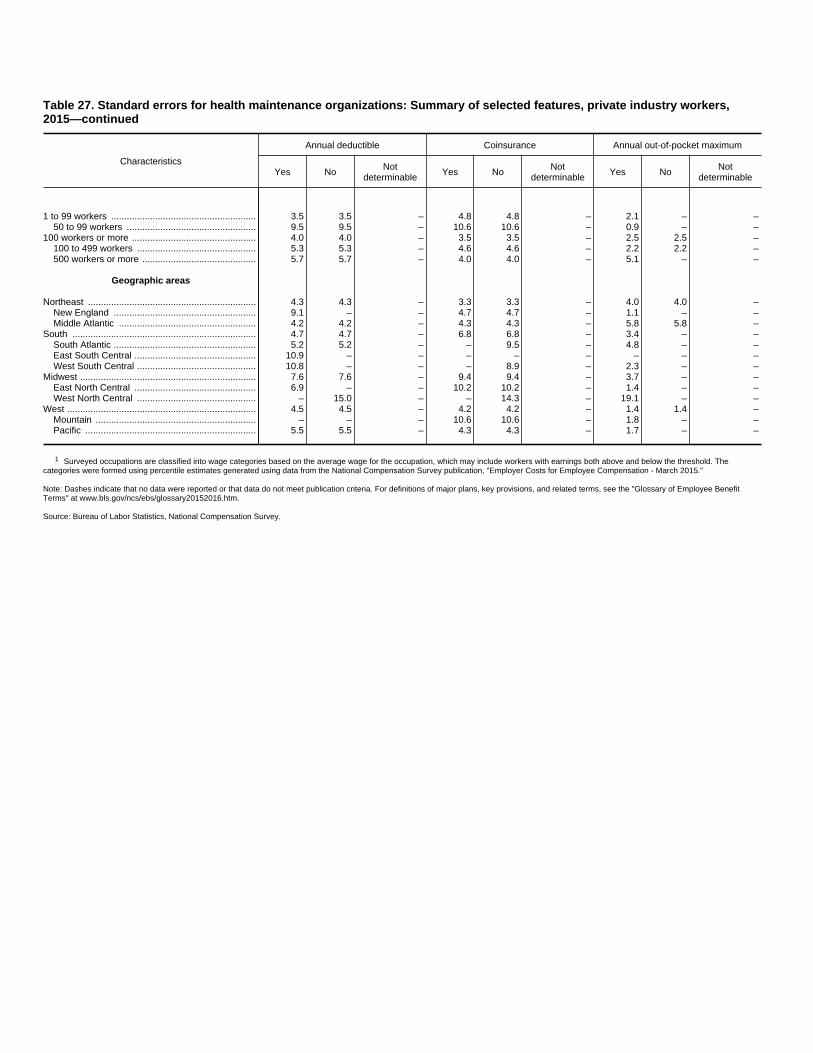
Table 27. Standard errors for health maintenance organizations: Summary of selected features, private industry workers,2015—continued
Characteristics
Annual deductible Coinsurance Annual out-of-pocket maximum
Yes No Notdeterminable Yes No Not
determinable Yes No Notdeterminable
1 to 99 workers ........................................................ 3.5 3.5 – 4.8 4.8 – 2.1 – –50 to 99 workers .................................................. 9.5 9.5 – 10.6 10.6 – 0.9 – –
100 workers or more ................................................ 4.0 4.0 – 3.5 3.5 – 2.5 2.5 –100 to 499 workers .............................................. 5.3 5.3 – 4.6 4.6 – 2.2 2.2 –500 workers or more ............................................ 5.7 5.7 – 4.0 4.0 – 5.1 – –
Geographic areas
Northeast ................................................................. 4.3 4.3 – 3.3 3.3 – 4.0 4.0 –New England ....................................................... 9.1 – – 4.7 4.7 – 1.1 – –Middle Atlantic ..................................................... 4.2 4.2 – 4.3 4.3 – 5.8 5.8 –
South ....................................................................... 4.7 4.7 – 6.8 6.8 – 3.4 – –South Atlantic ....................................................... 5.2 5.2 – – 9.5 – 4.8 – –East South Central ............................................... 10.9 – – – – – – – –West South Central .............................................. 10.8 – – – 8.9 – 2.3 – –
Midwest .................................................................... 7.6 7.6 – 9.4 9.4 – 3.7 – –East North Central ............................................... 6.9 – – 10.2 10.2 – 1.4 – –West North Central .............................................. – 15.0 – – 14.3 – 19.1 – –
West ......................................................................... 4.5 4.5 – 4.2 4.2 – 1.4 1.4 –Mountain .............................................................. – – – 10.6 10.6 – 1.8 – –Pacific .................................................................. 5.5 5.5 – 4.3 4.3 – 1.7 – –
1 Surveyed occupations are classified into wage categories based on the average wage for the occupation, which may include workers with earnings both above and below the threshold. Thecategories were formed using percentile estimates generated using data from the National Compensation Survey publication, "Employer Costs for Employee Compensation - March 2015."
Note: Dashes indicate that no data were reported or that data do not meet publication criteria. For definitions of major plans, key provisions, and related terms, see the "Glossary of Employee BenefitTerms" at www.bls.gov/ncs/ebs/glossary20152016.htm.
Source: Bureau of Labor Statistics, National Compensation Survey.
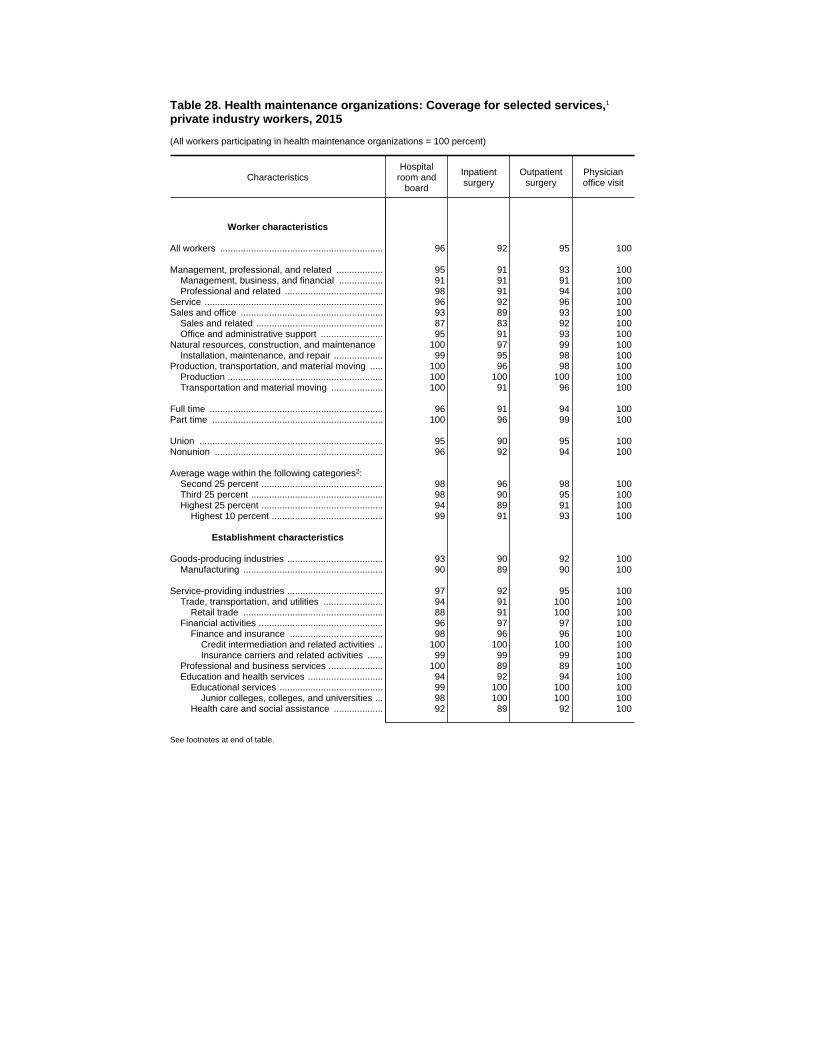
Table 28. Health maintenance organizations: Coverage for selected services,1
private industry workers, 2015
(All workers participating in health maintenance organizations = 100 percent)
CharacteristicsHospital
room andboard
Inpatientsurgery
Outpatientsurgery
Physicianoffice visit
Worker characteristics
All workers ............................................................... 96 92 95 100
Management, professional, and related .................. 95 91 93 100Management, business, and financial ................. 91 91 91 100Professional and related ...................................... 98 91 94 100
Service ..................................................................... 96 92 96 100Sales and office ....................................................... 93 89 93 100
Sales and related ................................................. 87 83 92 100Office and administrative support ........................ 95 91 93 100
Natural resources, construction, and maintenance 100 97 99 100Installation, maintenance, and repair ................... 99 95 98 100
Production, transportation, and material moving ..... 100 96 98 100Production ............................................................ 100 100 100 100Transportation and material moving .................... 100 91 96 100
Full time ................................................................... 96 91 94 100Part time .................................................................. 100 96 99 100
Union ....................................................................... 95 90 95 100Nonunion ................................................................. 96 92 94 100
Average wage within the following categories2:Second 25 percent ............................................... 98 96 98 100Third 25 percent ................................................... 98 90 95 100Highest 25 percent ............................................... 94 89 91 100
Highest 10 percent ........................................... 99 91 93 100
Establishment characteristics
Goods-producing industries ..................................... 93 90 92 100Manufacturing ...................................................... 90 89 90 100
Service-providing industries ..................................... 97 92 95 100Trade, transportation, and utilities ....................... 94 91 100 100
Retail trade ...................................................... 88 91 100 100Financial activities ................................................ 96 97 97 100
Finance and insurance .................................... 98 96 96 100Credit intermediation and related activities .. 100 100 100 100Insurance carriers and related activities ...... 99 99 99 100
Professional and business services ..................... 100 89 89 100Education and health services ............................. 94 92 94 100
Educational services ........................................ 99 100 100 100Junior colleges, colleges, and universities ... 98 100 100 100
Health care and social assistance ................... 92 89 92 100
See footnotes at end of table.

Table 28. Health maintenance organizations: Coverage for selected services,1
private industry workers, 2015—continued
(All workers participating in health maintenance organizations = 100 percent)
CharacteristicsHospital
room andboard
Inpatientsurgery
Outpatientsurgery
Physicianoffice visit
1 to 99 workers ........................................................ 95 89 93 10050 to 99 workers .................................................. 90 – 81 100
100 workers or more ................................................ 96 95 96 100100 to 499 workers .............................................. 96 95 95 100500 workers or more ............................................ 98 95 99 100
Geographic areas
Northeast ................................................................. 99 95 99 100New England ....................................................... 100 98 100 100Middle Atlantic ..................................................... 98 93 99 100
South ....................................................................... 92 92 92 100South Atlantic ....................................................... 90 90 90 100East South Central ............................................... 99 95 100 100West South Central .............................................. 96 96 96 100
Midwest .................................................................... 97 89 95 100East North Central ............................................... 96 91 96 100West North Central .............................................. – – 88 100
West ......................................................................... 96 91 93 100Mountain .............................................................. 100 98 100 100Pacific .................................................................. 95 89 92 100
1 The remaining workers include both workers not receiving the benefit and workers for whom the availability of the benefitcould not be determined.
2 Surveyed occupations are classified into wage categories based on the average wage for the occupation, which may includeworkers with earnings both above and below the threshold. The categories were formed using percentile estimates generated usingdata from the National Compensation Survey publication, "Employer Costs for Employee Compensation - March 2015."
Note: Dashes indicate that no data were reported or that data do not meet publication criteria. For definitions of major plans, keyprovisions, and related terms, see the "Glossary of Employee Benefit Terms" at www.bls.gov/ncs/ebs/glossary20152016.htm.
Source: Bureau of Labor Statistics, National Compensation Survey.
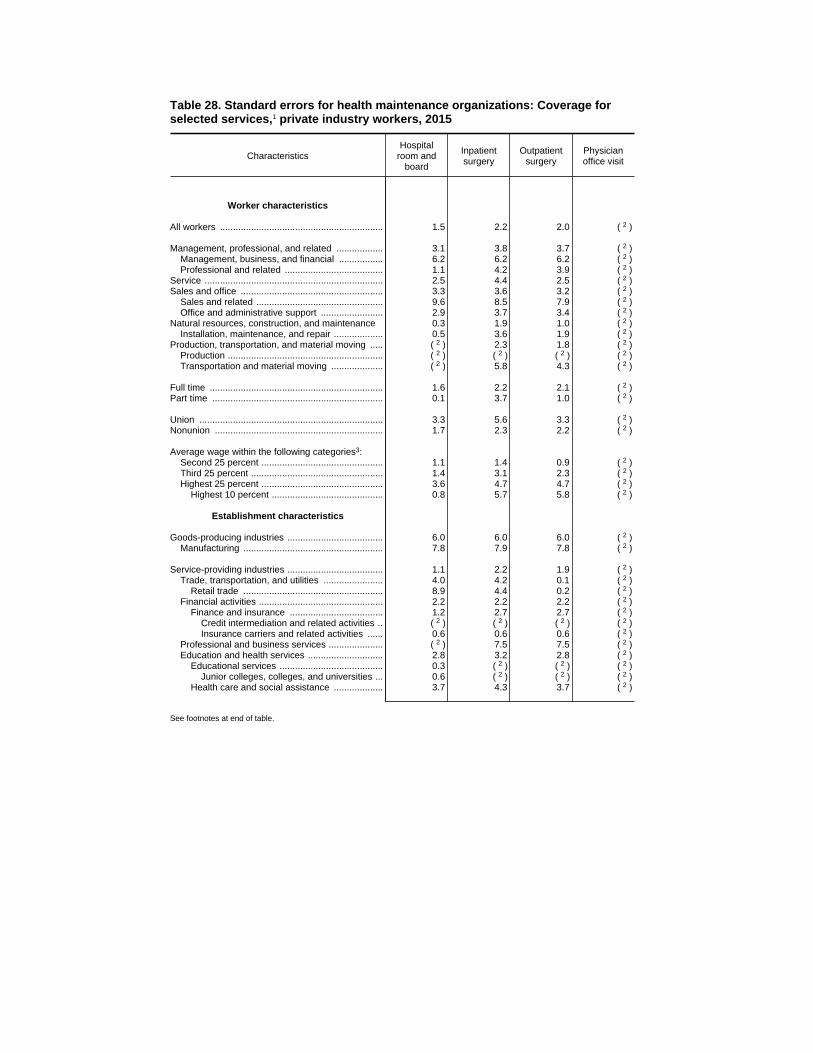
Table 28. Standard errors for health maintenance organizations: Coverage forselected services,1 private industry workers, 2015
CharacteristicsHospital
room andboard
Inpatientsurgery
Outpatientsurgery
Physicianoffice visit
Worker characteristics
All workers ............................................................... 1.5 2.2 2.0 2( )
Management, professional, and related .................. 3.1 3.8 3.7 2( )Management, business, and financial ................. 6.2 6.2 6.2 2( )Professional and related ...................................... 1.1 4.2 3.9 2( )
Service ..................................................................... 2.5 4.4 2.5 2( )Sales and office ....................................................... 3.3 3.6 3.2 2( )
Sales and related ................................................. 9.6 8.5 7.9 2( )Office and administrative support ........................ 2.9 3.7 3.4 2( )
Natural resources, construction, and maintenance 0.3 1.9 1.0 2( )Installation, maintenance, and repair ................... 0.5 3.6 1.9 2( )
Production, transportation, and material moving ..... 2( ) 2.3 1.8 2( )Production ............................................................ 2( ) 2( ) 2( ) 2( )Transportation and material moving .................... 2( ) 5.8 4.3 2( )
Full time ................................................................... 1.6 2.2 2.1 2( )Part time .................................................................. 0.1 3.7 1.0 2( )
Union ....................................................................... 3.3 5.6 3.3 2( )Nonunion ................................................................. 1.7 2.3 2.2 2( )
Average wage within the following categories3:Second 25 percent ............................................... 1.1 1.4 0.9 2( )Third 25 percent ................................................... 1.4 3.1 2.3 2( )Highest 25 percent ............................................... 3.6 4.7 4.7 2( )
Highest 10 percent ........................................... 0.8 5.7 5.8 2( )
Establishment characteristics
Goods-producing industries ..................................... 6.0 6.0 6.0 2( )Manufacturing ...................................................... 7.8 7.9 7.8 2( )
Service-providing industries ..................................... 1.1 2.2 1.9 2( )Trade, transportation, and utilities ....................... 4.0 4.2 0.1 2( )
Retail trade ...................................................... 8.9 4.4 0.2 2( )Financial activities ................................................ 2.2 2.2 2.2 2( )
Finance and insurance .................................... 1.2 2.7 2.7 2( )Credit intermediation and related activities .. 2( ) 2( ) 2( ) 2( )Insurance carriers and related activities ...... 0.6 0.6 0.6 2( )
Professional and business services ..................... 2( ) 7.5 7.5 2( )Education and health services ............................. 2.8 3.2 2.8 2( )
Educational services ........................................ 0.3 2( ) 2( ) 2( )Junior colleges, colleges, and universities ... 0.6 2( ) 2( ) 2( )
Health care and social assistance ................... 3.7 4.3 3.7 2( )
See footnotes at end of table.

Table 28. Standard errors for health maintenance organizations: Coverage forselected services,1 private industry workers, 2015—continued
CharacteristicsHospital
room andboard
Inpatientsurgery
Outpatientsurgery
Physicianoffice visit
1 to 99 workers ........................................................ 2.8 3.8 3.6 2( )50 to 99 workers .................................................. 8.9 – 10.3 2( )
100 workers or more ................................................ 1.5 1.8 1.5 2( )100 to 499 workers .............................................. 1.9 2.0 2.0 2( )500 workers or more ............................................ 1.0 2.7 1.0 2( )
Geographic areas
Northeast ................................................................. 0.8 2.7 0.5 2( )New England ....................................................... 2( ) 1.6 2( ) 2( )Middle Atlantic ..................................................... 1.2 4.1 0.7 2( )
South ....................................................................... 3.2 3.6 3.5 2( )South Atlantic ....................................................... 4.5 5.2 5.2 2( )East South Central ............................................... 1.4 4.7 2( ) 2( )West South Central .............................................. 3.5 3.6 3.5 2( )
Midwest .................................................................... 2.5 5.4 3.2 2( )East North Central ............................................... 3.0 5.6 3.0 2( )West North Central .............................................. – – 11.2 2( )
West ......................................................................... 3.1 4.3 4.3 2( )Mountain .............................................................. 2( ) 0.4 0.2 2( )Pacific .................................................................. 3.8 5.3 5.2 2( )
1 The remaining workers include both workers not receiving the benefit and workers for whom the availability of the benefitcould not be determined.
2 Less than 0.05.3 Surveyed occupations are classified into wage categories based on the average wage for the occupation, which may include
workers with earnings both above and below the threshold. The categories were formed using percentile estimates generated usingdata from the National Compensation Survey publication, "Employer Costs for Employee Compensation - March 2015."
Note: Dashes indicate that no data were reported or that data do not meet publication criteria. For definitions of major plans, keyprovisions, and related terms, see the "Glossary of Employee Benefit Terms" at www.bls.gov/ncs/ebs/glossary20152016.htm.
Source: Bureau of Labor Statistics, National Compensation Survey.
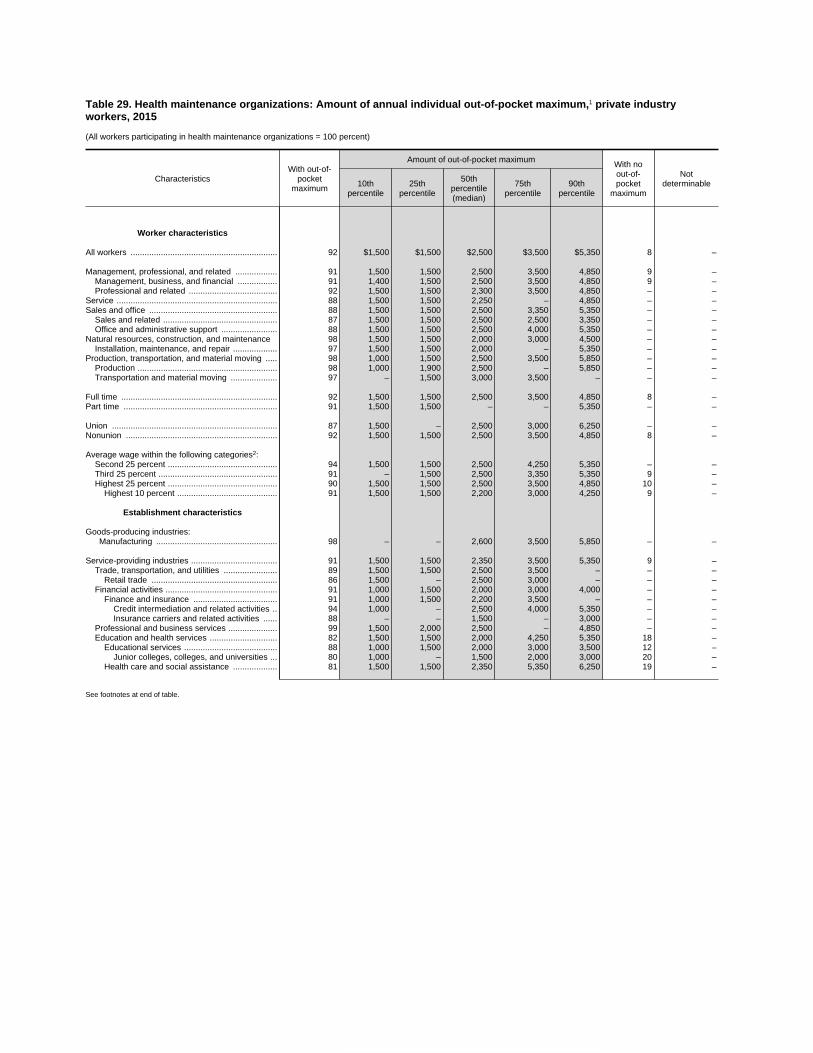
Table 29. Health maintenance organizations: Amount of annual individual out-of-pocket maximum,1 private industryworkers, 2015
(All workers participating in health maintenance organizations = 100 percent)
CharacteristicsWith out-of-
pocketmaximum
Amount of out-of-pocket maximum With noout-of-pocket
maximum
Notdeterminable10th
percentile25th
percentile
50thpercentile(median)
75thpercentile
90thpercentile
Worker characteristics
All workers ............................................................... 92 $1,500 $1,500 $2,500 $3,500 $5,350 8 –
Management, professional, and related .................. 91 1,500 1,500 2,500 3,500 4,850 9 –Management, business, and financial ................. 91 1,400 1,500 2,500 3,500 4,850 9 –Professional and related ...................................... 92 1,500 1,500 2,300 3,500 4,850 – –
Service ..................................................................... 88 1,500 1,500 2,250 – 4,850 – –Sales and office ....................................................... 88 1,500 1,500 2,500 3,350 5,350 – –
Sales and related ................................................. 87 1,500 1,500 2,500 2,500 3,350 – –Office and administrative support ........................ 88 1,500 1,500 2,500 4,000 5,350 – –
Natural resources, construction, and maintenance 98 1,500 1,500 2,000 3,000 4,500 – –Installation, maintenance, and repair ................... 97 1,500 1,500 2,000 – 5,350 – –
Production, transportation, and material moving ..... 98 1,000 1,500 2,500 3,500 5,850 – –Production ............................................................ 98 1,000 1,900 2,500 – 5,850 – –Transportation and material moving .................... 97 – 1,500 3,000 3,500 – – –
Full time ................................................................... 92 1,500 1,500 2,500 3,500 4,850 8 –Part time .................................................................. 91 1,500 1,500 – – 5,350 – –
Union ....................................................................... 87 1,500 – 2,500 3,000 6,250 – –Nonunion ................................................................. 92 1,500 1,500 2,500 3,500 4,850 8 –
Average wage within the following categories2:Second 25 percent ............................................... 94 1,500 1,500 2,500 4,250 5,350 – –Third 25 percent ................................................... 91 – 1,500 2,500 3,350 5,350 9 –Highest 25 percent ............................................... 90 1,500 1,500 2,500 3,500 4,850 10 –
Highest 10 percent ........................................... 91 1,500 1,500 2,200 3,000 4,250 9 –
Establishment characteristics
Goods-producing industries:Manufacturing .................................................... 98 – – 2,600 3,500 5,850 – –
Service-providing industries ..................................... 91 1,500 1,500 2,350 3,500 5,350 9 –Trade, transportation, and utilities ....................... 89 1,500 1,500 2,500 3,500 – – –
Retail trade ...................................................... 86 1,500 – 2,500 3,000 – – –Financial activities ................................................ 91 1,000 1,500 2,000 3,000 4,000 – –
Finance and insurance .................................... 91 1,000 1,500 2,200 3,500 – – –Credit intermediation and related activities .. 94 1,000 – 2,500 4,000 5,350 – –Insurance carriers and related activities ...... 88 – – 1,500 – 3,000 – –
Professional and business services ..................... 99 1,500 2,000 2,500 – 4,850 – –Education and health services ............................. 82 1,500 1,500 2,000 4,250 5,350 18 –
Educational services ........................................ 88 1,000 1,500 2,000 3,000 3,500 12 –Junior colleges, colleges, and universities ... 80 1,000 – 1,500 2,000 3,000 20 –
Health care and social assistance ................... 81 1,500 1,500 2,350 5,350 6,250 19 –
See footnotes at end of table.

Table 29. Health maintenance organizations: Amount of annual individual out-of-pocket maximum,1 private industryworkers, 2015—continued
(All workers participating in health maintenance organizations = 100 percent)
CharacteristicsWith out-of-
pocketmaximum
Amount of out-of-pocket maximum With noout-of-pocket
maximum
Notdeterminable10th
percentile25th
percentile
50thpercentile(median)
75thpercentile
90thpercentile
1 to 99 workers ........................................................ 93 $1,500 $1,500 $2,500 $4,250 $5,350 – –50 to 99 workers .................................................. 98 – 1,500 2,300 2,600 3,500 – –
100 workers or more ................................................ 90 1,500 1,700 2,500 3,000 4,850 10 –100 to 499 workers .............................................. 92 1,500 2,000 2,500 3,350 4,250 8 –500 workers or more ............................................ 85 – 1,500 2,000 3,000 6,250 – –
Geographic areas
Northeast ................................................................. 85 1,000 – 2,500 4,000 6,250 15 –New England ....................................................... 97 1,000 – 2,000 – – – –Middle Atlantic ..................................................... 79 – 2,000 3,000 4,000 6,250 21 –
South ....................................................................... 91 1,500 2,000 2,500 4,250 6,250 – –South Atlantic ....................................................... 87 1,500 2,000 2,500 4,000 5,350 – –West South Central .............................................. 97 1,500 – 3,500 – 6,350 – –
Midwest .................................................................... 93 1,500 1,700 2,350 4,850 5,350 – –East North Central ............................................... 96 1,500 1,900 2,350 – 4,850 – –West North Central .............................................. 69 1,500 1,500 – 4,850 6,350 – –
West ......................................................................... 95 1,500 1,500 2,250 2,700 4,000 5 –Mountain .............................................................. 98 1,500 – 2,500 3,350 – – –Pacific .................................................................. 95 1,500 1,500 2,000 2,600 4,000 – –
1 The out-of-pocket maximum is the annual limit on the amount of covered expenses that a participant or a family must pay after the deductible has been satisfied. Once reached, coveredexpenses are fully reimbursed for the rest of the year.
2 Surveyed occupations are classified into wage categories based on the average wage for the occupation, which may include workers with earnings both above and below the threshold. Thecategories were formed using percentile estimates generated using data from the National Compensation Survey publication, "Employer Costs for Employee Compensation - March 2015."
Note: Because of rounding, sums of individual items may not equal totals. Dashes indicate that no data were reported or that data do not meet publication criteria. For definitions of major plans, keyprovisions, and related terms, see the "Glossary of Employee Benefit Terms" at www.bls.gov/ncs/ebs/glossary20152016.htm.
Source: Bureau of Labor Statistics, National Compensation Survey.

Table 29. Standard errors for health maintenance organizations: Amount of annual individual out-of-pocket maximum,1
private industry workers, 2015
CharacteristicsWith out-of-
pocketmaximum
Amount of out-of-pocket maximumWith no out-of-
pocketmaximum
Notdeterminable10th
percentile25th
percentile
50thpercentile(median)
75thpercentile
90thpercentile
Worker characteristics
All workers ............................................................... 1.5 $0 $0 $196 $188 $695 1.5 –
Management, professional, and related .................. 2.1 18 179 130 354 639 2.1 –Management, business, and financial ................. 2.6 197 298 84 442 1,385 2.6 –Professional and related ...................................... 3.1 0 279 264 775 664 – –
Service ..................................................................... 4.7 0 426 279 – 651 – –Sales and office ....................................................... 3.9 0 172 0 595 409 – –
Sales and related ................................................. 9.5 0 365 0 223 477 – –Office and administrative support ........................ 3.8 36 248 172 502 431 – –
Natural resources, construction, and maintenance 1.0 0 0 26 744 292 – –Installation, maintenance, and repair ................... 1.7 151 0 430 – 1,261 – –
Production, transportation, and material moving ..... 1.4 205 295 534 526 1,205 – –Production ............................................................ 2.0 203 560 682 – 953 – –Transportation and material moving .................... 1.6 – 0 791 707 – – –
Full time ................................................................... 1.5 0 123 165 188 508 1.5 –Part time .................................................................. 5.2 164 0 – – 284 – –
Union ....................................................................... 4.2 0 – 551 64 1,463 – –Nonunion ................................................................. 1.4 0 0 215 474 619 1.4 –
Average wage within the following categories2:Second 25 percent ............................................... 2.5 0 440 69 453 0 – –Third 25 percent ................................................... 2.0 – 323 204 322 1,101 2.0 –Highest 25 percent ............................................... 2.1 157 66 228 608 387 2.1 –
Highest 10 percent ........................................... 2.7 0 0 465 266 449 2.7 –
Establishment characteristics
Goods-producing industries:Manufacturing .................................................... 1.4 – – 121 216 1,179 – –
Service-providing industries ..................................... 1.8 0 27 203 473 695 1.8 –Trade, transportation, and utilities ....................... 5.3 0 0 0 516 – – –
Retail trade ...................................................... 9.8 0 – 202 122 – – –Financial activities ................................................ 3.1 0 80 164 643 1,016 – –
Finance and insurance .................................... 2.9 0 0 270 796 – – –Credit intermediation and related activities .. 3.0 0 – 716 243 886 – –Insurance carriers and related activities ...... 4.2 – – 354 – 55 – –
Professional and business services ..................... 0.9 216 237 137 – 0 – –Education and health services ............................. 4.1 0 0 436 720 788 4.1 –
Educational services ........................................ 3.2 137 112 0 826 246 3.2 –Junior colleges, colleges, and universities ... 4.4 292 – 102 79 555 4.4 –
Health care and social assistance ................... 5.4 0 0 408 1,344 658 5.4 –
See footnotes at end of table.
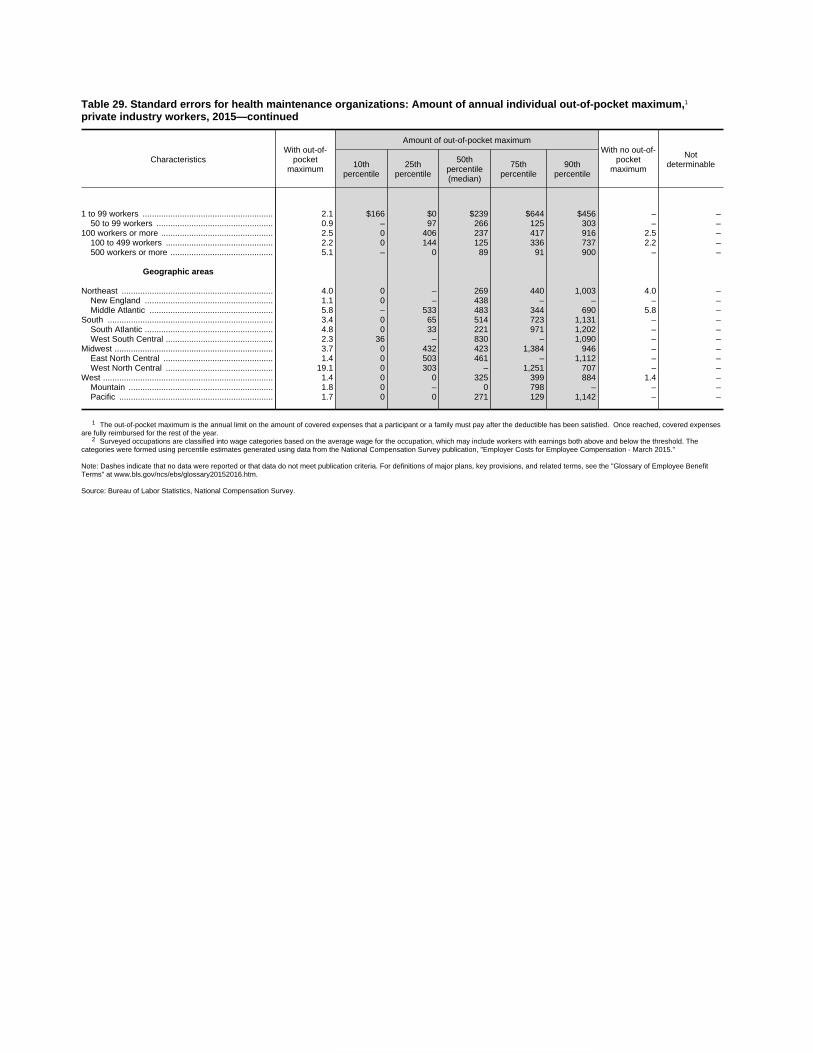
Table 29. Standard errors for health maintenance organizations: Amount of annual individual out-of-pocket maximum,1
private industry workers, 2015—continued
CharacteristicsWith out-of-
pocketmaximum
Amount of out-of-pocket maximumWith no out-of-
pocketmaximum
Notdeterminable10th
percentile25th
percentile
50thpercentile(median)
75thpercentile
90thpercentile
1 to 99 workers ........................................................ 2.1 $166 $0 $239 $644 $456 – –50 to 99 workers .................................................. 0.9 – 97 266 125 303 – –
100 workers or more ................................................ 2.5 0 406 237 417 916 2.5 –100 to 499 workers .............................................. 2.2 0 144 125 336 737 2.2 –500 workers or more ............................................ 5.1 – 0 89 91 900 – –
Geographic areas
Northeast ................................................................. 4.0 0 – 269 440 1,003 4.0 –New England ....................................................... 1.1 0 – 438 – – – –Middle Atlantic ..................................................... 5.8 – 533 483 344 690 5.8 –
South ....................................................................... 3.4 0 65 514 723 1,131 – –South Atlantic ....................................................... 4.8 0 33 221 971 1,202 – –West South Central .............................................. 2.3 36 – 830 – 1,090 – –
Midwest .................................................................... 3.7 0 432 423 1,384 946 – –East North Central ............................................... 1.4 0 503 461 – 1,112 – –West North Central .............................................. 19.1 0 303 – 1,251 707 – –
West ......................................................................... 1.4 0 0 325 399 884 1.4 –Mountain .............................................................. 1.8 0 – 0 798 – – –Pacific .................................................................. 1.7 0 0 271 129 1,142 – –
1 The out-of-pocket maximum is the annual limit on the amount of covered expenses that a participant or a family must pay after the deductible has been satisfied. Once reached, covered expensesare fully reimbursed for the rest of the year.
2 Surveyed occupations are classified into wage categories based on the average wage for the occupation, which may include workers with earnings both above and below the threshold. Thecategories were formed using percentile estimates generated using data from the National Compensation Survey publication, "Employer Costs for Employee Compensation - March 2015."
Note: Dashes indicate that no data were reported or that data do not meet publication criteria. For definitions of major plans, key provisions, and related terms, see the "Glossary of Employee BenefitTerms" at www.bls.gov/ncs/ebs/glossary20152016.htm.
Source: Bureau of Labor Statistics, National Compensation Survey.

Table 30. Health maintenance organizations: Amount of annual family out-of-pocket maximum,1 private industry workers,2015
(All workers participating in health maintenance organizations = 100 percent)
CharacteristicsWith out-of-
pocketmaximum
Amount of out-of-pocket maximum With noout-of-pocket
maximum
Notdeterminable10th
percentile25th
percentile
50thpercentile(median)
75thpercentile
90thpercentile
Worker characteristics
All workers ............................................................... 92 $3,000 $3,000 $5,000 $7,500 $9,700 8 –
Management, professional, and related .................. 91 3,000 3,000 5,000 8,000 9,700 9 –Management, business, and financial ................. 91 – – 5,200 7,500 9,700 9 –Professional and related ...................................... 92 3,000 3,000 5,000 8,000 9,700 – –
Service ..................................................................... 88 3,000 – 5,000 – 9,700 – –Sales and office ....................................................... 88 3,000 – 5,000 7,500 10,700 – –
Sales and related ................................................. 87 3,000 4,400 5,000 5,400 7,500 – –Office and administrative support ........................ 88 3,000 3,000 5,000 8,000 10,700 – –
Natural resources, construction, and maintenance 98 3,000 3,000 4,000 6,000 9,000 – –Installation, maintenance, and repair ................... 97 3,000 3,000 4,000 – 10,700 – –
Production, transportation, and material moving ..... 98 2,000 – 6,000 8,000 11,700 – –Production ............................................................ 98 2,000 3,800 – 8,000 11,700 – –Transportation and material moving .................... 97 – 3,000 6,000 8,000 – – –
Full time ................................................................... 92 3,000 3,000 5,000 7,500 9,700 8 –Part time .................................................................. 91 3,000 3,000 – – 10,700 – –
Union ....................................................................... 87 3,000 4,000 5,000 6,000 12,400 – –Nonunion ................................................................. 92 3,000 3,000 5,000 8,000 9,700 8 –
Average wage within the following categories2:Second 25 percent ............................................... 94 3,000 – 5,000 8,500 10,700 – –Third 25 percent ................................................... 91 – 4,000 5,000 7,500 10,700 9 –Highest 25 percent ............................................... 90 3,000 3,000 5,000 7,500 9,700 10 –
Highest 10 percent ........................................... 91 3,000 3,000 4,500 7,500 9,000 9 –
Establishment characteristics
Goods-producing industries:Manufacturing .................................................... 98 – 4,000 5,200 7,000 11,700 – –
Service-providing industries ..................................... 91 3,000 3,000 5,000 8,000 9,700 9 –Trade, transportation, and utilities ....................... 89 3,000 3,000 5,000 7,000 – – –
Retail trade ...................................................... 86 3,000 4,500 5,000 6,000 – – –Financial activities ................................................ 91 2,000 3,000 4,400 6,700 – – –
Finance and insurance .................................... 91 2,000 3,000 4,400 8,000 10,700 – –Credit intermediation and related activities .. 94 2,000 3,000 – 8,000 10,700 – –Insurance carriers and related activities ...... 88 – – – 5,000 – – –
Professional and business services ..................... 99 3,000 4,000 6,000 9,000 9,700 – –Education and health services ............................. 82 3,000 3,000 4,700 9,000 10,700 18 –
Educational services ........................................ 88 2,000 3,000 4,000 – 9,400 12 –Junior colleges, colleges, and universities ... 80 2,000 – 3,500 4,000 6,000 20 –
Health care and social assistance ................... 81 3,000 3,000 5,000 9,700 12,400 19 –
See footnotes at end of table.
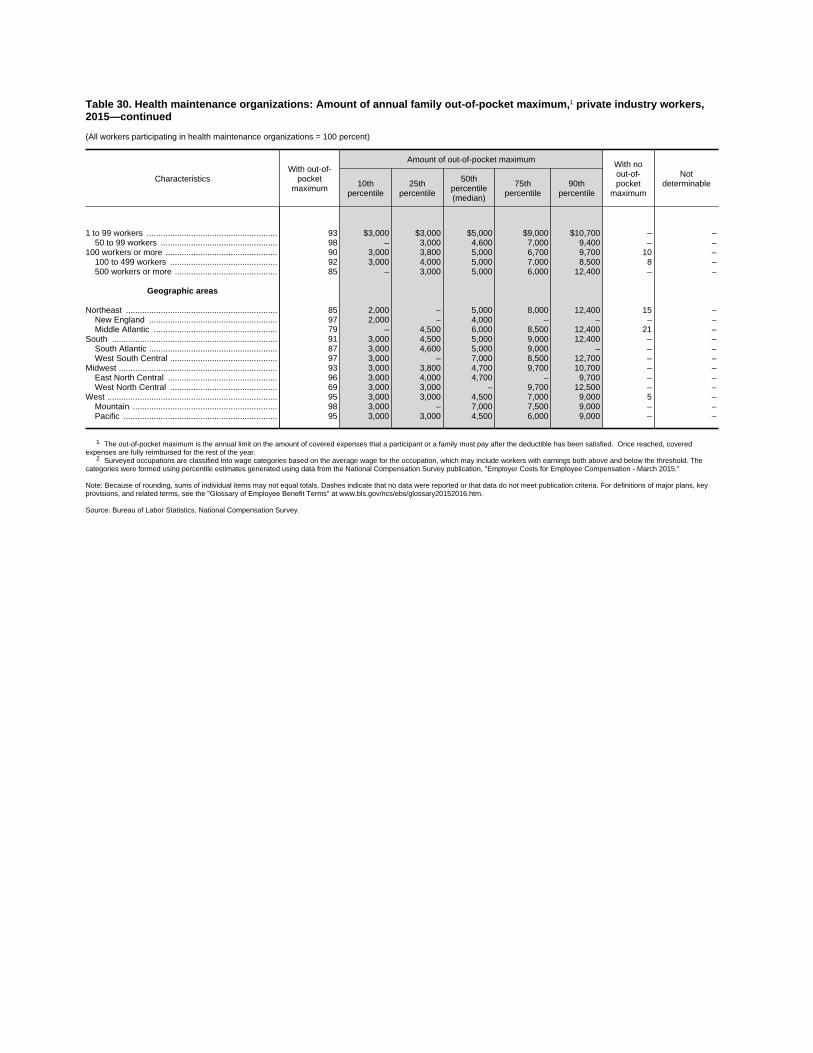
Table 30. Health maintenance organizations: Amount of annual family out-of-pocket maximum,1 private industry workers,2015—continued
(All workers participating in health maintenance organizations = 100 percent)
CharacteristicsWith out-of-
pocketmaximum
Amount of out-of-pocket maximum With noout-of-pocket
maximum
Notdeterminable10th
percentile25th
percentile
50thpercentile(median)
75thpercentile
90thpercentile
1 to 99 workers ........................................................ 93 $3,000 $3,000 $5,000 $9,000 $10,700 – –50 to 99 workers .................................................. 98 – 3,000 4,600 7,000 9,400 – –
100 workers or more ................................................ 90 3,000 3,800 5,000 6,700 9,700 10 –100 to 499 workers .............................................. 92 3,000 4,000 5,000 7,000 8,500 8 –500 workers or more ............................................ 85 – 3,000 5,000 6,000 12,400 – –
Geographic areas
Northeast ................................................................. 85 2,000 – 5,000 8,000 12,400 15 –New England ....................................................... 97 2,000 – 4,000 – – – –Middle Atlantic ..................................................... 79 – 4,500 6,000 8,500 12,400 21 –
South ....................................................................... 91 3,000 4,500 5,000 9,000 12,400 – –South Atlantic ....................................................... 87 3,000 4,600 5,000 9,000 – – –West South Central .............................................. 97 3,000 – 7,000 8,500 12,700 – –
Midwest .................................................................... 93 3,000 3,800 4,700 9,700 10,700 – –East North Central ............................................... 96 3,000 4,000 4,700 – 9,700 – –West North Central .............................................. 69 3,000 3,000 – 9,700 12,500 – –
West ......................................................................... 95 3,000 3,000 4,500 7,000 9,000 5 –Mountain .............................................................. 98 3,000 – 7,000 7,500 9,000 – –Pacific .................................................................. 95 3,000 3,000 4,500 6,000 9,000 – –
1 The out-of-pocket maximum is the annual limit on the amount of covered expenses that a participant or a family must pay after the deductible has been satisfied. Once reached, coveredexpenses are fully reimbursed for the rest of the year.
2 Surveyed occupations are classified into wage categories based on the average wage for the occupation, which may include workers with earnings both above and below the threshold. Thecategories were formed using percentile estimates generated using data from the National Compensation Survey publication, "Employer Costs for Employee Compensation - March 2015."
Note: Because of rounding, sums of individual items may not equal totals. Dashes indicate that no data were reported or that data do not meet publication criteria. For definitions of major plans, keyprovisions, and related terms, see the "Glossary of Employee Benefit Terms" at www.bls.gov/ncs/ebs/glossary20152016.htm.
Source: Bureau of Labor Statistics, National Compensation Survey.

Table 30. Standard errors for health maintenance organizations: Amount of annual family out-of-pocket maximum,1 privateindustry workers, 2015
CharacteristicsWith out-of-
pocketmaximum
Amount of out-of-pocket maximum With noout-of-pocket
maximum
Notdeterminable10th
percentile25th
percentile
50thpercentile(median)
75thpercentile
90thpercentile
Worker characteristics
All workers ............................................................... 1.5 $0 $374 $95 $678 $1,238 1.5 –
Management, professional, and related .................. 2.1 100 732 214 670 983 2.1 –Management, business, and financial ................. 2.6 – – 736 759 2,409 2.6 –Professional and related ...................................... 3.1 0 817 521 1,414 1,032 – –
Service ..................................................................... 4.7 0 – 478 – 994 – –Sales and office ....................................................... 3.9 0 – 0 1,078 730 – –
Sales and related ................................................. 9.5 0 609 0 858 847 – –Office and administrative support ........................ 3.8 73 869 747 710 880 – –
Natural resources, construction, and maintenance 1.0 0 137 258 885 1,916 – –Installation, maintenance, and repair ................... 1.7 258 0 867 – 2,207 – –
Production, transportation, and material moving ..... 1.4 410 – 1,274 1,080 2,411 – –Production ............................................................ 2.0 406 1,111 – 1,745 1,905 – –Transportation and material moving .................... 1.6 – 545 1,298 1,527 – – –
Full time ................................................................... 1.5 0 855 95 683 577 1.5 –Part time .................................................................. 5.2 258 0 – – 95 – –
Union ....................................................................... 4.2 0 620 708 338 2,400 – –Nonunion ................................................................. 1.4 0 220 275 660 1,064 1.4 –
Average wage within the following categories2:Second 25 percent ............................................... 2.5 0 – 103 878 0 – –Third 25 percent ................................................... 2.0 – 1,062 356 685 1,782 2.0 –Highest 25 percent ............................................... 2.1 489 560 335 524 352 2.1 –
Highest 10 percent ........................................... 2.7 0 0 800 736 644 2.7 –
Establishment characteristics
Goods-producing industries:Manufacturing .................................................... 1.4 – 1,179 555 760 2,358 – –
Service-providing industries ..................................... 1.8 0 356 229 734 1,251 1.8 –Trade, transportation, and utilities ....................... 5.3 0 748 0 930 – – –
Retail trade ...................................................... 9.8 0 516 403 245 – – –Financial activities ................................................ 3.1 0 328 770 1,268 – – –
Finance and insurance .................................... 2.9 0 0 541 1,780 3,184 – –Credit intermediation and related activities .. 3.0 0 887 – 359 1,791 – –Insurance carriers and related activities ...... 4.2 – – – 1,277 – – –
Professional and business services ..................... 0.9 463 479 1,280 2,188 0 – –Education and health services ............................. 4.1 0 0 647 899 1,491 4.1 –
Educational services ........................................ 3.2 348 456 0 – 752 3.2 –Junior colleges, colleges, and universities ... 4.4 584 – 619 182 966 4.4 –
Health care and social assistance ................... 5.4 0 0 475 1,831 1,245 5.4 –
See footnotes at end of table.
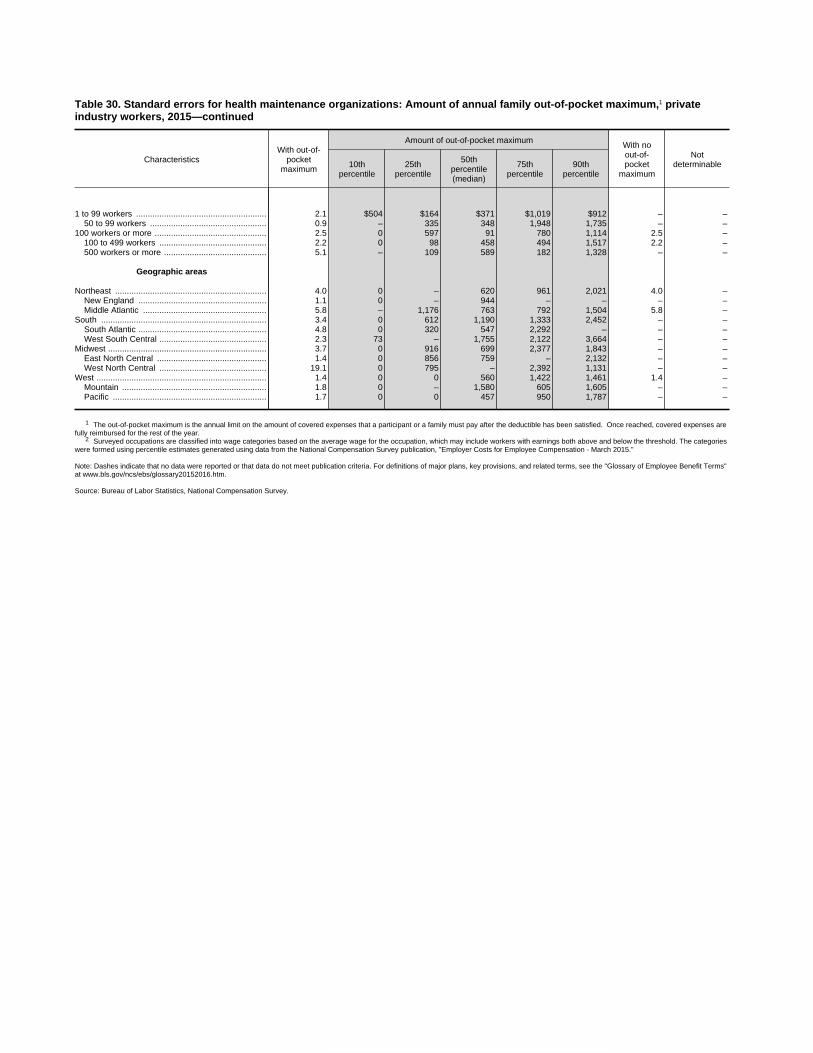
Table 30. Standard errors for health maintenance organizations: Amount of annual family out-of-pocket maximum,1 privateindustry workers, 2015—continued
CharacteristicsWith out-of-
pocketmaximum
Amount of out-of-pocket maximum With noout-of-pocket
maximum
Notdeterminable10th
percentile25th
percentile
50thpercentile(median)
75thpercentile
90thpercentile
1 to 99 workers ........................................................ 2.1 $504 $164 $371 $1,019 $912 – –50 to 99 workers .................................................. 0.9 – 335 348 1,948 1,735 – –
100 workers or more ................................................ 2.5 0 597 91 780 1,114 2.5 –100 to 499 workers .............................................. 2.2 0 98 458 494 1,517 2.2 –500 workers or more ............................................ 5.1 – 109 589 182 1,328 – –
Geographic areas
Northeast ................................................................. 4.0 0 – 620 961 2,021 4.0 –New England ....................................................... 1.1 0 – 944 – – – –Middle Atlantic ..................................................... 5.8 – 1,176 763 792 1,504 5.8 –
South ....................................................................... 3.4 0 612 1,190 1,333 2,452 – –South Atlantic ....................................................... 4.8 0 320 547 2,292 – – –West South Central .............................................. 2.3 73 – 1,755 2,122 3,664 – –
Midwest .................................................................... 3.7 0 916 699 2,377 1,843 – –East North Central ............................................... 1.4 0 856 759 – 2,132 – –West North Central .............................................. 19.1 0 795 – 2,392 1,131 – –
West ......................................................................... 1.4 0 0 560 1,422 1,461 1.4 –Mountain .............................................................. 1.8 0 – 1,580 605 1,605 – –Pacific .................................................................. 1.7 0 0 457 950 1,787 – –
1 The out-of-pocket maximum is the annual limit on the amount of covered expenses that a participant or a family must pay after the deductible has been satisfied. Once reached, covered expenses arefully reimbursed for the rest of the year.
2 Surveyed occupations are classified into wage categories based on the average wage for the occupation, which may include workers with earnings both above and below the threshold. The categorieswere formed using percentile estimates generated using data from the National Compensation Survey publication, "Employer Costs for Employee Compensation - March 2015."
Note: Dashes indicate that no data were reported or that data do not meet publication criteria. For definitions of major plans, key provisions, and related terms, see the "Glossary of Employee Benefit Terms"at www.bls.gov/ncs/ebs/glossary20152016.htm.
Source: Bureau of Labor Statistics, National Compensation Survey.

Table 31. Health maintenance organizations: Coverage formental health care,1 private industry workers, 2015
(All workers participating in health maintenance organizations = 100 percent)
CharacteristicsInpatient
mental healthcare
Outpatientmental health
care
Worker characteristics
All workers ............................................................... 82 82
Management, professional, and related .................. 84 84Professional and related ...................................... 87 87
Natural resources, construction, and maintenance 95 93Installation, maintenance, and repair ................... 93 90
Production, transportation, and material moving ..... 91 89Production ............................................................ 90 87Transportation and material moving .................... 92 92
Full time ................................................................... 82 81Part time .................................................................. 86 86
Union ....................................................................... 91 89Nonunion ................................................................. 81 –
Average wage within the following categories2:Second 25 percent ............................................... 82 81Third 25 percent ................................................... 88 87Highest 25 percent ............................................... 81 80
Highest 10 percent ........................................... 81 81
Establishment characteristics
Service-providing industries ..................................... 83 82Trade, transportation, and utilities ....................... 83 82Financial activities ................................................ 89 86
Finance and insurance .................................... 88 87Credit intermediation and related activities .. 85 85Insurance carriers and related activities ...... 90 90
Professional and business services ..................... 95 94Education and health services ............................. 83 82
Educational services ........................................ 81 81Junior colleges, colleges, and universities ... 90 90
Health care and social assistance ................... 83 83
1 to 99 workers ........................................................ 81 –100 workers or more ................................................ 84 84
500 workers or more ............................................ 92 92
Geographic areas
Northeast ................................................................. 88 86New England ....................................................... 88 84Middle Atlantic ..................................................... 88 87
South:East South Central ............................................... 89 89
Midwest .................................................................... 92 91West North Central .............................................. 98 98
West:Mountain .............................................................. 90 90
1 The remaining workers include both workers not receiving the benefit and workers forwhom the availability of the benefit could not be determined.
2 Surveyed occupations are classified into wage categories based on the average wage forthe occupation, which may include workers with earnings both above and below the threshold.The categories were formed using percentile estimates generated using data from the NationalCompensation Survey publication, "Employer Costs for Employee Compensation - March 2015."
Note: Dashes indicate that no data were reported or that data do not meet publication criteria.For definitions of major plans, key provisions, and related terms, see the "Glossary of EmployeeBenefit Terms" at www.bls.gov/ncs/ebs/glossary20152016.htm.
Source: Bureau of Labor Statistics, National Compensation Survey.

Table 31. Standard errors for health maintenanceorganizations: Coverage for mental health care,1 privateindustry workers, 2015
CharacteristicsInpatient
mental healthcare
Outpatientmental health
care
Worker characteristics
All workers ............................................................... 2.8 2.8
Management, professional, and related .................. 3.8 3.8Professional and related ...................................... 3.3 3.3
Natural resources, construction, and maintenance 2.4 3.1Installation, maintenance, and repair ................... 4.5 5.6
Production, transportation, and material moving ..... 3.2 3.5Production ............................................................ 4.1 4.6Transportation and material moving .................... 3.7 3.7
Full time ................................................................... 2.8 2.8Part time .................................................................. 12.3 12.3
Union ....................................................................... 3.5 3.5Nonunion ................................................................. 3.2 –
Average wage within the following categories2:Second 25 percent ............................................... 5.6 5.7Third 25 percent ................................................... 2.7 2.7Highest 25 percent ............................................... 4.7 4.7
Highest 10 percent ........................................... 4.4 4.4
Establishment characteristics
Service-providing industries ..................................... 2.8 2.9Trade, transportation, and utilities ....................... 4.0 4.9Financial activities ................................................ 3.6 4.4
Finance and insurance .................................... 4.5 4.5Credit intermediation and related activities .. 6.6 6.6Insurance carriers and related activities ...... 5.0 5.0
Professional and business services ..................... 3.4 3.6Education and health services ............................. 4.4 4.3
Educational services ........................................ 7.4 7.4Junior colleges, colleges, and universities ... 3.7 3.7
Health care and social assistance ................... 5.3 5.2
1 to 99 workers ........................................................ 4.9 –100 workers or more ................................................ 3.5 3.5
500 workers or more ............................................ 1.7 1.8
Geographic areas
Northeast ................................................................. 3.4 3.6New England ....................................................... 5.9 6.7Middle Atlantic ..................................................... 4.2 4.2
South:East South Central ............................................... 7.6 7.6
Midwest .................................................................... 3.5 3.5West North Central .............................................. 1.4 1.4
West:Mountain .............................................................. 8.8 8.8
1 The remaining workers include both workers not receiving the benefit and workers forwhom the availability of the benefit could not be determined.
2 Surveyed occupations are classified into wage categories based on the average wage forthe occupation, which may include workers with earnings both above and below the threshold.The categories were formed using percentile estimates generated using data from the NationalCompensation Survey publication, "Employer Costs for Employee Compensation - March 2015."
Note: Dashes indicate that no data were reported or that data do not meet publication criteria.For definitions of major plans, key provisions, and related terms, see the "Glossary of EmployeeBenefit Terms" at www.bls.gov/ncs/ebs/glossary20152016.htm.
Source: Bureau of Labor Statistics, National Compensation Survey.
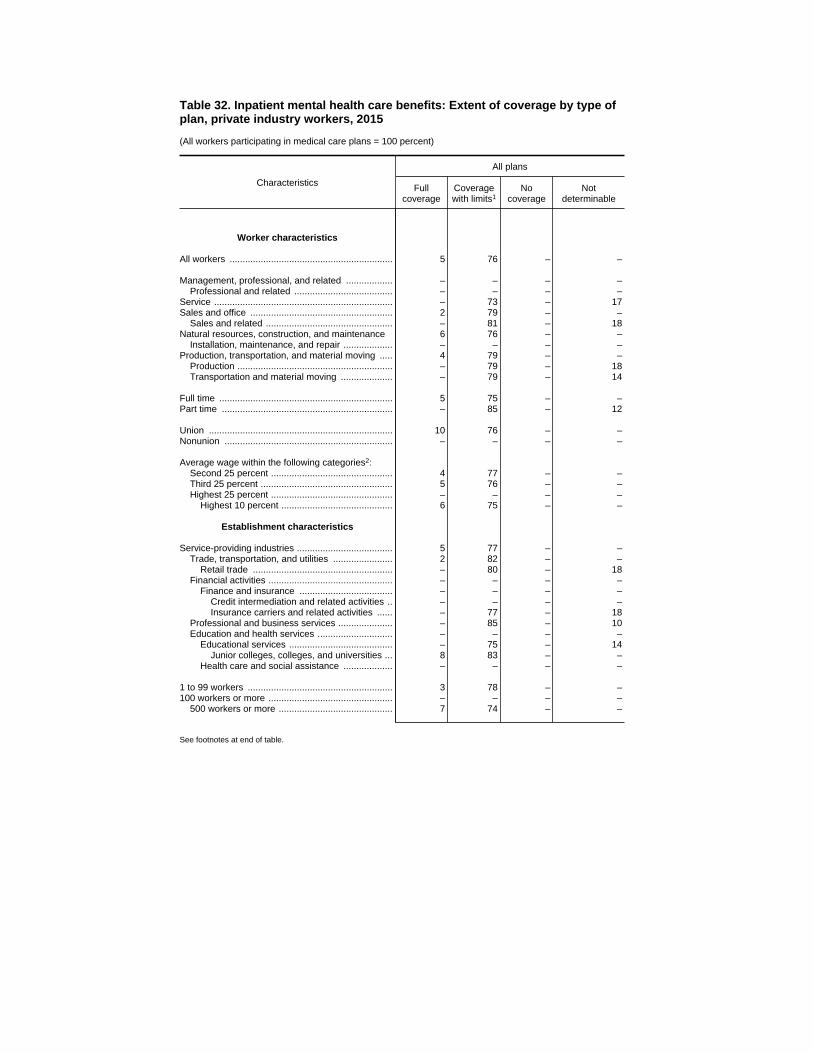
Table 32. Inpatient mental health care benefits: Extent of coverage by type ofplan, private industry workers, 2015
(All workers participating in medical care plans = 100 percent)
Characteristics
All plans
Fullcoverage
Coveragewith limits1
Nocoverage
Notdeterminable
Worker characteristics
All workers ............................................................... 5 76 – –
Management, professional, and related .................. – – – –Professional and related ...................................... – – – –
Service ..................................................................... – 73 – 17Sales and office ....................................................... 2 79 – –
Sales and related ................................................. – 81 – 18Natural resources, construction, and maintenance 6 76 – –
Installation, maintenance, and repair ................... – – – –Production, transportation, and material moving ..... 4 79 – –
Production ............................................................ – 79 – 18Transportation and material moving .................... – 79 – 14
Full time ................................................................... 5 75 – –Part time .................................................................. – 85 – 12
Union ....................................................................... 10 76 – –Nonunion ................................................................. – – – –
Average wage within the following categories2:Second 25 percent ............................................... 4 77 – –Third 25 percent ................................................... 5 76 – –Highest 25 percent ............................................... – – – –
Highest 10 percent ........................................... 6 75 – –
Establishment characteristics
Service-providing industries ..................................... 5 77 – –Trade, transportation, and utilities ....................... 2 82 – –
Retail trade ...................................................... – 80 – 18Financial activities ................................................ – – – –
Finance and insurance .................................... – – – –Credit intermediation and related activities .. – – – –Insurance carriers and related activities ...... – 77 – 18
Professional and business services ..................... – 85 – 10Education and health services ............................. – – – –
Educational services ........................................ – 75 – 14Junior colleges, colleges, and universities ... 8 83 – –
Health care and social assistance ................... – – – –
1 to 99 workers ........................................................ 3 78 – –100 workers or more ................................................ – – – –
500 workers or more ............................................ 7 74 – –
See footnotes at end of table.
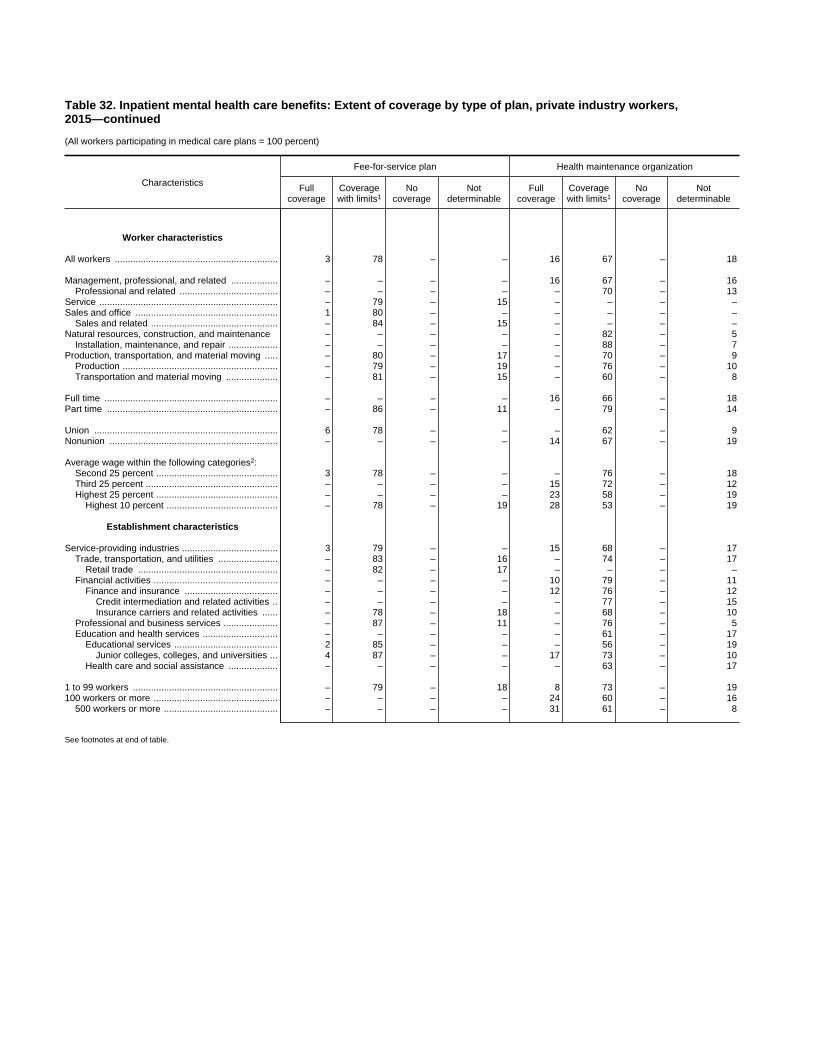
Table 32. Inpatient mental health care benefits: Extent of coverage by type of plan, private industry workers,2015—continued
(All workers participating in medical care plans = 100 percent)
Characteristics
Fee-for-service plan Health maintenance organization
Fullcoverage
Coveragewith limits1
Nocoverage
Notdeterminable
Fullcoverage
Coveragewith limits1
Nocoverage
Notdeterminable
Worker characteristics
All workers ............................................................... 3 78 – – 16 67 – 18
Management, professional, and related .................. – – – – 16 67 – 16Professional and related ...................................... – – – – – 70 – 13
Service ..................................................................... – 79 – 15 – – – –Sales and office ....................................................... 1 80 – – – – – –
Sales and related ................................................. – 84 – 15 – – – –Natural resources, construction, and maintenance – – – – – 82 – 5
Installation, maintenance, and repair ................... – – – – – 88 – 7Production, transportation, and material moving ..... – 80 – 17 – 70 – 9
Production ............................................................ – 79 – 19 – 76 – 10Transportation and material moving .................... – 81 – 15 – 60 – 8
Full time ................................................................... – – – – 16 66 – 18Part time .................................................................. – 86 – 11 – 79 – 14
Union ....................................................................... 6 78 – – – 62 – 9Nonunion ................................................................. – – – – 14 67 – 19
Average wage within the following categories2:Second 25 percent ............................................... 3 78 – – – 76 – 18Third 25 percent ................................................... – – – – 15 72 – 12Highest 25 percent ............................................... – – – – 23 58 – 19
Highest 10 percent ........................................... – 78 – 19 28 53 – 19
Establishment characteristics
Service-providing industries ..................................... 3 79 – – 15 68 – 17Trade, transportation, and utilities ....................... – 83 – 16 – 74 – 17
Retail trade ...................................................... – 82 – 17 – – – –Financial activities ................................................ – – – – 10 79 – 11
Finance and insurance .................................... – – – – 12 76 – 12Credit intermediation and related activities .. – – – – – 77 – 15Insurance carriers and related activities ...... – 78 – 18 – 68 – 10
Professional and business services ..................... – 87 – 11 – 76 – 5Education and health services ............................. – – – – – 61 – 17
Educational services ........................................ 2 85 – – – 56 – 19Junior colleges, colleges, and universities ... 4 87 – – 17 73 – 10
Health care and social assistance ................... – – – – – 63 – 17
1 to 99 workers ........................................................ – 79 – 18 8 73 – 19100 workers or more ................................................ – – – – 24 60 – 16
500 workers or more ............................................ – – – – 31 61 – 8
See footnotes at end of table.
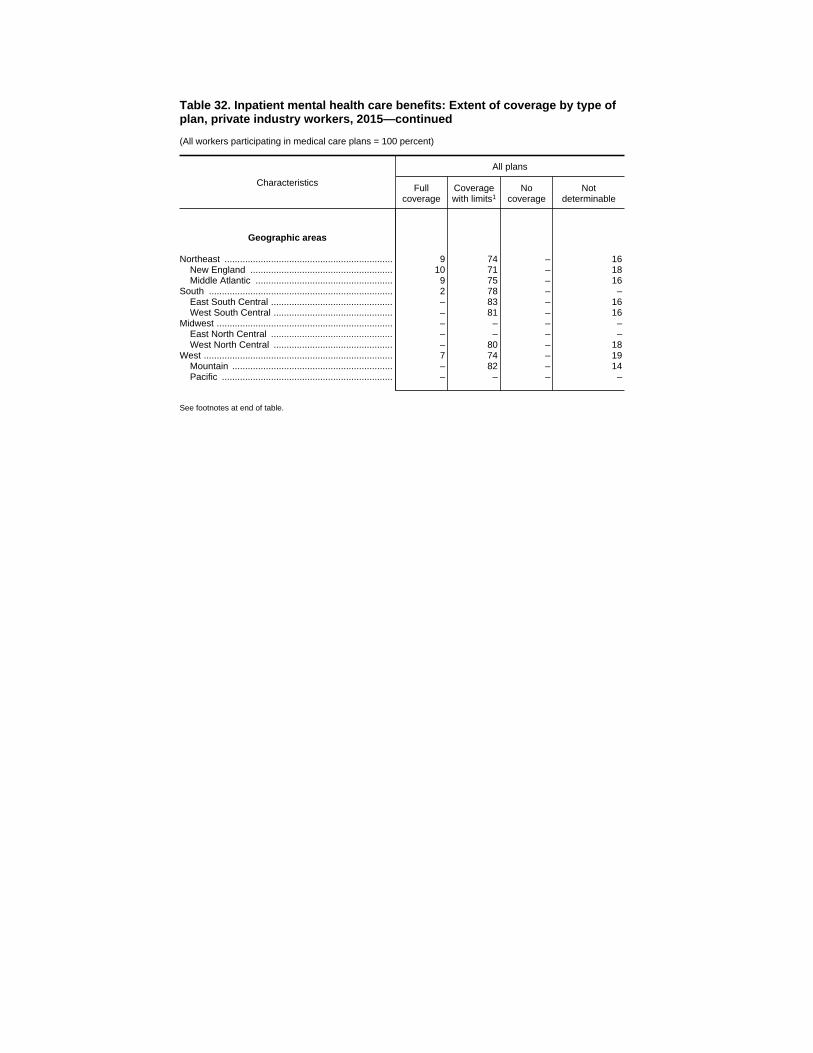
Table 32. Inpatient mental health care benefits: Extent of coverage by type ofplan, private industry workers, 2015—continued
(All workers participating in medical care plans = 100 percent)
Characteristics
All plans
Fullcoverage
Coveragewith limits1
Nocoverage
Notdeterminable
Geographic areas
Northeast ................................................................. 9 74 – 16New England ....................................................... 10 71 – 18Middle Atlantic ..................................................... 9 75 – 16
South ....................................................................... 2 78 – –East South Central ............................................... – 83 – 16West South Central .............................................. – 81 – 16
Midwest .................................................................... – – – –East North Central ............................................... – – – –West North Central .............................................. – 80 – 18
West ......................................................................... 7 74 – 19Mountain .............................................................. – 82 – 14Pacific .................................................................. – – – –
See footnotes at end of table.

Table 32. Inpatient mental health care benefits: Extent of coverage by type of plan, private industry workers,2015—continued
(All workers participating in medical care plans = 100 percent)
Characteristics
Fee-for-service plan Health maintenance organization
Fullcoverage
Coveragewith limits1
Nocoverage
Notdeterminable
Fullcoverage
Coveragewith limits1
Nocoverage
Notdeterminable
Geographic areas
Northeast ................................................................. 7 75 – 18 16 72 – 12New England ....................................................... – – – – 17 71 – 12Middle Atlantic ..................................................... 7 76 – 17 – 73 – 12
South ....................................................................... – 80 – 18 – – – –East South Central ............................................... – 83 – 16 – 86 – 11West South Central .............................................. – 82 – 16 – – – –
Midwest .................................................................... – – – – – 79 – 8East North Central ............................................... – – – – – 79 – 9West North Central .............................................. – 80 – 19 – 79 – 2
West ......................................................................... – 80 – 18 – – – –Mountain .............................................................. – 83 – 15 – 80 – 10Pacific .................................................................. – 78 – 19 – – – –
1 Limits may be set in terms of dollar or day ceiling on benefits, a requirement that the participant pay a percentage of costs (coinsurance), or a requirement that the participant pay aspecific amount (deductible or copayment) before reimbursement begins or services are rendered.
2 Surveyed occupations are classified into wage categories based on the average wage for the occupation, which may include workers with earnings both above and below the threshold.The categories were formed using percentile estimates generated using data from the National Compensation Survey publication, "Employer Costs for Employee Compensation - March2015."
Note: Because of rounding, sums of individual items may not equal totals. Dashes indicate that no data were reported or that data do not meet publication criteria. For definitions of majorplans, key provisions, and related terms, see the "Glossary of Employee Benefit Terms" at www.bls.gov/ncs/ebs/glossary20152016.htm.
Source: Bureau of Labor Statistics, National Compensation Survey.

Table 32. Standard errors for inpatient mental health care benefits: Extent ofcoverage by type of plan, private industry workers, 2015
Characteristics
All plans
Fullcoverage
Coveragewith limits1
Nocoverage
Notdeterminable
Worker characteristics
All workers ............................................................... 0.6 1.3 – –
Management, professional, and related .................. – – – –Professional and related ...................................... – – – –
Service ..................................................................... – 3.7 – 3.1Sales and office ....................................................... 0.3 1.7 – –
Sales and related ................................................. – 2.2 – 2.2Natural resources, construction, and maintenance 1.6 2.6 – –
Installation, maintenance, and repair ................... – – – –Production, transportation, and material moving ..... 1.3 2.9 – –
Production ............................................................ – 3.4 – 2.9Transportation and material moving .................... – 4.5 – 2.8
Full time ................................................................... 0.7 1.3 – –Part time .................................................................. – 2.9 – 2.2
Union ....................................................................... 2.1 4.2 – –Nonunion ................................................................. – – – –
Average wage within the following categories2:Second 25 percent ............................................... 0.8 2.2 – –Third 25 percent ................................................... 0.8 1.5 – –Highest 25 percent ............................................... – – – –
Highest 10 percent ........................................... 1.4 3.0 – –
Establishment characteristics
Service-providing industries ..................................... 0.8 1.5 – –Trade, transportation, and utilities ....................... 0.6 1.6 – –
Retail trade ...................................................... – 1.7 – 1.5Financial activities ................................................ – – – –
Finance and insurance .................................... – – – –Credit intermediation and related activities .. – – – –Insurance carriers and related activities ...... – 3.8 – 3.4
Professional and business services ..................... – 4.0 – 3.1Education and health services ............................. – – – –
Educational services ........................................ – 5.2 – 4.7Junior colleges, colleges, and universities ... 0.9 2.6 – –
Health care and social assistance ................... – – – –
1 to 99 workers ........................................................ 0.7 1.7 – –100 workers or more ................................................ – – – –
500 workers or more ............................................ 1.2 2.0 – –
See footnotes at end of table.
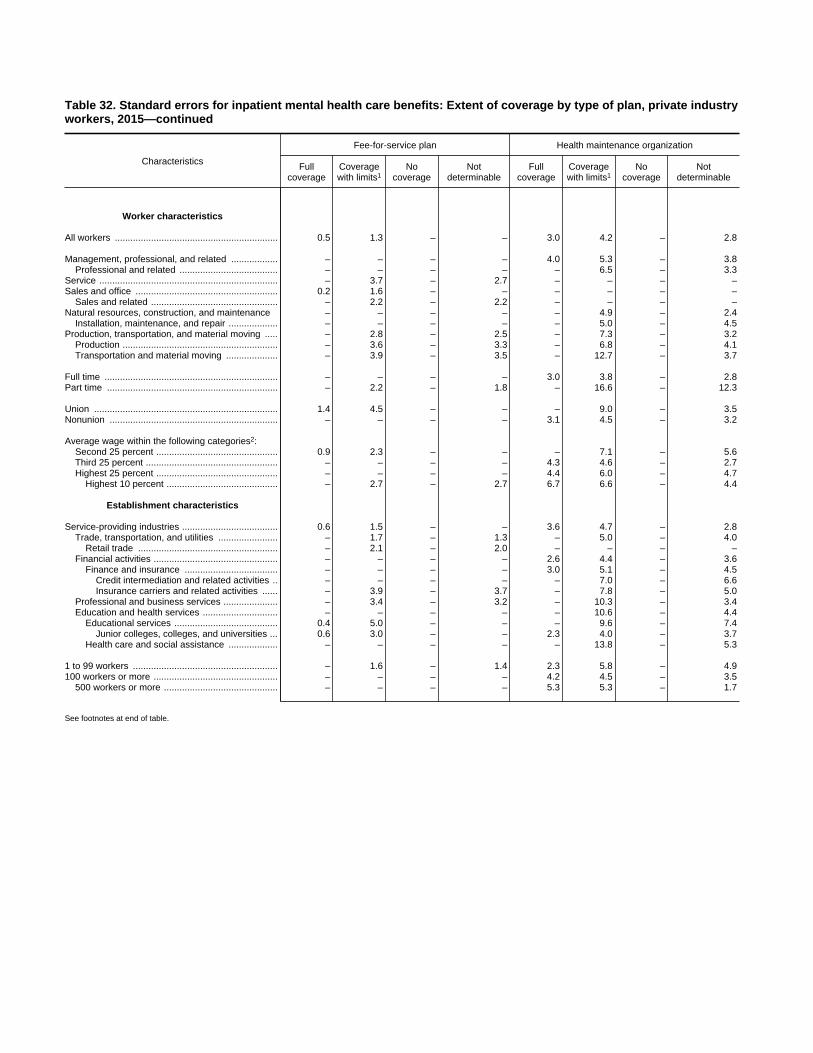
Table 32. Standard errors for inpatient mental health care benefits: Extent of coverage by type of plan, private industryworkers, 2015—continued
Characteristics
Fee-for-service plan Health maintenance organization
Fullcoverage
Coveragewith limits1
Nocoverage
Notdeterminable
Fullcoverage
Coveragewith limits1
Nocoverage
Notdeterminable
Worker characteristics
All workers ............................................................... 0.5 1.3 – – 3.0 4.2 – 2.8
Management, professional, and related .................. – – – – 4.0 5.3 – 3.8Professional and related ...................................... – – – – – 6.5 – 3.3
Service ..................................................................... – 3.7 – 2.7 – – – –Sales and office ....................................................... 0.2 1.6 – – – – – –
Sales and related ................................................. – 2.2 – 2.2 – – – –Natural resources, construction, and maintenance – – – – – 4.9 – 2.4
Installation, maintenance, and repair ................... – – – – – 5.0 – 4.5Production, transportation, and material moving ..... – 2.8 – 2.5 – 7.3 – 3.2
Production ............................................................ – 3.6 – 3.3 – 6.8 – 4.1Transportation and material moving .................... – 3.9 – 3.5 – 12.7 – 3.7
Full time ................................................................... – – – – 3.0 3.8 – 2.8Part time .................................................................. – 2.2 – 1.8 – 16.6 – 12.3
Union ....................................................................... 1.4 4.5 – – – 9.0 – 3.5Nonunion ................................................................. – – – – 3.1 4.5 – 3.2
Average wage within the following categories2:Second 25 percent ............................................... 0.9 2.3 – – – 7.1 – 5.6Third 25 percent ................................................... – – – – 4.3 4.6 – 2.7Highest 25 percent ............................................... – – – – 4.4 6.0 – 4.7
Highest 10 percent ........................................... – 2.7 – 2.7 6.7 6.6 – 4.4
Establishment characteristics
Service-providing industries ..................................... 0.6 1.5 – – 3.6 4.7 – 2.8Trade, transportation, and utilities ....................... – 1.7 – 1.3 – 5.0 – 4.0
Retail trade ...................................................... – 2.1 – 2.0 – – – –Financial activities ................................................ – – – – 2.6 4.4 – 3.6
Finance and insurance .................................... – – – – 3.0 5.1 – 4.5Credit intermediation and related activities .. – – – – – 7.0 – 6.6Insurance carriers and related activities ...... – 3.9 – 3.7 – 7.8 – 5.0
Professional and business services ..................... – 3.4 – 3.2 – 10.3 – 3.4Education and health services ............................. – – – – – 10.6 – 4.4
Educational services ........................................ 0.4 5.0 – – – 9.6 – 7.4Junior colleges, colleges, and universities ... 0.6 3.0 – – 2.3 4.0 – 3.7
Health care and social assistance ................... – – – – – 13.8 – 5.3
1 to 99 workers ........................................................ – 1.6 – 1.4 2.3 5.8 – 4.9100 workers or more ................................................ – – – – 4.2 4.5 – 3.5
500 workers or more ............................................ – – – – 5.3 5.3 – 1.7
See footnotes at end of table.
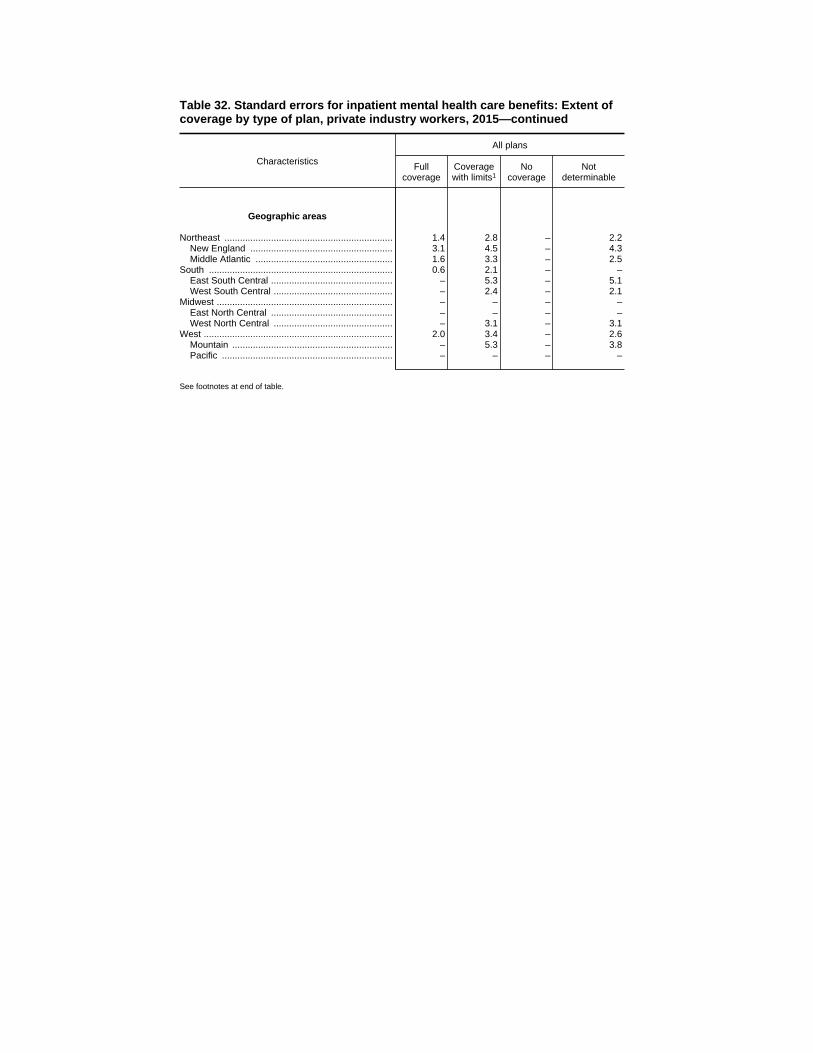
Table 32. Standard errors for inpatient mental health care benefits: Extent ofcoverage by type of plan, private industry workers, 2015—continued
Characteristics
All plans
Fullcoverage
Coveragewith limits1
Nocoverage
Notdeterminable
Geographic areas
Northeast ................................................................. 1.4 2.8 – 2.2New England ....................................................... 3.1 4.5 – 4.3Middle Atlantic ..................................................... 1.6 3.3 – 2.5
South ....................................................................... 0.6 2.1 – –East South Central ............................................... – 5.3 – 5.1West South Central .............................................. – 2.4 – 2.1
Midwest .................................................................... – – – –East North Central ............................................... – – – –West North Central .............................................. – 3.1 – 3.1
West ......................................................................... 2.0 3.4 – 2.6Mountain .............................................................. – 5.3 – 3.8Pacific .................................................................. – – – –
See footnotes at end of table.

Table 32. Standard errors for inpatient mental health care benefits: Extent of coverage by type of plan, private industryworkers, 2015—continued
Characteristics
Fee-for-service plan Health maintenance organization
Fullcoverage
Coveragewith limits1
Nocoverage
Notdeterminable
Fullcoverage
Coveragewith limits1
Nocoverage
Notdeterminable
Geographic areas
Northeast ................................................................. 1.2 2.9 – 2.5 3.9 4.9 – 3.4New England ....................................................... – – – – 4.2 5.5 – 5.9Middle Atlantic ..................................................... 1.2 3.2 – 2.9 – 6.9 – 4.2
South ....................................................................... – 2.0 – 1.9 – – – –East South Central ............................................... – 5.5 – 5.4 – 8.1 – 7.6West South Central .............................................. – 2.6 – 2.6 – – – –
Midwest .................................................................... – – – – – 7.8 – 3.5East North Central ............................................... – – – – – 8.9 – 4.2West North Central .............................................. – 3.5 – 3.4 – 10.5 – 1.4
West ......................................................................... – 2.6 – 2.3 – – – –Mountain .............................................................. – 4.5 – 3.4 – 13.5 – 8.8Pacific .................................................................. – 3.2 – 3.0 – – – –
1 Limits may be set in terms of dollar or day ceiling on benefits, a requirement that the participant pay a percentage of costs (coinsurance), or a requirement that the participant pay aspecific amount (deductible or copayment) before reimbursement begins or services are rendered.
2 Surveyed occupations are classified into wage categories based on the average wage for the occupation, which may include workers with earnings both above and below the threshold.The categories were formed using percentile estimates generated using data from the National Compensation Survey publication, "Employer Costs for Employee Compensation - March2015."
Note: Dashes indicate that no data were reported or that data do not meet publication criteria. For definitions of major plans, key provisions, and related terms, see the "Glossary of EmployeeBenefit Terms" at www.bls.gov/ncs/ebs/glossary20152016.htm.
Source: Bureau of Labor Statistics, National Compensation Survey.
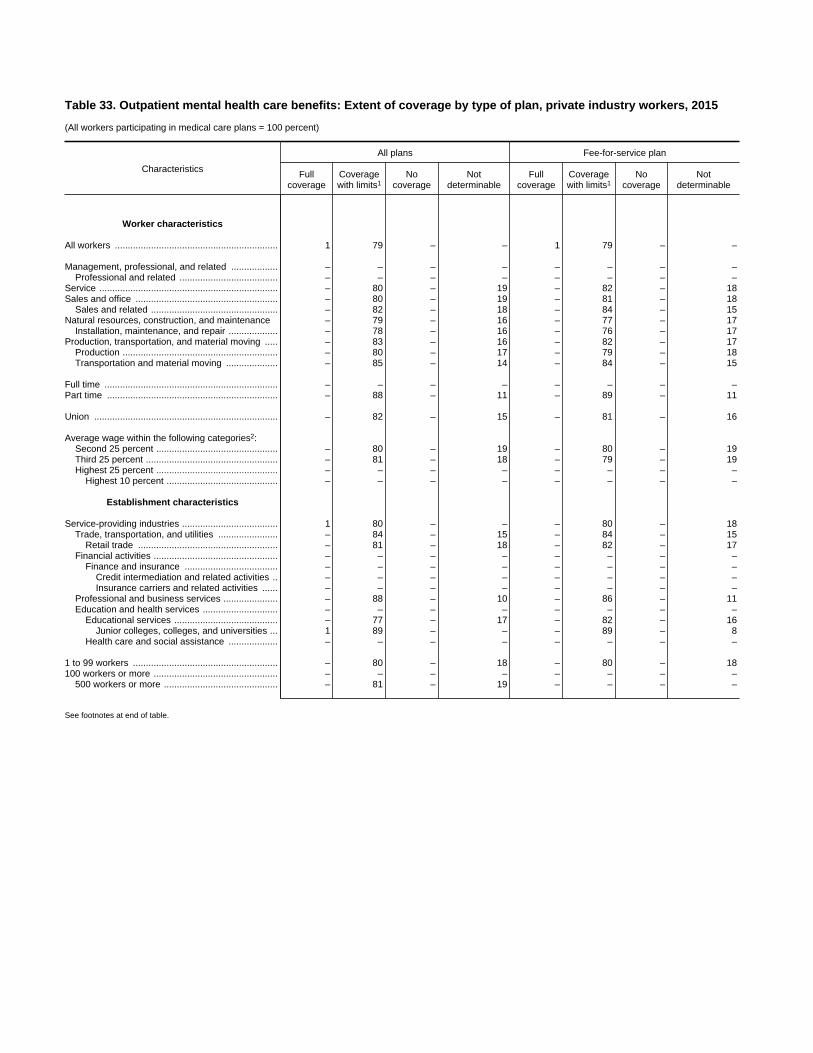
Table 33. Outpatient mental health care benefits: Extent of coverage by type of plan, private industry workers, 2015
(All workers participating in medical care plans = 100 percent)
Characteristics
All plans Fee-for-service plan
Fullcoverage
Coveragewith limits1
Nocoverage
Notdeterminable
Fullcoverage
Coveragewith limits1
Nocoverage
Notdeterminable
Worker characteristics
All workers ............................................................... 1 79 – – 1 79 – –
Management, professional, and related .................. – – – – – – – –Professional and related ...................................... – – – – – – – –
Service ..................................................................... – 80 – 19 – 82 – 18Sales and office ....................................................... – 80 – 19 – 81 – 18
Sales and related ................................................. – 82 – 18 – 84 – 15Natural resources, construction, and maintenance – 79 – 16 – 77 – 17
Installation, maintenance, and repair ................... – 78 – 16 – 76 – 17Production, transportation, and material moving ..... – 83 – 16 – 82 – 17
Production ............................................................ – 80 – 17 – 79 – 18Transportation and material moving .................... – 85 – 14 – 84 – 15
Full time ................................................................... – – – – – – – –Part time .................................................................. – 88 – 11 – 89 – 11
Union ....................................................................... – 82 – 15 – 81 – 16
Average wage within the following categories2:Second 25 percent ............................................... – 80 – 19 – 80 – 19Third 25 percent ................................................... – 81 – 18 – 79 – 19Highest 25 percent ............................................... – – – – – – – –
Highest 10 percent ........................................... – – – – – – – –
Establishment characteristics
Service-providing industries ..................................... 1 80 – – – 80 – 18Trade, transportation, and utilities ....................... – 84 – 15 – 84 – 15
Retail trade ...................................................... – 81 – 18 – 82 – 17Financial activities ................................................ – – – – – – – –
Finance and insurance .................................... – – – – – – – –Credit intermediation and related activities .. – – – – – – – –Insurance carriers and related activities ...... – – – – – – – –
Professional and business services ..................... – 88 – 10 – 86 – 11Education and health services ............................. – – – – – – – –
Educational services ........................................ – 77 – 17 – 82 – 16Junior colleges, colleges, and universities ... 1 89 – – – 89 – 8
Health care and social assistance ................... – – – – – – – –
1 to 99 workers ........................................................ – 80 – 18 – 80 – 18100 workers or more ................................................ – – – – – – – –
500 workers or more ............................................ – 81 – 19 – – – –
See footnotes at end of table.
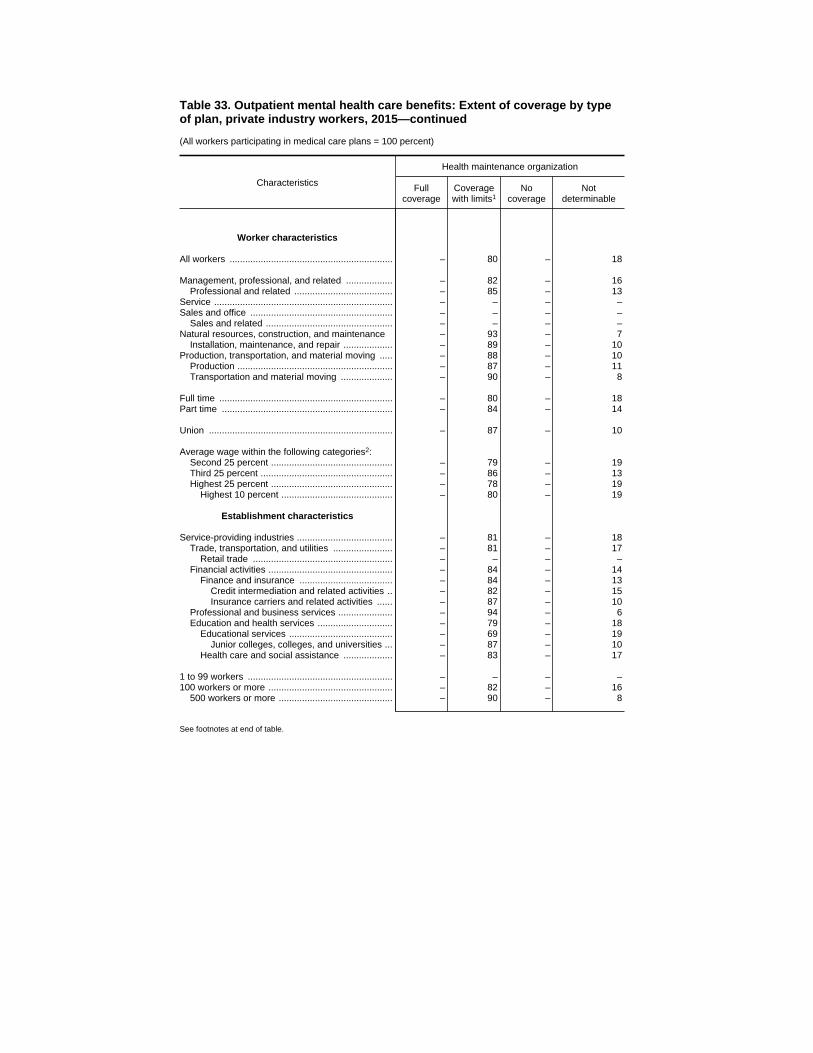
Table 33. Outpatient mental health care benefits: Extent of coverage by typeof plan, private industry workers, 2015—continued
(All workers participating in medical care plans = 100 percent)
Characteristics
Health maintenance organization
Fullcoverage
Coveragewith limits1
Nocoverage
Notdeterminable
Worker characteristics
All workers ............................................................... – 80 – 18
Management, professional, and related .................. – 82 – 16Professional and related ...................................... – 85 – 13
Service ..................................................................... – – – –Sales and office ....................................................... – – – –
Sales and related ................................................. – – – –Natural resources, construction, and maintenance – 93 – 7
Installation, maintenance, and repair ................... – 89 – 10Production, transportation, and material moving ..... – 88 – 10
Production ............................................................ – 87 – 11Transportation and material moving .................... – 90 – 8
Full time ................................................................... – 80 – 18Part time .................................................................. – 84 – 14
Union ....................................................................... – 87 – 10
Average wage within the following categories2:Second 25 percent ............................................... – 79 – 19Third 25 percent ................................................... – 86 – 13Highest 25 percent ............................................... – 78 – 19
Highest 10 percent ........................................... – 80 – 19
Establishment characteristics
Service-providing industries ..................................... – 81 – 18Trade, transportation, and utilities ....................... – 81 – 17
Retail trade ...................................................... – – – –Financial activities ................................................ – 84 – 14
Finance and insurance .................................... – 84 – 13Credit intermediation and related activities .. – 82 – 15Insurance carriers and related activities ...... – 87 – 10
Professional and business services ..................... – 94 – 6Education and health services ............................. – 79 – 18
Educational services ........................................ – 69 – 19Junior colleges, colleges, and universities ... – 87 – 10
Health care and social assistance ................... – 83 – 17
1 to 99 workers ........................................................ – – – –100 workers or more ................................................ – 82 – 16
500 workers or more ............................................ – 90 – 8
See footnotes at end of table.

Table 33. Outpatient mental health care benefits: Extent of coverage by type of plan, private industry workers,2015—continued
(All workers participating in medical care plans = 100 percent)
Characteristics
All plans Fee-for-service plan
Fullcoverage
Coveragewith limits1
Nocoverage
Notdeterminable
Fullcoverage
Coveragewith limits1
Nocoverage
Notdeterminable
Geographic areas
Northeast ................................................................. – 81 – 18 – 79 – 19New England ....................................................... – – – – – – – –Middle Atlantic ..................................................... – 82 – 17 – 81 – 18
South ....................................................................... – – – – – 79 – 19East South Central ............................................... – 84 – 16 – 84 – 16West South Central .............................................. – 82 – 16 – 82 – 16
Midwest .................................................................... – – – – – – – –East North Central ............................................... – – – – – – – –West North Central .............................................. – 82 – 18 – 81 – 18
West ......................................................................... – 79 – 19 – 80 – 18Mountain .............................................................. – 83 – 16 – 82 – 17Pacific .................................................................. – – – – – 79 – 19
See footnotes at end of table.

Table 33. Outpatient mental health care benefits: Extent of coverage by typeof plan, private industry workers, 2015—continued
(All workers participating in medical care plans = 100 percent)
Characteristics
Health maintenance organization
Fullcoverage
Coveragewith limits1
Nocoverage
Notdeterminable
Geographic areas
Northeast ................................................................. – 85 – 14New England ....................................................... – 83 – 16Middle Atlantic ..................................................... – 86 – 13
South ....................................................................... – – – –East South Central ............................................... – 86 – 11West South Central .............................................. – – – –
Midwest .................................................................... – 91 – 9East North Central ............................................... – 90 – 10West North Central .............................................. – 98 – 2
West ......................................................................... – – – –Mountain .............................................................. – 90 – 10Pacific .................................................................. – – – –
1 Limits may be set in terms of dollar or day ceiling on benefits, a requirement that the participant pay a percentage ofcosts (coinsurance), or a requirement that the participant pay a specific amount (deductible or copayment) beforereimbursement begins or services are rendered.
2 Surveyed occupations are classified into wage categories based on the average wage for the occupation, which mayinclude workers with earnings both above and below the threshold. The categories were formed using percentile estimatesgenerated using data from the National Compensation Survey publication, "Employer Costs for Employee Compensation -March 2015."
Note: Because of rounding, sums of individual items may not equal totals. Dashes indicate that no data were reported or thatdata do not meet publication criteria. For definitions of major plans, key provisions, and related terms, see the "Glossary ofEmployee Benefit Terms" at www.bls.gov/ncs/ebs/glossary20152016.htm.
Source: Bureau of Labor Statistics, National Compensation Survey.

Table 33. Standard errors for outpatient mental health care benefits: Extent of coverage by type of plan, privateindustry workers, 2015
Characteristics
All plans Fee-for-service plan
Fullcoverage
Coveragewith limits1
Nocoverage
Notdeterminable
Fullcoverage
Coveragewith limits1
Nocoverage
Notdeterminable
Worker characteristics
All workers ............................................................... 0.3 1.1 – – 0.3 1.3 – –
Management, professional, and related .................. – – – – – – – –Professional and related ...................................... – – – – – – – –
Service ..................................................................... – 3.4 – 3.3 – 2.9 – 2.9Sales and office ....................................................... – 1.5 – 1.6 – 1.6 – 1.7
Sales and related ................................................. – 2.2 – 2.2 – 2.2 – 2.2Natural resources, construction, and maintenance – 2.3 – 1.9 – 2.5 – 2.1
Installation, maintenance, and repair ................... – 3.7 – 2.9 – 3.9 – 3.3Production, transportation, and material moving ..... – 2.3 – 2.2 – 2.7 – 2.5
Production ............................................................ – 3.1 – 2.9 – 3.6 – 3.3Transportation and material moving .................... – 2.8 – 2.8 – 3.5 – 3.5
Full time ................................................................... – – – – – – – –Part time .................................................................. – 2.2 – 2.2 – 1.9 – 1.8
Union ....................................................................... – 3.8 – 3.9 – 4.4 – 4.4
Average wage within the following categories2:Second 25 percent ............................................... – 1.8 – 1.8 – 1.8 – 1.8Third 25 percent ................................................... – 1.5 – 1.4 – 1.7 – 1.5Highest 25 percent ............................................... – – – – – – – –
Highest 10 percent ........................................... – – – – – – – –
Establishment characteristics
Service-providing industries ..................................... 0.3 1.3 – – – 1.4 – 1.4Trade, transportation, and utilities ....................... – 1.5 – 1.2 – 1.6 – 1.3
Retail trade ...................................................... – 1.5 – 1.5 – 2.0 – 2.0Financial activities ................................................ – – – – – – – –
Finance and insurance .................................... – – – – – – – –Credit intermediation and related activities .. – – – – – – – –Insurance carriers and related activities ...... – – – – – – – –
Professional and business services ..................... – 3.3 – 3.1 – 3.5 – 3.2Education and health services ............................. – – – – – – – –
Educational services ........................................ – 4.8 – 4.3 – 3.5 – 3.7Junior colleges, colleges, and universities ... 0.4 2.5 – – – 3.0 – 3.1
Health care and social assistance ................... – – – – – – – –
1 to 99 workers ........................................................ – 1.5 – 1.5 – 1.5 – 1.4100 workers or more ................................................ – – – – – – – –
500 workers or more ............................................ – 1.9 – 1.9 – – – –
See footnotes at end of table.

Table 33. Standard errors for outpatient mental health care benefits: Extent ofcoverage by type of plan, private industry workers, 2015—continued
Characteristics
Health maintenance organization
Fullcoverage
Coveragewith limits1
Nocoverage
Notdeterminable
Worker characteristics
All workers ............................................................... – 2.9 – 2.8
Management, professional, and related .................. – 3.9 – 3.8Professional and related ...................................... – 3.8 – 3.3
Service ..................................................................... – – – –Sales and office ....................................................... – – – –
Sales and related ................................................. – – – –Natural resources, construction, and maintenance – 3.1 – 3.1
Installation, maintenance, and repair ................... – 5.7 – 5.6Production, transportation, and material moving ..... – 3.8 – 3.3
Production ............................................................ – 4.6 – 4.2Transportation and material moving .................... – 5.0 – 3.7
Full time ................................................................... – 2.8 – 2.8Part time .................................................................. – 12.5 – 12.3
Union ....................................................................... – 3.6 – 3.5
Average wage within the following categories2:Second 25 percent ............................................... – 5.9 – 5.7Third 25 percent ................................................... – 2.7 – 2.7Highest 25 percent ............................................... – 4.7 – 4.7
Highest 10 percent ........................................... – 4.2 – 4.4
Establishment characteristics
Service-providing industries ..................................... – 2.9 – 2.8Trade, transportation, and utilities ....................... – 4.5 – 4.0
Retail trade ...................................................... – – – –Financial activities ................................................ – 4.6 – 4.4
Finance and insurance .................................... – 4.6 – 4.5Credit intermediation and related activities .. – 7.0 – 6.6Insurance carriers and related activities ...... – 5.6 – 5.0
Professional and business services ..................... – 3.6 – 3.6Education and health services ............................. – 4.7 – 4.3
Educational services ........................................ – 9.6 – 7.4Junior colleges, colleges, and universities ... – 3.5 – 3.7
Health care and social assistance ................... – 5.2 – 5.2
1 to 99 workers ........................................................ – – – –100 workers or more ................................................ – 3.6 – 3.5
500 workers or more ............................................ – 2.0 – 1.8
See footnotes at end of table.
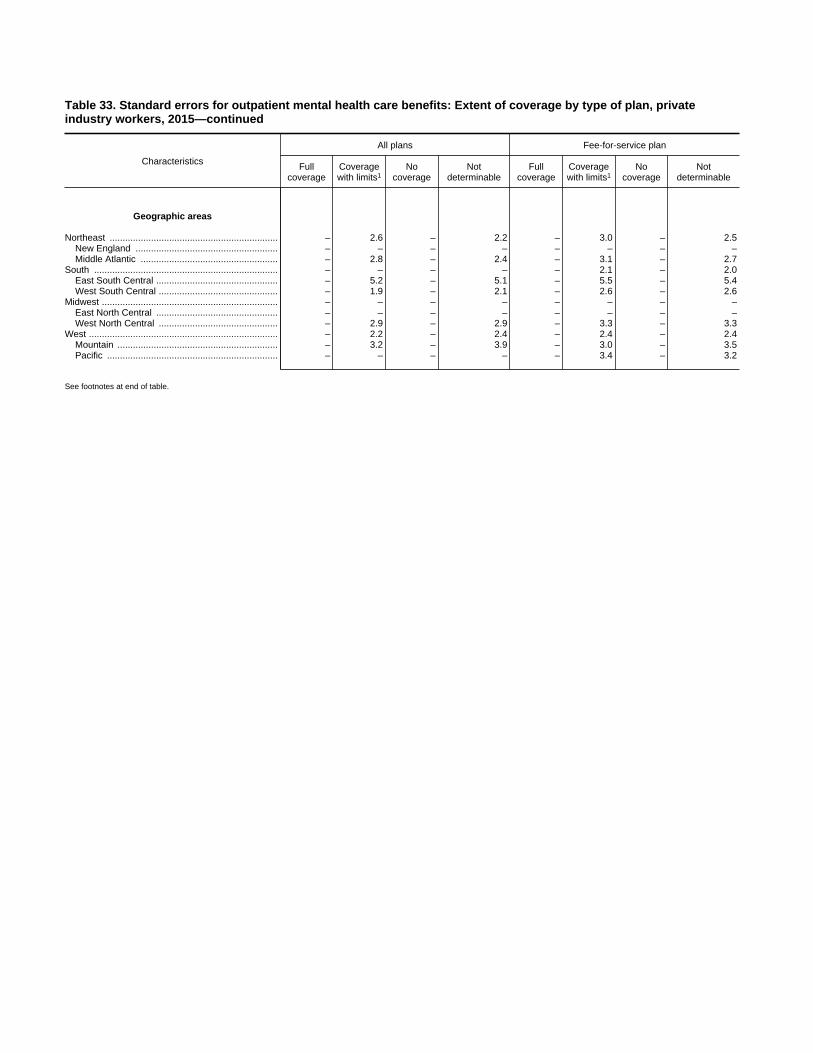
Table 33. Standard errors for outpatient mental health care benefits: Extent of coverage by type of plan, privateindustry workers, 2015—continued
Characteristics
All plans Fee-for-service plan
Fullcoverage
Coveragewith limits1
Nocoverage
Notdeterminable
Fullcoverage
Coveragewith limits1
Nocoverage
Notdeterminable
Geographic areas
Northeast ................................................................. – 2.6 – 2.2 – 3.0 – 2.5New England ....................................................... – – – – – – – –Middle Atlantic ..................................................... – 2.8 – 2.4 – 3.1 – 2.7
South ....................................................................... – – – – – 2.1 – 2.0East South Central ............................................... – 5.2 – 5.1 – 5.5 – 5.4West South Central .............................................. – 1.9 – 2.1 – 2.6 – 2.6
Midwest .................................................................... – – – – – – – –East North Central ............................................... – – – – – – – –West North Central .............................................. – 2.9 – 2.9 – 3.3 – 3.3
West ......................................................................... – 2.2 – 2.4 – 2.4 – 2.4Mountain .............................................................. – 3.2 – 3.9 – 3.0 – 3.5Pacific .................................................................. – – – – – 3.4 – 3.2
See footnotes at end of table.
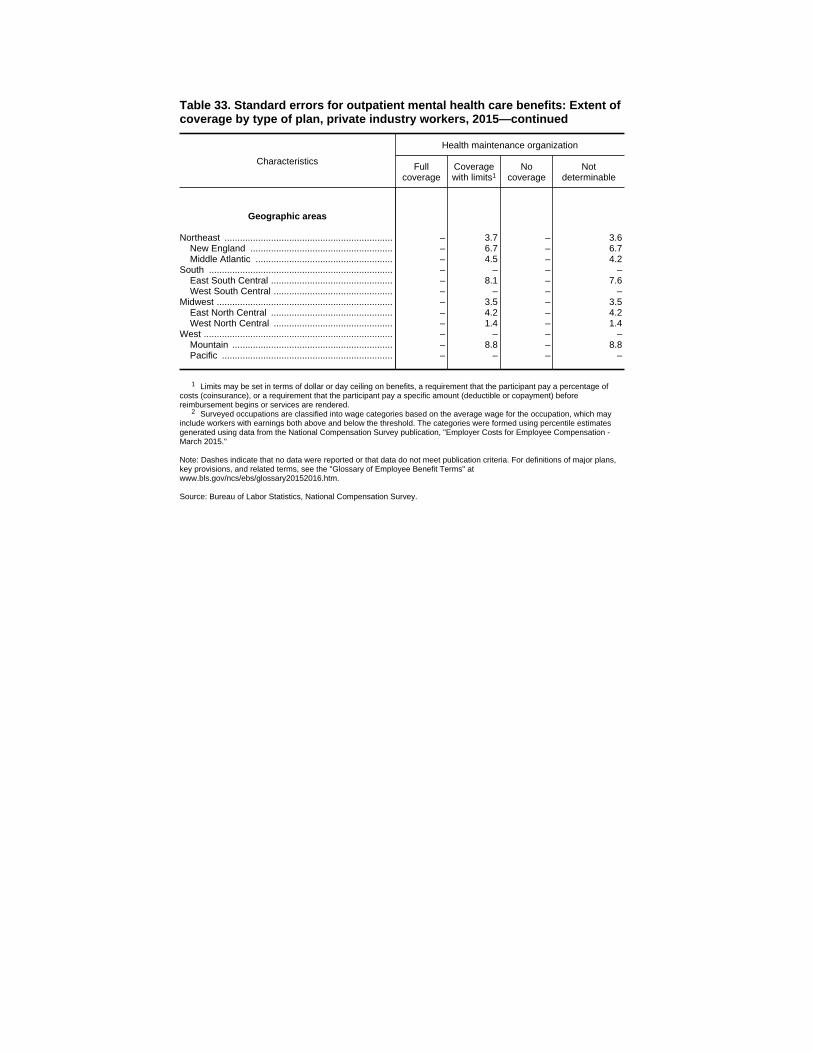
Table 33. Standard errors for outpatient mental health care benefits: Extent ofcoverage by type of plan, private industry workers, 2015—continued
Characteristics
Health maintenance organization
Fullcoverage
Coveragewith limits1
Nocoverage
Notdeterminable
Geographic areas
Northeast ................................................................. – 3.7 – 3.6New England ....................................................... – 6.7 – 6.7Middle Atlantic ..................................................... – 4.5 – 4.2
South ....................................................................... – – – –East South Central ............................................... – 8.1 – 7.6West South Central .............................................. – – – –
Midwest .................................................................... – 3.5 – 3.5East North Central ............................................... – 4.2 – 4.2West North Central .............................................. – 1.4 – 1.4
West ......................................................................... – – – –Mountain .............................................................. – 8.8 – 8.8Pacific .................................................................. – – – –
1 Limits may be set in terms of dollar or day ceiling on benefits, a requirement that the participant pay a percentage ofcosts (coinsurance), or a requirement that the participant pay a specific amount (deductible or copayment) beforereimbursement begins or services are rendered.
2 Surveyed occupations are classified into wage categories based on the average wage for the occupation, which mayinclude workers with earnings both above and below the threshold. The categories were formed using percentile estimatesgenerated using data from the National Compensation Survey publication, "Employer Costs for Employee Compensation -March 2015."
Note: Dashes indicate that no data were reported or that data do not meet publication criteria. For definitions of major plans,key provisions, and related terms, see the "Glossary of Employee Benefit Terms" atwww.bls.gov/ncs/ebs/glossary20152016.htm.
Source: Bureau of Labor Statistics, National Compensation Survey.
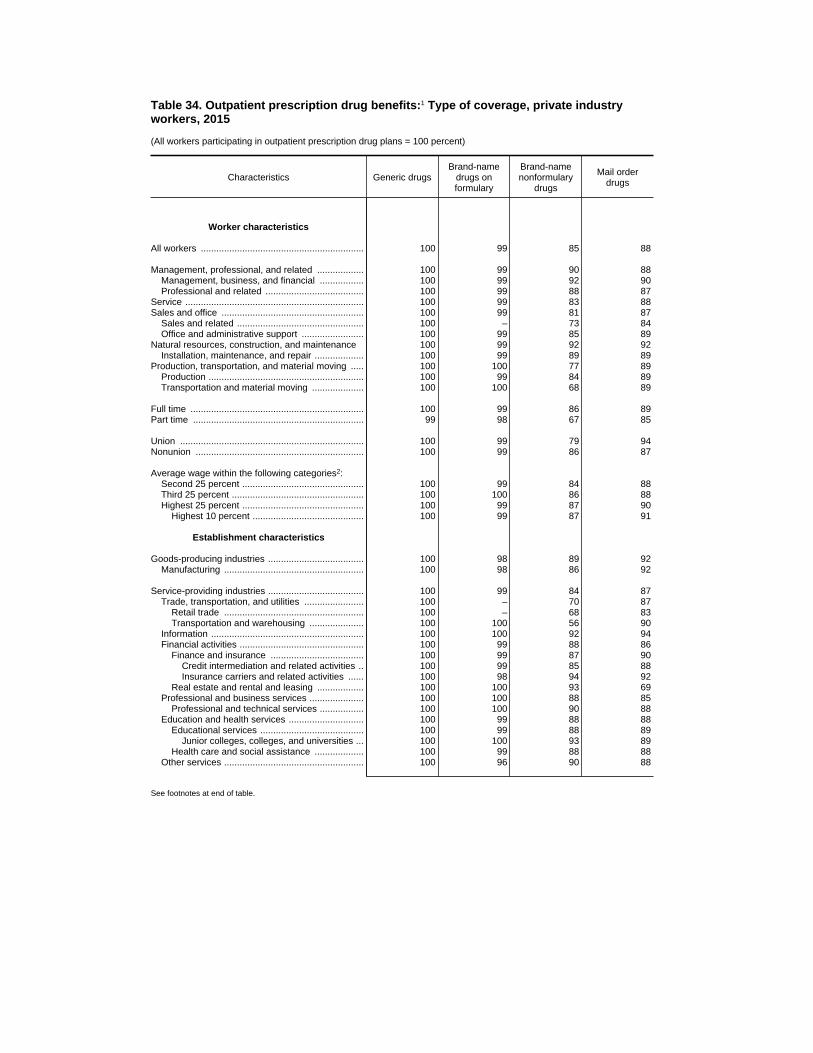
Table 34. Outpatient prescription drug benefits:1 Type of coverage, private industryworkers, 2015
(All workers participating in outpatient prescription drug plans = 100 percent)
Characteristics Generic drugsBrand-name
drugs onformulary
Brand-namenonformulary
drugs
Mail orderdrugs
Worker characteristics
All workers ............................................................... 100 99 85 88
Management, professional, and related .................. 100 99 90 88Management, business, and financial ................. 100 99 92 90Professional and related ...................................... 100 99 88 87
Service ..................................................................... 100 99 83 88Sales and office ....................................................... 100 99 81 87
Sales and related ................................................. 100 – 73 84Office and administrative support ........................ 100 99 85 89
Natural resources, construction, and maintenance 100 99 92 92Installation, maintenance, and repair ................... 100 99 89 89
Production, transportation, and material moving ..... 100 100 77 89Production ............................................................ 100 99 84 89Transportation and material moving .................... 100 100 68 89
Full time ................................................................... 100 99 86 89Part time .................................................................. 99 98 67 85
Union ....................................................................... 100 99 79 94Nonunion ................................................................. 100 99 86 87
Average wage within the following categories2:Second 25 percent ............................................... 100 99 84 88Third 25 percent ................................................... 100 100 86 88Highest 25 percent ............................................... 100 99 87 90
Highest 10 percent ........................................... 100 99 87 91
Establishment characteristics
Goods-producing industries ..................................... 100 98 89 92Manufacturing ...................................................... 100 98 86 92
Service-providing industries ..................................... 100 99 84 87Trade, transportation, and utilities ....................... 100 – 70 87
Retail trade ...................................................... 100 – 68 83Transportation and warehousing ..................... 100 100 56 90
Information ........................................................... 100 100 92 94Financial activities ................................................ 100 99 88 86
Finance and insurance .................................... 100 99 87 90Credit intermediation and related activities .. 100 99 85 88Insurance carriers and related activities ...... 100 98 94 92
Real estate and rental and leasing .................. 100 100 93 69Professional and business services ..................... 100 100 88 85
Professional and technical services ................. 100 100 90 88Education and health services ............................. 100 99 88 88
Educational services ........................................ 100 99 88 89Junior colleges, colleges, and universities ... 100 100 93 89
Health care and social assistance ................... 100 99 88 88Other services ...................................................... 100 96 90 88
See footnotes at end of table.

Table 34. Outpatient prescription drug benefits:1 Type of coverage, private industryworkers, 2015—continued
(All workers participating in outpatient prescription drug plans = 100 percent)
Characteristics Generic drugsBrand-name
drugs onformulary
Brand-namenonformulary
drugs
Mail orderdrugs
1 to 99 workers:50 to 99 workers ................................................ 99 97 86 90
100 workers or more ................................................ 100 99 81 91100 to 499 workers .............................................. 100 – 81 91500 workers or more ............................................ 100 99 81 91
Geographic areas
Northeast ................................................................. 100 99 86 89New England ....................................................... 100 99 88 83Middle Atlantic ..................................................... 100 99 86 91
South ....................................................................... 100 99 86 88South Atlantic ....................................................... 100 99 86 89West South Central .............................................. 100 100 88 87
Midwest .................................................................... 100 – 85 86East North Central ............................................... 100 99 86 88West North Central .............................................. 100 99 83 83
West ......................................................................... 100 99 81 91Mountain .............................................................. 100 100 87 90Pacific .................................................................. 100 99 78 91
1 Outpatient prescription drug benefits include both stand-alone drug plans and prescription drug benefits included as part of a medicalplan.
2 Surveyed occupations are classified into wage categories based on the average wage for the occupation, which may include workerswith earnings both above and below the threshold. The categories were formed using percentile estimates generated using data from theNational Compensation Survey publication, "Employer Costs for Employee Compensation - March 2015."
Note: For definitions of major plans, key provisions, and related terms, see the "Glossary of Employee Benefit Terms" atwww.bls.gov/ncs/ebs/glossary20152016.htm.
Source: Bureau of Labor Statistics, National Compensation Survey.

Table 34. Standard errors for outpatient prescription drug benefits:1 Type of coverage,private industry workers, 2015
Characteristics Generic drugsBrand-name
drugs onformulary
Brand-namenonformulary
drugs
Mail orderdrugs
Worker characteristics
All workers ............................................................... 2( ) 0.2 0.9 0.7
Management, professional, and related .................. 2( ) 0.4 1.3 1.2Management, business, and financial ................. 2( ) 0.4 1.1 1.5Professional and related ...................................... 0.1 0.5 2.1 1.7
Service ..................................................................... 0.2 0.3 3.3 3.3Sales and office ....................................................... 2( ) 0.4 1.2 1.4
Sales and related ................................................. 2( ) – 2.0 3.1Office and administrative support ........................ 2( ) 0.3 1.3 1.4
Natural resources, construction, and maintenance 2( ) 0.3 1.4 1.8Installation, maintenance, and repair ................... 2( ) 0.6 2.1 3.0
Production, transportation, and material moving ..... 2( ) 0.2 3.0 2.0Production ............................................................ 2( ) 0.4 3.0 2.8Transportation and material moving .................... 2( ) 0.2 5.1 2.0
Full time ................................................................... 2( ) 0.2 0.9 0.7Part time .................................................................. 0.4 1.0 3.7 3.8
Union ....................................................................... 2( ) 0.6 3.3 1.7Nonunion ................................................................. 2( ) 0.2 1.0 0.8
Average wage within the following categories3:Second 25 percent ............................................... 2( ) 0.3 2.0 1.2Third 25 percent ................................................... 2( ) 0.2 1.3 1.2Highest 25 percent ............................................... 2( ) 0.4 1.5 1.1
Highest 10 percent ........................................... 2( ) 0.4 1.9 1.1
Establishment characteristics
Goods-producing industries ..................................... 2( ) 0.6 1.8 1.3Manufacturing ...................................................... 2( ) 0.8 2.5 1.8
Service-providing industries ..................................... 2( ) 0.2 1.1 0.8Trade, transportation, and utilities ....................... 2( ) – 2.6 1.4
Retail trade ...................................................... 2( ) – 2.3 2.2Transportation and warehousing ..................... 2( ) 2( ) 7.2 5.1
Information ........................................................... 2( ) 2( ) 3.3 2.7Financial activities ................................................ 0.1 0.4 1.2 1.9
Finance and insurance .................................... 0.1 0.5 1.3 1.1Credit intermediation and related activities .. 0.2 0.1 2.2 1.3Insurance carriers and related activities ...... 2( ) 1.3 1.9 2.2
Real estate and rental and leasing .................. 2( ) 2( ) 4.9 9.3Professional and business services ..................... 2( ) 2( ) 2.9 2.3
Professional and technical services ................. 2( ) 2( ) 3.2 2.7Education and health services ............................. 2( ) 0.3 1.9 1.9
Educational services ........................................ 2( ) 1.2 3.3 2.0Junior colleges, colleges, and universities ... 2( ) 2( ) 2.1 3.4
Health care and social assistance ................... 2( ) 0.3 2.1 2.2Other services ...................................................... 2( ) 4.4 5.1 6.5
See footnotes at end of table.

Table 34. Standard errors for outpatient prescription drug benefits:1 Type of coverage,private industry workers, 2015—continued
Characteristics Generic drugsBrand-name
drugs onformulary
Brand-namenonformulary
drugs
Mail orderdrugs
1 to 99 workers:50 to 99 workers ................................................ 0.2 1.0 2.7 2.0
100 workers or more ................................................ 2( ) 0.3 1.4 1.0100 to 499 workers .............................................. 2( ) – 1.7 1.3500 workers or more ............................................ 2( ) 0.4 2.5 1.6
Geographic areas
Northeast ................................................................. 2( ) 0.7 2.0 1.9New England ....................................................... 2( ) 0.9 3.8 2.9Middle Atlantic ..................................................... 2( ) 0.9 2.3 2.4
South ....................................................................... 2( ) 0.3 1.8 0.9South Atlantic ....................................................... 2( ) 0.5 2.2 1.2West South Central .............................................. 2( ) 0.2 3.8 1.6
Midwest .................................................................... 0.1 – 1.9 1.5East North Central ............................................... 0.1 0.6 2.4 1.8West North Central .............................................. 0.3 0.6 2.8 2.9
West ......................................................................... 2( ) 0.5 1.6 1.7Mountain .............................................................. 2( ) 2( ) 1.9 4.3Pacific .................................................................. 0.1 0.7 2.1 1.4
1 Outpatient prescription drug benefits include both stand-alone drug plans and prescription drug benefits included as part of a medicalplan.
2 Less than 0.05.3 Surveyed occupations are classified into wage categories based on the average wage for the occupation, which may include workers
with earnings both above and below the threshold. The categories were formed using percentile estimates generated using data from theNational Compensation Survey publication, "Employer Costs for Employee Compensation - March 2015."
Note: For definitions of major plans, key provisions, and related terms, see the "Glossary of Employee Benefit Terms" atwww.bls.gov/ncs/ebs/glossary20152016.htm.
Source: Bureau of Labor Statistics, National Compensation Survey.

Table 35. Outpatient prescription drug benefits:1 Copayment provisions, private industry workers, 2015
(All workers participating in selected outpatient prescription drug plans = 100 percent)
Characteristics
Generic drugs2 Brand-name drugs on formulary3
Copayment Nocopayment
Notdeterminable
Mediancopayment
perprescription
Copayment Nocopayment
Notdeterminable
Mediancopayment
perprescription
Worker characteristics
All workers ............................................................... 80 19 1 $10 78 22 1 $30
Management, professional, and related .................. 79 20 1 10 75 25 5( ) 30Management, business, and financial ................. 78 21 1 10 76 24 5( ) 30Professional and related ...................................... 80 20 1 10 75 25 5( ) 30
Service ..................................................................... 83 16 1 10 82 18 1 30Sales and office ....................................................... 83 16 2 10 80 18 1 35
Sales and related ................................................. 84 15 1 10 81 18 1 30Office and administrative support ........................ 83 16 2 10 80 18 1 35
Natural resources, construction, and maintenance 83 16 1 10 83 16 1 30Installation, maintenance, and repair ................... 82 16 1 10 82 17 1 35
Production, transportation, and material moving ..... 76 24 5( ) 10 73 27 5( ) 30Production ............................................................ 80 19 1 10 76 23 1 30Transportation and material moving .................... 71 29 – 10 69 31 5( ) 30
Full time ................................................................... 80 19 1 10 77 22 1 30Part time .................................................................. 88 10 1 7 82 17 1 30
Union ....................................................................... 76 23 1 10 74 25 1 25Nonunion ................................................................. 81 18 1 10 78 21 1 30
Average wage within the following categories6:Second 25 percent ............................................... 83 16 1 10 82 18 1 35Third 25 percent ................................................... 79 20 1 10 77 23 5( ) 30Highest 25 percent ............................................... 78 21 1 10 74 25 1 30
Highest 10 percent ........................................... 79 21 1 10 75 24 5( ) 30
Establishment characteristics
Goods-producing industries ..................................... 80 20 5( ) 10 76 23 5( ) 30Manufacturing ...................................................... 78 22 5( ) 10 73 26 5( ) 30
Service-providing industries ..................................... 80 18 1 10 78 21 1 30Trade, transportation, and utilities ....................... 77 22 1 10 73 26 1 30
Retail trade ...................................................... 84 15 1 7 80 19 1 30Transportation and warehousing ..................... 65 31 3 – 64 33 3 30
Information ........................................................... 71 29 – 10 69 31 – 30Financial activities ................................................ 76 22 2 10 75 24 1 30
Finance and insurance .................................... 74 23 2 10 72 27 1 30Credit intermediation and related activities .. 81 18 1 10 79 20 1 30Insurance carriers and related activities ...... 66 31 3 10 63 35 2 30
Real estate and rental and leasing .................. 83 17 – 10 88 12 – 35Professional and business services ..................... 81 19 – 10 76 24 – 35
Professional and technical services ................. 82 18 – 10 80 20 – 35Education and health services ............................. 89 10 1 10 83 16 1 30
Educational services ........................................ 93 4 3 10 94 4 2 30Junior colleges, colleges, and universities ... 89 8 3 10 90 7 3 30
Health care and social assistance ................... 88 11 1 10 81 18 1 30Other services ...................................................... 82 – – 10 86 – – 30
See footnotes at end of table.

Table 35. Outpatient prescription drug benefits:1 Copayment provisions, privateindustry workers, 2015—continued
(All workers participating in selected outpatient prescription drug plans = 100 percent)
Characteristics
Brand-name drugs not on formulary4
Copayment Nocopayment
Notdeterminable
Mediancopayment
perprescription
Worker characteristics
All workers ............................................................... 75 25 5( ) $55
Management, professional, and related .................. 72 28 5( ) 55Management, business, and financial ................. 72 28 5( ) 50Professional and related ...................................... 71 28 5( ) 55
Service ..................................................................... 78 21 1 50Sales and office ....................................................... 78 21 1 60
Sales and related ................................................. 76 23 1 50Office and administrative support ........................ 78 21 1 60
Natural resources, construction, and maintenance 81 19 5( ) 55Installation, maintenance, and repair ................... 79 20 1 60
Production, transportation, and material moving ..... 70 30 5( ) 55Production ............................................................ 73 26 5( ) 55Transportation and material moving .................... 66 34 – 60
Full time ................................................................... 74 25 5( ) 55Part time .................................................................. 80 19 1 –
Union ....................................................................... 73 27 1 50Nonunion ................................................................. 75 25 5( ) 55
Average wage within the following categories6:Second 25 percent ............................................... 79 21 5( ) 60Third 25 percent ................................................... 77 23 5( ) 55Highest 25 percent ............................................... 70 29 1 50
Highest 10 percent ........................................... 75 25 5( ) 50
Establishment characteristics
Goods-producing industries ..................................... 72 27 5( ) 50Manufacturing ...................................................... 68 32 5( ) 50
Service-providing industries ..................................... 75 24 1 55Trade, transportation, and utilities ....................... 70 30 1 50
Retail trade ...................................................... 74 25 1 50Transportation and warehousing ..................... 55 43 1 50
Information ........................................................... 66 34 – 60Financial activities ................................................ 76 23 1 60
Finance and insurance .................................... 74 25 1 55Credit intermediation and related activities .. 81 18 5( ) 55Insurance carriers and related activities ...... 66 32 2 60
Real estate and rental and leasing .................. 85 – – 60Professional and business services ..................... 75 25 – 60
Professional and technical services ................. 79 21 – 60Education and health services ............................. 76 23 1 –
Educational services ........................................ 90 8 1 50Junior colleges, colleges, and universities ... 89 9 3 50
Health care and social assistance ................... 73 26 1 55Other services ...................................................... 86 – – 50
See footnotes at end of table.
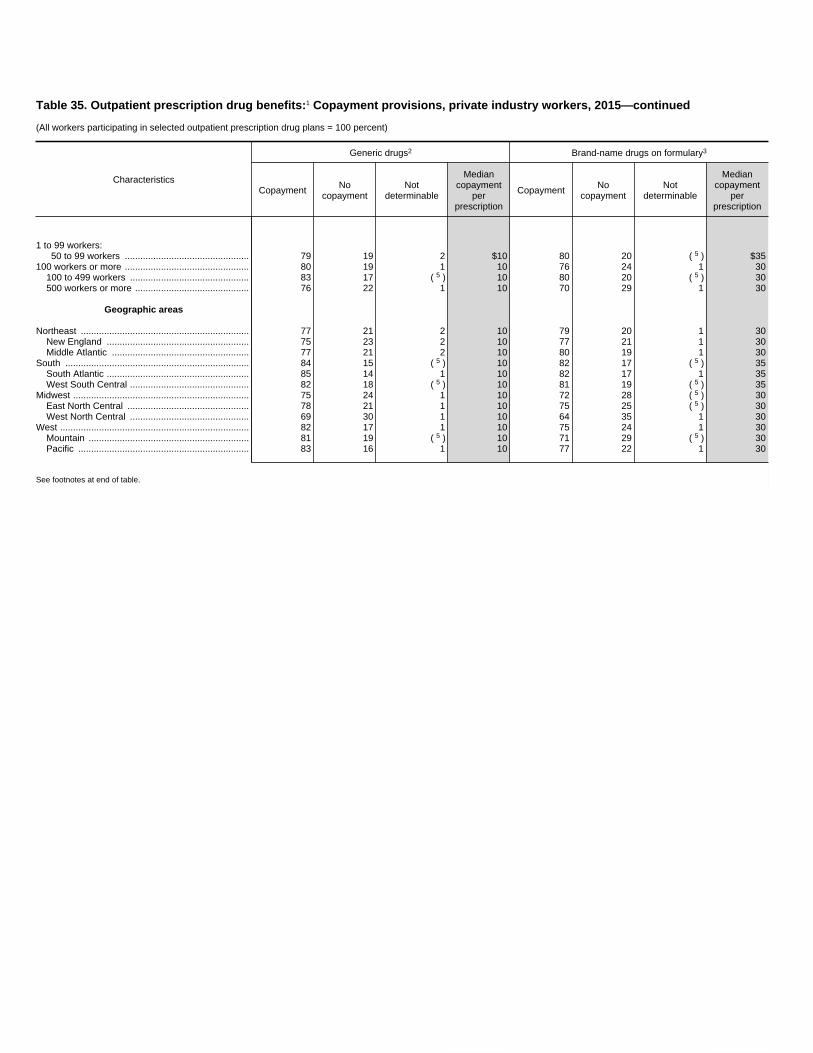
Table 35. Outpatient prescription drug benefits:1 Copayment provisions, private industry workers, 2015—continued
(All workers participating in selected outpatient prescription drug plans = 100 percent)
Characteristics
Generic drugs2 Brand-name drugs on formulary3
Copayment Nocopayment
Notdeterminable
Mediancopayment
perprescription
Copayment Nocopayment
Notdeterminable
Mediancopayment
perprescription
1 to 99 workers:50 to 99 workers ................................................ 79 19 2 $10 80 20 5( ) $35
100 workers or more ................................................ 80 19 1 10 76 24 1 30100 to 499 workers .............................................. 83 17 5( ) 10 80 20 5( ) 30500 workers or more ............................................ 76 22 1 10 70 29 1 30
Geographic areas
Northeast ................................................................. 77 21 2 10 79 20 1 30New England ....................................................... 75 23 2 10 77 21 1 30Middle Atlantic ..................................................... 77 21 2 10 80 19 1 30
South ....................................................................... 84 15 5( ) 10 82 17 5( ) 35South Atlantic ....................................................... 85 14 1 10 82 17 1 35West South Central .............................................. 82 18 5( ) 10 81 19 5( ) 35
Midwest .................................................................... 75 24 1 10 72 28 5( ) 30East North Central ............................................... 78 21 1 10 75 25 5( ) 30West North Central .............................................. 69 30 1 10 64 35 1 30
West ......................................................................... 82 17 1 10 75 24 1 30Mountain .............................................................. 81 19 5( ) 10 71 29 5( ) 30Pacific .................................................................. 83 16 1 10 77 22 1 30
See footnotes at end of table.
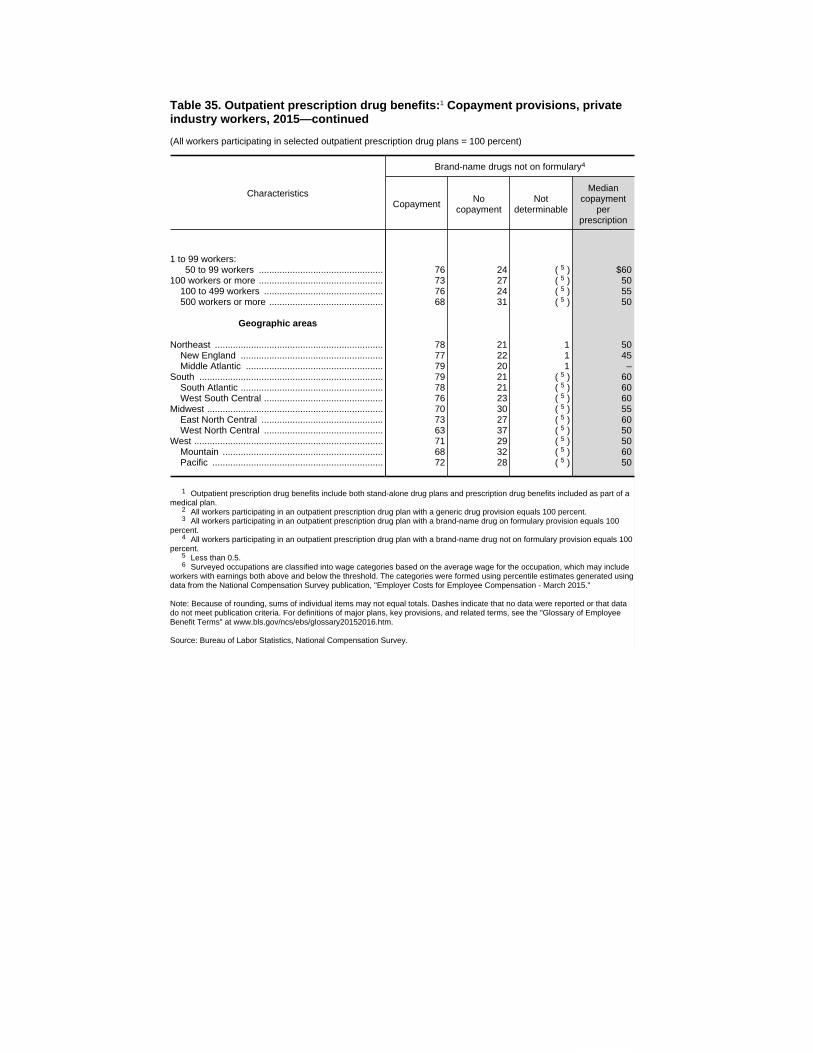
Table 35. Outpatient prescription drug benefits:1 Copayment provisions, privateindustry workers, 2015—continued
(All workers participating in selected outpatient prescription drug plans = 100 percent)
Characteristics
Brand-name drugs not on formulary4
Copayment Nocopayment
Notdeterminable
Mediancopayment
perprescription
1 to 99 workers:50 to 99 workers ................................................ 76 24 5( ) $60
100 workers or more ................................................ 73 27 5( ) 50100 to 499 workers .............................................. 76 24 5( ) 55500 workers or more ............................................ 68 31 5( ) 50
Geographic areas
Northeast ................................................................. 78 21 1 50New England ....................................................... 77 22 1 45Middle Atlantic ..................................................... 79 20 1 –
South ....................................................................... 79 21 5( ) 60South Atlantic ....................................................... 78 21 5( ) 60West South Central .............................................. 76 23 5( ) 60
Midwest .................................................................... 70 30 5( ) 55East North Central ............................................... 73 27 5( ) 60West North Central .............................................. 63 37 5( ) 50
West ......................................................................... 71 29 5( ) 50Mountain .............................................................. 68 32 5( ) 60Pacific .................................................................. 72 28 5( ) 50
1 Outpatient prescription drug benefits include both stand-alone drug plans and prescription drug benefits included as part of amedical plan.
2 All workers participating in an outpatient prescription drug plan with a generic drug provision equals 100 percent.3 All workers participating in an outpatient prescription drug plan with a brand-name drug on formulary provision equals 100
percent.4 All workers participating in an outpatient prescription drug plan with a brand-name drug not on formulary provision equals 100
percent.5 Less than 0.5.6 Surveyed occupations are classified into wage categories based on the average wage for the occupation, which may include
workers with earnings both above and below the threshold. The categories were formed using percentile estimates generated usingdata from the National Compensation Survey publication, "Employer Costs for Employee Compensation - March 2015."
Note: Because of rounding, sums of individual items may not equal totals. Dashes indicate that no data were reported or that datado not meet publication criteria. For definitions of major plans, key provisions, and related terms, see the "Glossary of EmployeeBenefit Terms" at www.bls.gov/ncs/ebs/glossary20152016.htm.
Source: Bureau of Labor Statistics, National Compensation Survey.
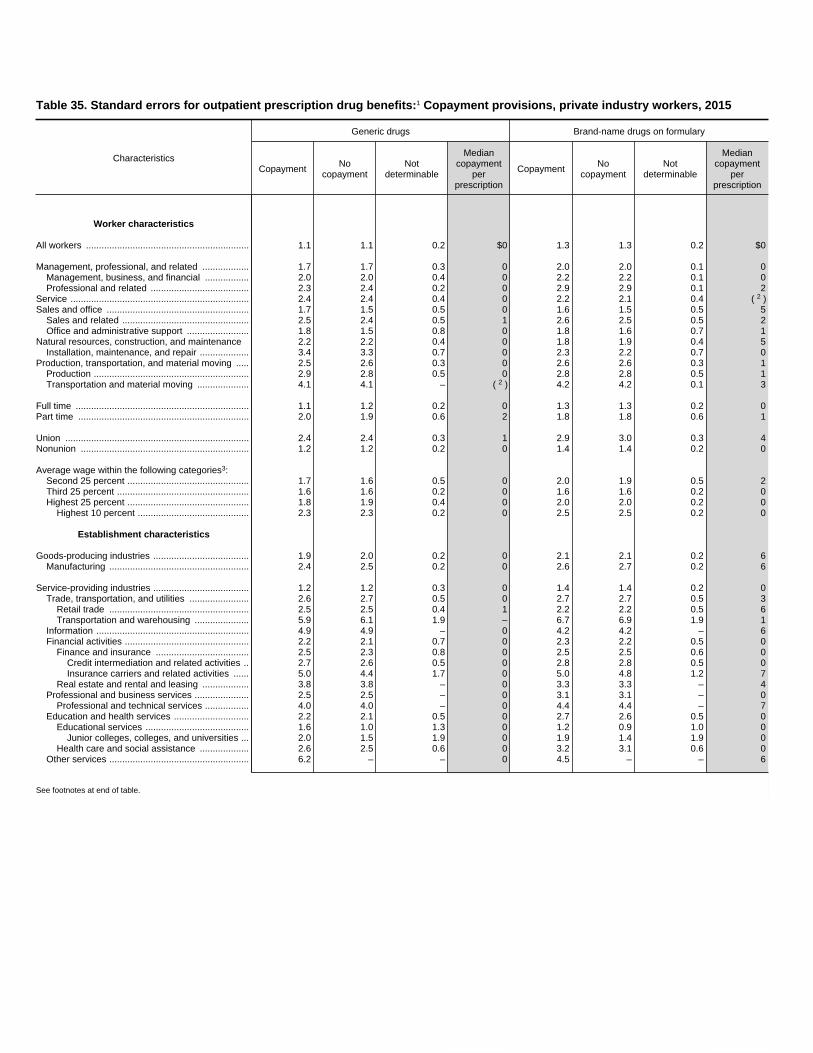
Table 35. Standard errors for outpatient prescription drug benefits:1 Copayment provisions, private industry workers, 2015
Characteristics
Generic drugs Brand-name drugs on formulary
Copayment Nocopayment
Notdeterminable
Mediancopayment
perprescription
Copayment Nocopayment
Notdeterminable
Mediancopayment
perprescription
Worker characteristics
All workers ............................................................... 1.1 1.1 0.2 $0 1.3 1.3 0.2 $0
Management, professional, and related .................. 1.7 1.7 0.3 0 2.0 2.0 0.1 0Management, business, and financial ................. 2.0 2.0 0.4 0 2.2 2.2 0.1 0Professional and related ...................................... 2.3 2.4 0.2 0 2.9 2.9 0.1 2
Service ..................................................................... 2.4 2.4 0.4 0 2.2 2.1 0.4 2( )Sales and office ....................................................... 1.7 1.5 0.5 0 1.6 1.5 0.5 5
Sales and related ................................................. 2.5 2.4 0.5 1 2.6 2.5 0.5 2Office and administrative support ........................ 1.8 1.5 0.8 0 1.8 1.6 0.7 1
Natural resources, construction, and maintenance 2.2 2.2 0.4 0 1.8 1.9 0.4 5Installation, maintenance, and repair ................... 3.4 3.3 0.7 0 2.3 2.2 0.7 0
Production, transportation, and material moving ..... 2.5 2.6 0.3 0 2.6 2.6 0.3 1Production ............................................................ 2.9 2.8 0.5 0 2.8 2.8 0.5 1Transportation and material moving .................... 4.1 4.1 – 2( ) 4.2 4.2 0.1 3
Full time ................................................................... 1.1 1.2 0.2 0 1.3 1.3 0.2 0Part time .................................................................. 2.0 1.9 0.6 2 1.8 1.8 0.6 1
Union ....................................................................... 2.4 2.4 0.3 1 2.9 3.0 0.3 4Nonunion ................................................................. 1.2 1.2 0.2 0 1.4 1.4 0.2 0
Average wage within the following categories3:Second 25 percent ............................................... 1.7 1.6 0.5 0 2.0 1.9 0.5 2Third 25 percent ................................................... 1.6 1.6 0.2 0 1.6 1.6 0.2 0Highest 25 percent ............................................... 1.8 1.9 0.4 0 2.0 2.0 0.2 0
Highest 10 percent ........................................... 2.3 2.3 0.2 0 2.5 2.5 0.2 0
Establishment characteristics
Goods-producing industries ..................................... 1.9 2.0 0.2 0 2.1 2.1 0.2 6Manufacturing ...................................................... 2.4 2.5 0.2 0 2.6 2.7 0.2 6
Service-providing industries ..................................... 1.2 1.2 0.3 0 1.4 1.4 0.2 0Trade, transportation, and utilities ....................... 2.6 2.7 0.5 0 2.7 2.7 0.5 3
Retail trade ...................................................... 2.5 2.5 0.4 1 2.2 2.2 0.5 6Transportation and warehousing ..................... 5.9 6.1 1.9 – 6.7 6.9 1.9 1
Information ........................................................... 4.9 4.9 – 0 4.2 4.2 – 6Financial activities ................................................ 2.2 2.1 0.7 0 2.3 2.2 0.5 0
Finance and insurance .................................... 2.5 2.3 0.8 0 2.5 2.5 0.6 0Credit intermediation and related activities .. 2.7 2.6 0.5 0 2.8 2.8 0.5 0Insurance carriers and related activities ...... 5.0 4.4 1.7 0 5.0 4.8 1.2 7
Real estate and rental and leasing .................. 3.8 3.8 – 0 3.3 3.3 – 4Professional and business services ..................... 2.5 2.5 – 0 3.1 3.1 – 0
Professional and technical services ................. 4.0 4.0 – 0 4.4 4.4 – 7Education and health services ............................. 2.2 2.1 0.5 0 2.7 2.6 0.5 0
Educational services ........................................ 1.6 1.0 1.3 0 1.2 0.9 1.0 0Junior colleges, colleges, and universities ... 2.0 1.5 1.9 0 1.9 1.4 1.9 0
Health care and social assistance ................... 2.6 2.5 0.6 0 3.2 3.1 0.6 0Other services ...................................................... 6.2 – – 0 4.5 – – 6
See footnotes at end of table.

Table 35. Standard errors for outpatient prescription drug benefits:1 Copaymentprovisions, private industry workers, 2015—continued
Characteristics
Brand-name drugs not on formulary
Copayment Nocopayment
Notdeterminable
Mediancopayment
perprescription
Worker characteristics
All workers ............................................................... 1.4 1.4 0.1 $1
Management, professional, and related .................. 2.3 2.3 0.1 3Management, business, and financial ................. 2.7 2.7 0.1 6Professional and related ...................................... 3.0 3.0 0.1 2
Service ..................................................................... 2.7 2.6 0.5 2Sales and office ....................................................... 1.8 1.7 0.4 0
Sales and related ................................................. 3.2 3.2 0.4 2Office and administrative support ........................ 1.8 1.8 0.5 0
Natural resources, construction, and maintenance 2.2 2.2 0.2 2Installation, maintenance, and repair ................... 2.6 2.6 0.4 2
Production, transportation, and material moving ..... 2.9 3.0 0.2 7Production ............................................................ 2.8 2.8 0.3 8Transportation and material moving .................... 5.6 5.6 – 3
Full time ................................................................... 1.5 1.5 0.1 1Part time .................................................................. 2.9 2.9 0.8 –
Union ....................................................................... 3.4 3.5 0.4 8Nonunion ................................................................. 1.5 1.5 0.1 3
Average wage within the following categories3:Second 25 percent ............................................... 2.1 2.1 0.2 2Third 25 percent ................................................... 1.8 1.8 0.2 5Highest 25 percent ............................................... 2.4 2.4 0.2 0
Highest 10 percent ........................................... 3.1 3.0 0.2 0
Establishment characteristics
Goods-producing industries ..................................... 2.4 2.4 0.1 4Manufacturing ...................................................... 3.2 3.2 0.1 3
Service-providing industries ..................................... 1.7 1.7 0.2 5Trade, transportation, and utilities ....................... 3.1 3.2 0.2 2
Retail trade ...................................................... 3.3 3.3 0.3 3Transportation and warehousing ..................... 8.5 9.0 1.0 12
Information ........................................................... 4.6 4.6 – 1Financial activities ................................................ 2.6 2.5 0.5 0
Finance and insurance .................................... 2.7 2.7 0.6 9Credit intermediation and related activities .. 2.9 2.9 0.3 9Insurance carriers and related activities ...... 5.2 5.0 1.3 10
Real estate and rental and leasing .................. 4.4 – – 0Professional and business services ..................... 3.4 3.4 – 0
Professional and technical services ................. 5.3 5.3 – 7Education and health services ............................. 3.3 3.2 0.6 –
Educational services ........................................ 2.6 2.3 1.0 0Junior colleges, colleges, and universities ... 2.5 2.0 1.7 0
Health care and social assistance ................... 3.9 3.8 0.7 5Other services ...................................................... 5.0 – – 14
See footnotes at end of table.

Table 35. Standard errors for outpatient prescription drug benefits:1 Copayment provisions, private industry workers,2015—continued
Characteristics
Generic drugs Brand-name drugs on formulary
Copayment Nocopayment
Notdeterminable
Mediancopayment
perprescription
Copayment Nocopayment
Notdeterminable
Mediancopayment
perprescription
1 to 99 workers:50 to 99 workers ................................................ 2.6 2.7 1.0 $0 2.7 2.7 0.2 $6
100 workers or more ................................................ 1.3 1.3 0.2 0 1.5 1.5 0.2 0100 to 499 workers .............................................. 1.5 1.5 0.1 0 1.7 1.7 0.1 5500 workers or more ............................................ 2.3 2.2 0.5 0 2.8 2.7 0.5 4
Geographic areas
Northeast ................................................................. 2.3 2.6 0.9 0 1.9 1.8 0.5 0New England ....................................................... 3.3 3.0 1.3 0 3.2 2.9 0.9 3Middle Atlantic ..................................................... 2.8 3.3 1.1 0 2.6 2.5 0.6 0
South ....................................................................... 1.6 1.6 0.2 0 2.0 2.1 0.2 0South Atlantic ....................................................... 2.2 2.4 0.3 0 3.2 3.4 0.3 3West South Central .............................................. 2.8 2.8 0.2 0 3.5 3.3 0.2 0
Midwest .................................................................... 2.2 2.3 0.3 0 2.7 2.8 0.2 6East North Central ............................................... 1.9 2.0 0.3 0 2.8 3.0 0.2 7West North Central .............................................. 5.0 5.4 0.5 0 5.2 5.5 0.5 5
West ......................................................................... 2.7 2.6 0.4 0 3.1 3.0 0.4 0Mountain .............................................................. 4.1 4.0 0.1 0 5.4 5.4 0.1 0Pacific .................................................................. 3.4 3.3 0.6 0 3.8 3.7 0.6 0
See footnotes at end of table.

Table 35. Standard errors for outpatient prescription drug benefits:1 Copaymentprovisions, private industry workers, 2015—continued
Characteristics
Brand-name drugs not on formulary
Copayment Nocopayment
Notdeterminable
Mediancopayment
perprescription
1 to 99 workers:50 to 99 workers ................................................ 3.2 3.2 4( ) $4
100 workers or more ................................................ 1.8 1.8 0.1 6100 to 499 workers .............................................. 2.1 2.1 0.1 5500 workers or more ............................................ 3.0 3.0 0.2 0
Geographic areas
Northeast ................................................................. 2.8 2.8 0.6 0New England ....................................................... 3.8 3.4 1.0 8Middle Atlantic ..................................................... 3.7 3.6 0.7 –
South ....................................................................... 2.2 2.3 0.1 0South Atlantic ....................................................... 3.5 3.6 0.3 1West South Central .............................................. 3.9 3.8 0.2 0
Midwest .................................................................... 3.0 3.0 0.1 5East North Central ............................................... 3.0 3.0 0.1 7West North Central .............................................. 6.7 6.7 0.2 7
West ......................................................................... 3.5 3.5 0.1 0Mountain .............................................................. 5.8 5.8 0.1 6Pacific .................................................................. 4.4 4.5 0.1 0
1 Outpatient prescription drug benefits include both stand-alone drug plans and prescription drug benefits included as part of amedical plan.
2 Less than 0.5.3 Surveyed occupations are classified into wage categories based on the average wage for the occupation, which may include
workers with earnings both above and below the threshold. The categories were formed using percentile estimates generated usingdata from the National Compensation Survey publication, "Employer Costs for Employee Compensation - March 2015."
4 Less than 0.05.
Note: Dashes indicate that no data were reported or that data do not meet publication criteria. For definitions of major plans, keyprovisions, and related terms, see the "Glossary of Employee Benefit Terms" at www.bls.gov/ncs/ebs/glossary20152016.htm.
Source: Bureau of Labor Statistics, National Compensation Survey.
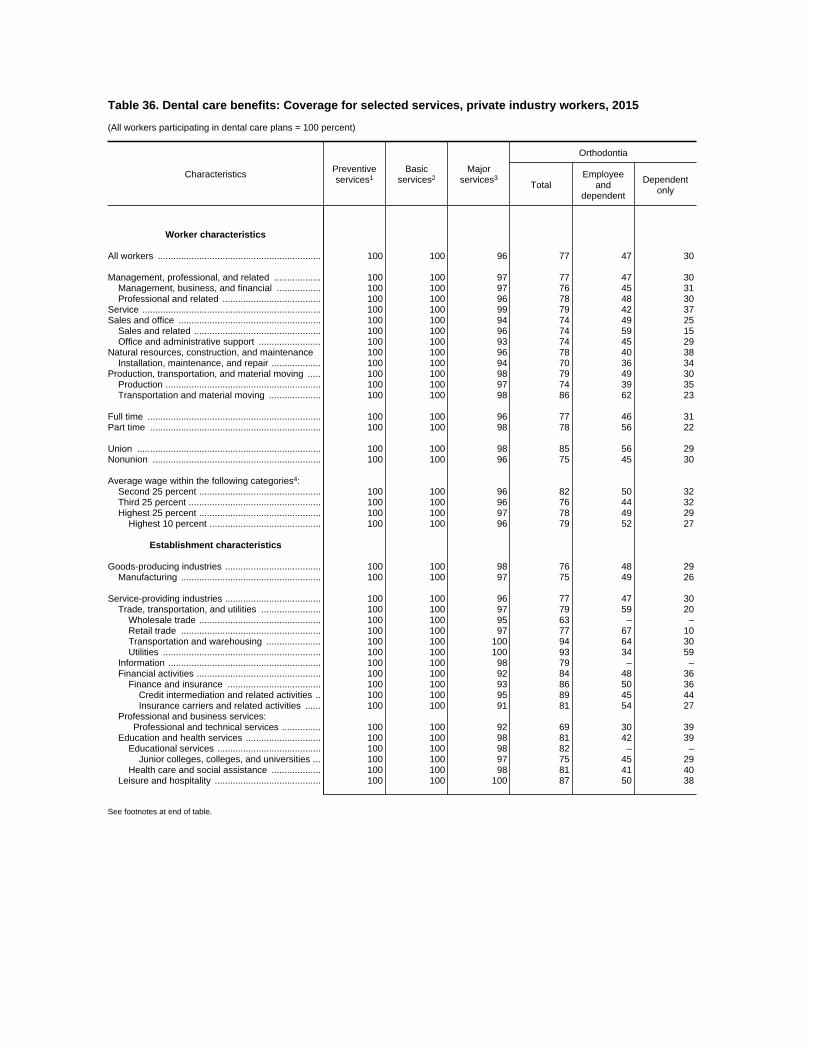
Table 36. Dental care benefits: Coverage for selected services, private industry workers, 2015
(All workers participating in dental care plans = 100 percent)
Characteristics Preventiveservices1
Basicservices2
Majorservices3
Orthodontia
TotalEmployee
anddependent
Dependentonly
Worker characteristics
All workers ............................................................... 100 100 96 77 47 30
Management, professional, and related .................. 100 100 97 77 47 30Management, business, and financial ................. 100 100 97 76 45 31Professional and related ...................................... 100 100 96 78 48 30
Service ..................................................................... 100 100 99 79 42 37Sales and office ....................................................... 100 100 94 74 49 25
Sales and related ................................................. 100 100 96 74 59 15Office and administrative support ........................ 100 100 93 74 45 29
Natural resources, construction, and maintenance 100 100 96 78 40 38Installation, maintenance, and repair ................... 100 100 94 70 36 34
Production, transportation, and material moving ..... 100 100 98 79 49 30Production ............................................................ 100 100 97 74 39 35Transportation and material moving .................... 100 100 98 86 62 23
Full time ................................................................... 100 100 96 77 46 31Part time .................................................................. 100 100 98 78 56 22
Union ....................................................................... 100 100 98 85 56 29Nonunion ................................................................. 100 100 96 75 45 30
Average wage within the following categories4:Second 25 percent ............................................... 100 100 96 82 50 32Third 25 percent ................................................... 100 100 96 76 44 32Highest 25 percent ............................................... 100 100 97 78 49 29
Highest 10 percent ........................................... 100 100 96 79 52 27
Establishment characteristics
Goods-producing industries ..................................... 100 100 98 76 48 29Manufacturing ...................................................... 100 100 97 75 49 26
Service-providing industries ..................................... 100 100 96 77 47 30Trade, transportation, and utilities ....................... 100 100 97 79 59 20
Wholesale trade ............................................... 100 100 95 63 – –Retail trade ...................................................... 100 100 97 77 67 10Transportation and warehousing ..................... 100 100 100 94 64 30Utilities ............................................................. 100 100 100 93 34 59
Information ........................................................... 100 100 98 79 – –Financial activities ................................................ 100 100 92 84 48 36
Finance and insurance .................................... 100 100 93 86 50 36Credit intermediation and related activities .. 100 100 95 89 45 44Insurance carriers and related activities ...... 100 100 91 81 54 27
Professional and business services:Professional and technical services ............... 100 100 92 69 30 39
Education and health services ............................. 100 100 98 81 42 39Educational services ........................................ 100 100 98 82 – –
Junior colleges, colleges, and universities ... 100 100 97 75 45 29Health care and social assistance ................... 100 100 98 81 41 40
Leisure and hospitality ......................................... 100 100 100 87 50 38
See footnotes at end of table.

Table 36. Dental care benefits: Coverage for selected services, private industry workers,2015—continued
(All workers participating in dental care plans = 100 percent)
Characteristics Preventiveservices1
Basicservices2
Majorservices3
Orthodontia
TotalEmployee
anddependent
Dependentonly
1 to 99 workers ........................................................ 100 100 97 71 40 3250 to 99 workers .................................................. 100 100 98 76 45 31
100 workers or more ................................................ 100 100 96 80 51 29100 to 499 workers .............................................. 100 100 96 76 47 30500 workers or more ............................................ 100 100 95 84 56 28
Geographic areas
Northeast ................................................................. 100 100 96 80 42 38New England ....................................................... 100 100 93 74 43 30Middle Atlantic ..................................................... 100 100 97 83 41 41
South ....................................................................... 100 100 95 77 46 31South Atlantic ....................................................... 100 100 95 74 45 29East South Central ............................................... 100 100 98 88 57 31West South Central .............................................. 100 100 93 77 44 33
Midwest .................................................................... 100 100 95 77 46 32East North Central ............................................... 100 100 97 80 44 35West North Central .............................................. 100 100 92 74 48 26
West ......................................................................... 100 100 98 74 52 22Mountain .............................................................. 100 100 98 63 46 16
1 Preventive services include routine exams, cleanings, and x-rays, and other preventive care. 2 Basic services include fillings, dental surgery, periodontal care (treatment for gum disease), and endodontics (root canal therapy). 3 Major services include procedures such as crowns and prosthetics (replacement of missing teeth with bridgework or dentures).4 Surveyed occupations are classified into wage categories based on the average wage for the occupation, which may include workers with earnings both above
and below the threshold. The categories were formed using percentile estimates generated using data from the National Compensation Survey publication, "EmployerCosts for Employee Compensation - March 2015."
Note: Because of rounding, sums of individual items may not equal totals. Dashes indicate that no data were reported or that data do not meet publication criteria. Fordefinitions of major plans, key provisions, and related terms, see the "Glossary of Employee Benefit Terms" at www.bls.gov/ncs/ebs/glossary20152016.htm.
Source: Bureau of Labor Statistics, National Compensation Survey.
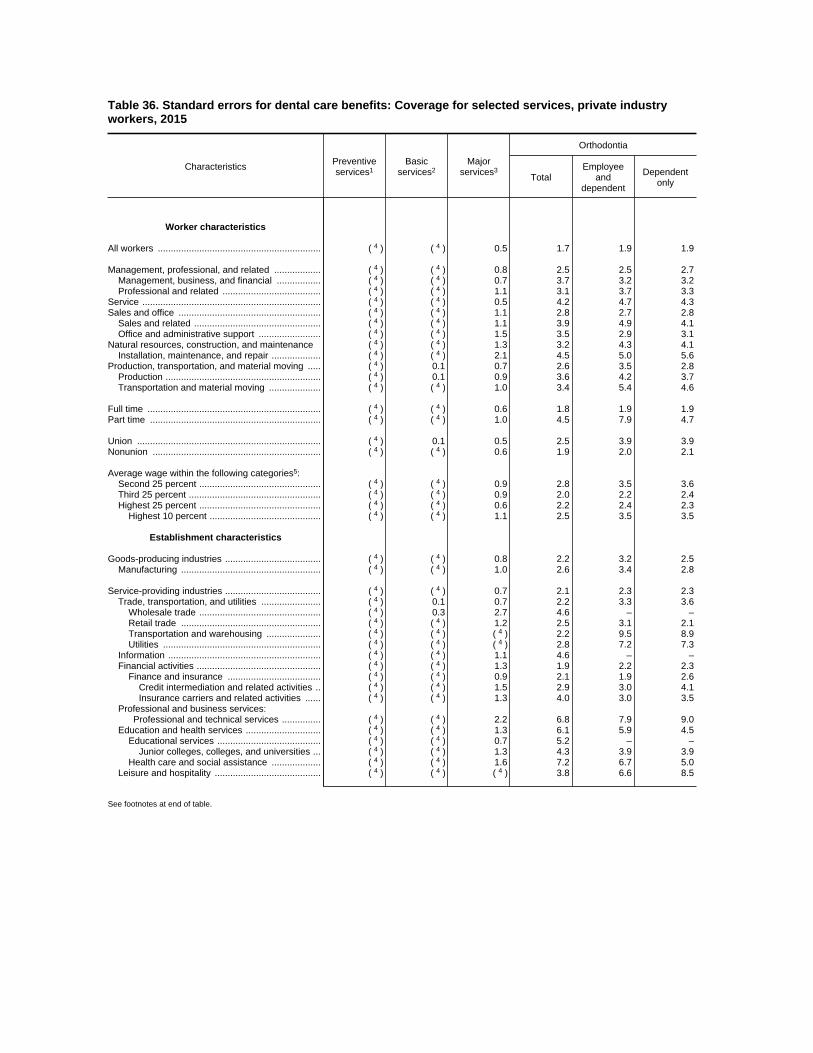
Table 36. Standard errors for dental care benefits: Coverage for selected services, private industryworkers, 2015
Characteristics Preventiveservices1
Basicservices2
Majorservices3
Orthodontia
TotalEmployee
anddependent
Dependentonly
Worker characteristics
All workers ............................................................... 4( ) 4( ) 0.5 1.7 1.9 1.9
Management, professional, and related .................. 4( ) 4( ) 0.8 2.5 2.5 2.7Management, business, and financial ................. 4( ) 4( ) 0.7 3.7 3.2 3.2Professional and related ...................................... 4( ) 4( ) 1.1 3.1 3.7 3.3
Service ..................................................................... 4( ) 4( ) 0.5 4.2 4.7 4.3Sales and office ....................................................... 4( ) 4( ) 1.1 2.8 2.7 2.8
Sales and related ................................................. 4( ) 4( ) 1.1 3.9 4.9 4.1Office and administrative support ........................ 4( ) 4( ) 1.5 3.5 2.9 3.1
Natural resources, construction, and maintenance 4( ) 4( ) 1.3 3.2 4.3 4.1Installation, maintenance, and repair ................... 4( ) 4( ) 2.1 4.5 5.0 5.6
Production, transportation, and material moving ..... 4( ) 0.1 0.7 2.6 3.5 2.8Production ............................................................ 4( ) 0.1 0.9 3.6 4.2 3.7Transportation and material moving .................... 4( ) 4( ) 1.0 3.4 5.4 4.6
Full time ................................................................... 4( ) 4( ) 0.6 1.8 1.9 1.9Part time .................................................................. 4( ) 4( ) 1.0 4.5 7.9 4.7
Union ....................................................................... 4( ) 0.1 0.5 2.5 3.9 3.9Nonunion ................................................................. 4( ) 4( ) 0.6 1.9 2.0 2.1
Average wage within the following categories5:Second 25 percent ............................................... 4( ) 4( ) 0.9 2.8 3.5 3.6Third 25 percent ................................................... 4( ) 4( ) 0.9 2.0 2.2 2.4Highest 25 percent ............................................... 4( ) 4( ) 0.6 2.2 2.4 2.3
Highest 10 percent ........................................... 4( ) 4( ) 1.1 2.5 3.5 3.5
Establishment characteristics
Goods-producing industries ..................................... 4( ) 4( ) 0.8 2.2 3.2 2.5Manufacturing ...................................................... 4( ) 4( ) 1.0 2.6 3.4 2.8
Service-providing industries ..................................... 4( ) 4( ) 0.7 2.1 2.3 2.3Trade, transportation, and utilities ....................... 4( ) 0.1 0.7 2.2 3.3 3.6
Wholesale trade ............................................... 4( ) 0.3 2.7 4.6 – –Retail trade ...................................................... 4( ) 4( ) 1.2 2.5 3.1 2.1Transportation and warehousing ..................... 4( ) 4( ) 4( ) 2.2 9.5 8.9Utilities ............................................................. 4( ) 4( ) 4( ) 2.8 7.2 7.3
Information ........................................................... 4( ) 4( ) 1.1 4.6 – –Financial activities ................................................ 4( ) 4( ) 1.3 1.9 2.2 2.3
Finance and insurance .................................... 4( ) 4( ) 0.9 2.1 1.9 2.6Credit intermediation and related activities .. 4( ) 4( ) 1.5 2.9 3.0 4.1Insurance carriers and related activities ...... 4( ) 4( ) 1.3 4.0 3.0 3.5
Professional and business services:Professional and technical services ............... 4( ) 4( ) 2.2 6.8 7.9 9.0
Education and health services ............................. 4( ) 4( ) 1.3 6.1 5.9 4.5Educational services ........................................ 4( ) 4( ) 0.7 5.2 – –
Junior colleges, colleges, and universities ... 4( ) 4( ) 1.3 4.3 3.9 3.9Health care and social assistance ................... 4( ) 4( ) 1.6 7.2 6.7 5.0
Leisure and hospitality ......................................... 4( ) 4( ) 4( ) 3.8 6.6 8.5
See footnotes at end of table.
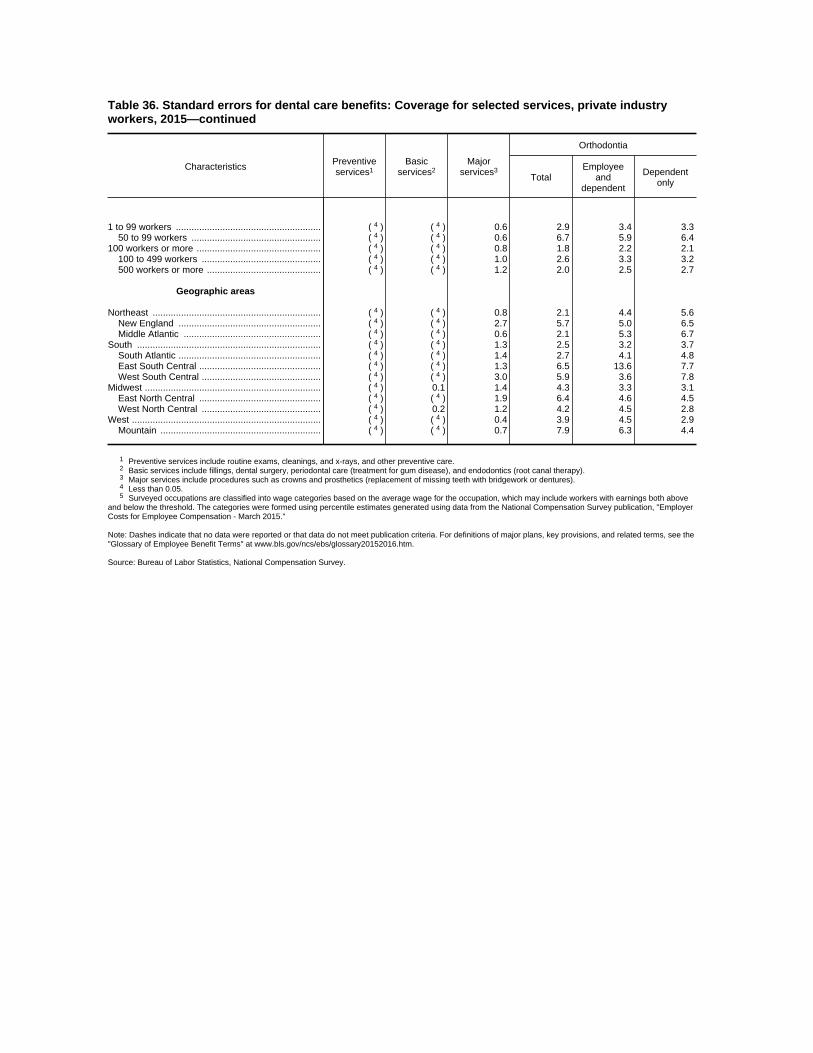
Table 36. Standard errors for dental care benefits: Coverage for selected services, private industryworkers, 2015—continued
Characteristics Preventiveservices1
Basicservices2
Majorservices3
Orthodontia
TotalEmployee
anddependent
Dependentonly
1 to 99 workers ........................................................ 4( ) 4( ) 0.6 2.9 3.4 3.350 to 99 workers .................................................. 4( ) 4( ) 0.6 6.7 5.9 6.4
100 workers or more ................................................ 4( ) 4( ) 0.8 1.8 2.2 2.1100 to 499 workers .............................................. 4( ) 4( ) 1.0 2.6 3.3 3.2500 workers or more ............................................ 4( ) 4( ) 1.2 2.0 2.5 2.7
Geographic areas
Northeast ................................................................. 4( ) 4( ) 0.8 2.1 4.4 5.6New England ....................................................... 4( ) 4( ) 2.7 5.7 5.0 6.5Middle Atlantic ..................................................... 4( ) 4( ) 0.6 2.1 5.3 6.7
South ....................................................................... 4( ) 4( ) 1.3 2.5 3.2 3.7South Atlantic ....................................................... 4( ) 4( ) 1.4 2.7 4.1 4.8East South Central ............................................... 4( ) 4( ) 1.3 6.5 13.6 7.7West South Central .............................................. 4( ) 4( ) 3.0 5.9 3.6 7.8
Midwest .................................................................... 4( ) 0.1 1.4 4.3 3.3 3.1East North Central ............................................... 4( ) 4( ) 1.9 6.4 4.6 4.5West North Central .............................................. 4( ) 0.2 1.2 4.2 4.5 2.8
West ......................................................................... 4( ) 4( ) 0.4 3.9 4.5 2.9Mountain .............................................................. 4( ) 4( ) 0.7 7.9 6.3 4.4
1 Preventive services include routine exams, cleanings, and x-rays, and other preventive care. 2 Basic services include fillings, dental surgery, periodontal care (treatment for gum disease), and endodontics (root canal therapy). 3 Major services include procedures such as crowns and prosthetics (replacement of missing teeth with bridgework or dentures).4 Less than 0.05.5 Surveyed occupations are classified into wage categories based on the average wage for the occupation, which may include workers with earnings both above
and below the threshold. The categories were formed using percentile estimates generated using data from the National Compensation Survey publication, "EmployerCosts for Employee Compensation - March 2015."
Note: Dashes indicate that no data were reported or that data do not meet publication criteria. For definitions of major plans, key provisions, and related terms, see the"Glossary of Employee Benefit Terms" at www.bls.gov/ncs/ebs/glossary20152016.htm.
Source: Bureau of Labor Statistics, National Compensation Survey.
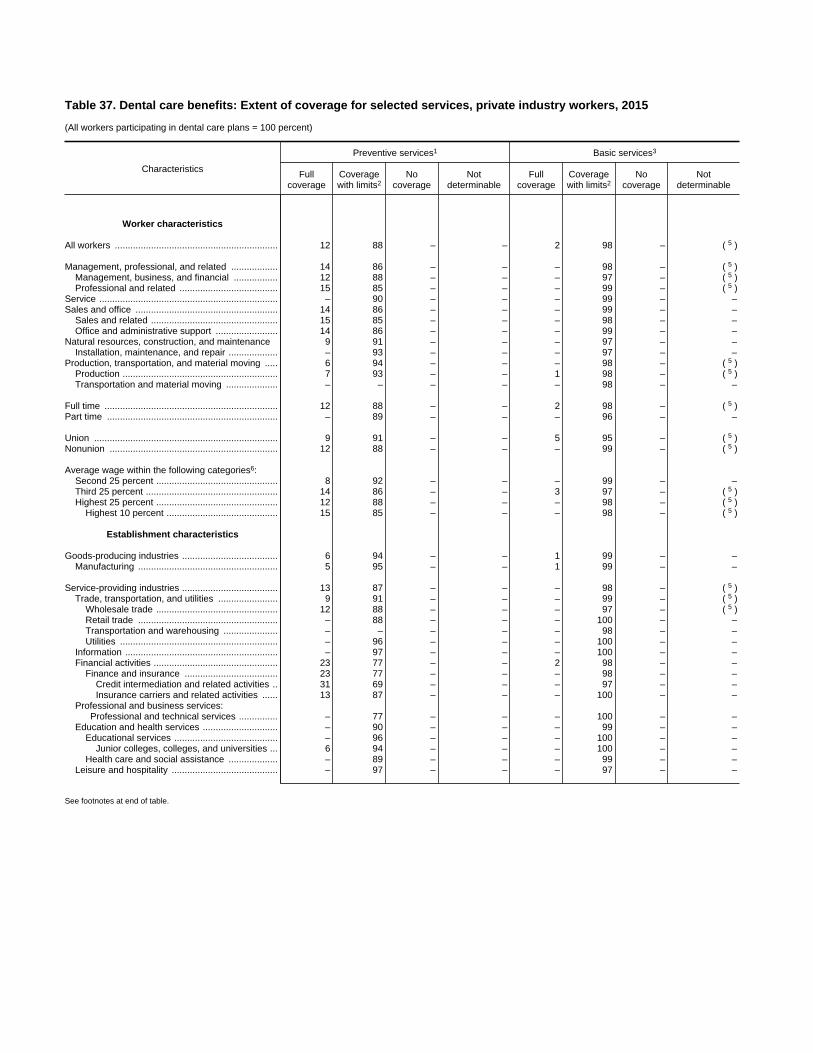
Table 37. Dental care benefits: Extent of coverage for selected services, private industry workers, 2015
(All workers participating in dental care plans = 100 percent)
Characteristics
Preventive services1 Basic services3
Fullcoverage
Coveragewith limits2
Nocoverage
Notdeterminable
Fullcoverage
Coveragewith limits2
Nocoverage
Notdeterminable
Worker characteristics
All workers ............................................................... 12 88 – – 2 98 – 5( )
Management, professional, and related .................. 14 86 – – – 98 – 5( )Management, business, and financial ................. 12 88 – – – 97 – 5( )Professional and related ...................................... 15 85 – – – 99 – 5( )
Service ..................................................................... – 90 – – – 99 – –Sales and office ....................................................... 14 86 – – – 99 – –
Sales and related ................................................. 15 85 – – – 98 – –Office and administrative support ........................ 14 86 – – – 99 – –
Natural resources, construction, and maintenance 9 91 – – – 97 – –Installation, maintenance, and repair ................... – 93 – – – 97 – –
Production, transportation, and material moving ..... 6 94 – – – 98 – 5( )Production ............................................................ 7 93 – – 1 98 – 5( )Transportation and material moving .................... – – – – – 98 – –
Full time ................................................................... 12 88 – – 2 98 – 5( )Part time .................................................................. – 89 – – – 96 – –
Union ....................................................................... 9 91 – – 5 95 – 5( )Nonunion ................................................................. 12 88 – – – 99 – 5( )
Average wage within the following categories6:Second 25 percent ............................................... 8 92 – – – 99 – –Third 25 percent ................................................... 14 86 – – 3 97 – 5( )Highest 25 percent ............................................... 12 88 – – – 98 – 5( )
Highest 10 percent ........................................... 15 85 – – – 98 – 5( )
Establishment characteristics
Goods-producing industries ..................................... 6 94 – – 1 99 – –Manufacturing ...................................................... 5 95 – – 1 99 – –
Service-providing industries ..................................... 13 87 – – – 98 – 5( )Trade, transportation, and utilities ....................... 9 91 – – – 99 – 5( )
Wholesale trade ............................................... 12 88 – – – 97 – 5( )Retail trade ...................................................... – 88 – – – 100 – –Transportation and warehousing ..................... – – – – – 98 – –Utilities ............................................................. – 96 – – – 100 – –
Information ........................................................... – 97 – – – 100 – –Financial activities ................................................ 23 77 – – 2 98 – –
Finance and insurance .................................... 23 77 – – – 98 – –Credit intermediation and related activities .. 31 69 – – – 97 – –Insurance carriers and related activities ...... 13 87 – – – 100 – –
Professional and business services:Professional and technical services ............... – 77 – – – 100 – –
Education and health services ............................. – 90 – – – 99 – –Educational services ........................................ – 96 – – – 100 – –
Junior colleges, colleges, and universities ... 6 94 – – – 100 – –Health care and social assistance ................... – 89 – – – 99 – –
Leisure and hospitality ......................................... – 97 – – – 97 – –
See footnotes at end of table.

Table 37. Dental care benefits: Extent of coverage for selected services,private industry workers, 2015—continued
(All workers participating in dental care plans = 100 percent)
Characteristics
Major services4
Fullcoverage
Coveragewith limits2
Nocoverage
Notdeterminable
Worker characteristics
All workers ............................................................... – 96 3 –
Management, professional, and related .................. – 96 3 –Management, business, and financial ................. – 97 3 –Professional and related ...................................... – 96 – 5( )
Service ..................................................................... – 98 – –Sales and office ....................................................... – 93 6 –
Sales and related ................................................. – 95 – 1Office and administrative support ........................ – 93 7 –
Natural resources, construction, and maintenance – 96 – –Installation, maintenance, and repair ................... – 94 – –
Production, transportation, and material moving ..... – 97 – 1Production ............................................................ – 97 – 5( )Transportation and material moving .................... – 98 – 1
Full time ................................................................... – 96 4 –Part time .................................................................. – 97 – 5( )
Union ....................................................................... – 98 – 5( )Nonunion ................................................................. – 96 4 –
Average wage within the following categories6:Second 25 percent ............................................... – 96 4 –Third 25 percent ................................................... – 96 4 –Highest 25 percent ............................................... – 97 2 –
Highest 10 percent ........................................... – 96 – 5( )
Establishment characteristics
Goods-producing industries ..................................... – 97 – –Manufacturing ...................................................... – 97 – –
Service-providing industries ..................................... – 96 4 –Trade, transportation, and utilities ....................... – 97 – 1
Wholesale trade ............................................... – 95 – 3Retail trade ...................................................... – 97 – 5( )Transportation and warehousing ..................... – 100 – –Utilities ............................................................. – 100 – –
Information ........................................................... – 98 – –Financial activities ................................................ – 92 6 –
Finance and insurance .................................... – 93 5 –Credit intermediation and related activities .. – 94 – 3Insurance carriers and related activities ...... – 91 8 1
Professional and business services:Professional and technical services ............... – 92 – –
Education and health services ............................. – 98 – –Educational services ........................................ – 98 – –
Junior colleges, colleges, and universities ... – 97 – –Health care and social assistance ................... – 97 – –
Leisure and hospitality ......................................... – 99 – –
See footnotes at end of table.

Table 37. Dental care benefits: Extent of coverage for selected services, private industry workers, 2015—continued
(All workers participating in dental care plans = 100 percent)
Characteristics
Preventive services1 Basic services3
Fullcoverage
Coveragewith limits2
Nocoverage
Notdeterminable
Fullcoverage
Coveragewith limits2
Nocoverage
Notdeterminable
1 to 99 workers ........................................................ 14 86 – – – 98 – –50 to 99 workers .................................................. – 87 – – – 99 – –
100 workers or more ................................................ 11 89 – – 2 98 – 5( )100 to 499 workers .............................................. 10 90 – – – 98 – 5( )500 workers or more ............................................ 11 89 – – – 98 – –
Geographic areas
Northeast ................................................................. 22 78 – – – 96 – –New England ....................................................... – 89 – – – 98 – –Middle Atlantic ..................................................... 25 75 – – – 95 – –
South ....................................................................... 9 91 – – – 100 – –South Atlantic ....................................................... 11 89 – – – 99 – –East South Central ............................................... – 95 – – – 100 – –West South Central .............................................. – 94 – – – 100 – –
Midwest .................................................................... 9 91 – – – 98 – 5( )East North Central ............................................... 10 90 – – – 97 – –West North Central .............................................. – 95 – – – 99 – 5( )
West ......................................................................... 11 89 – – – 99 – –Mountain .............................................................. – 87 – – – 100 – –
See footnotes at end of table.

Table 37. Dental care benefits: Extent of coverage for selected services,private industry workers, 2015—continued
(All workers participating in dental care plans = 100 percent)
Characteristics
Major services4
Fullcoverage
Coveragewith limits2
Nocoverage
Notdeterminable
1 to 99 workers ........................................................ – 97 3 –50 to 99 workers .................................................. – 98 – –
100 workers or more ................................................ – 96 4 –100 to 499 workers .............................................. – 96 4 –500 workers or more ............................................ – 95 4 –
Geographic areas
Northeast ................................................................. – 96 3 –New England ....................................................... – 93 – 3Middle Atlantic ..................................................... – 97 2 –
South ....................................................................... – 95 5 –South Atlantic ....................................................... – 95 5 5( )East South Central ............................................... – 98 – 5( )West South Central .............................................. – 93 – 1
Midwest .................................................................... – 95 – 5( )East North Central ............................................... – 97 – –West North Central .............................................. – 92 8 –
West ......................................................................... – 98 1 –Mountain .............................................................. – 98 – 5( )
1 Preventive services include routine exams, cleanings, and x-rays, and other preventive care. 2 Coverage for dental procedures may be subject to scheduled allowance, deductible, or coinsurance provisions, in
addition to maximum dollar limitations.3 Basic services include fillings, dental surgery, periodontal care (treatment for gum disease), and endodontics (root canal
therapy). 4 Major services include procedures such as crowns and prosthetics (replacement of missing teeth with bridgework or
dentures).5 Less than 0.5.6 Surveyed occupations are classified into wage categories based on the average wage for the occupation, which may
include workers with earnings both above and below the threshold. The categories were formed using percentile estimatesgenerated using data from the National Compensation Survey publication, "Employer Costs for Employee Compensation -March 2015."
Note: Because of rounding, sums of individual items may not equal totals. Dashes indicate that no data were reported or thatdata do not meet publication criteria. For definitions of major plans, key provisions, and related terms, see the "Glossary ofEmployee Benefit Terms" at www.bls.gov/ncs/ebs/glossary20152016.htm.
Source: Bureau of Labor Statistics, National Compensation Survey.
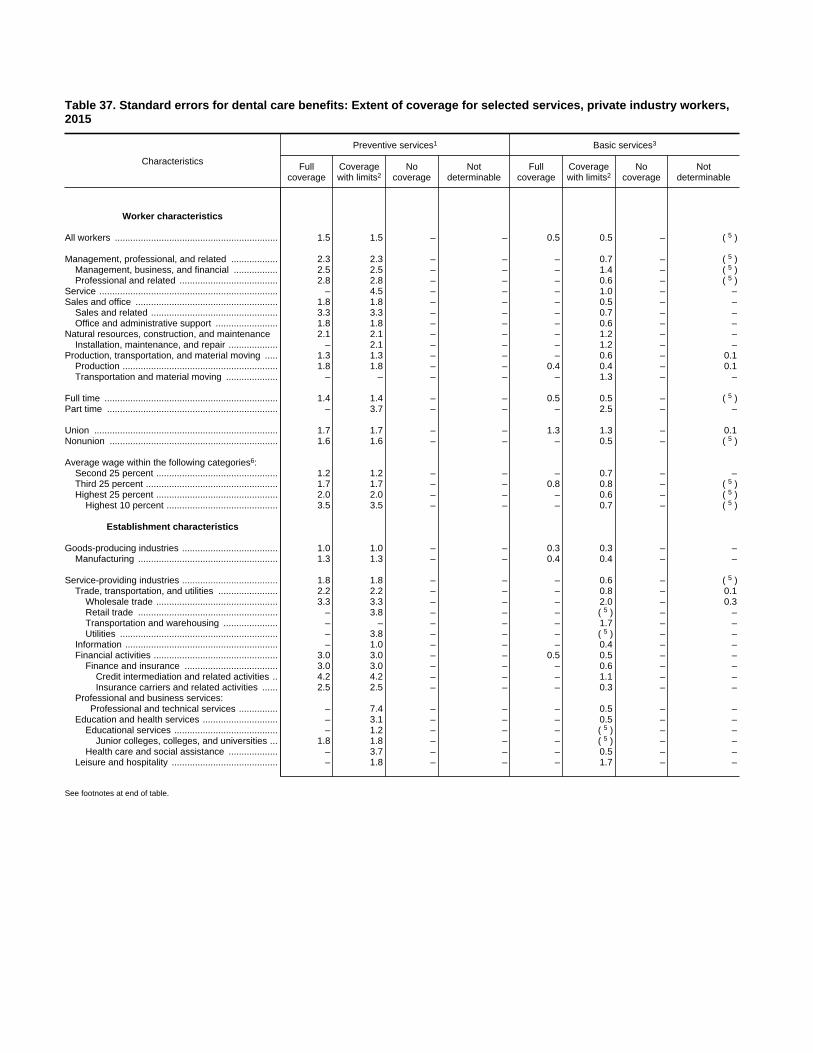
Table 37. Standard errors for dental care benefits: Extent of coverage for selected services, private industry workers,2015
Characteristics
Preventive services1 Basic services3
Fullcoverage
Coveragewith limits2
Nocoverage
Notdeterminable
Fullcoverage
Coveragewith limits2
Nocoverage
Notdeterminable
Worker characteristics
All workers ............................................................... 1.5 1.5 – – 0.5 0.5 – 5( )
Management, professional, and related .................. 2.3 2.3 – – – 0.7 – 5( )Management, business, and financial ................. 2.5 2.5 – – – 1.4 – 5( )Professional and related ...................................... 2.8 2.8 – – – 0.6 – 5( )
Service ..................................................................... – 4.5 – – – 1.0 – –Sales and office ....................................................... 1.8 1.8 – – – 0.5 – –
Sales and related ................................................. 3.3 3.3 – – – 0.7 – –Office and administrative support ........................ 1.8 1.8 – – – 0.6 – –
Natural resources, construction, and maintenance 2.1 2.1 – – – 1.2 – –Installation, maintenance, and repair ................... – 2.1 – – – 1.2 – –
Production, transportation, and material moving ..... 1.3 1.3 – – – 0.6 – 0.1Production ............................................................ 1.8 1.8 – – 0.4 0.4 – 0.1Transportation and material moving .................... – – – – – 1.3 – –
Full time ................................................................... 1.4 1.4 – – 0.5 0.5 – 5( )Part time .................................................................. – 3.7 – – – 2.5 – –
Union ....................................................................... 1.7 1.7 – – 1.3 1.3 – 0.1Nonunion ................................................................. 1.6 1.6 – – – 0.5 – 5( )
Average wage within the following categories6:Second 25 percent ............................................... 1.2 1.2 – – – 0.7 – –Third 25 percent ................................................... 1.7 1.7 – – 0.8 0.8 – 5( )Highest 25 percent ............................................... 2.0 2.0 – – – 0.6 – 5( )
Highest 10 percent ........................................... 3.5 3.5 – – – 0.7 – 5( )
Establishment characteristics
Goods-producing industries ..................................... 1.0 1.0 – – 0.3 0.3 – –Manufacturing ...................................................... 1.3 1.3 – – 0.4 0.4 – –
Service-providing industries ..................................... 1.8 1.8 – – – 0.6 – 5( )Trade, transportation, and utilities ....................... 2.2 2.2 – – – 0.8 – 0.1
Wholesale trade ............................................... 3.3 3.3 – – – 2.0 – 0.3Retail trade ...................................................... – 3.8 – – – 5( ) – –Transportation and warehousing ..................... – – – – – 1.7 – –Utilities ............................................................. – 3.8 – – – 5( ) – –
Information ........................................................... – 1.0 – – – 0.4 – –Financial activities ................................................ 3.0 3.0 – – 0.5 0.5 – –
Finance and insurance .................................... 3.0 3.0 – – – 0.6 – –Credit intermediation and related activities .. 4.2 4.2 – – – 1.1 – –Insurance carriers and related activities ...... 2.5 2.5 – – – 0.3 – –
Professional and business services:Professional and technical services ............... – 7.4 – – – 0.5 – –
Education and health services ............................. – 3.1 – – – 0.5 – –Educational services ........................................ – 1.2 – – – 5( ) – –
Junior colleges, colleges, and universities ... 1.8 1.8 – – – 5( ) – –Health care and social assistance ................... – 3.7 – – – 0.5 – –
Leisure and hospitality ......................................... – 1.8 – – – 1.7 – –
See footnotes at end of table.

Table 37. Standard errors for dental care benefits: Extent of coverage forselected services, private industry workers, 2015—continued
Characteristics
Major services4
Fullcoverage
Coveragewith limits2
Nocoverage
Notdeterminable
Worker characteristics
All workers ............................................................... – 0.5 0.5 –
Management, professional, and related .................. – 0.8 0.8 –Management, business, and financial ................. – 0.7 0.6 –Professional and related ...................................... – 1.1 – 5( )
Service ..................................................................... – 0.5 – –Sales and office ....................................................... – 1.1 1.1 –
Sales and related ................................................. – 1.1 – 0.7Office and administrative support ........................ – 1.5 1.4 –
Natural resources, construction, and maintenance – 1.3 – –Installation, maintenance, and repair ................... – 2.1 – –
Production, transportation, and material moving ..... – 0.7 – 0.4Production ............................................................ – 0.9 – 0.1Transportation and material moving .................... – 1.0 – 0.9
Full time ................................................................... – 0.6 0.5 –Part time .................................................................. – 1.0 – 0.1
Union ....................................................................... – 0.5 – 0.1Nonunion ................................................................. – 0.6 0.6 –
Average wage within the following categories6:Second 25 percent ............................................... – 1.0 0.9 –Third 25 percent ................................................... – 0.9 0.9 –Highest 25 percent ............................................... – 0.6 0.5 –
Highest 10 percent ........................................... – 1.1 – 0.2
Establishment characteristics
Goods-producing industries ..................................... – 0.8 – –Manufacturing ...................................................... – 1.0 – –
Service-providing industries ..................................... – 0.7 0.7 –Trade, transportation, and utilities ....................... – 0.7 – 0.6
Wholesale trade ............................................... – 2.7 – 2.2Retail trade ...................................................... – 1.2 – 0.2Transportation and warehousing ..................... – 5( ) – –Utilities ............................................................. – 5( ) – –
Information ........................................................... – 1.3 – –Financial activities ................................................ – 1.3 1.0 –
Finance and insurance .................................... – 1.0 0.7 –Credit intermediation and related activities .. – 1.5 – 1.2Insurance carriers and related activities ...... – 1.3 1.3 0.5
Professional and business services:Professional and technical services ............... – 2.2 – –
Education and health services ............................. – 1.3 – –Educational services ........................................ – 0.7 – –
Junior colleges, colleges, and universities ... – 1.3 – –Health care and social assistance ................... – 1.6 – –
Leisure and hospitality ......................................... – 0.8 – –
See footnotes at end of table.
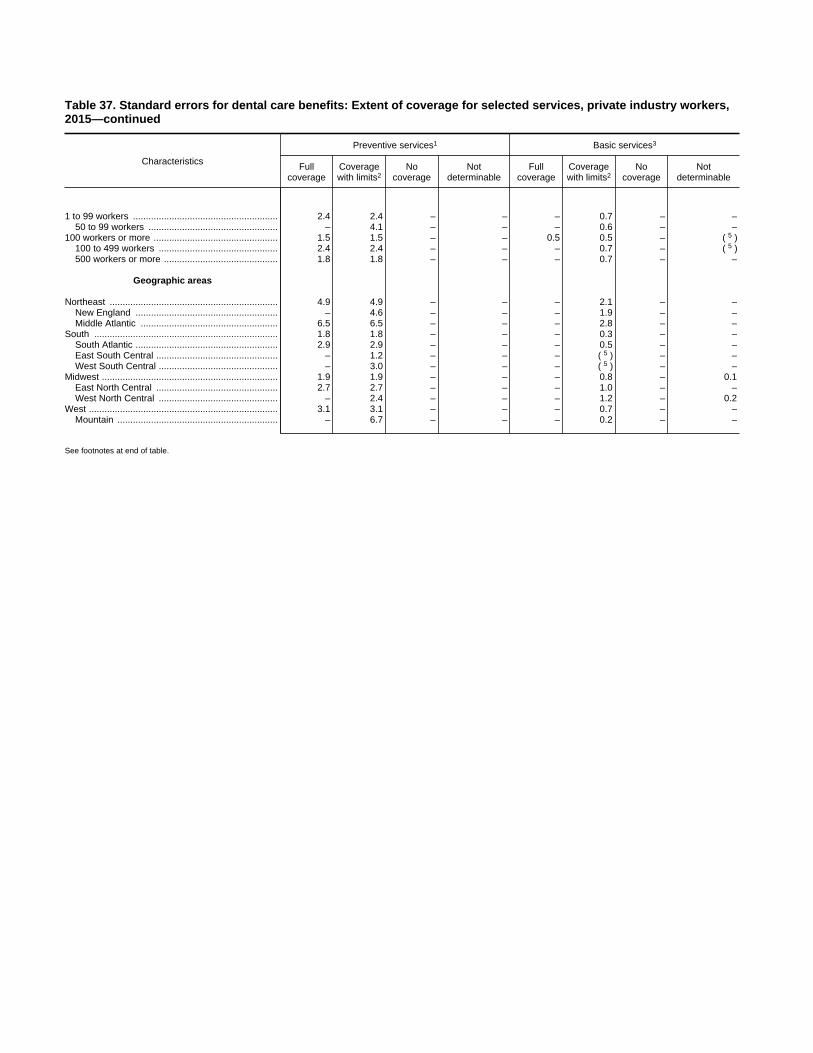
Table 37. Standard errors for dental care benefits: Extent of coverage for selected services, private industry workers,2015—continued
Characteristics
Preventive services1 Basic services3
Fullcoverage
Coveragewith limits2
Nocoverage
Notdeterminable
Fullcoverage
Coveragewith limits2
Nocoverage
Notdeterminable
1 to 99 workers ........................................................ 2.4 2.4 – – – 0.7 – –50 to 99 workers .................................................. – 4.1 – – – 0.6 – –
100 workers or more ................................................ 1.5 1.5 – – 0.5 0.5 – 5( )100 to 499 workers .............................................. 2.4 2.4 – – – 0.7 – 5( )500 workers or more ............................................ 1.8 1.8 – – – 0.7 – –
Geographic areas
Northeast ................................................................. 4.9 4.9 – – – 2.1 – –New England ....................................................... – 4.6 – – – 1.9 – –Middle Atlantic ..................................................... 6.5 6.5 – – – 2.8 – –
South ....................................................................... 1.8 1.8 – – – 0.3 – –South Atlantic ....................................................... 2.9 2.9 – – – 0.5 – –East South Central ............................................... – 1.2 – – – 5( ) – –West South Central .............................................. – 3.0 – – – 5( ) – –
Midwest .................................................................... 1.9 1.9 – – – 0.8 – 0.1East North Central ............................................... 2.7 2.7 – – – 1.0 – –West North Central .............................................. – 2.4 – – – 1.2 – 0.2
West ......................................................................... 3.1 3.1 – – – 0.7 – –Mountain .............................................................. – 6.7 – – – 0.2 – –
See footnotes at end of table.

Table 37. Standard errors for dental care benefits: Extent of coverage forselected services, private industry workers, 2015—continued
Characteristics
Major services4
Fullcoverage
Coveragewith limits2
Nocoverage
Notdeterminable
1 to 99 workers ........................................................ – 0.6 0.4 –50 to 99 workers .................................................. – 0.6 – –
100 workers or more ................................................ – 0.8 0.8 –100 to 499 workers .............................................. – 1.0 1.0 –500 workers or more ............................................ – 1.2 1.2 –
Geographic areas
Northeast ................................................................. – 0.8 0.6 –New England ....................................................... – 2.7 – 2.4Middle Atlantic ..................................................... – 0.7 0.5 –
South ....................................................................... – 1.3 1.3 –South Atlantic ....................................................... – 1.4 1.4 0.2East South Central ............................................... – 1.3 – 5( )West South Central .............................................. – 3.0 – 0.5
Midwest .................................................................... – 1.4 – 0.1East North Central ............................................... – 1.9 – –West North Central .............................................. – 1.2 1.2 –
West ......................................................................... – 0.4 0.3 –Mountain .............................................................. – 0.7 – 0.2
1 Preventive services include routine exams, cleanings, and x-rays, and other preventive care. 2 Coverage for dental procedures may be subject to scheduled allowance, deductible, or coinsurance provisions, in
addition to maximum dollar limitations.3 Basic services include fillings, dental surgery, periodontal care (treatment for gum disease), and endodontics (root canal
therapy). 4 Major services include procedures such as crowns and prosthetics (replacement of missing teeth with bridgework or
dentures).5 Less than 0.05.6 Surveyed occupations are classified into wage categories based on the average wage for the occupation, which may
include workers with earnings both above and below the threshold. The categories were formed using percentile estimatesgenerated using data from the National Compensation Survey publication, "Employer Costs for Employee Compensation -March 2015."
Note: Dashes indicate that no data were reported or that data do not meet publication criteria. For definitions of major plans,key provisions, and related terms, see the "Glossary of Employee Benefit Terms" atwww.bls.gov/ncs/ebs/glossary20152016.htm.
Source: Bureau of Labor Statistics, National Compensation Survey.

Table 38. Dental care benefits: Coverage for orthodontia, private industry workers,2015
(All workers participating in dental care plans = 100 percent)
Characteristics
Employee and dependent
Fullcoverage
Coveragewith limits1
Nocoverage
Notdeterminable
Medianpercent ofcoveredcharges2
Worker characteristics
All workers ............................................................... – 47 52 – 50
Management, professional, and related .................. – 47 53 1 50Management, business, and financial ................. – 45 54 3( ) 50Professional and related ...................................... – 48 51 1 50
Service ..................................................................... – 42 57 – 50Sales and office ....................................................... – 49 49 – 50
Sales and related ................................................. – 59 39 3 50Office and administrative support ........................ – 45 54 – 50
Natural resources, construction, and maintenance – 40 60 3( ) 50Installation, maintenance, and repair ................... – 36 63 3( ) 50
Production, transportation, and material moving ..... – 49 50 1 50Production ............................................................ – 39 60 3( ) 50Transportation and material moving .................... – 62 36 1 50
Full time ................................................................... – 46 53 – 50Part time .................................................................. – 56 44 – 50
Union ....................................................................... – 56 44 3( ) 50Nonunion ................................................................. – 45 54 – 50
Average wage within the following categories4:Second 25 percent ............................................... – 50 49 – 50Third 25 percent ................................................... – 44 55 1 50Highest 25 percent ............................................... – 49 51 3( ) 50
Highest 10 percent ........................................... – 52 48 3( ) 50
Establishment characteristics
Goods-producing industries ..................................... – 48 52 – 50Manufacturing ...................................................... – 49 51 – 50
Service-providing industries ..................................... – 47 52 – 50Trade, transportation, and utilities ....................... – 59 41 3( ) 50
Wholesale trade ............................................... – 48 50 1 50Retail trade ...................................................... – 67 33 – –Transportation and warehousing ..................... – 64 36 – 50Utilities ............................................................. – 34 66 – 100
Information ........................................................... – 71 29 – 50Financial activities ................................................ – 48 52 – 50
Finance and insurance .................................... – 50 50 – 50Credit intermediation and related activities .. – 45 55 – 50Insurance carriers and related activities ...... – 54 46 – 50
Professional and business services:Professional and technical services ............... – 30 70 – 50
Education and health services ............................. – 42 58 3( ) 50Educational services ........................................ – 48 51 1 50
Junior colleges, colleges, and universities ... – 45 54 3( ) 50Health care and social assistance ................... – 41 59 – 50
Leisure and hospitality ......................................... – 49 47 – –
See footnotes at end of table.
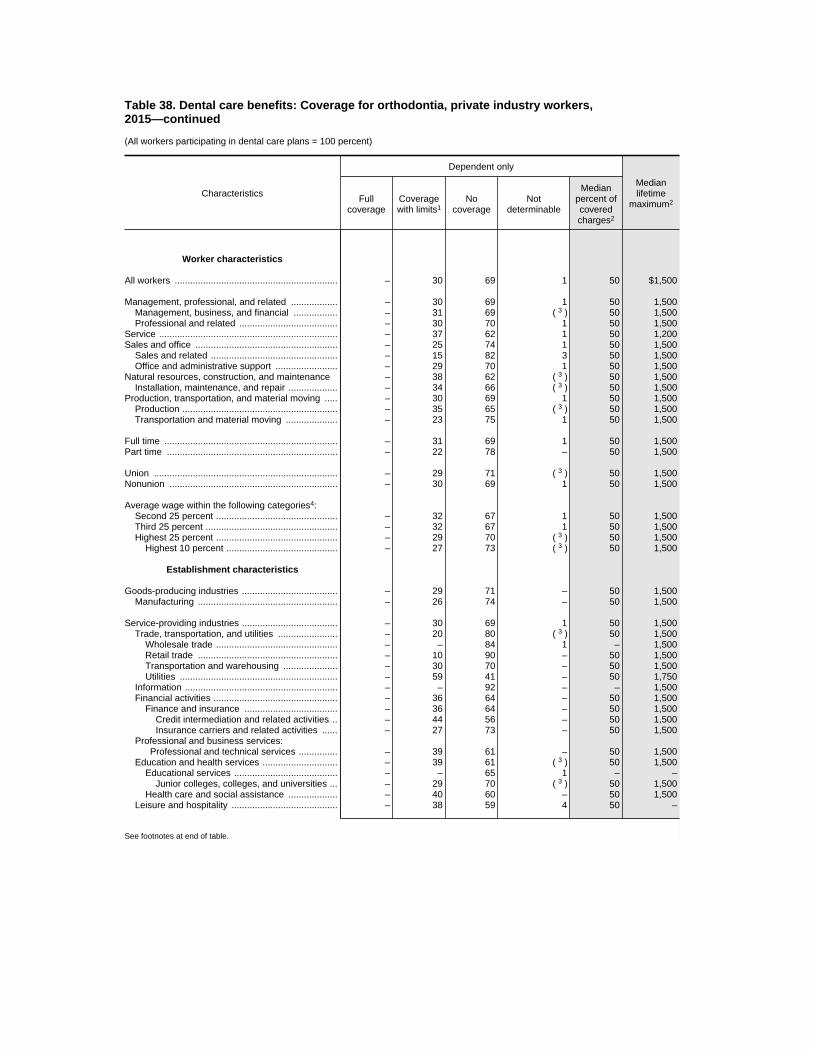
Table 38. Dental care benefits: Coverage for orthodontia, private industry workers,2015—continued
(All workers participating in dental care plans = 100 percent)
Characteristics
Dependent only
Medianlifetime
maximum2Fullcoverage
Coveragewith limits1
Nocoverage
Notdeterminable
Medianpercent ofcoveredcharges2
Worker characteristics
All workers ............................................................... – 30 69 1 50 $1,500
Management, professional, and related .................. – 30 69 1 50 1,500Management, business, and financial ................. – 31 69 3( ) 50 1,500Professional and related ...................................... – 30 70 1 50 1,500
Service ..................................................................... – 37 62 1 50 1,200Sales and office ....................................................... – 25 74 1 50 1,500
Sales and related ................................................. – 15 82 3 50 1,500Office and administrative support ........................ – 29 70 1 50 1,500
Natural resources, construction, and maintenance – 38 62 3( ) 50 1,500Installation, maintenance, and repair ................... – 34 66 3( ) 50 1,500
Production, transportation, and material moving ..... – 30 69 1 50 1,500Production ............................................................ – 35 65 3( ) 50 1,500Transportation and material moving .................... – 23 75 1 50 1,500
Full time ................................................................... – 31 69 1 50 1,500Part time .................................................................. – 22 78 – 50 1,500
Union ....................................................................... – 29 71 3( ) 50 1,500Nonunion ................................................................. – 30 69 1 50 1,500
Average wage within the following categories4:Second 25 percent ............................................... – 32 67 1 50 1,500Third 25 percent ................................................... – 32 67 1 50 1,500Highest 25 percent ............................................... – 29 70 3( ) 50 1,500
Highest 10 percent ........................................... – 27 73 3( ) 50 1,500
Establishment characteristics
Goods-producing industries ..................................... – 29 71 – 50 1,500Manufacturing ...................................................... – 26 74 – 50 1,500
Service-providing industries ..................................... – 30 69 1 50 1,500Trade, transportation, and utilities ....................... – 20 80 3( ) 50 1,500
Wholesale trade ............................................... – – 84 1 – 1,500Retail trade ...................................................... – 10 90 – 50 1,500Transportation and warehousing ..................... – 30 70 – 50 1,500Utilities ............................................................. – 59 41 – 50 1,750
Information ........................................................... – – 92 – – 1,500Financial activities ................................................ – 36 64 – 50 1,500
Finance and insurance .................................... – 36 64 – 50 1,500Credit intermediation and related activities .. – 44 56 – 50 1,500Insurance carriers and related activities ...... – 27 73 – 50 1,500
Professional and business services:Professional and technical services ............... – 39 61 – 50 1,500
Education and health services ............................. – 39 61 3( ) 50 1,500Educational services ........................................ – – 65 1 – –
Junior colleges, colleges, and universities ... – 29 70 3( ) 50 1,500Health care and social assistance ................... – 40 60 – 50 1,500
Leisure and hospitality ......................................... – 38 59 4 50 –
See footnotes at end of table.
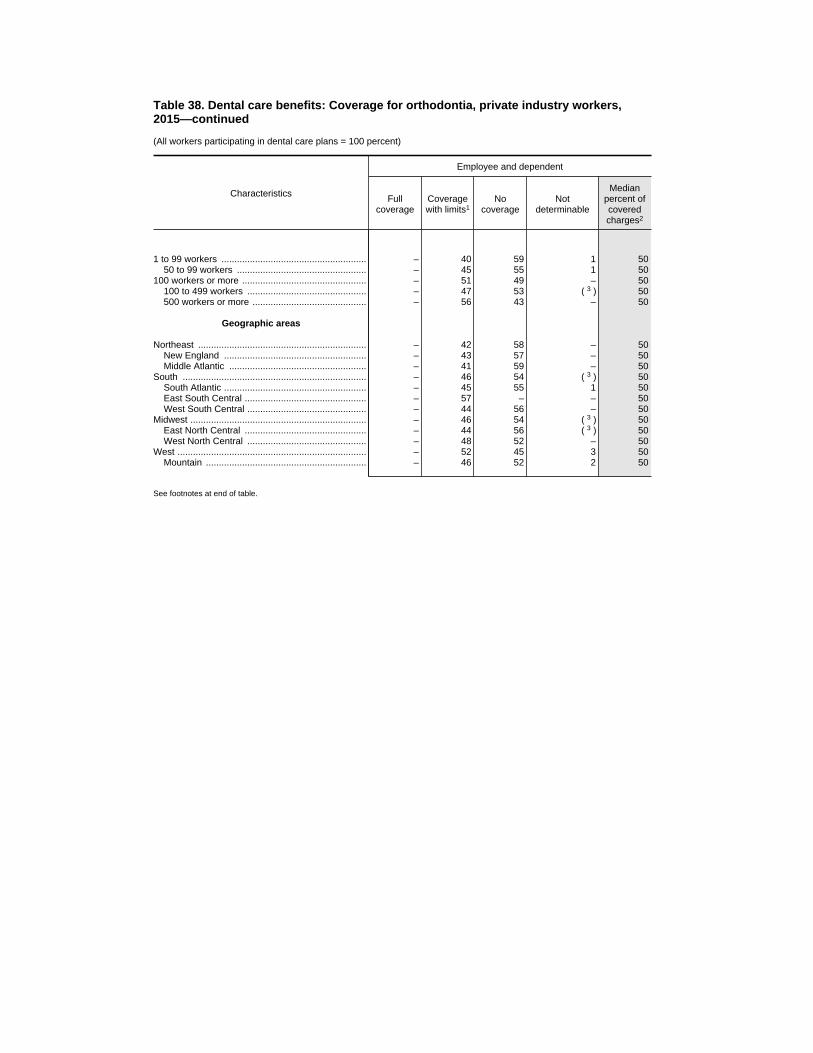
Table 38. Dental care benefits: Coverage for orthodontia, private industry workers,2015—continued
(All workers participating in dental care plans = 100 percent)
Characteristics
Employee and dependent
Fullcoverage
Coveragewith limits1
Nocoverage
Notdeterminable
Medianpercent ofcoveredcharges2
1 to 99 workers ........................................................ – 40 59 1 5050 to 99 workers .................................................. – 45 55 1 50
100 workers or more ................................................ – 51 49 – 50100 to 499 workers .............................................. – 47 53 3( ) 50500 workers or more ............................................ – 56 43 – 50
Geographic areas
Northeast ................................................................. – 42 58 – 50New England ....................................................... – 43 57 – 50Middle Atlantic ..................................................... – 41 59 – 50
South ....................................................................... – 46 54 3( ) 50South Atlantic ....................................................... – 45 55 1 50East South Central ............................................... – 57 – – 50West South Central .............................................. – 44 56 – 50
Midwest .................................................................... – 46 54 3( ) 50East North Central ............................................... – 44 56 3( ) 50West North Central .............................................. – 48 52 – 50
West ......................................................................... – 52 45 3 50Mountain .............................................................. – 46 52 2 50
See footnotes at end of table.
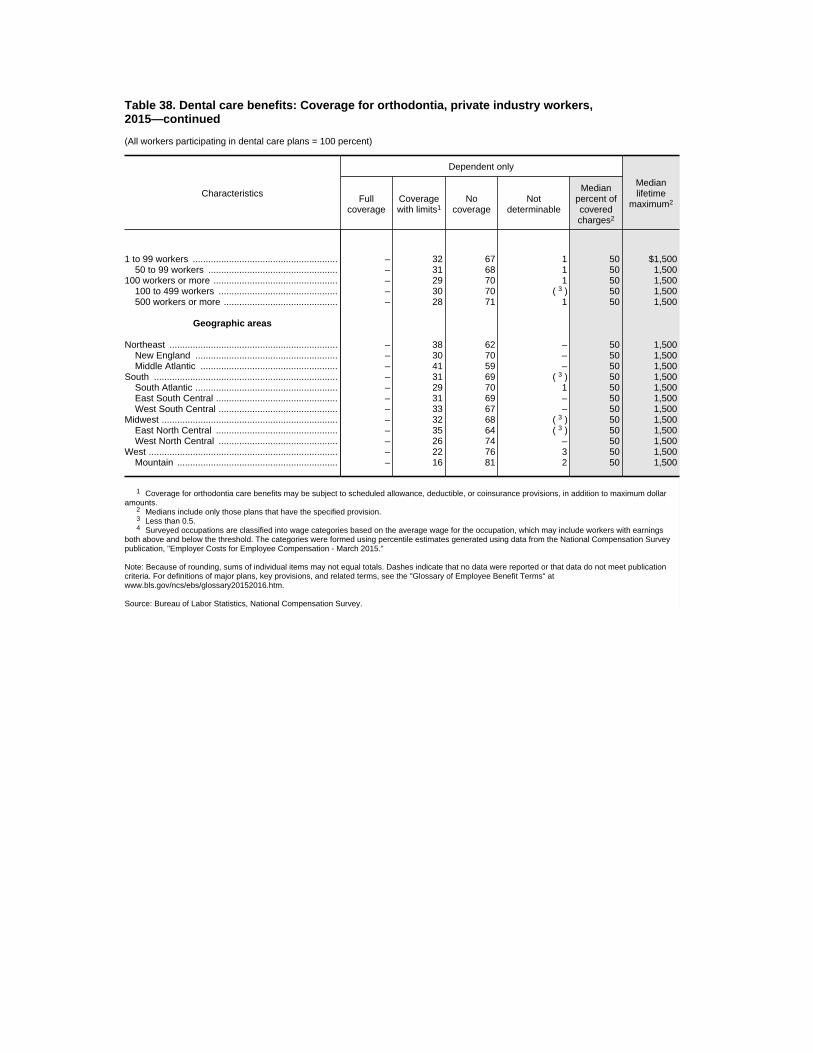
Table 38. Dental care benefits: Coverage for orthodontia, private industry workers,2015—continued
(All workers participating in dental care plans = 100 percent)
Characteristics
Dependent only
Medianlifetime
maximum2Fullcoverage
Coveragewith limits1
Nocoverage
Notdeterminable
Medianpercent ofcoveredcharges2
1 to 99 workers ........................................................ – 32 67 1 50 $1,50050 to 99 workers .................................................. – 31 68 1 50 1,500
100 workers or more ................................................ – 29 70 1 50 1,500100 to 499 workers .............................................. – 30 70 3( ) 50 1,500500 workers or more ............................................ – 28 71 1 50 1,500
Geographic areas
Northeast ................................................................. – 38 62 – 50 1,500New England ....................................................... – 30 70 – 50 1,500Middle Atlantic ..................................................... – 41 59 – 50 1,500
South ....................................................................... – 31 69 3( ) 50 1,500South Atlantic ....................................................... – 29 70 1 50 1,500East South Central ............................................... – 31 69 – 50 1,500West South Central .............................................. – 33 67 – 50 1,500
Midwest .................................................................... – 32 68 3( ) 50 1,500East North Central ............................................... – 35 64 3( ) 50 1,500West North Central .............................................. – 26 74 – 50 1,500
West ......................................................................... – 22 76 3 50 1,500Mountain .............................................................. – 16 81 2 50 1,500
1 Coverage for orthodontia care benefits may be subject to scheduled allowance, deductible, or coinsurance provisions, in addition to maximum dollaramounts.
2 Medians include only those plans that have the specified provision.3 Less than 0.5.4 Surveyed occupations are classified into wage categories based on the average wage for the occupation, which may include workers with earnings
both above and below the threshold. The categories were formed using percentile estimates generated using data from the National Compensation Surveypublication, "Employer Costs for Employee Compensation - March 2015."
Note: Because of rounding, sums of individual items may not equal totals. Dashes indicate that no data were reported or that data do not meet publicationcriteria. For definitions of major plans, key provisions, and related terms, see the "Glossary of Employee Benefit Terms" atwww.bls.gov/ncs/ebs/glossary20152016.htm.
Source: Bureau of Labor Statistics, National Compensation Survey.

Table 38. Standard errors for dental care benefits: Coverage for orthodontia, privateindustry workers, 2015
Characteristics
Employee and dependent
Fullcoverage
Coveragewith limits1
Nocoverage
Notdeterminable
Medianpercent ofcoveredcharges2
Worker characteristics
All workers ............................................................... – 1.9 1.9 – 0.0
Management, professional, and related .................. – 2.5 2.5 0.4 0.0Management, business, and financial ................. – 3.2 3.2 0.4 0.0Professional and related ...................................... – 3.7 3.8 0.5 0.0
Service ..................................................................... – 4.7 4.9 – 0.0Sales and office ....................................................... – 2.7 2.8 – 0.0
Sales and related ................................................. – 4.9 4.9 1.7 0.0Office and administrative support ........................ – 2.9 3.0 – 0.0
Natural resources, construction, and maintenance – 4.3 4.3 0.2 0.0Installation, maintenance, and repair ................... – 5.0 4.9 0.4 0.0
Production, transportation, and material moving ..... – 3.5 3.5 0.5 0.0Production ............................................................ – 4.2 4.2 0.2 0.0Transportation and material moving .................... – 5.4 5.4 1.3 0.0
Full time ................................................................... – 1.9 2.0 – 0.0Part time .................................................................. – 7.9 7.9 – 0.0
Union ....................................................................... – 3.9 3.9 0.2 0.0Nonunion ................................................................. – 2.0 2.0 – 0.0
Average wage within the following categories3:Second 25 percent ............................................... – 3.5 3.5 – 0.0Third 25 percent ................................................... – 2.2 2.2 0.4 0.0Highest 25 percent ............................................... – 2.4 2.4 0.2 0.0
Highest 10 percent ........................................... – 3.5 3.5 4( ) 0.0
Establishment characteristics
Goods-producing industries ..................................... – 3.2 3.2 – 0.0Manufacturing ...................................................... – 3.4 3.4 – 0.0
Service-providing industries ..................................... – 2.3 2.3 – 0.0Trade, transportation, and utilities ....................... – 3.3 3.4 0.1 3.2
Wholesale trade ............................................... – 4.7 4.7 0.3 9.0Retail trade ...................................................... – 3.1 3.1 – –Transportation and warehousing ..................... – 9.5 9.5 – 1.8Utilities ............................................................. – 7.2 7.2 – 27.4
Information ........................................................... – 5.6 5.6 – 0.0Financial activities ................................................ – 2.2 2.2 – 0.0
Finance and insurance .................................... – 1.9 1.9 – 0.0Credit intermediation and related activities .. – 3.0 3.0 – 0.0Insurance carriers and related activities ...... – 3.0 3.0 – 0.0
Professional and business services:Professional and technical services ............... – 7.9 7.9 – 0.0
Education and health services ............................. – 5.9 5.9 0.1 0.0Educational services ........................................ – 9.2 9.3 0.6 0.0
Junior colleges, colleges, and universities ... – 3.9 3.8 0.4 0.0Health care and social assistance ................... – 6.7 6.7 – 0.0
Leisure and hospitality ......................................... – 6.7 7.7 – –
See footnotes at end of table.
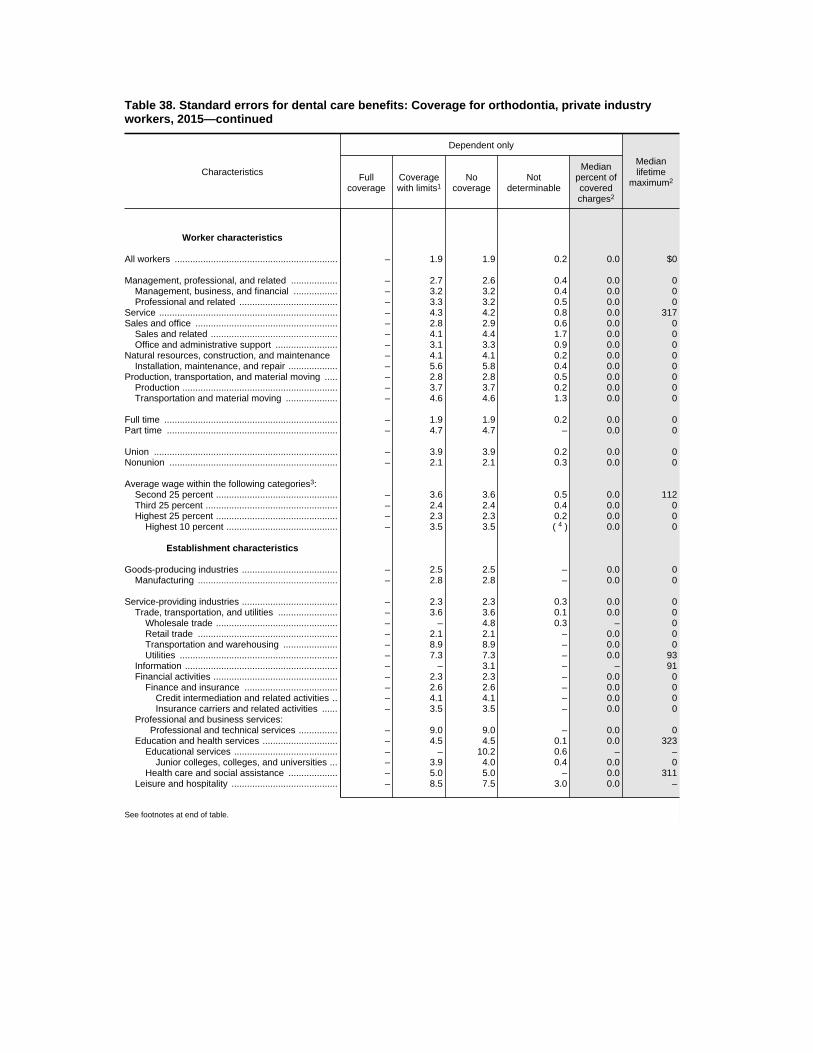
Table 38. Standard errors for dental care benefits: Coverage for orthodontia, private industryworkers, 2015—continued
Characteristics
Dependent only
Medianlifetime
maximum2Fullcoverage
Coveragewith limits1
Nocoverage
Notdeterminable
Medianpercent ofcoveredcharges2
Worker characteristics
All workers ............................................................... – 1.9 1.9 0.2 0.0 $0
Management, professional, and related .................. – 2.7 2.6 0.4 0.0 0Management, business, and financial ................. – 3.2 3.2 0.4 0.0 0Professional and related ...................................... – 3.3 3.2 0.5 0.0 0
Service ..................................................................... – 4.3 4.2 0.8 0.0 317Sales and office ....................................................... – 2.8 2.9 0.6 0.0 0
Sales and related ................................................. – 4.1 4.4 1.7 0.0 0Office and administrative support ........................ – 3.1 3.3 0.9 0.0 0
Natural resources, construction, and maintenance – 4.1 4.1 0.2 0.0 0Installation, maintenance, and repair ................... – 5.6 5.8 0.4 0.0 0
Production, transportation, and material moving ..... – 2.8 2.8 0.5 0.0 0Production ............................................................ – 3.7 3.7 0.2 0.0 0Transportation and material moving .................... – 4.6 4.6 1.3 0.0 0
Full time ................................................................... – 1.9 1.9 0.2 0.0 0Part time .................................................................. – 4.7 4.7 – 0.0 0
Union ....................................................................... – 3.9 3.9 0.2 0.0 0Nonunion ................................................................. – 2.1 2.1 0.3 0.0 0
Average wage within the following categories3:Second 25 percent ............................................... – 3.6 3.6 0.5 0.0 112Third 25 percent ................................................... – 2.4 2.4 0.4 0.0 0Highest 25 percent ............................................... – 2.3 2.3 0.2 0.0 0
Highest 10 percent ........................................... – 3.5 3.5 4( ) 0.0 0
Establishment characteristics
Goods-producing industries ..................................... – 2.5 2.5 – 0.0 0Manufacturing ...................................................... – 2.8 2.8 – 0.0 0
Service-providing industries ..................................... – 2.3 2.3 0.3 0.0 0Trade, transportation, and utilities ....................... – 3.6 3.6 0.1 0.0 0
Wholesale trade ............................................... – – 4.8 0.3 – 0Retail trade ...................................................... – 2.1 2.1 – 0.0 0Transportation and warehousing ..................... – 8.9 8.9 – 0.0 0Utilities ............................................................. – 7.3 7.3 – 0.0 93
Information ........................................................... – – 3.1 – – 91Financial activities ................................................ – 2.3 2.3 – 0.0 0
Finance and insurance .................................... – 2.6 2.6 – 0.0 0Credit intermediation and related activities .. – 4.1 4.1 – 0.0 0Insurance carriers and related activities ...... – 3.5 3.5 – 0.0 0
Professional and business services:Professional and technical services ............... – 9.0 9.0 – 0.0 0
Education and health services ............................. – 4.5 4.5 0.1 0.0 323Educational services ........................................ – – 10.2 0.6 – –
Junior colleges, colleges, and universities ... – 3.9 4.0 0.4 0.0 0Health care and social assistance ................... – 5.0 5.0 – 0.0 311
Leisure and hospitality ......................................... – 8.5 7.5 3.0 0.0 –
See footnotes at end of table.

Table 38. Standard errors for dental care benefits: Coverage for orthodontia, privateindustry workers, 2015—continued
Characteristics
Employee and dependent
Fullcoverage
Coveragewith limits1
Nocoverage
Notdeterminable
Medianpercent ofcoveredcharges2
1 to 99 workers ........................................................ – 3.4 3.6 0.9 0.050 to 99 workers .................................................. – 5.9 6.1 0.5 0.0
100 workers or more ................................................ – 2.2 2.2 – 0.0100 to 499 workers .............................................. – 3.3 3.3 0.3 0.0500 workers or more ............................................ – 2.5 2.6 – 0.0
Geographic areas
Northeast ................................................................. – 4.5 4.4 – 0.0New England ....................................................... – 5.0 5.0 – 0.0Middle Atlantic ..................................................... – 5.4 5.3 – 0.0
South ....................................................................... – 3.2 3.2 0.3 0.0South Atlantic ....................................................... – 4.1 4.2 0.6 0.0East South Central ............................................... – 13.6 – – 0.0West South Central .............................................. – 3.6 3.6 – 0.0
Midwest .................................................................... – 3.3 3.3 0.1 0.0East North Central ............................................... – 4.6 4.5 0.1 0.0West North Central .............................................. – 4.5 4.5 – 0.0
West ......................................................................... – 4.5 4.6 0.8 0.0Mountain .............................................................. – 6.3 6.7 1.2 0.0
See footnotes at end of table.

Table 38. Standard errors for dental care benefits: Coverage for orthodontia, private industryworkers, 2015—continued
Characteristics
Dependent only
Medianlifetime
maximum2Fullcoverage
Coveragewith limits1
Nocoverage
Notdeterminable
Medianpercent ofcoveredcharges2
1 to 99 workers ........................................................ – 3.3 3.2 0.9 0.0 $050 to 99 workers .................................................. – 6.4 6.3 0.5 0.0 77
100 workers or more ................................................ – 2.1 2.0 0.3 0.0 0100 to 499 workers .............................................. – 3.2 3.2 0.3 0.0 0500 workers or more ............................................ – 2.7 2.6 0.6 0.0 0
Geographic areas
Northeast ................................................................. – 5.6 5.6 – 0.0 0New England ....................................................... – 6.5 6.5 – 0.0 0Middle Atlantic ..................................................... – 6.7 6.7 – 0.0 0
South ....................................................................... – 3.7 3.6 0.3 0.0 0South Atlantic ....................................................... – 4.8 4.7 0.6 0.0 0East South Central ............................................... – 7.7 7.7 – 0.0 0West South Central .............................................. – 7.8 7.8 – 0.0 0
Midwest .................................................................... – 3.1 3.1 0.1 0.0 0East North Central ............................................... – 4.5 4.6 0.1 0.0 0West North Central .............................................. – 2.8 2.8 – 0.0 0
West ......................................................................... – 2.9 2.9 0.8 0.0 0Mountain .............................................................. – 4.4 4.4 1.2 0.0 0
1 Coverage for orthodontia care benefits may be subject to scheduled allowance, deductible, or coinsurance provisions, in addition to maximum dollaramounts.
2
Note: Medians include only those plans that have specified provision3 Surveyed occupations are classified into wage categories based on the average wage for the occupation, which may include workers with earnings
both above and below the threshold. The categories were formed using percentile estimates generated using data from the National Compensation Surveypublication, "Employer Costs for Employee Compensation - March 2015."
4 Less than 0.05.
Note: Dashes indicate that no data were reported or that data do not meet publication criteria. For definitions of major plans, key provisions, and relatedterms, see the "Glossary of Employee Benefit Terms" at www.bls.gov/ncs/ebs/glossary20152016.htm.
Source: Bureau of Labor Statistics, National Compensation Survey.

Table 39. Dental care benefits: Median percent of covered chargespaid by plan for selected services, private industry workers, 2015
(Includes all workers participating in dental care plans)
Characteristics Preventiveservices1
Basicservices2
Majorservices3
Worker characteristics
All workers ............................................................... 100 80 50
Management, professional, and related .................. 100 80 50Management, business, and financial ................. 100 80 50Professional and related ...................................... 100 80 50
Service ..................................................................... 100 80 50Sales and office ....................................................... 100 80 50
Sales and related ................................................. 100 80 50Office and administrative support ........................ 100 80 50
Natural resources, construction, and maintenance 100 80 50Installation, maintenance, and repair ................... 100 80 50
Production, transportation, and material moving ..... 100 80 50Production ............................................................ 100 80 50Transportation and material moving .................... – 80 60
Full time ................................................................... 100 80 50Part time .................................................................. 100 80 50
Union ....................................................................... 100 80 50Nonunion ................................................................. 100 80 50
Average wage within the following categories4:Second 25 percent ............................................... 100 80 50Third 25 percent ................................................... 100 80 50Highest 25 percent ............................................... 100 80 50
Highest 10 percent ........................................... 100 80 50
Establishment characteristics
Goods-producing industries ..................................... 100 80 50Manufacturing ...................................................... 100 80 50
Service-providing industries ..................................... 100 80 50Trade, transportation, and utilities ....................... 100 80 50
Wholesale trade ............................................... 100 80 50Retail trade ...................................................... 100 80 50Transportation and warehousing ..................... – 80 60Utilities ............................................................. 100 80 60
Information ........................................................... 100 80 50Financial activities ................................................ 100 80 50
Finance and insurance .................................... 100 80 50Credit intermediation and related activities .. 100 80 50Insurance carriers and related activities ...... 100 80 50
Professional and business services:Professional and technical services ............... 100 80 50
Education and health services ............................. 100 80 50Educational services ........................................ 100 80 50
Junior colleges, colleges, and universities ... 100 80 50Health care and social assistance ................... 100 80 50
Leisure and hospitality ......................................... 100 80 50
See footnotes at end of table.

Table 39. Dental care benefits: Median percent of covered chargespaid by plan for selected services, private industry workers,2015—continued
(Includes all workers participating in dental care plans)
Characteristics Preventiveservices1
Basicservices2
Majorservices3
1 to 99 workers ........................................................ 100 80 5050 to 99 workers .................................................. 100 80 50
100 workers or more ................................................ 100 80 50100 to 499 workers .............................................. 100 80 50500 workers or more ............................................ 100 80 50
Geographic areas
Northeast ................................................................. 100 80 50New England ....................................................... 100 80 50Middle Atlantic ..................................................... 100 80 50
South ....................................................................... 100 80 50South Atlantic ....................................................... 100 80 50East South Central ............................................... 100 80 50West South Central .............................................. 100 80 50
Midwest .................................................................... 100 80 50East North Central ............................................... 100 80 50West North Central .............................................. 100 80 50
West ......................................................................... 100 80 50Mountain .............................................................. 100 80 50
1 Preventive services include routine exams, cleanings, and x-rays, and other preventive care. 2 Basic services include fillings, dental surgery, periodontal care (treatment for gum disease), and
endodontics (root canal therapy). 3 Major services include procedures such as crowns and prosthetics (replacement of missing teeth with
bridgework or dentures).4 Surveyed occupations are classified into wage categories based on the average wage for the occupation,
which may include workers with earnings both above and below the threshold. The categories were formed usingpercentile estimates generated using data from the National Compensation Survey publication, "Employer Costsfor Employee Compensation - March 2015."
Note: For definitions of major plans, key provisions, and related terms, see the "Glossary of Employee BenefitTerms" at www.bls.gov/ncs/ebs/glossary20152016.htm.
Source: Bureau of Labor Statistics, National Compensation Survey.
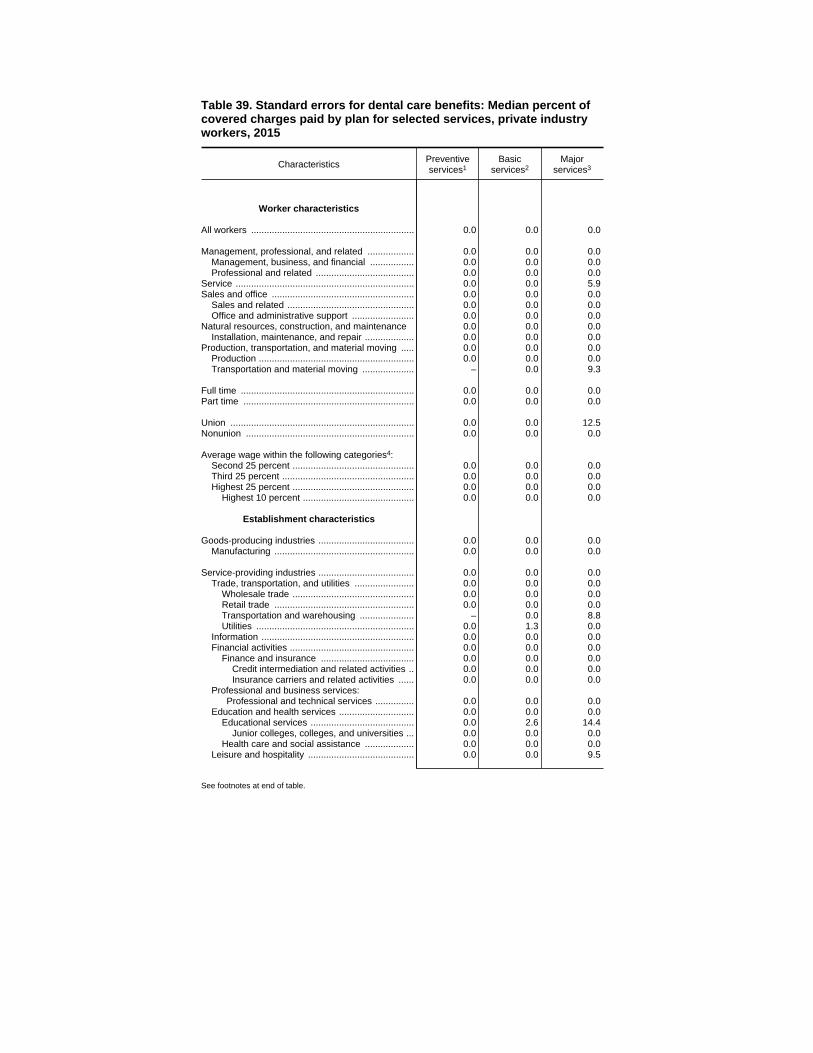
Table 39. Standard errors for dental care benefits: Median percent ofcovered charges paid by plan for selected services, private industryworkers, 2015
Characteristics Preventiveservices1
Basicservices2
Majorservices3
Worker characteristics
All workers ............................................................... 0.0 0.0 0.0
Management, professional, and related .................. 0.0 0.0 0.0Management, business, and financial ................. 0.0 0.0 0.0Professional and related ...................................... 0.0 0.0 0.0
Service ..................................................................... 0.0 0.0 5.9Sales and office ....................................................... 0.0 0.0 0.0
Sales and related ................................................. 0.0 0.0 0.0Office and administrative support ........................ 0.0 0.0 0.0
Natural resources, construction, and maintenance 0.0 0.0 0.0Installation, maintenance, and repair ................... 0.0 0.0 0.0
Production, transportation, and material moving ..... 0.0 0.0 0.0Production ............................................................ 0.0 0.0 0.0Transportation and material moving .................... – 0.0 9.3
Full time ................................................................... 0.0 0.0 0.0Part time .................................................................. 0.0 0.0 0.0
Union ....................................................................... 0.0 0.0 12.5Nonunion ................................................................. 0.0 0.0 0.0
Average wage within the following categories4:Second 25 percent ............................................... 0.0 0.0 0.0Third 25 percent ................................................... 0.0 0.0 0.0Highest 25 percent ............................................... 0.0 0.0 0.0
Highest 10 percent ........................................... 0.0 0.0 0.0
Establishment characteristics
Goods-producing industries ..................................... 0.0 0.0 0.0Manufacturing ...................................................... 0.0 0.0 0.0
Service-providing industries ..................................... 0.0 0.0 0.0Trade, transportation, and utilities ....................... 0.0 0.0 0.0
Wholesale trade ............................................... 0.0 0.0 0.0Retail trade ...................................................... 0.0 0.0 0.0Transportation and warehousing ..................... – 0.0 8.8Utilities ............................................................. 0.0 1.3 0.0
Information ........................................................... 0.0 0.0 0.0Financial activities ................................................ 0.0 0.0 0.0
Finance and insurance .................................... 0.0 0.0 0.0Credit intermediation and related activities .. 0.0 0.0 0.0Insurance carriers and related activities ...... 0.0 0.0 0.0
Professional and business services:Professional and technical services ............... 0.0 0.0 0.0
Education and health services ............................. 0.0 0.0 0.0Educational services ........................................ 0.0 2.6 14.4
Junior colleges, colleges, and universities ... 0.0 0.0 0.0Health care and social assistance ................... 0.0 0.0 0.0
Leisure and hospitality ......................................... 0.0 0.0 9.5
See footnotes at end of table.
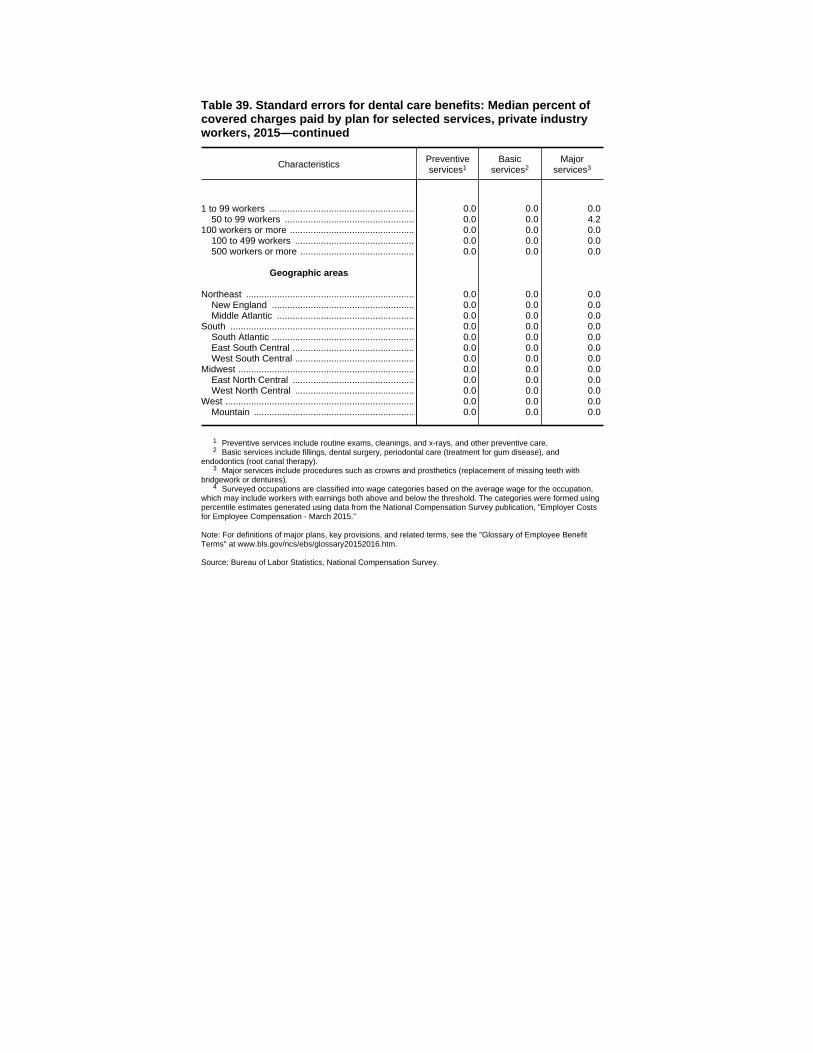
Table 39. Standard errors for dental care benefits: Median percent ofcovered charges paid by plan for selected services, private industryworkers, 2015—continued
Characteristics Preventiveservices1
Basicservices2
Majorservices3
1 to 99 workers ........................................................ 0.0 0.0 0.050 to 99 workers .................................................. 0.0 0.0 4.2
100 workers or more ................................................ 0.0 0.0 0.0100 to 499 workers .............................................. 0.0 0.0 0.0500 workers or more ............................................ 0.0 0.0 0.0
Geographic areas
Northeast ................................................................. 0.0 0.0 0.0New England ....................................................... 0.0 0.0 0.0Middle Atlantic ..................................................... 0.0 0.0 0.0
South ....................................................................... 0.0 0.0 0.0South Atlantic ....................................................... 0.0 0.0 0.0East South Central ............................................... 0.0 0.0 0.0West South Central .............................................. 0.0 0.0 0.0
Midwest .................................................................... 0.0 0.0 0.0East North Central ............................................... 0.0 0.0 0.0West North Central .............................................. 0.0 0.0 0.0
West ......................................................................... 0.0 0.0 0.0Mountain .............................................................. 0.0 0.0 0.0
1 Preventive services include routine exams, cleanings, and x-rays, and other preventive care. 2 Basic services include fillings, dental surgery, periodontal care (treatment for gum disease), and
endodontics (root canal therapy). 3 Major services include procedures such as crowns and prosthetics (replacement of missing teeth with
bridgework or dentures).4 Surveyed occupations are classified into wage categories based on the average wage for the occupation,
which may include workers with earnings both above and below the threshold. The categories were formed usingpercentile estimates generated using data from the National Compensation Survey publication, "Employer Costsfor Employee Compensation - March 2015."
Note: For definitions of major plans, key provisions, and related terms, see the "Glossary of Employee BenefitTerms" at www.bls.gov/ncs/ebs/glossary20152016.htm.
Source: Bureau of Labor Statistics, National Compensation Survey.

Table 40. Dental care benefits: Amount of annual individual deductible,1 private industry workers, 2015
(All workers participating in dental care plans = 100 percent)
CharacteristicsWith annualindividualdeductible
Amount of annual individual deductible With noannual
individualdeductible
Notdeterminable10th
percentile25th
percentile
50thpercentile(median)
75thpercentile
90thpercentile
Worker characteristics
All workers ............................................................... 77 $25 $50 $50 $50 – 22 1
Management, professional, and related .................. 81 25 50 50 50 $50 18 2( )Management, business, and financial ................. 81 25 50 50 50 50 19 2( )Professional and related ...................................... 81 25 – 50 50 50 18 1
Service ..................................................................... 68 25 50 50 50 100 27 5Sales and office ....................................................... 79 25 50 50 50 75 20 1
Sales and related ................................................. 76 – 50 50 – 75 – –Office and administrative support ........................ 80 25 50 50 50 60 20 2( )
Natural resources, construction, and maintenance 69 25 50 50 50 – 31 –Installation, maintenance, and repair ................... 72 25 50 50 50 75 28 –
Production, transportation, and material moving ..... 75 25 50 50 50 – 24 2( )Production ............................................................ 82 25 50 50 50 50 17 1Transportation and material moving .................... 67 – 50 50 50 75 33 –
Full time ................................................................... 78 25 50 50 50 – 21 1Part time .................................................................. 65 25 – 50 50 – 33 2
Union ....................................................................... 62 25 – 50 50 – 36 2Nonunion ................................................................. 80 25 50 50 50 – 19 1
Average wage within the following categories3:Lowest 25 percent ............................................... – – – – – – – 5
Lowest 10 percent ........................................... – – – – – – – 3Second 25 percent ............................................... 78 25 50 50 50 75 21 2Third 25 percent ................................................... 76 25 50 50 50 50 24 2( )Highest 25 percent ............................................... 79 25 50 50 50 50 21 2( )
Highest 10 percent ........................................... 79 25 50 50 50 50 20 1
Establishment characteristics
Goods-producing industries ..................................... 84 25 50 50 50 50 16 –Manufacturing ...................................................... 86 – 50 50 50 50 14 –
Service-providing industries ..................................... 75 25 50 50 50 75 23 1Trade, transportation, and utilities ....................... 76 – 50 50 60 75 22 2
Wholesale trade ............................................... 86 – 50 50 50 50 14 1Retail trade ...................................................... 82 – 50 50 75 75 13 5Transportation and warehousing ..................... 58 – 50 50 50 75 42 –Utilities ............................................................. 91 25 25 50 50 150 – –
Information ........................................................... 87 25 50 50 50 50 – –Financial activities ................................................ 83 – 50 50 50 50 17 2( )
Finance and insurance .................................... 85 25 50 50 50 50 14 1Credit intermediation and related activities .. 81 50 50 50 50 50 19 –Insurance carriers and related activities ...... 90 25 50 50 50 50 9 1
Professional and business services:Professional and technical services ............... 72 25 – 50 50 50 – –
Education and health services ............................. 74 25 – 50 50 50 23 3Educational services ........................................ 74 – 50 50 50 50 26 –
Junior colleges, colleges, and universities ... 72 25 50 50 50 50 28 –Health care and social assistance ................... 74 25 – 50 50 50 22 4
Leisure and hospitality ......................................... 68 – 50 50 100 100 32 –
See footnotes at end of table.

Table 40. Dental care benefits: Amount of annual individual deductible,1 private industry workers, 2015—continued
(All workers participating in dental care plans = 100 percent)
CharacteristicsWith annualindividualdeductible
Amount of annual individual deductible With noannual
individualdeductible
Notdeterminable10th
percentile25th
percentile
50thpercentile(median)
75thpercentile
90thpercentile
1 to 99 workers ........................................................ 77 $25 – $50 $50 $50 22 11 to 49 workers .................................................... – – – – – – – 150 to 99 workers .................................................. 74 25 $50 50 50 50 26 1
100 workers or more ................................................ 78 25 50 50 50 75 21 1100 to 499 workers .............................................. 81 – 50 50 50 75 18 2500 workers or more ............................................ 74 25 50 50 50 75 25 1
Geographic areas
Northeast ................................................................. 75 25 – 50 50 75 23 2New England ....................................................... 83 25 50 50 50 – – –Middle Atlantic ..................................................... 73 25 – 50 50 75 25 2
South ....................................................................... 78 25 50 50 50 50 21 1South Atlantic ....................................................... 80 25 50 50 50 50 19 1East South Central ............................................... 68 – 50 50 50 75 32 –West South Central .............................................. 80 – 50 50 50 50 – –
Midwest .................................................................... 82 25 50 50 50 75 18 2( )East North Central ............................................... 77 25 50 50 50 75 23 2( )West North Central .............................................. 91 25 50 50 50 – 9 1
West ......................................................................... 73 25 50 50 50 50 25 2Mountain .............................................................. 80 – 50 50 50 100 19 1Pacific .................................................................. – – – – – – – 3
1 Amount of deductible excludes separate deductibles for orthodontic procedures. A deductible may not apply to all covered dental procedures. If separate deductibles apply to differentprocedures, the sum of the deductible amounts are tabulated.
2 Less than 0.5.3 Surveyed occupations are classified into wage categories based on the average wage for the occupation, which may include workers with earnings both above and below the threshold. The
categories were formed using percentile estimates generated using data from the National Compensation Survey publication, "Employer Costs for Employee Compensation - March 2015."
Note: Because of rounding, sums of individual items may not equal totals. Dashes indicate that no data were reported or that data do not meet publication criteria. For definitions of major plans,key provisions, and related terms, see the "Glossary of Employee Benefit Terms" at www.bls.gov/ncs/ebs/glossary20152016.htm.

Table 40. Standard errors for dental care benefits: Amount of annual individual deductible,1 private industry workers,2015
CharacteristicsWith annualindividualdeductible
Amount of annual individual deductible With noannual
individualdeductible
Notdeterminable10th
percentile25th
percentile
50thpercentile(median)
75thpercentile
90thpercentile
Worker characteristics
All workers ............................................................... 1.6 $0 $0 $0 $0 – 1.4 0.4
Management, professional, and related .................. 1.9 0 0 0 0 $0 1.8 0.2Management, business, and financial ................. 3.1 0 0 0 0 0 3.1 0.3Professional and related ...................................... 2.2 0 – 0 0 0 2.1 0.3
Service ..................................................................... 6.3 0 13 0 0 0 4.9 2.4Sales and office ....................................................... 2.6 3 0 0 0 0 2.6 0.4
Sales and related ................................................. 6.3 – 0 0 – 0 – –Office and administrative support ........................ 2.6 1 0 0 0 14 2.5 0.3
Natural resources, construction, and maintenance 4.1 0 2 0 0 – 4.1 –Installation, maintenance, and repair ................... 4.6 1 0 0 0 6 4.6 –
Production, transportation, and material moving ..... 4.0 0 0 0 0 – 4.1 0.2Production ............................................................ 4.6 2 0 0 0 0 4.5 0.4Transportation and material moving .................... 6.5 – 0 0 0 0 6.5 –
Full time ................................................................... 1.6 0 0 0 0 – 1.4 0.4Part time .................................................................. 5.9 0 – 5 5 – 5.8 1.3
Union ....................................................................... 4.1 0 – 0 0 – 4.0 1.1Nonunion ................................................................. 1.7 0 0 0 0 – 1.5 0.4
Average wage within the following categories2:Lowest 25 percent ............................................... – – – – – – – 2.7
Lowest 10 percent ........................................... – – – – – – – 2.8Second 25 percent ............................................... 2.8 0 0 0 0 0 2.8 0.5Third 25 percent ................................................... 2.3 0 0 0 0 5 2.3 0.2Highest 25 percent ............................................... 2.1 0 0 0 0 0 2.0 0.2
Highest 10 percent ........................................... 3.4 0 0 0 0 0 3.4 0.4
Establishment characteristics
Goods-producing industries ..................................... 2.7 0 0 0 0 8 2.7 –Manufacturing ...................................................... 2.6 – 0 0 0 10 2.6 –
Service-providing industries ..................................... 1.9 0 0 0 0 8 1.6 0.5Trade, transportation, and utilities ....................... 3.7 – 0 0 15 0 3.6 0.7
Wholesale trade ............................................... 4.1 – 0 0 0 12 4.1 0.4Retail trade ...................................................... 3.8 – 0 0 0 0 3.4 1.5Transportation and warehousing ..................... 8.5 – 0 0 12 0 8.5 –Utilities ............................................................. 3.4 0 0 0 0 0 – –
Information ........................................................... 4.1 0 0 0 0 13 – –Financial activities ................................................ 1.6 – 0 0 0 0 1.7 0.5
Finance and insurance .................................... 1.2 2 0 0 0 0 1.3 0.5Credit intermediation and related activities .. 2.0 5 0 0 0 0 2.0 –Insurance carriers and related activities ...... 1.9 0 0 0 0 0 1.6 1.3
Professional and business services:Professional and technical services ............... 9.0 0 – 0 0 0 – –
Education and health services ............................. 5.3 0 – 0 0 0 3.9 1.5Educational services ........................................ 5.4 – 0 0 0 0 5.4 –
Junior colleges, colleges, and universities ... 4.4 6 0 0 0 0 4.4 –Health care and social assistance ................... 6.2 0 – 0 0 0 4.5 1.8
Leisure and hospitality ......................................... 7.5 – 0 0 24 0 7.5 –
See footnotes at end of table.
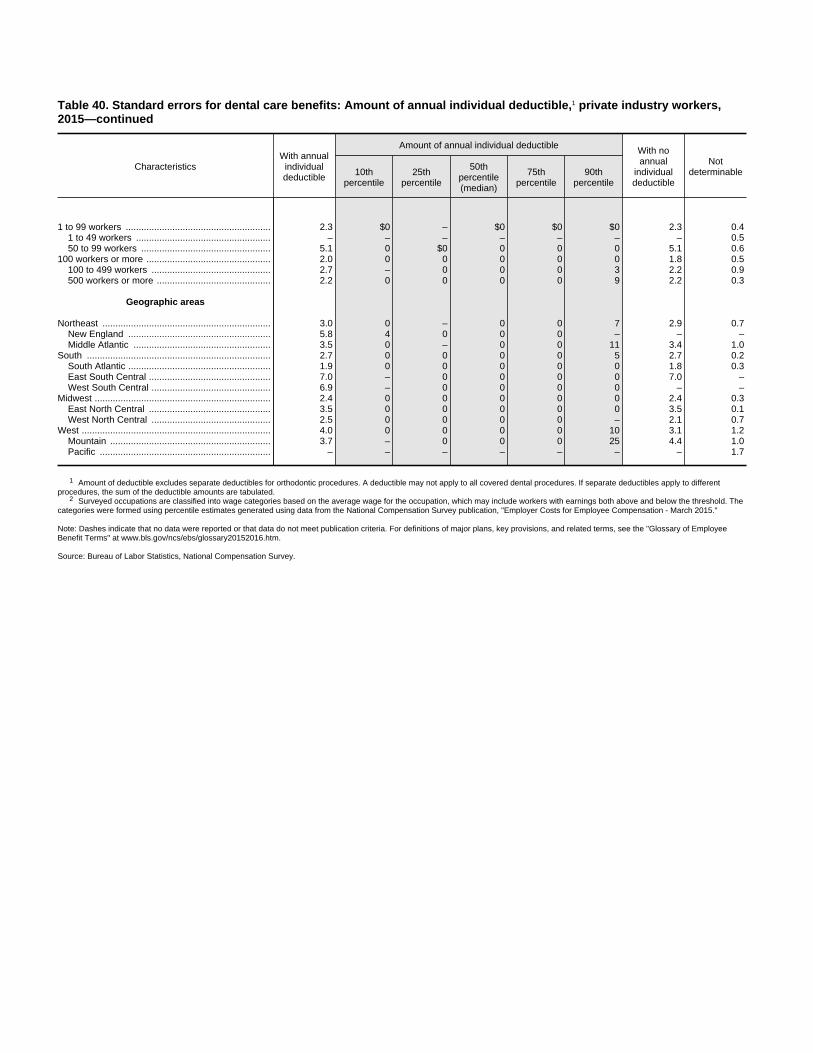
Table 40. Standard errors for dental care benefits: Amount of annual individual deductible,1 private industry workers,2015—continued
CharacteristicsWith annualindividualdeductible
Amount of annual individual deductible With noannual
individualdeductible
Notdeterminable10th
percentile25th
percentile
50thpercentile(median)
75thpercentile
90thpercentile
1 to 99 workers ........................................................ 2.3 $0 – $0 $0 $0 2.3 0.41 to 49 workers .................................................... – – – – – – – 0.550 to 99 workers .................................................. 5.1 0 $0 0 0 0 5.1 0.6
100 workers or more ................................................ 2.0 0 0 0 0 0 1.8 0.5100 to 499 workers .............................................. 2.7 – 0 0 0 3 2.2 0.9500 workers or more ............................................ 2.2 0 0 0 0 9 2.2 0.3
Geographic areas
Northeast ................................................................. 3.0 0 – 0 0 7 2.9 0.7New England ....................................................... 5.8 4 0 0 0 – – –Middle Atlantic ..................................................... 3.5 0 – 0 0 11 3.4 1.0
South ....................................................................... 2.7 0 0 0 0 5 2.7 0.2South Atlantic ....................................................... 1.9 0 0 0 0 0 1.8 0.3East South Central ............................................... 7.0 – 0 0 0 0 7.0 –West South Central .............................................. 6.9 – 0 0 0 0 – –
Midwest .................................................................... 2.4 0 0 0 0 0 2.4 0.3East North Central ............................................... 3.5 0 0 0 0 0 3.5 0.1West North Central .............................................. 2.5 0 0 0 0 – 2.1 0.7
West ......................................................................... 4.0 0 0 0 0 10 3.1 1.2Mountain .............................................................. 3.7 – 0 0 0 25 4.4 1.0Pacific .................................................................. – – – – – – – 1.7
1 Amount of deductible excludes separate deductibles for orthodontic procedures. A deductible may not apply to all covered dental procedures. If separate deductibles apply to differentprocedures, the sum of the deductible amounts are tabulated.
2 Surveyed occupations are classified into wage categories based on the average wage for the occupation, which may include workers with earnings both above and below the threshold. Thecategories were formed using percentile estimates generated using data from the National Compensation Survey publication, "Employer Costs for Employee Compensation - March 2015."
Note: Dashes indicate that no data were reported or that data do not meet publication criteria. For definitions of major plans, key provisions, and related terms, see the "Glossary of EmployeeBenefit Terms" at www.bls.gov/ncs/ebs/glossary20152016.htm.
Source: Bureau of Labor Statistics, National Compensation Survey.

Table 41. Dental care benefits: Amount of annual family deductible,1 private industry workers, 2015
(All workers participating in dental care plans = 100 percent)
CharacteristicsWith annual
familydeductible
Amount of annual family deductible With noannualfamily
deductible
Notdeterminable10th
percentile25th
percentile
50thpercentile(median)
75thpercentile
90thpercentile
Worker characteristics
All workers ............................................................... 67 $75 $100 $150 $150 $200 32 1
Management, professional, and related .................. 71 75 100 150 150 150 29 2( )Management, business, and financial ................. 73 75 100 150 150 150 26 2( )Professional and related ...................................... 69 75 – 150 150 150 30 1
Service ..................................................................... 60 – 150 150 150 300 35 5Sales and office ....................................................... 66 100 150 150 150 225 33 1
Sales and related ................................................. 66 100 150 150 225 225 – –Office and administrative support ........................ 65 100 150 150 150 225 34 2( )
Natural resources, construction, and maintenance 58 75 100 150 150 – 42 –Installation, maintenance, and repair ................... 60 75 100 150 150 225 40 –
Production, transportation, and material moving ..... 66 75 100 150 150 – 34 2( )Production ............................................................ 71 75 100 150 150 150 29 1Transportation and material moving .................... 60 – 100 150 150 225 40 –
Full time ................................................................... 68 75 100 150 150 200 31 1Part time .................................................................. 50 75 – 150 200 300 48 2
Union ....................................................................... 54 50 100 150 150 150 44 2Nonunion ................................................................. 69 75 100 150 150 200 30 1
Average wage within the following categories3:Lowest 25 percent ............................................... – – – – – – – 5
Lowest 10 percent ........................................... – – – – – – – 3Second 25 percent ............................................... 65 – 150 150 150 225 33 2Third 25 percent ................................................... 66 75 100 150 150 150 34 2( )Highest 25 percent ............................................... 69 75 100 150 150 150 30 2( )
Highest 10 percent ........................................... 72 75 100 150 150 150 27 1
Establishment characteristics
Goods-producing industries ..................................... 72 75 100 150 150 – 28 –Manufacturing ...................................................... 74 75 100 150 150 – 26 –
Service-providing industries ..................................... 65 75 100 150 150 225 34 1Trade, transportation, and utilities ....................... 68 75 100 150 200 225 30 2
Wholesale trade ............................................... 77 75 – 150 150 – 22 1Retail trade ...................................................... 76 – 150 – 225 225 19 5Transportation and warehousing ..................... 53 – 100 – – 225 47 –Utilities ............................................................. 47 75 75 75 – 150 53 –
Information ........................................................... 83 75 100 – 150 150 17 –Financial activities ................................................ 65 75 – 150 150 150 34 2( )
Finance and insurance .................................... 68 75 – 150 150 150 31 1Credit intermediation and related activities .. 59 100 – 150 150 150 41 –Insurance carriers and related activities ...... 79 75 100 150 150 150 20 1
Professional and business services:Professional and technical services ............... 69 75 – 150 150 150 31 –
Education and health services ............................. 59 – 150 150 150 150 38 3Educational services ........................................ 69 – – 150 150 150 31 –
Junior colleges, colleges, and universities ... 69 75 150 150 150 150 31 –Health care and social assistance ................... 58 – 150 150 150 150 39 4
Leisure and hospitality ......................................... 57 150 150 – 300 300 43 –
See footnotes at end of table.
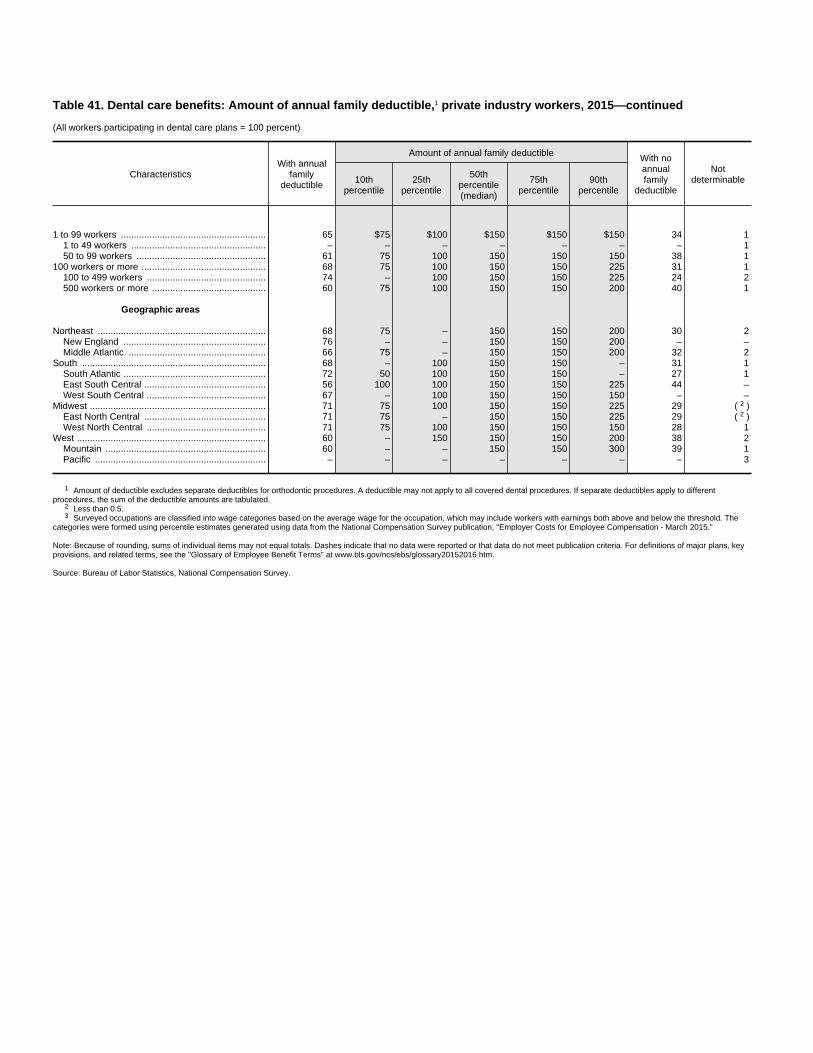
Table 41. Dental care benefits: Amount of annual family deductible,1 private industry workers, 2015—continued
(All workers participating in dental care plans = 100 percent)
CharacteristicsWith annual
familydeductible
Amount of annual family deductible With noannualfamily
deductible
Notdeterminable10th
percentile25th
percentile
50thpercentile(median)
75thpercentile
90thpercentile
1 to 99 workers ........................................................ 65 $75 $100 $150 $150 $150 34 11 to 49 workers .................................................... – – – – – – – 150 to 99 workers .................................................. 61 75 100 150 150 150 38 1
100 workers or more ................................................ 68 75 100 150 150 225 31 1100 to 499 workers .............................................. 74 – 100 150 150 225 24 2500 workers or more ............................................ 60 75 100 150 150 200 40 1
Geographic areas
Northeast ................................................................. 68 75 – 150 150 200 30 2New England ....................................................... 76 – – 150 150 200 – –Middle Atlantic ..................................................... 66 75 – 150 150 200 32 2
South ....................................................................... 68 – 100 150 150 – 31 1South Atlantic ....................................................... 72 50 100 150 150 – 27 1East South Central ............................................... 56 100 100 150 150 225 44 –West South Central .............................................. 67 – 100 150 150 150 – –
Midwest .................................................................... 71 75 100 150 150 225 29 2( )East North Central ............................................... 71 75 – 150 150 225 29 2( )West North Central .............................................. 71 75 100 150 150 150 28 1
West ......................................................................... 60 – 150 150 150 200 38 2Mountain .............................................................. 60 – – 150 150 300 39 1Pacific .................................................................. – – – – – – – 3
1 Amount of deductible excludes separate deductibles for orthodontic procedures. A deductible may not apply to all covered dental procedures. If separate deductibles apply to differentprocedures, the sum of the deductible amounts are tabulated.
2 Less than 0.5.3 Surveyed occupations are classified into wage categories based on the average wage for the occupation, which may include workers with earnings both above and below the threshold. The
categories were formed using percentile estimates generated using data from the National Compensation Survey publication, "Employer Costs for Employee Compensation - March 2015."
Note: Because of rounding, sums of individual items may not equal totals. Dashes indicate that no data were reported or that data do not meet publication criteria. For definitions of major plans, keyprovisions, and related terms, see the "Glossary of Employee Benefit Terms" at www.bls.gov/ncs/ebs/glossary20152016.htm.
Source: Bureau of Labor Statistics, National Compensation Survey.
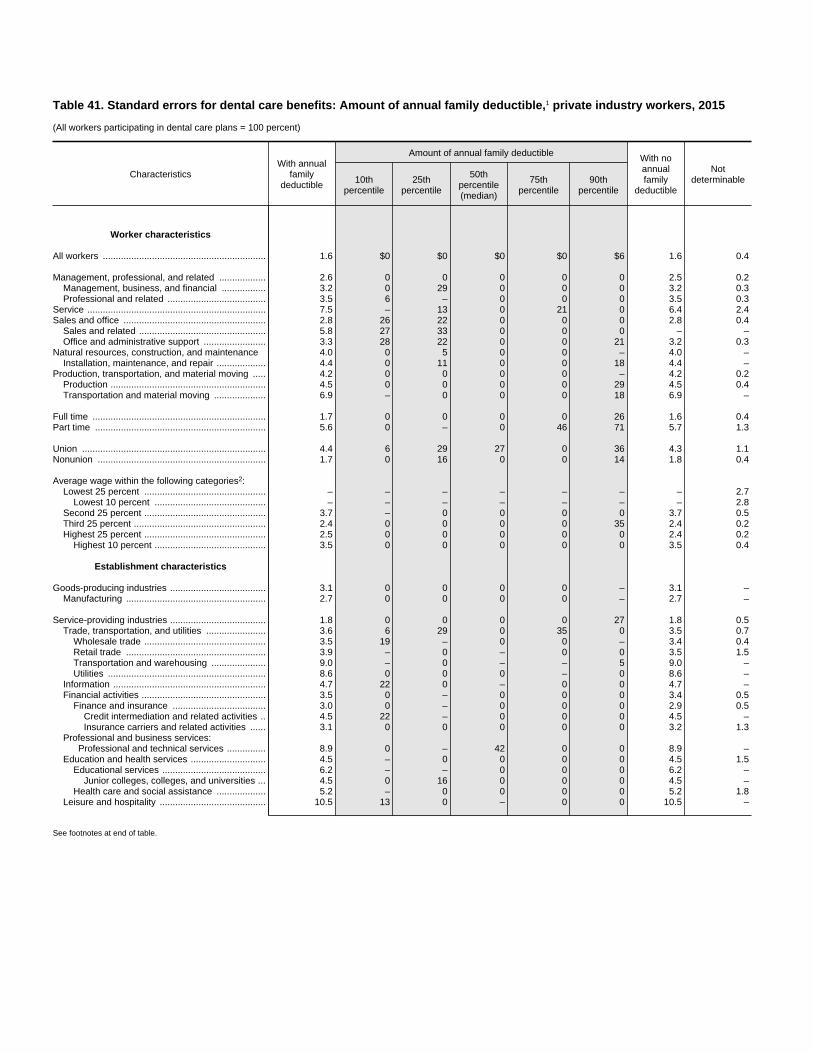
Table 41. Standard errors for dental care benefits: Amount of annual family deductible,1 private industry workers, 2015
(All workers participating in dental care plans = 100 percent)
CharacteristicsWith annual
familydeductible
Amount of annual family deductible With noannualfamily
deductible
Notdeterminable10th
percentile25th
percentile
50thpercentile(median)
75thpercentile
90thpercentile
Worker characteristics
All workers ............................................................... 1.6 $0 $0 $0 $0 $6 1.6 0.4
Management, professional, and related .................. 2.6 0 0 0 0 0 2.5 0.2Management, business, and financial ................. 3.2 0 29 0 0 0 3.2 0.3Professional and related ...................................... 3.5 6 – 0 0 0 3.5 0.3
Service ..................................................................... 7.5 – 13 0 21 0 6.4 2.4Sales and office ....................................................... 2.8 26 22 0 0 0 2.8 0.4
Sales and related ................................................. 5.8 27 33 0 0 0 – –Office and administrative support ........................ 3.3 28 22 0 0 21 3.2 0.3
Natural resources, construction, and maintenance 4.0 0 5 0 0 – 4.0 –Installation, maintenance, and repair ................... 4.4 0 11 0 0 18 4.4 –
Production, transportation, and material moving ..... 4.2 0 0 0 0 – 4.2 0.2Production ............................................................ 4.5 0 0 0 0 29 4.5 0.4Transportation and material moving .................... 6.9 – 0 0 0 18 6.9 –
Full time ................................................................... 1.7 0 0 0 0 26 1.6 0.4Part time .................................................................. 5.6 0 – 0 46 71 5.7 1.3
Union ....................................................................... 4.4 6 29 27 0 36 4.3 1.1Nonunion ................................................................. 1.7 0 16 0 0 14 1.8 0.4
Average wage within the following categories2:Lowest 25 percent ............................................... – – – – – – – 2.7
Lowest 10 percent ........................................... – – – – – – – 2.8Second 25 percent ............................................... 3.7 – 0 0 0 0 3.7 0.5Third 25 percent ................................................... 2.4 0 0 0 0 35 2.4 0.2Highest 25 percent ............................................... 2.5 0 0 0 0 0 2.4 0.2
Highest 10 percent ........................................... 3.5 0 0 0 0 0 3.5 0.4
Establishment characteristics
Goods-producing industries ..................................... 3.1 0 0 0 0 – 3.1 –Manufacturing ...................................................... 2.7 0 0 0 0 – 2.7 –
Service-providing industries ..................................... 1.8 0 0 0 0 27 1.8 0.5Trade, transportation, and utilities ....................... 3.6 6 29 0 35 0 3.5 0.7
Wholesale trade ............................................... 3.5 19 – 0 0 – 3.4 0.4Retail trade ...................................................... 3.9 – 0 – 0 0 3.5 1.5Transportation and warehousing ..................... 9.0 – 0 – – 5 9.0 –Utilities ............................................................. 8.6 0 0 0 – 0 8.6 –
Information ........................................................... 4.7 22 0 – 0 0 4.7 –Financial activities ................................................ 3.5 0 – 0 0 0 3.4 0.5
Finance and insurance .................................... 3.0 0 – 0 0 0 2.9 0.5Credit intermediation and related activities .. 4.5 22 – 0 0 0 4.5 –Insurance carriers and related activities ...... 3.1 0 0 0 0 0 3.2 1.3
Professional and business services:Professional and technical services ............... 8.9 0 – 42 0 0 8.9 –
Education and health services ............................. 4.5 – 0 0 0 0 4.5 1.5Educational services ........................................ 6.2 – – 0 0 0 6.2 –
Junior colleges, colleges, and universities ... 4.5 0 16 0 0 0 4.5 –Health care and social assistance ................... 5.2 – 0 0 0 0 5.2 1.8
Leisure and hospitality ......................................... 10.5 13 0 – 0 0 10.5 –
See footnotes at end of table.
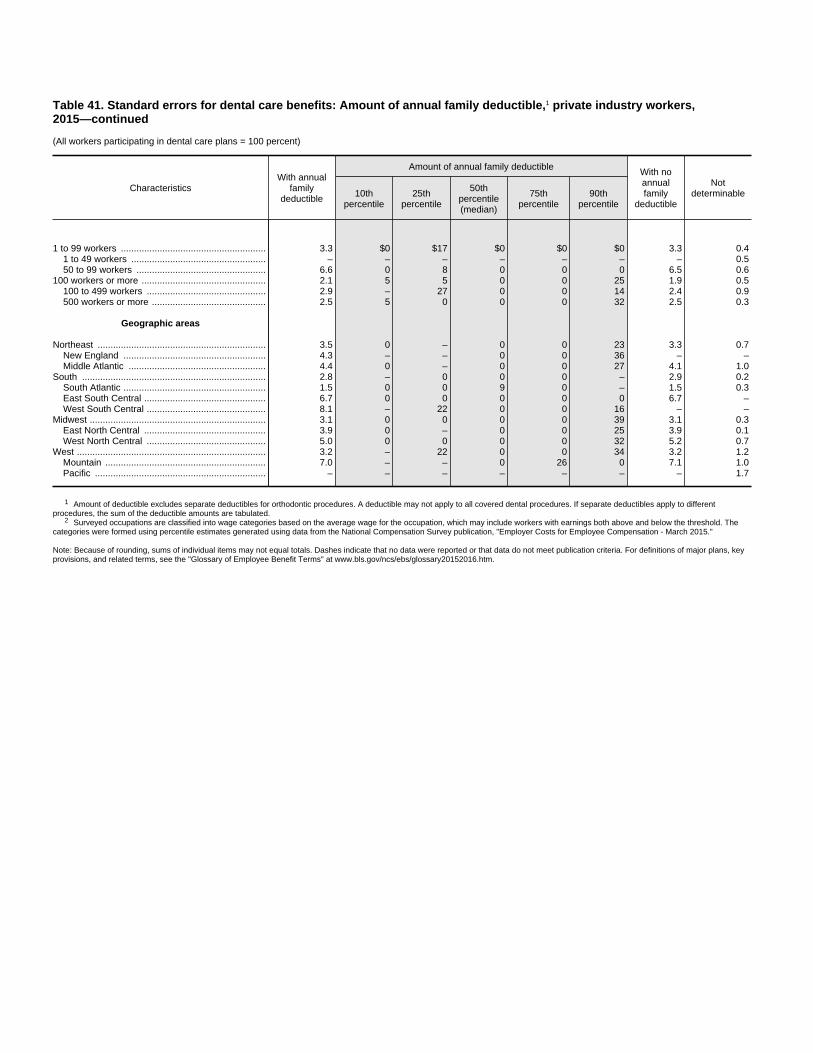
Table 41. Standard errors for dental care benefits: Amount of annual family deductible,1 private industry workers,2015—continued
(All workers participating in dental care plans = 100 percent)
CharacteristicsWith annual
familydeductible
Amount of annual family deductible With noannualfamily
deductible
Notdeterminable10th
percentile25th
percentile
50thpercentile(median)
75thpercentile
90thpercentile
1 to 99 workers ........................................................ 3.3 $0 $17 $0 $0 $0 3.3 0.41 to 49 workers .................................................... – – – – – – – 0.550 to 99 workers .................................................. 6.6 0 8 0 0 0 6.5 0.6
100 workers or more ................................................ 2.1 5 5 0 0 25 1.9 0.5100 to 499 workers .............................................. 2.9 – 27 0 0 14 2.4 0.9500 workers or more ............................................ 2.5 5 0 0 0 32 2.5 0.3
Geographic areas
Northeast ................................................................. 3.5 0 – 0 0 23 3.3 0.7New England ....................................................... 4.3 – – 0 0 36 – –Middle Atlantic ..................................................... 4.4 0 – 0 0 27 4.1 1.0
South ....................................................................... 2.8 – 0 0 0 – 2.9 0.2South Atlantic ....................................................... 1.5 0 0 9 0 – 1.5 0.3East South Central ............................................... 6.7 0 0 0 0 0 6.7 –West South Central .............................................. 8.1 – 22 0 0 16 – –
Midwest .................................................................... 3.1 0 0 0 0 39 3.1 0.3East North Central ............................................... 3.9 0 – 0 0 25 3.9 0.1West North Central .............................................. 5.0 0 0 0 0 32 5.2 0.7
West ......................................................................... 3.2 – 22 0 0 34 3.2 1.2Mountain .............................................................. 7.0 – – 0 26 0 7.1 1.0Pacific .................................................................. – – – – – – – 1.7
1 Amount of deductible excludes separate deductibles for orthodontic procedures. A deductible may not apply to all covered dental procedures. If separate deductibles apply to differentprocedures, the sum of the deductible amounts are tabulated.
2 Surveyed occupations are classified into wage categories based on the average wage for the occupation, which may include workers with earnings both above and below the threshold. Thecategories were formed using percentile estimates generated using data from the National Compensation Survey publication, "Employer Costs for Employee Compensation - March 2015."
Note: Because of rounding, sums of individual items may not equal totals. Dashes indicate that no data were reported or that data do not meet publication criteria. For definitions of major plans, keyprovisions, and related terms, see the "Glossary of Employee Benefit Terms" at www.bls.gov/ncs/ebs/glossary20152016.htm.

Table 42. Dental care benefits: Amount of annual plan maximum,1 private industry workers, 2015
(All workers participating in dental care plans = 100 percent)
Characteristics With annualmaximum
Amount of annual plan maximumWith noannual
maximum
Notdeterminable10th
percentile25th
percentile
50thpercentile(median)
75thpercentile
90thpercentile
Worker characteristics
All workers ............................................................... 90 $1,000 $1,200 $1,500 $2,000 $2,000 8 2
Management, professional, and related .................. 90 1,000 1,200 1,500 2,000 2,000 8 2Management, business, and financial ................. 88 1,000 1,500 1,500 2,000 2,000 10 2Professional and related ...................................... 91 1,000 1,200 1,500 2,000 2,000 7 3
Service ..................................................................... 89 1,000 1,000 1,500 1,500 2,000 – –Sales and office ....................................................... 90 1,000 1,200 1,500 2,000 2,500 8 2
Sales and related ................................................. 89 1,000 1,500 1,500 2,000 2,500 9 2Office and administrative support ........................ 91 1,000 1,000 1,500 2,000 2,000 8 2
Natural resources, construction, and maintenance 92 1,000 1,000 1,500 2,000 2,000 7 2( )Installation, maintenance, and repair ................... 92 1,000 1,000 1,500 2,000 – 8 1
Production, transportation, and material moving ..... 90 1,000 1,000 1,500 1,750 2,000 9 1Production ............................................................ 96 1,000 1,000 1,500 1,500 2,000 – –Transportation and material moving .................... 84 1,000 1,500 1,500 2,000 2,500 15 2
Full time ................................................................... 91 1,000 1,200 1,500 2,000 2,000 8 2Part time .................................................................. 79 1,000 1,000 1,500 2,000 2,000 20 2
Union ....................................................................... 86 1,000 1,250 1,500 1,800 2,000 13 1Nonunion ................................................................. 91 1,000 1,200 1,500 2,000 2,000 8 2
Average wage within the following categories3:Second 25 percent ............................................... 91 1,000 1,000 1,500 2,000 2,000 8 1Third 25 percent ................................................... 89 1,000 1,200 1,500 1,850 2,000 9 1Highest 25 percent ............................................... 90 1,000 1,250 1,500 2,000 2,000 8 2
Highest 10 percent ........................................... 92 1,000 1,250 1,500 2,000 2,000 8 2( )
Establishment characteristics
Goods-producing industries ..................................... 95 1,000 1,200 1,500 1,850 2,000 5 2( )Manufacturing ...................................................... 94 1,000 1,200 1,500 1,800 2,000 5 2( )
Service-providing industries ..................................... 89 1,000 1,200 1,500 2,000 2,000 10 2Trade, transportation, and utilities ....................... 89 1,000 1,400 1,500 2,000 2,500 10 1
Wholesale trade ............................................... 91 1,000 1,400 1,500 1,800 2,000 – –Retail trade ...................................................... 90 1,000 1,250 1,850 2,500 2,500 – –Transportation and warehousing ..................... 83 1,000 1,500 – 2,000 2,500 – –Utilities ............................................................. 96 1,000 1,250 1,500 1,750 2,000 – –
Information ........................................................... 90 1,000 1,500 1,500 2,000 2,000 – –Financial activities ................................................ 88 1,000 1,200 1,500 2,000 2,000 11 2( )
Finance and insurance .................................... 88 1,000 1,200 1,500 2,000 2,000 12 2( )Credit intermediation and related activities .. 83 1,000 1,200 1,500 2,000 2,000 16 2( )Insurance carriers and related activities ...... 93 1,000 1,200 1,500 – 2,000 7 –
Professional and business services:Professional and technical services ............... 98 1,000 1,200 1,500 – – – –
Education and health services ............................. 86 1,000 1,200 1,500 1,500 2,000 – –Educational services ........................................ 86 1,000 – 1,500 2,000 2,000 – –
Junior colleges, colleges, and universities ... 90 1,000 1,250 1,500 2,000 3,000 9 1Health care and social assistance ................... 86 1,000 1,200 1,500 1,500 2,000 – –
Leisure and hospitality ......................................... 91 1,000 1,500 1,500 1,500 2,000 – –
See footnotes at end of table.
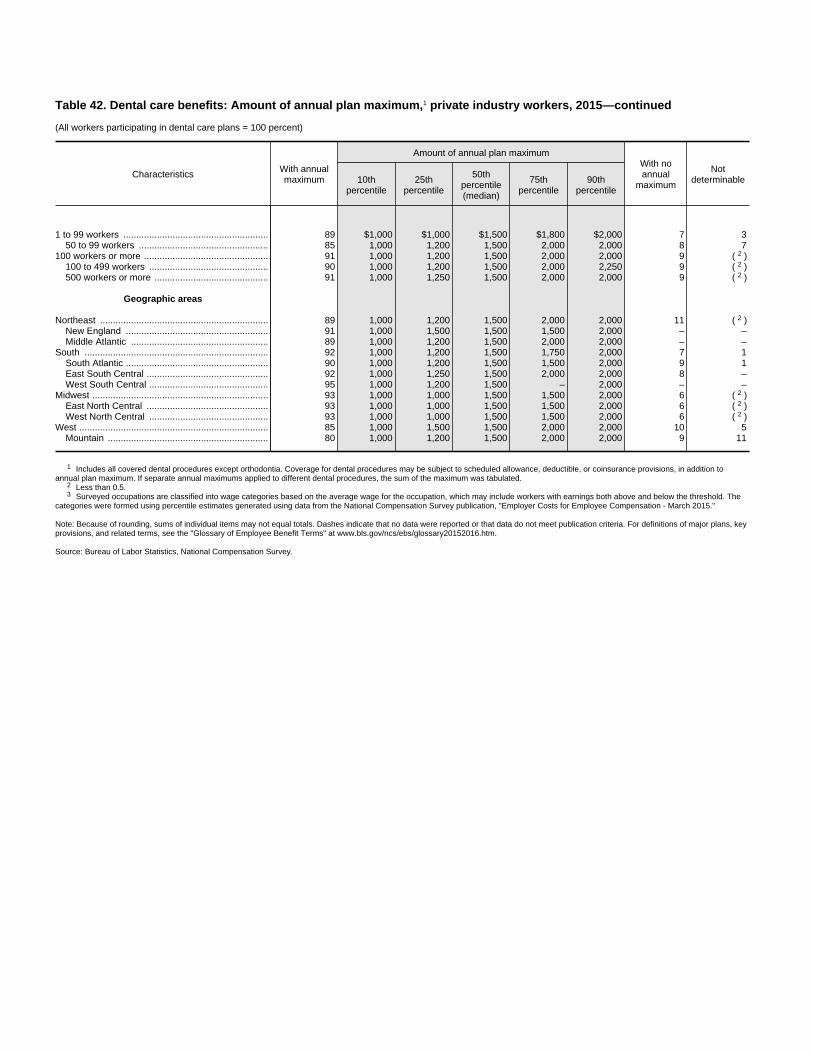
Table 42. Dental care benefits: Amount of annual plan maximum,1 private industry workers, 2015—continued
(All workers participating in dental care plans = 100 percent)
Characteristics With annualmaximum
Amount of annual plan maximumWith noannual
maximum
Notdeterminable10th
percentile25th
percentile
50thpercentile(median)
75thpercentile
90thpercentile
1 to 99 workers ........................................................ 89 $1,000 $1,000 $1,500 $1,800 $2,000 7 350 to 99 workers .................................................. 85 1,000 1,200 1,500 2,000 2,000 8 7
100 workers or more ................................................ 91 1,000 1,200 1,500 2,000 2,000 9 2( )100 to 499 workers .............................................. 90 1,000 1,200 1,500 2,000 2,250 9 2( )500 workers or more ............................................ 91 1,000 1,250 1,500 2,000 2,000 9 2( )
Geographic areas
Northeast ................................................................. 89 1,000 1,200 1,500 2,000 2,000 11 2( )New England ....................................................... 91 1,000 1,500 1,500 1,500 2,000 – –Middle Atlantic ..................................................... 89 1,000 1,200 1,500 2,000 2,000 – –
South ....................................................................... 92 1,000 1,200 1,500 1,750 2,000 7 1South Atlantic ....................................................... 90 1,000 1,200 1,500 1,500 2,000 9 1East South Central ............................................... 92 1,000 1,250 1,500 2,000 2,000 8 –West South Central .............................................. 95 1,000 1,200 1,500 – 2,000 – –
Midwest .................................................................... 93 1,000 1,000 1,500 1,500 2,000 6 2( )East North Central ............................................... 93 1,000 1,000 1,500 1,500 2,000 6 2( )West North Central .............................................. 93 1,000 1,000 1,500 1,500 2,000 6 2( )
West ......................................................................... 85 1,000 1,500 1,500 2,000 2,000 10 5Mountain .............................................................. 80 1,000 1,200 1,500 2,000 2,000 9 11
1 Includes all covered dental procedures except orthodontia. Coverage for dental procedures may be subject to scheduled allowance, deductible, or coinsurance provisions, in addition toannual plan maximum. If separate annual maximums applied to different dental procedures, the sum of the maximum was tabulated.
2 Less than 0.5.3 Surveyed occupations are classified into wage categories based on the average wage for the occupation, which may include workers with earnings both above and below the threshold. The
categories were formed using percentile estimates generated using data from the National Compensation Survey publication, "Employer Costs for Employee Compensation - March 2015."
Note: Because of rounding, sums of individual items may not equal totals. Dashes indicate that no data were reported or that data do not meet publication criteria. For definitions of major plans, keyprovisions, and related terms, see the "Glossary of Employee Benefit Terms" at www.bls.gov/ncs/ebs/glossary20152016.htm.
Source: Bureau of Labor Statistics, National Compensation Survey.
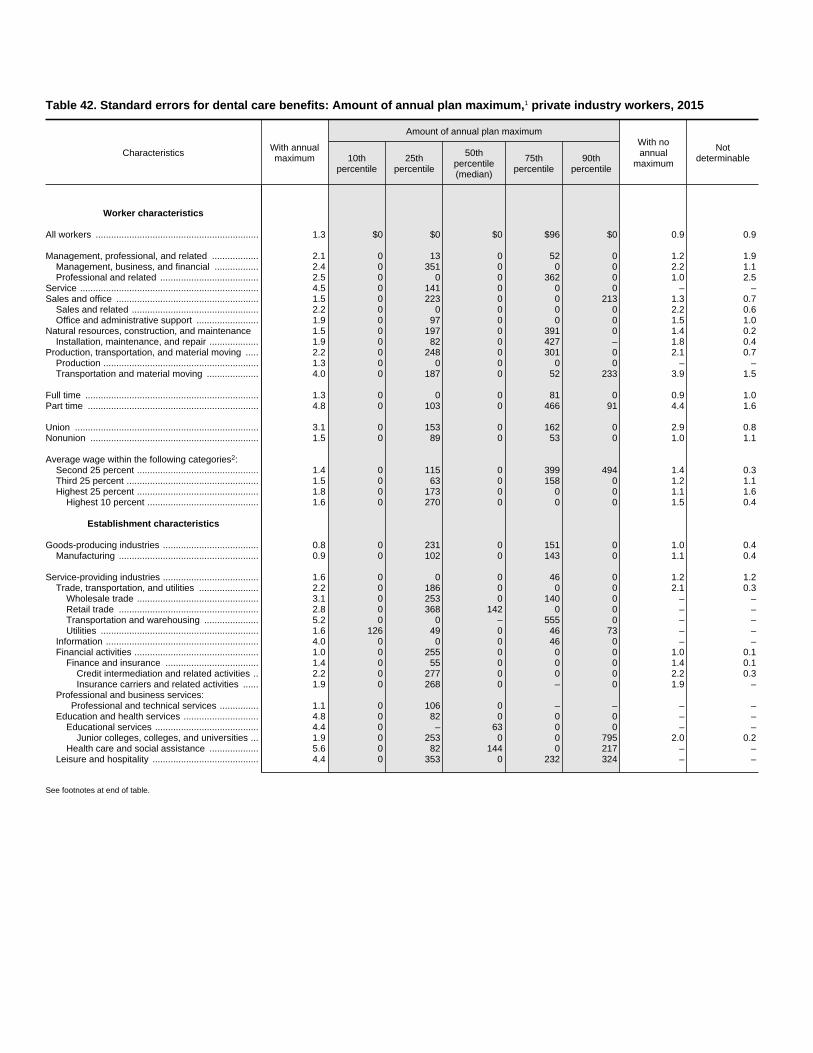
Table 42. Standard errors for dental care benefits: Amount of annual plan maximum,1 private industry workers, 2015
Characteristics With annualmaximum
Amount of annual plan maximumWith noannual
maximum
Notdeterminable10th
percentile25th
percentile
50thpercentile(median)
75thpercentile
90thpercentile
Worker characteristics
All workers ............................................................... 1.3 $0 $0 $0 $96 $0 0.9 0.9
Management, professional, and related .................. 2.1 0 13 0 52 0 1.2 1.9Management, business, and financial ................. 2.4 0 351 0 0 0 2.2 1.1Professional and related ...................................... 2.5 0 0 0 362 0 1.0 2.5
Service ..................................................................... 4.5 0 141 0 0 0 – –Sales and office ....................................................... 1.5 0 223 0 0 213 1.3 0.7
Sales and related ................................................. 2.2 0 0 0 0 0 2.2 0.6Office and administrative support ........................ 1.9 0 97 0 0 0 1.5 1.0
Natural resources, construction, and maintenance 1.5 0 197 0 391 0 1.4 0.2Installation, maintenance, and repair ................... 1.9 0 82 0 427 – 1.8 0.4
Production, transportation, and material moving ..... 2.2 0 248 0 301 0 2.1 0.7Production ............................................................ 1.3 0 0 0 0 0 – –Transportation and material moving .................... 4.0 0 187 0 52 233 3.9 1.5
Full time ................................................................... 1.3 0 0 0 81 0 0.9 1.0Part time .................................................................. 4.8 0 103 0 466 91 4.4 1.6
Union ....................................................................... 3.1 0 153 0 162 0 2.9 0.8Nonunion ................................................................. 1.5 0 89 0 53 0 1.0 1.1
Average wage within the following categories2:Second 25 percent ............................................... 1.4 0 115 0 399 494 1.4 0.3Third 25 percent ................................................... 1.5 0 63 0 158 0 1.2 1.1Highest 25 percent ............................................... 1.8 0 173 0 0 0 1.1 1.6
Highest 10 percent ........................................... 1.6 0 270 0 0 0 1.5 0.4
Establishment characteristics
Goods-producing industries ..................................... 0.8 0 231 0 151 0 1.0 0.4Manufacturing ...................................................... 0.9 0 102 0 143 0 1.1 0.4
Service-providing industries ..................................... 1.6 0 0 0 46 0 1.2 1.2Trade, transportation, and utilities ....................... 2.2 0 186 0 0 0 2.1 0.3
Wholesale trade ............................................... 3.1 0 253 0 140 0 – –Retail trade ...................................................... 2.8 0 368 142 0 0 – –Transportation and warehousing ..................... 5.2 0 0 – 555 0 – –Utilities ............................................................. 1.6 126 49 0 46 73 – –
Information ........................................................... 4.0 0 0 0 46 0 – –Financial activities ................................................ 1.0 0 255 0 0 0 1.0 0.1
Finance and insurance .................................... 1.4 0 55 0 0 0 1.4 0.1Credit intermediation and related activities .. 2.2 0 277 0 0 0 2.2 0.3Insurance carriers and related activities ...... 1.9 0 268 0 – 0 1.9 –
Professional and business services:Professional and technical services ............... 1.1 0 106 0 – – – –
Education and health services ............................. 4.8 0 82 0 0 0 – –Educational services ........................................ 4.4 0 – 63 0 0 – –
Junior colleges, colleges, and universities ... 1.9 0 253 0 0 795 2.0 0.2Health care and social assistance ................... 5.6 0 82 144 0 217 – –
Leisure and hospitality ......................................... 4.4 0 353 0 232 324 – –
See footnotes at end of table.
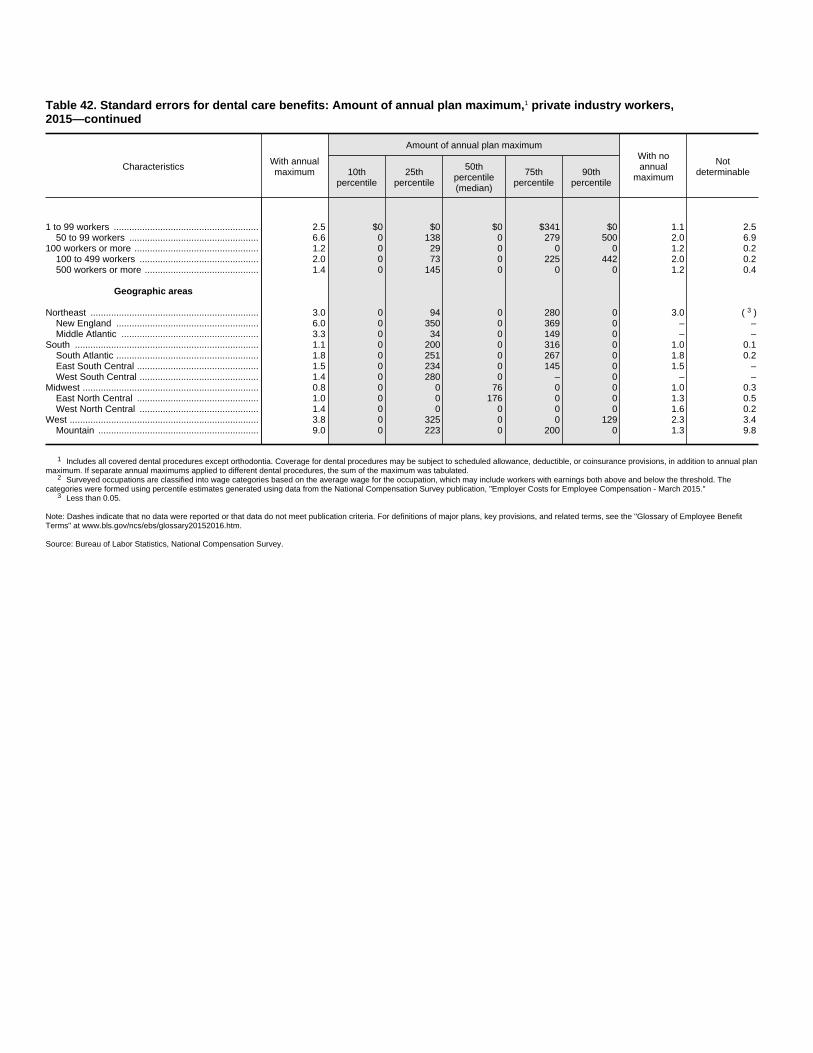
Table 42. Standard errors for dental care benefits: Amount of annual plan maximum,1 private industry workers,2015—continued
Characteristics With annualmaximum
Amount of annual plan maximumWith noannual
maximum
Notdeterminable10th
percentile25th
percentile
50thpercentile(median)
75thpercentile
90thpercentile
1 to 99 workers ........................................................ 2.5 $0 $0 $0 $341 $0 1.1 2.550 to 99 workers .................................................. 6.6 0 138 0 279 500 2.0 6.9
100 workers or more ................................................ 1.2 0 29 0 0 0 1.2 0.2100 to 499 workers .............................................. 2.0 0 73 0 225 442 2.0 0.2500 workers or more ............................................ 1.4 0 145 0 0 0 1.2 0.4
Geographic areas
Northeast ................................................................. 3.0 0 94 0 280 0 3.0 3( )New England ....................................................... 6.0 0 350 0 369 0 – –Middle Atlantic ..................................................... 3.3 0 34 0 149 0 – –
South ....................................................................... 1.1 0 200 0 316 0 1.0 0.1South Atlantic ....................................................... 1.8 0 251 0 267 0 1.8 0.2East South Central ............................................... 1.5 0 234 0 145 0 1.5 –West South Central .............................................. 1.4 0 280 0 – 0 – –
Midwest .................................................................... 0.8 0 0 76 0 0 1.0 0.3East North Central ............................................... 1.0 0 0 176 0 0 1.3 0.5West North Central .............................................. 1.4 0 0 0 0 0 1.6 0.2
West ......................................................................... 3.8 0 325 0 0 129 2.3 3.4Mountain .............................................................. 9.0 0 223 0 200 0 1.3 9.8
1 Includes all covered dental procedures except orthodontia. Coverage for dental procedures may be subject to scheduled allowance, deductible, or coinsurance provisions, in addition to annual planmaximum. If separate annual maximums applied to different dental procedures, the sum of the maximum was tabulated.
2 Surveyed occupations are classified into wage categories based on the average wage for the occupation, which may include workers with earnings both above and below the threshold. Thecategories were formed using percentile estimates generated using data from the National Compensation Survey publication, "Employer Costs for Employee Compensation - March 2015."
3 Less than 0.05.
Note: Dashes indicate that no data were reported or that data do not meet publication criteria. For definitions of major plans, key provisions, and related terms, see the "Glossary of Employee BenefitTerms" at www.bls.gov/ncs/ebs/glossary20152016.htm.
Source: Bureau of Labor Statistics, National Compensation Survey.

Table 43. Vision care benefits:1 Coverage for selected services, privateindustry workers, 2015
(All workers participating in vision care plans = 100 percent)
Characteristics Eye exams Glasses Contactlenses2
Worker characteristics
All workers ............................................................... 100 100 94
Management, professional, and related .................. 100 100 93Management, business, and financial ................. 100 100 94Professional and related ...................................... 100 100 92
Service ..................................................................... 100 100 92Sales and office ....................................................... 100 100 93
Sales and related ................................................. 100 100 96Office and administrative support ........................ 100 100 92
Natural resources, construction, and maintenance 100 100 100Installation, maintenance, and repair ................... 100 100 99
Production, transportation, and material moving ..... 100 100 97Production ............................................................ 100 100 99Transportation and material moving .................... 100 100 96
Full time ................................................................... 100 100 95Part time .................................................................. 100 100 87
Union ....................................................................... 100 100 95Nonunion ................................................................. 100 100 94
Average wage within the following categories3:Second 25 percent ............................................... 100 100 92Third 25 percent ................................................... 100 100 95Highest 25 percent ............................................... 100 100 95
Highest 10 percent ........................................... 100 100 99
Establishment characteristics
Goods-producing industries ..................................... 100 100 100Manufacturing ...................................................... 100 100 100
Service-providing industries ..................................... 100 100 92Trade, transportation, and utilities ....................... 100 100 95Information ........................................................... 100 100 97Financial activities ................................................ 100 100 99
Finance and insurance .................................... 100 100 98Credit intermediation and related activities .. 100 100 97Insurance carriers and related activities ...... 100 100 100
Professional and business services:Professional and technical services ............... 100 100 100
Education and health services ............................. 100 100 83Educational services ........................................ 99 100 95
Junior colleges, colleges, and universities ... 98 100 90Health care and social assistance ................... 100 100 81
See footnotes at end of table.
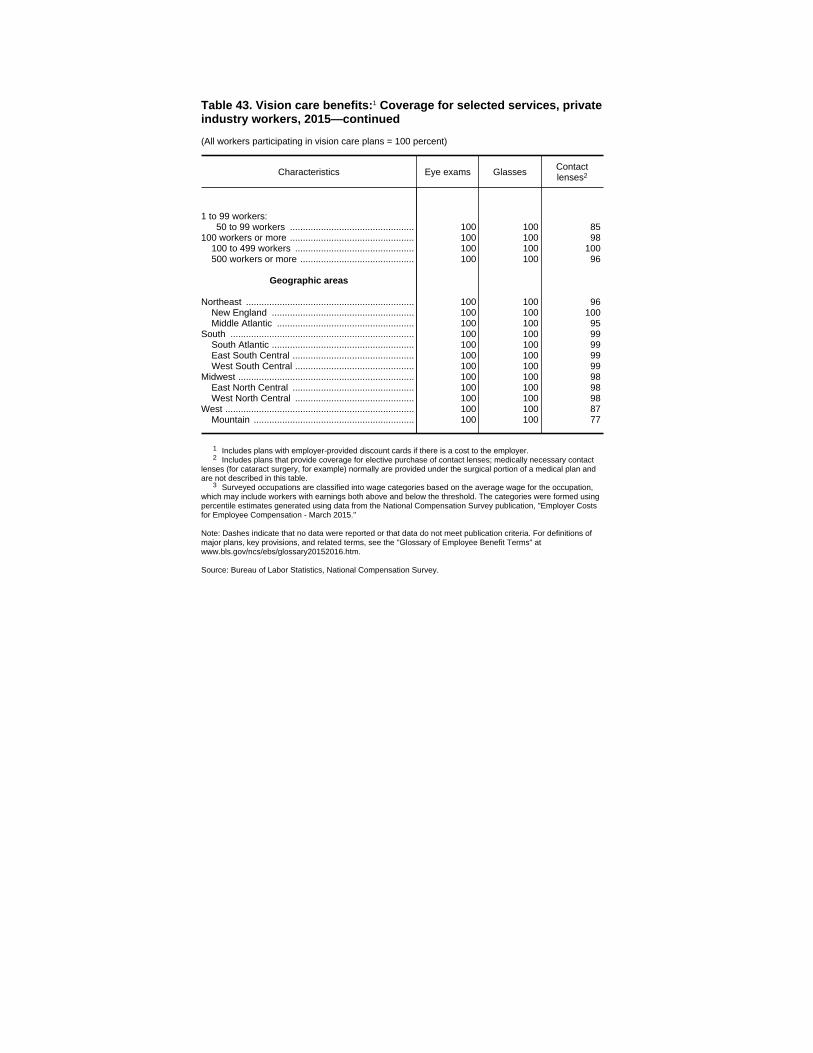
Table 43. Vision care benefits:1 Coverage for selected services, privateindustry workers, 2015—continued
(All workers participating in vision care plans = 100 percent)
Characteristics Eye exams Glasses Contactlenses2
1 to 99 workers:50 to 99 workers ................................................ 100 100 85
100 workers or more ................................................ 100 100 98100 to 499 workers .............................................. 100 100 100500 workers or more ............................................ 100 100 96
Geographic areas
Northeast ................................................................. 100 100 96New England ....................................................... 100 100 100Middle Atlantic ..................................................... 100 100 95
South ....................................................................... 100 100 99South Atlantic ....................................................... 100 100 99East South Central ............................................... 100 100 99West South Central .............................................. 100 100 99
Midwest .................................................................... 100 100 98East North Central ............................................... 100 100 98West North Central .............................................. 100 100 98
West ......................................................................... 100 100 87Mountain .............................................................. 100 100 77
1 Includes plans with employer-provided discount cards if there is a cost to the employer.2 Includes plans that provide coverage for elective purchase of contact lenses; medically necessary contact
lenses (for cataract surgery, for example) normally are provided under the surgical portion of a medical plan andare not described in this table.
3 Surveyed occupations are classified into wage categories based on the average wage for the occupation,which may include workers with earnings both above and below the threshold. The categories were formed usingpercentile estimates generated using data from the National Compensation Survey publication, "Employer Costsfor Employee Compensation - March 2015."
Note: Dashes indicate that no data were reported or that data do not meet publication criteria. For definitions ofmajor plans, key provisions, and related terms, see the "Glossary of Employee Benefit Terms" atwww.bls.gov/ncs/ebs/glossary20152016.htm.
Source: Bureau of Labor Statistics, National Compensation Survey.
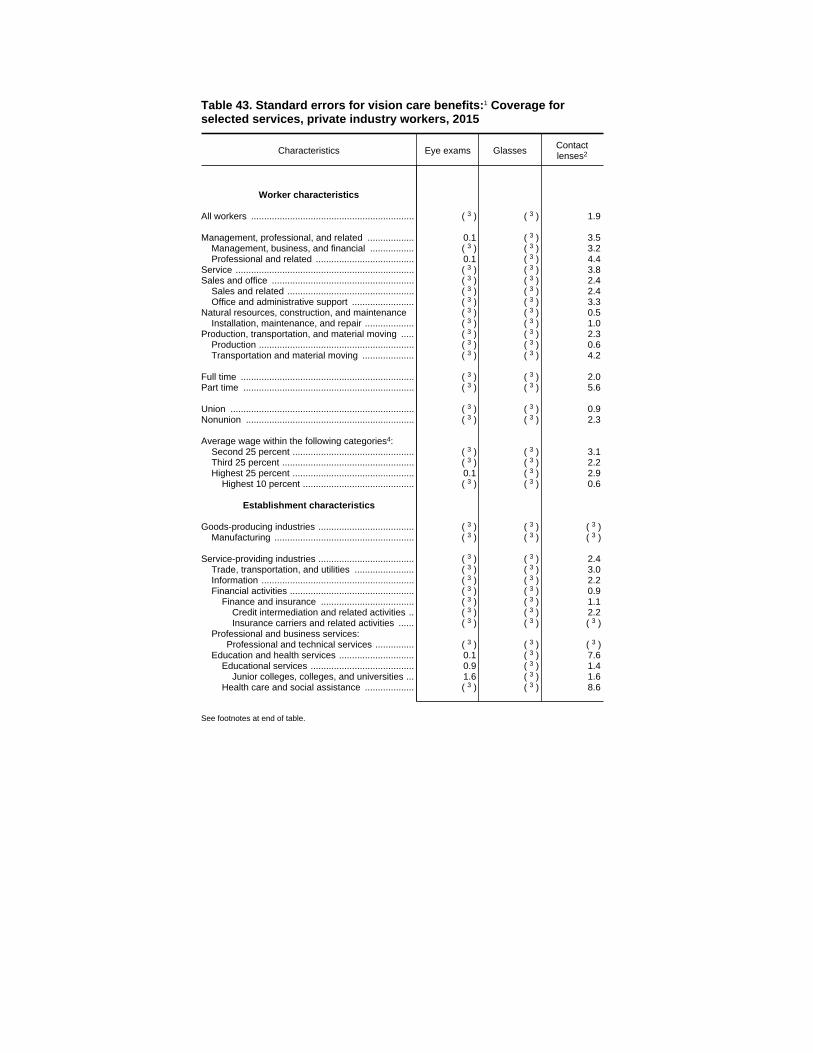
Table 43. Standard errors for vision care benefits:1 Coverage forselected services, private industry workers, 2015
Characteristics Eye exams Glasses Contactlenses2
Worker characteristics
All workers ............................................................... 3( ) 3( ) 1.9
Management, professional, and related .................. 0.1 3( ) 3.5Management, business, and financial ................. 3( ) 3( ) 3.2Professional and related ...................................... 0.1 3( ) 4.4
Service ..................................................................... 3( ) 3( ) 3.8Sales and office ....................................................... 3( ) 3( ) 2.4
Sales and related ................................................. 3( ) 3( ) 2.4Office and administrative support ........................ 3( ) 3( ) 3.3
Natural resources, construction, and maintenance 3( ) 3( ) 0.5Installation, maintenance, and repair ................... 3( ) 3( ) 1.0
Production, transportation, and material moving ..... 3( ) 3( ) 2.3Production ............................................................ 3( ) 3( ) 0.6Transportation and material moving .................... 3( ) 3( ) 4.2
Full time ................................................................... 3( ) 3( ) 2.0Part time .................................................................. 3( ) 3( ) 5.6
Union ....................................................................... 3( ) 3( ) 0.9Nonunion ................................................................. 3( ) 3( ) 2.3
Average wage within the following categories4:Second 25 percent ............................................... 3( ) 3( ) 3.1Third 25 percent ................................................... 3( ) 3( ) 2.2Highest 25 percent ............................................... 0.1 3( ) 2.9
Highest 10 percent ........................................... 3( ) 3( ) 0.6
Establishment characteristics
Goods-producing industries ..................................... 3( ) 3( ) 3( )Manufacturing ...................................................... 3( ) 3( ) 3( )
Service-providing industries ..................................... 3( ) 3( ) 2.4Trade, transportation, and utilities ....................... 3( ) 3( ) 3.0Information ........................................................... 3( ) 3( ) 2.2Financial activities ................................................ 3( ) 3( ) 0.9
Finance and insurance .................................... 3( ) 3( ) 1.1Credit intermediation and related activities .. 3( ) 3( ) 2.2Insurance carriers and related activities ...... 3( ) 3( ) 3( )
Professional and business services:Professional and technical services ............... 3( ) 3( ) 3( )
Education and health services ............................. 0.1 3( ) 7.6Educational services ........................................ 0.9 3( ) 1.4
Junior colleges, colleges, and universities ... 1.6 3( ) 1.6Health care and social assistance ................... 3( ) 3( ) 8.6
See footnotes at end of table.
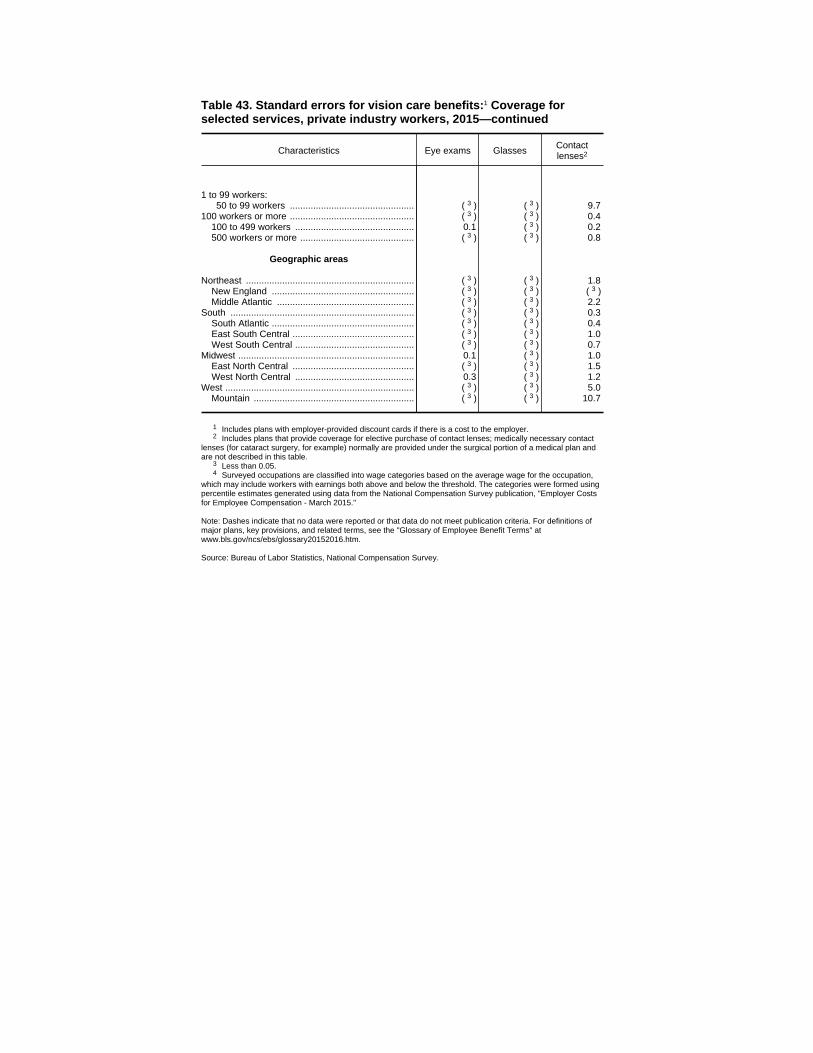
Table 43. Standard errors for vision care benefits:1 Coverage forselected services, private industry workers, 2015—continued
Characteristics Eye exams Glasses Contactlenses2
1 to 99 workers:50 to 99 workers ................................................ 3( ) 3( ) 9.7
100 workers or more ................................................ 3( ) 3( ) 0.4100 to 499 workers .............................................. 0.1 3( ) 0.2500 workers or more ............................................ 3( ) 3( ) 0.8
Geographic areas
Northeast ................................................................. 3( ) 3( ) 1.8New England ....................................................... 3( ) 3( ) 3( )Middle Atlantic ..................................................... 3( ) 3( ) 2.2
South ....................................................................... 3( ) 3( ) 0.3South Atlantic ....................................................... 3( ) 3( ) 0.4East South Central ............................................... 3( ) 3( ) 1.0West South Central .............................................. 3( ) 3( ) 0.7
Midwest .................................................................... 0.1 3( ) 1.0East North Central ............................................... 3( ) 3( ) 1.5West North Central .............................................. 0.3 3( ) 1.2
West ......................................................................... 3( ) 3( ) 5.0Mountain .............................................................. 3( ) 3( ) 10.7
1 Includes plans with employer-provided discount cards if there is a cost to the employer.2 Includes plans that provide coverage for elective purchase of contact lenses; medically necessary contact
lenses (for cataract surgery, for example) normally are provided under the surgical portion of a medical plan andare not described in this table.
3 Less than 0.05.4 Surveyed occupations are classified into wage categories based on the average wage for the occupation,
which may include workers with earnings both above and below the threshold. The categories were formed usingpercentile estimates generated using data from the National Compensation Survey publication, "Employer Costsfor Employee Compensation - March 2015."
Note: Dashes indicate that no data were reported or that data do not meet publication criteria. For definitions ofmajor plans, key provisions, and related terms, see the "Glossary of Employee Benefit Terms" atwww.bls.gov/ncs/ebs/glossary20152016.htm.
Source: Bureau of Labor Statistics, National Compensation Survey.
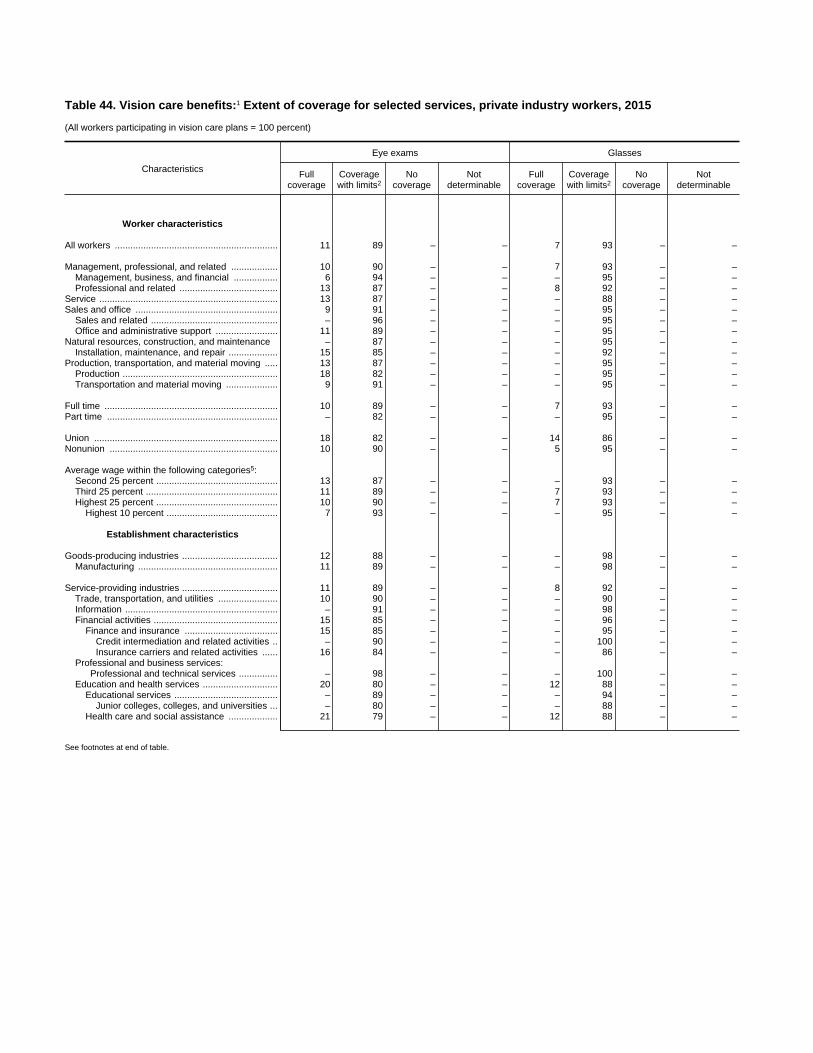
Table 44. Vision care benefits:1 Extent of coverage for selected services, private industry workers, 2015
(All workers participating in vision care plans = 100 percent)
Characteristics
Eye exams Glasses
Fullcoverage
Coveragewith limits2
Nocoverage
Notdeterminable
Fullcoverage
Coveragewith limits2
Nocoverage
Notdeterminable
Worker characteristics
All workers ............................................................... 11 89 – – 7 93 – –
Management, professional, and related .................. 10 90 – – 7 93 – –Management, business, and financial ................. 6 94 – – – 95 – –Professional and related ...................................... 13 87 – – 8 92 – –
Service ..................................................................... 13 87 – – – 88 – –Sales and office ....................................................... 9 91 – – – 95 – –
Sales and related ................................................. – 96 – – – 95 – –Office and administrative support ........................ 11 89 – – – 95 – –
Natural resources, construction, and maintenance – 87 – – – 95 – –Installation, maintenance, and repair ................... 15 85 – – – 92 – –
Production, transportation, and material moving ..... 13 87 – – – 95 – –Production ............................................................ 18 82 – – – 95 – –Transportation and material moving .................... 9 91 – – – 95 – –
Full time ................................................................... 10 89 – – 7 93 – –Part time .................................................................. – 82 – – – 95 – –
Union ....................................................................... 18 82 – – 14 86 – –Nonunion ................................................................. 10 90 – – 5 95 – –
Average wage within the following categories5:Second 25 percent ............................................... 13 87 – – – 93 – –Third 25 percent ................................................... 11 89 – – 7 93 – –Highest 25 percent ............................................... 10 90 – – 7 93 – –
Highest 10 percent ........................................... 7 93 – – – 95 – –
Establishment characteristics
Goods-producing industries ..................................... 12 88 – – – 98 – –Manufacturing ...................................................... 11 89 – – – 98 – –
Service-providing industries ..................................... 11 89 – – 8 92 – –Trade, transportation, and utilities ....................... 10 90 – – – 90 – –Information ........................................................... – 91 – – – 98 – –Financial activities ................................................ 15 85 – – – 96 – –
Finance and insurance .................................... 15 85 – – – 95 – –Credit intermediation and related activities .. – 90 – – – 100 – –Insurance carriers and related activities ...... 16 84 – – – 86 – –
Professional and business services:Professional and technical services ............... – 98 – – – 100 – –
Education and health services ............................. 20 80 – – 12 88 – –Educational services ........................................ – 89 – – – 94 – –
Junior colleges, colleges, and universities ... – 80 – – – 88 – –Health care and social assistance ................... 21 79 – – 12 88 – –
See footnotes at end of table.

Table 44. Vision care benefits:1 Extent of coverage for selected services,private industry workers, 2015—continued
(All workers participating in vision care plans = 100 percent)
Characteristics
Contact lenses3
Fullcoverage
Coveragewith limits2
Nocoverage
Notdeterminable
Worker characteristics
All workers ............................................................... 2 92 – –
Management, professional, and related .................. – 90 – 6Management, business, and financial ................. – 92 – 5Professional and related ...................................... – 89 – 6
Service ..................................................................... – 87 – 7Sales and office ....................................................... – 93 – 3
Sales and related ................................................. – 95 – 1Office and administrative support ........................ – 92 – 4
Natural resources, construction, and maintenance – 99 – 4( )Installation, maintenance, and repair ................... – 98 – 1
Production, transportation, and material moving ..... – 97 – 2Production ............................................................ – 99 – –Transportation and material moving .................... – 96 – 4
Full time ................................................................... 2 93 – –Part time .................................................................. – 86 – 4
Union ....................................................................... – 91 – 4Nonunion ................................................................. – 93 – 4
Average wage within the following categories5:Second 25 percent ............................................... – 90 – 4Third 25 percent ................................................... – 93 – 4Highest 25 percent ............................................... – 93 – 5
Highest 10 percent ........................................... – 97 – 4( )
Establishment characteristics
Goods-producing industries ..................................... – 100 – –Manufacturing ...................................................... – 100 – –
Service-providing industries ..................................... 2 90 – –Trade, transportation, and utilities ....................... – 95 – 3Information ........................................................... – 92 – –Financial activities ................................................ – 93 – –
Finance and insurance .................................... – 92 – –Credit intermediation and related activities .. – 94 – –Insurance carriers and related activities ...... – 86 – –
Professional and business services:Professional and technical services ............... – 100 – –
Education and health services ............................. – 78 – 12Educational services ........................................ – 95 – 5
Junior colleges, colleges, and universities ... – 90 – 9Health care and social assistance ................... – 76 – 13
See footnotes at end of table.
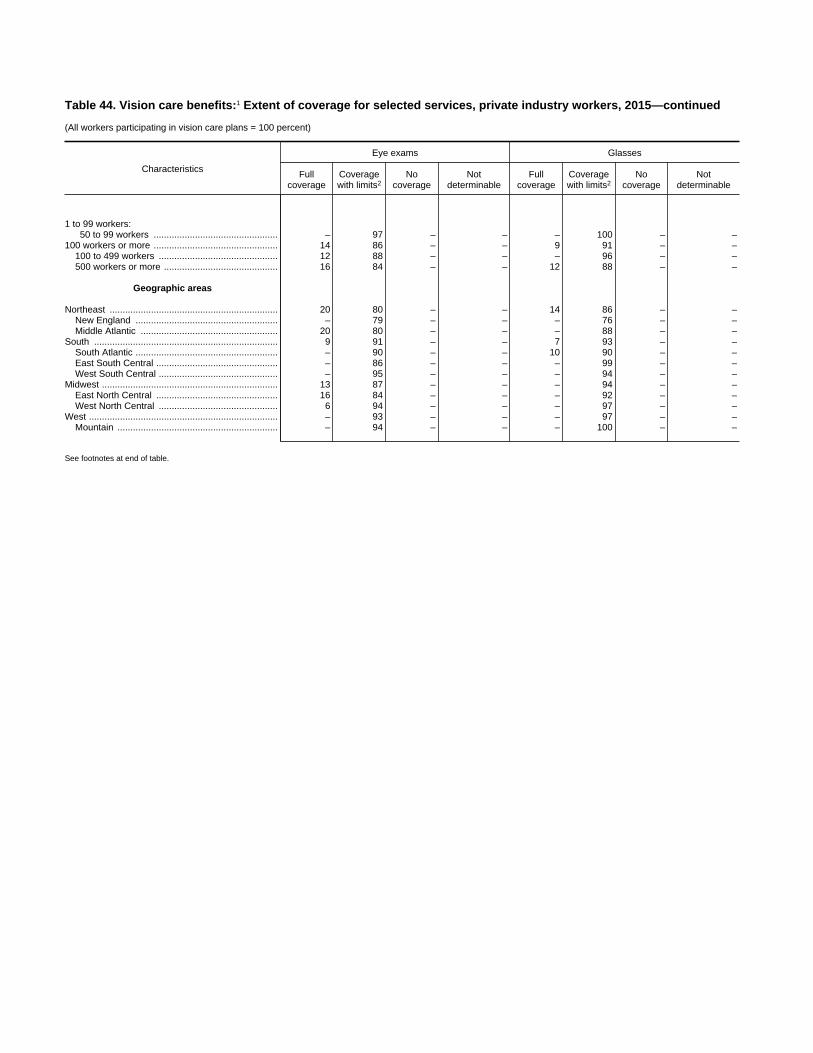
Table 44. Vision care benefits:1 Extent of coverage for selected services, private industry workers, 2015—continued
(All workers participating in vision care plans = 100 percent)
Characteristics
Eye exams Glasses
Fullcoverage
Coveragewith limits2
Nocoverage
Notdeterminable
Fullcoverage
Coveragewith limits2
Nocoverage
Notdeterminable
1 to 99 workers:50 to 99 workers ................................................ – 97 – – – 100 – –
100 workers or more ................................................ 14 86 – – 9 91 – –100 to 499 workers .............................................. 12 88 – – – 96 – –500 workers or more ............................................ 16 84 – – 12 88 – –
Geographic areas
Northeast ................................................................. 20 80 – – 14 86 – –New England ....................................................... – 79 – – – 76 – –Middle Atlantic ..................................................... 20 80 – – – 88 – –
South ....................................................................... 9 91 – – 7 93 – –South Atlantic ....................................................... – 90 – – 10 90 – –East South Central ............................................... – 86 – – – 99 – –West South Central .............................................. – 95 – – – 94 – –
Midwest .................................................................... 13 87 – – – 94 – –East North Central ............................................... 16 84 – – – 92 – –West North Central .............................................. 6 94 – – – 97 – –
West ......................................................................... – 93 – – – 97 – –Mountain .............................................................. – 94 – – – 100 – –
See footnotes at end of table.
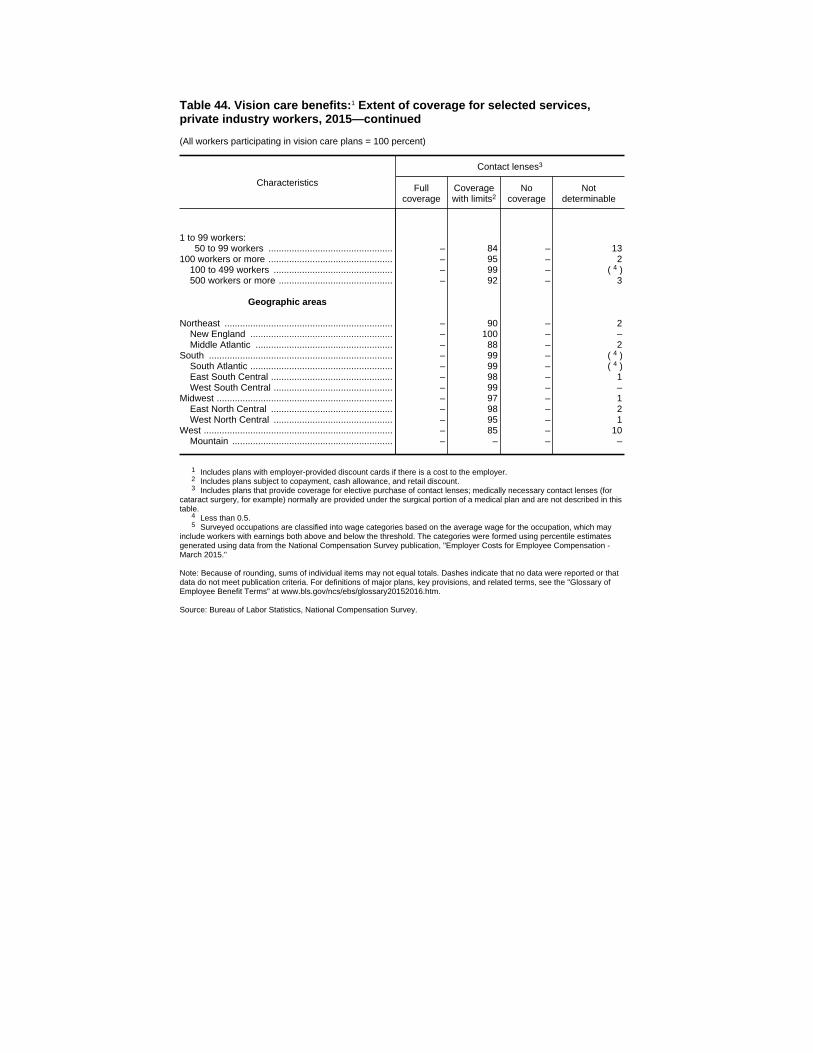
Table 44. Vision care benefits:1 Extent of coverage for selected services,private industry workers, 2015—continued
(All workers participating in vision care plans = 100 percent)
Characteristics
Contact lenses3
Fullcoverage
Coveragewith limits2
Nocoverage
Notdeterminable
1 to 99 workers:50 to 99 workers ................................................ – 84 – 13
100 workers or more ................................................ – 95 – 2100 to 499 workers .............................................. – 99 – 4( )500 workers or more ............................................ – 92 – 3
Geographic areas
Northeast ................................................................. – 90 – 2New England ....................................................... – 100 – –Middle Atlantic ..................................................... – 88 – 2
South ....................................................................... – 99 – 4( )South Atlantic ....................................................... – 99 – 4( )East South Central ............................................... – 98 – 1West South Central .............................................. – 99 – –
Midwest .................................................................... – 97 – 1East North Central ............................................... – 98 – 2West North Central .............................................. – 95 – 1
West ......................................................................... – 85 – 10Mountain .............................................................. – – – –
1 Includes plans with employer-provided discount cards if there is a cost to the employer.2 Includes plans subject to copayment, cash allowance, and retail discount.3 Includes plans that provide coverage for elective purchase of contact lenses; medically necessary contact lenses (for
cataract surgery, for example) normally are provided under the surgical portion of a medical plan and are not described in thistable.
4 Less than 0.5.5 Surveyed occupations are classified into wage categories based on the average wage for the occupation, which may
include workers with earnings both above and below the threshold. The categories were formed using percentile estimatesgenerated using data from the National Compensation Survey publication, "Employer Costs for Employee Compensation -March 2015."
Note: Because of rounding, sums of individual items may not equal totals. Dashes indicate that no data were reported or thatdata do not meet publication criteria. For definitions of major plans, key provisions, and related terms, see the "Glossary ofEmployee Benefit Terms" at www.bls.gov/ncs/ebs/glossary20152016.htm.
Source: Bureau of Labor Statistics, National Compensation Survey.

Table 44. Standard errors for vision care benefits:1 Extent of coverage for selected services, private industry workers,2015
Characteristics
Eye exams Glasses
Fullcoverage
Coveragewith limits2
Nocoverage
Notdeterminable
Fullcoverage
Coveragewith limits2
Nocoverage
Notdeterminable
Worker characteristics
All workers ............................................................... 1.4 1.4 – – 1.1 1.1 – –
Management, professional, and related .................. 2.1 2.1 – – 1.7 1.7 – –Management, business, and financial ................. 1.5 1.5 – – – 1.7 – –Professional and related ...................................... 2.9 2.9 – – 2.4 2.4 – –
Service ..................................................................... 3.8 3.8 – – – 3.8 – –Sales and office ....................................................... 2.1 2.1 – – – 1.6 – –
Sales and related ................................................. – 1.5 – – – 2.3 – –Office and administrative support ........................ 2.8 2.8 – – – 2.2 – –
Natural resources, construction, and maintenance – 4.0 – – – 2.2 – –Installation, maintenance, and repair ................... 3.8 3.8 – – – 3.4 – –
Production, transportation, and material moving ..... 2.6 2.6 – – – 1.7 – –Production ............................................................ 4.7 4.7 – – – 1.7 – –Transportation and material moving .................... 2.5 2.5 – – – 2.7 – –
Full time ................................................................... 1.3 1.3 – – 1.1 1.1 – –Part time .................................................................. – 5.8 – – – 2.2 – –
Union ....................................................................... 3.5 3.5 – – 2.4 2.4 – –Nonunion ................................................................. 1.5 1.5 – – 1.1 1.1 – –
Average wage within the following categories4:Second 25 percent ............................................... 3.6 3.6 – – – 2.4 – –Third 25 percent ................................................... 1.9 1.9 – – 1.7 1.7 – –Highest 25 percent ............................................... 1.9 1.9 – – 1.7 1.7 – –
Highest 10 percent ........................................... 1.9 1.9 – – – 1.7 – –
Establishment characteristics
Goods-producing industries ..................................... 2.4 2.4 – – – 0.8 – –Manufacturing ...................................................... 2.8 2.8 – – – 0.8 – –
Service-providing industries ..................................... 1.6 1.6 – – 1.3 1.3 – –Trade, transportation, and utilities ....................... 2.3 2.3 – – – 3.3 – –Information ........................................................... – 3.9 – – – 1.6 – –Financial activities ................................................ 4.1 4.1 – – – 1.4 – –
Finance and insurance .................................... 3.3 3.3 – – – 1.7 – –Credit intermediation and related activities .. – 3.8 – – – 0.4 – –Insurance carriers and related activities ...... 4.5 4.5 – – – 4.3 – –
Professional and business services:Professional and technical services ............... – 1.9 – – – 5( ) – –
Education and health services ............................. 4.6 4.6 – – 3.2 3.2 – –Educational services ........................................ – 4.7 – – – 4.0 – –
Junior colleges, colleges, and universities ... – 7.3 – – – 6.7 – –Health care and social assistance ................... 5.1 5.1 – – 3.6 3.6 – –
See footnotes at end of table.

Table 44. Standard errors for vision care benefits:1 Extent of coverage forselected services, private industry workers, 2015—continued
Characteristics
Contact lenses3
Fullcoverage
Coveragewith limits2
Nocoverage
Notdeterminable
Worker characteristics
All workers ............................................................... 0.5 1.9 – –
Management, professional, and related .................. – 3.4 – 3.5Management, business, and financial ................. – 3.3 – 3.2Professional and related ...................................... – 4.3 – 4.3
Service ..................................................................... – 4.1 – 3.8Sales and office ....................................................... – 2.3 – 1.7
Sales and related ................................................. – 2.5 – 0.6Office and administrative support ........................ – 3.3 – 2.5
Natural resources, construction, and maintenance – 0.8 – 0.5Installation, maintenance, and repair ................... – 1.7 – 1.0
Production, transportation, and material moving ..... – 2.3 – 2.3Production ............................................................ – 0.8 – –Transportation and material moving .................... – 4.2 – 4.2
Full time ................................................................... 0.5 2.0 – –Part time .................................................................. – 5.6 – 3.4
Union ....................................................................... – 1.4 – 0.5Nonunion ................................................................. – 2.3 – 2.2
Average wage within the following categories4:Second 25 percent ............................................... – 3.1 – 0.9Third 25 percent ................................................... – 2.2 – 2.2Highest 25 percent ............................................... – 2.8 – 2.9
Highest 10 percent ........................................... – 1.1 – 0.2
Establishment characteristics
Goods-producing industries ..................................... – 0.5 – –Manufacturing ...................................................... – 5( ) – –
Service-providing industries ..................................... 0.6 2.3 – –Trade, transportation, and utilities ....................... – 3.0 – 2.2Information ........................................................... – 4.1 – –Financial activities ................................................ – 2.0 – –
Finance and insurance .................................... – 2.5 – –Credit intermediation and related activities .. – 3.1 – –Insurance carriers and related activities ...... – 4.3 – –
Professional and business services:Professional and technical services ............... – 5( ) – –
Education and health services ............................. – 6.9 – 7.4Educational services ........................................ – 1.4 – 1.2
Junior colleges, colleges, and universities ... – 1.6 – 1.3Health care and social assistance ................... – 7.6 – 8.5
See footnotes at end of table.

Table 44. Standard errors for vision care benefits:1 Extent of coverage for selected services, private industry workers,2015—continued
Characteristics
Eye exams Glasses
Fullcoverage
Coveragewith limits2
Nocoverage
Notdeterminable
Fullcoverage
Coveragewith limits2
Nocoverage
Notdeterminable
1 to 99 workers:50 to 99 workers ................................................ – 1.5 – – – 0.2 – –
100 workers or more ................................................ 2.0 2.0 – – 1.5 1.5 – –100 to 499 workers .............................................. 2.5 2.5 – – – 1.9 – –500 workers or more ............................................ 3.4 3.4 – – 2.4 2.4 – –
Geographic areas
Northeast ................................................................. 3.8 3.8 – – 4.1 4.1 – –New England ....................................................... – 11.5 – – – 13.4 – –Middle Atlantic ..................................................... 4.4 4.4 – – – 4.2 – –
South ....................................................................... 2.2 2.2 – – 1.6 1.6 – –South Atlantic ....................................................... – 3.3 – – 0.9 0.9 – –East South Central ............................................... – 8.1 – – – 1.3 – –West South Central .............................................. – 2.4 – – – 4.7 – –
Midwest .................................................................... 2.9 2.9 – – – 2.3 – –East North Central ............................................... 4.3 4.3 – – – 3.4 – –West North Central .............................................. 1.4 1.4 – – – 1.2 – –
West ......................................................................... – 2.3 – – – 1.2 – –Mountain .............................................................. – 3.3 – – – 0.5 – –
See footnotes at end of table.

Table 44. Standard errors for vision care benefits:1 Extent of coverage forselected services, private industry workers, 2015—continued
Characteristics
Contact lenses3
Fullcoverage
Coveragewith limits2
Nocoverage
Notdeterminable
1 to 99 workers:50 to 99 workers ................................................ – 9.6 – 9.7
100 workers or more ................................................ – 0.8 – 0.2100 to 499 workers .............................................. – 0.7 – 0.2500 workers or more ............................................ – 1.6 – 0.4
Geographic areas
Northeast ................................................................. – 2.0 – 0.5New England ....................................................... – 5( ) – –Middle Atlantic ..................................................... – 2.3 – 0.6
South ....................................................................... – 0.3 – 0.2South Atlantic ....................................................... – 0.4 – 0.4East South Central ............................................... – 0.3 – 0.8West South Central .............................................. – 0.8 – –
Midwest .................................................................... – 1.2 – 0.9East North Central ............................................... – 1.5 – 1.4West North Central .............................................. – 2.0 – 0.6
West ......................................................................... – 4.9 – 4.9Mountain .............................................................. – – – –
1 Includes plans with employer-provided discount cards if there is a cost to the employer.2 Includes plans subject to copayment, cash allowance, and retail discount.3 Includes plans that provide coverage for elective purchase of contact lenses; medically necessary contact lenses (for
cataract surgery, for example) normally are provided under the surgical portion of a medical plan and are not described in thistable.
4 Surveyed occupations are classified into wage categories based on the average wage for the occupation, which mayinclude workers with earnings both above and below the threshold. The categories were formed using percentile estimatesgenerated using data from the National Compensation Survey publication, "Employer Costs for Employee Compensation -March 2015."
5 Less than 0.05.
Note: Dashes indicate that no data were reported or that data do not meet publication criteria. For definitions of major plans,key provisions, and related terms, see the "Glossary of Employee Benefit Terms" atwww.bls.gov/ncs/ebs/glossary20152016.htm.
Source: Bureau of Labor Statistics, National Compensation Survey.
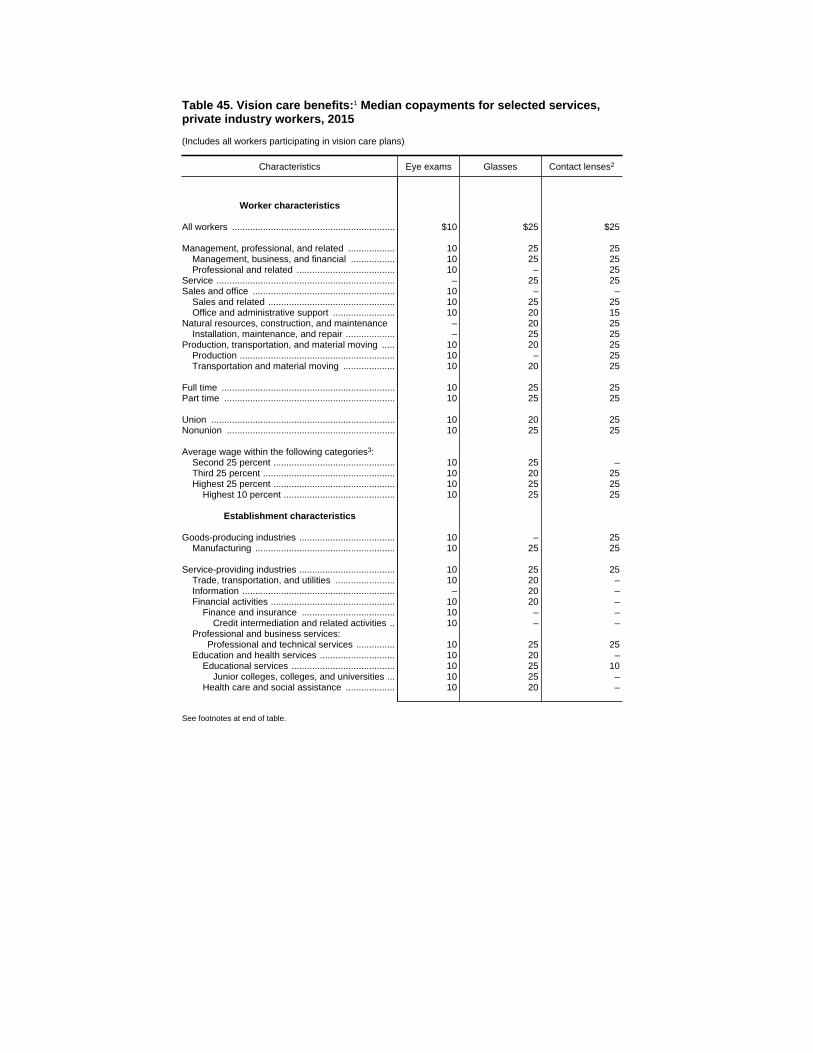
Table 45. Vision care benefits:1 Median copayments for selected services,private industry workers, 2015
(Includes all workers participating in vision care plans)
Characteristics Eye exams Glasses Contact lenses2
Worker characteristics
All workers ............................................................... $10 $25 $25
Management, professional, and related .................. 10 25 25Management, business, and financial ................. 10 25 25Professional and related ...................................... 10 – 25
Service ..................................................................... – 25 25Sales and office ....................................................... 10 – –
Sales and related ................................................. 10 25 25Office and administrative support ........................ 10 20 15
Natural resources, construction, and maintenance – 20 25Installation, maintenance, and repair ................... – 25 25
Production, transportation, and material moving ..... 10 20 25Production ............................................................ 10 – 25Transportation and material moving .................... 10 20 25
Full time ................................................................... 10 25 25Part time .................................................................. 10 25 25
Union ....................................................................... 10 20 25Nonunion ................................................................. 10 25 25
Average wage within the following categories3:Second 25 percent ............................................... 10 25 –Third 25 percent ................................................... 10 20 25Highest 25 percent ............................................... 10 25 25
Highest 10 percent ........................................... 10 25 25
Establishment characteristics
Goods-producing industries ..................................... 10 – 25Manufacturing ...................................................... 10 25 25
Service-providing industries ..................................... 10 25 25Trade, transportation, and utilities ....................... 10 20 –Information ........................................................... – 20 –Financial activities ................................................ 10 20 –
Finance and insurance .................................... 10 – –Credit intermediation and related activities .. 10 – –
Professional and business services:Professional and technical services ............... 10 25 25
Education and health services ............................. 10 20 –Educational services ........................................ 10 25 10
Junior colleges, colleges, and universities ... 10 25 –Health care and social assistance ................... 10 20 –
See footnotes at end of table.

Table 45. Vision care benefits:1 Median copayments for selected services,private industry workers, 2015—continued
(Includes all workers participating in vision care plans)
Characteristics Eye exams Glasses Contact lenses2
1 to 99 workers:50 to 99 workers ................................................ $10 $15 $25
100 workers or more ................................................ 10 25 25100 to 499 workers .............................................. 10 25 25500 workers or more ............................................ 10 – 25
Geographic areas
Northeast ................................................................. 10 20 –New England ....................................................... 10 20 25Middle Atlantic ..................................................... 10 20 –
South ....................................................................... 10 20 25South Atlantic ....................................................... 10 – 25West South Central .............................................. – 25 25
Midwest .................................................................... 10 25 25East North Central ............................................... 10 25 25West North Central .............................................. 10 25 25
West ......................................................................... 10 25 25Mountain .............................................................. 10 – –
1 Includes plans with employer-provided discount cards if there is a cost to the employer.2 Includes plans that provide coverage for elective purchase of contact lenses; medically necessary contact lenses (for
cataract surgery, for example) normally are provided under the surgical portion of a medical plan and are not described inthis table.
3 Surveyed occupations are classified into wage categories based on the average wage for the occupation, which mayinclude workers with earnings both above and below the threshold. The categories were formed using percentile estimatesgenerated using data from the National Compensation Survey publication, "Employer Costs for Employee Compensation -March 2015."
Note: Dashes indicate that no data were reported or that data do not meet publication criteria. For definitions of major plans,key provisions, and related terms, see the "Glossary of Employee Benefit Terms" atwww.bls.gov/ncs/ebs/glossary20152016.htm.
Source: Bureau of Labor Statistics, National Compensation Survey.

Table 45. Standard errors for vision care benefits:1 Median copayments forselected services, private industry workers, 2015
Characteristics Eye exams Glasses Contact lenses2
Worker characteristics
All workers ............................................................... $0 $6 $0
Management, professional, and related .................. 0 5 0Management, business, and financial ................. 0 4 0Professional and related ...................................... 0 – 3
Service ..................................................................... – 0 0Sales and office ....................................................... 1 – –
Sales and related ................................................. 0 6 0Office and administrative support ........................ 3 5 3
Natural resources, construction, and maintenance – 5 2Installation, maintenance, and repair ................... – 5 1
Production, transportation, and material moving ..... 0 2 0Production ............................................................ 1 – 0Transportation and material moving .................... 0 2 3
Full time ................................................................... 0 7 0Part time .................................................................. 0 1 0
Union ....................................................................... 0 4 0Nonunion ................................................................. 0 5 0
Average wage within the following categories3:Second 25 percent ............................................... 0 7 –Third 25 percent ................................................... 0 4 0Highest 25 percent ............................................... 0 7 0
Highest 10 percent ........................................... 0 6 0
Establishment characteristics
Goods-producing industries ..................................... 0 – 2Manufacturing ...................................................... 0 6 0
Service-providing industries ..................................... 0 5 0Trade, transportation, and utilities ....................... 0 4 –Information ........................................................... – 5 –Financial activities ................................................ 0 4 –
Finance and insurance .................................... 0 – –Credit intermediation and related activities .. 0 – –
Professional and business services:Professional and technical services ............... 1 1 0
Education and health services ............................. 0 5 –Educational services ........................................ 0 0 0
Junior colleges, colleges, and universities ... 0 7 –Health care and social assistance ................... 0 4 –
See footnotes at end of table.

Table 45. Standard errors for vision care benefits:1 Median copayments forselected services, private industry workers, 2015—continued
Characteristics Eye exams Glasses Contact lenses2
1 to 99 workers:50 to 99 workers ................................................ $0 $4 $7
100 workers or more ................................................ 0 1 2100 to 499 workers .............................................. 0 1 2500 workers or more ............................................ 2 – 3
Geographic areas
Northeast ................................................................. 0 2 –New England ....................................................... 3 0 0Middle Atlantic ..................................................... 0 2 –
South ....................................................................... 1 0 1South Atlantic ....................................................... 0 – 5West South Central .............................................. – 6 0
Midwest .................................................................... 0 0 0East North Central ............................................... 0 0 2West North Central .............................................. 0 2 0
West ......................................................................... 0 3 0Mountain .............................................................. 0 – –
1 Includes plans with employer-provided discount cards if there is a cost to the employer.2 Includes plans that provide coverage for elective purchase of contact lenses; medically necessary contact lenses (for
cataract surgery, for example) normally are provided under the surgical portion of a medical plan and are not described inthis table.
3 Surveyed occupations are classified into wage categories based on the average wage for the occupation, which mayinclude workers with earnings both above and below the threshold. The categories were formed using percentile estimatesgenerated using data from the National Compensation Survey publication, "Employer Costs for Employee Compensation -March 2015."
Note: Dashes indicate that no data were reported or that data do not meet publication criteria. For definitions of major plans,key provisions, and related terms, see the "Glossary of Employee Benefit Terms" atwww.bls.gov/ncs/ebs/glossary20152016.htm.
Source: Bureau of Labor Statistics, National Compensation Survey.

Table 46. Defined benefit plans: Availability and eligibility requirements for open plans,1 private industry workers, 2015
(All workers participating in defined benefit plans = 100 percent)
CharacteristicsPlans open to
newemployees
Open to new employees
Plans notopen to newemployees
Notdeterminable
Minimumage andservice
requirement
Minimumage only
requirement
Minimumservice onlyrequirement
No minimumage orservice
requirement
Age andservice
requirementnot
determinable
Worker characteristics
All workers ............................................................... 59 17 – 27 13 – 40 1
Management, professional, and related .................. 52 16 – 21 11 – 48 2( )Management, business, and financial ................. 54 14 – 30 – – 46 2( )Professional and related ...................................... 50 18 – 14 13 – 50 –
Service ..................................................................... 78 – – 42 14 – 22 –Sales and office ....................................................... 55 21 – 19 – – 45 –
Sales and related ................................................. 51 – – 10 – – 49 –Office and administrative support ........................ 57 24 – 22 8 – 43 –
Natural resources, construction, and maintenance 72 – – 48 19 – 27 1Construction, extraction, farming, fishing, andforestry ............................................................... 82 – – 60 22 – – –
Installation, maintenance, and repair ................... 59 – – 32 – – 40 2Production, transportation, and material moving ..... 59 18 – 29 11 – 37 4
Production ............................................................ 42 – – 19 – – 51 6Transportation and material moving .................... 73 26 – 38 – – 25 2
Full time ................................................................... 57 14 – 28 13 – 42 1Part time .................................................................. 75 42 – 21 12 – 25 1
Union ....................................................................... 75 11 – 47 17 – 23 2Nonunion ................................................................. 48 20 – 15 10 – 51 2( )
Average wage within the following categories3:Lowest 25 percent ............................................... 58 28 – 19 – – 39 3Second 25 percent ............................................... 66 27 – 29 9 – 34 2( )Third 25 percent ................................................... 57 17 – 27 12 – 42 2Highest 25 percent ............................................... 57 11 – 28 14 – 42 1
Highest 10 percent ........................................... 55 7 – 28 – – 45 2( )
Establishment characteristics
Goods-producing industries ..................................... 43 – – 27 11 – 54 2Construction ......................................................... 84 – – 61 23 – – –Manufacturing ...................................................... 30 – – 16 – – 67 3
Service-providing industries ..................................... 63 21 – 27 13 – 36 1Trade, transportation, and utilities ....................... 68 30 – 29 9 – 30 2
Wholesale trade ............................................... 70 48 – – – – – –Retail trade ...................................................... 61 35 – – – – 37 2Transportation and warehousing ..................... 76 – – 46 – – – –Utilities ............................................................. 56 – – – – – 44 –
Information ........................................................... 48 – – – – – 52 –Financial activities ................................................ 57 24 – 26 – – 43 –
Finance and insurance .................................... 55 25 – 24 – – 45 –Credit intermediation and related activities .. 59 19 – – – – 41 –Insurance carriers and related activities ...... 58 34 – – – – 42 –
Professional and business services ..................... 63 – – – – – 37 –Education and health services ............................. 58 23 – – 19 – 42 –
Educational services ........................................ 44 – – – – – 56 –Junior colleges, colleges, and universities ... 59 41 – – – – 41 –
Health care and social assistance ................... 61 – – – – – 39 –
See footnotes at end of table.
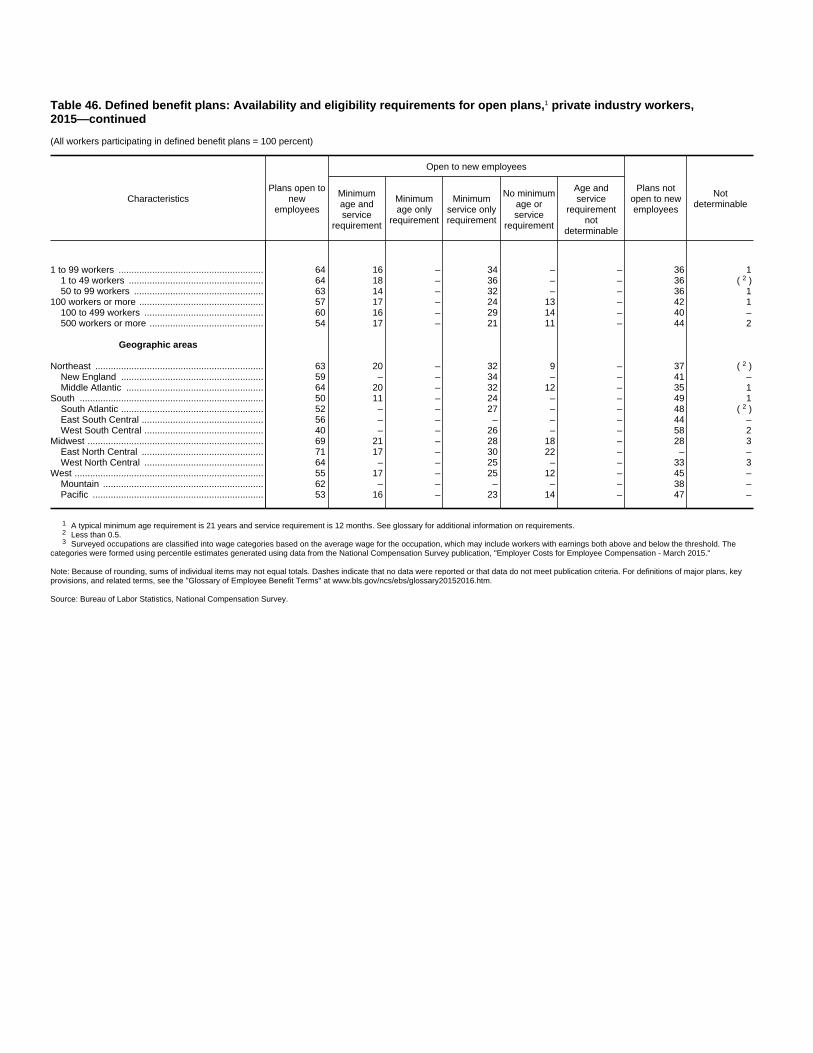
Table 46. Defined benefit plans: Availability and eligibility requirements for open plans,1 private industry workers,2015—continued
(All workers participating in defined benefit plans = 100 percent)
CharacteristicsPlans open to
newemployees
Open to new employees
Plans notopen to newemployees
Notdeterminable
Minimumage andservice
requirement
Minimumage only
requirement
Minimumservice onlyrequirement
No minimumage orservice
requirement
Age andservice
requirementnot
determinable
1 to 99 workers ........................................................ 64 16 – 34 – – 36 11 to 49 workers .................................................... 64 18 – 36 – – 36 2( )50 to 99 workers .................................................. 63 14 – 32 – – 36 1
100 workers or more ................................................ 57 17 – 24 13 – 42 1100 to 499 workers .............................................. 60 16 – 29 14 – 40 –500 workers or more ............................................ 54 17 – 21 11 – 44 2
Geographic areas
Northeast ................................................................. 63 20 – 32 9 – 37 2( )New England ....................................................... 59 – – 34 – – 41 –Middle Atlantic ..................................................... 64 20 – 32 12 – 35 1
South ....................................................................... 50 11 – 24 – – 49 1South Atlantic ....................................................... 52 – – 27 – – 48 2( )East South Central ............................................... 56 – – – – – 44 –West South Central .............................................. 40 – – 26 – – 58 2
Midwest .................................................................... 69 21 – 28 18 – 28 3East North Central ............................................... 71 17 – 30 22 – – –West North Central .............................................. 64 – – 25 – – 33 3
West ......................................................................... 55 17 – 25 12 – 45 –Mountain .............................................................. 62 – – – – – 38 –Pacific .................................................................. 53 16 – 23 14 – 47 –
1 A typical minimum age requirement is 21 years and service requirement is 12 months. See glossary for additional information on requirements.2 Less than 0.5.3 Surveyed occupations are classified into wage categories based on the average wage for the occupation, which may include workers with earnings both above and below the threshold. The
categories were formed using percentile estimates generated using data from the National Compensation Survey publication, "Employer Costs for Employee Compensation - March 2015."
Note: Because of rounding, sums of individual items may not equal totals. Dashes indicate that no data were reported or that data do not meet publication criteria. For definitions of major plans, keyprovisions, and related terms, see the "Glossary of Employee Benefit Terms" at www.bls.gov/ncs/ebs/glossary20152016.htm.
Source: Bureau of Labor Statistics, National Compensation Survey.
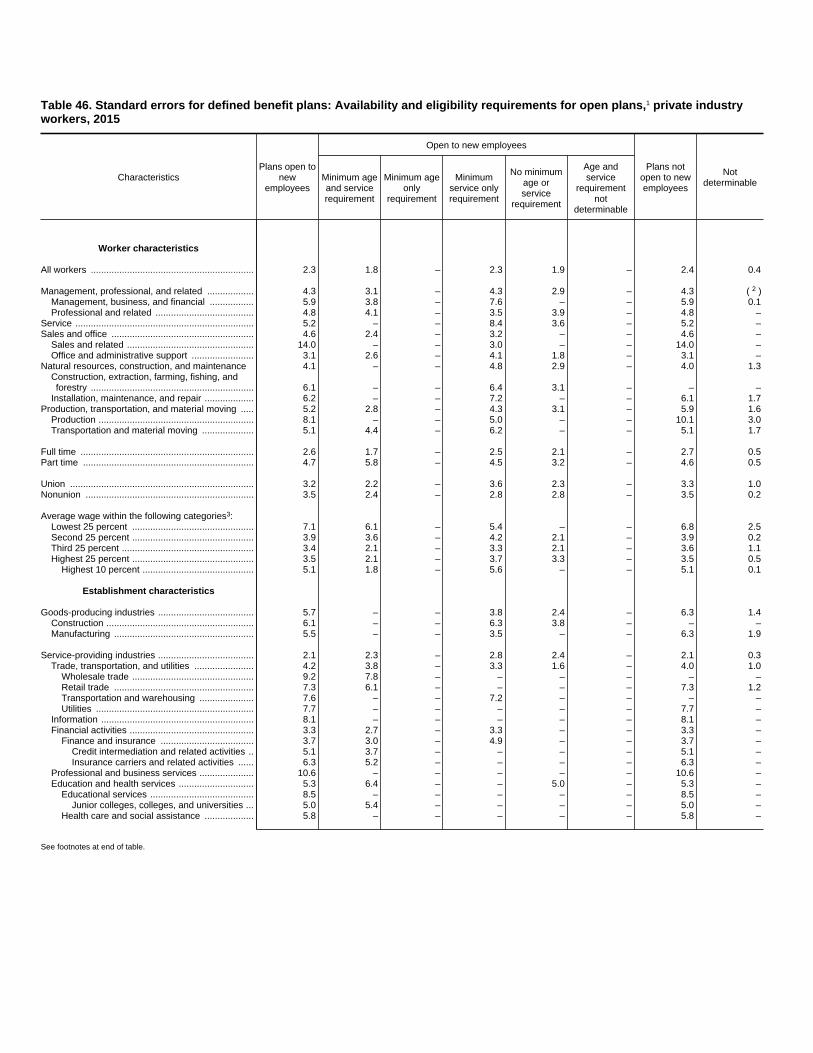
Table 46. Standard errors for defined benefit plans: Availability and eligibility requirements for open plans,1 private industryworkers, 2015
CharacteristicsPlans open to
newemployees
Open to new employees
Plans notopen to newemployees
NotdeterminableMinimum age
and servicerequirement
Minimum ageonly
requirement
Minimumservice onlyrequirement
No minimumage orservice
requirement
Age andservice
requirementnot
determinable
Worker characteristics
All workers ............................................................... 2.3 1.8 – 2.3 1.9 – 2.4 0.4
Management, professional, and related .................. 4.3 3.1 – 4.3 2.9 – 4.3 2( )Management, business, and financial ................. 5.9 3.8 – 7.6 – – 5.9 0.1Professional and related ...................................... 4.8 4.1 – 3.5 3.9 – 4.8 –
Service ..................................................................... 5.2 – – 8.4 3.6 – 5.2 –Sales and office ....................................................... 4.6 2.4 – 3.2 – – 4.6 –
Sales and related ................................................. 14.0 – – 3.0 – – 14.0 –Office and administrative support ........................ 3.1 2.6 – 4.1 1.8 – 3.1 –
Natural resources, construction, and maintenance 4.1 – – 4.8 2.9 – 4.0 1.3Construction, extraction, farming, fishing, andforestry ............................................................... 6.1 – – 6.4 3.1 – – –
Installation, maintenance, and repair ................... 6.2 – – 7.2 – – 6.1 1.7Production, transportation, and material moving ..... 5.2 2.8 – 4.3 3.1 – 5.9 1.6
Production ............................................................ 8.1 – – 5.0 – – 10.1 3.0Transportation and material moving .................... 5.1 4.4 – 6.2 – – 5.1 1.7
Full time ................................................................... 2.6 1.7 – 2.5 2.1 – 2.7 0.5Part time .................................................................. 4.7 5.8 – 4.5 3.2 – 4.6 0.5
Union ....................................................................... 3.2 2.2 – 3.6 2.3 – 3.3 1.0Nonunion ................................................................. 3.5 2.4 – 2.8 2.8 – 3.5 0.2
Average wage within the following categories3:Lowest 25 percent ............................................... 7.1 6.1 – 5.4 – – 6.8 2.5Second 25 percent ............................................... 3.9 3.6 – 4.2 2.1 – 3.9 0.2Third 25 percent ................................................... 3.4 2.1 – 3.3 2.1 – 3.6 1.1Highest 25 percent ............................................... 3.5 2.1 – 3.7 3.3 – 3.5 0.5
Highest 10 percent ........................................... 5.1 1.8 – 5.6 – – 5.1 0.1
Establishment characteristics
Goods-producing industries ..................................... 5.7 – – 3.8 2.4 – 6.3 1.4Construction ......................................................... 6.1 – – 6.3 3.8 – – –Manufacturing ...................................................... 5.5 – – 3.5 – – 6.3 1.9
Service-providing industries ..................................... 2.1 2.3 – 2.8 2.4 – 2.1 0.3Trade, transportation, and utilities ....................... 4.2 3.8 – 3.3 1.6 – 4.0 1.0
Wholesale trade ............................................... 9.2 7.8 – – – – – –Retail trade ...................................................... 7.3 6.1 – – – – 7.3 1.2Transportation and warehousing ..................... 7.6 – – 7.2 – – – –Utilities ............................................................. 7.7 – – – – – 7.7 –
Information ........................................................... 8.1 – – – – – 8.1 –Financial activities ................................................ 3.3 2.7 – 3.3 – – 3.3 –
Finance and insurance .................................... 3.7 3.0 – 4.9 – – 3.7 –Credit intermediation and related activities .. 5.1 3.7 – – – – 5.1 –Insurance carriers and related activities ...... 6.3 5.2 – – – – 6.3 –
Professional and business services ..................... 10.6 – – – – – 10.6 –Education and health services ............................. 5.3 6.4 – – 5.0 – 5.3 –
Educational services ........................................ 8.5 – – – – – 8.5 –Junior colleges, colleges, and universities ... 5.0 5.4 – – – – 5.0 –
Health care and social assistance ................... 5.8 – – – – – 5.8 –
See footnotes at end of table.
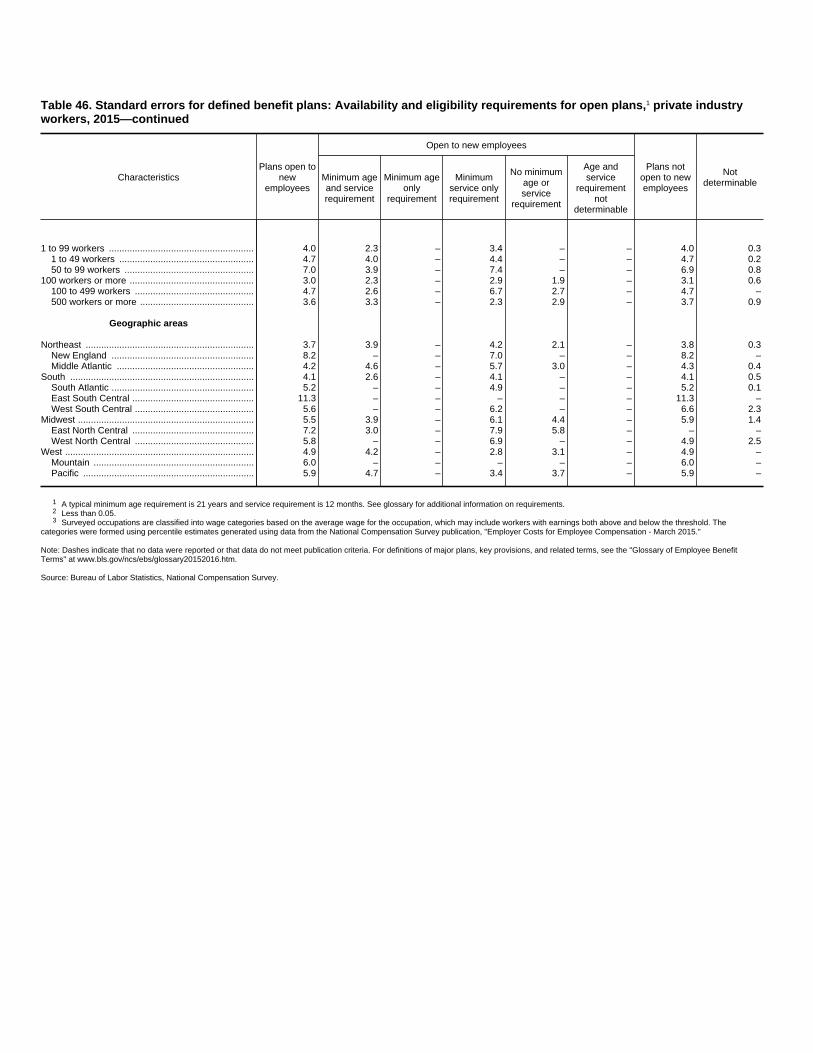
Table 46. Standard errors for defined benefit plans: Availability and eligibility requirements for open plans,1 private industryworkers, 2015—continued
CharacteristicsPlans open to
newemployees
Open to new employees
Plans notopen to newemployees
NotdeterminableMinimum age
and servicerequirement
Minimum ageonly
requirement
Minimumservice onlyrequirement
No minimumage orservice
requirement
Age andservice
requirementnot
determinable
1 to 99 workers ........................................................ 4.0 2.3 – 3.4 – – 4.0 0.31 to 49 workers .................................................... 4.7 4.0 – 4.4 – – 4.7 0.250 to 99 workers .................................................. 7.0 3.9 – 7.4 – – 6.9 0.8
100 workers or more ................................................ 3.0 2.3 – 2.9 1.9 – 3.1 0.6100 to 499 workers .............................................. 4.7 2.6 – 6.7 2.7 – 4.7 –500 workers or more ............................................ 3.6 3.3 – 2.3 2.9 – 3.7 0.9
Geographic areas
Northeast ................................................................. 3.7 3.9 – 4.2 2.1 – 3.8 0.3New England ....................................................... 8.2 – – 7.0 – – 8.2 –Middle Atlantic ..................................................... 4.2 4.6 – 5.7 3.0 – 4.3 0.4
South ....................................................................... 4.1 2.6 – 4.1 – – 4.1 0.5South Atlantic ....................................................... 5.2 – – 4.9 – – 5.2 0.1East South Central ............................................... 11.3 – – – – – 11.3 –West South Central .............................................. 5.6 – – 6.2 – – 6.6 2.3
Midwest .................................................................... 5.5 3.9 – 6.1 4.4 – 5.9 1.4East North Central ............................................... 7.2 3.0 – 7.9 5.8 – – –West North Central .............................................. 5.8 – – 6.9 – – 4.9 2.5
West ......................................................................... 4.9 4.2 – 2.8 3.1 – 4.9 –Mountain .............................................................. 6.0 – – – – – 6.0 –Pacific .................................................................. 5.9 4.7 – 3.4 3.7 – 5.9 –
1 A typical minimum age requirement is 21 years and service requirement is 12 months. See glossary for additional information on requirements.2 Less than 0.05.3 Surveyed occupations are classified into wage categories based on the average wage for the occupation, which may include workers with earnings both above and below the threshold. The
categories were formed using percentile estimates generated using data from the National Compensation Survey publication, "Employer Costs for Employee Compensation - March 2015."
Note: Dashes indicate that no data were reported or that data do not meet publication criteria. For definitions of major plans, key provisions, and related terms, see the "Glossary of Employee BenefitTerms" at www.bls.gov/ncs/ebs/glossary20152016.htm.
Source: Bureau of Labor Statistics, National Compensation Survey.

Table 47. Defined benefit plans: Plan sponsor,1 private industry workers, 2015
(All workers participating in selected defined benefit plans = 100 percent)
Characteristics
All defined benefit plans2 Traditional defined benefitplans4
Nontraditional defined benefitplans5
Singleemployersponsor
Multi-employersponsor3
Singleemployersponsor
Multi-employersponsor3
Singleemployersponsor
Multi-employersponsor3
Worker characteristics
All workers ............................................................... 80 18 71 26 100 –
Management, professional, and related .................. 93 – 87 – 100 –Management, business, and financial ................. 91 – 83 – 100 –Professional and related ...................................... 94 – 89 – 100 –
Service ..................................................................... 52 48 38 62 100 –Sales and office ....................................................... 84 15 75 25 100 –
Sales and related ................................................. 76 – 71 – 100 –Office and administrative support ........................ 88 12 77 22 100 –
Natural resources, construction, and maintenance 54 42 46 49 96 –Construction, extraction, farming, fishing, andforestry ............................................................... 26 68 19 75 – –
Installation, maintenance, and repair ................... 89 – 85 – 100 –Production, transportation, and material moving ..... 80 16 75 20 100 –
Production ............................................................ 86 14 81 19 100 –Transportation and material moving .................... 76 – 72 – 100 –
Full time ................................................................... 83 15 74 23 100 –Part time .................................................................. 59 41 49 51 100 –
Union ....................................................................... 53 43 47 48 98 –Nonunion ................................................................. 97 – 95 – 100 –
Average wage within the following categories6:Lowest 25 percent ............................................... 61 39 47 53 – –Second 25 percent ............................................... 75 24 61 39 100 –Third 25 percent ................................................... 84 14 78 20 100 –Highest 25 percent ............................................... 83 14 74 22 100 –
Highest 10 percent ........................................... 86 – 76 – 100 –
Establishment characteristics
Goods-producing industries ..................................... 76 23 69 29 99 –Construction ......................................................... 27 68 – 78 – –Manufacturing ...................................................... 92 – 89 – 100 –
Service-providing industries ..................................... 82 16 71 25 100 –Trade, transportation, and utilities ....................... 71 24 65 30 100 –
Retail trade ...................................................... 43 57 29 71 – –Transportation and warehousing ..................... 77 – 74 – – –Utilities ............................................................. 97 – 95 – 100 –
Information ........................................................... 100 – 100 – – –Financial activities ................................................ 96 – 89 – 100 –
Finance and insurance .................................... 100 – 100 – 100 –Credit intermediation and related activities .. 100 – 100 – 100 –Insurance carriers and related activities ...... 100 – 100 – 100 –
Professional and business services ..................... 95 – – – – –Education and health services ............................. 91 – 85 – 100 –
Educational services ........................................ 79 – 66 – – –Junior colleges, colleges, and universities ... 97 – 96 – – –
Health care and social assistance ................... 93 – 88 – 100 –
See footnotes at end of table.

Table 47. Defined benefit plans: Plan sponsor,1 private industry workers, 2015—continued
(All workers participating in selected defined benefit plans = 100 percent)
Characteristics
All defined benefit plans2 Traditional defined benefitplans4
Nontraditional defined benefitplans5
Singleemployersponsor
Multi-employersponsor3
Singleemployersponsor
Multi-employersponsor3
Singleemployersponsor
Multi-employersponsor3
1 to 99 workers ........................................................ 71 26 64 33 99 –1 to 49 workers .................................................... 76 24 69 31 98 –50 to 99 workers .................................................. 62 30 57 34 – –
100 workers or more ................................................ 84 15 74 24 100 –100 to 499 workers .............................................. 85 14 77 22 100 –500 workers or more ............................................ 83 15 73 25 100 –
Geographic areas
Northeast ................................................................. 75 22 64 32 99 –New England ....................................................... 69 – 56 – 97 –Middle Atlantic ..................................................... 78 22 67 33 100 –
South ....................................................................... 88 10 83 15 100 –South Atlantic ....................................................... 85 13 79 19 100 –West South Central .............................................. 91 – 86 – 100 –
Midwest .................................................................... 78 20 64 34 100 –East North Central ............................................... 79 21 61 39 100 –West North Central .............................................. 76 20 69 26 100 –
West ......................................................................... 74 23 63 33 100 –Mountain .............................................................. 70 – – – 100 –Pacific .................................................................. 75 22 65 30 100 –
1 Sum of single- and multi-employer sponsor may not equal 100 percent as other plan sponsor types are not included (e.g., employer associations, railroad retirementboards).
2 All workers participating in defined benefit plans = 100 percent.3 Plans established by a labor organization and provided to employees of two or more unrelated companies in accordance with a collective bargaining agreement.4 All workers participating in traditional defined benefit plans = 100 percent. See glossary for definition of traditional plans.5 All workers participating in nontraditional defined benefit plans = 100 percent. See glossary for definition of nontraditional plans.6 Surveyed occupations are classified into wage categories based on the average wage for the occupation, which may include workers with earnings both above and
below the threshold. The categories were formed using percentile estimates generated using data from the National Compensation Survey publication, "Employer Costs forEmployee Compensation - March 2015."
Note: Dashes indicate that no data were reported or that data do not meet publication criteria. For definitions of major plans, key provisions, and related terms, see the"Glossary of Employee Benefit Terms" at www.bls.gov/ncs/ebs/glossary20152016.htm.
Source: Bureau of Labor Statistics, National Compensation Survey.
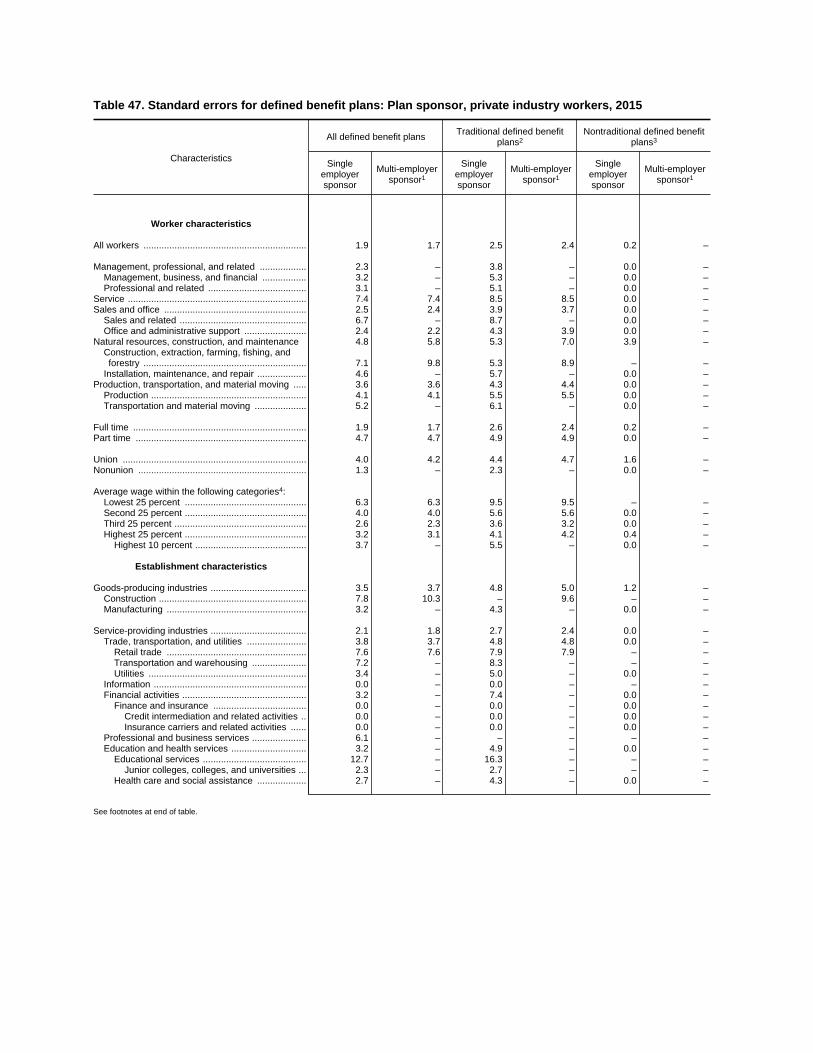
Table 47. Standard errors for defined benefit plans: Plan sponsor, private industry workers, 2015
Characteristics
All defined benefit plans Traditional defined benefitplans2
Nontraditional defined benefitplans3
Singleemployersponsor
Multi-employersponsor1
Singleemployersponsor
Multi-employersponsor1
Singleemployersponsor
Multi-employersponsor1
Worker characteristics
All workers ............................................................... 1.9 1.7 2.5 2.4 0.2 –
Management, professional, and related .................. 2.3 – 3.8 – 0.0 –Management, business, and financial ................. 3.2 – 5.3 – 0.0 –Professional and related ...................................... 3.1 – 5.1 – 0.0 –
Service ..................................................................... 7.4 7.4 8.5 8.5 0.0 –Sales and office ....................................................... 2.5 2.4 3.9 3.7 0.0 –
Sales and related ................................................. 6.7 – 8.7 – 0.0 –Office and administrative support ........................ 2.4 2.2 4.3 3.9 0.0 –
Natural resources, construction, and maintenance 4.8 5.8 5.3 7.0 3.9 –Construction, extraction, farming, fishing, andforestry ............................................................... 7.1 9.8 5.3 8.9 – –
Installation, maintenance, and repair ................... 4.6 – 5.7 – 0.0 –Production, transportation, and material moving ..... 3.6 3.6 4.3 4.4 0.0 –
Production ............................................................ 4.1 4.1 5.5 5.5 0.0 –Transportation and material moving .................... 5.2 – 6.1 – 0.0 –
Full time ................................................................... 1.9 1.7 2.6 2.4 0.2 –Part time .................................................................. 4.7 4.7 4.9 4.9 0.0 –
Union ....................................................................... 4.0 4.2 4.4 4.7 1.6 –Nonunion ................................................................. 1.3 – 2.3 – 0.0 –
Average wage within the following categories4:Lowest 25 percent ............................................... 6.3 6.3 9.5 9.5 – –Second 25 percent ............................................... 4.0 4.0 5.6 5.6 0.0 –Third 25 percent ................................................... 2.6 2.3 3.6 3.2 0.0 –Highest 25 percent ............................................... 3.2 3.1 4.1 4.2 0.4 –
Highest 10 percent ........................................... 3.7 – 5.5 – 0.0 –
Establishment characteristics
Goods-producing industries ..................................... 3.5 3.7 4.8 5.0 1.2 –Construction ......................................................... 7.8 10.3 – 9.6 – –Manufacturing ...................................................... 3.2 – 4.3 – 0.0 –
Service-providing industries ..................................... 2.1 1.8 2.7 2.4 0.0 –Trade, transportation, and utilities ....................... 3.8 3.7 4.8 4.8 0.0 –
Retail trade ...................................................... 7.6 7.6 7.9 7.9 – –Transportation and warehousing ..................... 7.2 – 8.3 – – –Utilities ............................................................. 3.4 – 5.0 – 0.0 –
Information ........................................................... 0.0 – 0.0 – – –Financial activities ................................................ 3.2 – 7.4 – 0.0 –
Finance and insurance .................................... 0.0 – 0.0 – 0.0 –Credit intermediation and related activities .. 0.0 – 0.0 – 0.0 –Insurance carriers and related activities ...... 0.0 – 0.0 – 0.0 –
Professional and business services ..................... 6.1 – – – – –Education and health services ............................. 3.2 – 4.9 – 0.0 –
Educational services ........................................ 12.7 – 16.3 – – –Junior colleges, colleges, and universities ... 2.3 – 2.7 – – –
Health care and social assistance ................... 2.7 – 4.3 – 0.0 –
See footnotes at end of table.

Table 47. Standard errors for defined benefit plans: Plan sponsor, private industry workers,2015—continued
Characteristics
All defined benefit plans Traditional defined benefitplans2
Nontraditional defined benefitplans3
Singleemployersponsor
Multi-employersponsor1
Singleemployersponsor
Multi-employersponsor1
Singleemployersponsor
Multi-employersponsor1
1 to 99 workers ........................................................ 3.8 3.9 4.8 4.9 1.3 –1 to 49 workers .................................................... 4.4 4.4 5.7 5.7 1.6 –50 to 99 workers .................................................. 7.8 7.4 9.0 8.6 – –
100 workers or more ................................................ 1.9 1.7 2.8 2.6 0.0 –100 to 499 workers .............................................. 2.6 2.5 4.5 4.3 0.0 –500 workers or more ............................................ 2.7 2.4 3.7 3.6 0.0 –
Geographic areas
Northeast ................................................................. 4.3 4.1 5.5 5.2 1.0 –New England ....................................................... 6.8 – 10.0 – 3.6 –Middle Atlantic ..................................................... 6.5 6.5 8.3 8.3 0.0 –
South ....................................................................... 2.9 2.2 3.5 2.9 0.0 –South Atlantic ....................................................... 4.1 2.8 5.0 3.8 0.0 –West South Central .............................................. 7.3 – 9.9 – 0.0 –
Midwest .................................................................... 3.0 2.9 4.8 4.8 0.0 –East North Central ............................................... 3.6 3.6 6.8 6.8 0.0 –West North Central .............................................. 5.6 4.6 5.8 5.1 0.0 –
West ......................................................................... 5.1 5.2 7.4 7.3 0.0 –Mountain .............................................................. 5.6 – – – 0.0 –Pacific .................................................................. 6.2 6.3 8.6 8.6 0.0 –
1 Plans established by a labor organization and provided to employees of two or more unrelated companies in accordance with a collective bargaining agreement.2 See glossary for definition of traditional plans.3 See glossary for definition of nontraditional plans.4 Surveyed occupations are classified into wage categories based on the average wage for the occupation, which may include workers with earnings both above and
below the threshold. The categories were formed using percentile estimates generated using data from the National Compensation Survey publication, "Employer Costs forEmployee Compensation - March 2015."
Note: Dashes indicate that no data were reported or that data do not meet publication criteria. For definitions of major plans, key provisions, and related terms, see the"Glossary of Employee Benefit Terms" at www.bls.gov/ncs/ebs/glossary20152016.htm.
Source: Bureau of Labor Statistics, National Compensation Survey.
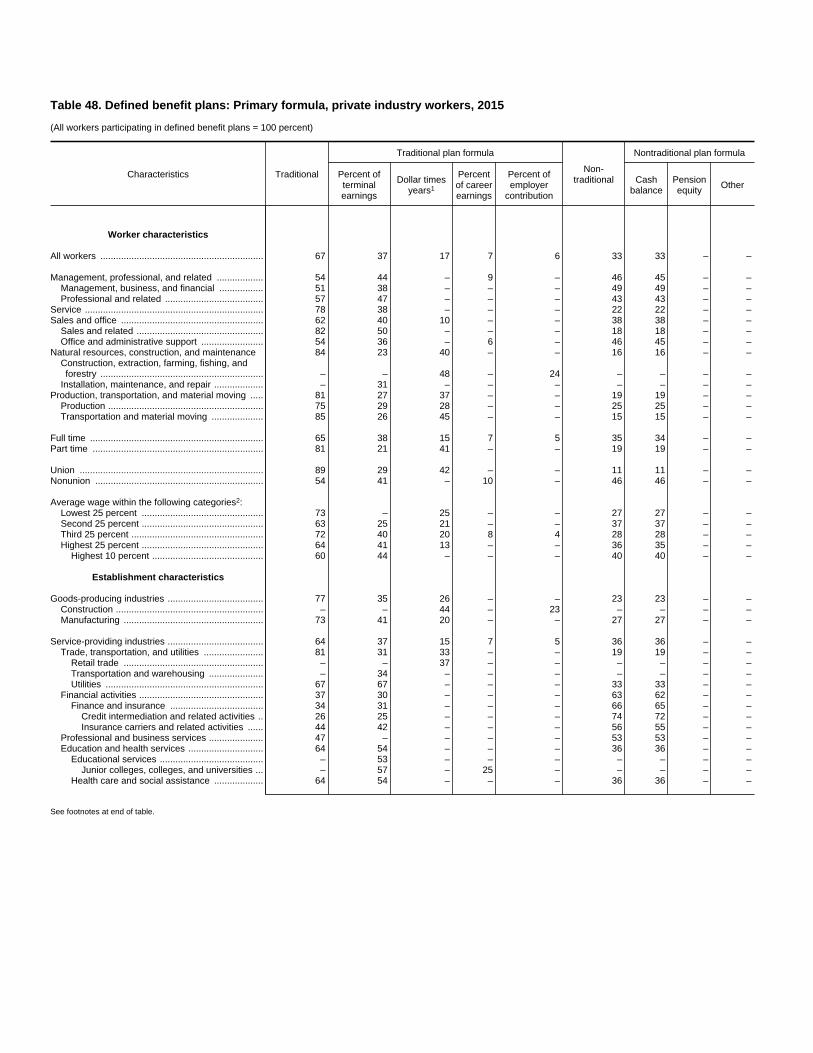
Table 48. Defined benefit plans: Primary formula, private industry workers, 2015
(All workers participating in defined benefit plans = 100 percent)
Characteristics Traditional
Traditional plan formula
Non-traditional
Nontraditional plan formula
Percent ofterminalearnings
Dollar timesyears1
Percentof careerearnings
Percent ofemployer
contribution
Cashbalance
Pensionequity Other
Worker characteristics
All workers ............................................................... 67 37 17 7 6 33 33 – –
Management, professional, and related .................. 54 44 – 9 – 46 45 – –Management, business, and financial ................. 51 38 – – – 49 49 – –Professional and related ...................................... 57 47 – – – 43 43 – –
Service ..................................................................... 78 38 – – – 22 22 – –Sales and office ....................................................... 62 40 10 – – 38 38 – –
Sales and related ................................................. 82 50 – – – 18 18 – –Office and administrative support ........................ 54 36 – 6 – 46 45 – –
Natural resources, construction, and maintenance 84 23 40 – – 16 16 – –Construction, extraction, farming, fishing, andforestry ............................................................... – – 48 – 24 – – – –
Installation, maintenance, and repair ................... – 31 – – – – – – –Production, transportation, and material moving ..... 81 27 37 – – 19 19 – –
Production ............................................................ 75 29 28 – – 25 25 – –Transportation and material moving .................... 85 26 45 – – 15 15 – –
Full time ................................................................... 65 38 15 7 5 35 34 – –Part time .................................................................. 81 21 41 – – 19 19 – –
Union ....................................................................... 89 29 42 – – 11 11 – –Nonunion ................................................................. 54 41 – 10 – 46 46 – –
Average wage within the following categories2:Lowest 25 percent ............................................... 73 – 25 – – 27 27 – –Second 25 percent ............................................... 63 25 21 – – 37 37 – –Third 25 percent ................................................... 72 40 20 8 4 28 28 – –Highest 25 percent ............................................... 64 41 13 – – 36 35 – –
Highest 10 percent ........................................... 60 44 – – – 40 40 – –
Establishment characteristics
Goods-producing industries ..................................... 77 35 26 – – 23 23 – –Construction ......................................................... – – 44 – 23 – – – –Manufacturing ...................................................... 73 41 20 – – 27 27 – –
Service-providing industries ..................................... 64 37 15 7 5 36 36 – –Trade, transportation, and utilities ....................... 81 31 33 – – 19 19 – –
Retail trade ...................................................... – – 37 – – – – – –Transportation and warehousing ..................... – 34 – – – – – – –Utilities ............................................................. 67 67 – – – 33 33 – –
Financial activities ................................................ 37 30 – – – 63 62 – –Finance and insurance .................................... 34 31 – – – 66 65 – –
Credit intermediation and related activities .. 26 25 – – – 74 72 – –Insurance carriers and related activities ...... 44 42 – – – 56 55 – –
Professional and business services ..................... 47 – – – – 53 53 – –Education and health services ............................. 64 54 – – – 36 36 – –
Educational services ........................................ – 53 – – – – – – –Junior colleges, colleges, and universities ... – 57 – 25 – – – – –
Health care and social assistance ................... 64 54 – – – 36 36 – –
See footnotes at end of table.
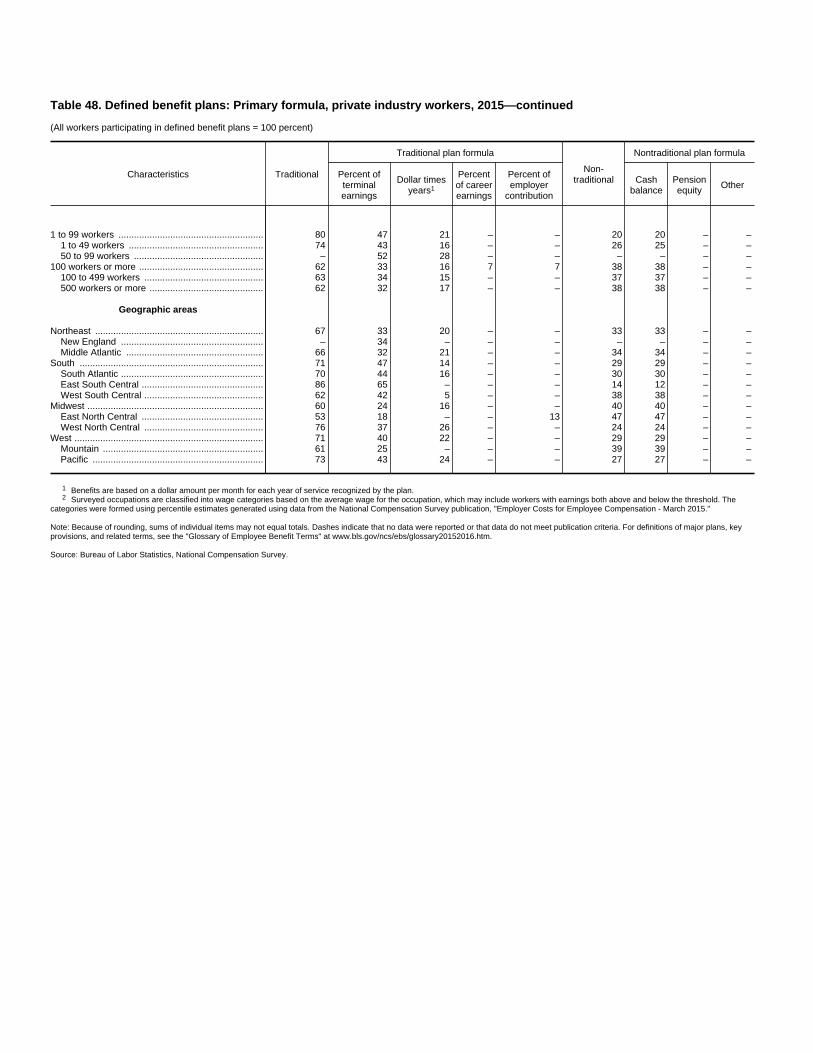
Table 48. Defined benefit plans: Primary formula, private industry workers, 2015—continued
(All workers participating in defined benefit plans = 100 percent)
Characteristics Traditional
Traditional plan formula
Non-traditional
Nontraditional plan formula
Percent ofterminalearnings
Dollar timesyears1
Percentof careerearnings
Percent ofemployer
contribution
Cashbalance
Pensionequity Other
1 to 99 workers ........................................................ 80 47 21 – – 20 20 – –1 to 49 workers .................................................... 74 43 16 – – 26 25 – –50 to 99 workers .................................................. – 52 28 – – – – – –
100 workers or more ................................................ 62 33 16 7 7 38 38 – –100 to 499 workers .............................................. 63 34 15 – – 37 37 – –500 workers or more ............................................ 62 32 17 – – 38 38 – –
Geographic areas
Northeast ................................................................. 67 33 20 – – 33 33 – –New England ....................................................... – 34 – – – – – – –Middle Atlantic ..................................................... 66 32 21 – – 34 34 – –
South ....................................................................... 71 47 14 – – 29 29 – –South Atlantic ....................................................... 70 44 16 – – 30 30 – –East South Central ............................................... 86 65 – – – 14 12 – –West South Central .............................................. 62 42 5 – – 38 38 – –
Midwest .................................................................... 60 24 16 – – 40 40 – –East North Central ............................................... 53 18 – – 13 47 47 – –West North Central .............................................. 76 37 26 – – 24 24 – –
West ......................................................................... 71 40 22 – – 29 29 – –Mountain .............................................................. 61 25 – – – 39 39 – –Pacific .................................................................. 73 43 24 – – 27 27 – –
1 Benefits are based on a dollar amount per month for each year of service recognized by the plan.2 Surveyed occupations are classified into wage categories based on the average wage for the occupation, which may include workers with earnings both above and below the threshold. The
categories were formed using percentile estimates generated using data from the National Compensation Survey publication, "Employer Costs for Employee Compensation - March 2015."
Note: Because of rounding, sums of individual items may not equal totals. Dashes indicate that no data were reported or that data do not meet publication criteria. For definitions of major plans, keyprovisions, and related terms, see the "Glossary of Employee Benefit Terms" at www.bls.gov/ncs/ebs/glossary20152016.htm.
Source: Bureau of Labor Statistics, National Compensation Survey.
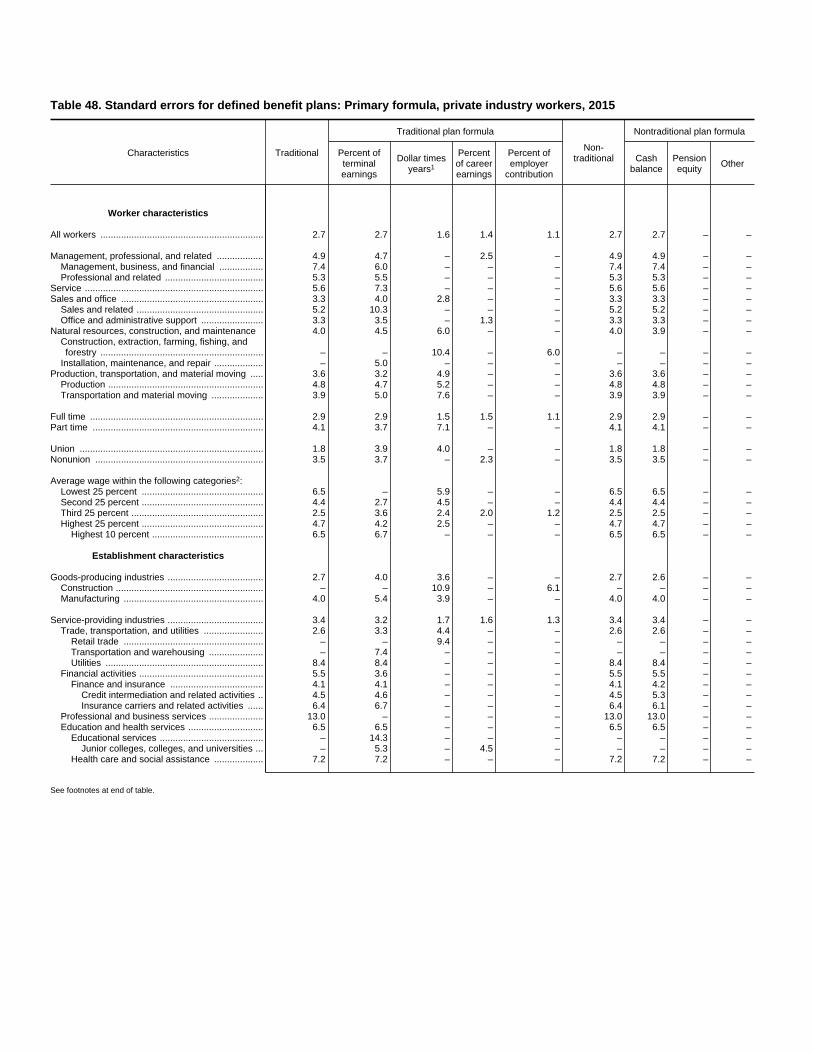
Table 48. Standard errors for defined benefit plans: Primary formula, private industry workers, 2015
Characteristics Traditional
Traditional plan formula
Non-traditional
Nontraditional plan formula
Percent ofterminalearnings
Dollar timesyears1
Percentof careerearnings
Percent ofemployer
contribution
Cashbalance
Pensionequity Other
Worker characteristics
All workers ............................................................... 2.7 2.7 1.6 1.4 1.1 2.7 2.7 – –
Management, professional, and related .................. 4.9 4.7 – 2.5 – 4.9 4.9 – –Management, business, and financial ................. 7.4 6.0 – – – 7.4 7.4 – –Professional and related ...................................... 5.3 5.5 – – – 5.3 5.3 – –
Service ..................................................................... 5.6 7.3 – – – 5.6 5.6 – –Sales and office ....................................................... 3.3 4.0 2.8 – – 3.3 3.3 – –
Sales and related ................................................. 5.2 10.3 – – – 5.2 5.2 – –Office and administrative support ........................ 3.3 3.5 – 1.3 – 3.3 3.3 – –
Natural resources, construction, and maintenance 4.0 4.5 6.0 – – 4.0 3.9 – –Construction, extraction, farming, fishing, andforestry ............................................................... – – 10.4 – 6.0 – – – –
Installation, maintenance, and repair ................... – 5.0 – – – – – – –Production, transportation, and material moving ..... 3.6 3.2 4.9 – – 3.6 3.6 – –
Production ............................................................ 4.8 4.7 5.2 – – 4.8 4.8 – –Transportation and material moving .................... 3.9 5.0 7.6 – – 3.9 3.9 – –
Full time ................................................................... 2.9 2.9 1.5 1.5 1.1 2.9 2.9 – –Part time .................................................................. 4.1 3.7 7.1 – – 4.1 4.1 – –
Union ....................................................................... 1.8 3.9 4.0 – – 1.8 1.8 – –Nonunion ................................................................. 3.5 3.7 – 2.3 – 3.5 3.5 – –
Average wage within the following categories2:Lowest 25 percent ............................................... 6.5 – 5.9 – – 6.5 6.5 – –Second 25 percent ............................................... 4.4 2.7 4.5 – – 4.4 4.4 – –Third 25 percent ................................................... 2.5 3.6 2.4 2.0 1.2 2.5 2.5 – –Highest 25 percent ............................................... 4.7 4.2 2.5 – – 4.7 4.7 – –
Highest 10 percent ........................................... 6.5 6.7 – – – 6.5 6.5 – –
Establishment characteristics
Goods-producing industries ..................................... 2.7 4.0 3.6 – – 2.7 2.6 – –Construction ......................................................... – – 10.9 – 6.1 – – – –Manufacturing ...................................................... 4.0 5.4 3.9 – – 4.0 4.0 – –
Service-providing industries ..................................... 3.4 3.2 1.7 1.6 1.3 3.4 3.4 – –Trade, transportation, and utilities ....................... 2.6 3.3 4.4 – – 2.6 2.6 – –
Retail trade ...................................................... – – 9.4 – – – – – –Transportation and warehousing ..................... – 7.4 – – – – – – –Utilities ............................................................. 8.4 8.4 – – – 8.4 8.4 – –
Financial activities ................................................ 5.5 3.6 – – – 5.5 5.5 – –Finance and insurance .................................... 4.1 4.1 – – – 4.1 4.2 – –
Credit intermediation and related activities .. 4.5 4.6 – – – 4.5 5.3 – –Insurance carriers and related activities ...... 6.4 6.7 – – – 6.4 6.1 – –
Professional and business services ..................... 13.0 – – – – 13.0 13.0 – –Education and health services ............................. 6.5 6.5 – – – 6.5 6.5 – –
Educational services ........................................ – 14.3 – – – – – – –Junior colleges, colleges, and universities ... – 5.3 – 4.5 – – – – –
Health care and social assistance ................... 7.2 7.2 – – – 7.2 7.2 – –
See footnotes at end of table.

Table 48. Standard errors for defined benefit plans: Primary formula, private industry workers, 2015—continued
Characteristics Traditional
Traditional plan formula
Non-traditional
Nontraditional plan formula
Percent ofterminalearnings
Dollar timesyears1
Percentof careerearnings
Percent ofemployer
contribution
Cashbalance
Pensionequity Other
1 to 99 workers ........................................................ 4.0 4.9 2.9 – – 4.0 4.0 – –1 to 49 workers .................................................... 4.7 4.7 3.6 – – 4.7 4.7 – –50 to 99 workers .................................................. – 10.0 7.0 – – – – – –
100 workers or more ................................................ 3.2 2.9 1.8 1.6 1.4 3.2 3.2 – –100 to 499 workers .............................................. 5.2 5.5 2.6 – – 5.2 5.2 – –500 workers or more ............................................ 3.9 3.4 2.6 – – 3.9 3.9 – –
Geographic areas
Northeast ................................................................. 4.8 3.7 2.8 – – 4.8 4.8 – –New England ....................................................... – 7.7 – – – – – – –Middle Atlantic ..................................................... 5.1 4.1 3.5 – – 5.1 5.1 – –
South ....................................................................... 4.3 5.0 2.7 – – 4.3 4.3 – –South Atlantic ....................................................... 5.7 6.2 3.1 – – 5.7 5.7 – –East South Central ............................................... 3.7 13.8 – – – 3.7 2.5 – –West South Central .............................................. 10.8 6.7 1.0 – – 10.8 10.8 – –
Midwest .................................................................... 5.4 4.4 2.4 – – 5.4 5.4 – –East North Central ............................................... 6.5 5.1 – – 2.4 6.5 6.5 – –West North Central .............................................. 5.0 5.5 7.3 – – 5.0 5.0 – –
West ......................................................................... 6.6 7.3 5.2 – – 6.6 6.6 – –Mountain .............................................................. 8.3 7.4 – – – 8.3 8.3 – –Pacific .................................................................. 7.6 8.5 5.1 – – 7.6 7.6 – –
1 Benefits are based on a dollar amount per month for each year of service recognized by the plan.2 Surveyed occupations are classified into wage categories based on the average wage for the occupation, which may include workers with earnings both above and below the threshold. The
categories were formed using percentile estimates generated using data from the National Compensation Survey publication, "Employer Costs for Employee Compensation - March 2015."
Note: Dashes indicate that no data were reported or that data do not meet publication criteria. For definitions of major plans, key provisions, and related terms, see the "Glossary of Employee BenefitTerms" at www.bls.gov/ncs/ebs/glossary20152016.htm.
Source: Bureau of Labor Statistics, National Compensation Survey.
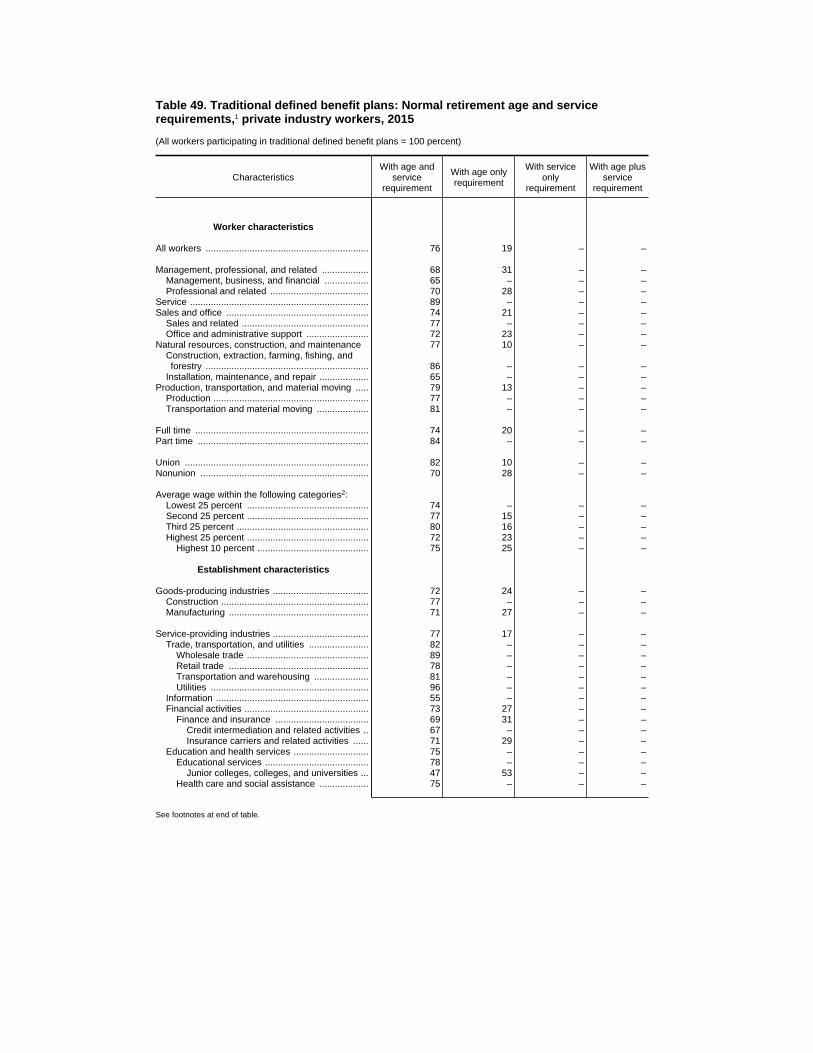
Table 49. Traditional defined benefit plans: Normal retirement age and servicerequirements,1 private industry workers, 2015
(All workers participating in traditional defined benefit plans = 100 percent)
CharacteristicsWith age and
servicerequirement
With age onlyrequirement
With serviceonly
requirement
With age plusservice
requirement
Worker characteristics
All workers ............................................................... 76 19 – –
Management, professional, and related .................. 68 31 – –Management, business, and financial ................. 65 – – –Professional and related ...................................... 70 28 – –
Service ..................................................................... 89 – – –Sales and office ....................................................... 74 21 – –
Sales and related ................................................. 77 – – –Office and administrative support ........................ 72 23 – –
Natural resources, construction, and maintenance 77 10 – –Construction, extraction, farming, fishing, andforestry ............................................................... 86 – – –
Installation, maintenance, and repair ................... 65 – – –Production, transportation, and material moving ..... 79 13 – –
Production ............................................................ 77 – – –Transportation and material moving .................... 81 – – –
Full time ................................................................... 74 20 – –Part time .................................................................. 84 – – –
Union ....................................................................... 82 10 – –Nonunion ................................................................. 70 28 – –
Average wage within the following categories2:Lowest 25 percent ............................................... 74 – – –Second 25 percent ............................................... 77 15 – –Third 25 percent ................................................... 80 16 – –Highest 25 percent ............................................... 72 23 – –
Highest 10 percent ........................................... 75 25 – –
Establishment characteristics
Goods-producing industries ..................................... 72 24 – –Construction ......................................................... 77 – – –Manufacturing ...................................................... 71 27 – –
Service-providing industries ..................................... 77 17 – –Trade, transportation, and utilities ....................... 82 – – –
Wholesale trade ............................................... 89 – – –Retail trade ...................................................... 78 – – –Transportation and warehousing ..................... 81 – – –Utilities ............................................................. 96 – – –
Information ........................................................... 55 – – –Financial activities ................................................ 73 27 – –
Finance and insurance .................................... 69 31 – –Credit intermediation and related activities .. 67 – – –Insurance carriers and related activities ...... 71 29 – –
Education and health services ............................. 75 – – –Educational services ........................................ 78 – – –
Junior colleges, colleges, and universities ... 47 53 – –Health care and social assistance ................... 75 – – –
See footnotes at end of table.
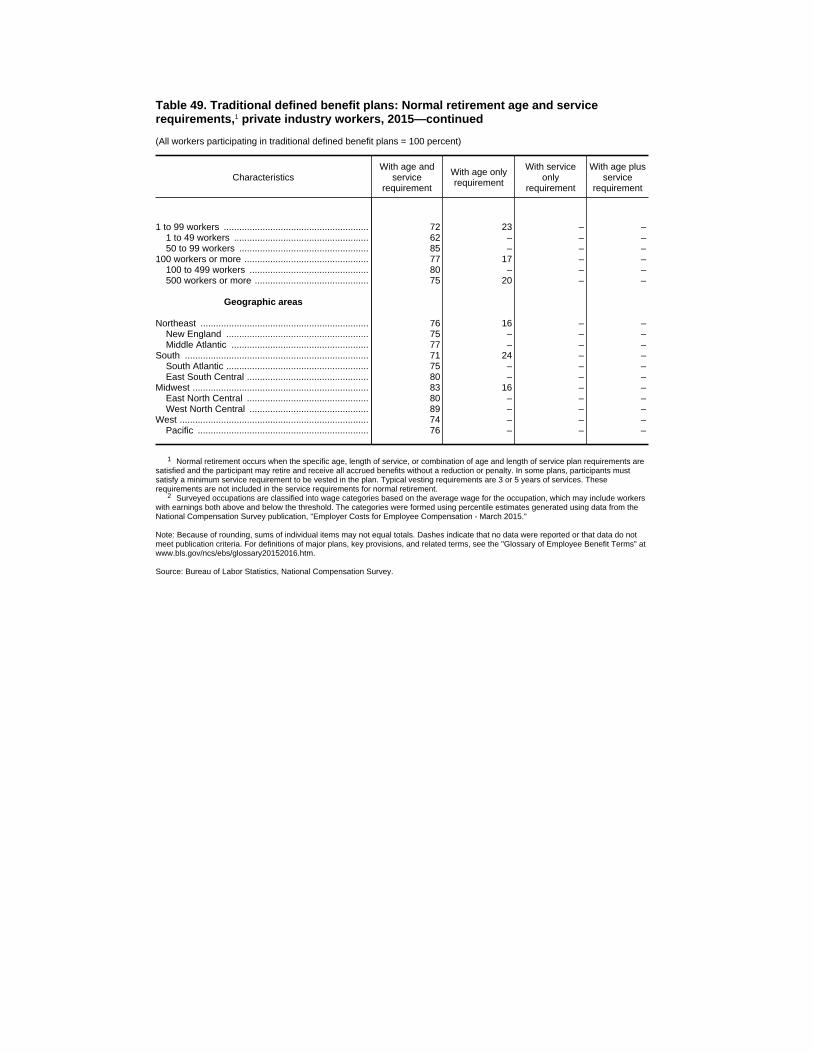
Table 49. Traditional defined benefit plans: Normal retirement age and servicerequirements,1 private industry workers, 2015—continued
(All workers participating in traditional defined benefit plans = 100 percent)
CharacteristicsWith age and
servicerequirement
With age onlyrequirement
With serviceonly
requirement
With age plusservice
requirement
1 to 99 workers ........................................................ 72 23 – –1 to 49 workers .................................................... 62 – – –50 to 99 workers .................................................. 85 – – –
100 workers or more ................................................ 77 17 – –100 to 499 workers .............................................. 80 – – –500 workers or more ............................................ 75 20 – –
Geographic areas
Northeast ................................................................. 76 16 – –New England ....................................................... 75 – – –Middle Atlantic ..................................................... 77 – – –
South ....................................................................... 71 24 – –South Atlantic ....................................................... 75 – – –East South Central ............................................... 80 – – –
Midwest .................................................................... 83 16 – –East North Central ............................................... 80 – – –West North Central .............................................. 89 – – –
West ......................................................................... 74 – – –Pacific .................................................................. 76 – – –
1 Normal retirement occurs when the specific age, length of service, or combination of age and length of service plan requirements aresatisfied and the participant may retire and receive all accrued benefits without a reduction or penalty. In some plans, participants mustsatisfy a minimum service requirement to be vested in the plan. Typical vesting requirements are 3 or 5 years of services. Theserequirements are not included in the service requirements for normal retirement.
2 Surveyed occupations are classified into wage categories based on the average wage for the occupation, which may include workerswith earnings both above and below the threshold. The categories were formed using percentile estimates generated using data from theNational Compensation Survey publication, "Employer Costs for Employee Compensation - March 2015."
Note: Because of rounding, sums of individual items may not equal totals. Dashes indicate that no data were reported or that data do notmeet publication criteria. For definitions of major plans, key provisions, and related terms, see the "Glossary of Employee Benefit Terms" atwww.bls.gov/ncs/ebs/glossary20152016.htm.
Source: Bureau of Labor Statistics, National Compensation Survey.

Table 49. Standard errors for traditional defined benefit plans: Normal retirement ageand service requirements,1 private industry workers, 2015
CharacteristicsWith age and
servicerequirement
With age onlyrequirement
With serviceonly
requirement
With age plusservice
requirement
Worker characteristics
All workers ............................................................... 3.2 2.9 – –
Management, professional, and related .................. 6.4 6.4 – –Management, business, and financial ................. 11.6 – – –Professional and related ...................................... 6.9 6.8 – –
Service ..................................................................... 4.6 – – –Sales and office ....................................................... 4.5 4.1 – –
Sales and related ................................................. 7.7 – – –Office and administrative support ........................ 5.3 4.8 – –
Natural resources, construction, and maintenance 4.4 2.5 – –Construction, extraction, farming, fishing, andforestry ............................................................... 5.7 – – –
Installation, maintenance, and repair ................... 6.9 – – –Production, transportation, and material moving ..... 5.3 3.4 – –
Production ............................................................ 6.9 – – –Transportation and material moving .................... 7.4 – – –
Full time ................................................................... 3.5 3.3 – –Part time .................................................................. 5.6 – – –
Union ....................................................................... 3.5 2.4 – –Nonunion ................................................................. 4.8 4.6 – –
Average wage within the following categories2:Lowest 25 percent ............................................... 8.4 – – –Second 25 percent ............................................... 5.7 3.9 – –Third 25 percent ................................................... 3.5 3.2 – –Highest 25 percent ............................................... 4.8 4.7 – –
Highest 10 percent ........................................... 7.2 7.2 – –
Establishment characteristics
Goods-producing industries ..................................... 5.6 5.5 – –Construction ......................................................... 8.3 – – –Manufacturing ...................................................... 6.5 6.7 – –
Service-providing industries ..................................... 3.9 3.5 – –Trade, transportation, and utilities ....................... 5.2 – – –
Wholesale trade ............................................... 11.1 – – –Retail trade ...................................................... 6.4 – – –Transportation and warehousing ..................... 8.8 – – –Utilities ............................................................. 3.9 – – –
Information ........................................................... 12.5 – – –Financial activities ................................................ 6.4 6.4 – –
Finance and insurance .................................... 6.7 6.7 – –Credit intermediation and related activities .. 10.4 – – –Insurance carriers and related activities ...... 8.7 8.7 – –
Education and health services ............................. 7.1 – – –Educational services ........................................ 7.1 – – –
Junior colleges, colleges, and universities ... 5.4 5.4 – –Health care and social assistance ................... 8.2 – – –
See footnotes at end of table.
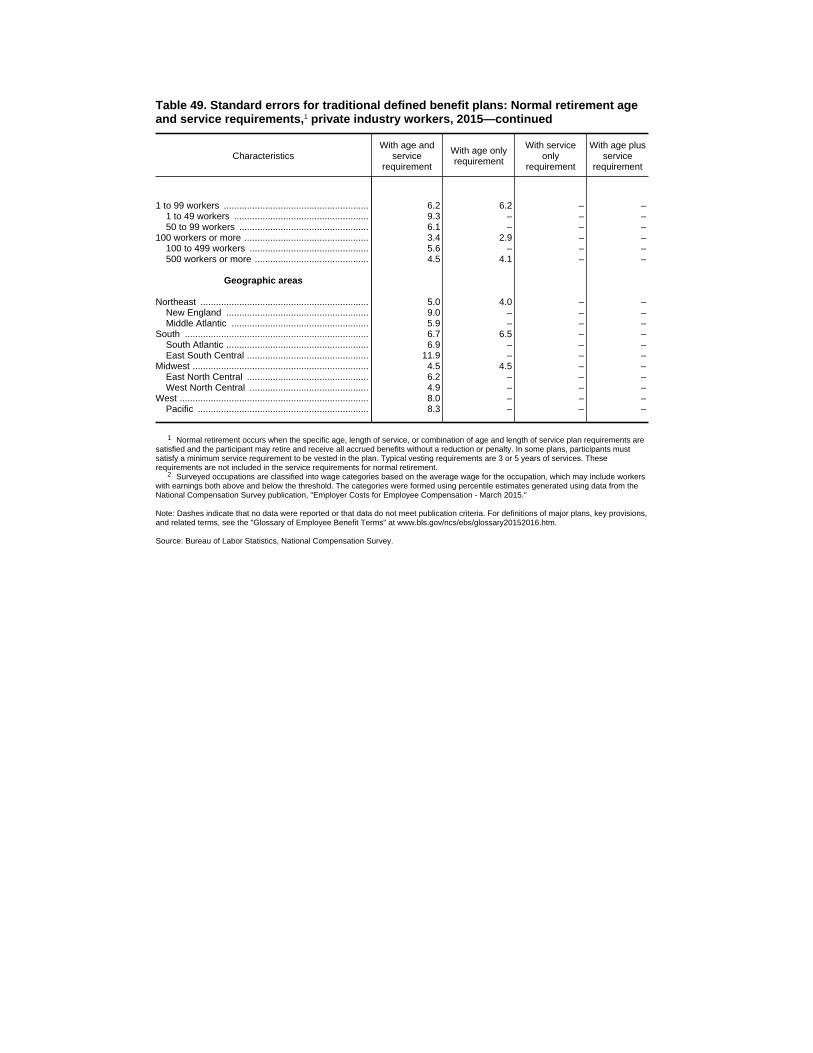
Table 49. Standard errors for traditional defined benefit plans: Normal retirement ageand service requirements,1 private industry workers, 2015—continued
CharacteristicsWith age and
servicerequirement
With age onlyrequirement
With serviceonly
requirement
With age plusservice
requirement
1 to 99 workers ........................................................ 6.2 6.2 – –1 to 49 workers .................................................... 9.3 – – –50 to 99 workers .................................................. 6.1 – – –
100 workers or more ................................................ 3.4 2.9 – –100 to 499 workers .............................................. 5.6 – – –500 workers or more ............................................ 4.5 4.1 – –
Geographic areas
Northeast ................................................................. 5.0 4.0 – –New England ....................................................... 9.0 – – –Middle Atlantic ..................................................... 5.9 – – –
South ....................................................................... 6.7 6.5 – –South Atlantic ....................................................... 6.9 – – –East South Central ............................................... 11.9 – – –
Midwest .................................................................... 4.5 4.5 – –East North Central ............................................... 6.2 – – –West North Central .............................................. 4.9 – – –
West ......................................................................... 8.0 – – –Pacific .................................................................. 8.3 – – –
1 Normal retirement occurs when the specific age, length of service, or combination of age and length of service plan requirements aresatisfied and the participant may retire and receive all accrued benefits without a reduction or penalty. In some plans, participants mustsatisfy a minimum service requirement to be vested in the plan. Typical vesting requirements are 3 or 5 years of services. Theserequirements are not included in the service requirements for normal retirement.
2 Surveyed occupations are classified into wage categories based on the average wage for the occupation, which may include workerswith earnings both above and below the threshold. The categories were formed using percentile estimates generated using data from theNational Compensation Survey publication, "Employer Costs for Employee Compensation - March 2015."
Note: Dashes indicate that no data were reported or that data do not meet publication criteria. For definitions of major plans, key provisions,and related terms, see the "Glossary of Employee Benefit Terms" at www.bls.gov/ncs/ebs/glossary20152016.htm.
Source: Bureau of Labor Statistics, National Compensation Survey.

Table 50. Traditional defined benefit plans: Selected normal retirement agerequirements,1 private industry workers, 2015
(All workers participating in traditional defined benefit plans = 100 percent)
Characteristics
Age less than 65 Age 65
Less than 10years ofservice2
10 years ormore ofservice
Less than 10years ofservice2
10 years ormore ofservice
Worker characteristics
All workers ............................................................... 15 25 57 –
Management, professional, and related .................. – 22 68 –Management, business, and financial ................. 18 23 60 –Professional and related ...................................... – 21 73 –
Service ..................................................................... – – 54 –Sales and office ....................................................... 8 13 76 –
Sales and related ................................................. – – 87 –Office and administrative support ........................ 11 19 68 –
Natural resources, construction, and maintenance 26 38 34 –Construction, extraction, farming, fishing, andforestry ............................................................... 40 35 24 –
Installation, maintenance, and repair ................... – 44 49 –Production, transportation, and material moving ..... 19 32 43 –
Production ............................................................ – 38 54 –Transportation and material moving .................... – 28 35 –
Full time ................................................................... 16 27 55 –Part time .................................................................. – – 70 –
Union ....................................................................... 22 30 43 –Nonunion ................................................................. 9 20 70 –
Average wage within the following categories3:Lowest 25 percent ............................................... – – 68 –Second 25 percent ............................................... – 13 61 –Third 25 percent ................................................... 13 28 57 –Highest 25 percent ............................................... 18 28 53 –
Highest 10 percent ........................................... 21 – 58 –
Establishment characteristics
Goods-producing industries ..................................... 17 31 51 –Construction ......................................................... 41 30 28 –Manufacturing ...................................................... – 32 60 –
Service-providing industries ..................................... 15 23 59 –Trade, transportation, and utilities ....................... 18 23 50 –
Wholesale trade ............................................... – – – –Retail trade ...................................................... – – 84 –Transportation and warehousing ..................... – – 33 –Utilities ............................................................. – 47 45 –
Information ........................................................... – 44 53 –Financial activities ................................................ – – 67 –
Finance and insurance .................................... – – 67 –Credit intermediation and related activities .. – – – –Insurance carriers and related activities ...... – – 56 –
Education and health services ............................. – – 71 –Educational services ........................................ – – 53 –
Junior colleges, colleges, and universities ... – – 64 –Health care and social assistance ................... – – 74 –
See footnotes at end of table.

Table 50. Traditional defined benefit plans: Selected normal retirement agerequirements,1 private industry workers, 2015—continued
(All workers participating in traditional defined benefit plans = 100 percent)
Characteristics
Normal retirement age requirements
10thpercentile
25thpercentile
50thpercentile(median)
75thpercentile
90thpercentile
Worker characteristics
All workers ............................................................... 60 62 65 65 65
Management, professional, and related .................. 60 62 65 65 65Management, business, and financial ................. 60 60 65 65 65Professional and related ...................................... 60 62 65 65 65
Service ..................................................................... 60 62 65 65 65Sales and office ....................................................... 62 65 65 65 65
Sales and related ................................................. 65 65 65 65 65Office and administrative support ........................ 60 62 65 65 65
Natural resources, construction, and maintenance 60 62 62 65 65Construction, extraction, farming, fishing, andforestry ............................................................... 58 60 62 65 65
Installation, maintenance, and repair ................... 60 62 65 65 65Production, transportation, and material moving ..... 60 62 62 65 65
Production ............................................................ 62 62 65 65 65Transportation and material moving .................... 60 62 62 65 65
Full time ................................................................... 60 62 65 65 65Part time .................................................................. 60 65 65 65 65
Union ....................................................................... 60 62 62 65 65Nonunion ................................................................. 60 62 65 65 65
Average wage within the following categories3:Lowest 25 percent ............................................... 62 65 65 65 65Second 25 percent ............................................... 60 62 65 65 65Third 25 percent ................................................... 60 62 65 65 65Highest 25 percent ............................................... 60 62 65 65 65
Highest 10 percent ........................................... 60 62 65 65 65
Establishment characteristics
Goods-producing industries ..................................... 60 62 65 65 65Construction ......................................................... 58 62 62 65 65Manufacturing ...................................................... 60 62 65 65 65
Service-providing industries ..................................... 60 62 65 65 65Trade, transportation, and utilities ....................... 60 62 65 65 65
Wholesale trade ............................................... 60 62 65 65 65Retail trade ...................................................... 65 65 65 65 65Transportation and warehousing ..................... 60 60 62 65 65Utilities ............................................................. 55 55 62 65 65
Information ........................................................... 55 65 65 65 65Financial activities ................................................ 62 62 65 65 65
Finance and insurance .................................... 62 62 65 65 65Credit intermediation and related activities .. 62 65 65 65 65Insurance carriers and related activities ...... 62 62 65 65 65
Education and health services ............................. 60 65 65 65 65Educational services ........................................ 60 60 65 65 65
Junior colleges, colleges, and universities ... 60 62 65 65 65Health care and social assistance ................... 62 65 65 65 65
See footnotes at end of table.

Table 50. Traditional defined benefit plans: Selected normal retirement agerequirements,1 private industry workers, 2015—continued
(All workers participating in traditional defined benefit plans = 100 percent)
Characteristics
Age less than 65 Age 65
Less than 10years ofservice2
10 years ormore ofservice
Less than 10years ofservice2
10 years ormore ofservice
1 to 99 workers ........................................................ 17 19 61 –1 to 49 workers .................................................... – 21 62 –50 to 99 workers .................................................. – – 60 –
100 workers or more ................................................ 14 28 55 –100 to 499 workers .............................................. 11 32 57 –500 workers or more ............................................ 17 25 54 –
Geographic areas
Northeast ................................................................. – 29 58 –New England ....................................................... – – 59 –Middle Atlantic ..................................................... – 32 58 –
South ....................................................................... 16 23 61 –South Atlantic ....................................................... 14 – 62 –East South Central ............................................... – – 56 –West South Central .............................................. – – 59 –
Midwest .................................................................... – 30 56 –East North Central ............................................... – 29 57 –West North Central .............................................. – 31 54 –
West ......................................................................... 21 20 49 –Mountain .............................................................. – – – –Pacific .................................................................. 20 21 53 –
See footnotes at end of table.

Table 50. Traditional defined benefit plans: Selected normal retirement agerequirements,1 private industry workers, 2015—continued
(All workers participating in traditional defined benefit plans = 100 percent)
Characteristics
Normal retirement age requirements
10thpercentile
25thpercentile
50thpercentile(median)
75thpercentile
90thpercentile
1 to 99 workers ........................................................ 60 62 65 65 651 to 49 workers .................................................... 60 62 65 65 6550 to 99 workers .................................................. 60 62 65 65 65
100 workers or more ................................................ 60 62 65 65 65100 to 499 workers .............................................. 60 62 65 65 65500 workers or more ............................................ 60 62 65 65 65
Geographic areas
Northeast ................................................................. 60 62 65 65 65New England ....................................................... 60 62 65 65 65Middle Atlantic ..................................................... 60 62 65 65 65
South ....................................................................... 60 62 65 65 65South Atlantic ....................................................... 60 62 65 65 65East South Central ............................................... 62 62 65 65 65West South Central .............................................. 60 62 65 65 65
Midwest .................................................................... 60 62 65 65 65East North Central ............................................... 60 62 65 65 65West North Central .............................................. – 60 65 65 65
West ......................................................................... 60 62 65 65 65Mountain .............................................................. 62 62 62 65 65Pacific .................................................................. 60 62 65 65 65
1 Normal retirement occurs when the specific age, length of service, or combination of age and length of service plan requirementsare satisfied and the participant may retire and receive all accrued benefits without a reduction or penalty.
2 Includes workers in plans with no minimum service requirements.3 Surveyed occupations are classified into wage categories based on the average wage for the occupation, which may include
workers with earnings both above and below the threshold. The categories were formed using percentile estimates generated usingdata from the National Compensation Survey publication, "Employer Costs for Employee Compensation - March 2015."
Note: Dashes indicate that no data were reported or that data do not meet publication criteria. For definitions of major plans, keyprovisions, and related terms, see the "Glossary of Employee Benefit Terms" at www.bls.gov/ncs/ebs/glossary20152016.htm.
Source: Bureau of Labor Statistics, National Compensation Survey.
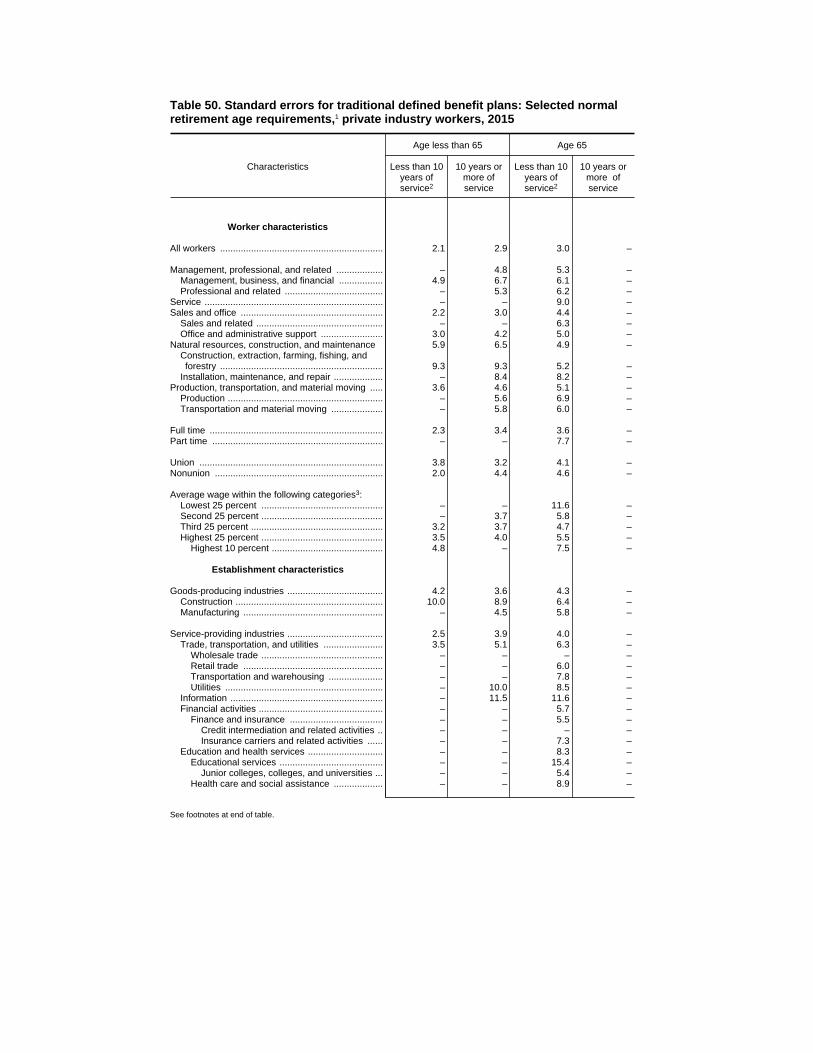
Table 50. Standard errors for traditional defined benefit plans: Selected normalretirement age requirements,1 private industry workers, 2015
Characteristics
Age less than 65 Age 65
Less than 10years ofservice2
10 years ormore ofservice
Less than 10years ofservice2
10 years ormore ofservice
Worker characteristics
All workers ............................................................... 2.1 2.9 3.0 –
Management, professional, and related .................. – 4.8 5.3 –Management, business, and financial ................. 4.9 6.7 6.1 –Professional and related ...................................... – 5.3 6.2 –
Service ..................................................................... – – 9.0 –Sales and office ....................................................... 2.2 3.0 4.4 –
Sales and related ................................................. – – 6.3 –Office and administrative support ........................ 3.0 4.2 5.0 –
Natural resources, construction, and maintenance 5.9 6.5 4.9 –Construction, extraction, farming, fishing, andforestry ............................................................... 9.3 9.3 5.2 –
Installation, maintenance, and repair ................... – 8.4 8.2 –Production, transportation, and material moving ..... 3.6 4.6 5.1 –
Production ............................................................ – 5.6 6.9 –Transportation and material moving .................... – 5.8 6.0 –
Full time ................................................................... 2.3 3.4 3.6 –Part time .................................................................. – – 7.7 –
Union ....................................................................... 3.8 3.2 4.1 –Nonunion ................................................................. 2.0 4.4 4.6 –
Average wage within the following categories3:Lowest 25 percent ............................................... – – 11.6 –Second 25 percent ............................................... – 3.7 5.8 –Third 25 percent ................................................... 3.2 3.7 4.7 –Highest 25 percent ............................................... 3.5 4.0 5.5 –
Highest 10 percent ........................................... 4.8 – 7.5 –
Establishment characteristics
Goods-producing industries ..................................... 4.2 3.6 4.3 –Construction ......................................................... 10.0 8.9 6.4 –Manufacturing ...................................................... – 4.5 5.8 –
Service-providing industries ..................................... 2.5 3.9 4.0 –Trade, transportation, and utilities ....................... 3.5 5.1 6.3 –
Wholesale trade ............................................... – – – –Retail trade ...................................................... – – 6.0 –Transportation and warehousing ..................... – – 7.8 –Utilities ............................................................. – 10.0 8.5 –
Information ........................................................... – 11.5 11.6 –Financial activities ................................................ – – 5.7 –
Finance and insurance .................................... – – 5.5 –Credit intermediation and related activities .. – – – –Insurance carriers and related activities ...... – – 7.3 –
Education and health services ............................. – – 8.3 –Educational services ........................................ – – 15.4 –
Junior colleges, colleges, and universities ... – – 5.4 –Health care and social assistance ................... – – 8.9 –
See footnotes at end of table.
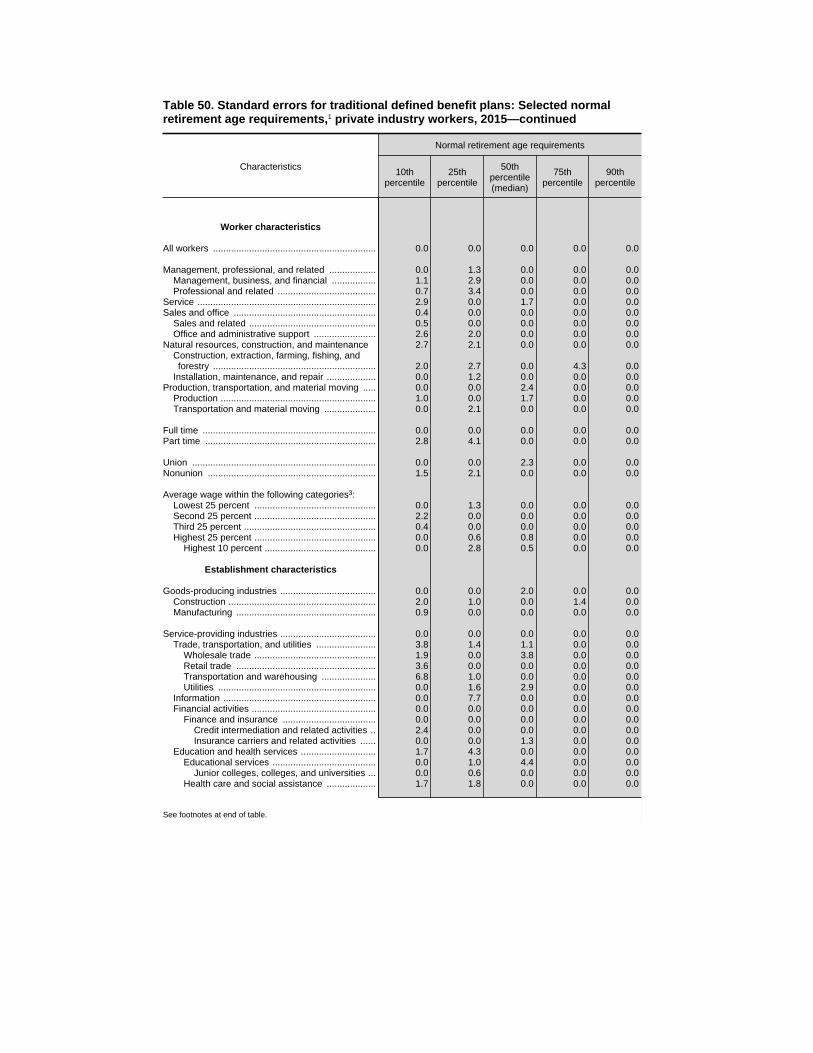
Table 50. Standard errors for traditional defined benefit plans: Selected normalretirement age requirements,1 private industry workers, 2015—continued
Characteristics
Normal retirement age requirements
10thpercentile
25thpercentile
50thpercentile(median)
75thpercentile
90thpercentile
Worker characteristics
All workers ............................................................... 0.0 0.0 0.0 0.0 0.0
Management, professional, and related .................. 0.0 1.3 0.0 0.0 0.0Management, business, and financial ................. 1.1 2.9 0.0 0.0 0.0Professional and related ...................................... 0.7 3.4 0.0 0.0 0.0
Service ..................................................................... 2.9 0.0 1.7 0.0 0.0Sales and office ....................................................... 0.4 0.0 0.0 0.0 0.0
Sales and related ................................................. 0.5 0.0 0.0 0.0 0.0Office and administrative support ........................ 2.6 2.0 0.0 0.0 0.0
Natural resources, construction, and maintenance 2.7 2.1 0.0 0.0 0.0Construction, extraction, farming, fishing, andforestry ............................................................... 2.0 2.7 0.0 4.3 0.0
Installation, maintenance, and repair ................... 0.0 1.2 0.0 0.0 0.0Production, transportation, and material moving ..... 0.0 0.0 2.4 0.0 0.0
Production ............................................................ 1.0 0.0 1.7 0.0 0.0Transportation and material moving .................... 0.0 2.1 0.0 0.0 0.0
Full time ................................................................... 0.0 0.0 0.0 0.0 0.0Part time .................................................................. 2.8 4.1 0.0 0.0 0.0
Union ....................................................................... 0.0 0.0 2.3 0.0 0.0Nonunion ................................................................. 1.5 2.1 0.0 0.0 0.0
Average wage within the following categories3:Lowest 25 percent ............................................... 0.0 1.3 0.0 0.0 0.0Second 25 percent ............................................... 2.2 0.0 0.0 0.0 0.0Third 25 percent ................................................... 0.4 0.0 0.0 0.0 0.0Highest 25 percent ............................................... 0.0 0.6 0.8 0.0 0.0
Highest 10 percent ........................................... 0.0 2.8 0.5 0.0 0.0
Establishment characteristics
Goods-producing industries ..................................... 0.0 0.0 2.0 0.0 0.0Construction ......................................................... 2.0 1.0 0.0 1.4 0.0Manufacturing ...................................................... 0.9 0.0 0.0 0.0 0.0
Service-providing industries ..................................... 0.0 0.0 0.0 0.0 0.0Trade, transportation, and utilities ....................... 3.8 1.4 1.1 0.0 0.0
Wholesale trade ............................................... 1.9 0.0 3.8 0.0 0.0Retail trade ...................................................... 3.6 0.0 0.0 0.0 0.0Transportation and warehousing ..................... 6.8 1.0 0.0 0.0 0.0Utilities ............................................................. 0.0 1.6 2.9 0.0 0.0
Information ........................................................... 0.0 7.7 0.0 0.0 0.0Financial activities ................................................ 0.0 0.0 0.0 0.0 0.0
Finance and insurance .................................... 0.0 0.0 0.0 0.0 0.0Credit intermediation and related activities .. 2.4 0.0 0.0 0.0 0.0Insurance carriers and related activities ...... 0.0 0.0 1.3 0.0 0.0
Education and health services ............................. 1.7 4.3 0.0 0.0 0.0Educational services ........................................ 0.0 1.0 4.4 0.0 0.0
Junior colleges, colleges, and universities ... 0.0 0.6 0.0 0.0 0.0Health care and social assistance ................... 1.7 1.8 0.0 0.0 0.0
See footnotes at end of table.

Table 50. Standard errors for traditional defined benefit plans: Selected normalretirement age requirements,1 private industry workers, 2015—continued
Characteristics
Age less than 65 Age 65
Less than 10years ofservice2
10 years ormore ofservice
Less than 10years ofservice2
10 years ormore ofservice
1 to 99 workers ........................................................ 4.0 4.2 5.6 –1 to 49 workers .................................................... – 5.8 8.0 –50 to 99 workers .................................................. – – 8.8 –
100 workers or more ................................................ 2.4 4.0 3.8 –100 to 499 workers .............................................. 3.1 6.6 7.0 –500 workers or more ............................................ 3.3 5.0 4.4 –
Geographic areas
Northeast ................................................................. – 5.2 5.3 –New England ....................................................... – – 11.8 –Middle Atlantic ..................................................... – 5.3 6.0 –
South ....................................................................... 3.2 6.8 6.0 –South Atlantic ....................................................... 4.0 – 8.1 –East South Central ............................................... – – 14.2 –West South Central .............................................. – – 4.4 –
Midwest .................................................................... – 3.6 5.6 –East North Central ............................................... – 4.4 5.9 –West North Central .............................................. – 6.5 11.6 –
West ......................................................................... 5.8 3.7 6.3 –Mountain .............................................................. – – – –Pacific .................................................................. 4.8 4.3 7.2 –
See footnotes at end of table.
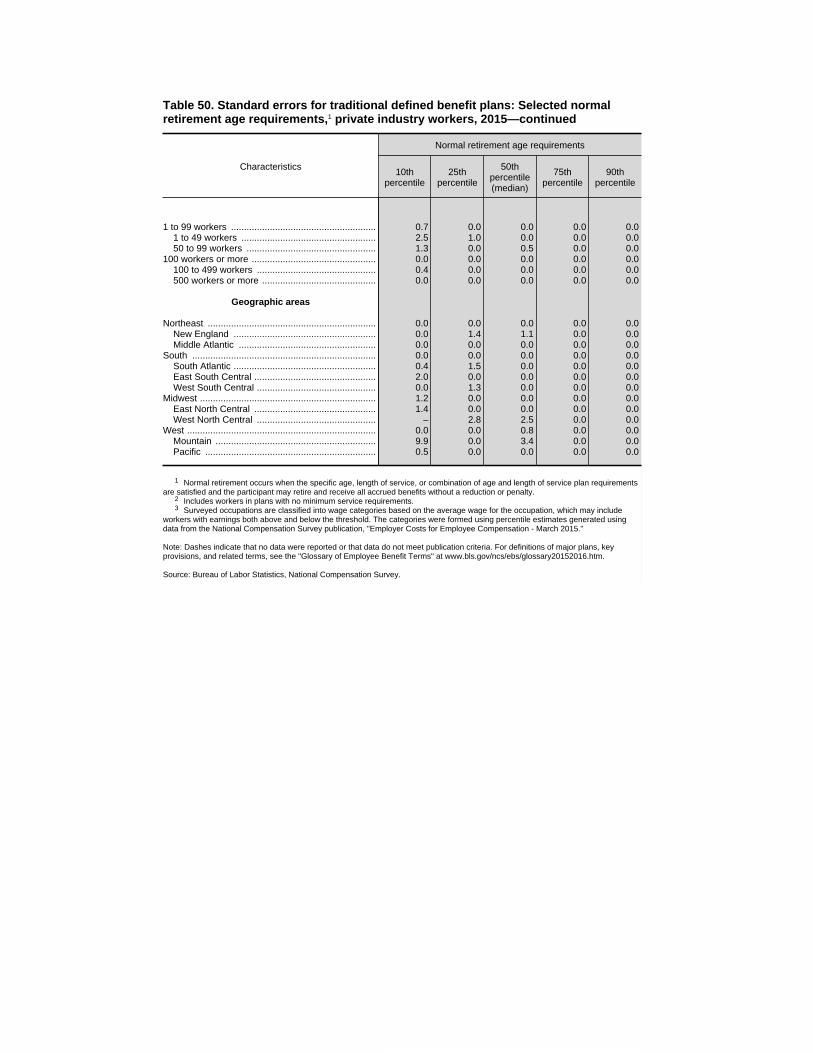
Table 50. Standard errors for traditional defined benefit plans: Selected normalretirement age requirements,1 private industry workers, 2015—continued
Characteristics
Normal retirement age requirements
10thpercentile
25thpercentile
50thpercentile(median)
75thpercentile
90thpercentile
1 to 99 workers ........................................................ 0.7 0.0 0.0 0.0 0.01 to 49 workers .................................................... 2.5 1.0 0.0 0.0 0.050 to 99 workers .................................................. 1.3 0.0 0.5 0.0 0.0
100 workers or more ................................................ 0.0 0.0 0.0 0.0 0.0100 to 499 workers .............................................. 0.4 0.0 0.0 0.0 0.0500 workers or more ............................................ 0.0 0.0 0.0 0.0 0.0
Geographic areas
Northeast ................................................................. 0.0 0.0 0.0 0.0 0.0New England ....................................................... 0.0 1.4 1.1 0.0 0.0Middle Atlantic ..................................................... 0.0 0.0 0.0 0.0 0.0
South ....................................................................... 0.0 0.0 0.0 0.0 0.0South Atlantic ....................................................... 0.4 1.5 0.0 0.0 0.0East South Central ............................................... 2.0 0.0 0.0 0.0 0.0West South Central .............................................. 0.0 1.3 0.0 0.0 0.0
Midwest .................................................................... 1.2 0.0 0.0 0.0 0.0East North Central ............................................... 1.4 0.0 0.0 0.0 0.0West North Central .............................................. – 2.8 2.5 0.0 0.0
West ......................................................................... 0.0 0.0 0.8 0.0 0.0Mountain .............................................................. 9.9 0.0 3.4 0.0 0.0Pacific .................................................................. 0.5 0.0 0.0 0.0 0.0
1 Normal retirement occurs when the specific age, length of service, or combination of age and length of service plan requirementsare satisfied and the participant may retire and receive all accrued benefits without a reduction or penalty.
2 Includes workers in plans with no minimum service requirements.3 Surveyed occupations are classified into wage categories based on the average wage for the occupation, which may include
workers with earnings both above and below the threshold. The categories were formed using percentile estimates generated usingdata from the National Compensation Survey publication, "Employer Costs for Employee Compensation - March 2015."
Note: Dashes indicate that no data were reported or that data do not meet publication criteria. For definitions of major plans, keyprovisions, and related terms, see the "Glossary of Employee Benefit Terms" at www.bls.gov/ncs/ebs/glossary20152016.htm.
Source: Bureau of Labor Statistics, National Compensation Survey.

Table 51. Traditional defined benefit plans: Normal retirement1 service requirements, privateindustry workers, 2015
(Includes all workers in traditional defined benefit plans with a service requirement)
Characteristics
Normal retirement service requirements
10thpercentile
25thpercentile
50thpercentile(median)
75thpercentile
90thpercentile
Worker characteristics
All workers ............................................................... 5 5 5 10 25
Management, professional, and related .................. 5 5 5 – 25Management, business, and financial ................. – 5 5 – 25Professional and related ...................................... 5 5 5 – 25
Service ..................................................................... 5 5 5 – 25Sales and office ....................................................... 5 5 5 5 25
Sales and related ................................................. 5 5 5 5 5Office and administrative support ........................ 5 5 5 – 30
Natural resources, construction, and maintenance 5 5 – – 30Construction, extraction, farming, fishing, andforestry ............................................................... 5 5 – 10 –
Installation, maintenance, and repair ................... 5 5 – 30 30Production, transportation, and material moving ..... 5 5 5 – 25
Production ............................................................ 5 5 – – 25Transportation and material moving .................... 5 5 5 – 30
Full time ................................................................... 5 5 5 – 25Part time .................................................................. 5 5 5 5 –
Union ....................................................................... 5 5 5 – 30Nonunion ................................................................. 5 5 5 – 25
Average wage within the following categories2:Lowest 25 percent ............................................... 5 5 5 – –Second 25 percent ............................................... 5 5 5 5 20Third 25 percent ................................................... 5 5 5 – 25Highest 25 percent ............................................... 5 5 5 – 30
Highest 10 percent ........................................... 5 5 5 – 25
Establishment characteristics
Goods-producing industries ..................................... 5 5 5 10 25Construction ......................................................... 5 5 5 10 –Manufacturing ...................................................... 5 5 – – 25
Service-providing industries ..................................... 5 5 5 – 25Trade, transportation, and utilities ....................... 5 5 5 – 30
Wholesale trade ............................................... 5 – – 25 30Retail trade ...................................................... 5 5 5 5 5Transportation and warehousing ..................... 5 5 5 – 30Utilities ............................................................. 5 5 – 30 35
Information ........................................................... 5 5 – 30 30Financial activities ................................................ 5 5 5 5 25
Finance and insurance .................................... 5 5 5 5 20Credit intermediation and related activities .. 5 5 5 – 25Insurance carriers and related activities ...... 5 5 5 5 –
Education and health services ............................. 5 5 5 – 25Educational services ........................................ 5 5 5 5 25
Junior colleges, colleges, and universities ... 5 5 25 25 30Health care and social assistance ................... – 5 5 – 25
See footnotes at end of table.

Table 51. Traditional defined benefit plans: Normal retirement1 service requirements, privateindustry workers, 2015—continued
(Includes all workers in traditional defined benefit plans with a service requirement)
Characteristics
Normal retirement service requirements
10thpercentile
25thpercentile
50thpercentile(median)
75thpercentile
90thpercentile
1 to 99 workers ........................................................ 5 5 5 – 251 to 49 workers .................................................... – 5 5 – 2550 to 99 workers .................................................. 5 5 5 – –
100 workers or more ................................................ 5 5 5 – 25100 to 499 workers .............................................. 5 5 5 – 25500 workers or more ............................................ 5 5 5 – 25
Geographic areas
Northeast ................................................................. 5 5 5 20 30New England ....................................................... 5 5 5 – 30Middle Atlantic ..................................................... 5 5 5 20 30
South ....................................................................... 5 5 5 – 25South Atlantic ....................................................... 5 5 5 – –East South Central ............................................... 5 5 5 – –West South Central .............................................. 5 5 5 – –
Midwest .................................................................... 5 5 5 – 25East North Central ............................................... 5 5 5 10 20West North Central .............................................. 5 5 5 – 30
West ......................................................................... – 5 5 – 25Mountain .............................................................. 5 5 5 – –Pacific .................................................................. – 5 5 – –
1 Normal retirement occurs when the specific age, length of service, or combination of age and length of service plan requirements are satisfiedand the participant may retire and receive all accrued benefits without a reduction or penalty.
2 Surveyed occupations are classified into wage categories based on the average wage for the occupation, which may include workers withearnings both above and below the threshold. The categories were formed using percentile estimates generated using data from the NationalCompensation Survey publication, "Employer Costs for Employee Compensation - March 2015."
Note: Dashes indicate that no data were reported or that data do not meet publication criteria. For definitions of major plans, key provisions, andrelated terms, see the "Glossary of Employee Benefit Terms" at www.bls.gov/ncs/ebs/glossary20152016.htm.
Source: Bureau of Labor Statistics, National Compensation Survey.
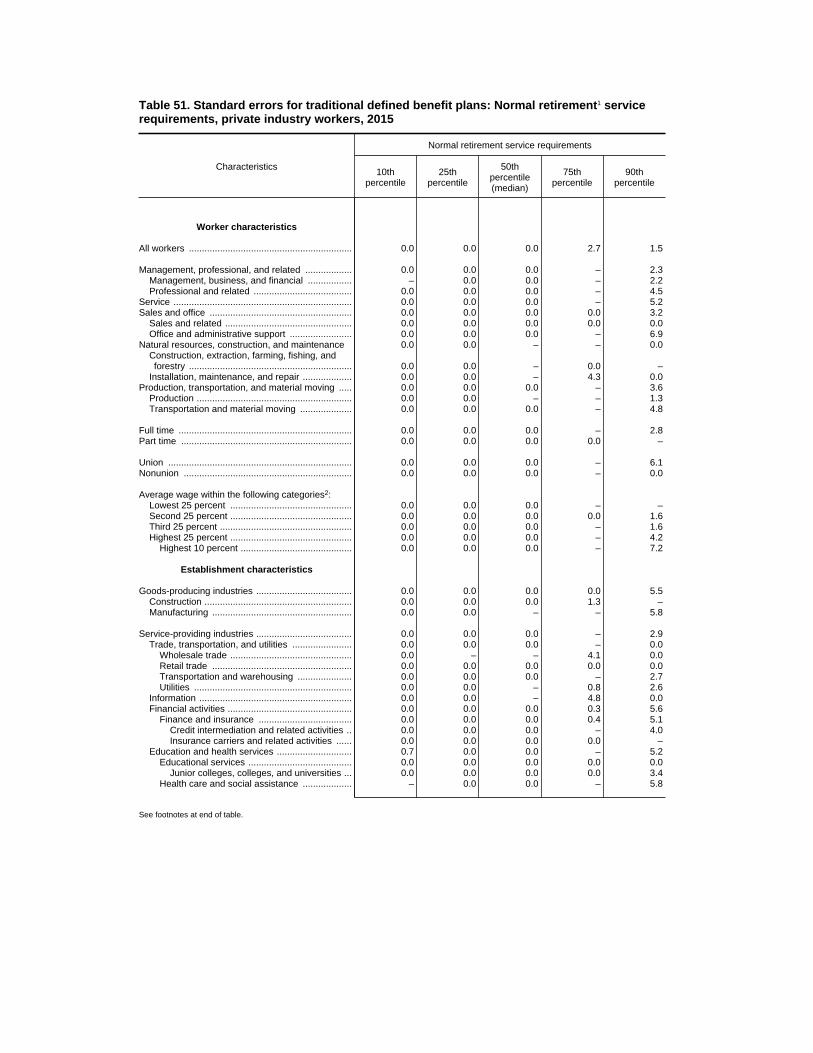
Table 51. Standard errors for traditional defined benefit plans: Normal retirement1 servicerequirements, private industry workers, 2015
Characteristics
Normal retirement service requirements
10thpercentile
25thpercentile
50thpercentile(median)
75thpercentile
90thpercentile
Worker characteristics
All workers ............................................................... 0.0 0.0 0.0 2.7 1.5
Management, professional, and related .................. 0.0 0.0 0.0 – 2.3Management, business, and financial ................. – 0.0 0.0 – 2.2Professional and related ...................................... 0.0 0.0 0.0 – 4.5
Service ..................................................................... 0.0 0.0 0.0 – 5.2Sales and office ....................................................... 0.0 0.0 0.0 0.0 3.2
Sales and related ................................................. 0.0 0.0 0.0 0.0 0.0Office and administrative support ........................ 0.0 0.0 0.0 – 6.9
Natural resources, construction, and maintenance 0.0 0.0 – – 0.0Construction, extraction, farming, fishing, andforestry ............................................................... 0.0 0.0 – 0.0 –
Installation, maintenance, and repair ................... 0.0 0.0 – 4.3 0.0Production, transportation, and material moving ..... 0.0 0.0 0.0 – 3.6
Production ............................................................ 0.0 0.0 – – 1.3Transportation and material moving .................... 0.0 0.0 0.0 – 4.8
Full time ................................................................... 0.0 0.0 0.0 – 2.8Part time .................................................................. 0.0 0.0 0.0 0.0 –
Union ....................................................................... 0.0 0.0 0.0 – 6.1Nonunion ................................................................. 0.0 0.0 0.0 – 0.0
Average wage within the following categories2:Lowest 25 percent ............................................... 0.0 0.0 0.0 – –Second 25 percent ............................................... 0.0 0.0 0.0 0.0 1.6Third 25 percent ................................................... 0.0 0.0 0.0 – 1.6Highest 25 percent ............................................... 0.0 0.0 0.0 – 4.2
Highest 10 percent ........................................... 0.0 0.0 0.0 – 7.2
Establishment characteristics
Goods-producing industries ..................................... 0.0 0.0 0.0 0.0 5.5Construction ......................................................... 0.0 0.0 0.0 1.3 –Manufacturing ...................................................... 0.0 0.0 – – 5.8
Service-providing industries ..................................... 0.0 0.0 0.0 – 2.9Trade, transportation, and utilities ....................... 0.0 0.0 0.0 – 0.0
Wholesale trade ............................................... 0.0 – – 4.1 0.0Retail trade ...................................................... 0.0 0.0 0.0 0.0 0.0Transportation and warehousing ..................... 0.0 0.0 0.0 – 2.7Utilities ............................................................. 0.0 0.0 – 0.8 2.6
Information ........................................................... 0.0 0.0 – 4.8 0.0Financial activities ................................................ 0.0 0.0 0.0 0.3 5.6
Finance and insurance .................................... 0.0 0.0 0.0 0.4 5.1Credit intermediation and related activities .. 0.0 0.0 0.0 – 4.0Insurance carriers and related activities ...... 0.0 0.0 0.0 0.0 –
Education and health services ............................. 0.7 0.0 0.0 – 5.2Educational services ........................................ 0.0 0.0 0.0 0.0 0.0
Junior colleges, colleges, and universities ... 0.0 0.0 0.0 0.0 3.4Health care and social assistance ................... – 0.0 0.0 – 5.8
See footnotes at end of table.

Table 51. Standard errors for traditional defined benefit plans: Normal retirement1 servicerequirements, private industry workers, 2015—continued
Characteristics
Normal retirement service requirements
10thpercentile
25thpercentile
50thpercentile(median)
75thpercentile
90thpercentile
1 to 99 workers ........................................................ 0.0 0.0 0.0 – 1.31 to 49 workers .................................................... – 0.0 0.0 – 4.750 to 99 workers .................................................. 0.0 0.0 0.0 – –
100 workers or more ................................................ 0.0 0.0 0.0 – 3.1100 to 499 workers .............................................. 0.0 0.0 0.0 – 6.6500 workers or more ............................................ 0.0 0.0 0.0 – 3.2
Geographic areas
Northeast ................................................................. 0.0 0.0 0.0 2.0 2.7New England ....................................................... 0.0 0.0 0.0 – 2.4Middle Atlantic ..................................................... 0.0 0.0 0.0 0.0 6.2
South ....................................................................... 0.0 0.0 0.0 – 4.2South Atlantic ....................................................... 0.0 0.0 0.0 – –East South Central ............................................... 0.0 0.0 0.0 – –West South Central .............................................. 0.0 0.0 0.0 – –
Midwest .................................................................... 0.0 0.0 0.0 – 5.4East North Central ............................................... 0.0 0.0 0.0 2.7 2.6West North Central .............................................. 0.0 0.0 0.0 – 7.1
West ......................................................................... – 0.0 0.0 – 6.2Mountain .............................................................. 0.0 0.0 0.0 – –Pacific .................................................................. – 0.0 0.0 – –
1 Normal retirement occurs when the specific age, length of service, or combination of age and length of service plan requirements are satisfiedand the participant may retire and receive all accrued benefits without a reduction or penalty.
2 Surveyed occupations are classified into wage categories based on the average wage for the occupation, which may include workers withearnings both above and below the threshold. The categories were formed using percentile estimates generated using data from the NationalCompensation Survey publication, "Employer Costs for Employee Compensation - March 2015."
Note: Dashes indicate that no data were reported or that data do not meet publication criteria. For definitions of major plans, key provisions, andrelated terms, see the "Glossary of Employee Benefit Terms" at www.bls.gov/ncs/ebs/glossary20152016.htm.
Source: Bureau of Labor Statistics, National Compensation Survey.

Table 52. Traditional defined benefit plans: Availability of early retirement with selectedrequirements,1 private industry workers, 2015
(All workers participating in traditional defined benefit plans = 100 percent)
CharacteristicsEarly
retirementavailable
Early retirement age requirements
10thpercentile
25thpercentile
50thpercentile(median)
75thpercentile
90thpercentile
Worker characteristics
All workers ............................................................... 96 50 55 55 55 55
Management, professional, and related .................. 97 55 55 55 55 55Management, business, and financial ................. 99 55 55 55 55 55Professional and related ...................................... 95 55 55 55 55 55
Service ..................................................................... 91 55 55 55 55 55Sales and office ....................................................... 99 55 55 55 55 55
Sales and related ................................................. 100 55 55 55 55 55Office and administrative support ........................ 98 50 55 55 55 55
Natural resources, construction, and maintenance 98 50 55 55 55 55Construction, extraction, farming, fishing, andforestry ............................................................... 99 55 55 55 55 60
Installation, maintenance, and repair ................... 95 50 55 55 55 55Production, transportation, and material moving ..... 94 50 50 55 55 55
Production ............................................................ 100 55 55 55 55 62Transportation and material moving .................... 90 50 50 50 55 55
Full time ................................................................... 96 50 55 55 55 55Part time .................................................................. 100 50 50 55 55 55
Union ....................................................................... 97 50 55 55 55 55Nonunion ................................................................. 95 55 55 55 55 55
Average wage within the following categories3:Lowest 25 percent ............................................... 85 50 55 55 55 55Second 25 percent ............................................... 99 50 55 55 55 55Third 25 percent ................................................... 97 50 55 55 55 55Highest 25 percent ............................................... 96 50 55 55 55 55
Highest 10 percent ........................................... 98 55 55 55 55 55
Establishment characteristics
Goods-producing industries ..................................... 100 55 55 55 55 60Construction ......................................................... 100 55 55 55 55 60Manufacturing ...................................................... 100 55 55 55 55 62
Service-providing industries ..................................... 95 50 55 55 55 55Trade, transportation, and utilities ....................... 94 50 50 55 55 55
Wholesale trade ............................................... 100 50 55 55 55 55Retail trade ...................................................... 100 55 55 55 55 55Transportation and warehousing ..................... 88 50 50 50 55 55Utilities ............................................................. 95 50 50 55 55 55
Information ........................................................... 100 50 50 55 55 55Financial activities ................................................ 100 55 55 55 55 55
Finance and insurance .................................... 100 55 55 55 55 55Credit intermediation and related activities .. 100 55 55 55 55 55Insurance carriers and related activities ...... 100 55 55 55 55 55
Education and health services ............................. 88 55 55 55 55 55Educational services ........................................ 96 55 55 55 55 55
Junior colleges, colleges, and universities ... 90 55 55 55 55 60Health care and social assistance ................... 86 55 55 55 55 55
See footnotes at end of table.

Table 52. Traditional defined benefit plans: Availability of earlyretirement with selected requirements,1 private industry workers,2015—continued
(All workers participating in traditional defined benefit plans = 100 percent)
Characteristics
Age 55
Sum of ageplus serviceLess than 10
years ofservice2
10 years ormore ofservice
Worker characteristics
All workers ............................................................... 32 42 2
Management, professional, and related .................. 39 44 2Management, business, and financial ................. 37 49 –Professional and related ...................................... 41 42 –
Service ..................................................................... 53 32 –Sales and office ....................................................... 35 51 –
Sales and related ................................................. 24 68 –Office and administrative support ........................ 42 40 –
Natural resources, construction, and maintenance 22 49 –Construction, extraction, farming, fishing, andforestry ............................................................... – 55 –
Installation, maintenance, and repair ................... 29 39 –Production, transportation, and material moving ..... 18 34 –
Production ............................................................ 26 52 –Transportation and material moving .................... – – –
Full time ................................................................... 31 43 2Part time .................................................................. 35 36 –
Union ....................................................................... 31 37 –Nonunion ................................................................. 32 48 –
Average wage within the following categories3:Lowest 25 percent ............................................... 31 43 –Second 25 percent ............................................... 40 33 –Third 25 percent ................................................... 33 42 –Highest 25 percent ............................................... 28 46 –
Highest 10 percent ........................................... 31 52 –
Establishment characteristics
Goods-producing industries ..................................... 21 56 –Construction ......................................................... – 54 –Manufacturing ...................................................... 25 56 –
Service-providing industries ..................................... 36 37 2Trade, transportation, and utilities ....................... 18 35 –
Wholesale trade ............................................... – 42 –Retail trade ...................................................... 30 61 –Transportation and warehousing ..................... – – –Utilities ............................................................. – 27 –
Information ........................................................... 44 – –Financial activities ................................................ 65 – –
Finance and insurance .................................... 73 19 –Credit intermediation and related activities .. 62 30 –Insurance carriers and related activities ...... 82 – –
Education and health services ............................. 46 – –Educational services ........................................ 61 – –
Junior colleges, colleges, and universities ... 39 – –Health care and social assistance ................... 44 – –
See footnotes at end of table.

Table 52. Traditional defined benefit plans: Availability of early retirement with selectedrequirements,1 private industry workers, 2015—continued
(All workers participating in traditional defined benefit plans = 100 percent)
CharacteristicsEarly
retirementavailable
Early retirement age requirements
10thpercentile
25thpercentile
50thpercentile(median)
75thpercentile
90thpercentile
1 to 99 workers ........................................................ 100 – 55 55 55 551 to 49 workers .................................................... 99 50 55 55 55 5550 to 99 workers .................................................. 100 – 55 55 55 55
100 workers or more ................................................ 94 50 55 55 55 55100 to 499 workers .............................................. 93 50 55 55 55 55500 workers or more ............................................ 95 50 55 55 55 55
Geographic areas
Northeast ................................................................. 93 50 55 55 55 55New England ....................................................... 81 55 55 55 55 55Middle Atlantic ..................................................... 99 50 55 55 55 55
South ....................................................................... 94 50 55 55 55 55South Atlantic ....................................................... 97 50 55 55 55 55East South Central ............................................... 80 50 55 55 55 55West South Central .............................................. 100 50 55 55 55 55
Midwest .................................................................... 98 50 55 55 55 55East North Central ............................................... 100 55 55 55 55 55West North Central .............................................. 95 50 55 55 55 60
West ......................................................................... 100 50 55 55 55 55Mountain .............................................................. – 50 50 55 55 55Pacific .................................................................. 100 50 55 55 55 55
See footnotes at end of table.
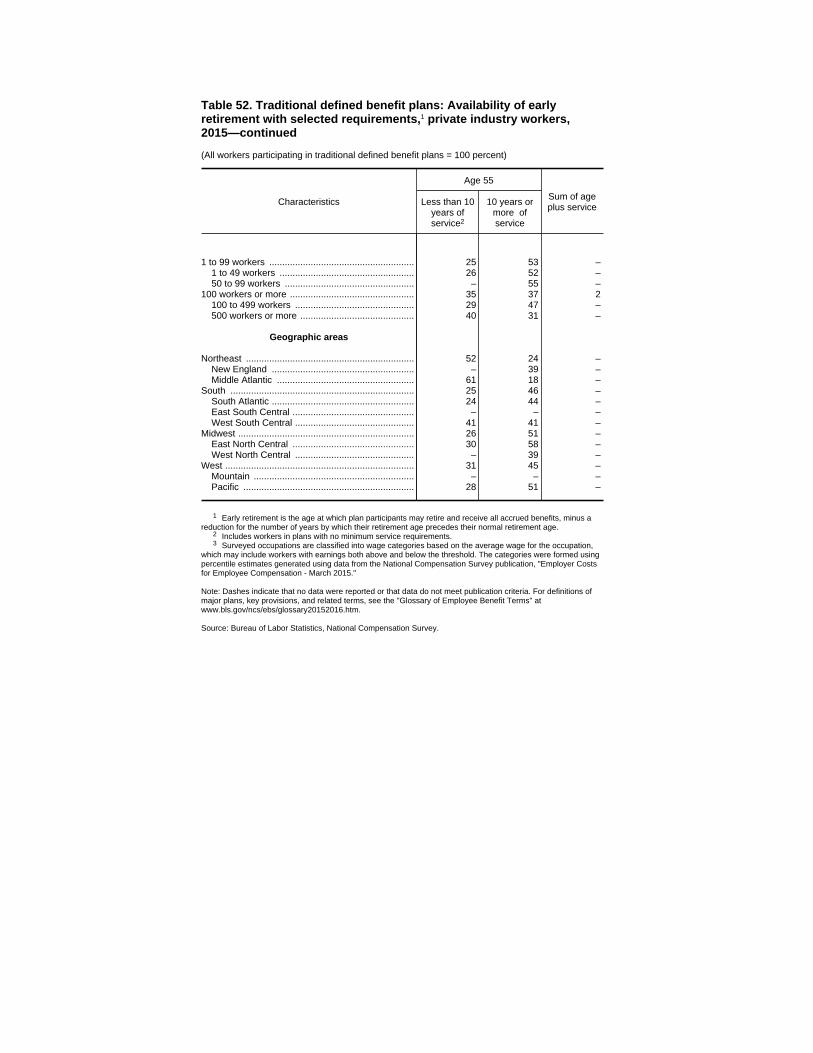
Table 52. Traditional defined benefit plans: Availability of earlyretirement with selected requirements,1 private industry workers,2015—continued
(All workers participating in traditional defined benefit plans = 100 percent)
Characteristics
Age 55
Sum of ageplus serviceLess than 10
years ofservice2
10 years ormore ofservice
1 to 99 workers ........................................................ 25 53 –1 to 49 workers .................................................... 26 52 –50 to 99 workers .................................................. – 55 –
100 workers or more ................................................ 35 37 2100 to 499 workers .............................................. 29 47 –500 workers or more ............................................ 40 31 –
Geographic areas
Northeast ................................................................. 52 24 –New England ....................................................... – 39 –Middle Atlantic ..................................................... 61 18 –
South ....................................................................... 25 46 –South Atlantic ....................................................... 24 44 –East South Central ............................................... – – –West South Central .............................................. 41 41 –
Midwest .................................................................... 26 51 –East North Central ............................................... 30 58 –West North Central .............................................. – 39 –
West ......................................................................... 31 45 –Mountain .............................................................. – – –Pacific .................................................................. 28 51 –
1 Early retirement is the age at which plan participants may retire and receive all accrued benefits, minus areduction for the number of years by which their retirement age precedes their normal retirement age.
2 Includes workers in plans with no minimum service requirements.3 Surveyed occupations are classified into wage categories based on the average wage for the occupation,
which may include workers with earnings both above and below the threshold. The categories were formed usingpercentile estimates generated using data from the National Compensation Survey publication, "Employer Costsfor Employee Compensation - March 2015."
Note: Dashes indicate that no data were reported or that data do not meet publication criteria. For definitions ofmajor plans, key provisions, and related terms, see the "Glossary of Employee Benefit Terms" atwww.bls.gov/ncs/ebs/glossary20152016.htm.
Source: Bureau of Labor Statistics, National Compensation Survey.
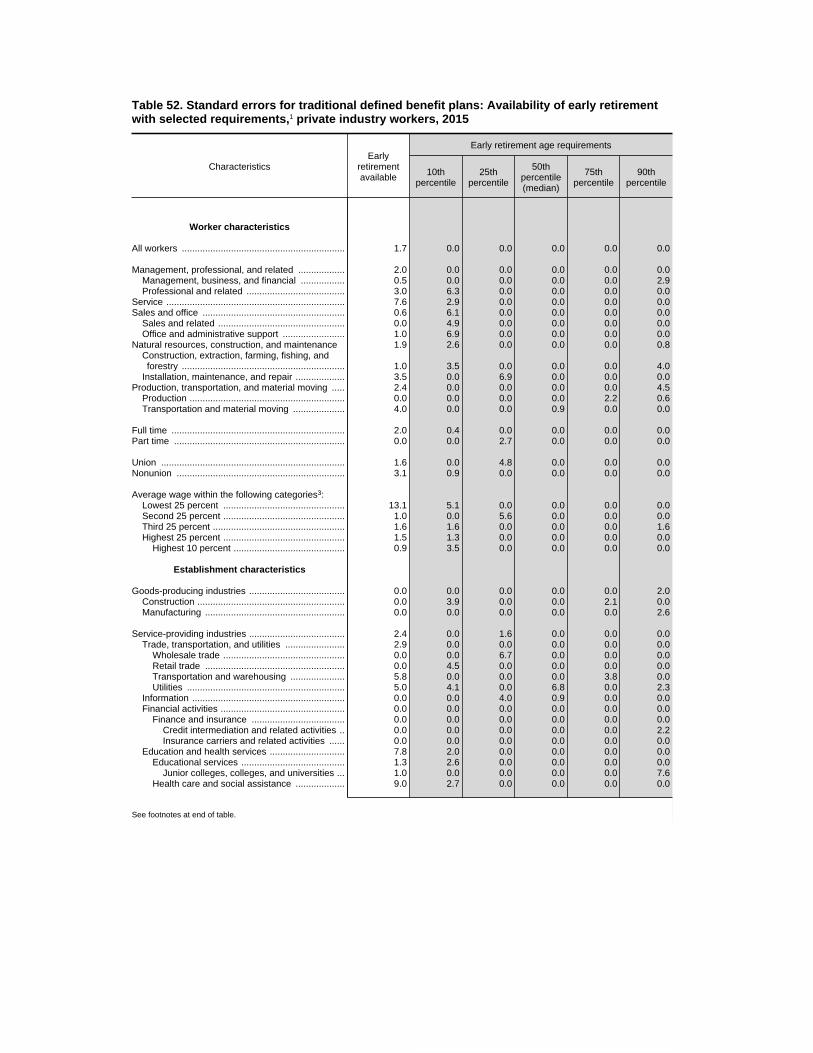
Table 52. Standard errors for traditional defined benefit plans: Availability of early retirementwith selected requirements,1 private industry workers, 2015
CharacteristicsEarly
retirementavailable
Early retirement age requirements
10thpercentile
25thpercentile
50thpercentile(median)
75thpercentile
90thpercentile
Worker characteristics
All workers ............................................................... 1.7 0.0 0.0 0.0 0.0 0.0
Management, professional, and related .................. 2.0 0.0 0.0 0.0 0.0 0.0Management, business, and financial ................. 0.5 0.0 0.0 0.0 0.0 2.9Professional and related ...................................... 3.0 6.3 0.0 0.0 0.0 0.0
Service ..................................................................... 7.6 2.9 0.0 0.0 0.0 0.0Sales and office ....................................................... 0.6 6.1 0.0 0.0 0.0 0.0
Sales and related ................................................. 0.0 4.9 0.0 0.0 0.0 0.0Office and administrative support ........................ 1.0 6.9 0.0 0.0 0.0 0.0
Natural resources, construction, and maintenance 1.9 2.6 0.0 0.0 0.0 0.8Construction, extraction, farming, fishing, andforestry ............................................................... 1.0 3.5 0.0 0.0 0.0 4.0
Installation, maintenance, and repair ................... 3.5 0.0 6.9 0.0 0.0 0.0Production, transportation, and material moving ..... 2.4 0.0 0.0 0.0 0.0 4.5
Production ............................................................ 0.0 0.0 0.0 0.0 2.2 0.6Transportation and material moving .................... 4.0 0.0 0.0 0.9 0.0 0.0
Full time ................................................................... 2.0 0.4 0.0 0.0 0.0 0.0Part time .................................................................. 0.0 0.0 2.7 0.0 0.0 0.0
Union ....................................................................... 1.6 0.0 4.8 0.0 0.0 0.0Nonunion ................................................................. 3.1 0.9 0.0 0.0 0.0 0.0
Average wage within the following categories3:Lowest 25 percent ............................................... 13.1 5.1 0.0 0.0 0.0 0.0Second 25 percent ............................................... 1.0 0.0 5.6 0.0 0.0 0.0Third 25 percent ................................................... 1.6 1.6 0.0 0.0 0.0 1.6Highest 25 percent ............................................... 1.5 1.3 0.0 0.0 0.0 0.0
Highest 10 percent ........................................... 0.9 3.5 0.0 0.0 0.0 0.0
Establishment characteristics
Goods-producing industries ..................................... 0.0 0.0 0.0 0.0 0.0 2.0Construction ......................................................... 0.0 3.9 0.0 0.0 2.1 0.0Manufacturing ...................................................... 0.0 0.0 0.0 0.0 0.0 2.6
Service-providing industries ..................................... 2.4 0.0 1.6 0.0 0.0 0.0Trade, transportation, and utilities ....................... 2.9 0.0 0.0 0.0 0.0 0.0
Wholesale trade ............................................... 0.0 0.0 6.7 0.0 0.0 0.0Retail trade ...................................................... 0.0 4.5 0.0 0.0 0.0 0.0Transportation and warehousing ..................... 5.8 0.0 0.0 0.0 3.8 0.0Utilities ............................................................. 5.0 4.1 0.0 6.8 0.0 2.3
Information ........................................................... 0.0 0.0 4.0 0.9 0.0 0.0Financial activities ................................................ 0.0 0.0 0.0 0.0 0.0 0.0
Finance and insurance .................................... 0.0 0.0 0.0 0.0 0.0 0.0Credit intermediation and related activities .. 0.0 0.0 0.0 0.0 0.0 2.2Insurance carriers and related activities ...... 0.0 0.0 0.0 0.0 0.0 0.0
Education and health services ............................. 7.8 2.0 0.0 0.0 0.0 0.0Educational services ........................................ 1.3 2.6 0.0 0.0 0.0 0.0
Junior colleges, colleges, and universities ... 1.0 0.0 0.0 0.0 0.0 7.6Health care and social assistance ................... 9.0 2.7 0.0 0.0 0.0 0.0
See footnotes at end of table.
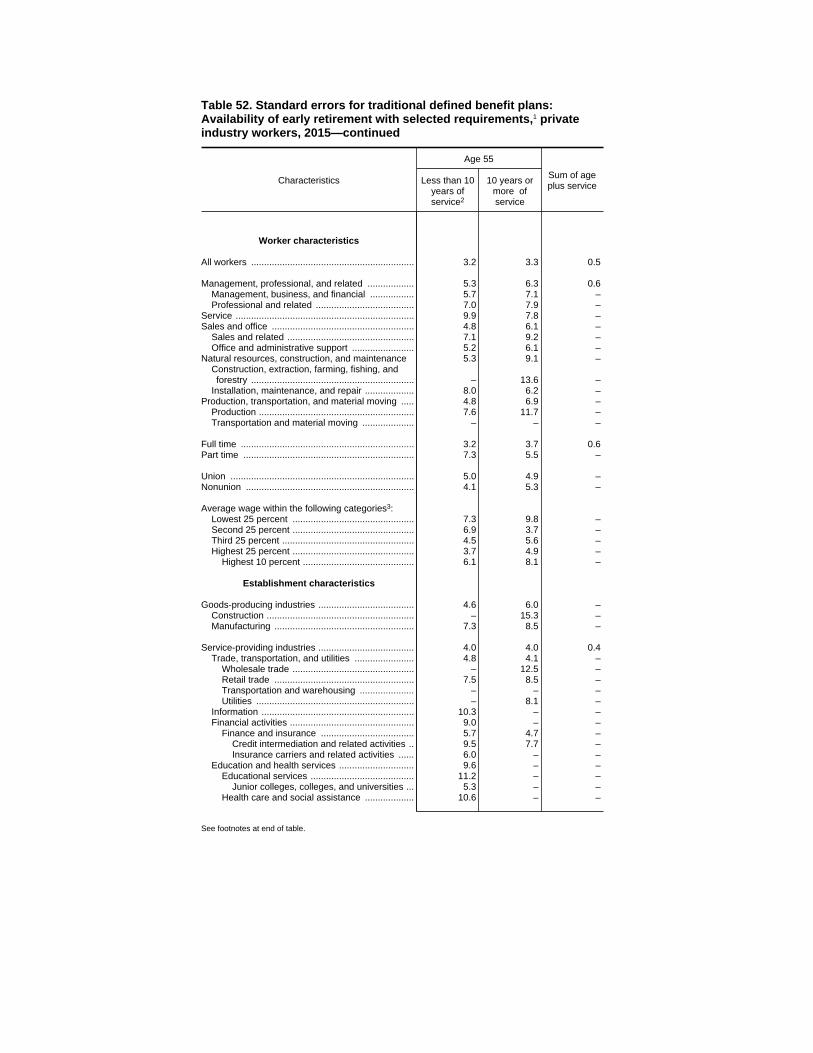
Table 52. Standard errors for traditional defined benefit plans:Availability of early retirement with selected requirements,1 privateindustry workers, 2015—continued
Characteristics
Age 55
Sum of ageplus serviceLess than 10
years ofservice2
10 years ormore ofservice
Worker characteristics
All workers ............................................................... 3.2 3.3 0.5
Management, professional, and related .................. 5.3 6.3 0.6Management, business, and financial ................. 5.7 7.1 –Professional and related ...................................... 7.0 7.9 –
Service ..................................................................... 9.9 7.8 –Sales and office ....................................................... 4.8 6.1 –
Sales and related ................................................. 7.1 9.2 –Office and administrative support ........................ 5.2 6.1 –
Natural resources, construction, and maintenance 5.3 9.1 –Construction, extraction, farming, fishing, andforestry ............................................................... – 13.6 –
Installation, maintenance, and repair ................... 8.0 6.2 –Production, transportation, and material moving ..... 4.8 6.9 –
Production ............................................................ 7.6 11.7 –Transportation and material moving .................... – – –
Full time ................................................................... 3.2 3.7 0.6Part time .................................................................. 7.3 5.5 –
Union ....................................................................... 5.0 4.9 –Nonunion ................................................................. 4.1 5.3 –
Average wage within the following categories3:Lowest 25 percent ............................................... 7.3 9.8 –Second 25 percent ............................................... 6.9 3.7 –Third 25 percent ................................................... 4.5 5.6 –Highest 25 percent ............................................... 3.7 4.9 –
Highest 10 percent ........................................... 6.1 8.1 –
Establishment characteristics
Goods-producing industries ..................................... 4.6 6.0 –Construction ......................................................... – 15.3 –Manufacturing ...................................................... 7.3 8.5 –
Service-providing industries ..................................... 4.0 4.0 0.4Trade, transportation, and utilities ....................... 4.8 4.1 –
Wholesale trade ............................................... – 12.5 –Retail trade ...................................................... 7.5 8.5 –Transportation and warehousing ..................... – – –Utilities ............................................................. – 8.1 –
Information ........................................................... 10.3 – –Financial activities ................................................ 9.0 – –
Finance and insurance .................................... 5.7 4.7 –Credit intermediation and related activities .. 9.5 7.7 –Insurance carriers and related activities ...... 6.0 – –
Education and health services ............................. 9.6 – –Educational services ........................................ 11.2 – –
Junior colleges, colleges, and universities ... 5.3 – –Health care and social assistance ................... 10.6 – –
See footnotes at end of table.
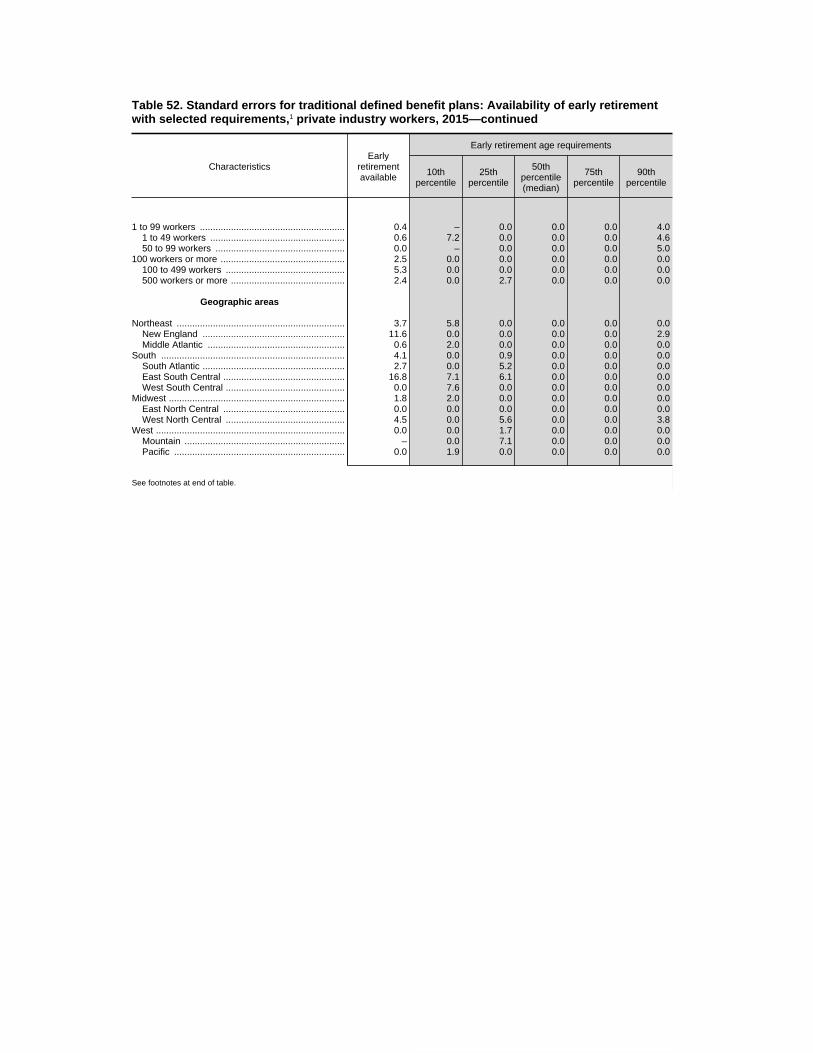
Table 52. Standard errors for traditional defined benefit plans: Availability of early retirementwith selected requirements,1 private industry workers, 2015—continued
CharacteristicsEarly
retirementavailable
Early retirement age requirements
10thpercentile
25thpercentile
50thpercentile(median)
75thpercentile
90thpercentile
1 to 99 workers ........................................................ 0.4 – 0.0 0.0 0.0 4.01 to 49 workers .................................................... 0.6 7.2 0.0 0.0 0.0 4.650 to 99 workers .................................................. 0.0 – 0.0 0.0 0.0 5.0
100 workers or more ................................................ 2.5 0.0 0.0 0.0 0.0 0.0100 to 499 workers .............................................. 5.3 0.0 0.0 0.0 0.0 0.0500 workers or more ............................................ 2.4 0.0 2.7 0.0 0.0 0.0
Geographic areas
Northeast ................................................................. 3.7 5.8 0.0 0.0 0.0 0.0New England ....................................................... 11.6 0.0 0.0 0.0 0.0 2.9Middle Atlantic ..................................................... 0.6 2.0 0.0 0.0 0.0 0.0
South ....................................................................... 4.1 0.0 0.9 0.0 0.0 0.0South Atlantic ....................................................... 2.7 0.0 5.2 0.0 0.0 0.0East South Central ............................................... 16.8 7.1 6.1 0.0 0.0 0.0West South Central .............................................. 0.0 7.6 0.0 0.0 0.0 0.0
Midwest .................................................................... 1.8 2.0 0.0 0.0 0.0 0.0East North Central ............................................... 0.0 0.0 0.0 0.0 0.0 0.0West North Central .............................................. 4.5 0.0 5.6 0.0 0.0 3.8
West ......................................................................... 0.0 0.0 1.7 0.0 0.0 0.0Mountain .............................................................. – 0.0 7.1 0.0 0.0 0.0Pacific .................................................................. 0.0 1.9 0.0 0.0 0.0 0.0
See footnotes at end of table.
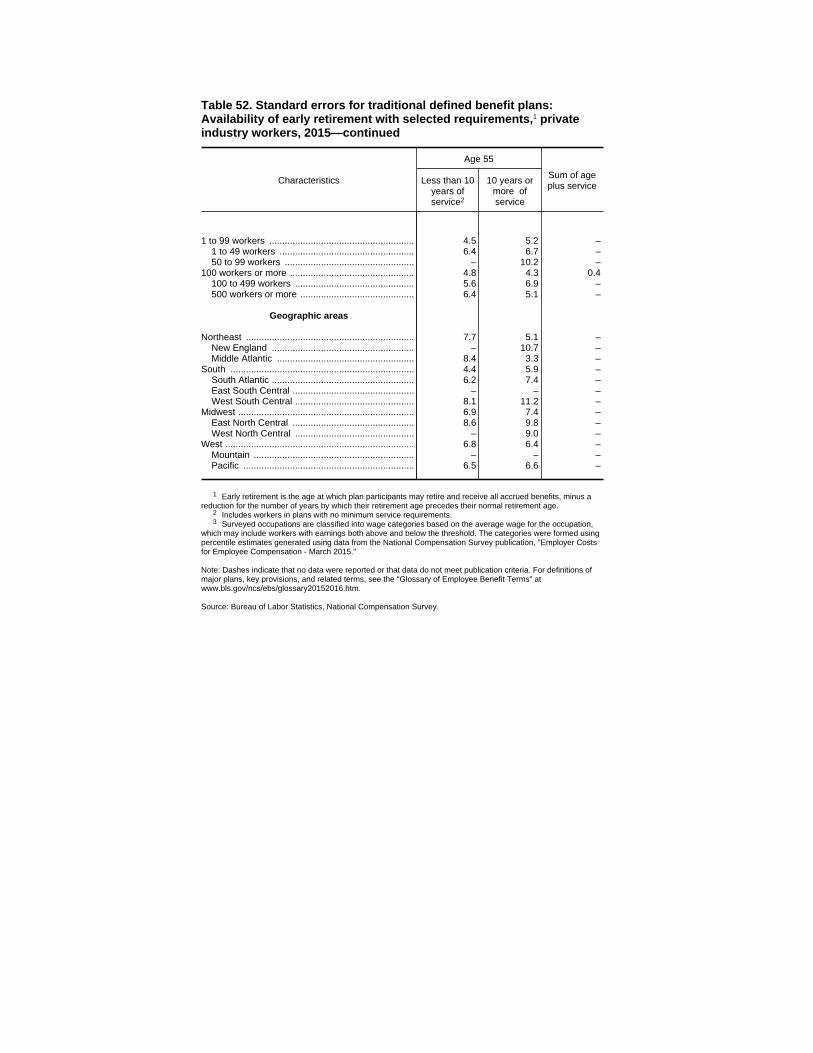
Table 52. Standard errors for traditional defined benefit plans:Availability of early retirement with selected requirements,1 privateindustry workers, 2015—continued
Characteristics
Age 55
Sum of ageplus serviceLess than 10
years ofservice2
10 years ormore ofservice
1 to 99 workers ........................................................ 4.5 5.2 –1 to 49 workers .................................................... 6.4 6.7 –50 to 99 workers .................................................. – 10.2 –
100 workers or more ................................................ 4.8 4.3 0.4100 to 499 workers .............................................. 5.6 6.9 –500 workers or more ............................................ 6.4 5.1 –
Geographic areas
Northeast ................................................................. 7.7 5.1 –New England ....................................................... – 10.7 –Middle Atlantic ..................................................... 8.4 3.3 –
South ....................................................................... 4.4 5.9 –South Atlantic ....................................................... 6.2 7.4 –East South Central ............................................... – – –West South Central .............................................. 8.1 11.2 –
Midwest .................................................................... 6.9 7.4 –East North Central ............................................... 8.6 9.8 –West North Central .............................................. – 9.0 –
West ......................................................................... 6.8 6.4 –Mountain .............................................................. – – –Pacific .................................................................. 6.5 6.6 –
1 Early retirement is the age at which plan participants may retire and receive all accrued benefits, minus areduction for the number of years by which their retirement age precedes their normal retirement age.
2 Includes workers in plans with no minimum service requirements.3 Surveyed occupations are classified into wage categories based on the average wage for the occupation,
which may include workers with earnings both above and below the threshold. The categories were formed usingpercentile estimates generated using data from the National Compensation Survey publication, "Employer Costsfor Employee Compensation - March 2015."
Note: Dashes indicate that no data were reported or that data do not meet publication criteria. For definitions ofmajor plans, key provisions, and related terms, see the "Glossary of Employee Benefit Terms" atwww.bls.gov/ncs/ebs/glossary20152016.htm.
Source: Bureau of Labor Statistics, National Compensation Survey.
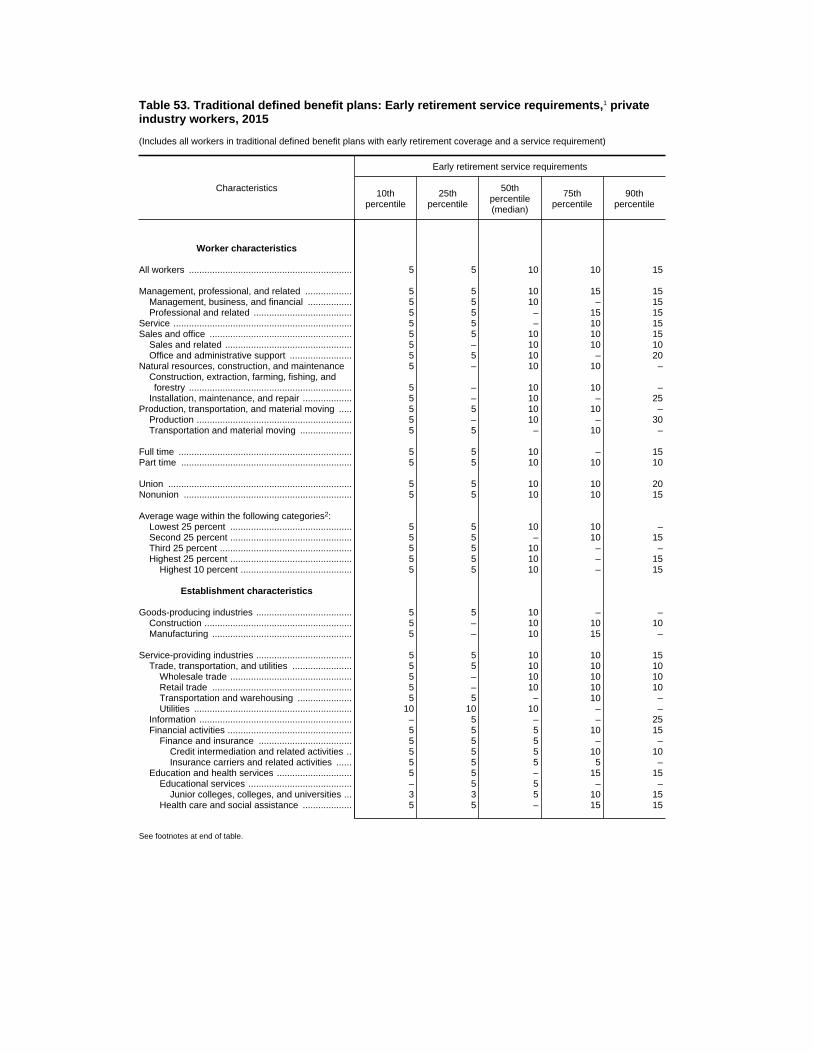
Table 53. Traditional defined benefit plans: Early retirement service requirements,1 privateindustry workers, 2015
(Includes all workers in traditional defined benefit plans with early retirement coverage and a service requirement)
Characteristics
Early retirement service requirements
10thpercentile
25thpercentile
50thpercentile(median)
75thpercentile
90thpercentile
Worker characteristics
All workers ............................................................... 5 5 10 10 15
Management, professional, and related .................. 5 5 10 15 15Management, business, and financial ................. 5 5 10 – 15Professional and related ...................................... 5 5 – 15 15
Service ..................................................................... 5 5 – 10 15Sales and office ....................................................... 5 5 10 10 15
Sales and related ................................................. 5 – 10 10 10Office and administrative support ........................ 5 5 10 – 20
Natural resources, construction, and maintenance 5 – 10 10 –Construction, extraction, farming, fishing, andforestry ............................................................... 5 – 10 10 –
Installation, maintenance, and repair ................... 5 – 10 – 25Production, transportation, and material moving ..... 5 5 10 10 –
Production ............................................................ 5 – 10 – 30Transportation and material moving .................... 5 5 – 10 –
Full time ................................................................... 5 5 10 – 15Part time .................................................................. 5 5 10 10 10
Union ....................................................................... 5 5 10 10 20Nonunion ................................................................. 5 5 10 10 15
Average wage within the following categories2:Lowest 25 percent ............................................... 5 5 10 10 –Second 25 percent ............................................... 5 5 – 10 15Third 25 percent ................................................... 5 5 10 – –Highest 25 percent ............................................... 5 5 10 – 15
Highest 10 percent ........................................... 5 5 10 – 15
Establishment characteristics
Goods-producing industries ..................................... 5 5 10 – –Construction ......................................................... 5 – 10 10 10Manufacturing ...................................................... 5 – 10 15 –
Service-providing industries ..................................... 5 5 10 10 15Trade, transportation, and utilities ....................... 5 5 10 10 10
Wholesale trade ............................................... 5 – 10 10 10Retail trade ...................................................... 5 – 10 10 10Transportation and warehousing ..................... 5 5 – 10 –Utilities ............................................................. 10 10 10 – –
Information ........................................................... – 5 – – 25Financial activities ................................................ 5 5 5 10 15
Finance and insurance .................................... 5 5 5 – –Credit intermediation and related activities .. 5 5 5 10 10Insurance carriers and related activities ...... 5 5 5 5 –
Education and health services ............................. 5 5 – 15 15Educational services ........................................ – 5 5 – –
Junior colleges, colleges, and universities ... 3 3 5 10 15Health care and social assistance ................... 5 5 – 15 15
See footnotes at end of table.
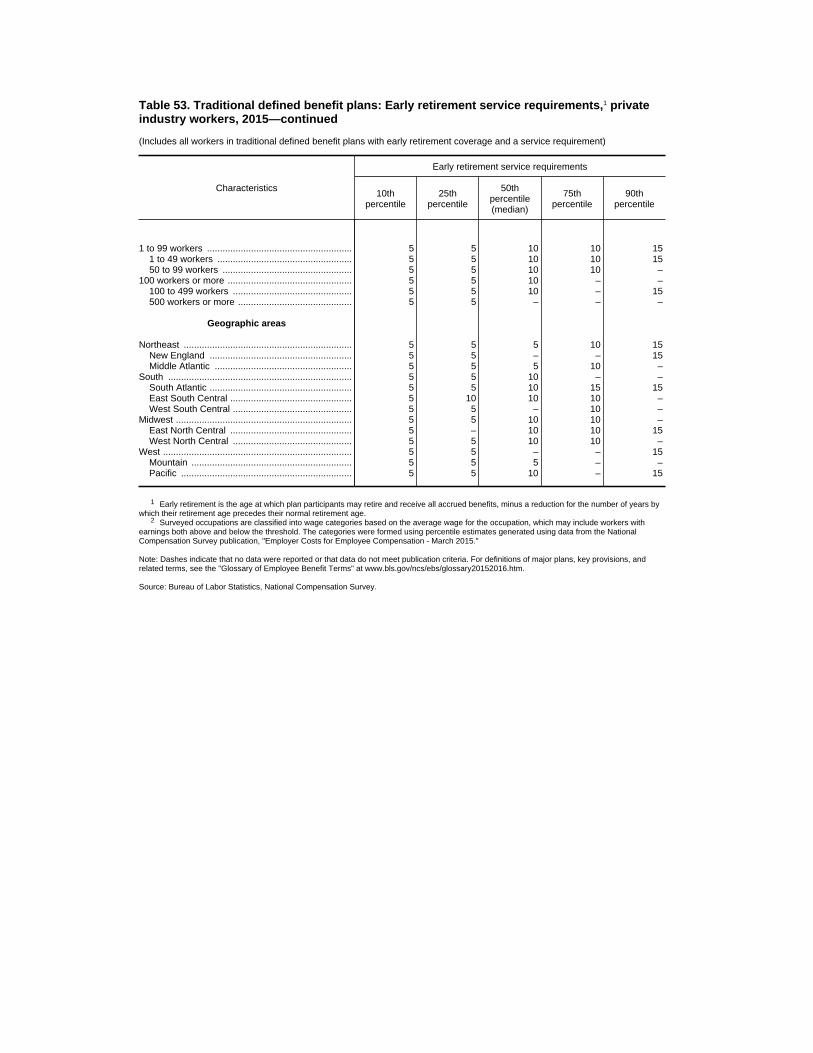
Table 53. Traditional defined benefit plans: Early retirement service requirements,1 privateindustry workers, 2015—continued
(Includes all workers in traditional defined benefit plans with early retirement coverage and a service requirement)
Characteristics
Early retirement service requirements
10thpercentile
25thpercentile
50thpercentile(median)
75thpercentile
90thpercentile
1 to 99 workers ........................................................ 5 5 10 10 151 to 49 workers .................................................... 5 5 10 10 1550 to 99 workers .................................................. 5 5 10 10 –
100 workers or more ................................................ 5 5 10 – –100 to 499 workers .............................................. 5 5 10 – 15500 workers or more ............................................ 5 5 – – –
Geographic areas
Northeast ................................................................. 5 5 5 10 15New England ....................................................... 5 5 – – 15Middle Atlantic ..................................................... 5 5 5 10 –
South ....................................................................... 5 5 10 – –South Atlantic ....................................................... 5 5 10 15 15East South Central ............................................... 5 10 10 10 –West South Central .............................................. 5 5 – 10 –
Midwest .................................................................... 5 5 10 10 –East North Central ............................................... 5 – 10 10 15West North Central .............................................. 5 5 10 10 –
West ......................................................................... 5 5 – – 15Mountain .............................................................. 5 5 5 – –Pacific .................................................................. 5 5 10 – 15
1 Early retirement is the age at which plan participants may retire and receive all accrued benefits, minus a reduction for the number of years bywhich their retirement age precedes their normal retirement age.
2 Surveyed occupations are classified into wage categories based on the average wage for the occupation, which may include workers withearnings both above and below the threshold. The categories were formed using percentile estimates generated using data from the NationalCompensation Survey publication, "Employer Costs for Employee Compensation - March 2015."
Note: Dashes indicate that no data were reported or that data do not meet publication criteria. For definitions of major plans, key provisions, andrelated terms, see the "Glossary of Employee Benefit Terms" at www.bls.gov/ncs/ebs/glossary20152016.htm.
Source: Bureau of Labor Statistics, National Compensation Survey.
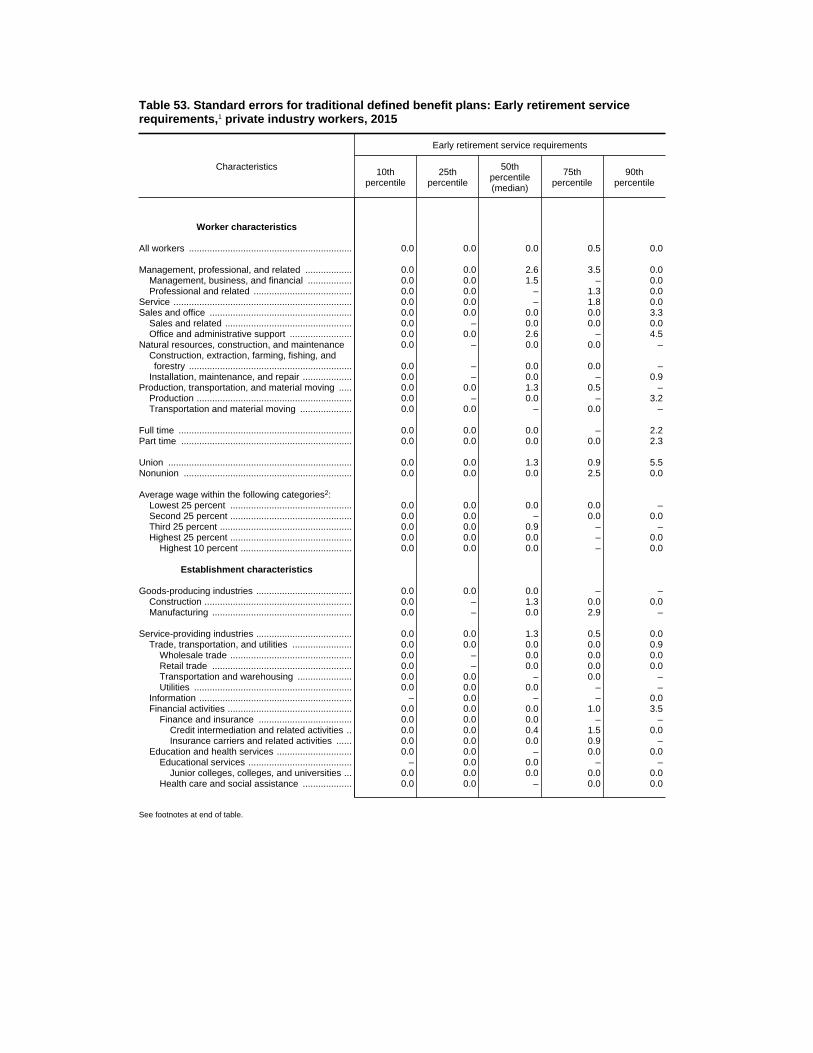
Table 53. Standard errors for traditional defined benefit plans: Early retirement servicerequirements,1 private industry workers, 2015
Characteristics
Early retirement service requirements
10thpercentile
25thpercentile
50thpercentile(median)
75thpercentile
90thpercentile
Worker characteristics
All workers ............................................................... 0.0 0.0 0.0 0.5 0.0
Management, professional, and related .................. 0.0 0.0 2.6 3.5 0.0Management, business, and financial ................. 0.0 0.0 1.5 – 0.0Professional and related ...................................... 0.0 0.0 – 1.3 0.0
Service ..................................................................... 0.0 0.0 – 1.8 0.0Sales and office ....................................................... 0.0 0.0 0.0 0.0 3.3
Sales and related ................................................. 0.0 – 0.0 0.0 0.0Office and administrative support ........................ 0.0 0.0 2.6 – 4.5
Natural resources, construction, and maintenance 0.0 – 0.0 0.0 –Construction, extraction, farming, fishing, andforestry ............................................................... 0.0 – 0.0 0.0 –
Installation, maintenance, and repair ................... 0.0 – 0.0 – 0.9Production, transportation, and material moving ..... 0.0 0.0 1.3 0.5 –
Production ............................................................ 0.0 – 0.0 – 3.2Transportation and material moving .................... 0.0 0.0 – 0.0 –
Full time ................................................................... 0.0 0.0 0.0 – 2.2Part time .................................................................. 0.0 0.0 0.0 0.0 2.3
Union ....................................................................... 0.0 0.0 1.3 0.9 5.5Nonunion ................................................................. 0.0 0.0 0.0 2.5 0.0
Average wage within the following categories2:Lowest 25 percent ............................................... 0.0 0.0 0.0 0.0 –Second 25 percent ............................................... 0.0 0.0 – 0.0 0.0Third 25 percent ................................................... 0.0 0.0 0.9 – –Highest 25 percent ............................................... 0.0 0.0 0.0 – 0.0
Highest 10 percent ........................................... 0.0 0.0 0.0 – 0.0
Establishment characteristics
Goods-producing industries ..................................... 0.0 0.0 0.0 – –Construction ......................................................... 0.0 – 1.3 0.0 0.0Manufacturing ...................................................... 0.0 – 0.0 2.9 –
Service-providing industries ..................................... 0.0 0.0 1.3 0.5 0.0Trade, transportation, and utilities ....................... 0.0 0.0 0.0 0.0 0.9
Wholesale trade ............................................... 0.0 – 0.0 0.0 0.0Retail trade ...................................................... 0.0 – 0.0 0.0 0.0Transportation and warehousing ..................... 0.0 0.0 – 0.0 –Utilities ............................................................. 0.0 0.0 0.0 – –
Information ........................................................... – 0.0 – – 0.0Financial activities ................................................ 0.0 0.0 0.0 1.0 3.5
Finance and insurance .................................... 0.0 0.0 0.0 – –Credit intermediation and related activities .. 0.0 0.0 0.4 1.5 0.0Insurance carriers and related activities ...... 0.0 0.0 0.0 0.9 –
Education and health services ............................. 0.0 0.0 – 0.0 0.0Educational services ........................................ – 0.0 0.0 – –
Junior colleges, colleges, and universities ... 0.0 0.0 0.0 0.0 0.0Health care and social assistance ................... 0.0 0.0 – 0.0 0.0
See footnotes at end of table.
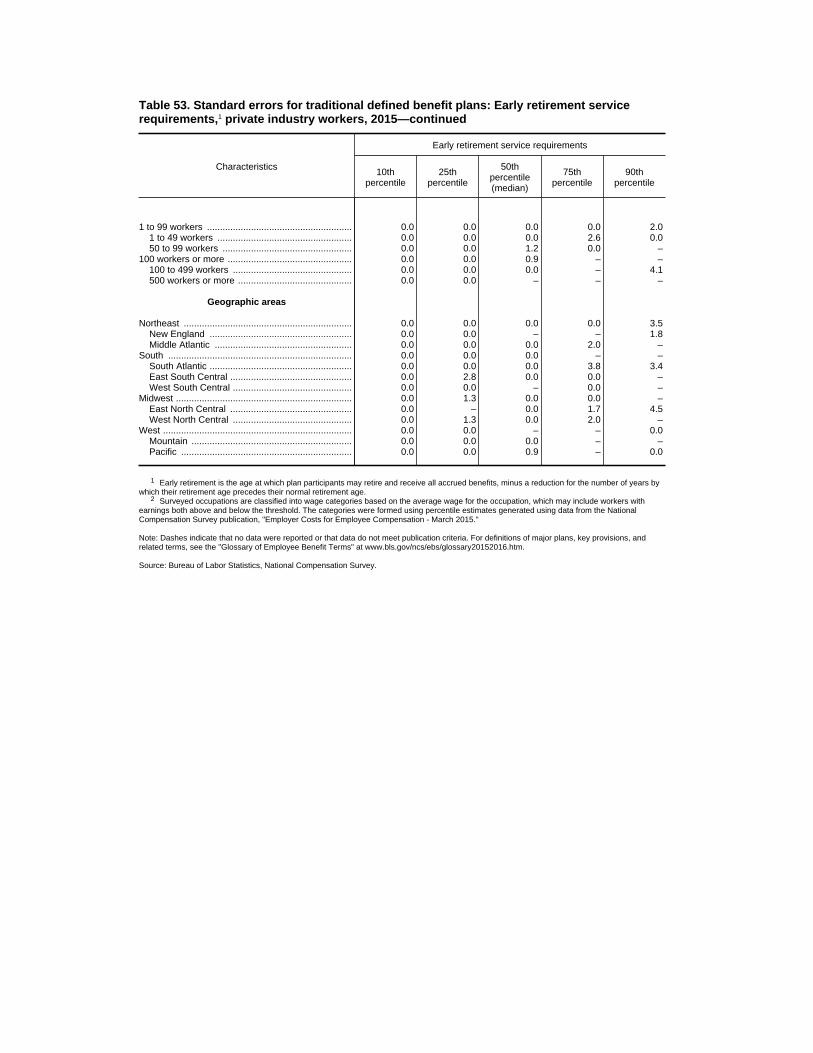
Table 53. Standard errors for traditional defined benefit plans: Early retirement servicerequirements,1 private industry workers, 2015—continued
Characteristics
Early retirement service requirements
10thpercentile
25thpercentile
50thpercentile(median)
75thpercentile
90thpercentile
1 to 99 workers ........................................................ 0.0 0.0 0.0 0.0 2.01 to 49 workers .................................................... 0.0 0.0 0.0 2.6 0.050 to 99 workers .................................................. 0.0 0.0 1.2 0.0 –
100 workers or more ................................................ 0.0 0.0 0.9 – –100 to 499 workers .............................................. 0.0 0.0 0.0 – 4.1500 workers or more ............................................ 0.0 0.0 – – –
Geographic areas
Northeast ................................................................. 0.0 0.0 0.0 0.0 3.5New England ....................................................... 0.0 0.0 – – 1.8Middle Atlantic ..................................................... 0.0 0.0 0.0 2.0 –
South ....................................................................... 0.0 0.0 0.0 – –South Atlantic ....................................................... 0.0 0.0 0.0 3.8 3.4East South Central ............................................... 0.0 2.8 0.0 0.0 –West South Central .............................................. 0.0 0.0 – 0.0 –
Midwest .................................................................... 0.0 1.3 0.0 0.0 –East North Central ............................................... 0.0 – 0.0 1.7 4.5West North Central .............................................. 0.0 1.3 0.0 2.0 –
West ......................................................................... 0.0 0.0 – – 0.0Mountain .............................................................. 0.0 0.0 0.0 – –Pacific .................................................................. 0.0 0.0 0.9 – 0.0
1 Early retirement is the age at which plan participants may retire and receive all accrued benefits, minus a reduction for the number of years bywhich their retirement age precedes their normal retirement age.
2 Surveyed occupations are classified into wage categories based on the average wage for the occupation, which may include workers withearnings both above and below the threshold. The categories were formed using percentile estimates generated using data from the NationalCompensation Survey publication, "Employer Costs for Employee Compensation - March 2015."
Note: Dashes indicate that no data were reported or that data do not meet publication criteria. For definitions of major plans, key provisions, andrelated terms, see the "Glossary of Employee Benefit Terms" at www.bls.gov/ncs/ebs/glossary20152016.htm.
Source: Bureau of Labor Statistics, National Compensation Survey.

Table 54. Defined contribution plans: Type of plan,1 private industry workers, 2015
(All workers participating in defined contribution plans = 100 percent)
Characteristics Savings andthrift
Deferredprofit
sharing
Moneypurchasepension
Employeestock
ownership
Simplifiedemployeepension(SEP)
Savingsincentive
match plan(SIMPLE)
Other
Worker characteristics
All workers ............................................................... 74 19 16 4 – 3 –
Management, professional, and related .................. 73 19 20 4 – 2 –Management, business, and financial ................. 77 20 17 – – – –Professional and related ...................................... 70 19 22 4 – – –
Service ..................................................................... 79 13 13 – – – –Protective service ................................................ 92 – – – – – –
Sales and office ....................................................... 79 18 11 6 – 3 –Sales and related ................................................. 80 15 8 9 – – –Office and administrative support ........................ 78 20 13 4 – – –
Natural resources, construction, and maintenance 59 18 19 – – – –Installation, maintenance, and repair ................... 71 15 13 – – – –
Production, transportation, and material moving ..... 75 20 15 – – – –Production ............................................................ 76 18 16 – – – –Transportation and material moving .................... 72 22 – – – – –
Full time ................................................................... 74 19 16 4 – 3 –Part time .................................................................. 75 13 11 11 – – –
Union ....................................................................... 67 – 27 – – – –Nonunion ................................................................. 75 19 15 4 – 3 –
Average wage within the following categories2:Lowest 25 percent ............................................... 78 18 7 7 – – –
Lowest 10 percent ........................................... 80 17 – – – – –Second 25 percent ............................................... 80 18 9 3 – – –Third 25 percent ................................................... 70 18 19 3 – 6 –Highest 25 percent ............................................... 73 20 21 5 – 1 –
Highest 10 percent ........................................... 79 16 19 – – – –
Establishment characteristics
Goods-producing industries ..................................... 70 21 18 6 – 3 –Manufacturing ...................................................... 75 20 17 – – – –
Service-providing industries ..................................... 76 18 15 4 – 3 –Trade, transportation, and utilities ....................... 81 18 8 5 – – –
Wholesale trade ............................................... 84 20 – – – – –Retail trade ...................................................... 79 18 – – – – –Transportation and warehousing ..................... 80 – – – – – –Utilities ............................................................. 90 – – – – – –
Information ........................................................... 83 19 – – – – –Financial activities ................................................ 86 18 16 7 – – –
Finance and insurance .................................... 88 18 17 7 – – –Credit intermediation and related activities .. 88 23 13 11 – – –Insurance carriers and related activities ...... 91 12 17 – – – –
Professional and business services ..................... 73 20 – – – – –Professional and technical services ................. 72 18 – – – – –
Education and health services ............................. 65 – 30 – – – –Educational services ........................................ 41 – 57 – – – –
Junior colleges, colleges, and universities ... 37 – 82 – – – –Health care and social assistance ................... 70 – 24 – – – –
See footnotes at end of table.
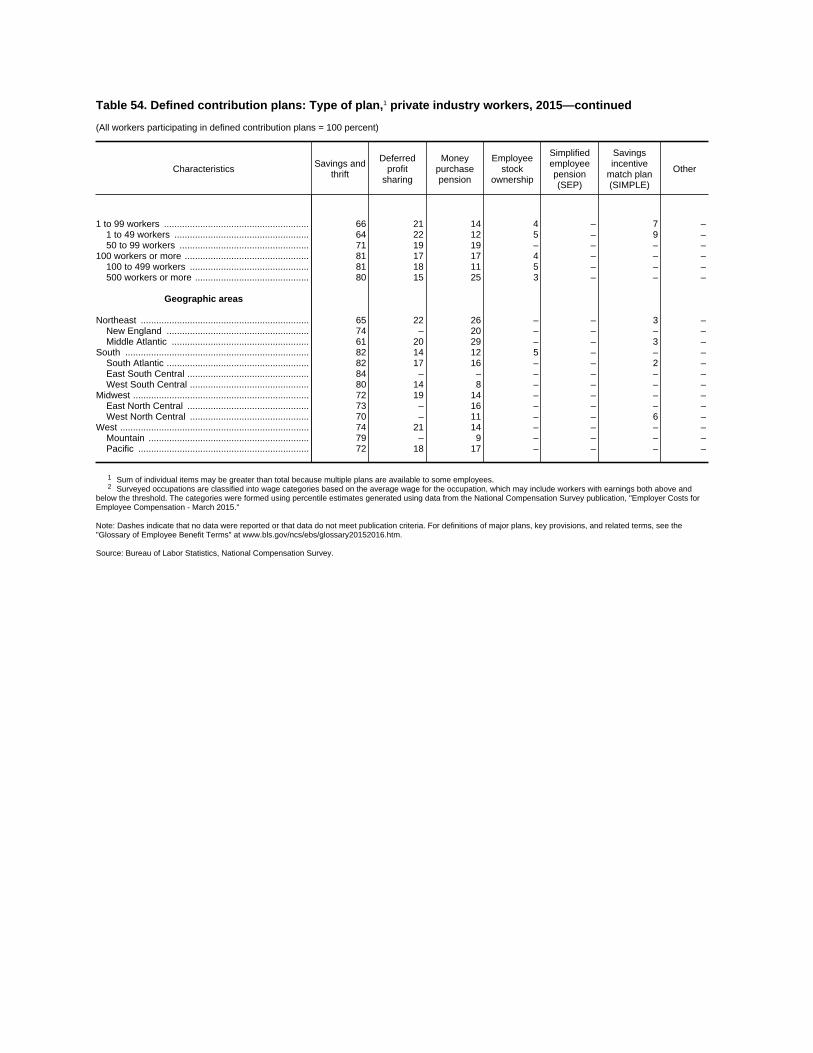
Table 54. Defined contribution plans: Type of plan,1 private industry workers, 2015—continued
(All workers participating in defined contribution plans = 100 percent)
Characteristics Savings andthrift
Deferredprofit
sharing
Moneypurchasepension
Employeestock
ownership
Simplifiedemployeepension(SEP)
Savingsincentive
match plan(SIMPLE)
Other
1 to 99 workers ........................................................ 66 21 14 4 – 7 –1 to 49 workers .................................................... 64 22 12 5 – 9 –50 to 99 workers .................................................. 71 19 19 – – – –
100 workers or more ................................................ 81 17 17 4 – – –100 to 499 workers .............................................. 81 18 11 5 – – –500 workers or more ............................................ 80 15 25 3 – – –
Geographic areas
Northeast ................................................................. 65 22 26 – – 3 –New England ....................................................... 74 – 20 – – – –Middle Atlantic ..................................................... 61 20 29 – – 3 –
South ....................................................................... 82 14 12 5 – – –South Atlantic ....................................................... 82 17 16 – – 2 –East South Central ............................................... 84 – – – – – –West South Central .............................................. 80 14 8 – – – –
Midwest .................................................................... 72 19 14 – – – –East North Central ............................................... 73 – 16 – – – –West North Central .............................................. 70 – 11 – – 6 –
West ......................................................................... 74 21 14 – – – –Mountain .............................................................. 79 – 9 – – – –Pacific .................................................................. 72 18 17 – – – –
1 Sum of individual items may be greater than total because multiple plans are available to some employees. 2 Surveyed occupations are classified into wage categories based on the average wage for the occupation, which may include workers with earnings both above and
below the threshold. The categories were formed using percentile estimates generated using data from the National Compensation Survey publication, "Employer Costs forEmployee Compensation - March 2015."
Note: Dashes indicate that no data were reported or that data do not meet publication criteria. For definitions of major plans, key provisions, and related terms, see the"Glossary of Employee Benefit Terms" at www.bls.gov/ncs/ebs/glossary20152016.htm.
Source: Bureau of Labor Statistics, National Compensation Survey.
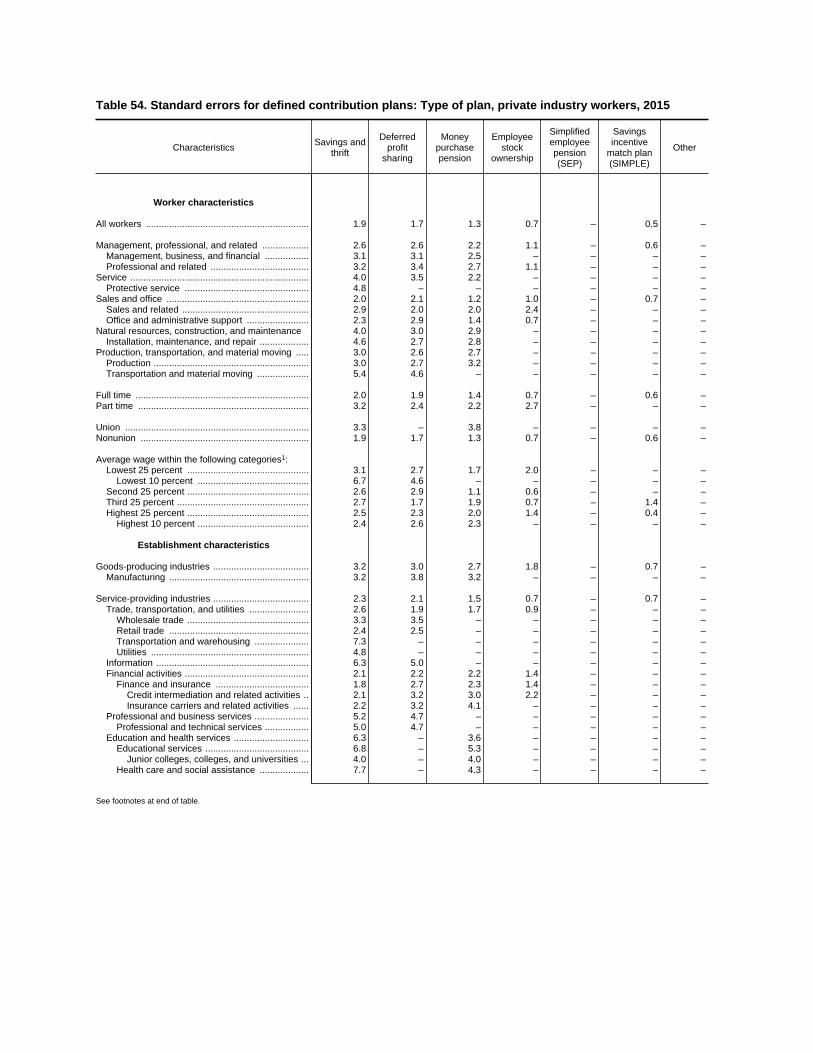
Table 54. Standard errors for defined contribution plans: Type of plan, private industry workers, 2015
Characteristics Savings andthrift
Deferredprofit
sharing
Moneypurchasepension
Employeestock
ownership
Simplifiedemployeepension(SEP)
Savingsincentive
match plan(SIMPLE)
Other
Worker characteristics
All workers ............................................................... 1.9 1.7 1.3 0.7 – 0.5 –
Management, professional, and related .................. 2.6 2.6 2.2 1.1 – 0.6 –Management, business, and financial ................. 3.1 3.1 2.5 – – – –Professional and related ...................................... 3.2 3.4 2.7 1.1 – – –
Service ..................................................................... 4.0 3.5 2.2 – – – –Protective service ................................................ 4.8 – – – – – –
Sales and office ....................................................... 2.0 2.1 1.2 1.0 – 0.7 –Sales and related ................................................. 2.9 2.0 2.0 2.4 – – –Office and administrative support ........................ 2.3 2.9 1.4 0.7 – – –
Natural resources, construction, and maintenance 4.0 3.0 2.9 – – – –Installation, maintenance, and repair ................... 4.6 2.7 2.8 – – – –
Production, transportation, and material moving ..... 3.0 2.6 2.7 – – – –Production ............................................................ 3.0 2.7 3.2 – – – –Transportation and material moving .................... 5.4 4.6 – – – – –
Full time ................................................................... 2.0 1.9 1.4 0.7 – 0.6 –Part time .................................................................. 3.2 2.4 2.2 2.7 – – –
Union ....................................................................... 3.3 – 3.8 – – – –Nonunion ................................................................. 1.9 1.7 1.3 0.7 – 0.6 –
Average wage within the following categories1:Lowest 25 percent ............................................... 3.1 2.7 1.7 2.0 – – –
Lowest 10 percent ........................................... 6.7 4.6 – – – – –Second 25 percent ............................................... 2.6 2.9 1.1 0.6 – – –Third 25 percent ................................................... 2.7 1.7 1.9 0.7 – 1.4 –Highest 25 percent ............................................... 2.5 2.3 2.0 1.4 – 0.4 –
Highest 10 percent ........................................... 2.4 2.6 2.3 – – – –
Establishment characteristics
Goods-producing industries ..................................... 3.2 3.0 2.7 1.8 – 0.7 –Manufacturing ...................................................... 3.2 3.8 3.2 – – – –
Service-providing industries ..................................... 2.3 2.1 1.5 0.7 – 0.7 –Trade, transportation, and utilities ....................... 2.6 1.9 1.7 0.9 – – –
Wholesale trade ............................................... 3.3 3.5 – – – – –Retail trade ...................................................... 2.4 2.5 – – – – –Transportation and warehousing ..................... 7.3 – – – – – –Utilities ............................................................. 4.8 – – – – – –
Information ........................................................... 6.3 5.0 – – – – –Financial activities ................................................ 2.1 2.2 2.2 1.4 – – –
Finance and insurance .................................... 1.8 2.7 2.3 1.4 – – –Credit intermediation and related activities .. 2.1 3.2 3.0 2.2 – – –Insurance carriers and related activities ...... 2.2 3.2 4.1 – – – –
Professional and business services ..................... 5.2 4.7 – – – – –Professional and technical services ................. 5.0 4.7 – – – – –
Education and health services ............................. 6.3 – 3.6 – – – –Educational services ........................................ 6.8 – 5.3 – – – –
Junior colleges, colleges, and universities ... 4.0 – 4.0 – – – –Health care and social assistance ................... 7.7 – 4.3 – – – –
See footnotes at end of table.

Table 54. Standard errors for defined contribution plans: Type of plan, private industry workers,2015—continued
Characteristics Savings andthrift
Deferredprofit
sharing
Moneypurchasepension
Employeestock
ownership
Simplifiedemployeepension(SEP)
Savingsincentive
match plan(SIMPLE)
Other
1 to 99 workers ........................................................ 2.9 2.5 2.1 1.0 – 1.2 –1 to 49 workers .................................................... 3.3 2.8 1.9 1.4 – 1.7 –50 to 99 workers .................................................. 5.4 3.7 5.2 – – – –
100 workers or more ................................................ 1.6 1.8 1.4 1.0 – – –100 to 499 workers .............................................. 2.4 2.6 1.7 1.5 – – –500 workers or more ............................................ 2.3 2.3 2.9 1.0 – – –
Geographic areas
Northeast ................................................................. 4.7 3.5 4.5 – – 0.7 –New England ....................................................... 6.9 – 3.9 – – – –Middle Atlantic ..................................................... 5.6 3.9 6.1 – – 0.9 –
South ....................................................................... 1.4 1.5 1.6 1.5 – – –South Atlantic ....................................................... 1.9 1.7 2.8 – – 0.6 –East South Central ............................................... 0.8 – – – – – –West South Central .............................................. 2.9 3.5 1.4 – – – –
Midwest .................................................................... 4.9 4.8 1.7 – – – –East North Central ............................................... 5.7 – 2.0 – – – –West North Central .............................................. 9.0 – 3.1 – – 1.3 –
West ......................................................................... 4.5 4.2 3.1 – – – –Mountain .............................................................. 7.2 – 2.6 – – – –Pacific .................................................................. 5.8 3.8 4.6 – – – –
1 Surveyed occupations are classified into wage categories based on the average wage for the occupation, which may include workers with earnings both above andbelow the threshold. The categories were formed using percentile estimates generated using data from the National Compensation Survey publication, "Employer Costs forEmployee Compensation - March 2015."
Note: Dashes indicate that no data were reported or that data do not meet publication criteria. For definitions of major plans, key provisions, and related terms, see the"Glossary of Employee Benefit Terms" at www.bls.gov/ncs/ebs/glossary20152016.htm.
Source: Bureau of Labor Statistics, National Compensation Survey.
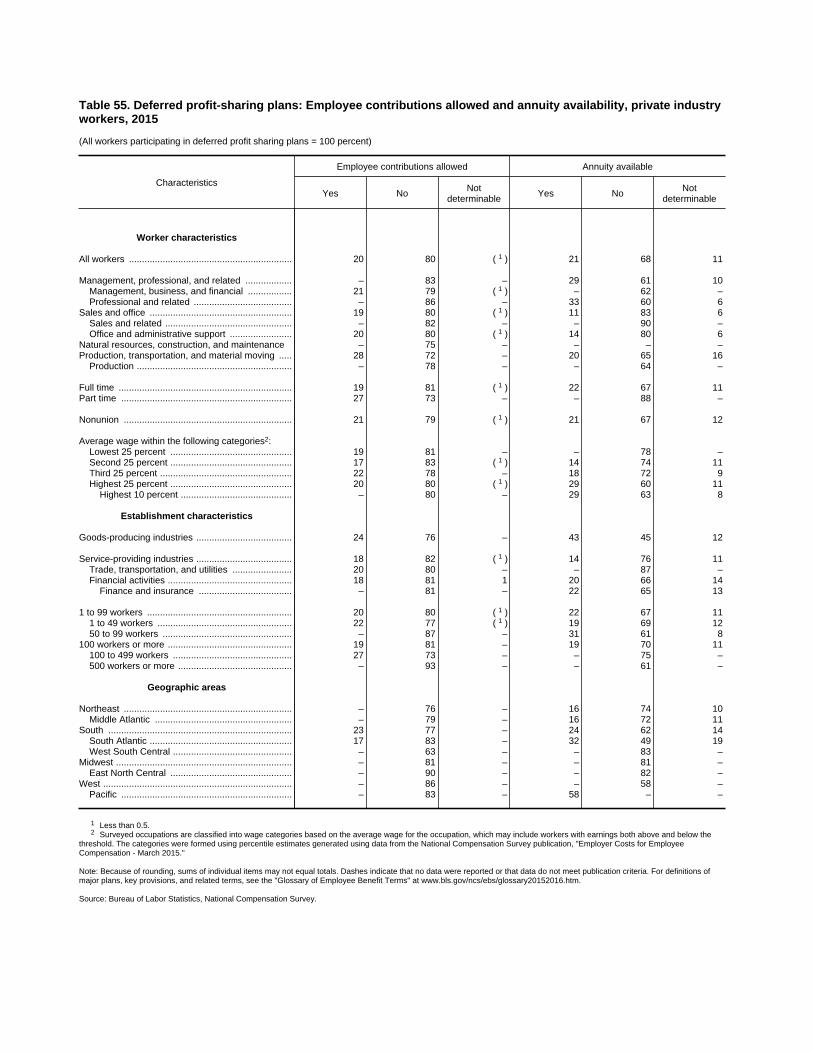
Table 55. Deferred profit-sharing plans: Employee contributions allowed and annuity availability, private industryworkers, 2015
(All workers participating in deferred profit sharing plans = 100 percent)
Characteristics
Employee contributions allowed Annuity available
Yes No Notdeterminable Yes No Not
determinable
Worker characteristics
All workers ............................................................... 20 80 1( ) 21 68 11
Management, professional, and related .................. – 83 – 29 61 10Management, business, and financial ................. 21 79 1( ) – 62 –Professional and related ...................................... – 86 – 33 60 6
Sales and office ....................................................... 19 80 1( ) 11 83 6Sales and related ................................................. – 82 – – 90 –Office and administrative support ........................ 20 80 1( ) 14 80 6
Natural resources, construction, and maintenance – 75 – – – –Production, transportation, and material moving ..... 28 72 – 20 65 16
Production ............................................................ – 78 – – 64 –
Full time ................................................................... 19 81 1( ) 22 67 11Part time .................................................................. 27 73 – – 88 –
Nonunion ................................................................. 21 79 1( ) 21 67 12
Average wage within the following categories2:Lowest 25 percent ............................................... 19 81 – – 78 –Second 25 percent ............................................... 17 83 1( ) 14 74 11Third 25 percent ................................................... 22 78 – 18 72 9Highest 25 percent ............................................... 20 80 1( ) 29 60 11
Highest 10 percent ........................................... – 80 – 29 63 8
Establishment characteristics
Goods-producing industries ..................................... 24 76 – 43 45 12
Service-providing industries ..................................... 18 82 1( ) 14 76 11Trade, transportation, and utilities ....................... 20 80 – – 87 –Financial activities ................................................ 18 81 1 20 66 14
Finance and insurance .................................... – 81 – 22 65 13
1 to 99 workers ........................................................ 20 80 1( ) 22 67 111 to 49 workers .................................................... 22 77 1( ) 19 69 1250 to 99 workers .................................................. – 87 – 31 61 8
100 workers or more ................................................ 19 81 – 19 70 11100 to 499 workers .............................................. 27 73 – – 75 –500 workers or more ............................................ – 93 – – 61 –
Geographic areas
Northeast ................................................................. – 76 – 16 74 10Middle Atlantic ..................................................... – 79 – 16 72 11
South ....................................................................... 23 77 – 24 62 14South Atlantic ....................................................... 17 83 – 32 49 19West South Central .............................................. – 63 – – 83 –
Midwest .................................................................... – 81 – – 81 –East North Central ............................................... – 90 – – 82 –
West ......................................................................... – 86 – – 58 –Pacific .................................................................. – 83 – 58 – –
1 Less than 0.5.2 Surveyed occupations are classified into wage categories based on the average wage for the occupation, which may include workers with earnings both above and below the
threshold. The categories were formed using percentile estimates generated using data from the National Compensation Survey publication, "Employer Costs for EmployeeCompensation - March 2015."
Note: Because of rounding, sums of individual items may not equal totals. Dashes indicate that no data were reported or that data do not meet publication criteria. For definitions ofmajor plans, key provisions, and related terms, see the "Glossary of Employee Benefit Terms" at www.bls.gov/ncs/ebs/glossary20152016.htm.
Source: Bureau of Labor Statistics, National Compensation Survey.
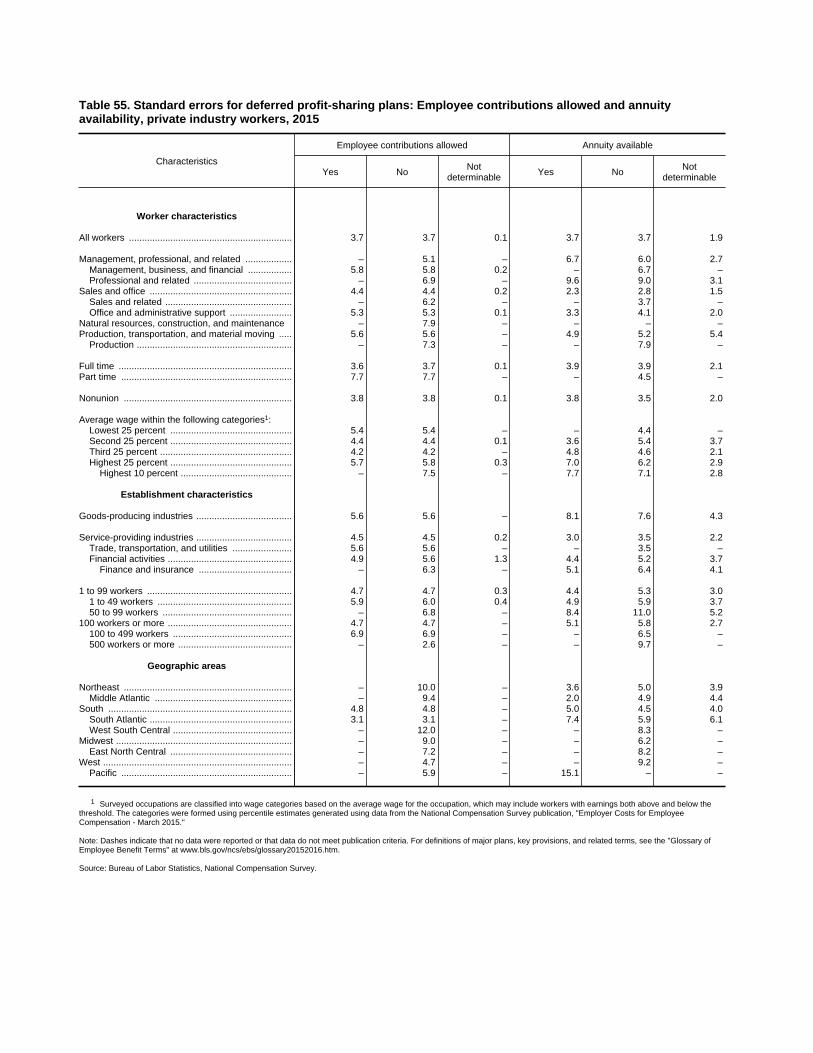
Table 55. Standard errors for deferred profit-sharing plans: Employee contributions allowed and annuityavailability, private industry workers, 2015
Characteristics
Employee contributions allowed Annuity available
Yes No Notdeterminable Yes No Not
determinable
Worker characteristics
All workers ............................................................... 3.7 3.7 0.1 3.7 3.7 1.9
Management, professional, and related .................. – 5.1 – 6.7 6.0 2.7Management, business, and financial ................. 5.8 5.8 0.2 – 6.7 –Professional and related ...................................... – 6.9 – 9.6 9.0 3.1
Sales and office ....................................................... 4.4 4.4 0.2 2.3 2.8 1.5Sales and related ................................................. – 6.2 – – 3.7 –Office and administrative support ........................ 5.3 5.3 0.1 3.3 4.1 2.0
Natural resources, construction, and maintenance – 7.9 – – – –Production, transportation, and material moving ..... 5.6 5.6 – 4.9 5.2 5.4
Production ............................................................ – 7.3 – – 7.9 –
Full time ................................................................... 3.6 3.7 0.1 3.9 3.9 2.1Part time .................................................................. 7.7 7.7 – – 4.5 –
Nonunion ................................................................. 3.8 3.8 0.1 3.8 3.5 2.0
Average wage within the following categories1:Lowest 25 percent ............................................... 5.4 5.4 – – 4.4 –Second 25 percent ............................................... 4.4 4.4 0.1 3.6 5.4 3.7Third 25 percent ................................................... 4.2 4.2 – 4.8 4.6 2.1Highest 25 percent ............................................... 5.7 5.8 0.3 7.0 6.2 2.9
Highest 10 percent ........................................... – 7.5 – 7.7 7.1 2.8
Establishment characteristics
Goods-producing industries ..................................... 5.6 5.6 – 8.1 7.6 4.3
Service-providing industries ..................................... 4.5 4.5 0.2 3.0 3.5 2.2Trade, transportation, and utilities ....................... 5.6 5.6 – – 3.5 –Financial activities ................................................ 4.9 5.6 1.3 4.4 5.2 3.7
Finance and insurance .................................... – 6.3 – 5.1 6.4 4.1
1 to 99 workers ........................................................ 4.7 4.7 0.3 4.4 5.3 3.01 to 49 workers .................................................... 5.9 6.0 0.4 4.9 5.9 3.750 to 99 workers .................................................. – 6.8 – 8.4 11.0 5.2
100 workers or more ................................................ 4.7 4.7 – 5.1 5.8 2.7100 to 499 workers .............................................. 6.9 6.9 – – 6.5 –500 workers or more ............................................ – 2.6 – – 9.7 –
Geographic areas
Northeast ................................................................. – 10.0 – 3.6 5.0 3.9Middle Atlantic ..................................................... – 9.4 – 2.0 4.9 4.4
South ....................................................................... 4.8 4.8 – 5.0 4.5 4.0South Atlantic ....................................................... 3.1 3.1 – 7.4 5.9 6.1West South Central .............................................. – 12.0 – – 8.3 –
Midwest .................................................................... – 9.0 – – 6.2 –East North Central ............................................... – 7.2 – – 8.2 –
West ......................................................................... – 4.7 – – 9.2 –Pacific .................................................................. – 5.9 – 15.1 – –
1 Surveyed occupations are classified into wage categories based on the average wage for the occupation, which may include workers with earnings both above and below thethreshold. The categories were formed using percentile estimates generated using data from the National Compensation Survey publication, "Employer Costs for EmployeeCompensation - March 2015."
Note: Dashes indicate that no data were reported or that data do not meet publication criteria. For definitions of major plans, key provisions, and related terms, see the "Glossary ofEmployee Benefit Terms" at www.bls.gov/ncs/ebs/glossary20152016.htm.
Source: Bureau of Labor Statistics, National Compensation Survey.
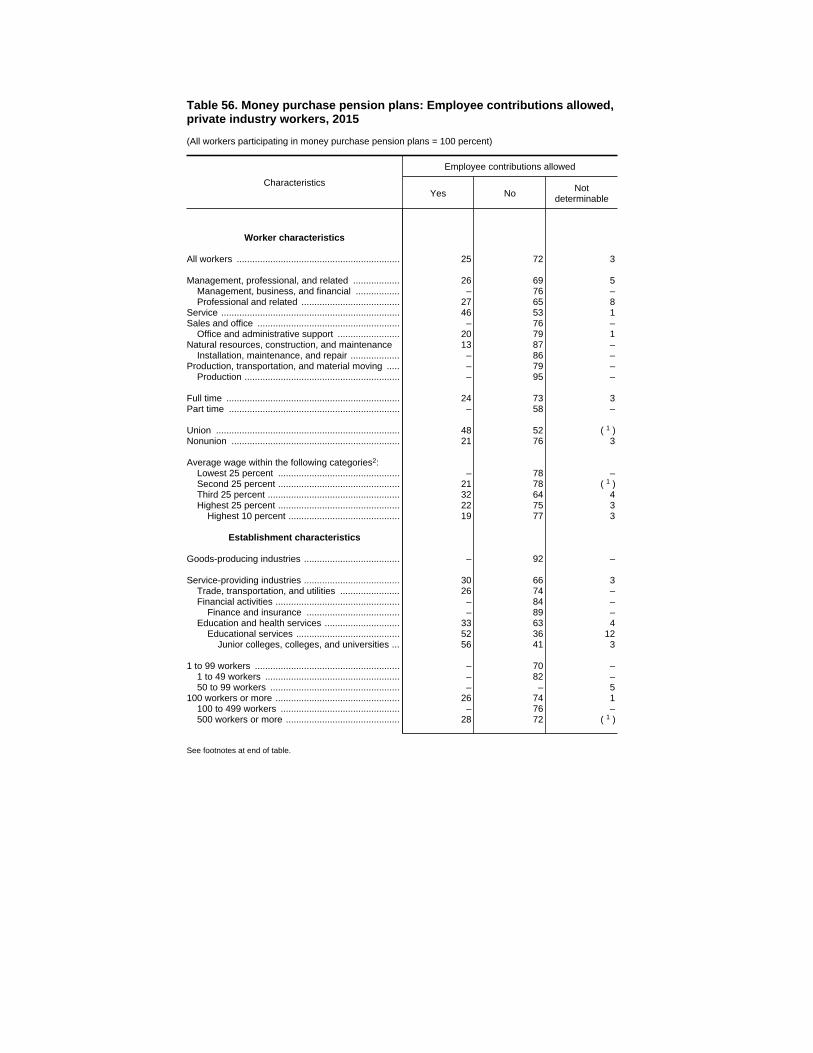
Table 56. Money purchase pension plans: Employee contributions allowed,private industry workers, 2015
(All workers participating in money purchase pension plans = 100 percent)
Characteristics
Employee contributions allowed
Yes No Notdeterminable
Worker characteristics
All workers ............................................................... 25 72 3
Management, professional, and related .................. 26 69 5Management, business, and financial ................. – 76 –Professional and related ...................................... 27 65 8
Service ..................................................................... 46 53 1Sales and office ....................................................... – 76 –
Office and administrative support ........................ 20 79 1Natural resources, construction, and maintenance 13 87 –
Installation, maintenance, and repair ................... – 86 –Production, transportation, and material moving ..... – 79 –
Production ............................................................ – 95 –
Full time ................................................................... 24 73 3Part time .................................................................. – 58 –
Union ....................................................................... 48 52 1( )Nonunion ................................................................. 21 76 3
Average wage within the following categories2:Lowest 25 percent ............................................... – 78 –Second 25 percent ............................................... 21 78 1( )Third 25 percent ................................................... 32 64 4Highest 25 percent ............................................... 22 75 3
Highest 10 percent ........................................... 19 77 3
Establishment characteristics
Goods-producing industries ..................................... – 92 –
Service-providing industries ..................................... 30 66 3Trade, transportation, and utilities ....................... 26 74 –Financial activities ................................................ – 84 –
Finance and insurance .................................... – 89 –Education and health services ............................. 33 63 4
Educational services ........................................ 52 36 12Junior colleges, colleges, and universities ... 56 41 3
1 to 99 workers ........................................................ – 70 –1 to 49 workers .................................................... – 82 –50 to 99 workers .................................................. – – 5
100 workers or more ................................................ 26 74 1100 to 499 workers .............................................. – 76 –500 workers or more ............................................ 28 72 1( )
See footnotes at end of table.
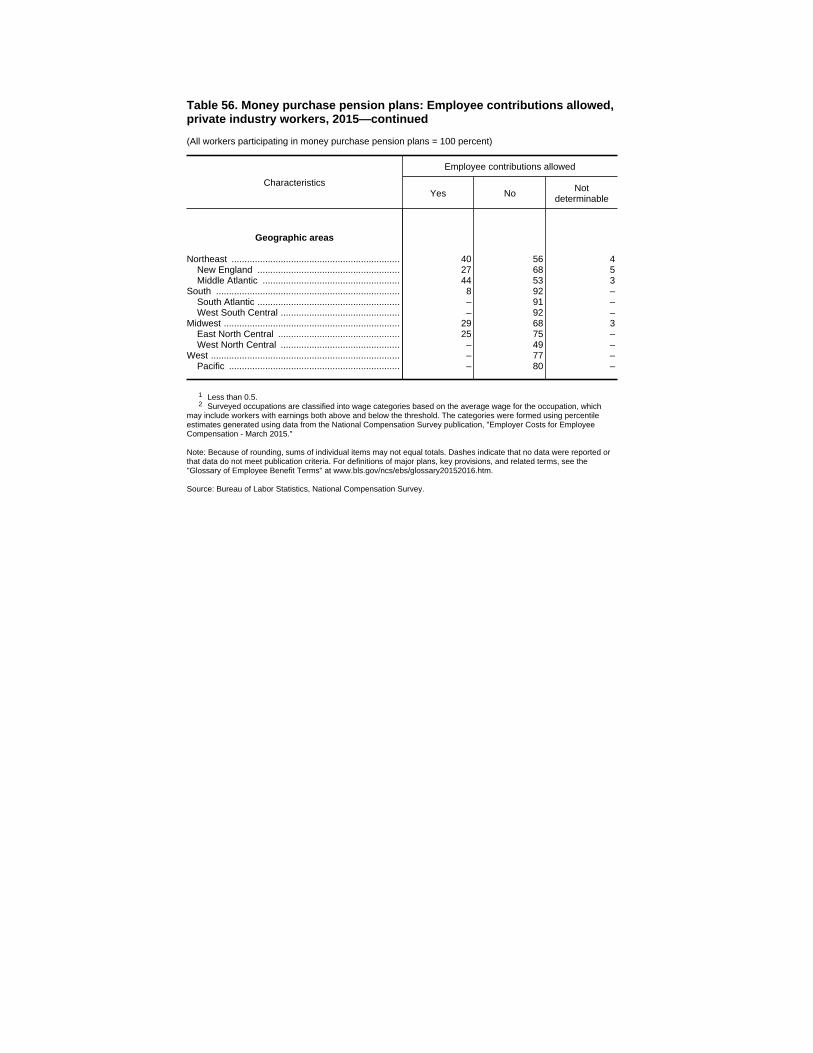
Table 56. Money purchase pension plans: Employee contributions allowed,private industry workers, 2015—continued
(All workers participating in money purchase pension plans = 100 percent)
Characteristics
Employee contributions allowed
Yes No Notdeterminable
Geographic areas
Northeast ................................................................. 40 56 4New England ....................................................... 27 68 5Middle Atlantic ..................................................... 44 53 3
South ....................................................................... 8 92 –South Atlantic ....................................................... – 91 –West South Central .............................................. – 92 –
Midwest .................................................................... 29 68 3East North Central ............................................... 25 75 –West North Central .............................................. – 49 –
West ......................................................................... – 77 –Pacific .................................................................. – 80 –
1 Less than 0.5.2 Surveyed occupations are classified into wage categories based on the average wage for the occupation, which
may include workers with earnings both above and below the threshold. The categories were formed using percentileestimates generated using data from the National Compensation Survey publication, "Employer Costs for EmployeeCompensation - March 2015."
Note: Because of rounding, sums of individual items may not equal totals. Dashes indicate that no data were reported orthat data do not meet publication criteria. For definitions of major plans, key provisions, and related terms, see the"Glossary of Employee Benefit Terms" at www.bls.gov/ncs/ebs/glossary20152016.htm.
Source: Bureau of Labor Statistics, National Compensation Survey.

Table 56. Standard errors for money purchase pension plans: Employeecontributions allowed, private industry workers, 2015
Characteristics
Employee contributions allowed
Yes No Notdeterminable
Worker characteristics
All workers ............................................................... 4.4 4.3 1.1
Management, professional, and related .................. 5.7 5.8 2.1Management, business, and financial ................. – 7.6 –Professional and related ...................................... 5.5 6.0 3.1
Service ..................................................................... 8.3 8.1 1.3Sales and office ....................................................... – 7.8 –
Office and administrative support ........................ 5.6 5.6 0.5Natural resources, construction, and maintenance 3.7 3.7 –
Installation, maintenance, and repair ................... – 7.0 –Production, transportation, and material moving ..... – 7.8 –
Production ............................................................ – 2.6 –
Full time ................................................................... 4.3 4.3 1.1Part time .................................................................. – 12.8 –
Union ....................................................................... 7.6 7.5 0.2Nonunion ................................................................. 4.7 4.7 1.2
Average wage within the following categories1:Lowest 25 percent ............................................... – 11.0 –Second 25 percent ............................................... 5.8 5.8 0.3Third 25 percent ................................................... 6.9 6.8 1.8Highest 25 percent ............................................... 4.0 4.2 1.5
Highest 10 percent ........................................... 3.6 3.9 1.7
Establishment characteristics
Goods-producing industries ..................................... – 3.4 –
Service-providing industries ..................................... 5.4 5.4 1.4Trade, transportation, and utilities ....................... 7.3 7.3 –Financial activities ................................................ – 5.0 –
Finance and insurance .................................... – 4.8 –Education and health services ............................. 5.7 5.8 2.2
Educational services ........................................ 6.3 2.7 5.7Junior colleges, colleges, and universities ... 5.0 3.6 2.3
1 to 99 workers ........................................................ – 9.1 –1 to 49 workers .................................................... – 5.5 –50 to 99 workers .................................................. – – 3.7
100 workers or more ................................................ 4.2 4.2 0.4100 to 499 workers .............................................. – 7.5 –500 workers or more ............................................ 4.6 4.6 0.3
See footnotes at end of table.
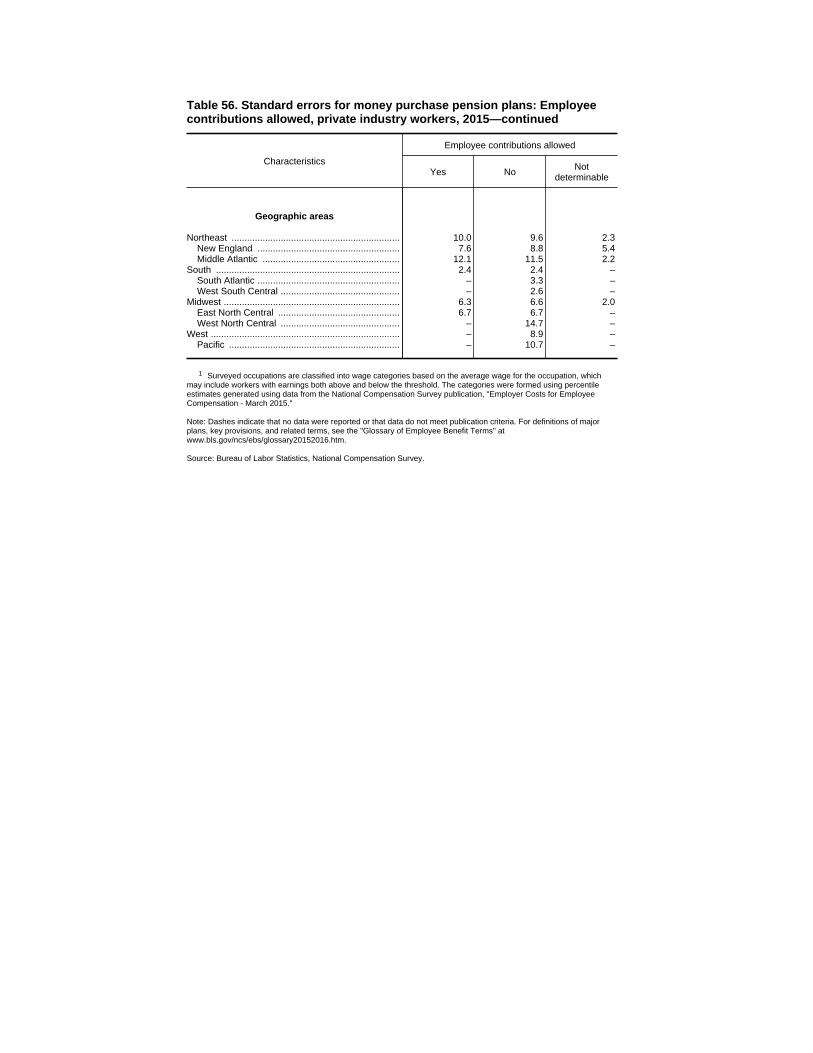
Table 56. Standard errors for money purchase pension plans: Employeecontributions allowed, private industry workers, 2015—continued
Characteristics
Employee contributions allowed
Yes No Notdeterminable
Geographic areas
Northeast ................................................................. 10.0 9.6 2.3New England ....................................................... 7.6 8.8 5.4Middle Atlantic ..................................................... 12.1 11.5 2.2
South ....................................................................... 2.4 2.4 –South Atlantic ....................................................... – 3.3 –West South Central .............................................. – 2.6 –
Midwest .................................................................... 6.3 6.6 2.0East North Central ............................................... 6.7 6.7 –West North Central .............................................. – 14.7 –
West ......................................................................... – 8.9 –Pacific .................................................................. – 10.7 –
1 Surveyed occupations are classified into wage categories based on the average wage for the occupation, whichmay include workers with earnings both above and below the threshold. The categories were formed using percentileestimates generated using data from the National Compensation Survey publication, "Employer Costs for EmployeeCompensation - March 2015."
Note: Dashes indicate that no data were reported or that data do not meet publication criteria. For definitions of majorplans, key provisions, and related terms, see the "Glossary of Employee Benefit Terms" atwww.bls.gov/ncs/ebs/glossary20152016.htm.
Source: Bureau of Labor Statistics, National Compensation Survey.
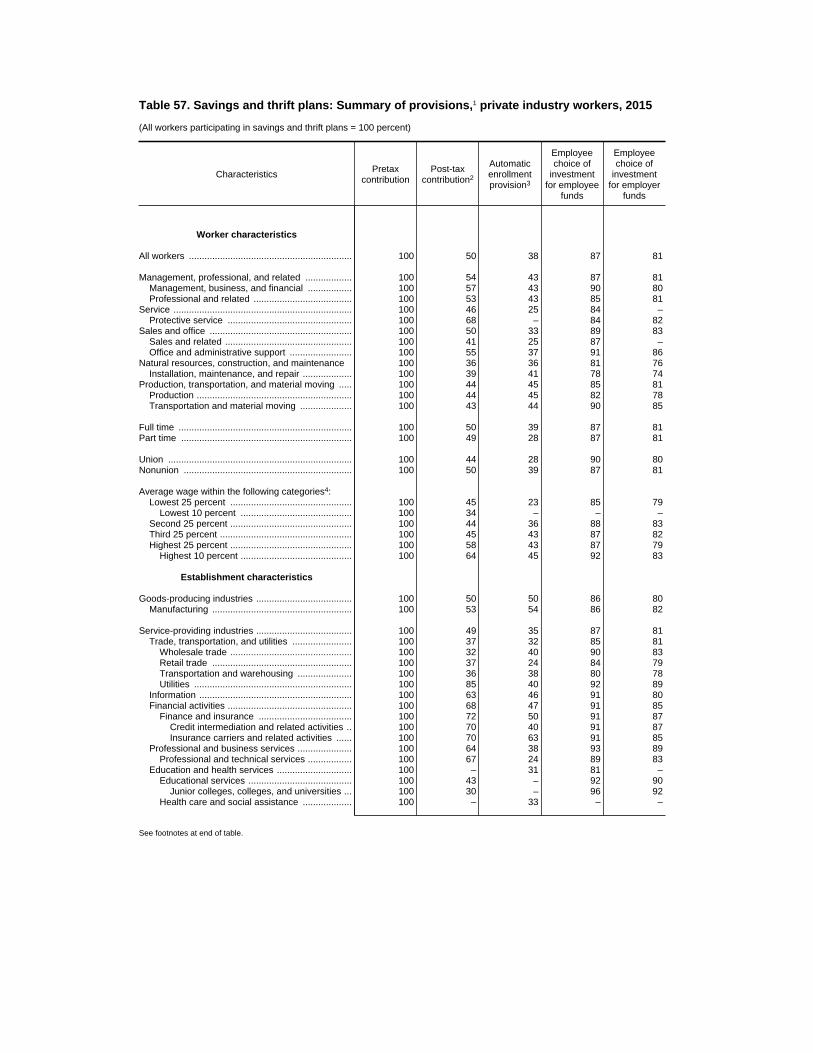
Table 57. Savings and thrift plans: Summary of provisions,1 private industry workers, 2015
(All workers participating in savings and thrift plans = 100 percent)
Characteristics Pretaxcontribution
Post-taxcontribution2
Automaticenrollmentprovision3
Employeechoice of
investmentfor employee
funds
Employeechoice of
investmentfor employer
funds
Worker characteristics
All workers ............................................................... 100 50 38 87 81
Management, professional, and related .................. 100 54 43 87 81Management, business, and financial ................. 100 57 43 90 80Professional and related ...................................... 100 53 43 85 81
Service ..................................................................... 100 46 25 84 –Protective service ................................................ 100 68 – 84 82
Sales and office ....................................................... 100 50 33 89 83Sales and related ................................................. 100 41 25 87 –Office and administrative support ........................ 100 55 37 91 86
Natural resources, construction, and maintenance 100 36 36 81 76Installation, maintenance, and repair ................... 100 39 41 78 74
Production, transportation, and material moving ..... 100 44 45 85 81Production ............................................................ 100 44 45 82 78Transportation and material moving .................... 100 43 44 90 85
Full time ................................................................... 100 50 39 87 81Part time .................................................................. 100 49 28 87 81
Union ....................................................................... 100 44 28 90 80Nonunion ................................................................. 100 50 39 87 81
Average wage within the following categories4:Lowest 25 percent ............................................... 100 45 23 85 79
Lowest 10 percent ........................................... 100 34 – – –Second 25 percent ............................................... 100 44 36 88 83Third 25 percent ................................................... 100 45 43 87 82Highest 25 percent ............................................... 100 58 43 87 79
Highest 10 percent ........................................... 100 64 45 92 83
Establishment characteristics
Goods-producing industries ..................................... 100 50 50 86 80Manufacturing ...................................................... 100 53 54 86 82
Service-providing industries ..................................... 100 49 35 87 81Trade, transportation, and utilities ....................... 100 37 32 85 81
Wholesale trade ............................................... 100 32 40 90 83Retail trade ...................................................... 100 37 24 84 79Transportation and warehousing ..................... 100 36 38 80 78Utilities ............................................................. 100 85 40 92 89
Information ........................................................... 100 63 46 91 80Financial activities ................................................ 100 68 47 91 85
Finance and insurance .................................... 100 72 50 91 87Credit intermediation and related activities .. 100 70 40 91 87Insurance carriers and related activities ...... 100 70 63 91 85
Professional and business services ..................... 100 64 38 93 89Professional and technical services ................. 100 67 24 89 83
Education and health services ............................. 100 – 31 81 –Educational services ........................................ 100 43 – 92 90
Junior colleges, colleges, and universities ... 100 30 – 96 92Health care and social assistance ................... 100 – 33 – –
See footnotes at end of table.
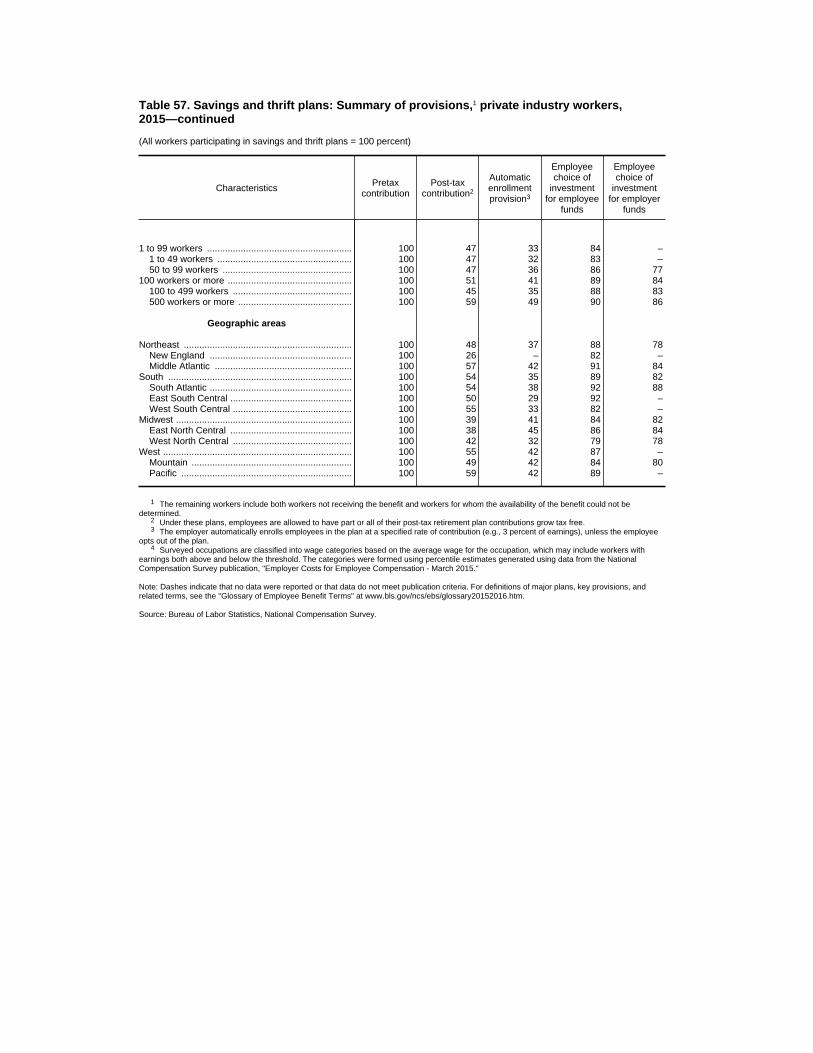
Table 57. Savings and thrift plans: Summary of provisions,1 private industry workers,2015—continued
(All workers participating in savings and thrift plans = 100 percent)
Characteristics Pretaxcontribution
Post-taxcontribution2
Automaticenrollmentprovision3
Employeechoice of
investmentfor employee
funds
Employeechoice of
investmentfor employer
funds
1 to 99 workers ........................................................ 100 47 33 84 –1 to 49 workers .................................................... 100 47 32 83 –50 to 99 workers .................................................. 100 47 36 86 77
100 workers or more ................................................ 100 51 41 89 84100 to 499 workers .............................................. 100 45 35 88 83500 workers or more ............................................ 100 59 49 90 86
Geographic areas
Northeast ................................................................. 100 48 37 88 78New England ....................................................... 100 26 – 82 –Middle Atlantic ..................................................... 100 57 42 91 84
South ....................................................................... 100 54 35 89 82South Atlantic ....................................................... 100 54 38 92 88East South Central ............................................... 100 50 29 92 –West South Central .............................................. 100 55 33 82 –
Midwest .................................................................... 100 39 41 84 82East North Central ............................................... 100 38 45 86 84West North Central .............................................. 100 42 32 79 78
West ......................................................................... 100 55 42 87 –Mountain .............................................................. 100 49 42 84 80Pacific .................................................................. 100 59 42 89 –
1 The remaining workers include both workers not receiving the benefit and workers for whom the availability of the benefit could not bedetermined.
2 Under these plans, employees are allowed to have part or all of their post-tax retirement plan contributions grow tax free.3 The employer automatically enrolls employees in the plan at a specified rate of contribution (e.g., 3 percent of earnings), unless the employee
opts out of the plan.4 Surveyed occupations are classified into wage categories based on the average wage for the occupation, which may include workers with
earnings both above and below the threshold. The categories were formed using percentile estimates generated using data from the NationalCompensation Survey publication, "Employer Costs for Employee Compensation - March 2015."
Note: Dashes indicate that no data were reported or that data do not meet publication criteria. For definitions of major plans, key provisions, andrelated terms, see the "Glossary of Employee Benefit Terms" at www.bls.gov/ncs/ebs/glossary20152016.htm.
Source: Bureau of Labor Statistics, National Compensation Survey.

Table 57. Standard errors for savings and thrift plans: Summary of provisions,1 privateindustry workers, 2015
Characteristics Pretaxcontribution
Post-taxcontribution2
Automaticenrollmentprovision3
Employeechoice of
investmentfor employee
funds
Employeechoice of
investmentfor employer
funds
Worker characteristics
All workers ............................................................... 0.0 2.3 1.7 1.3 1.4
Management, professional, and related .................. 0.0 3.6 2.9 2.2 2.2Management, business, and financial ................. 0.0 4.2 3.5 1.6 2.4Professional and related ...................................... 4( ) 4.1 3.4 3.2 3.2
Service ..................................................................... 0.0 6.5 5.7 4.4 –Protective service ................................................ 0.0 11.0 – 8.5 8.9
Sales and office ....................................................... 0.0 2.9 2.1 1.3 2.4Sales and related ................................................. 0.0 5.5 3.2 3.1 –Office and administrative support ........................ 0.0 2.8 2.8 1.9 2.2
Natural resources, construction, and maintenance 0.0 4.3 3.7 4.6 4.5Installation, maintenance, and repair ................... 0.0 4.8 4.5 5.3 5.1
Production, transportation, and material moving ..... 0.0 3.3 4.5 3.2 3.1Production ............................................................ 0.0 4.2 7.0 4.8 5.0Transportation and material moving .................... 4( ) 6.6 5.2 2.6 2.4
Full time ................................................................... 4( ) 2.4 1.7 1.4 1.6Part time .................................................................. 0.0 5.0 3.3 3.1 3.4
Union ....................................................................... 0.0 6.4 5.5 2.8 3.6Nonunion ................................................................. 0.0 2.5 1.8 1.4 1.5
Average wage within the following categories5:Lowest 25 percent ............................................... 0.0 4.9 3.4 3.4 3.8
Lowest 10 percent ........................................... 0.0 8.1 – – –Second 25 percent ............................................... 0.0 3.5 3.3 2.2 2.4Third 25 percent ................................................... 4( ) 2.7 2.2 1.8 1.8Highest 25 percent ............................................... 0.0 3.7 3.0 2.2 2.6
Highest 10 percent ........................................... 0.0 4.5 4.0 1.4 2.8
Establishment characteristics
Goods-producing industries ..................................... 4( ) 3.2 4.7 2.6 3.0Manufacturing ...................................................... 0.0 3.4 5.3 3.5 3.8
Service-providing industries ..................................... 0.0 2.8 1.6 1.5 1.6Trade, transportation, and utilities ....................... 0.0 3.6 2.1 1.9 1.7
Wholesale trade ............................................... 0.0 5.3 3.9 3.6 4.4Retail trade ...................................................... 0.0 4.9 3.0 2.5 2.8Transportation and warehousing ..................... 0.0 8.6 7.5 8.3 8.3Utilities ............................................................. 0.0 5.9 9.3 4.8 4.3
Information ........................................................... 4( ) 5.9 7.5 3.5 5.1Financial activities ................................................ 0.0 3.1 3.2 1.4 1.6
Finance and insurance .................................... 0.0 3.5 3.3 1.4 1.6Credit intermediation and related activities .. 4( ) 5.4 5.1 2.3 2.5Insurance carriers and related activities ...... 0.0 5.5 4.0 2.6 3.3
Professional and business services ..................... 0.0 7.7 5.4 2.6 3.9Professional and technical services ................. 0.0 9.4 5.0 4.3 6.1
Education and health services ............................. 0.0 – 4.6 6.2 –Educational services ........................................ 0.0 7.9 – 4.8 5.0
Junior colleges, colleges, and universities ... 0.0 5.9 – 4.0 4.8Health care and social assistance ................... 0.0 – 5.2 – –
See footnotes at end of table.

Table 57. Standard errors for savings and thrift plans: Summary of provisions,1 privateindustry workers, 2015—continued
Characteristics Pretaxcontribution
Post-taxcontribution2
Automaticenrollmentprovision3
Employeechoice of
investmentfor employee
funds
Employeechoice of
investmentfor employer
funds
1 to 99 workers ........................................................ 0.0 3.6 2.9 2.5 –1 to 49 workers .................................................... 0.0 4.3 3.3 2.2 –50 to 99 workers .................................................. 0.0 6.9 5.7 6.7 6.8
100 workers or more ................................................ 0.0 2.3 2.4 1.4 1.5100 to 499 workers .............................................. 0.0 3.2 2.7 1.8 2.0500 workers or more ............................................ 4( ) 3.4 3.7 2.2 2.3
Geographic areas
Northeast ................................................................. 0.0 9.0 5.0 1.9 2.9New England ....................................................... 0.0 4.1 – 3.8 –Middle Atlantic ..................................................... 0.0 12.1 6.6 2.1 2.6
South ....................................................................... 0.0 2.6 2.1 1.9 2.4South Atlantic ....................................................... 0.0 2.5 3.2 1.5 1.0East South Central ............................................... 0.0 11.8 4.5 2.8 –West South Central .............................................. 0.0 4.6 3.0 5.6 –
Midwest .................................................................... 0.0 2.6 3.8 2.2 2.4East North Central ............................................... 0.0 2.9 4.7 2.7 3.1West North Central .............................................. 4( ) 5.3 4.5 2.9 2.8
West ......................................................................... 0.0 6.2 3.4 4.1 –Mountain .............................................................. 0.0 12.6 5.2 9.3 8.9Pacific .................................................................. 0.0 6.1 4.4 2.7 –
1 The remaining workers include both workers not receiving the benefit and workers for whom the availability of the benefit could not bedetermined.
2 Under these plans, employees are allowed to have part or all of their post-tax retirement plan contributions grow tax free.3 The employer automatically enrolls employees in the plan at a specified rate of contribution (e.g., 3 percent of earnings), unless the employee
opts out of the plan.4 Less than 0.05.5 Surveyed occupations are classified into wage categories based on the average wage for the occupation, which may include workers with
earnings both above and below the threshold. The categories were formed using percentile estimates generated using data from the NationalCompensation Survey publication, "Employer Costs for Employee Compensation - March 2015."
Note: Dashes indicate that no data were reported or that data do not meet publication criteria. For definitions of major plans, key provisions, andrelated terms, see the "Glossary of Employee Benefit Terms" at www.bls.gov/ncs/ebs/glossary20152016.htm.
Source: Bureau of Labor Statistics, National Compensation Survey.

Table 58. Savings and thrift plans: Maximum employee contributions, private industry workers, 2015
(All workers participating in savings and thrift plans = 100 percent)
Characteristics Percent ofearnings
Percent of earnings, up to Internal Revenue Code limit Any amountup to Internal
RevenueCode limit
Other Notdeterminable10th
percentile25th
percentile
50thpercentile(median)
75thpercentile
90thpercentile
Worker characteristics
All workers ............................................................... 60 25 50 50 75 80 39 – –
Management, professional, and related .................. 58 25 50 50 75 85 42 – –Management, business, and financial ................. 62 25 35 50 75 80 38 – –Professional and related ...................................... 55 25 50 60 75 85 45 – –
Service ..................................................................... 54 25 50 75 75 80 46 – –Protective service ................................................ 78 50 – 75 75 75 – – –
Sales and office ....................................................... 66 40 50 50 75 80 34 – –Sales and related ................................................. 77 40 50 50 – 80 23 – –Office and administrative support ........................ 60 – 50 50 75 90 40 – –
Natural resources, construction, and maintenance 58 25 50 – 75 – 41 – –Installation, maintenance, and repair ................... 63 25 40 50 75 85 35 – –
Production, transportation, and material moving ..... 61 25 50 50 75 75 39 – –Production ............................................................ 53 25 – 50 75 75 47 – –Transportation and material moving .................... 73 – 50 50 75 80 27 – –
Full time ................................................................... 59 25 50 50 75 80 41 – –Part time .................................................................. 71 30 50 50 75 80 29 – –
Union ....................................................................... 67 25 50 50 75 75 32 – –Nonunion ................................................................. 60 25 50 50 75 80 40 – –
Average wage within the following categories1:Lowest 25 percent ............................................... 63 25 50 50 75 80 37 – –
Lowest 10 percent ........................................... 60 25 – 50 – 75 40 – –Second 25 percent ............................................... 62 – 50 50 75 80 38 – –Third 25 percent ................................................... 54 25 50 50 75 80 46 – –Highest 25 percent ............................................... 63 25 50 50 75 – 36 – –
Highest 10 percent ........................................... 69 25 50 50 75 85 31 – –
Establishment characteristics
Goods-producing industries ..................................... 57 25 50 50 75 75 43 – –Manufacturing ...................................................... 60 25 40 50 65 75 40 – –
Service-providing industries ..................................... 61 25 50 50 75 85 39 – –Trade, transportation, and utilities ....................... 72 25 50 50 60 80 27 – –
Wholesale trade ............................................... 59 – 25 50 60 75 41 – –Retail trade ...................................................... 76 30 50 50 – 80 24 – –Transportation and warehousing ..................... 78 35 50 50 – 90 – – –Utilities ............................................................. 78 25 30 50 75 75 – – –
Information ........................................................... 77 25 – 50 75 80 23 – –Financial activities ................................................ 66 40 50 50 75 80 34 – –
Finance and insurance .................................... 69 40 50 50 75 80 31 – –Credit intermediation and related activities .. 66 50 50 50 75 80 34 – –Insurance carriers and related activities ...... 69 30 50 50 75 80 31 – –
Professional and business services ..................... 73 – 50 50 75 90 27 – –Professional and technical services ................. 69 25 50 60 80 90 31 – –
Education and health services ............................. 25 – – 75 90 95 75 – –Educational services ........................................ – – – – – – 85 – –
Junior colleges, colleges, and universities ... 18 75 75 75 92 95 82 – –Health care and social assistance ................... 26 – – 75 80 99 74 – –
See footnotes at end of table.
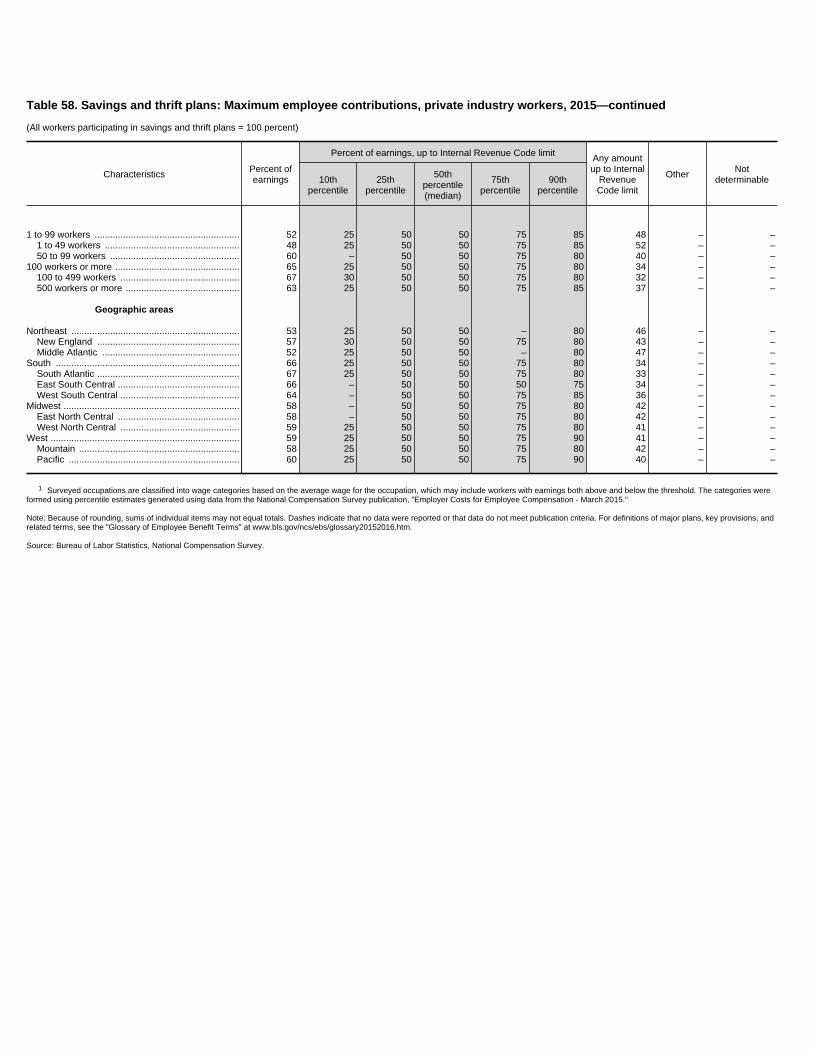
Table 58. Savings and thrift plans: Maximum employee contributions, private industry workers, 2015—continued
(All workers participating in savings and thrift plans = 100 percent)
Characteristics Percent ofearnings
Percent of earnings, up to Internal Revenue Code limit Any amountup to Internal
RevenueCode limit
Other Notdeterminable10th
percentile25th
percentile
50thpercentile(median)
75thpercentile
90thpercentile
1 to 99 workers ........................................................ 52 25 50 50 75 85 48 – –1 to 49 workers .................................................... 48 25 50 50 75 85 52 – –50 to 99 workers .................................................. 60 – 50 50 75 80 40 – –
100 workers or more ................................................ 65 25 50 50 75 80 34 – –100 to 499 workers .............................................. 67 30 50 50 75 80 32 – –500 workers or more ............................................ 63 25 50 50 75 85 37 – –
Geographic areas
Northeast ................................................................. 53 25 50 50 – 80 46 – –New England ....................................................... 57 30 50 50 75 80 43 – –Middle Atlantic ..................................................... 52 25 50 50 – 80 47 – –
South ....................................................................... 66 25 50 50 75 80 34 – –South Atlantic ....................................................... 67 25 50 50 75 80 33 – –East South Central ............................................... 66 – 50 50 50 75 34 – –West South Central .............................................. 64 – 50 50 75 85 36 – –
Midwest .................................................................... 58 – 50 50 75 80 42 – –East North Central ............................................... 58 – 50 50 75 80 42 – –West North Central .............................................. 59 25 50 50 75 80 41 – –
West ......................................................................... 59 25 50 50 75 90 41 – –Mountain .............................................................. 58 25 50 50 75 80 42 – –Pacific .................................................................. 60 25 50 50 75 90 40 – –
1 Surveyed occupations are classified into wage categories based on the average wage for the occupation, which may include workers with earnings both above and below the threshold. The categories wereformed using percentile estimates generated using data from the National Compensation Survey publication, "Employer Costs for Employee Compensation - March 2015."
Note: Because of rounding, sums of individual items may not equal totals. Dashes indicate that no data were reported or that data do not meet publication criteria. For definitions of major plans, key provisions, andrelated terms, see the "Glossary of Employee Benefit Terms" at www.bls.gov/ncs/ebs/glossary20152016.htm.
Source: Bureau of Labor Statistics, National Compensation Survey.
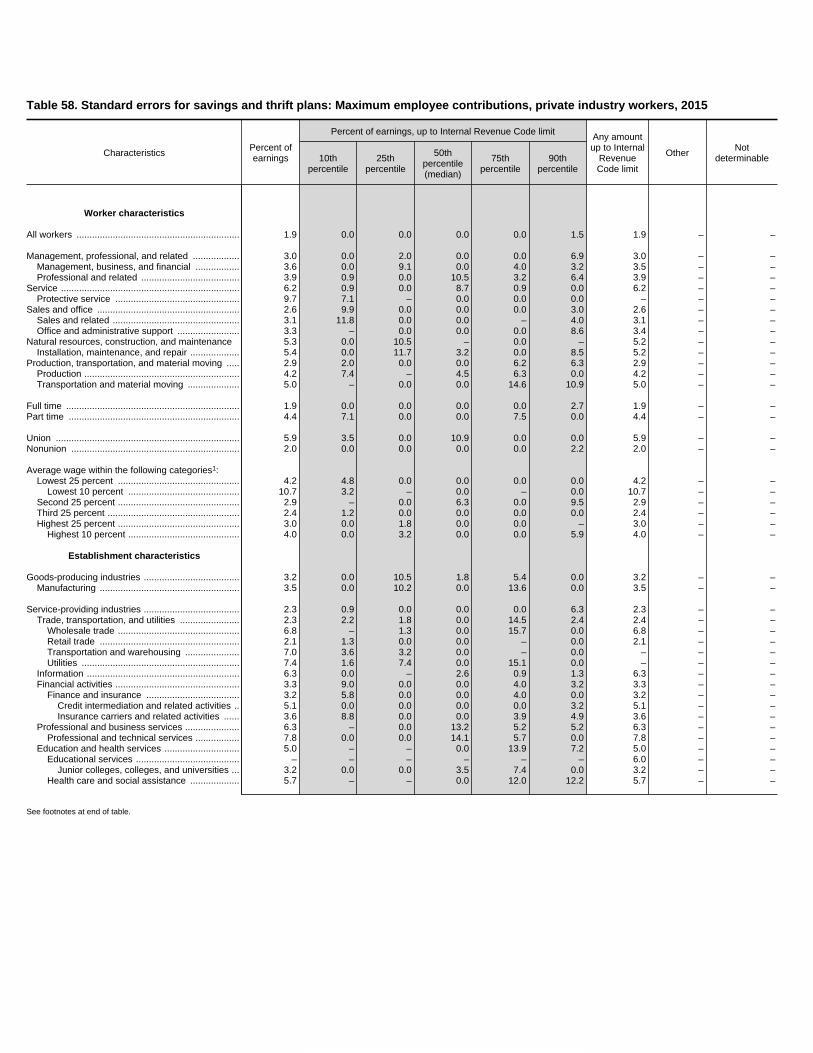
Table 58. Standard errors for savings and thrift plans: Maximum employee contributions, private industry workers, 2015
Characteristics Percent ofearnings
Percent of earnings, up to Internal Revenue Code limit Any amountup to Internal
RevenueCode limit
Other Notdeterminable10th
percentile25th
percentile
50thpercentile(median)
75thpercentile
90thpercentile
Worker characteristics
All workers ............................................................... 1.9 0.0 0.0 0.0 0.0 1.5 1.9 – –
Management, professional, and related .................. 3.0 0.0 2.0 0.0 0.0 6.9 3.0 – –Management, business, and financial ................. 3.6 0.0 9.1 0.0 4.0 3.2 3.5 – –Professional and related ...................................... 3.9 0.9 0.0 10.5 3.2 6.4 3.9 – –
Service ..................................................................... 6.2 0.9 0.0 8.7 0.9 0.0 6.2 – –Protective service ................................................ 9.7 7.1 – 0.0 0.0 0.0 – – –
Sales and office ....................................................... 2.6 9.9 0.0 0.0 0.0 3.0 2.6 – –Sales and related ................................................. 3.1 11.8 0.0 0.0 – 4.0 3.1 – –Office and administrative support ........................ 3.3 – 0.0 0.0 0.0 8.6 3.4 – –
Natural resources, construction, and maintenance 5.3 0.0 10.5 – 0.0 – 5.2 – –Installation, maintenance, and repair ................... 5.4 0.0 11.7 3.2 0.0 8.5 5.2 – –
Production, transportation, and material moving ..... 2.9 2.0 0.0 0.0 6.2 6.3 2.9 – –Production ............................................................ 4.2 7.4 – 4.5 6.3 0.0 4.2 – –Transportation and material moving .................... 5.0 – 0.0 0.0 14.6 10.9 5.0 – –
Full time ................................................................... 1.9 0.0 0.0 0.0 0.0 2.7 1.9 – –Part time .................................................................. 4.4 7.1 0.0 0.0 7.5 0.0 4.4 – –
Union ....................................................................... 5.9 3.5 0.0 10.9 0.0 0.0 5.9 – –Nonunion ................................................................. 2.0 0.0 0.0 0.0 0.0 2.2 2.0 – –
Average wage within the following categories1:Lowest 25 percent ............................................... 4.2 4.8 0.0 0.0 0.0 0.0 4.2 – –
Lowest 10 percent ........................................... 10.7 3.2 – 0.0 – 0.0 10.7 – –Second 25 percent ............................................... 2.9 – 0.0 6.3 0.0 9.5 2.9 – –Third 25 percent ................................................... 2.4 1.2 0.0 0.0 0.0 0.0 2.4 – –Highest 25 percent ............................................... 3.0 0.0 1.8 0.0 0.0 – 3.0 – –
Highest 10 percent ........................................... 4.0 0.0 3.2 0.0 0.0 5.9 4.0 – –
Establishment characteristics
Goods-producing industries ..................................... 3.2 0.0 10.5 1.8 5.4 0.0 3.2 – –Manufacturing ...................................................... 3.5 0.0 10.2 0.0 13.6 0.0 3.5 – –
Service-providing industries ..................................... 2.3 0.9 0.0 0.0 0.0 6.3 2.3 – –Trade, transportation, and utilities ....................... 2.3 2.2 1.8 0.0 14.5 2.4 2.4 – –
Wholesale trade ............................................... 6.8 – 1.3 0.0 15.7 0.0 6.8 – –Retail trade ...................................................... 2.1 1.3 0.0 0.0 – 0.0 2.1 – –Transportation and warehousing ..................... 7.0 3.6 3.2 0.0 – 0.0 – – –Utilities ............................................................. 7.4 1.6 7.4 0.0 15.1 0.0 – – –
Information ........................................................... 6.3 0.0 – 2.6 0.9 1.3 6.3 – –Financial activities ................................................ 3.3 9.0 0.0 0.0 4.0 3.2 3.3 – –
Finance and insurance .................................... 3.2 5.8 0.0 0.0 4.0 0.0 3.2 – –Credit intermediation and related activities .. 5.1 0.0 0.0 0.0 0.0 3.2 5.1 – –Insurance carriers and related activities ...... 3.6 8.8 0.0 0.0 3.9 4.9 3.6 – –
Professional and business services ..................... 6.3 – 0.0 13.2 5.2 5.2 6.3 – –Professional and technical services ................. 7.8 0.0 0.0 14.1 5.7 0.0 7.8 – –
Education and health services ............................. 5.0 – – 0.0 13.9 7.2 5.0 – –Educational services ........................................ – – – – – – 6.0 – –
Junior colleges, colleges, and universities ... 3.2 0.0 0.0 3.5 7.4 0.0 3.2 – –Health care and social assistance ................... 5.7 – – 0.0 12.0 12.2 5.7 – –
See footnotes at end of table.

Table 58. Standard errors for savings and thrift plans: Maximum employee contributions, private industry workers, 2015—continued
Characteristics Percent ofearnings
Percent of earnings, up to Internal Revenue Code limit Any amountup to Internal
RevenueCode limit
Other Notdeterminable10th
percentile25th
percentile
50thpercentile(median)
75thpercentile
90thpercentile
1 to 99 workers ........................................................ 2.9 0.0 2.6 0.0 0.0 6.4 2.9 – –1 to 49 workers .................................................... 3.7 0.0 3.6 8.8 0.9 6.3 3.7 – –50 to 99 workers .................................................. 6.8 – 12.6 1.8 5.6 13.7 6.8 – –
100 workers or more ................................................ 2.3 2.9 0.0 0.0 0.0 0.0 2.3 – –100 to 499 workers .............................................. 2.9 7.3 0.0 0.0 2.0 0.9 2.9 – –500 workers or more ............................................ 3.0 0.9 0.0 0.0 0.0 7.5 3.0 – –
Geographic areas
Northeast ................................................................. 7.0 3.4 7.8 0.0 – 6.6 7.2 – –New England ....................................................... 7.6 3.5 9.7 2.6 20.5 6.9 7.6 – –Middle Atlantic ..................................................... 9.1 3.8 13.1 0.0 – 9.6 9.4 – –
South ....................................................................... 2.1 3.4 0.0 0.0 0.0 1.3 2.1 – –South Atlantic ....................................................... 3.3 6.6 0.0 13.2 0.0 0.0 3.3 – –East South Central ............................................... 1.8 – 14.1 0.0 8.9 4.7 1.8 – –West South Central .............................................. 3.4 – 0.0 11.2 4.3 7.5 3.4 – –
Midwest .................................................................... 3.6 – 0.0 4.1 0.0 0.0 3.6 – –East North Central ............................................... 5.0 – 0.0 7.5 0.0 1.6 5.0 – –West North Central .............................................. 3.1 6.5 0.0 0.0 6.1 2.6 3.1 – –
West ......................................................................... 4.2 0.0 0.0 0.0 0.0 11.4 4.2 – –Mountain .............................................................. 5.6 0.0 0.0 0.0 5.1 0.0 5.6 – –Pacific .................................................................. 5.9 0.0 2.7 0.0 1.6 4.6 5.9 – –
1 Surveyed occupations are classified into wage categories based on the average wage for the occupation, which may include workers with earnings both above and below the threshold. The categories wereformed using percentile estimates generated using data from the National Compensation Survey publication, "Employer Costs for Employee Compensation - March 2015."
Note: Dashes indicate that no data were reported or that data do not meet publication criteria. For definitions of major plans, key provisions, and related terms, see the "Glossary of Employee Benefit Terms" atwww.bls.gov/ncs/ebs/glossary20152016.htm.
Source: Bureau of Labor Statistics, National Compensation Survey.
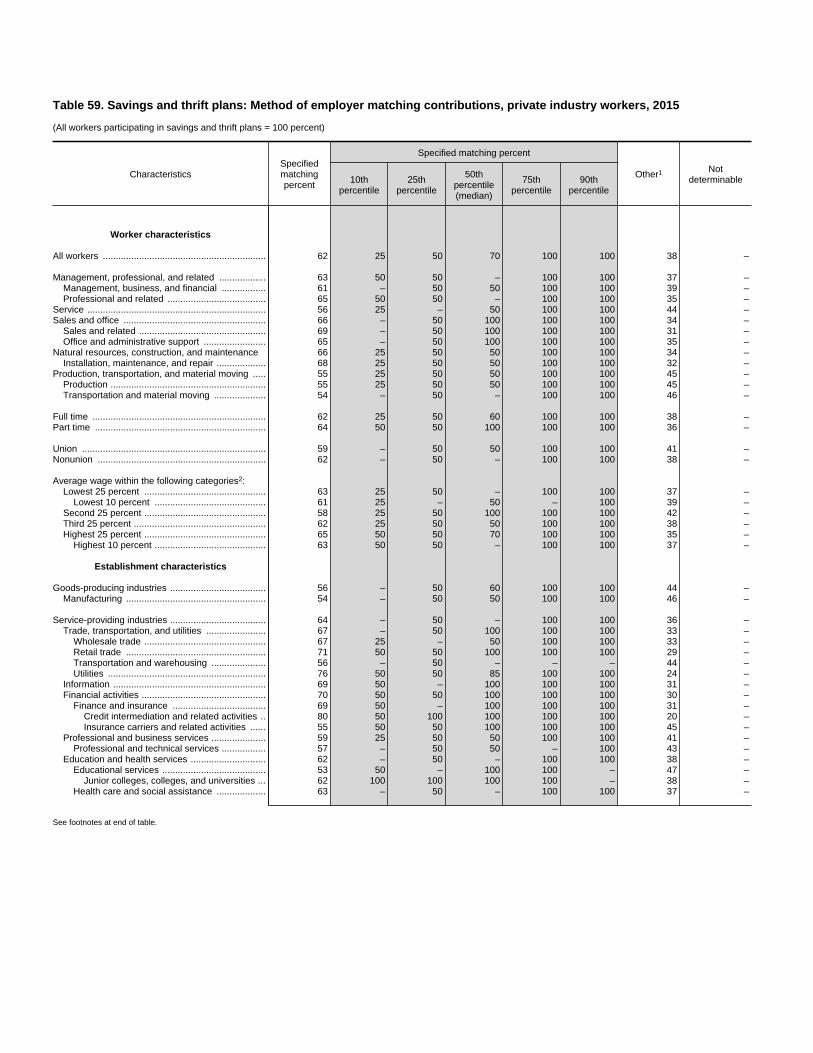
Table 59. Savings and thrift plans: Method of employer matching contributions, private industry workers, 2015
(All workers participating in savings and thrift plans = 100 percent)
CharacteristicsSpecifiedmatchingpercent
Specified matching percent
Other1 Notdeterminable10th
percentile25th
percentile
50thpercentile(median)
75thpercentile
90thpercentile
Worker characteristics
All workers ............................................................... 62 25 50 70 100 100 38 –
Management, professional, and related .................. 63 50 50 – 100 100 37 –Management, business, and financial ................. 61 – 50 50 100 100 39 –Professional and related ...................................... 65 50 50 – 100 100 35 –
Service ..................................................................... 56 25 – 50 100 100 44 –Sales and office ....................................................... 66 – 50 100 100 100 34 –
Sales and related ................................................. 69 – 50 100 100 100 31 –Office and administrative support ........................ 65 – 50 100 100 100 35 –
Natural resources, construction, and maintenance 66 25 50 50 100 100 34 –Installation, maintenance, and repair ................... 68 25 50 50 100 100 32 –
Production, transportation, and material moving ..... 55 25 50 50 100 100 45 –Production ............................................................ 55 25 50 50 100 100 45 –Transportation and material moving .................... 54 – 50 – 100 100 46 –
Full time ................................................................... 62 25 50 60 100 100 38 –Part time .................................................................. 64 50 50 100 100 100 36 –
Union ....................................................................... 59 – 50 50 100 100 41 –Nonunion ................................................................. 62 – 50 – 100 100 38 –
Average wage within the following categories2:Lowest 25 percent ............................................... 63 25 50 – 100 100 37 –
Lowest 10 percent ........................................... 61 25 – 50 – 100 39 –Second 25 percent ............................................... 58 25 50 100 100 100 42 –Third 25 percent ................................................... 62 25 50 50 100 100 38 –Highest 25 percent ............................................... 65 50 50 70 100 100 35 –
Highest 10 percent ........................................... 63 50 50 – 100 100 37 –
Establishment characteristics
Goods-producing industries ..................................... 56 – 50 60 100 100 44 –Manufacturing ...................................................... 54 – 50 50 100 100 46 –
Service-providing industries ..................................... 64 – 50 – 100 100 36 –Trade, transportation, and utilities ....................... 67 – 50 100 100 100 33 –
Wholesale trade ............................................... 67 25 – 50 100 100 33 –Retail trade ...................................................... 71 50 50 100 100 100 29 –Transportation and warehousing ..................... 56 – 50 – – – 44 –Utilities ............................................................. 76 50 50 85 100 100 24 –
Information ........................................................... 69 50 – 100 100 100 31 –Financial activities ................................................ 70 50 50 100 100 100 30 –
Finance and insurance .................................... 69 50 – 100 100 100 31 –Credit intermediation and related activities .. 80 50 100 100 100 100 20 –Insurance carriers and related activities ...... 55 50 50 100 100 100 45 –
Professional and business services ..................... 59 25 50 50 100 100 41 –Professional and technical services ................. 57 – 50 50 – 100 43 –
Education and health services ............................. 62 – 50 – 100 100 38 –Educational services ........................................ 53 50 – 100 100 – 47 –
Junior colleges, colleges, and universities ... 62 100 100 100 100 – 38 –Health care and social assistance ................... 63 – 50 – 100 100 37 –
See footnotes at end of table.

Table 59. Savings and thrift plans: Method of employer matching contributions, private industry workers, 2015—continued
(All workers participating in savings and thrift plans = 100 percent)
CharacteristicsSpecifiedmatchingpercent
Specified matching percent
Other1 Notdeterminable10th
percentile25th
percentile
50thpercentile(median)
75thpercentile
90thpercentile
1 to 99 workers ........................................................ 58 25 50 – 100 100 42 –1 to 49 workers .................................................... 64 – 50 – 100 100 36 –50 to 99 workers .................................................. 47 25 50 – 100 100 53 –
100 workers or more ................................................ 64 – 50 75 100 100 36 –100 to 499 workers .............................................. 63 – 50 – 100 100 37 –500 workers or more ............................................ 66 – 50 – 100 100 34 –
Geographic areas
Northeast ................................................................. 67 25 50 – 100 100 33 –New England ....................................................... 71 25 – 50 100 100 29 –Middle Atlantic ..................................................... 65 25 50 – 100 100 35 –
South ....................................................................... 62 – 50 100 100 100 38 –South Atlantic ....................................................... 61 – 50 – 100 100 39 –East South Central ............................................... 70 25 – – 100 100 30 –West South Central .............................................. 59 50 50 – 100 – 41 –
Midwest .................................................................... 68 – 50 100 100 100 32 –East North Central ............................................... 64 – 50 100 100 100 36 –West North Central .............................................. 75 – 50 – 100 100 25 –
West ......................................................................... 53 – 50 50 100 100 47 –Mountain .............................................................. 50 25 50 50 100 100 50 –Pacific .................................................................. 55 – 50 50 100 100 45 –
1 Other methods of employer matches include maximum dollar amounts specified by the employer, varying contributions by the employer based on employee contributions or service, and othermatching methods.
2 Surveyed occupations are classified into wage categories based on the average wage for the occupation, which may include workers with earnings both above and below the threshold. Thecategories were formed using percentile estimates generated using data from the National Compensation Survey publication, "Employer Costs for Employee Compensation - March 2015."
Note: Because of rounding, sums of individual items may not equal totals. Dashes indicate that no data were reported or that data do not meet publication criteria. For definitions of major plans, keyprovisions, and related terms, see the "Glossary of Employee Benefit Terms" at www.bls.gov/ncs/ebs/glossary20152016.htm.
Source: Bureau of Labor Statistics, National Compensation Survey.
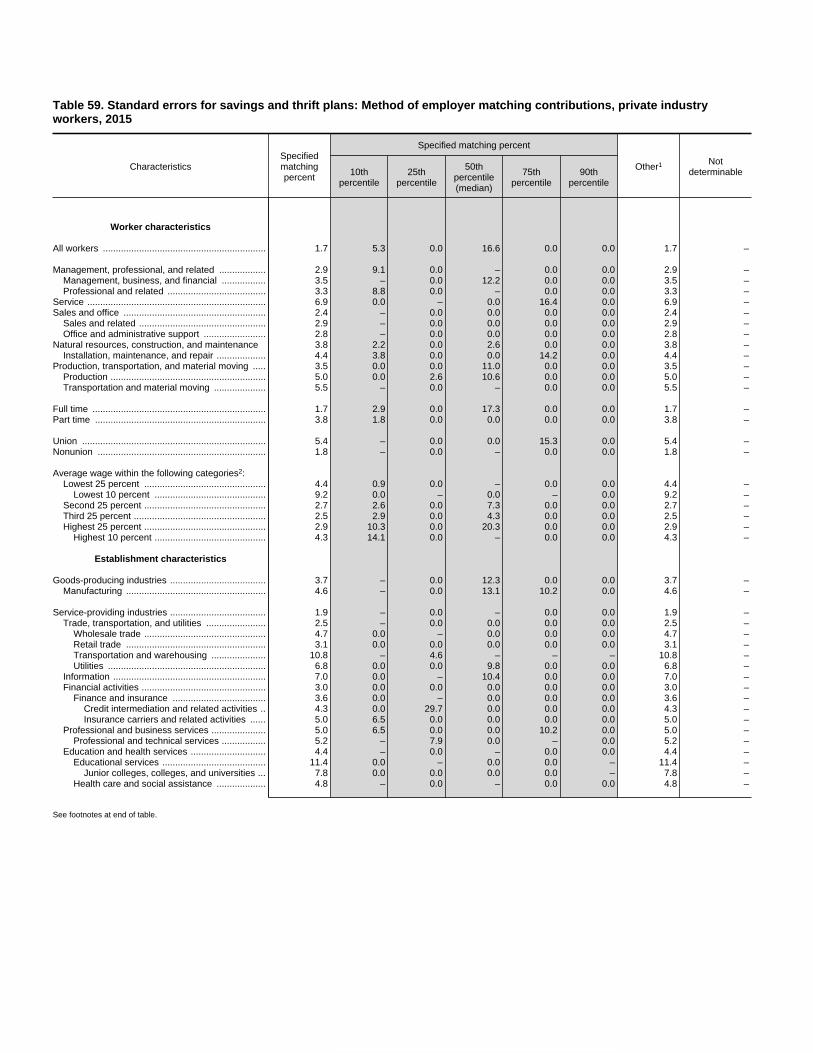
Table 59. Standard errors for savings and thrift plans: Method of employer matching contributions, private industryworkers, 2015
CharacteristicsSpecifiedmatchingpercent
Specified matching percent
Other1 Notdeterminable10th
percentile25th
percentile
50thpercentile(median)
75thpercentile
90thpercentile
Worker characteristics
All workers ............................................................... 1.7 5.3 0.0 16.6 0.0 0.0 1.7 –
Management, professional, and related .................. 2.9 9.1 0.0 – 0.0 0.0 2.9 –Management, business, and financial ................. 3.5 – 0.0 12.2 0.0 0.0 3.5 –Professional and related ...................................... 3.3 8.8 0.0 – 0.0 0.0 3.3 –
Service ..................................................................... 6.9 0.0 – 0.0 16.4 0.0 6.9 –Sales and office ....................................................... 2.4 – 0.0 0.0 0.0 0.0 2.4 –
Sales and related ................................................. 2.9 – 0.0 0.0 0.0 0.0 2.9 –Office and administrative support ........................ 2.8 – 0.0 0.0 0.0 0.0 2.8 –
Natural resources, construction, and maintenance 3.8 2.2 0.0 2.6 0.0 0.0 3.8 –Installation, maintenance, and repair ................... 4.4 3.8 0.0 0.0 14.2 0.0 4.4 –
Production, transportation, and material moving ..... 3.5 0.0 0.0 11.0 0.0 0.0 3.5 –Production ............................................................ 5.0 0.0 2.6 10.6 0.0 0.0 5.0 –Transportation and material moving .................... 5.5 – 0.0 – 0.0 0.0 5.5 –
Full time ................................................................... 1.7 2.9 0.0 17.3 0.0 0.0 1.7 –Part time .................................................................. 3.8 1.8 0.0 0.0 0.0 0.0 3.8 –
Union ....................................................................... 5.4 – 0.0 0.0 15.3 0.0 5.4 –Nonunion ................................................................. 1.8 – 0.0 – 0.0 0.0 1.8 –
Average wage within the following categories2:Lowest 25 percent ............................................... 4.4 0.9 0.0 – 0.0 0.0 4.4 –
Lowest 10 percent ........................................... 9.2 0.0 – 0.0 – 0.0 9.2 –Second 25 percent ............................................... 2.7 2.6 0.0 7.3 0.0 0.0 2.7 –Third 25 percent ................................................... 2.5 2.9 0.0 4.3 0.0 0.0 2.5 –Highest 25 percent ............................................... 2.9 10.3 0.0 20.3 0.0 0.0 2.9 –
Highest 10 percent ........................................... 4.3 14.1 0.0 – 0.0 0.0 4.3 –
Establishment characteristics
Goods-producing industries ..................................... 3.7 – 0.0 12.3 0.0 0.0 3.7 –Manufacturing ...................................................... 4.6 – 0.0 13.1 10.2 0.0 4.6 –
Service-providing industries ..................................... 1.9 – 0.0 – 0.0 0.0 1.9 –Trade, transportation, and utilities ....................... 2.5 – 0.0 0.0 0.0 0.0 2.5 –
Wholesale trade ............................................... 4.7 0.0 – 0.0 0.0 0.0 4.7 –Retail trade ...................................................... 3.1 0.0 0.0 0.0 0.0 0.0 3.1 –Transportation and warehousing ..................... 10.8 – 4.6 – – – 10.8 –Utilities ............................................................. 6.8 0.0 0.0 9.8 0.0 0.0 6.8 –
Information ........................................................... 7.0 0.0 – 10.4 0.0 0.0 7.0 –Financial activities ................................................ 3.0 0.0 0.0 0.0 0.0 0.0 3.0 –
Finance and insurance .................................... 3.6 0.0 – 0.0 0.0 0.0 3.6 –Credit intermediation and related activities .. 4.3 0.0 29.7 0.0 0.0 0.0 4.3 –Insurance carriers and related activities ...... 5.0 6.5 0.0 0.0 0.0 0.0 5.0 –
Professional and business services ..................... 5.0 6.5 0.0 0.0 10.2 0.0 5.0 –Professional and technical services ................. 5.2 – 7.9 0.0 – 0.0 5.2 –
Education and health services ............................. 4.4 – 0.0 – 0.0 0.0 4.4 –Educational services ........................................ 11.4 0.0 – 0.0 0.0 – 11.4 –
Junior colleges, colleges, and universities ... 7.8 0.0 0.0 0.0 0.0 – 7.8 –Health care and social assistance ................... 4.8 – 0.0 – 0.0 0.0 4.8 –
See footnotes at end of table.

Table 59. Standard errors for savings and thrift plans: Method of employer matching contributions, private industryworkers, 2015—continued
CharacteristicsSpecifiedmatchingpercent
Specified matching percent
Other1 Notdeterminable10th
percentile25th
percentile
50thpercentile(median)
75thpercentile
90thpercentile
1 to 99 workers ........................................................ 2.8 1.3 0.0 – 0.0 0.0 2.8 –1 to 49 workers .................................................... 3.4 – 0.0 – 0.0 0.0 3.4 –50 to 99 workers .................................................. 5.4 0.0 6.5 – 0.0 0.0 5.4 –
100 workers or more ................................................ 2.1 – 0.0 19.2 0.0 0.0 2.1 –100 to 499 workers .............................................. 2.7 – 0.0 – 0.0 0.0 2.7 –500 workers or more ............................................ 3.2 – 0.0 – 0.0 0.0 3.2 –
Geographic areas
Northeast ................................................................. 3.5 0.0 0.0 – 0.0 0.0 3.5 –New England ....................................................... 4.5 0.0 – 0.0 25.6 0.0 4.5 –Middle Atlantic ..................................................... 4.3 0.0 0.0 – 0.0 0.0 4.3 –
South ....................................................................... 2.6 – 0.0 24.8 0.0 0.0 2.6 –South Atlantic ....................................................... 3.5 – 0.0 – 0.0 0.0 3.5 –East South Central ............................................... 7.7 0.0 – – 0.0 0.0 7.7 –West South Central .............................................. 4.6 0.0 0.0 – 0.0 – 4.6 –
Midwest .................................................................... 3.3 – 0.0 9.6 0.0 0.0 3.3 –East North Central ............................................... 4.1 – 0.0 0.0 0.0 0.0 4.1 –West North Central .............................................. 3.0 – 0.0 – 0.0 0.0 3.0 –
West ......................................................................... 4.6 – 0.0 0.0 0.0 0.0 4.6 –Mountain .............................................................. 9.2 0.0 0.0 9.8 0.0 0.0 9.2 –Pacific .................................................................. 4.7 – 0.0 0.0 0.0 0.0 4.7 –
1 Other methods of employer matches include maximum dollar amounts specified by the employer, varying contributions by the employer based on employee contributions or service, and othermatching methods.
2 Surveyed occupations are classified into wage categories based on the average wage for the occupation, which may include workers with earnings both above and below the threshold. Thecategories were formed using percentile estimates generated using data from the National Compensation Survey publication, "Employer Costs for Employee Compensation - March 2015."
Note: Dashes indicate that no data were reported or that data do not meet publication criteria. For definitions of major plans, key provisions, and related terms, see the "Glossary of Employee BenefitTerms" at www.bls.gov/ncs/ebs/glossary20152016.htm.
Source: Bureau of Labor Statistics, National Compensation Survey.

Table 60. Savings and thrift plans: Maximum employee contribution matched by employer, private industry workers, 2015
(All workers participating in savings and thrift plans = 100 percent)
CharacteristicsSpecifiedmatchingpercent
Maximum employee contribution matched by employer
Other1 Notdeterminable10th
percentile25th
percentile
50thpercentile(median)
75thpercentile
90thpercentile
Worker characteristics
All workers ............................................................... 62 3.0 4.0 6.0 6.0 6.0 38 –
Management, professional, and related .................. 63 3.0 4.0 6.0 6.0 6.0 37 –Management, business, and financial ................. 61 – 4.0 6.0 6.0 7.0 39 –Professional and related ...................................... 65 3.0 4.0 5.0 6.0 6.0 35 –
Service ..................................................................... 56 3.0 4.0 – 6.0 6.0 44 –Sales and office ....................................................... 66 4.0 4.0 6.0 6.0 6.0 34 –
Sales and related ................................................. 69 4.0 4.0 6.0 6.0 6.0 31 –Office and administrative support ........................ 65 – 4.0 6.0 6.0 6.0 35 –
Natural resources, construction, and maintenance 66 3.0 4.0 6.0 6.0 8.0 34 –Installation, maintenance, and repair ................... 68 3.0 4.0 6.0 6.0 – 32 –
Production, transportation, and material moving ..... 55 3.0 4.0 5.0 6.0 6.0 45 –Production ............................................................ 55 – 4.0 5.0 6.0 6.0 45 –Transportation and material moving .................... 54 3.0 4.0 5.0 6.0 6.0 46 –
Full time ................................................................... 62 3.0 4.0 6.0 6.0 6.0 38 –Part time .................................................................. 64 3.0 4.0 5.0 6.0 6.0 36 –
Union ....................................................................... 59 – – 6.0 6.0 – 41 –Nonunion ................................................................. 62 3.0 4.0 6.0 6.0 6.0 38 –
Average wage within the following categories2:Lowest 25 percent ............................................... 63 – 4.0 5.0 6.0 6.0 37 –
Lowest 10 percent ........................................... 61 4.0 4.0 – 6.0 6.0 39 –Second 25 percent ............................................... 58 3.0 4.0 5.0 6.0 6.0 42 –Third 25 percent ................................................... 62 3.0 4.0 6.0 6.0 6.0 38 –Highest 25 percent ............................................... 65 3.0 4.0 6.0 6.0 7.0 35 –
Highest 10 percent ........................................... 63 4.0 4.0 6.0 6.0 7.0 37 –
Establishment characteristics
Goods-producing industries ..................................... 56 – 4.0 6.0 6.0 – 44 –Manufacturing ...................................................... 54 – 4.0 6.0 6.0 6.0 46 –
Service-providing industries ..................................... 64 3.0 4.0 6.0 6.0 6.0 36 –Trade, transportation, and utilities ....................... 67 – 4.0 6.0 6.0 6.0 33 –
Wholesale trade ............................................... 67 4.0 4.0 6.0 6.0 6.0 33 –Retail trade ...................................................... 71 4.0 4.0 6.0 6.0 6.0 29 –Transportation and warehousing ..................... 56 3.0 3.0 5.0 6.0 – 44 –Utilities ............................................................. 76 – 5.0 6.0 6.0 6.0 24 –
Information ........................................................... 69 4.0 – 6.0 6.0 – 31 –Financial activities ................................................ 70 4.0 5.0 6.0 6.0 6.0 30 –
Finance and insurance .................................... 69 4.0 5.0 6.0 6.0 6.0 31 –Credit intermediation and related activities .. 80 4.0 5.0 5.0 6.0 6.0 20 –Insurance carriers and related activities ...... 55 4.0 5.0 6.0 6.0 6.0 45 –
Professional and business services ..................... 59 4.0 – 6.0 6.0 – 41 –Professional and technical services ................. 57 – 4.0 6.0 6.0 – 43 –
Education and health services ............................. 62 2.0 3.0 4.0 5.0 6.0 38 –Educational services ........................................ 53 2.0 – 5.0 5.0 5.0 47 –
Junior colleges, colleges, and universities ... 62 – – 5.0 5.0 5.0 38 –Health care and social assistance ................... 63 2.0 3.0 4.0 5.0 6.0 37 –
See footnotes at end of table.

Table 60. Savings and thrift plans: Maximum employee contribution matched by employer, private industry workers,2015—continued
(All workers participating in savings and thrift plans = 100 percent)
CharacteristicsSpecifiedmatchingpercent
Maximum employee contribution matched by employer
Other1 Notdeterminable10th
percentile25th
percentile
50thpercentile(median)
75thpercentile
90thpercentile
1 to 99 workers ........................................................ 58 3.0 4.0 5.0 6.0 6.0 42 –1 to 49 workers .................................................... 64 3.0 4.0 5.0 6.0 6.0 36 –50 to 99 workers .................................................. 47 3.0 4.0 6.0 6.0 6.0 53 –
100 workers or more ................................................ 64 3.0 4.0 6.0 6.0 6.0 36 –100 to 499 workers .............................................. 63 3.0 4.0 6.0 6.0 6.0 37 –500 workers or more ............................................ 66 3.0 4.0 6.0 6.0 6.0 34 –
Geographic areas
Northeast ................................................................. 67 4.0 4.0 6.0 6.0 6.0 33 –New England ....................................................... 71 – 4.0 6.0 6.0 7.0 29 –Middle Atlantic ..................................................... 65 4.0 4.0 6.0 6.0 6.0 35 –
South ....................................................................... 62 4.0 4.0 6.0 6.0 6.0 38 –South Atlantic ....................................................... 61 4.0 4.0 6.0 6.0 6.0 39 –East South Central ............................................... 70 4.0 4.0 6.0 6.0 6.0 30 –West South Central .............................................. 59 3.0 4.0 5.0 6.0 – 41 –
Midwest .................................................................... 68 3.0 – 5.0 6.0 6.0 32 –East North Central ............................................... 64 – – 5.0 6.0 6.0 36 –West North Central .............................................. 75 3.0 – 5.0 6.0 6.0 25 –
West ......................................................................... 53 – 4.0 6.0 6.0 6.0 47 –Mountain .............................................................. 50 4.0 5.0 6.0 6.0 6.0 50 –Pacific .................................................................. 55 – 4.0 6.0 6.0 7.0 45 –
1 Other methods of employer matches include maximum dollar amounts specified by the employer, varying contributions by the employer based on employee contributions or service, and othermatching methods.
2 Surveyed occupations are classified into wage categories based on the average wage for the occupation, which may include workers with earnings both above and below the threshold. Thecategories were formed using percentile estimates generated using data from the National Compensation Survey publication, "Employer Costs for Employee Compensation - March 2015."
Note: Because of rounding, sums of individual items may not equal totals. Dashes indicate that no data were reported or that data do not meet publication criteria. For definitions of major plans, keyprovisions, and related terms, see the "Glossary of Employee Benefit Terms" at www.bls.gov/ncs/ebs/glossary20152016.htm.
Source: Bureau of Labor Statistics, National Compensation Survey.
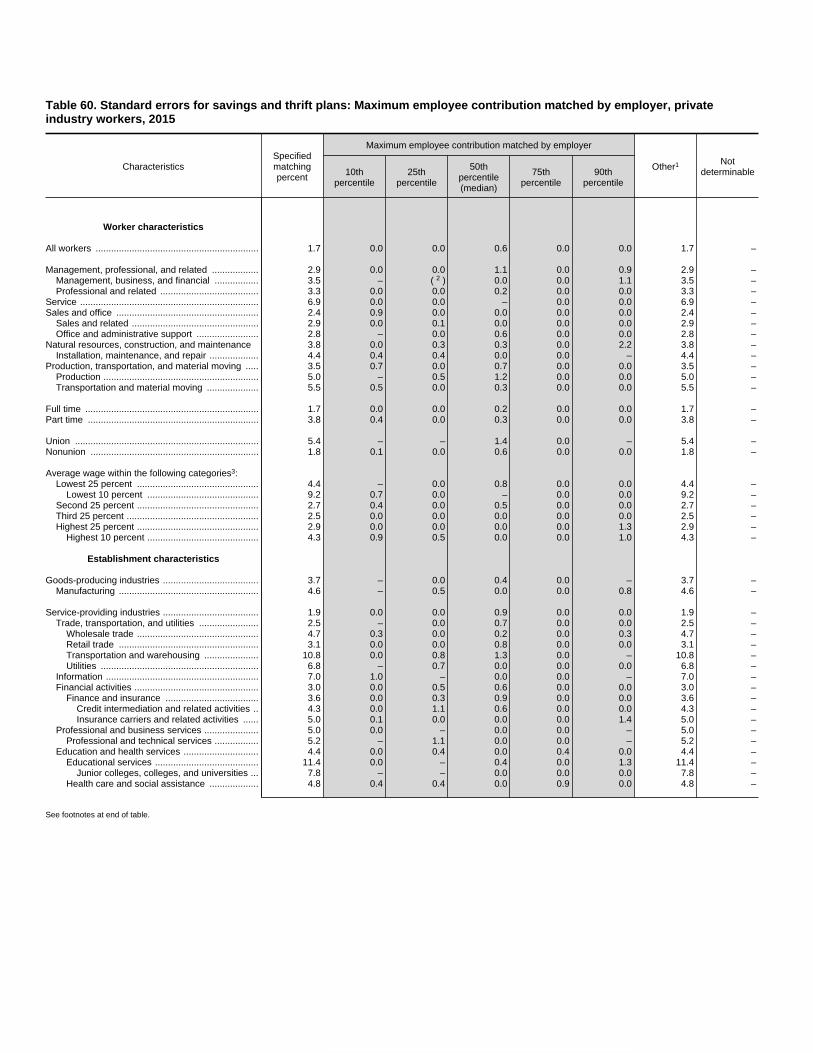
Table 60. Standard errors for savings and thrift plans: Maximum employee contribution matched by employer, privateindustry workers, 2015
CharacteristicsSpecifiedmatchingpercent
Maximum employee contribution matched by employer
Other1 Notdeterminable10th
percentile25th
percentile
50thpercentile(median)
75thpercentile
90thpercentile
Worker characteristics
All workers ............................................................... 1.7 0.0 0.0 0.6 0.0 0.0 1.7 –
Management, professional, and related .................. 2.9 0.0 0.0 1.1 0.0 0.9 2.9 –Management, business, and financial ................. 3.5 – 2( ) 0.0 0.0 1.1 3.5 –Professional and related ...................................... 3.3 0.0 0.0 0.2 0.0 0.0 3.3 –
Service ..................................................................... 6.9 0.0 0.0 – 0.0 0.0 6.9 –Sales and office ....................................................... 2.4 0.9 0.0 0.0 0.0 0.0 2.4 –
Sales and related ................................................. 2.9 0.0 0.1 0.0 0.0 0.0 2.9 –Office and administrative support ........................ 2.8 – 0.0 0.6 0.0 0.0 2.8 –
Natural resources, construction, and maintenance 3.8 0.0 0.3 0.3 0.0 2.2 3.8 –Installation, maintenance, and repair ................... 4.4 0.4 0.4 0.0 0.0 – 4.4 –
Production, transportation, and material moving ..... 3.5 0.7 0.0 0.7 0.0 0.0 3.5 –Production ............................................................ 5.0 – 0.5 1.2 0.0 0.0 5.0 –Transportation and material moving .................... 5.5 0.5 0.0 0.3 0.0 0.0 5.5 –
Full time ................................................................... 1.7 0.0 0.0 0.2 0.0 0.0 1.7 –Part time .................................................................. 3.8 0.4 0.0 0.3 0.0 0.0 3.8 –
Union ....................................................................... 5.4 – – 1.4 0.0 – 5.4 –Nonunion ................................................................. 1.8 0.1 0.0 0.6 0.0 0.0 1.8 –
Average wage within the following categories3:Lowest 25 percent ............................................... 4.4 – 0.0 0.8 0.0 0.0 4.4 –
Lowest 10 percent ........................................... 9.2 0.7 0.0 – 0.0 0.0 9.2 –Second 25 percent ............................................... 2.7 0.4 0.0 0.5 0.0 0.0 2.7 –Third 25 percent ................................................... 2.5 0.0 0.0 0.0 0.0 0.0 2.5 –Highest 25 percent ............................................... 2.9 0.0 0.0 0.0 0.0 1.3 2.9 –
Highest 10 percent ........................................... 4.3 0.9 0.5 0.0 0.0 1.0 4.3 –
Establishment characteristics
Goods-producing industries ..................................... 3.7 – 0.0 0.4 0.0 – 3.7 –Manufacturing ...................................................... 4.6 – 0.5 0.0 0.0 0.8 4.6 –
Service-providing industries ..................................... 1.9 0.0 0.0 0.9 0.0 0.0 1.9 –Trade, transportation, and utilities ....................... 2.5 – 0.0 0.7 0.0 0.0 2.5 –
Wholesale trade ............................................... 4.7 0.3 0.0 0.2 0.0 0.3 4.7 –Retail trade ...................................................... 3.1 0.0 0.0 0.8 0.0 0.0 3.1 –Transportation and warehousing ..................... 10.8 0.0 0.8 1.3 0.0 – 10.8 –Utilities ............................................................. 6.8 – 0.7 0.0 0.0 0.0 6.8 –
Information ........................................................... 7.0 1.0 – 0.0 0.0 – 7.0 –Financial activities ................................................ 3.0 0.0 0.5 0.6 0.0 0.0 3.0 –
Finance and insurance .................................... 3.6 0.0 0.3 0.9 0.0 0.0 3.6 –Credit intermediation and related activities .. 4.3 0.0 1.1 0.6 0.0 0.0 4.3 –Insurance carriers and related activities ...... 5.0 0.1 0.0 0.0 0.0 1.4 5.0 –
Professional and business services ..................... 5.0 0.0 – 0.0 0.0 – 5.0 –Professional and technical services ................. 5.2 – 1.1 0.0 0.0 – 5.2 –
Education and health services ............................. 4.4 0.0 0.4 0.0 0.4 0.0 4.4 –Educational services ........................................ 11.4 0.0 – 0.4 0.0 1.3 11.4 –
Junior colleges, colleges, and universities ... 7.8 – – 0.0 0.0 0.0 7.8 –Health care and social assistance ................... 4.8 0.4 0.4 0.0 0.9 0.0 4.8 –
See footnotes at end of table.

Table 60. Standard errors for savings and thrift plans: Maximum employee contribution matched by employer, privateindustry workers, 2015—continued
CharacteristicsSpecifiedmatchingpercent
Maximum employee contribution matched by employer
Other1 Notdeterminable10th
percentile25th
percentile
50thpercentile(median)
75thpercentile
90thpercentile
1 to 99 workers ........................................................ 2.8 0.0 0.0 2( ) 0.0 0.0 2.8 –1 to 49 workers .................................................... 3.4 0.0 0.0 1.3 0.0 0.0 3.4 –50 to 99 workers .................................................. 5.4 0.5 0.0 0.0 0.0 0.9 5.4 –
100 workers or more ................................................ 2.1 0.5 0.0 0.0 0.0 0.0 2.1 –100 to 499 workers .............................................. 2.7 0.8 0.2 0.0 0.0 0.0 2.7 –500 workers or more ............................................ 3.2 0.9 0.0 0.2 0.0 1.2 3.2 –
Geographic areas
Northeast ................................................................. 3.5 0.8 0.0 0.9 0.0 0.5 3.5 –New England ....................................................... 4.5 – 0.1 1.1 0.0 1.5 4.5 –Middle Atlantic ..................................................... 4.3 0.0 2( ) 1.2 0.0 0.0 4.3 –
South ....................................................................... 2.6 0.4 0.0 0.0 0.0 0.0 2.6 –South Atlantic ....................................................... 3.5 0.0 0.0 0.0 0.0 0.0 3.5 –East South Central ............................................... 7.7 0.0 1.0 0.0 0.0 0.0 7.7 –West South Central .............................................. 4.6 0.4 0.0 0.4 0.0 – 4.6 –
Midwest .................................................................... 3.3 0.8 – 0.2 0.0 0.0 3.3 –East North Central ............................................... 4.1 – – 0.7 0.0 0.0 4.1 –West North Central .............................................. 3.0 0.0 – 0.6 0.0 0.0 3.0 –
West ......................................................................... 4.6 – 0.5 0.0 0.0 1.2 4.6 –Mountain .............................................................. 9.2 0.0 0.6 0.0 0.0 0.0 9.2 –Pacific .................................................................. 4.7 – 0.0 0.9 0.0 1.2 4.7 –
1 Other methods of employer matches include maximum dollar amounts specified by the employer, varying contributions by the employer based on employee contributions or service, and othermatching methods.
2 Less than 0.05.3 Surveyed occupations are classified into wage categories based on the average wage for the occupation, which may include workers with earnings both above and below the threshold. The
categories were formed using percentile estimates generated using data from the National Compensation Survey publication, "Employer Costs for Employee Compensation - March 2015."
Note: Dashes indicate that no data were reported or that data do not meet publication criteria. For definitions of major plans, key provisions, and related terms, see the "Glossary of Employee BenefitTerms" at www.bls.gov/ncs/ebs/glossary20152016.htm.
Source: Bureau of Labor Statistics, National Compensation Survey.
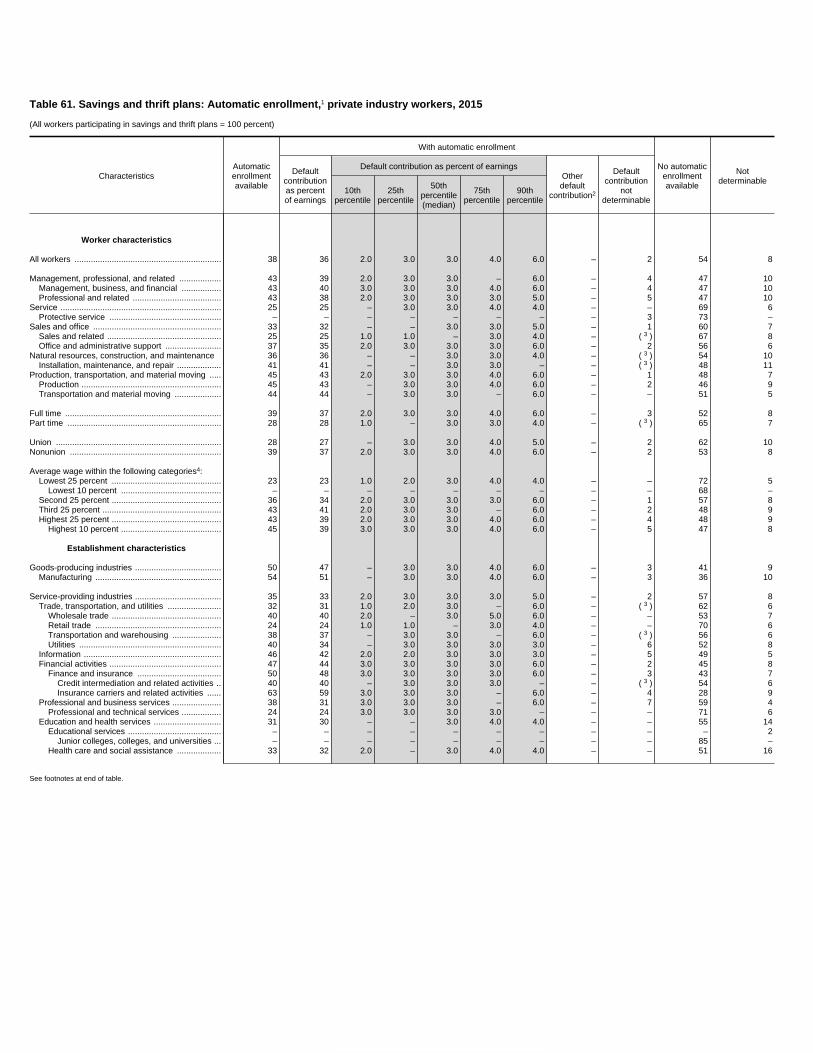
Table 61. Savings and thrift plans: Automatic enrollment,1 private industry workers, 2015
(All workers participating in savings and thrift plans = 100 percent)
CharacteristicsAutomaticenrollmentavailable
With automatic enrollment
No automaticenrollmentavailable
Notdeterminable
Defaultcontributionas percentof earnings
Default contribution as percent of earningsOtherdefault
contribution2
Defaultcontribution
notdeterminable
10thpercentile
25thpercentile
50thpercentile(median)
75thpercentile
90thpercentile
Worker characteristics
All workers ............................................................... 38 36 2.0 3.0 3.0 4.0 6.0 – 2 54 8
Management, professional, and related .................. 43 39 2.0 3.0 3.0 – 6.0 – 4 47 10Management, business, and financial ................. 43 40 3.0 3.0 3.0 4.0 6.0 – 4 47 10Professional and related ...................................... 43 38 2.0 3.0 3.0 3.0 5.0 – 5 47 10
Service ..................................................................... 25 25 – 3.0 3.0 4.0 4.0 – – 69 6Protective service ................................................ – – – – – – – – 3 73 –
Sales and office ....................................................... 33 32 – – 3.0 3.0 5.0 – 1 60 7Sales and related ................................................. 25 25 1.0 1.0 – 3.0 4.0 – 3( ) 67 8Office and administrative support ........................ 37 35 2.0 3.0 3.0 3.0 6.0 – 2 56 6
Natural resources, construction, and maintenance 36 36 – – 3.0 3.0 4.0 – 3( ) 54 10Installation, maintenance, and repair ................... 41 41 – – 3.0 3.0 – – 3( ) 48 11
Production, transportation, and material moving ..... 45 43 2.0 3.0 3.0 4.0 6.0 – 1 48 7Production ............................................................ 45 43 – 3.0 3.0 4.0 6.0 – 2 46 9Transportation and material moving .................... 44 44 – 3.0 3.0 – 6.0 – – 51 5
Full time ................................................................... 39 37 2.0 3.0 3.0 4.0 6.0 – 3 52 8Part time .................................................................. 28 28 1.0 – 3.0 3.0 4.0 – 3( ) 65 7
Union ....................................................................... 28 27 – 3.0 3.0 4.0 5.0 – 2 62 10Nonunion ................................................................. 39 37 2.0 3.0 3.0 4.0 6.0 – 2 53 8
Average wage within the following categories4:Lowest 25 percent ............................................... 23 23 1.0 2.0 3.0 4.0 4.0 – – 72 5
Lowest 10 percent ........................................... – – – – – – – – – 68 –Second 25 percent ............................................... 36 34 2.0 3.0 3.0 3.0 6.0 – 1 57 8Third 25 percent ................................................... 43 41 2.0 3.0 3.0 – 6.0 – 2 48 9Highest 25 percent ............................................... 43 39 2.0 3.0 3.0 4.0 6.0 – 4 48 9
Highest 10 percent ........................................... 45 39 3.0 3.0 3.0 4.0 6.0 – 5 47 8
Establishment characteristics
Goods-producing industries ..................................... 50 47 – 3.0 3.0 4.0 6.0 – 3 41 9Manufacturing ...................................................... 54 51 – 3.0 3.0 4.0 6.0 – 3 36 10
Service-providing industries ..................................... 35 33 2.0 3.0 3.0 3.0 5.0 – 2 57 8Trade, transportation, and utilities ....................... 32 31 1.0 2.0 3.0 – 6.0 – 3( ) 62 6
Wholesale trade ............................................... 40 40 2.0 – 3.0 5.0 6.0 – – 53 7Retail trade ...................................................... 24 24 1.0 1.0 – 3.0 4.0 – – 70 6Transportation and warehousing ..................... 38 37 – 3.0 3.0 – 6.0 – 3( ) 56 6Utilities ............................................................. 40 34 – 3.0 3.0 3.0 3.0 – 6 52 8
Information ........................................................... 46 42 2.0 2.0 3.0 3.0 3.0 – 5 49 5Financial activities ................................................ 47 44 3.0 3.0 3.0 3.0 6.0 – 2 45 8
Finance and insurance .................................... 50 48 3.0 3.0 3.0 3.0 6.0 – 3 43 7Credit intermediation and related activities .. 40 40 – 3.0 3.0 3.0 – – 3( ) 54 6Insurance carriers and related activities ...... 63 59 3.0 3.0 3.0 – 6.0 – 4 28 9
Professional and business services ..................... 38 31 3.0 3.0 3.0 – 6.0 – 7 59 4Professional and technical services ................. 24 24 3.0 3.0 3.0 3.0 – – – 71 6
Education and health services ............................. 31 30 – – 3.0 4.0 4.0 – – 55 14Educational services ........................................ – – – – – – – – – – 2
Junior colleges, colleges, and universities ... – – – – – – – – – 85 –Health care and social assistance ................... 33 32 2.0 – 3.0 4.0 4.0 – – 51 16
See footnotes at end of table.
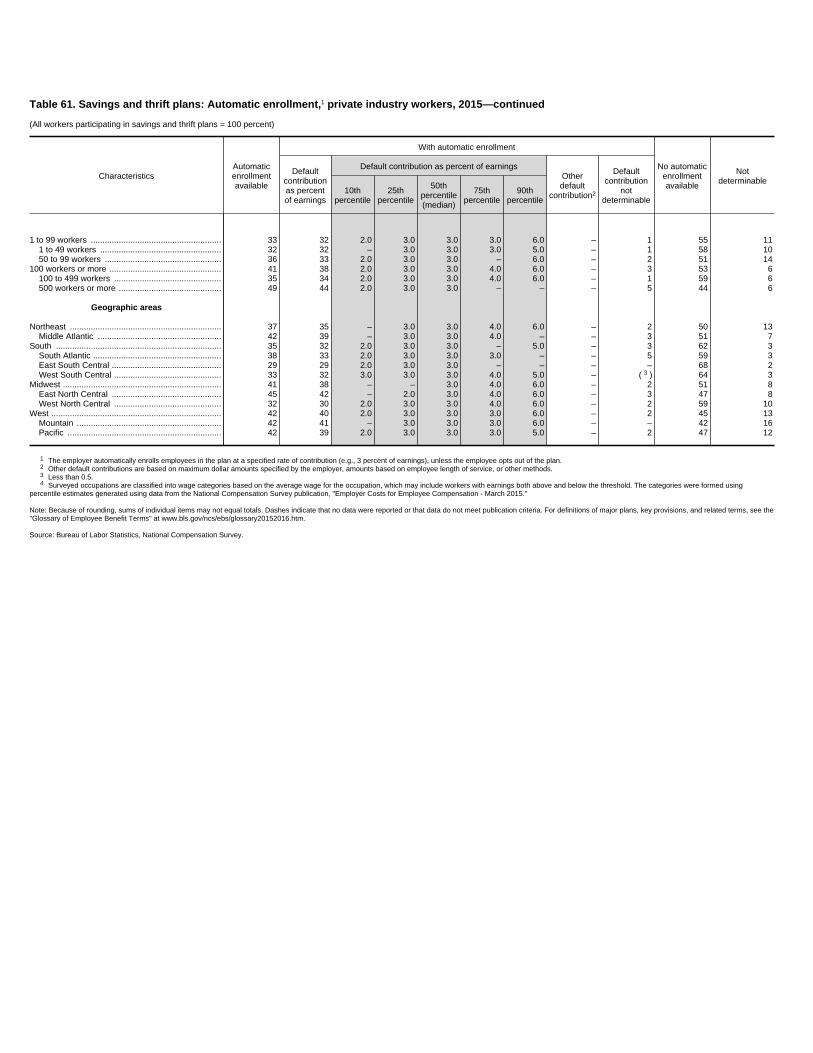
Table 61. Savings and thrift plans: Automatic enrollment,1 private industry workers, 2015—continued
(All workers participating in savings and thrift plans = 100 percent)
CharacteristicsAutomaticenrollmentavailable
With automatic enrollment
No automaticenrollmentavailable
Notdeterminable
Defaultcontributionas percentof earnings
Default contribution as percent of earningsOtherdefault
contribution2
Defaultcontribution
notdeterminable
10thpercentile
25thpercentile
50thpercentile(median)
75thpercentile
90thpercentile
1 to 99 workers ........................................................ 33 32 2.0 3.0 3.0 3.0 6.0 – 1 55 111 to 49 workers .................................................... 32 32 – 3.0 3.0 3.0 5.0 – 1 58 1050 to 99 workers .................................................. 36 33 2.0 3.0 3.0 – 6.0 – 2 51 14
100 workers or more ................................................ 41 38 2.0 3.0 3.0 4.0 6.0 – 3 53 6100 to 499 workers .............................................. 35 34 2.0 3.0 3.0 4.0 6.0 – 1 59 6500 workers or more ............................................ 49 44 2.0 3.0 3.0 – – – 5 44 6
Geographic areas
Northeast ................................................................. 37 35 – 3.0 3.0 4.0 6.0 – 2 50 13Middle Atlantic ..................................................... 42 39 – 3.0 3.0 4.0 – – 3 51 7
South ....................................................................... 35 32 2.0 3.0 3.0 – 5.0 – 3 62 3South Atlantic ....................................................... 38 33 2.0 3.0 3.0 3.0 – – 5 59 3East South Central ............................................... 29 29 2.0 3.0 3.0 – – – – 68 2West South Central .............................................. 33 32 3.0 3.0 3.0 4.0 5.0 – 3( ) 64 3
Midwest .................................................................... 41 38 – – 3.0 4.0 6.0 – 2 51 8East North Central ............................................... 45 42 – 2.0 3.0 4.0 6.0 – 3 47 8West North Central .............................................. 32 30 2.0 3.0 3.0 4.0 6.0 – 2 59 10
West ......................................................................... 42 40 2.0 3.0 3.0 3.0 6.0 – 2 45 13Mountain .............................................................. 42 41 – 3.0 3.0 3.0 6.0 – – 42 16Pacific .................................................................. 42 39 2.0 3.0 3.0 3.0 5.0 – 2 47 12
1 The employer automatically enrolls employees in the plan at a specified rate of contribution (e.g., 3 percent of earnings), unless the employee opts out of the plan.2 Other default contributions are based on maximum dollar amounts specified by the employer, amounts based on employee length of service, or other methods. 3 Less than 0.5.4 Surveyed occupations are classified into wage categories based on the average wage for the occupation, which may include workers with earnings both above and below the threshold. The categories were formed using
percentile estimates generated using data from the National Compensation Survey publication, "Employer Costs for Employee Compensation - March 2015."
Note: Because of rounding, sums of individual items may not equal totals. Dashes indicate that no data were reported or that data do not meet publication criteria. For definitions of major plans, key provisions, and related terms, see the"Glossary of Employee Benefit Terms" at www.bls.gov/ncs/ebs/glossary20152016.htm.
Source: Bureau of Labor Statistics, National Compensation Survey.

Table 61. Standard errors for savings and thrift plans: Automatic enrollment,1 private industry workers, 2015
CharacteristicsAutomaticenrollmentavailable
With automatic enrollment
No automaticenrollmentavailable
Notdeterminable
Defaultcontributionas percentof earnings
Default contribution as percent of earningsOtherdefault
contribution2
Defaultcontribution
notdeterminable
10thpercentile
25thpercentile
50thpercentile(median)
75thpercentile
90thpercentile
Worker characteristics
All workers ............................................................... 1.7 1.7 0.0 0.0 0.0 1.0 0.2 – 0.5 1.7 1.1
Management, professional, and related .................. 2.9 2.9 0.0 0.0 0.0 – 0.3 – 1.1 3.2 2.1Management, business, and financial ................. 3.5 3.7 0.0 0.0 0.0 0.8 0.0 – 1.2 3.9 2.0Professional and related ...................................... 3.4 3.3 0.0 0.2 0.0 0.4 1.4 – 1.4 3.6 3.1
Service ..................................................................... 5.7 5.7 – 0.0 0.0 0.7 0.0 – – 5.6 2.3Protective service ................................................ – – – – – – – – 2.5 9.2 –
Sales and office ....................................................... 2.1 2.4 – – 0.0 0.0 1.1 – 0.5 2.3 1.2Sales and related ................................................. 3.2 3.2 0.0 0.3 – 0.0 0.0 – 0.1 3.9 2.8Office and administrative support ........................ 2.8 3.2 0.0 0.0 0.0 0.3 1.2 – 0.8 2.8 1.3
Natural resources, construction, and maintenance 3.7 3.6 – – 0.0 0.0 0.5 – 0.2 3.8 2.7Installation, maintenance, and repair ................... 4.5 4.4 – – 0.0 0.0 – – 0.2 4.2 3.2
Production, transportation, and material moving ..... 4.5 3.9 0.0 0.0 0.0 0.9 0.0 – 0.9 4.0 1.6Production ............................................................ 7.0 5.9 – 0.0 0.0 0.9 0.0 – 1.5 5.8 2.7Transportation and material moving .................... 5.2 5.2 – 0.3 0.0 – 0.0 – – 5.1 1.2
Full time ................................................................... 1.7 1.7 0.0 0.0 0.0 0.7 0.0 – 0.6 1.8 1.2Part time .................................................................. 3.3 3.4 0.0 – 0.0 0.3 0.0 – 0.3 3.3 2.2
Union ....................................................................... 5.5 5.4 – 0.2 0.0 0.5 0.9 – 0.8 5.8 2.8Nonunion ................................................................. 1.8 1.8 0.0 0.0 0.0 1.2 0.2 – 0.6 1.9 1.2
Average wage within the following categories3:Lowest 25 percent ............................................... 3.4 3.4 0.2 0.4 0.0 0.5 0.0 – – 3.5 1.4
Lowest 10 percent ........................................... – – – – – – – – – 9.1 –Second 25 percent ............................................... 3.3 3.1 0.2 0.0 0.0 0.6 1.2 – 0.4 3.3 1.2Third 25 percent ................................................... 2.2 2.3 0.0 0.0 0.0 – 0.2 – 0.6 2.3 1.7Highest 25 percent ............................................... 3.0 2.9 0.3 0.0 0.0 0.7 0.2 – 1.4 3.3 1.9
Highest 10 percent ........................................... 4.0 3.9 0.3 0.0 0.0 0.8 0.0 – 1.7 4.4 1.7
Establishment characteristics
Goods-producing industries ..................................... 4.7 4.6 – 0.0 0.0 0.5 0.0 – 1.3 4.5 1.6Manufacturing ...................................................... 5.3 5.0 – 0.0 0.0 0.9 0.0 – 1.6 4.8 1.9
Service-providing industries ..................................... 1.6 1.7 0.0 0.0 0.0 0.0 1.3 – 0.6 1.8 1.3Trade, transportation, and utilities ....................... 2.1 2.0 0.0 0.0 0.0 – 1.0 – 0.2 2.4 1.7
Wholesale trade ............................................... 3.9 3.9 0.0 – 0.0 0.5 0.0 – – 4.3 2.4Retail trade ...................................................... 3.0 3.0 0.0 0.0 – 0.0 0.4 – – 3.0 2.8Transportation and warehousing ..................... 7.5 7.5 – 0.3 0.0 – 0.0 – 0.2 7.5 3.5Utilities ............................................................. 9.3 7.1 – 0.0 0.0 0.0 0.8 – 3.7 9.2 4.8
Information ........................................................... 7.5 7.4 0.0 0.0 0.0 0.0 0.0 – 2.6 7.4 3.3Financial activities ................................................ 3.2 3.6 0.0 0.0 0.0 0.0 0.9 – 0.8 3.0 1.6
Finance and insurance .................................... 3.3 3.6 0.0 0.0 0.0 0.2 0.7 – 0.9 3.3 1.6Credit intermediation and related activities .. 5.1 5.0 – 0.0 0.0 0.0 – – 0.4 5.5 2.2Insurance carriers and related activities ...... 4.0 4.1 0.0 0.0 0.0 – 0.5 – 0.7 3.3 2.8
Professional and business services ..................... 5.4 5.1 0.0 0.0 0.0 – 1.2 – 3.2 6.1 2.0Professional and technical services ................. 5.0 5.0 0.0 0.0 0.0 0.0 – – – 6.2 3.3
Education and health services ............................. 4.6 4.7 – – 0.0 0.7 0.7 – – 4.7 5.4Educational services ........................................ – – – – – – – – – – 2.1
Junior colleges, colleges, and universities ... – – – – – – – – – 4.3 –Health care and social assistance ................... 5.2 5.2 0.0 – 0.0 0.5 1.1 – – 5.1 6.1
See footnotes at end of table.

Table 61. Standard errors for savings and thrift plans: Automatic enrollment,1 private industry workers, 2015—continued
CharacteristicsAutomaticenrollmentavailable
With automatic enrollment
No automaticenrollmentavailable
Notdeterminable
Defaultcontributionas percentof earnings
Default contribution as percent of earningsOtherdefault
contribution2
Defaultcontribution
notdeterminable
10thpercentile
25thpercentile
50thpercentile(median)
75thpercentile
90thpercentile
1 to 99 workers ........................................................ 2.9 2.9 0.2 0.0 0.0 0.0 1.4 – 0.6 3.3 2.61 to 49 workers .................................................... 3.3 3.3 – 0.4 0.0 0.0 1.3 – 0.3 3.6 2.050 to 99 workers .................................................. 5.7 5.6 0.3 0.0 0.0 – 1.7 – 1.2 5.7 6.9
100 workers or more ................................................ 2.4 2.6 0.0 0.0 0.0 0.2 0.2 – 0.8 2.4 0.7100 to 499 workers .............................................. 2.7 2.8 0.0 0.0 0.0 0.3 0.0 – 0.7 2.7 1.2500 workers or more ............................................ 3.7 4.2 0.0 0.0 0.0 – – – 2.1 3.6 1.3
Geographic areas
Northeast ................................................................. 5.0 5.5 – 0.0 0.0 0.5 0.0 – 0.9 5.6 2.3Middle Atlantic ..................................................... 6.6 7.3 – 0.0 0.0 1.1 – – 1.3 7.8 2.3
South ....................................................................... 2.1 2.0 0.0 0.0 0.0 – 1.2 – 1.1 2.0 0.6South Atlantic ....................................................... 3.2 3.2 0.0 0.0 0.0 0.0 – – 1.9 2.8 0.8East South Central ............................................... 4.5 4.5 0.0 0.0 0.0 – – – – 4.4 1.2West South Central .............................................. 3.0 3.0 0.2 0.0 0.0 0.2 1.3 – 0.1 3.6 1.4
Midwest .................................................................... 3.8 3.4 – – 0.0 0.4 0.0 – 0.8 3.7 1.8East North Central ............................................... 4.7 4.3 – 0.4 0.0 0.9 0.0 – 1.0 4.4 2.4West North Central .............................................. 4.5 4.1 0.0 0.0 0.0 0.5 1.1 – 0.9 5.5 2.3
West ......................................................................... 3.4 3.7 0.0 0.0 0.0 0.0 1.5 – 1.0 3.3 3.8Mountain .............................................................. 5.2 5.3 – 0.0 0.0 0.5 1.0 – – 4.5 8.7Pacific .................................................................. 4.4 5.2 0.3 0.0 0.0 0.0 1.5 – 1.6 4.6 2.4
1 The employer automatically enrolls employees in the plan at a specified rate of contribution (e.g., 3 percent of earnings), unless the employee opts out of the plan.2 Other default contributions are based on maximum dollar amounts specified by the employer, amounts based on employee length of service, or other methods. 3 Surveyed occupations are classified into wage categories based on the average wage for the occupation, which may include workers with earnings both above and below the threshold. The categories were formed using
percentile estimates generated using data from the National Compensation Survey publication, "Employer Costs for Employee Compensation - March 2015."
Note: Dashes indicate that no data were reported or that data do not meet publication criteria. For definitions of major plans, key provisions, and related terms, see the "Glossary of Employee Benefit Terms" atwww.bls.gov/ncs/ebs/glossary20152016.htm.
Source: Bureau of Labor Statistics, National Compensation Survey.
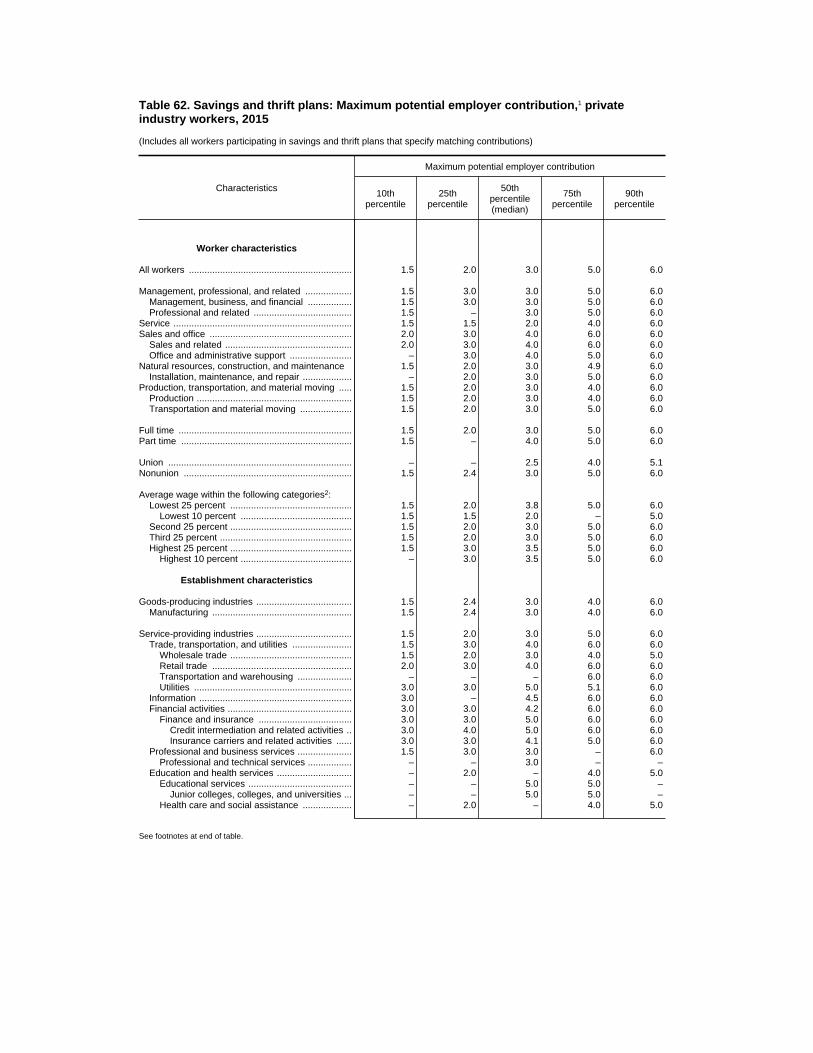
Table 62. Savings and thrift plans: Maximum potential employer contribution,1 privateindustry workers, 2015
(Includes all workers participating in savings and thrift plans that specify matching contributions)
Characteristics
Maximum potential employer contribution
10thpercentile
25thpercentile
50thpercentile(median)
75thpercentile
90thpercentile
Worker characteristics
All workers ............................................................... 1.5 2.0 3.0 5.0 6.0
Management, professional, and related .................. 1.5 3.0 3.0 5.0 6.0Management, business, and financial ................. 1.5 3.0 3.0 5.0 6.0Professional and related ...................................... 1.5 – 3.0 5.0 6.0
Service ..................................................................... 1.5 1.5 2.0 4.0 6.0Sales and office ....................................................... 2.0 3.0 4.0 6.0 6.0
Sales and related ................................................. 2.0 3.0 4.0 6.0 6.0Office and administrative support ........................ – 3.0 4.0 5.0 6.0
Natural resources, construction, and maintenance 1.5 2.0 3.0 4.9 6.0Installation, maintenance, and repair ................... – 2.0 3.0 5.0 6.0
Production, transportation, and material moving ..... 1.5 2.0 3.0 4.0 6.0Production ............................................................ 1.5 2.0 3.0 4.0 6.0Transportation and material moving .................... 1.5 2.0 3.0 5.0 6.0
Full time ................................................................... 1.5 2.0 3.0 5.0 6.0Part time .................................................................. 1.5 – 4.0 5.0 6.0
Union ....................................................................... – – 2.5 4.0 5.1Nonunion ................................................................. 1.5 2.4 3.0 5.0 6.0
Average wage within the following categories2:Lowest 25 percent ............................................... 1.5 2.0 3.8 5.0 6.0
Lowest 10 percent ........................................... 1.5 1.5 2.0 – 5.0Second 25 percent ............................................... 1.5 2.0 3.0 5.0 6.0Third 25 percent ................................................... 1.5 2.0 3.0 5.0 6.0Highest 25 percent ............................................... 1.5 3.0 3.5 5.0 6.0
Highest 10 percent ........................................... – 3.0 3.5 5.0 6.0
Establishment characteristics
Goods-producing industries ..................................... 1.5 2.4 3.0 4.0 6.0Manufacturing ...................................................... 1.5 2.4 3.0 4.0 6.0
Service-providing industries ..................................... 1.5 2.0 3.0 5.0 6.0Trade, transportation, and utilities ....................... 1.5 3.0 4.0 6.0 6.0
Wholesale trade ............................................... 1.5 2.0 3.0 4.0 5.0Retail trade ...................................................... 2.0 3.0 4.0 6.0 6.0Transportation and warehousing ..................... – – – 6.0 6.0Utilities ............................................................. 3.0 3.0 5.0 5.1 6.0
Information ........................................................... 3.0 – 4.5 6.0 6.0Financial activities ................................................ 3.0 3.0 4.2 6.0 6.0
Finance and insurance .................................... 3.0 3.0 5.0 6.0 6.0Credit intermediation and related activities .. 3.0 4.0 5.0 6.0 6.0Insurance carriers and related activities ...... 3.0 3.0 4.1 5.0 6.0
Professional and business services ..................... 1.5 3.0 3.0 – 6.0Professional and technical services ................. – – 3.0 – –
Education and health services ............................. – 2.0 – 4.0 5.0Educational services ........................................ – – 5.0 5.0 –
Junior colleges, colleges, and universities ... – – 5.0 5.0 –Health care and social assistance ................... – 2.0 – 4.0 5.0
See footnotes at end of table.

Table 62. Savings and thrift plans: Maximum potential employer contribution,1 privateindustry workers, 2015—continued
(Includes all workers participating in savings and thrift plans that specify matching contributions)
Characteristics
Maximum potential employer contribution
10thpercentile
25thpercentile
50thpercentile(median)
75thpercentile
90thpercentile
1 to 99 workers ........................................................ 1.5 2.4 3.0 4.0 5.01 to 49 workers .................................................... 1.5 2.4 3.0 4.0 5.050 to 99 workers .................................................. – – 3.0 4.0 6.0
100 workers or more ................................................ 1.5 2.0 3.6 6.0 6.0100 to 499 workers .............................................. 1.5 2.0 3.5 6.0 6.0500 workers or more ............................................ 1.5 – 4.0 6.0 6.0
Geographic areas
Northeast ................................................................. – 2.4 3.0 4.2 6.0New England ....................................................... 1.5 2.0 3.0 4.0 5.0Middle Atlantic ..................................................... 1.0 3.0 3.0 4.9 6.0
South ....................................................................... 1.5 3.0 4.0 6.0 6.0South Atlantic ....................................................... – – 4.0 6.0 6.0East South Central ............................................... 1.5 – 4.0 6.0 6.0West South Central .............................................. 2.0 3.0 4.0 6.0 6.0
Midwest .................................................................... 1.5 2.0 3.0 5.0 6.0East North Central ............................................... 1.5 2.0 3.0 5.0 6.0West North Central .............................................. 1.5 – 3.0 4.5 6.0
West ......................................................................... 1.5 2.4 3.0 5.0 6.0Mountain .............................................................. 1.5 – 3.0 5.0 6.0Pacific .................................................................. – 2.4 3.0 4.5 6.0
1 The maximum potential employer contribution is determined by multiplying the maximum employee contribution subject to matching by theemployer matching percent, for those plans that specify both values.
2 Surveyed occupations are classified into wage categories based on the average wage for the occupation, which may include workers withearnings both above and below the threshold. The categories were formed using percentile estimates generated using data from the NationalCompensation Survey publication, "Employer Costs for Employee Compensation - March 2015."
Note: Dashes indicate that no data were reported or that data do not meet publication criteria. For definitions of major plans, key provisions, andrelated terms, see the "Glossary of Employee Benefit Terms" at www.bls.gov/ncs/ebs/glossary20152016.htm.
Source: Bureau of Labor Statistics, National Compensation Survey.
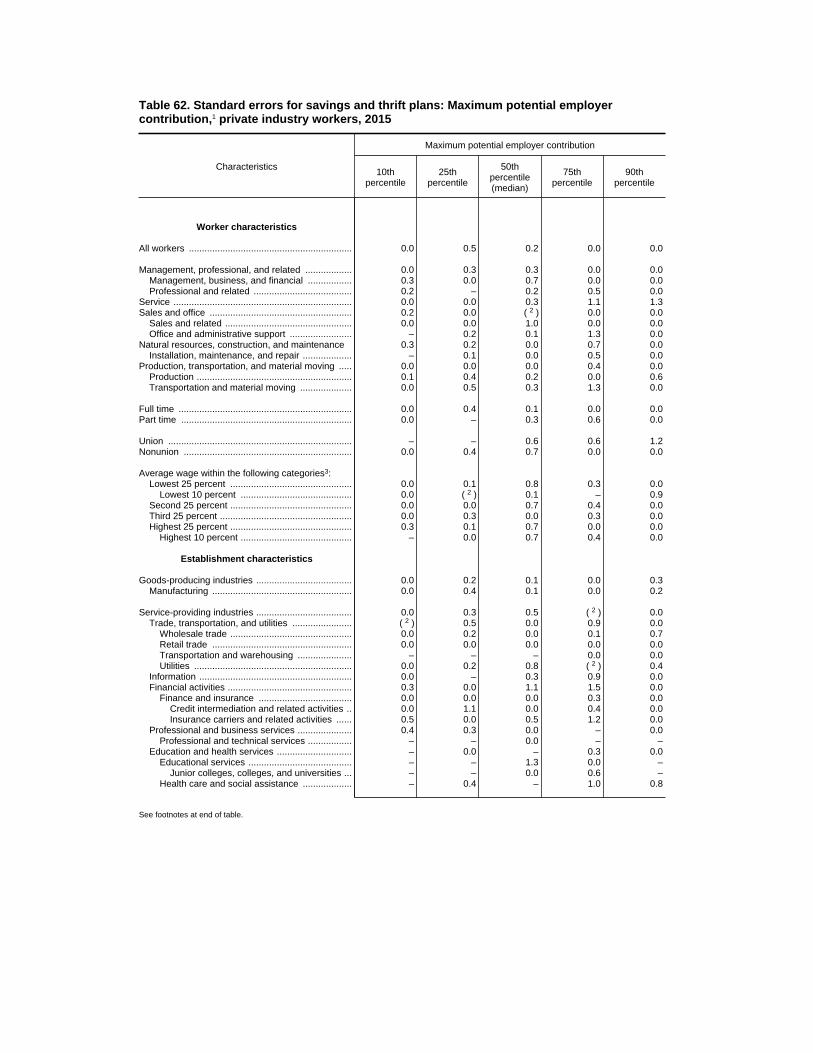
Table 62. Standard errors for savings and thrift plans: Maximum potential employercontribution,1 private industry workers, 2015
Characteristics
Maximum potential employer contribution
10thpercentile
25thpercentile
50thpercentile(median)
75thpercentile
90thpercentile
Worker characteristics
All workers ............................................................... 0.0 0.5 0.2 0.0 0.0
Management, professional, and related .................. 0.0 0.3 0.3 0.0 0.0Management, business, and financial ................. 0.3 0.0 0.7 0.0 0.0Professional and related ...................................... 0.2 – 0.2 0.5 0.0
Service ..................................................................... 0.0 0.0 0.3 1.1 1.3Sales and office ....................................................... 0.2 0.0 2( ) 0.0 0.0
Sales and related ................................................. 0.0 0.0 1.0 0.0 0.0Office and administrative support ........................ – 0.2 0.1 1.3 0.0
Natural resources, construction, and maintenance 0.3 0.2 0.0 0.7 0.0Installation, maintenance, and repair ................... – 0.1 0.0 0.5 0.0
Production, transportation, and material moving ..... 0.0 0.0 0.0 0.4 0.0Production ............................................................ 0.1 0.4 0.2 0.0 0.6Transportation and material moving .................... 0.0 0.5 0.3 1.3 0.0
Full time ................................................................... 0.0 0.4 0.1 0.0 0.0Part time .................................................................. 0.0 – 0.3 0.6 0.0
Union ....................................................................... – – 0.6 0.6 1.2Nonunion ................................................................. 0.0 0.4 0.7 0.0 0.0
Average wage within the following categories3:Lowest 25 percent ............................................... 0.0 0.1 0.8 0.3 0.0
Lowest 10 percent ........................................... 0.0 2( ) 0.1 – 0.9Second 25 percent ............................................... 0.0 0.0 0.7 0.4 0.0Third 25 percent ................................................... 0.0 0.3 0.0 0.3 0.0Highest 25 percent ............................................... 0.3 0.1 0.7 0.0 0.0
Highest 10 percent ........................................... – 0.0 0.7 0.4 0.0
Establishment characteristics
Goods-producing industries ..................................... 0.0 0.2 0.1 0.0 0.3Manufacturing ...................................................... 0.0 0.4 0.1 0.0 0.2
Service-providing industries ..................................... 0.0 0.3 0.5 2( ) 0.0Trade, transportation, and utilities ....................... 2( ) 0.5 0.0 0.9 0.0
Wholesale trade ............................................... 0.0 0.2 0.0 0.1 0.7Retail trade ...................................................... 0.0 0.0 0.0 0.0 0.0Transportation and warehousing ..................... – – – 0.0 0.0Utilities ............................................................. 0.0 0.2 0.8 2( ) 0.4
Information ........................................................... 0.0 – 0.3 0.9 0.0Financial activities ................................................ 0.3 0.0 1.1 1.5 0.0
Finance and insurance .................................... 0.0 0.0 0.0 0.3 0.0Credit intermediation and related activities .. 0.0 1.1 0.0 0.4 0.0Insurance carriers and related activities ...... 0.5 0.0 0.5 1.2 0.0
Professional and business services ..................... 0.4 0.3 0.0 – 0.0Professional and technical services ................. – – 0.0 – –
Education and health services ............................. – 0.0 – 0.3 0.0Educational services ........................................ – – 1.3 0.0 –
Junior colleges, colleges, and universities ... – – 0.0 0.6 –Health care and social assistance ................... – 0.4 – 1.0 0.8
See footnotes at end of table.
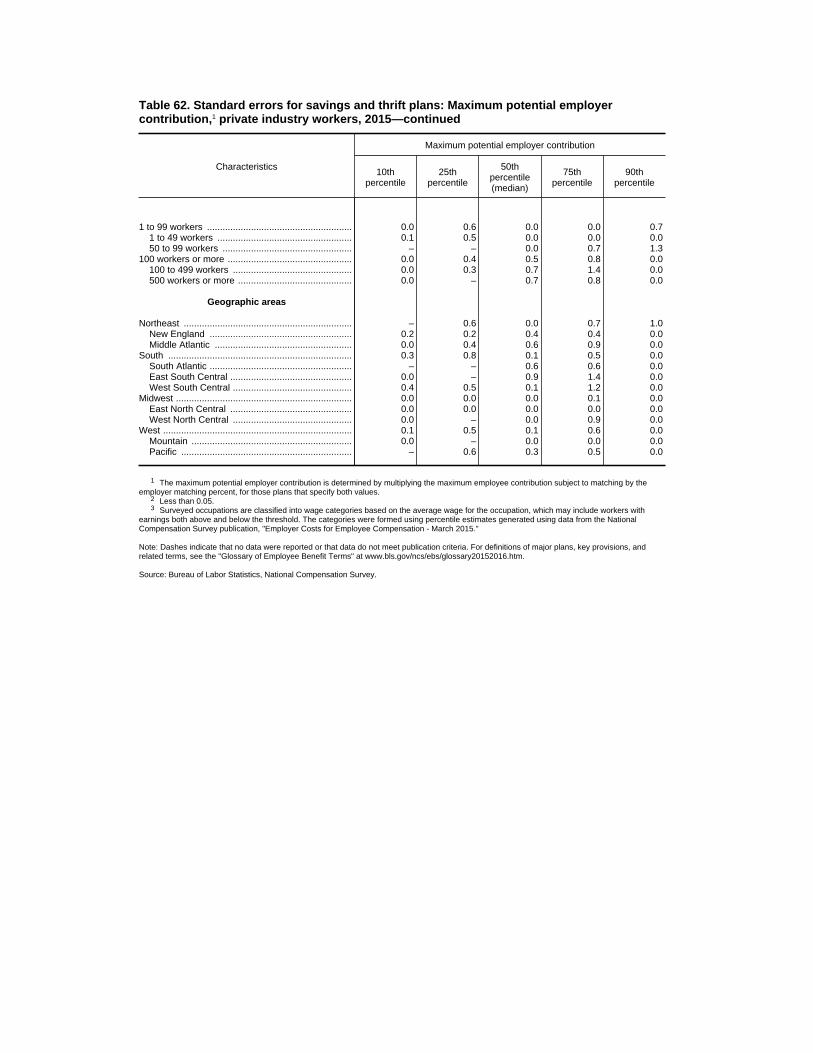
Table 62. Standard errors for savings and thrift plans: Maximum potential employercontribution,1 private industry workers, 2015—continued
Characteristics
Maximum potential employer contribution
10thpercentile
25thpercentile
50thpercentile(median)
75thpercentile
90thpercentile
1 to 99 workers ........................................................ 0.0 0.6 0.0 0.0 0.71 to 49 workers .................................................... 0.1 0.5 0.0 0.0 0.050 to 99 workers .................................................. – – 0.0 0.7 1.3
100 workers or more ................................................ 0.0 0.4 0.5 0.8 0.0100 to 499 workers .............................................. 0.0 0.3 0.7 1.4 0.0500 workers or more ............................................ 0.0 – 0.7 0.8 0.0
Geographic areas
Northeast ................................................................. – 0.6 0.0 0.7 1.0New England ....................................................... 0.2 0.2 0.4 0.4 0.0Middle Atlantic ..................................................... 0.0 0.4 0.6 0.9 0.0
South ....................................................................... 0.3 0.8 0.1 0.5 0.0South Atlantic ....................................................... – – 0.6 0.6 0.0East South Central ............................................... 0.0 – 0.9 1.4 0.0West South Central .............................................. 0.4 0.5 0.1 1.2 0.0
Midwest .................................................................... 0.0 0.0 0.0 0.1 0.0East North Central ............................................... 0.0 0.0 0.0 0.0 0.0West North Central .............................................. 0.0 – 0.0 0.9 0.0
West ......................................................................... 0.1 0.5 0.1 0.6 0.0Mountain .............................................................. 0.0 – 0.0 0.0 0.0Pacific .................................................................. – 0.6 0.3 0.5 0.0
1 The maximum potential employer contribution is determined by multiplying the maximum employee contribution subject to matching by theemployer matching percent, for those plans that specify both values.
2 Less than 0.05.3 Surveyed occupations are classified into wage categories based on the average wage for the occupation, which may include workers with
earnings both above and below the threshold. The categories were formed using percentile estimates generated using data from the NationalCompensation Survey publication, "Employer Costs for Employee Compensation - March 2015."
Note: Dashes indicate that no data were reported or that data do not meet publication criteria. For definitions of major plans, key provisions, andrelated terms, see the "Glossary of Employee Benefit Terms" at www.bls.gov/ncs/ebs/glossary20152016.htm.
Source: Bureau of Labor Statistics, National Compensation Survey.
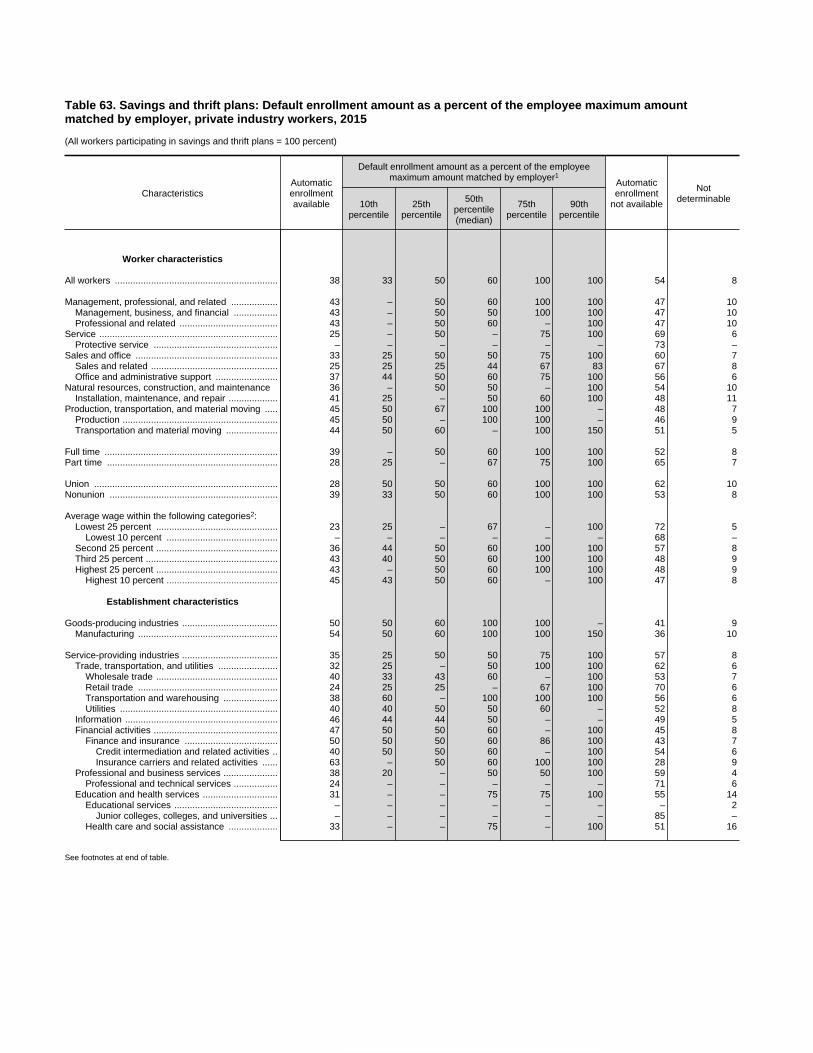
Table 63. Savings and thrift plans: Default enrollment amount as a percent of the employee maximum amountmatched by employer, private industry workers, 2015
(All workers participating in savings and thrift plans = 100 percent)
CharacteristicsAutomaticenrollmentavailable
Default enrollment amount as a percent of the employeemaximum amount matched by employer1
Automaticenrollment
not available
Notdeterminable10th
percentile25th
percentile
50thpercentile(median)
75thpercentile
90thpercentile
Worker characteristics
All workers ............................................................... 38 33 50 60 100 100 54 8
Management, professional, and related .................. 43 – 50 60 100 100 47 10Management, business, and financial ................. 43 – 50 50 100 100 47 10Professional and related ...................................... 43 – 50 60 – 100 47 10
Service ..................................................................... 25 – 50 – 75 100 69 6Protective service ................................................ – – – – – – 73 –
Sales and office ....................................................... 33 25 50 50 75 100 60 7Sales and related ................................................. 25 25 25 44 67 83 67 8Office and administrative support ........................ 37 44 50 60 75 100 56 6
Natural resources, construction, and maintenance 36 – 50 50 – 100 54 10Installation, maintenance, and repair ................... 41 25 – 50 60 100 48 11
Production, transportation, and material moving ..... 45 50 67 100 100 – 48 7Production ............................................................ 45 50 – 100 100 – 46 9Transportation and material moving .................... 44 50 60 – 100 150 51 5
Full time ................................................................... 39 – 50 60 100 100 52 8Part time .................................................................. 28 25 – 67 75 100 65 7
Union ....................................................................... 28 50 50 60 100 100 62 10Nonunion ................................................................. 39 33 50 60 100 100 53 8
Average wage within the following categories2:Lowest 25 percent ............................................... 23 25 – 67 – 100 72 5
Lowest 10 percent ........................................... – – – – – – 68 –Second 25 percent ............................................... 36 44 50 60 100 100 57 8Third 25 percent ................................................... 43 40 50 60 100 100 48 9Highest 25 percent ............................................... 43 – 50 60 100 100 48 9
Highest 10 percent ........................................... 45 43 50 60 – 100 47 8
Establishment characteristics
Goods-producing industries ..................................... 50 50 60 100 100 – 41 9Manufacturing ...................................................... 54 50 60 100 100 150 36 10
Service-providing industries ..................................... 35 25 50 50 75 100 57 8Trade, transportation, and utilities ....................... 32 25 – 50 100 100 62 6
Wholesale trade ............................................... 40 33 43 60 – 100 53 7Retail trade ...................................................... 24 25 25 – 67 100 70 6Transportation and warehousing ..................... 38 60 – 100 100 100 56 6Utilities ............................................................. 40 40 50 50 60 – 52 8
Information ........................................................... 46 44 44 50 – – 49 5Financial activities ................................................ 47 50 50 60 – 100 45 8
Finance and insurance .................................... 50 50 50 60 86 100 43 7Credit intermediation and related activities .. 40 50 50 60 – 100 54 6Insurance carriers and related activities ...... 63 – 50 60 100 100 28 9
Professional and business services ..................... 38 20 – 50 50 100 59 4Professional and technical services ................. 24 – – – – – 71 6
Education and health services ............................. 31 – – 75 75 100 55 14Educational services ........................................ – – – – – – – 2
Junior colleges, colleges, and universities ... – – – – – – 85 –Health care and social assistance ................... 33 – – 75 – 100 51 16
See footnotes at end of table.

Table 63. Savings and thrift plans: Default enrollment amount as a percent of the employee maximum amountmatched by employer, private industry workers, 2015—continued
(All workers participating in savings and thrift plans = 100 percent)
CharacteristicsAutomaticenrollmentavailable
Default enrollment amount as a percent of the employeemaximum amount matched by employer1
Automaticenrollment
not available
Notdeterminable10th
percentile25th
percentile
50thpercentile(median)
75thpercentile
90thpercentile
1 to 99 workers ........................................................ 33 – 50 60 75 100 55 111 to 49 workers .................................................... 32 25 50 60 75 100 58 1050 to 99 workers .................................................. 36 43 50 50 100 – 51 14
100 workers or more ................................................ 41 – 50 60 100 100 53 6100 to 499 workers .............................................. 35 – 50 67 100 100 59 6500 workers or more ............................................ 49 – 50 50 100 100 44 6
Geographic areas
Northeast ................................................................. 37 43 50 67 – 100 50 13Middle Atlantic ..................................................... 42 43 – 67 75 100 51 7
South ....................................................................... 35 – 50 50 100 100 62 3South Atlantic ....................................................... 38 – 50 50 100 100 59 3East South Central ............................................... 29 50 50 67 – 100 68 2West South Central .............................................. 33 20 – 60 75 100 64 3
Midwest .................................................................... 41 – 50 – 100 100 51 8East North Central ............................................... 45 – 50 – 100 100 47 8West North Central .............................................. 32 – 50 – 100 100 59 10
West ......................................................................... 42 – 50 50 – 100 45 13Mountain .............................................................. 42 – 50 50 – 100 42 16Pacific .................................................................. 42 – 43 50 – 100 47 12
1 The percentage is determined by the ratio of the default enrollment amount to the maximum employee contribution matched by the employer, for those plans that specify both values.2 Surveyed occupations are classified into wage categories based on the average wage for the occupation, which may include workers with earnings both above and below the threshold.
The categories were formed using percentile estimates generated using data from the National Compensation Survey publication, "Employer Costs for Employee Compensation - March2015."
Note: Because of rounding, sums of individual items may not equal totals. Dashes indicate that no data were reported or that data do not meet publication criteria. For definitions of majorplans, key provisions, and related terms, see the "Glossary of Employee Benefit Terms" at www.bls.gov/ncs/ebs/glossary20152016.htm.
Source: Bureau of Labor Statistics, National Compensation Survey.

Table 63. Standard errors for savings and thrift plans: Default enrollment amount as a percent of the employeemaximum amount matched by employer, private industry workers, 2015
CharacteristicsAutomaticenrollmentavailable
Default enrollment amount as a percent of the employeemaximum amount matched by employer1
Automaticenrollment
not available
Notdeterminable10th
percentile25th
percentile
50thpercentile(median)
75thpercentile
90thpercentile
Worker characteristics
All workers ............................................................... 1.7 7.3 0.0 2.5 2.6 0.0 1.7 1.1
Management, professional, and related .................. 2.9 – 1.0 13.0 17.0 0.0 3.2 2.1Management, business, and financial ................. 3.5 – 0.0 11.5 11.9 0.0 3.9 2.0Professional and related ...................................... 3.4 – 3.7 16.0 – 0.0 3.6 3.1
Service ..................................................................... 5.7 – 0.0 – 13.4 25.4 5.6 2.3Protective service ................................................ – – – – – – 9.2 –
Sales and office ....................................................... 2.1 7.2 7.6 13.4 5.3 0.0 2.3 1.2Sales and related ................................................. 3.2 0.0 4.3 8.6 4.7 11.6 3.9 2.8Office and administrative support ........................ 2.8 7.0 0.0 6.8 15.8 0.0 2.8 1.3
Natural resources, construction, and maintenance 3.7 – 8.1 0.0 – 0.0 3.8 2.7Installation, maintenance, and repair ................... 4.5 4.8 – 0.0 14.1 6.8 4.2 3.2
Production, transportation, and material moving ..... 4.5 4.8 13.7 0.0 0.0 – 4.0 1.6Production ............................................................ 7.0 12.7 – 0.0 0.0 – 5.8 2.7Transportation and material moving .................... 5.2 7.4 9.5 – 0.0 28.9 5.1 1.2
Full time ................................................................... 1.7 – 0.0 2.5 0.0 0.0 1.8 1.2Part time .................................................................. 3.3 0.0 – 18.0 12.9 0.0 3.3 2.2
Union ....................................................................... 5.5 1.8 6.6 5.7 21.7 0.0 5.8 2.8Nonunion ................................................................. 1.8 9.2 0.0 4.0 0.0 0.0 1.9 1.2
Average wage within the following categories2:Lowest 25 percent ............................................... 3.4 0.0 – 12.1 – 0.0 3.5 1.4
Lowest 10 percent ........................................... – – – – – – 9.1 –Second 25 percent ............................................... 3.3 8.6 0.0 10.0 0.0 0.0 3.3 1.2Third 25 percent ................................................... 2.2 9.7 0.0 7.2 0.0 0.0 2.3 1.7Highest 25 percent ............................................... 3.0 – 0.0 14.1 11.5 0.0 3.3 1.9
Highest 10 percent ........................................... 4.0 11.9 0.0 13.7 – 0.0 4.4 1.7
Establishment characteristics
Goods-producing industries ..................................... 4.7 0.0 7.3 7.9 0.0 – 4.5 1.6Manufacturing ...................................................... 5.3 0.0 9.2 9.1 0.0 42.5 4.8 1.9
Service-providing industries ..................................... 1.6 4.8 5.8 4.8 3.0 0.0 1.8 1.3Trade, transportation, and utilities ....................... 2.1 0.0 – 13.3 21.7 0.0 2.4 1.7
Wholesale trade ............................................... 3.9 0.0 9.2 15.2 – 0.0 4.3 2.4Retail trade ...................................................... 3.0 0.0 0.0 – 18.7 26.0 3.0 2.8Transportation and warehousing ..................... 7.5 10.9 – 0.0 0.0 0.0 7.5 3.5Utilities ............................................................. 9.3 10.5 9.3 11.4 0.0 – 9.2 4.8
Information ........................................................... 7.5 0.0 1.4 0.0 – – 7.4 3.3Financial activities ................................................ 3.2 0.0 0.0 0.0 – 0.0 3.0 1.6
Finance and insurance .................................... 3.3 0.0 0.0 0.0 23.1 0.0 3.3 1.6Credit intermediation and related activities .. 5.1 0.0 0.0 0.0 – 0.0 5.5 2.2Insurance carriers and related activities ...... 4.0 – 0.0 4.6 6.9 0.0 3.3 2.8
Professional and business services ..................... 5.4 0.0 – 11.8 0.0 18.2 6.1 2.0Professional and technical services ................. 5.0 – – – – – 6.2 3.3
Education and health services ............................. 4.6 – – 7.6 18.2 11.2 4.7 5.4Educational services ........................................ – – – – – – – 2.1
Junior colleges, colleges, and universities ... – – – – – – 4.3 –Health care and social assistance ................... 5.2 – – 0.0 – 11.2 5.1 6.1
See footnotes at end of table.

Table 63. Standard errors for savings and thrift plans: Default enrollment amount as a percent of the employeemaximum amount matched by employer, private industry workers, 2015—continued
CharacteristicsAutomaticenrollmentavailable
Default enrollment amount as a percent of the employeemaximum amount matched by employer1
Automaticenrollment
not available
Notdeterminable10th
percentile25th
percentile
50thpercentile(median)
75thpercentile
90thpercentile
1 to 99 workers ........................................................ 2.9 – 4.1 10.0 12.8 0.0 3.3 2.61 to 49 workers .................................................... 3.3 5.0 12.9 13.1 4.6 0.0 3.6 2.050 to 99 workers .................................................. 5.7 2.0 5.5 13.3 24.2 – 5.7 6.9
100 workers or more ................................................ 2.4 – 0.0 4.5 0.0 0.0 2.4 0.7100 to 499 workers .............................................. 2.7 – 0.0 12.0 0.0 0.0 2.7 1.2500 workers or more ............................................ 3.7 – 0.0 13.0 0.0 0.0 3.6 1.3
Geographic areas
Northeast ................................................................. 5.0 7.8 13.1 12.3 – 0.0 5.6 2.3Middle Atlantic ..................................................... 6.6 8.5 – 12.5 0.0 0.0 7.8 2.3
South ....................................................................... 2.1 – 0.0 12.8 23.5 0.0 2.0 0.6South Atlantic ....................................................... 3.2 – 0.0 5.2 6.4 0.0 2.8 0.8East South Central ............................................... 4.5 7.9 0.0 5.3 – 0.0 4.4 1.2West South Central .............................................. 3.0 0.0 – 15.5 16.5 12.1 3.6 1.4
Midwest .................................................................... 3.8 – 0.0 – 0.0 0.0 3.7 1.8East North Central ............................................... 4.7 – 1.4 – 0.0 20.4 4.4 2.4West North Central .............................................. 4.5 – 0.0 – 0.0 0.0 5.5 2.3
West ......................................................................... 3.4 – 3.4 3.2 – 0.0 3.3 3.8Mountain .............................................................. 5.2 – 0.0 10.0 – 21.0 4.5 8.7Pacific .................................................................. 4.4 – 9.4 5.2 – 0.0 4.6 2.4
1 The percentage is determined by the ratio of the default enrollment amount to the maximum employee contribution matched by the employer, for those plans that specify both values.2 Surveyed occupations are classified into wage categories based on the average wage for the occupation, which may include workers with earnings both above and below the threshold.
The categories were formed using percentile estimates generated using data from the National Compensation Survey publication, "Employer Costs for Employee Compensation - March2015."
Note: Dashes indicate that no data were reported or that data do not meet publication criteria. For definitions of major plans, key provisions, and related terms, see the "Glossary of EmployeeBenefit Terms" at www.bls.gov/ncs/ebs/glossary20152016.htm.
Source: Bureau of Labor Statistics, National Compensation Survey.
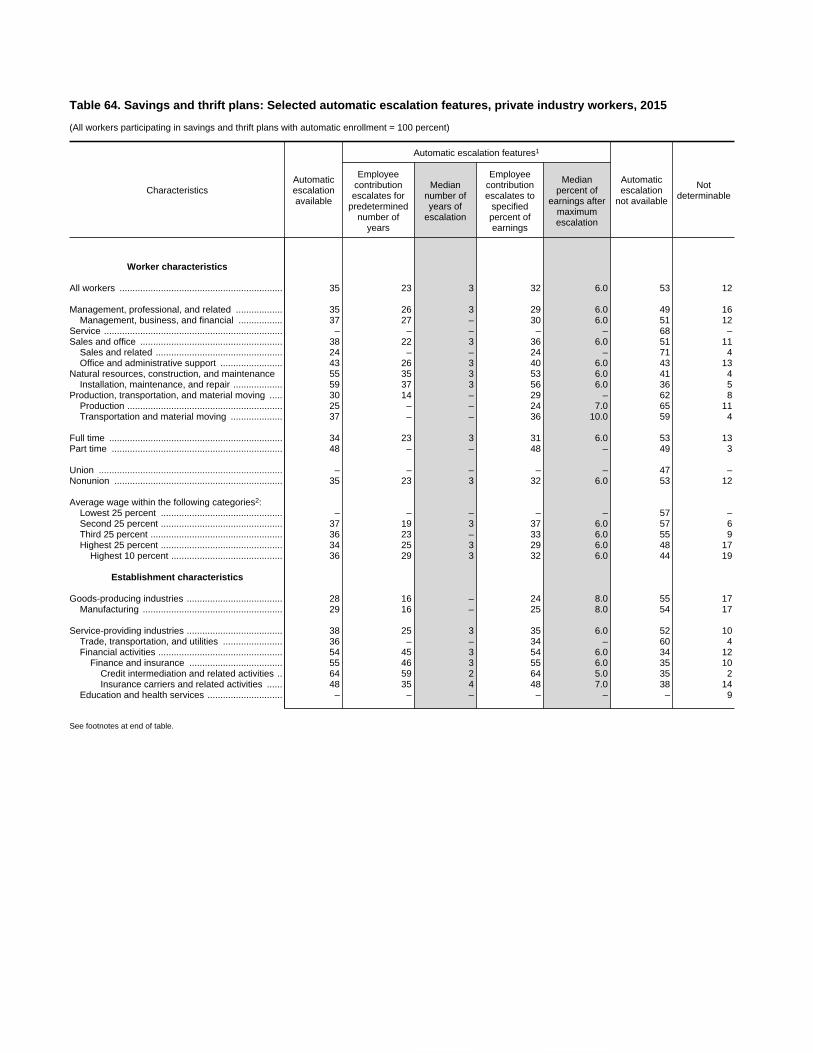
Table 64. Savings and thrift plans: Selected automatic escalation features, private industry workers, 2015
(All workers participating in savings and thrift plans with automatic enrollment = 100 percent)
CharacteristicsAutomaticescalationavailable
Automatic escalation features1
Automaticescalation
not available
Notdeterminable
Employeecontributionescalates for
predeterminednumber of
years
Mediannumber ofyears of
escalation
Employeecontributionescalates to
specifiedpercent ofearnings
Medianpercent of
earnings aftermaximumescalation
Worker characteristics
All workers ............................................................... 35 23 3 32 6.0 53 12
Management, professional, and related .................. 35 26 3 29 6.0 49 16Management, business, and financial ................. 37 27 – 30 6.0 51 12
Service ..................................................................... – – – – – 68 –Sales and office ....................................................... 38 22 3 36 6.0 51 11
Sales and related ................................................. 24 – – 24 – 71 4Office and administrative support ........................ 43 26 3 40 6.0 43 13
Natural resources, construction, and maintenance 55 35 3 53 6.0 41 4Installation, maintenance, and repair ................... 59 37 3 56 6.0 36 5
Production, transportation, and material moving ..... 30 14 – 29 – 62 8Production ............................................................ 25 – – 24 7.0 65 11Transportation and material moving .................... 37 – – 36 10.0 59 4
Full time ................................................................... 34 23 3 31 6.0 53 13Part time .................................................................. 48 – – 48 – 49 3
Union ....................................................................... – – – – – 47 –Nonunion ................................................................. 35 23 3 32 6.0 53 12
Average wage within the following categories2:Lowest 25 percent ............................................... – – – – – 57 –Second 25 percent ............................................... 37 19 3 37 6.0 57 6Third 25 percent ................................................... 36 23 – 33 6.0 55 9Highest 25 percent ............................................... 34 25 3 29 6.0 48 17
Highest 10 percent ........................................... 36 29 3 32 6.0 44 19
Establishment characteristics
Goods-producing industries ..................................... 28 16 – 24 8.0 55 17Manufacturing ...................................................... 29 16 – 25 8.0 54 17
Service-providing industries ..................................... 38 25 3 35 6.0 52 10Trade, transportation, and utilities ....................... 36 – – 34 – 60 4Financial activities ................................................ 54 45 3 54 6.0 34 12
Finance and insurance .................................... 55 46 3 55 6.0 35 10Credit intermediation and related activities .. 64 59 2 64 5.0 35 2Insurance carriers and related activities ...... 48 35 4 48 7.0 38 14
Education and health services ............................. – – – – – – 9
See footnotes at end of table.
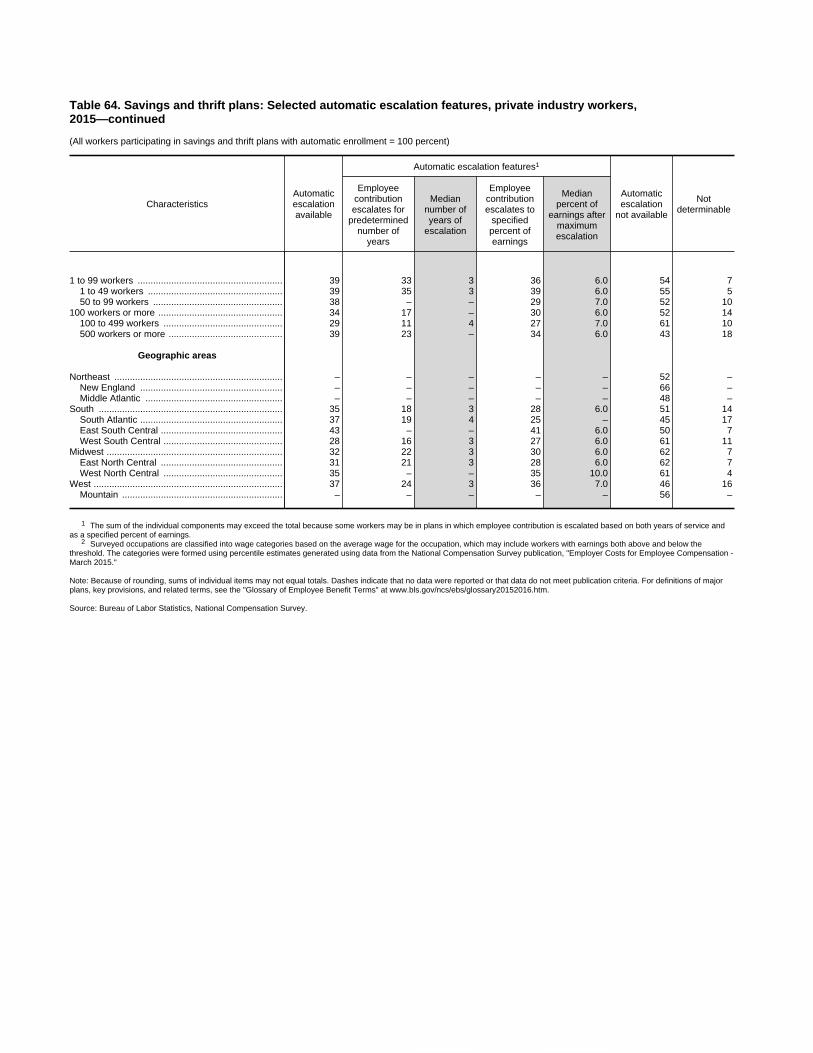
Table 64. Savings and thrift plans: Selected automatic escalation features, private industry workers,2015—continued
(All workers participating in savings and thrift plans with automatic enrollment = 100 percent)
CharacteristicsAutomaticescalationavailable
Automatic escalation features1
Automaticescalation
not available
Notdeterminable
Employeecontributionescalates for
predeterminednumber of
years
Mediannumber ofyears of
escalation
Employeecontributionescalates to
specifiedpercent ofearnings
Medianpercent of
earnings aftermaximumescalation
1 to 99 workers ........................................................ 39 33 3 36 6.0 54 71 to 49 workers .................................................... 39 35 3 39 6.0 55 550 to 99 workers .................................................. 38 – – 29 7.0 52 10
100 workers or more ................................................ 34 17 – 30 6.0 52 14100 to 499 workers .............................................. 29 11 4 27 7.0 61 10500 workers or more ............................................ 39 23 – 34 6.0 43 18
Geographic areas
Northeast ................................................................. – – – – – 52 –New England ....................................................... – – – – – 66 –Middle Atlantic ..................................................... – – – – – 48 –
South ....................................................................... 35 18 3 28 6.0 51 14South Atlantic ....................................................... 37 19 4 25 – 45 17East South Central ............................................... 43 – – 41 6.0 50 7West South Central .............................................. 28 16 3 27 6.0 61 11
Midwest .................................................................... 32 22 3 30 6.0 62 7East North Central ............................................... 31 21 3 28 6.0 62 7West North Central .............................................. 35 – – 35 10.0 61 4
West ......................................................................... 37 24 3 36 7.0 46 16Mountain .............................................................. – – – – – 56 –
1 The sum of the individual components may exceed the total because some workers may be in plans in which employee contribution is escalated based on both years of service andas a specified percent of earnings.
2 Surveyed occupations are classified into wage categories based on the average wage for the occupation, which may include workers with earnings both above and below thethreshold. The categories were formed using percentile estimates generated using data from the National Compensation Survey publication, "Employer Costs for Employee Compensation -March 2015."
Note: Because of rounding, sums of individual items may not equal totals. Dashes indicate that no data were reported or that data do not meet publication criteria. For definitions of majorplans, key provisions, and related terms, see the "Glossary of Employee Benefit Terms" at www.bls.gov/ncs/ebs/glossary20152016.htm.
Source: Bureau of Labor Statistics, National Compensation Survey.
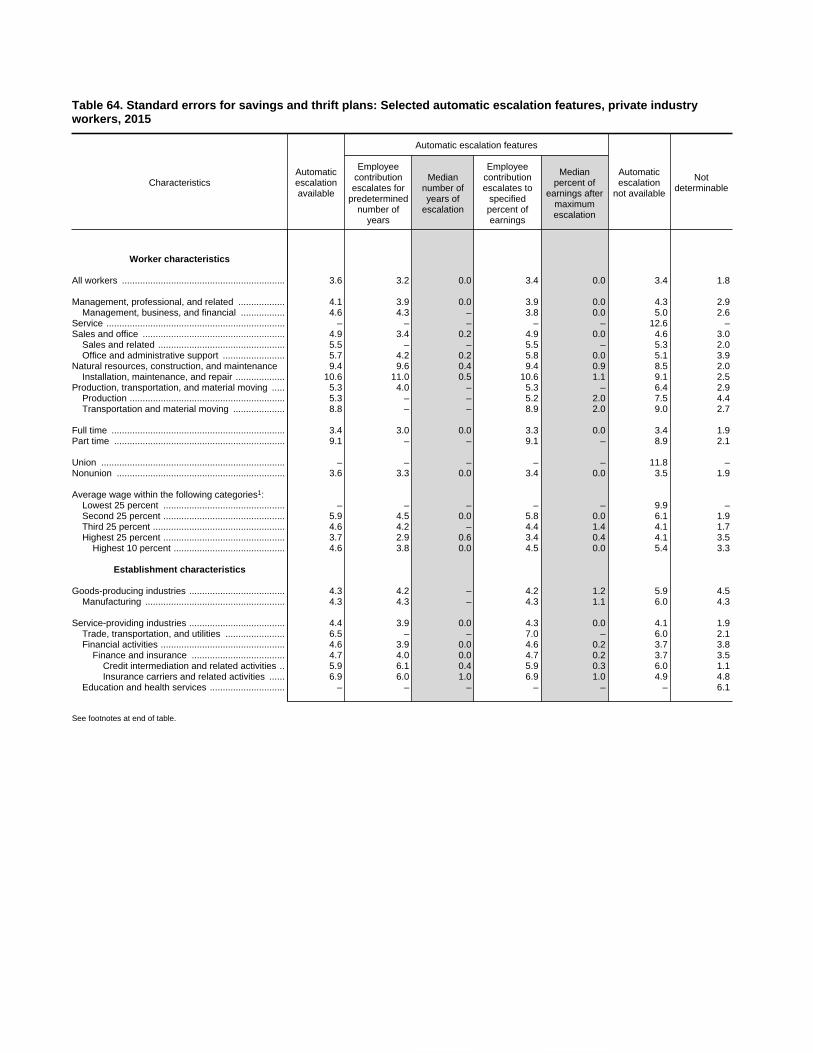
Table 64. Standard errors for savings and thrift plans: Selected automatic escalation features, private industryworkers, 2015
CharacteristicsAutomaticescalationavailable
Automatic escalation features
Automaticescalation
not available
Notdeterminable
Employeecontributionescalates for
predeterminednumber of
years
Mediannumber ofyears of
escalation
Employeecontributionescalates to
specifiedpercent ofearnings
Medianpercent of
earnings aftermaximumescalation
Worker characteristics
All workers ............................................................... 3.6 3.2 0.0 3.4 0.0 3.4 1.8
Management, professional, and related .................. 4.1 3.9 0.0 3.9 0.0 4.3 2.9Management, business, and financial ................. 4.6 4.3 – 3.8 0.0 5.0 2.6
Service ..................................................................... – – – – – 12.6 –Sales and office ....................................................... 4.9 3.4 0.2 4.9 0.0 4.6 3.0
Sales and related ................................................. 5.5 – – 5.5 – 5.3 2.0Office and administrative support ........................ 5.7 4.2 0.2 5.8 0.0 5.1 3.9
Natural resources, construction, and maintenance 9.4 9.6 0.4 9.4 0.9 8.5 2.0Installation, maintenance, and repair ................... 10.6 11.0 0.5 10.6 1.1 9.1 2.5
Production, transportation, and material moving ..... 5.3 4.0 – 5.3 – 6.4 2.9Production ............................................................ 5.3 – – 5.2 2.0 7.5 4.4Transportation and material moving .................... 8.8 – – 8.9 2.0 9.0 2.7
Full time ................................................................... 3.4 3.0 0.0 3.3 0.0 3.4 1.9Part time .................................................................. 9.1 – – 9.1 – 8.9 2.1
Union ....................................................................... – – – – – 11.8 –Nonunion ................................................................. 3.6 3.3 0.0 3.4 0.0 3.5 1.9
Average wage within the following categories1:Lowest 25 percent ............................................... – – – – – 9.9 –Second 25 percent ............................................... 5.9 4.5 0.0 5.8 0.0 6.1 1.9Third 25 percent ................................................... 4.6 4.2 – 4.4 1.4 4.1 1.7Highest 25 percent ............................................... 3.7 2.9 0.6 3.4 0.4 4.1 3.5
Highest 10 percent ........................................... 4.6 3.8 0.0 4.5 0.0 5.4 3.3
Establishment characteristics
Goods-producing industries ..................................... 4.3 4.2 – 4.2 1.2 5.9 4.5Manufacturing ...................................................... 4.3 4.3 – 4.3 1.1 6.0 4.3
Service-providing industries ..................................... 4.4 3.9 0.0 4.3 0.0 4.1 1.9Trade, transportation, and utilities ....................... 6.5 – – 7.0 – 6.0 2.1Financial activities ................................................ 4.6 3.9 0.0 4.6 0.2 3.7 3.8
Finance and insurance .................................... 4.7 4.0 0.0 4.7 0.2 3.7 3.5Credit intermediation and related activities .. 5.9 6.1 0.4 5.9 0.3 6.0 1.1Insurance carriers and related activities ...... 6.9 6.0 1.0 6.9 1.0 4.9 4.8
Education and health services ............................. – – – – – – 6.1
See footnotes at end of table.
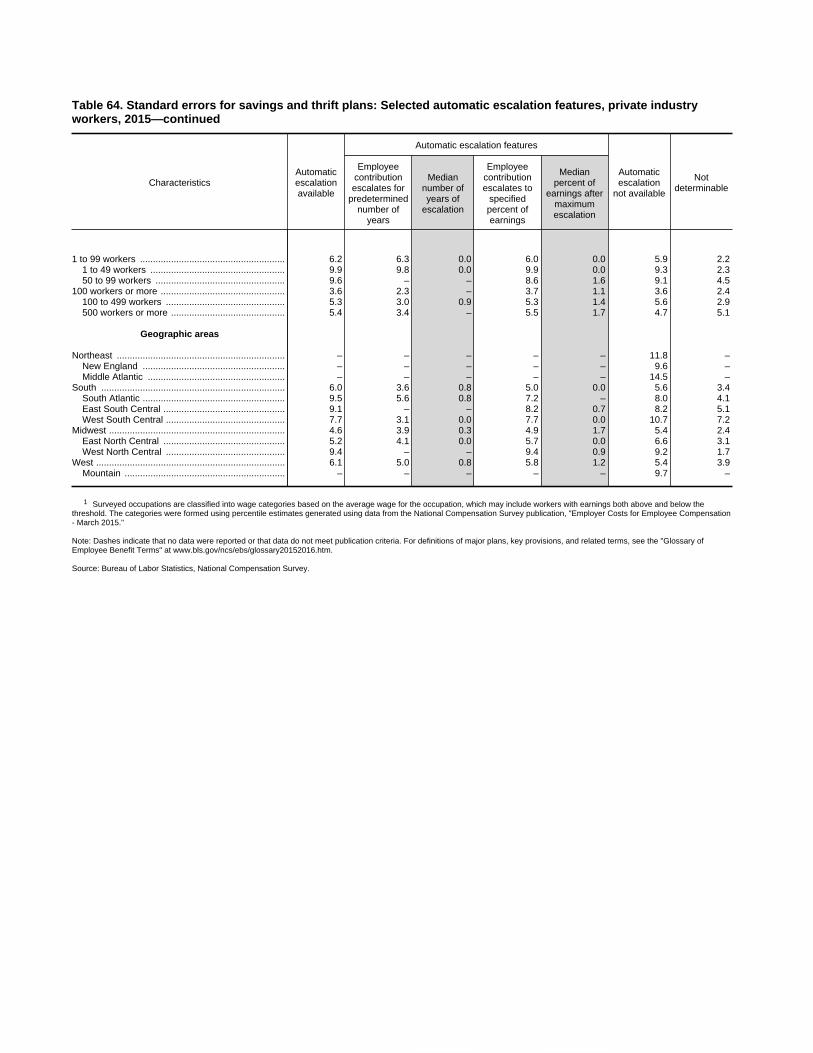
Table 64. Standard errors for savings and thrift plans: Selected automatic escalation features, private industryworkers, 2015—continued
CharacteristicsAutomaticescalationavailable
Automatic escalation features
Automaticescalation
not available
Notdeterminable
Employeecontributionescalates for
predeterminednumber of
years
Mediannumber ofyears of
escalation
Employeecontributionescalates to
specifiedpercent ofearnings
Medianpercent of
earnings aftermaximumescalation
1 to 99 workers ........................................................ 6.2 6.3 0.0 6.0 0.0 5.9 2.21 to 49 workers .................................................... 9.9 9.8 0.0 9.9 0.0 9.3 2.350 to 99 workers .................................................. 9.6 – – 8.6 1.6 9.1 4.5
100 workers or more ................................................ 3.6 2.3 – 3.7 1.1 3.6 2.4100 to 499 workers .............................................. 5.3 3.0 0.9 5.3 1.4 5.6 2.9500 workers or more ............................................ 5.4 3.4 – 5.5 1.7 4.7 5.1
Geographic areas
Northeast ................................................................. – – – – – 11.8 –New England ....................................................... – – – – – 9.6 –Middle Atlantic ..................................................... – – – – – 14.5 –
South ....................................................................... 6.0 3.6 0.8 5.0 0.0 5.6 3.4South Atlantic ....................................................... 9.5 5.6 0.8 7.2 – 8.0 4.1East South Central ............................................... 9.1 – – 8.2 0.7 8.2 5.1West South Central .............................................. 7.7 3.1 0.0 7.7 0.0 10.7 7.2
Midwest .................................................................... 4.6 3.9 0.3 4.9 1.7 5.4 2.4East North Central ............................................... 5.2 4.1 0.0 5.7 0.0 6.6 3.1West North Central .............................................. 9.4 – – 9.4 0.9 9.2 1.7
West ......................................................................... 6.1 5.0 0.8 5.8 1.2 5.4 3.9Mountain .............................................................. – – – – – 9.7 –
1 Surveyed occupations are classified into wage categories based on the average wage for the occupation, which may include workers with earnings both above and below thethreshold. The categories were formed using percentile estimates generated using data from the National Compensation Survey publication, "Employer Costs for Employee Compensation- March 2015."
Note: Dashes indicate that no data were reported or that data do not meet publication criteria. For definitions of major plans, key provisions, and related terms, see the "Glossary ofEmployee Benefit Terms" at www.bls.gov/ncs/ebs/glossary20152016.htm.
Source: Bureau of Labor Statistics, National Compensation Survey.

Technical Note
Data in this bulletin are from the National Compensation Survey (NCS), conducted by the U.S.
Department of Labor, Bureau of Labor Statistics (BLS). The bulletin contains 2015 estimates on
detailed provisions of employer-provided health and retirement benefit plans offered to private
industry workers in the United States. Excluded are federal government workers, the military,
state and local government workers, agricultural workers, private household workers, and the
self-employed. Previous publications containing information on employee benefits for private
industry and state and local government workers are available on the BLS website
at www.bls.gov/ncs/ebs.
Survey scope and method
Information on the survey scope, sample design, data collection, estimation, reliability of
estimates, and technical references are available in Chapter 8 of the BLS Handbook of
Methods, www.bls.gov/opub/hom/pdf/homch8.pdf. Definitions of major plans, key provisions,
and related benefit terms used by the National Compensation Survey are provided in the
Glossary of Employee Benefit Terms, available online
at www.bls.gov/ncs/ebs/glossary20152016.htm. For information on survey establishment
response and on the number of workers represented by the survey, see Appendix tables 1 and 2,
respectively.
Appendix Table 1 (TXT) (PDF)
Appendix Table 2 (TXT) (PDF)
Calculation details
For data presented by wage category, average hourly earnings from sampled occupations within
an establishment were used to produce estimates for worker groups within six earnings
categories: the lowest 10 percent, the lowest 25 percent, the second 25 percent, the third 25
percent, the highest 25 percent, and the highest 10 percent. The categories are based on March
2015 wages and salaries from the Employer Costs for Employee Compensation.
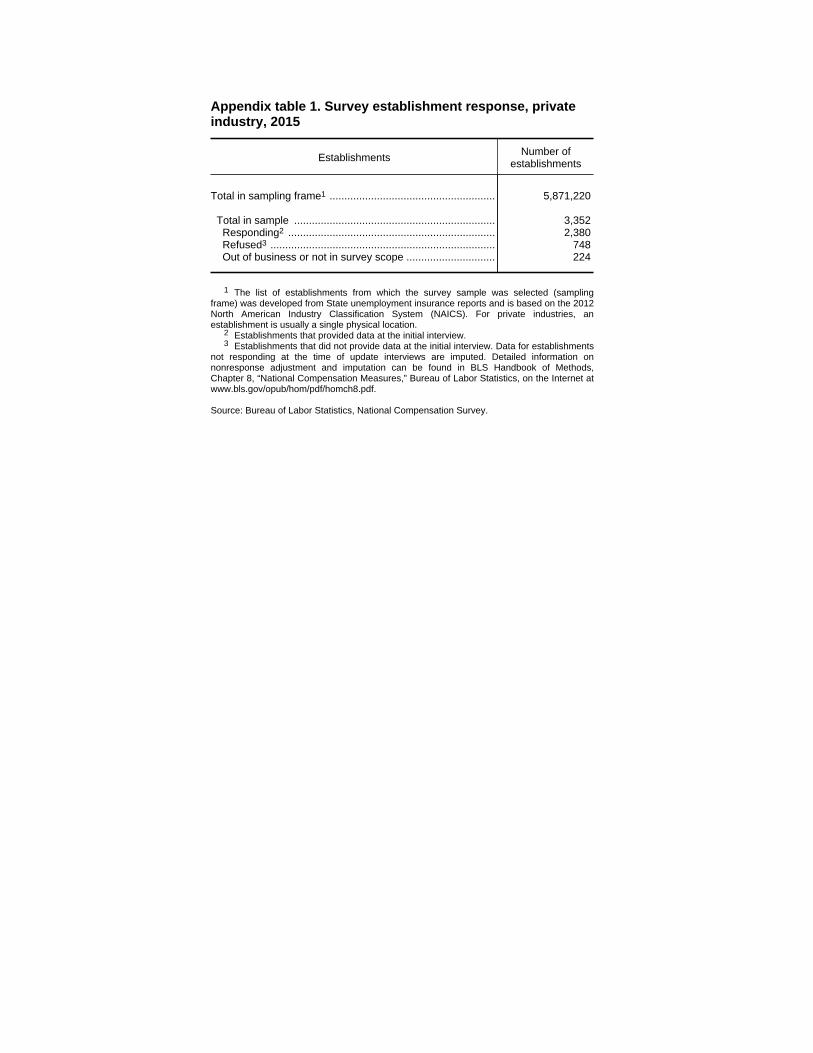
Appendix table 1. Survey establishment response, privateindustry, 2015
Establishments Number ofestablishments
Total in sampling frame1 ........................................................ 5,871,220
Total in sample .................................................................... 3,352 Responding2 ...................................................................... 2,380 Refused3 ............................................................................ 748 Out of business or not in survey scope .............................. 224
1 The list of establishments from which the survey sample was selected (samplingframe) was developed from State unemployment insurance reports and is based on the 2012North American Industry Classification System (NAICS). For private industries, anestablishment is usually a single physical location.
2 Establishments that provided data at the initial interview.3 Establishments that did not provide data at the initial interview. Data for establishments
not responding at the time of update interviews are imputed. Detailed information onnonresponse adjustment and imputation can be found in BLS Handbook of Methods,Chapter 8, “National Compensation Measures,” Bureau of Labor Statistics, on the Internet atwww.bls.gov/opub/hom/pdf/homch8.pdf.
Source: Bureau of Labor Statistics, National Compensation Survey.

Appendix table 2. Number of workers represented, privateindustry, 2015
Occupational group1 Estimated numberof workers2
All workers ............................................................................. 111,811,700
Management, professional, and related ............................ 29,468,500Management, business, and financial ........................... 11,189,600Professional and related ................................................ 18,278,900
Service ............................................................................... 25,564,800Protective service .......................................................... 1,616,600
Sales and office ................................................................. 29,105,300Sales and related ........................................................... 11,793,300Office and administrative support .................................. 17,312,100
Natural resources, construction, and maintenance ........... 9,380,700Construction, extraction, farming, fishing, and forestry .. 4,661,400Installation, maintenance, and repair ............................. 4,719,300
Production, transportation, and material moving ............... 18,292,400Production ...................................................................... 9,287,100Transportation and material moving .............................. 9,005,200
1 The 2010 Standard Occupational Classification system is used to classify workers.2 The number of workers represented by the survey are rounded to the nearest 100.
Estimates of the number of workers provide a description of the size and composition of thelabor force included in the survey. Estimates are not intended, however, for comparison toother statistical series to measure employment trends or levels.
Source: Bureau of Labor Statistics, National Compensation Survey.
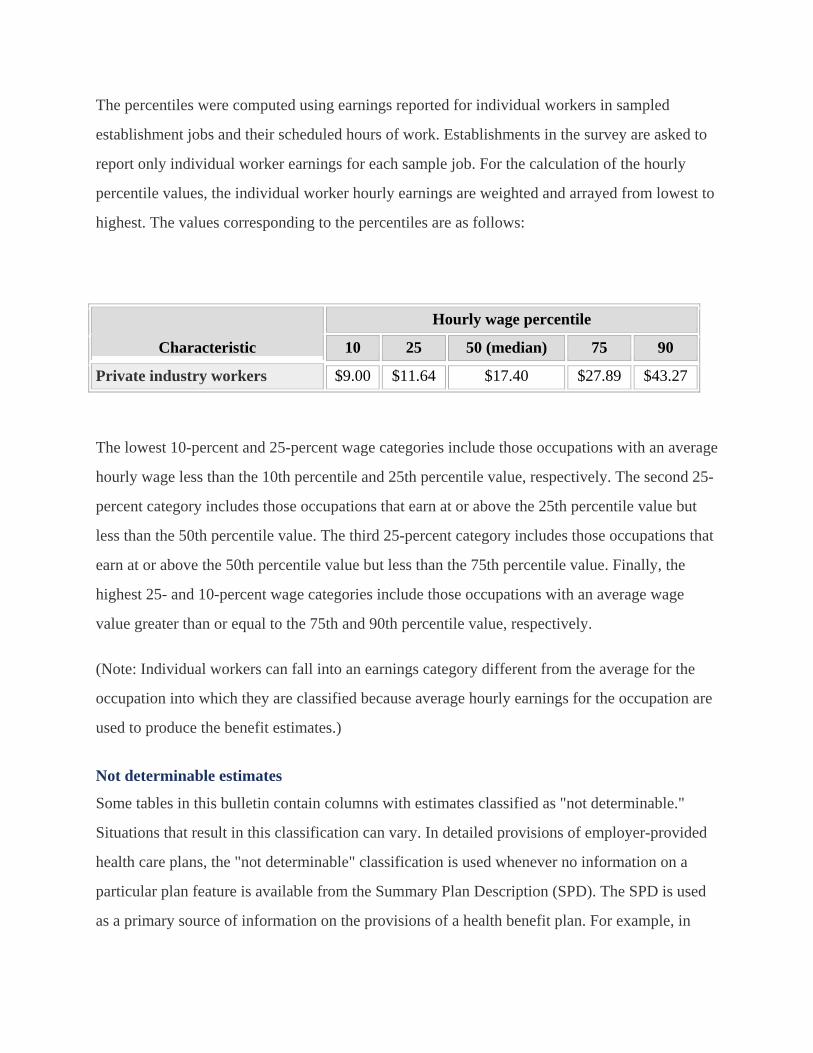
The percentiles were computed using earnings reported for individual workers in sampled
establishment jobs and their scheduled hours of work. Establishments in the survey are asked to
report only individual worker earnings for each sample job. For the calculation of the hourly
percentile values, the individual worker hourly earnings are weighted and arrayed from lowest to
highest. The values corresponding to the percentiles are as follows:
Characteristic
Hourly wage percentile
10 25 50 (median) 75 90
Private industry workers $9.00 $11.64 $17.40 $27.89 $43.27
The lowest 10-percent and 25-percent wage categories include those occupations with an average
hourly wage less than the 10th percentile and 25th percentile value, respectively. The second 25-
percent category includes those occupations that earn at or above the 25th percentile value but
less than the 50th percentile value. The third 25-percent category includes those occupations that
earn at or above the 50th percentile value but less than the 75th percentile value. Finally, the
highest 25- and 10-percent wage categories include those occupations with an average wage
value greater than or equal to the 75th and 90th percentile value, respectively.
(Note: Individual workers can fall into an earnings category different from the average for the
occupation into which they are classified because average hourly earnings for the occupation are
used to produce the benefit estimates.)
Not determinable estimates
Some tables in this bulletin contain columns with estimates classified as "not determinable."
Situations that result in this classification can vary. In detailed provisions of employer-provided
health care plans, the "not determinable" classification is used whenever no information on a
particular plan feature is available from the Summary Plan Description (SPD). The SPD is used
as a primary source of information on the provisions of a health benefit plan. For example, in
table 1, workers are classified as participating in four types of fee-for-service plans. Workers that
were known to participate in a fee-for-service plan, but the plan type was either not specified or
was specified but did not fit into any of the four categories used in the table, were classified into
the "not determinable" category.
Another situation in which the "not determinable" classification may be used is when workers
participate in plans in which a provision is known to exist, but no information on the specific
details of this provision is available from the SPD. For example, in one of the tables, all workers
participate in fee-for-service plans. The majority of the workers included in this table
participated in plans that specified a deductible, but a small percentage of workers participated in
plans in which the deductible was mentioned but not described. These workers were classified
into the "not determinable" category.
Interpreting the tables
All estimates shown in the table are based on the set of workers specified underneath the table
title and on any subsets indicated by column headers. For example, the statement may indicate
that “All workers participating in medical care plans = 100 percent,” or “Includes all workers
participating in savings and thrift plans that specify matching contributions.”
Most of the estimates in this bulletin are expressed in terms of the percentage of workers
participating in a particular benefit plan or the percentage covered by a specific provision. Some
estimates, however, provide values other than percentages of workers, such as the median age
requirement for eligibility to participate in a defined benefit retirement plan; dollar averages,
medians, and percentiles for various benefit provisions; and the specified matching percent (by
percentile) an employer will contribute to an employees’ savings and thrift retirement plan.
Estimates in the non-shaded columns indicate percentages of workers. Estimates in shaded
columns measure values other than the percent of workers.
Geographic areas
The census regions have been added to the detailed provisions publication beginning with the
2014 health and retirement plan provisions bulletin.
The census regions are defined as follows: Northeast: New England and Middle Atlantic;
South: South Atlantic, East South Central, and West South Central; Midwest: East North
Central and West North Central; and West: Mountain and Pacific.
The census divisions are defined as follows: New England: Connecticut, Maine, Massachusetts,
New Hampshire, Rhode Island and Vermont; Middle Atlantic: New Jersey, New York, and
Pennsylvania; South Atlantic: Delaware, District of Columbia, Florida, Georgia, Maryland,
North Carolina, South Carolina, Virginia, and West Virginia; East South Central: Alabama,
Kentucky, Mississippi, and Tennessee; West South Central: Arkansas, Louisiana, Oklahoma,
and Texas; East North Central: Illinois, Indiana, Michigan, Ohio, and Wisconsin; West North
Central: Iowa, Kansas, Minnesota, Missouri, Nebraska, North Dakota, and South Dakota;
Mountain: Arizona, Colorado, Idaho, Montana, Nevada, New Mexico, Utah, and Wyoming; and
Pacific: Alaska, California, Hawaii, Oregon, and Washington.

Appendix table 1. Survey establishment response, privateindustry, 2015
Establishments Number ofestablishments
Total in sampling frame1 ........................................................ 5,871,220
Total in sample .................................................................... 3,352 Responding2 ...................................................................... 2,380 Refused3 ............................................................................ 748 Out of business or not in survey scope .............................. 224
1 The list of establishments from which the survey sample was selected (samplingframe) was developed from State unemployment insurance reports and is based on the 2012North American Industry Classification System (NAICS). For private industries, anestablishment is usually a single physical location.
2 Establishments that provided data at the initial interview.3 Establishments that did not provide data at the initial interview. Data for establishments
not responding at the time of update interviews are imputed. Detailed information onnonresponse adjustment and imputation can be found in BLS Handbook of Methods,Chapter 8, “National Compensation Measures,” Bureau of Labor Statistics, on the Internet atwww.bls.gov/opub/hom/pdf/homch8.pdf.
Source: Bureau of Labor Statistics, National Compensation Survey.
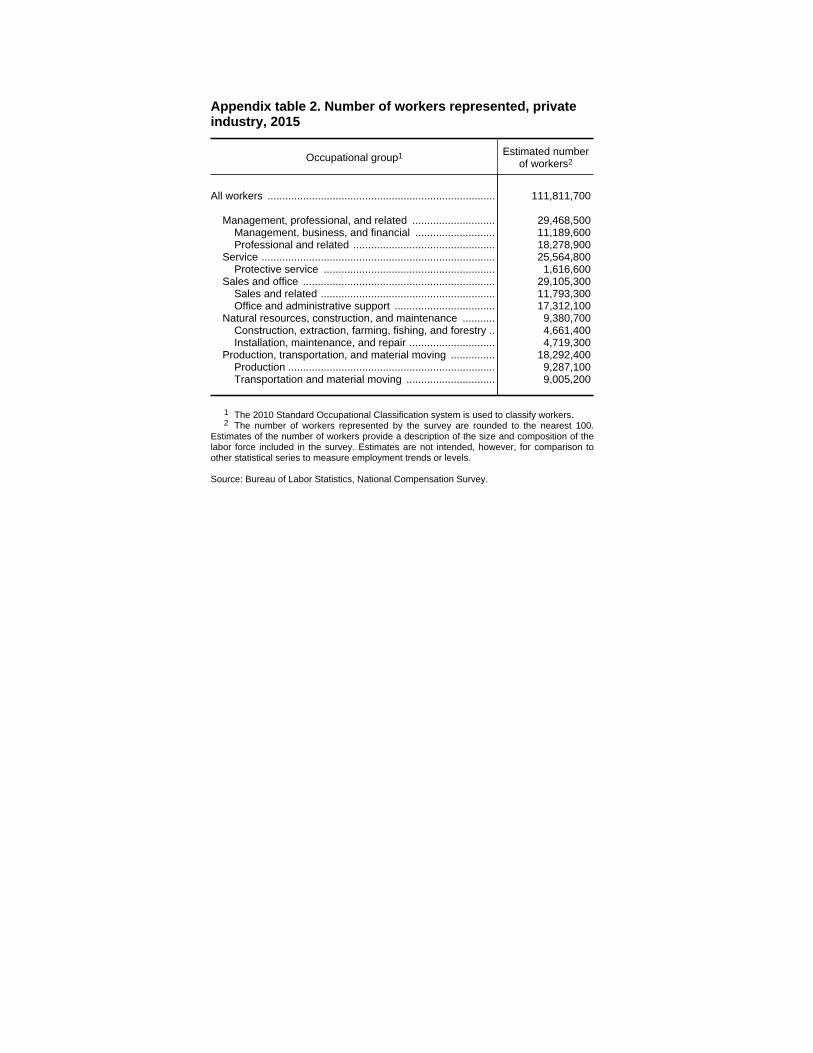
Appendix table 2. Number of workers represented, privateindustry, 2015
Occupational group1 Estimated numberof workers2
All workers ............................................................................. 111,811,700
Management, professional, and related ............................ 29,468,500Management, business, and financial ........................... 11,189,600Professional and related ................................................ 18,278,900
Service ............................................................................... 25,564,800Protective service .......................................................... 1,616,600
Sales and office ................................................................. 29,105,300Sales and related ........................................................... 11,793,300Office and administrative support .................................. 17,312,100
Natural resources, construction, and maintenance ........... 9,380,700Construction, extraction, farming, fishing, and forestry .. 4,661,400Installation, maintenance, and repair ............................. 4,719,300
Production, transportation, and material moving ............... 18,292,400Production ...................................................................... 9,287,100Transportation and material moving .............................. 9,005,200
1 The 2010 Standard Occupational Classification system is used to classify workers.2 The number of workers represented by the survey are rounded to the nearest 100.
Estimates of the number of workers provide a description of the size and composition of thelabor force included in the survey. Estimates are not intended, however, for comparison toother statistical series to measure employment trends or levels.
Source: Bureau of Labor Statistics, National Compensation Survey.