ncc already has the municipal population scale and ... · 1.1 executive summary . newcastle city...
TRANSCRIPT


1
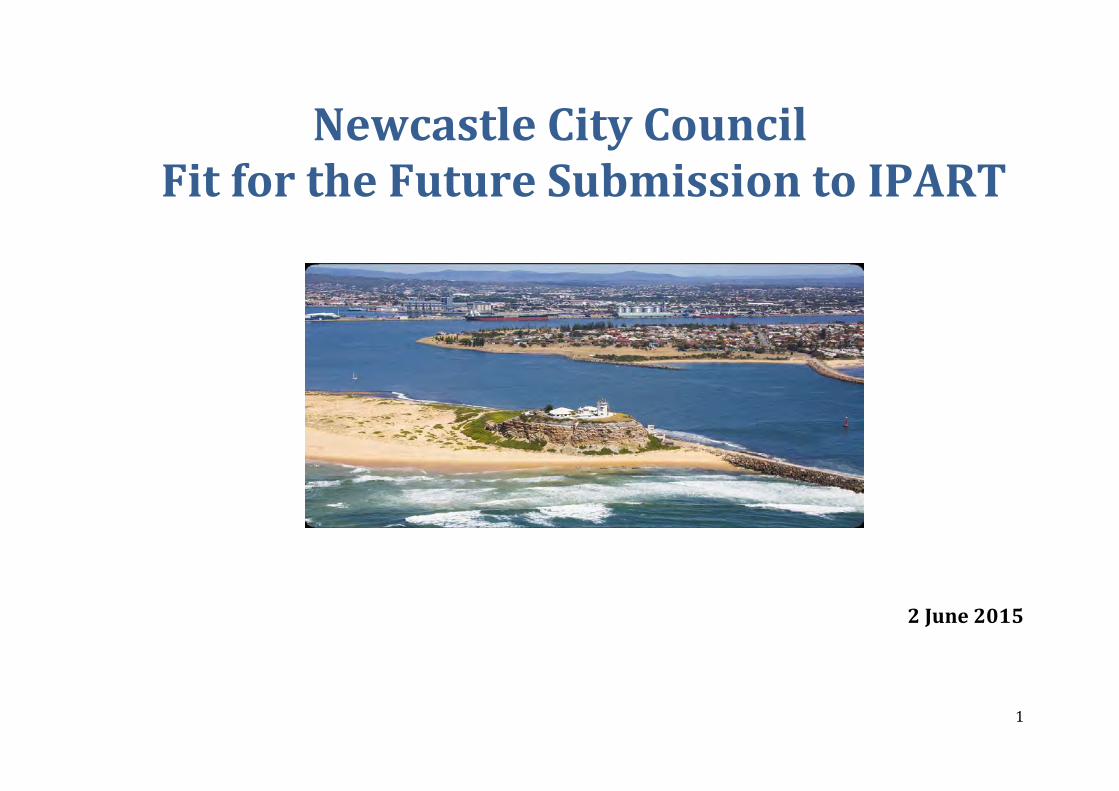
Newcastle City Council Fit for the Future Submission to IPART
2 June 2015
2
Copyright© Newcastle City Council, May 2015 The views expressed in this submission reflect those of Newcastle City Council. The work of Percy Allan & Associates Pty Ltd in assisting Council management and staff with the preparation of this document is acknowledged.

3
1. The Newcastle City Council Proposal
1.1 Executive summary Newcastle City Council (NCC) believes it has sufficient scale and strategic capacity and has a robust plan to be fit for the future. The Independent Local Government Review Panel (ILGRP) report raises questions of strategic capacity (forecast operating deficits, large capital works requirements, urban renewal, integrated planning considerations regarding its southern boundary with Lake Macquarie) as the rationale for amalgamation with Lake Macquarie City Council (LMCC). Scale (minimum population) does not receive particular focus and is noted instead as an outcome of the recommendations. NCC has however addressed both scale and strategic capacity with evidence provided in this submission to support the conclusions reached (Appendices D, F and G, in particular, provide further detail). (NCC is a large council by both Australian and international standards.i Its existing population of approximately 163,000 residents is projected to grow to around 190,050 by 2031. There is no evidence that municipalities beyond 100,000 citizens exhibit any economies of scale in New South Wales. Indeed academic research shows there is no optimal size for local government bodies; in other words getting bigger does not inherently reduce unit costs. In terms of ordinary revenue, NCC is already the eighth largest council in NSW (Office of Local Government (OLG) comparative data 2013/14). Even if all other proposed Fit for the Future (FFTF) mergers proceeded, NCC with its existing boundaries would still be the sixteenth largest council by population and eighth largest based on revenue in the state of 85 councils (OLG comparative data 2013/14). NCC has sufficient administrative capacity to undertake vital strategic and intergovernmental activities such as negotiating regional infrastructure with State and Federal agencies, designing urban plans and assessing complex development applications. Its core planning sections employ 126.3 Effective Full Time (EFT) staff (see Appendix B), which is sufficient to enable division of labour, specialisation of task and team brainstorming to optimise planning and approval decisions. NCC can capture both economies of scale and scope in activities by using Hunter Councils Ltd, a joint venture commercial operation established in the 1990s by the Hunter Regional Organisation of Councils which was reconstituted as Hunter Councils Inc. Hunter Councils Ltd is widely recognised as the most successful shared services centre in NSW local government.
4
In terms of the seven FFTF sustainability ratios, Council already satisfies the majority of these and under its Reform Program will achieve all but one of these goalposts by 2020/21. Indeed if the infrastructure backlog ratio had been more appropriately defined using replacement cost rather than written down value in the FFTF guidance material, NCC would achieve all FFTF benchmarks by 2019/20. NCC’s Reform Program comprises both its Roads to Recovery strategy (under its ten year Financial Plan) and Improvement Initiatives undertaken in response to FFTF. There has been a significant improvement in the financial performance of Council across all metrics over the past few years and this will continue for the forecast period. Over the past two years Council has reduced its infrastructure backlog from $117.3m in 2011/12, to $90.4m in 2013/14. It has a concerted program to reduce this further so that the infrastructure backlog ratio falls below the cap of 2% on the incorrectly conceived ratio by 2020/21 and on the correctly defined ratio by 2019/20. Finally, NCC has a bright future. In partnership with the State Government, Council is revitalising the Newcastle CBD to make it more liveable for residents and more attractive to tourists. NCC wants to position the City as an alternative growth centre to Sydney whose increasing traffic congestion, unaffordable housing and lack of a hinterland constrains its ability to keep absorbing two out of three new residents in the State. By contrast Newcastle is the commercial centre of the Hunter Region whose habitable land and bountiful water and energy resources make it the obvious outlet for the State’s future expansion. NCC already successfully undertakes regional economic and population planning in cooperation with adjoining councils - Lake Macquarie (to its south), Cessnock and Maitland (to its west) and Port Stephens (to its north) - through Hunter Councils Inc, a regional organisation of councils, that envisages becoming a Joint Organisation as part of FFTF.

5
The Hunter has been identified as a pilot for the new “Joint Organisations of Councils”. Hunter Councils scores well against the criteria listed within Box 29: Factors in Defining Regions (ILGRP report, p81) and Newcastle scores well against the criteria listed within Box 32: Key Attributes of a Regional Centre (ILGRP report, p85). This is a superior answer to the Hunter’s future than the administratively costly and politically divisive approach of merging councils that have the capacity to become financially sustainable on their own. Indeed there is a poor fit between NCC and LMCC as demonstrated in Appendix D. Not only do the two councils have very different priorities (NCC focusing on renewing its historic CBD and LMCC on developing green-field housing estates), but Lake Macquarie as a large body of water would complicate the administration of the combined municipalities whose area would be almost as large as greater metropolitan Sydney. Since LMCC objects to a merger and NCC has the population scale and strategic capacity to successfully operate on a stand-alone basis and has resolved to submit a FFTF Template 2 (improvement program) format.
1.2 Scale & capacity
NCC already has the municipal population scale and organisational strategic capacity to be FFTF.

6
Operating Scale
In terms of scale, the Local Government Review Panel recommended that NCC amalgamate with Lake Macquarie to form a new council with a projected population of around 390,000 in 2031. The Panel noted that NCC faces significant challenges including forecast operating deficits, large capital works requirements and demanding issues associated with urban renewal. This submission outlines the positive plans of Council to address these fundamental issues and the progress already made. Central to the proposal for the amalgamation was the Panel view that Council’s “southern suburbs merge seamlessly into the Lake Macquarie area to form a single metropolis that needs to be planned and managed as an integrated whole.” LMCC has advised NCC that it does not support the merger recommendation of the Panel. Also, a high level assessment by NCC indicated that there would be only limited economies of scale from any merger and that these were likely to be outweighed by the associated integration costs.
The Panel noted that a merged Council would have a projected population of around 390,000 in 2031. On a stand-alone basis, NCC is projected to have a population of 192,500 by that date. To the extent that more than a doubling of population was considered necessary by the Panel for attaining financial sustainability for NCC, academic research does not support this contention. Researchers both in Australia and abroad have found that larger councils do not exhibit lower unit costs of servicing than smaller ones.ii In fact the 2006 New South Wales Local Government Inquiryiii “found no conclusive evidence that mergers would reduce unit costs”. Another study found with NSW councils that “Increasing population yields a lower level of gross expenditure per capita, however, once this reaches a point between 31,500 and 100,000, increasing population size results in higher levels of gross expenditure per capita.”iv
The following chart prepared by Percy Allan & Associates shows that for NSW local councils with populations in excess of 100,000 residents there is no reduction in council expenditure per capita as council population size increases. If anything unit cost slightly increases with size. In other words becoming bigger does not improve operating cost efficiency. Instead any economies of scale are offset by diseconomies of scale.
Since NCC has a current population close to 163,000 it already exhibits optimal residency size with future population growth from either mergers or natural increases not likely to reduce unit costs further. Only concerted action by NCC, whatever its size, will make it more cost efficient, service effective and community responsive.

7
NCC contends that the best measure of a council’s scale is its total ordinary revenue, not its population. In 2012/13, NCC ranked sixth in NSW on this metric. Council also ranked highly on other metrics such as the number of residential assessments. Along with its existing and projected population NCC, has more than sufficient scale to successfully operate as a stand-alone entity.
Council Per Capita Expense versus Population Size, 2012-13
Source: DLG, Comparative Information on NSW Councils
R² = 0.0102
0
500
1,000
1,500
2,000
2,500
3,000
0 100 200 300 400
Tota
l Exp
ense
s pe
r Res
iden
t ($)
Population Size (thousands of persons)
NSW councils with populations above 100,000

8
Strategic Capacity NCC has the organisational scale and skills to exhibit strategic capacity.
More robust revenue base and increased discretionary spending Council’s robust revenue base gives it the capacity to increase discretionary spending. In 2013/14, Council had total operating revenue of $223.8m, of which $193.7m (86.6%) was classified as own-source revenue. As seen in the following chart, Council’s revenue mix is relatively diverse with strong income from commercial activities and the utilisation of Council assets. Further, 40% of rate income is generated from business as opposed to residential ratepayers.
44%
2%
10%
28%
16%
Council Revenue Mix FY14 (%)
Rates 2012 SRV Annual Charges User Charges & Fees Other Revenue

9
Scope to undertake new functions and major projects
NCC operates on a much larger scale than surrounding councils. Council’s strong revenue base is allowing it to invest heavily in capital projects over the medium term to address a large backlog in maintenance and renewals of assets. Council had total capital outlays of $25.3m in 2012/13, which rose to $43.6m in 2013/14; a 72% increase. Council’s Long Term Financial Plan (LTFP) demonstrates its capacity to further increase this to $71.7m in 2015/16 and thereafter lift it to over $80m per annum in the final years of Council’s LTFP. This will diminish Council’s worn out assets to an acceptable level. Council’s strong revenue base coupled with its improving operating position provides it with the financial capacity to undertake new functions and invest in major projects without having to look to resources of neighbouring councils.
Council has a strong professional base providing the strategic and operational capacity to undertake new functions and manage major projects as part of the Newcastle 2030 Community Strategic Plan. Council’s Workforce Management Plan supports this by attracting and retaining talent, investing in the capability of staff, planning Council’s future needs and facilitating a culture of cooperation, respect and wellbeing. Ability to employ wider range of skilled staff
The current organisational structure appears in Appendix A. There are 16 business units across three groups; Planning & Regulatory, Corporate Services and Infrastructure. Over the past 18 months significant changes have been made to the organisational structure through a review of service delivery mechanisms and a re-engineering of work processes. As noted above, Council has a strong professional base providing a wide skills base for Council to draw upon. NCC benefits from being a regional city when attracting skilled staff to employ. As a regional city, Council benefits from an educated workforce, lower cost of housing, greater employment opportunities for spouses and well regarded health and education facilities. Knowledge, creativity and innovation
NCC already has the professional capacity to manage complex change occurring across its region as its economy becomes more sophisticated and its residents become more interconnected through better transport and telecommunication networks. Council recognises that residents in the region from Gosford, across to Muswellbrook and up to Forster will increasingly look to Newcastle to provide the same commercial and public services as Sydney. Council has developed the professional skills to build a multi-purpose Central Business District (CBD) where people can live close to their jobs, shops, recreation and entertainment facilities so as to keep traffic congestion low and social and economic interconnectivity
10
high so as to maximise city productivity and liveability. Such professional skills are very different to those required for planning and developing mainly low rise suburban residential suburbs and shopping centres, which is the case for local government areas surrounding the Newcastle Local Government Area (LGA) including Lake Macquarie.
Advanced skills in strategic planning and policy development
Primary responsibility for strategic thinking, planning and policy making falls to the specialist business units of Strategic Planning and Infrastructure Planning. However, strategic policy skills also sit in Corporate Finance, Human Resources, Commercial Property and Customer Service within the Corporate Services Directorate and in Facilities and Recreation within the Infrastructure Directorate. See Council’s organisation chart below which circles areas with strong strategic capacity in addition to those of the General Manager. Appendix B provides NCC’s core strategic planning staff numbers.

11
12
Council’s advanced skills in this area are best evidenced by the Asian Cup which required significant planning and had a significant regional impact. The Asian Football Confederation said Newcastle was the friendliest, most engaged and best organised host city, while Newcastle's No. 2 Sportsground was voted the competition's best pitch. (Newcastle Herald March 13, 2015). Effective regional collaboration
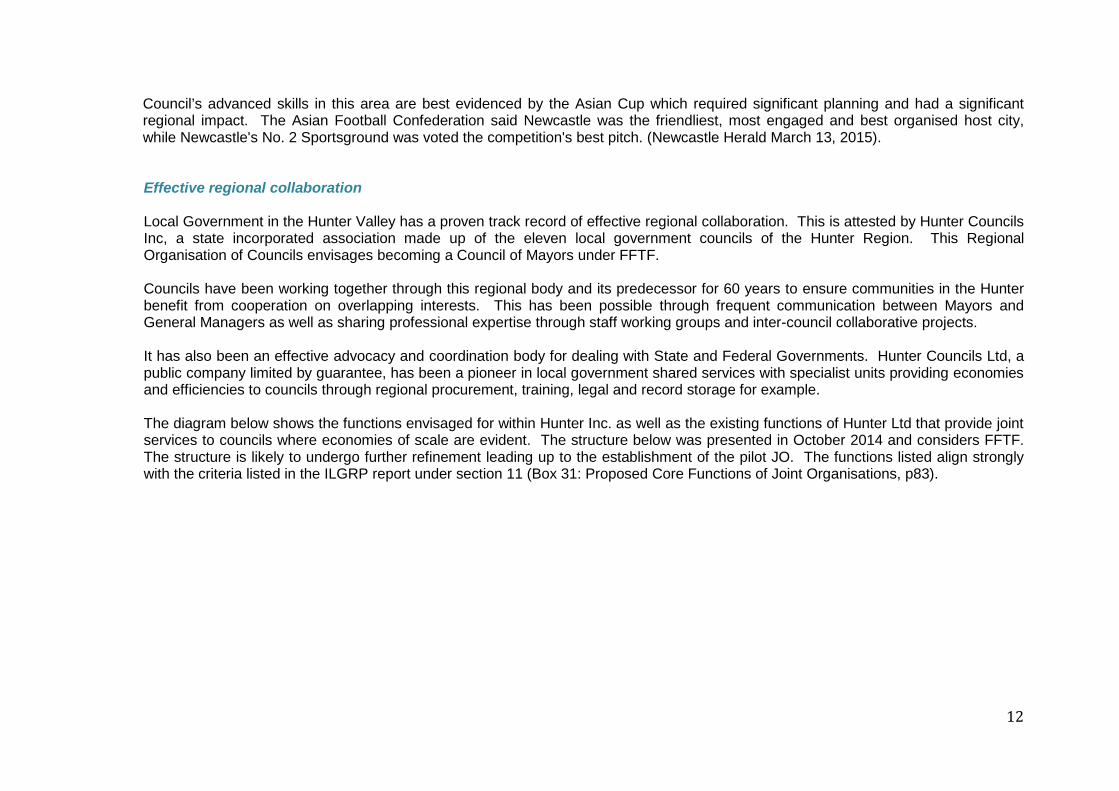
Local Government in the Hunter Valley has a proven track record of effective regional collaboration. This is attested by Hunter Councils Inc, a state incorporated association made up of the eleven local government councils of the Hunter Region. This Regional Organisation of Councils envisages becoming a Council of Mayors under FFTF. Councils have been working together through this regional body and its predecessor for 60 years to ensure communities in the Hunter benefit from cooperation on overlapping interests. This has been possible through frequent communication between Mayors and General Managers as well as sharing professional expertise through staff working groups and inter-council collaborative projects. It has also been an effective advocacy and coordination body for dealing with State and Federal Governments. Hunter Councils Ltd, a public company limited by guarantee, has been a pioneer in local government shared services with specialist units providing economies and efficiencies to councils through regional procurement, training, legal and record storage for example. The diagram below shows the functions envisaged for within Hunter Inc. as well as the existing functions of Hunter Ltd that provide joint services to councils where economies of scale are evident. The structure below was presented in October 2014 and considers FFTF. The structure is likely to undergo further refinement leading up to the establishment of the pilot JO. The functions listed align strongly with the criteria listed in the ILGRP report under section 11 (Box 31: Proposed Core Functions of Joint Organisations, p83).

13
Source: Leaders in Local Government Resource Sharing, Roger Stephan, CEO, Hunter Councils Inc (Oct 2014) Credibility for more effective advocacy
NCC is already an organisation of significant size and scope with a proven track record of representing the interests of Newcastle with government and other third party agencies. NCC developed an Alcohol Management Strategy for The City of Newcastle 2010 – 2013 (a leader in this regard amongst councils) and was a strong advocate and partner for what became known as the “The Newcastle Solution” lock out laws. Working with NSW Police, and the Office of Liquor, Gaming and Racing, Council developed the ‘Newcastle Solution’ in dealing with alcohol related violence surrounding licensed venues. This approach was later adopted with success in the Sydney Kings Cross area. As noted above, Hunter Councils Ltd already provides a credible and influential vehicle for promoting the interests of the Hunter region as a whole at both State and Federal levels.
14
Capable partner for State and Federal Agencies
NCC has a proven partnership with both State and Federal agencies for the successful delivery of capital projects and other social and economic development projects. The “Newcastle Solution” as noted involved significant partnering. Another example is the urban renewal of Newcastle. This is seen as a crucial initiative for the Hunter Region and reflected across State Government planning documents as a priority. NCC engaged with Hunter Development Corporation (HDC) is the successful redevelopment of the Honeysuckle precinct. NCC is now actively engaged with Urban Growth and HDC in the revitalisation of Newcastle’s CBD and surrounds. Council is a service provider to Roads and Maritime Services undertaking approximately $8m of road maintenance and construction works per annum. Federally, the City has successfully managed the Building Better Cities funding program for the past ten years to deliver additional affordable housing in Newcastle. Resources to cope with complex and unexpected change
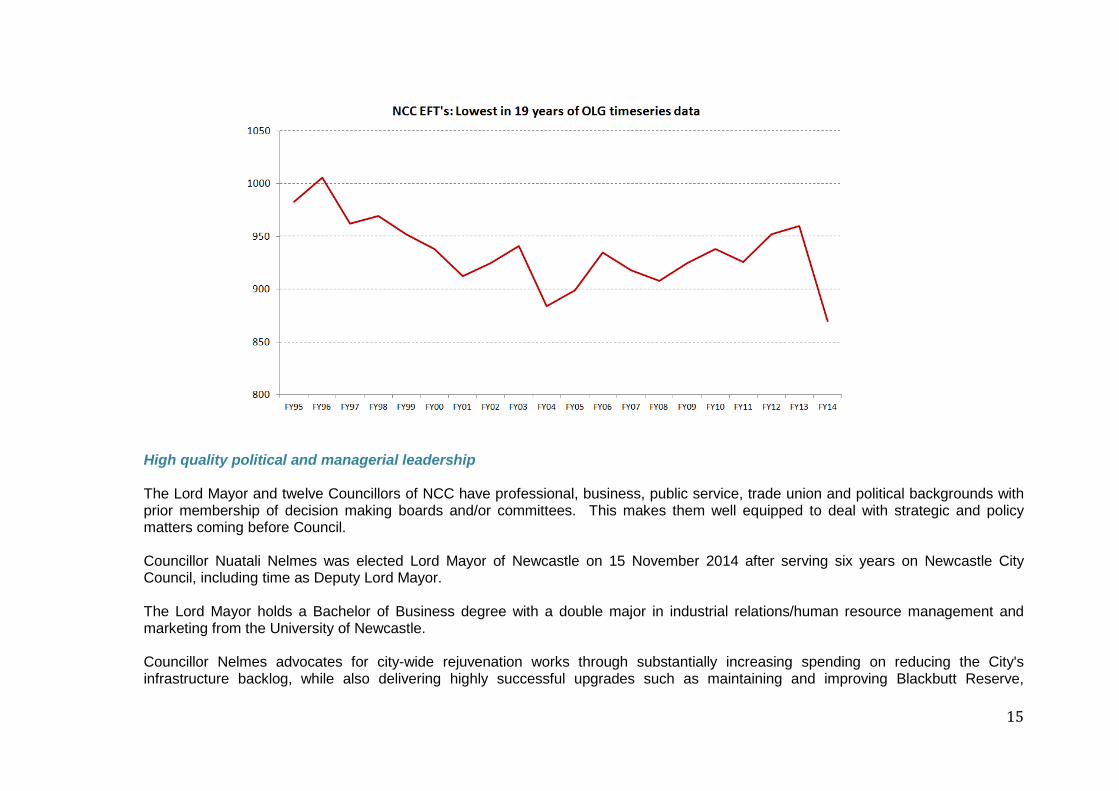
Council has successfully managed the transition of Newcastle from a city based on heavy industry, to a plural economy with a strong services sector presence. This has involved significant economic, social, environmental and urban planning change management on the part of Council to ensure a vibrant future for the City. NCC’s highly experienced management team includes resources with specialist skills in change management. For example, NCC has been successful in coordinating successful response to two major storm events (in 2007 and 2015) and the aftermath. NCC has also undertaken a substantial organisation restructure which was completed whilst maintaining all but a limited number of service levels to the community. Staffing levels (EFT) are now the lowest since the OLG comparative data became available whilst population has grown by over 15% in the same period (source: OLG comparative data). Such an outcome has required considerable change in how Council delivers services.
15
High quality political and managerial leadership The Lord Mayor and twelve Councillors of NCC have professional, business, public service, trade union and political backgrounds with prior membership of decision making boards and/or committees. This makes them well equipped to deal with strategic and policy matters coming before Council. Councillor Nuatali Nelmes was elected Lord Mayor of Newcastle on 15 November 2014 after serving six years on Newcastle City Council, including time as Deputy Lord Mayor. The Lord Mayor holds a Bachelor of Business degree with a double major in industrial relations/human resource management and marketing from the University of Newcastle. Councillor Nelmes advocates for city-wide rejuvenation works through substantially increasing spending on reducing the City's infrastructure backlog, while also delivering highly successful upgrades such as maintaining and improving Blackbutt Reserve,

16
revitalising Newcastle's iconic coastline, renewing Hunter Street and delivering a connected network of cycleways across the City and suburbs. NCC is led by an experienced team of highly skilled executives with diverse professional backgrounds. Council’s General Manager Ken Gouldthorp has extensive experience in executive positions within government and private sectors including financial and commercial management. Mr Gouldthorp has extensive local government experience including as a former Chief Executive Officer of both the Toowoomba Regional Council and Mackay Council Council’s Infrastructure Group is led by Frank Cordingley, an engineer with 35 years experience including senior management roles across public and private sectors. Peter Chrystal leads the Planning and Regulatory Group and brings to Council 19 years experience in local government across environment, business development, compliance, policy and planning, building and general management. Council’s Corporate Services Group is led by Glen Cousins, a chartered accountant with 30 years experience in financial and commercial functions for privately owned and publicly listed national companies. Over the past two years Councils has undergone an organisational restructure and the establishment of a new leadership team. There was significant competition for each of the management positions and the successful candidates reflect significant experience often in organisations of greater scale than Council. Many managers have experience across different sectors. This includes experience in senior corporate roles. A detailed overview of Council’s senior management team and its capabilities is outlined in Appendix A. Business Case Assessment For Council’s business case assessment of NCC being amalgamated with LMCC versus remaining a standalone council see Appendix F. Appendix G provides a detailed comparison. The conclusion of this assessment is that a merger would have considerable costs and adverse impacts and not generate significant benefits in terms of scale and capacity or other criteria. Hence the standalone option is superior to the ILGRP recommendation. Based on the assessment an amalgamation might impede rather than aid Newcastle’s strategic capacity. NCC has a crucial role as the Regional Capital for the Hunter and this role needs to grow as the Hunter region grows economically and certain Hunter LGA’s support significant population growth.
17
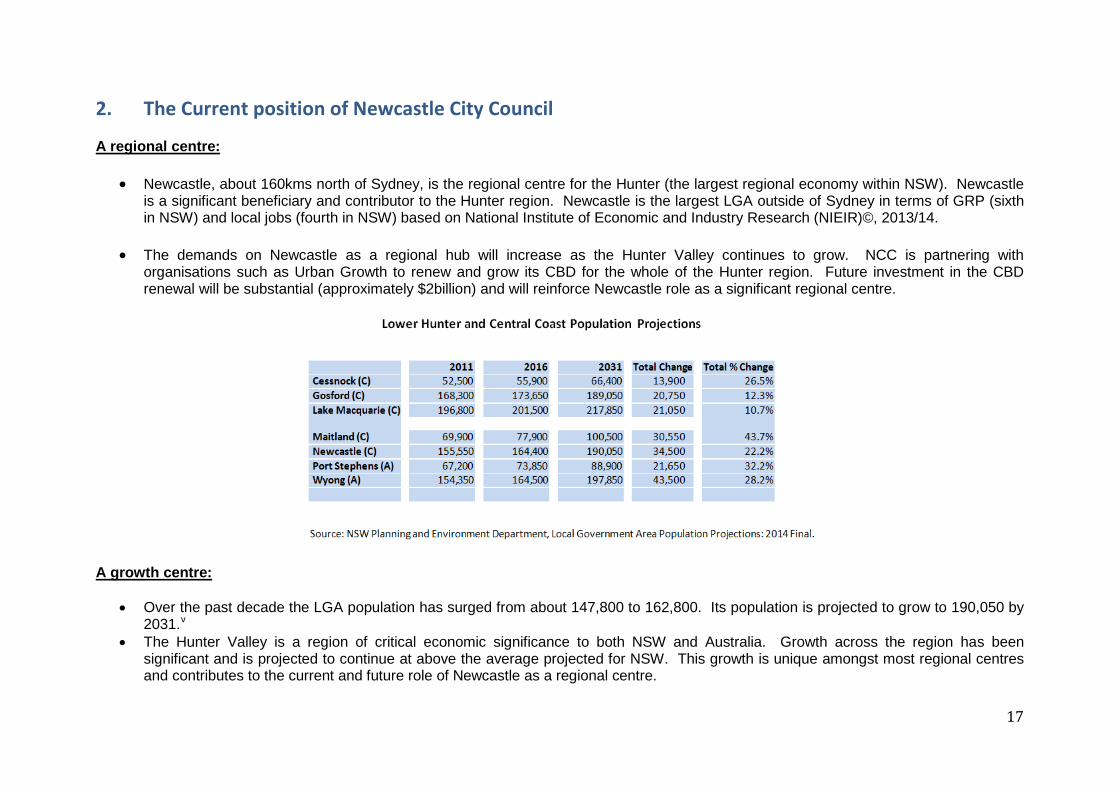
2. The Current position of Newcastle City Council A regional centre:
• Newcastle, about 160kms north of Sydney, is the regional centre for the Hunter (the largest regional economy within NSW). Newcastle
is a significant beneficiary and contributor to the Hunter region. Newcastle is the largest LGA outside of Sydney in terms of GRP (sixth in NSW) and local jobs (fourth in NSW) based on National Institute of Economic and Industry Research (NIEIR)©, 2013/14.
• The demands on Newcastle as a regional hub will increase as the Hunter Valley continues to grow. NCC is partnering with
organisations such as Urban Growth to renew and grow its CBD for the whole of the Hunter region. Future investment in the CBD renewal will be substantial (approximately $2billion) and will reinforce Newcastle role as a significant regional centre.
A growth centre:
• Over the past decade the LGA population has surged from about 147,800 to 162,800. Its population is projected to grow to 190,050 by
2031.v • The Hunter Valley is a region of critical economic significance to both NSW and Australia. Growth across the region has been
significant and is projected to continue at above the average projected for NSW. This growth is unique amongst most regional centres and contributes to the current and future role of Newcastle as a regional centre.

18
• Newcastle is a proud and plural community that has coped with earthquakes, floods and industrial restructuring, but continues to flourish
and evolve. NCC and the community have a track record of effectively addressing challenging and complex events including natural disasters.
• The City has undergone a major transformation over the last two decades, with the expansion of health, higher education, research centres, defence industries and professional and technical services as major sources of employment. The transformation continues and includes:
o The expansion of the regional airport to support international flights (owned and operated as a JV with Port Stephens). o The largest regional training organisation in Australia (Hunter TAFE). o A new inner city campus for the University of Newcastle (the University has 36,000 enrolments). o The $94m Newcastle courthouse redevelopment will provide the largest and most technologically advanced NSW court complex
outside of Sydney o Important and expanding defence facilities (nearly $1billion in development related to F35 strike fighter). This impacts both Port
Stephens and Newcastle. o Regional medical services (Hunter New England Health services 25 LGA’s and over 1,200 clinical and biomedical researchers
and staff working at the Hunter Medical Research Institute). The John Hunter is the busiest trauma centre in NSW, the only major trauma centre outside metropolitan Sydney and the only combined adult and pediatric trauma centre in the state.
o A significant and expanding visitor economy (Newcastle attracted 3.6m visitors in 2012). A significant contributor to the vibrant Hunter Valley visitor economy.
These industries combine with traditional energy and engineering sectors to make Newcastle a recognised commercial and human services hub for the Hunter Region.
• Newcastle has the economic, transport, political and administrative characteristics typical of a regional centre and consequently is
significantly different from surrounding LGAs. For example, Newcastle:
1. Has a self-contained CBD with sufficient underutilised land space to accommodate future adaptive reuse or re-development for offices, shops, light industry, entertainment complexes and apartments. LMCC is largely a residential area of green-field estates, comprised of 90 separate communities.
2. Has largely self-contained local roads. 3. Is transitioning from a heavy industry city to a modern services-based CBD through urban renewal initiatives whereas LMCC is
accommodating residential growth through broad-acre housing estates. The government has committed $460m to the revitalisation

19
of Newcastle’s CBD and this revitalisation is prominent in all relevant NSW planning documents. Newcastle revitalisation is one of only two Urban Renewal SEPP’s documented by Dept of Planning and Environment.
• Newcastle covers around 30% of the Hunter’s developed industrial space and 80% of the office space.vi This contributes significantly to the estimated Gross Regional Product of $14.044 billon.vii
• The Port of Newcastle is Australia’s largest coal export outlet by volume and a growing multi-purpose cargo hub. In 2012/13 it handled
150 million tonnes of bulk cargo, worth $19 billion.
A social centre
• Newcastle has a vibrant performing and visual arts scene home to the Newcastle Art Gallery, Conservatorium of Music, Civic Theatre
and Playhouse and Newcastle Museum. It also attracts major national and international sports events. Newcastle was named a World Festival and Event City by the International Festival and Events Association in 2012 and 2014.
• Newcastle is home to the Newcastle Knights Rugby League and Newcastle Jets Football Club. Other major sports include surfing,
netball, basketball, soccer, AFL, rugby union and hockey.
• The City’s credentials and future potential have attracted funding from Federal and State Governments through investments in infrastructure such as the Hunter Expressway, the Newcastle Inner City Bypass, Intertrade Industrial Park, Newcastle Courthouse complex and the Hunter Medical Research Institute.
• Newcastle Airport and surrounding facilities continue to expand to cater for predicted domestic and international aviation growth.
• Newcastle 2030 Community Strategic Plan is Council's key driving strategic document that outlines the shared community vision to be a “Smart, Liveable and Sustainable City”.
Note that Appendix E provides a more detailed profile of Newcastle as a City.

20
2.2 Key challenges and opportunities
Strengths Weaknesses • A refocused Council better aligned to the delivery of the City’s
strategic plan following a major restructure of the organisation over the last two years;
• Demonstrated capacity to make tough decisions to materially improve its financial position and achieve financial sustainability through the implementation of the City’s “Road to Recovery” strategies;
• Strong own-source operating revenue including strong commercial revenue generating opportunities;
• Good liquidity and debt servicing capacity - the City’s strong reserves will provide funding to help overcome the excessive infrastructure backlog;
• Diverse and experienced management team harnessing both government and corporate experience;
• The State Government’s $460m capital expenditure on revitalising Newcastle's CBD, including the provision of light rail, is expected to be a major boost to retail activity and tourism;
• A large Council by both Australian and International standards with a significant base of both residential and business ratepayers;
• Hosts significant regional infrastructure including Newcastle Port, a waste management facility (2nd largest in NSW) and regional civic facilities;
• Newcastle Airport, a significant strategic asset owned and operated in a JV with PSC;
• Demonstrated ability to deliver large scale events as proven by the recent Asian Football Cup; and
• An engaged local community. Examples include the active role played by Newcastle Voice (a community reference group of 2,700 residents and businesses from both Newcastle and surrounding LGA's) in developing Council’s strategic direction.
• Issues arising from a previous lack of financial discipline impacting on operating performance and a substantial infrastructure backlog;
• Ageing infrastructure; • Constraints and additional costs associated with urban
development on land impacted by prior mining activity; • Challenging industrial relations environment; and • Council costs are not competitive in some areas with
commercial organisations.

21
Opportunities Threats • Implementation of Council’s community strategic plan,
Newcastle 2030, leading to the revitalisation of the city centre, coastal revitalisation, Blackbutt Reserve and development of cycle-ways;
• Leverage regional role via regional infrastructure and central location including expanding and broadening use of port facilities and expanding the airport to support international travel;
• Further improve returns from commercial facilities. This includes an upgrade of the Summerhill Waste Management Centre to support a wider geographic area, outside of the immediate LGA;
• Integrated tourism opportunities; • Well planned urban renewal corridors providing opportunities for
economic growth alongside housing renewal and intensification; and
• Strong regional economic outlook, with the industrial sector continuing to play an important role alongside a substantial and growing part of the economy now based around services, especially health and education.
• A growing and ageing population will put pressure on Council resources (through increased use of community amenities) and reduce rating capacity (through increased pensioner rate rebates). Those aged over 65 expected to increase by 26.6% between 2011 and 2021 while under 15 year olds are projected to increase by only 6.2%. viii;
• Changing environment as increasing residential and commercial development places pressures on bushland, waterways and coastline;
• Economic impact of reduced coal mining investment and income on broader Hunter economy;
• Potential for lack of future alignment between the strategic objectives of NCC and the Port Authority of NSW for the redevelopment and future direction of the Newcastle port;
• Possible development inertia resulting from divergent and strongly held views on the direction that Newcastle’s revitalisation should take;
• Cost pressures on Council’s waste management operations due to tighter Environmental Protection Agency requirements; and
• Airport use constrained by other site requirements and legislation.
22
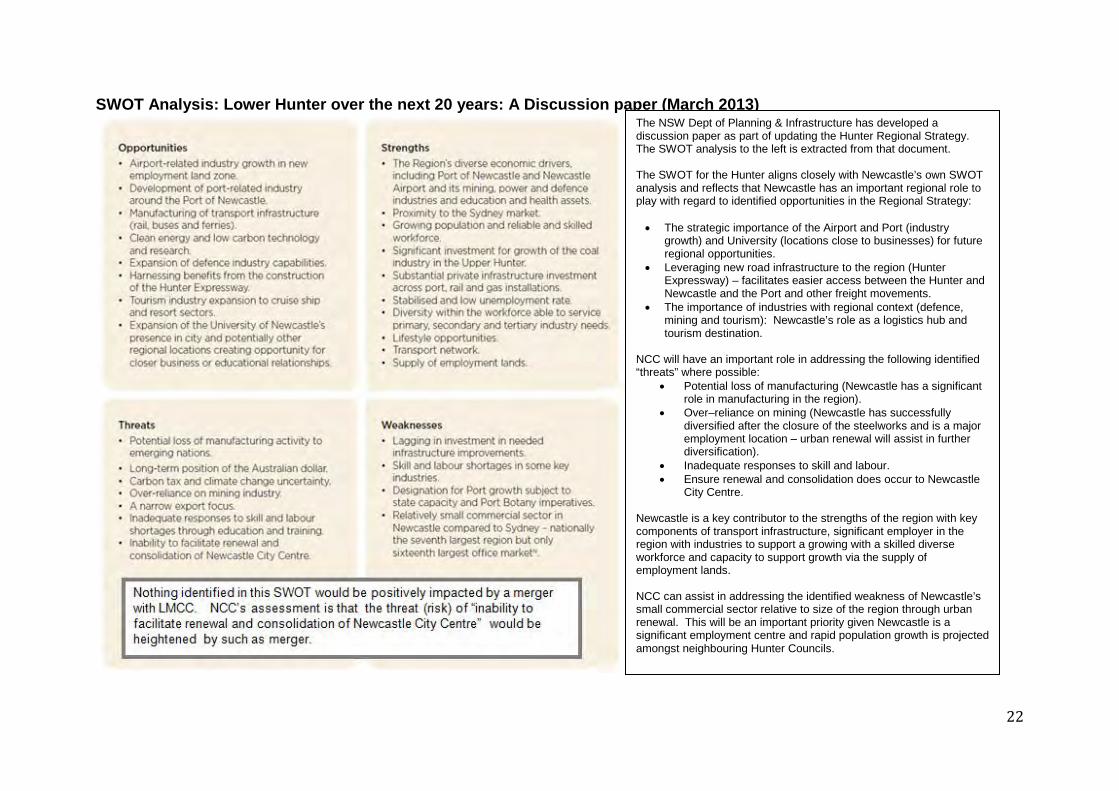
SWOT Analysis: Lower Hunter over the next 20 years: A Discussion paper (March 2013) The NSW Dept of Planning & Infrastructure has developed a discussion paper as part of updating the Hunter Regional Strategy. The SWOT analysis to the left is extracted from that document. The SWOT for the Hunter aligns closely with Newcastle’s own SWOT analysis and reflects that Newcastle has an important regional role to play with regard to identified opportunities in the Regional Strategy: • The strategic importance of the Airport and Port (industry
growth) and University (locations close to businesses) for future regional opportunities.
• Leveraging new road infrastructure to the region (Hunter Expressway) – facilitates easier access between the Hunter and Newcastle and the Port and other freight movements.
• The importance of industries with regional context (defence, mining and tourism): Newcastle’s role as a logistics hub and tourism destination.
NCC will have an important role in addressing the following identified “threats” where possible:
• Potential loss of manufacturing (Newcastle has a significant role in manufacturing in the region).
• Over–reliance on mining (Newcastle has successfully diversified after the closure of the steelworks and is a major employment location – urban renewal will assist in further diversification).
• Inadequate responses to skill and labour. • Ensure renewal and consolidation does occur to Newcastle
City Centre. Newcastle is a key contributor to the strengths of the region with key components of transport infrastructure, significant employer in the region with industries to support a growing with a skilled diverse workforce and capacity to support growth via the supply of employment lands. NCC can assist in addressing the identified weakness of Newcastle’s small commercial sector relative to size of the region through urban renewal. This will be an important priority given Newcastle is a significant employment centre and rapid population growth is projected amongst neighbouring Hunter Councils.

23
2.3 Performance against the Fit for the Future benchmarks
Road to Recovery Strategy Prior to the State Government’s announcement of “Fit for the Future”, NCC through its “Road to Recovery” strategy had already taken decisive action to achieve financial sustainability. This included both expenditure reduction and revenue improvement measures. “Road to Recovery” commenced in 2012/13 and focused on reversing Council’s operating deficit and constraining its capital expenditure to shore up solvency with an initial focus on improving revenues from commercial operations and reducing operating expenditure via a rapid and significant organisational restructure.
Only once these initiatives were completed did Council seek its first ever multi-year Special Rate Variation (SRV). The SRV will enable Council to not only uphold the current rate of capital spending, but also to increase expenditure to achieve FFTF infrastructure benchmarks within the required timelines. Council was granted its SRV application in full (8% per annum over five years) by IPART, increasing Council’s revenue by 46.9% over the five years to 2019/20 (annual increases of between $8.5m and $11.7m over the five years). The combination of internal measures and the SRV will produce lasting operating surpluses from 2017/18. Council now has the financial capacity to undertake all projected expenditure required to be sustainable. An expanded capital works program is currently underway to address the backlog of building and infrastructure assets. Sustainable levels of asset maintenance and renewals are also now fully funded. This will see both the Asset Renewal and Maintenance Ratios achieve FFTF benchmarks by 2016/17. With an infrastructure maintenance and renewal backlog of $90.4m, Council needs (before the FFTF improvement program) to significantly exceed its normal annual maintenance and renewals expenditure for the next seven years to reduce the backlog to an acceptable level. If the backlog is calculated using asset replacement cost only four years is required to exceed the 2% target. The additional operational expenditure required to support this will constrain Council’s operating result during this period however Council will still achieve an operating surplus from 2017/18 onwards and will maintain a strong cash position. Without its “Road to Recovery” strategy or FFTF Improvement Initiatives NCC would have met only three of the seven FFTF benchmarks (namely own source revenue, debt service and real expenditure constraint). By 2016/17 it would have achieved four benchmarks (with asset maintenance passing muster, close to achieving the operating performance and building and infrastructure renewal benchmarks. The backlog ratio however requires the most focus and the strategy (and funding) has been heavily documented as part of Council’s SRV application. That is illustrated by the following tables. (Technical Note: NCC believes that the Building and Infrastructure Backlog Ratio, as defined by the Guidance Material on FFTF, erroneously overstates the extent of a Council’s infrastructure backlog ratio by expressing the current replacement cost of the asset

24
renewals’ backlog as a percentage of the depreciated historical value of the buildings and infrastructure asset stock. This view is supported by a number of independent experts including Percy Allan & Associates Pty Ltd, which specialises in local government financial sustainability analysis. According to Percy Allan & Associates the correct formula is the estimated cost to bring assets to a satisfactory condition divided by the current replacement cost of the total asset stock so that both the numerator and denominator of the ratio measure assets in terms of current replacement value. As a result NCC has provided both measures in its submission tables.)
25
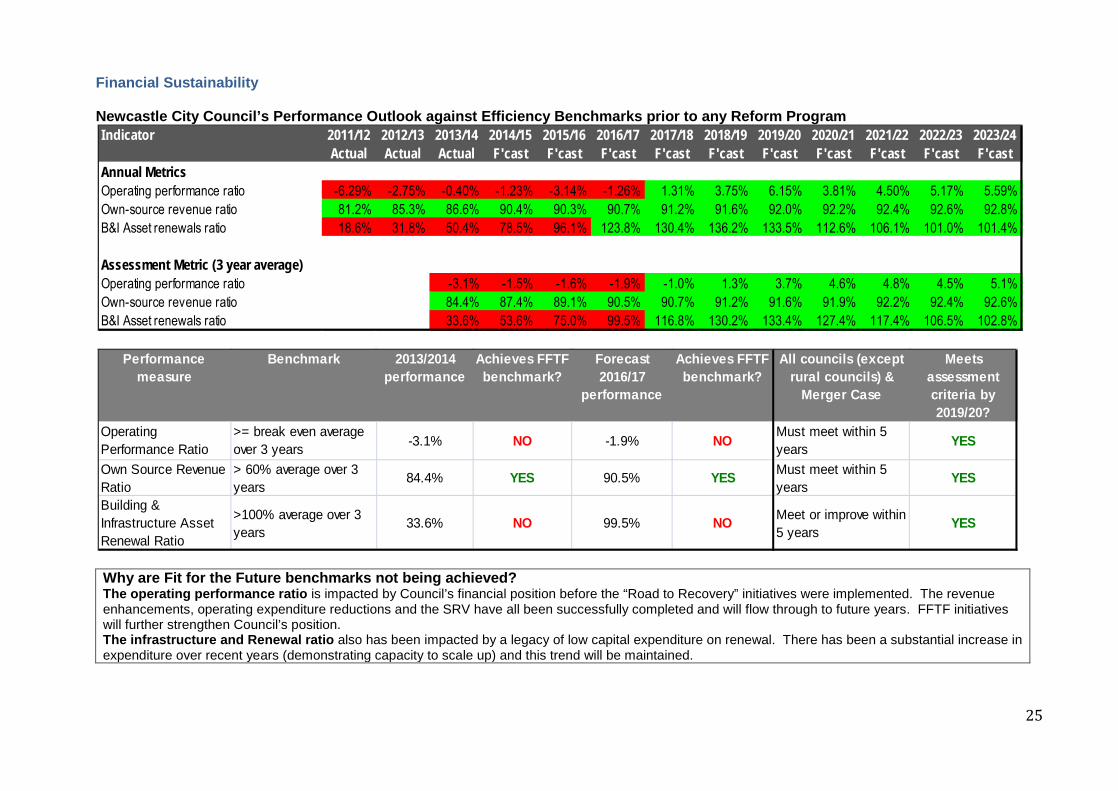
Financial Sustainability Newcastle City Council’s Performance Outlook against Efficiency Benchmarks prior to any Reform Program
Why are Fit for the Future benchmarks not being achieved? The operating performance ratio is impacted by Council’s financial position before the “Road to Recovery” initiatives were implemented. The revenue enhancements, operating expenditure reductions and the SRV have all been successfully completed and will flow through to future years. FFTF initiatives will further strengthen Council’s position. The infrastructure and Renewal ratio also has been impacted by a legacy of low capital expenditure on renewal. There has been a substantial increase in expenditure over recent years (demonstrating capacity to scale up) and this trend will be maintained.
Indicator 2011/12 2012/13 2013/14Actual Actual Actual
Annual MetricsOperating performance ratio -6.29% -2.75% -0.40% -1.23% -3.14% -1.26% 1.31% 3.75% 6.15% 3.81% 4.50% 5.17% 5.59%Own-source revenue ratio 81.2% 85.3% 86.6% 90.4% 90.3% 90.7% 91.2% 91.6% 92.0% 92.2% 92.4% 92.6% 92.8%B&I Asset renewals ratio 18.6% 31.8% 50.4% 78.5% 96.1% 123.8% 130.4% 136.2% 133.5% 112.6% 106.1% 101.0% 101.4%
Assessment Metric (3 year average)Operating performance ratio -3.1% -1.5% -1.6% -1.9% -1.0% 1.3% 3.7% 4.6% 4.8% 4.5% 5.1%Own-source revenue ratio 84.4% 87.4% 89.1% 90.5% 90.7% 91.2% 91.6% 91.9% 92.2% 92.4% 92.6%B&I Asset renewals ratio 33.6% 53.6% 75.0% 99.5% 116.8% 130.2% 133.4% 127.4% 117.4% 106.5% 102.8%
2014/15 F'cast
2015/16 F'cast
2016/17 F'cast
2017/18 F'cast
2018/19 F'cast
2019/20 F'cast
2020/21 F'cast
2021/22 F'cast
2022/23 F'cast
2023/24 F'cast
Performance measure
Benchmark 2013/2014 performance
Achieves FFTF benchmark?
Forecast 2016/17
performance
Achieves FFTF benchmark?
All councils (except rural councils) &
Merger Case
Meets assessment criteria by 2019/20?
Operating Performance Ratio
>= break even average over 3 years -3.1% NO -1.9% NO Must meet within 5
years YES
Own Source Revenue Ratio
> 60% average over 3 years
84.4% YES 90.5% YES Must meet within 5 years
YES
Building & Infrastructure Asset Renewal Ratio
>100% average over 3 years
33.6% NO 99.5% NO Meet or improve within 5 years
YES

26
Infrastructure and service management Newcastle City Council’s Performance Outlook against Efficiency Benchmarks prior to any Reform Program
Why are Fit for the Future benchmarks not being achieved? The infrastructure backlog was dominated by aging building assets which were not of satisfactory condition (unlike other councils which usually have a backlog primarily in roads). TCorp recommended NCC sell non-core assets (largely complete) to reduce the backlog. Both Asset Maintenance and renewal are priorities in Council’s LTFP and were the primary rationale for the successful SRV submission.
Indicator 2011/12 2012/13 2013/14Actual Actual Actual
Annual MetricsInfrastructure backlog ratio (FFFT) 9.00% 10.40% 9.99% 8.71% 7.17% 5.36% 3.60% 2.72% 2.09% 1.68% 1.24%Infrastructure backlog ratio (replacement value) 5.05% 5.23% 5.03% 4.38% 3.60% 2.70% 1.82% 1.38% 1.06% 0.84% 0.62%Asset maintenance ratio 59.9% 49.8% 84.6% 100.6% 100.5% 100.9% 101.3% 101.4% 107.4% 104.6% 104.8% 105.0% 105.1%Debt service ratio 2.82% 3.15% 5.13% 3.17% 2.89% 2.83% 2.75% 2.60% 2.46% 2.40% 2.33% 2.33% 1.76%
Assessment MetricInfrastructure backlog ratio (FFFT) 9.00% 10.40% 9.99% 8.71% 7.17% 5.36% 3.60% 2.72% 2.09% 1.68% 1.24%Infrastructure backlog ratio (replacement value) 5.05% 5.23% 5.03% 4.38% 3.60% 2.70% 1.82% 1.38% 1.06% 0.84% 0.62%Asset maintenance ratio (3 year average) 64.79% 78.36% 95.23% 100.64% 100.88% 101.18% 103.36% 104.46% 105.60% 104.80% 104.96%Debt service ratio (3 year average) 3.70% 3.82% 3.73% 2.96% 2.82% 2.73% 2.60% 2.49% 2.40% 2.36% 2.14%
2019/20 F'cast
2020/21 F'cast
2021/22 F'cast
2022/23 F'cast
2023/24 F'cast
2014/15 F'cast
2015/16 F'cast
2016/17 F'cast
2017/18 F'cast
2018/19 F'cast
Performance measure Benchmark 2013/2014 performance
Achieves FFTF benchmark?
Forecast 2016/17 performance
Achieves FFTF benchmark?
All councils (except rural councils) & Merger Case
Meets assessment criteria by 2019/20?
Infrastructure Backlog Ratio (FFTF)
< 2% 9.00% NO 8.71% NO Meet or improve/ inform within 5 years
YES
Infrastructure Backlog Ratio (replacement Value)
< 2% 5.05% NO 4.38% NO Meet or improve/ inform within 5 years
YES
Asset Maintenance Ratio > 100% average over 3 years
64.79% NO 100.64% YES Meet or improve/ inform within 5 years
YES
Debt Service Ratio 0 to 20% average over 3 years 3.70% YES 2.96% YES Meet within 5 years YES

27
Cost Efficiency Newcastle City Council’s Performance Outlook against Efficiency Benchmarks prior to any Reform Program
Why are Fit for the Future benchmarks not being achieved? Efficiency benchmark is being achieved. The benchmark is achieved despite Council increasing expenditure on asset maintenance and renewal and also increasing certain services and reinstating certain services (under the SRV application).
Indicator 2011/12 2012/13 2013/14Actual Actual Actual
Annual MetricsReal opex per capita index (FFTF data) 1.32 1.26 1.20 1.18 1.19 1.18 1.17 1.16 1.15 1.16 1.14 1.13 1.11
Assessment Metric (3 year average)Real opex per capita index (ABS & NSW Planning & Environment)
1.26 1.21 1.19 1.18 1.18 1.17 1.16 1.15 1.15 1.14 1.13
2014/15 F'cast
2015/16 F'cast
2016/17 F'cast
2017/18 F'cast
2018/19 F'cast
2019/20 F'cast
2020/21 F'cast
2021/22 F'cast
2022/23 F'cast
2023/24 F'cast
Performance Measure & Benchmark
All councils (except rural councils)
2013/2014 performance
Achieves FFTF benchmark?
Forecast 2016/17 performance
Achieves FFTF benchmark?
Merger case Meets assessment criteria by 2019/20?
A decrease in Real Operating Expenditure per capita over time
Must demonstrate operational savings (net of IPR supported service improvements) over 5 years
1.26 YES 1.18 YES
Demonstrate operational savings (net of IPR supported service improvements) over 5 years but may not be practical in short term
YES

28
3. Becoming Fit for the Future As noted earlier the combination of initiatives already undertaken under “Road to Recovery (including the SRV) has resulted in a substantial difference from the TCorp assessment (Appendix C captures both current progress and projections as a comparison). The “Fit for the Future” Improvement Initiatives detailed below are in addition to the revenue enhancement strategies already in place. The FFTF Improvement Initiatives will achieve significant benefits by 2017/18 (and continue for the full three year projection to 2019/20). By 2017/18 the initiatives are projected to generate an annual improvement of $5.4m in the operating position (a combination of improved revenue and reduced operating expenditure) and annual efficiencies in capital works programs of $1.8m. These benefits will enable Council to accelerate its rehabilitation spending to overcome the City’s significant infrastructure backlog. On the operating side, the focus of the FFTF Improvement Initiatives is on improving investment returns on the reserve funds of Council and on increasing external grant and sponsorship funding for strategic priorities. Council will also explore partially divesting its interest in Newcastle Airport and further improving economic returns from other commercial activities. This will include expanding Summerhill Waste Management Centre to provide increased services to the broader Hunter region and beyond. On the infrastructure side, increased maintenance and rehabilitation spending will be on roads, footpaths, storm water assets, buildings and structures, natural resources and cultural assets. This program was a central component of the recent SRV application and has already been reviewed by IPART. Long term financial projections incorporating the impact of both FFTF Improvement Initiatives and “Road to Recovery” measures are included in Appendix C under the rubric of “Reform Program”. The projected results include the estimated establishment or capital costs of each initiative.
29
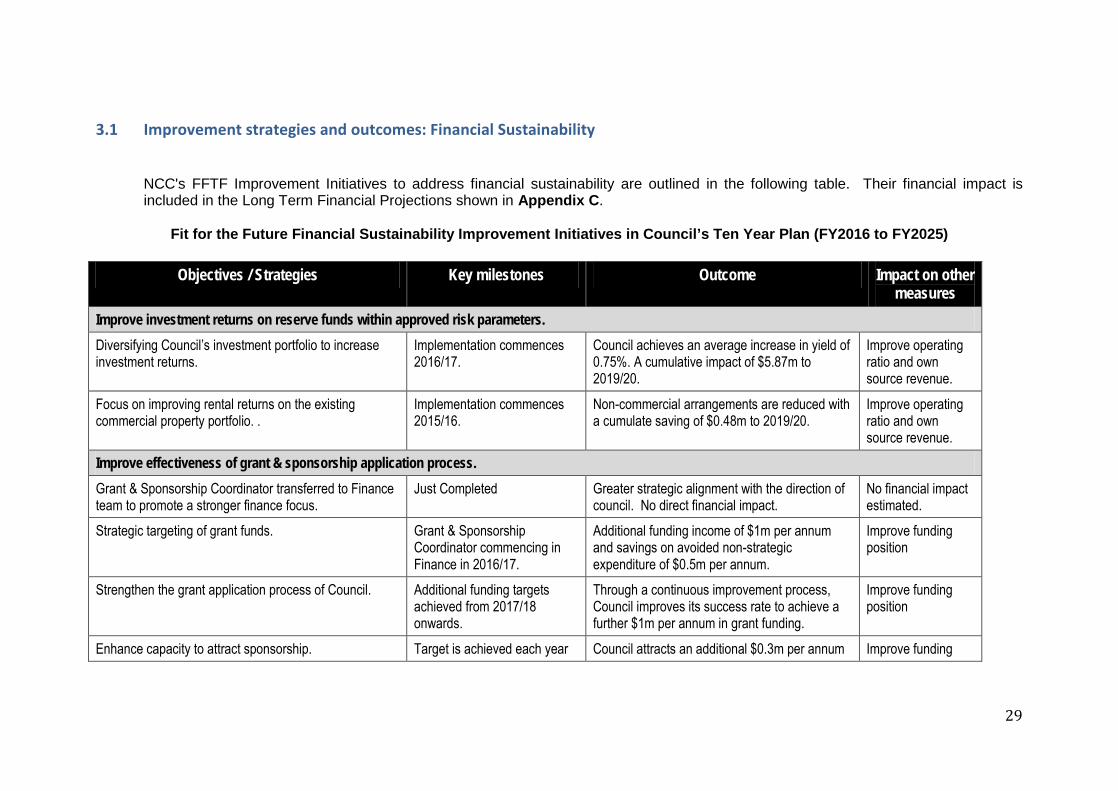
3.1 Improvement strategies and outcomes: Financial Sustainability
NCC's FFTF Improvement Initiatives to address financial sustainability are outlined in the following table. Their financial impact is included in the Long Term Financial Projections shown in Appendix C.
Fit for the Future Financial Sustainability Improvement Initiatives in Council’s Ten Year Plan (FY2016 to FY2025)
Objectives / Strategies Key milestones Outcome Impact on other
measures Improve investment returns on reserve funds within approved risk parameters. Diversifying Council’s investment portfolio to increase investment returns.
Implementation commences 2016/17.
Council achieves an average increase in yield of 0.75%. A cumulative impact of $5.87m to 2019/20.
Improve operating ratio and own source revenue.
Focus on improving rental returns on the existing commercial property portfolio. .
Implementation commences 2015/16.
Non-commercial arrangements are reduced with a cumulate saving of $0.48m to 2019/20.
Improve operating ratio and own source revenue.
Improve effectiveness of grant & sponsorship application process. Grant & Sponsorship Coordinator transferred to Finance team to promote a stronger finance focus.
Just Completed Greater strategic alignment with the direction of council. No direct financial impact.
No financial impact estimated.
Strategic targeting of grant funds.
Grant & Sponsorship Coordinator commencing in Finance in 2016/17.
Additional funding income of $1m per annum and savings on avoided non-strategic expenditure of $0.5m per annum.
Improve funding position
Strengthen the grant application process of Council.
Additional funding targets achieved from 2017/18 onwards.
Through a continuous improvement process, Council improves its success rate to achieve a further $1m per annum in grant funding.
Improve funding position
Enhance capacity to attract sponsorship. Target is achieved each year Council attracts an additional $0.3m per annum Improve funding

30
Objectives / Strategies Key milestones Outcome Impact on other measures
from 2015/16. in sponsorships. position Partial divestment and capital injection into Newcastle airport to maximise returns. Partial sale of Council’s stake in Newcastle Airport. Targeted for 2018/19. Partial sale to fund capital injection into airport
and a revised dividend policy resulting in increased distributions to council of at least $0.5m from 2018/19.
Improve operating ratio and own source revenue.
Coordinate sales and administration functions across Civic areas to improve revenue opportunities.
Implement in 2015/16. Revenue improves by a minimum of $0.1m per annum.
Improve operating ratio and own source revenue.
Expand the capacity of the Summerhill Waste Management Centre to generate higher net revenue.
Targeted for 2016/17. After a $2m capital injection, the facility produces an additional net benefit of $1mper annum (combination of higher revenue and lower costs (due to recycling reducing waste levy).
Improve operating ratio and own source revenue.
Provide organic processing services to other Councils who do not have organic processing capabilities.
Targeted for 2017/18, following expansion of Summerhill capacity.
Services are provided to Maitland and Singleton Council’s increasing regional cooperation.
No financial benefit reflected.
Upgrade the car park ticketing system.
Reprioritised and now completed.
A revenue benefit of $0.1m is achieved per annum from 2015/16.
Improve operating ratio and own source revenue.
Total Sustainability Initiatives $5.6m per annum Capital Costs (one off costs) $2.9m.

31
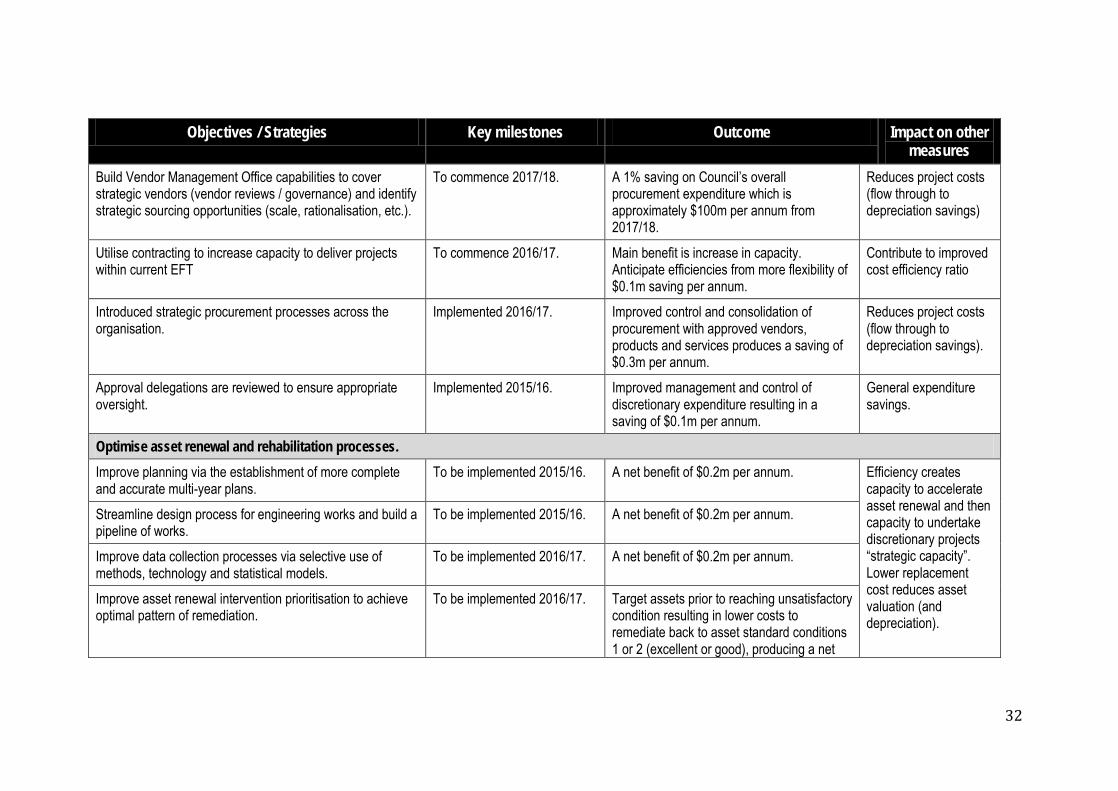
3.2 Improvement strategies and outcomes: Infrastructure & Service Management
As part of NCC's existing LTFP, Council already has a robust strategy in place to address the historical underinvestment in infrastructure maintenance and renewal that has led to a substantial backlog of dilapidated physical assets. As part of this strategy the Council has a program for selling redundant assets and applying the proceeds to rehabilitating buildings and infrastructure to overcome the backlog. This program is expected to realise $56.5m in asset sales for asset renewal over the ten years to 2025. The strategies developed as part of this FFTF Council Improvement Proposal, are focused on enhancing the project management capability of NCC to lift project delivery efficiency and strengthen the procurement practices of the organisation.
NCC's strategies to improve infrastructure and service management are outline in the following table. Their financial impact is included in the Long Term Financial Projections shown in Appendix C.
Fit for the Future Infrastructure and Service Management Improvement Initiatives in Council’s Ten Year Plan (FY2016 to FY2025)
Objectives / Strategies Key milestones Outcome Impact on other
measures Enhance project management capability to improve project delivery efficiency. Project management framework enhanced. To commence 2017/18. A1% efficiency saving together with
improved budgeting and resource allocation across all new works projects delivers a cumulative saving of $0.2m per annum over 7 years to 2025.
Initially will utilise efficiencies to accelerate asset renewal however ultimately increases capacity for discretionary projects “strategic capacity criteria”
Expansion of dedicated and specialist project management. To commence 2017/18. Enhance quality of contract drafting for outsourced projects. To commence 2017/18. Enhance governance arrangements for outsourced projects. To commence 2017/18. Optimise project performance through multi-year planning. To commence 2017/18. Leverage ERP to improve project management and generate project efficiencies.
To commence 2017/18.
Establish a Vendor Management Office and apply sourcing best practice.
32
Objectives / Strategies Key milestones Outcome Impact on other measures
Build Vendor Management Office capabilities to cover strategic vendors (vendor reviews / governance) and identify strategic sourcing opportunities (scale, rationalisation, etc.).
To commence 2017/18. A 1% saving on Council’s overall procurement expenditure which is approximately $100m per annum from 2017/18.
Reduces project costs (flow through to depreciation savings)
Utilise contracting to increase capacity to deliver projects within current EFT
To commence 2016/17. Main benefit is increase in capacity. Anticipate efficiencies from more flexibility of $0.1m saving per annum.
Contribute to improved cost efficiency ratio
Introduced strategic procurement processes across the organisation.
Implemented 2016/17. Improved control and consolidation of procurement with approved vendors, products and services produces a saving of $0.3m per annum.
Reduces project costs (flow through to depreciation savings).
Approval delegations are reviewed to ensure appropriate oversight.
Implemented 2015/16. Improved management and control of discretionary expenditure resulting in a saving of $0.1m per annum.
General expenditure savings.
Optimise asset renewal and rehabilitation processes. Improve planning via the establishment of more complete and accurate multi-year plans.
To be implemented 2015/16. A net benefit of $0.2m per annum. Efficiency creates capacity to accelerate asset renewal and then capacity to undertake discretionary projects “strategic capacity”. Lower replacement cost reduces asset valuation (and depreciation).
Streamline design process for engineering works and build a pipeline of works.
To be implemented 2015/16. A net benefit of $0.2m per annum.
Improve data collection processes via selective use of methods, technology and statistical models.
To be implemented 2016/17. A net benefit of $0.2m per annum.
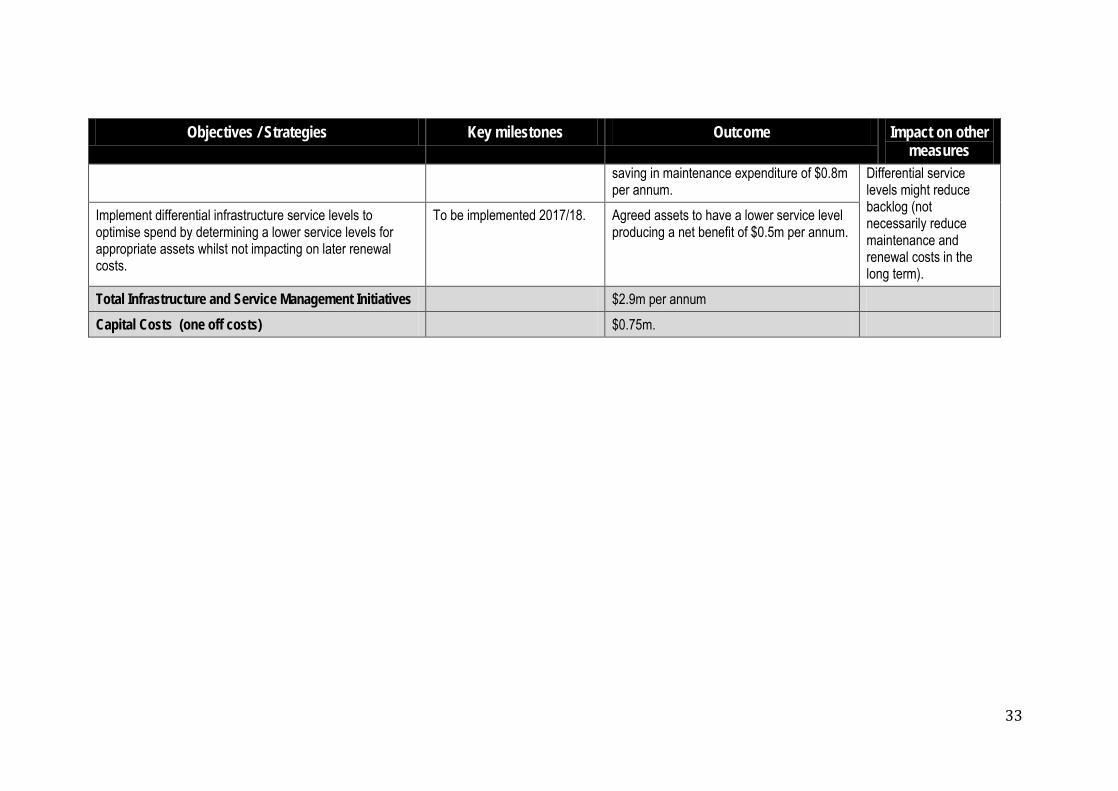
Improve asset renewal intervention prioritisation to achieve optimal pattern of remediation.
To be implemented 2016/17. Target assets prior to reaching unsatisfactory condition resulting in lower costs to remediate back to asset standard conditions 1 or 2 (excellent or good), producing a net
33
Objectives / Strategies Key milestones Outcome Impact on other measures
saving in maintenance expenditure of $0.8m per annum.
Differential service levels might reduce backlog (not necessarily reduce maintenance and renewal costs in the long term).
Implement differential infrastructure service levels to optimise spend by determining a lower service levels for appropriate assets whilst not impacting on later renewal costs.
To be implemented 2017/18. Agreed assets to have a lower service level producing a net benefit of $0.5m per annum.
Total Infrastructure and Service Management Initiatives $2.9m per annum Capital Costs (one off costs) $0.75m.

34
3.3 Improvement strategies and outcomes: Cost Efficiency
As part of its “Road to Recovery” strategy Council, over the last two years, underwent a substantial organisational restructure involving some reduction in services as well as the implementation of alternate service delivery models for some of the swimming centres and the golf course. These measures reduced staff expenses by 10.8%. This downsizing alone will generate cumulative savings of $116m over ten years. NCC has also commenced implementing a new Enterprise Resource Planning (ERP) software system that will significantly improve asset management capability as well as improved reporting and performance management capacity.
35
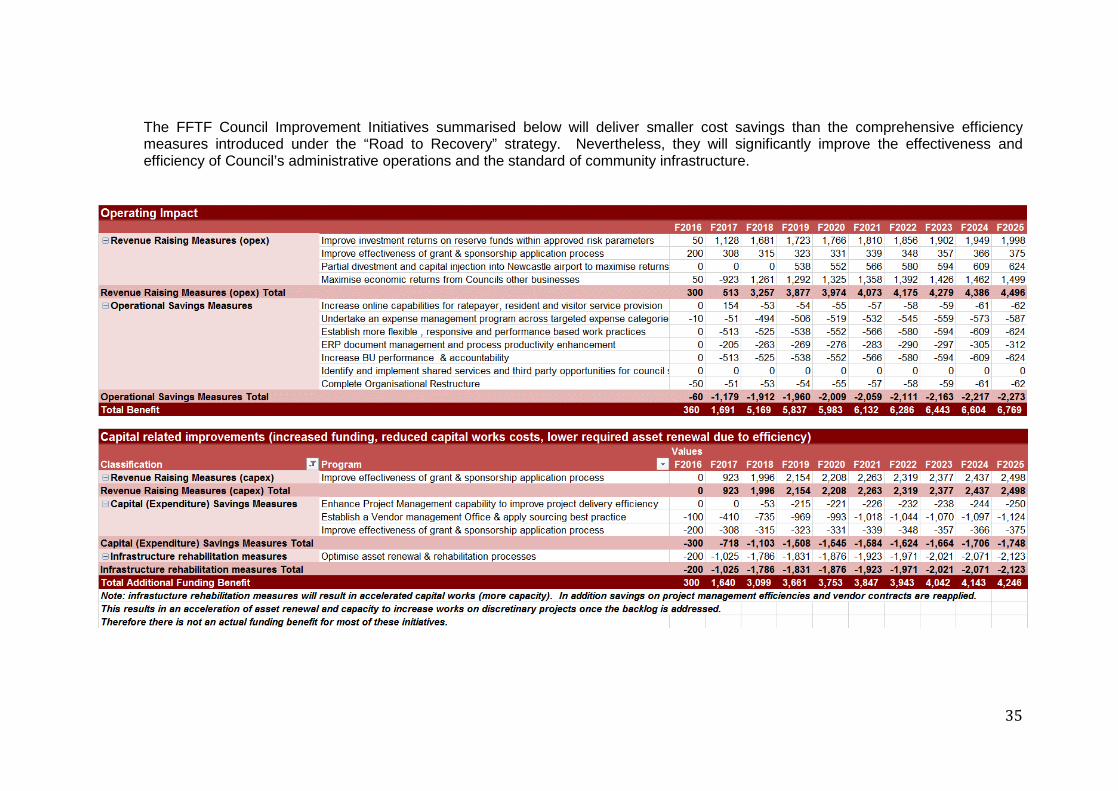
The FFTF Council Improvement Initiatives summarised below will deliver smaller cost savings than the comprehensive efficiency measures introduced under the “Road to Recovery” strategy. Nevertheless, they will significantly improve the effectiveness and efficiency of Council’s administrative operations and the standard of community infrastructure.

36
The FFTF Initiatives include further upgrades to online self service capabilities for ratepayers and other users, introducing an expense control program across Council business units, improving the measurement and accountability for the performance of each business unit, establishing more flexible, responsive and performance-based work practices and continuing to explore further opportunities for shared services and third party engagements.
NCC's strategies to improve efficiency are outline in the following table:
Fit for the Future Efficiency Improvement Initiatives in Council’s Ten Year Plan (FY2016 to FY2025)
Objectives / Strategies Key milestones Outcome Impact on other
measures Increase online capabilities for ratepayer, resident and visitor service provision. Enhance ratepayer self-service capabilities. Implement 2016/17. A saving of $0.05m per annum. Improve operating
ratio. Re-engineer DA process (online monitoring and submission, charging, etc.) to reduce administrative requirements.
Implement 2017/18. Primarily a service improvement (reduce processing times).
Improve operating ratio.
Undertake an expense management program across targeted expense categories. Review & optimise phone, mobile phone, and data usage plans. Implement 2016/17. A $0.01m saving after implementation. Improve operating
ratio. Optimise utilisation of Council real estate and seek opportunities to reduce real estate requirements for Council use.
Implement 2017/18. Reduced space requirements enabling a reduction in leased properties, or the sale or lease of owned properties yielding a sale of $0.2m per annum.
Improve operating ratio.
Review motor vehicle fleet arrangements. Implement 2015/16. Better fleet management yielding a saving of $0.05m per annum.
Improve operating ratio.
Review administration of staff car parking to reduce FBT expense. Implement 2015/16. A saving of $0.01m per annum. Improve operating ratio.
Update workers compensation claims management system Implement 2016/17. Reduced compensation claims and better return to Improve operating
37
Objectives / Strategies Key milestones Outcome Impact on other measures
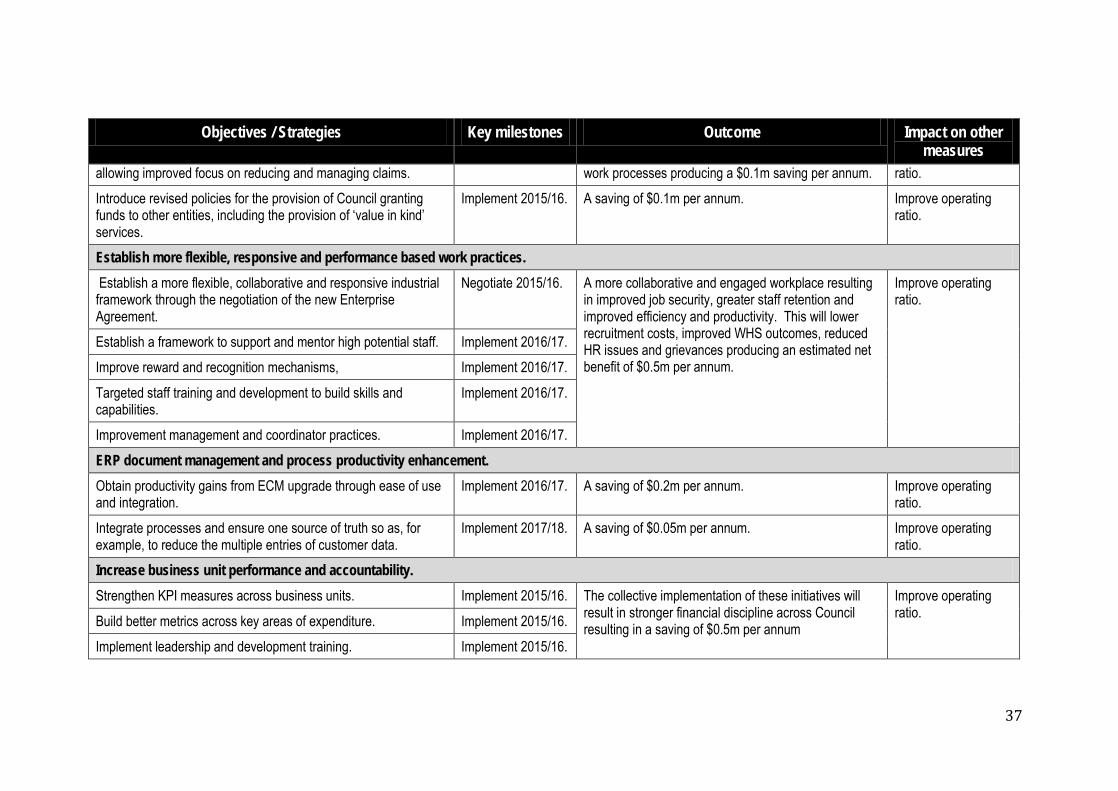
allowing improved focus on reducing and managing claims. work processes producing a $0.1m saving per annum. ratio. Introduce revised policies for the provision of Council granting funds to other entities, including the provision of ‘value in kind’ services.
Implement 2015/16. A saving of $0.1m per annum. Improve operating ratio.
Establish more flexible, responsive and performance based work practices. Establish a more flexible, collaborative and responsive industrial framework through the negotiation of the new Enterprise Agreement.
Negotiate 2015/16. A more collaborative and engaged workplace resulting in improved job security, greater staff retention and improved efficiency and productivity. This will lower recruitment costs, improved WHS outcomes, reduced HR issues and grievances producing an estimated net benefit of $0.5m per annum.
Improve operating ratio.
Establish a framework to support and mentor high potential staff. Implement 2016/17. Improve reward and recognition mechanisms, Implement 2016/17. Targeted staff training and development to build skills and capabilities.
Implement 2016/17.
Improvement management and coordinator practices. Implement 2016/17. ERP document management and process productivity enhancement. Obtain productivity gains from ECM upgrade through ease of use and integration.
Implement 2016/17. A saving of $0.2m per annum. Improve operating ratio.
Integrate processes and ensure one source of truth so as, for example, to reduce the multiple entries of customer data.
Implement 2017/18. A saving of $0.05m per annum. Improve operating ratio.
Increase business unit performance and accountability. Strengthen KPI measures across business units. Implement 2015/16. The collective implementation of these initiatives will
result in stronger financial discipline across Council resulting in a saving of $0.5m per annum
Improve operating ratio. Build better metrics across key areas of expenditure. Implement 2015/16.
Implement leadership and development training. Implement 2015/16.

38
Objectives / Strategies Key milestones Outcome Impact on other measures
Identify and implement shared services and third party opportunities for council services. Consider opportunities for NCC to provide services to smaller councils (based on cost recovery) or shared services arrangements which benefit all councils
Undertake review in 2016/17.
Use efficiency gains to improve service levels to the community.
No financial impact.
Complete current organisational restructuring Establish Customer Contact Centre. Complete in
2015/16. A more efficient means of dealing with inquiries and transactions producing savings to reapply to other services.
No financial impact.
Total Efficiency Initiatives $2.02m per annum Capital Costs (one off costs) $1.37m
39
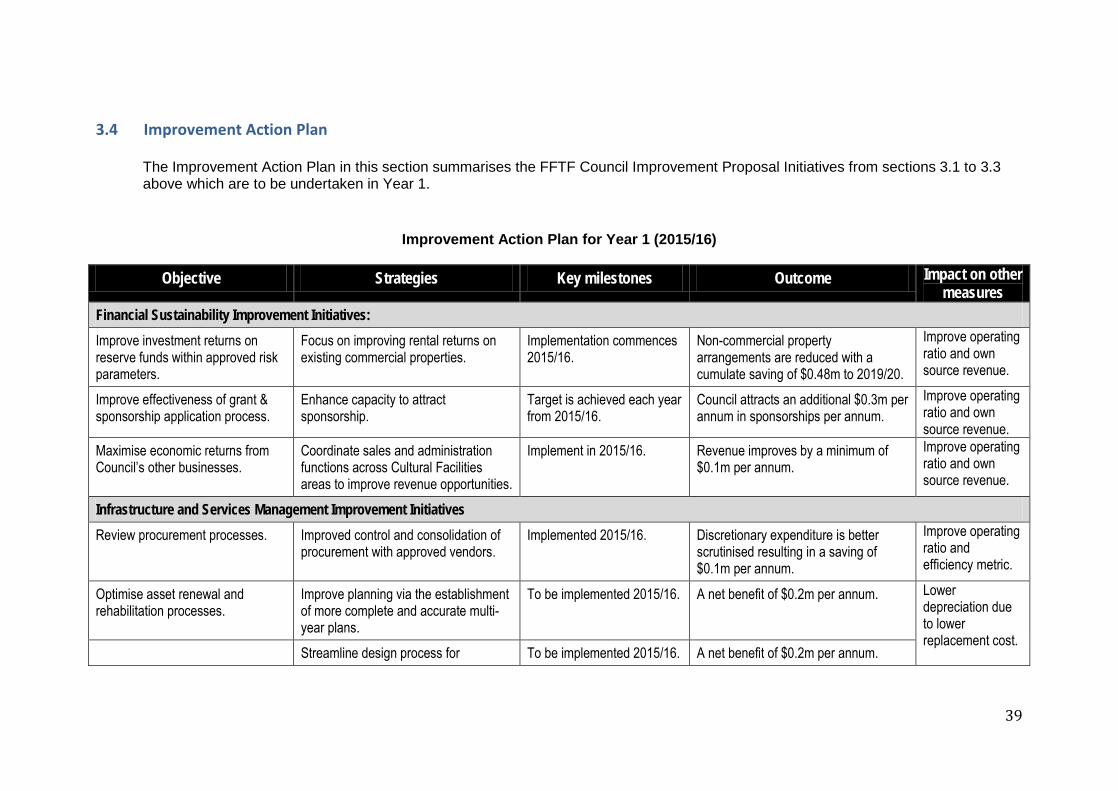
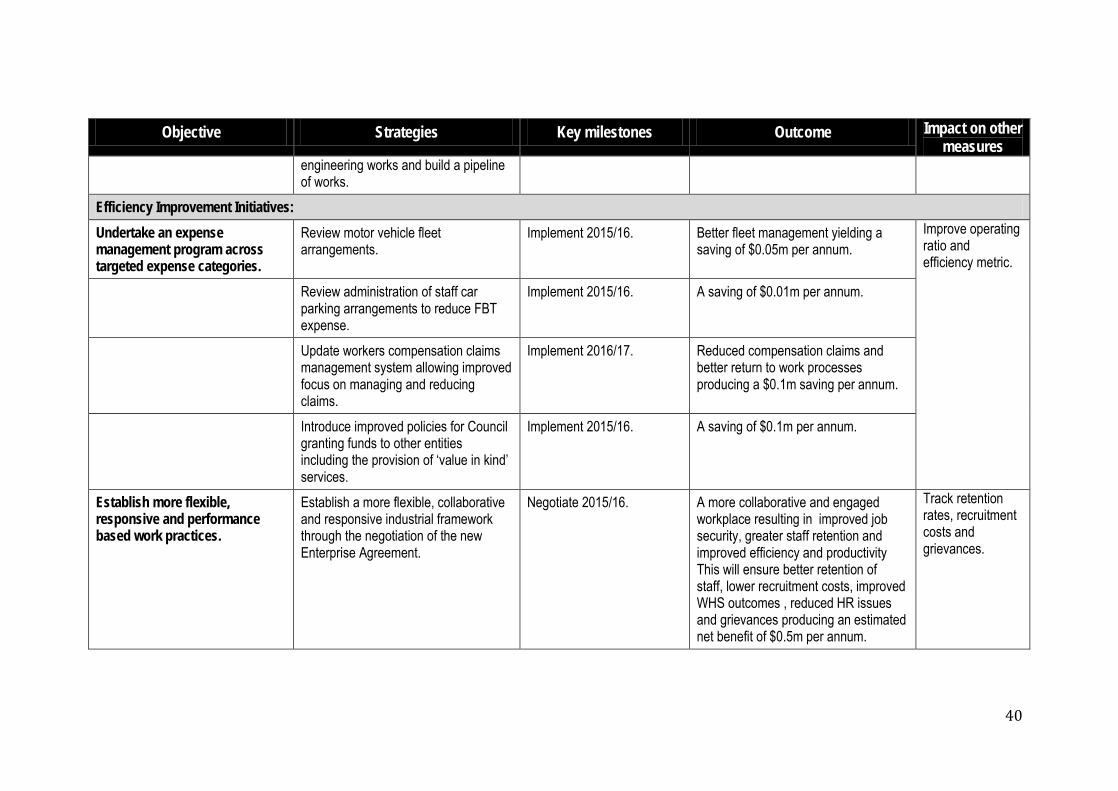
3.4 Improvement Action Plan
The Improvement Action Plan in this section summarises the FFTF Council Improvement Proposal Initiatives from sections 3.1 to 3.3 above which are to be undertaken in Year 1.
Improvement Action Plan for Year 1 (2015/16)
Objective Strategies Key milestones Outcome Impact on other measures
Financial Sustainability Improvement Initiatives: Improve investment returns on reserve funds within approved risk parameters.
Focus on improving rental returns on existing commercial properties.
Implementation commences 2015/16.
Non-commercial property arrangements are reduced with a cumulate saving of $0.48m to 2019/20.
Improve operating ratio and own source revenue.
Improve effectiveness of grant & sponsorship application process.
Enhance capacity to attract sponsorship.
Target is achieved each year from 2015/16.
Council attracts an additional $0.3m per annum in sponsorships per annum.
Improve operating ratio and own source revenue.
Maximise economic returns from Council’s other businesses.
Coordinate sales and administration functions across Cultural Facilities areas to improve revenue opportunities.
Implement in 2015/16. Revenue improves by a minimum of $0.1m per annum.
Improve operating ratio and own source revenue.
Infrastructure and Services Management Improvement Initiatives Review procurement processes. Improved control and consolidation of
procurement with approved vendors. Implemented 2015/16. Discretionary expenditure is better
scrutinised resulting in a saving of $0.1m per annum.
Improve operating ratio and efficiency metric.
Optimise asset renewal and rehabilitation processes.
Improve planning via the establishment of more complete and accurate multi-year plans.
To be implemented 2015/16.
A net benefit of $0.2m per annum. Lower depreciation due to lower replacement cost. Streamline design process for To be implemented 2015/16. A net benefit of $0.2m per annum.
40
Objective Strategies Key milestones Outcome Impact on other measures
engineering works and build a pipeline of works.
Efficiency Improvement Initiatives: Undertake an expense management program across targeted expense categories.
Review motor vehicle fleet arrangements.
Implement 2015/16. Better fleet management yielding a saving of $0.05m per annum.
Improve operating ratio and efficiency metric.
Review administration of staff car parking arrangements to reduce FBT expense.
Implement 2015/16. A saving of $0.01m per annum.
Update workers compensation claims management system allowing improved focus on managing and reducing claims.
Implement 2016/17. Reduced compensation claims and better return to work processes producing a $0.1m saving per annum.
Introduce improved policies for Council granting funds to other entities including the provision of ‘value in kind’ services.
Implement 2015/16. A saving of $0.1m per annum.
Establish more flexible, responsive and performance based work practices.
Establish a more flexible, collaborative and responsive industrial framework through the negotiation of the new Enterprise Agreement.
Negotiate 2015/16. A more collaborative and engaged workplace resulting in improved job security, greater staff retention and improved efficiency and productivity This will ensure better retention of staff, lower recruitment costs, improved WHS outcomes , reduced HR issues and grievances producing an estimated net benefit of $0.5m per annum.
Track retention rates, recruitment costs and grievances.

41
Objective Strategies Key milestones Outcome Impact on other measures
Increase business unit performance and accountability.
Strengthen KPI measures across business units.
Implement 2015/16. The collective implementation of these initiatives will result in stronger financial discipline across Council resulting in a saving of $0.5m per annum.
Greater budgetary control (build into council budgets).
Build better metrics across key areas of expenditure.
Implement 2015/16.
Implement leadership and development training.
Implement 2015/16.
Complete organisational restructuring.
Establish Customer Contact Centre. Complete in 2015/16. Utilise efficiencies to improve service levels.
No financial impact.

42
3.5 Other strategies considered
NCC Improvement Action Plan focuses on policy and operational initiatives that will deliver the greatest and most immediate benefit. These involve boosting revenue from investments, developing additional revenue from commercial operations, achieving procurement savings, achieving program and project management efficiencies and asset renewal optimisation. A number of other initiatives were considered and rejected, due to either inadequate financial benefits or unacceptable operational impact. Council will continue to monitor and assess its overall performance regularly during the course of the LTFP and Strategic Plan:
Initiative Rationale for not adopting A further restructure of the organisation
Council has already reduced its workforce by almost 10% in the last 18 months and there is limited capacity for further reductions. Council is committed to achieving further efficiencies from each business unit together with a general productivity improvement factor (0.2% of rates in line with IPART expectations) while maintaining the current EFT.
Additional revenue from Town Hall and Civic facilities
An operational assessment indicates there are very limited opportunities to significantly increase revenue at these facilities (particularly when set-up costs are considered).
Expansion of asset sales program
Council’s asset sales program has already realised $16m in benefits with a further $50m of sales already planned. The sale of Council assets is not without community criticism and NCC will continue to give consideration to this issue once current planned sales are finalised.
Shared services or joint venture with other councils or third party organisations
Council presently makes extensive use of third parties for the purposes of undertaking capital works. Shared services are already provided by Hunter Councils. The net benefit of further shared services activities would need to be assessed on a case by case basis prior to considering any further expansion.
Tendering for the waste pick-up services contracts of neighbouring councils
Council’s action plan includes the expansion of the capability of its Summerhill Waste Management Centre. Once Council has the necessary infrastructure in place, it will give further consideration to tendering to provide waste pick-up services for neighbouring councils.
43
4. Expected outcomes
4.1 Expected performance improvements
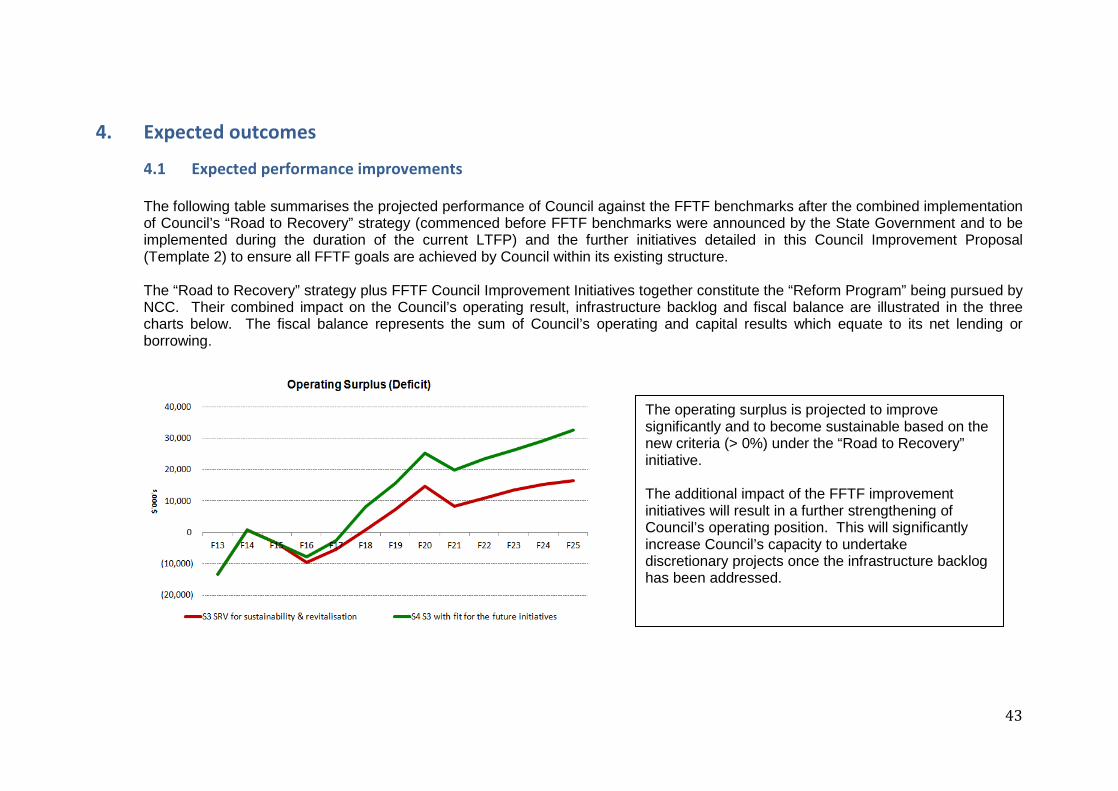
The following table summarises the projected performance of Council against the FFTF benchmarks after the combined implementation of Council’s “Road to Recovery” strategy (commenced before FFTF benchmarks were announced by the State Government and to be implemented during the duration of the current LTFP) and the further initiatives detailed in this Council Improvement Proposal (Template 2) to ensure all FFTF goals are achieved by Council within its existing structure. The “Road to Recovery” strategy plus FFTF Council Improvement Initiatives together constitute the “Reform Program” being pursued by NCC. Their combined impact on the Council’s operating result, infrastructure backlog and fiscal balance are illustrated in the three charts below. The fiscal balance represents the sum of Council’s operating and capital results which equate to its net lending or borrowing.
The operating surplus is projected to improve significantly and to become sustainable based on the new criteria (> 0%) under the “Road to Recovery” initiative. The additional impact of the FFTF improvement initiatives will result in a further strengthening of Council’s operating position. This will significantly increase Council’s capacity to undertake discretionary projects once the infrastructure backlog has been addressed.

44
Council already has a program in place to address the infrastructure backlog. This was covered extensively in the recent SRV application. The graph to the left reflect the infrastructure backlog applying WDV. The FFTF improvement initiatives enable capital works especially asset renewal to be completed more efficiently. These efficiencies will be applied to accelerating the asset renewal program rather than as savings. Note: Calculating the backlog using replacement cost would result in the backlog exceeding the benchmark by 2018/19.
The FFTF improvement initiatives will enable Council to build a stronger cash position. This will allow Council to handle unforeseen events and also have the funding to undertake significant capital works programs in the future. Both of these capabilities are important elements in assessing Council’s strategic capacity.
45
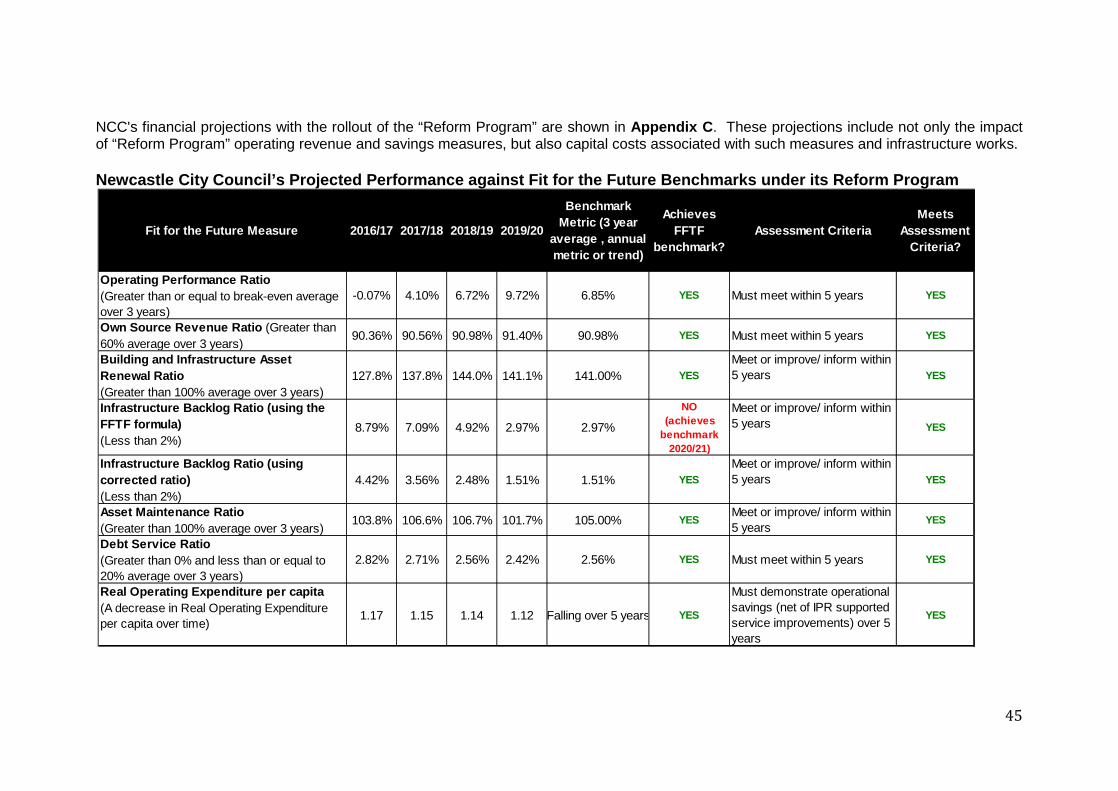
NCC's financial projections with the rollout of the “Reform Program” are shown in Appendix C. These projections include not only the impact of “Reform Program” operating revenue and savings measures, but also capital costs associated with such measures and infrastructure works. Newcastle City Council’s Projected Performance against Fit for the Future Benchmarks under its Reform Program
Fit for the Future Measure 2016/17 2017/18 2018/19 2019/20
Benchmark Metric (3 year
average , annual metric or trend)
Achieves FFTF
benchmark?Assessment Criteria
Meets Assessment
Criteria?
Operating Performance Ratio (Greater than or equal to break-even average over 3 years)
-0.07% 4.10% 6.72% 9.72% 6.85% YES Must meet within 5 years YES
Own Source Revenue Ratio (Greater than 60% average over 3 years)
90.36% 90.56% 90.98% 91.40% 90.98% YES Must meet within 5 years YES
Building and Infrastructure Asset Renewal Ratio (Greater than 100% average over 3 years)
127.8% 137.8% 144.0% 141.1% 141.00% YESMeet or improve/ inform within 5 years YES
Infrastructure Backlog Ratio (using the FFTF formula)(Less than 2%)
8.79% 7.09% 4.92% 2.97% 2.97%
NO (achieves
benchmark 2020/21)
Meet or improve/ inform within 5 years YES
Infrastructure Backlog Ratio (using corrected ratio)(Less than 2%)
4.42% 3.56% 2.48% 1.51% 1.51% YESMeet or improve/ inform within 5 years YES
Asset Maintenance Ratio(Greater than 100% average over 3 years)
103.8% 106.6% 106.7% 101.7% 105.00% YES Meet or improve/ inform within 5 years
YES
Debt Service Ratio(Greater than 0% and less than or equal to 20% average over 3 years)
2.82% 2.71% 2.56% 2.42% 2.56% YES Must meet within 5 years YES
Real Operating Expenditure per capita(A decrease in Real Operating Expenditure per capita over time)
1.17 1.15 1.14 1.12 Falling over 5 years YES
Must demonstrate operational savings (net of IPR supported service improvements) over 5 years
YES

46
FFFT Performance Ratios (As per self assessment tool)Indicator 2011/12 2012/13 2013/14
Actual Actual ActualAnnual MetricsOperating performance ratio -6.29% -2.75% -0.50% -1.23% -2.84% -0.07% 4.10% 6.72% 9.72% 7.65% 8.46% 9.08% 9.75%Own-source revenue ratio 81.2% 85.3% 86.5% 90.4% 90.3% 90.4% 90.6% 91.0% 91.4% 91.6% 91.8% 92.0% 92.2%B&I Asset renewals ratio 18.6% 31.8% 50.4% 78.5% 96.7% 127.8% 137.8% 144.0% 141.1% 119.1% 102.8% 102.3% 100.5%
Assessment Metric (3 year average)Operating performance ratio -3.2% -1.5% -1.5% -1.4% 0.4% 3.6% 6.8% 8.0% 8.6% 8.4% 9.1%Own-source revenue ratio 84.3% 87.4% 89.1% 90.3% 90.4% 90.6% 91.0% 91.3% 91.6% 91.8% 92.0%B&I Asset renewals ratio 33.6% 53.6% 75.2% 101.0% 120.8% 136.6% 141.0% 134.7% 121.0% 108.0% 101.9%
Indicator 2011/12 2012/13 2013/14Actual Actual Actual
Annual MetricsInfrastructure backlog ratio (FFFT) 9.00% 10.40% 10.02% 8.79% 7.09% 4.92% 2.97% 1.92% 1.52% 1.12% 0.81%Infrastructure backlog ratio (replacement value) 5.05% 5.23% 5.05% 4.42% 3.56% 2.48% 1.51% 0.98% 0.77% 0.57% 0.41%Asset maintenance ratio 59.9% 49.8% 84.6% 100.6% 101.0% 103.8% 106.6% 106.7% 101.7% 100.5% 100.9% 101.4% 100.7%Debt service ratio 2.82% 3.15% 5.14% 3.17% 2.88% 2.82% 2.71% 2.56% 2.42% 2.36% 2.29% 2.29% 1.73%
Assessment MetricInfrastructure backlog ratio (FFFT) 9.00% 10.40% 10.02% 8.79% 7.09% 4.92% 2.97% 1.92% 1.52% 1.12% 0.81%Infrastructure backlog ratio (replacement value) 5.05% 5.23% 5.05% 4.42% 3.56% 2.48% 1.51% 0.98% 0.77% 0.57% 0.41%Asset maintenance ratio (3 year average) 64.79% 78.36% 95.40% 101.81% 103.81% 105.72% 105.00% 102.97% 101.04% 100.94% 101.00%Debt service ratio (3 year average) 3.70% 3.82% 3.73% 2.96% 2.80% 2.70% 2.56% 2.45% 2.36% 2.31% 2.10%
Indicator 2011/12 2012/13 2013/14Actual Actual Actual
Annual MetricsReal opex per capita index (FFTF data) 1.32 1.26 1.20 1.18 1.19 1.17 1.15 1.14 1.12 1.14 1.11 1.10 1.08
Assessment Metric (3 year average)Real opex per capita index (ABS & NSW Planning & Environment) 1.26 1.21 1.19 1.18 1.17 1.15 1.14 1.13 1.12 1.12 1.10
2014/15 F'cast
2015/16 F'cast
2016/17 F'cast
2017/18 F'cast
2018/19 F'cast
2019/20 F'cast
2020/21 F'cast
2021/22 F'cast
2022/23 F'cast
2023/24 F'cast
2014/15 F'cast
2015/16 F'cast
2016/17 F'cast
2017/18 F'cast
2018/19 F'cast
2019/20 F'cast
2020/21 F'cast
2021/22 F'cast
2022/23 F'cast
2023/24 F'cast
2014/15 Forecast
2015/16 Forecast
2016/17 Forecast
2017/18 Forecast
2018/19 Forecast
2019/20 Forecast
2020/21 Forecast
2021/22 Forecast
2022/23 Forecast
2023/24 Forecast
47
Conclusion
NCC meets all of the scaled timeframe assessment targets for the Sustainability, Effective Infrastructure and Service Management and Efficiency criteria, as outlined in the IPART Methodology for Assessment. NCC will also meet six of the seven actual FFTF benchmarks within the period 2016/17 to 2019/20 (seven if it is accepted that the prescribed Infrastructure Backlog Ratio as defined in FFTF guidance material uses an erroneous denominator as outlined in section 2.3 above). Council’s performance against the prescribed Infrastructure Backlog Ratio improves dramatically from 8.77% in 2016/17 to 2.97% in 2019/20. While this is above the desired maximum threshold of 2%, the ratio falls to 1.92% by 2020/21. Using the corrected ratio, Council’s infrastructure backlog is reduced from 4.42% in 2016/17 to 1.51% in 2019/20. After that, it should continue to trend down for the remaining term of Council’s LTFP.
Hence NCC will achieve all seven FFTF benchmarks by 2020/21 (and on a corrected infrastructure ratio by 2019/20) as a result of its “Road to Recovery” strategy together with the FFTF initiatives as outlined in this Council Improvement Proposal.
See Appendix G for a more detailed response to FFTF criteria.

48
5. Implementation
5.1 Implementation Process
NCC will project manage the implementation of its “Reform Program” using the proven processes and methodologies already in place within Council for introducing changes to date. In summary this approach involves:
• Defining each “Reform Program” initiative’s effort, cost, funding, project manager, timeline and financial and non-financial
benefits; • Agreeing on the Implementation Plan for each initiative with key stakeholders; • Reflecting the financial cost and benefits of each initiative in key financial documents including the Annual Operational Plan
and the LTFP; • Establishing a Steering Group and assigning a Project Manager and budget for each initiative; • Showing how the initiatives will impact the Key Performance Indictors of Council; • Starting initiatives in line with the Year 1 “Action Plan” schedules and tracking progress using existing project management
tools and governance oversight mechanisms; • Measuring project realisation against target costs and benefits; and • Reporting net financial and other outcomes against targets in Council’s management and annual reports.
5.2 Assigning Responsibility
A specialist Project Manager from within Council will be assigned to manage the overall implementation of the City’s FFTF Improvement Initiatives. Ultimate responsibility for the implementation of revenue enhancement initiatives will rest with the Director Corporate Services, whilst the Director Infrastructure will have final responsibility for the implementation of expenditure savings and infrastructure rehabilitation measures. Responsibility for tracking net financial outcomes from implementing the improvement initiatives will be assigned to the Manager Finance.
5.3 Monitoring Progress
As per current practices, regular project reporting to the relevant Steering Group overseeing each project will occur.
49
The General Manager and Executive Management Committee will receive and review a monthly one page report showing any initiatives which are not on schedule or on budget to deliver expected net benefits.
On a quarterly basis, management will report to Council on progress made whilst formal reporting will occur yearly in the Annual Report and the Delivery Program Report utilising specific purpose software that integrates with other Council systems.
Business unit managers will have relevant key performance targets included in their respective performance plans. This should drive results and ensure a high level of transparency with respect to demonstrating progress against agreed outcomes.
50
Appendices Appendix A: Newcastle City Council Organisational Chart & Leadership Capabilities
Appendix B: Newcastle City Council Core Strategic Planning Staff Numbers
Appendix C: Council’s Finances and Benchmarks with its Reform Program
C1: Assessment of Treasury Corp – Financial Assessment and Benchmarking Report (Oct 2012) C2: NCC Financials (including FFTF Council Improvement Proposal Initiatives) C3: NCC Financials (including FFTF Initiatives, excluding 50% interest in Airport C4: FFTF Self Assessment Calculations (2011/12 to 2019/20) Consolidated View C5: FFTF Self Assessment Calculations (2011/12 to 2019/20) excluding Airport
Appendix D: The Obstacles to a Merger of NCC and LMCC
D1: Geographical / Topographical Assessment of an Amalgamated Council D2: Assessment of Amalgamation v Standalone Councils against ILGRP boundary criteria D3: Regional Considerations – Linkages within the Hunter Region D4: Integrated Planning: Where is the Government Focus in the Hunter Region? D5: Development Applications across the Hunter Region (2013/14) D6: Council’s Internal High level Assessment of functions potentially impacted by Economies/Diseconomies of Scale
Appendix E: A profile of Newcastle Appendix F: “Business Case” Assessment of Amalgamation versus Standalone Councils
Appendix G: Detailed Response to the Fit for the Future Criteria
Appendix H: Program Charters
Appendix I: Community Feedback
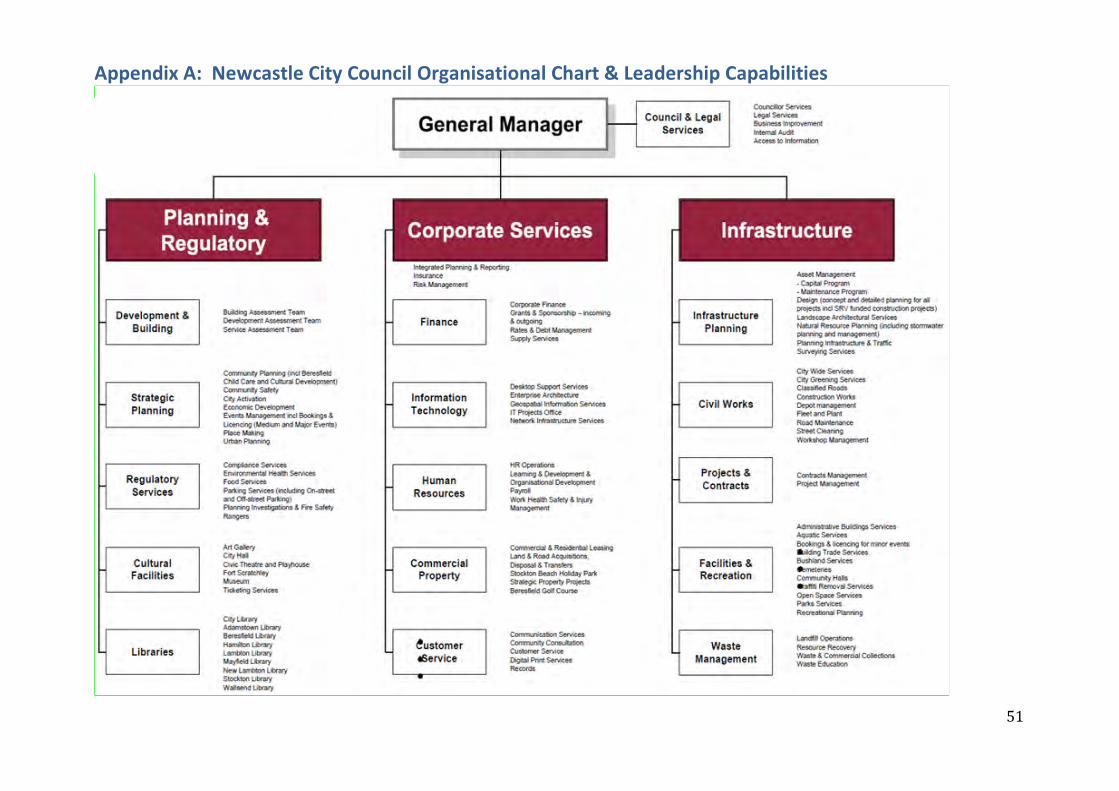
51
Appendix A: Newcastle City Council Organisational Chart & Leadership Capabilities
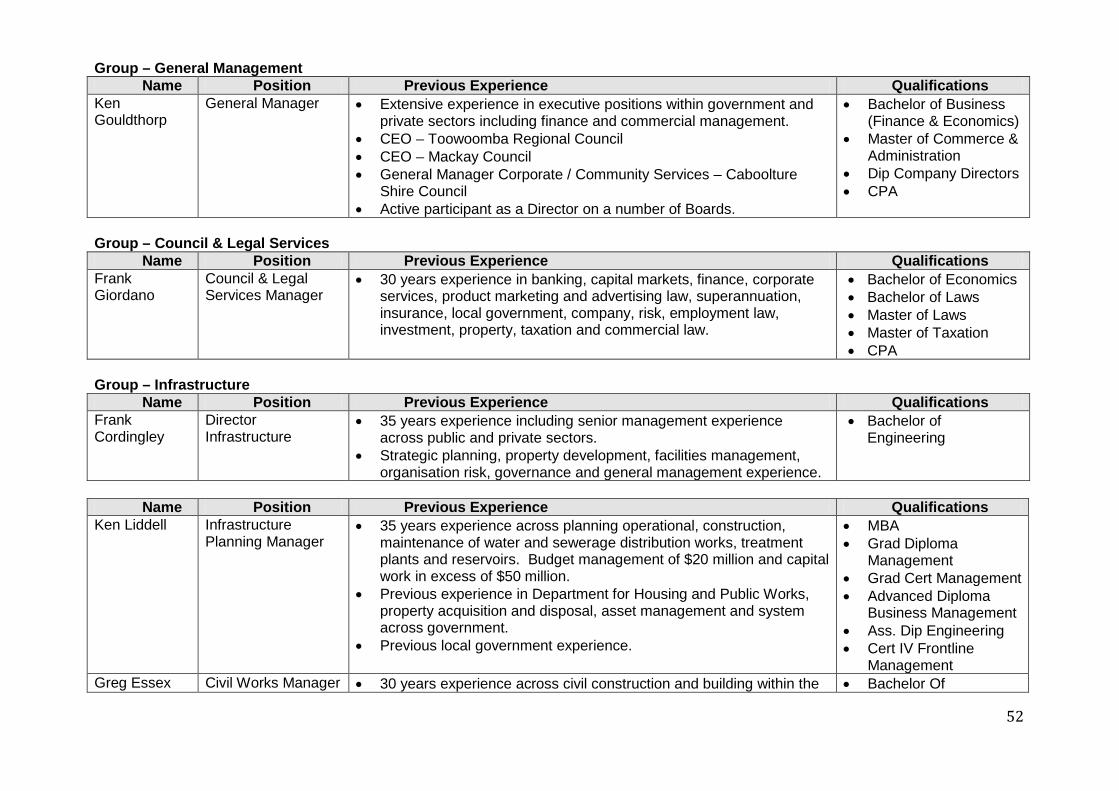
52
Group – General Management Name Position Previous Experience Qualifications
Ken Gouldthorp
General Manager • Extensive experience in executive positions within government and private sectors including finance and commercial management.
• CEO – Toowoomba Regional Council • CEO – Mackay Council • General Manager Corporate / Community Services – Caboolture
Shire Council • Active participant as a Director on a number of Boards.
• Bachelor of Business (Finance & Economics)
• Master of Commerce & Administration
• Dip Company Directors • CPA
Group – Council & Legal Services
Name Position Previous Experience Qualifications Frank Giordano
Council & Legal Services Manager
• 30 years experience in banking, capital markets, finance, corporate services, product marketing and advertising law, superannuation, insurance, local government, company, risk, employment law, investment, property, taxation and commercial law.
• Bachelor of Economics • Bachelor of Laws • Master of Laws • Master of Taxation • CPA
Group – Infrastructure
Name Position Previous Experience Qualifications Frank Cordingley
Director Infrastructure
• 35 years experience including senior management experience across public and private sectors.
• Strategic planning, property development, facilities management, organisation risk, governance and general management experience.
• Bachelor of Engineering
Name Position Previous Experience Qualifications
Ken Liddell Infrastructure Planning Manager
• 35 years experience across planning operational, construction, maintenance of water and sewerage distribution works, treatment plants and reservoirs. Budget management of $20 million and capital work in excess of $50 million.
• Previous experience in Department for Housing and Public Works, property acquisition and disposal, asset management and system across government.
• Previous local government experience.
• MBA • Grad Diploma
Management • Grad Cert Management • Advanced Diploma
Business Management • Ass. Dip Engineering • Cert IV Frontline
Management Greg Essex Civil Works Manager • 30 years experience across civil construction and building within the • Bachelor Of
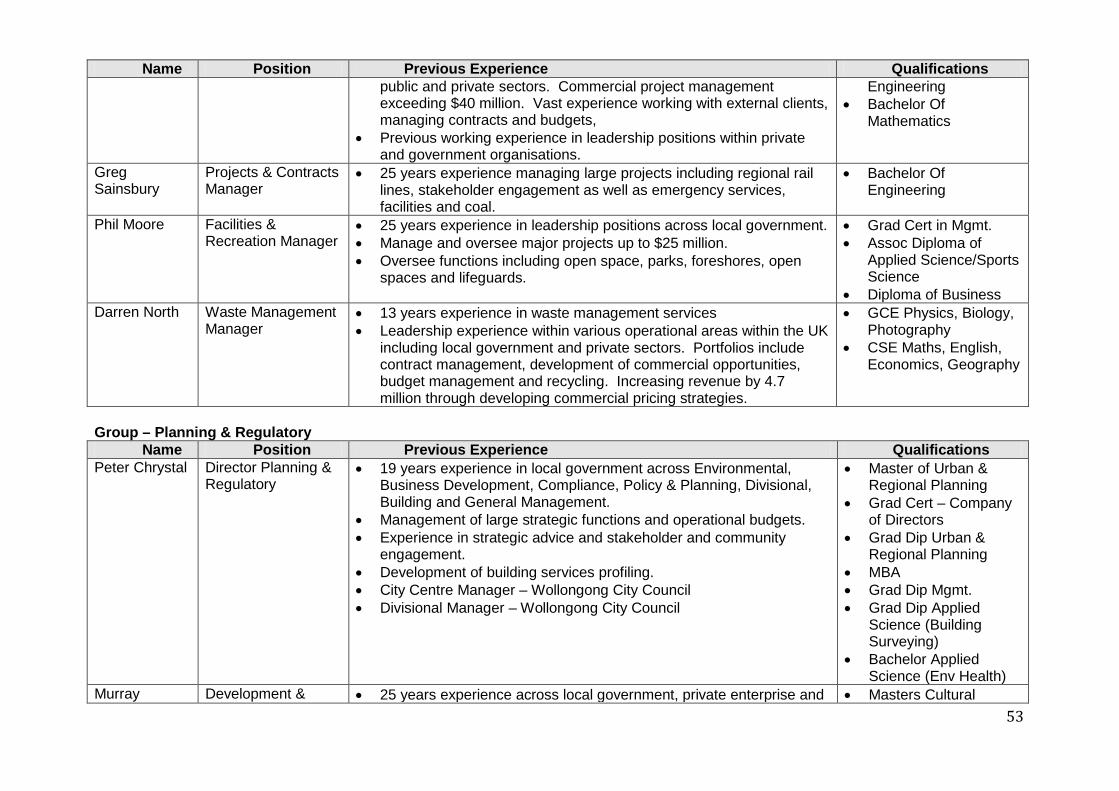
53
Name Position Previous Experience Qualifications public and private sectors. Commercial project management exceeding $40 million. Vast experience working with external clients, managing contracts and budgets,
• Previous working experience in leadership positions within private and government organisations.
Engineering • Bachelor Of
Mathematics
Greg Sainsbury
Projects & Contracts Manager
• 25 years experience managing large projects including regional rail lines, stakeholder engagement as well as emergency services, facilities and coal.
• Bachelor Of Engineering
Phil Moore Facilities &
Recreation Manager • 25 years experience in leadership positions across local government. • Manage and oversee major projects up to $25 million. • Oversee functions including open space, parks, foreshores, open
spaces and lifeguards.
• Grad Cert in Mgmt. • Assoc Diploma of
Applied Science/Sports Science
• Diploma of Business Darren North Waste Management
Manager • 13 years experience in waste management services • Leadership experience within various operational areas within the UK
including local government and private sectors. Portfolios include contract management, development of commercial opportunities, budget management and recycling. Increasing revenue by 4.7 million through developing commercial pricing strategies.
• GCE Physics, Biology, Photography
• CSE Maths, English, Economics, Geography
Group – Planning & Regulatory
Name Position Previous Experience Qualifications Peter Chrystal Director Planning &
Regulatory • 19 years experience in local government across Environmental,
Business Development, Compliance, Policy & Planning, Divisional, Building and General Management.
• Management of large strategic functions and operational budgets. • Experience in strategic advice and stakeholder and community
engagement. • Development of building services profiling. • City Centre Manager – Wollongong City Council • Divisional Manager – Wollongong City Council
• Master of Urban & Regional Planning
• Grad Cert – Company of Directors
• Grad Dip Urban & Regional Planning
• MBA • Grad Dip Mgmt. • Grad Dip Applied
Science (Building Surveying)
• Bachelor Applied Science (Env Health)
Murray Development & • 25 years experience across local government, private enterprise and • Masters Cultural

54
Name Position Previous Experience Qualifications Blackburn-Smith
Building Manager owner of own business. • Lead commercial projects involving highway services centres,
shopping centres, petrol stations, sub-division and heritage work. • Preparation of strategic land use.
Heritage • Cert IV Corporate
Communications • Cert IV Project
Management • Grad Dip Urban &
Regional Planning • Bachelor Arts • Grad Cert. Land &
Engineering Survey Drafting.
Jill Gaynor Strategic Planning Manager
• 20 years previous experience in planning, environmental, land administration and other legislation at local and federal levels.
• Community strategic planning, economic development, child care services, Flood planning Risk Management, Parks and Recreation, Heritage.
• Master of Arts (Urban & Regional Planning)
• Bachelor Science (Hons)
Andrew Baxter Regulatory Services
Manager • 25 years of experience in policing across covert operations in
organised crime, terrorism, surveillance. • Police Integrity Commission. • Investigation experience, writers, analysis and complaints
management. • Stakeholder management within the political arena.
• Cert in Integrity Investigations (Australia Federal Police)
• Managing Serious & Complex Investigations (Charles Stuart)
Liz Burcham Cultural Facilities Manager
• 20 years of experience in non-for-profits and multi media organisations.
• Developed Metro Arts by providing leading platforms in infrastructure, mentoring, production services, networks and leadership.
• Bachelor Arts
Suzie Gately Libraries Manager • 35 years experience leading library functions and community centres, staffing, budget management, IT.
• Previous experience as a Director of Community Wellbeing. • Development of redevelopment strategies, funding strategies,
negotiations of leasing, working with architects and advisors on heritage overlays.
• Bachelor of Education • Diploma of Education
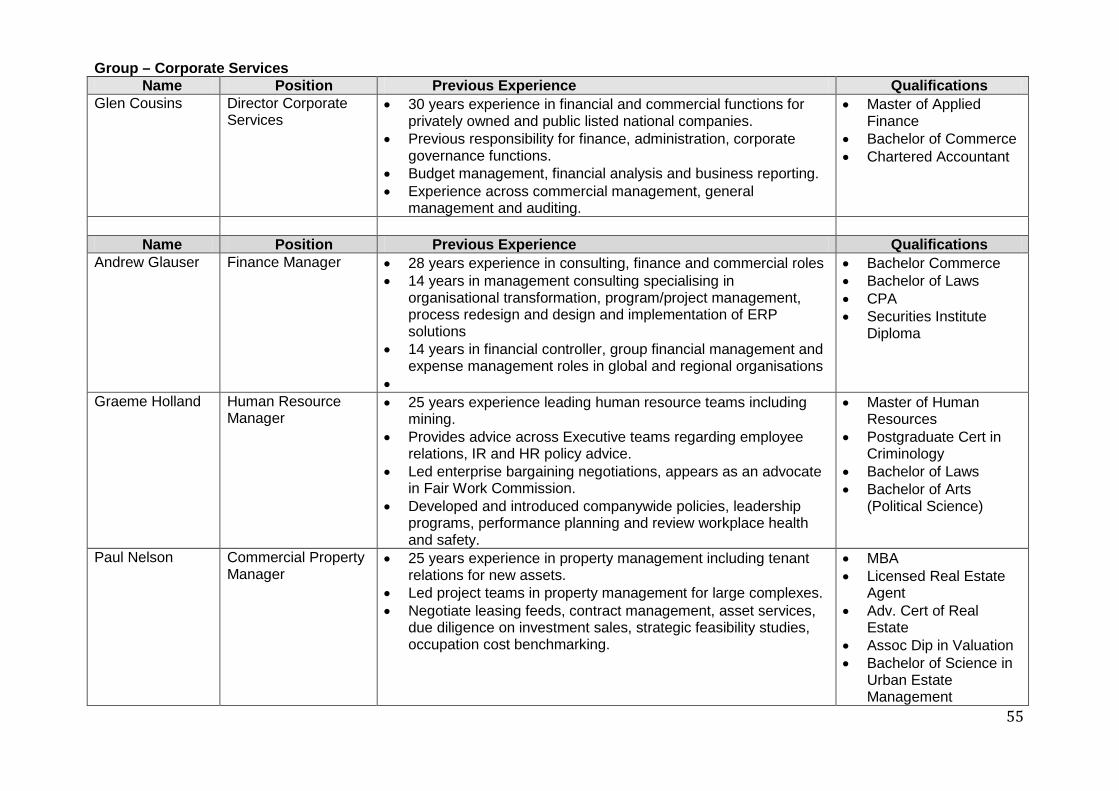
55
Group – Corporate Services Name Position Previous Experience Qualifications
Glen Cousins Director Corporate Services
• 30 years experience in financial and commercial functions for privately owned and public listed national companies.
• Previous responsibility for finance, administration, corporate governance functions.
• Budget management, financial analysis and business reporting. • Experience across commercial management, general
management and auditing.
• Master of Applied Finance
• Bachelor of Commerce • Chartered Accountant
Name Position Previous Experience Qualifications
Andrew Glauser Finance Manager • 28 years experience in consulting, finance and commercial roles • 14 years in management consulting specialising in
organisational transformation, program/project management, process redesign and design and implementation of ERP solutions
• 14 years in financial controller, group financial management and expense management roles in global and regional organisations
•
• Bachelor Commerce • Bachelor of Laws • CPA • Securities Institute
Diploma
Graeme Holland Human Resource Manager
• 25 years experience leading human resource teams including mining.
• Provides advice across Executive teams regarding employee relations, IR and HR policy advice.
• Led enterprise bargaining negotiations, appears as an advocate in Fair Work Commission.
• Developed and introduced companywide policies, leadership programs, performance planning and review workplace health and safety.
• Master of Human Resources
• Postgraduate Cert in Criminology
• Bachelor of Laws • Bachelor of Arts
(Political Science)
Paul Nelson Commercial Property Manager
• 25 years experience in property management including tenant relations for new assets.
• Led project teams in property management for large complexes. • Negotiate leasing feeds, contract management, asset services,
due diligence on investment sales, strategic feasibility studies, occupation cost benchmarking.
• MBA • Licensed Real Estate
Agent • Adv. Cert of Real
Estate • Assoc Dip in Valuation • Bachelor of Science in
Urban Estate Management

56
Name Position Previous Experience Qualifications Greg Brent • 24 years experience within Information Technology and project
management functions. • Business and design analysis, budget management and system
tender experience.
• Various Information Technology courses including Project Management

57
Appendix B: Newcastle City Council Core Strategic Planning Staff Numbers
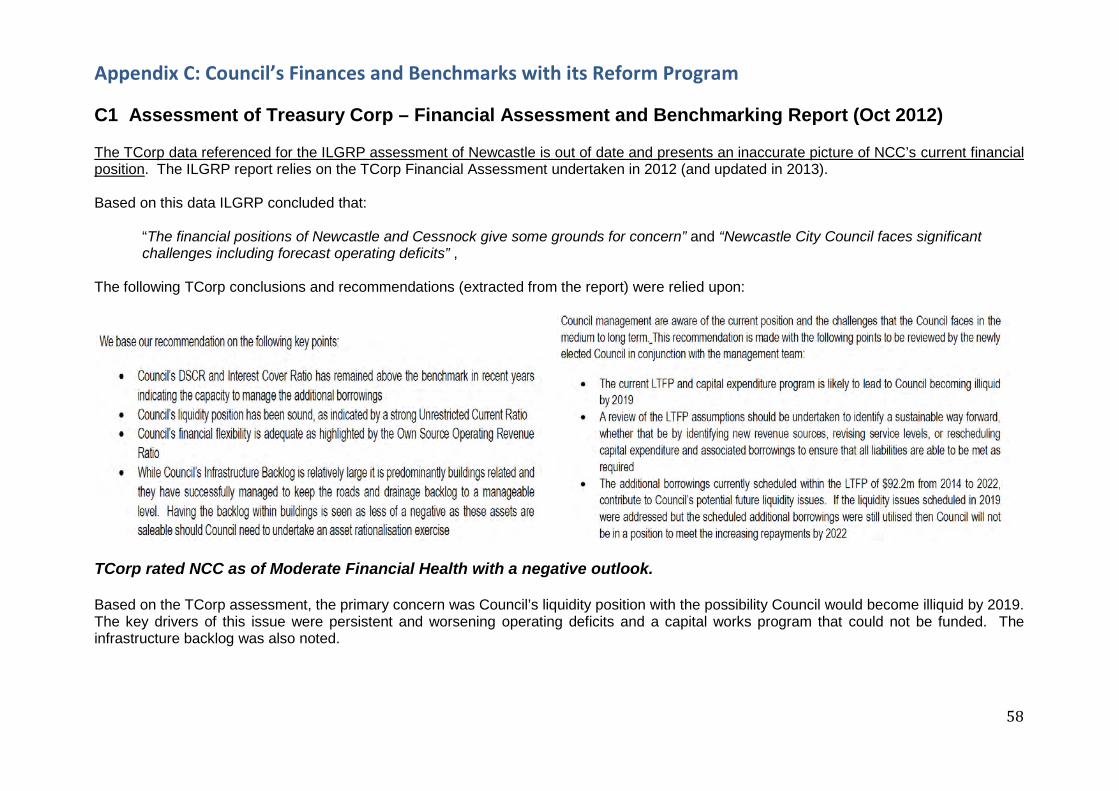
58
Appendix C: Council’s Finances and Benchmarks with its Reform Program C1 Assessment of Treasury Corp – Financial Assessment and Benchmarking Report (Oct 2012) The TCorp data referenced for the ILGRP assessment of Newcastle is out of date and presents an inaccurate picture of NCC’s current financial position. The ILGRP report relies on the TCorp Financial Assessment undertaken in 2012 (and updated in 2013). Based on this data ILGRP concluded that:
“The financial positions of Newcastle and Cessnock give some grounds for concern” and “Newcastle City Council faces significant challenges including forecast operating deficits” ,
The following TCorp conclusions and recommendations (extracted from the report) were relied upon:
TCorp rated NCC as of Moderate Financial Health with a negative outlook. Based on the TCorp assessment, the primary concern was Council’s liquidity position with the possibility Council would become illiquid by 2019. The key drivers of this issue were persistent and worsening operating deficits and a capital works program that could not be funded. The infrastructure backlog was also noted.

59
Council Response Council has actioned all recommendations noted in the TCorp report and has already achieved a dramatic turnaround of Council’s financial position. Council has (1) reprioritised capital works programs (2) reduced operating costs via an organisational restructuring (3) generated more own sourced revenue from commercial sources and (4) successfully applied for an multi-year SRV. Surplus assets (including assets with the backlog) have been sold with a further pipeline of assets sales in progress. Operating Position Extract from TCorp Report Latest NCC LTFP
There is a vast difference between the original assessment and Council’s current position.
• Council's operating position is already significantly better than in the TCorp report. Modest surplus in FY14. • FY15 and FY16 project modest deficits but are substantially better than the TCorp projections and meet the previous benchmark. The
deficit is due to greater expenditure on maintenance and operating cost impact of above trend asset renewal to address the backlog. • The recently approved SRV (8% pa for five years commencing in 2015/16) improves Council’s revenue position by approximately 31%
above the rate peg. This largely explains the significant improvement in the operating ratios demonstrated above. • Current LTFP projections incorporate sustainable maintenance and renewal and aggressive reductions in the backlog.
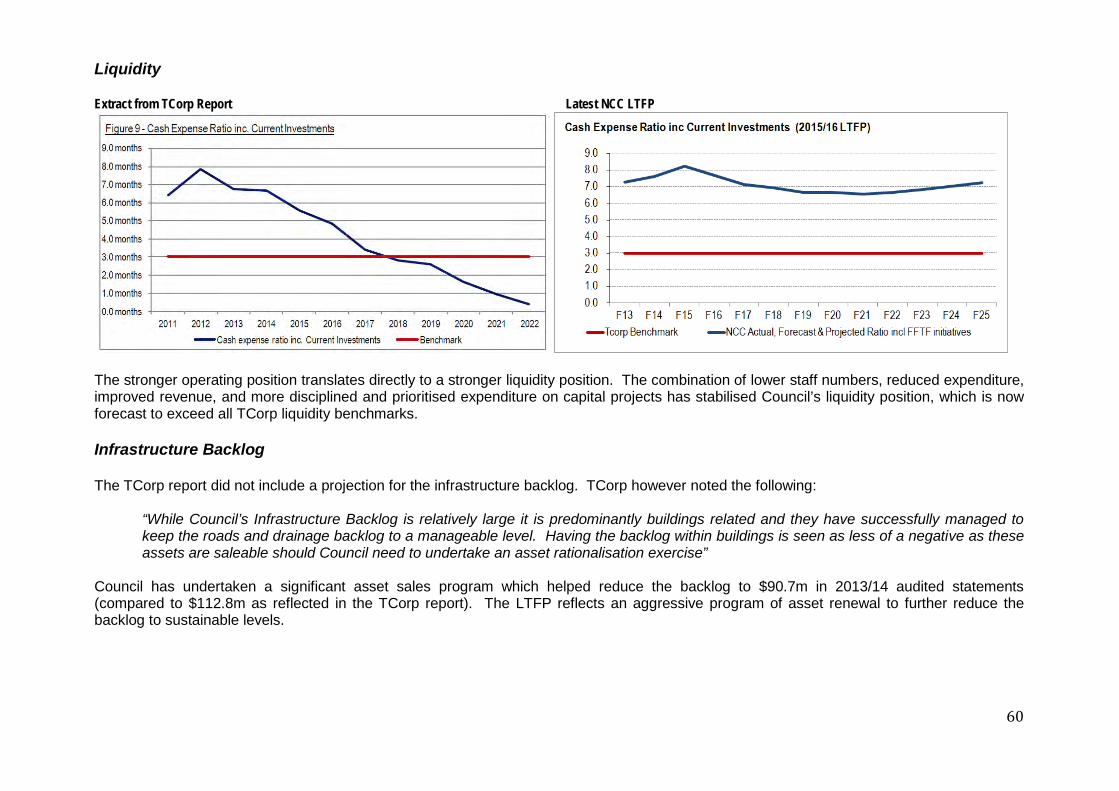
60
Liquidity Extract from TCorp Report Latest NCC LTFP
The stronger operating position translates directly to a stronger liquidity position. The combination of lower staff numbers, reduced expenditure, improved revenue, and more disciplined and prioritised expenditure on capital projects has stabilised Council’s liquidity position, which is now forecast to exceed all TCorp liquidity benchmarks. Infrastructure Backlog The TCorp report did not include a projection for the infrastructure backlog. TCorp however noted the following:
“While Council’s Infrastructure Backlog is relatively large it is predominantly buildings related and they have successfully managed to keep the roads and drainage backlog to a manageable level. Having the backlog within buildings is seen as less of a negative as these assets are saleable should Council need to undertake an asset rationalisation exercise”
Council has undertaken a significant asset sales program which helped reduce the backlog to $90.7m in 2013/14 audited statements (compared to $112.8m as reflected in the TCorp report). The LTFP reflects an aggressive program of asset renewal to further reduce the backlog to sustainable levels.
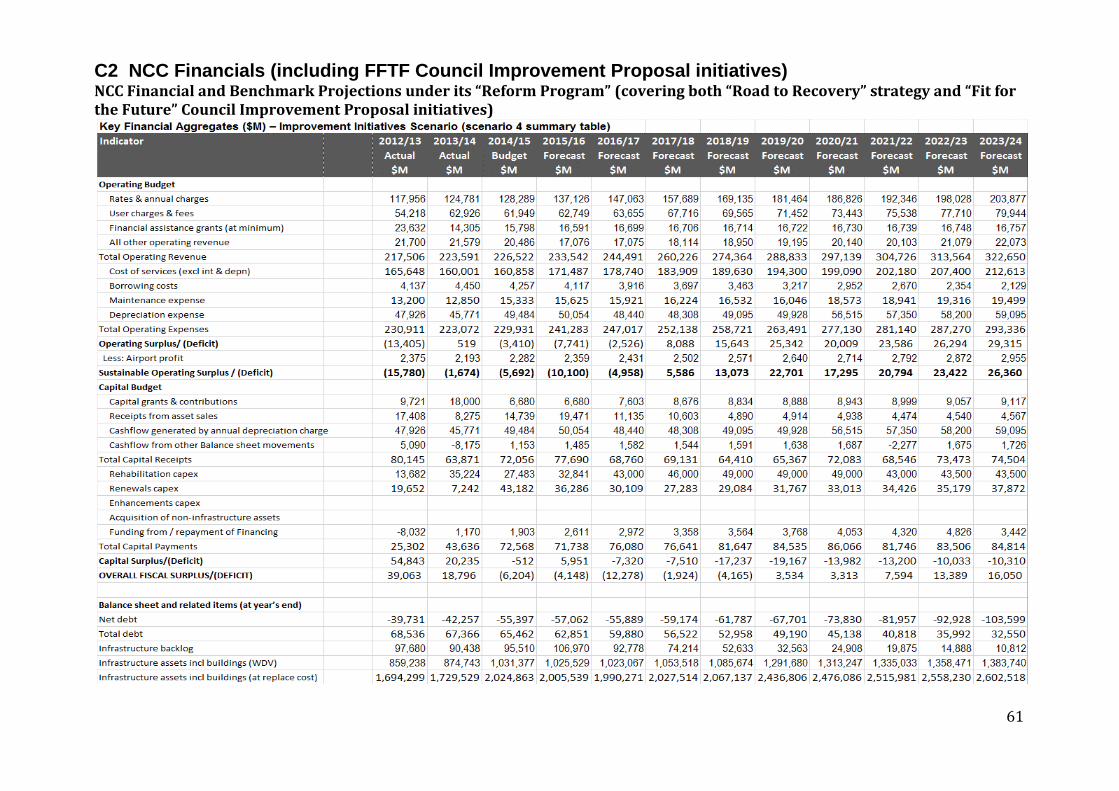
61
C2 NCC Financials (including FFTF Council Improvement Proposal initiatives) NCC Financial and Benchmark Projections under its “Reform Program” (covering both “Road to Recovery” strategy and “Fit for the Future” Council Improvement Proposal initiatives)

62
C3 NCC Financials (including FFTF Initiatives, excluding 50% interest in Airport
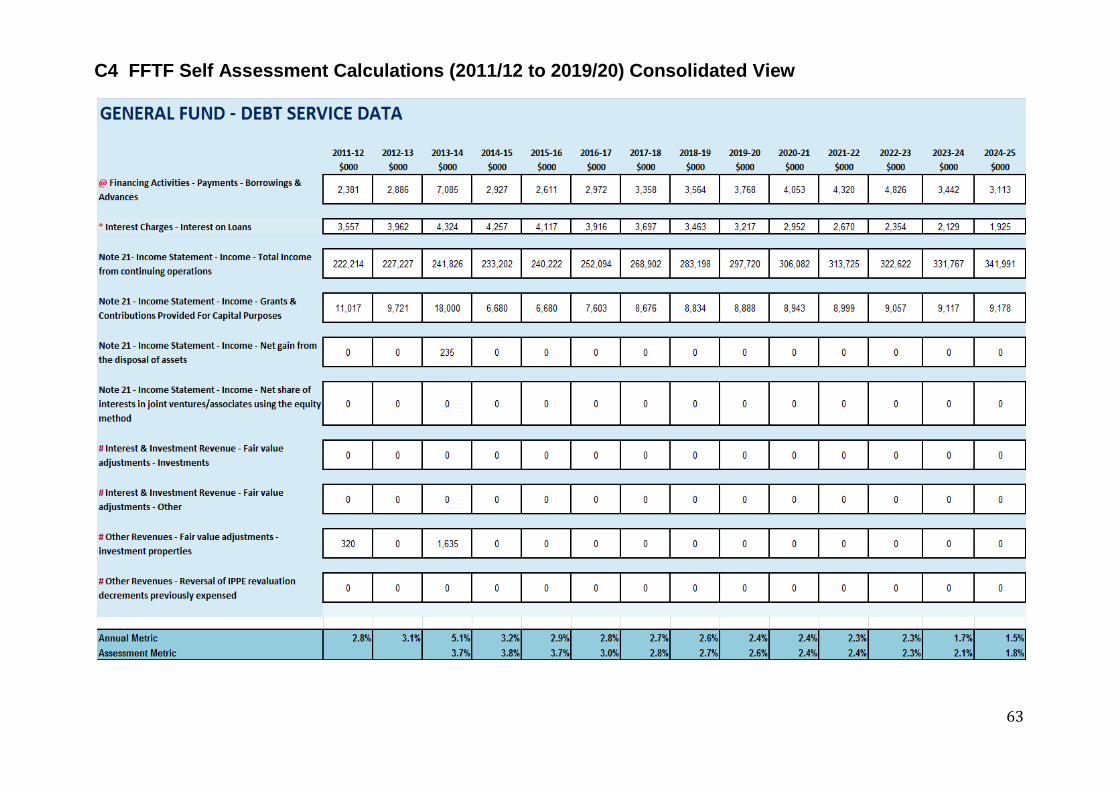
63
C4 FFTF Self Assessment Calculations (2011/12 to 2019/20) Consolidated View

64

65
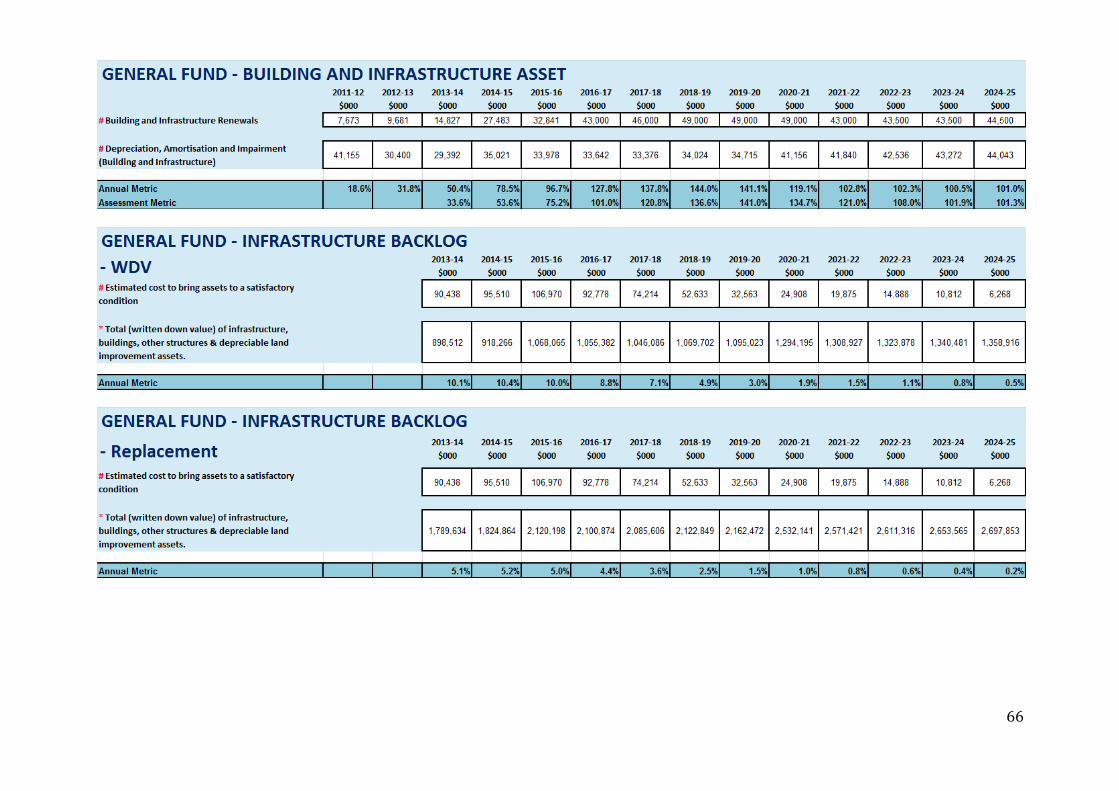
66
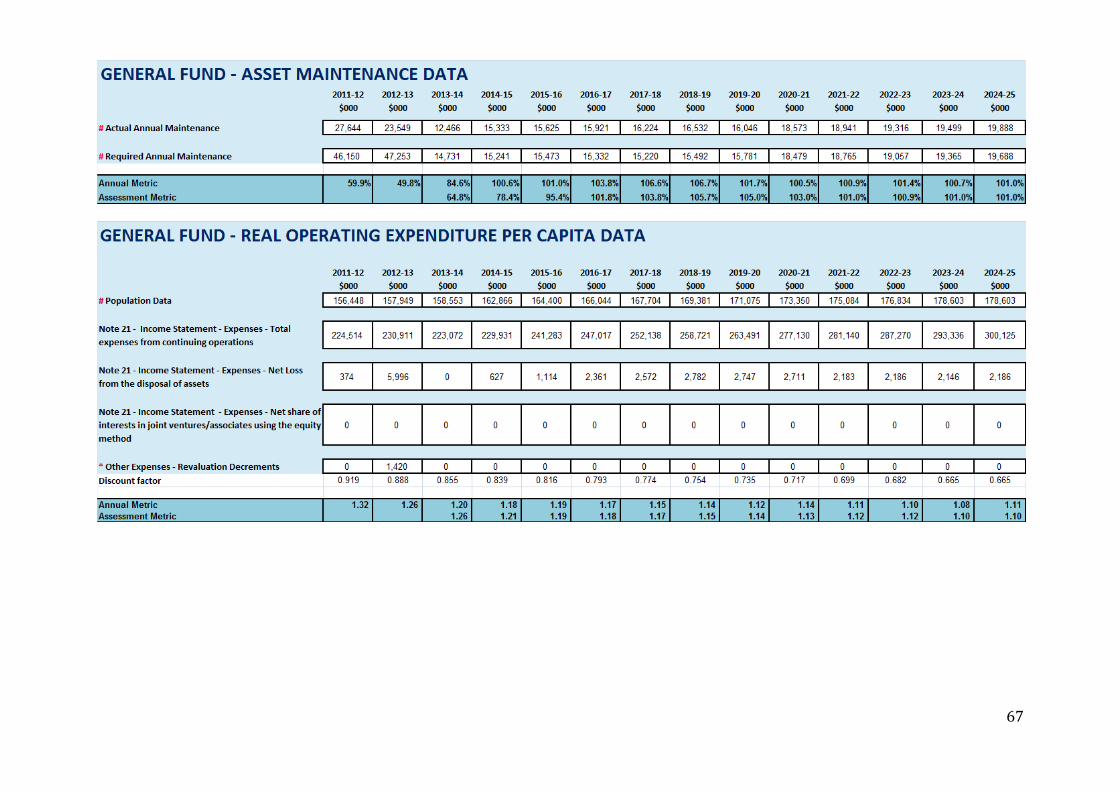
67

68
C5 FFTF Self Assessment Calculations (2011/12 to 2019/20) excluding Airport

69

70

71

72
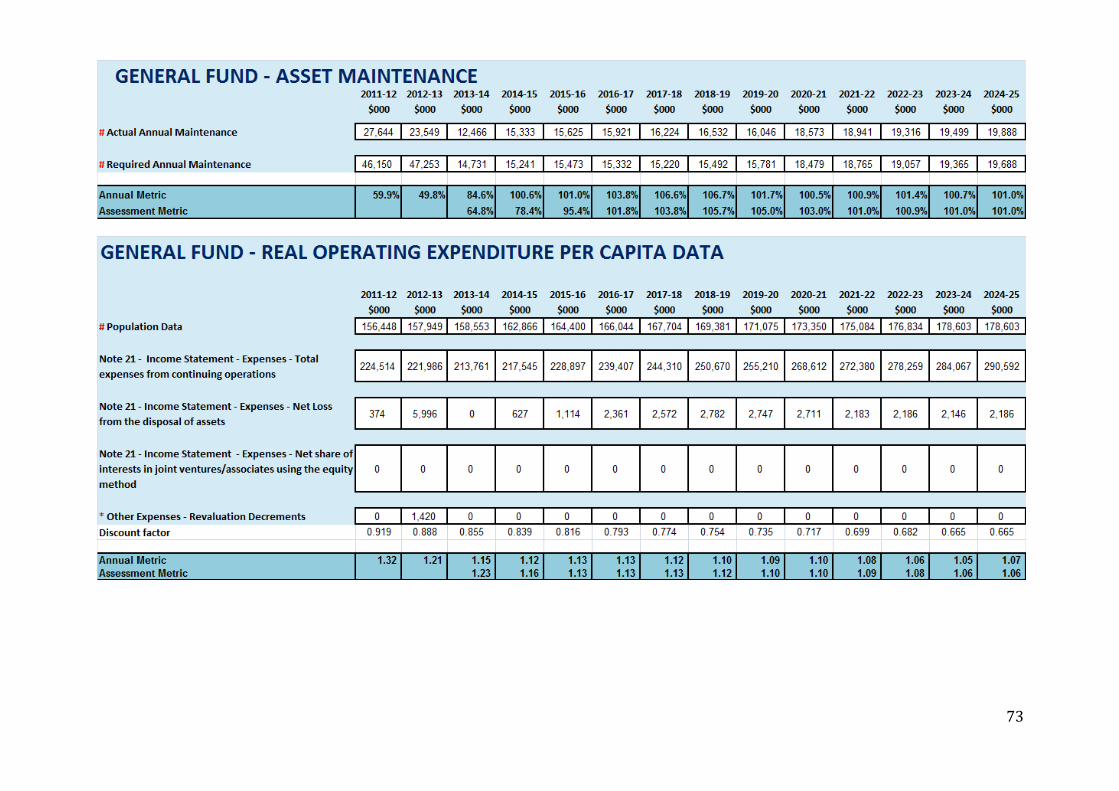
73
74
Appendix D: The Obstacles to a Merger of NCC and LMCC
D1 Geographical / Topographical Assessment of an Amalgamated Council Lake Macquarie and Newcastle LGA’s have unique characteristics and are distinctly different from each other.
• Lake Macquarie LGA surrounds a significant lake (Lake Macquarie). The lake is approximately 22km long and approximately 110km2 in area. This is approximately twice the size of Sydney Harbour and provides significant logistical challenges for council service delivery.
• Newcastle is the major regional centre for the Hunter Region. It is the primary provider of employment for the region, a logistical centre, recreational centre (cultural facilities, sporting facilities, parks and beaches) and service centre (health care, education) for the region. These essential services and facilities support residents and businesses from Newcastle and other council areas throughout NSW.
The two comparisons below provide an indication of the scale of an amalgamated LGA comprised of NCC and LMCC.
1. A side by side comparison Newcastle/Lake Macquarie and greater Sydney. The length of the area is equivalent (approximately) from north of Hornsby down to Cronulla. The width is (approximately) from east coast of Sydney to past Parramatta and closer to Blacktown, Wetherill Park and Liverpool.
Newcastle and Lake Macquarie whilst not reflecting the density of Sydney are not rural areas and are significant urban centres in their own rights. They are impacted by road congestion and will continue growing with increasing densification in certain locations. The added challenge is that whilst Council could relocate it offices, the lake constrains options and will result in the council offices being more difficult to access (irrespective of the relocation) than a similar relocation undertaken in the greater Sydney region.
2. A side by side comparison reflects the distance travelled to reach a part of Lake Macquarie LGA from the current NCC offices. The equivalent trip would be from Sydney CBD to Mt Druitt. The distance travelled is the equivalent of crossing four of the proposed Sydney region amalgamated councils (either fully or in part).
By comparison each of these proposed amalgamated Sydney councils would be able to locate their council chambers and facilities in a more central location than is possible for Newcastle / Lake Macquarie, due to the aforementioned logistical constraints.

75
The map on the left reflects the scale and impact of the lake. Lake Macquarie is approximately twice the area of Sydney harbour and due to its scale there is no opportunity (unlike Sydney harbour) for road crossings to be built (at least certainly not economically). The map demonstrates the scale of the proposed amalgamated council and the logistics of traversing the proposed LGA. (More detailed maps provide further clarity on the scale and logistics of the proposed amalgamated council). The population and business centres are towards the top right corner of the proposed LGA. This would be the logical location for a central administrative centre. It is anticipated that further population growth will occur in the CBD as the city becomes densified. In addition, the focus on urban renewal is likely to result in business expansion. Lake Macquarie is likely to have further greenfield development and a significant portion of this development is likely to occur in Lake Macquarie West. Travel times (covered later) are likely to breach the ILGRP guidelines for determining future boundary changes:
Accessibility: As a general rule, it should be possible to drive to the boundaries of a LGA from a main administration centre within 60-90 minutes in country areas and within 30 to 45 minutes in metropolitan areas. (ILGRP Report, Box 27, Page 76). This is covered later in this section with an example. It is anticipated that as population growth continues traffic congestion would be likely to increase.
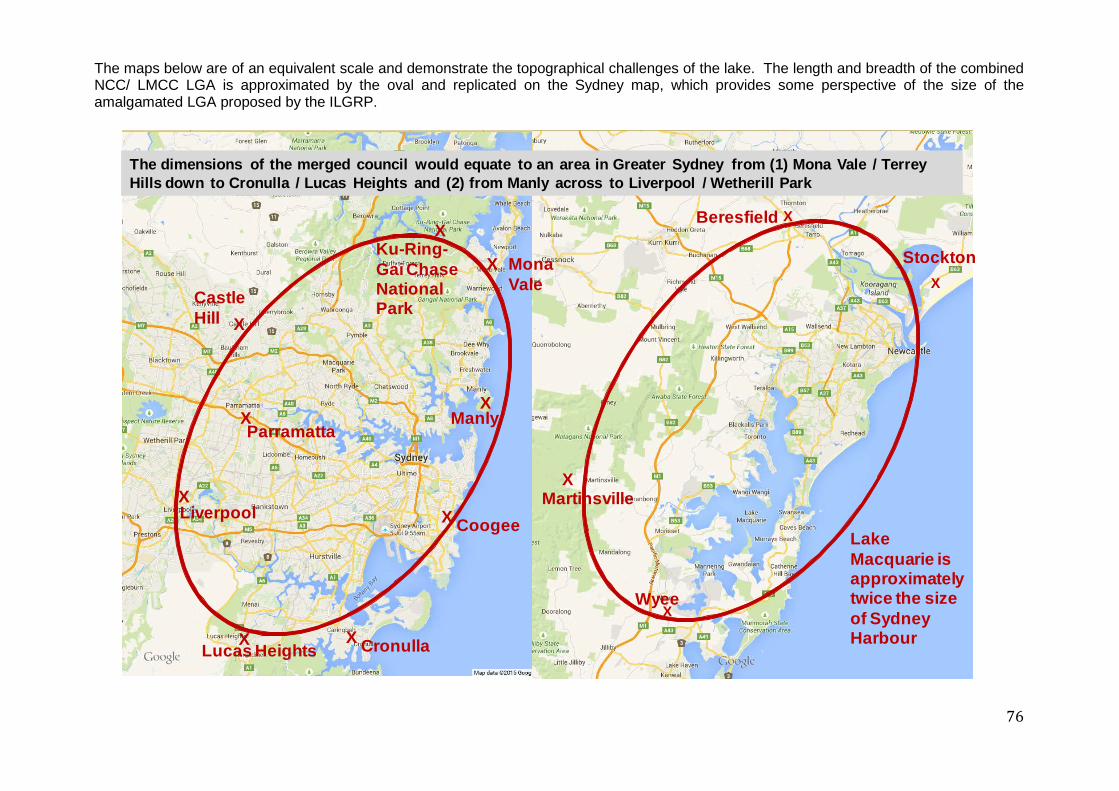
76
The maps below are of an equivalent scale and demonstrate the topographical challenges of the lake. The length and breadth of the combined NCC/ LMCC LGA is approximated by the oval and replicated on the Sydney map, which provides some perspective of the size of the amalgamated LGA proposed by the ILGRP.
The dimensions of the merged council would equate to an area in Greater Sydney from (1) Mona Vale / Terrey Hills down to Cronulla / Lucas Heights and (2) from Manly across to Liverpool / Wetherill Park
X
X
X
X
Stockton
Beresfield
Martinsville
Wyee
X
X X
X
X
X
X
X
Liverpool
Lucas Heights Cronulla
Castle Hill
Ku-Ring-Gai Chase National Park
Mona Vale
Manly
CoogeeXLake Macquarie is approximately twice the size of Sydney Harbour
Parramatta
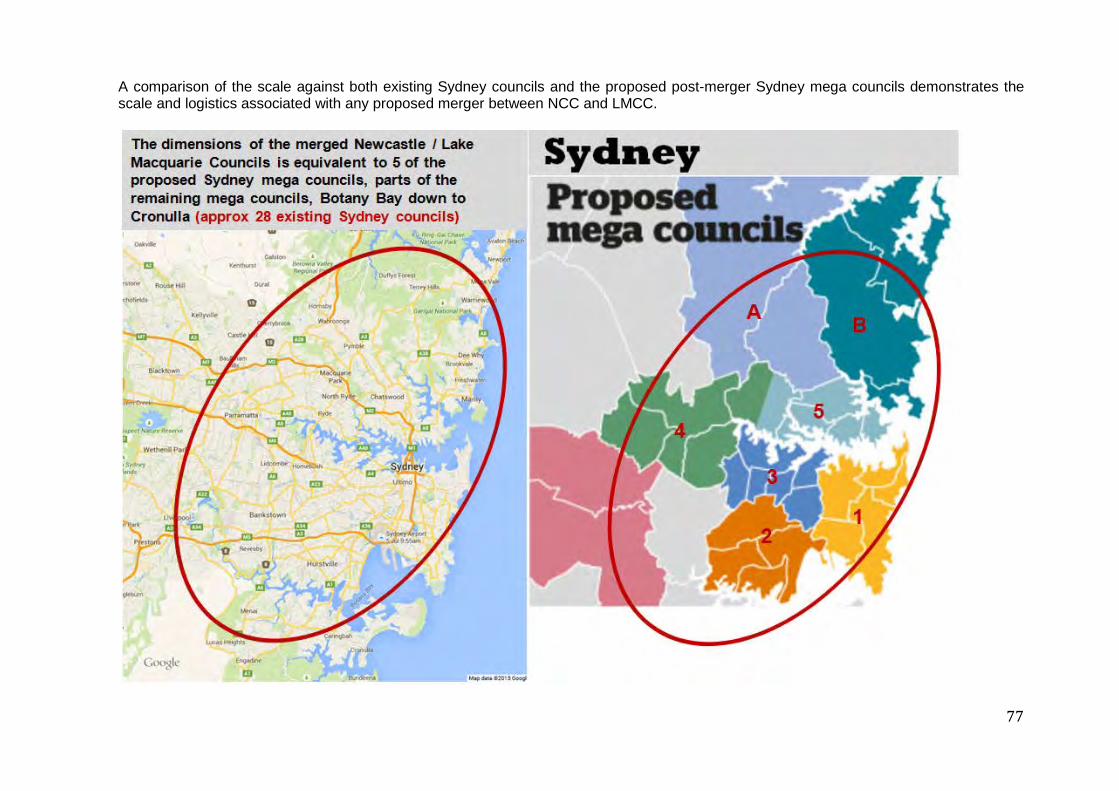
77
A comparison of the scale against both existing Sydney councils and the proposed post-merger Sydney mega councils demonstrates the scale and logistics associated with any proposed merger between NCC and LMCC.
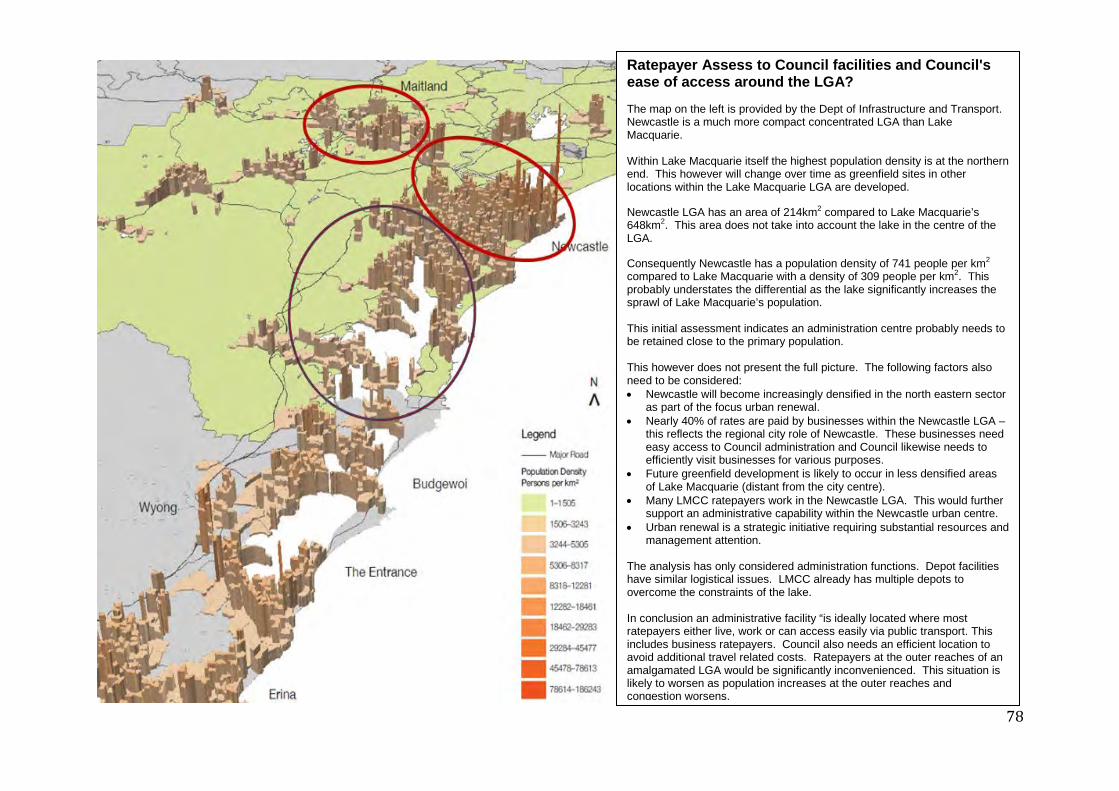
78
Ratepayer Assess to Council facilities and Council's ease of access around the LGA? The map on the left is provided by the Dept of Infrastructure and Transport. Newcastle is a much more compact concentrated LGA than Lake Macquarie. Within Lake Macquarie itself the highest population density is at the northern end. This however will change over time as greenfield sites in other locations within the Lake Macquarie LGA are developed. Newcastle LGA has an area of 214km2 compared to Lake Macquarie’s 648km2. This area does not take into account the lake in the centre of the LGA. Consequently Newcastle has a population density of 741 people per km2 compared to Lake Macquarie with a density of 309 people per km2. This probably understates the differential as the lake significantly increases the sprawl of Lake Macquarie’s population. This initial assessment indicates an administration centre probably needs to be retained close to the primary population. This however does not present the full picture. The following factors also need to be considered: • Newcastle will become increasingly densified in the north eastern sector
as part of the focus urban renewal. • Nearly 40% of rates are paid by businesses within the Newcastle LGA –
this reflects the regional city role of Newcastle. These businesses need easy access to Council administration and Council likewise needs to efficiently visit businesses for various purposes.
• Future greenfield development is likely to occur in less densified areas of Lake Macquarie (distant from the city centre).
• Many LMCC ratepayers work in the Newcastle LGA. This would further support an administrative capability within the Newcastle urban centre.
• Urban renewal is a strategic initiative requiring substantial resources and management attention.
The analysis has only considered administration functions. Depot facilities have similar logistical issues. LMCC already has multiple depots to overcome the constraints of the lake. In conclusion an administrative facility “is ideally located where most ratepayers either live, work or can access easily via public transport. This includes business ratepayers. Council also needs an efficient location to avoid additional travel related costs. Ratepayers at the outer reaches of an amalgamated LGA would be significantly inconvenienced. This situation is likely to worsen as population increases at the outer reaches and congestion worsens.

79
The third map comparison (again with both sections to the same scale) reflects a trip from Civic (NCC Administrative Centre) to Silverwater Road, Sunshine (a southern suburb of LMCC). This trip is approximately 50km and equates to a trip from Sydney CBD to Mount Druitt in both distance and duration.
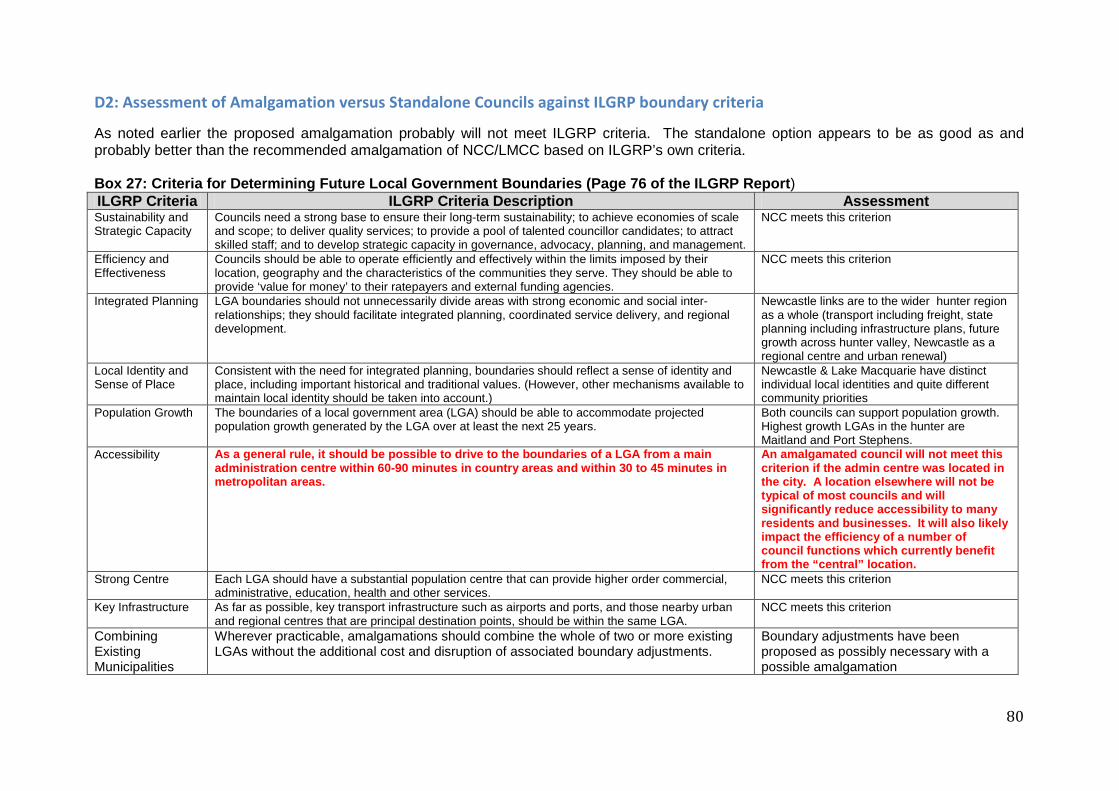
80
D2: Assessment of Amalgamation versus Standalone Councils against ILGRP boundary criteria As noted earlier the proposed amalgamation probably will not meet ILGRP criteria. The standalone option appears to be as good as and probably better than the recommended amalgamation of NCC/LMCC based on ILGRP’s own criteria. Box 27: Criteria for Determining Future Local Government Boundaries (Page 76 of the ILGRP Report) ILGRP Criteria ILGRP Criteria Description Assessment Sustainability and Strategic Capacity
Councils need a strong base to ensure their long-term sustainability; to achieve economies of scale and scope; to deliver quality services; to provide a pool of talented councillor candidates; to attract skilled staff; and to develop strategic capacity in governance, advocacy, planning, and management.
NCC meets this criterion
Efficiency and Effectiveness
Councils should be able to operate efficiently and effectively within the limits imposed by their location, geography and the characteristics of the communities they serve. They should be able to provide ‘value for money’ to their ratepayers and external funding agencies.
NCC meets this criterion
Integrated Planning LGA boundaries should not unnecessarily divide areas with strong economic and social inter-relationships; they should facilitate integrated planning, coordinated service delivery, and regional development.
Newcastle links are to the wider hunter region as a whole (transport including freight, state planning including infrastructure plans, future growth across hunter valley, Newcastle as a regional centre and urban renewal)
Local Identity and Sense of Place
Consistent with the need for integrated planning, boundaries should reflect a sense of identity and place, including important historical and traditional values. (However, other mechanisms available to maintain local identity should be taken into account.)
Newcastle & Lake Macquarie have distinct individual local identities and quite different community priorities
Population Growth The boundaries of a local government area (LGA) should be able to accommodate projected population growth generated by the LGA over at least the next 25 years.
Both councils can support population growth. Highest growth LGAs in the hunter are Maitland and Port Stephens.
Accessibility As a general rule, it should be possible to drive to the boundaries of a LGA from a main administration centre within 60-90 minutes in country areas and within 30 to 45 minutes in metropolitan areas.
An amalgamated council will not meet this criterion if the admin centre was located in the city. A location elsewhere will not be typical of most councils and will significantly reduce accessibility to many residents and businesses. It will also likely impact the efficiency of a number of council functions which currently benefit from the “central” location.
Strong Centre Each LGA should have a substantial population centre that can provide higher order commercial, administrative, education, health and other services.
NCC meets this criterion
Key Infrastructure As far as possible, key transport infrastructure such as airports and ports, and those nearby urban and regional centres that are principal destination points, should be within the same LGA.
NCC meets this criterion
Combining Existing Municipalities
Wherever practicable, amalgamations should combine the whole of two or more existing LGAs without the additional cost and disruption of associated boundary adjustments.
Boundary adjustments have been proposed as possibly necessary with a possible amalgamation

81
D3: Regional Considerations – Linkages within the Hunter Region A significant regional consideration is the number of residents from surrounding LGA’s commuting to Newcastle for work. This is a significant consideration as Newcastle is the LGA in the region with the most jobs. An analysis based on Bureau of Transport Statistics for 2012-13 indicates that Newcastle residents dominate the residential employment mix. Lake Macquarie (East) is the next largest. Lake Macquarie (West), Maitland and Port Stephens are largely equivalent. A possible reason is that each of these council areas is reasonably equivalent in proximity to Newcastle.
This assessment becomes clearer based on the table (above right). The percentage of employed people in each council area for Lake Macquarie (West), Maitland and Port Stephens are similar. Based on planning projections the two fastest growing council areas however are Maitland and Port Stephens (4 and 2 times the growth of Lake Macquarie respectively). Although only a high level analysis it would be reasonable to conclude that residents of Maitland and Port Stephens are likely to provide an increasing proportion of the future labour pool for the Newcastle LGA labour market than Lake Macquarie West based on current projections. This assessment is supported by data reflected in the ILGRP Research Report. The Spatial Analysis undertaken by SGS Economics and Planning includes the following tables (p423/4 of Supporting Information, Volume 2, Part II.
Approx 60% of projected population growth in Maitland, Port Stephens and Cessnock
-
10,000
20,000
30,000
40,000
50,000
60,000
Working in Newcastle
Residents working in Newcastle
Newcastle
Lake Macquarie - East
Lake Macquarie - West
Maitland
Port Stephens
Lower Hunter
Wyong
Origin Standard Area 3s (SA3s)where employed people are coming from?
Working in Newcastle
Total residents employed
% of employed working in Newcastle
Newcastle 48,363 72,644 67%Lake Macquarie - East 20,604 52,635 39%Lake Macquarie - West 7,253 29,442 25%Maitland 6,792 29,800 23%Port Stephens 5,630 27,045 21%
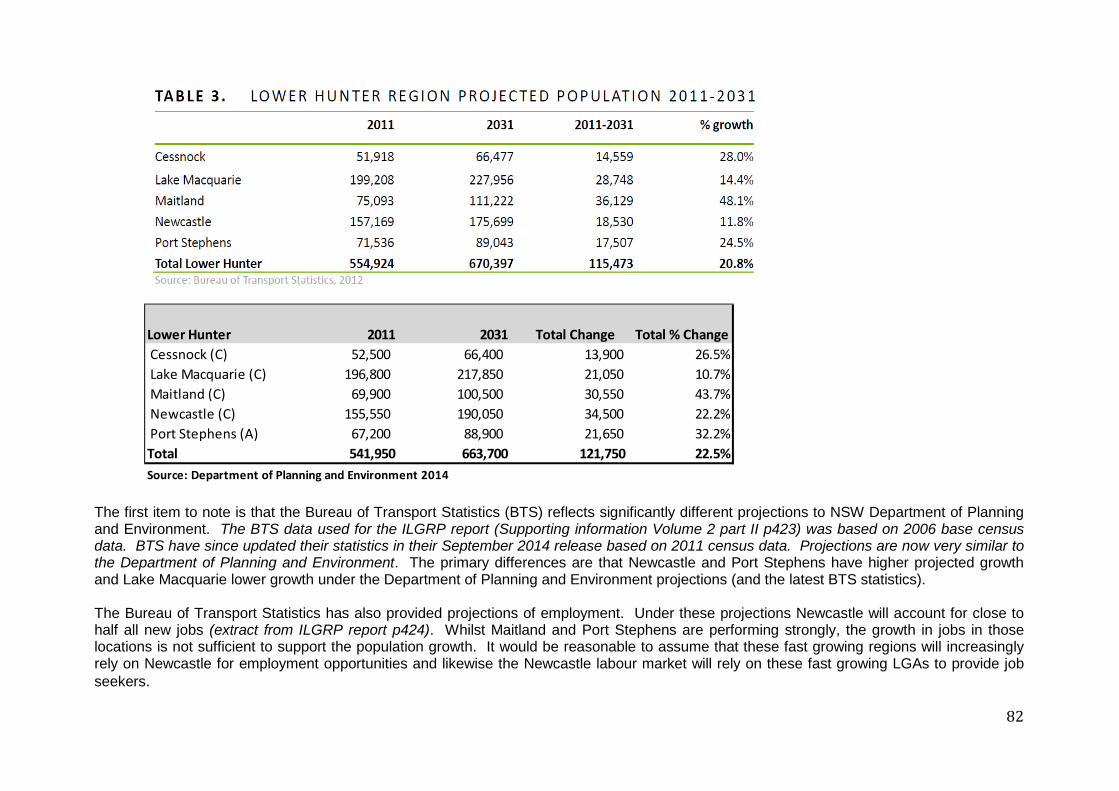
82
The first item to note is that the Bureau of Transport Statistics (BTS) reflects significantly different projections to NSW Department of Planning and Environment. The BTS data used for the ILGRP report (Supporting information Volume 2 part II p423) was based on 2006 base census data. BTS have since updated their statistics in their September 2014 release based on 2011 census data. Projections are now very similar to the Department of Planning and Environment. The primary differences are that Newcastle and Port Stephens have higher projected growth and Lake Macquarie lower growth under the Department of Planning and Environment projections (and the latest BTS statistics). The Bureau of Transport Statistics has also provided projections of employment. Under these projections Newcastle will account for close to half all new jobs (extract from ILGRP report p424). Whilst Maitland and Port Stephens are performing strongly, the growth in jobs in those locations is not sufficient to support the population growth. It would be reasonable to assume that these fast growing regions will increasingly rely on Newcastle for employment opportunities and likewise the Newcastle labour market will rely on these fast growing LGAs to provide job seekers.
Lower Hunter 2011 2031 Total Change Total % Change Cessnock (C) 52,500 66,400 13,900 26.5% Lake Macquarie (C) 196,800 217,850 21,050 10.7% Maitland (C) 69,900 100,500 30,550 43.7% Newcastle (C) 155,550 190,050 34,500 22.2% Port Stephens (A) 67,200 88,900 21,650 32.2%Total 541,950 663,700 121,750 22.5%Source: Department of Planning and Environment 2014

83
Nearly half of projected employment growth in Newcastle (46%)
Key observations regarding the high level analysis on commuting are:
• Most jobs in Newcastle filled by Newcastle residents. • Lake Macquarie East is a significant source of job holders. • Lake Macquarie West is however similar contributor as Maitland & Port Stephens. • Maitland / Port Stephens key areas of future residential growth. • Based on this analysis traffic is likely to increase more rapidly between locations of high residential growth and Newcastle
(primary source of current and future employment). • Data presented from prior to opening of Hunter Expressway – future trends are likely to favour areas linked via the
expressway.
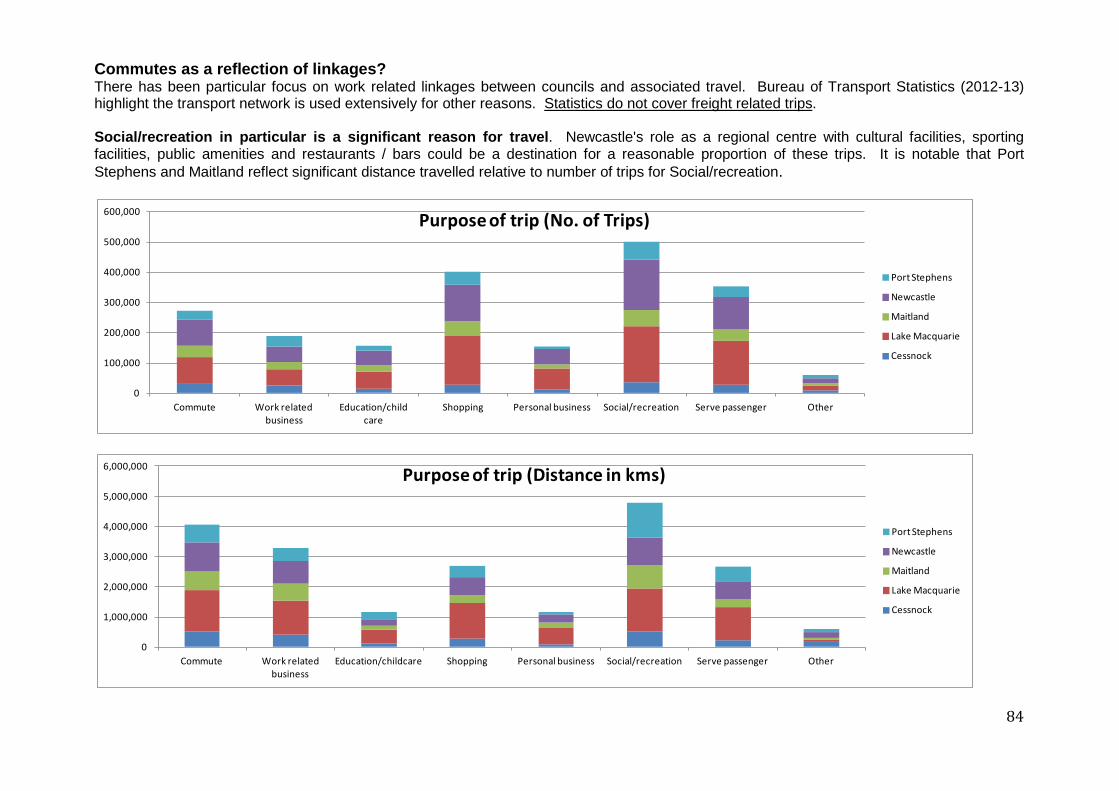
84
Commutes as a reflection of linkages? There has been particular focus on work related linkages between councils and associated travel. Bureau of Transport Statistics (2012-13) highlight the transport network is used extensively for other reasons. Statistics do not cover freight related trips. Social/recreation in particular is a significant reason for travel. Newcastle's role as a regional centre with cultural facilities, sporting facilities, public amenities and restaurants / bars could be a destination for a reasonable proportion of these trips. It is notable that Port Stephens and Maitland reflect significant distance travelled relative to number of trips for Social/recreation.
0
100,000
200,000
300,000
400,000
500,000
600,000
Commute Work related business
Education/child care
Shopping Personal business Social/recreation Serve passenger Other
Purpose of trip (No. of Trips)
Port Stephens
Newcastle
Maitland
Lake Macquarie
Cessnock
0
1,000,000
2,000,000
3,000,000
4,000,000
5,000,000
6,000,000
Commute Work related business
Education/childcare Shopping Personal business Social/recreation Serve passenger Other
Purpose of trip (Distance in kms)
Port Stephens
Newcastle
Maitland
Lake Macquarie
Cessnock

85
Impact of freight related activity in the Hunter Valley Based on the analysis summarised below road based freight will be a key consideration in future infrastructure investment and a “supply chain” whole of region approach is considered for future planning. Road-based freight haulage requirements across the Hunter Valley are forecast to nearly double in the 20-year period from 2011. A breakdown of this forecast growth is provided in Table 2 bearing in mind that inbound logistics volumes have a direct correlation to coal mining production and coal exports are expected to double by 2025 (currently 121 Mtpa). Table 2: Headline road freight demand across the Hunter Valley Freight (HEIP, p30)
Between 2001 and 2011, the Hunter Valley (excluding Newcastle and Sydney) had the largest and fastest-growing population increase in NSW – up by 31,500 (equivalent to a 14 per cent increase). Non-freight traffic is predominantly associated with community or personal travel. (HEIP p28). As noted, high growth areas will remain in locations which utilise the same transport network as freight.
Freight contention with commuter traffic: the primary impact is commuter traffic from competing locations: Household Travel Survey Data for 2010/11 from the NSW Bureau of Freight Statistics was analysed for the Hunter Region and Maitland/Cessnock in particular and from this, the investigation found that: • Commuter trips comprise around 15 per cent of average weekday
trips; • Social and recreational trips comprise 20 per cent to 25 per cent; • Shopping trips comprise around 17 per cent. • Overall, car travel is the dominant mode in the non-freight sector
throughout the Hunter Region. It should be noted that while commuter trips represent around 15 per cent of all trips, time of day travel is dominated by morning and evening peak trips that conflict with inbound road freight movements to the Hunter, which are timed so to arrive to be met by the incoming workforce. (HEIP, p30) Major choke points in the road network are across the Hunter Region are across the region generally and include Newcastle (Kooragang Island) CORRIDOR PERFORMANCE AND IMPEDIMENTS Current major choke points on the road network serving the Hunter are: • Singleton south and north township; • Muswellbrook township; • Scone level crossings; • New England Highway particularly at the turn off onto the Golden
Highway; • Kooragang Island. Looking at predictive 2031 forecast freight flows, it is evident that the corridor along the Golden Highway will encounter significant impact due to the continuing development of the Central Hunter Region and the proposed large-scale development of the Ulan region. (HEIP, p37)

86
The conclusions reached from this analysis are: Newcastle has important transport linkages across the Hunter Region due to its role as a regional city including being an employment and recreational centre across the region and due to its important role in the supply chain (major port, business centre, and airport). Linkages beyond Lake Macquarie are likely to increase rapidly due to more rapid population growth in other parts of the hunter and the rapid increase in both mining and non-mining related freight activity. Government infrastructure plans reflect this focus. Specifically:
• Newcastle is the primary LGA in the Hunter Region for local jobs. • Newcastle will retain and consolidate this role based on projections. • Maitland, Port Stephens are Cessnock are projected to have the fastest population growth in the lower hunter. • Newcastle will generate more jobs than population growth would indicate can be filled by local residents of the LGA and fast growing
LGA’s in the hunter will not generate sufficient jobs to support jobs locally for their respective growing populations. • A plausible scenario is that Newcastle will increasingly become an employment hub for all other LGAs within the lower hunter. • Residents across the Hunter Region travel for a variety of purposes. Commuting constitutes only a limited component of all travel and
other purposes across the region involve travel beyond immediate localities. • Freight traffic (both mining and non-mining) is a significant contributor to traffic volumes and is projected to grow significantly across the
Hunter Region. Freight traffic is projected to increase significantly faster than other purposes. • The primary reason for congestion during commuting peaks (as documented) is due to the combined impact of residents commuting to
work combined with a peak in volume of freight related traffic. The primary areas impacted are the major freight corridors across the Hunter Region.
• State Government infrastructure plans reflect the regional focus required in transport planning with significant investment planned for key transport corridors across the region.
87
D4: Integrated Planning: Where is the Government Focus in the Hunter Region? The Hunter Economic Infrastructure Plan (HEIP) provides a good basis for assessing future plans for the region due to its referencing of other key planning documents and its relatively recent publication (2013). As noted in the report:
“It draws on initiatives from the existing regional and state-wide plans and strategies plus new studies examining requirements for specific infrastructure. These plans include: The Hunter Regional Action Plan, The Hunter Economic Infrastructure Plan (this report), The Hunter Strategic Infrastructure Plan being developed by the Department of Planning and Infrastructure with Council’s and The Hunter Development Corporation, The Hunter Regional Transport Plan being developed by Transport for NSW, The Upper Hunter Strategic Regional Landuse Plan and the revised Lower Hunter Regional Strategy.”
Key messages are:
• The NSW State Infrastructure Strategy 2012 – 2032 prepared by Infrastructure NSW presents an up to date assessment of regional requirements.
• The Strategy contains $2.5 billion worth of priority projects for the Hunter Region. • It identifies the urgency to invest in projects to support mining and other industries as well as improve quality of life. • The Hunter is seen as being a critical part of the future economic prosperity of NSW. • The Hunter Coal Chain is identified as a major priority for investment. • The strategy also recognises that specific transport challenges are being experienced in the coal community with rapid population
growth and increased traffic through regional townships. • It recommends that priority is given to addressing congestion, safety and amenity impacts for towns like Scone, Singleton and
Muswellbrook. In conclusion, the Hunter Infrastructure Plan provides an integrated picture of future investments in transport infrastructure. There are also expansion plans associated with rail, port and airport infrastructure. These plans are focusing on the Hunter Valley as an integrated economic region . It is important that Newcastle, as an important contributor to the region (regional city, key logistics hub, key location of businesses and associated source of employment), retains a regional focus and partners government agencies to realise the full economic and social potential of both Newcastle as an important regional city and partner in an integrated approach to the ongoing growth and development of the region.

88
D5: Development Applications across the Hunter Region (2013/14) NCC processed the highest value of development applications of any council within the Hunter Valley. Hunter councils (excluding Newcastle and Lake Macquarie) however involve significant development activity. This, combined with the focus of government related infrastructure activity, provides an integrated picture of where the primary areas of development are across the region.
Source: OLG Comparative Data 2013/14
The Hunter Valley is also a significant contributor to Development Application (DA) activity across NSW. The total value of DA’s across NSW for 2013/14 was $25.69b. The Hunter Valley councils processed $1.64b over the same period of 6.4% of all DA’s by value.

89
D6: Council’s Internal High level Assessment of functions potentially impacted by Economies/Diseconomies of Scale A high level analysis of NCC's operating costs has been completed at the cost centre level. An assessment of where economies / diseconomies of scale may exist in the event of a proposed amalgamation have been made based high level assessment of Council services, informed by the conclusions drawn from relevant international research. The topographical issues already noted have been considered in this assessment.
Sum of Expenses ex Depn Classificatio
Business Unit
Possible Economies
of Scale
Limited Economies
of ScaleNo Scale Impact
Possibility of Diseconomies
Regional Service Grand Total
Civil Works 1,095,536 7,574,791 16,894,049 25,564,376Commercial Property 281,973 222,549 1,896,849 2,401,371Council & Legal Services 1,848,514 878,198 2,726,712Cultural Facilities 234,524 6,817,378 7,051,902Customer Service 1,338,478 405,007 1,804,424 3,547,909Development and Building 201,110 4,156,629 4,357,739Director - Corporate 651,642 2,355,032 3,006,674Director - Infrastructure 486,540 486,540Director - Planning & Regulatory 408,821 408,821Facilities and Recreation 15,241,142 6,205,050 21,446,192Finance 191,537 3,552,965 6,569,522 10,314,024General Manager's Office 793,587 793,587Human Resources 196,623 1,934,980 5,669,250 7,800,853Information Technology 1,013,989 2,977,075 3,991,064Infrastructure Planning 4,482,866 4,966,917 9,449,783Libraries 618,785 1,337,411 3,983,594 5,939,790Lord Mayor's Office 290,054 290,054Newcastle Airport 7,384,667 7,384,667Projects and Contracts 229,256 351,650 404,211 1,005,891 1,991,008Regulatory Services 350,270 5,700,319 6,050,589Strategic Planning 4,523,229 2,334,842 6,858,071Waste Management 6,906,434 30,053,919 36,960,353Grand Total 8,901,179 21,761,466 62,892,046 31,011,424 44,255,964 168,822,079Capital works 68,321,000 68,321,000 Total 8,901,179 21,761,466 62,892,046 99,332,424 44,255,964 237,143,079
The table below classifies current total NCC costs (excluding depreciation) into categories based on the nature of the potential impact (from possible economies to possible diseconomies). This is to help approximate the quantum of costs against which there might be an economy of scale impact (beneficial or adverse). Assessment • Possible economies of scale are associated with costs which
do not need to be replicated based on scale. There will be some costs associated with addressing span of control considerations and salary points associated with higher skill requirements. Volume in many instances also will not reduce but will need to be absorbed (delegated). Only a small percentage of total costs generate potential economy of scale opportunities.
• Limited economies of scale reflect there might be some synergies in an amalgamation however the scale of these are less certain. Approx 9% of costs have “limited economy of scale” opportunities.
• A significant portion of Council's costs are proportionate to scale. As some of these functions are labour intensive and outdoors the logistics of a larger area/workforce might result in some diseconomies (as per international experience). Approximately 27% of total costs fall into this category.
• The possible diseconomies relate to the challenges highlighted in this submission. There are possible diseconomies where there is greater complexity, bottlenecks, challenges in prioritising activities and logistical issues. Capital works is a notable example. A Significant proportion of total costs fall into this category (approx 42%). A small percentage of inefficiency has the potential to outweigh any potential gains elsewhere.
• NCC has significant roles that are already regional in nature. Examples include the waste facility, cultural functions and the airport. The cost of operating these facilities would be little changed in any amalgamation.
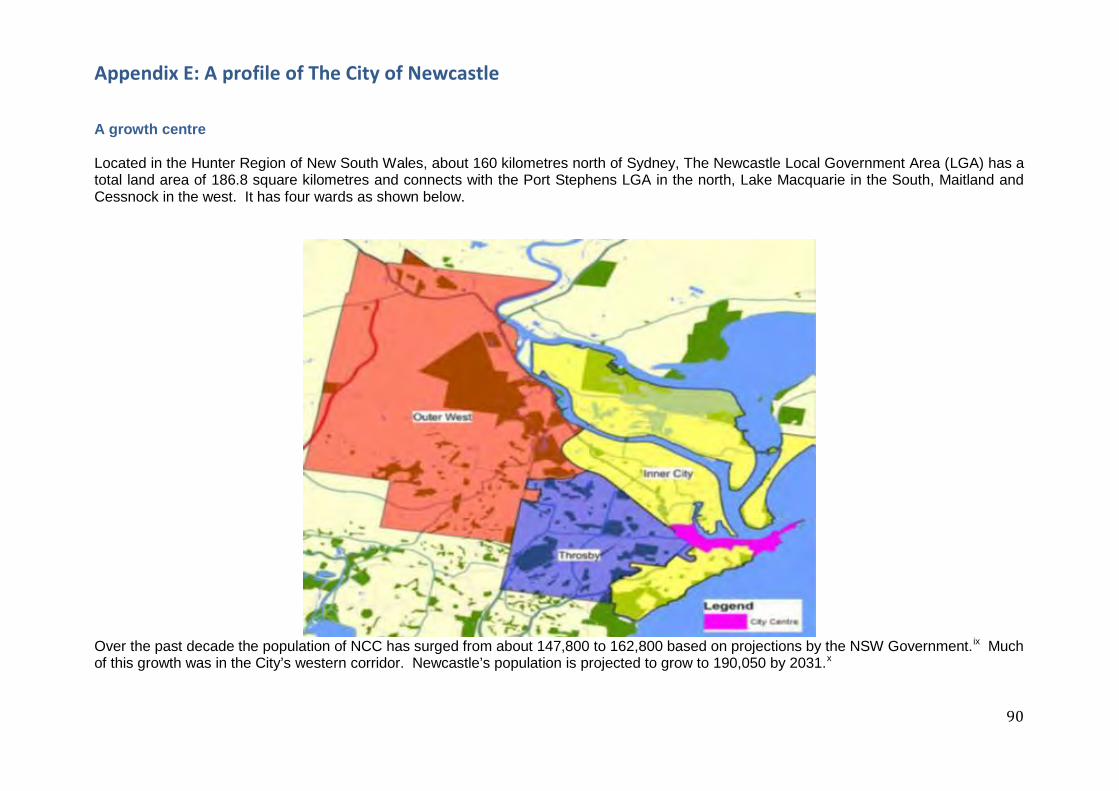
90
Appendix E: A profile of The City of Newcastle
A growth centre Located in the Hunter Region of New South Wales, about 160 kilometres north of Sydney, The Newcastle Local Government Area (LGA) has a total land area of 186.8 square kilometres and connects with the Port Stephens LGA in the north, Lake Macquarie in the South, Maitland and Cessnock in the west. It has four wards as shown below.
Over the past decade the population of NCC has surged from about 147,800 to 162,800 based on projections by the NSW Government.ix Much of this growth was in the City’s western corridor. Newcastle’s population is projected to grow to 190,050 by 2031.x

91
While Lake Macquarie is currently the most populated LGA north of Sydney (which is why the Panel saw it as a good fit for Newcastle), most other LGAs in the Lower Hunter and Central Coast will grow two to four times faster than Lake Macquarie by 2031. See chart below.
A social centre The City is a proud, welcoming and plural community that has coped with earthquakes, floods and drastic industrial restructuring, but continues to flourish and evolve. It also offers a remarkably diverse natural environment – from coastal headlands and beaches to wetlands, mangrove forests, steep ridges and rainforest gullies. This diversity presents significant challenges in terms of maintaining this environment.

92
Newcastle City Council’s Social Profile, 2011
Source: Australian Bureau of Statistics Census of Population and Housing 2011 and Estimated Resident Population 2011. A regional centre The wider Newcastle metropolitan area is the largest regional centre in New South Wales and the second largest non-capital urban centre in Australia.
The City has undergone a major transformation over the last two decades, with strong growth in services activity and employment. In particular, there has been an emphasis on knowledge industries, with the expansion of health, higher education, research centres, defence industries and professional and technical services. These industries, along with the traditional energy and engineering sectors, make Newcastle the recognised commercial and human services hub for the Hunter Region as a whole. NCC, like the City of Wollongong (which is not being recommended for a merger), has economic, transport, political and administrative characteristics that distinguish it from other local government areas within its region, especially Lake Macquarie (its proposed suitor). They are:
• Growth challenges: Newcastle LGA has a self-contained CBD with sufficient underutilised land space (left by the closure of heavy industry) to accommodate future infill development of offices, shops, light industry, entertainment complexes and apartments. By contrast the Lake Macquarie LGA is largely a residential area of green-field estates. The planning and development requirements of each municipality (and hence its community concerns and priorities) are quite distinct and different.
93
• Transport modes: Newcastle LGA has largely self-contained local roads. The M1 Pacific Motorway links Wahroonga, a northern suburb
of Sydney, to Beresfield, a north-western suburb of Newcastle. From there (via a link provided by the A1 New England Highway) the major freeway to Brisbane is the A1 Pacific Highway. East-west, the major freeways are the A15 Newcastle Link Road which connects the Newcastle CBD to the M1 Pacific Motorway and the M15 Hunter Expressway which runs to Branxton within the Cessnock LGA. Other feeder and arterial roads (eg B63, B68, B82, and A43) important to the Newcastle LGA are largely self-contained within the City’s boundaries. Hence future infrastructure planning does not require the integration of NCC with the LMCC or any other adjacent Council.
• Political priorities: NCC’s challenge is transitioning from being a heavy industry steel city to a modern services-based CBD through
urban renewal initiatives whereas the LMCC’s challenge is accommodating a fast growing residential population in broad-acre housing estates where new amenities are needed. Merging these two municipalities would dilute the focus and retard the urban planning of each Council because its constituents have very different place management aspirations and concerns. Newcastle is engaged in urban consolidation and renewal within a largely brown-field setting whereas Lake Macquarie is managing urban sprawl through green-field development within a sensitive natural environment.
• Topographic features: There are topographic barriers to jointly administering the municipalities of Lake Macquarie and Newcastle as a
single local government entity. The large lake that defines the Lake Macquarie LGA makes for a complex road and water transport network within the municipality. Servicing urban centres scattered around the vast inlets of the lake from a joint council administration centre in Newcastle would be more expensive than doing so from the existing Lake Macquarie Council administration centre in Speers Point, which is on the northern shore of Lake Macquarie, in Cockle and Warners Bays, 17 km west-southwest of NCC. Retaining both administration centres for convenience would defeat the prime purpose of a merger.
A commercial hub The greater Newcastle area is the commercial and administrative centre of the Hunter Region with foundations based on a diverse commercial, cultural, trade and industrial economy. Newcastle LGA covers around 30% of the Hunter’s developed industrial space and 80% of the office space.xi 87,489 jobs in Newcastle LGA contribute to the estimated Gross Regional Product of $14.044 billon.xii The Port of Newcastle is Australia’s largest coal export outlet by volume and a growing multi-purpose cargo hub. In 2012/13 it handled 150 million tonnes of bulk cargo, worth $19 billion. The port precinct hosts a range of ship repair and other port related services spread over 700 hectares. It remains the economic and trade centre for the Hunter Region as well as for much of Northern NSW. While Newcastle’s industrial sector continues to play a vital role, Newcastle is no longer a ‘steel city’. A substantial and growing portion of the Newcastle economy is now based around services.

94
A cultural centre Newcastle is a contemporary city rich in history, arts and culture. As Australia’s second oldest city its public places have historical significance with a blending of colonial and modern architecture. Newcastle has a vibrant performing arts scene consisting of dance, theatre and music. The City’s visual arts projects, initiatives, spaces and practitioners attract widespread acclaim. The civic cultural precinct encompasses the Newcastle Art Gallery, Conservatorium of Music, Civic Theatre and Playhouse and the Newcastle Museum. Players, spectators and visitors throng to major national and international sports events. Newcastle is home to two major national teams, the Newcastle Knights Rugby League and Newcastle Jets Football Club. Other major sports include surfing, netball, basketball, soccer, AFL, rugby union and hockey. These activities all play a role in Newcastle’s identity, culture and spirit.
A city in transition Like other post-industrial cities, Newcastle has undergone a significant transition over the past twenty years. Previously based on heavy industry, Newcastle now has a plural economy where residents enjoy the benefits and amenities of a large city and the pace and lifestyle of a regional town. The City’s higher education and advanced health care facilities are world class and serve a wider population of approximately 600,000 people. Newcastle is a nationally recognised centre for medical and environmental research. The City’s credentials and future potential have attracted funding from Federal and State Governments through investments in infrastructure such as the Hunter Expressway on the city’s western edge and the Newcastle Inner City Bypass, Intertrade Industrial Park on the former BHP steelmaking site, Newcastle Courthouse complex, the Honeysuckle project, Hunter Stadium and the Hunter Medical Research Institute. Newcastle Airport and surrounding facilities continue to expand to cater for predicted domestic and international aviation growth. The City’s local transport habits are also changing as residents become more conscious of the impact of transport choices on their health and the environment. The 2011 Census found that the number of Novocastrians catching public transport or riding bikes to work has increased over recent years.
Newcastle 2030 - Community Strategic Plan Newcastle 2030 is Council’s shared community vision developed as a guide to inform policies and actions throughout the city for the next twenty years. With direct input from a wide cross-section of the community, NCC now aims to be a “Smart, Liveable and Sustainable City”. Newcastle wants to renew and grow its CBD for the whole of the Hunter Valley, something that would be difficult to achieve if it got embroiled in the development/ environmental tensions of residential expansion through the lake country to its south.

95
Further information about Newcastle 2030 can be obtained at http://www.newcastle.nsw.gov.au/about_newcastle/Newcastle2030.
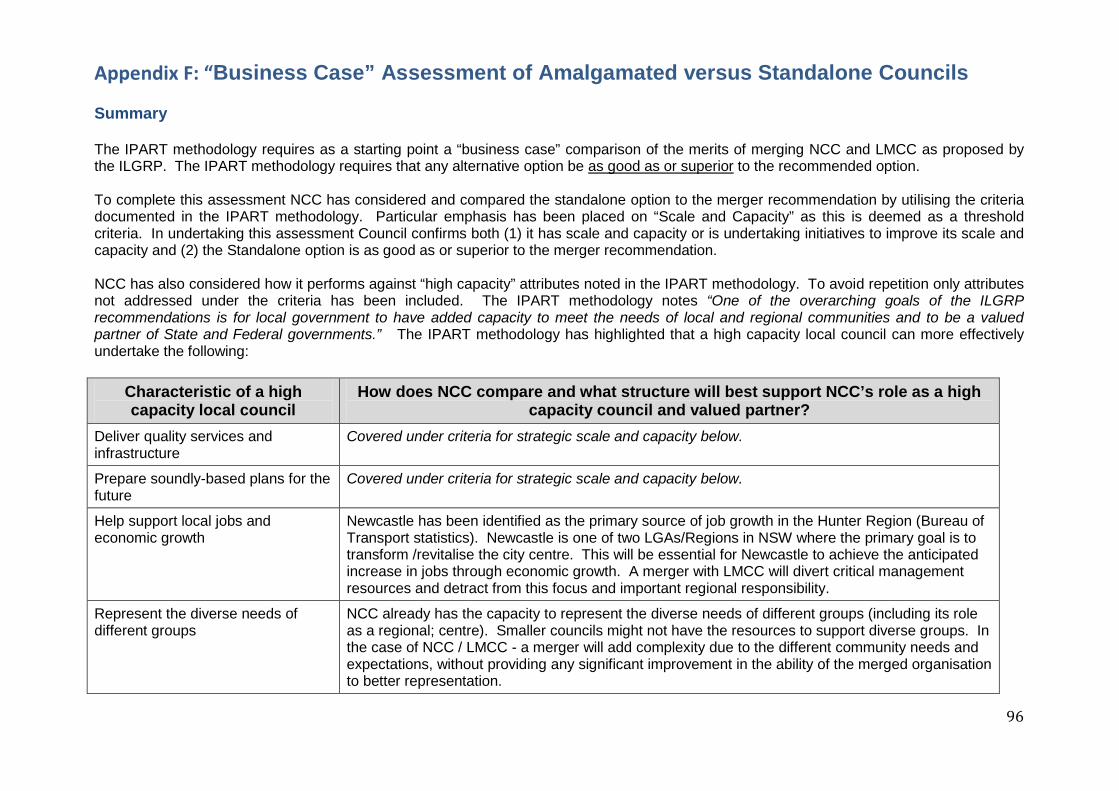
96
Appendix F: “Business Case” Assessment of Amalgamated versus Standalone Councils Summary The IPART methodology requires as a starting point a “business case” comparison of the merits of merging NCC and LMCC as proposed by the ILGRP. The IPART methodology requires that any alternative option be as good as or superior to the recommended option. To complete this assessment NCC has considered and compared the standalone option to the merger recommendation by utilising the criteria documented in the IPART methodology. Particular emphasis has been placed on “Scale and Capacity” as this is deemed as a threshold criteria. In undertaking this assessment Council confirms both (1) it has scale and capacity or is undertaking initiatives to improve its scale and capacity and (2) the Standalone option is as good as or superior to the merger recommendation. NCC has also considered how it performs against “high capacity” attributes noted in the IPART methodology. To avoid repetition only attributes not addressed under the criteria has been included. The IPART methodology notes “One of the overarching goals of the ILGRP recommendations is for local government to have added capacity to meet the needs of local and regional communities and to be a valued partner of State and Federal governments.” The IPART methodology has highlighted that a high capacity local council can more effectively undertake the following:
Characteristic of a high capacity local council
How does NCC compare and what structure will best support NCC’s role as a high capacity council and valued partner?
Deliver quality services and infrastructure
Covered under criteria for strategic scale and capacity below.
Prepare soundly-based plans for the future
Covered under criteria for strategic scale and capacity below.
Help support local jobs and economic growth
Newcastle has been identified as the primary source of job growth in the Hunter Region (Bureau of Transport statistics). Newcastle is one of two LGAs/Regions in NSW where the primary goal is to transform /revitalise the city centre. This will be essential for Newcastle to achieve the anticipated increase in jobs through economic growth. A merger with LMCC will divert critical management resources and detract from this focus and important regional responsibility.
Represent the diverse needs of different groups
NCC already has the capacity to represent the diverse needs of different groups (including its role as a regional; centre). Smaller councils might not have the resources to support diverse groups. In the case of NCC / LMCC - a merger will add complexity due to the different community needs and expectations, without providing any significant improvement in the ability of the merged organisation to better representation.
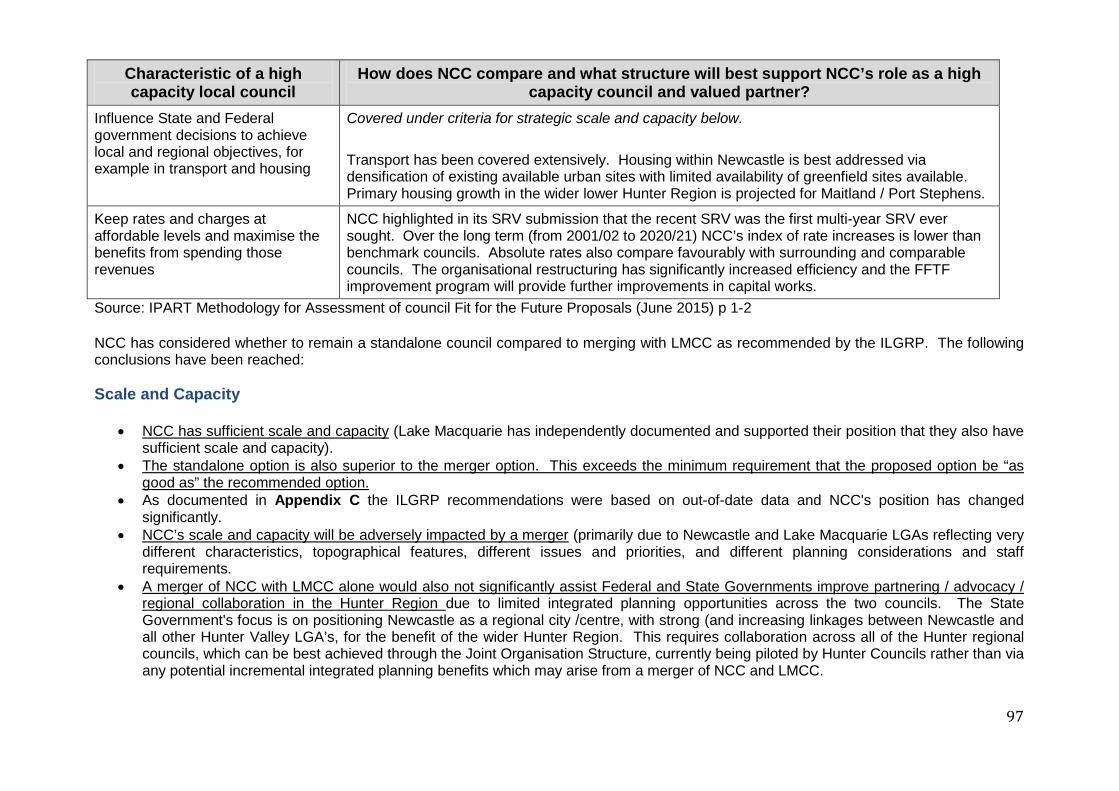
97
Characteristic of a high capacity local council
How does NCC compare and what structure will best support NCC’s role as a high capacity council and valued partner?
Influence State and Federal government decisions to achieve local and regional objectives, for example in transport and housing
Covered under criteria for strategic scale and capacity below. Transport has been covered extensively. Housing within Newcastle is best addressed via densification of existing available urban sites with limited availability of greenfield sites available. Primary housing growth in the wider lower Hunter Region is projected for Maitland / Port Stephens.
Keep rates and charges at affordable levels and maximise the benefits from spending those revenues
NCC highlighted in its SRV submission that the recent SRV was the first multi-year SRV ever sought. Over the long term (from 2001/02 to 2020/21) NCC’s index of rate increases is lower than benchmark councils. Absolute rates also compare favourably with surrounding and comparable councils. The organisational restructuring has significantly increased efficiency and the FFTF improvement program will provide further improvements in capital works.
Source: IPART Methodology for Assessment of council Fit for the Future Proposals (June 2015) p 1-2 NCC has considered whether to remain a standalone council compared to merging with LMCC as recommended by the ILGRP. The following conclusions have been reached: Scale and Capacity
• NCC has sufficient scale and capacity (Lake Macquarie has independently documented and supported their position that they also have
sufficient scale and capacity). • The standalone option is also superior to the merger option. This exceeds the minimum requirement that the proposed option be “as
good as” the recommended option. • As documented in Appendix C the ILGRP recommendations were based on out-of-date data and NCC's position has changed
significantly. • NCC’s scale and capacity will be adversely impacted by a merger (primarily due to Newcastle and Lake Macquarie LGAs reflecting very
different characteristics, topographical features, different issues and priorities, and different planning considerations and staff requirements.
• A merger of NCC with LMCC alone would also not significantly assist Federal and State Governments improve partnering / advocacy / regional collaboration in the Hunter Region due to limited integrated planning opportunities across the two councils. The State Government's focus is on positioning Newcastle as a regional city /centre, with strong (and increasing linkages between Newcastle and all other Hunter Valley LGA’s, for the benefit of the wider Hunter Region. This requires collaboration across all of the Hunter regional councils, which can be best achieved through the Joint Organisation Structure, currently being piloted by Hunter Councils rather than via any potential incremental integrated planning benefits which may arise from a merger of NCC and LMCC.

98
• The State Government has promoted standardised planning guidelines to assist with greater uniformity for developers. The implementation of this should assist in simplifying developer / building projects across the State. As noted in Appendix D there is significant DA activity within the Hunter (ex Newcastle and Lake Macquarie). A region-wide perspective might assist businesses in that sector.
• A merger will consume considerable staff time and effort and will result in significant cost and for which no clear financial or community benefit has been identified during the preparation of this submission.
Strategic Capacity The following table assesses each of the strategic capacity considerations in more detail. Strategic Capacity
Elements Summary Assessment of Merger v Alternate (Standalone) Option Which option
scores best? More robust revenue base and increased discretionary spending capacity
A merger will not strengthen either Council’s revenue base nor create greater discretionary spending capacity. The economies of scale are limited and are largely associated with certain generic back-office functions which could best be shared with all Hunter Councils through the existing service centre of Hunter Ltd. Also each council has distinct spending priorities which are not complementary. Independently both councils have robust revenue and sufficient available cash reserves. Both councils need to address their respective infrastructure backlog as a priority and both have clearly identified strategies together with the capacity to do so, while continuing to provide the service levels required by their respective communities. The integration costs arising from any proposed merger would divert funds and resources from the current priorities.
Standalone
Scope to undertake new functions and major projects
There is no evidence to suggest that a merger will create a greater capacity for the merged entity to undertake new functions or major projects. Both councils on their own have significant financial and staffing resources and currently undertake all of the functions anticipated by the community. NCC is undertaking significant projects (some in partnership with State Government entities and in the case of the expansion of Newcastle Airport, in conjunction with neighbouring Port Stephens Council). Programs are strategic in nature and multi-year (eg coastal revitalisation & Hunter Street revitalisation). Commencement is determined by sequencing considerations and not capacity. Any integration from a merger would divert funds and resources from current priorities.
Standalone
Ability to employ wider range of skilled staff
Both individual councils are significant employers in the Hunter Region and each already has sufficient scale and the proven ability to recruit and utilise a wide range of specialist staff. As previously noted in this submission the Hunter region provides a significant recruitment pool. NCC has attracted a diverse and experienced group of senior staff from other industries and locales.
Neutral
Knowledge, creativity and
Again there is no clear evidence to indicate that a merger per se will increase the knowledge, creativity or innovation which a combined entity would be able to offer the community. Due to their
Neutral or Standalone
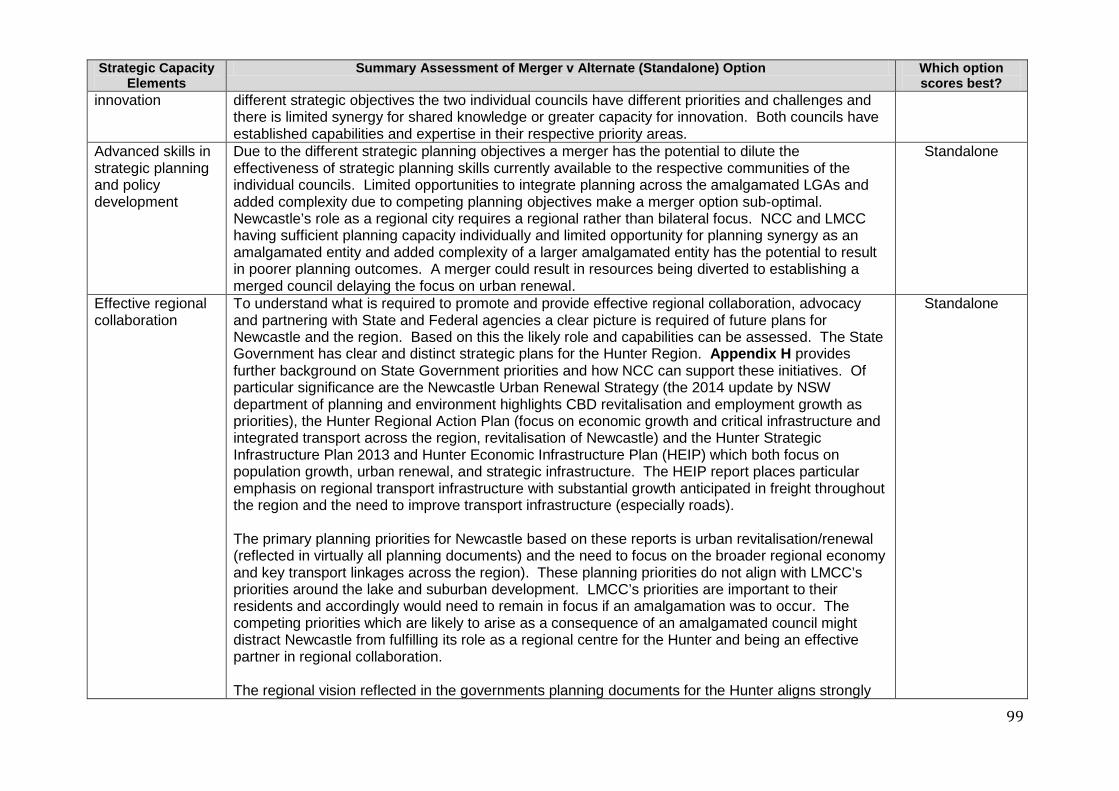
99
Strategic Capacity Elements
Summary Assessment of Merger v Alternate (Standalone) Option Which option scores best?
innovation different strategic objectives the two individual councils have different priorities and challenges and there is limited synergy for shared knowledge or greater capacity for innovation. Both councils have established capabilities and expertise in their respective priority areas.
Advanced skills in strategic planning and policy development
Due to the different strategic planning objectives a merger has the potential to dilute the effectiveness of strategic planning skills currently available to the respective communities of the individual councils. Limited opportunities to integrate planning across the amalgamated LGAs and added complexity due to competing planning objectives make a merger option sub-optimal. Newcastle’s role as a regional city requires a regional rather than bilateral focus. NCC and LMCC having sufficient planning capacity individually and limited opportunity for planning synergy as an amalgamated entity and added complexity of a larger amalgamated entity has the potential to result in poorer planning outcomes. A merger could result in resources being diverted to establishing a merged council delaying the focus on urban renewal.
Standalone
Effective regional collaboration
To understand what is required to promote and provide effective regional collaboration, advocacy and partnering with State and Federal agencies a clear picture is required of future plans for Newcastle and the region. Based on this the likely role and capabilities can be assessed. The State Government has clear and distinct strategic plans for the Hunter Region. Appendix H provides further background on State Government priorities and how NCC can support these initiatives. Of particular significance are the Newcastle Urban Renewal Strategy (the 2014 update by NSW department of planning and environment highlights CBD revitalisation and employment growth as priorities), the Hunter Regional Action Plan (focus on economic growth and critical infrastructure and integrated transport across the region, revitalisation of Newcastle) and the Hunter Strategic Infrastructure Plan 2013 and Hunter Economic Infrastructure Plan (HEIP) which both focus on population growth, urban renewal, and strategic infrastructure. The HEIP report places particular emphasis on regional transport infrastructure with substantial growth anticipated in freight throughout the region and the need to improve transport infrastructure (especially roads). The primary planning priorities for Newcastle based on these reports is urban revitalisation/renewal (reflected in virtually all planning documents) and the need to focus on the broader regional economy and key transport linkages across the region). These planning priorities do not align with LMCC’s priorities around the lake and suburban development. LMCC’s priorities are important to their residents and accordingly would need to remain in focus if an amalgamation was to occur. The competing priorities which are likely to arise as a consequence of an amalgamated council might distract Newcastle from fulfilling its role as a regional centre for the Hunter and being an effective partner in regional collaboration. The regional vision reflected in the governments planning documents for the Hunter aligns strongly
Standalone

100
Strategic Capacity Elements
Summary Assessment of Merger v Alternate (Standalone) Option Which option scores best?
with NCC’s current priorities and focus. NCC will be much more effective in regional collaboration by retaining this focus and not becoming distracted by the need to consider issues which are not consistent with the State Government's regional vision. The Joint Organisation model currently being piloted by Hunter Councils will provide a more effective vehicle for regional collaboration across the wider Hunter Region than a proposed merger of the two largest LGA members of the Hunter Councils organisation. Any proposed merger of NCC and LMCC has the potential to be counter-productive to effective collaboration across the wider Hunter Region as it would significantly skew the "balance of power", with the merged council being larger than (based on population) all the remaining councils combined. Given regional organisations function on a one vote per council model this could impact decision making processes.
Credibility for more effective advocacy
Newcastle has demonstrated its capacity to be an advocate on key matters of social and economic importance. The Newcastle Solution is a good example of both advocacy and partnering. As noted under regional collaboration the long term plans for Newcastle and the Hunter Region focus heavily on urban renewal and transport infrastructure to support ongoing economic growth and residential development in high growth areas. NCC will play a lead role in advocating for the best possible outcome for its community as these critical initiatives for the region are undertaken. Alignment of Newcastle’s plans with the broader region is essential. The City of Newcastle and NCC already have significant scale and prominence. Newcastle is NSW’s second largest city, a significant employer (fourth largest LGA) and the home of state significant infrastructure and regional services). This economic and social significance along with NCC’s strong regional focus and strong alignment of future plans ensures NCC is well positioned to continue to be an effective advocate for its community as well as the wider regional community of the Hunter.
Standalone
Capable partner for State and Federal agencies
NCC already demonstrates a strong capability to partner effectively with government agencies. The Minister for Local Government is seeking to have fewer councils to reduce the interaction required on integrated planning decisions. Newcastle however has limited opportunities for such interaction with LMCC because its infrastructure is largely self-contained. As noted under regional collaboration the State Governments plans for the Hunter Region have a region-wide focus rather than a bilateral focus on NCC/LMCC and have a greater focus on linkages between Newcastle and other LGAs in the Hunter rather than with Lake Macquarie. The primary value NCC can provide is as an effective partner in realising the strategy for the Hunter Region including specifically the transformation and revitalisation of Newcastle’s city centre. This is best achieved by Newcastle remaining as a standalone council.
Standalone
Resources to cope with complex and
NCC has sufficient resources and has demonstrated the capacity to apply these resources to cope with significant change or crisis scenarios. There is no clear evidence to suggest that the increased
Standalone
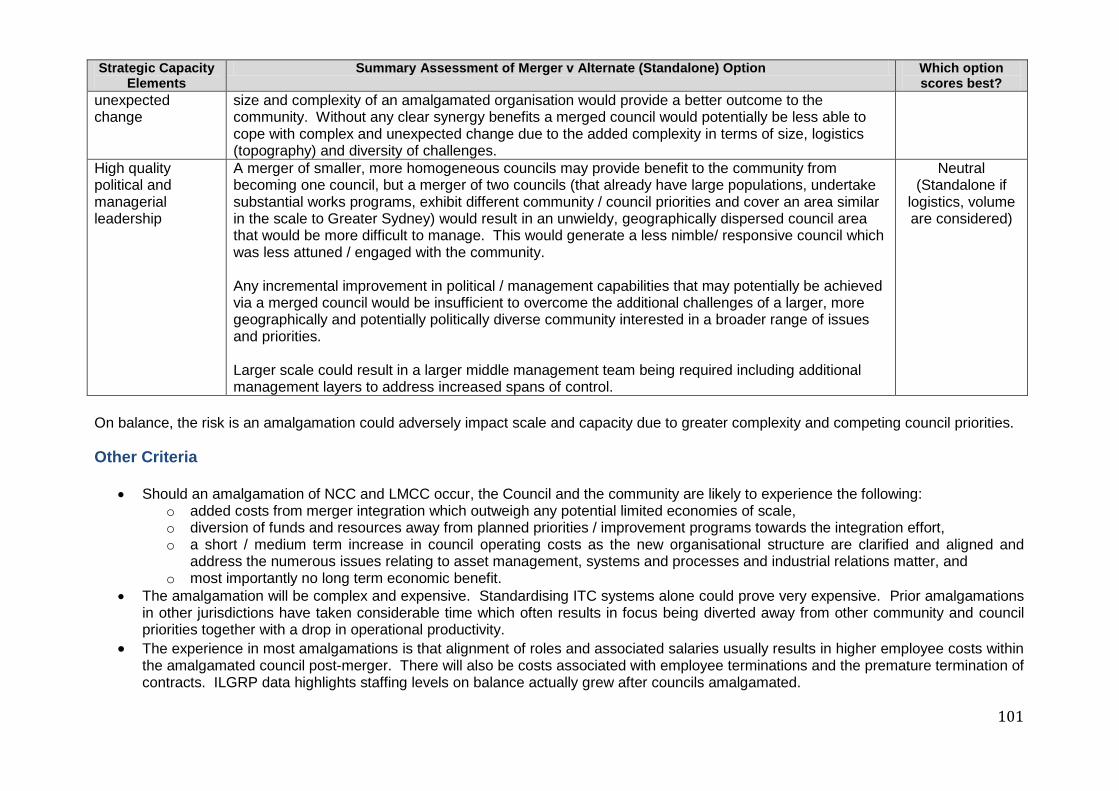
101
Strategic Capacity Elements
Summary Assessment of Merger v Alternate (Standalone) Option Which option scores best?
unexpected change
size and complexity of an amalgamated organisation would provide a better outcome to the community. Without any clear synergy benefits a merged council would potentially be less able to cope with complex and unexpected change due to the added complexity in terms of size, logistics (topography) and diversity of challenges.
High quality political and managerial leadership
A merger of smaller, more homogeneous councils may provide benefit to the community from becoming one council, but a merger of two councils (that already have large populations, undertake substantial works programs, exhibit different community / council priorities and cover an area similar in the scale to Greater Sydney) would result in an unwieldy, geographically dispersed council area that would be more difficult to manage. This would generate a less nimble/ responsive council which was less attuned / engaged with the community. Any incremental improvement in political / management capabilities that may potentially be achieved via a merged council would be insufficient to overcome the additional challenges of a larger, more geographically and potentially politically diverse community interested in a broader range of issues and priorities. Larger scale could result in a larger middle management team being required including additional management layers to address increased spans of control.
Neutral (Standalone if
logistics, volume are considered)
On balance, the risk is an amalgamation could adversely impact scale and capacity due to greater complexity and competing council priorities.
Other Criteria
• Should an amalgamation of NCC and LMCC occur, the Council and the community are likely to experience the following: o added costs from merger integration which outweigh any potential limited economies of scale, o diversion of funds and resources away from planned priorities / improvement programs towards the integration effort, o a short / medium term increase in council operating costs as the new organisational structure are clarified and aligned and
address the numerous issues relating to asset management, systems and processes and industrial relations matter, and o most importantly no long term economic benefit.
• The amalgamation will be complex and expensive. Standardising ITC systems alone could prove very expensive. Prior amalgamations in other jurisdictions have taken considerable time which often results in focus being diverted away from other community and council priorities together with a drop in operational productivity.
• The experience in most amalgamations is that alignment of roles and associated salaries usually results in higher employee costs within the amalgamated council post-merger. There will also be costs associated with employee terminations and the premature termination of contracts. ILGRP data highlights staffing levels on balance actually grew after councils amalgamated.

102
Other Criteria Summary Assessment of Merger v Alternate (Standalone) Option Meet Benchmark? /
Which option scores best?
Operating performance
Limited economies of scale, possible diseconomies of scale in some areas, possible loss of focus on BAU operations, projects and improvement programs are likely to result in an adverse impact on operating performance. This will be exacerbated by the additional costs associated with any merger. It is unlikely funds for merger assistance would cover this impact.
• Standalone proposal meets FFTF criteria
• Standalone is superior option
Own source revenue
A merger will have no significant impact on this ratio. • Standalone proposal meets FFTF criteria
• Standalone is superior option
Building and asset renewal
A merger would result in the diversion of scarce resources to the more immediate priority of the effective integration of the two councils. In the longer term the added complexity and complicated logistics of the combined council are likely to create inefficiencies. The labour intensive nature of capital works (and maintenance), the increased scale of the combined works program and significant spans of control indicate there is unlikely to be sufficient economies of scale arising from any proposed merger to counteract the possible inefficiencies created.
• Standalone proposal meets FFTF criteria
• Standalone superior
Infrastructure backlog
Focus on asset renewal, targeting backlog reduction, is a requirement of NCC's recently approved SRV determination. A merger is likely to divert resources away from these priorities towards merger integration tasks in the short to medium term.
• Standalone proposal meets FFTF criteria
• Standalone superior Asset maintenance
There is no clear evidence that a merger would result in any improvement in this ratio. Experience across councils generally is that asset maintenance can be adversely impacted when councils are under financial stress or have resource constraints. Increased focus on asset maintenance is a key feature of Council as reflected in the current IP&R documents. As previously indicated a merger is likely to shift focus away from this objective which presents a risk to the community that asset maintenance would deteriorate in the short to medium term.
• Standalone proposal meets FFTF criteria
• Standalone superior
Debt service No significant difference for this criteria between merger or standalone. • Standalone proposal meets FFTF criteria
• Standalone superior Efficiency • There is no evidence that a merger will create any significant economies of scale. This is due to a
number of factors including: the significant existing scale of both standalone councils, topographical considerations, no significant synergies (different planning considerations, strategies, priorities). Appendix D provides support that duplicate assets and associated services will need to be
• Standalone proposal meets FFTF criteria
• Standalone superior
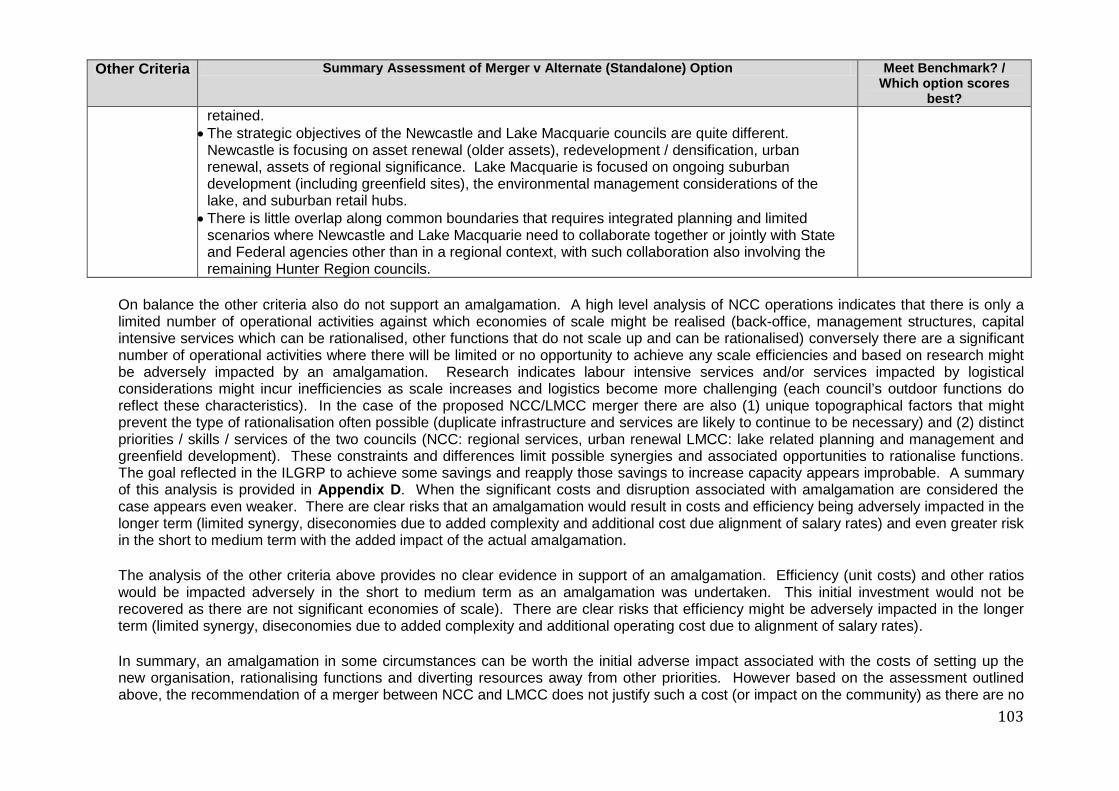
103
Other Criteria Summary Assessment of Merger v Alternate (Standalone) Option Meet Benchmark? / Which option scores
best? retained.
• The strategic objectives of the Newcastle and Lake Macquarie councils are quite different. Newcastle is focusing on asset renewal (older assets), redevelopment / densification, urban renewal, assets of regional significance. Lake Macquarie is focused on ongoing suburban development (including greenfield sites), the environmental management considerations of the lake, and suburban retail hubs.
• There is little overlap along common boundaries that requires integrated planning and limited scenarios where Newcastle and Lake Macquarie need to collaborate together or jointly with State and Federal agencies other than in a regional context, with such collaboration also involving the remaining Hunter Region councils.
On balance the other criteria also do not support an amalgamation. A high level analysis of NCC operations indicates that there is only a limited number of operational activities against which economies of scale might be realised (back-office, management structures, capital intensive services which can be rationalised, other functions that do not scale up and can be rationalised) conversely there are a significant number of operational activities where there will be limited or no opportunity to achieve any scale efficiencies and based on research might be adversely impacted by an amalgamation. Research indicates labour intensive services and/or services impacted by logistical considerations might incur inefficiencies as scale increases and logistics become more challenging (each council’s outdoor functions do reflect these characteristics). In the case of the proposed NCC/LMCC merger there are also (1) unique topographical factors that might prevent the type of rationalisation often possible (duplicate infrastructure and services are likely to continue to be necessary) and (2) distinct priorities / skills / services of the two councils (NCC: regional services, urban renewal LMCC: lake related planning and management and greenfield development). These constraints and differences limit possible synergies and associated opportunities to rationalise functions. The goal reflected in the ILGRP to achieve some savings and reapply those savings to increase capacity appears improbable. A summary of this analysis is provided in Appendix D. When the significant costs and disruption associated with amalgamation are considered the case appears even weaker. There are clear risks that an amalgamation would result in costs and efficiency being adversely impacted in the longer term (limited synergy, diseconomies due to added complexity and additional cost due alignment of salary rates) and even greater risk in the short to medium term with the added impact of the actual amalgamation. The analysis of the other criteria above provides no clear evidence in support of an amalgamation. Efficiency (unit costs) and other ratios would be impacted adversely in the short to medium term as an amalgamation was undertaken. This initial investment would not be recovered as there are not significant economies of scale). There are clear risks that efficiency might be adversely impacted in the longer term (limited synergy, diseconomies due to added complexity and additional operating cost due to alignment of salary rates).
In summary, an amalgamation in some circumstances can be worth the initial adverse impact associated with the costs of setting up the new organisation, rationalising functions and diverting resources away from other priorities. However based on the assessment outlined above, the recommendation of a merger between NCC and LMCC does not justify such a cost (or impact on the community) as there are no
104
discernible financial benefits, either in terms of scale and capacity or other criteria. Based on this assessment the standalone option is superior to the recommendation.

105
Appendix G: Detailed Response to the Fit for the Future Criteria The final report of the ILGRP on Revitalising Local Government was completed in October 2013. The OLG has indicated that this report (including its recommendations) is to be the starting point for each council's proposal on how it plans to become Fit for the Future (FFTF). The ILGRP Report made the following assessment of NCC and other councils within the Lower Hunter and concluded that NCC and LMCC should be amalgamated:
The Lower Hunter presents a range of issues needing attention. The financial positions of Newcastle and Cessnock give some grounds for concern, and there are complex patterns of socio-economic linkages, urban development and council boundaries. The quality and stability of governance has also been an issue in some councils. The City of Newcastle faces significant challenges including forecast operating deficits, large capital works requirements and demanding issues associated with urban renewal. Its southern suburbs merge seamlessly into the Lake Macquarie area to form a single metropolis that needs to be planned and managed as an integrated whole. The Panel sees this as a fundamental factor in determining the future strength and capacity of local government in the region. It has therefore concluded that Newcastle and Lake Macquarie should be amalgamated to form a new council with a projected population of around 390,000 in 2031. At the same time, there may well be a case for the southern area of Lake Macquarie around Morriset to be added to Wyong or a new Central Coast council, reflecting expected patterns of urban growth and an orientation towards Sydney. Also, the Beresfield area of Newcastle, which is separated by a major wetland from the rest of the city, could be transferred to Maitland.
The OLG has established the scale and capacity criterion as the threshold criterion. In preparing their FFTF proposals, councils must first asses their scale and capacity and must demonstrate that they either currently have, or will have, sufficient scale and capacity with their proposed approach, consistent with the objectives identified by the ILGRP for their region, and the features of strategic capacity. IPART will consider first the ILGRP’s preferred option for each council regarding scale and capacity and whether the council’s proposed option is broadly consistent with this option. Economies of Scale Appendix C concluded that there are no discernible economies of scale as a result of a merger. This is in effect supported by other sources:
• The ILGRP provides an assessment of prior NSW council amalgamations which indicates that staffing levels actually increased post merger (p 69-70 of the Research Report, Supporting Information, Volume 2, Part 1). The report referenced indicates there was an 11.7% increase in EFT employees from 2002/03 to 2010/11.

106
Based on OLG data total staff EFT for NSW councils increased from 40,960 (2002/03) to 44,303 (2010/11). This is an increase of 8.2% over the same period.
• Research undertaken by Professor Percy Allan finds no apparent economies of scale for councils with populations greater than 100,000
residents.
• NCC’s own analysis using OLG data for 2012/13 has reached similar conclusions. This analysis assessed the correlation between per capita costs for different services based on number of residents found that there was a positive correlation (diseconomies) across a number of services.
• Prior amalgamations have taken considerable time which often results in focus being diverted away from other council priorities and a drop in productivity.
Strategic Capacity The key elements of strategic capacity which IPART will consider are shown in the following table with NCC’s response against each criteria.
Strategic Capacity Elements
Merged Entity (starting point)
Standalone Improvement Initiatives / Further Evidence
Assessment
More robust revenue base and increased discretionary spending capacity
• The ILGRP report notes “financial position give some grounds for concern” and “challenges including forecast operating deficits”. This assessment is based on outdated data (TCorp report in 2013). As evidenced in the submission Council has on the path to sustainability and would be likely to receive an improved TCorp rating.
• Council has a robust revenue base (breakeven position for 2013/14, >85% own revenue, diverse revenue base (residential & business rate payers and commercial revenue sources) and SRV providing 8% rate growth per annum over 5 years. Operating position trends strongly positive and reserves remain robust even with extra expenditure on asset renewal.
• High % own revenue (over 80% for all projections)
• Historical Trend : Capital works on discretionary projects projected to increase over the longer term
• Upside potential from
• All improvement initiatives to address sustainability criteria further strengthen Councils operating position and thereby increase capacity for discretionary expenditure.
• This builds on financials already presented in the successful 2015 SRV application.
• The funds from the 2012 SRV are specifically applied to revitalisation. The rates from this program can be reapplied to other discretionary purposes once the special projects are completed.
• Once the asset backlog is reduced further funds can be applied to discretionary spending.
• By 2024/25 the LTFP projects capital expenditure on
A merger will not strengthen either councils revenue base not create greater discretionary spending capacity. There are no economies of scale and each council has distinct spending priorities which are not complementary and therefore would compete for the funds available. The current and projected revenue base is very robust and supports a significant increase in capital works. The priority is to address the infrastructure backlog. Once this has been addressed discretionary spending capacity will increase substantially. Financial discipline

107
Strategic Capacity Elements
Merged Entity (starting point)
Standalone Improvement Initiatives / Further Evidence
Assessment
commercial revenue opportunities (airport, waste facility)
• Government focus on Newcastle urban renewal and associated commitments ($430m earmarked)
• Positive economic impact of large infrastructure will also benefit council
discretionary projects of $40m with a funding surplus of approximately $20m. Investments and cash is projected at $277m. This is a substantial turnaround from the TCorp report.
Scope to undertake new functions and major projects
• The ILGRP report notes “challenges including forecast operating deficits, large capital works requirements and demanding issues associated with urban renewal.” A merged entity would have a capital works program in excess of $120M per annum – this will add complexity. The diverse priorities of NCC & LM would complicate planning and prioritisation. There a few synergies between the functions of the 2 councils in any merger due to unique factors (regional centre v lake).
• Geographic factors might impact efficiency and effectiveness in the coordination and provision of projects and services.
• -merged entity create competition for resources for other functions / capital works - with no material econ of scale a merger does not greater more funds for functions / capital works - merely more complex decision process on how best to allocate funds
• -both councils have funding for major capital works programs. Where funds are not already
• -NCC already has a regional focus and significant expenditure on “regional” assets and associated services. Examples are: - expenditure on cultural
functions and events, - waste management centre
of regional scale • regional recreational
facilities (Blackbutt, Beaches, coastal walk, CBD and suburban restaurant hubs all attract residents from across the hunter
• NCC already makes a significant investment in facilities of regional (or national) scale (e.g. Theatre, Sporting Facilities including major sporting ovals, Art Gallery & Museum., Newcastle Airport, Waste Centre OLG data for 2013 reflects NCC spends significantly more than most other NSW councils on functions of a regional focus.
• Council has substantially increased expenditure on major projects (with further projected increases in 2015/16 and future years). Recent increases
• Initiatives to improve program / project management, vendor management and optimisation of asset renewal program create greater capacity to undertake major projects. (NCC has already demonstrated capacity to undertake both large projects , as well as an increasing number of projects
There is no evidence to indicate that a merger creates a greater capacity to undertake new functions or major projects. Both councils have significant existing financial and staffing resources and undertake functions anticipated by the community. There is as much debate within the community about reducing functions as there is considering new or expanded functions. Any new functions are likely to be incremental in nature. NCC is undertaking significant projects (some in partnership with state government entities and some such as the Airport and Waste Centre in partnership and/or in cooperation with surrounding LGAs). Programs are strategic in nature and multi-year (e.g. coastal revitalisation & hunter street revitalisation). Commencement is determined by sequencing considerations and not capacity.

108
Strategic Capacity Elements
Merged Entity (starting point)
Standalone Improvement Initiatives / Further Evidence
Assessment
identified for future projects an amalgamation will create competition against existing projects from the existing funds pool
demonstrate Councils capacity to scale up.
• Council has not been constrained by capacity to deliver projects. No project has been rejected due to scale or capacity constraints. Decisions have been made based on funding priorities.
Ability to employ wider range of skilled staff
• This element was not referenced in the ILGRP report.
• A merged entity would result in a council workforce in excess of 1,800 staff. Increasing a workforce from approximately 900 /1,000 staff to 1,800 will not significantly alter the ability of council to employ a wider range of staff.
• A larger workforce might result in the need for additional layers of management to maintain reasonable spans of control.
• An assessment of NCC workforce has not identified any functions which are deficient due to scale. Council has sufficient scale (over 900 staff) to have specialist roles and therefore provide attractive roles for prospective job seekers
• Council has been capable of attracting strong candidates across Australia for senior management roles.
• -Newcastle an attractive sea change location with lower property prices and excellent facilities (schools, tertiary, medical and recreational) and only 2 hours from Sydney
• NCC is continuing its program of applying best practices from other sectors. The newly established management team is undertaking change programs across all business units. This will include ongoing staff training and selective recruitment
• Bureau of Transport Statistics data indicates residents from the Lower Hunter and Central Coast work in Newcastle. A limited number of Attracts workers from lower hunter and central coast and Sydney.
• The Newcastle LGA is the 4th largest LGA for local jobs. Due to the industries supported potential employees are a good match to council requirements.
• NCC has recruited a diverse management team that reflects extensive experience in large complex organisations (a mix of local government and private sector). See Appendix A.
• There is no evidence that a merged entity provides any additional capacity as both councils are major employers in the hunter region and have sufficient scale to recruit and utilise specialist staff. Newcastle provides a significant recruitment pool. NCC has attracted a diverse and experienced group of senior staff from other industries and locales.
Knowledge, creativity and innovation
• There is a risk that size (and the associated risks of bureaucracy) can stifle innovation and creativity
• A merger is unlikely to significantly increase the
• NCC has sufficient scale to create roles, recruit staff and engender a culture of knowledge, creativity and innovation. The LGA itself supports a high level of
• LMCC has developed its key functions which support its priorities (documented in the LMCC submission)
• NCC has extensive experience in key functional areas through a
• No evidence that a merger will improve performance against this element of strategic capacity. .
• The different priorities and challenges across the two councils does not support much synergy
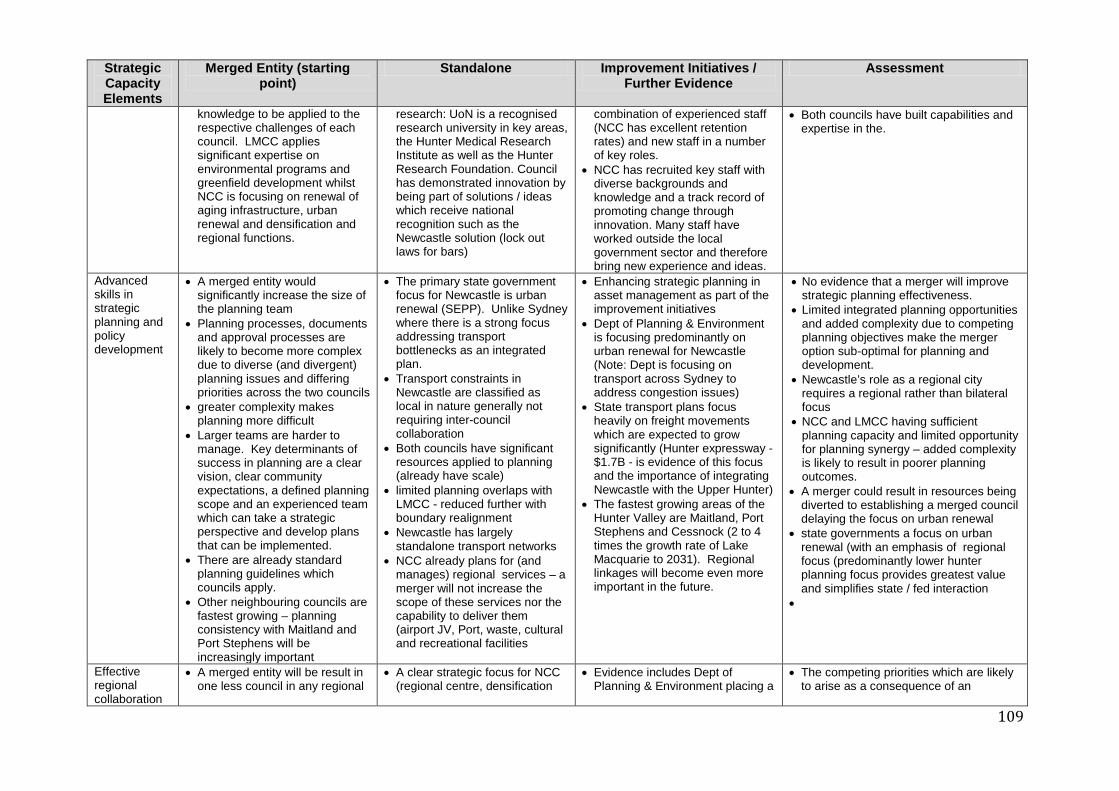
109
Strategic Capacity Elements
Merged Entity (starting point)
Standalone Improvement Initiatives / Further Evidence
Assessment
knowledge to be applied to the respective challenges of each council. LMCC applies significant expertise on environmental programs and greenfield development whilst NCC is focusing on renewal of aging infrastructure, urban renewal and densification and regional functions.
research: UoN is a recognised research university in key areas, the Hunter Medical Research Institute as well as the Hunter Research Foundation. Council has demonstrated innovation by being part of solutions / ideas which receive national recognition such as the Newcastle solution (lock out laws for bars)
combination of experienced staff (NCC has excellent retention rates) and new staff in a number of key roles.
• NCC has recruited key staff with diverse backgrounds and knowledge and a track record of promoting change through innovation. Many staff have worked outside the local government sector and therefore bring new experience and ideas.
• Both councils have built capabilities and expertise in the.
Advanced skills in strategic planning and policy development
• A merged entity would significantly increase the size of the planning team
• Planning processes, documents and approval processes are likely to become more complex due to diverse (and divergent) planning issues and differing priorities across the two councils
• greater complexity makes planning more difficult
• Larger teams are harder to manage. Key determinants of success in planning are a clear vision, clear community expectations, a defined planning scope and an experienced team which can take a strategic perspective and develop plans that can be implemented.
• There are already standard planning guidelines which councils apply.
• Other neighbouring councils are fastest growing – planning consistency with Maitland and Port Stephens will be increasingly important
• The primary state government focus for Newcastle is urban renewal (SEPP). Unlike Sydney where there is a strong focus addressing transport bottlenecks as an integrated plan.
• Transport constraints in Newcastle are classified as local in nature generally not requiring inter-council collaboration
• Both councils have significant resources applied to planning (already have scale)
• limited planning overlaps with LMCC - reduced further with boundary realignment
• Newcastle has largely standalone transport networks
• NCC already plans for (and manages) regional services – a merger will not increase the scope of these services nor the capability to deliver them (airport JV, Port, waste, cultural and recreational facilities
• Enhancing strategic planning in asset management as part of the improvement initiatives
• Dept of Planning & Environment is focusing predominantly on urban renewal for Newcastle (Note: Dept is focusing on transport across Sydney to address congestion issues)
• State transport plans focus heavily on freight movements which are expected to grow significantly (Hunter expressway - $1.7B - is evidence of this focus and the importance of integrating Newcastle with the Upper Hunter)
• The fastest growing areas of the Hunter Valley are Maitland, Port Stephens and Cessnock (2 to 4 times the growth rate of Lake Macquarie to 2031). Regional linkages will become even more important in the future.
• No evidence that a merger will improve strategic planning effectiveness.
• Limited integrated planning opportunities and added complexity due to competing planning objectives make the merger option sub-optimal for planning and development.
• Newcastle’s role as a regional city requires a regional rather than bilateral focus
• NCC and LMCC having sufficient planning capacity and limited opportunity for planning synergy – added complexity is likely to result in poorer planning outcomes.
• A merger could result in resources being diverted to establishing a merged council delaying the focus on urban renewal
• state governments a focus on urban renewal (with an emphasis of regional focus (predominantly lower hunter planning focus provides greatest value and simplifies state / fed interaction
•
Effective regional collaboration
• A merged entity will be result in one less council in any regional
• A clear strategic focus for NCC (regional centre, densification
• Evidence includes Dept of Planning & Environment placing a
• The competing priorities which are likely to arise as a consequence of an

110
Strategic Capacity Elements
Merged Entity (starting point)
Standalone Improvement Initiatives / Further Evidence
Assessment
collaboration. This will not reduce the level of collaboration required. There is a danger than one “super council” among the group might adversely impact the dynamics of a group in which decisions are based on consensus
• Collaboration however needs to occur across the hunter region to be effective. Maitland and Port Stephens will become increasingly important in the future as they grow rapidly. As covered in the section on linkages it is important recognise the current and future regional role of NCC.
and urban renewal) is important and will increase in important if NCC is to fulfil its role as a regional centre.
• State planning considers the two LGAs in isolation and not as a "single metropolis" as indicated by the ILGRP.
• NCC has worked with state planning on a consultative basis to during the development and recent review of the Strategy.
• NCC is part of The Hunter Councils Incorporated, a state incorporated association which is made up of the eleven local government councils of the Hunter Region.
strong focus on Newcastle as a regional city. It notes Newcastle is the 2nd biggest city in NSW. It notes Newcastle has an opportunity to strengthen its position as the Hunter region’s capital (vibrant economic, residential and tourist hub).
• The Dept of Planning and environment notes that the NSE government is working with NCC, key government agencies, local business and the community to transform and revitalise Newcastle’s city centre.
• NCC has a clear strategy to revitalise the city centre (this is the top priority as reflected in key IP&R documents)
• NCC takes a regional perspective with the consultation for the city revitalisation seeking feedback from residents and businesses across the Hunter Valley.
amalgamated council might distract Newcastle from fulfilling its role as a regional centre for the Hunter.
• To support this regional vision NCC needs to apply a regional focus and not become distracted by the need to consider issues not currently the purview of the Council.
Credibility for more effective advocacy
• A larger entity will represent more ratepayers and a larger economic area and this is seen as improving the credibility for more effective advocacy
• In a merger of councils with similar priorities and issues more effective advocacy could be achieved. NCC and LM however do not fit this model as the two councils are very different. To be an effective advocate will require council to speak with a unified voice
• Dept of Planning and Environment primary focus for Newcastle is the transformation of revitalisation of Newcastle to strengthen its role as the Hunter region’s capital.
• Effective advocacy requires NCC to have clear planning and policy priorities which can be clearly articulated and key stakeholders
• To support the state government strategic plans NCC needs to be an effective advocate for urban renewal and Newcastle’s role as an effective regional centre for the hunter region. Newcastle is best placed to perform this advocacy
• NCC included additional funding for revitalisation and community consultation in its recent successful SRV application.
• NCC has been effective in determining community priorities and the city revitalisation is the top priority
• The Joint Organisation currently being piloted by Hunter Councils is a preferable vehicle for improving the effectiveness of regional advocacy. The 11 Hunter councils are members of this organisation, which is more representative of the region than an amalgamated NCC/LMCC would be
• Newcastle is a very prominent and well recognised council. The council (representing NSW 2nd largest city) already has significant presence as an effective advocate.
• Hunter Councils has been held up as a model for such organisations across the state and has been selected to pilot the FftF Joint Organisation program. This entity will be a more credible and representative voice for Hunter regional advocacy than the proposed merger of NCC/LMCC
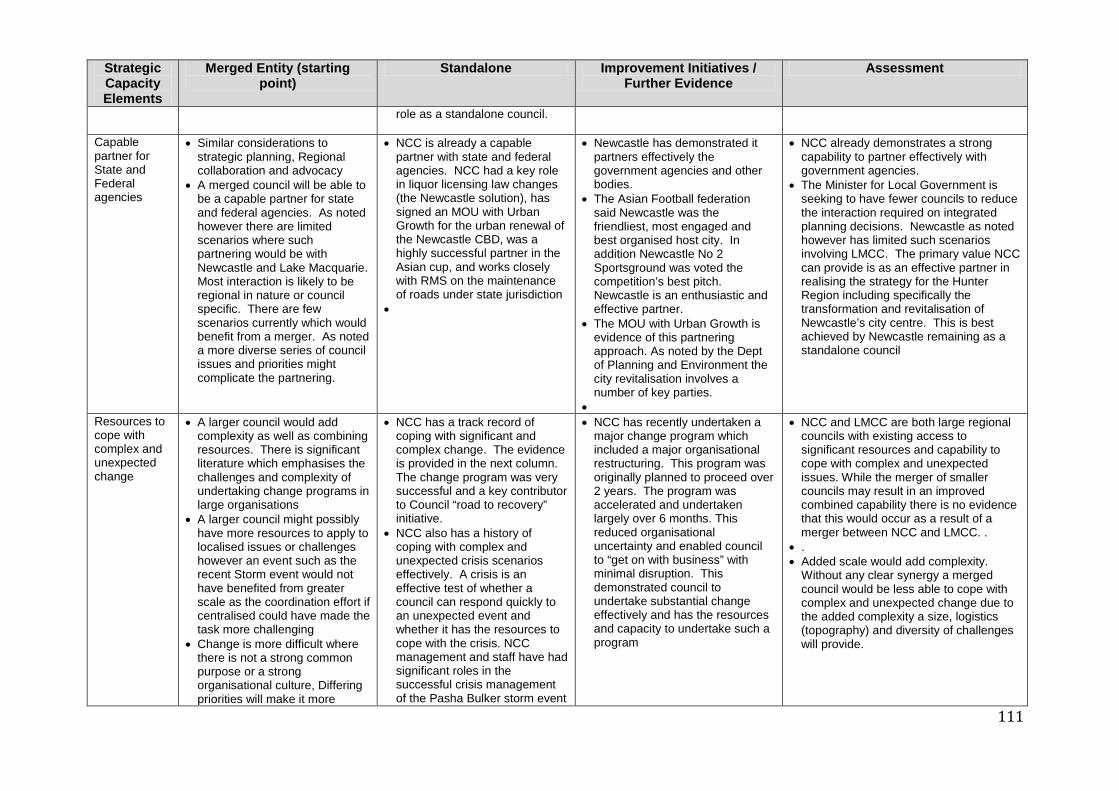
111
Strategic Capacity Elements
Merged Entity (starting point)
Standalone Improvement Initiatives / Further Evidence
Assessment
role as a standalone council.
Capable partner for State and Federal agencies
• Similar considerations to strategic planning, Regional collaboration and advocacy
• A merged council will be able to be a capable partner for state and federal agencies. As noted however there are limited scenarios where such partnering would be with Newcastle and Lake Macquarie. Most interaction is likely to be regional in nature or council specific. There are few scenarios currently which would benefit from a merger. As noted a more diverse series of council issues and priorities might complicate the partnering.
• NCC is already a capable partner with state and federal agencies. NCC had a key role in liquor licensing law changes (the Newcastle solution), has signed an MOU with Urban Growth for the urban renewal of the Newcastle CBD, was a highly successful partner in the Asian cup, and works closely with RMS on the maintenance of roads under state jurisdiction
•
• Newcastle has demonstrated it partners effectively the government agencies and other bodies.
• The Asian Football federation said Newcastle was the friendliest, most engaged and best organised host city. In addition Newcastle No 2 Sportsground was voted the competition’s best pitch. Newcastle is an enthusiastic and effective partner.
• The MOU with Urban Growth is evidence of this partnering approach. As noted by the Dept of Planning and Environment the city revitalisation involves a number of key parties.
•
• NCC already demonstrates a strong capability to partner effectively with government agencies.
• The Minister for Local Government is seeking to have fewer councils to reduce the interaction required on integrated planning decisions. Newcastle as noted however has limited such scenarios involving LMCC. The primary value NCC can provide is as an effective partner in realising the strategy for the Hunter Region including specifically the transformation and revitalisation of Newcastle’s city centre. This is best achieved by Newcastle remaining as a standalone council
Resources to cope with complex and unexpected change
• A larger council would add complexity as well as combining resources. There is significant literature which emphasises the challenges and complexity of undertaking change programs in large organisations
• A larger council might possibly have more resources to apply to localised issues or challenges however an event such as the recent Storm event would not have benefited from greater scale as the coordination effort if centralised could have made the task more challenging
• Change is more difficult where there is not a strong common purpose or a strong organisational culture, Differing priorities will make it more
• NCC has a track record of coping with significant and complex change. The evidence is provided in the next column. The change program was very successful and a key contributor to Council “road to recovery” initiative.
• NCC also has a history of coping with complex and unexpected crisis scenarios effectively. A crisis is an effective test of whether a council can respond quickly to an unexpected event and whether it has the resources to cope with the crisis. NCC management and staff have had significant roles in the successful crisis management of the Pasha Bulker storm event
• NCC has recently undertaken a major change program which included a major organisational restructuring. This program was originally planned to proceed over 2 years. The program was accelerated and undertaken largely over 6 months. This reduced organisational uncertainty and enabled council to “get on with business” with minimal disruption. This demonstrated council to undertake substantial change effectively and has the resources and capacity to undertake such a program
• NCC and LMCC are both large regional councils with existing access to significant resources and capability to cope with complex and unexpected issues. While the merger of smaller councils may result in an improved combined capability there is no evidence that this would occur as a result of a merger between NCC and LMCC. .
• . • Added scale would add complexity.
Without any clear synergy a merged council would be less able to cope with complex and unexpected change due to the added complexity a size, logistics (topography) and diversity of challenges will provide.

112
Strategic Capacity Elements
Merged Entity (starting point)
Standalone Improvement Initiatives / Further Evidence
Assessment
difficult to determine what change council should focus upon and council size might make council less able to respond quickly to unexpected change.
and the recent Hunter storm disaster. NCC has needed to take tough action via a recent organisational restructure to become financially sustainable.
High quality political and managerial leadership
• Increase in council size adds complexity and workload - less time available to dedicate to individual ratepayers and/or issues
• More diverse ratepayer priorities will require councillors and management to spend more resources on building consensus and reducing conflict / disenfranchisement.
• Potential bottlenecks due to centralised nature of council decision making.
• Span of coverage provides challenges - breadth of responsibilities, volume, less knowledge of less familiar constituents etc
• Councillors have significant and diverse political experience
• Council provides excellent diversity based on gender and age of councillors
• Most councillors are degree qualified and a number have business experience including running their own businesses and/or Director / CEO or senior management roles.
• All senior management staff are on performance based contracts
• GM, directors, and managers have diverse commercial and/or government experience in large and complex organisations.
• Diverse and highly experienced managerial leadership team. GM, Director and Management experience has been provided in Appendix A.
• A merger of smaller, more homogeneous councils can benefit from merger however 2 councils that are already large and have substantial works programs and which have different ratepayer / council priorities and will result in a geographically dispersed council area is likely to result in a less nimble/ responsive council which is less attuned / engaged with the community.
• A higher level of political / management capabilities (if achieved via a merged council) would not be able to overcome the additional challenges of a larger, more geographically diverse council with a more diverse community interested in a broader range of issues and priorities.
• Larger scale could result in a larger management team being required and additional management layers (to address spans of control)
Based on the above assessment NCC believes that it has the scale and capacity as a standalone council to meet the needs of its ratepayers, undertake an increasingly important regional role, and engage / partner in a capable, constructive and effective manner with State and Federal agencies. As assessed in Appendix C there are also geographical challenges and issues of increased operational complexity associated with an amalgamation of two large regional councils such as NCC and LMCC. Lake Macquarie creates a significant barrier to realising economies of scale. It is not possible to establish a central hub for local government services due to the location and size of the lake. As the analysis shows the logistics are significant and the geographical spread equates in scale to a substantial portion of greater Sydney. Unlike rural councils (which would be of similar scale) the merged council of Newcastle and Lake Macquarie would have similar logistical issues as Sydney with travel times being similar (reflecting the urban and suburban nature of the combined council).
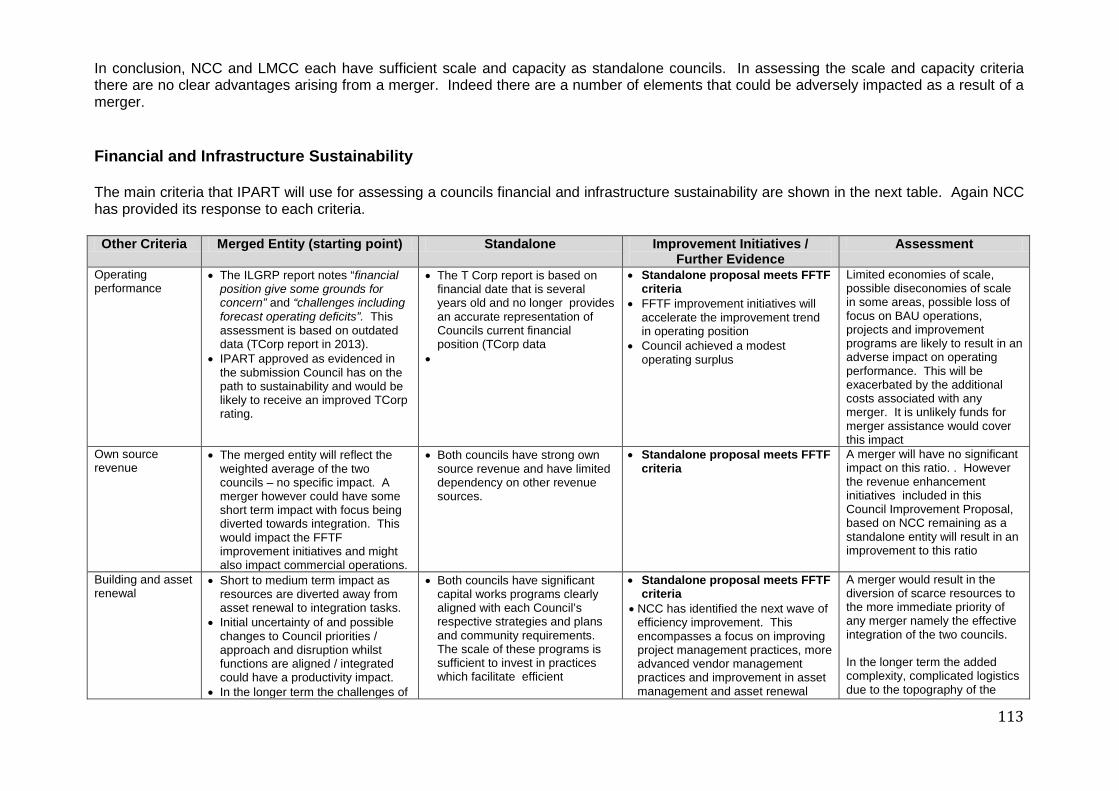
113
In conclusion, NCC and LMCC each have sufficient scale and capacity as standalone councils. In assessing the scale and capacity criteria there are no clear advantages arising from a merger. Indeed there are a number of elements that could be adversely impacted as a result of a merger. Financial and Infrastructure Sustainability The main criteria that IPART will use for assessing a councils financial and infrastructure sustainability are shown in the next table. Again NCC has provided its response to each criteria. Other Criteria Merged Entity (starting point) Standalone Improvement Initiatives /
Further Evidence Assessment
Operating performance
• The ILGRP report notes “financial position give some grounds for concern” and “challenges including forecast operating deficits”. This assessment is based on outdated data (TCorp report in 2013).
• IPART approved as evidenced in the submission Council has on the path to sustainability and would be likely to receive an improved TCorp rating.
• The T Corp report is based on financial date that is several years old and no longer provides an accurate representation of Councils current financial position (TCorp data
•
• Standalone proposal meets FFTF criteria
• FFTF improvement initiatives will accelerate the improvement trend in operating position
• Council achieved a modest operating surplus
Limited economies of scale, possible diseconomies of scale in some areas, possible loss of focus on BAU operations, projects and improvement programs are likely to result in an adverse impact on operating performance. This will be exacerbated by the additional costs associated with any merger. It is unlikely funds for merger assistance would cover this impact
Own source revenue
• The merged entity will reflect the weighted average of the two councils – no specific impact. A merger however could have some short term impact with focus being diverted towards integration. This would impact the FFTF improvement initiatives and might also impact commercial operations.
• Both councils have strong own source revenue and have limited dependency on other revenue sources.
• Standalone proposal meets FFTF criteria
A merger will have no significant impact on this ratio. . However the revenue enhancement initiatives included in this Council Improvement Proposal, based on NCC remaining as a standalone entity will result in an improvement to this ratio
Building and asset renewal
• Short to medium term impact as resources are diverted away from asset renewal to integration tasks.
• Initial uncertainty of and possible changes to Council priorities / approach and disruption whilst functions are aligned / integrated could have a productivity impact.
• In the longer term the challenges of
• Both councils have significant capital works programs clearly aligned with each Council’s respective strategies and plans and community requirements. The scale of these programs is sufficient to invest in practices which facilitate efficient
• Standalone proposal meets FFTF criteria
• NCC has identified the next wave of efficiency improvement. This encompasses a focus on improving project management practices, more advanced vendor management practices and improvement in asset management and asset renewal
A merger would result in the diversion of scarce resources to the more immediate priority of any merger namely the effective integration of the two councils. In the longer term the added complexity, complicated logistics due to the topography of the

114
Other Criteria Merged Entity (starting point) Standalone Improvement Initiatives / Further Evidence
Assessment
being a larger council (complexity, logistics, broader range of priorities) would need to be managed effectively to ensure an adverse impact on productivity
optimisation. These initiatives have a material impact on efficiency, lowering operating expenses due to reductions in depreciation (lower replacement costs) and more efficient asset maintenance.
combined council are likely to create inefficiencies. The labour intensive nature of capital works (and maintenance), large current scale and significant spans of control indicate there is unlikely to be sufficient economies of scale to counteract possible inefficiencies created.
Infrastructure backlog
• Both councils have infrastructure backlogs that currently exceed the TCorp benchmark of less than 2% of written down assets. A merger will not improve this position.
• There is a risk that a merger will result in management time and resources being directed to integration activities and delay progress on reducing the infrastructure backlog
• NCC has made asset renewal and the reduction of the infrastructure backlog as a priority. The primary purpose of the recently successful SRV is to ensure there are sufficient funds to address the asset renewal program while maintaining adequate reserves to cover the future long term financial obligations of the organisation
• Standalone proposal meets FFTF criteria by 2020/21 and modified ratio by 2019/20.
• The projects noted under the building and asset renewal will accelerate the reduction of the infrastructure backlog
Focus on asset renewal targeting backlog reduction is a requirement of the recent SRV determination. Resources could be diverted away from this priority towards merger integration tasks in a merger scenario
Asset maintenance
• Asset Maintenance is often an area that councils neglect when under financial or resourcing pressure as the impact is not immediate and lower maintenance does not impact service levels in the short term. Maintaining sustainable asset maintenance is therefore at particular risk where resource constraints exist.
• NCC has built a sustainable level of asset maintenance into the 2015/16 operating plan and financial projections for all future years (as reflected in the LTFP and Delivery program). This commitment was highlighted in the recent SRV application (which as noted was successful).
• Standalone proposal meets FFTF criteria
• Asset maintenance is
Experience across councils generally is that asset maintenance can be adversely impacted when councils are under financial stress or have resource constraints. There is no clear evidence that a merger would result in any improvement in this ratio. Experience across councils generally is that asset maintenance can be adversely impacted when councils are under financial stress or have resource constraints. As previously indicated a merger is likely to shift focus away from this objective which presents a risk to the community that asset maintenance would deteriorate in the short to medium term
Debt service • Both councils have limited debt and debt servicing ratio is strong.
• NCC has limited debt and with the SRV approved will be able to maintain a strong reserves position.
• Standalone proposal meets FFTF criteria
• No action required
No difference for this criteria between merger or standalone

115
Other Criteria Merged Entity (starting point) Standalone Improvement Initiatives / Further Evidence
Assessment
• NCC will consider internal borrowing against reserves where appropriate to address intergenerational equity considerations and to fund services which have a commercial focus (such as the waste management facility).
Efficiency • Australian and international research indicates that there are no discernible economies of scale for the merger of larger councils.
• Topographical considerations impede opportunities for the rationalisation of infrastructure and services. Lake Macquarie already needs to duplicate to overcome the barriers associated with having a large lake in the centre
• Many activities are labour intensive (or a combination of labour and capital) rather than purely capital intensive and these types of services do not provide economies of scale opportunities. Greater complexity in managing a larger and more geographically spread workforce can result in inefficiencies.
• There are economies of scale opportunities for some capital intensive activities (Information Technology) and functions which do not scale up in proportion to growth (support services such as parts of Finance, HR etc). These parts of functions are a relatively small portion of council's costs and the limited benefits realised are likely to be outweighed by the other factors listed above. Council is predominantly staffed with employees servicing ratepayers or maintaining / building the
• NCC and LMCC already have sufficient scale. Scale insensitive costs consequently constitute a significant portion of each councils cost structure. Each council has sufficient scale to fully utilise specialist staff resources.
• NCC has the scale to justify specialist recruitment where appropriate and recent experience demonstrates Council can attract excellent candidates. Council has sufficient scale to ensure effective utilisation of specialist staff.
• A number of capital intensive functions either have a regional focus / role (waste management, civic facilities, sporting facilities) or are not within the scope of council services (water and sewerage)
• Standalone proposal meets FFTF criteria
• FFTF Council Improvement initiatives will build on the efficiencies already achieved under the recent “road to recovery” program.
• The ILGRP provides an assessment of prior NSW council amalgamations which indicates that staffing levels actually increased post merger (p69-70 of the Research Report, Supporting Information, Volume 2, Part 1). The report referenced indicates there was an 11.7% increase in EFT employees from 2002-03 to 2010-11.
• Based on OLG data total staff EFT for NSW councils increased from 40,960 (2002-03) to 44,303 (2010-11). This is an increase of 8.2% over the same period.
• NNC’s own analysis using OLG data for 2012-13 has reached similar conclusions. This analysis assessed the correlation between per capita costs for different services based on number of residents found that there was a positive correlation (diseconomies) across a number of services.
• Case studies on prior amalgamations have identified that amalgamations
• There is no evidence that a merger will create any significant economies of scale. This is due to a number of factors including: significant scale as standalone councils, topographical considerations, no significant synergies (different planning considerations, strategies, priorities).
• Appendix D provides additional details.
• The strategic objectives of Newcastle and Lake Macquarie are quite different. Newcastle is focusing on asset renewal (older assets), redevelopment / densification, urban renewal, assets of regional significance. Lake Macquarie is focused on ongoing suburban development (including Greenfield sites), the environmental management considerations of the lake, and suburban retail hubs.
• There is little overlap along common boundaries that requires integrated planning and limited scenarios where Newcastle and Lake Macquarie need to collaborate together or jointly with state and federal agencies. .
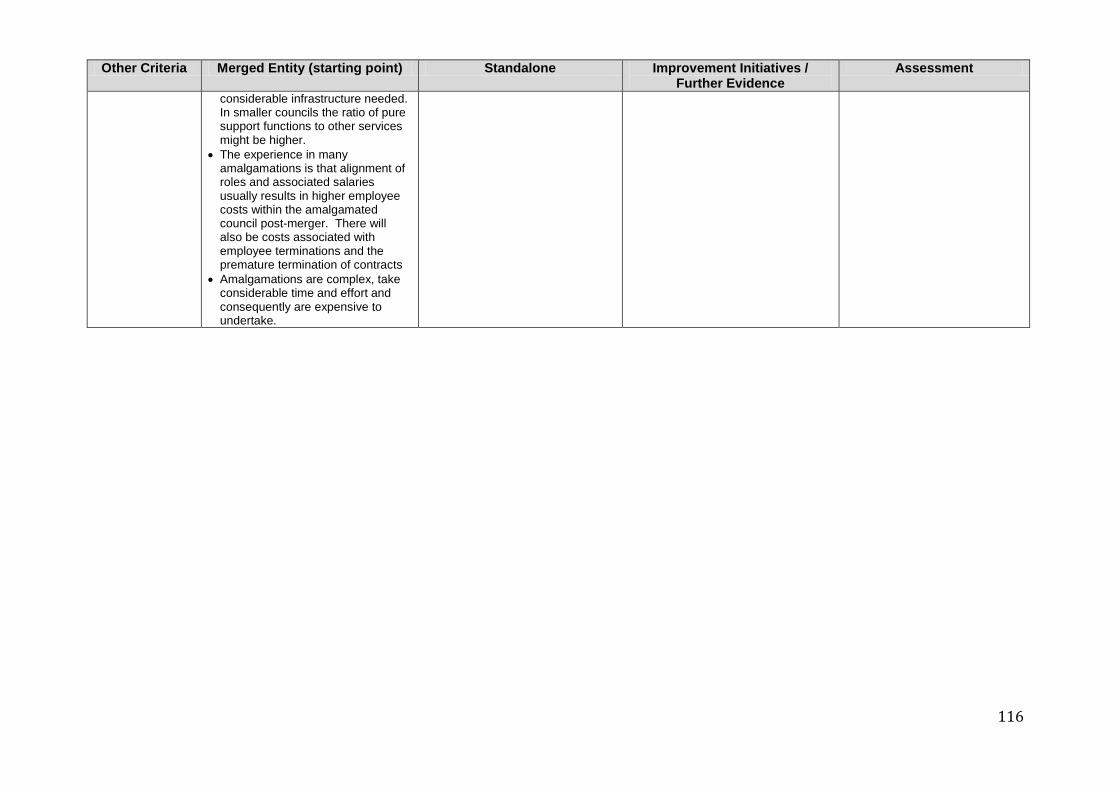
116
Other Criteria Merged Entity (starting point) Standalone Improvement Initiatives / Further Evidence
Assessment
considerable infrastructure needed. In smaller councils the ratio of pure support functions to other services might be higher.
• The experience in many amalgamations is that alignment of roles and associated salaries usually results in higher employee costs within the amalgamated council post-merger. There will also be costs associated with employee terminations and the premature termination of contracts
• Amalgamations are complex, take considerable time and effort and consequently are expensive to undertake.

117
Appendix H: Program Charters
The FFTF initiatives have been grouped into improvement programs of related projects / initiatives. This assists in ensuring that a strategic perspective is maintained and there is recognition that success is dependent upon a multi-year focus on the program objectives. The FFTF improvement program is a multi-year program which focuses on directly addressing a number of scale and capacity sub-criteria as well as the other criteria that are metrics based and cover financial ratios or ratios derived from financial data. The programs help strengthen Council's revenue position and/or increase Council's own-source revenue. A number programs focus on efficiency and improving productivity of project related activities (a major component of Council’s costs). These initiatives assist in increasing Council’s capacity to undertake more capital works and enables Council to reduce the infrastructure backlog faster. Seven program charters have been completed (in line with Council’s project management framework) to define programs that will be commencing in 2015/16. The program charters for programs commencing in 1016/17 will be completed next year. The programs are:
H1 Revenue Raising – Improve Investment Returns Program H2 Revenue Raising – Improve Grant & Sponsorship Application Process H3 Revenue Raising – Maximising economic returns from Council's other businesses H4 Operational Savings - Expense Management Program H5 Operational Savings - Complete Organisational Restructure H6 Capital Expenditure Savings - Improve Procurement Controls H7 Infrastructure Rehabilitation – Optimise asset renewal & rehabilitation processes.

118
H1 Revenue Raising – Improve Investment Returns Program
Project Name Revenue Raising – Improve Investment Returns Program Project File Number
Project Type • Choose which funding program
Built infrastructure X Strategic Corporate IT Major Asset Preservation Program (MAPPs) Governance
Executive Summary • Where is the project located? • What is the project? • Project background? • Who is the end user?
Location: Undertaken by Finance and Commercial Property Business Units Project Description: Diversifying our investment portfolio to include TCorp approved investments which are projected to provide higher returns in the longer term. An example would be TCorp's hourglass facility Enable council to utilise available funds to invest in commercial property that supports Councils functions and are aligned to Council’s strategic priorities. Appropriate hurdle rates will be required to ensure Council does not invest in assets which are detrimental to Council’s financial position. The risk premium associated with the appropriate hurdle rate might result in a higher return from these acquisitions. Another identified use of funds is to utilise the funds in the form of internal borrowing. This approach will avoid council incurring the cost between margins which apply for borrowing and investment. In some instances this might not be an optimal approach. This option will need to be accessed on a case by case basis. Project Background: The NSW Office of Local Government (OLG) has implemented a program to ensure all NSW councils are “Fit for the Future (FftF)”. A Fit for the Future council is one that is:
• Sustainable; • Efficient; • Effectively manages infrastructure and delivers services for communities; • Has the scale and capacity to engage effectively across community, industry and government.

119
Councils have 2 options (1) demonstrate that an amalgamation with other councils will enable them to become sustainable or (2) if not already sustainable then present a viable plan which demonstrates council will be sustainable (meets sustainability criteria) within an reasonable period or reflects a clear and strong trend towards a position of enduring sustainability. NCC is pursing the second option and has developed an FftF program builds on the improvement program council has already undertaken. Council has identified areas where Council can make further improvements in its operating position (through revenue enhancement and expense management) and improving the efficiency of undertaking capital works (particularly asset renewal projects) to enable a faster and more cost effective reduction of the infrastructure backlog. The program has been broken into the following streams:
1. Revenue Raising Measures (operating) 2. Operational Saving Measures 3. Revenue Raising Measures (capital) 4. Capital (expenditure) Savings Measures 5. Infrastructure Rehabilitation
There are a number of programs under each stream and each program will have one or more projects (or initiatives). The goal is for project costs to be largely funded by the projects and the projects have been sequenced to (1)avoid creating a material adverse financial impact in any year of the program and (2) pace the projects to ensure sufficient management attention and resources can be applied across the program. The annual benefits of the program are largely achieved by 2017/18 to ensure The program is part of the Revenue Raising Measures Stream (operating). This stream includes the following projects (for context):
• Improve investment returns on reserve funds within approved risk parameters • Improve effectiveness of grant & sponsorship application process • Partial divestment and capital injection into Newcastle airport to maximise returns • Maximise economic returns from Councils other businesses
This program will focus on two initiatives:
• Diversifying our investment portfolio to include additional investment grade commercial properties (this can only be undertaken if investments meet other strategic objectives of Council i.e. investment returns alone is not sufficient justification for any commercial property investments).
• Focus on improving rental returns on existing commercial properties. Council already has a legacy portfolio of commercial properties. Council will dispose of any holdings in the future that do not meet Council’s strategic objectives. Any properties held either temporarily (until disposed) or on a more permanent basis (due to strategic alignment) will be managed on a commercial basis to ensure Council maximises returns for the benefit of ratepayers.

120
Project Purpose/Justification • Why are we doing this? • Alignment with Council’s strategic
objectives? (Delete those not applicable)
• Other strategic Documents eg Business Case, Master Plan, Technical Manuals, DCP etc
The 2030 Community Strategic Plan highlights the need for Council to provide services to the community in a sustainable manner. Council has been undertaking a “road to recovery” program which has achieved significant results and in conjunction with an SRV has placed Council on a sustainable path. The OLG Fit for the Future initiatives have been introduced to determine Local Government's ability to be strong and sustainable into the future. The following financial targets have been outlined to be met by Council's to demonstrate they are "Fit for the Future": 1. Operating Performance Ratio being greater than or equal to break even over three years; 2. Own Source Revenue Ratio being greater than 60% over three years; 3. Building and Infrastructure Asset Renewal Ratio being greater than one over three years; 4. Infrastructure backlog ratio being less than 2%; 5. Asset Maintenance Ratio being greater than one; 6. Debt Service Ratio being greater than zero and less than 0.2. 7. Real Operating Expenditure per capita over time has the scale and capacity consistent with the recommendations of the Independent Panel. Council's LTFP and Delivery Programs have been revised as part of the 2015/16 budget process to include all of the FftF initiatives identified (including this program of initiatives) to endeavour to achieve all 7 of the targets outlined by the OLG. Maximising returns from Council's investments will clearly contribute to improving Council's financial positioning into the future. In terms of the FftF targets this project will directly benefit Council by improving Council's Operating Performance Ratio and Own Source Revenue Ratio. Other Ratios may also be indirectly improved due to the projected increase in Council's Operating result providing increased revenue available to be directed to such tasks as asset renewal and rehabilitation.

121
Project Objectives • What are we doing? • Specific objectives for the scope
of work covered by this charter?
The program will have the following objectives:
• Identify strategic objectives within Council that will benefit from of be supported by potential commercial property investments
• Seek to achieve commercial property yields which are 3% above current investment yields • Based on reserve requirements which include a significant portion on long term provisions (employee related
and associated with provisions for waste site remediation) target a portion of the investments which aligns to these long term reserve requirements which can also support investment in strategic assets. This is currently estimated as approximately 25% of current cash and investments
• Utilise investment returns to fund the waste remediation provisioning (maintaining reserves in real terms) with surplus funds applied to funding strategic priorities such as asset renewal.
• Based on the above objectives target an increase in average yield on cash and investments of approximately 0.75%
• Seek commercial returns on existing commercial property portfolio by undertaking more extensive rent reviews and reviewing subsidised rental arrangements – target an additional $20k per annum
Constraints Possible constraints
• Lack of investment properties that both (1) support Council strategic objectives and (2) meet Council’s investment criteria (including hurdle rates, caps on capital and operating costs)
• Total investment will always be constrained by (1) total cash and investment position and (2) portion of funds that support longer term requirements and can therefore support investment in longer term (and less liquid) investments.
• Policy will reflect need to hold assets typically for an extended duration (not trading assets) to support the strategic purposes of Council and to limit the potential for capital loss
Assumptions Assumptions:
• Council approval to consider actively increasing grant and sponsorship applications. • Council can identify sufficient internal funding sources or alternative funding sources to successfully meet grant
conditions to achieve the budgeted increase in revenue through grants and sponsorship. • Council has the resources and skill set available to achieve the objectives of this project or has the capacity to
source them within the required timeframe. • There is a clear understanding and agreed cooperation between the relevant Business Units involved in the
project.
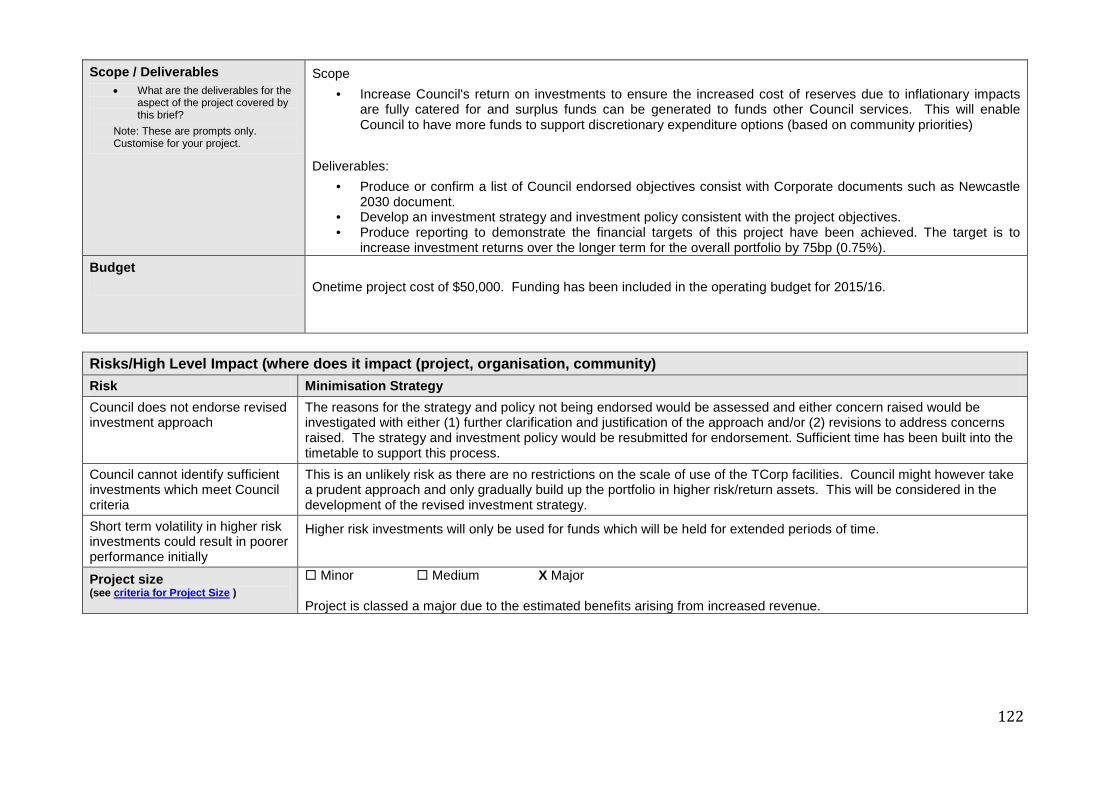
122
Scope / Deliverables • What are the deliverables for the
aspect of the project covered by this brief?
Note: These are prompts only. Customise for your project.
Scope • Increase Council's return on investments to ensure the increased cost of reserves due to inflationary impacts
are fully catered for and surplus funds can be generated to funds other Council services. This will enable Council to have more funds to support discretionary expenditure options (based on community priorities)
Deliverables:
• Produce or confirm a list of Council endorsed objectives consist with Corporate documents such as Newcastle 2030 document.
• Develop an investment strategy and investment policy consistent with the project objectives. • Produce reporting to demonstrate the financial targets of this project have been achieved. The target is to
increase investment returns over the longer term for the overall portfolio by 75bp (0.75%). Budget
Onetime project cost of $50,000. Funding has been included in the operating budget for 2015/16.
Risks/High Level Impact (where does it impact (project, organisation, community) Risk Minimisation Strategy Council does not endorse revised investment approach
The reasons for the strategy and policy not being endorsed would be assessed and either concern raised would be investigated with either (1) further clarification and justification of the approach and/or (2) revisions to address concerns raised. The strategy and investment policy would be resubmitted for endorsement. Sufficient time has been built into the timetable to support this process.
Council cannot identify sufficient investments which meet Council criteria
This is an unlikely risk as there are no restrictions on the scale of use of the TCorp facilities. Council might however take a prudent approach and only gradually build up the portfolio in higher risk/return assets. This will be considered in the development of the revised investment strategy.
Short term volatility in higher risk investments could result in poorer performance initially
Higher risk investments will only be used for funds which will be held for extended periods of time.
Project size (see criteria for Project Size )
Minor Medium X Major Project is classed a major due to the estimated benefits arising from increased revenue.
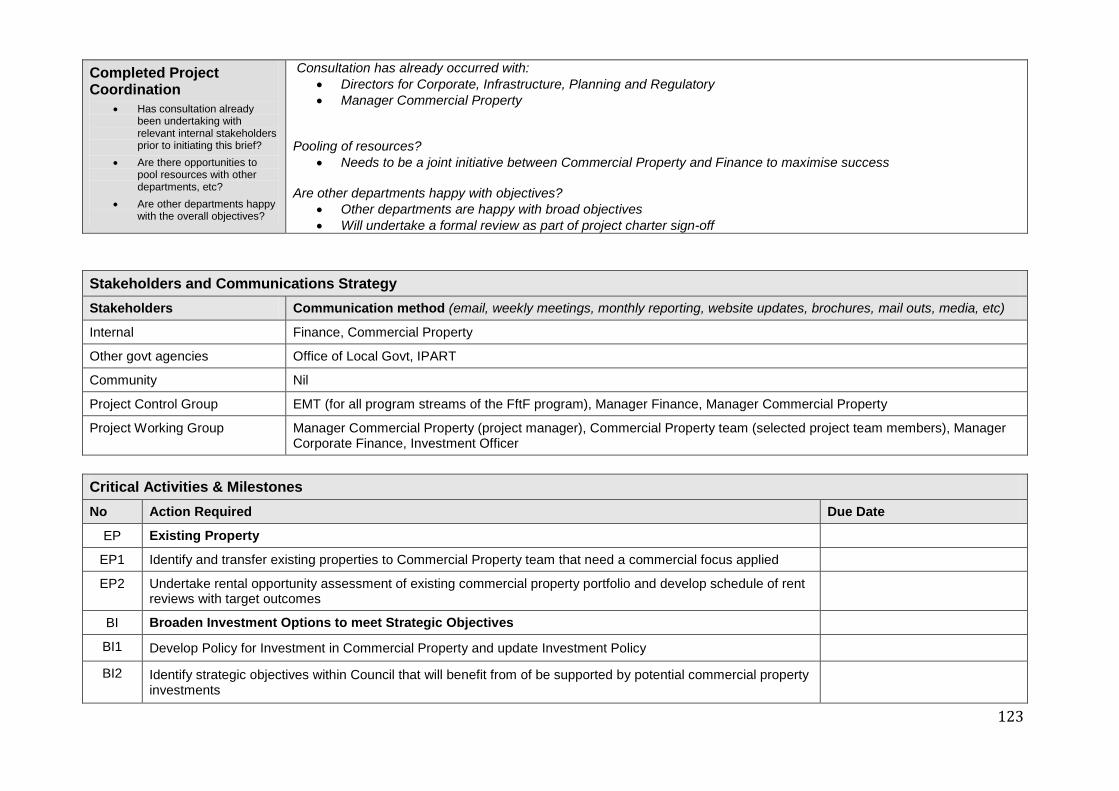
123
Completed Project Coordination
• Has consultation already been undertaking with relevant internal stakeholders prior to initiating this brief?
• Are there opportunities to pool resources with other departments, etc?
• Are other departments happy with the overall objectives?
Consultation has already occurred with: • Directors for Corporate, Infrastructure, Planning and Regulatory • Manager Commercial Property
Pooling of resources?
• Needs to be a joint initiative between Commercial Property and Finance to maximise success Are other departments happy with objectives?
• Other departments are happy with broad objectives • Will undertake a formal review as part of project charter sign-off
Stakeholders and Communications Strategy Stakeholders Communication method (email, weekly meetings, monthly reporting, website updates, brochures, mail outs, media, etc)
Internal Finance, Commercial Property
Other govt agencies Office of Local Govt, IPART
Community Nil
Project Control Group EMT (for all program streams of the FftF program), Manager Finance, Manager Commercial Property
Project Working Group Manager Commercial Property (project manager), Commercial Property team (selected project team members), Manager Corporate Finance, Investment Officer
Critical Activities & Milestones No Action Required Due Date
EP Existing Property
EP1 Identify and transfer existing properties to Commercial Property team that need a commercial focus applied
EP2 Undertake rental opportunity assessment of existing commercial property portfolio and develop schedule of rent reviews with target outcomes
BI Broaden Investment Options to meet Strategic Objectives
BI1 Develop Policy for Investment in Commercial Property and update Investment Policy
BI2 Identify strategic objectives within Council that will benefit from of be supported by potential commercial property investments

124
BI3 Undertake an appraisal of the Newcastle LGA for candidate properties
BI
BI4 • Based on reserve requirements which include a significant portion on long term provisions (employee related and associated with provisions for waste site remediation) target a portion of the investments which aligns to these long term reserve requirements which can also support investment in strategic assets. This is currently estimated as approximately 25% of current cash and investments
• Utilise investment returns to fund the waste remediation provisioning (maintaining reserves in real terms) with surplus funds applied to funding strategic priorities such as asset renewal.
• Based on the above objectives target an increase in average yield on cash and investments of approximately 0.75%
Governance Client Director Corporate
Asset Manager/s n/a
Sponsor General Manager
Project Control Group (Major Projects only) EMT (for all program streams of the FftF program), Manager Finance, Manager Commercial Property
Service Provider Business Unit: Commercial Property Business Unit Manager: Paul Nelson Team Coordinator: n/a Project Manager/Officer: Manager Commercial Property
Project Charter Prepared by Andrew Glauser (Manager Finance) Date: 28 April 2015
Approved By Sponsor:_______________________________________ Date: ________ Client::________________________________________ Date: ________ Project Manager:________________________________ Date: ________

125
H2 Revenue Raising – Improve Grant & Sponsorship Application Process
Project Name Revenue Raising – Improve Grant & Sponsorship Application Process Project File Number
Project Type • Choose which funding program
Built infrastructure X Strategic Corporate IT Major Asset Preservation Program (MAPPs) Governance
Executive Summary • Where is the project located? • What is the project? • Project background? • Who is the end user?
Location: Undertaken by Finance Project Description: Improving the effectiveness of our grants and sponsorship application process Project Background: The NSW Office of Local Government (OLG) has implemented a program to ensure all NSW councils are “Fit for the Future (FftF)”. A Fit for the Future council is one that is:
• Sustainable; • Efficient; • Effectively manages infrastructure and delivers services for communities; • Has the scale and capacity to engage effectively across community, industry and government.
NCC is submitting a Template 2 Improvement Proposal and has developed an FftF program building on the "Road to Recovery" improvement program already underway. Council has identified areas where further improvements in its operating position can be achieved, through revenue enhancement and expense management Opportunities have also been identified to improve the efficiency of undertaking capital works (particularly asset renewal projects) which will result in a faster and more cost effective reduction of the infrastructure backlog.

126
The program has been broken into the following streams:
1. Revenue Raising Measures (operating) 2. Operational Saving Measures 3. Revenue Raising Measures (capital) 4. Capital (expenditure) Savings Measures 5. Infrastructure Rehabilitation
There are a number of programs under each stream and each program will have one or more projects (or improvement initiatives). The goal is for project costs to be largely funded by the additional revenue and/or cost savings created by the projects and the projects have been sequenced to (1) avoid creating a material adverse financial impact in any year of the program and (2) Scheduled to ensure sufficient management attention and resources can be applied across the program. The annual benefits of the program are largely achieved by 2017/18 to ensure Council has a stronger financial position in the short term which can be built upon in the long term. The program is part of the Revenue Raising Measures Stream (both operating and capital). As well as the Capital (expenditure) Savings Measures. These streams includes the following projects (for context):
• Improve investment returns on reserve funds within approved risk parameters • Improve effectiveness of grant & sponsorship application process • Partial divestment and capital injection into Newcastle airport to maximise returns • Maximise economic returns from Councils other businesses • Enhance Project Management capability to improve project delivery efficiency • Establish a vendor management office and apply sourcing best practice • Improve procurement controls
This program will focus on four initiatives:
• Creating a greater financial focus by relocating key staff to the Financial Services Business Unit. • Improved accuracy in targeting grant funding by reviewing and amending Council's grant and sponsorship
process to achieve a holistic, strategic approach. • Strengthening of grant submissions by focusing on continual improvement process. • Enhancing capacity to attract sponsorship
127
Project Purpose/Justification • Why are we doing this? • Alignment with Council’s strategic
objectives? (Delete those not applicable)
• Other strategic Documents eg Business Case, Master Plan, Technical Manuals, DCP etc
The 2030 objectives applicable to this project are: • Smart & Innovative City • Open & Collaborative Leadership •
The 2030 Community strategic Plan highlights the need for Council to provide services to the community in a sustainable manner. Council has been undertaking a “road to recovery” program which has achieved significant results and in conjunction with an SRV has placed Council on a sustainable path. The OLG Fit for the Future initiatives have been introduced to determine Local Government's ability to be strong and sustainable into the future. The following financial targets have been outlined to be met by Council's to demonstrate they are "Fit for the Future": 1. Operating Performance Ratio being greater than or equal to break even over three years; 2. Own Source Revenue Ratio being greater than 60% over three years; 3. Building and Infrastructure Asset Renewal Ratio being greater than one over three years; 4. Infrastructure backlog ratio being less than 2%; 5. Asset Maintenance Ratio being greater than one; 6. Debt Service Ratio being greater than zero and less than 0.2. 7. Real Operating Expenditure per capita over time has the scale and capacity consistent with the recommendations of the Independent Panel. Council's LTFP and Delivery Programs have been revised as part of the 2015/16 budget process to include all of the FftF initiatives identified (including this program of initiatives) to endeavour to achieve all 7 of the targets outlined by the OLG.

128
This project will assist with achieving many of the FftF targets depending on whether the grant is operational or capital based. By improving the grant and sponsorship process outlined by this project it has the ability to positively impact Council's Operating Performance Ratio should Council be successful in securing further grant funding for Operational purposes. An indirect improvement will result in many areas including the possibility of a favourable effect on Council's Building and Infrastructure Asset Renewal Ratio, Infrastructure Backlog Ratio and Asset Maintenance Ratio due to a more efficient, strategic use of total funding and corporate focus.
Project Objectives • What are we doing? • Specific objectives for the scope
of work covered by this charter? The program will have the following objectives:
• Clearly identify strategic objectives of Council in line with Council's overarching corporate documents such as
Newcastle 2030 and the LTFP, which will form the basis for targeting and prioritising grant related funding applications.
• Create a Project Steering Committee to actively identify grant funding sources which support projects in line with achieving Council's strategic objectives.
• By strengthening Council's relationship between corporate objectives and grant funding through explicitly documenting strategic goals including detailed business cases with a basis of Total Cost of Ownership, it is envisioned to result in an increase in achieved grant funding of $1m per annual. Additionally, from this objective there is an expected decrease in capital expenditure through the avoidance of non-strategic expenditure. It is expected this will produce a saving of $300k per annum.
• Strengthen Council's grant application quality and efficiency by focusing on continually improving the process and associated staff skills. This continual improvement in grant submissions is expected to increase Council's success rate of applied grant funding by an estimated $1m per annum.
• With the strengthening of Council's processes and resources through the above objectives, in conjunction with Council's experienced and proficient Leadership Team, Council will have an enhanced capacity to attract further sponsorship income.

129
Constraints
Possible constraints
• Determination of prioritisation of the corporate objectives for grant funding. • Skilled resources availability to take part in the project. • Workforce availability to produce the required result consistent with the grant conditions. • External Economic constraints. The pool of grant funding available to Council will be driven by external
economic conditions including Federal and State Government budgetary pressures, for example Council's primary operational grant revenue is the federal FAG. The Federal Government has frozen this grant for the next three years with uncertainty.
• State and Federal Governments priority for allocating grant funding may differ from Council's priorities in line with our strategic objectives. For example there is currently a trend to redistribute government funding to rural or smaller councils which are deemed to have a great need for funding.
• Revised grant funding criteria (for example State Government criteria in regards to assigning the Financial Assistance Grant).
• Internal funding and budget limitations. Grant funding and sponsorship are primary comprised of multiple funding sources. Internal funding is often required in terms of matching the grant funding awarded to a project.
• Information availability on all relevant sources of grant and sponsorship available. • Difficulty in tracking and documenting whether project objectives are being met. • Timeframe to increase the grant and sponsorship revenue and reduce expenditure is relatively short.
Assumptions Assumptions:
• Council approval to consider actively increasing grant and sponsorship applications. • Council can identify sufficient internal funding sources or alternative funding sources to successfully meet grant
conditions to achieve the budgeted increase in revenue through grants and sponsorship. • Council has the resources and skill set available to achieve the objectives of this project or has the capacity to
source them within the required timeframe. • There is a clear understanding and agreed cooperation between the relevant Business Units involved in the
project.
130
Scope / Deliverables • What are the deliverables for the
aspect of the project covered by this brief?
Scope • Increase Council's ability to attract further grant and sponsorship funding by enhancing and improving our
application process and strategy. Included in the scope of the project is continual improvement of our application quality and a stronger focus on the inter-relationship between grant applications and Council's corporate objectives with additional attention given to financial aspect of total project cost and total ownership cost of the resulting assets or services.
Deliverables:
• Produce or confirm a list of Council endorsed objectives consist with Corporate documents such as Newcastle 2030 document.
• Produce a report listing the total grant and sponsorship funding available which coincide with the identified corporate objectives and the amount of which we were successful in securing by financial year.
• Produce reporting to demonstrate the financial targets of this project have been achieved. The financial objectives of this project are to realise a $1m capital revenue increase per annum from the 2016/2017 financial year through strategically targeting specific desired grants. A further increase in capital revenue of $1m per annum from 2017/2018 due to developing Council's quality of applications. A rise in operating revenue of $300k per annum from 2016/2017 through attracting additional sponsorship. A reduction of $300k per annum in capital expenditure through avoidance of expenditure on projects not associated with the corporate objectives.
Budget
Total project budget is $100k. Budgeted through the 2015/2016 Operational Plan.
Risks/High Level Impact (where does it impact (project, organisation, community) Risk Minimisation Strategy Council may not have the workforce capacity to produce the required asset within the specified timeframe of the grant conditions
Minimisation strategy will include the following:
• Ongoing consultation and communication with relevant business units to ensure they can schedule and prioritise workload demands.
• Ensure Council has access to additional workforce resources if required
Economic restrictions on total pool of funds available
• Ensure Council's approach and quality of grant applications is extreme strong and interlinks with corporate documentation to demonstrate a holistic, well considered approach.
Availability of required internal funding to satisfy grant conditions
• Ensure stringent controls over project prioritisation, budgeting and funding during the Operational and Delivery programs development phase
• Ensure this is communicated to all internally vested parties
131
Project size (see criteria for Project Size )
Minor Medium X Major Project is classed a major due to the estimated benefits arising from increased revenue.
Completed Project Coordination
• Has consultation already been undertaking with relevant internal stakeholders prior to initiating this brief?
• Are there opportunities to pool resources with other departments, etc?
• Are other departments happy with the overall objectives?
Consultation has already occurred with: • Directors for Corporate, Infrastructure, and Planning & Regulatory • Managers of Infrastructure Planning and Projects and Contracts
Pooling of resources?
• Needs to be a joint initiative between Infrastructure Planning, Projects and Finance to maximise success Are other departments happy with objectives?
• Other departments are happy with broad objectives • Will undertake a formal review as part of project charter sign-off
Stakeholders and Communications Strategy Stakeholders Communication method (email, weekly meetings, monthly reporting, website updates, brochures, mail outs, media, etc)
Internal Finance, Infrastructure Planning, Projects & Contracts
Other govt agencies State Gov, Federal Gov
Community Nil
Project Control Group EMT (for all program streams of the FftF program), Manager Finance, Manager Infrastructure Planning, Manager Projects & Contracts
Project Working Group Manager Business Finance (project manager), Infrastructure Planning and Projects & Contracts (selected project team members), Manager Finance, Grants Officer, Treasury Accountant, Budget Accountant
Critical Activities & Milestones No Action Required Due Date
CO Corporate Objectives
CO1 Identify strategic objectives within Council that will benefit from being supported by grant and sponsorship funding
132
CO2 Develop matrix of Corporate Objectives with relevant projects, project status, funding, timeframe and prioritisation for funding
G Grant Funding
G Identify all grant and sponsorship funding available and appropriate for the corporate objectives identified
G1 Identify the funding available which is suitable to planned projects and identify all other funding sources and schedule of works to ensure projects are feasible in terms of resources, time frames and funding
G2 Identify the funding available which is suitable for unplanned projects which are still consistent with the corporate objectives.
G3 Develop a report identifying grant funding secured and which corporate objective the funding is associated with.
AP Application Process
AP1 Develop flow chart of application process for grant funding
Governance
Client Director Corporate
Asset Manager/s n/a
Sponsor General Manager
Project Control Group (Major Projects only) EMT (for all program streams of the FftF program), Manager Finance, Manager Infrastructure Planning, Manager of Projects
Service Provider Business Unit: Finance Business Unit Manager: Andrew Glauser Team Coordinator: n/a Project Manager/Officer: Martin Swan
Project Charter Prepared by Andrew Glauser (Manager Finance) Date: 14th May 2015

133
Approved By Sponsor:_______________________________________ Date: ________ Client::________________________________________ Date: ________ Project Manager:________________________________ Date: ________
134
H3 Revenue Raising – Maximising economic returns from Council's other businesses < Insert program charters>
Project Name Revenue Raising – Maximising economic returns from Council's other businesses Project File Number
Project Type • Choose which funding program
Built infrastructure X Strategic Corporate IT Major Asset Preservation Program (MAPPs) Governance
Executive Summary • Where is the project located? • What is the project? • Project background? • Who is the end user?
Location: Undertaken by Finance Project Description: Raise Council's revenue margin through strategic adjustments to the operations of Council's commercial businesses. Project Background: The NSW Office of Local Government (OLG) has implemented a program to ensure all NSW councils are “Fit for the Future (FftF)”. A Fit for the Future council is one that is:
• Sustainable; • Efficient; • Effectively manages infrastructure and delivers services for communities; • Has the scale and capacity to engage effectively across community, industry and government.
NCC is submitting a Template 2 Improvement Proposal and has developed an FftF program building on the "Road to Recovery" improvement program already underway. Council has identified areas where further improvements in its operating position can be achieved, through revenue enhancement and expense management. Opportunities have also been identified to improve the efficiency of undertaking capital works (particularly asset renewal projects) which will result in a faster and more cost effective reduction of the infrastructure backlog.
135
The program has been broken into the following streams:
1. Revenue Raising Measures (operating) 2. Operational Saving Measures 3. Revenue Raising Measures (capital) 4. Capital (expenditure) Savings Measures 5. Infrastructure Rehabilitation
There are a number of programs under each stream and each program will have one or more projects (or improvement initiatives). The goal is for project costs to be largely funded by the additional revenue and/or cost savings created by the projects and the projects have been sequenced to (1) avoid creating a material adverse financial impact in any year of the program and (2) ensure sufficient management attention and resources can be applied across the program. The annual benefits of the program are largely achieved by 2017/18 to ensure Council has a stronger financial position in the short term which can be built upon in the long term. This program is part of the Revenue Raising Measures Stream (both operating and capital). As well as the Capital (expenditure) Savings Measures. This stream includes the following projects (for context):
• Improvement of investment returns on reserve funds within approved risk parameters. • Improvement of effectiveness of the grant & sponsorship application process. • Partial divestment and capital injection into Newcastle airport to maximise returns. • Maximising economic returns from Councils other businesses. • Enhancing Project Management capability to improve project delivery efficiency. • Establishing a vendor management office and applying sourcing best practice • Improvement to procurement controls.
This program will focus on four initiatives:
• Expansion of capabilities and capacity of Summerhill Waste facility, • Market differentiation via Summerhill offering waste facilities not widely offered in the local geographic area, • Increased margin for Cultural venues through a reduction in expenses facilitated through shared administrative
services, • Upgrade of ticketing system for the Mall car park (complete).

136
Project Purpose/Justification • Why are we doing this? • Alignment with Council’s strategic
objectives? (Delete those not applicable)
• Other strategic Documents eg Business Case, Master Plan, Technical Manuals, DCP etc
The 2030 objectives applicable to this project are: • Smart & Innovative City • Open & Collaborative Leadership • Protected & Enhanced Environment
The 2030 Community Strategic Plan highlights the need for Council to provide services to the community in a sustainable manner. Council has been undertaking a “road to recovery” program which has achieved significant results and in conjunction with an SRV has placed Council on a sustainable path. The OLG Fit for the Future initiatives have been introduced to determine Local Government's ability to be strong and sustainable into the future. The following financial targets have been outlined to be met by Council's to demonstrate they are "Fit for the Future": 1. Operating Performance Ratio being greater than or equal to break even over three years; 2. Own Source Revenue Ratio being greater than 60% over three years; 3. Building and Infrastructure Asset Renewal Ratio being greater than one over three years; 4. Infrastructure backlog ratio being less than 2%; 5. Asset Maintenance Ratio being greater than one; 6. Debt Service Ratio being greater than zero and less than 0.2. 7. Real Operating Expenditure per capita over time has the scale and capacity consistent with the recommendations of the Independent Panel. Council's LTFP and Delivery Programs have been revised as part of the 2015/16 budget process to include all of the FftF initiatives identified (including this program of initiatives) to endeavour to achieve all 7 of the targets outlined by the OLG. Maximising returns from Council's commercially based businesses will clearly contribute to improving Council's financial positioning into the future. In terms of the FftF targets this project will directly benefit Council by improving Council's Operating Performance Ratio and Own Source Revenue Ratio. Other Ratios may also be indirectly improved due to the projected increase in Council's Operating result providing increased revenue available to be directed to such tasks as asset renewal and rehabilitation.

137
Project Objectives • What are we doing?
• Specific objectives for the scope of work covered by this charter?
The program will have the following objectives:
• Provide Newcastle City Council with significant ongoing operational savings through diversion of material from landfill and subsequent avoidance of the NSW Government S88 Landfill Levy. Whilst relatively large upfront capital investment and ongoing expenditure is required to establish and maintain the required infrastructure to achieve diversion, these costs (including the costs of capital) are heavily outweighed by the operational benefits of diversion and Levy avoidance.
• Adherence to the NSW EPA Waste Avoidance and Resource Recovery (WARR) Strategy 2014-21 which in turn looks to 'avoiding and reducing the amount of waste generate per person in NSW' as well as increasing waste diverted from landfill to 75%.
• Improved asset preservation through the most efficient use of Summerhill's landfill airspace capacity. This airspace is a considerable asset which is available for sale to commercial clients. With regional landfill facilities such as Awaba and Mt Vincent nearing their long term operational capacity, preserving the Summerhill airspace capacity will potentially allow the site to increase its commercial viability both now and into the future.
• Increase Council's revenue raising ability by expanding operational capacity and commercial appeal of Summerhill as a regional waste solution within the Hunter region. Establishing the proposed projects will allow LGA's within the region access to facilities that will achieve diversion of materials not otherwise achievable, whilst also providing the capacity for Council to receive waste of other LGA's once their existing landfill facilities have reached capacity. This positioning will have both social and economic benefits for the region and specifically to Council.
• Increase shared services across Council's commercial functions which will lead to greater economies of scale providing a larger profit margin for Council. For the Summerhill site the ability to take on more waste materials through both preservation of landfill airspace and strengthening of the regional market position in waste diversion and recovery will allow Council to achieve greater economic benefits through the spread of fixed costs. Whilst improved revenue opportunities will arise through coordinated sales and administrative functions across the Civic services.
• Alignment to Newcastle City Council's Strategic Objective of a protected and enhanced environment through; greater efficiency in the use of resources, maintenance, enhancement and connection of our unique natural environment and understanding and management of environmental and climate changes risks.
• Place NCC in a position to participate in future energy markets for Process Engineered Fuel (PEF). Whilst these markets are currently in their infancy and have not been taking into account when forecasting the economic benefits of the proposed projects, there is the potential for diversion to near 100% in the future which would serve to further increase the economic benefits to NCC of the projects.
• Secure additional grant funding to support capital development to facilitate expansion and improved commercial services.
• Upgrade to systems supporting commercial functions such as the car park ticketing system

138
Constraints
Possible constraints
• Length of time in establishing infrastructure. All three proposed projects at Summerhill require significant infrastructure, most notable the Dirty MRF facility and SVRC expansion. Engineering and/or construction delays will result in an increase in the time that capital is outlaid before an economic return is achieved.
• Availability of contractor workforce to undertake all three of the projects (along with the construction of the new landfill cell) at the site. A lot of the works required will be specialised in nature, meaning that the pool of available contractors is small.
• Budgetary constraints in terms of the significant capital investment required. • Operational budgetary challenges to support the expanded services. • Market demand for the proposed services will be reliant on many external factors, including competition from
other waste facilities in the region. It is noted that a private operator within the region (partnering with another LGA) is undertaking some waste diversion activities currently; however given the size of the market, proximity of Summerhill to local commercial operators and major transport infrastructure, the size of the local market for waste disposal and diminishing landfill capacity in comparable sites, this risk should be minimal. Markets for extracted materials reducing (hence leading to a non-diversion from landfill). This is again considered to have a small impact given that a lot of these markets and customers are already established.
Assumptions Assumptions: • The size of the NSW S88 Waste Levy remains constant in real dollar terms. Any decrease or abolition of the
Levy would prove to have a major economic impact on the viability of the projects (however is considered to be highly unlikely). Conversely, any increase to the levy beyond inflation will only move to increase the economic benefits to Council of diversion.
• Council are able to employ the skills and personnel to operate the proposed infrastructure in a manner which is both resource and economically efficient.
• Summerhill are able to hold gate fees and margins at the Summerhill facility constant, or (in the case of providing discounts for source separated materials) offer discounts equal to savings in operating costs from presented materials. Market position should ensure that this is possible and that Council retains the economic benefits associated with divergence and avoidance of the Landfill Levy.
139
Scope / Deliverables • What are the deliverables for the
aspect of the project covered by this brief?
Scope • To improve the economic returns of Councils commercial operation s primarily through investment in
infrastructure that will divert waste materials from landfill, avoid Council paying the NSW S88 Waste Levy and in turn increase the margins from Councils existing waste operations. Council will potentially be able to strengthen our position in these markets, leading to further benefits in the future.
• Increase Council's waste diversion and recycling rates in order to adhere to the environmental goals and concerns of the community.
Deliverables:
• Improve Council's Summerhill facilities to allow for the diversion of materials otherwise placed to landfill. This is to be achieved via three major capital projects at the Summerhill site, being the expansion of the existing SVRC facility, and the development of the two new facilities being organic processing division and Dirty MRF function. Reports into the effectiveness of the various projects will be developed which will capture both the environmental benefits (through tonnages of diverted material) and economic benefits (avoided waste levy compared to operating costs) of the individual projects and how these in turn interact with the profitability and scale of the existing landfill operation.
• Presentation of recycled materials to customers for reuse and reconstitution. Material and economic measures of these materials will be monitored and presented.
• Secure $5.8m of NSW Government sourced grant funding to assist in delivery of the proposed capital projects for Waste Management.
• Adjustments to the Long Term Financial Plan showing increased margins and profitability of Summerhill and Council's other commercial functions.
• Increased market share of regionally sourced waste material as measured through increased tonnages received and increased revenue.
• Investigate and report on operating systems utilised in car parking facilities and determine if there is a significant financial benefit to upgrading Council's current system.
Budget
Total project budget for the three capital Waste projects is for an initial capital outlay of $16.58m. $5.275m is budgeted to take place in FY16 as proposed through the 2015-16 Operational Plan. It should be noted that $6.0m of this capital expenditure will be met through Grant funding, a large portion of the Organics Processing Facility can potentially be funded from DWMS reserves and that the remaining funding (deemed to be towards the commercially focused operations) be met through internal loans from existing reserves.
140
Risks/High Level Impact (where does it impact (project, organisation, community) Risk Minimisation Strategy Reduction or elimination to the NSW Government S88 Waste Levy.
Minimisation strategy will include the following:
• Whilst this risk cannot by and large be materially mitigated and is considered highly unlikely, ensuring ongoing operational efficiency of the proposed pieces of infrastructure, as well as ensuring economies of scale and synergy of operations are put in place will ensure the financial impact of this event is minimised where possible.
Availability of contractor workforce to undertake all three of the projects (along with the construction of the new landfill cell) at the site
• Upfront and ongoing consultation with proposed tenderers, ensuring that projects are able to be delivered in a timely fashion.
Supply of input into the resource recovery facilities
• Ensuring that existing commercial relationships are kept intact as well as putting in place longer term commercial contracts will maintain inputs into the pieces of infrastructure and that economies of scale are sufficiently achieved. It should be noted the assumed inputs are based on currently received waste streams.
Diversion rates being lower than expected either through waste streams presented with material mixes vastly different to assumed numbers
• Audits have been undertaken of typically presented waste streams and consultants engaged as to the most efficient extraction of materials.
Project size (see criteria for Project Size )
Minor Medium X Major Project is classed a major due to the estimated benefits arising from increased revenue.
Completed Project Coordination
• Has consultation already been undertaking with relevant internal stakeholders prior to initiating this brief?
• Are there opportunities to pool resources with other departments, etc?
• Are other departments happy with the overall objectives?
Consultation has already occurred with: • Directors for Corporate, Infrastructure, and Planning & Regulatory • Managers of Waste Management and Projects and Contracts
Pooling of resources?
• Needs to be a joint initiative between Waste Management, Projects and Finance to maximise success Are other departments happy with objectives?
• Other departments are happy with broad objectives • Will undertake a formal review as part of project charter sign-off
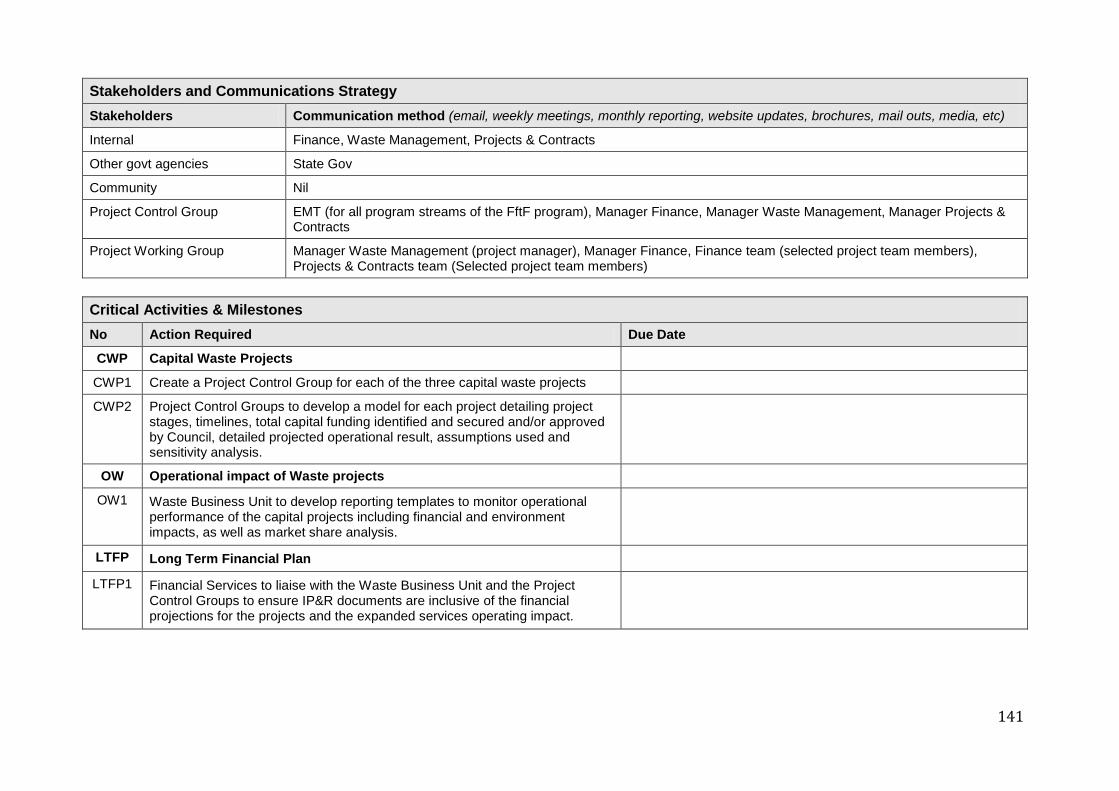
141
Stakeholders and Communications Strategy Stakeholders Communication method (email, weekly meetings, monthly reporting, website updates, brochures, mail outs, media, etc)
Internal Finance, Waste Management, Projects & Contracts
Other govt agencies State Gov
Community Nil
Project Control Group EMT (for all program streams of the FftF program), Manager Finance, Manager Waste Management, Manager Projects & Contracts
Project Working Group Manager Waste Management (project manager), Manager Finance, Finance team (selected project team members), Projects & Contracts team (Selected project team members)
Critical Activities & Milestones No Action Required Due Date
CWP Capital Waste Projects
CWP1 Create a Project Control Group for each of the three capital waste projects
CWP2 Project Control Groups to develop a model for each project detailing project stages, timelines, total capital funding identified and secured and/or approved by Council, detailed projected operational result, assumptions used and sensitivity analysis.
OW Operational impact of Waste projects
OW1 Waste Business Unit to develop reporting templates to monitor operational performance of the capital projects including financial and environment impacts, as well as market share analysis.
LTFP Long Term Financial Plan
LTFP1 Financial Services to liaise with the Waste Business Unit and the Project Control Groups to ensure IP&R documents are inclusive of the financial projections for the projects and the expanded services operating impact.

142
Governance Client Director Corporate
Asset Manager/s n/a
Sponsor General Manager
Project Control Group (Major Projects only)
EMT (for all program streams of the FftF program), Manager Finance, Manager Infrastructure Planning, Manager of Projects
Service Provider Business Unit: Finance Business Unit Manager: Andrew Glauser Team Coordinator: n/a Project Manager/Officer: Martin Swan
Project Charter Prepared by Andrew Glauser (Manager Finance) Date: 11th June 2015
Approved By Sponsor:_______________________________________ Date: ________ Client::________________________________________ Date: ________ Project Manager:________________________________ Date: ________

143
H4 Operational Savings - Expense Management Program
Project Name Operational Savings - Expense Management Program Project File Number
Project Type • Choose which funding program
Built infrastructure X Strategic Corporate IT Major Asset Preservation Program (MAPPs) Governance
Executive Summary • Where is the project located? • What is the project? • Project background? • Who is the end user?
Location: Undertaken by Finance Project Description: Undertake an expense management program which focuses on instituting similar expense management initiatives and controls as are applied in other industry sectors. Project Background: The NSW Office of Local Government (OLG) has implemented a program to ensure all NSW councils are “Fit for the Future (FftF)”. A Fit for the Future council is one that is:
• Sustainable; • Efficient; • Effectively manages infrastructure and delivers services for communities; • Has the scale and capacity to engage effectively across community, industry and government.
NCC is submitting a Template 2 Improvement Proposal and has developed an FftF program building on the "Road to Recovery" improvement program already underway. Council has identified areas where further improvements in its operating position can be achieved, through revenue enhancement and expense management Opportunities have also been identified to improve the efficiency of undertaking capital works (particularly asset renewal projects) which will result in a faster and more cost effective reduction of the infrastructure backlog.

144
The program has been broken into the following streams:
1. Revenue Raising Measures (operating) 2. Operational Saving Measures 3. Revenue Raising Measures (capital) 4. Capital (expenditure) Savings Measures 5. Infrastructure Rehabilitation
There are a number of programs under each stream and each program will have one or more projects (or improvement initiatives). The goal is for project costs to be largely funded by the additional revenue and/or cost savings created by the projects and the projects have been sequenced to (1) avoid creating a material adverse financial impact in any year of the program and (2) Scheduled to ensure sufficient management attention and resources can be applied across the program. The annual benefits of the program are largely achieved by 2017/18 to ensure Council has a stronger financial position in the short term which can be built upon in the long term. The program is part of the Operational Savings Measures Stream. This stream includes the following projects (for context):
• Increased online capabilities for ratepayers, residents and visitor service provision. • Revision of organisational expense management. • Establish more flexible, responsive and performance based work practices. • Increase Business Units performance and accountability. • Identify and implement shared services and third party opportunities as a means to improve Council services
within the existing EFT. • Completion of the remaining elements of the current organisational re-structure.
This program will focus on six initiatives:
• Review and optimisation of telecommunication usage, • Review and optimisation of Council's property requirements, • Review of Council's vehicle fleet usage requirements and lease back arrangements, • Review of Council's car parking arrangements and requirements, • Reduction of workers compensation claims through improved system management, • Revision of processes for allocating Council funding to third parties.

145
Project Purpose/Justification • Why are we doing this? • Alignment with Council’s strategic
objectives? (Delete those not applicable)
• Other strategic Documents eg Business Case, Master Plan, Technical Manuals, DCP etc
The 2030 objectives applicable to this project are: • Smart & Innovative City • Open & Collaborative Leadership
The 2030 Community strategic Plan highlights the need for Council to provide services to the community in a sustainable manner. Council has been undertaking a “road to recovery” program which has achieved significant results and in conjunction with an SRV has placed Council on a sustainable path. The OLG Fit for the Future initiatives have been introduced to determine Local Government's ability to be strong and sustainable into the future. The following financial targets have been outlined to be met by Council's to demonstrate they are "Fit for the Future": 1. Operating Performance Ratio being greater than or equal to break even over three years; 2. Own Source Revenue Ratio being greater than 60% over three years; 3. Building and Infrastructure Asset Renewal Ratio being greater than one over three years; 4. Infrastructure backlog ratio being less than 2%; 5. Asset Maintenance Ratio being greater than one; 6. Debt Service Ratio being greater than zero and less than 0.2. 7. Real Operating Expenditure per capita over time has the scale and capacity consistent with the recommendations of the Independent Panel. Council's LTFP and Delivery Programs have been revised as part of the 2015/16 budget process to include all of the FftF initiatives identified (including this program of initiatives) to endeavour to achieve all 7 of the targets outlined by the OLG.

146
It is a prudent managerial strategy to regularly revise operational expenditure and identify improvements. This project proposes a review and improvement of key operational expenditure areas where efficiencies can be identified, implemented and measured. This project will assist Council improve our long term financial sustainability and is demonstrated by an improvement in Council's Operating Performance Ratio and Council's Real Operating Expenditure per capita.
Project Objectives • What are we doing? • Specific objectives for the scope
of work covered by this charter? The program will have the following objectives:
• Produce a reduction in the cost of Council's telecommunication expenditure through a review and analysis of the usage and associated plans regarding phone, mobile and data usage. Optimisation will be achieved through analysing the findings of the review and investigating options available for these services.
• Optimise the usage of Council's property portfolio by performing a review of Council's spatial requirements, current occupancy of Council property by Council and third parties via leasing arrangements and leases held by Council with third partied. Reallocation of property and leases to best suit Council's requirements to minimise costs to Council of using external property while ensuring Council's property portfolio is utilised to Council's greatest financial advantage.
• Conduct a review of Council's fleet usage and provide a recommendation of the necessity of the quantity of vehicles and strategies for best utilising Council's fleet.
• Achieve a reduction in Council's FBT liability by improving the administration and management of staff car parking arrangements.
• Research and implement an updated Workers Compensation system to enable a stronger focus on reducing the number of claims.
• Ensure Council has transparent and robust processes in place for allocating Council funding to third parties in the form of Council grants and in kind services.

147
Constraints
Possible constraints
• Telecommunication services are primarily long term contracts based and therefore may prove difficult to break or alter if mid contract.
• Reluctance from Business Units to engage in a review and potential transfer to a new telecommunication company due to the relatively short turn-around time from the last review of this service.
• Legislative restrictions on usage of Council property. • Difficulty may arise if attempting to reduce Council's fleet due to a majority of vehicles being attached to
positions and salary packaging. • Difficulty may arise if attempting to reduce car parking provided due to parking spaces being affiliated with
Council fleet vehicles. • Updating the Workers Compensation system may have limited impact on the number of claims lodged due to a
multitude of factors which can affect this aspect of Council. • Council are contractually obligated to some third party grants and in kind services which therefore allows limited
flexibility in the allocation process. • Disharmony may be created with Community groups wishing to access Council funding through grants and in
kind services if the application process is more challenging. • Difficulty in tracking and documenting whether project objectives are being met. • Workforce availability to achieve the objectives listed.
Assumptions Assumptions:
• Council is supportive of the project objectives. • Council has the resources and skill set available to achieve the objectives of this project or has the capacity to
source them within the required timeframe. • There is a clear understanding and agreed cooperation between the relevant Business Units involved in the
project. • There will be prudent diligence applied researched and proposed strategies to ensure they are within Council's
legislative jurisdiction.

148
Scope / Deliverables • What are the deliverables for the
aspect of the project covered by this brief?
Scope • To improve Council's financial sustainability by engaging in an expense management program which results in
the reduction of operating expenditure where it is efficient to do so. Included in the scope of the project is a revision of key cost drives to ensure maximum cost efficiency for Council.
Deliverables:
• Produce a report on Council's current phone, mobile and data usage, providing analysis on the findings, alternative options for future telecommunications services inclusive of costing and recommended option.
• Produce a report analysing Council's spatial requirements and current property utilisation. Report to include recommendations to EMT to optimise Council's property portfolio and reduce operational expenditure on property requirements.
• Conduct a review of Council's fleet usage and car parking arrangements inclusive of recommendations for efficiencies including a reduction in Council's FBT liability.
• Analysis of Workers Compensation system and alternative systems available. Recommendation to EMT of most efficient system.
• Review Council's procedure for allocation of funding and in kind services to third parties, including recommendations for strengthening the policies.
Budget
Total project budget is $370k. Budgeted through the 2015/2016 Operational Plan.
Risks/High Level Impact (where does it impact (project, organisation, community) Risk Minimisation Strategy Council may not have the workforce capacity to meet the objectives
Minimisation strategy will include the following:
• Ongoing consultation and communication with relevant business units to ensure they can schedule and prioritise workload demands.
• Ensure Council has access to additional workforce resources if required
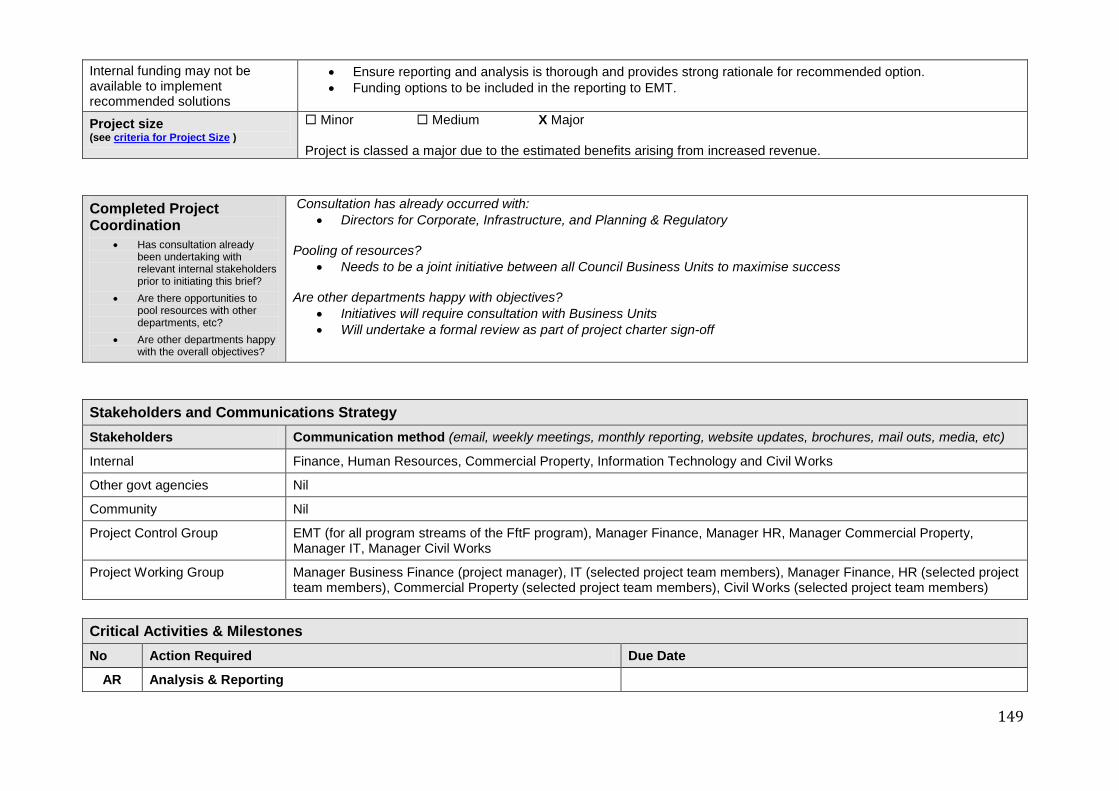
149
Internal funding may not be available to implement recommended solutions
• Ensure reporting and analysis is thorough and provides strong rationale for recommended option. • Funding options to be included in the reporting to EMT.
Project size (see criteria for Project Size )
Minor Medium X Major Project is classed a major due to the estimated benefits arising from increased revenue.
Completed Project Coordination
• Has consultation already been undertaking with relevant internal stakeholders prior to initiating this brief?
• Are there opportunities to pool resources with other departments, etc?
• Are other departments happy with the overall objectives?
Consultation has already occurred with: • Directors for Corporate, Infrastructure, and Planning & Regulatory
Pooling of resources?
• Needs to be a joint initiative between all Council Business Units to maximise success Are other departments happy with objectives?
• Initiatives will require consultation with Business Units • Will undertake a formal review as part of project charter sign-off
Stakeholders and Communications Strategy Stakeholders Communication method (email, weekly meetings, monthly reporting, website updates, brochures, mail outs, media, etc)
Internal Finance, Human Resources, Commercial Property, Information Technology and Civil Works
Other govt agencies Nil
Community Nil
Project Control Group EMT (for all program streams of the FftF program), Manager Finance, Manager HR, Manager Commercial Property, Manager IT, Manager Civil Works
Project Working Group Manager Business Finance (project manager), IT (selected project team members), Manager Finance, HR (selected project team members), Commercial Property (selected project team members), Civil Works (selected project team members)
Critical Activities & Milestones No Action Required Due Date
AR Analysis & Reporting
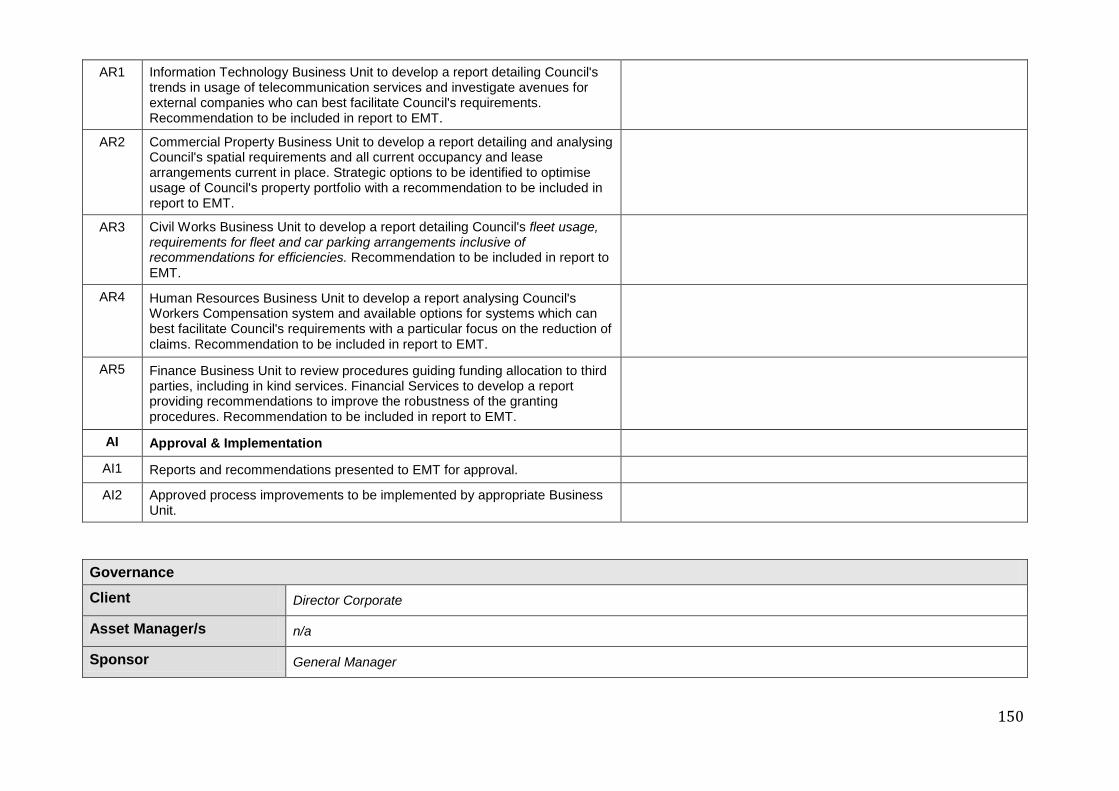
150
AR1 Information Technology Business Unit to develop a report detailing Council's trends in usage of telecommunication services and investigate avenues for external companies who can best facilitate Council's requirements. Recommendation to be included in report to EMT.
AR2 Commercial Property Business Unit to develop a report detailing and analysing Council's spatial requirements and all current occupancy and lease arrangements current in place. Strategic options to be identified to optimise usage of Council's property portfolio with a recommendation to be included in report to EMT.
AR3 Civil Works Business Unit to develop a report detailing Council's fleet usage, requirements for fleet and car parking arrangements inclusive of recommendations for efficiencies. Recommendation to be included in report to EMT.
AR4 Human Resources Business Unit to develop a report analysing Council's Workers Compensation system and available options for systems which can best facilitate Council's requirements with a particular focus on the reduction of claims. Recommendation to be included in report to EMT.
AR5 Finance Business Unit to review procedures guiding funding allocation to third parties, including in kind services. Financial Services to develop a report providing recommendations to improve the robustness of the granting procedures. Recommendation to be included in report to EMT.
AI Approval & Implementation
AI1 Reports and recommendations presented to EMT for approval.
AI2 Approved process improvements to be implemented by appropriate Business Unit.
Governance Client Director Corporate
Asset Manager/s n/a
Sponsor General Manager

151
Project Control Group (Major Projects only)
EMT (for all program streams of the FftF program), Manager Finance, Manager HR, Manager Commercial Property, Manager IT, Manager Civil Works
Service Provider Business Unit: Finance Business Unit Manager: Andrew Glauser Team Coordinator: n/a Project Manager/Officer: Martin Swan
Project Charter Prepared by Andrew Glauser (Manager Finance) Date: 12th June 2015
Approved By Sponsor:_______________________________________ Date: ________ Client::________________________________________ Date: ________ Project Manager:________________________________ Date: ________

152
H5 Operational Savings - Complete Organisational Restructure
Project Name Operational Savings - Complete Organisational Restructure
Project File Number
Project Type • Choose which funding program
Built infrastructure X Strategic Corporate IT Major Asset Preservation Program (MAPPs) Governance
Executive Summary • Where is the project located? • What is the project? • Project background? • Who is the end user?
Location: Undertaken by Finance Project Description: Reduce Council's operating expenditure by completing the outstanding elements of the current Organisational Restructure. Project Background: The NSW Office of Local Government (OLG) has implemented a program to ensure all NSW councils are “Fit for the Future (FftF)”. A Fit for the Future council is one that is:
• Sustainable; • Efficient; • Effectively manages infrastructure and delivers services for communities; • Has the scale and capacity to engage effectively across community, industry and government.
NCC is submitting a Template 2 Improvement Proposal and has developed an FftF program building on the "Road to Recovery" improvement program already underway. Council has identified areas where further improvements in its operating position can be achieved, through revenue enhancement and expense management Opportunities have also been identified to improve the efficiency of undertaking capital works (particularly asset renewal projects) which will result in a faster and more cost effective reduction of the infrastructure backlog.
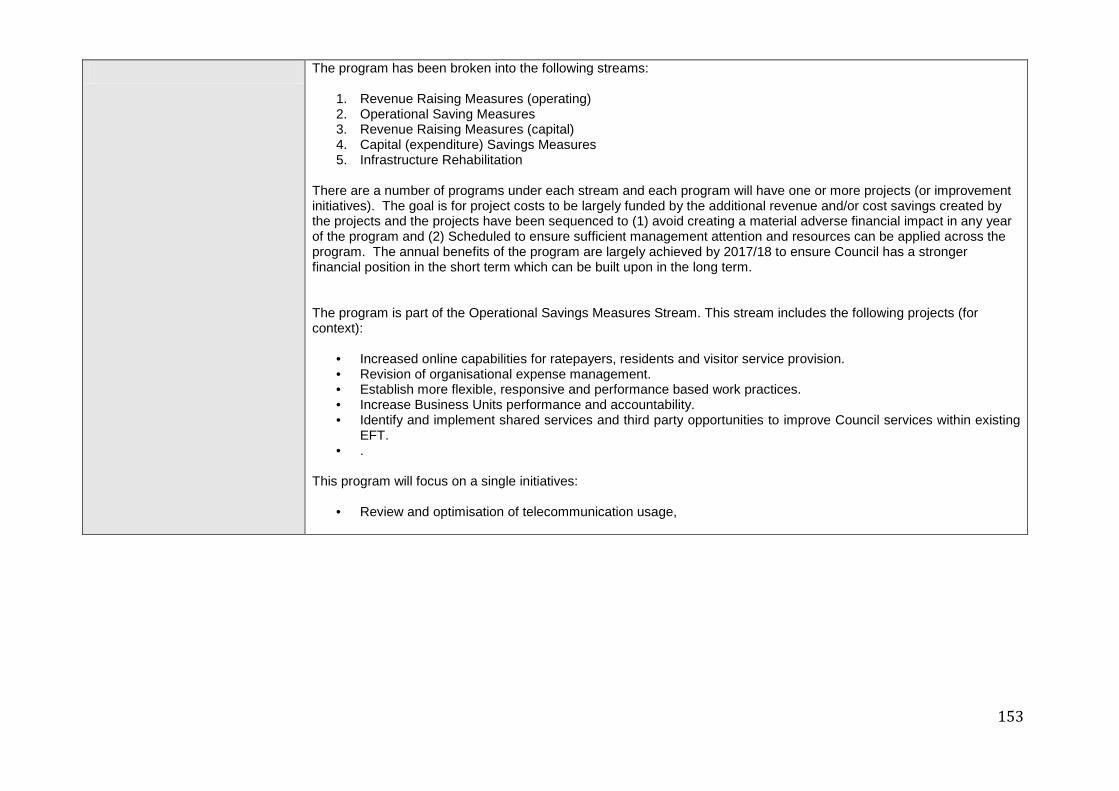
153
The program has been broken into the following streams:
1. Revenue Raising Measures (operating) 2. Operational Saving Measures 3. Revenue Raising Measures (capital) 4. Capital (expenditure) Savings Measures 5. Infrastructure Rehabilitation
There are a number of programs under each stream and each program will have one or more projects (or improvement initiatives). The goal is for project costs to be largely funded by the additional revenue and/or cost savings created by the projects and the projects have been sequenced to (1) avoid creating a material adverse financial impact in any year of the program and (2) Scheduled to ensure sufficient management attention and resources can be applied across the program. The annual benefits of the program are largely achieved by 2017/18 to ensure Council has a stronger financial position in the short term which can be built upon in the long term. The program is part of the Operational Savings Measures Stream. This stream includes the following projects (for context):
• Increased online capabilities for ratepayers, residents and visitor service provision. • Revision of organisational expense management. • Establish more flexible, responsive and performance based work practices. • Increase Business Units performance and accountability. • Identify and implement shared services and third party opportunities to improve Council services within existing
EFT. • .
This program will focus on a single initiatives:
• Review and optimisation of telecommunication usage,

154
Project Purpose/Justification • Why are we doing this? • Alignment with Council’s strategic
objectives? (Delete those not applicable)
• Other strategic Documents eg Business Case, Master Plan, Technical Manuals, DCP etc
The 2030 objectives applicable to this project are: • Smart & Innovative City • Open & Collaborative Leadership
The 2030 Community strategic Plan highlights the need for Council to provide services to the community in a sustainable manner. Council has been undertaking a “road to recovery” program which has achieved significant results and in conjunction with an SRV has placed Council on a sustainable path. The OLG Fit for the Future initiatives have been introduced to determine Local Government's ability to be strong and sustainable into the future. The following financial targets have been outlined to be met by Council's to demonstrate they are "Fit for the Future": 1. Operating Performance Ratio being greater than or equal to break even over three years; 2. Own Source Revenue Ratio being greater than 60% over three years; 3. Building and Infrastructure Asset Renewal Ratio being greater than one over three years; 4. Infrastructure backlog ratio being less than 2%; 5. Asset Maintenance Ratio being greater than one; 6. Debt Service Ratio being greater than zero and less than 0.2. 7. Real Operating Expenditure per capita over time has the scale and capacity consistent with the recommendations of the Independent Panel. Council's LTFP and Delivery Programs have been revised as part of the 2015/16 budget process to include all of the FftF initiatives identified (including this program of initiatives) to endeavour to achieve all 7 of the targets outlined by the OLG. It is a prudent managerial strategy to regularly revise operational expenditure and identify improvements. This project proposes a review and improvement of key operational expenditure areas where efficiencies can be identified, implemented and measured. This project will assist Council improve our long term financial sustainability and is demonstrated by an improvement in Council's Operating Performance Ratio and Council's Real Operating Expenditure per capita.
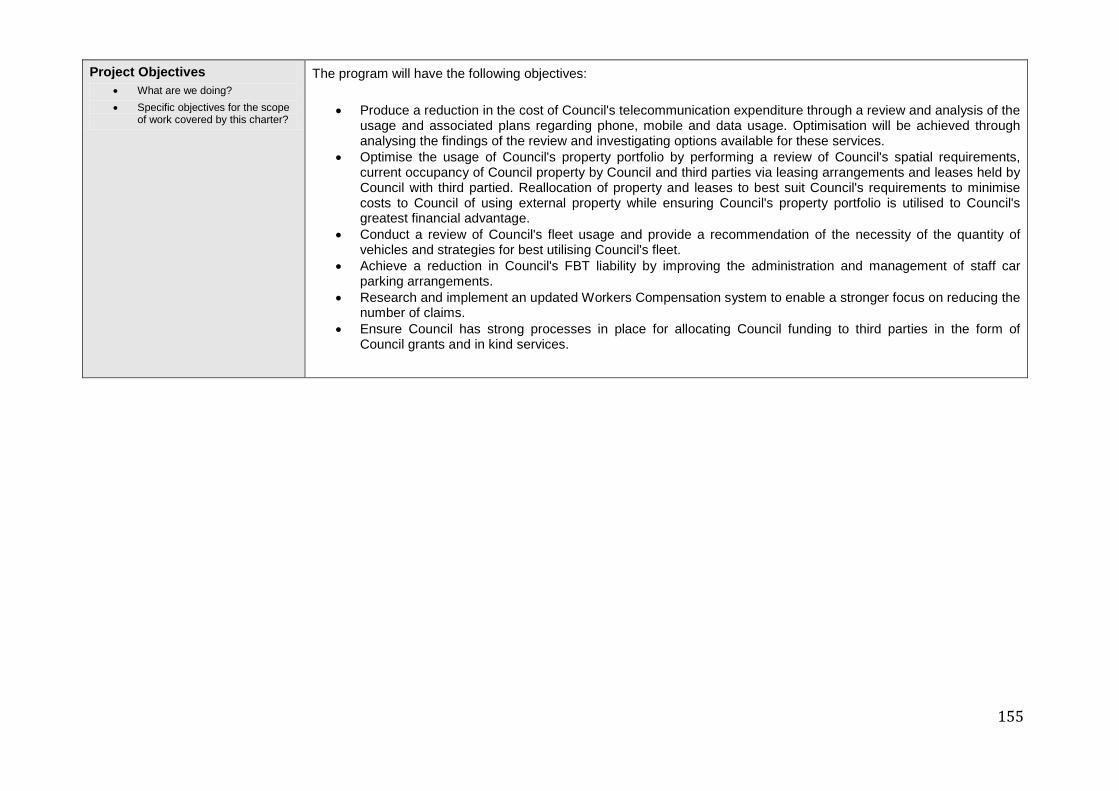
155
Project Objectives • What are we doing? • Specific objectives for the scope
of work covered by this charter?
The program will have the following objectives:
• Produce a reduction in the cost of Council's telecommunication expenditure through a review and analysis of the usage and associated plans regarding phone, mobile and data usage. Optimisation will be achieved through analysing the findings of the review and investigating options available for these services.
• Optimise the usage of Council's property portfolio by performing a review of Council's spatial requirements, current occupancy of Council property by Council and third parties via leasing arrangements and leases held by Council with third partied. Reallocation of property and leases to best suit Council's requirements to minimise costs to Council of using external property while ensuring Council's property portfolio is utilised to Council's greatest financial advantage.
• Conduct a review of Council's fleet usage and provide a recommendation of the necessity of the quantity of vehicles and strategies for best utilising Council's fleet.
• Achieve a reduction in Council's FBT liability by improving the administration and management of staff car parking arrangements.
• Research and implement an updated Workers Compensation system to enable a stronger focus on reducing the number of claims.
• Ensure Council has strong processes in place for allocating Council funding to third parties in the form of Council grants and in kind services.

156
Constraints
Possible constraints
• Telecommunication services are primarily long term contracts based and therefore may prove difficult to break or alter if mid contract.
• Reluctance from Business Units to engage in a review and potential transfer to a new telecommunication company due to the relatively short turn-around time from the last review of this service.
• Legislative restrictions on usage of Council property. • Difficulty may arise if attempting to reduce Council's fleet due to a majority of vehicles being attached to
positions and salary packaging. • Difficulty may arise if attempting to reduce car parking provided due to parking spaces being affiliated with
Council fleet vehicles. • Updating the Workers Compensation system may have limited impact on the number of claims lodged due to a
multitude of factors which can affect this aspect of Council. • Council are contractually obligated to some third party grants and in kind services which therefore allows limited
flexibility in the allocation process. • Disharmony may be created with Community groups wishing to access Council funding through grants and in
kind services if the application process is more challenging. • Difficulty in tracking and documenting whether project objectives are being met. • Workforce availability to achieve the objectives listed.
Assumptions Assumptions:
• Council is supportive of the project objectives. • Council has the resources and skill set available to achieve the objectives of this project or has the capacity to
source them within the required timeframe. • There is a clear understanding and agreed cooperation between the relevant Business Units involved in the
project. • There will be prudent diligence applied researched and proposed strategies to ensure they are within Council's
legislative jurisdiction.

157
Scope / Deliverables • What are the deliverables for the
aspect of the project covered by this brief?
Scope • To improve Council's financial sustainability by engaging in an expense management program which results in
the reduction of operating expenditure where it is efficient to do so. Included in the scope of the project is a revision of key cost drives to ensure maximum cost efficiency for Council.
Deliverables:
• Produce a report on Council's current phone, mobile and data usage, providing analysis on the findings, alternative options for future telecommunications services inclusive of costing and recommended option.
• Produce a report analysing Council's spatial requirements and current property utilisation. Report to include recommendations to EMT to optimise Council's property portfolio and reduce operational expenditure on property requirements.
• Conduct a review of Council's fleet usage and car parking arrangements inclusive of recommendations for efficiencies including a reduction in Council's FBT liability.
• Analysis of Workers Compensation system and alternative systems available. Recommendation to EMT of most efficient system.
• Review Council's procedure for allocation of funding and in kind services to third parties, including recommendations for strengthening the policies.
Budget
Total project budget is $370k. Budgeted through the 2015/2016 Operational Plan.
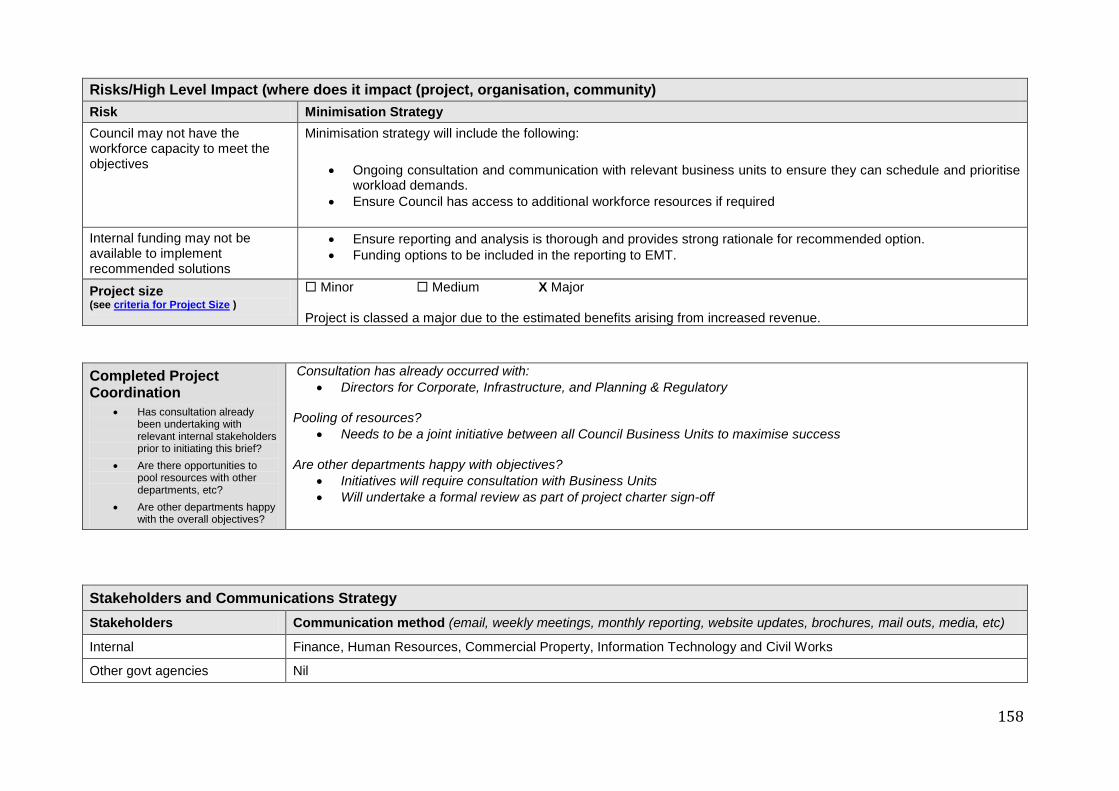
158
Risks/High Level Impact (where does it impact (project, organisation, community) Risk Minimisation Strategy Council may not have the workforce capacity to meet the objectives
Minimisation strategy will include the following:
• Ongoing consultation and communication with relevant business units to ensure they can schedule and prioritise workload demands.
• Ensure Council has access to additional workforce resources if required
Internal funding may not be available to implement recommended solutions
• Ensure reporting and analysis is thorough and provides strong rationale for recommended option. • Funding options to be included in the reporting to EMT.
Project size (see criteria for Project Size )
Minor Medium X Major Project is classed a major due to the estimated benefits arising from increased revenue.
Completed Project Coordination
• Has consultation already been undertaking with relevant internal stakeholders prior to initiating this brief?
• Are there opportunities to pool resources with other departments, etc?
• Are other departments happy with the overall objectives?
Consultation has already occurred with: • Directors for Corporate, Infrastructure, and Planning & Regulatory
Pooling of resources?
• Needs to be a joint initiative between all Council Business Units to maximise success Are other departments happy with objectives?
• Initiatives will require consultation with Business Units • Will undertake a formal review as part of project charter sign-off
Stakeholders and Communications Strategy Stakeholders Communication method (email, weekly meetings, monthly reporting, website updates, brochures, mail outs, media, etc)
Internal Finance, Human Resources, Commercial Property, Information Technology and Civil Works
Other govt agencies Nil
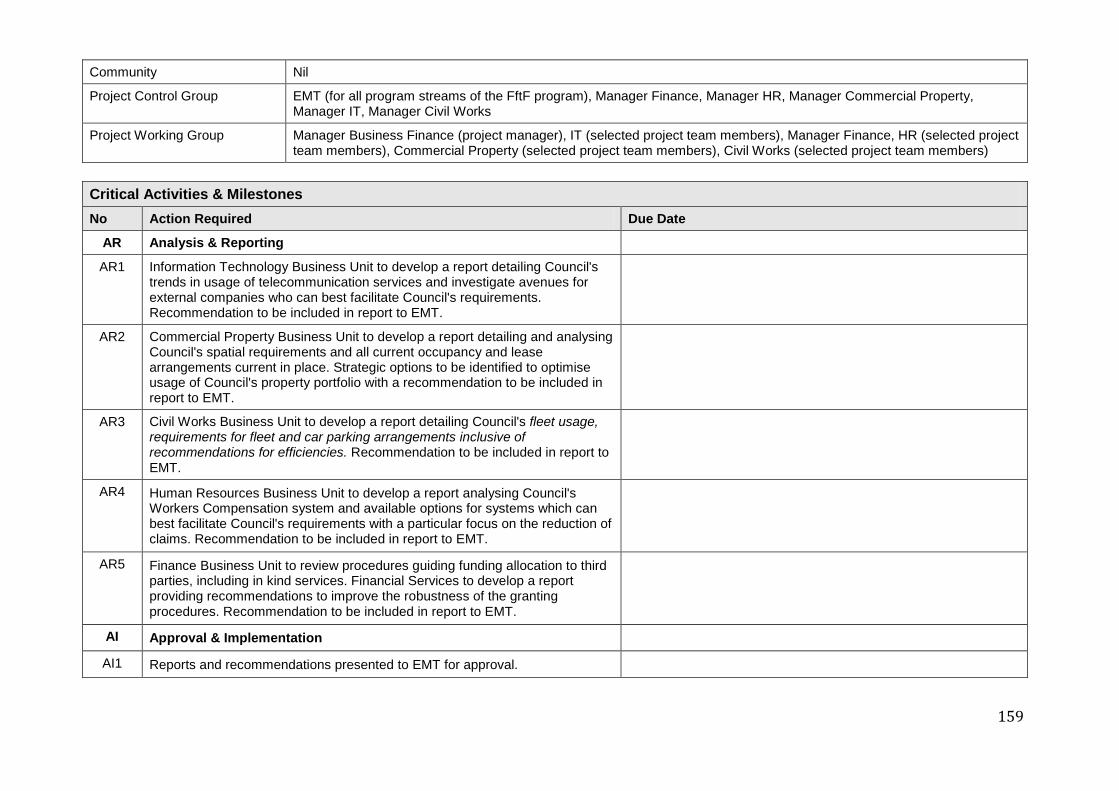
159
Community Nil
Project Control Group EMT (for all program streams of the FftF program), Manager Finance, Manager HR, Manager Commercial Property, Manager IT, Manager Civil Works
Project Working Group Manager Business Finance (project manager), IT (selected project team members), Manager Finance, HR (selected project team members), Commercial Property (selected project team members), Civil Works (selected project team members)
Critical Activities & Milestones No Action Required Due Date
AR Analysis & Reporting
AR1 Information Technology Business Unit to develop a report detailing Council's trends in usage of telecommunication services and investigate avenues for external companies who can best facilitate Council's requirements. Recommendation to be included in report to EMT.
AR2 Commercial Property Business Unit to develop a report detailing and analysing Council's spatial requirements and all current occupancy and lease arrangements current in place. Strategic options to be identified to optimise usage of Council's property portfolio with a recommendation to be included in report to EMT.
AR3 Civil Works Business Unit to develop a report detailing Council's fleet usage, requirements for fleet and car parking arrangements inclusive of recommendations for efficiencies. Recommendation to be included in report to EMT.
AR4 Human Resources Business Unit to develop a report analysing Council's Workers Compensation system and available options for systems which can best facilitate Council's requirements with a particular focus on the reduction of claims. Recommendation to be included in report to EMT.
AR5 Finance Business Unit to review procedures guiding funding allocation to third parties, including in kind services. Financial Services to develop a report providing recommendations to improve the robustness of the granting procedures. Recommendation to be included in report to EMT.
AI Approval & Implementation
AI1 Reports and recommendations presented to EMT for approval.

160
AI2 Approved process improvements to be implemented by appropriate Business Unit.
Governance Client Director Corporate
Asset Manager/s n/a
Sponsor General Manager
Project Control Group (Major Projects only)
EMT (for all program streams of the FftF program), Manager Finance, Manager HR, Manager Commercial Property, Manager IT, Manager Civil Works
Service Provider Business Unit: Finance Business Unit Manager: Andrew Glauser Team Coordinator: n/a Project Manager/Officer: Martin Swan
Project Charter Prepared by Andrew Glauser (Manager Finance) Date: 12th June 2015
Approved By Sponsor:_______________________________________ Date: ________ Client::________________________________________ Date: ________ Project Manager:________________________________ Date: ________

161
H6 Capital Expenditure Savings - Improve Procurement Controls
Project Name Capital Expenditure Savings - Improve Procurement Controls Project File Number
Project Type • Choose which funding program
Built infrastructure X Strategic Corporate IT Major Asset Preservation Program (MAPPs) Governance
Executive Summary • Where is the project located? • What is the project? • Project background? • Who is the end user?
Location: Undertaken by Finance Project Description: Improve the robustness of our procurement processes. Project Background: The NSW Office of Local Government (OLG) has implemented a program to ensure all NSW councils are “Fit for the Future (FftF)”. A Fit for the Future council is one that is:
• Sustainable; • Efficient; • Effectively manages infrastructure and delivers services for communities; • Has the scale and capacity to engage effectively across community, industry and government.
NCC is submitting a Template 2 Improvement Proposal and has developed an FftF program building on the "Road to Recovery" improvement program already underway. Council has identified areas where further improvements in its operating position can be achieved, through revenue enhancement and expense management Opportunities have also been identified to improve the efficiency of undertaking capital works (particularly asset renewal projects) which will result in a faster and more cost effective reduction of the infrastructure backlog.
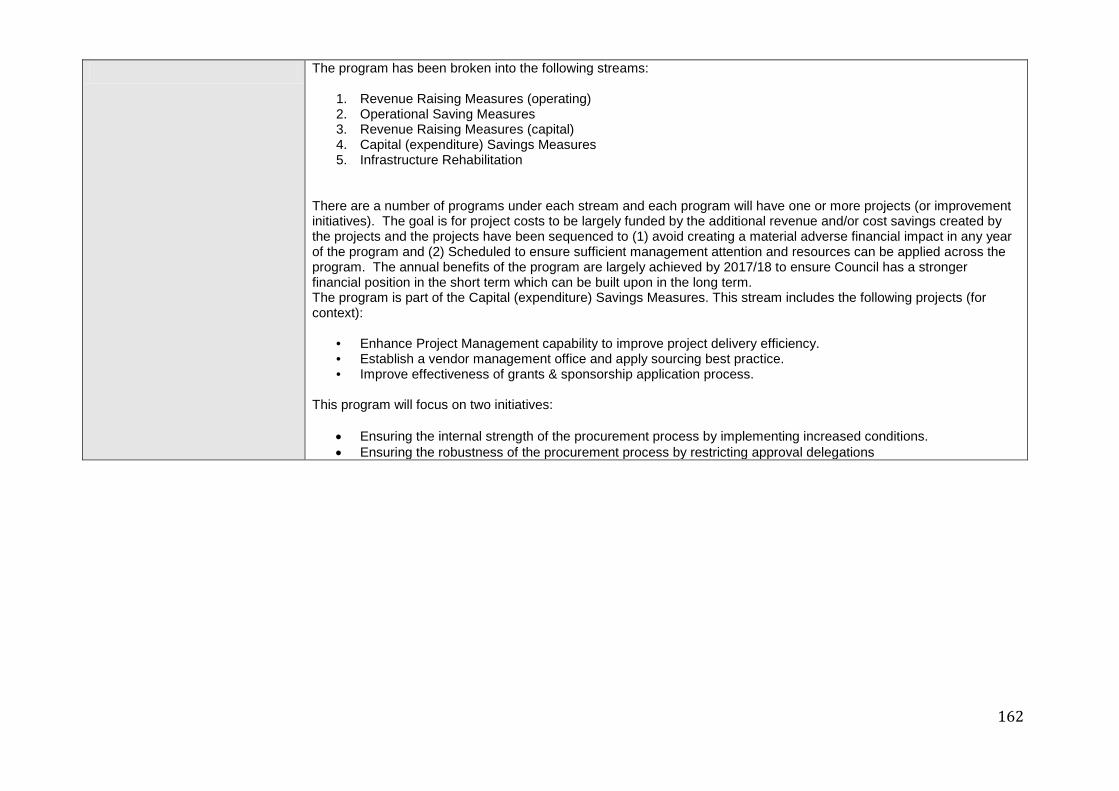
162
The program has been broken into the following streams:
1. Revenue Raising Measures (operating) 2. Operational Saving Measures 3. Revenue Raising Measures (capital) 4. Capital (expenditure) Savings Measures 5. Infrastructure Rehabilitation
There are a number of programs under each stream and each program will have one or more projects (or improvement initiatives). The goal is for project costs to be largely funded by the additional revenue and/or cost savings created by the projects and the projects have been sequenced to (1) avoid creating a material adverse financial impact in any year of the program and (2) Scheduled to ensure sufficient management attention and resources can be applied across the program. The annual benefits of the program are largely achieved by 2017/18 to ensure Council has a stronger financial position in the short term which can be built upon in the long term. The program is part of the Capital (expenditure) Savings Measures. This stream includes the following projects (for context):
• Enhance Project Management capability to improve project delivery efficiency. • Establish a vendor management office and apply sourcing best practice. • Improve effectiveness of grants & sponsorship application process.
This program will focus on two initiatives:
• Ensuring the internal strength of the procurement process by implementing increased conditions. • Ensuring the robustness of the procurement process by restricting approval delegations

163
Project Purpose/Justification • Why are we doing this? • Alignment with Council’s strategic
objectives? (Delete those not applicable)
• Other strategic Documents eg Business Case, Master Plan, Technical Manuals, DCP etc
The 2030 objectives applicable to this project are: • Open & Collaborative Leadership
The 2030 Community strategic Plan highlights the need for Council to provide services to the community in a sustainable manner. Council has been undertaking a “road to recovery” program which has achieved significant results and in conjunction with an SRV has placed Council on a sustainable path. The OLG Fit for the Future initiatives have been introduced to determine Local Government's ability to be strong and sustainable into the future. The following financial targets have been outlined to be met by Council's to demonstrate they are "Fit for the Future": 1. Operating Performance Ratio being greater than or equal to break even over three years; 2. Own Source Revenue Ratio being greater than 60% over three years; 3. Building and Infrastructure Asset Renewal Ratio being greater than one over three years; 4. Infrastructure backlog ratio being less than 2%; 5. Asset Maintenance Ratio being greater than one; 6. Debt Service Ratio being greater than zero and less than 0.2. 7. Real Operating Expenditure per capita over time has the scale and capacity consistent with the recommendations of the Independent Panel. Council's LTFP and Delivery Programs have been revised as part of the 2015/16 budget process to include all of the FftF initiatives identified (including this program of initiatives) to endeavour to achieve all 7 of the targets outlined by the OLG. This project will assist Council in achieving some of the FftF targets. Improving the strength of the procurement process outlined by this project it has the ability to positively impact Council's Operating Performance Ratio should Council. An indirect improvement will result in many areas including the possibility of a favourable effect on Council's Building and Infrastructure Asset Renewal Ratio, Infrastructure Backlog Ratio and Asset Maintenance Ratio due to a more efficient, strategic use of total funding and corporate focus.

164
Project Objectives • What are we doing? • Specific objectives for the scope
of work covered by this charter?
The program will have the following objectives:
• Confirm the integrity of Council's procurement procedure by ensuring the highest level of controls are applied resulting in the most cost effective process for Council.
• Ensure expenditure is relevant and essential by ensuring stringent boundaries are applied to the procurement process.
Constraints
Possible constraints
• Some specialist products or services may not be available through pre-approved vendors. • Information availability on relevant suppliers to determine if they are suitable for approved vendor status. • Timeframe necessary to review, update and seek approval for changes in approval delegation. • System capabilities to allow for changes in delegation limitations. • Budgetary constraints to facilitate the project and implement recommendations.
Assumptions Assumptions:
• Council is supportive of the project objectives. • Council has the resources and skill set available to achieve the objectives of this project or has the capacity to
source them within the required timeframe. • There is a clear understanding and agreed cooperation between the relevant Business Units involved in the
project. • There will be prudent diligence applied researched and proposed strategies to ensure they are within Council's
legislative jurisdiction.
Scope / Deliverables • What are the deliverables for the
aspect of the project covered by this brief?
Scope • Increase Council's ability to reduce capital expenditure by enhancing and improving our procurement procedure.
Included in the scope of the project is continual improvement of our procurement policy and a stronger focus on ensuring the integrity of the procedures surround procurement within Council.

165
Deliverables:
• Develop a process for approving preferred vendors. • Improve the procurement process by redirecting purchasing to approved vendors with the view to save $300k
per annum on products and services. • Review delegation limitations and reduce approval amounts where appropriate. • Implement a process of reviewing and challenging discretionary expenditure.
Budget
At present the project does not have a determined amount and is unfunded. Predominantly the project objective could be achieved through the ordinary course of business.
Risks/High Level Impact (where does it impact (project, organisation, community) Risk Minimisation Strategy Vendors may not be willing to provide a substantial discount in return for approved vendor status
Minimisation strategy will include the following:
• Clear communication with preferred vendors to explicitly define the benefits of becoming a preferred supplier.
Project size (see criteria for Project Size )
Minor Medium X Major Project is classed a major due to the estimated benefits arising from increased revenue.
Completed Project Coordination
• Has consultation already been undertaking with relevant internal stakeholders prior to initiating this brief?
• Are there opportunities to pool resources with other departments, etc?
• Are other departments happy with the overall objectives?
Consultation has already occurred with: • Directors for Corporate, Infrastructure, and Planning & Regulatory • Managers of Information Technology and Legal & Council Services
Pooling of resources?
• Needs to be a joint initiative between Information Technology, Legal & Council Services and Finance to maximise success
Are other departments happy with objectives?
• Other departments are happy with broad objectives • Will undertake a formal review as part of project charter sign-off

166
Stakeholders and Communications Strategy Stakeholders Communication method (email, weekly meetings, monthly reporting, website updates, brochures, mail outs, media, etc)
Internal Finance, Information Technology, Legal & Council Services
Other govt agencies Nil
Community Nil
Project Control Group EMT (for all program streams of the FftF program), Manager Finance, Manager Information Technology, Manager Legal & Council Services
Project Working Group Manager Business Finance (project manager), Manager Finance, Management Accounting team, Information Technology (selected project team members), Legal & Council Services (selected project team members)
Critical Activities & Milestones No Action Required Due Date
AV Approved Vendor
AV1 Financial Services to develop a procedure for identifying and approving vendors as preferred suppliers including cost and discount negotiation perimeters.
AV2 Review the procurement procedure and recommend the most efficient method of amending the procedure to utilise approved vendors.
AV3 Present the findings to EMT for approval.
AV4 Implement recommendations if approved by EMT.
DL Delegations Limits
DL1 Legal & Council Services and Financial Services to collaboratively review the financial delegations and restricted delegation amounts where agreed appropriate.
DL2 Update delegation register and finance system to reflect the changes.
ERP Expenditure Review Process
ERP1 Financial Services to develop and implement a process to review discretionary expenditure and query expenditure with purchaser

167
Governance Client Director Corporate
Asset Manager/s n/a
Sponsor General Manager
Project Control Group (Major Projects only)
EMT (for all program streams of the FftF program), Manager Finance, Manager Infrastructure Planning, Manager of Projects
Service Provider Business Unit: Finance Business Unit Manager: Andrew Glauser Team Coordinator: n/a Project Manager/Officer: Martin Swan
Project Charter Prepared by Andrew Glauser (Manager Finance) Date: 12th June 2015
Approved By Sponsor:_______________________________________ Date: ________ Client::________________________________________ Date: ________ Project Manager:________________________________ Date: ________
168
H7 Infrastructure Rehabilitation – Optimise asset renewal & rehabilitation processes
Project Name Infrastructure Rehabilitation – Optimise asset renewal & rehabilitation processes Project File Number
Project Type • Choose which funding program
Built infrastructure X Strategic Corporate IT Major Asset Preservation Program (MAPPs) Governance
Executive Summary • Where is the project located? • What is the project? • Project background? • Who is the end user?
Location: Undertaken by Finance and Commercial Property Business Units Project Description: To review and improve the processes applicable to renewal and rehabilitation of Council's assets to achieve optimal performance and efficiency. Project Background: The NSW Office of Local Government (OLG) has implemented a program to ensure all NSW councils are “Fit for the Future (FftF)”. A Fit for the Future council is one that is:
• Sustainable; • Efficient; • Effectively manages infrastructure and delivers services for communities; • Has the scale and capacity to engage effectively across community, industry and government.
NCC is submitting a Template 2 Improvement Proposal and has developed an FftF program building on the "Road to Recovery" improvement program already underway. Council has identified areas where further improvements in its operating position can be achieved, through revenue enhancement and expense management Opportunities have also been identified to improve the efficiency of undertaking capital works (particularly asset renewal projects) which will result in a faster and more cost effective reduction of the infrastructure backlog.

169
The program has been broken into the following streams:
1. Revenue Raising Measures (operating) 2. Operational Saving Measures 3. Revenue Raising Measures (capital) 4. Capital (expenditure) Savings Measures 5. Infrastructure Rehabilitation
There are a number of programs under each stream and each program will have one or more projects (or improvement initiatives). The goal is for project costs to be largely funded by the additional revenue and/or cost savings created by the projects and the projects have been sequenced to (1) avoid creating a material adverse financial impact in any year of the program and (2) Scheduled to ensure sufficient management attention and resources can be applied across the program. The annual benefits of the program are largely achieved by 2017/18 to ensure Council has a stronger financial position in the short term which can be built upon in the long term. The program is part of the Infrastructure Rehabilitation Stream. At this point in time, this is the only project identified within this stream (for context). This program will focus on six initiatives:
• Raising the amount of actual asset maintenance to the level required as outlined in the Asset Management Plan (AMP).
• Increase asset renewal and remediation levels to reflect the required amount as per the AMP. • Improve prioritisation of intervention levels to achieve optimal remediation. • Review and determine optimal service levels of assets to ensure most effective level of maintenance and capital
works. • Ensure asset renewal and remediation is conducted to a level which addresses the infrastructure backlog by the
targeted timeframe. • Focus on improving processes associated with asset management in order to create efficiencies.

170
Project Purpose/Justification • Why are we doing this? • Alignment with Council’s strategic
objectives? (Delete those not applicable)
• Other strategic Documents eg Business Case, Master Plan, Technical Manuals, DCP etc
The 2030 objectives applicable to this project are: • Liveable & Distinctive Built Environment • Open & Collaborative Leadership
The 2030 Community strategic Plan highlights the need for Council to provide services to the community in a sustainable manner. Council has been undertaking a “road to recovery” program which has achieved significant results and in conjunction with an SRV has placed Council on a sustainable path. The OLG Fit for the Future initiatives have been introduced to determine Local Government's ability to be strong and sustainable into the future. The following financial targets have been outlined to be met by Council's to demonstrate they are "Fit for the Future": 1. Operating Performance Ratio being greater than or equal to break even over three years; 2. Own Source Revenue Ratio being greater than 60% over three years; 3. Building and Infrastructure Asset Renewal Ratio being greater than one over three years; 4. Infrastructure backlog ratio being less than 2%; 5. Asset Maintenance Ratio being greater than one; 6. Debt Service Ratio being greater than zero and less than 0.2. 7. Real Operating Expenditure per capita over time has the scale and capacity consistent with the recommendations of the Independent Panel. Council's LTFP and Delivery Programs have been revised as part of the 2015/16 budget process to include all of the FftF initiatives identified (including this program of initiatives) to endeavour to achieve all 7 of the targets outlined by the OLG. By optimising Council's asset renewal and rehabilitation processes multiple benefits to Council's ability to be sustainable into the future will ensue. In terms of the FftF targets this project will directly benefit Council by improving many of the ratios noted in the OLG indicators, including improvements in Council's Building and Infrastructure Asset Renewal Ratio, the Infrastructure Backlog Ratio and the Asset Maintenance Ratio.
171
Project Objectives • What are we doing? • Specific objectives for the scope
of work covered by this charter?
The program will have the following objectives:
• Historically Council has significantly underspent on asset maintenance. The 2013/2014 Financial Statements highlights the gap in expenditure for maintenance, noting $12.5m was spent on asset maintenance against a required level of asset maintenance of $14.7m. This program aims to ensure Council achieves an Asset Maintenance Ratio of greater than 100% to ensure Council is investing enough funds within the year to ensure assets are properly maintained and avoid those assets becoming part of the infrastructure backlog. The level of maintenance required to produce this ratio is outlined in Council's AMP and LTFP.
• Ensure Council successfully produces a Building and Infrastructure Asset Renewal ratio of at least 100% over three years. The AMP and LTFP provide guidance on what constitutes satisfactory condition, what our current position is and what investment is required in asset renewal for sustainability.
• Council's current asset backlog level of 9% significantly exceeds the targeted level of 2%. This program seeks to achieve an infrastructure backlog level lower than 2% of Council's gross assets by 2019/2020 if using the asset replacement value, which is the recommended method by Professor Percy Allan, or by the following year if using WDV.
• Identify the most effective method for assessing asset condition and implement that method to ensure Council is intervening with remediation at the most cost effective point in the asset's life cycle. Therefore by targeting assets for renewal prior to the asset reaching unsatisfactory condition will result in lower costs to remediate the asset to an acceptable condition.
• Implement differential service levels for assets to prioritise expenditure on both maintenance and renewal based on the service level allocated.
• Improve asset planning via establishing more developed and accurate multi-year plans. • Streamline design process for engineering works and build pipeline of works. • Improve data collection in terms of timeliness, effectiveness and efficiency via utilisation of selected best
practice methods, improved technology and statistical models.
172
Constraints Possible constraints
• Workforce available to meet the level of asset maintenance and renewal required. • Determination of which method is the most effective method for assessing asset condition. • Length of time required to conclude best method for assessing asset condition and the time required to
implement this method and assess Council assets. • Workforce availability and length of time necessary to research asset condition methods, build a business case
for their determination and implement the method. • Not only will Council's asset renewal program effect the backlog amount other variables including the asset
maintenance program, asset revaluations and asset condition method utilised may impact on the level of the backlog.
• Difficulty in obtaining long term data to develop useful, accurate multi-year asset planning. • Budgetary constraints for improvements in systems and model development to facilitate improved data
collection.
Assumptions Assumptions: • Council is committed to providing funding and resources to facilitate optimising asset renewal and rehabilitation. • Council will adopt the proposed Delivery Program, inclusive of the capital program modelled from the LTFP
aimed to heavily address the infrastructure backlog. • Council has the resources and skill set available to achieve the objectives of this project or has the capacity to
source them within the required time frame. • There is a clear understanding and agreed cooperation between the relevant Business Units involved in the
project.

173
Scope / Deliverables • What are the deliverables for the
aspect of the project covered by this brief?
Note: These are prompts only. Customise for your project.
Scope • To improve Council's asset renewal and rehabilitation programs and processes to ensure long term effective
asset management is in place. Included in the scope of the project is continual improvement of Council's asset management programs and a stronger focus on best practice processes to ensure asset management is at its optimal and most cost effective level.
Deliverables:
• Develop and produce a monthly report to EMT detailing the progress in Council's asset program including actual asset maintenance and renewal amounts, targeted amounts and movement in the asset backlog.
• Create a working group to review service levels of assets and provide a report ranking assets in terms of service level allocated, inclusive of the required level of maintenance and renewal per assigned service level.
• Create a working group to investigate and implement recommended process improvements such as most effective method for asset condition assessment including optimal intervention level, avenues for streamlining asset design and building works, and options for improved data collection and usage.
• Incorporate detailed multi-year asset planning into the Delivery Program development.
Budget
Total project budget is $200k. Budgeted through the 2015/2016 Operational Plan.
Risks/High Level Impact (where does it impact (project, organisation, community) Risk Minimisation Strategy Council may not have the workforce capacity to produce the required asset maintenance and renewal program recommended
Minimisation strategy will include the following:
• Ongoing consultation and communication with relevant business units to ensure they can schedule and prioritise workload demands.
• Ensure Council has access to additional workforce resources if required • Ensure detailed program of works is developed and regular progress reporting is completed
Timeliness of asset condition data • Ensure an appropriate number of qualified staff are assigned to this task and regular progress updated are provided to the project steering committee
Fluctuations may occur in the asset backlog amount
• Detailed modelling as part of the LTFP model to capture identifiable variables such as asset revaluations and present value of future costs to restore and maintain assets.
• Regular reporting requirements detailing the backlog amount, including commentary on material movements

174
Project size (see criteria for Project Size )
Minor Medium X Major Project is classed a major due to the estimated benefits arising from increased revenue.
Completed Project Coordination
• Has consultation already been undertaking with relevant internal stakeholders prior to initiating this brief?
• Are there opportunities to pool resources with other departments, etc?
• Are other departments happy with the overall objectives?
Consultation has already occurred with: • Directors for Corporate, Infrastructure, and Planning & Regulatory • Manager of Infrastructure Planning
Pooling of resources?
• Needs to be a joint initiative between Infrastructure Planning and Finance to maximise success Are other departments happy with objectives?
• Other departments are happy with broad objectives • Will undertake a formal review as part of project charter sign-off
Stakeholders and Communications Strategy Stakeholders Communication method (email, weekly meetings, monthly reporting, website updates, brochures, mail outs, media, etc)
Internal Finance, Infrastructure Planning
Other govt agencies Nil
Community Nil
Project Control Group EMT (for all program streams of the FftF program), Manager Finance, Manager Infrastructure Planning
Project Working Group Infrastructure Planning (project manager), Infrastructure Planning team (selected project team members), Manager Corporate Finance, Budget Accountant and/or Finance team (selected project team members)
Critical Activities & Milestones No Action Required Due Date
AMR Asset Management Reporting
AMR1 Develop an asset management report demonstrating Council's progress with reducing the asset backlog, actual maintenance and renewal against planned renewal and rehabilitation and YTD ratios for Asset Maintenance, Built and Infrastructure Asset Renewal and Asset Backlog ratios against the targeted OLG ratios. Commentary to be included on variations with recommendations to remedy variations.
ASL Asset Service Levels

175
ASL1 Create a working group for Asset Service Levels.
ASL2 Working group to develop a matrix to determine service levels for assets and the required maintenance and renewal levels for the allocated level of service assigned.
ASL3 Approval of matrix by EMT.
ASL4 Approved maintenance and renewal levels incorporated into AMPs and MAPPs program by Infrastructure Planning.
PI Process Improvements
PI1 Create a working group for asset renewal and rehabilitation process improvements.
PI2 Working group to investigate avenues for process improvements including best practice method for asset condition assessment and optimal intervention levels, streamlining asset design and building works processes, and data collection and usage.
PI3 Report detailing process improvements identified and those improvements recommended for implementation.
PI4 Findings and recommendations presented to EMT for approval.
PI5 Approved process improvements to be implemented by appropriate Business Unit.
Governance Client Director Corporate
Asset Manager/s Infrastructure Planning Manager
Sponsor General Manager
Project Control Group (Major Projects only) EMT (for all program streams of the FftF program), Manager Finance, Manager Infrastructure Planning
Service Provider Business Unit: Infrastructure Planning Business Unit Manager: Ken Liddell Team Coordinator: n/a Project Manager/Officer: Manager Infrastructure Planning
Project Charter Prepared by Andrew Glauser (Manager Finance) Date: 22 May 2015
176
Approved By Sponsor:_______________________________________ Date: ________ Client::________________________________________ Date: ________ Project Manager:________________________________ Date: ________

177
Appendix I: Community Feedback The ILGRP Report included a number of attachments. One of these attachments was the Consultation Report. This was Supporting Information Volume 1 of the Final Report. The consultation report included a number of surveys on amalgamation. This included:
• Online survey with a majority of responses from within the government sector
The Panel received 200 responses to the survey. The majority of responses (83%) were from people within the local government sector which included Mayors, Councillors, Councils, Council Employees and Regional Grouping of Councils (eg ROCs, Alliances). Community organisations and community members comprised 14% of responses, with the remaining 3% representing responses from individual business, non‐government organisations and others.
• A Local Government in NSW Future Directions Opinion Poll
The survey was conducted on the IRIS from 22nd May to 28th May 2013. A total of 1003 residents were interviewed in the Sydney Region and a further 500 interviews were conducted amongst residents of the Hunter region. In total the Hunter region covered 9 Local government Areas, while Sydney region covered 38 LGA’s
Most emphasis in the analysis will be placed on the randomised community feedback in the second survey. The survey size of 500 is statistically significant. NCC has undertaken further analysis and focussed specifically on how the data applies to the Hunter region and its relevance to the proposed amalgamation of NCC and LMCC. Based on OLG data, Newcastle and Lake Macquarie constitute approximately 58% of the total population across the Hunter region. Although there is not a breakdown of the data by LGA the results (where very definitive) can reasonably be considered to apply to ratepayers within Newcastle and Lake Macquarie due to high representation of these two areas in a randomised survey. NCC has undertaken significant consultation with the community on its financial sustainability, the “road to recovery” program including the recent successful SRV application. Council received very strong support for an SRV. The recent public exhibition of the Delivery program and Operational Plan 2015/16 received referenced the Fit for the Future initiative. Based on this extensive consultation with the community and ILGRP’s own research which indicates there is not community support within the Hunter region for amalgamations, NCC did not incur further cost in undertaking an independent survey on the topic.
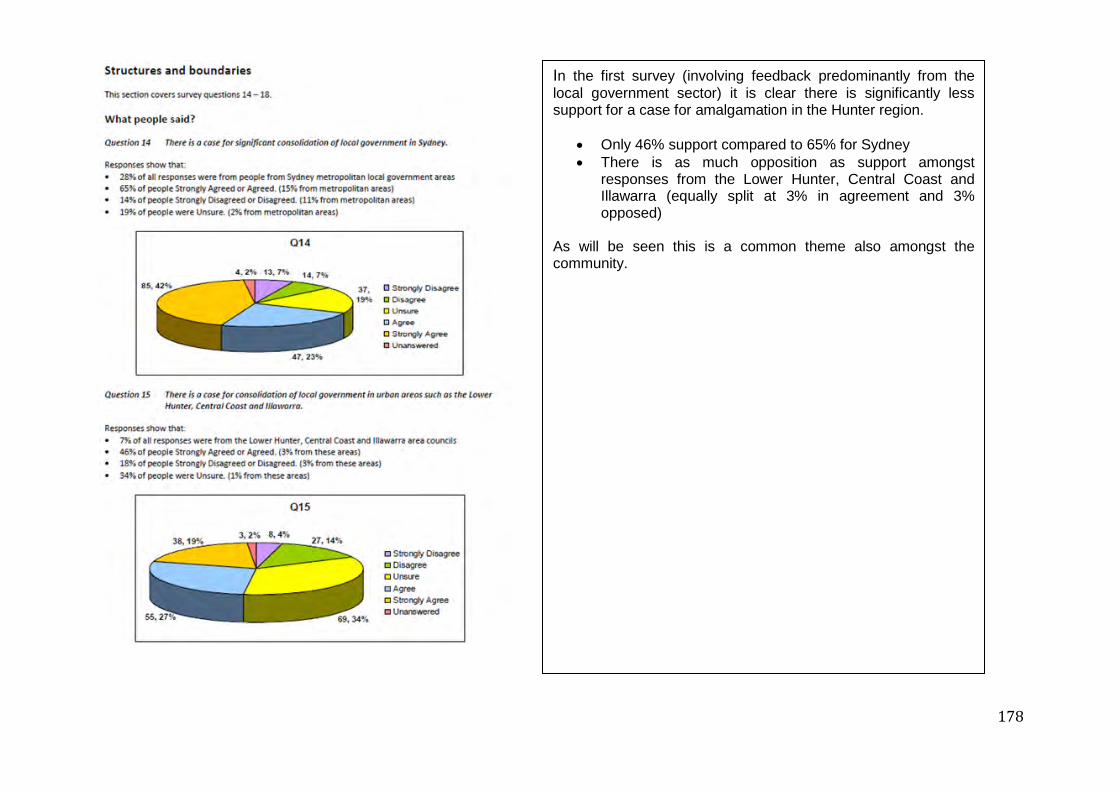
178
In the first survey (involving feedback predominantly from the local government sector) it is clear there is significantly less support for a case for amalgamation in the Hunter region.
• Only 46% support compared to 65% for Sydney • There is as much opposition as support amongst
responses from the Lower Hunter, Central Coast and Illawarra (equally split at 3% in agreement and 3% opposed)
As will be seen this is a common theme also amongst the community.
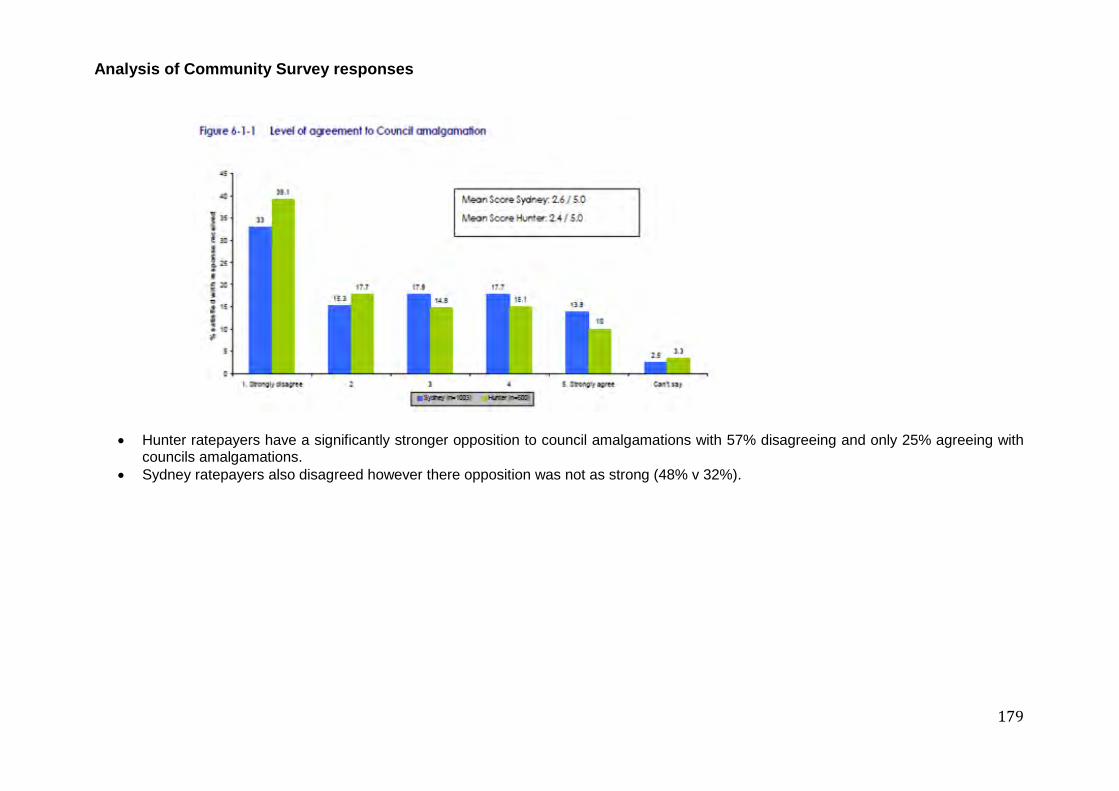
179
Analysis of Community Survey responses
• Hunter ratepayers have a significantly stronger opposition to council amalgamations with 57% disagreeing and only 25% agreeing with councils amalgamations.
• Sydney ratepayers also disagreed however there opposition was not as strong (48% v 32%).
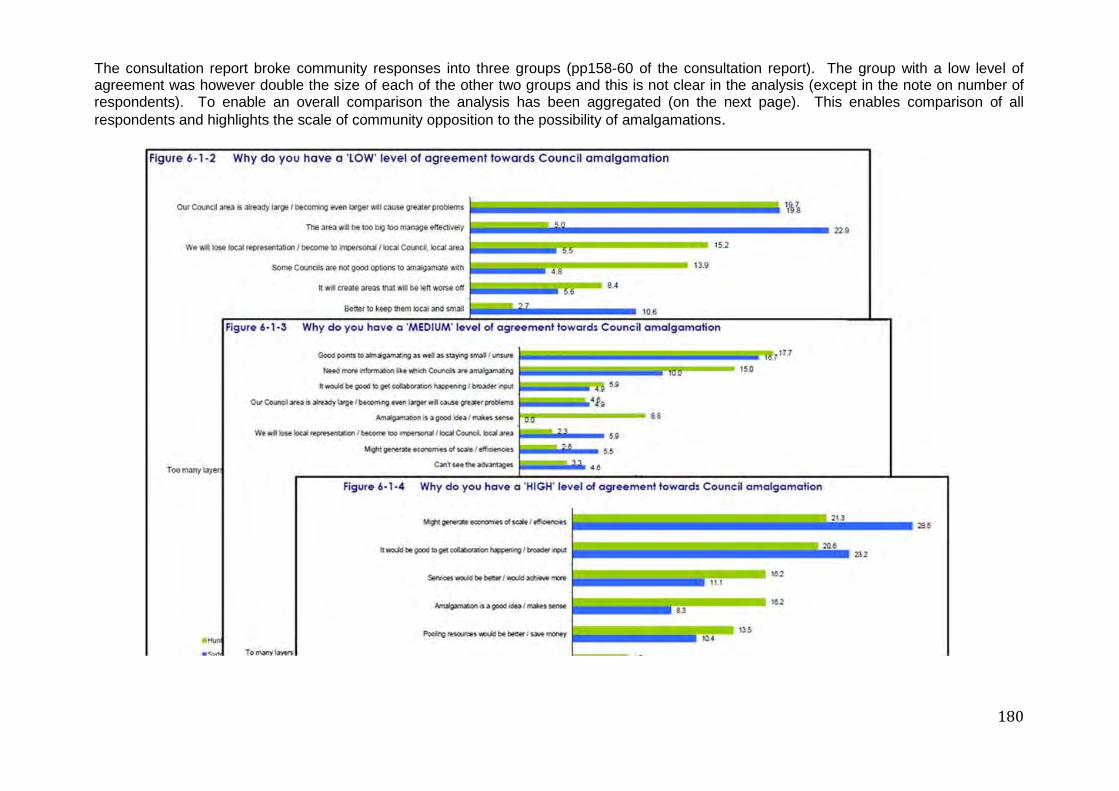
180
The consultation report broke community responses into three groups (pp158-60 of the consultation report). The group with a low level of agreement was however double the size of each of the other two groups and this is not clear in the analysis (except in the note on number of respondents). To enable an overall comparison the analysis has been aggregated (on the next page). This enables comparison of all respondents and highlights the scale of community opposition to the possibility of amalgamations.
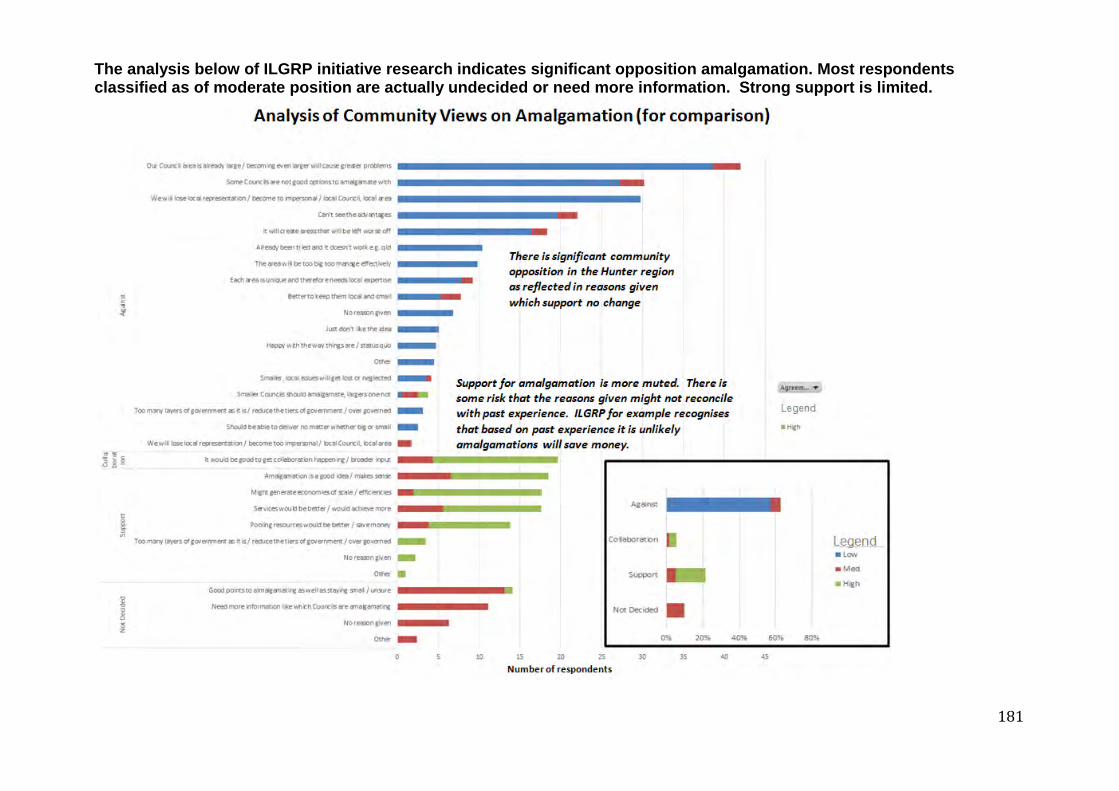
181
The analysis below of ILGRP initiative research indicates significant opposition amalgamation. Most respondents classified as of moderate position are actually undecided or need more information. Strong support is limited.
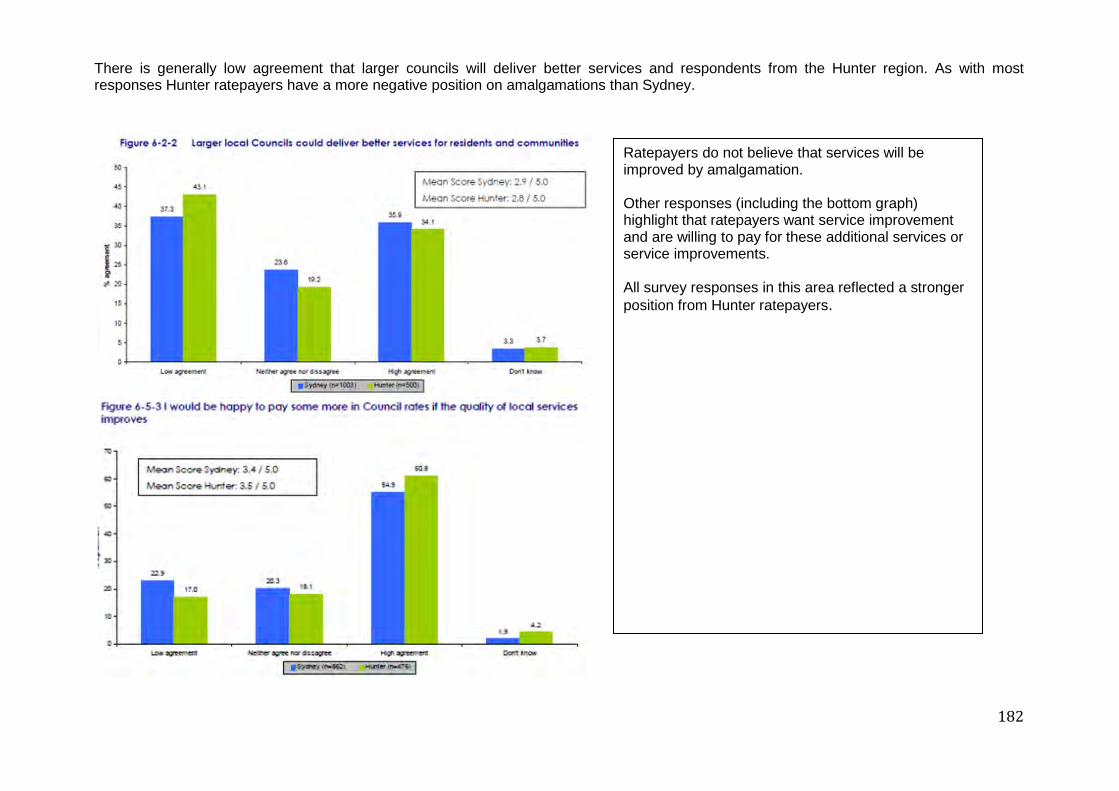
182
There is generally low agreement that larger councils will deliver better services and respondents from the Hunter region. As with most responses Hunter ratepayers have a more negative position on amalgamations than Sydney.
Ratepayers do not believe that services will be improved by amalgamation. Other responses (including the bottom graph) highlight that ratepayers want service improvement and are willing to pay for these additional services or service improvements. All survey responses in this area reflected a stronger position from Hunter ratepayers.

183
In conclusion:
• Independent research by ILGRP indicates the community does not support amalgamation • An analysis of the reasons for not supporting or supporting amalgamation reinforces this conclusion • Ratepayers do generally seek a higher level of service and are prepared to pay for these improvements. • Ratepayers do not believe amalgamation is the answer to improving service levels.

184
i In 2011 the average residency of a local government area in Australia was just over 40,000 people whereas in Europe it was 5,693 and in the USA 7,981. See Allan, P, Virtual Local Government, chapter 3.2 in A Federation for the 21st Century, CEDA, Melbourne, October 2014, page 116 ii Allan, P 2003, ‘Why Smaller Councils Make Sense’, Australian Journal of Public Administration, Vol. 62, No. 3, Sept, pp.74-81. See also - Bish, RL, Local Government Amalgamations, Discredited Nineteenth-Century Ideals Alive in the Twenty-First Century, The Urban Papers, No. 150, C.D. Howe Institute, 2001, page 26 - Byrnes, J and Dollery, B, Do economies of Scale Exist in Australian Local Government? A review of the Research Evidence, Urban Policy and Research, Vol. 20. No 4, 2002, page 393 - Allan P, Darlison L and Gibbs D, Independent Inquiry into the Financial Sustainability of NSW Local Government (LGI), Are Councils Sustainable? Final Report: Findings and Recommendations, NSW (LGSA), May 2006, pages 21 and 260. - Dollery B, Byrnes J and Allan P, Original Structural Reform in Australian Local Government: An Empirical Analysis of Economies of Scale by Council Function in New South Wales, Working Paper Series In Economics, University of New England, No 2006-4, 2006, page 2. - Aulich C, McKinlay P and Sansom G, Consolidation in Local Government - A Fresh look at Municipal Consolidation in Australia, Original Draft Report, 2011, Pages 7, 9 and 39. - Dollery B, Grant B and Kortt M, Councils in Cooperation, The Federation Press, Sydney, 2012, pages 20 and 44. - Drew J, Kortt M and Dollery B, Economies of Scale and Local Government Expenditure: Evidence from Australia, Administration & Society, 2014 Vol. 46, page 632. - Drew J and Dollery B, Would Bigger Councils Yield Scale Economies in the Greater Perth Metropolitan Region? A Critique of the Metropolitan Review for Perth Local Government, Australian Journal of Public Administration, Vol. 73, No. 1, page 135 - Sansom G, Debate: The case for local government amalgamations in Sydney: Fact and Fiction, Public Money and Management, 2015, 35:1, page 65 - Drew J, Kortt M and Dollery B, No Aladdin’s Cave in New South Wales? Local Government Amalgamation, Scale Economies, and Data Envelopment Analysis Specification, Administration and Society, April 2015.
iii Jones MA 1993, Transforming Australian Local Government – Making it Work, Allen and Uwin, Sydney. iv Soul, S 2000, Population Size and Economic and Political Performance of Local Government Jurisdictions, research thesis submitted to The Southern Cross University to fulfill requirements for a Degree of Doctor of Philosophy, p. 179. v Ibid. vi Newcastle City Council Economic Profile, http://www.economicprofile.com.au/newcastle/ vii Newcastle City Council Economic Profile, http://www.economicprofile.com.au/newcastle/ viii City of Newcastle, Local Planning Strategy Fact Sheet 4: Who we are: History and Community Profile, page 5. http://www.newcastle.nsw.gov.au/__data/assets/pdf_file/0007/221110/Fact_Sheet_4_Who_we_are.pdf

185
ix NSW Government, Planning and Environment, Local Government Area Population Projections: 2014 Final, http://www.planning.nsw.gov.au/en-us/deliveringhomes/populationandhouseholdprojections/data.aspx x Ibid. xi Newcastle City Council Economic Profile, http://www.economicprofile.com.au/newcastle/ xii Newcastle City Council Economic Profile, http://www.economicprofile.com.au/newcastle/