nc math 4 standard course of study. ncdpi staff are
TRANSCRIPT

NC Math 4 ● Unpacked Contents For the new Standard Course of Study that will be effective in all North Carolina schools in the 2020-21 School Year. This document is designed to help North Carolina educators teach the NC Math 4 Standard Course of Study. NCDPI staff are continually updating and improving these tools to better serve teachers and districts.
What is the purpose of this document? The purpose of this document is to increase student achievement by ensuring educators understand the expectations of the new standards. This document may also be used to facilitate discussion among teachers and curriculum staff and to encourage coherence in the sequence, pacing, and units of study for grade-level curricula. This document, along with on-going professional development, is one of many resources used to understand and teach the NC SCOS.
What is in the document? This document includes a detailed clarification of each standard in the grade level along with a sample of questions or directions that may be used during the instructional sequence to determine whether students are meeting the learning objective outlined by the standard. These items are included to support classroom instruction and are not intended to reflect summative assessment items. The examples included may not fully address the scope of the standard. The document also includes a table of contents of the standards organized by domain with hyperlinks to assist in navigating the electronic version of this instructional support tool.
How do I send Feedback? Link for: Feedback for NC’s Unpacking Documents. We will use your input to refine our unpacking of the standards. Thank You! Just want the standards alone? Link to: North Carolina Mathematics Standards

NC Department of Public Instruction 2 NC Math 4 Unpacking Document (6/2020)
NC Math 4 Standards
Standards for Mathematical Practice
Number and Quantity Algebra and Functions Statistics and Probability
NC.M4.N.1 Apply properties and operations with complex numbers. NC.M4.N.1.1 NC.M4.N.1.2 NC.M4.N.2 Apply properties and operations with matrices and vectors. NC.M4.N.2.1 NC.M4.N.2.2
NC.M4.AF.1 Apply properties of function composition to build new functions from existing functions. NC.M4.AF.1.1 NC.M4.AF.1.2 NC.M4.AF.2 Apply properties of trigonometry to solve problems. NC.M4.AF.2.1 NC.M4.AF.2.2 NC.M4.AF.2.3 NC.M4.AF.3 Apply the properties and key features of logarithmic functions. NC.M4.AF.3.1 NC.M4.AF.3.2 NC.M4.AF.3.3 NC.M4.AF.4 Understand the properties and key features of piecewise functions. NC.M4.AF.4.1 NC.M4.AF.4.2 NC.M4.AF.5 Understand how to model functions with regression. NC.M4.AF.5.1 NC.M4.AF.5.2
NC.M4.SP.1 Create statistical investigations to make sense of real-world phenomena. NC.M4.SP.1.1 NC.M4.SP.1.2 NC.M4.SP.1.3 NC.M4.SP.1.4 NC.M4.SP.2 Apply informal and formal statistical inference to make sense of, and make decisions in, meaningful real-world contexts. NC.M4.SP.2.1 NC.M4.SP.2.2 NC.M4.SP.2.3 NC.M4.SP.3 Apply probability distributions in making decisions in uncertainty. NC.M4.SP.3.1 NC.M4.SP.3.2 NC.M4.SP.3.3 NC.M4.SP.3.4

NC Department of Public Instruction 3 NC Math 4 Unpacking Document (6/2020)
Standards for Mathematical Practice
Practice Explanation
1. Make sense of problems and persevere in solving them.
In NC Math 4, students solve real world problems using their knowledge of numbers, functions, and algebra. Students seek the meaning of a problem and look for efficient ways to represent and solve it. They may check their thinking by asking themselves, “What is the most efficient way to solve the problem?”, “Does this make sense?”, and “Can I solve the problem in a different way?” Students also consider the reasonableness of intermediate results while applying processes to solve complex equations.
2. Reason abstractly and quantitatively.
In NC Math 4, students use algebraic, tabular, and graphical representations to reason about mathematical and real world contexts. They examine patterns in their processes. Students contextualize to understand the meaning of the number or variable as related to the problem. They mathematize problem situations to manipulate symbolic representations by applying properties of operations.
3. Construct viable arguments and critique the reasoning of others.
In NC Math 4, students construct arguments using verbal or written explanations accompanied by expressions, equations, functions, graphs, and tables. They further refine their mathematical communication skills through mathematical discussions in which they critically evaluate their own thinking and the thinking of other students. They construct arguments to defend functions they have created to model contextual situations. They pose questions like “How did you get that?”, “Why is that true?” “Does that always work?” They explain their thinking to others and respond to others’ thinking.
4. Model with mathematics.
In NC Math 4, students model problem situations symbolically, graphically, tabularly, and contextually. Students form expressions, generate functions, equations, or inequalities from real world contexts and connect symbolic and graphical representations. Students determine whether the model and the constraints they have constructed makes sense given the context of the problem.
5. Use appropriate tools strategically.
In NC Math 4, students consider available tools when solving mathematical problems and decide when particular tools might be helpful. It is assumed that students will have access to graphing technologies (e..g, graphing calculator, Desmos) and spreadsheets. Students should examine results produced using technology to determine if the solution makes sense and be aware of issues that may arise when selecting an appropriate scale for a graph or mode to evaluate an expression. Students should also recognize when solving a problem by-hand is more efficient than a technology-assisted approach.
6. Attend to precision. In NC Math 4, students use clear and precise language in their discussions with others and in their own reasoning. Students are aware of the effects of rounding on a solution. They recognize the importance and meaning of the symbols they use. They attend to units when solving real-world problems and appropriately label and interpret axes in graphs.
7. Look for and make use of structure.
Students routinely seek patterns or structures to model and solve problems. In NC Math 4, students reason about the solution and determine whether a simplified form is helpful for interpreting or using the result. Students are able to recognize key features of the graph of a function from its algebraic structure that may include asymptotes, end behavior, zeroes, amplitude, or period.
8. Look for and express regularity in repeated reasoning.
In NC Math 4, students use repeated reasoning to make generalizations about patterns and structures. By using repeated reasoning students are able to synthesize processes. For example, when examining a sequence of values students are able to develop a recursive function rule by identifying the repeated operations.
9. Use strategies and procedures flexibly.
In NC Math 4, students solve real world problems using their knowledge of numbers, functions, and algebra. Students seek the meaning of a problem and look for efficient ways to represent and solve it. They may check their thinking by asking themselves, “What is the most efficient way to solve the problem?”, “Does this make sense?”, and “Can I solve the problem in a different way?” Students also consider the reasonableness of intermediate results while applying processes to solve complex equations.
10. Reflect on mistakes and misconceptions.
In NC Math 4, students use algebraic, tabular, and graphical representations to reason about mathematical and real world contexts. They examine patterns in their processes. Students contextualize to understand the meaning of the number or variable as related to the problem. They mathematize problem situations to manipulate symbolic representations by applying properties of operations.
Return to: Standards
NC Department of Public Instruction 4 NC Math 4 Unpacking Document (6/2020)
Number and Quantity
NC.M4.N.1 Apply properties and operations with complex numbers. NC.M4.N.1.1 Execute procedures to add and subtract complex numbers.
Clarification Checking for Understanding
In NC Math 2 students use the quadratic formula to identify whether there are complex solutions to a quadratic equation. They express these complex solutions using i. NC Math 2 students have also learned that all real numbers are complex numbers (NC.M2.N-CN.1). In NC Math 4, students use properties to add and subtract complex numbers. They should recognize that the sum or difference of two complex numbers results in another complex number. Please note the sum and difference algorithms refer to adding and subtracting, respectively, the like terms, combining the real parts and combining the imaginary parts.
Indicator: Evaluate the following expressions: a. (5 + 7𝑖) + (−2 + 3𝑖)
b. (9 − 𝑖) − (4 + 6𝑖)
c. (4 − 𝑖√2) − (3 + 𝑖√2) + 8𝑖 Answers: a. 3 + 10𝑖, b. 5 − 7𝑖 c. 1 + (8 − 2√2)𝑖
Return to: Standards
NC.M4.N.1 Apply properties and operations with complex numbers. NC.M4.N.1.2 Execute procedures to multiply complex numbers.
Clarification Checking for Understanding
In Math 1 students multiply two binomial expressions like (𝑥 + 2)(𝑥 + 3)
to produce a polynomial, 𝑥 2 + 5𝑥 + 6. Students also rewrite expressions that involve complex numbers as described in M4.N.1.1. In NC Math 4, students are expected to be able to multiply two complex numbers with and without technology. To multiply two complex numbers, you expand the product as you would with polynomials.
Indicator: Evaluate the following expressions: a. 2𝑖(13 − 9𝑖)
b. (3 + 4𝑖)(8 − 5𝑖) c. 2(2 + 4𝑖)(−3 + 𝑖)
d. −3(2𝑖 + 1) ⋅ (5𝑖) Answers: a. 18 − 26𝑖, b. 44 + 17𝑖 c. −10 − 10𝑖, d. 30 − 15𝑖
Return to: Standards
NC.M4.N.2 Apply properties and operations with matrices and vectors. NC.M4.N.2.1 Execute procedures of addition, subtraction, multiplication, and scalar multiplication on matrices.
Clarification Checking for Understanding
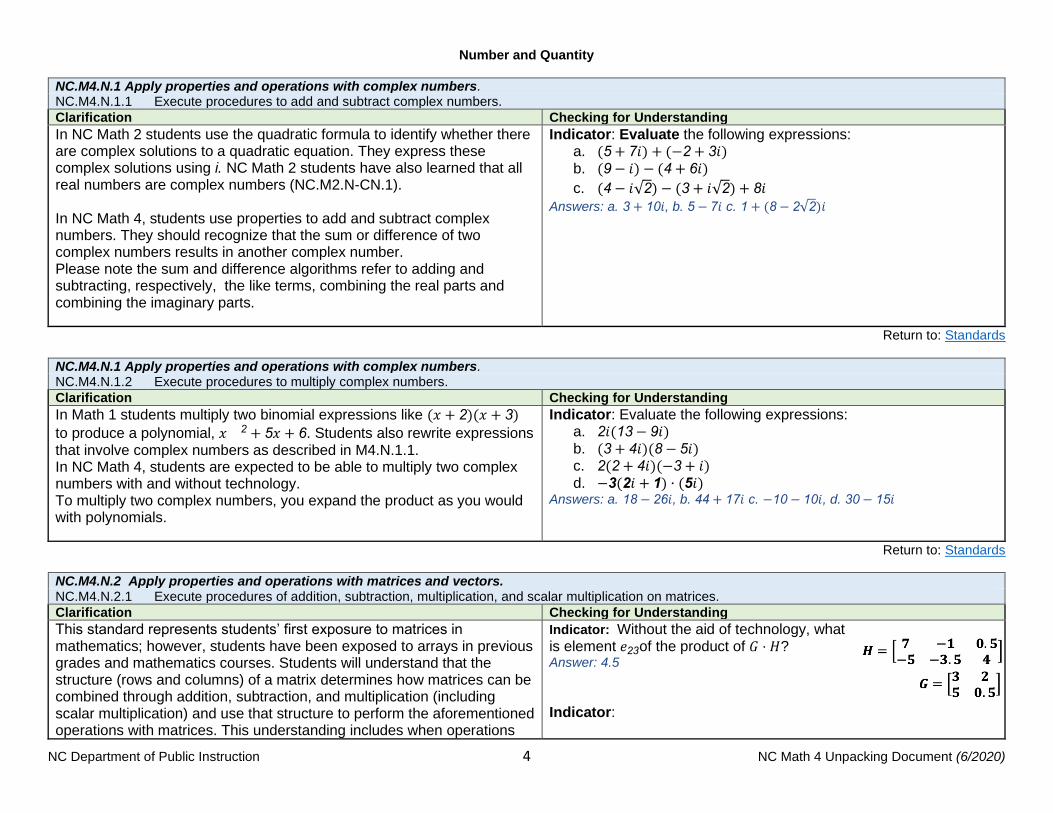
This standard represents students’ first exposure to matrices in mathematics; however, students have been exposed to arrays in previous grades and mathematics courses. Students will understand that the structure (rows and columns) of a matrix determines how matrices can be combined through addition, subtraction, and multiplication (including scalar multiplication) and use that structure to perform the aforementioned operations with matrices. This understanding includes when operations
Indicator: Without the aid of technology, what is element 𝑒23of the product of 𝐺 ⋅ 𝐻? Answer: 4.5
Indicator:
NC Department of Public Instruction 5 NC Math 4 Unpacking Document (6/2020)
on matrices cannot be completed. Students are not expected to solve matrix equations.
Given the matrices A, B, and C above, evaluate the following expressions:
a. 𝐴 + 𝐵 b. 𝐵 − 𝐴 c. 𝐴 ⋅ 𝐶
d. 3𝐵 + 2𝐴 e. 𝐵 ⋅ 𝐴
Answers:
a. b. c. d. e.
Return to: Standards
NC.M4.N.2 Apply properties and operations with matrices and vectors. NC.M4.N.2.2 Execute procedures of addition, subtraction, and scalar multiplication on vectors.
Clarification Checking for Understanding
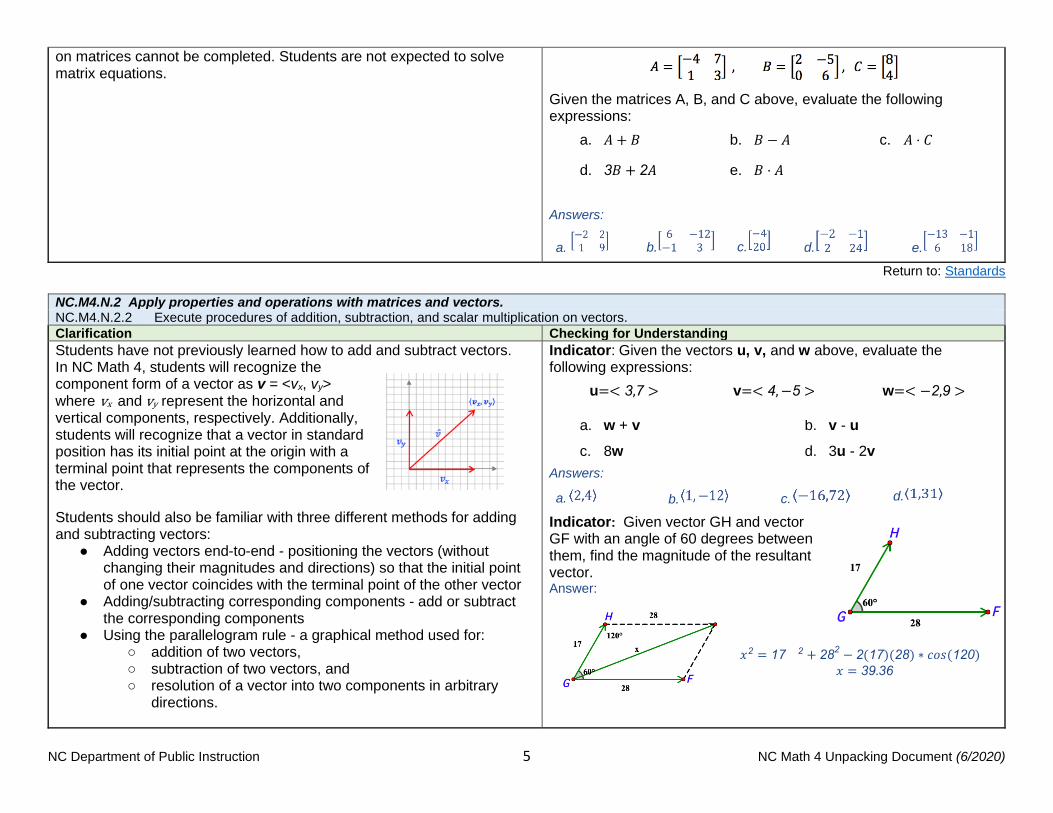
Students have not previously learned how to add and subtract vectors. In NC Math 4, students will recognize the component form of a vector as v = <vx, vy> where vx and vy represent the horizontal and vertical components, respectively. Additionally, students will recognize that a vector in standard position has its initial point at the origin with a terminal point that represents the components of the vector.
Students should also be familiar with three different methods for adding and subtracting vectors:
● Adding vectors end-to-end - positioning the vectors (without changing their magnitudes and directions) so that the initial point of one vector coincides with the terminal point of the other vector
● Adding/subtracting corresponding components - add or subtract the corresponding components
● Using the parallelogram rule - a graphical method used for: ○ addition of two vectors, ○ subtraction of two vectors, and ○ resolution of a vector into two components in arbitrary
directions.
Indicator: Given the vectors u, v, and w above, evaluate the following expressions:
u=< 3,7 > v=< 4, −5 > w=< −2,9 >
a. w + v b. v - u
c. 8w d. 3u - 2v
Answers:
a. b. c. d.
Indicator: Given vector GH and vector GF with an angle of 60 degrees between them, find the magnitude of the resultant vector. Answer:
𝑥2 = 17 2 + 282 − 2(17)(28) ∗ 𝑐𝑜𝑠(120)
𝑥 = 39.36

NC Department of Public Instruction 6 NC Math 4 Unpacking Document (6/2020)
Students should understand the process of finding the sum/difference of two vectors using any of the methods mentioned. They are not expected to know the name of the methods. Students will also apply the properties when multiplying a vector by a scalar. Students are not expected to execute procedures for vectors beyond 2-dimensional vectors.
Return to: Standards

NC Department of Public Instruction 7 NC Math 4 Unpacking Document (6/2020)
Algebra and Functions
NC.M4.AF.1 Apply properties of function composition to build new functions from existing functions. NC.M4.AF.1.1 Execute algebraic procedures to compose two functions.
Clarification Checking for Understanding
Students will extend their understanding of function notation and evaluating functions to working with compositions of two functions. This includes evaluating a composition of functions for specific values in the domain. Students will understand that the net effect of 𝑓 ∘ 𝑔 is 𝑎 → 𝑔(𝑎) →𝑓(𝑔(𝑎)) for any real value, 𝑎. Students understand that 𝑎 is in the domain
of 𝑔 and that 𝑔(𝑎) is in the domain of 𝑓. There is no limit as to the type of functions to be used when composing functions. In problems involving roots in the denominator, it is not necessary to rationalize the denominator.
Indicator: Find (𝑓 ∘ 𝑔)(𝑥) if 𝑓(𝑥) = −6𝑥 + 11 and 𝑔(𝑥) = 3𝑥 − 5. Answer: −18𝑥 + 41
Indicator: Given the two functions,
𝑓(𝑥) = 2𝑥 − 3 and 𝑔(𝑥) = 𝑥2 + 1, find the following:
a. 𝑓(𝑔(𝑥)) b. 𝑔(𝑓(𝑥))
c. (𝑓 ∘ 𝑓)(𝑥) d. (𝑔 ∘ 𝑔)(𝑥)
Answers: a. 2𝑥2 − 1, b.4𝑥2 − 12𝑥 + 10, c. 4𝑥 − 9, d. 𝑥4 + 2𝑥2 + 2
Indicator: Given 𝑓(𝑥) =1
𝑥2+4 and 𝑔(𝑥) = √𝑥 + 1. Find 𝑓(𝑔(𝑥)) and
𝑔(𝑓(𝑥)).
Answers: 𝑓(𝑔(𝑥)) =1
(√𝑥 + 1)2
+ 4
and 𝑔(𝑓(𝑥)) = √𝑥 + 5
𝑥 + 4
Return to: Standards
NC.M4.AF.1 Apply properties of function composition to build new functions from existing functions. NC.M4.AF.1.2 Execute a procedure to determine the value of a composite function at a given value when the functions are in algebraic, graphical, or tabular
representations.
Clarification Checking for Understanding
Students have already evaluated functions for specific values in the domain, given a function in algebraic, graphical or tabular form. Building upon this skill, students will now apply it to compositions of functions in a variety of representations; this includes functions presented in two different representations. For example, given the graph of the quadratic function𝑔(𝑥) and the algebraic representation of
the linear function 𝑓(𝑥) = 3𝑥 − 1 students can evaluate 𝑓(𝑔(4)) by finding the corresponding y-
value (2) in 𝑔(𝑥) and then evaluating f(2). So 𝑓(𝑔(4)) = 3(2) − 1 = 5.
Indicator:
𝑥 -2 -1 0 1 2 3 4 5
𝑓(𝑥) 5 2 1 2 5 10 17 26
𝑥 -2 -1 0 1 2 3 4 5
𝑔(𝑥) -1 1 3 5 7 9 11 13
Given the two functions above, find the following:
a. 𝑓(𝑔(−2)) b. 𝑔(𝑓(2)) c. (𝑓 ∘ 𝑔)(1) d. (𝑔 ∘ 𝑓)(−1)
Answers: a. 2, b. 13, c. 26, d. 7

NC Department of Public Instruction 8 NC Math 4 Unpacking Document (6/2020)
There is no limit as to the type of functions to be used when composing functions.
Indicator: Given the two functions, 𝑓(𝑥) = 2𝑥 − 3 and 𝑔(𝑥) = 𝑥2 +1, find the following with the given values:
a. 𝑓(𝑔(1)) b. 𝑔(𝑓(−1)) c. (𝑓 ∘ 𝑓)(−3) d. (𝑔 ∘ 𝑔)(0)
Answers: a. 1, b. 26, c. -21, d. 2
Indicator: Given the two functions below, find the following:
a. 𝑓(𝑔(−2)) b. 𝑔(𝑓(2)) c. (𝑓 ∘ 𝑔)(−4) d. (𝑔 ∘ 𝑓)(1)
Answers: a. -2, b. 0.5, c. 2, d. 1
Return to: Standards
NC.M4.AF.2 Apply properties of trigonometry to solve problems. NC.M4.AF.2.1 Translate trigonometric expressions using the reciprocal and Pythagorean identities.
Clarification Checking for Understanding
Grade 8 students study the Pythagorean theorem to find the length of one side of a right triangle given the lengths of two sides. In Math 2 students learn right triangle trigonometry and are familiar with trigonometric ratios. However, this is the first time that students will encounter trigonometric identities. In NC Math 4, students will use algebraic reasoning to rewrite trigonometric expressions in simplified equivalent forms using the reciprocal and Pythagorean identities.
Indicator: Rewrite the following trigonometric expression as a single trigonometric function: 𝑠𝑒𝑐𝜃 − 𝑠𝑖𝑛𝜃 ⋅ 𝑡𝑎𝑛𝜃 Answer: 𝑐𝑜𝑠𝜃
Return to: Standards

NC Department of Public Instruction 9 NC Math 4 Unpacking Document (6/2020)
NC.M4.AF.2 Apply properties of trigonometry to solve problems. NC.M4.AF.2.2 Implement the Law of Sines and the Law of Cosines to solve problems.
Clarification Checking for Understanding
Students have previously worked with finding the missing sides and angles of right triangles using the Pythagorean Theorem and by applying the trigonometric ratios, respectively. Students will use the Law of Sines and the Law of Cosines to find unknown measurements in right and non-right triangles. They should be able to:
● Distinguish between situations that require the Law of Sines (ASA, AAS, SSA) and situations that require the Law of Cosines (SAS, SSS);
● represent real world problems with diagrams of non-right triangles and use them to solve for unknown side lengths and angle measures;
● Solve for missing side lengths and angles using Law of Sines and Law of Cosines.
Note: The ambiguous case for oblique triangles is NOT an expectation in NC Math 4.
Indicator: A plane is flying from city D to city B, which is 115 miles due north. After flying 45 miles, the pilot must change course and fly 15° west of north to avoid a thunderstorm.
a. If the pilot remains on this course for 25 miles, how far will the plane be from city B?
b. How many degrees will the pilot need to turn to the right to fly directly to city B?
Answers: a. 𝑐 ≈ 46.3 𝑚𝑖𝑙𝑒𝑠,
b. 𝑚𝑒𝑎𝑠𝑢𝑟𝑒 𝑜𝑓 𝑎𝑛𝑔𝑙𝑒 𝐴 ≈ 157.02∘
Indicator: Two fire towers are 21 miles apart. Tower B is due East of Tower A. The rangers at Tower A spot a fire at 43°north of east. The rangers at Tower B spot the same fire 31° north of west. How far is Tower B from the fire?
Answer: 𝑥 ≈ 14.899 𝑚𝑖𝑙𝑒𝑠
Return to: Standards
NC.M4.AF.2 Apply properties of trigonometry to solve problems. NC.M4.AF.2.3 Interpret key features (amplitude, period, phase shift, vertical shifts, midline, domain, range) of models using sine and cosine functions in terms
of a context.
Clarification Checking for Understanding
This standard is an extension of standards in NC Math 3 which addressed the key features and parameters of the sine function. This standard extends to the key features of the cosine function. Additionally, phase shift for trigonometric functions is a new concept in NC Math 4. It is appropriate to make sure that students understand the relationship between the sine and cosine functions in relation to their key features. Students will be required to determine the meaning of variables and coefficients of trigonometric models and translate between different representational forms of trigonometric models (i.e. graphs, tables, and algebraic formats). The standard for sine and cosine functions: 𝑓(𝑥) = 𝑎 𝑠𝑖𝑛 (𝑏(𝑥 + 𝑐)) + 𝑑
Indicator: The depth of water near a boat dock is collected by a buoy. The data shows that the water level reached 11 ft. during high tide at 2:00 am and a level of 8 ft. during low tide at 9:00 am. The depth can be modeled by a sinusoidal function.
a. How deep will the water be at noon? b. For approximately what times will the water level be less than
9 ft?
Answers: a. 𝑓(𝑥) = 1.5𝑠𝑖𝑛(𝜋
7(𝑥 + 1.5)) + 9.5, 𝑓(12) = 9.17𝑓𝑡, b.
Approximately 6:00 am to 12:00am, repeats every 14 hours.

NC Department of Public Instruction 10 NC Math 4 Unpacking Document (6/2020)
𝑔(𝑥) = 𝑎 𝑐𝑜𝑠 (𝑏(𝑥 + 𝑐)) + 𝑑
where a, b, c and d are constants.
Return to: Standards
NC.M4.AF.3 Apply the properties and key features of logarithmic functions. NC.M4.AF.3.1 Execute properties of logarithms to rewrite expressions and solve equations algebraically.
Clarification Checking for Understanding
In NC Math 3, students recognized the inverse relationship between exponential and logarithmic functions. They also translated between exponential and logarithmic forms of equations. In NC Math 4, students will build upon their understanding of the properties of exponents when applying the properties of logarithms. This standard requires students to procedurally rewrite logarithmic expressions to solve logarithmic equations; including natural logs and e.
Indicator: Solve 𝑙𝑜𝑔(𝑥 − 3) + 𝑙𝑜𝑔(𝑥 + 4) = 2𝑙𝑜𝑔3.
Answer:−1+√85
2≈ 4.11
Return to: Standards
NC.M4.AF.3 Apply the properties and key features of logarithmic functions. NC.M4.AF.3.2 Implement properties of logarithms to solve equations in contextual situations.
Clarification Checking for Understanding
This standard requires students to use the skills developed in NC.M4.AF.3.1 to solve logarithmic equations that are based on contextual situations. Students should be able to determine when it is appropriate to apply logarithmic properties when presented with a problem based in a contextual situation; this may include creating an exponential equation and then solving the equation using properties of logarithms. Students should be familiar with all logarithms, including natural logs.
Indicator: The formula 𝐴 = 𝑃(1 +𝑟
𝑛) 𝑛𝑡 describes the accumulated
value, A, of a sum of money, P, the principal, after t years at annual percentage rate r (in decimal form) compounded n times a year. How long will it take $50,000 to grow to $900,000 at 20% annual interest compounded quarterly?
Answer:≈ 14.8 𝑦𝑒𝑎𝑟𝑠
Indicator: The Smiths are saving for their son’s college education. If they deposit $12,000 in an account bearing 6.4% interest compounded continuously, how much will be in the account when Evan goes to college in 12 years?

NC Department of Public Instruction 11 NC Math 4 Unpacking Document (6/2020)
Answer: $25,865.41
Return to: Standard
NC.M4.AF.3 Apply the properties and key features of logarithmic functions. NC.M4.AF.3.3 Interpret key features of a logarithmic function using multiple representations.
Clarification Checking for Understanding
In NC.M3, students develop an understanding of a logarithm through its inverse relationship with exponents. They also recognize that each constant and coefficient in a log equation or function represents a key feature of the function. Additionally in NC.M3.F-IF.7, students analyze the key features of piecewise, absolute value, polynomial, exponential, rational, and trigonometric functions using different representations. In NC Math 4, students will need to understand and interpret the key features (intercepts, end behavior, domain, range, and intervals where the function is increasing and decreasing) of log functions.
Indicator: Given the function 𝑓(𝑥) = 𝑙𝑜𝑔 3 𝑥 − 1 , describe the
key features. Include domain and range, intercepts, intervals of increasing or decreasing, and end behavior. Answer:
domain: (0, ∞) range: (−∞, ∞)
x-intercept: 3 y-intercept: ⊘
increasing: (0, ∞) decreasing: ⊘
EB(L): 𝑥 → 0; 𝑦 → ∞ EB(L): 𝑥 → ∞; 𝑦 → ∞
Indicator: Given the logarithmic function on the right, describe the key features. Include domain and range, intercepts, intervals of increasing or decreasing, and end behavior. Answer:
domain: (−3, ∞) range: (−∞, ∞)
x-intercept: (−2,0) y-intercept:(0,2)
increasing: (0, ∞) decreasing: ⊘
EB(L): 𝑥 → −3; 𝑦 → ∞ EB(L): 𝑥 → ∞; 𝑦 → ∞
Return to: Standards

NC Department of Public Instruction 12 NC Math 4 Unpacking Document (6/2020)
NC.M4.AF.4 Understand the properties and key features of piecewise functions. NC.M4.AF.4.1 Translate between algebraic and graphical representations of piecewise functions (linear, exponential, quadratic, polynomial, square root).
Clarification Checking for Understanding
This standard builds upon the interpreting functions (IF) standards from Math 1–3, where students have graphed functions given in algebraic form and written equations for graphical forms of functions. In NC Math 3, students analyzed the key features of piecewise-defined functions. They also interpret and evaluate piecewise functions. In NC Math 4, students will write algebraic representations of piecewise defined functions given in graphical form and graph algebraic representations of piecewise-defined functions.
Indicator: Create a piecewise-defined function for the graph to the right. Answer:
Indicator: Graph the following function and determine the domain and range of the function.
Answer: (Graph to the right.) Domain: All real numbers Range:
[−6, −2) ∪ [0, ∞)
Return to: Standards
NC.M4.AF.4 Understand the properties and key features of piecewise functions. NC.M4.AF.4.2 Construct piecewise functions to model a contextual situation.
Clarification Checking for Understanding
This standard requires students to write piecewise functions based on real-world context. Students understand that each part of the given context may represent a different function type and understand that the domain for each piece is restricted by the context of the problem.
Indicator: Write the rule for a piecewise function that models the following situation, the data plan for a smart phone costs $35 for 5 gigabytes of data and it costs $10 extra for each additional gigabyte of data used.

NC Department of Public Instruction 13 NC Math 4 Unpacking Document (6/2020)
Answer:
Indicator: A certain county has a tax code, where 10% tax is paid on all income up to the first $10,000, a 15% tax is paid for any income over $10,000 and up to $25,000, and a tax rate of 25% is paid on all income over $25,000. Find a piecewise function to calculate the total tax 𝑇(𝑥) on an income of 𝑥 dollars. Answer:
Return to: Standards
NC.M4.AF.5 Understand how to model functions with regression. NC.M4.AF.5.1 Construct regression models of linear, quadratic, exponential, logarithmic, & sinusoidal functions of bivariate data using technology to model
data and solve problems.
Clarification Checking for Understanding
Students have previously worked with scatter plots and lines of best fit in 8th grade. In NC Math 1, students have done linear and exponential regression using technology. They have also examined residual plots to determine linearity. In NC Math 4, students will also construct regression models for quadratic, logarithmic and sinusoidal functions of bivariate data. Additionally, students will be able to use regression models to solve real-world and mathematical problems.
Indicator: a. Analyze the scatterplot
of the cost of a 30-second advertisement for the Super Bowl from 1967-2011. Describe the patterns in the data.
b. Calculate a quadratic regression model for x years after 1967.
c. Based on your model, what is the predicted cost of a 30-sec. advertisement in 2007? How accurate is your prediction model’s cost compared to the actual cost?
d. Based on your model, what is the predicted cost for a 30-sec. advertisement in 2020?

NC Department of Public Instruction 14 NC Math 4 Unpacking Document (6/2020)
Answer:
a. The scatterplot is positive and nonlinear. The cost of a 30-second advertisement increases as the years increase.
b. 𝑦 = 1.916𝑥2 − 15.510𝑥 +104.408, x=years since 1967 and y=predicted cost of a 30-second advertisement.
c. In 2007, the predicted cost was roughly $2,550,000. This is fairly close to the actual recorded cost which was $2,600,000.
d. In 2020, the predicted cost is approximately $4,660,000. Data obtained from: https://www.businessinsider.com/cost-super-bowl-ads-through-the-years-
2011-2
Return to: Standards

NC Department of Public Instruction 15 NC Math 4 Unpacking Document (6/2020)
NC.M4.AF.5 Understand how to model functions with regression. NC.M4.AF.5.2 Compare residuals and residual plots of non-linear models to assess the goodness-of-fit of the model.
Clarification Checking for Understanding
In NC Math 1, students created scatter plots of data and determined whether a linear model was appropriate based on the residual plot. In NC Math 4, students will apply knowledge from Math 1 about interpolating and extrapolating and validity of predictions. They will now closely analyze the residual plots of non-linear models to determine the goodness-of-fit of a selected non-linear model. Students will understand that a residual plot with no discernable pattern indicates the selected model is a good fit for the data set.
Indicator: Answer the following questions Does the wealth of a country influence its citizens’ life expectancy?
Do you live longer in countries
that have more money?
a. Describe the relationship
between the Gross
Domestic Product per
Capita for a country and
its Life Expectancy. What
trends do you notice?
b. What type of function
might model this well?
c. Using your calculator
regression tools or
statistical software,
calculate a model for the
data. Compare the
residual plots as well.
Record the model
equation that best fits the
data AND sketch the
residual plot.
d. If Canada has a GDP per
capita of $48,100, what
would you predict to be
their Life Expectancy?
Look up how accurate this
is based on today’s life
expectancy information on
the World Factbook.

NC Department of Public Instruction 16 NC Math 4 Unpacking Document (6/2020)
Answers: a. The scatter plot is positive and
nonlinear. As GDP increases, so does life expectancy. The life expectancy is increasing, but at a decreasing rate.
b. A logarithmic function might model this scatterplot the best.
c. The best model found was a logarithmic one. The regression equation is 𝑦 = 11.77 + 6.40𝑙𝑛(𝑥) where x=GDP and y=predicted life expectancy. *This residual plot shows that there is more variation in the residuals for lower GDPs than higher GDPs.
d. Canada: 𝑦 = 11.77 +6.40𝑙𝑛(48100) = 80.8 𝑦𝑒𝑎𝑟𝑠 According to World Factbook (in 2018), the life expectancy for people in Canada is 82 years. The predicted value is fairly close to the actual life expectancy data for Canada.
Return to: Standards

NC Department of Public Instruction 17 NC Math 4 Unpacking Document (6/2020)
Statistics and Probability
NC.M4.SP.1 Create statistical investigations to make sense of real-world phenomena. NC.M4.SP.1.1 Construct statistical questions to guide explorations of data in context.
Clarification Checking for Understanding
Students were first introduced to statistical questions in 6th grade. They recognize statistical questions as questions that anticipate variability. The focus in NC.6.SP.1 is on the recognition of statistical questions and their distinction from non-statistical questions. The GAISE Report for Statistics outlines a four-step process for problem-solving as students engage in statistical inquiry:
1. Formulating a statistical question that anticipates variability and can be answered by data.
2. Designing and implementing a plan that collects appropriate data. 3. Analyzing the data by graphical and/or numerical methods. 4. Interpreting the analysis in the context of the original question.
This standard will focus on the first step of the statistical problem-solving process as students construct statistical questions that “anticipate an answer based on data that vary”.
Formative check: Determine if the question is a statistical question.
a. How has the number of live births changed over the last 30 years?
b. How many votes did the candidate that won Student Body President receive?
c. How do the heights of basketball players from two rival high schools compare?
Answers: a, Yes, b. No, c. Yes Indicator: The prom committee is planning the Junior/Senior prom for this year. The committee wants to make sure that they honor the preferences of students in both the junior and senior class. Write a statistical question that can help the committee to determine the student’s music preferences. Possible answers: What type of music is most popular among students at our school? How do the favorite types of music differ between classes?
Return to: Standards
NC.M4.SP.1 Create statistical investigations to make sense of real-world phenomena. NC.M4.SP.1.2 Design sample surveys and comparative experiments using sampling methods to collect and analyze data to answer a statistical question.
Clarification Checking for Understanding
Students have experience with a variety of data collection and analysis tools (numerical summaries and graphical displays) based on the type of data collected (qualitative or quantitative). In NC Math 3, students investigate different methods of data collection (surveys, experiments, observations, etc.), study design and data analysis techniques to best answer a statistical question. In NC.7.SP.1, students understand sampling and its usefulness in drawing inferences about a population under investigation. In NC Math 4, students will develop their understanding of sampling methods that are both biased and unbiased in relation to surveys and comparative experiments.
Indicator: The prom committee is planning the Junior/Senior prom for this year. The committee wants to make sure that they honor the preferences of students in both the junior and senior class.
a. Describe how you would collect data to answer the question: “What type of music is most popular among students at our school?”
b. Describe your plan to analyze the data. Possible answers: a) Survey or questionnaire; the question will have 5 main choices (r&b, rock, rap, country or other) b) A bar graph will be used to compare preferences; a table could also be created comparing favorite music type to class (junior or senior) to determine preferences by class.
Indicator: An agricultural researcher is investigating the effectiveness of

NC Department of Public Instruction 18 NC Math 4 Unpacking Document (6/2020)
As stated in NC.M4.SP.1.1, the GAISE Report for Statistics outlines a four-step process for problem-solving as students engage in statistical inquiry.
1. Formulating a statistical question that anticipates variability and can be answered by data.
2. Designing and implementing a plan that collects appropriate data. 3. Analyzing the data by graphical and/or numerical methods. 4. Interpreting the analysis in the context of the original question.
This standard will focus on the second and third steps of the problem-solving process as students will design surveys and comparative experiments to plan the collection and analysis of the data stemming from the original statistical question. Students will now combine their understanding of how to construct statistical questions and different sampling methods to create surveys and design experiments to answer statistical questions. Given a real-world context, students can design an experiment based on random sampling to investigate the phenomenon. Students also understand unbiased probability sampling methods (e.g. SRS, stratified, cluster, systematic, multistage) and use appropriate methods when designing experiments or conducting surveys. Likewise, they are aware of biased sampling methods and avoid them when collecting data.
three different brands of weed killer, brands X, Y, & Z. He has set up an area of weeds in a 4 by 4 zone as shown below. Describe how he can create an experiment to compare the effectiveness of the weed killers. Answer: The researcher can number the zones 1-16, put the numbers in a hat, and then randomly choose out 3 zones to be assigned to brand X weed killer. Then randomly choose another 3 numbers to assign the zones to brand Y. Again randomly choose another 3 numbers to assign the zones to brand Z. The last remaining 3 zones will be left alone as a control and no weed killer will be assigned. The researcher will compare the amount of weeds killed in the zones to see which brand is the most effective.
Return to: Standards
NC.M4.SP.1 Create statistical investigations to make sense of real-world phenomena. NC.M4.SP.1.3 Organize large datasets of real-world contexts (i.e. datasets that include 3 or more measures and have sample sizes >200) using technology
(e.g., spreadsheets, dynamic data analysis tools) to determine: types of variables in the data set, possible outcomes for each variable, statistical questions that could be asked of the data, and types of numerical and graphical summaries could be used to make sense of the data.
Clarification Checking for Understanding
Up until this point, students have worked with relatively small data sets so that they better understand the tools used for statistical analysis. Most statistical phenomena are based on real-world data which can include relatively larger data sets. Building on the understanding that more sampling may yield more accurate results, students will now work with larger data sets and multiple measures. This will require the use of technology that has the capacity to efficiently output summary measurements and create graphical displays of
Indicator: Use the random sampler at the census@school (https://ww2.amstat.org/censusatschool/index.cfm) to draw a sample of 250 students from NC. First use technology to explore what variables are in the data set.
a. Create a statistical question you could investigate using the data set.
b. Use technology to create appropriate visualizations of the data that help you to investigate the question you posed.
c. Use technology to find appropriate descriptive statistics to

NC Department of Public Instruction 19 NC Math 4 Unpacking Document (6/2020)
data for very large data sets. This may include, but is not limited to, statistical software, spreadsheets, and online analytical tools:
● Spreadsheet software, such as Google Sheets and Microsoft Excel can be used at the very minimum.
● CODAP is a free open source software for data analysis. ● Cause Web also has a variety of data collection and analysis tools
listed on their site.
help you to investigate the question you posed.
Return to: Standards

NC Department of Public Instruction 20 NC Math 4 Unpacking Document (6/2020)
NC.M4.SP.1 Create statistical investigations to make sense of real-world phenomena. NC.M4.SP.1.4 Interpret non-standard data visualizations from the media or scientific papers to make sense of real-world phenomena.
Clarification Checking for Understanding
Exploratory data analysis includes the analysis of graphical displays of data. Traditionally, students have worked with “typical” statistical graphs…dot plots, line plots, box plots, histograms and scatter plots. However, these graphical displays are not widely used when examining real-world phenomena intended for the general public. For example, the following map was used to track the spread of the Coronavirus in the United States at the beginning of the pandemic.
Students understand the display, what information it conveys and how to translate the information into another form (e.g. a table, another graph, etc.). A useful resource is the New York Times’ What’s Going On in This Graph?
Indicator:
• What do you notice? • What do you wonder? What are you curious about that comes from what you notice in the graph? • What might be going on in this graph? Write a catchy headline that captures the graph’s main idea. If your headline makes a claim, explain what you noticed that supports your claim.
Return to: Standards

NC Department of Public Instruction 21 NC Math 4 Unpacking Document (6/2020)
NC.M4.SP.2 Apply informal and formal statistical inference to make sense of, and make decisions in, meaningful real-world contexts. NC.M4.SP.2.1 Design a simulation to make a sampling distribution that can be used in making informal statistical inferences.
Clarification Checking for Understanding
Formal statistical inference is new to students in NC Math 4. Students were briefly introduced to simulation in the middle grades (7.SP.2). They understand that random sampling (or simulated samples) can be used to gauge variation and to make statistical inferences. Students also understand the difference between a statistic and a parameter and how statistics are used to estimate population parameters. This standard explicitly has students design a simulation and use the information to create a sampling distribution to make informal inferences. Students will understand that a sampling distribution is a graph of a statistic generated from multiple samples of the same size from the population of interest (see figure below).
Students understand that sampling distributions can be created by collecting sample means or sample proportions.
Indicator: Collect the heights of all the students in your math class measured in centimeters. Also record each students sex. Find the average height of males in your class and of females.
a. Would you expect to get the same average heights if you collect height and sex data from another class in your school?
b. How could you simulate collecting height data from 100 classes with 25 students in them using the sample you collected from your class?
Carry out your simulation for the height of females and approximate what the average height of females is based on your sample. The Center for Disease Control reported the average height of women ages 20 and over in 2015-2016 to be 161.5 cm (source:https://www.cdc.gov/nchs/data/nhsr/nhsr122-508.pdf).
c. How likely is it to get the average height of women reported by the CDC given your sample?
d. Explain why you might be seeing the results you are seeing, including some of the limitations in making inferences from your sample.
Return to: Standards

NC Department of Public Instruction 22 NC Math 4 Unpacking Document (6/2020)
NC.M4.SP.2 Apply informal and formal statistical inference to make sense of, and make decisions in, meaningful real-world contexts. NC.M4.SP.2.2 Construct confidence intervals of population proportions in the context of the data.
Clarification Checking for Understanding
Students have worked with statistical measurements for center and variability. They have graphed data and analyzed summary statistics. Students understand that the sampling distribution of the sample proportions takes on the shape of the normal distribution for larger sample sizes and as the number of samples from the population increases. Yates, Moore, and Starnes (2002) state that “a confidence interval uses sample data to estimate an unknown population parameter with an indication of how accurate the estimate is and of how confident we are that the result is correct.” Students will understand the connection between repeated sampling and the construction of the confidence interval.
Students will use �̂� ± 𝑧 ∗ √𝑝(1−𝑝)
𝑛to construct the confidence interval;
students understand all constants and coefficients of the formula and can interpret confidence intervals in the context of the problem. Students also understand the conditions by which it is appropriate to use a sample to construct a confidence interval for a given sample. Students in NC Math 4 will construct confidence intervals for population proportions only. In NC Math 4, calculation of the margin of error becomes formalized; extending from informal understanding based on simulation in NC Math 3.
Indicator: Devise and carry out a plan to investigate, “what proportion of students at your school plan on going to a college or university after graduating.” After collecting your data create a 95% confidence interval of the proportion of students reporting planning on attending a college or university after graduating and interpret what that interval tells you relative to the statistical question under investigation. Possible answer: Create a survey to determine the post-secondary plans of all students in your school. It is impossible to do a consensus because there are 1300 students in your school and you do not have the resources or the time to get information from all of them. Since you want to make sure that you capture a representation of all students in the school, you decide to do stratified sampling by grade level. You ask students to complete your survey during grade level assemblies organized by the administration and you collect the surveys. After collecting the surveys, you find that 29 of the 75 students completing the survey indicate that they’re going to college or university after graduating.
𝑛 = 75; �̂� = .39 𝑧 ∗= 1.96
𝑛 ⋅ 10 = 75 ⋅ 10 = 750; 750 < 1300 𝑛 ⋅ 𝑝 = 75(.39) = 29.25; 𝑛 ⋅ (1 − 𝑝) = 75(.61) = 53.25
�̂� ± 𝑧 ∗ √𝑝(1−𝑝)
𝑛----> . 39 ± (1.96)√
(.39)(.61)
75; 0.39 ± .1104
We are 95% confident that the percent of students going to college or university after high school from this school lies between 28% and 50%.
Return to: Standards

NC Department of Public Instruction 23 NC Math 4 Unpacking Document (6/2020)
NC.M4.SP.2 Apply informal and formal statistical inference to make sense of, and make decisions in, meaningful real-world contexts. NC.M4.SP.2.3 Implement a one proportion z-test to determine if an observed proportion is significantly different from a hypothesized proportion.
Clarification Checking for Understanding
Hypothesis testing is the use of statistics to determine the probability that a given hypothesis is true. Students understand hypothesis testing as a formal statistical procedure for determining the true population parameter; in this case students will be determining the probability that a sample proportion is the true population proportion based on a one-proportion z-test. In order to fully understand the process of hypothesis testing, students should engage in the entire process and relate each step to the context of the problem. A basic process includes the following steps: Step 1: State the null and alternative hypotheses using symbols and in the context of the problem.
𝐻0: 𝑝 = 𝑝0
𝐻𝑎: 𝑝 ≠ 𝑝0or 𝐻𝑎: 𝑝 < 𝑝0 or 𝐻𝑎: 𝑝 > 𝑝0 Step 2: Verify the conditions of the inference procedure (one-proportion z-test).
If 𝑛𝑝0 ≥ 10and 𝑛(1 − 𝑝0) ≥ 10, then we can use the normal
distribution Step 3: Carry out the procedure by hand or using technology. Find the z-statistic and the corresponding p-value in the z-table.
𝑧 =�̂� − 𝑝0
√𝑝0(1 − 𝑝0)𝑛
Step 4: Interpret the results in the context of the problem; stating whether to reject or to fail to reject the null hypothesis. Measure statistical significance against a predetermined significance level (0.05 unless otherwise stated).
● If 𝑝 − 𝑣𝑎𝑙𝑢𝑒 ≤ 𝛼; reject H0: the difference between the proportions
is statistically significant.
● If 𝑝 − 𝑣𝑎𝑙𝑢𝑒 > 𝛼;fail to reject H0: the difference between the
proportions is NOT statistically significant.
Indicator: According the the CDC the relative frequency of males born in the U.S. is .512 (source: https://www.cdc.gov/nchs/data/nvsr/nvsr53/nvsr53_20.pdf) In a random sample of 200 babies born in North Carolina 120 were males.
a. Is this unusual? b. Is 120 out of 200 babies significantly different than the
proportion that the CDC reports? Answers:
a. �̂� = .60;This is not unusual because there can be a lot of variation in individual samples. b. S1: 𝐻0: 𝑝 = .512 (51.2% 𝑜𝑓 𝑏𝑎𝑏𝑖𝑒𝑠 𝑏𝑜𝑟𝑛 𝑖𝑛 𝑡ℎ𝑒 𝑈𝑆 𝑎𝑟𝑒 𝑚𝑎𝑙𝑒); 𝐻𝑎: 𝑝≠ .512 (𝑡ℎ𝑒 𝑝𝑒𝑟𝑐𝑒𝑛𝑡𝑎𝑔𝑒 𝑜𝑓 𝑚𝑎𝑙𝑒𝑠 𝑏𝑜𝑟𝑛 𝑖𝑛 𝑡ℎ𝑒 𝑈𝑆 𝑖𝑠 𝑠𝑜𝑚𝑒𝑡ℎ𝑖𝑛𝑔 𝑜𝑡ℎ𝑒𝑟 𝑡ℎ𝑎𝑛 51.2%) S2: 200(.512) = 102.4; 102.4 ≥ 10and 200(.488) = 97.6; 97.6 ≥ 10
S3: 𝑧 =.6−.512
√.6(.4)
200
=.088
.0346= 2.54; 𝑝 = .9945
S4: . 9945 ≥ .05so we fail to reject the null hypothesis; There is not enough evidence to say that the proportion of males born in the US is something different than what the CDC reports.
Return to: Standards

NC Department of Public Instruction 24 NC Math 4 Unpacking Document (6/2020)
NC.M4.SP.3 Apply probability distributions in making decisions in uncertainty. NC.M4.SP.3.1 Implement discrete probability distributions to model random phenomena and make decisions (e.g., expected value of playing a game, etc.).
Clarification Checking for Understanding
Discrete probability distributions are based on discrete random variables, where there is a finite number of possible outcomes. A discrete probability distribution lists each outcome and its associated probability. Students can create a probability distribution table listing each outcome and their probabilities. Students understand that a probability distribution can be used to find the expected value or average weighted outcome of discrete random variables. They also understand expected value in determining fairness of a game. A probability histogram is a graphical display that graphs each outcome on the horizontal axis and its probability on the vertical axis. For example, the probability histogram on the right represents the sum of the rolls of 2 six-sided dice and the probability of obtaining each sum. The probabilities in a discrete probability distribution should add to 1.
Indicator: The NC lottery has a game called pick 3 which involves picking three numbers in exact order. It costs a dollar to play and if you win you get $500. What is the expected value of playing this game many times in the long run? Is it a wise investment to play the NC pick 3 in the long run? Answer:
Possible Outcome -$1 +$499
Probability 999
1000
1
1000
Expected Value = −1(999
1000) + 499(
1
1000) = −0.50
In the long run, a player is expected to lose $0.50 per play. Since the expected value is less than zero, the game isn’t fair.
Return to: Standards
NC.M4.SP.3 Apply probability distributions in making decisions in uncertainty. NC.M4.SP.3.2 Implement the binomial distribution to model situations and make decisions.
Clarification Checking for Understanding
Students understand the four main criteria for a binomial setting: 1. A fixed number of observations, n. 2. Each observation (n) is independent. 3. Each observation falls into one of two possible categories, known
as success or failure. 4. The probability of success (p) is the same for each observation.
Students also understand that the distribution of the count of X successes
in the binomial setting is called the binomial distribution with parameters n
Indicator: A test has 10 multiple choice questions each of which has four choices and only one right answer. A student decides to use a spinner with four equivalent sectors on it to randomly choose which answer to pick for each question. What is the likelihood the students gets the following number of questions correct:
a. 5 b. 10 c. At least 5 d. No more than 2 e. Between 7 and 9, inclusive

NC Department of Public Instruction 25 NC Math 4 Unpacking Document (6/2020)
and p where n represents the number of observations and p represents
the probability of success; abbreviated as 𝑋 is 𝐵(𝑛, 𝑝). Students understand that when n is large, the distribution of X is
normal,𝑁(𝑛𝑝, √𝑛𝑝(1 − 𝑝))and the normal approximation can be used
when n and p satisfy the following conditions: 1) 𝑛𝑝 ≥ 10and 𝑛(1 − 𝑝) ≥10. *Technology use is at the discretion of the teacher.
Answers: a. 0.058, b. 0.0000009, c. 0.078, d. 0.244, e. 0.0035
Return to: Standards
NC.M4.SP.3 Apply probability distributions in making decisions in uncertainty. NC.M4.SP.3.3 Recognize from simulations of sampling distributions of sample means and proportions that a normal distribution can be used as an
approximate model in certain situations.
Clarification Checking for Understanding
Students understand that a sampling distribution is a graphical display of a
𝜇statistic for sample data. They also understand that the sampling
distribution is a probability distribution that is obtained from the collection of a large number of samples of the same size. It represents a wide range of possible outcomes of a statistic for a given population. Students understand that there is less variability in larger sample sizes than in smaller sample sizes (less than 30). So, the sampling distribution becomes more like the normal distribution as sample size increases and more samples are drawn. Students understand that they can use the normal approximation
𝑁(𝑝, √𝑝(1−𝑝)
𝑛) for the probability distribution of sample proportions when:
1) The population is at least 10 times as larger as the sample 2) 𝑛𝑝 > 10and 𝑛(1 − 𝑝) > 10
Students understand that they can use the normal approximation
𝑁(𝜇,𝜎
√𝑛) for the probability distribution of sample means when the
population is at least 10 times as larger as the sample
Indicator: In a recent NPR/Ipsos poll of 1,007 U.S. adults conducted March 21-22, 2019 “78% of Americans support schools teaching about climate change” (source:https://www.ipsos.com/en-us/news-polls/four-five-parents-want-schools-teach-about-climate-change-04-22-2019).
a. How could you simulate a sampling distribution of sample proportions based on this information?
b. If we assume this sample is representative of the people of the United States, what probability distribution could be used to approximate the sampling distribution?
c. Discuss what information you are relying on to make this conclusion.
Answers: a. Collect 100 samples of n=50 and create a sampling distribution of the sample proportions and estimate the center, shape, and spread of the sampling distribution. b. A normal distribution with a mean 𝑢𝑝 = .78and
standard deviation 𝜎�̂� = √𝑝(1−𝑝)
𝑛= .013; c. The a US population is larger
than 10,070 and 1007(.78) ≥ 10 𝑎𝑛𝑑 1007(.22) ≥ 10. So, the normal approximation can be used.
Return to: Standards

NC Department of Public Instruction 26 NC Math 4 Unpacking Document (6/2020)
NC.M4.SP.3 Apply probability distributions in making decisions in uncertainty. NC.M4.SP.3.4 Implement the normal distribution as a probability distribution to determine the likelihood of events occurring.
Clarification Checking for Understanding
Students know when it is appropriate to use the normal distribution and how to determine probabilities using the normal distribution. They also know how to find an observation from a given probability based on an assumption of the normal distribution. Students understand that the normal curve is a density curve, where the area under the curve is exactly one and above the horizontal axis. Students understand the empirical (68-95-99.7) rule and how it applies to the normal curve. Students know that the standard normal distribution 𝑁(𝜇, 𝜎)has mean,
𝜇,and standard deviation, 𝜎.
Students understand z-scores and know how to find the standardized
value of x using 𝑧 =𝑥−𝜇
𝜎, where z represents the distance that a value is
from the mean, 𝜇, in standard deviation, 𝜎, units.
Indicator: During the production of a new part for a turbine, parts must be tested and assessed for quality control. The mean of this new part should be 1.4 cm with a standard deviation of 0.006 cm.
a. What is the probability that one of the new parts produced will be over 1.412 cm long?
b. What is the probability that one of the new parts produced will be under 1.395 cm long?
Answers: a. 0.025, b. 0.2023
Return to: Standards