nbs-m016 contemporary issues in climate change and energy 2010
DESCRIPTION
N.K. Tovey ( 杜伟贤 ) M.A, PhD, CEng, MICE, CEnv Н.К.Тови М.А., д-р технических наук Energy Science Director C Red Project HSBC Director of Low Carbon Innovation. Section 8. Section 7. Section 5. Section 9. NBS-M016 Contemporary Issues in Climate Change and Energy 2010. - PowerPoint PPT PresentationTRANSCRIPT

1
NBS-M016 Contemporary Issues in Climate Change and Energy
2010
4. POTENTIAL OF ENERGY RESOURCES
N.K. Tovey (杜伟贤 ) M.A, PhD, CEng, MICE, CEnv
Н.К.Тови М.А., д-р технических наук
Energy Science Director CRed Project
HSBC Director of Low Carbon InnovationSection 5 Section 7 Section 8 Section 9

2
4. POTENTIAL OF ENERGY RESOURCES
4.1. CURRENT AND PROJECTED USAGE
Projected Saturation Population in 2050 -- 10000 M consumption averages current UK value Requirement in 2050 = 50 TW i.e. 5 x 10¹³ W.consumption reaches current USA value Requirement in 2050 = 100 TW
i.e. 10 times current demand
Range of forecasts 20 - 100 TW with a likely valuein range 30 - 50 TW (say 40 TW).
Country Energy Requirement
Population Per Capita
World 12.0 TW 6000 M 2.0 kW
USA 3.0 TW 300 M 10.0 kW
Europe 2.0 TW 350 M 5.7 kW
UK 0.3 TW 60 M 5.0 kW

3
4.2 PROJECTED LIFESPAN OF RESOURCES
decades:- centuries: millennia:
projected average consumption of 40 TW annual consumption will be:- 1.25 x 10²¹ J
Compare this to the Current World Proven Reserves:-
Oil Reserves:- 5 x 10²¹ J Gas Reserves:- 4 x 10²¹ J Uranium:- 1 x 10²¹ J Coal Reserves:- 2.6 x 10²² J Uranium (Fast Breeder):- 1 x 10²³ J Fusion (Deuterium):- 1 x 1030 J
D – D fusionCoal,Geothermal, D – T fusion, 232Th
235U, Tar sands,238U,
Oil ShalesOil, Gas,

4
4.3 "RENEWABLE ENERGY RESOURCES"
Orders of magnitude only
Practically Achievable:-
1010 - Tidal (i.e. 1 x 10¹⁰ to 1 x 10¹¹)
1011 - Geothermal; OTEC; Biomass; Wastes
1012 - Hydro; Wind; Waves
1013 – Solar
Projected demand is 40 TW – 4 x 10¹³ W

5
4. POTENTIAL OF ENERGY RESOURCES
Theoretical Practical Realised to date
TW GW GW
NON-SOLAR
Tidal 3 50 1 France, Russia, China
6
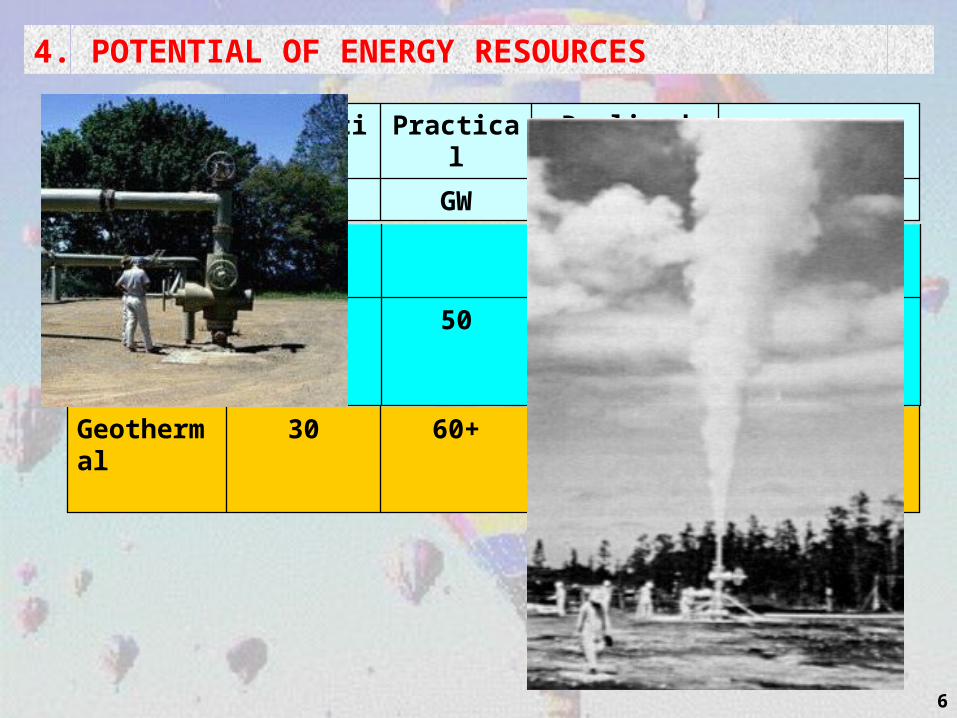
4. POTENTIAL OF ENERGY RESOURCES
GWGWTW
Realised to date
PracticalTheoretical
France, Russia, China
1503Tidal
NON-SOLAR
Italy, Iceland, USA, New Zealand
1060+30Geothermal

7
4. POTENTIAL OF ENERGY RESOURCES
GWGWTW
Realised to date
PracticalTheoretical
France, Russia, China
1503Tidal
NON-SOLAR
Italy, Iceland, USA, New Zealand
1060+30Geothermal
USA, Israel: third world
1.8 electrical 0.2 Active Solar
3000030000(on land)
SOLAR Direct

8
4. POTENTIAL OF ENERGY RESOURCES
Normal hot water circuit
Solar Circuit
Solar Pump

9
Solar Gain (kWh/day)
0
1
2
3
4
5
6
7
8
9
10 20 30 9 19 29 8 18 28 10 20 30 9 19 29 9 19 29 8 18 28 8 18 28 7 17 27 6 16 26 6 16 26 5 15 25 5 15 1 11 21 31 10
Day of Month
Solar
Gain
(kW
h)
December JanuaryFebruary MarchApril MayJune JulyAugust SeptemberOctober NovemberDecember
Solar Hot Water
0
0.5
1
1.5
2
2.5
3
3.5
4
4.5
5
Dec Jan Feb Mar Apr May Jun Jul Aug Sep Oct Nov
kWh
/ d
ay
2006 - 07
2007 - 08
4. POTENTIAL OF ENERGY RESOURCES

10
4. POTENTIAL OF ENERGY RESOURCES - Solar
House in Lerwick, Shetland Isles
- less than 15,000 people live north of this in UK!
It is all very well for South East, but what about the North?
11
4. POTENTIAL OF ENERGY RESOURCES
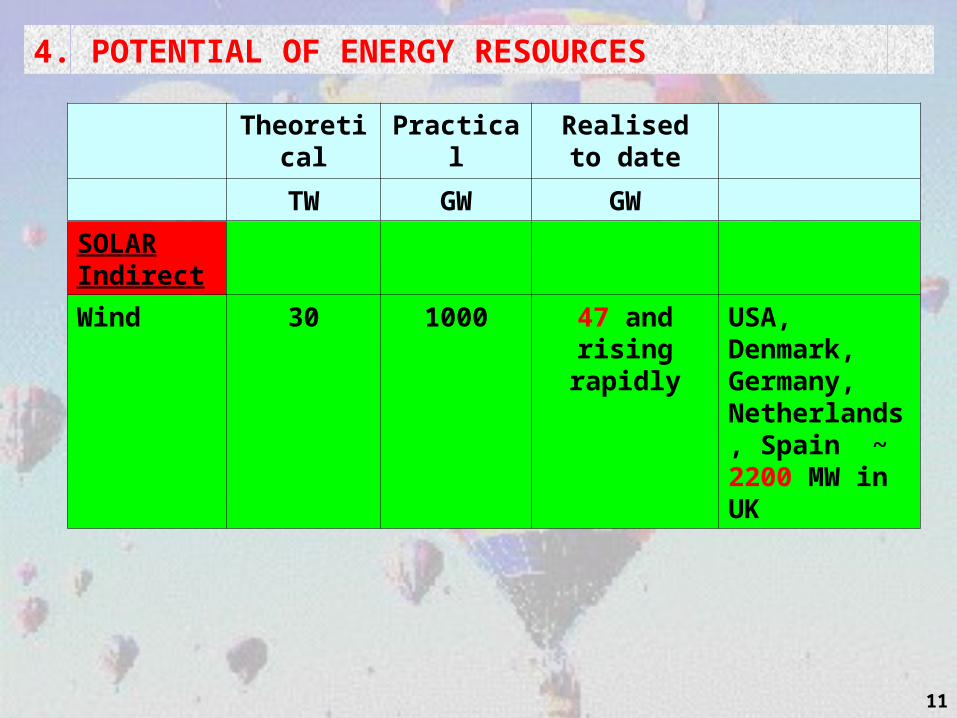
Theoretical Practical Realised to date
TW GW GW
SOLAR Indirect
Wind 30 1000 47 and rising rapidly
USA, Denmark, Germany, Netherlands, Spain ~ 2200 MW in UK

12
4. POTENTIAL OF ENERGY RESOURCES

13
4. POTENTIAL OF ENERGY RESOURCES
GWGWTW
Realised to date
PracticalTheoretical
USA, Denmark, Germany, Netherlands, Spain ~ 2200MW in UK
47 and rising rapidly
100030Wind
SOLAR Indirect
14
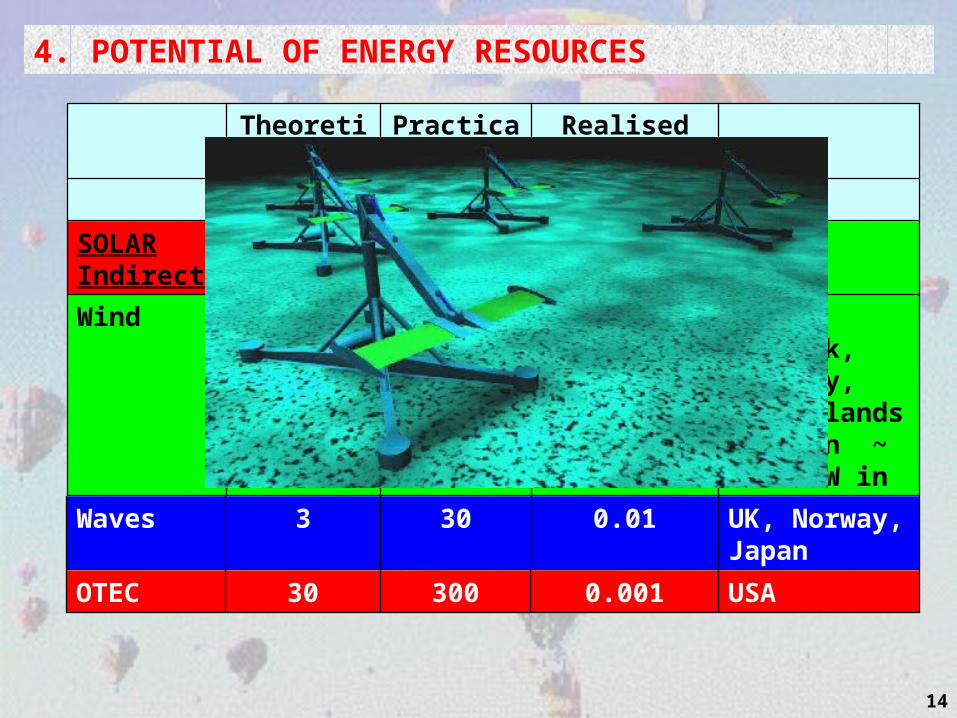
4. POTENTIAL OF ENERGY RESOURCES
GWGWTW
Realised to date
PracticalTheoretical
USA, Denmark, Germany, Netherlands, Spain ~ 3000 MW in UK
63 and rising rapidly
100030Wind
SOLAR Indirect
UK, Norway, Japan
0.01303Waves
USA0.00130030OTEC
15
4. POTENTIAL OF ENERGY RESOURCES
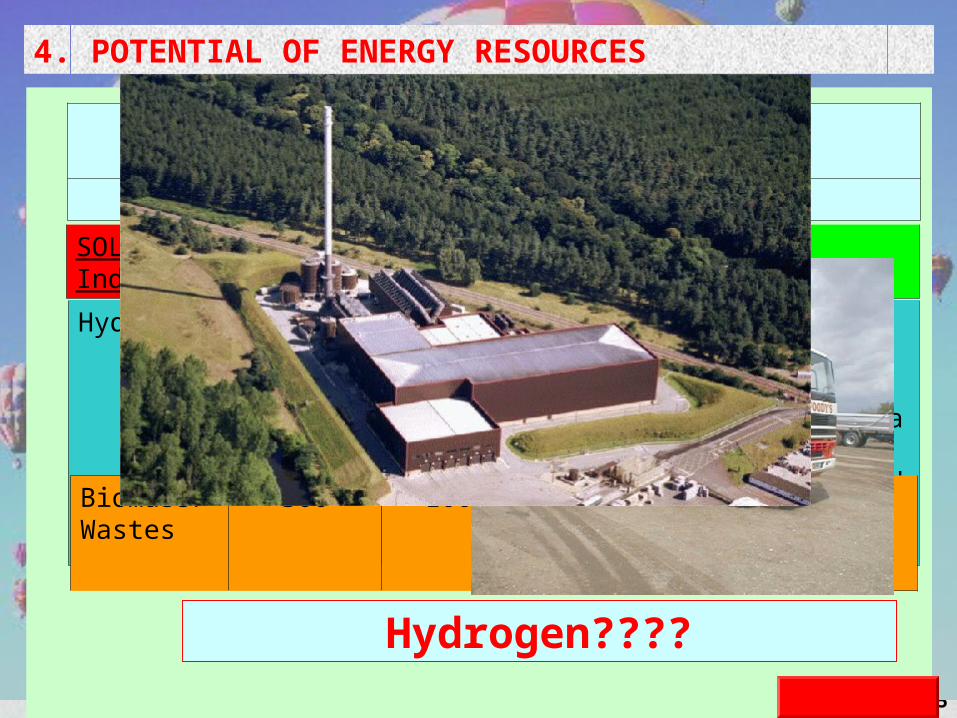
Theoretical Practical Realised to date
TW GW GW
Hydro 30+ 2000 400 USA, Brazil, Canada, Scandinavia, Switzerland, Malaysia etc.
Biomass/ Wastes
300 1000 10-100? Various
Brazil - Bioethanol
SOLAR Indirect
Hydrogen????

16
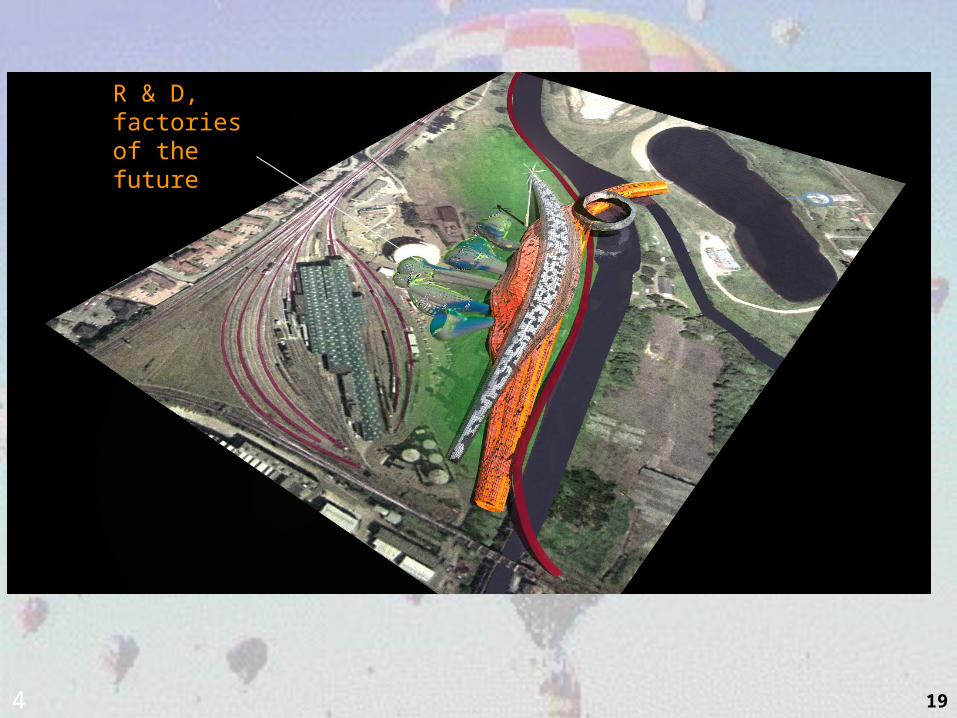
The Star of the East

173
country park
Approx 1km
International Airport

182
energy station
floating farmers market
river walk & quay
(proposed residential development)
turbine viewing & display gallery
194
R & D, factories of the future

205
(country park)interactive
learning centreworking environmental organisations
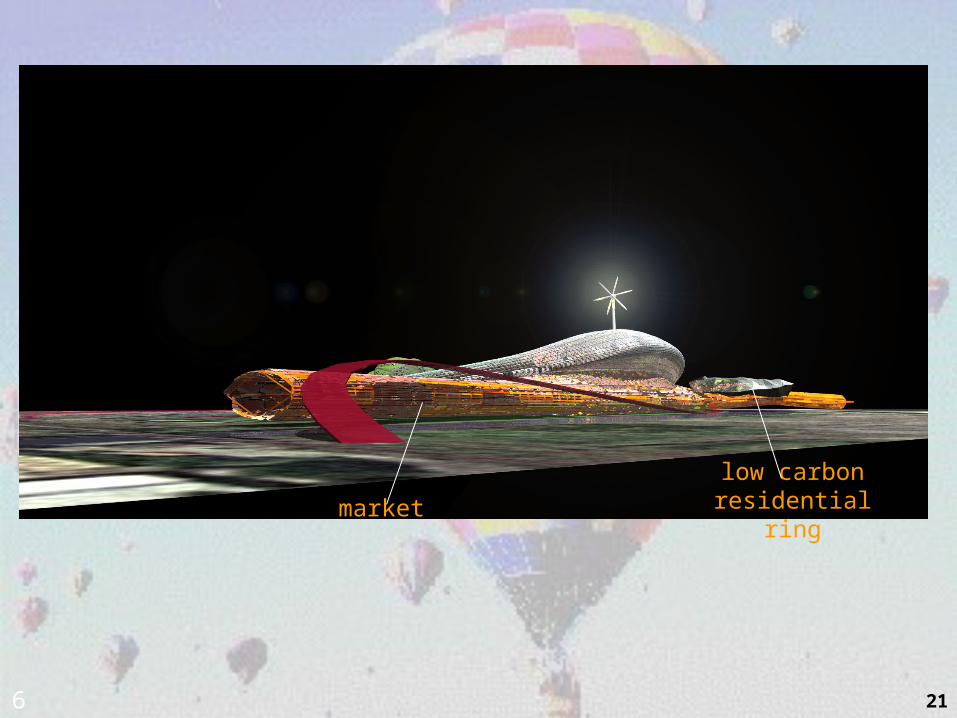
216
market
low carbon residential ring

22
Star of the East
Alsop Architects

23
View from Thorpe Station
The STAR will be 50% higher than the pylons which will be demolished

24
5. CONSERVATION - BARRIERS
ENV-M558 Contemporary Issues in Climate Change and Energy
2009
N.K. Tovey (杜伟贤 ) M.A, PhD, CEng, MICE, CEnv
Н.К.Тови М.А., д-р технических наук
Energy Science Director CRed Project
HSBC Director of Low Carbon Innovation
25
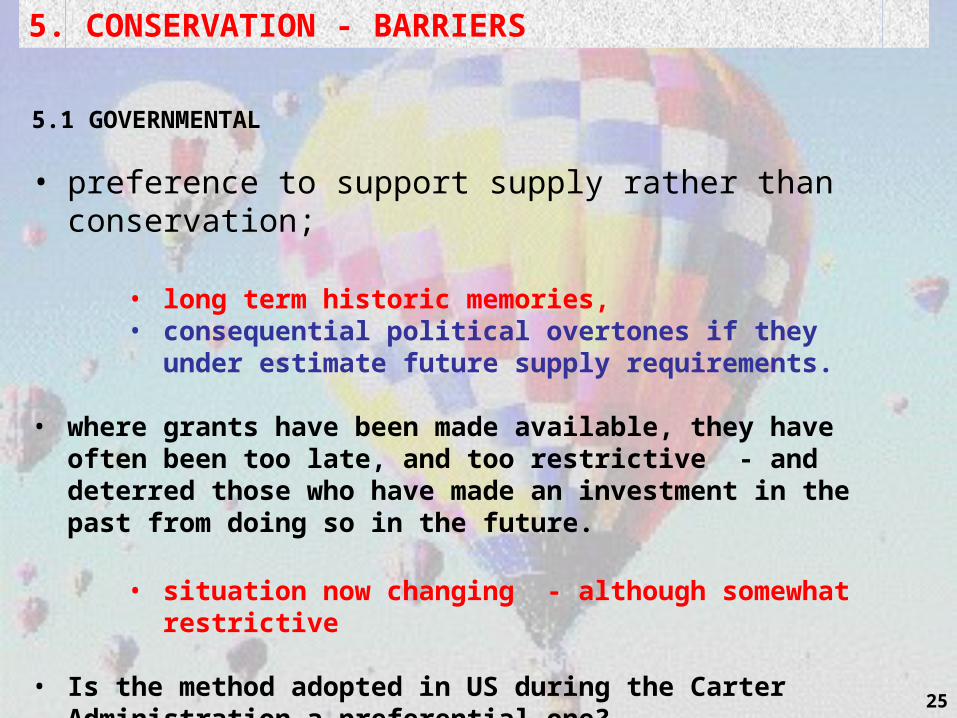
5. CONSERVATION - BARRIERS
5.1 GOVERNMENTAL
• preference to support supply rather than conservation;
• long term historic memories, • consequential political overtones if they under estimate
future supply requirements.
• where grants have been made available, they have often been too late, and too restrictive - and deterred those who have made an investment in the past from doing so in the future.
• situation now changing - although somewhat restrictive
• Is the method adopted in US during the Carter Administration a preferential one?

26
5.1 GOVERNMENTAL BARRIERS
• lack of / or inadequate legislation to promote conservation (2006
Building Regulations do address some issues, but they are too late and there are still loop holes - so encourages minimum compliance rather than promoting conservation.)
• delays in decision making favour supply rather than conservation
• reluctance at Local Government Level to implement tougher measures - e.g. Building Industry who argue against such measures - Exceptions:- Southampton City Council; Milton Keynes.
• reluctance to promote strategies which could cost Government votes at next election (e.g. higher taxation on petrol etc.) - many measures take a period longer than lifetime of Government to become effective.
• enactment of legislation which is has loose or incorrect wording:- 1947 Electricity Act in UK. Conservation Bill in US in 1979.

27
5.2 VESTED INTERESTS
• manufacturing industries continuing to promote out of date products and/or energy wasteful products - or to give Pseudo-Conservation Information.
• retailers promoting products on the capital outlay, or other attributes, and not energy consumption.
• competition between supply industries leads them to promote their products which may not always be the most energy conserving - e.g. off peak heating with electricity. [less of a problem these days]
• scheduling of TV programs
• cowboy firms making unsubstantiated claims.
• preference to view Energy Conservation in terms of MONETARY saving rather than Resource saving.
28
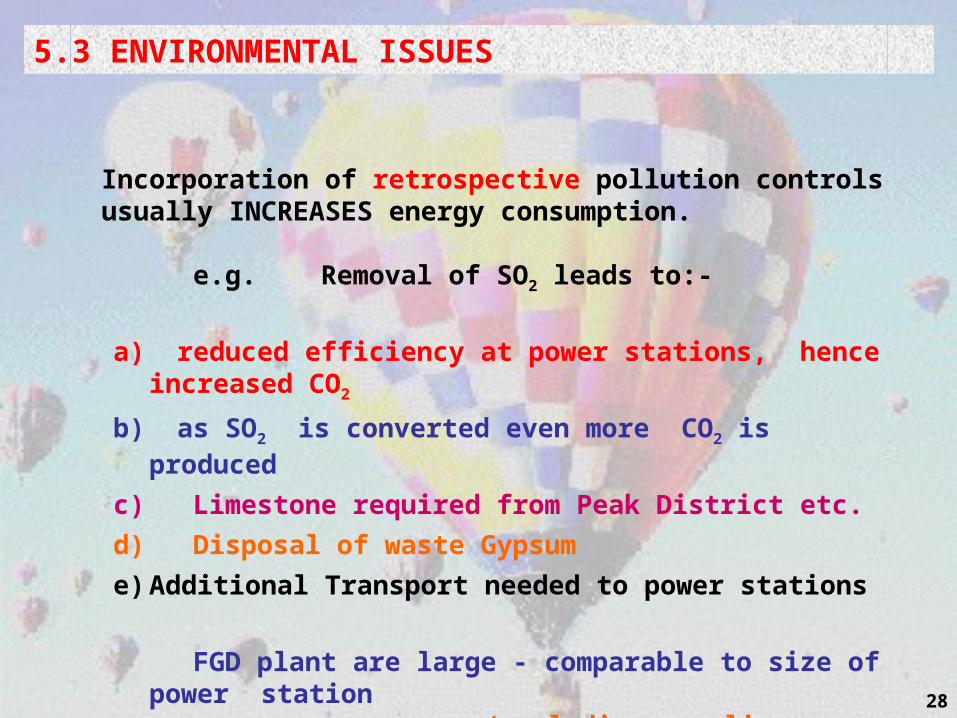
5.3 ENVIRONMENTAL ISSUES
Incorporation of retrospective pollution controls usually INCREASES energy consumption.
e.g. Removal of SO2 leads to:-
a) reduced efficiency at power stations, hence increased CO2
b) as SO2 is converted even more CO2 is produced
c) Limestone required from Peak District etc.
d) Disposal of waste Gypsum
e) Additional Transport needed to power stations
FGD plant are large - comparable to size of power station (excluding cooling towers).

29
5. CONSERVATION - DIFFICULTIES
5.4 PHYSICAL LIMITATIONS
• laws of thermodynamics limit efficiency of energy conversion.• climate affects energy consumption• geological resources in a country will affect utilisation of energy. e.g. it makes sense to use electricity for heating in Norway which has abundant hydro-electricity, but not in UK.
5.5 TECHNICAL PROBLEMS
• old buildings/appliances which have a long life so improvements in energy efficiency will take time to become effective.
• difficulty in making perfect machine
• difficulty in achieving high insulation standards in brick built buildings

30
5.6 SOCIAL ATTITUDES
• desire for greater thermal comfort. Comfort temperatures have risen over last 30 years.
• desire for greater mobility.
• desire for smaller households in larger and individual buildings (unlike many other European Countries).
• come to depend on reliability of energy supply (contrast situation in late 50's).
• purchasing larger and more energy wasteful appliances -e.g. tumbler dryers, freezers etc.
• disregarding notices/adverts designed to promote energy conservation.
• short memories - previous high costs of energy are forgotten when energy becomes cheap.
• sliding back into old habits.• energy conservation not often seen as important as direct
investment even when the returns are much greater. • decisions made on impulse with little regard to energy used.

31
The Behavioural Dimension
Electricity Consumption
0
200
400
600
800
1000
1200
0 1 2 3 4 5 6 7No. people
Ave
rage
kW
h/m
onth
• Household size has little impact on electricity consumption.
• Consumption varies by up to a factor of 9 for any given household size.
• Allowing for Income still shows a range of 6 or more.
• Education/Awareness is important
32
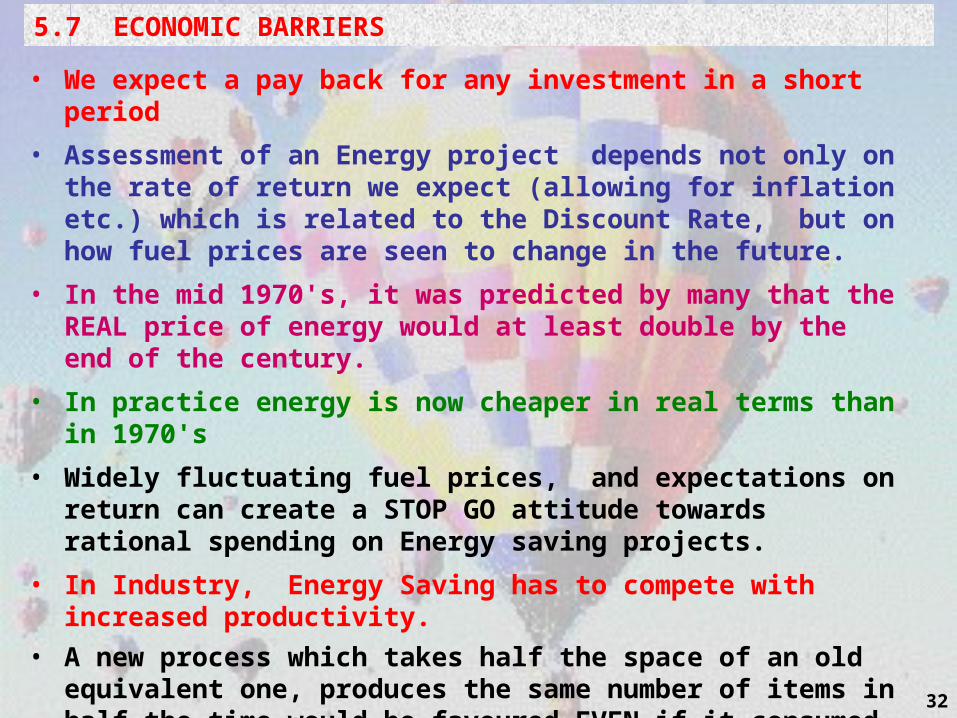
5.7 ECONOMIC BARRIERS
• We expect a pay back for any investment in a short period
• Assessment of an Energy project depends not only on the rate of return we expect (allowing for inflation etc.) which is related to the Discount Rate, but on how fuel prices are seen to change in the future.
• In the mid 1970's, it was predicted by many that the REAL price of energy would at least double by the end of the century.
• In practice energy is now cheaper in real terms than in 1970's
• Widely fluctuating fuel prices, and expectations on return can create a STOP GO attitude towards rational spending on Energy saving projects.
• In Industry, Energy Saving has to compete with increased productivity.
• A new process which takes half the space of an old equivalent one, produces the same number of items in half the time would be favoured EVEN if it consumed 50-100% more in Energy (as labour costs would be reduced and profits increased because the price of Energy is TOO LOW).

33
5.7 ECONOMIC BARRIERS
• The choice of a particular Discount Rate will load the dice in favour of a particular option if only Economics is used in decision making EVEN IF EXTERNAL ENVIRONMENTAL COSTS ARE INCLUDED.
Fig. 5.1 Effect of Discount Rate on Economic Viability of Energy Projects
High Discount Rates favour Coal
Medium Discount Rates favour Nuclear
Low/zero/negative Discount Rates favour Conservation and Renewables
Discount Rate
Present Value
+ve-ve Ca
pit
al C
ost
s
coal
coal
nuclear
nuclear
Renewables/conservation
34
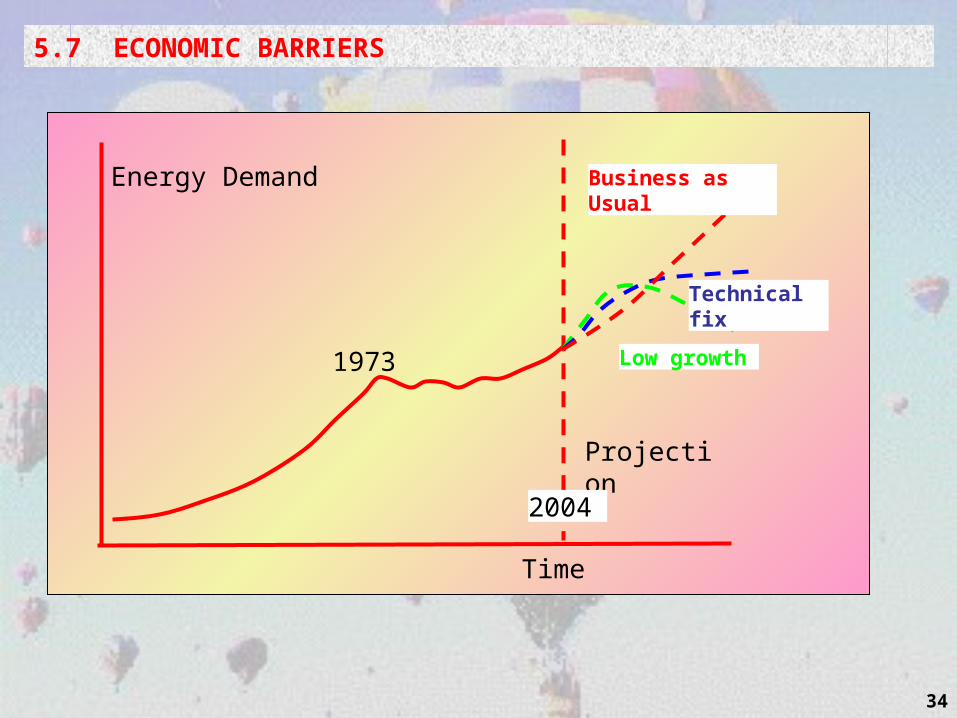
5.7 ECONOMIC BARRIERS
Time
Energy Demand
Projection
1973
2004
Low growth
Technical fix
Business as Usual

35
7. Conservation Possibilities
NBS-M016 Contemporary Issues in Climate Change and Energy
2010
N.K. Tovey (杜伟贤 ) M.A, PhD, CEng, MICE, CEnv
Н.К.Тови М.А., д-р технических наук
Energy Science Director CRed Project
HSBC Director of Low Carbon Innovation

36
7. CONSERVATION POSSIBILITIES.
Technical Education Energy Management
Technical Measures will have limited impact on energy consumption if people are not educated to use energy wisely.
Energy Management is a key aspect in energy conservation
A good Energy Manager will:-
Assess Energy Demand - record keeping
Analyse Energy Demand - examine trends relating to physical factors
Advise on technical and other methods to promote energy conservation
Advertise and publicise ways to save energy
Account for energy consumed

37
Significant saving are possible by reducing waste in conversion of energy to secondary fuels.
Significant savings are possible in some area in end use appliance efficiency - e.g. low energy light bulbs.
Effective Energy Conservation and Environmental Legislation may well see a rise in electricity consumption in the short term.
promotion of heat pumps - require electricity
industry switching to more efficient electrically driven processes. e.g. Case Hardening
move towards electric cars.?????
Hydrogen???????
7. CONSERVATION POSSIBILITIES.

38
• Energy Conservation requires innovative “joined-up” thinking.
• Some of the best ideas come from individuals.
• What do you see as possibilities?
• Would a move to Hydrogen powered vehicles be viable in foreseeable future?
• What are the problems?
7. CONSERVATION POSSIBILITIES.
39
8. UK Energy Consumption
Maxine Narburgh
CSERGE
NBS-M016 Contemporary Issues in Climate Change and Energy
2010
N.K. Tovey (杜伟贤 ) M.A, PhD, CEng, MICE, CEnv
Н.К.Тови М.А., д-р технических наук
Energy Science Director CRed Project
HSBC Director of Low Carbon Innovation

Kung Hei Fat Choi !Kung Hei Fat Choi !
Gong Xi Fa Cai !Gong Xi Fa Cai !

41
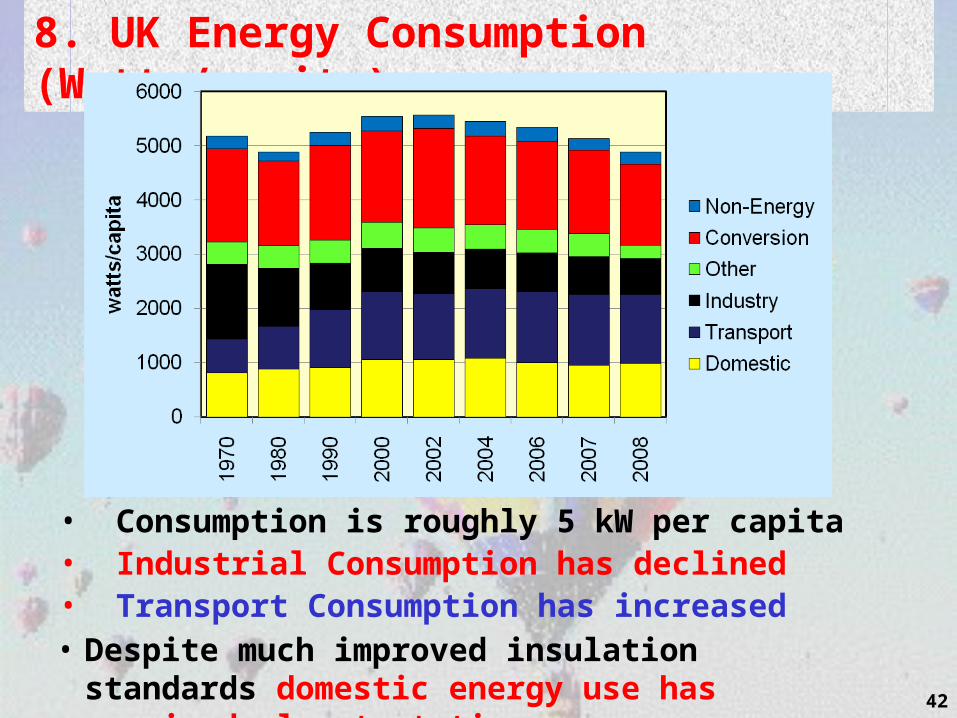
Per Capita Consumption in Watts ~ 5 kW
8. UK Energy Consumption
The recent reductions are not as dramatic as appear above as total population has increased by 2.1 million since 2000
1970 1980 1990 2000 2002 2004 2006 2007 2008
Domestic 816 882 902 1056 1060 1078 998 958 987
Transport 623 786 1076 1250 1207 1282 1310 1302 1272
Industry 1379 1069 855 797 769 735 713 690 662
Other 411 414 425 486 442 450 436 421 390
Conversion 1712 1565 1745 1680 1844 1635 1629 1549 1503
Total 4942 4716 5004 5270 5321 5180 5086 4921 4814
Non-Energy 240 165 249 277 241 270 261 212 220
42
8. UK Energy Consumption (Watts/capita)
• Consumption is roughly 5 kW per capita• Industrial Consumption has declined• Transport Consumption has increased• Despite much improved insulation standards
domestic energy use has remained almost static
43
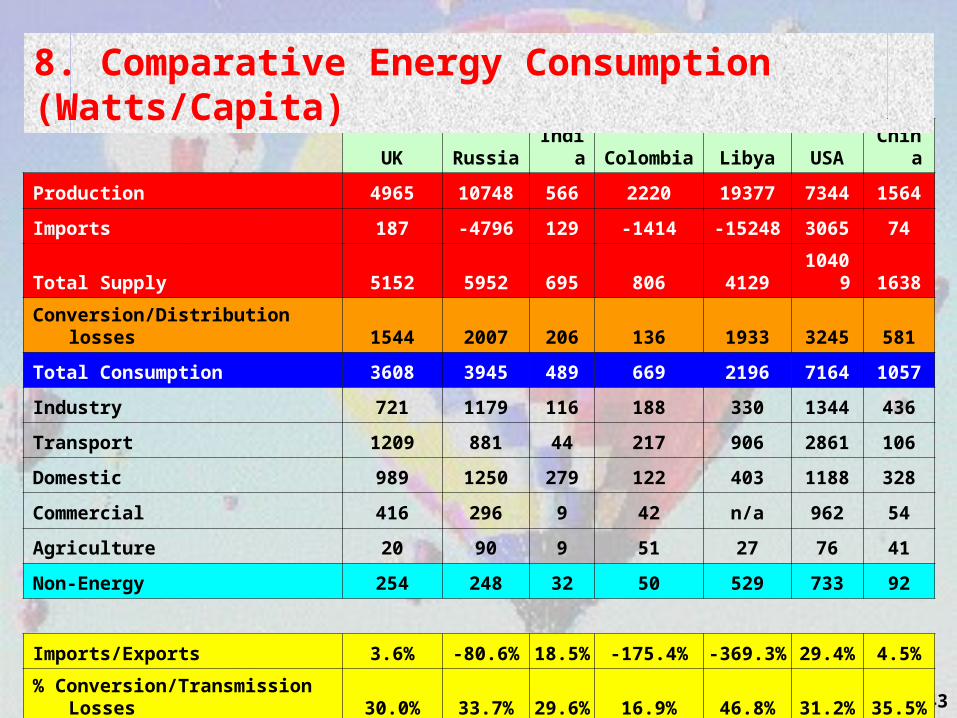
UK Russia India Colombia Libya USA China
Production 4965 10748 566 2220 19377 7344 1564
Imports 187 -4796 129 -1414 -15248 3065 74
Total Supply 5152 5952 695 806 4129 10409 1638
Conversion/Distribution losses 1544 2007 206 136 1933 3245 581
Total Consumption 3608 3945 489 669 2196 7164 1057
Industry 721 1179 116 188 330 1344 436
Transport 1209 881 44 217 906 2861 106
Domestic 989 1250 279 122 403 1188 328
Commercial 416 296 9 42 n/a 962 54
Agriculture 20 90 9 51 27 76 41
Non-Energy 254 248 32 50 529 733 92
Imports/Exports 3.6% -80.6% 18.5% -175.4% -369.3% 29.4% 4.5%
% Conversion/Transmission Losses 30.0% 33.7% 29.6% 16.9% 46.8% 31.2% 35.5%
8. Comparative Energy Consumption (Watts/Capita)

44
9. Generation of Electricity
Maxine Narburgh
CSERGE
NBS-M016 Contemporary Issues in Climate Change and Energy
2010
N.K. Tovey (杜伟贤 ) M.A, PhD, CEng, MICE, CEnv
Н.К.Тови М.А., д-р технических наук
Energy Science Director CRed Project
HSBC Director of Low Carbon Innovation
45
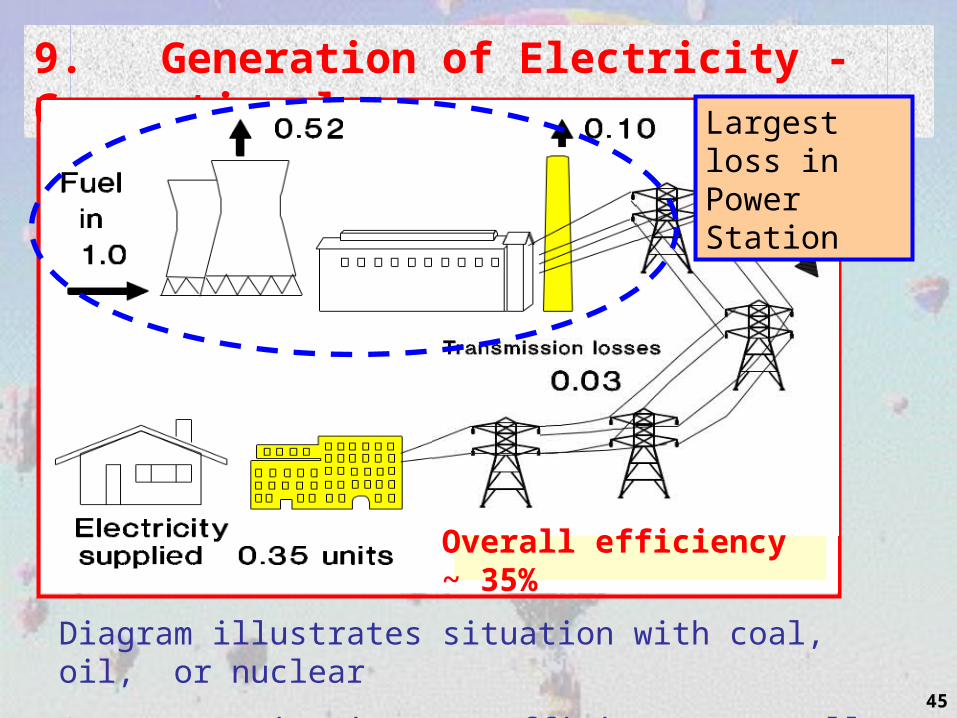
9. Generation of Electricity - Conventional
Diagram illustrates situation with coal, oil, or nuclear
Gas Generation is more efficient - overall ~ 45%
Overall efficiency ~ 35%
Largest loss in Power Station
46
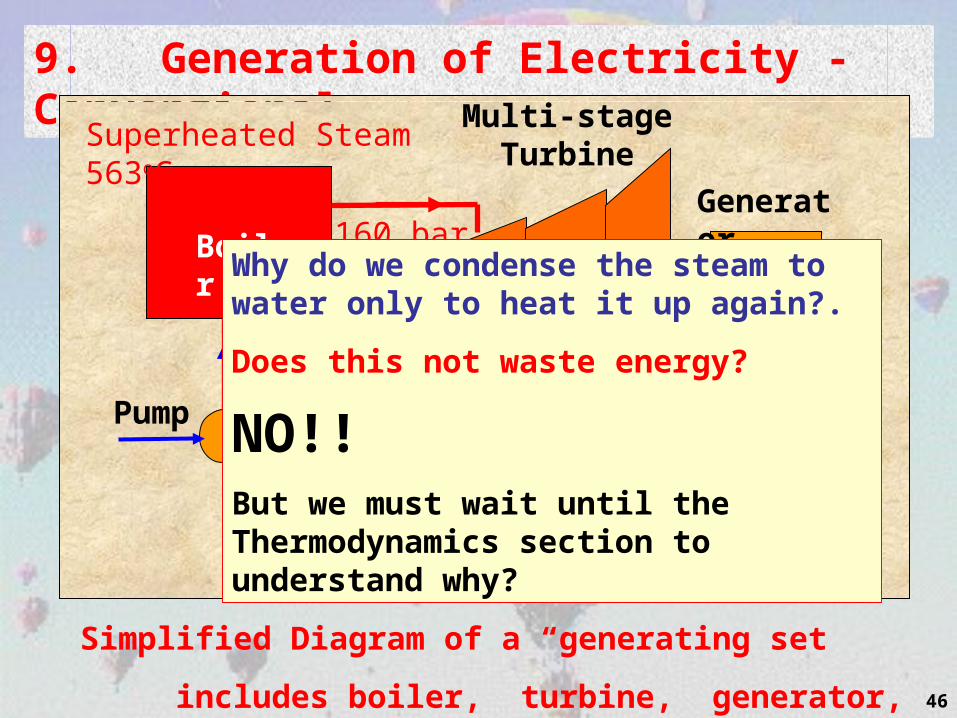
9. Generation of Electricity - Conventional.
Pump
Multi-stage Turbine
Generator
Boiler
Condenser
Simplified Diagram of a “generating set”
includes boiler, turbine, generator, and condenser
Superheated Steam 563oC 160 bar
Steam at ~ 0.03 bar
Why do we condense the steam to water only to heat it up again?.
Does this not waste energy?
NO!!
But we must wait until the Thermodynamics section to understand why?
47
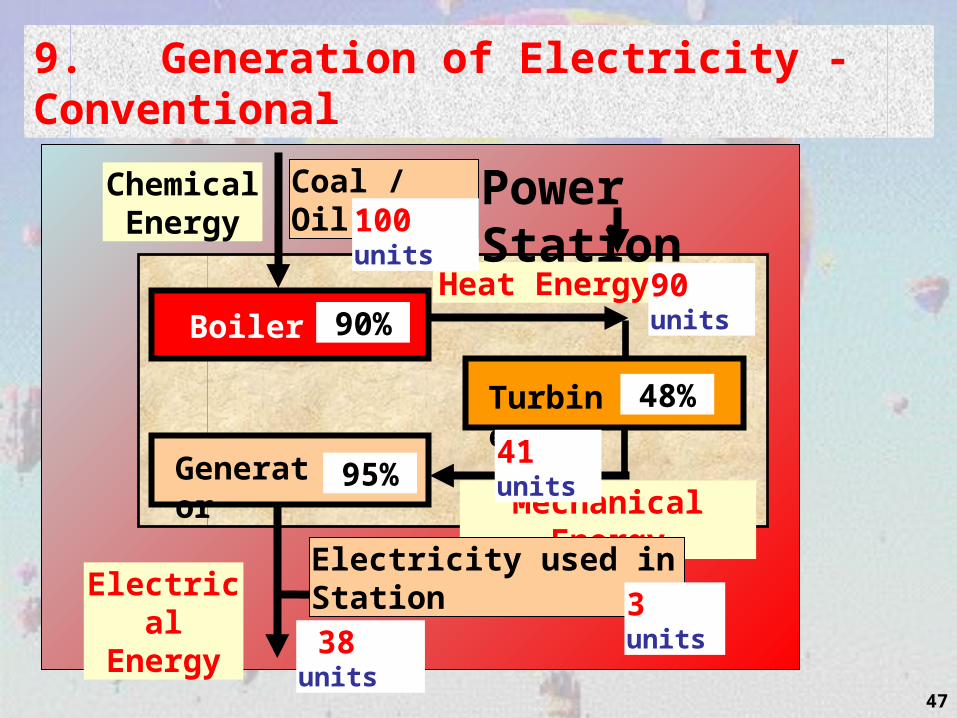
9. Generation of Electricity - Conventional
Chemical Energy
Coal / Oil / Gas
Electrical Energy
Heat EnergyBoiler
Turbine
GeneratorMechanical Energy
Electricity used in Station
Power Station100 units
38 units
90 units
3 units
90%
95%
48%
41 units
48
Why not use the heat from power station? - it is typically at 30oC?
Too cold for space heating as radiators must be operated ~ 60+oC
What about fish farming - tomato growing?
- Yes, but this only represent about 0.005% of heat output.
Problem is that if we increase the output temperature of the heat from the power station we get less electricity.
Does this matter if overall energy supply is increased?
9. Generation of Electricity - Conventional.

49
9. Generation of Electricity - CHP
Overall Efficiency - 73%
•Heat is rejected at ~ 90oC for supply to heat buildings.
•City Wide schemes are common in Eastern Europe
50
1947 Electricity Act blinked our approach for 35 years into attempting to get as much electricity from fuel rather than as much energy.
Since Privatisation, opportunities for CHP have increased
on an individual complex basis (e.g. UEA), unlike Russia
A problem: need to always reject heat.
What happens in summer when heating is not required?
Need to understand basic thermodynamics
9. Generation of Electricity - Conventional.