nber working paper series the decline of … decline of the independent inventor: a schumpterian...
TRANSCRIPT
NBER WORKING PAPER SERIES
THE DECLINE OF THE INDEPENDENTINVENTOR: A SCHUMPTERIAN STORY
Naomi R. LamoreauxKenneth L. Sokoloff
Working Paper 11654http://www.nber.org/papers/w11654
NATIONAL BUREAU OF ECONOMIC RESEARCH1050 Massachusetts Avenue
Cambridge, MA 02138September 2005
We would like to express our appreciation to our research assistants Marigee Bacolod, Young-Nahn Baek,Dalit Baranoff, Lisa Boehmer, Nancy Cole, Yael Elad, Svjetlana Gacinovic, Brian Houghton, Anna MariaLagiss, Huagang Li, Catherine Truong Ly, Homan Dayani, Gina Franco, Charles Kaljian, David MaderoSuarez, John Majewski, Yolanda McDonough Summerhill, Brian Rivera, Ludmila Skulkina, DhanoosSutthiphisal, Matthew Wiswall, and Tamara Zavaliyenko. We are also indebted to Zorina Khan for hercollaboration with us in collecting the great inventor data sets and for her invaluable advice, as well as toMarjorie Ciarlante and Carolyn Cooper for their help in accessing the records of the Patent Office at theNational Archives. We have also benefited from discussions with Robert Allen, Ashish Arora, Sally Clarke,Iain Cockburn, Wes Cohen, Paul David, Stanley Engerman, Joseph Ferrie, Catherine Fisk, Avner Greif,Louis Galambos, Timothy Guinnane, Stephen Haber, Rebecca Henderson, David Hounshell, Thomas P.Hughes, Adam Jaffe, Margaret Jacob, Margaret Levenstein, Josh Lerner, Joel Mokyr, Ariel Pakes, DanielRaff, Jean-Laurent Rosenthal, Bhaven Sampat, Suzanne Scotchmer, John Kenly Smith, Jr., Scott Stern,William Summerhill, Peter Temin, Ross Thomson, Manuel Trajtenberg, Steven Usselman, MichaelWaldman, John Wallis, Norton Wise, Gavin Wright, Mary Yeager, and participants in seminar presentationsat the Washington Area Seminar in Economic History, Harvard University, Northwestern University, OxfordUniversity, Stanford University, and Yale University, at meetings of the Economic History Association andthe NBER's Entrepreneurship Group, and, of course, at the Loufest Conference. We gratefully acknowledgethe financial support we have received for this research from the National Science Foundation, as well asfrom All Souls College at Oxford University, the Russell Sage Foundation, the Social Science ResearchCouncil, and the Collins Endowment and the Academic Senate at the University of California, Los Angeles.The views expressed herein are those of the author(s) and do not necessarily reflect the views of the NationalBureau of Economic Research.
©2005 by Naomi R. Lamoreaux and Kenneth L. Sokoloff. All rights reserved. Short sections of text, not toexceed two paragraphs, may be quoted without explicit permission provided that full credit, including ©notice, is given to the source.

The Decline of the Independent Inventor: A Schumpterian Story?Naomi R. Lamoreaux and Kenneth L. SokoloffNBER Working Paper No. 11654September 2005JEL No. N, O
ABSTRACT
Joseph Schumpeter argued in Capitalism, Socialism and Democracy that the rise of large firms’
investments in in-house R&D spelled the doom of the entrepreneurial innovator. We explore thisidea by analyzing the career patterns of successive cohorts of highly productive inventors from thelate nineteenth and early twentieth centuries. We find that over time highly productive inventorswere increasingly likely to form long-term attachments with firms. In the Northeast, theseattachments seem to have taken the form of employment positions within large firms, but in theMidwest inventors were more likely to become principals in firms bearing their names.Entrepreneurship, therefore, was by no means dead, but the increasing capital requirements—bothfinancial and human—for effective invention and the need for inventors to establish a reputationbefore they could attract support made it more difficult for creative people to pursue careers asinventors. The relative numbers of highly productive inventors in the population correspondingly
decreased, as did rates of patenting per capita.
Naomi R. LamoreauxUCLA Department of Economics405 Hilgard AvenueLos Angeles, CA 90095-1477and [email protected]
Kenneth L. SokoloffUCLA Department of Economics405 Hilgard AvenueLos Angeles, CA 90095-1477and [email protected]
1
The perfectly bureaucratized giant industrial unit not only ousts the small or medium-
sized firm and “expropriates” its owners, but in the end it also ousts the entrepreneur and
expropriates the bourgeoisie as a class which in the process stands to lose not only its
income but also what is infinitely more important, its function. The true pacemakers of
socialism were not the intellectuals or agitators who preached it but the Vanderbilts,
Carnegies and Rockefellers.
Joseph A. Schumpeter1
For Joseph Schumpeter, the heart of the capitalist system was the entrepreneur—an
extraordinary individual who had the foresight to see profit in new products or production
processes as well as the tenacity to overcome any obstacles that stood in the way. Schumpeter
believed that the rise of large firms in the early twentieth century was making the entrepreneur
obsolete. By investing in in-house R&D laboratories staffed by teams of engineers and
scientists, large firms had routinized the process of innovation, “depersonalized and
autonomatized” technological change, so that the incremental advances were realized “as a
matter of course.” In such an environment not only did “personality and will power,” and thus
the entrepreneur, “count for less,” but the greater efficiency of large-scale enterprises was
undermining the small- and medium-size firms that historically had been the spawning ground
for heroic innovators with radically new ideas about how to do things. These developments,
Schumpeter foretold, would have profound consequences for the entire society. Because
1 Joseph A. Schumpeter, Capitalism, Socialism and Democracy (3rd edn.; New York: Harper & Row, 1950), p. 134.
2
entrepreneurs were the primary political supports for “private property and free contracting,”
their eclipse would pave the way for socialist revolution.2
From the standpoint of the early twenty-first century, it may be difficult to take this
vision of the decline of capitalism seriously. On the eve of World War II, however, when
Schumpeter was writing Capitalism, Socialism and Democracy, it seemed much more
compelling—both on logical and empirical grounds. During the 1920s, many privately held
firms in new-technology industries had taken advantage of the boom in stock-market prices to go
public, increasing their scale and adding new layers of professional management to their
company hierarchies. This era, in which the roles of financiers (and the managers who served
their interests) appeared to have been elevated above those who created new technologies, gave
way to a deep and prolonged depression that weighed heavily on the populations of capitalist
countries. Gloom about the future was pervasive, and rival systems, such as Communism in the
Soviet Union, attracted growing numbers of adherents throughout the West.
During the post-World War II period, the technological prowess exhibited by General
Electric, IBM, and other giant corporations spurred widespread acceptance of Schumpeter’s
belief that large firms were undermining the basis for individual entrepreneurship. Indeed,
despite mounting evidence that large firms were losing their edge, the idea that technological
discovery was most effectively pursued inside large integrated enterprises became, if anything,
more dominant in the scholarship during the 1980s, when the so-called “new economics of
information” supplied an alternative theoretical rationale. According to this theory, problems of
asymmetric information place severe limits on the exchange of technological ideas in the market.
Before firms will invest in a technology, they need to be able to assess its value—to estimate, for
example, the extent to which a new process will lower production costs, or whether a novel 2 Schumpeter, Capitalism, Socialism and Democracy, pp. 131-63.

3
product will likely appeal to consumers. But because inventors (or other sellers of new
technology) fear that firms will steal their ideas, they typically will not be willing to provide
potential purchasers with enough information to effectuate sales. Moving the process of
technological discovery within the firm not only overcomes this source of market failure, but
also, it is argued, yields other informational advantages. For example, firms with R&D labs will
be in a better position to exploit ideas for innovation that arise from the actual experience of
producing or marketing goods. This kind of knowledge is largely firm-specific and can be
transmitted much more readily among personnel responsible for different functions within the
organization than it can across organizational boundaries.3
Certainly, there is evidence that the dynamics of technological change shifted during the
early twentieth century in ways that seem, at least on the surface, to fit Schumpeter’s analysis of
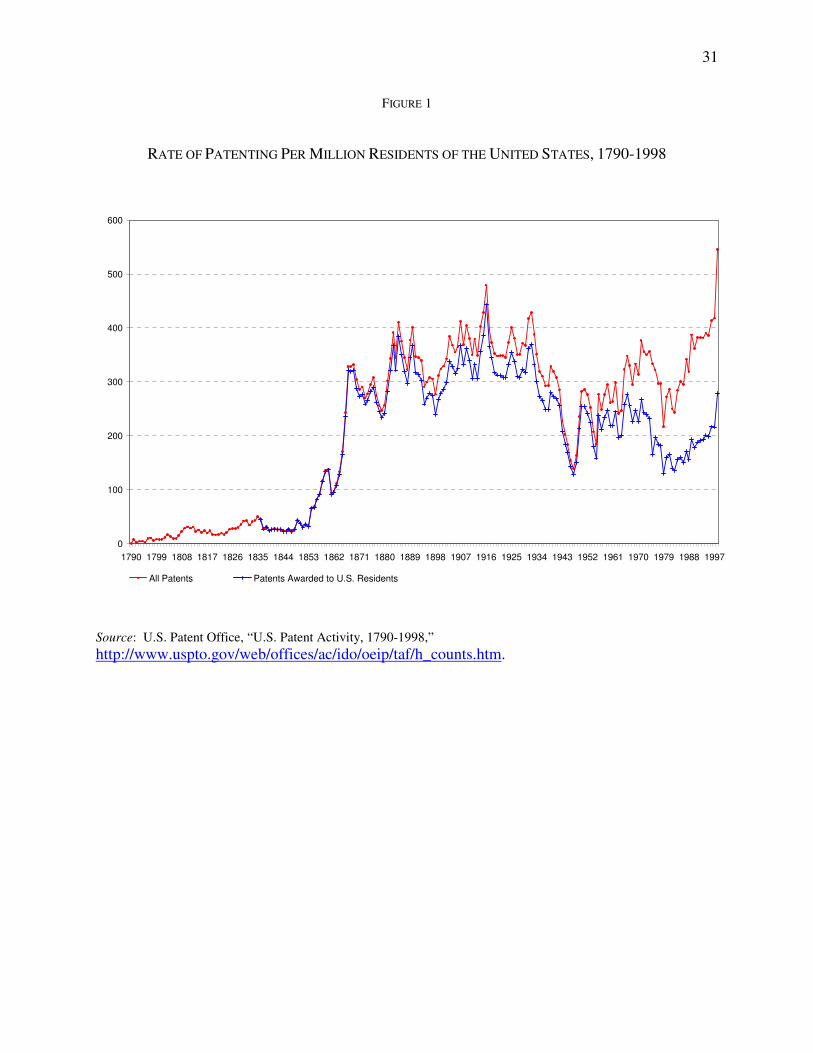
the demise of the entrepreneur. As Figure 1 shows, patenting rates per capita increased
dramatically across the nineteenth century, peaked around the turn of the century, and then began
a long period of decline. In other words, patenting rates appear to have been inversely correlated
3 See Kenneth J. Arrow, “Economic Welfare and the Allocation of Resources for Invention,” in The Rate and Direction of Economic Activity (Princeton: Princeton University Press, 1962), pp. 609-25; David C. Mowery, “The Relationship between Intrafirm and Contractual forms of Industrial Research in American Manufacturing, 1900-1940,” Explorations in Economic History, 20 (Oct. 1983), pp. 351-74; Mowery, “The Boundaries of the U.S. Firm in R&D,” in Coordination and Information: Historical Perspectives on the Organization of Enterprise, ed. Naomi R. Lamoreaux and Daniel M. G. Raff (Chicago: University of Chicago Press, 1995), pp. 147-76; and David J. Teece, “Technological Change and the Nature of the Firm,” in Technical Change and Economic Theory, ed. Giovanni Dosi, et al. (London: Pinter, 1998), pp. 256-81.
In recent years, this view of the inherent superiority of large-firm R&D has come under attack from scholars who show that it both overestimates the problems associated with the market exchange of technological ideas and underestimates the difficulty of managing technological information within the firm. This article is part of that revisionist effort. See also Ashish Arora, Andrea Fosfuri, and Alfonso Gambardella, Markets for Technology: The Economics of Innovation and Corporate Strategy (Cambridge: MIT Press, 2001); Joshua Gans and Scott Stern, “The Product Market and the Market for ‘Ideas’: Commercialization Strategies for Technology Entrepreneurs,” Research Policy, 32 (Feb. 2003), pp. 333-50; Naomi R. Lamoreaux and Kenneth L. Sokoloff, “Inventors, Firms, and the Market for Technology in the Late Nineteenth and Early Twentieth Centuries,” in Learning by Doing in Markets, Firms, and Countries, ed. Naomi R. Lamoreaux, Daniel M. G. Raff, and Peter Temin (Chicago: University of Chicago Press, 1999), pp. 19-60; and Lamoreaux and Sokoloff, “Intermediaries in the U.S. Market for Technology, 1870-1920,” in Finance, Intermediaries, and Economic Development, ed. Stanley L. Engerman, et al. (New York: Cambridge University Press, 2003), pp. 209-46.

4
with the growth of in-house R&D, dropping in the twentieth century as more and more firms
created their own research laboratories.
Of course, we recognize that there are objections to using patents as a measure of
entrepreneurial innovation. Schumpeter himself explicitly distinguished the concept of
innovation from that of invention. What entrepreneurs did when they innovated, according to
Schumpeter, was to take a new idea (an invention) and make it work—that is, embody the idea in
a productive enterprise and generate profits. It was the latter achievement that was important to
Schumpeter, not the discovery of the invention. We also recognize that patenting is an imperfect
measure even of invention. Some valuable inventions are never patented, and many inventions
are patented that have little or no economic significance.
Nonetheless, we contend that data on trends in patenting are useful for testing
Schumpeter’s argument about the diminishing role of the entrepreneur in technological change
and, more generally, in capitalism. The essence of a patent is the grant of an exclusive property
right to a new technological idea. By making property out of intangible knowledge—property
that could be exploited by the owner or sold or leased to someone else—the patent system
created the foundation of property rights upon which entrepreneurial innovation flourished. As
we will show, moreover, it was this foundation, and the flourishing market for patented
technology it made possible, that created the conditions for the emergence of a class of talented,
highly entrepreneurial inventors who specialized in the production for sale of new technological
ideas.
Before plunging into this demonstration, it is useful to provide a brief description of our
data. The starting point for our analysis is three random cross-sectional samples (totaling about
6,600 patents) that we drew from the Annual Reports of the Commissioner of Patents for the
5
years 1870-71, 1890-91, and 1910-11. For each patent in the samples we recorded a brief
description of the invention, the name and location of the patentee(s), and the names and
locations of any assignees granted rights to the invention before the date the patent was issued.
We also linked this data on patents to other information, such as characteristics of the firms to
which the patentees assigned their patent rights. Our second major data set is longitudinal and
was obtained by selecting from the three cross-sectional samples all (561) inventors whose last
names began with the letter “B.” We then collected information from Patent Gazettes and from
the Annual Reports of the Commissioner of Patents for all of the (6057) patents obtained by these
patentees for the twenty-five years before and after they appeared in one of our samples, again
linking this data to the same kinds of sources we used for the original cross-sections. For our
third data set, we collected similar information for patents granted in selected years to “great
inventors” born between 1820 and 1885. We defined great inventors as individuals whose
technological discoveries were notable enough to earn them inclusion in the Dictionary of
American Biography. In addition to specific information on a substantial subset of their patents,
we collected biographical detail on these inventors from the dictionary entries, as well as the
total number of patents each received over his or her career.4
In the analysis that follows we first describe the details of the patent system that were
most important for supporting entrepreneurial innovation. After legislation in 1836 put the final
elements of this system in place, both patenting and trade in patent rights boomed. The result,
4 This data set was compiled in collaboration with B. Zorina Khan. The approach to the collection of information was basically the same as that previously followed by Khan and Sokoloff for the period before, except that we systematically collected information on assignments at issue and opted to sample all patents awarded through 1846, and then those in every fifth year from 1850 on rather than obtain detailed information on every patent the inventor was granted. See B. Zorina Khan and Kenneth L. Sokoloff, “‘Schemes of Practical Utility’: Entrepreneurship and Innovation Among ‘Great Inventors’ During Early American Industrialization, 1790-1865,” Journal of Economic History, 53 (June 1993), pp. 289-307. We will also refer in this article to earlier work based on samples taken from the manuscript records of patent assignments. In order to be legally binding, a contract for the sale or transfer of a patent right had to be recorded with the Patent Office. These records are now stored in the National Archives.
6
we show, was the emergence by the last third of the century of a broad group of specialized,
highly productive, and highly entrepreneurial inventors. It was the thinning of the ranks of these
independent inventors that accounts for much of the decline in patenting rates in the early
twentieth century. The rest of this article is devoted to examining the changing career patterns of
this extraordinary group of inventors in order to understand why their numbers were dwindling.
The Patent System and the Rise of Institutions Supporting a Market for Technology
The institutional foundation for the rise of the independent inventor was the U.S. patent
system, created in accordance with the Commerce Clause of the Constitution. Although
influenced by British law, the framers of the U.S. system self-consciously made a number of
important innovations. Among them were dramatically lower fees, impersonal administrative
procedures for handling applications, and the requirement that a patentee be the “first and true”
inventor anywhere in the world. Patentees also had to be individual men or women; firms could
not receive patents directly for ideas developed in their shops. The individuals who received
patent grants then had the option of exploiting their property rights themselves, or they could sell
(assign) or lease (license) them to other individuals or to firms. These provisions not only
extended the protection of property rights to a much broader range of inventions than obtained in
Britain or elsewhere in Europe but, when coupled with effective enforcement, meant that
inventors could advantageously reveal information about their ideas to prospective buyers even
before they received a patent.5
5 For a comparison of the U.S. and British patent systems, see B. Zorina Khan and Kenneth L. Sokoloff, “Two Paths to Industrial Development and Technological Change,” in Technological Revolutions in Europe, 1760-1860, ed. Maxine Berg and Kristine Bruland (Cheltenham: Elgar, 1998), pp. 292-313.

7
Although the main purpose of the patent system was to stimulate invention by granting
creative individuals secure rights to their intellectual property, another important goal was to
promote the diffusion of technological knowledge. The law required patentees to provide the
Patent Office with detailed specifications of their inventions (including, where appropriate,
working models), and the result was a central storehouse of information that was open to all.
Anyone could journey to Washington and study the specifications of inventions already patented.
In addition, more convenient means of tapping this rich source of information soon developed.
The Patent Office itself began to publish on a regular basis lists of the patents it granted. By the
middle of the century, moreover, a number of private journals had emerged to improve upon this
official service. One of the most important was Scientific American, published by Munn and
Company, the largest patent agency of the nineteenth century. Others included the American
Artisan, published by the patent agency Brown, Coombs & Company; the American Inventor, by
the American Patent Agency; and the Patent Right Gazette, by the United States Patent Right
Association (which, despite its name, functioned as a general patent agency). Covering the full
spectrum of technologies, these journals featured articles about important new inventions,
printed complete lists of patents issued, and offered inventors advice about how to profit from
their ideas. Many pages were devoted to classified advertisements by patent agents and lawyers
soliciting clients, by inventors seeking partners with capital to invest, and by patentees hoping to
sell or lease rights to their technologies. One of the primary aims of these journals, of course,
was to drum up business for the patent agencies that published them.6
During the early years of the century, patent rights were awarded automatically to all
inventors who registered their inventions and paid the necessary fees. This procedure effectively
6 See Lamoreaux and Sokoloff, “Inventors, Firms, and the Market for Technology in the Late Nineteenth and Early Twentieth Centuries” and “Intermediaries in the U.S. Market for Technology.”

8
delegated to the courts responsibility for resolving disputes about the originality, novelty, and
appropriate scope of patent rights. New legislation in 1836 resolved the obvious problems this
system created by requiring that each invention be scrutinized by technically trained examiners
to insure that it constituted an original advance in the state of the art and otherwise conformed to
the law. Uncertainty about the value of patents decreased dramatically after the passage of this
law, and trade in patent rights boomed, attaining very quickly a volume of three to six times the
number of patents issued.7
The bulk of this early commerce in patents (80 to 90 percent of transactions during the
1840s) involved efforts by inventors to make multiple partial assignments of their rights for
different, geographically restricted areas. Because markets were primarily local or regional,
inventors with valuable intellectual property could use their ideas in their own manufacturing
facilities and, at the same time, earn additional profits by assigning partial rights to their
inventions to producers in other parts of the country. Thomas Blanchard, inventor of the
gunstocking lathe, a woodbending machine, and a variety of other devices, exploited these
possibilities to the hilt. For example, he used his lathe himself to make gunstocks for the Boston
market and for export. He also leased the rights to use the invention to gun producers operating
in other locations and to manufacturers making shoe lasts, tool handles, wheel spokes, and a
variety of other goods in different places around the country.8
After the development of the railroad network and the emergence of national product
markets, interest in purchasing geographically segmented patent rights declined, and
7 B. Zorina Khan, “Property Rights and Patent Litigation in Early Nineteenth-Century America,” Journal of Economic History, 55 (March 1995), pp. 58-97; Naomi R. Lamoreaux and Kenneth L. Sokoloff, “The Market for Technology and the Organization of Invention in U.S. History,” in Entrepreneurship, Innovation and the Growth Mechanism of the Free-Market Economies, ed. William Baumol and Eytan Sheshinski (Princeton: Princeton University Press, forthcoming); and Lamoreaux and Sokoloff, “Intermediaries in the U.S. Market for Technology.” 8 Carolyn C. Cooper, Shaping Invention: Thomas Blanchard’s Machinery and Patent Management in Nineteenth-Century America (New York: Columbia University Press, 1991).

9
manufacturers instead sought to acquire full national rights to important technologies. As a
result, already by 1870 the proportion of assignments that were geographically specific had
dropped to 23 percent of the total, and the proportion would fall to 5 percent by 1890. Moreover,
in a legal environment where many, if not most, inventions were protected by patents, and where
this kind of property right was vigorously enforced, maintaining one’s competitive position often
meant beating out rivals to secure exclusive rights to new devices. As firms eagerly snapped up
new technological ideas, the proportion of patents that were assigned before they were even
issued rose from 18 percent of the total in 1870-71 to 29 percent by 1890-91.9
As a consequence of the growth of national markets, the ways in which inventors could
extract the returns from their ideas necessarily changed. Whereas Blanchard could make use of
his invention himself and also sell off partial rights to others, patentees now typically faced a
stark choice. They could either exploit their inventions directly by establishing enterprises
capable of operating in national (or even international markets), or they could sell or license their
rights to others better situated to develop and commercialize the technology on a large scale.
Regardless, they could now benefit greatly from the assistance of specialized intermediaries who
could help them find buyers or leasers for their national patent rights, or alternatively could help
them secure the financial backing they needed to found their own enterprises (whether for the
direct commercial exploitation of their inventions or for the generation and patenting of new
technological knowledge to be sold or licensed out).
Although the role of intermediary could be played by almost any kind of business person,
patent agents and lawyers were particularly well suited for this task. Indeed, inventors who used
the services of these professionals were able on average to sell their patents more quickly than
9 Lamoreaux and Sokoloff, “Inventors, Firms, and the Market for Technology in the Late Nineteenth and Early Twentieth Centuries,” p. 26. These figures are based on a sample of assignment contracts taken from the manuscript records in the National Archives.
10
anyone else (by the early 1870s, 47 percent of the assignments handled by individuals known to
be patent agents or lawyers occurred before issue, as opposed to 18 percent handled by other
intermediaries, and only 9 percent handled by the parties themselves). Not only did patent
agents and lawyers usually have considerable technical training, but in the course of their
ordinary business they serviced both sides of market for technology, helping inventors file patent
applications and assisting buyers in evaluating inventions’ technical merits. They were therefore
in a good position to obtain information about new technologies coming on the market, as well
as to know the kinds of technologies that particular buyers were interested in purchasing.
Located in urban centers, these agents typically had connections with colleagues in other cities—
sometimes formally through partnerships, sometimes informally through family ties, and
sometimes simply through repeat interactions—and thus were able to weave into a national web
the dense local networks that each of them created.10
As is evident from Table 1, both the propensity to trade patent rights and the location of
concentrations of patent agents were positively associated across regions with rates of patenting
per capita. New England, which had exhibited the highest patenting rates in the nation since the
beginning of the nineteenth century, had both the largest proportion of patents assigned at issue
as well as the most disproportionate concentration of patent agents relative to population. The
Middle Atlantic and the East North Central regions were the next highest respectively in
patenting, assignments rates, and the clustering of agents. The South ranked lowest on all three
scales.
This robust regional correspondence between the extent of the market for technology and
patenting rates is exactly what one would expect to observe. On the one hand, intermediaries
should, all other things being equal, concentrate in areas where rates of invention were already 10 Lamoreaux and Sokoloff, “Intermediaries in the U.S. Market for Technology.”
11
high. On the other, the presence of firms and institutions conducive to trade in technology
should stimulate greater specialization in invention—in the first place, by increasing the net
returns that inventors could expect from a given discovery (encouraging individuals with a
comparative advantage in invention to make appropriate investments in physical and human
capital) and, second, by making it easier for inventors to raise capital to support their inventive
activity. Individuals already inclined to specialize in invention might also be expected to move
to cities or regions with more developed market institutions or greater demand for new
technological knowledge. As we show in the next section, inventors did indeed respond to these
various incentives in a manner befitting Schumpeterian entrepreneurs.
Independent Inventors as Entrepreneurs
Once one accepts the notion that inventions were a tradable good which, like other tradable
goods, could be a source of profit, then it is not difficult to see how specialized inventors resembling
Schumpeterian entrepreneurs emerged and thrived during the second half of the nineteenth century.
The entrepreneurial bent of these specialized inventors manifested itself in a variety of ways.
Perhaps the most significant was the extensive use they made of the market for technology—
extracting the returns from their patented inventions by selling off the property rights to other
individuals or firms. The resulting division of labor gave inventors the freedom to concentrate on
what they did best—invent. It also allowed them to take better advantage of differences across
firms in the ability or inclination to exploit the commercial potential of particular inventions.
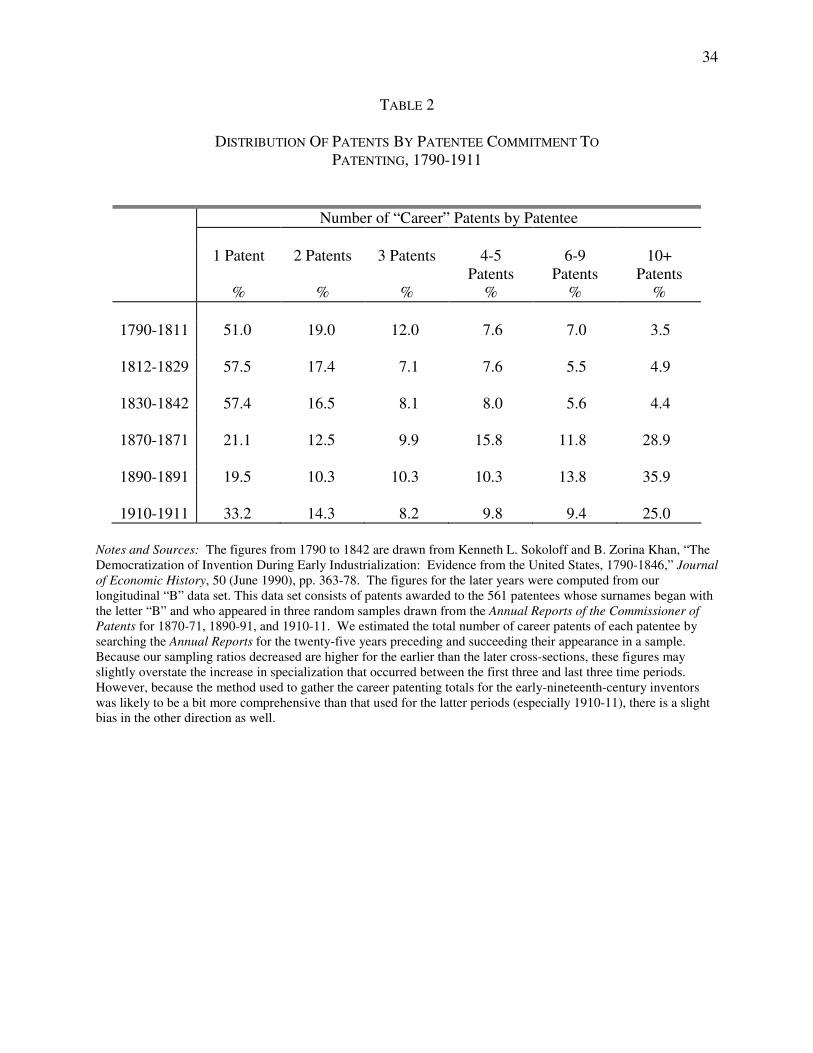
That the evolution of this market for patented inventions did in fact expand opportunities for
the technologically creative is suggested by the jump in the relative importance of specialized
inventors between the first and last third of the nineteenth century (see Table 2). The proportion

12
of patents in any given year that were awarded to individuals who received ten or more patents over
their careers increased from below 5 percent during the early 1800s to 28.9 and 35.9 percent
respectively in 1870-71 and 1890-91.11 Moreover, as indicated by their higher rates of assignment at
issue by the late nineteenth century, inventors who were more specialized or productive at this
activity were the ones most likely to trade away the rights to their patents (see Table 3).12 This
association strengthened over time, so that, by the 1910-11 subsample, inventors with 10 or more
career patents assigned 62.4 percent of their patents by the date they were issued (56.2 percent of
them to companies), whereas those with just 1 or 2 career patents assigned only 15.0 percent of their
patents.
Because the inventors who were most successful at coming up with important new
technological ideas were also likely to be those most inclined toward, and best able to mobilize
resources for, continuing along that career path, it seems likely that these specialized, market-
oriented patentees played an even more disproportionate role in generating significant (high-value)
inventions. This view is consistent with the finding that the career patent totals for our sample of
great inventors were far higher than they were for representative (“B”) patentees and also that the
greater inventors were much more likely to assign away their inventions than other patentees. For
example, great inventors born between 1820 and 1839 received on average 35.1 patents over their
careers, those born between 1840 and 1859 received on average 68.8 patents, and those born
between 1860 and 1885 received 100.0. The respective rates of assignment for these cohorts were
29.3, 42.9, and 64.2 percent. By contrast, the average numbers of patents received by the different
11 The fall in the proportion of patents that were awarded to inventors with 10 or more patents over their careers between 1890-1891 and 1910-1911 may have resulted from some tendency in our data collection method to oversample patents for the first subsample of inventors relative to the second, but it may also have resulted from early-twentieth-century changes in the environment for invention that we discuss below. 12 In previous work, based on the manuscript assignment records stored at the National Archives, we have shown that the more productive inventors were also more likely to use specialized intermediaries. See Lamoreaux and Sokoloff, “Intermediaries in the U.S. Market for Technology.”

13
subsamples of our “B” inventors ranged between 7.8 and 15.6, and assignment rates were
significantly lower. The evidence thus supports the view that, by the last third of the nineteenth
century, there had emerged a class of highly productive and entrepreneurial inventors geared toward
selling off the rights to their discoveries, and that this class was a crucial source of new
technological knowledge.
Here skeptics might object that the high assignment rates we observe for specialized
inventors did not necessarily reflect their entrepreneurial orientation toward the market for
technology but instead might simply indicate that they were employees of the firms to which they
assigned their patents. Upon closer examination, however, we can reject this possibility. During
the middle of the nineteenth century, as we have already discussed, most assignments involved
patentees selling geographically delimited rights to firms or individuals in different jurisdictions;
such geographic assignments were virtually always arms-length transactions. Moreover, in earlier
work we traced the occupations of “B” patentees wherever possible in city directories. We found
that, even as the prevalence of geographic assignments declined over time with the emergence of
national product markets, it remained quite unusual for highly productive inventors to be employees
of the firms that obtained their patent rights. To the contrary, the great majority of these patentees
either had no long-term attachment with their assignees or, as was increasingly the case by the early
twentieth century, were principals in the firms to which they assigned their patents.13
The entrepreneurial opportunities that the ability to sell off patent rights afforded specialized
inventors were not merely potential. Productive inventors seem actively to have pursued them by
assigning their inventions to multiple individuals and firms. This pattern is evident from Table 4,
which examines the assignment behavior of the 545 patentees from our “B” sample who were
13 Lamoreaux and Sokoloff, “Inventors, Firms, and the Market for Technology in the Late Nineteenth and Early Twentieth Centuries.”

14
residents of the United States during at least some period of their careers. 168 of these patentees (or
30.8 percent) received ten or more patents over the fifty years we followed them (accounting for
80.6 percent of the total 5,794 patents awarded to the 545 inventors), and 51 of these 168 transferred
their patents at issue to four or more different assignees. These 51 patentees (9.4 percent of the total
number of patentees) received 2034 patents (or more than 35 percent of total patents). In
comparison, the 36 patentees with ten or more patents (6.6 percent of the sample) who dealt with
only one assignee over their careers received only 727 patents (12.5 percent of the total).14
Even stronger evidence for such entrepreneurial behavior comes from our sample of great
inventors. Although our estimates (in Table 5) of their contractual mobility are based only on a
twenty percent sample of their patents, and are thus downward biased, we still find that 26 percent
of the most productive of these renowned inventors (that is, of the 96 inventors for whom we
collected ten or more patent records) had four or more distinct assignees over their careers,
accounting for roughly 43 percent of all the patents in the sample. The difference between
patentees with multiple assignees and those who assigned to only one individual or firm is
especially pronounced by the time of the cohort born between 1840 and 1859. More than 53
percent of the patents obtained by members of that cohort went to inventors with four or more
assignees, and only 14 percent went to those with only one assignee.15
Entrepreneurs are generally thought to be geographically mobile—willing to relocate to take
advantage of better opportunities. Hence another way of examining the entrepreneurial qualities of
14 Because the possibility of having more assignees increases with the number of patents, this way of describing the patterns in the data slightly overstates the strength of the relationship we want to highlight, but the qualitative result is robust to other approaches. It is also important to emphasize that our data includes only assignments at issue. If we were able to track assignments that occurred subsequent to issue, our estimates of the number of different assignees would undoubtedly increase. 15 Note that the pattern is also strong for the cohort born between 1860 and 1885, but that the growth in the prevalence of inventors with limited contractual mobility over their career is becoming apparent (see the fraction of patents and patentees accounted for by inventors with only one career assignee). We discuss this change in the next section.
15
these specialized and productive inventors is to track their movements. The great inventor sample
allows us to compare the residences of patentees at the times they received their various patents and
also with their place of birth, and it is evident from the data that these talented inventors were far
more geographically mobile than the general population. For example, the fraction of patents
awarded to U.S. born great inventors who resided outside their state of birth was nearly double
the migration estimates (36 percent and 30 percent) that Joseph Ferrie has compiled for U.S.-
born adults over the thirty-year periods from 1850 to 1880 and 1880 to 1910 respectively.16
Perhaps more directly comparable (and impressive), about 55 percent of these patents went to great
inventors who obtained their last patent in a different state from the one where they had obtained
their first. For great inventors whose patenting careers (defined as the period between their first and
last patents) lasted between 20 and 35 years, the figure was fully two thirds, and for those with
careers over 35 years, nearly three quarters. Moreover, patentees who had the most career patents
were on average the most mobile, and hence seemingly the most entrepreneurial, even after
adjusting for the duration of their careers.
Not only were the great inventors highly mobile, but their locational decisions followed
systematic patterns (see Table 6). Patenting by great inventors remained very concentrated in the
Northeast throughout the period under study. For the cohort born between 1820 and 1839, this
pattern could be attributed to the disproportionate numbers of great inventors born in New England
and the Middle Atlantic, but later cohorts evinced a powerful tendency to relocate to these regions
and particularly to the Middle Atlantic states. For example, members of the 1840 to 1859 birth
16 It is also striking that the foreign born were significantly over-represented, relative to the general population, among the great inventors. Those born abroad composed 22.9 percent (19.7, 33.0, and 11.4 percent of the respective three birth cohorts) of the great inventors born between 1820 and 1885, and received 24.9 percent (15.6, 34.7, and 17.9 percent for the respective cohorts) of the great inventors’ patents. The foreign-born great inventors were more likely to locate in New England than their U.S.-born counterparts. Ferrie’s estimate is from Joseph P. Ferry, “Longitudinal Data for the Analysis of Mobility in the U.S., 1850-1910,” unpublished paper, 2004.

16
cohort who were born in the Middle Atlantic accounted for nearly 18 percent of total patents,
whereas those who resided in that region received 47.3 percent. By the third cohort (those born
between 1860 and 1885), nearly two-thirds of all great inventor patents went to residents of the
Middle Atlantic, even though those born in the region generated less than 10 percent of the total.
This extreme concentration of great inventor patents in the Middle Atlantic contrasts starkly with
the contemporaneous trend toward regional convergence in overall patenting rates, suggesting
that conditions in that region were especially favorable to the most talented inventors. Inventors
and the enterprises committed to technological innovation may have found it increasingly
important over time to have ready access to the legal services and financial intermediation
provided by the region’s dense cluster of patent agents, lawyers, and financial institutions.
Elmer Sperry is an excellent example of a great inventor who assiduously pursued
entrepreneurial opportunities.17 Born into an upstate New York family of modest means, Sperry
attended public schools and then went on to college at Cortland Normal. While there, he decided
that he wanted to be an inventor and set about learning as much as possible about electricity.
Acting on the suggestion of one of the professors he sought out at nearby Cornell University, he
designed a generator capable of supplying a constant current regardless of the load on its circuits
and then began systematically to scour the local business community in search of a financial
backer. The Cortland Wagon Company, whose executives included both inventors and investors
interested in supporting new technological developments, took Sperry in, providing him with the
advice and services of a patent lawyer, as well as money to live on and a shop in which to work.
The year was 1880, and in this sheltered environment, Sperry not only perfected his dynamo, but
over the next two years developed a complete system of arc lighting to go with it. The company
17 The following discussion is based on Thomas Parke Hughes, Elmer Sperry: Inventor and Engineer (Baltimore: Johns Hopkins Press, 1971).
17
had a branch in Chicago, and there the company’s officers, with additional backing from local
Chicago investors, organized The Sperry Electric Light, Motor, and Car Brake Company in
1883, with Sperry (who owned a big chunk of the company’s stock) serving as “electrician,
inventor, and superintendent of the mechanical department.”
Although the company launched Sperry’s career as an inventor, it was never a financial
success. For Sperry, it proved to be a constant source of anxiety that absorbed all his attention
and left him little time and energy for creative pursuits. Indeed, this period was the low point of
his career in terms of generating new technological ideas. The nineteen patents he applied for
during his five years with the company amounted collectively to half his annual average over a
career as an inventor that stretched from 1880 to 1930. Sperry emerged from this experience
determined to devote his energies to research and never again to become so deeply involved in
the internal affairs of a company. But he was also determined to profit from his inventions. To
this end, he sold off many of his inventions to companies that were well placed to put them to
productive use. Others he commercialized himself, founding with the help of a wide assortment
of financial backers a variety of companies that bore his name, such as the Sperry Electric
Mining Machine Company, the Sperry Streetcar Electric Railway Company, and the Sperry
Gyroscope Company. Although Sperry often played an active role in these companies in their
early stages, he always downgraded his position to technical consultant as quickly as possible
and went on to something else. Like other great inventors, Sperry demonstrated a willingness
throughout his career to uproot himself and his family whenever new opportunities beckoned.
He moved from Cortland to Chicago to commercialize his arc lighting system, departed for
Cleveland when a group of wealthy investors offered financial backing for his work on electric
streetcars, and finally headed back East to Brooklyn to work on electrolytic methods for

18
producing tin plate for American Can. Apparently, opportunities in the Middle Atlantic were
sufficiently rich that he was able to spend the last thirty plus years of his long, productive career
in New York.
Difficulties Facing Independent Inventors
Large numbers of entrepreneurially oriented individuals were able to become inventors
during the nineteenth century because barriers to entry into this activity (other than talent) were
low. The examination-based patent system, coupled with favorable legal institutions, offered
strong protection for intellectual property rights at quite a modest cost. At the same time, the
traditional social institution for the transmission of technological knowledge—apprenticeship (or
more generally the practice of leaving home during adolescence to pick up skills in a trade)—
was both widely accessible and capable of adapting to the quickening pace of advance.
Technologically creative individuals without the resources to attend institutions of higher
learning thus had avenues for acquiring the skills and knowledge they needed to be effective
inventors.
By the end of the nineteenth century, however, barriers to entry into inventive activity
seemed to be rising. The most obvious change was the apparent advantage that accrued to
inventors with formal training in science and engineering. Figure 2 documents the shift for
successive cohorts of our sample of great inventors. Up through the cohort of inventors born
between 1820 and 1845, individuals without an advanced formal education accounted for most
major inventions. Indeed, roughly 75 to 80 percent of the patents awarded to members of these
cohorts went to those with only primary or secondary schooling. There was an abrupt change,
however, in the educational backgrounds of the great inventors born after 1845. Whereas only
19
10 percent of the patents awarded to those born between 1820 and 1845 went to individuals with
college or graduate training in a technical field (engineering, natural science, or medicine), the
figure jumped to around 60 percent for the cohort born between 1865 and 1885 (with still
another 20 percent awarded to those who studied other subjects in college).18
Perhaps because access to higher education was still quite limited, or perhaps (as we will
suggest) for this reason in combination with other changes associated with the shift toward
science-based technologies, a smaller proportion of the population seems to have been able to
engage in effective invention by the early twentieth century. Table 7 presents the distribution of
patents for our three “B” subsamples, broken down by the total number of career patents
received by the patentee and by the region of the patentee’s residence. Although specialized
inventors (those with more that 10 patents over their careers) accounted for a somewhat larger
share of inventions in New England than in the other two main patenting regions (the Middle
Atlantic and the East North Central), in all three regions there was a marked increase in the share
of patents accounted for by specialized inventors. Between 1870-71 and 1910-11, the share of
patents that were granted to patentees with 10 or more career patents rose from 76.1 to 91.9
percent in New England, 65.2 to 80.7 percent in the Middle Atlantic, and 68.4 to 84.9 percent in
the East North Central. When one considers that the overall rate of patenting per capita had
essentially peaked for the country at large during the late 1880s and early 1890s, and was
declining dramatically in the two regions where inventive activity had long been concentrated (in
New England, as Table 1 shows, it dropped from 775.8 patents per million residents in 1870-71 18 Those who received some schooling at institutions of higher learning are strikingly over-represented among great inventors relative to the general population, where the proportions of cohorts graduating from secondary school and college were under 10 percent and 3 percent respectively as late as 1900. See Thomas D. Snyder, 120 Years of American Education: A Statistical Portrait (Washington, D.C.: U.S. Department of Education, National Center for Education Statistics, 1993), figures 11 and 17. See also B. Zorina Khan and Kenneth L. Sokoloff, “Institutions and Technological Innovation During Early Economic Growth: Evidence from the Great Inventors of the United States, 1790-1930,” in Institutions and Growth, eds. Theo Eicher and Cecilia Penalosa Garcia (Cambridge: MIT Press, forthcoming).
20
to 534.3 in 1910-11 and in the Middle Atlantic from 563.4 to 488.6), the implication is that it
was becoming more difficult in these parts of the country to succeed as an inventor. And yet we
know that these were precisely the regions to which great inventors were migrating. The puzzle,
therefore, is to understand the circumstances that attracted talented inventors to the Northeast
but, at the same time, made pursuing a career as an inventor more daunting there than before.
Another piece of the puzzle is that the degree of independence that inventors enjoyed
seems to have begun to diminish by the early twentieth century. Table 8 shows that, after rising
between the 1870-71 and 1890-91 subsamples, the contractual mobility of our “B” inventors
declined significantly between the 1890-91 and 1910-11 groups. The proportions of patentees
who assigned their patents at issue to 2-3 different assignees and 4 or more assignees increased
respectively from 7.5 to 21.1 percent and 7.5 to 12.5 percent between 1870-71 and 1890-91, but
then fell to 16.9 and 9.4 percent by 1910-11. Intriguingly, the decline in contractual mobility
that occurred during this last interval was virtually all a result of developments in the Middle
Atlantic, the region to which great inventors who born in the U.S. were disproportionately
moving. Contractual mobility changed little, or even increased slightly, in New England and the
East North Central between the 1890-91 and 1910-11 subsamples and was much greater in both
of these regions than in the Middle Atlantic.
Schumpeter’s theory of the decline of the entrepreneur suggests a possible way to put
these puzzle pieces together. According to this view, the rise of large-scale businesses with in-
house R&D laboratories, particularly in the science-based industries associated with the Second
Industrial Revolution, gave employment (and provided the resources needed to engage
productively in the generation of new technological knowledge) to creative individuals with the
requisite educational background (or other credentials satisfactory to professional managers) at
21
the same time as it made it difficult for independent inventor/entrepreneurs to survive in
competition. In order to explore this possibility, we classified the assignees in our samples by
types and then examined how these types varied over time, by region, by industry, and according
to various characteristics of the patentees. The analysis is complicated by the difficulty of
classifying the large number of assignees in our samples in a way that captures the essential
characteristics of large firms that Schumpeter had in mind. The solution we adopted was to sort
the patents into the following categories: (0) the inventor did not assign the patent at issue; (1)
the inventor made a partial assignment at issue to an individual (often a partner); (2) a full
assignment to an individual; (3) an assignment to a company with the same name as the patentee
(indicating that the inventor was likely to be a principal in the firm); (4) an assignment to a
company for which financial information was reported in the Commercial and Financial
Chronicle or in Poor’s or Moody’s Manual of Industrial Securities (indicating that the company
was important enough to tap the national capital markets) or, alternatively, that was listed in an
early-1920s National Research Council directory of companies with research laboratories; (5) an
assignment to a not-already classified company that was located in the same city as the patentee;
(6) an assignment to a not-already classified U.S. company (that is, a company located in
different city from the patentee); and (7) an assignment to a company located in another country.
We think of category (4) as being closest to the sort of bureaucratic enterprise to which
Schumpeter attributed the decline of the entrepreneur, and assume that patentees whom made
these assignments were more likely to be employees than principals of such firms. Category (3),
by contrast, consists of enterprises that were likely run by inventors, their relatives, or other close
personal associates. The firms in this category most resemble Schumpeter’s concept of an
22
entrepreneurial enterprise—that is, a company set up to exploit the profit-potential of a particular
innovation.
In Table 9, we present cross-tabulations for each of our “B” subsamples, breaking down
the distribution of patents by the total number of career patents the patentee received (our
measure of specialization at invention) and the type of assignment. Major differences are
evident in the assignment behavior of patentees with different degrees of specialization at
invention, as are changes over time. In all three subsamples, patentees who were more
specialized at invention had markedly higher assignment rates. Although all classes of inventors
assigned some of their patents to individuals, those that were more specialized or productive over
their careers were much more likely to assign their patents to companies—both as a share of their
assigned patents as well as of total patents. This association between specialized inventors and
assignments to companies strengthened over time, and is particularly evident in the high
proportion of the patents assigned to companies that came from this class of inventors. Indeed,
specialized inventors accounted for virtually all of the patents assigned to companies in
categories (3) or (4) (companies with the same name as the inventor or firms that were highly-
capitalized or had early R & D labs). By the 1910-11 subsample, inventors with 10 or more
career patents assigned at issue nearly two-thirds of all the patents they were awarded, and of
those assigned patents, over sixty percent went to firms in categories (3) or (4) and a bit over
thirty percent to other companies.
Although these results are consistent with Schumpeter’s view of the growing importance
of large-firm R&D, other patterns in the table do not fit his account of the demise of individual
entrepreneurship. Yes, specialized inventors transferred more and more of their patents to large
integrated companies, but over time they assigned an even greater proportion of their patents to
23
companies that bore their name—that is, companies in which they were more likely to be
principals than employees. Inventors with 10 or more career patents in the 1910-11 subsample
assigned 23.5 of their patents to such companies (accounting for fully 37.7 percent of their
assignments). Although these findings are consistent with the idea that, by the early twentieth
century, inventors needed to attach themselves to firms in order to remain specialized and
productive at invention, they suggest that going to work in a large firm’s R&D lab was not the
only option available.
Examination of the data on great inventors yields essentially the same findings, though
the relative importance of assignments to large integrated versus family-name companies is
reversed. Table 10 reports the disposition at issue of the patents awarded to inventors in each of
the three birth cohorts. Members of the 1860-85 cohort would have been roughly similar in age
to the “B” patentees in the 1910-11 subsample, so it is this comparison that is most instructive.
Inventors in both the 1860-85 cohort of great inventors and the 1910-11 “B” subsample assigned
away nearly two-thirds of their patents at issue, with more than 60 percent of their assigned
patents going either to large integrated companies or to companies bearing the inventor’s family
name. The similarity of the results for these two, very different data sets provides powerful
support for the idea that productive inventors were increasingly finding it necessary to form
long-term attachments with firms.
In order better to understand why such attachments were becoming more and more
prevalent over time, we break down the three distributions of patents awarded to “B” inventors
with 10 or more career patents by the stage of the inventor’s career and the type of assignment
(see Table 11). We classify patents granted within five years of the first patent as belonging to
the early stage of an inventor’s career, those granted 5 to 15 years after the first patent as

24
intermediate stage, and those thereafter as late. The logic behind the table is that, if we can
identify when in their careers inventors began to assign their patents to large-integrated or
family-name firms (that is, to the kinds of firms with which they were more likely to have long-
term attachments), we can distinguish between two alternative explanations for the association
between productivity at invention and assignments to these kinds of companies: that inventors
were productive in generating patents because they came to be supported early in their careers by
such enterprises; or that inventors who had already distinguished themselves from the pack were
the ones able to attract such support.
The data in Table 11 are more consistent with the second hypothesis than the first. Even
inventors who received many patents over their lives seem generally to have had much more
difficulty finding assignees for their patents when they were first starting out than during the
later phases of their career. This pattern, which was especially pronounced for the first two
subsamples and for assignments to family-name companies, suggests that inventors, in some
sense, had to prove themselves before they were able to mobilize capital to organize their own
firms. Although the speed at which these highly productive inventors made the transition to
assigning a high proportion of their patents at issue (and to family-name companies) may have
increased somewhat over time, dramatic differences in assignment behavior by stage of career
remain evident by the 1910-11 subsample. During the last stage of their careers, productive
inventors in this group were able to assign 70.3 percent of their patents at issue, with 32.6
percent (or 46.4 of their assignments) going to family-name companies. By contrast, during the
first stage of their careers, members of this group assigned just 54.4 of their patents, with only
1.3 percent (2.4 percent of assignments) going to companies that bore their names. Further
evidence that inventors first had to prove themselves in order to gain the resources they needed

25
to be productive at their vocation, and that the capital required to support effective inventive
activity may have increased mightily, is provided by the dramatic change that occurred over time
in the proportions of their patents they obtained at different stages of their careers. For
specialized inventors in the 1870-71 subsample, patents were spread fairly evenly over time,
with about a third obtained in the early stage of their careers, a third in the intermediate stage,
and a third later on. By contrast, productive members of the 1910-1911 subsample obtained only
about 15 percent of their patents in the first stage of their careers and nearly 60 percent in the
last.19
Although productive inventors apparently found it difficult to mobilize enough capital to
start their own companies during the first stage of their careers, the proportion of their early
patents that they assigned at issue did rise steadily, increasing, for example, from 38.0 percent
for the 1890-91 subsample to 54.5 percent for 1910-11. Most of this increase was accounted for
by assignments to large integrated and other (local and non-local) companies, which together
accounted for 39.0 percent of early-stage patents (71.7 percent of assignments) for the 1910-11
subsample. The substantial proportion of these assignments that went to large integrated
companies may well reflect a tendency for such enterprises to hire young, university-trained
researchers when setting up or expanding their research labs during the early twentieth century,
with the college degree perhaps serving as a signal of the employee’s qualifications in lieu of a
previous record of successful invention.20 Certainly, there is circumstantial evidence for this
notion. Not only was there was a substantial increase over time in the proportion of great
inventors who attended college in engineering or the natural sciences, but as B. Zorina Khan and
19 These figures may somewhat understate the trend because we are likely to have undersampled patents for both the first career stage of the first subsample and for the last stage of the last subsample. 20 See Naomi R. Lamoreaux and Kenneth L. Sokoloff, “Market Trade in Patents and the Rise of A Class of Specialized Inventors in the 19th-Century United States,” American Economic Review, 91 (May 2001), pp. 39-44.
26
Sokoloff have shown, great inventors who had such backgrounds attained higher rates of
patenting at younger ages than those without similar educational achievements.21 As shown in
Table 12, moreover, assignment rates increased dramatically over time for great inventors with
training in engineering and the natural sciences. Great inventors born between 1860 and 1885
who had college training in these subjects had much higher assignment rates than other members
of the cohort. They were also far more likely to assign their patents to large integrated
companies.
These findings on career patterns lend credence to the idea that the technological
advances of the Second Industrial Revolution had made it more difficult for inventors to secure
the resources they needed to maintain their independent status. As technology became more
complex and science-based during the late nineteenth century, creative individuals with the
requisite skills and knowledge may have required more capital to pursue careers at invention
than local partners (or other traditional sources of funding) could readily provide. The marked
decrease by the early twentieth century in the number of productive inventors who managed their
careers without forming long-term attachments with firms, together with the sharp decline in
patenting rates in the regions where independent inventors had mainly been concentrated,
suggests that the need to mobilize substantial amounts of capital may indeed have operated as a
barrier to success in, or even to entry into, inventive activity by this period. Moreover, the
observation that patents were especially likely to be assigned to firms in categories (3) or (4) in
the manufacturing and energy/communications sectors, presumably the most capital-intensive on
average in the economy, is consistent with this view.22
21 See Khan and Sokoloff, “Institutions and Technological Innovation During Early Economic Growth.” 22 Using descriptions of the patents, we classified each of the patents in the three cross-sectional samples (1870-71, 1890-91, and 1910-11) into six sectors: agriculture and food processing; construction; energy and communications; manufacturing; transportation; and miscellaneous. Although the differences across sectors in 1870-71 were small

27
From this perspective, one explanation for the increase in the proportion of assignments
that went to large integrated companies may be the superior access that such firms possessed to
the nation’s main capital markets. Indeed, the concentration of large firms near New York,
which was rapidly becoming the financial center of the nation, may account both for the
migration patterns of great inventors and for the large proportion of the assignments to such
companies that occurred in the Middle Atlantic region (see Table 13). As Table 13 shows,
however, assignments by great inventors to family-name companies had a very different
geographic distribution, occurring disproportionately in the East North Central states.
Moreover, this contrasting regional pattern appears even more prominently when we breakdown
the subsamples of patents in our “B” dataset by region as well as by type of assignment at issue
(Table 14). By 1910-11, inventors in the Middle Atlantic were assigning 22.1 percent of their
patents to large integrated companies and only 2.7 percent to family-named companies, whereas
the figures for inventors in the East North Central were just the reverse—only 4.1 of patents
went to large integrated companies and 31.4 percent to companies that bore the inventor’s name.
Although our analysis of both the “B” and great inventor samples indicates that
specialized or productive inventors found it increasingly difficult to maintain their independence
by the early twentieth century, it also suggests that the options available to inventors who were
seeking long-term attachments with firms differed systematically across regions. In particular,
inventors in the Middle Atlantic seem to have been less able, or at least less inclined, to organize
their own firms than their counterparts in the East North Central (and to a lesser extent New
England). Understanding the reasons for this geographic pattern is beyond the scope of this
and insignificant, for the latter two cross-sections patents in energy and communications and in manufacturing were much more likely to be assigned at issue than patents in other sectors and also more likely to be assigned to companies than to individuals. In addition, they were much more likely (energy and communications patents especially) to be assigned to large integrated companies, and somewhat more likely to be assigned to companies with the same name as the inventor.

28
article, but differences across regions in the structure of capital markets may well have been
significant. Other research that we have done on Cleveland, an East North Central city that was
a hotbed of high-tech startups during the Second Industrial Revolution, highlights the existence
in that city of a vibrant local venture-capital sector—a sector that may have flourished (like
Silicon Valley’s in the late twentieth century) in part because of its distance from New York.23
Was Schumpeter Right?
Although more work needs to be done, clearly there was much truth in Schumpeter’s
observation that, by the early twentieth century, the advance of technology had transformed the
organization of invention and innovation—that the higher cost of conducting R&D was making
it increasingly difficult (or less likely) for talented inventors to realize their creative potential on
their own. This change shows up in our finding that the contractual mobility of specialized
inventors was declining (that is, there was a sharp reduction in the number of different
individuals and firms to which they assigned their patents) and that inventors were increasingly
assigning their patents to firms with which they seem to have formed some kind of long-term
attachment. It also shows up in the changing career patterns of specialized inventors. By the
1910-11 subsample of “B” patentees, even the most productive inventors were obtaining on
average many fewer patents in the early stages of their careers than they were later on, after they
had formed such attachments.
Talented inventors could procure the funds and complementary inputs they needed to
pursue their vocation by taking employment positions in the R&D labs of large integrated firms.
23 Naomi R. Lamoreaux, Margaret Levenstein, and Kenneth L. Sokoloff, “Financing Invention during the Second Industrial Revolution: Cleveland, Ohio, 1870-1920,” in The Financing of Invention in Historical Perspective, eds. Lamoreaux and Sokoloff (Cambridge: MIT Press, forthcoming).
29
That many important inventors were indeed choosing this career option by the early twentieth is
readily apparent from our great inventors data set. These highly talented individuals migrated in
large numbers to the Middle Atlantic, where they increasingly assigned their patents to the large
integrated companies that were concentrated in that region. Great inventors who had studied
science or engineering in college were particularly likely to assign their patents to this type of
firm. Indeed, one advantage of this career option for inventors with scientific training was that
their university credentials enabled them to secure desirable positions early in their careers. The
great disadvantage, of course, was their loss of independence which, Schumpeter suggested, may
have affected their creativity.
Schumpeter’s accounts stops here, but our own analysis suggests that there is much more
to the story—that talented individuals had other ways of gaining access to the resources needed
for effective invention. In particular, technologically creative individuals could become
principals in firms formed for the purpose of exploiting their inventions. This alternative seems
to have been most readily available in Midwestern cities like Cleveland where there were local
pools of venture capital, and we find productive inventors in the East North Central region
commonly assigning their patents to start-up ventures that bore their name. This pattern, along
with the recent emergence in areas like Silicon Valley of similar pockets of entrepreneurship by
the technologically creative, suggests that Schumpeter’s pessimism about the future role for
entrepreneurs in technological innovation was more than a bit extreme.24 Nonetheless, because
inventors who chose this route first had to prove themselves in order to attract capital, they faced 24 Admittedly, by the post-World War II era, large, managerially directed firms had become increasingly dominant, and the number of in-house R&D labs had grown dramatically. See Alfred D. Chandler, Jr., The Visible Hand: The Managerial Revolution in American Business (Cambridge: Harvard University Press, 1977); and David C. Mowery and Nathan Rosenberg, Technology and the Pursuit of Economic Growth (New York: Cambridge University Press, 1989). It is intriguing to consider, however, whether these developments may have owed less to the inherent superiority of large-firm R&D than to the disastrous impact that the Great Depression and the new federal regulatory efforts that followed had on the opportunities for organizing institutions geared toward the provision of venture capital.

30
substantial hurdles to success—hurdles that may help to explain the decline in patenting rates
that occurred in the twentieth century.
31
FIGURE 1
RATE OF PATENTING PER MILLION RESIDENTS OF THE UNITED STATES, 1790-1998
0
100
200
300
400
500
600
1790 1799 1808 1817 1826 1835 1844 1853 1862 1871 1880 1889 1898 1907 1916 1925 1934 1943 1952 1961 1970 1979 1988 1997
All Patents Patents Awarded to U.S. Residents
Source: U.S. Patent Office, “U.S. Patent Activity, 1790-1998,” http://www.uspto.gov/web/offices/ac/ido/oeip/taf/h_counts.htm.

32
FIGURE 2
THE DISTRIBUTION OF GREAT INVENTOR PATENTS BY FORMAL SCHOOLING AND BIRTH COHORT
(PERCENT DISTRIBUTION OF PATENTS)
0
10
20
30
40
50
60
70
80
1739-1794 1795-1819 1820-1845 1846-1865 1866-1885
Prim ary SecondaryCollege Technical
Notes and Sources: Great inventors were classified as having a primary education if they did not attend school beyond age 12 (or did not attend school at all). The secondary-school category includes those who were identified as spending one or more years in an academy or who attended school after the age of 12 but did not attend a college or seminary. Those who spent any time at all in college were counted either in the college category, or (if they attended a school with an engineering orientation or followed a course of study in medicine or a natural science) in the technical category. For more discussion of the data set, see B. Zorina Khan and Kenneth L. Sokoloff, “Institutions and Technological Innovation During Early Economic Growth: Evidence from the Great Inventors of the United States, 1790-1930,” in Institutions and Growth, eds. Theo Eicher and Cecilia Penalosa Garcia (Cambridge, MA: MIT Press, forthcoming).

33
TABLE 1
PATENTS, ASSIGNMENTS AT ISSUE, AND PATENT ATTORNEYS, BY REGION
1870-
1871 1890-1891
1910-1911
New England Patents/Population 775.8 772.0 534.3 % of Patents Assigned 26.5 40.8 50.0 Patent Attorneys/Population ----- 2.7 2.0 Middle Atlantic Patents/Population 563.4 607.0 488.6 % of Patents Assigned 20.6 29.1 36.1 Patent Attorneys/Population ----- 2.2 2.0 East North Central Patents/Population 312.3 429.9 442.3 % of Patents Assigned 14.7 27.9 32.3 Patent Attorneys/Population ----- 1.1 1.1 West North Central Patents/Population 146.5 248.7 272.0 % of Patents Assigned 9.0 21.8 17.5 Patent Attorneys/Population ----- 0.3 0.7 South Patents/Population 85.8 103.1 114.4 % of Patents Assigned 6.4 25.0 22.7 Patent Attorneys/Population ----- 0.1 0.2 West Patents/Population 366.7 381.6 458.4 % of Patents Assigned 0.0 25.4 21.4 Patent Attorneys/Population ----- 0.5 1.1 All Patents, Including Foreign Patents/Population 325.4 360.4 334.2 % of Patents Assigned 18.5 29.1 30.5 Patent Attorneys/Population ----- ----- -----
Notes and Sources: Patents/Population are annual rates of patenting per million residents. The percent of patents assigned (which comes from our three cross-sectional samples for 1870-71, 1890-91, and 1910-11) are the proportion of patents that were assigned before the patent’s date of issue. Patent Attorneys/Population was computed as the ratio of the proportion of attorneys registered with the patent office who were located outside of the District of Columbia to the proportion of the U.S. population. The data are from U.S. Patent Office, Names and Addresses of Attorneys Practicing Before the United States Patent Office (Washington, DC: Government Printing Office, 1883 and 1905).
34
TABLE 2
DISTRIBUTION OF PATENTS BY PATENTEE COMMITMENT TO PATENTING, 1790-1911
Number of “Career” Patents by Patentee 1 Patent 2 Patents 3 Patents 4-5
Patents 6-9
Patents 10+
Patents % % % % % % 1790-1811 51.0 19.0 12.0 7.6 7.0 3.5 1812-1829 57.5 17.4 7.1 7.6 5.5 4.9 1830-1842 57.4 16.5 8.1 8.0 5.6 4.4 1870-1871 21.1 12.5 9.9 15.8 11.8 28.9 1890-1891 19.5 10.3 10.3 10.3 13.8 35.9 1910-1911 33.2 14.3 8.2 9.8 9.4 25.0
Notes and Sources: The figures from 1790 to 1842 are drawn from Kenneth L. Sokoloff and B. Zorina Khan, “The Democratization of Invention During Early Industrialization: Evidence from the United States, 1790-1846,” Journal of Economic History, 50 (June 1990), pp. 363-78. The figures for the later years were computed from our longitudinal “B” data set. This data set consists of patents awarded to the 561 patentees whose surnames began with the letter “B” and who appeared in three random samples drawn from the Annual Reports of the Commissioner of Patents for 1870-71, 1890-91, and 1910-11. We estimated the total number of career patents of each patentee by searching the Annual Reports for the twenty-five years preceding and succeeding their appearance in a sample. Because our sampling ratios decreased are higher for the earlier than the later cross-sections, these figures may slightly overstate the increase in specialization that occurred between the first three and last three time periods. However, because the method used to gather the career patenting totals for the early-nineteenth-century inventors was likely to be a bit more comprehensive than that used for the latter periods (especially 1910-11), there is a slight bias in the other direction as well.

35
TABLE 3
ASSIGNMENT RATES AT ISSUE OF “B” PATENTEES BY CAREER PRODUCTIVITY
Career Patent Total for Patentee Subsamples 1-2 Patents 3-5 Patents 6-9 Patents 10+ Patents 1870-71 mean career patents 1.6 4.1 7.3 28.3 % assigned at issue 17.6 11.4 12.3 24.7 % assigned to companies 1.5 1.4 4.1 8.9 n 68 140 122 749 1890-91 mean career patents 1.5 3.9 7.7 61.0 % assigned at issue 27.1 28.7 39.4 54.4 % assigned to companies 12.9 7.0 17.0 40.5 n 70 129 188 2060 1910-11 mean career patents 1.5 4.0 7.1 107.4 % assigned at issue 15.0 22.0 42.5 62.4 % assigned to companies 3.8 7.7 30.8 56.2 n 133 155 120 1860 Notes and Sources: These estimates were computed for the 545 “B” patents who were residents of the United States at some time during their careers. They include all of the patents these patentees received while living in the U.S. For details on the “B” sample, see Table 2.
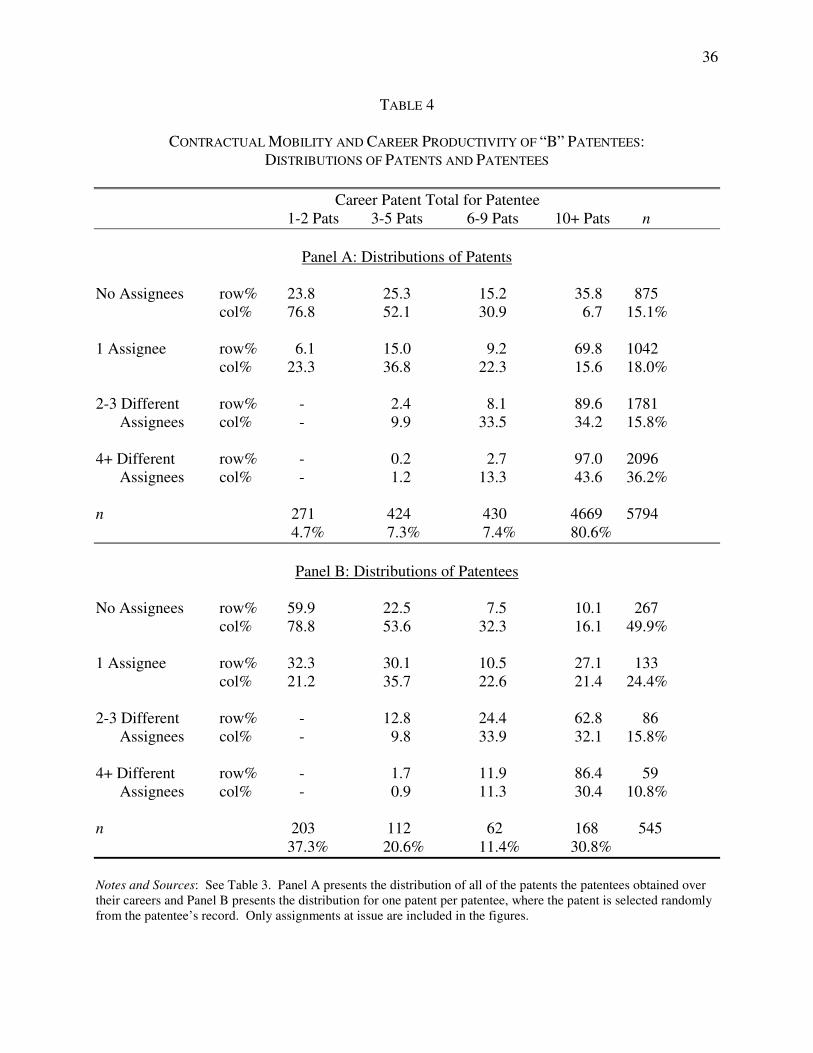
36
TABLE 4
CONTRACTUAL MOBILITY AND CAREER PRODUCTIVITY OF “B” PATENTEES: DISTRIBUTIONS OF PATENTS AND PATENTEES
Career Patent Total for Patentee 1-2 Pats 3-5 Pats 6-9 Pats 10+ Pats n
Panel A: Distributions of Patents No Assignees row% 23.8 25.3 15.2 35.8 875 col% 76.8 52.1 30.9 6.7 15.1% 1 Assignee row% 6.1 15.0 9.2 69.8 1042 col% 23.3 36.8 22.3 15.6 18.0% 2-3 Different row% - 2.4 8.1 89.6 1781 Assignees col% - 9.9 33.5 34.2 15.8% 4+ Different row% - 0.2 2.7 97.0 2096 Assignees col% - 1.2 13.3 43.6 36.2% n 271 424 430 4669 5794 4.7% 7.3% 7.4% 80.6%
Panel B: Distributions of Patentees No Assignees row% 59.9 22.5 7.5 10.1 267 col% 78.8 53.6 32.3 16.1 49.9% 1 Assignee row% 32.3 30.1 10.5 27.1 133 col% 21.2 35.7 22.6 21.4 24.4% 2-3 Different row% - 12.8 24.4 62.8 86 Assignees col% - 9.8 33.9 32.1 15.8% 4+ Different row% - 1.7 11.9 86.4 59 Assignees col% - 0.9 11.3 30.4 10.8% n 203 112 62 168 545 37.3% 20.6% 11.4% 30.8% Notes and Sources: See Table 3. Panel A presents the distribution of all of the patents the patentees obtained over their careers and Panel B presents the distribution for one patent per patentee, where the patent is selected randomly from the patentee’s record. Only assignments at issue are included in the figures.

TABLE 5
CONTRACTUAL MOBILITY OF “GREAT INVENTORS”
number of different assignees over career Birth Cohort no assignees 1 assignee 2 assignees 3 assignees 4 assignees 5 or more assignees n (row %) (row %) (row %) (row %) (row %) (row %) 1820 to 1839
inventors 20.0 22.9 31.4 11.4 8.6 5.7 35 patents 17.2 16.4 32.5 17.0 10.6 6.4 548 1840 to 1859
inventors 8.1 24.3 32.4 2.7 18.9 13.5 37 patents 6.1 14.0 25.1 1.5 18.9 34.5 1117 1860 to 1885
inventors 4.2 37.5 8.3 16.7 8.3 25.0 24 patents 2.3 34.1 5.4 11.3 5.5 41.4 815 All Cohorts
inventors 11.5 27.1 26.0 9.4 12.5 13.5 96 patents 7.3 21.1 20.2 8.2 12.7 30.5 2480
Notes and Sources: The sample of “great inventors” encompasses all of the 249 individuals recognized as important inventors in the Dictionary of American Biography who were born after 1819 and before 1886 and who were active in the U.S. For each person (248 men and 1 woman), we collected biographical information as well as roughly a 20 percent sample of the patents he/she were ever awarded (all patents received before 1847, and then one out of every five years from 1850 through 1930). Here we report the distributions computed over the 96 great inventors for whom we have sampled ten or more patents. Because we have only sampled one fifth of the patents on average and are confining our analysis to assignments at issue, we are underestimating the full extent of contractual mobility.

TABLE 6
REGIONAL PATTERNS OF MIGRATION BY THE GREAT INVENTORS
Birth Cohort 1820-1839 Region of Residence at Date of Patent
Region of Birth New England
Mid-Atlantic Midwest Other U.S. Foreign Total
New England # row % col %
306 73.4
80.7
83 19.9 21.9
25 6.0
24.8
3 0.7 8.6
- - -
417
46.5
Mid-Atlantic # row % col %
35 12.2
9.2
220 76.4 58.1
29 10.1 28.7
4 1.4
11.4
- - -
288
32.1
Midwest # row % col %
- - -
11 26.8
2.9
21 51.2 20.8
9 27.0 25.7
3 7.3
100
41
4.6
Other U.S. # row % col %
2 18.2
0.5
2 18.2
0.5
- - -
7 63.6 20.0
- - -
11
1.2
Foreign # row % col %
36 25.7
9.5
63 45.0 16.6
26 18.6 25.7
15 10.7 42.9
- - -
140
15.6
Total # row %
379 42.3
379 42.3
101 11.3
35 3.9
3 0.3
897

39
Birth Cohort 1840-1859 Region of Residence at Date of Patent
Region of Birth New England
Mid-Atlantic Midwest Other U.S. Foreign Total
New England # row % col %
51 27.9 17.9
94 51.4 15.1
9 4.9 2.9
4 2.2 6.4
25 13.7 78.1
183
13.9
Mid-Atlantic # row % col %
30 12.7 10.5
149 63.1 23.9
51 21.6 16.3
2 0.9 3.2
4 1.7
12.5
236
17.9
Midwest # row % col %
3 0.8 1.1
207 53.6 33.2
167 43.3 53.4
7 1.8
11.1
2 0.5 6.3
386
29.3
Other U.S. # row % col %
1 1.8 0.4
9 16.4
1.4
8 14.6
2.6
37 67.3 58.7
- - -
55
4.2
Foreign # row % col %
200 43.9 70.2
164 36.0 26.3
78 17.1 24.9
13 2.9
20.6
1 0.2 3.1
456
34.7
Total # row %
285 21.7
623 47.3
313 23.8
63 4.8
32 2.4
1316

40
Birth Cohort 1860-1885 Region of Residence at Date of Patent
Region of Birth
New
England Middle Atlantic Midwest Other U.S. Foreign Total
New England # row % col %
58 27.0 43.3
156 72.6 25.8
1 0.5 0.8
- - -
- - -
215
23.5
Middle Atlantic # row % col %
42 11.3 31.3
286 76.7 47.4
40 10.7 33.1
5 1.3 8.8
- - -
373
40.7
Midwest # row % col %
2 1.4 1.5
43 29.1
7.1
78 52.7 64.5
25 16.9 43.9
- - -
148
16.2
Other U.S. # row % col %
- - -
7 43.8
1.2
0 0.0 0.0
9 56.3 15.8
- - -
16
1.75
Foreign # row % col %
32 19.5 23.9
112 68.3 18.5
2 1.2 1.7
18 11.0 31.6
- - -
164
17.9
Total # row %
134 14.6
604 65.9
121 13.2
57 6.2
- -
916
Notes and Sources: See Table 5 and the text.
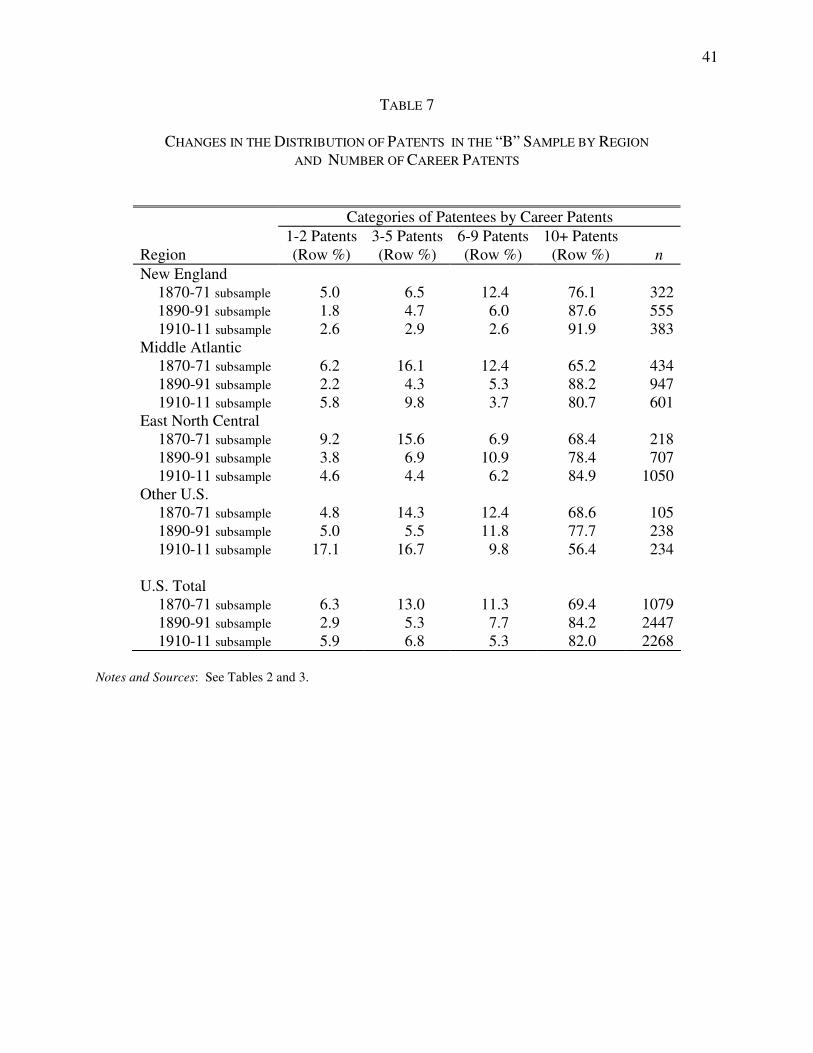
41
TABLE 7
CHANGES IN THE DISTRIBUTION OF PATENTS IN THE “B” SAMPLE BY REGION AND NUMBER OF CAREER PATENTS
Categories of Patentees by Career Patents 1-2 Patents 3-5 Patents 6-9 Patents 10+ Patents Region (Row %) (Row %) (Row %) (Row %) n New England 1870-71 subsample 5.0 6.5 12.4 76.1 322 1890-91 subsample 1.8 4.7 6.0 87.6 555 1910-11 subsample 2.6 2.9 2.6 91.9 383 Middle Atlantic 1870-71 subsample 6.2 16.1 12.4 65.2 434 1890-91 subsample 2.2 4.3 5.3 88.2 947 1910-11 subsample 5.8 9.8 3.7 80.7 601 East North Central 1870-71 subsample 9.2 15.6 6.9 68.4 218 1890-91 subsample 3.8 6.9 10.9 78.4 707 1910-11 subsample 4.6 4.4 6.2 84.9 1050 Other U.S. 1870-71 subsample 4.8 14.3 12.4 68.6 105 1890-91 subsample 5.0 5.5 11.8 77.7 238 1910-11 subsample 17.1 16.7 9.8 56.4 234 U.S. Total 1870-71 subsample 6.3 13.0 11.3 69.4 1079 1890-91 subsample 2.9 5.3 7.7 84.2 2447 1910-11 subsample 5.9 6.8 5.3 82.0 2268
Notes and Sources: See Tables 2 and 3.

42
TABLE 8
CHANGES IN THE CONTRACTUAL MOBILITY OF “B” PATENTEES, BY REGION
Region of Patentee Number of Assignees
at Issue
New England (Col. %)
Middle Atlantic (Col. %)
East North Central
(Col. %)
Other U.S.
(Col. %)
n No Assignees 1870-71 subsample 51.2 64.8 60.5 57.1 87 1890-91 subsample 25.7 42.4 36.7 41.7 69 1910-11 subsample 34.8 48.4 55.0 60.4 111 1 Assignee 1870-71 subsample 39.0 18.5 26.3 14.3 38 1890-91 subsample 28.6 12.1 38.3 33.3 49 1910-11 subsample 17.4 29.0 13.8 27.1 46 2-3 Different Assignees 1870-71 subsample 2.4 9.3 5.3 21.4 11 1890-91 subsample 25.7 25.8 16.7 12.5 39 1910-11 subsample 34.8 12.9 18.8 10.4 36 4+ Different Assignees 1870-71 subsample 7.3 7.4 7.9 7.1 11 1890-91 subsample 20.0 19.7 8.3 12.5 28 1910-11 subsample 13.0 9.7 12.5 2.1 20 # of Patentees (n) 1870-71 subsample 41 54 38 14 147 1890-91 subsample 35 66 60 24 185 1910-11 subsample 23 62 80 48 213
Notes and Sources: See Tables 2 and 3. Each inventor is represented in the table by one patent that was randomly selected from the patentee’s record.
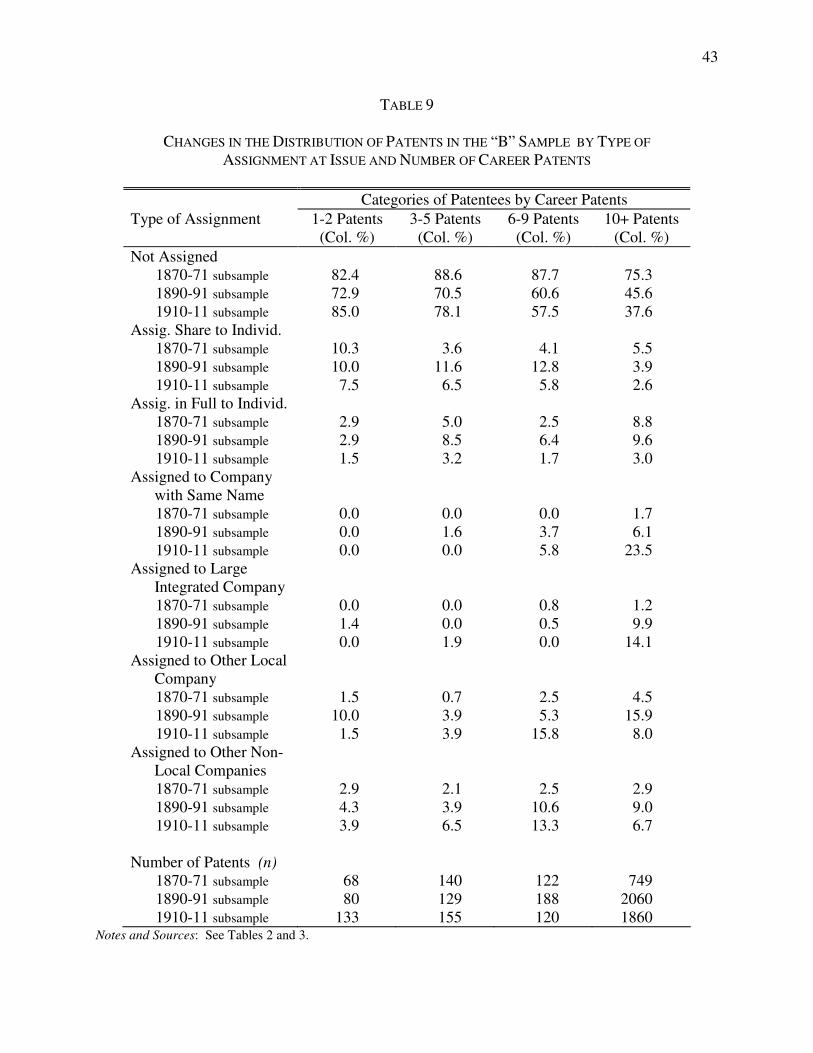
43
TABLE 9
CHANGES IN THE DISTRIBUTION OF PATENTS IN THE “B” SAMPLE BY TYPE OF ASSIGNMENT AT ISSUE AND NUMBER OF CAREER PATENTS
Categories of Patentees by Career Patents Type of Assignment 1-2 Patents
(Col. %) 3-5 Patents
(Col. %) 6-9 Patents
(Col. %) 10+ Patents
(Col. %) Not Assigned 1870-71 subsample 82.4 88.6 87.7 75.3 1890-91 subsample 72.9 70.5 60.6 45.6 1910-11 subsample 85.0 78.1 57.5 37.6 Assig. Share to Individ. 1870-71 subsample 10.3 3.6 4.1 5.5 1890-91 subsample 10.0 11.6 12.8 3.9 1910-11 subsample 7.5 6.5 5.8 2.6 Assig. in Full to Individ. 1870-71 subsample 2.9 5.0 2.5 8.8 1890-91 subsample 2.9 8.5 6.4 9.6 1910-11 subsample 1.5 3.2 1.7 3.0 Assigned to Company
with Same Name
1870-71 subsample 0.0 0.0 0.0 1.7 1890-91 subsample 0.0 1.6 3.7 6.1 1910-11 subsample 0.0 0.0 5.8 23.5 Assigned to Large
Integrated Company
1870-71 subsample 0.0 0.0 0.8 1.2 1890-91 subsample 1.4 0.0 0.5 9.9 1910-11 subsample 0.0 1.9 0.0 14.1 Assigned to Other Local
Company
1870-71 subsample 1.5 0.7 2.5 4.5 1890-91 subsample 10.0 3.9 5.3 15.9 1910-11 subsample 1.5 3.9 15.8 8.0 Assigned to Other Non-
Local Companies
1870-71 subsample 2.9 2.1 2.5 2.9 1890-91 subsample 4.3 3.9 10.6 9.0 1910-11 subsample 3.9 6.5 13.3 6.7 Number of Patents (n) 1870-71 subsample 68 140 122 749 1890-91 subsample 80 129 188 2060 1910-11 subsample 133 155 120 1860
Notes and Sources: See Tables 2 and 3.

TABLE 10
CHANGE OVER BIRTH COHORTS IN THE TYPES OF ASSIGNMENTS AT ISSUE MADE BY GREAT INVENTORS
Assignment Type Birth Cohort Not Assigned Individual Family-Name Large Integrated Other n Company Company Company 1820 to 1839 patents (%) 69.5 9.6 7.1 1.5 12.3 908 1840 to 1859
patents (%) 56.5 5.6 11.3 11.8 14.8 1351 1860 to 1885
patents (%) 35.3 3.5 14.3 27.0 19.9 921 ___________________ All Cohorts
patents (%) 54.1 6.1 11.0 13.3 15.6 3180
Notes and Sources: See Table 5.

TABLE 11
CHANGES IN THE DISTRIBUTION OF PATENTS IN THE “B” SAMPLE BY TYPE OF ASSIGNMENT AT ISSUE AND STAGE OF PATENTEE’S CAREER
Stage of Career
� 5 Years Since First
Patent
> 5 Years and � 15
Years Since First Patent
> 15 Years Since First
Patent Type of Assignment at Issue (Col. %) (Col. %) (Col. %) Not Assigned 1870-71 subsample 81.9 75.3 68.9 1890-91 subsample 62.0 52.7 36.6 1910-11 subsample 45.6 50.3 29.7 Assigned Share to Individual 1870-71 subsample 6.2 6.7 3.6 1890-91 subsample 4.0 5.4 3.0 1910-11 subsample 6.9 4.0 0.8 Assigned in Full to Individual 1870-71 subsample 4.1 11.4 10.8 1890-91 subsample 12.1 11.1 8.0 1910-11 subsample 7.2 3.1 1.8 Assigned to Company with Same Name 1870-71 subsample 0.4 0.0 4.8 1890-91 subsample 2.2 4.2 8.4 1910-11 subsample 1.3 17.1 32.6 Assigned to Large Integrated Company 1870-71 subsample 0.0 0.0 0.0 1890-91 subsample 7.1 6.3 12.9 1910-11 subsample 12.1 7.3 17.8 Assigned to Other Local Company 1870-71 subsample 6.6 3.1 7.6 1890-91 subsample 8.4 15.1 18.6 1910-11 subsample 17.1 11.7 3.8 Assigned to Other Company 1870-71 subsample 0.8 3.5 4.4 1890-91 subsample 4.3 5.4 12.6 1910-11 subsample 9.8 6.5 5.9 Number of Patents (n) 1870-71 subsample 243 255 251 1890-91 subsample 323 651 1086 1910-11 subsample 305 479 1076

46
Notes and Sources: See Tables 2 and 3. Only patents awarded to patentees with ten or more career patents are included in this table.

47
TABLE 12
CHANGES IN THE DISTRIBUTION OF GREAT-INVENTOR PATENTS BY TYPE OF ASSIGNMENT AT ISSUE AND EDUCATIONAL BACKGROUND
Educational Background
Primary or Secondary Education
College in
Non-Scientific Subject
College in Engineering,
Natural Science, or Medicine
Type of Assignment at Issue (Col. %) (Col. %) (Col. %) Not Assigned 1820-1839 Birth Cohort 64.9 82.0 82.9 1840-1859 Birth Cohort 49.9 63.1 64.9 1860-1885 Birth Cohort 49.1 44.0 24.5 Assigned to Individual 1820-1839 Birth Cohort 11.2 3.1 7.2 1840-1859 Birth Cohort 5.8 8.6 2.9 1860-1885 Birth Cohort 4.7 7.9 0.9 Assigned to Company with Same Name 1820-1839 Birth Cohort 8.4 3.9 2.7 1840-1859 Birth Cohort 11.5 1.4 19.0 1860-1885 Birth Cohort 3.5 25.0 14.8 Assigned to Large Integrated Company 1820-1839 Birth Cohort 1.8 0.8 0.9 1840-1859 Birth Cohort 15.3 11.1 4.9 1860-1885 Birth Cohort 11.2 12.5 41.4 Assigned to Other Company 1820-1839 Birth Cohort 13.8 10.2 6.3 1840-1859 Birth Cohort 17.5 15.8 8.3 1860-1885 Birth Cohort 31.5 10.7 18.4 Number of Patents (n) 1820-1839 Birth Cohort 669 128 111 1840-1859 Birth Cohort 724 279 348 1860-1885 Birth Cohort 232 216 473
Notes and Sources: See Figure 2 and Table 5.

48
TABLE 13
CHANGES IN THE DISTRIBUTION OF GREAT-INVENTOR PATENTS BY TYPE OF ASSIGNMENT AT ISSUE AND REGION
Region New
England Middle Atlantic
East North Central
Type of Assignment at Issue (Col. %) (Col. %) (Col. %) Not Assigned 1820-1839 Birth Cohort 58.8 76.8 81.2 1840-1859 Birth Cohort 47.7 60.9 52.4 1860-1885 Birth Cohort 35.1 33.6 32.2 Assigned to Individual 1820-1839 Birth Cohort 9.0 12.9 2.0 1840-1859 Birth Cohort 2.4 7.6 6.1 1860-1885 Birth Cohort 5.2 2.8 2.5 Assigned to Company with Same Name 1820-1839 Birth Cohort 11.6 4.5 2.0 1840-1859 Birth Cohort 19.2 5.4 17.9 1860-1885 Birth Cohort 6.0 13.3 25.6 Assigned to Large Integrated Company 1820-1839 Birth Cohort 2.4 0.5 3.0 1840-1859 Birth Cohort 25.8 9.1 7.0 1860-1885 Birth Cohort 22.4 30.5 26.5 Assigned to Other Company 1820-1839 Birth Cohort 18.2 5.3 11.9 1840-1859 Birth Cohort 4.9 17.0 16.6 1860-1885 Birth Cohort 31.3 19.9 13.2 Number of Patents (n) 1820-1839 Birth Cohort 379 379 101 1840-1859 Birth Cohort 287 647 313 1860-1885 Birth Cohort 134 604 121
Notes and Sources: See Table 5.
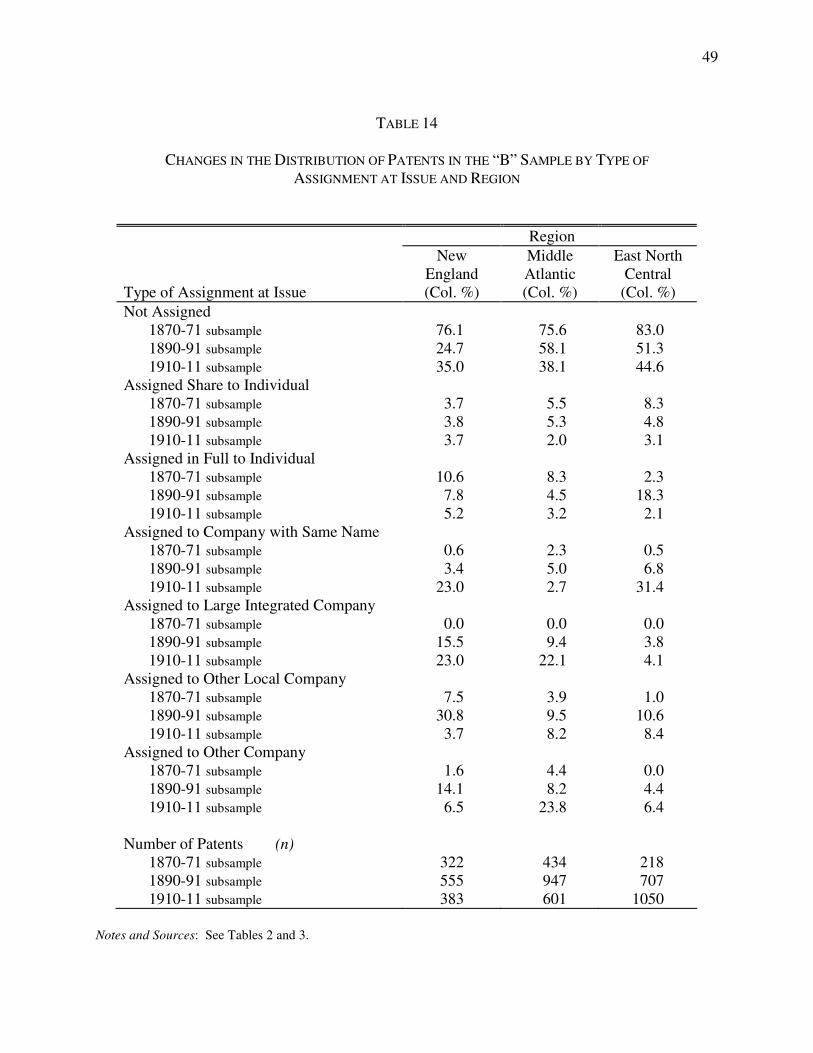
49
TABLE 14
CHANGES IN THE DISTRIBUTION OF PATENTS IN THE “B” SAMPLE BY TYPE OF
ASSIGNMENT AT ISSUE AND REGION
Region New
England Middle Atlantic
East North Central
Type of Assignment at Issue (Col. %) (Col. %) (Col. %) Not Assigned 1870-71 subsample 76.1 75.6 83.0 1890-91 subsample 24.7 58.1 51.3 1910-11 subsample 35.0 38.1 44.6 Assigned Share to Individual 1870-71 subsample 3.7 5.5 8.3 1890-91 subsample 3.8 5.3 4.8 1910-11 subsample 3.7 2.0 3.1 Assigned in Full to Individual 1870-71 subsample 10.6 8.3 2.3 1890-91 subsample 7.8 4.5 18.3 1910-11 subsample 5.2 3.2 2.1 Assigned to Company with Same Name 1870-71 subsample 0.6 2.3 0.5 1890-91 subsample 3.4 5.0 6.8 1910-11 subsample 23.0 2.7 31.4 Assigned to Large Integrated Company 1870-71 subsample 0.0 0.0 0.0 1890-91 subsample 15.5 9.4 3.8 1910-11 subsample 23.0 22.1 4.1 Assigned to Other Local Company 1870-71 subsample 7.5 3.9 1.0 1890-91 subsample 30.8 9.5 10.6 1910-11 subsample 3.7 8.2 8.4 Assigned to Other Company 1870-71 subsample 1.6 4.4 0.0 1890-91 subsample 14.1 8.2 4.4 1910-11 subsample 6.5 23.8 6.4 Number of Patents (n) 1870-71 subsample 322 434 218 1890-91 subsample 555 947 707 1910-11 subsample 383 601 1050
Notes and Sources: See Tables 2 and 3.