nber working paper series tax-exempt lobbying
TRANSCRIPT
NBER WORKING PAPER SERIES
TAX-EXEMPT LOBBYING:CORPORATE PHILANTHROPY AS A TOOL FOR POLITICAL INFLUENCE
Marianne BertrandMatilde Bombardini
Raymond FismanFrancesco Trebbi
Working Paper 24451http://www.nber.org/papers/w24451
NATIONAL BUREAU OF ECONOMIC RESEARCH1050 Massachusetts Avenue
Cambridge, MA 02138March 2018
Bertrand: University of Chicago Booth School of Business and NBER; Bombardini: University of British Columbia, CIFAR, and NBER; Fisman: Boston University and NBER; Trebbi: University of British Columbia, CIFAR, and NBER. We would like to thank Dave Baron, Matthew Gentzkow and participants at the 2017 meeting of the Canadian Economics Association and seminar participants at Stanford GSB, University of Texas-Austin, NYU, Princeton, UCLA, Warwick, LSE and Yale. Bombardini and Trebbi acknowledge financial support from CIFAR and SSHRC. Ken Norris, Dina Rabinovitz, Juan Felipe Riano, Varit Senapitak, and Ana-Maria Tenekedjieva provided excellent research assistance. The views expressed herein are those of the authors and do not necessarily reflect the views of the National Bureau of Economic Research.
NBER working papers are circulated for discussion and comment purposes. They have not been peer-reviewed or been subject to the review by the NBER Board of Directors that accompanies official NBER publications.
© 2018 by Marianne Bertrand, Matilde Bombardini, Raymond Fisman, and Francesco Trebbi. All rights reserved. Short sections of text, not to exceed two paragraphs, may be quoted without explicit permission provided that full credit, including © notice, is given to the source.

Tax-Exempt Lobbying: Corporate Philanthropy as a Tool for Political InfluenceMarianne Bertrand, Matilde Bombardini, Raymond Fisman, and Francesco TrebbiNBER Working Paper No. 24451March 2018JEL No. G28,P16,P48
ABSTRACT
We explore the role of charitable giving as a means of political influence, a channel that has been heretofore unexplored in the political economy literature. For philanthropic foundations associated with Fortune 500 and S&P500 corporations, we show that grants given to charitable organizations located in a congressional district increase when its representative obtains seats on committees that are of policy relevance to the firm associated with the foundation. This pattern parallels that of publicly disclosed Political Action Committee (PAC) spending. As further evidence on firms’ political motivations for charitable giving, we show that a member of Congress’s departure leads to a short-term decline in charitable giving to his district, and we again observe similar patterns in PAC spending. Charities directly linked to politicians through personal financial disclosure forms filed in accordance to Ethics in Government Act requirements exhibit similar patterns of political dependence. Our analysis suggests that firms deploy their charitable foundations as a form of tax-exempt influence seeking. Based on a straightforward model of political influence, our estimates imply that 7.1 percent of total U.S. corporate charitable giving is politically motivated, an amount that is economically significant: it is 280 percent larger than annual PAC contributions and about 40 percent of total federal lobbying expenditures. Given the lack of formal electoral or regulatory disclosure requirements, charitable giving may be a form of political influence that goes mostly undetected by voters and shareholders, and which is directly subsidized by taxpayers.
Marianne BertrandBooth School of Business University of Chicago5807 South Woodlawn Avenue Chicago, IL 60637and [email protected]
Matilde BombardiniVancouver School of Economics University of British Columbia 6000 Iona DriveVancouver, BC V6T 1L4 CANADAand CIFAR and RCEAand also [email protected]
Raymond Fisman Department of Economics Boston University270 Bay State Road, 304A Boston, MA 02215and [email protected]
Francesco TrebbiUniversity of British Columbia 6000 Iona DriveVancouver, BC V6T 1L4 Canadaand CIFARand also [email protected]
1 Introduction
Representative Joe Baca has achieved near celebrity status in his suburban Los Ange-
les district...a charity his family set up three years ago to aid local organizations. It
provides another benefit, too: helping the Democratic congressman run something akin
to a permanent political campaign...But unlike most private foundations, Mr. Baca’s
gets little of its money from its founders’ pockets. Instead, local companies and major
corporations that have often turned to Mr. Baca’s Washington office for help, and
usually succeed in getting it, are the chief donors.
[“Congressional Charities Pulling In Corporate Cash”, New York Times, Sep 5, 2010]
[Joe Barton] the top Republican on the House Energy and Commerce Committee op-
erates a foundation that has raised donations from the industries his committee over-
sees...taking credit when companies give directly to community groups in the founda-
tion’s name - essentially bypassing a 2007 congressional requirement that donations
from lobbying interests to lawmakers’ charities be disclosed...The Barton foundation
also promised...to help build a $1.2 million Boys and Girls Club in Corsicana, Texas,
and those attending the meeting “burst into applause” ... Texas Monthly magazine re-
ported in 2005...The [Exelon] contribution was made at a time when Mr. Barton...was
proposing legislation that would help expand the market for nuclear energy. Exelon
also had been negotiating for government approval to build a multimillion-dollar nu-
clear power plant in Mr. Barton’s home state.
[“EXCLUSIVE: Barton’s foundation not so charitable” The Washington Times, Apr
6, 2009]
In the United States, as in any representative democracy, legislators are tasked with creating
laws that serve voters’ interests. Politicians, however, are thought to be influenced via a number
of channels that may untether the link from voter well-being to legislative decisions. Lawmakers
rely on donations from individuals and businesses to run their campaigns, they may be promised
lucrative jobs or board appointments after exiting politics, and they may be cajoled, rather than
merely informed, by lobbyists. The extent to which we should concern ourselves with special
interests’ influence (the broader connotation of the term lobbying used in this paper’s title), and
the effectiveness of potential regulatory responses, are governed by both the degree of influence and
the potential strategic responses to the tightening of campaign finance rules or other regulations.
2
A large literature that straddles economics, law, and political science aims to study both
the amount of money in politics, as well as its influence. With few exceptions, past research
has tended to focus on campaign finance and lobbying, which are easily observable both to the
researcher as well as to the electorate. This visibility is a result of explicit legislative provisions
that serve to inform voters of large monetary transfers to politicians, thereby tracing special
interest influence in politics.1 The amounts of money involved in these channels – as well as the
outsized influence per dollar that some papers measure (Ansolabehere et al., 2003) – have led
to concerns that these observable channels may be a small subset of the broader mechanisms by
which special interests influence politics (for example, through voter mobilization, Bombardini
and Trebbi, 2011). To better understand the scale and scope of influence-seeking activities it is
necessary to assess the existence, and potential importance, of other channels. This may be also
required for an informed assessment of corporate governance regulations, as suggested by Bebchuk
et al. (2010), who advocate that the government “develop rules to require public companies to
disclose to shareholders the use of corporate resources for political activities.”
This paper provides systematic empirical evidence that corporate philanthropy serves as a tool
of political influence in American politics, involving sums that are economically significant when
compared to other channels of influence seeking.
We begin by examining whether companies use corporate social responsibility (CSR), more
specifically their charitable foundations, to cater to the interests of politicians who are particularly
important to the firm’s profitability. To this end, we assembled a data set based on the IRS Form
990 tax returns from the (tax-exempt) charitable foundations funded by Fortune 500 and S&P
500 corporations. Schedule I of the Form 990 includes information on all charities (typically
organizations claiming 501(c)(3) tax-exempt status) funded by the foundation, as well as the
dollar value of their charitable grant giving.
Using a combination of lobbying data and congressional committee assignments, we generate
a time-varying, pair-specific measure that links company interests to specific legislators, which we
then show is predictive of donations by the company’s foundation to charities in the legislator’s own
district and charities for which the legislator sits on the board. To construct this measure for our
empirical analysis, we employ issues listed in lobbying disclosure forms available from the Senate
Office of Public Records under the dictate of the Lobbying Disclosure Act of 1995 to link corporate
interests to specific congressional committees, which in turn allows us to link companies’ interests
to specific lawmakers based on (time-varying) congressional committee assignments. That is, we
use the data to construct, for each company-legislator pair, a variable which captures the number
1See, for example, the Federal Election Campaign Act of 1972 and the Lobbying Disclosure Act of 1995. Fora review of empirical and theoretical analyses based on the disclosure data, see Stratmann (2005). For lobbyingspecifically, see Bertrand et al. (2014).
3

of legislative issues covered both in a company’s federal lobbying disclosures and by committees
that include the legislator as a member. As an illustrative example, consider the case of Congress
member Joe Baca, cited in the New York Times quote above. Baca was a member of the House
of Representatives between 2003-2013 and in 2007 the Joe Baca Foundation was established in
San Bernardino, California, in his district. In 2010 the Walmart Foundation gave $6,000 to this
charity when Baca was sitting on the Financial Services Committee. At the time Walmart Stores
was battling Visa/Mastercard on credit card fees and multiple financial issues, as disclosed in
multiple lobbying reports filed by lobbying firms Patton Boggs LLP, Bryan Cave LLP, Cornerstone
Government Affairs LLP, all hired by the corporation.
We then use this measure to explore whether donations directed at a politicians’ charities (ei-
ther those in her constituency or those for which she sits on the board) vary as a function of the
number of issues covered. We emphasize that our identification strategy, by exploiting turnover
in committee membership, and issue relevance to a firm, to generate within-legislator variation in
issues covered, credibly rules out the possibility that companies simply provide donations to like-
minded representatives and/or have non-political interests in supporting particular geographies.
In our most stringent specification, we include firm-congressional district fixed effects which absorb
all time-invariant pair-specific effects. Because we employ time variation in the issues of relevance
for a given firm across different Congresses based on its lobbying activities, we are also simulta-
neously controlling for self-selection of firms into charitable giving and for any fixed firm-specific
unobservables. We additionally analyze how legislator exits affect the flow of donations into a
district, again using within-district variation based on legislator turnover to detect the political
sensitivity of charitable giving.
To understand how charitable contributions directed to a congressional district may serve as
a useful channel of political influence, one can build on the notion of credit-claiming by self-
motivated politicians, an idea in political economy and political science that dates back at least to
David Mayhew’s observation that “Credit claiming is highly important to congressmen, with the
consequence that much of congressional life is a relentless search for opportunities to engage in
it.” (Mayhew, 1974, p.53).2 Although it is typically discussed in the context of federal grants and
earmarks, political credit-claiming of local charities is a natural means of appealing to voters, given
the visibility of many charities to politicians’ constituencies. To provide some context, the close
relationship between the Washington State Farmworker Housing Trust and Washington’s senior
Senator, Patricia Murray, serves as an instructive example. Senator Murray’s official webpage
features the charitable organization in describing her work on housing, stating “I was proud to
help establish the Washington State Farmworker Housing Trust to help families who work hard
2For a recent discussion see Grimmer et al. (2012).
4
to keep one of our state’s most important industries strong. . . ”.3 According to a report by the
Sunlight Foundation, “[t]he charity’s donors include the foundations of JPMorgan Chase, Bank
of America and Wells Fargo, yet only JPMorgan reported gifts to the charity to the Senate.”4
The same report discusses a similar case involving Utah Senator Orrin Hatch and the local Utah
Families Foundation, a beneficiary of grants by the charitable arms of many large banks and
pharmaceutical companies. Senator Hatch often attends golf tournaments for the charity, which
provide both visibility in his home state and the opportunity to interact with powerful donors.5
We summarize our main results as follows. We begin by documenting a very robust posi-
tive relationship between charitable contributions and a more direct channel of political influence,
political action committee (PAC) contributions.6 This correlation survives the inclusion of con-
stituency fixed effects and a battery of robustness checks, suggestive of political forces at play in
charitable giving.
We then show that our proxy for a politician’s relevance to a firm through committee assign-
ment is correlated with donations by the firm’s charity to recipient charities in the politician’s
constituency (again, robust to the inclusion of constituency fixed effects). We similarly find a
strong link between a politician’s relevance to a company and its PAC contributions to the legis-
lator, a finding that is complementary to more standard extant research in political economy and
political science.7 As an alternative approach to linking corporate charity to political motivations,
we show that legislators’ exits induces a decline (and then a recovery) in charitable giving the
departing politicians’ congressional districts, as their replacements are by definition of lower rank.
Importantly, this pattern is very similar for PAC contributions.
As an alternative measure linking politicians’ interests to individual charities, we use infor-
mation on board memberships from politicians’ annual financial disclosures to explore whether
companies attempt to influence relevant legislators via donations to charities of personal interest
to them. In our first analysis using these data, we show that a non-profit is more than four times
more likely to receive grants from a corporate foundation if a politician sits on its board, control-
ling for the non-profit’s state as well as fine-grained measures of its size and sector. We then go on
3https://www.murray.senate.gov/public/index.cfm/ruralhousing Accessed last December 16, 20174http://web.archive.org/web/20160922002911/http://sunlightfoundation.com/blog/2011/07/12/some-
lobbyists-gifts-lawmakers-pet-causes-remain-dark/ last accessed December 23, 2017.5A more malignant form of political influence through charitable giving is made possible by the outright em-
bezzlement of the recipient charity’s funds by a politician, which effectively allows the politician to use the charityas a front for extracting bribes. Former Florida Representative Corinne Brown was sentenced to 5 years in prisonin December 2017 for misusing and appropriating funding of the One Door for Education, a nonprofit dedicated tosupporting financially disadvantaged students. Former Pennsylvania Representative Chaka Fattah was convictedin 2016 for a similar misuse of funds from the Educational Advancement Alliance, a local charity, for personal useand racketeering.
6Because it supplies more variation both cross-sectionally and over time, the focus in most of our analysis is onthe House of Representatives.
7For a recent contribution see Powell and Grimmer (2016).
5

to show, in results paralleling those described in the preceding paragraphs, that a foundation is
more likely to give to a politician-connected non-profit if the politician sits on committees lobbied
by the firm.
To gauge the magnitudes of the effects we document, we present the analysis of a political
influence setting, with PAC and charitable contributions as inputs whose productivity depends
on the influence of the targeted legislator. The reader versed in special interest politics may
think of this framework as a reduced-form representation of a quid-pro-quo political models (see
Grossman and Helpman, 2001). Our model assumes that, while only a fraction of corporate charity
is politically motivated, PAC contributions are, by definition, driven entirely by political concerns.
Based on this intuitive assumption, this framework yields the result that the fraction of corporate
charity that is politically motivated is the ratio of the charity-issues-covered elasticity (0.053) to
the PAC-issues-covered elasticity (0.742), that is 7.1 percent. For firms in our sample, the implied
scale of politically-motivated charity is higher than PAC giving, since total charitable giving per
congressional district ($15,078) is so much higher than average per district PAC contributions
($368). If we assume that 7.1 percent of the $18 billion in total corporate charitable contributions
made in 2014 is politically motivated, the implied dollar value of political charitable giving is about
$1.3 billion in that year, 280 percent higher than annual PAC contributions made to candidates
in the 2013-14 cycle, and about 40 percent of total annual lobbying expenditures in 2014.
Our results indicate that corporate foundations act, at least in part, as a means of influencing
government decision-makers which, broadly speaking, potentially leads to welfare loss, as policies
are distorted away from the voters’ optimum as a result of quid-pro-quo politics.8 This per se
contributes to our general understanding of the role of corporate social responsibility, although
offering a somewhat more nuanced and less optimistic perspective than much prior literature. In
addition, we see our findings as highlighting the need to go beyond easily-observable channels in
order to gain a broader appreciation of the full role of corporate influence in politics, to both
understand the potential welfare loss from different channels of political influence seeking as well
as inform the design of regulation. Grassroots operations, dark money in the form of 501(c)(4)
organizations, shadow lobbying and other covert forms of influence are already pervasive.9 Our
findings suggest that caution is in order in limiting influence through oversight of easily documented
channels. This may merely lead to displacement of influence-peddling to less visible channels. At
the very least the potential for such displacement effects should be fully considered in policy design
8These are welfare losses akin to those arising in menu auction models a la Grossman and Helpman (1994).Such losses are central to a large literature on political capture and rent seeking in political economy and cannotbe a priori excluded as a consequence of the politically-motivated charitable giving (see Grossman and Helpman,2001 ch. 7).
9For shadow lobbying see LaPira and Thomas, 2014 and for the use of trade associations in lobbying seeBombardini and Trebbi (2012).
6

or campaign finance and lobbying disclosure regulation.
We also see a number of potentially significant sources of welfare loss that are more specific
to the type of influence seeking channel we document in our paper. First, there is the loss of
information that may be useful to voters in forming their decision strategies. While foundation
grantees are disclosed via tax records, the link to political interests is far from transparent, which
makes influence of the sort described in the preceding paragraphs extremely hard for voters and
the media to infer or to monitor systematically. In fact, charitable giving is even afforded the right
to anonymity under the law along several dimensions. Yet such grants, sometimes extending into
the tens of millions of dollars,10 appear to warrant disclosure and regulation in “the prevention of
corruption or the appearance of corruption spawned by the real or imagined coercive influence of
large financial contributions on candidates’ positions and on their actions if elected to office.”11
A second source of welfare loss results from the tax subsidization of what amounts to the
political voice of certain special interests. Foundations taking a 501(c)(3) organizational form for
tax purposes are explicitly prohibited by the 1954 Johnson amendment to the U.S. tax code to
“participate in, or intervene in (including the publishing or distributing of statements), any political
campaign on behalf of (or in opposition to) any candidate for public office.” This provision aims to
exclude direct tax subsidization of political voice for selected groups. While the First Amendment
of the U.S. Constitution prevents Congress from abridging the freedom of speech, it does not
guarantee the public subsidization of certain voices over others. Unlike lobbying or campaign
contributions, charitable giving potentially represent a tax-advantaged and hard-to-trace form of
influence.
A third source of welfare loss, borne by corporate shareholders, could arise due to the lack of
information and transparency in the use of corporate funds for political charitable giving. Bebchuk
and Jackson (2013) provide empirical evidence in support of the view that disclosure of corporate
political giving is a necessary governance tool for shareholders to assure that such funds are used in
their own interests. The philanthropic foundations in our setting display a similar degree of opacity
as the active intermediaries (trade associations, umbrella coalitions, third party organizations, and
other) that Bebchuk and Jackson (2013) discuss in their work, and for which they present a strong
case for potential conflicts of interests between management and shareholders. In essence, the
opacity of this channel compounds the accountability argument raised by Friedman (1970).
Finally, there are welfare losses due to the misallocation of charitable funds. If we start from
the premise that corporations allocate their charitable grant giving across recipients based on their
10The largest aggregate grant recorded in our dataset is a charitable contribution of 62.7 million dollars by theGoldman Sachs Philantrophy Fund to charities in Minnesota’s 5th District. The largest campaign contributionrecorded is $25,000, a result of the $5,000 maximum cap by PACs for each election — primary and general -– andcandidate, on a two year election cycle.
11Buckley vs. Valeo, 1(1976) U.S. Supreme Court
7

quality and on the desirability of a charity’s services to its community, then the optimal allocation
of charitable funds may be distorted by political motivations. A charity whose work is not very
valuable to the community may get funding nonetheless, because it sits in the right congressional
district, while an efficient charity may lose funding for the opposite reason.
We contribute most directly to the literature on corporate influence in politics, particularly in
the U.S. Most work in this area has emphasized influence via campaign contributions (see Gross-
man and Helpman, 2001, Milyo et al., 2000, and Ansolabehere et al., 2003 for earlier overviews12)
or lobbying (e.g. de Figueiredo and Silverman, 2006, Vidal et al., 2012, Bertrand et al., 2014,
Drutman, 2015 or from a more structural perspective Kang, 2016 and Kang and You, 2016). As
emphasized by Stratmann (2005) and de Figueiredo and Richter (2014), interpretation of many
of these papers is clouded by issues of causation – do corporations support candidates because of
preexisting shared policy preferences, or because they wish to buy influence? A number of more
recent papers share our approach of exploiting committee assignments as a means of generating
credible causal identification.13 Others exploit exits of politicians.14
Our research also contributes to an entirely distinct literature on the motivations of firms to
engage in pro-social activities, such as charitable giving. Much of this research focuses on whether
and how firms can “do well by doing good,” to the extent that ethical conduct is demanded
by consumers, employees, investors, or other stakeholders (see, e.g. Margolis et al., 2009 for an
overview). Our findings turn the standard argument on its head. If corporations’ good deeds (in
the form of charitable contributions) cater to politicians’ interests, who as a result put the interests
of business ahead of those of voters, the overall welfare effects are ambiguous – society benefits via
increased charity, at the potentially high cost of distorting laws and regulation. We expand on this
discussion in the next section. While the connection between philanthropic behavior and political
influence has, to our knowledge, largely been overlooked, one notable exception that relates directly
to our work is Richter (2016), which jointly analyzes corporate social responsibility (CSR) and
lobbying by firms. He shows that firms at both negative and positive extremes of the CSR range
lobby more than firms that display intermediate levels of CSR. CSR and lobbying appear to work
as complements: the interaction between lobbying intensity and CSR quality correlates with higher
firm valuations.
Finally, while our emphasis in this paper is on the U.S., charity-as-influence-seeking is a global
phenomenon, and the implications of our analysis may thus have broader applicability. Israel’s
Holyland scandal, for example, which led to the imprisonment of a former Jerusalem mayor, Uri
12? is particularly notable in this list, as the absolute magnitudes of philanthropic giving are explored inthat paper. They are however mostly used to benchmark magnitudes of the more standard political spendingcomponents, PAC and lobbying.
13For two recent applications, see Powell and Grimmer, 2016 and Fouirnaies and Hall, 2017.14See Mian et al. (2010).
8

Lupolianski (as well as the imprisonment of Prime Minister Ehud Olmert), involved charitable
donations by a real estate developer to a charity founded by Lupolianski in his grandmother’s
name. Worldwide, charitable donations are sufficiently common a means of influence-seeking that
there are charity-related provisions in the U.S. Foreign Corrupt Practices Act, as well as the U.K.
Bribery Act. Intriguingly, the U.K. Bribery Act pairs charitable and political donations in its
language throughout, implying a similarity in their use by corporations operating abroad.
The rest of the paper is organized as follows. Section 2 provides a more detailed discussion of
charitable giving and corporate social responsibility, a literature to which this paper contributes
directly, and Section 3 presents our data. Section 4 introduces parallel analyses of corporate
giving and PAC contributions that explores whether contributions flow to congressional districts
whose legislators are more important to the firm. Section 5 presents evidence on the link between
corporate giving and politics based on the direct personal ties of politicians collected from their
Personal Disclosure Forms. We present a simple model of political influence in Section 6, and use
it to calibrate the scale of corporate giving as a tool for political influence. Section 7 concludes.
2 Primer on corporate social responsibility
As background, it is helpful to have some context for the broader set of explanations for corporate
philanthropy (and corporate citizenship more broadly). Benabou and Tirole (2010) provide a
useful delineation of the primary motives for such behavior: (a) a “win-win” in which the firm’s
prosocial behavior makes it easier to, for example, sell its products to socially conscious consumers
or recruit and retain ethically-minded employees, and in the process increase profits; (b) “delegated
philanthropy” in which stakeholders – customers, investors, or employees – effectively pay the
firm (through higher prices or lower wages/returns) to engage in prosocial behavior on their
behalf because, owing to information or transaction costs, the firm is better positioned to act on
stakeholders’ behalf; and (c) insider-initiated philanthropy, in which a firm’s board or management
exploits weak governance to spend shareholder profits on their own charitable interests, a view
most prominently associated with Friedman (1970), but also aligned with the analysis in Bebchuk
and Jackson (2013).
Our setting fits within what Benabou and Tirole describe within their “win-win” category
as “strategic CSR” (Baron, 2001), in which firms give to charity in order to strengthen their
market positions and hence longer-term profits. As the authors note, this form of CSR has “more
ambiguous social consequences” if it serves as “a means of placating regulators and public opinion
in order to avoid strict supervision in the future.” We see the primary purpose of our paper as
providing empirical evidence on exactly this concern – to the extent that firms use charity as a
means of securing favorable regulatory treatment, the societal benefits of their contributions to
9

charity (a public good) may be swamped by the social cost of, for example, weaker environmental
regulations that lead to excessive (relative to the social optimum) pollution, favorable treatment
by antitrust authorities that reduces consumer surplus, or lax financial oversight that increases
the chances of a banking crisis.
Firms may act on social concerns in a variety of ways: for example greening supply chains or
paying unskilled workers above minimum wage. Given our focus on philanthropy, we limit our
discussion here to the mechanisms available to firms for charitable giving. The simplest method
for a corporation to make charitable donations is through direct giving, in which the firm makes
a direct (tax-deductible) donation to a non-profit, tax-exempt organization (a so-called 501(c)(3)
organization).15 Such direct gifts require little administrative overhead and, critically for our
purposes, are difficult to track because firms are not required to disclose publicly the recipients
of their directed donations. In fact, if anything, the government protects the right to privacy of
donors and philanthropists in providing support for their causes.
A corporation may also set up a foundation, which allows a firm to take a tax deduction in
the present by giving to its foundation, without necessarily disbursing the funds to charities until
later. A foundation provides a greater visibility for the firm’s philanthropic efforts, serving as an
ongoing reminder to employees and the public more broadly of the company’s prosocial efforts,
as the foundation itself generally bears the company’s name. It also incurs an additional layer
of costs relative to direct giving, including the upfront cost to the firm of incorporating its own
non-profit corporation, and the continued expense and administrative burden associated with an
additional layer of reporting requirements (in particular the filing of an IRS Form 990-PF, a state
return, a state Attorney General report, among others) and managing a foundation board as a
means of oversight. It is precisely this additional layer of oversight which allows us to observe, via
foundation disclosures, the beneficiaries and amounts received from corporate giving.16
For all mechanisms, the sums involved are substantial – corporations made just over 5.1 bil-
lion dollars in donations via their foundations in 2014, the most recent year for which data are
available,17 and a total of 17.8 billion dollars overall in that year (Giving Institute, 2014). These
figures comprise a nontrivial fraction of overall giving: 60.2 billion dollars for all foundations in
2014, and 358.8 billion dollars in total charitable contributions overall. Further, aggregate corpo-
rate giving is very large when compared to more direct channels of corporate influence: total PAC
contributions in 2013 and 2014 were 464 million dollars (out of 1.7 billion dollars raised by PACs
15Donations to foreign entities are not tax deductible, nor are non-profits that do not have 501(c)(3) status, suchas local chambers of commerce or professional membership associations.
16A final option available to corporations is a donor-advised fund which has lower administrative costs than afoundation but also limits a firm’s subsequent control over donated funds.
17See the Foundation Center website, http://data.foundationcenter.org/#/foundations/corporate/nationwide/total/last accessed December 16, 2017.
10
each year of that congressional cycle), while total federal lobbying expenditures in 2014 were 3.2
billion dollars.18
Our focus on foundation giving, dictated by data availability, plausibly leads us to understate
the extent of philanthropy as a means of hidden corporate influence, particularly when it comes
to donations of personal interest to legislators. Since foundations are more subject to public
and media scrutiny because of the requisite disclosures, firms wishing to obscure their efforts at
currying favor with lawmakers by donating to their pet charities may choose to do so more often
through direct donations, which we do not detect in our analysis, rather than via foundation giving.
This downward bias is less likely to affect our analyses focused on giving which targets legislators’
constituents, because both the corporation and politician have an incentive to publicize these
donations: the corporation aims to boost its social image; the politician wishes to claim credit in
elections. Figure 1 reports as an example the executive summary of Bank of America’s 2012 CRS
Report, showcasing the social committment of the bank.
3 Data
3.1 Charitable giving by foundations
Data on charitable donations by foundations linked to corporations come from FoundationSearch,
which digitizes publicly available Internal Revenue Service data on the 120,000 largest active
foundations. The starting point for our sample is the companies in the Fortune 500 and S&P
500 in 2014 that can be matched by name to an active foundation. We have complete data for
320 of these foundations. As noted in Brown et al. (2006), larger and older companies are more
likely to have corporate foundations, which results naturally from the fixed cost of establishing a
foundation.19
Each foundation must submit Form 990/990 P-F “Return of Organization Exempt From In-
come Tax” to the IRS annually, and this form is open to public inspection. The Form 990 includes
contact information for each foundation, as well as the yearly total assets and total grants paid
to other organizations. Schedule I of Form 990, entitled “Grants and Other Assistance to Orga-
nizations, Governments, and Individuals in the United States,” requires the foundation to report
all grants greater than $4,000 (the limit was raised to $5,000 in recent years).20 For each grant,
18See https://www.opensecrets.org/pacs/ last accessed December 16, 2017.19They also find that state-level statutes – in particular laws relating to shareholder primary and the ability of
firms to consider broader interests in business decisions – predict establishment of a foundation. Various endoge-neous financial variables are also predictive of foundation establishment. The analysis in Brown et al. (2006) iscross-sectional, so their variables are absorbed by the various fixed effects in our analysis.
20The form is shown in Figure 2.
11

FoundationSearch reports the amount, the recipient’s name, city and state, and a giving category
created by the database.21
While the IRS assigns a unique identifier (EIN) to each nonprofit organization, unfortunately
FoundationSearch does not report this code, so we rely on the name, city and state information
to match it to a master list of all nonprofits. This list, called the Business Master File (BMF) of
Exempt Organizations, is put together by the National Center for Charitable Statistics (NCCS)
primarily from IRS Forms 1023 and 1024 (the applications for IRS recognition of tax-exempt
status). The BMF file reports many other characteristics of the recipient organization, including
a precise address which allows us to recover the Census Tract of each location (with the exclusion
of PO boxes) and thus match the organization to a congressional district using the program
MABLE/Geocorr from the Missouri Census Data Center. The results of the matching between
all 501(c)3 organizations in the BMF and the recipient FoundationSearch charitable giving by
Fortune 500 and S&P 500 companies is reported in Appendix A.1. The construction of the sample
is described in Appendix A.2.
3.2 Personal financial disclosures and ties of legislators to non-profits
As an alternative way of linking legislators to charities, we utilize information required of members
of the House and the Senate in their personal financial disclosure (PFD) forms. Members of
Congress are required by the Ethics in Government Act of 1978 to file annual forms with the
Clerk of the House and the Senate Office of Public Records disclosing their personal finances,
including a list of positions held with non-governmental organizations. This requirement covers
positions in non-profits, but excludes religious, social, fraternal and political organizations.22 The
Center for Responsive Politics obtained personal financial disclosure forms from the Senate Office
of Public Records and the Office of the Clerk of the House for the years 2004 to 2016, and we
obtained an electronic version of these data from Opensecrets.org.
Starting from these data, we isolate positions (often board memberships) held at non-profit
organizations and match, based on name (or name, city and state when available) the non-profits in
the personal financial disclosure forms to their EIN and other information contained in the Exempt
Organization Business Master Files (BMF). Because the personal financial disclosure forms are
often incomplete in specifying the start and end dates of a given position, we treat the data as
time-invariant. Overall, we identify 1087 unique non-profits in the personal financial disclosure
forms with links to 451 unique members of Congress; there are 1285 unique links between members
21The 10 categories are: Arts & Culture, Community Development, Education, Environment, Health, Interna-tional Giving, Religion, Social & Human Services, Sports & Recreation, Misc Philanthropy.
22There is no requirement for members of Congress to list purely honorary positions, nor are they required tolist positions held by spouses or dependent children.
12

of Congress and non-profits.
Finally, to create a data set that indicates whether a non-profit has a direct link to a legislator
via a board tie, we use the BMF data to consider the universe of non-profits in existence in at
least one of the years 1998, 2004, or 2015, and then create an indicator variable which denotes
whether a non-profit has a connection to at least one member of Congress. We also compute, for
each non-profit, the total number of members of Congress it is linked to via PFD forms. Using
the foundation data, we compute for each non-profit in the BMF data whether it received any
grants from any of the corporate foundations in our data set at any point in time, as well as the
total donation amounts received (summing across years and foundations). Finally, we compute
the number of different corporate foundations financially supporting each non-profit at any point
during our sample period.
3.3 Other data
3.3.1 Campaign contributions and lobbying reports
We employ the Center for Responsive Politics data on PAC contributions, originally from the
Federal Election Commission. For each congressional cycle we use information on the amount
donated by the PAC associated with each corporation to individual members of Congress. The
vast majority of S&P 500 and Fortune 500 firms have PACs and give politically (their share is
above 82 percent on average). In addition, 87 percent of the CEOs of S&P 500 companies give
at least once during the period 1991-2008 (Fremeth et al., 2013). However, not all S&P 500
and Fortune 500 firms present a clearly linkable 501(c)(3) entity. This may be because the firms
themselves do not use foundations and instead make direct charitable donations, or because they
do not give at all. Even if our data set is one of the most comprehensive CSR resources available
in the literature, our information may be incomplete in this respect. Plausibly the campaign
contribution data from the FEC may be also more accurate in pinpointing links to firms than
our grant-making data from the IRS, as the former is designed for public disclosure. However,
because we will employ time variation within a foundation, our estimates de facto condition on
self-selection of firms into charitable giving and on any firm-specific fixed unobservables.
From the Center for Responsive Politics we also obtain the lobbying reports that feature our
list of corporations as clients. These records list the issues and the dollar amounts related to the
lobbying work performed by a registrant (the lobbying firm or the lobbyist) on behalf its clients
(generally corporations). These reports allow us to determine the issues on which corporations
focus their lobbying efforts, by summing expenditures across all reports that mention a particular
issue. For each firm-Congress combination we generate a variable, TopIssueft, which denotes the
13
issue (or issues) with the highest expenditure for firm f in Congress t.23 Note that we allow the
interests of a firm/foundation to change over time, since we keep track of the topic(s) that feature
more often in its lobbying reports across congressional cycles; furthermore, we observe that this
procedure may result in more than one top lobbying issue per foundation per Congress if there
are several issues associated with the same level of spending.
3.3.2 Members of Congress and committee assignments
We obtain the list of members of the U.S. Congress and their committee assignments from Charles
Stewart III’s website24 and member seniority from Poole and Rosenthal’s voteview.org website.25
The analysis in Section 4 employs only members of the House while the analysis in Section 5also
includes the Senate, both for robustness and also because the PFD data can be linked to fewer
grants than the constituency data.
3.4 Basic data facts
Our sample consists of the 320 grant-giving foundations affiliated with the set of companies in
the S&P500 and Fortune 500 as of 2014, over the period 1998-2015, which spans the 105th to the
114th Congresses.
The unit of observation for PAC contributions is firm/foundation-congressional district-congressional
cycle; we sum across all recipients located in a congressional district d to obtain the corresponding
structure for charitable contributions. Table 1 reports the average contribution levels for both
PAC and corporate foundations (which we denote as “CSR contributions” or simply “CSR” for
brevity in reporting our results) across all firm-district-Congress observations in our sample. The
average PAC contribution is $515 with a maximum of $36,500. The latter figure can be rational-
ized if we consider that each PAC can contribute $5,000 dollars to each candidate for each race and
each year (and sometimes there are more than two candidates and special elections). On average,
each foundation donates to non-profits in fewer than 10 percent of all 435 congressional districts.
The average CSR contribution is $21,639, but as noted previously, zeros represent more than 90
percent of all foundation-congressional district combinations. The largest cumulative donation to
a congressional district is $62.7 million by Goldman Sachs Philantrophy Fund to charities located
in Minnesota’s 5th District.
In Appendix Table A.9 we summarize the data we will use to analyze links via the personal
financial disclosure forms of politicians. Slightly less than 4 percent of non-profits in existence
23There may be many client names in the lobbying data set associated with the same firm/foundation. SeeAppendix A.2 for a discussion of how we treat these cases.
24http://web.mit.edu/17.251/www/data page.html#225See Poole and Rosenthal (2017).
14

in 1998, 2004 or 2015 (or any subset of these years) were recipients of corporate philanthropy.
The mean number of connections to a corporate foundation is 0.08 and mean total foundation
contributions received is $9, 714 across all non-profits. Only about 0.05 percent of non-profits
have a tie to a member of Congress that we can measure in the PFD forms.
4 Evidence based on geographical link between non-profits
and House members
4.1 Empirical specification
In this section we measure the extent to which charitable contributions are targeted to non-profits
that are linked geographically to a specific House member, as the member moves to (or departs
from) committees that are of interest to a given firm/foundation. The key assumption in this
section is that the link between a charity and a House member is based on the location of the
charity. If the charity’s address is within the boundaries of the congressional district of the House
member, then we consider the two to be linked. This assumption fits with anecdotal evidence that
members of Congress are concerned with charity-funded initiatives like youth centers and musical
events that are situated within their districts. In Section 5 we adopt an alternative strategy to
focus on links between charities and members of Congress based on board memberships.
We begin by describing the construction of our key independent variable, which measures the
degree to which a congressional district is of interest to a given firm/foundation. We then discuss
our specification and possible identification concerns.
The key variable of interest IssuesCoveredfdt is a measure of how many issues of interest
to foundation/firm26 f are covered by the representative in district d through her committee
assignment in Congress t. To create this measure, we start by defining Membershipcdt to be equal
to one if the representative in d has a seat on committee c in Congress t. We then employ the
crosswalk constructed in Bertrand et al. (2014) to match all congressional committees to issues
listed in lobbying reports.27 The crosswalk is a matrix in which element xic is equal to 1 if issue
i is covered by committee c. Note that a committee often covers more than one issue and that
some issues are overseen by more than one committee. We then denote by lfit ∈ {0, 1} whether
issue i is of top interest to foundation/firm f , which we gather from the reports that lobbying
firms submit on behalf of their client f , using the definition provided in Section 3.3. We assemble
26We often use the terms firm and foundation interchangeably, but there are a handful of cases where one firmhas more than one foundation. Strictly speaking our unit of analysis is the foundation (EIN).
27See Appendix A.5 for the complete list of 79 issues.
15
the three sources of information in the following variable:
IssuesCoveredfdt =∑c
∑i
lfitxicMembershipcdt (1)
where:
lfit =
1 if issue i is a top issue for firm f lobbying in Congressional cycle t
0 otherwise
xic =
1 if issue i is overseen by Committee c
0 otherwise
Membershipcdt =
1 if Rep in d sits on Committee c
0 otherwise
Table 1 reports summary statistics for the variable IssuesCoveredfdt. Its median is 0 while its
mean is 0.2, once again revealing a skewed distribution with a maximum number of IssuesCovered
of 15 (for the Parker-Hannifin Foundation and Congressional Districts Texas 4 and Mississippi 3
in the 113th Congress).
Our main hypothesis is that there will be a positive relationship between the contributions
(both PAC and CSR) a firm makes toward a congressional district and the importance of its
representative to the firm as captured by our measure of committee relevance. We employ the
following specification:
ln (1 + Contributionsfdt) = β0 + β1 ln (1 + IssuesCoveredfdt) + δfd + γt + εfdt (2)
where f is foundation, d is congressional district and t is Congress. The dependent variable
Contributionsfdt is either (a) contributions from the PAC associated with firm f , or (b) CSR
contributions from the foundation associated with firm f directed to non-profit entities located in
Congressional District d. There are clearly a number of potential determinants of a foundation’s
charitable contributions, which may include a preference for specific geographical areas, or a desire
to focus on specific programs like education or health research. This can introduce bias in the
estimation of the effect of IssuesCovered if representatives from certain areas also self-select or are
assigned to committees that systematically correlate with the interests of the foundation. Take for
example the Bank of America Charitable Foundation. It is straightforward to see why it donates
to charities located in New York, since Bank of America has a large number of employees living in
many of New York City’s congressional districts and the company may thus be attuned to their
16
preferences for local charities. Representatives of New York’s congressional districts may also be
particularly interested in issues pertaining to the financial industry and therefore may seek seats
on the Financial Services Committee (6 members of the current committee are from the state of
New York). This could lead to a positive coefficient β1 even if there is no causal nexus between
committee assignment and charitable contributions. However, to the extent that these tendencies
are time-invariant, we can control for them by including foundation × congressional district fixed
effects. By including these fixed effects we exploit the variation in contributions and committee
assignments over time within a congressional district, and thus pick up the increase or decrease
in donations that occur when representatives join or depart from different committees. A similar
argument may be made regarding PAC contributions from Bank of America to representatives
of New York’s congressional districts, and it is also addressed by including the same set of fixed
effects.
Although suitable to address the endogeneity concerns discussed above, foundation × congres-
sional district fixed effects are very restrictive in that they absorb a large portion of the overall
variation. To achieve a compromise between credible identification while utilizing potentially
relevant between-district variation, we always report specifications with foundation × state fixed
effects. All specification also include Congress fixed effects, to account for time variation in average
contributions and committee size.
4.2 Main results
We begin by showing the association between PAC and CSR contributions in Table 2, controlling
for increasingly more demanding sets of fixed effects. The OLS coefficient is 0.137 when we
only include state and Congress fixed effects and remains positive and significant, but decreases
in size, as we consider the variation within finer groups. Column 5 shows that PAC and CSR
contributions are positively correlated even when we include foundation× congressional district
fixed effects, indicating that the two variables move together over time within a specific foundation-
congressional district pair.
In Figure 3 we present a graphical depiction of the PAC-CSR relationship, to show that
this relationship is monotonic, even if we look at a given firm’s allocation of PAC and chari-
table funds within a single Congressional cycle. To do so, we regress ln(1 + CSR) on a set
of foundation × Congress fixed effects, and show the average residuals for each of five bins
of PAC spending that, for non-zero values, divide observations approximately into quartiles:
{[0], (0, 1000], (1000, 2000], (2000, 4000], (4000, 25000]}. The Figure shows a clear and monotonic
increase in charitable giving by a firm (within a Congressional cycle) as its PAC giving increases.
We are not aware of any extant model that would rationalize this set of findings, and in the
17

discussion of our next set of results we put forward the view that the two types of contributions
may co-move because they both respond to the same set of political incentives induced by changes
in the committee assignments of representatives in the congressional district over time, based on
the specification in equation 2.
Table 3 shows the relationship between a firm’s PAC contributions directed to a congressional
district and the number of issues of interest to the firm that are covered by the district’s represen-
tative due to her committee assignments; Table 4 shows the analogous relationship for charitable
contributions by the firm’s foundation. We report results in which we take the logarithm of both
Contributions and IssuesCovered so that the coefficient has an elasticity interpretation; we also
include specifications that regress the logarithm of contributions on the level of IssuesCovered,
as well as specifications that measure political relevance using an indicator variable, Any Issue,
to denote whether IssuesCovered is positive. Columns 1-3 in Table 3 include foundation × state
fixed effects, while columns 4-6 include the more restrictive foundation × congressional district
fixed effects. In the latter set of specifications, the results in column 4 indicate that a 1 percent
increase in IssuesCovered is associated with an increase in PAC contributions of 0.742 percent.
This PAC elasticity estimate of 0.742 is quantitatively similar to that of Berry and Fowler (forth-
coming), who estimate the overall effect of entering a committee that is relevant for the industry
increases PAC contributions by 62 percent.
Table 4 has the same structure as Table 3, and shows that the elasticity of CSR contributions
with respect to IssuesCovered is 8.8 percent and 5.3 percent depending on whether foundation×state fixed effects or foundation ×congressional district fixed effects are used. The other specifi-
cations in columns 2, 3, 5 and 6 also find a positive and significant relationship.28
We return to explore the scale of politically motivated corporate giving in Section 6, where we
will use the preceding estimates to show that CSR contributions for political purposes may run into
the billions of dollars, potentially involving sums much greater than corporate PAC contributions.
To see how this can be the case, we note for now that, while the estimated PAC-Issue elasticity is
more than ten times greater than the CSR-Issue elasticity (0.742 versus 0.053), average charitable
contributions are more than 40 times higher than average PAC spending.
4.3 Heterogeneity
In this section we present a number of additional findings that explore possible heterogeneity in the
responsiveness of CSR contributions to political considerations, both as a function of characteristics
of targeted charities as well as the electoral environment of the House member. We begin by
showing how the sensitivity of CSR contributions to issues of interest varies by charity type. Figure
28In Appendix Table A.1, we show that the results are virtually unchanged if we use a dummy, Sign(CSR),asour outcome variable.
18

4 presents the point estimates from specifications of the form of equation (2), run separately for
charities in each of ten non-profit sectors, as well as the 95 percent confidence intervals around these
estimates. For ease of interpretation, we order sectors from smallest to largest effect. While we are
circumspect in taking a stand on the types of non-profits that would best cater to constituents’
interests, we believe that the ordering of effect sizes lines up roughly with one’s intuitions of which
sectors would most appeal to voters’ concerns. The bottom five, none of which approach statistical
significance, are membership benefit (MU), environmental (EN) unclassified (UN), health (HE),
and international (IN). The top five (in ascending order) are religion (RE), arts (AR), public
benefit (PU), education (ED), and human services (HU), with the last three having much larger
(and more statistically robust) effect sizes than other sectors. (If we scale each coefficient by the
standard deviation of the dependent variable, it only amplifies the differences across sectors.)
We next turn to examine whether the electoral environment affects the issues-charity relation-
ship. First, in Appendix Table A.2 we check whether charitable contributions are more sensitive
to IssuesCovered in election years, and we do not find any change in sensitivity. In Appendix
Table A.3 we examine whether the closeness of an electoral race has any effect on charitable con-
tributions to the congressional district of the House member. We capture the closeness of the
race with a dummy for whether the ex-post victory margin was less than 5 percent, and we do
not find an effect, even though PAC contributions appear to be sensitive to whether the seat is
more contested (columns 2 and 4). These results must naturally be treated with caution, given
the many factors that are correlated with victory margin and would plausibly affect contributions
as well.
4.4 Robustness
We performed several additional robustness checks for our main specification (2). We begin in Ap-
pendix Table A.4 by adding the square of the variable ln (1 + IssuesCoveredfdt) to assess whether
the responsiveness of contributions to congressional issues of interest is sensitive to nonlinearities
or other hard-to-interpret behavior. While we detect a degree of concavity in the relationship
for both CSR and PAC, the main message of our analysis is largely unaffected, both in terms of
magnitudes and statistical precision. In Appendix Table A.5 we run a specification in which the
dependent variable is not expressed in logs, but winsorized at the highest 1 percent of the values
in the sample to account for extremely large donations, which could be especially problematic for
CSR contributions. Again, our main results are qualitatively unaffected by this transformation.
In Appendix Tables A.6 and A.7 we further expand our set of fixed effects. We maintain in
all specifications either foundation × congressional district or foundation×state fixed effects, but
instead of employing Congress fixed effects, we include foundation×Congress (in Table A.6) or
19
congressional district×Congress (in Table A.7) fixed effects. These saturated specifications still
exhibit a robust relationship between CSR and issues of importance to the foundation. This is
also the case for PAC contributions.
Finally, as additional validation of the mechanism, Appendix Table A.8 focuses on the issues
covered by politicians who are committee chairs and ranking members only, rather than all com-
mittee members. Relative to our baseline specifications, the elasticities we measure for committee
leaders are at least 30-40 percent larger, as is expected given the higher strategic value of connec-
tions to these top appointments (and as documented by Berry and Fowler (forthcoming)for PAC
contributions).
4.5 Evidence from House member exits
In this subsection we provide additional evidence of the political sensitivity of corporate charitable
giving using a distinct source of variation in the data. We focus on the dynamics of donations
around the exits of House members from specific districts.
The intuition behind our approach is straightforward. If we observe a decline in charitable
contributions by corporations to charities in the politician’s district that is coincident with his
departure from Congress (whether due to death, resignation, or primary defeat) then, we argue,
the donations must have been politically motivated in part in the first place, as the departure leads
to a seasoned and influential legislator being replaced by a relatively inexperienced freshman. We
will again show that virtually identical dynamics exist for a standard channel of political influence,
i.e. PAC spending in the district, which we argue serves as an important consistency check.
As in the preceding analysis, we condition on a restrictive set of Congress and foundation ×congressional district fixed effects, but now we introduce information on whether this is the final
congressional cycle for the politician representing a particular district based on House membership
data from voteview.org. In the analysis below we also consider the extent in which charitable or
PAC giving responds to the tenure of the politician, which correlates strongly with congressional
ranking and power, and whether it is the politician’s first term in office. In order to keep the event
study approach as clean as possible from confounding overlap between pre- and post-exit periods,
we focus here on congressional districts within which we observe only one exit over our sample
period.
We employ the following modification of our most stringent specification:
ln (1 + Contributionsfdt) = β0 + β1Exitdt (3)
+β2 Tenuredt + β3Entrydt + δfd + γt + εfdt
20
where the independent variable Exittd indicates whether congressional cycle t is the last one
observed for the House representative of congressional district d, Tenuretd indicates his tenure at
t, and Entrytd indicates whether congressional cycle t is the first observed for the representative of
congressional district d. According to a comprehensive study of congressional careers by Diermeier
et al. (2005), exits of politicians from Congress are most typically official retirement from office,
sudden deaths, or scandals. Given the very high incumbency advantage, selection issues due to the
probability of reelection are low, according to the authors. Issues such as compensatory behavior
in the request of funds for political campaigning before a tough election bid or accumulation of
funds before a run for higher office are not quantitatively relevant and, in any case, would tend to
dampen the evidence of a drop in resources around exits.
Our results are reported in Table 5. Notice that in the table we also maintain a less stringent
specification relative to specification (3), where we condition on a still-restrictive set of Congress
and foundation×state fixed effects. Table 5 shows that the congressional cycle marking the exit of
a politician from a district is systematically characterized by a drop in charitable giving and of PAC
donations to that district. With congressional tenure, charitable giving increases, while for new
politicians the effect size is nearly zero. These results require some elaboration. Notice first that,
while a new representative enters a district in the cycle following an exit, we ascribe to a district
only the current incumbent’s PAC contributions, so the analysis emphasizes the withdrawal of
funds from the incumbent politician, which typically occurs because retirements are announced
well in advance (i.e. we do not consider donations to the open race that follows). Second, our
results on charitable giving also show a reduction at exit, indicating that a foundation reallocates
its resources to other districts. The rationale behind this pattern may be that congressional
committee assignments for freshmen may be less valuable.
Figures 5 and 6 present the evidence graphically, illustrating the dynamics of giving through
charities and PACs around the exit date. The figures report the means of the residuals from re-
gressing ln (1 + Contributionsfdt) on Congress and foundation×congressional district fixed effects
for each Congress surrounding an exit event. We also normalize each graph by rescaling so that
the mean residual at the time of the exit event is zero. The graphs indicate that both political
and charitable giving follow see-saw pattern around exits, with funds withdrawn at exit and then
rebuilding as new incumbents acquire ranking and status within their party and in the Congress.
The patterns we observe for PAC giving and charitable contributions are quite similar. Although
these figures are new (including for PAC contributions), a role for tenure in office as a driver of
campaign donations has been hypothesized within the political economy literature at least since
Snyder (1992).
21

5 Evidence from personal financial disclosure forms
Our analysis thus far has leveraged geographical linkages to identify the set of non-profits that
may be of relevance to particular members of Congress. As an alternative, we identify specific
non-profits with direct personal connections to members of Congress from the personal financial
disclosures (PFD) that members of Congress have to file in accordance to the Ethics in Government
Act of 1978.
5.1 Political ties and corporate charitable giving
While our main goal with these data is to conduct an empirical analysis that parallels the one
laid out in the previous section, we start with a simple cross-sectional exercise to assess whether
disclosure on a politician’s PFD is correlated with donations received from corporations in our
sample. To do so, we use the data set we generated by linking the universe of non-profits to those
with political ties (see Section 3.2).
A simple tabulation of the data immediately suggests that non-profits connected to members
of Congress receive more contributions from corporate foundations (recall that we refer to these as
CSR contributions). For example, while the mean number of corporate foundations giving grants
to non-profits without any reported connections to Congress in politicians’ PFD forms is only
.08, this number rises to 5.15 for non-profits that are listed in the disclosures. Of course, this
simple tabulation could be explained by many other factors beyond the strategic use of charitable
giving by corporations as a tool for political influence. For example, members of Congress may be
disproportionately linked to larger non-profits, which might also be more effective in attracting
corporate philanthropy. It is also possible that both members of Congress and corporate founda-
tions are more likely to be connected to non-profits in larger urban centers because of physical
proximity.
Table 6 assesses the sensitivity of the simple tabulation above to the addition of a battery of
controls for non-profits characteristics, including size, location and sector. We begin in columns
1 and 2 with the baseline correlation, only controlling for whether the non-profit is a 501c(3) or
other tax-exempt organization. As reported above, non-profits with any connection to Congress
received grants from 5.05 more corporate foundations than non-profits without such connections
(column 1). Column 2, which uses the number of connections as the right hand side variable,
shows that an additional connection to a member of Congress increases the number of different
corporate foundations contributing to the non-profit by 4.20. Remarkably, these two estimated
coefficients do not change substantially as we add controls for the non-profit characteristics that
would most plausibly have been responsible for large omitted variable bias in columns 1 and 2.
22
In particular, we first control in columns 3 and 4 for non-profit size (log assets and log income).
As expected, larger non-profits have connections to a greater number of corporate foundations,
but the estimated coefficients on “Any connection to Congress” and “Number of connections to
Congress” are barely affected. The same is true in columns 5 and 6, in which we further control for
location (state fixed effects and city fixed effects), as well as columns 7 to 10, where we additionally
control for non-profit sector fixed effects (coarse or detailed classifications). In the most saturated
specifications (columns 9 and 10), the estimated coefficient on “Any connection to Congress” is
4.61 (compared to 5.05 in the baseline) and the estimated coefficient on “Number of connections
to Congress” is 3.91 (compared to 4.20 in the baseline). Appendix TablesA.10 and A.11 replicate
the exercise in Table 6 for two alternative dependent variables: a dummy variable for receiving any
CSR contribution and the logarithm of total CSR contributions received by the non-profit. Any
connection to Congress increases the likelihood of receiving CSR contributions by 46 percentage
points and nearly sextuples the amount of corporate donations a non-profit receives. Controlling
for non-profit characteristics somewhat weakens these estimates, but as in Table 6, the correlation
remains economically and statistically very strong even in the most saturated specifications.
5.2 Political ties, issue relevance, and corporate charitable giving
These initial results should naturally be treated as only suggestive. Even in the most saturated
specification, the R2 is only about 10 percent, indicating that there are many unobserved factors
apart from size, location and sector that determine which non-profits receive CSR contributions,
and hence we cannot rule out remaining omitted variable biases. That said, the relative stability
of the results across specifications is strongly suggestive that political influence might be one of
the factors that corporations consider in allocating charitable contributions.
We now turn to our main empirical exercise leveraging the data collected via the PFD forms,
which more closely parallels the results presented in Section 4. In particular, we restrict the sample
of non-profits to those identified as connected to Congress in the PFD forms and ask whether
corporations are more likely to make charitable donations to any of the non-profits in this sample
when these non-profits are more politically relevant to the corporation’s main business interests.
For every non-profit/corporation/year cell, we can assign measures of the political relevance of
a non-profit to the corporation in a specific year. The most straightforward measure is simply
a 0/1 categorical variable constructed as follows. Consider first the set of issues appearing in
the lobbying portfolio of a corporation in a given year. Then consider the set of issues that are
indirectly linked to a non-profit in that year as a result of the committee assignments (in that year)
of any members of Congress that are board members of or otherwise connected to the non-profit.
If there is any overlap between the set of issues relevant to the corporation in that year and the
23

set of issues indirectly “covered” by the non-profit in that year, we set the variable “Any political
relevance” equal to 1. It is also possible to identify variation in such political relevance on the
intensive margin. We define the variable “relevant (number of issues)” as a count of the number
of issues that are both in the corporation’s lobbying portfolio and tied to the non-profit via a
member of Congress in a given year. We define the variable “relevant (number of Congressmen)”
as a count of the number of members of Congress that are tied to the non-profit and, because of
their committee assignments in that year, cover at least one issue of relevance to the corporation
in the same year. Finally, we define the variable “relevant (number of Congressmen-issue pairs)”
as a count of separate Congressmen-issue links for a non-profit in a given year that are relevant
to the corporation in that year.
An example may help to clarify the extensive margin measures. Imagine Firm F lobbies on
Issues A, B and C in year t. Imagine also that members of Congress X and Y are have ties to
non-profit NP. Member X’s committee assignment in year t covers issues A and D; member Y’s
committee assignment in year t covers issues A, B and E. In the context of this example, for the
cell (Firm F, non-profit NP, year t), the variable “relevant (number of Congressmen)” would be
equal to 2 (X and Y); the variable “relevant (number of issues)” would equal 2 (A and B); and the
variable “relevant (number of Congressmen-issue pairs) would equal 3 (pairings X-A, Y-A, and
Y-B).
Using the corporate foundation data from FoundationSearch, we then create a data set that
determines for each corporation/non-profit pair in each year (excluding years with missing contri-
butions data for that corporation), whether or not the corporation gave to the non-profit in that
year, and if so, how much. Our main empirical specification directly follows:
AnyGivingfct = β ∗ AnyRelevantfct + ωfc + υt + εfct
where f indexes corporations, c indexes non-profits and t indexes year. We include year (and thus
Congress) fixed effects in all specifications. We also control for corporation and non-profit fixed ef-
fects. Our preferred specification, as shown in the equation above, includes corporation/non-profit
pair fixed effects. In other words, under this preferred specification, we ask whether a corporation
gives more to a particular non-profit in a given year when that non-profit is politically relevant,
holding constant how much the corporation gives on average to that non-profit across years. Fi-
nally, we control in all specifications for the logarithm of total CSR contributions by corporation
f in year t to account for variation in total giving over time within a foundation/corporation.
Given the time invariance of the links between members of Congress and non-profits, the source
of identification comes from changes over time in committee assignments for members of Congress
and changes over time in the set of issues in the lobbying portfolios of corporations.
There are multiple candidates for the dependent variable. One can simply define an indicator
24

variable denoting whether a non-profit received any donation from a corporation in a given year.
Alternatively, one can define the dependent variable as the amount of charitable donations, i.e.
log(1 + CSR contributions), by a corporation to a non-profit in a given year. We present the
results in which we define the dependent variable as “Any giving” in Table 7. Results for the
alternative dependent variable are presented in Appendix Table A.13.
Appendix Table A.12 summarizes the data for this part of our analysis. The likelihood that
a non-profit in this data set of connected non-profits receive any charitable donation from a
corporation in a given year is about 0.4 percent. On average, about 28 percent of the non-profits
in the sample are of any political relevance (as defined above) to a corporation in a given year.
The political relevance (number of issues) of a given non-profit to a given corporation in a given
year is on average 0.7, with a maximum of 37. On average, there are 0.3 members of Congress
with ties to a given non-profit that are politically relevant to a corporation in a given year, with
a maximum of 9.
Table 7 presents our main results for this section. In columns 1 to 4, we include both foundation
(i.e., corporation) and year fixed effects. The estimated coefficients on the four measures of political
relevance are positive and statistically significant. In columns 5 to 8, we further control for non-
profit fixed effects. All four estimated coefficients remain positive and statistically significant, but
decline substantially in magnitude. Columns 9 to 12 present our most demanding specifications,
which include separate fixed effects for each corporation-non-profit pairing. The four estimated
coefficients of interest remain positive and statistically significant.
To assess economic magnitude, consider the estimated coefficients on “relevance (number of
issues).” The findings in column 3 indicate that any additional issue of relevance to a corporation
indirectly covered by a non-profit in a given year (via the connection of that non-profit to members
of Congress) increases the likelihood that the corporation makes any charitable grant to that non-
profit in that year by 0.00075, which is about a 17 percent increase (from a mean of 0.0043). The
estimate drops to about 10 percent in column 7 when we control for non-profit fixed effects, and
about 3.5 percent in column 11 when we control for corporation/non-profit pair fixed effects.
We obtain qualitatively similar results in Appendix Table A.13 where we define the dependent
variable of interest as the logarithm of CSR contributions by a corporation to a non-profit in a
given year. All estimated coefficients in these tables are of the expected sign and all are statistically
significant.
25

6 Quantifying the scale of politically motivated corporate
charity
Our goal in this section is to use the estimates generated in Section 4.2 to gauge how much of
total U.S. corporate giving is used for political purposes. This exercise is important for gauging
the economic importance of the phenomenon we have documented thus far.
Even if we do not provide a full structural model of political influence by corporations, below we
show how, in a fairly general environment of quid-pro-quo politics, one may employ the sensitivity
of PAC contributions to proxy for the sensitivity of politically-motivated corporate charitable
giving. This allows to back out the fraction of corporate charity that is politically motivated
based on the ratio of the CSR-issue and PAC-issue elasticities.
To see this formally, we begin by defining political-motivated charitable contributions as C
and non-political charitable contributions as C. Importantly, in the data the econometrician only
observes the sum of the two, C + C. To model political influence, we further assume the firm
has two tools at its disposal: C and PAC contributions, which we label P . Consider that a
committee assignment A that is relevant to a corporation is, in essence, a factor which increases
the productivity of the political investments in P and C, and presume that these three elements,
A, P , and C together influence the formation of a policy outcome of interest to the firm, τ . The
reader versed in special interest politics can interpret this framework as a straightforward reduced-
form representation of a richer quid-pro-quo political environment, akin to several discussed in
Grossman and Helpman (2001) (see chapters 7 and 8).
Let us posit a general production function of corporate influence:
τ = h (A,C, P ) .
The firm’s maximization problem is therefore:
maxC,P
Ah (A,C, P )− C − P (4)
This transparent politico-economic environment, under standard properties, delivers the fol-
lowing optimization result, central to our quantification exercise.
Claim 1. If h (A,C, P ) = Ag (f (C,P )) where g(.) is an increasing and concave function and f(.)
is increasing, quasi-convex and homogeneous of degree one, then the elasticity of C and P with
respect to A is identical:dC
C/dA
A=dP
P/dA
A.
Proof. See Appendix.
26

A function f (.) that is Cobb-Douglas with constant returns to scale or a more general CES
production function would fit this environment. In particular, if we adopt h (A,C, P ) = ACαP β
with α+ β < 1 then C = Φ1A1
1−α−β and P = Φ2A1
1−α−β , where Φ1 and Φ2 are constants. It is easy
to verify that the elasticity of C and P with respect to A is the same an equal to 11−α−β .
The three key assumptions in this exercise are:
1. The parameter A is a Hicks-neutral productivity shock. That is, it affects the productivity
of the two types of investment in a neutral manner, i.e. it is not C -biased or P -biased.
2. PAC contributions P are politically motivated.
3. Non-political charitable giving, C, is orthogonal to committee assignments, i.e.
dC
C/dA
A= 0.
Assumption 1 implies that committee assignments do not affect the productivity of PAC money
more than the productivity of political CSR, or vice-versa. We have no good a priori reason to think
that committee assignments or any political shock may induce such an asymmetry. Assumption
2 establishes the benchmark that PAC contributions are completely political, i.e. 100% of PAC
contributions enter h (·) .29 Assumption 3 is definitional: non-political CSR is defined by a lack
of correlation with political shocks, i.e. it is not driven by politics.
Under assumptions 1-3, we can take the elasticity from the PAC regressions in Table 3, so that:
dC
C/dA
A=dP
P/dA
A= 0.742 (5)
We may further use our estimates from Table 4, which reflect the elasticities for total giving, to
obtain:dC
C + C/dA
A= 0.053 (6)
Combining (5) and (6), it follows that:
dC
C+CdCC
= 0.071 =⇒ C
C + C= 7.1%
That is, based on our representation of the political investment problem of the firm and our
estimated baseline elasticities, 7.1 percent of corporate charitable giving is political motivated.
29If we assume that less than 100% of PAC contributions are political then we simply have to rescale accordinglythe charity coefficient in the rest of the exercise.
27

By scaling this percentage by the total US charitable giving by corporations of $18 billion,
the implied CSR component that is politically motivated amounts to $1.3 billion in 2014. As a
benchmark PAC contributions over 2013-14 were $464 million for each of the two years (Bertrand
et al. (2014)), so that political CSR is about 2.8 times larger. As a second point of comparison,
political CSR amounts to 40 percent of U.S. federal lobbying expenditures, which were $3.2 billion
in 2014, as reported by the Center for Responsive Politics. The estimated amount of political CSR
is thus economically substantial. We also emphasize that $18 billion may well be an underestimate
of total charitable activity by U.S. corporations. Givingusa.org estimates that total charitable
contributions by American individuals, estates, foundations and corporations amounted to $390.1
billion in 2016. Included in this total are certain family foundations and operating foundations
that are linked to corporate conglomerates, though not considered to be corporate foundations
(e.g., the Gates and Michael and Susan Dell Foundations). Such entities plausibly also direct part
of their giving politically.
7 Concluding remarks
This paper explores the role of charitable giving as a means of political influence. In documenting
the effect of political interests to private corporate charitable giving, we further highlight the
ambiguous social welfare consequences of firms’ corporate social responsibility. While this point
has been noted previously (e.g. in Benabou and Tirole, 2010), we are, to our knowledge, the first
to provide systematic empirical support for such concerns.
In our analysis, we show that corporate charitable donations are responsive to the same types
of political incentives as more standard instruments of political influence, such as Political Action
Committees’ campaign contributions. We show that grants by firms’ foundations tend to follow
congressional committee assignment trajectories for legislative topics of specific relevance to firms
over time. Further, our focus on philanthropy allows us to extend our examination of influence
to explore a more personal channel of favor-seeking, via donations to charities a legislator has a
personal connection to. Overall, we find that charity-as-influence may be economically substantial.
For example, given our estimated elasticities ranging from 5 to 10 percent and the very large base
rate levels of charitable spending (relative to PAC spending), total dollar magnitudes of this
channel dwarf PAC giving and are almost half as large as federal lobbying expenditures.
The case of charity-as-influence has a number of properties that merit special consideration.
Charitable contributions are a particularly opaque channel of influence, since they do not face
the same public disclosure requirements, aimed at supplying voters with information concerning
potential undue influence over legislators, as campaign donations or lobbying. Issues of account-
ability in the use of corporate funds may also be relevant to shareholders, who also face similar
28
challenges in tracking companies’ charitable donations. In addition, charitable foundations enjoy
tax-exempt status and are typically identified for tax purposes as 501(c)(3) organizations. They
are subject to the Johnson Amendment, a U.S. tax code provision dating back to 1954, that pro-
hibits 501(c)(3) from endorsing or opposing political candidates. Our results, while falling short of
a smoking gun, suggest that corporate foundations are at a minimum not in compliance with the
spirit of the law. More generally, one should also be aware of the potential welfare losses that can
be ascribed to policy distortion favoring contributing firms away from voters’ optima. Losses due
to inefficient allocation of philanthropic efforts to cater to political objectives may be of relevance
as well.
Our results contribute to a number of contemporary debates, both conceptual and practical.
First, by highlighting an omitted channel of influence, we contribute to efforts at understanding
why the amount of money in politics – when measured just by PAC and lobbying expenditures
– is so small, a puzzle originally posed by Gordon Tullock in 1972.30 Once we consider the
broader set of instruments available to firms, their expenditures are likely more substantial, and the
returns on these expenditures more reasonable. Collectively, our findings highlight the challenges
in identifying the full set of instruments employed by special interests in Washington, and the
complexities involved in designing the socially optimal policy. Failing to recognize the various
channels of influence (as well as their various degrees of oversight and visibility) can lead to
substantial bias in the assessment of the returns to government influence, and misdirection of
efforts to reduce undue tilting of the political scale.
30Tullock (1972)
29
References
Ansolabehere, S., De Figueiredo, J. M., Snyder, J. M., 2003. Why is there so little money in us
politics? The Journal of Economic Perspectives 17 (1), 105–130.
Baron, D. P., 2001. Private politics, corporate social responsibility, and integrated strategy. Journal
of Economics & Management Strategy 10 (1), 7–45.
Bebchuk, L., Black, B. S., jr, J. C., Cox, J. D., Gordon, J. N., Gilson, R. J., Hansmann, H.,
Jackson, R. J., Langevoort, D. C., Sale, H. A., 2010. Committee on disclosure of corporate
political spending, petition for rulemaking.
Bebchuk, L., Jackson, R. J., 04 2013. Shining light on corporate political spending. Georgetown
Law Journal 101, 923–967.
Benabou, R., Tirole, J., 2010. Individual and corporate social responsibility. Economica 77 (305),
1–19.
Berry, C. R., Fowler, A., forthcoming. Committee chairs and the concentration of power in
congress. Journal of Public Economics.
Bertrand, M., Bombardini, M., Trebbi, F., 2014. Is it whom you know or what you know? an
empirical assessment of the lobbying process. The American Economic Review 104 (12), 3885–
3920.
Bombardini, M., Trebbi, F., 2011. Votes or money? theory and evidence from the us congress.
Journal of Public Economics 95 (7), 587–611.
Bombardini, M., Trebbi, F., 2012. Competition and political organization: Together or alone in
lobbying for trade policy? Journal of International Economics 87 (1), 18–26.
Brown, W. O., Helland, E., Smith, J. K., 2006. Corporate philanthropic practices. Journal of
corporate finance 12 (5), 855–877.
de Figueiredo, J. M., Richter, B. K., 2014. Advancing the empirical research on lobbying. Annual
Review of Political Science 17, 163–185.
de Figueiredo, J. M., Silverman, B. S., 2006. Academic earmarks and the returns to lobbying. The
Journal of Law and Economics 49 (2), 597–625.
Diermeier, D., Keane, M., Merlo, A., 2005. A political economy model of congressional careers.
American Economic Review 95 (1), 347–373.
30

Drutman, L., 2015. The business of America is lobbying: How corporations became politicized
and politics became more corporate. Oxford University Press.
Fouirnaies, A., Hall, A. B., 2017. How do interest groups seek access to committees? working
paper.
Fremeth, A., Richter, B. K., Schaufele, B., 2013. Campaign contributions over ceos’ careers.
American Economic Journal: Applied Economics 5 (3), 170–188.
Friedman, M., 1970. The social responsibility of business is to make profit. New York Times
Magazine 13.
Grimmer, J., Messing, S., Westwood, S. J., 2012. How words and money cultivate a personal
vote: The effect of legislator credit claiming on constituent credit allocation. American Political
Science Review 106 (4), 703–719.
Grossman, G., Helpman, E., 1994. Protection for sale. American Economic Review 84 (4), 833–850.
Grossman, G. M., Helpman, E., 2001. Special interest politics. MIT press.
Kang, K., 2016. Policy influence and private returns from lobbying in the energy sector. Review
of Economic Studies 83 (1), 269–305.
Kang, K., You, H. Y., 2016. The value of connections in lobbying. working paper.
LaPira, T. M., Thomas, H. F., 2014. Revolving door lobbyists and interest representation. Interest
Groups & Advocacy 3 (1), 4–29.
Margolis, J. D., Elfenbein, H. A., Walsh, J. P., 2009. Does it pay to be good... and does it matter?
a meta-analysis of the relationship between corporate social and financial performance.
Mayhew, D. R., 1974. Congress:The Electoral Connection. Yale University Press.
Mian, A., Sufi, A., Trebbi, F., 12 2010. The political economy of the us mortgage default crisis.
American Economic Review 100 (5), 1967–1998.
Milyo, J., Primo, D., , Groseclose, T., 2000. Corporate pac contributions in perspective. Business
and Politics 2 (1), 75–88.
Poole, K. T., Rosenthal, H., 2017. Voteview. University of Georgia. www.voteview.com.
Powell, E. N., Grimmer, J., 2016. Money in exile: Campaign contributions and committee access.
The Journal of Politics 78 (4), 974–988.
31

Richter, B. K., 2016. Good and evil: The relationship between corporate social responsibility and
corporate political activity. mimeo, University of Texas Austin.
Snyder, J. M., 1992. Long-term investing in politicians: Or, give early, give often. Journal of Law
and Economics 35 (1), 15–43.
Stratmann, T., 2005. Some talk: Money in politics. a (partial) review of the literature. Public
Choice 124, 135–156.
Tullock, G., 1972. The purchase of politicians. Western Economic Journal 10 (3), 354–55.
Vidal, J. B. I., Draca, M., Fons-Rosen, C., 2012. Revolving door lobbyists. The American Economic
Review 102 (7), 3731–3748.
32
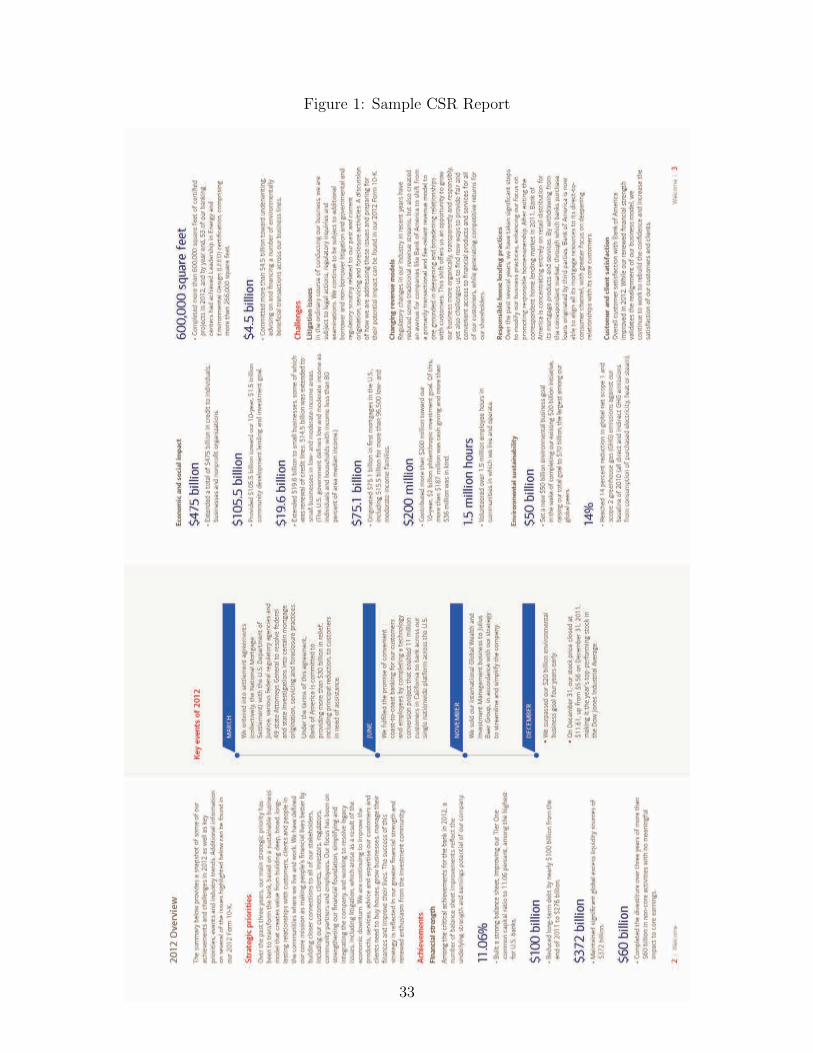
Figure 1: Sample CSR Report
33

Figure 2: Schedule I Form 990S
CH
ED
ULE
I (F
orm
990
)
Dep
artm
ent
of t
he T
reas
ury
In
tern
al R
even
ue S
ervi
ce
Gra
nts
and
Oth
er A
ssis
tanc
e to
Org
aniz
atio
ns,
Gov
ernm
ents
, an
d In
divi
dual
s in
the
Uni
ted
Sta
tes
Co
mp
lete
if t
he o
rgan
izat
ion
answ
ered
“Y
es”
on
Form
990
, Par
t IV
, lin
e 21
or
22.
▶ A
ttac
h to
Fo
rm 9
90.
▶ G
o t
o w
ww
.irs.
gov
/For
m99
0 fo
r th
e la
test
info
rmat
ion.
OM
B N
o. 1
545-
0047
201
7O
pen
to
Pub
lic
Insp
ecti
on
Nam
e of
the
org
aniz
atio
n E
mp
loye
r id
enti
ficat
ion
num
ber
Par
t I
Gen
eral
Info
rmat
ion
on
Gra
nts
and
Ass
ista
nce
1 D
oes
the
orga
niza
tion
mai
ntai
n re
cord
s to
sub
stan
tiate
the
am
ount
of t
he g
rant
s or
ass
ista
nce,
the
gra
ntee
s’ e
ligib
ility
for
the
gran
ts o
r as
sist
ance
, and
th
e se
lect
ion
crite
ria u
sed
to
awar
d t
he g
rant
s or
ass
ista
nce?
.
..
..
..
..
..
..
..
..
..
..
..
..
..
..
Yes
N
o
2 D
escr
ibe
in P
art
IV t
he o
rgan
izat
ion’
s p
roce
dur
es fo
r m
onito
ring
the
use
of g
rant
fund
s in
the
Uni
ted
Sta
tes.
P
art
II G
rant
s an
d O
ther
Ass
ista
nce
to D
om
esti
c O
rgan
izat
ions
and
Do
mes
tic
Go
vern
men
ts. C
omp
lete
if t
he o
rgan
izat
ion
answ
ered
“Y
es”
on F
orm
99
0, P
art
IV, l
ine
21, f
or a
ny r
ecip
ient
tha
t re
ceiv
ed m
ore
than
$5,
000.
Par
t II
can
be
dup
licat
ed if
ad
diti
onal
sp
ace
is n
eed
ed.
1 (a
) Nam
e an
d a
dd
ress
of o
rgan
izat
ion
or
gov
ernm
ent
(b) E
IN
(c) I
RC
sec
tion
(i
f ap
plic
able
) (d
) Am
ount
of c
ash
gran
t (e
) Am
ount
of n
on-
cash
ass
ista
nce
(f) M
etho
d of
val
uatio
n (b
ook,
FM
V, a
ppra
isal
, ot
her)
(g) D
escr
iptio
n of
no
ncas
h as
sist
ance
(h
) Pur
pos
e of
gra
nt
or a
ssis
tanc
e
(1)
(2)
(3)
(4)
(5)
(6)
(7)
(8)
(9)
(10)
(11)
(12) 2
Ent
er t
otal
num
ber
of s
ectio
n 50
1(c)
(3) a
nd g
over
nmen
t or
gani
zatio
ns li
sted
in t
he li
ne 1
tab
le.
..
..
..
..
..
..
..
..
. ▶
3
Ent
er t
otal
num
ber
of o
ther
org
aniz
atio
ns li
sted
in t
he li
ne 1
tab
le.
..
..
..
..
..
..
..
..
..
..
..
..
.. ▶
For
Pap
erw
ork
Red
ucti
on
Act
No
tice
, see
the
Inst
ruct
ions
fo
r Fo
rm 9
90.
Cat
. No.
500
55P
Sch
edul
e I (
Form
990
) (20
17)
34
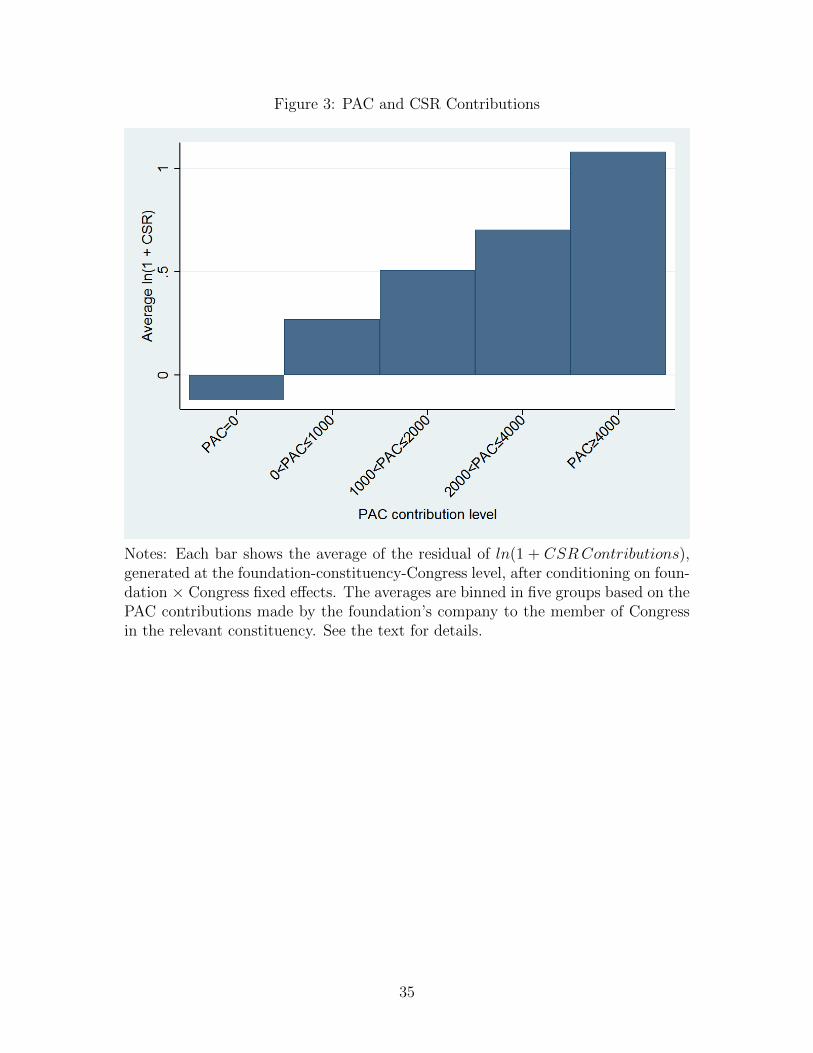
Figure 3: PAC and CSR Contributions
Notes: Each bar shows the average of the residual of ln(1 + CSRContributions),generated at the foundation-constituency-Congress level, after conditioning on foun-dation × Congress fixed effects. The averages are binned in five groups based on thePAC contributions made by the foundation’s company to the member of Congressin the relevant constituency. See the text for details.
35

Figure 4: Individual sector estimates of the sensitivity of CSR to lobbying issues
Notes: Each bar in the figure reflects the point estimate from regressingln (1 + CSR Contributionsfdt)on ln(1 + Issues of Interest) for donations to oneof the 10 NTEE sectors, listed below. The ‘whiskers’ provide the 95 percent confi-dence interval. We include state × foundation and Congress fixed effects, parallelingthe specifications in the first three columns of Table 4. The sector definitions, fromright to left, are: Human Services (HU), Education (ED), Public Benefit (PU), Arts(AR), Religion (RE), International (IN), Health (HE), Unclassified (UN), Environ-ment (EN), and Mutual/Membership Benefit (MU).
36
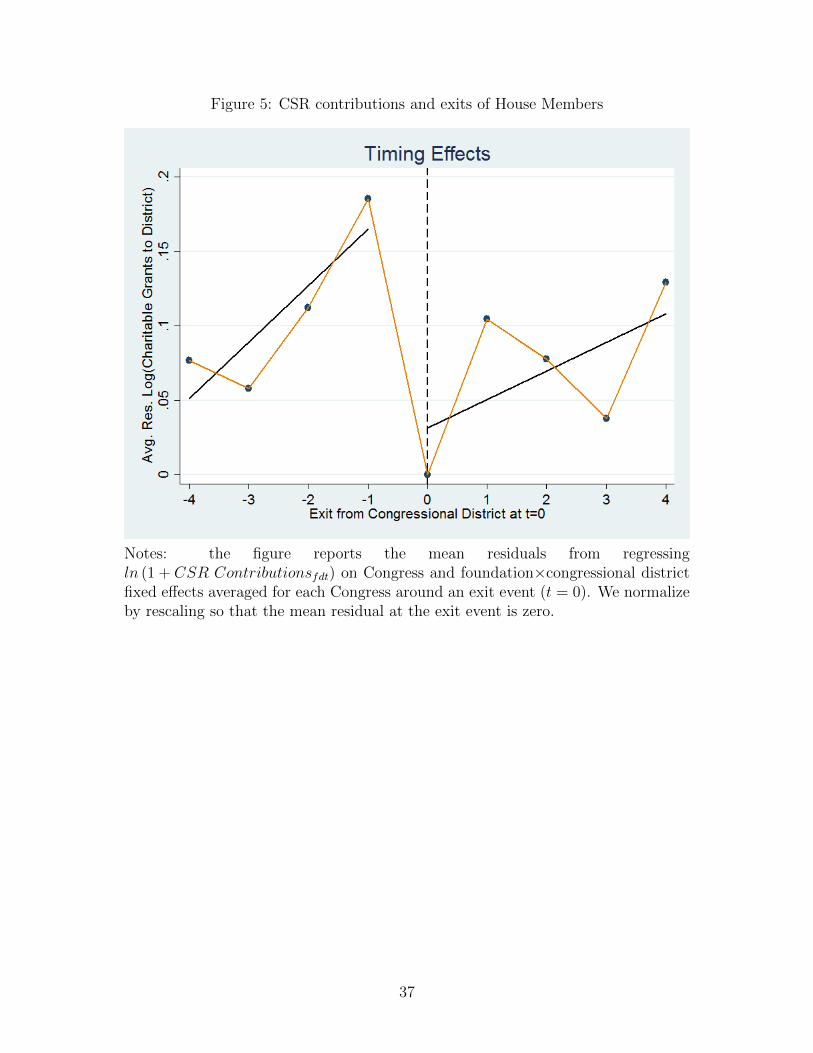
Figure 5: CSR contributions and exits of House Members
Notes: the figure reports the mean residuals from regressingln (1 + CSR Contributionsfdt) on Congress and foundation×congressional districtfixed effects averaged for each Congress around an exit event (t = 0). We normalizeby rescaling so that the mean residual at the exit event is zero.
37
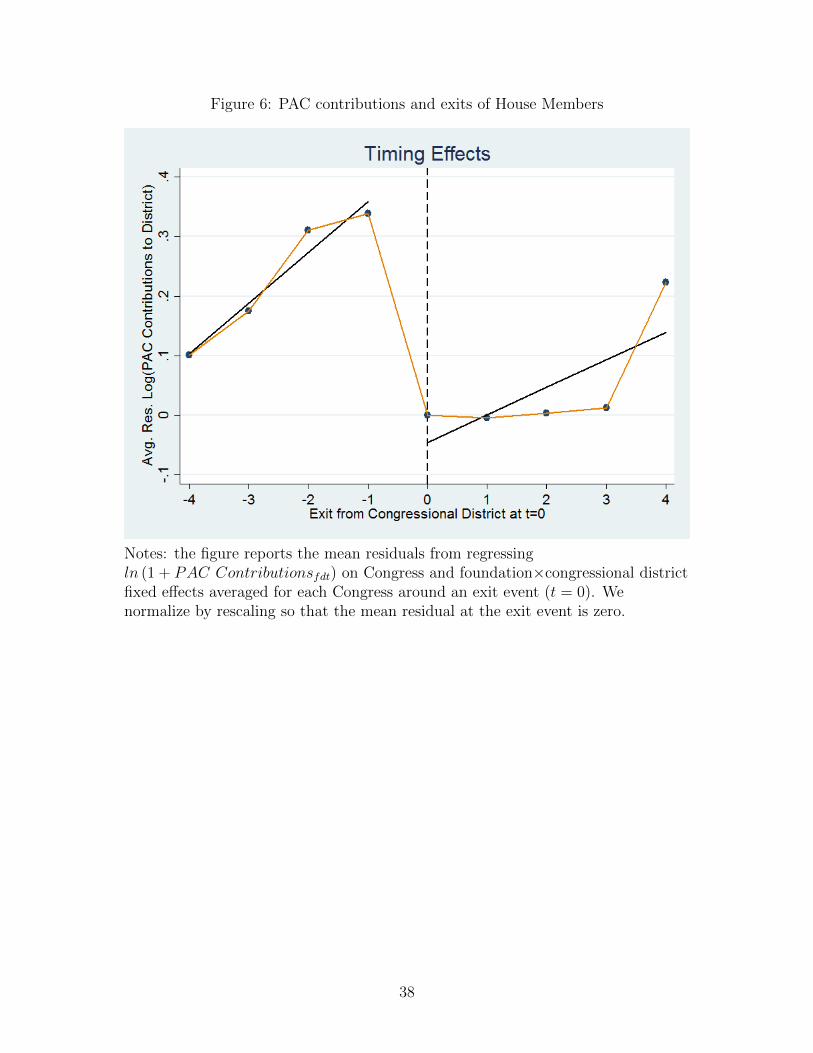
Figure 6: PAC contributions and exits of House Members
Notes: the figure reports the mean residuals from regressingln (1 + PAC Contributionsfdt) on Congress and foundation×congressional districtfixed effects averaged for each Congress around an exit event (t = 0). Wenormalize by rescaling so that the mean residual at the exit event is zero.
38

Table 1: Summary Statistics
mean std median 95th max
PAC Contributionsfdt 515.1 1,618.4 0 3500 36500CSR Contributionsfdt 21,638.7 311,908.5 0 35000 62705500IssuesCoveredfdt 0.2 0.6 0 1 15
39

Tab
le2:
Cor
rela
tion
bet
wee
nC
har
itab
lean
dP
AC
Con
trib
uti
ons
Dep
.V
aria
ble
:L
ogC
har
ity
Con
trib
uti
ons
from
Fou
ndat
ionf
toC
ong
Dis
td
(1)
(2)
(3)
(4)
(5)
Log
PA
CC
ontr
ibuti
ons
0.21
4***
0.12
2***
0.13
8***
0.03
7***
0.0
17***
from
fto
d(0
.009
)(0
.006
)(0
.006
)(0
.003
)(0
.003)
Fix
edE
ffec
ts
Sta
te,
Con
gres
sx
Fou
nd.f
,Sta
te,
Con
gres
sx
Fou
nd.f
,C
ong
Dis
td,
Con
gres
sx
Fou
nd.f×
Sta
te,
Con
gres
sx
Fou
nd.f×
Con
gD
istd,
Con
gres
sx
N56
0,39
556
0,39
556
0,39
556
0,39
5560,3
95
R2
0.04
00.
211
0.25
30.
321
0.5
79
Not
es:
Sta
nd
ard
erro
rsar
ecl
ust
ered
atth
efo
un
dat
ion
-sta
tele
vel.
***
p<
0.01
,**
p<
0.0
5,
*p<
0.1
40
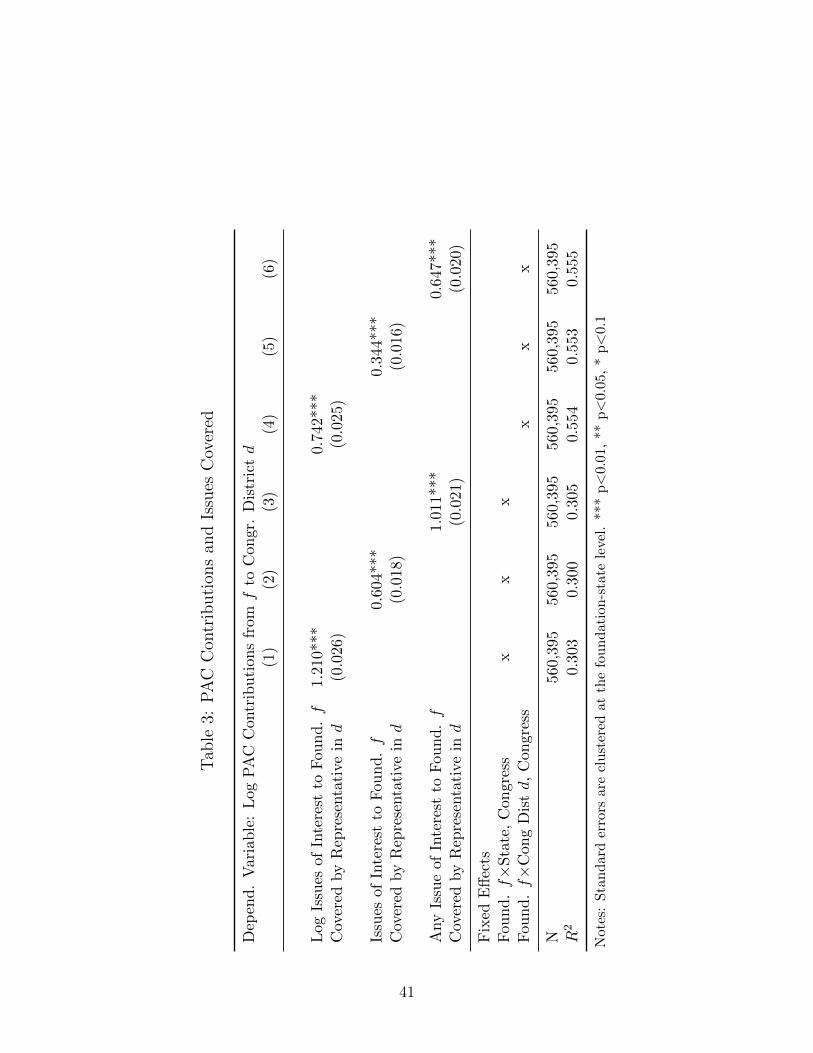
Tab
le3:
PA
CC
ontr
ibu
tion
san
dIs
sues
Cov
ered
Dep
end
.V
aria
ble
:L
ogP
AC
Con
trib
uti
ons
from
fto
Con
gr.
Dis
tric
td
(1)
(2)
(3)
(4)
(5)
(6)
Log
Issu
esof
Inte
rest
toF
oun
d.f
1.21
0***
0.74
2***
Cov
ered
by
Rep
rese
nta
tive
ind
(0.0
26)
(0.0
25)
Issu
esof
Inte
rest
toF
oun
d.f
0.60
4***
0.34
4***
Cov
ered
by
Rep
rese
nta
tive
ind
(0.0
18)
(0.0
16)
Any
Issu
eof
Inte
rest
toF
oun
d.f
1.01
1***
0.64
7***
Cov
ered
by
Rep
rese
nta
tive
ind
(0.0
21)
(0.0
20)
Fix
edE
ffec
tsF
oun
d.f×
Sta
te,
Con
gres
sx
xx
Fou
nd.f×
Con
gD
istd,
Con
gres
sx
xx
N56
0,39
556
0,39
556
0,39
556
0,39
556
0,39
556
0,39
5R
20.
303
0.30
00.
305
0.55
40.
553
0.55
5
Note
s:Sta
ndar
der
rors
are
clust
ered
atth
efo
undat
ion-s
tate
leve
l.**
*p<
0.01
,**
p<
0.05
,*
p<
0.1
41

Tab
le4:
CS
RC
ontr
ibu
tion
san
dIs
sues
Cov
ered
Dep
end.
Vari
able
:L
ogC
SR
Con
trib
uti
ons
from
fto
Con
gr.
Dis
tric
td
(1)
(2)
(3)
(4)
(5)
(6)
Log
Issu
esof
Inte
rest
toF
ound.f
0.0
88**
*0.
053*
**C
over
edby
Rep
rese
nta
tive
ind
(0.0
17)
(0.0
18)
Issu
esof
Inte
rest
toF
ound.f
0.03
9***
0.01
9**
Cov
ered
by
Rep
rese
nta
tive
ind
(0.0
09)
(0.0
10)
Any
Issu
eof
Inte
rest
toF
ound.f
0.08
3***
0.05
9***
Cov
ered
by
Rep
rese
nta
tive
ind
(0.0
13)
(0.0
14)
Fix
edE
ffec
tsF
ound.f×
Sta
te,
Con
gres
sx
xx
Found.f×
Cong
Dis
td,
Congre
ssx
xx
N56
0,39
456
0,39
456
0,39
456
0,39
456
0,39
456
0,39
4R
20.
320
0.32
00.
320
0.57
90.
579
0.57
9
Not
es:
Sta
nd
ard
erro
rsar
ecl
ust
ered
atth
efo
un
dat
ion
-sta
tele
vel.
***
p<
0.01
,**
p<
0.05
,*
p<
0.1
42
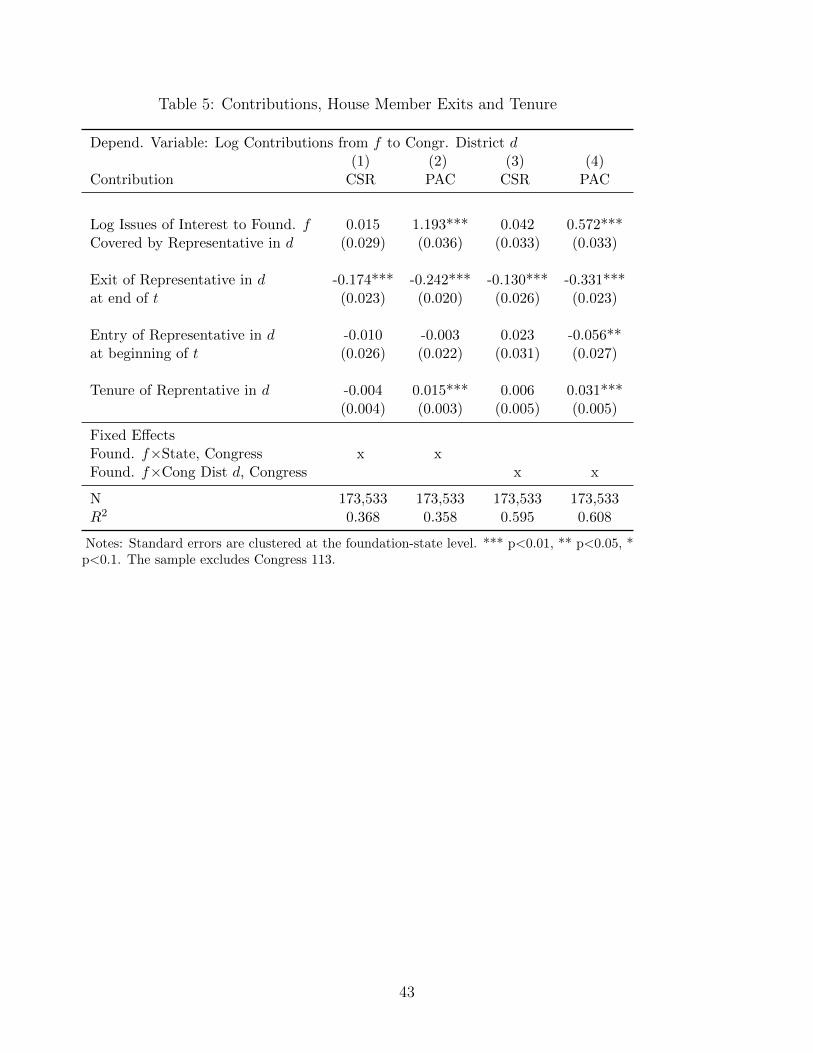
Table 5: Contributions, House Member Exits and Tenure
Depend. Variable: Log Contributions from f to Congr. District d(1) (2) (3) (4)
Contribution CSR PAC CSR PAC
Log Issues of Interest to Found. f 0.015 1.193*** 0.042 0.572***Covered by Representative in d (0.029) (0.036) (0.033) (0.033)
Exit of Representative in d -0.174*** -0.242*** -0.130*** -0.331***at end of t (0.023) (0.020) (0.026) (0.023)
Entry of Representative in d -0.010 -0.003 0.023 -0.056**at beginning of t (0.026) (0.022) (0.031) (0.027)
Tenure of Reprentative in d -0.004 0.015*** 0.006 0.031***(0.004) (0.003) (0.005) (0.005)
Fixed EffectsFound. f×State, Congress x xFound. f×Cong Dist d, Congress x x
N 173,533 173,533 173,533 173,533R2 0.368 0.358 0.595 0.608
Notes: Standard errors are clustered at the foundation-state level. *** p<0.01, ** p<0.05, *p<0.1. The sample excludes Congress 113.
43

Tab
le6:
CS
RC
ontr
ibu
tion
sto
Con
nec
ted
Ch
arit
ies
Dep
enden
tva
riab
le:
Num
ber
ofco
rpor
ate
foundat
ions
contr
ibuti
ng
toth
enon
-pro
fit
(1)
(2)
(3)
(4)
(5)
(6)
(7)
(8)
(9)
(10)
Any
connec
tions
toC
ongr
ess?
5.04
7***
4.89
2***
4.86
1***
4.83
8***
4.61
1***
(0.0
25)
(0.0
25)
(0.0
25)
(0.0
25)
(0.0
25)
Num
ber
ofco
nnec
tions
toC
ongre
ss4.
198*
**4.
099*
**4.
071*
**4.
056*
**3.
912*
**(0
.018
)(0
.018
)(0
.018
)(0
.018
)(0
.018
)L
og
Inco
me×
1000
9.46
2***
9.43
5***
9.21
8***
9.20
0***
4.82
8***
4.82
6***
1.84
6***
1.83
1***
(0.4
31)
(0.4
29)
(0.4
37)
(0.4
36)
(0.4
44)
(0.4
43)
(0.4
45)
(0.4
44)
Log
Ass
ets
9.39
6***
9.39
5***
9.20
2***
9.19
3***
14.5
04**
*14
.468
***
17.1
24**
*17
.087
***
(0.4
34)
(0.4
33)
(0.4
42)
(0.4
40)
(0.4
53)
(0.4
52)
(0.4
55)
(0.4
54)
Fix
edE
ffec
ts501
c(3)
XX
XX
XX
XX
XX
Cit
y,Sta
teX
XX
XX
XC
oar
senon
-pro
fit
sect
or(A
-Z)
XX
Det
aile
dnon-p
rofit
sect
or
(NT
EE
CC
)X
X
Obse
rvati
ons
2,1
79,
096
2,17
9,09
62,
179,
096
2,17
9,09
62,
177,
907
2,17
7,90
72,
177,
907
2,17
7,90
72,
177,
907
2,17
7,90
7R
-squar
ed0.0
220.
029
0.03
90.
046
0.04
70.
053
0.05
00.
057
0.08
00.
086
Not
es:
Rob
ust
stan
dar
der
rors
inpar
enth
eses
.**
*p<
0.01
,**
p<
0.05
,*
p<
0.1
44
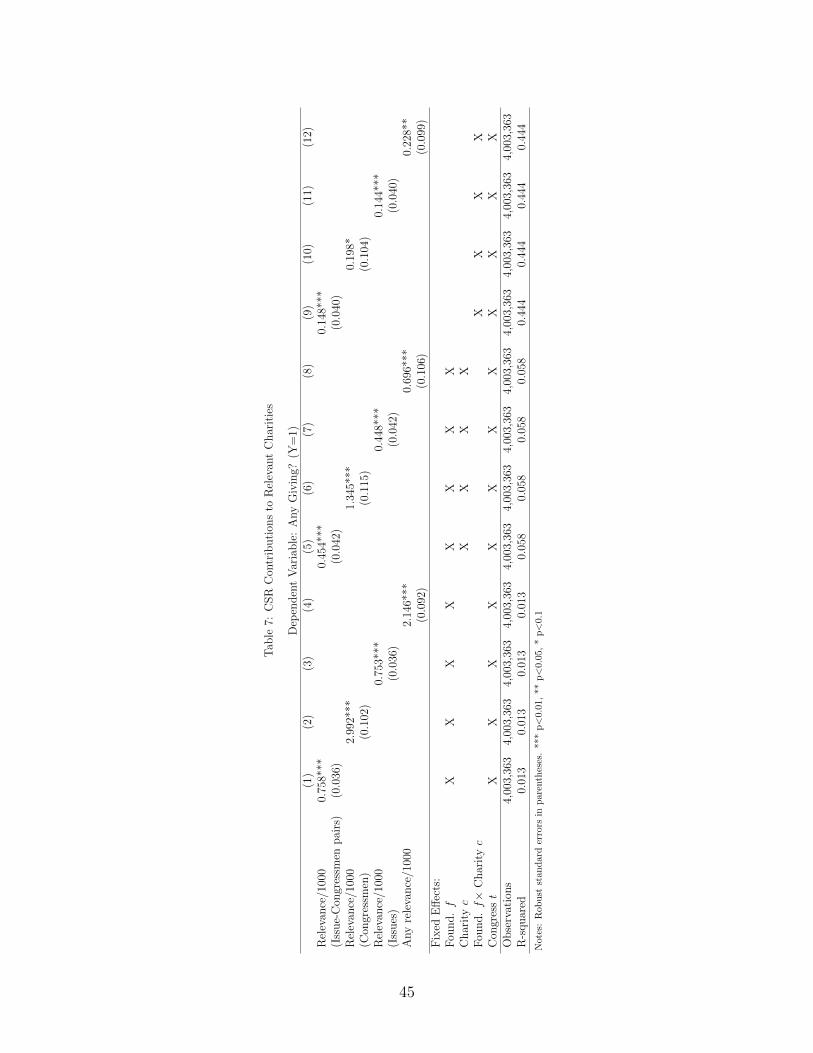
Tab
le7:
CSR
Con
trib
uti
ons
toR
elev
ant
Char
itie
s
Dep
enden
tV
aria
ble
:A
ny
Giv
ing?
(Y=
1)(1
)(2
)(3
)(4
)(5
)(6
)(7
)(8
)(9
)(1
0)(1
1)(1
2)R
elev
ance
/100
00.
758*
**0.
454*
**0.
148*
**(I
ssue-
Con
gres
smen
pai
rs)
(0.0
36)
(0.0
42)
(0.0
40)
Rel
evan
ce/1
000
2.99
2***
1.34
5***
0.19
8*(C
ongr
essm
en)
(0.1
02)
(0.1
15)
(0.1
04)
Rel
evan
ce/1
000
0.75
3***
0.44
8***
0.14
4***
(Iss
ues
)(0
.036
)(0
.042
)(0
.040
)A
ny
rele
vance
/100
02.
146*
**0.
696*
**0.
228*
*(0
.092
)(0
.106
)(0
.099
)F
ixed
Eff
ects
:F
ound.f
XX
XX
XX
XX
Char
ityc
XX
XX
Fou
nd.f×
Char
ityc
XX
XX
Con
gres
st
XX
XX
XX
XX
XX
XX
Obse
rvat
ions
4,00
3,36
34,
003,
363
4,00
3,36
34,
003,
363
4,00
3,36
34,
003,
363
4,00
3,36
34,
003,
363
4,00
3,36
34,
003,
363
4,00
3,36
34,
003,
363
R-s
quar
ed0.
013
0.01
30.
013
0.01
30.
058
0.05
80.
058
0.05
80.
444
0.44
40.
444
0.44
4
Not
es:
Rob
ust
stan
dar
der
rors
inp
aren
thes
es.
***
p<
0.01
,**
p<
0.05
,*
p<
0.1
45

A Appendix
A.1 Matching
We start with the grants by Fortune 500 and S&P 500 companies as of 2014, a file that has
809,940 observations, covering grants issued between 1998 and 2015. In the initial file we have
grants from 332 foundations to 76,321 unique recipients names. The first step is to match by name
only when the name in the FoundationSearch file matches perfectly with the name in the BMF.
For the remaining unmatched grants, we employed the matching algorithm -matchit- in Stata,
which provides similarity scores for strings that may vary because of spelling and word order. We
employed the option “token,” which reduces computational burden because it splits a string only
based on blanks, instead of generating all possible ngrams. Employing matches with a score above
0.85 we match 536,920 observations to the BMF (66.7 percent).
The number of grant-giving foundations with data that we employ is reduced slightly to 320
as a result of this matching process.
A.2 Sample construction
In this appendix we provide details on how the final sample was constructed. The basic sample
is composed of companies in the Fortune 500 or S&P 500 as of 2014. The unit of analysis is an
EIN, which is the code identifying a foundation. There are two important crosswalks that we have
constructed. The first one connects the EIN to the client name from the lobbying data, which we
use to determine the issues that are of importance to the firm/foundation. We assigned for each
EIN one or more client names based on a search performed on the OpenSecrets.org website. There
are several cases in which one EIN corresponds to more than one client name in the lobbying
records. We keep all the client names that correspond to an EIN and we determine the most
lobbied issue (based on total expenditures) for each one of those clients for each congressional
cycle. So for one EIN we potentially end up with several most lobbied issues, but we eliminate
duplications (e.g., the top issue lobbied by different divisions of Lockheed Martin is still Defense)
and keep the full set of top issues. The second crosswalk is the one between an EIN and a PACID.
The PACID is the identifier in the PAC contribution data. If there are multiple PACs per EIN
we sum the respective contribution amounts for the relevant period/recipient. If there are two
foundations/EINs that correspond to the same PAC, we split the PAC contributions equally in
two for the relevant period/recipient.
We take into account redistricting when constructing the panel and assign PACs only when a
congressional district exists. Importantly, because foundations are not active for the entire period
(or the data are not fully digitized for the earlier years in the sample), and in order to keep
46

the same sample for both PAC and CSR regressions, we keep only observations in which both
contributions are non-missing. This means that we drop some of the years in which PAC data
for the firm are available and non-missing, but we do not have data for charitable giving by the
corresponding foundation.
A.3 Proof of Claim 1
The first-order conditions of the firm maximization problem in (4) are:Ag′fC = 1
Ag′fP = 1(7)
We can take logarithms and differentiate each equation in (7):dAA
+ g′′
g′(fCdC + fPdP ) + fCP
fCdP + fCC
fCdC = 0
dAA
+ g′′
g′(fCdC + fPdP ) + fPP
fPdP + fPC
fPdC = 0
(8)
Now we can exploit the homogeneity of degree of one function f , which implies that the
marginal products fC and fP are homogeneous of degree zero. We can apply Euler’s Theorem to
the first derivatives fC and fP :
CfCC + PfCP = 0
CfPC + PfPP = 0
Therefore, the following relationships between the second-order derivatives of f hold:fCC = −PCfCP
fPP = −CPfPC
(9)
We can substitute the expressions for fCC and fPP from (9) into (8), collect terms, and manipulate
the equations to obtain the following:dAA
1P
+ dCC
[g′′
g′fC
CP− fCP
fC
]+ dP
P
[g′′
g′fP + fCP
fC
]= 0
dAA
1C
+ dCC
[g′′
g′fC + fPC
fP
]+ dP
P
[g′′
g′fP
PC− fPC
fP
]= 0
This system of equations can then be rewritten as:dAAα + dC
Cβ + dP
Pγ = 0
dAAα′ + dC
Cβ′ + dP
Pγ′ = 0
47

where α = 1/P , α′ = 1/C, β = g′′
g′fC
CP− fCP
fC, β′ = g′′
g′fC + fPC
fP, γ = g′′
g′fP + fCP
fC, γ′ =
g′′
g′fP
PC− fPC
fP. It is easy to show that dC
C/dAA
= dPP/dAA
if and only if α′β − αβ′ = αγ′ − α′γ.
To complete the proof, it is easy to verify that this condition is satisfied in our system, as the
following equality holds:
1
C
[g′′
g′fCC
P− fCP
fC
]− 1
P
[g′′
g′fC +
fPCfP
]=
1
P
[g′′
g′fPP
C− fPC
fP
]− 1
C
[g′′
g′fP +
fCPfC
]
48

A.4 Additional tables
In this section we report various robustness checks listed in the main text.
49
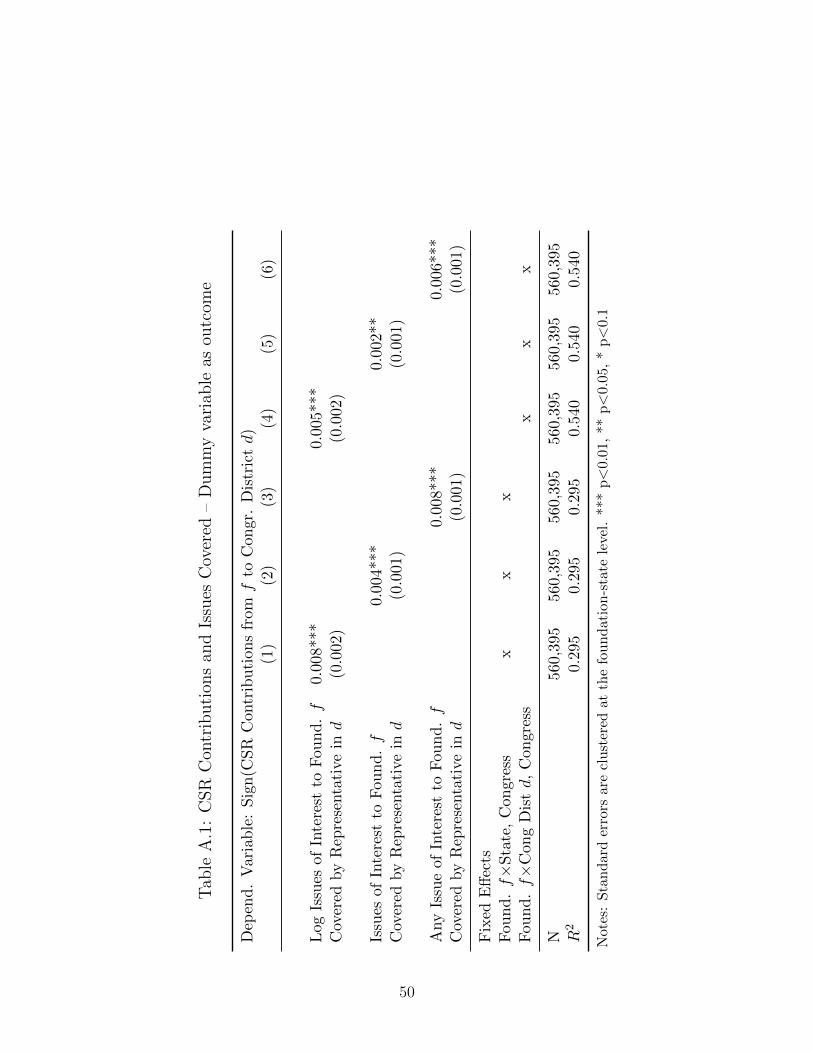
Tab
leA
.1:
CS
RC
ontr
ibu
tion
san
dIs
sues
Cov
ered
–D
um
my
vari
able
asou
tcom
e
Dep
end.
Vari
able
:Sig
n(C
SR
Contr
ibuti
ons
from
fto
Con
gr.
Dis
tric
td)
(1)
(2)
(3)
(4)
(5)
(6)
Log
Issu
esof
Inte
rest
toF
ound.f
0.0
08**
*0.
005*
**C
over
edby
Rep
rese
nta
tive
ind
(0.0
02)
(0.0
02)
Issu
esof
Inte
rest
toF
ound.f
0.00
4***
0.00
2**
Cov
ered
by
Rep
rese
nta
tive
ind
(0.0
01)
(0.0
01)
Any
Issu
eof
Inte
rest
toF
ound.f
0.00
8***
0.00
6***
Cov
ered
by
Rep
rese
nta
tive
ind
(0.0
01)
(0.0
01)
Fix
edE
ffec
tsF
ound.f×
Sta
te,
Con
gres
sx
xx
Found.f×
Cong
Dis
td,
Congre
ssx
xx
N56
0,39
556
0,39
556
0,39
556
0,39
556
0,39
556
0,39
5R
20.
295
0.29
50.
295
0.54
00.
540
0.54
0
Not
es:
Sta
nd
ard
erro
rsar
ecl
ust
ered
atth
efo
un
dat
ion
-sta
tele
vel.
***
p<
0.01
,**
p<
0.05
,*
p<
0.1
50

Table A.2: CSR Contributions in Election Years
Dep. Variable: Log Charity Contributions from Foundation f to Cong Dist dCharity Charity Charity Charity
(1) (2) (3) (4)
ElectionYear*Log Issues -0.003 -0.002(0.012) (0.013)
Log Issues 0.068*** 0.041***(0.015) (0.014)
ElectionYear*Issues -0.002 -0.002(0.007) (0.007)
Issues 0.034*** 0.020**(0.005) (0.006)
Fixed EffectsFound. f×State, Year x xFound. f×Cong Dist d, Year x x
Observations 1,047,561 1,047,561 1,047,561 1,047,561R-squared 0.290 0.290 0.513 0.513
Notes: Standard errors are clustered at the foundation-state level. *** p<0.01, **p<0.05, * p<0.1
51

Table A.3: CSR Contributions and Close Elections
Dep. Variable: Log Charity Contributions from Foundation f to Cong Dist dCharity PAC Charity PAC
(1) (2) (3) (4)
Margin<5%*Log Issues 0.0377 0.2484***(0.0597) (0.0617)
Margin<5% -0.0281 0.1139*** -0.0335 0.0783***(0.0193) (0.0188) (0.0205) (0.0196)
Log Issues 0.0620*** 0.7424*** 0.0596*** 0.7263***(0.0184) (0.0255) (0.0190) (0.0255)
Found. f×Cong Dist d FEs, Year FEs x x x x
Observations 530,699 530,699 530,699 530,699R-squared 0.5823 0.5551 0.5823 0.5551
Notes: Standard errors are clustered at the foundation-state level. *** p<0.01, ** p<0.05, * p<0.1
Table A.4: Robustness: Non-linear terms
Depend. Variable: Log Contributions from f to Congr. District d(1) (2) (3) (4)
CSR PAC CSR PAC
Log Issues of Interest to Found. f 0.226*** 1.998*** 0.173*** 1.337***Covered by Representative in d (0.038) (0.054) (0.042) (0.052)
(Log Issues)2 -0.147*** -0.846*** -0.124*** -0.616***(0.034) (0.043) (0.039) (0.044)
Fixed EffectsFound. f×State, Congress x xFound. f×Cong Dist d, Congress x x
N 560,395 560,395 560,395 560,395R2 0.320 0.305 0.579 0.555
Notes: Standard errors are clustered at the foundation-state level. *** p<0.01, ** p<0.05,* p<0.1
52

Table A.5: Robustness: Winsorized Contributions (top1%)
Depend. Variable: Winsorized Contributions from f to Congr. District d(1) (2) (3) (4)
CSR PAC CSR PAC
Log Issues of Interest to Found. f 1,008.972*** 564.095*** 328.916 335.999***Covered by Representative in d (250.427) (15.997) (234.084) (14.122)
Fixed EffectsFound. f×State, Congress x xFound. f×Cong Dist d, Congress x x
N 560,395 560,395 560,395 560,395R2 0.264 0.303 0.626 0.564
Notes: Standard errors are clustered at the foundation-state level. *** p<0.01, ** p<0.05, * p<0.1
53
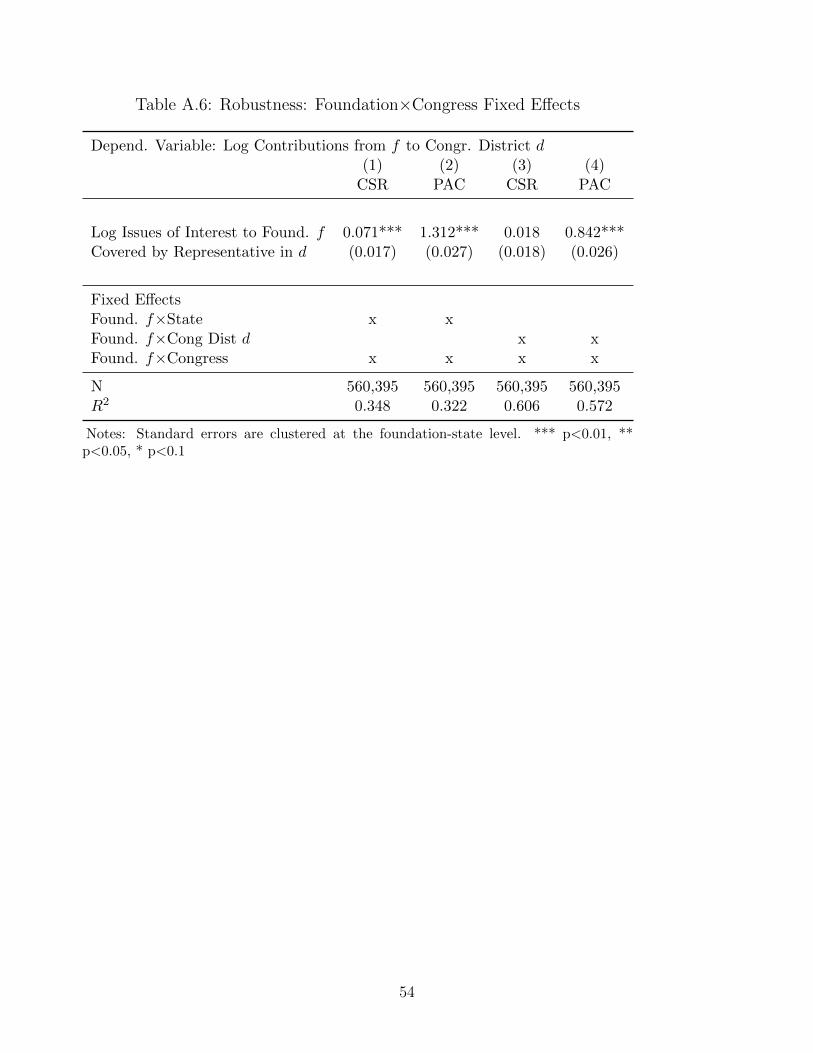
Table A.6: Robustness: Foundation×Congress Fixed Effects
Depend. Variable: Log Contributions from f to Congr. District d(1) (2) (3) (4)
CSR PAC CSR PAC
Log Issues of Interest to Found. f 0.071*** 1.312*** 0.018 0.842***Covered by Representative in d (0.017) (0.027) (0.018) (0.026)
Fixed EffectsFound. f×State x xFound. f×Cong Dist d x xFound. f×Congress x x x x
N 560,395 560,395 560,395 560,395R2 0.348 0.322 0.606 0.572
Notes: Standard errors are clustered at the foundation-state level. *** p<0.01, **p<0.05, * p<0.1
54
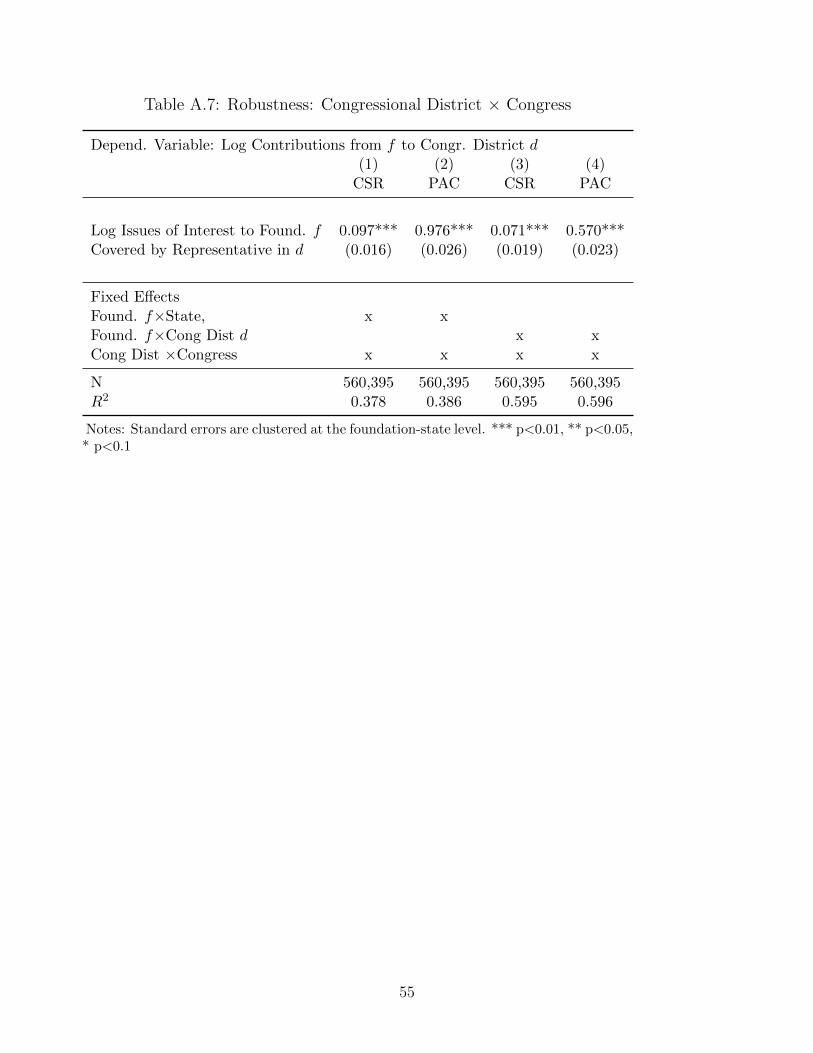
Table A.7: Robustness: Congressional District × Congress
Depend. Variable: Log Contributions from f to Congr. District d(1) (2) (3) (4)
CSR PAC CSR PAC
Log Issues of Interest to Found. f 0.097*** 0.976*** 0.071*** 0.570***Covered by Representative in d (0.016) (0.026) (0.019) (0.023)
Fixed EffectsFound. f×State, x xFound. f×Cong Dist d x xCong Dist ×Congress x x x x
N 560,395 560,395 560,395 560,395R2 0.378 0.386 0.595 0.596
Notes: Standard errors are clustered at the foundation-state level. *** p<0.01, ** p<0.05,* p<0.1
55
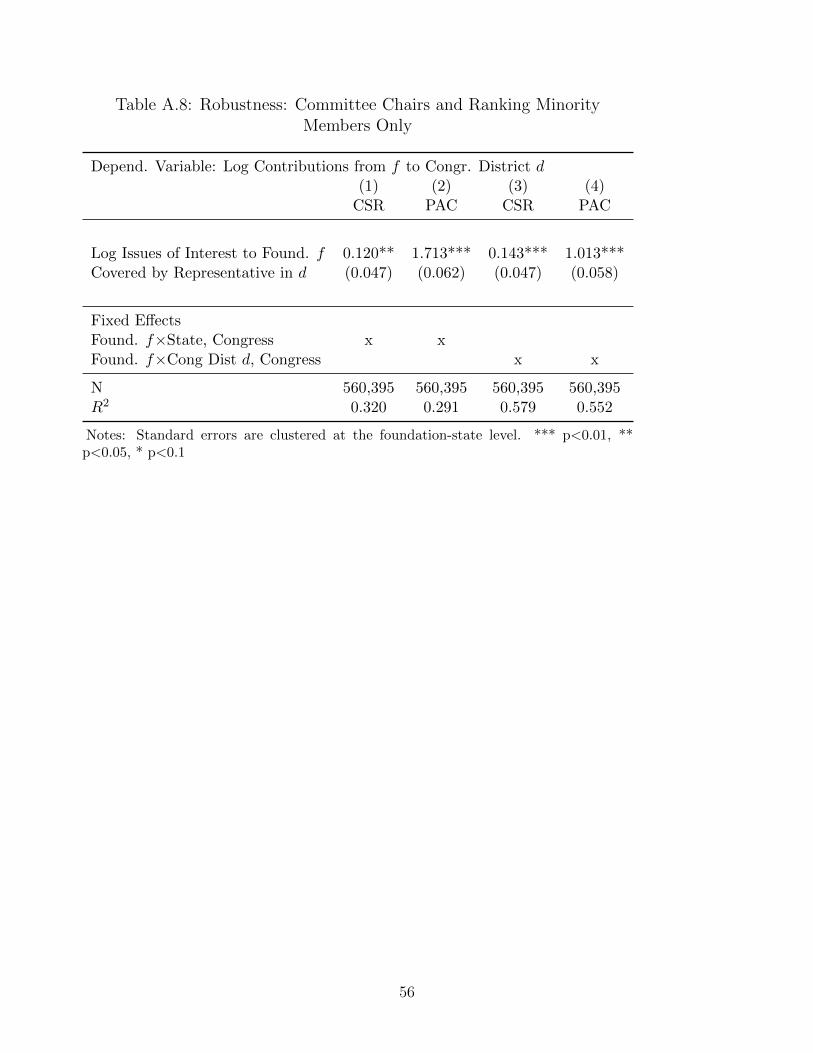
Table A.8: Robustness: Committee Chairs and Ranking MinorityMembers Only
Depend. Variable: Log Contributions from f to Congr. District d(1) (2) (3) (4)
CSR PAC CSR PAC
Log Issues of Interest to Found. f 0.120** 1.713*** 0.143*** 1.013***Covered by Representative in d (0.047) (0.062) (0.047) (0.058)
Fixed EffectsFound. f×State, Congress x xFound. f×Cong Dist d, Congress x x
N 560,395 560,395 560,395 560,395R2 0.320 0.291 0.579 0.552
Notes: Standard errors are clustered at the foundation-state level. *** p<0.01, **p<0.05, * p<0.1
56
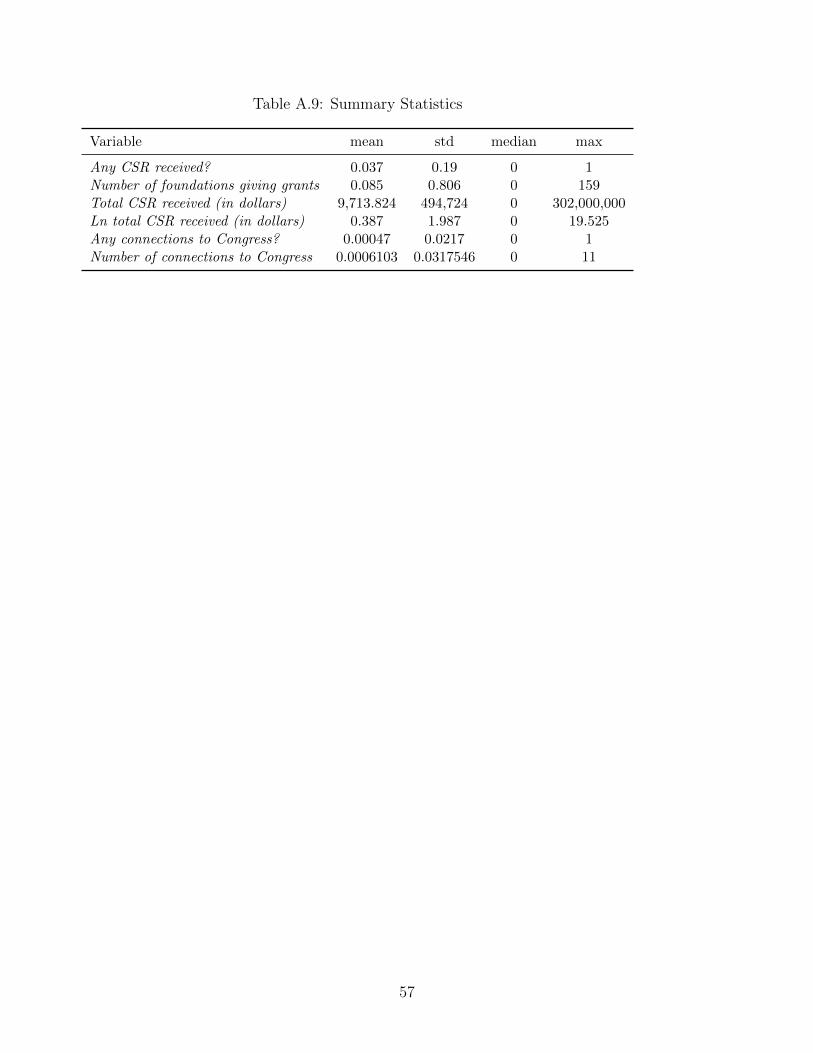
Table A.9: Summary Statistics
Variable mean std median max
Any CSR received? 0.037 0.19 0 1Number of foundations giving grants 0.085 0.806 0 159Total CSR received (in dollars) 9,713.824 494,724 0 302,000,000Ln total CSR received (in dollars) 0.387 1.987 0 19.525Any connections to Congress? 0.00047 0.0217 0 1Number of connections to Congress 0.0006103 0.0317546 0 11
57
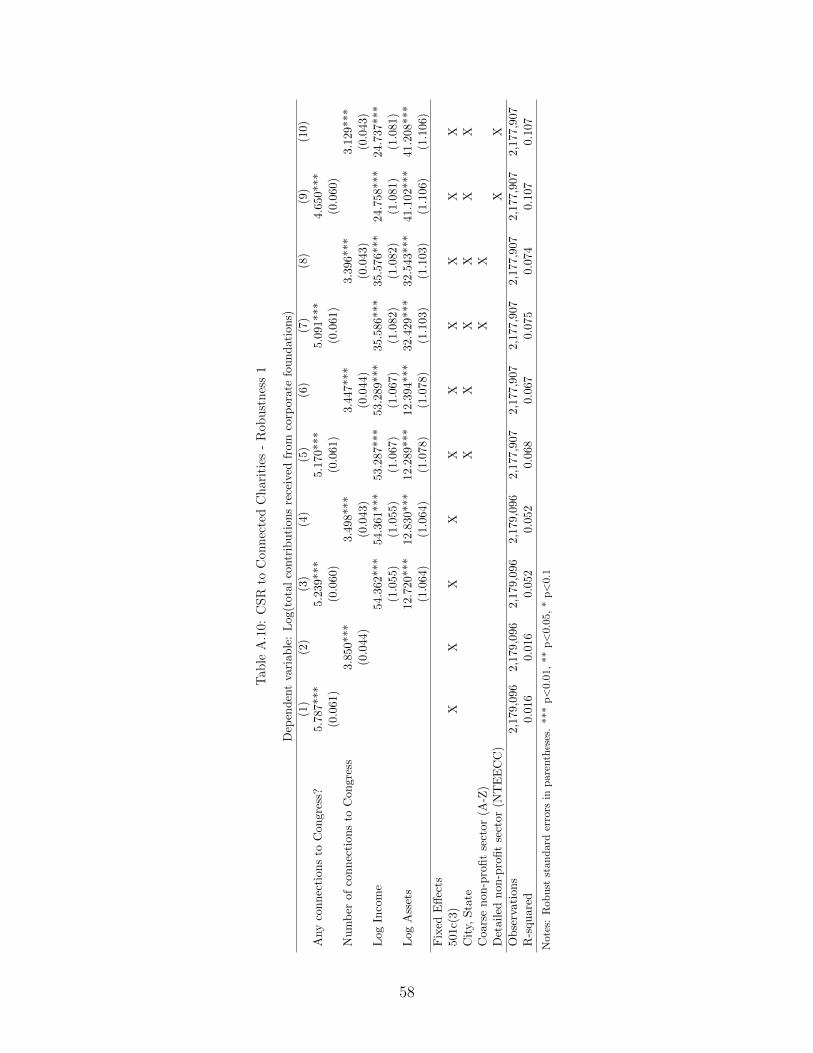
Tab
leA
.10:
CSR
toC
onnec
ted
Char
itie
s-
Rob
ust
nes
s1
Dep
end
ent
vari
able
:L
og(t
otal
contr
ibu
tion
sre
ceiv
edfr
omco
rpor
ate
fou
nd
atio
ns)
(1)
(2)
(3)
(4)
(5)
(6)
(7)
(8)
(9)
(10)
Any
con
nec
tion
sto
Con
gres
s?5.
787*
**5.
239*
**5.
170*
**5.
091*
**4.
650*
**(0
.061)
(0.0
60)
(0.0
61)
(0.0
61)
(0.0
60)
Nu
mb
erof
con
nec
tion
sto
Con
gres
s3.
850*
**3.
498*
**3.
447*
**3.
396*
**3.
129*
**(0
.044
)(0
.043
)(0
.044
)(0
.043
)(0
.043
)L
ogIn
com
e54
.362
***
54.3
61**
*53
.287
***
53.2
89**
*35
.586
***
35.5
76**
*24
.758
***
24.7
37**
*(1
.055
)(1
.055
)(1
.067
)(1
.067
)(1
.082
)(1
.082
)(1
.081
)(1
.081
)L
ogA
sset
s12
.720
***
12.8
30**
*12
.289
***
12.3
94**
*32
.429
***
32.5
43**
*41
.102
***
41.2
08**
*(1
.064
)(1
.064
)(1
.078
)(1
.078
)(1
.103
)(1
.103
)(1
.106
)(1
.106
)
Fix
edE
ffec
ts50
1c(3
)X
XX
XX
XX
XX
XC
ity,
Sta
teX
XX
XX
XC
oar
sen
on-p
rofi
tse
ctor
(A-Z
)X
XD
etai
led
non
-pro
fit
sect
or
(NT
EE
CC
)X
X
Ob
serv
atio
ns
2,17
9,09
62,
179,
096
2,17
9,09
62,
179,
096
2,17
7,90
72,
177,
907
2,17
7,90
72,
177,
907
2,17
7,90
72,
177,
907
R-s
qu
ared
0.0
16
0.01
60.
052
0.05
20.
068
0.06
70.
075
0.07
40.
107
0.10
7
Not
es:
Rob
ust
stan
dar
der
rors
inpar
enth
eses
.**
*p<
0.01
,**
p<
0.05
,*
p<
0.1
58

Tab
leA
.11:
CS
Rto
Con
nec
ted
Ch
arit
ies
-R
obu
stn
ess
2
Dep
end
ent
vari
able
:D
oes
the
non
-pro
fit
rece
ive
any
corp
orat
ech
ari
ty?
(1)
(2)
(3)
(4)
(5)
(6)
(7)
(8)
(9)
(10)
Any
con
nec
tion
sto
Con
gres
s?0.
462*
**0.
411*
**0.
405*
**0.3
98***
0.3
61***
(0.0
06)
(0.0
06)
(0.0
06)
(0.0
06)
(0.0
06)
Nu
mb
erof
con
nec
tion
sto
Con
gres
s0.
298*
**0.
266*
**0.
262*
**
0.2
57***
0.2
35***
(0.0
04)
(0.0
04)
(0.0
04)
(0.0
04)
(0.0
04)
Log
Inco
me/
1000
5.37
1***
5.37
1***
5.26
2***
5.26
3***
3.5
72***
3.5
71***
2.5
74***
2.5
73***
(0.1
01)
(0.1
01)
(0.1
02)
(0.1
02)
(0.1
04)
(0.1
04)
(0.1
04)
(0.1
04)
Log
Ass
ets/
1000
0.80
8***
0.81
7***
0.78
9***
0.79
9***
2.7
05***
2.7
15***
3.4
83***
3.4
93***
(0.1
02)
(0.1
02)
(0.1
03)
(0.1
03)
(0.1
06)
(0.1
06)
(0.1
06)
(0.1
06)
Fix
edE
ffec
ts50
1c(3
)X
XX
XX
XX
XX
XC
ity,
Sta
teX
XX
XX
XC
oars
en
on-p
rofi
tse
ctor
(A-Z
)X
XD
etai
led
non
-pro
fit
sect
or(N
TE
EC
C)
XX
Ob
serv
atio
ns
2,17
9,09
62,
179,
096
2,17
9,09
62,
179,
096
2,17
7,90
72,
177,
907
2,1
77,9
07
2,1
77,9
07
2,1
77,9
07
2,1
77,9
07
R-s
qu
ared
0.01
50.
015
0.04
90.
048
0.06
40.
064
0.0
71
0.0
71
0.1
00
0.1
00
Not
es:
Rob
ust
stan
dar
der
rors
inp
aren
thes
es.
***
p<
0.01
,**
p<
0.05
,*
p<
0.1
59

Table A.12: Summary Statistics for PFD exercise
Variable mean std min maxAny giving? 0.0044 0.0657 0 1Log (1+Charitable Contributions) 0.0436 0.6667 0 17.4534Relevance (Issue-Congressmen pairs) 0.7372 1.6994 0 41Relevance (Congressmen) 0.3046 0.5366 0 9Relevance(Issues) 0.7371 1.6991 0 37Any Relevance 0.2769 0.4475 0 1
60
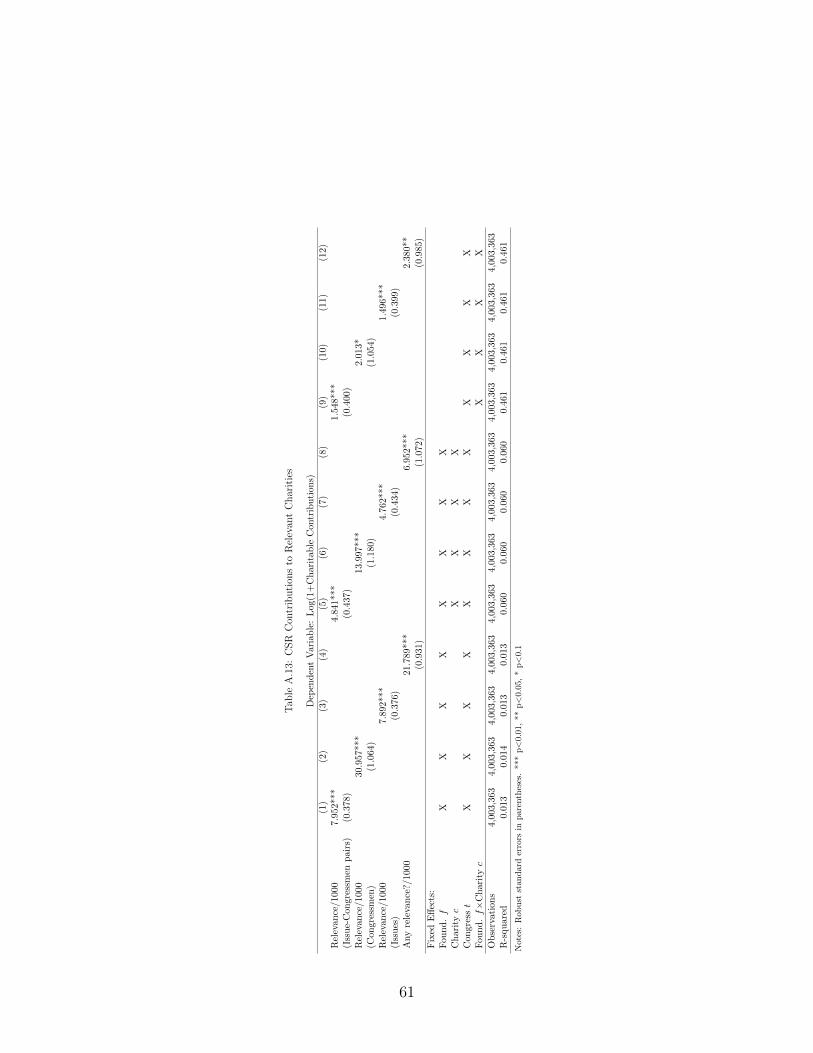
Tab
leA
.13:
CSR
Con
trib
uti
ons
toR
elev
ant
Char
itie
s
Dep
enden
tV
aria
ble
:L
og(1
+C
har
itab
leC
ontr
ibuti
ons)
(1)
(2)
(3)
(4)
(5)
(6)
(7)
(8)
(9)
(10)
(11)
(12)
Rel
evan
ce/1
000
7.95
2***
4.84
1***
1.54
8***
(Iss
ue-
Con
gres
smen
pai
rs)
(0.3
78)
(0.4
37)
(0.4
00)
Rel
evan
ce/1
000
30.9
57**
*13
.997
***
2.0
13*
(Con
gres
smen
)(1
.064
)(1
.180
)(1
.054)
Rel
evan
ce/1
000
7.89
2***
4.76
2***
1.4
96***
(Iss
ues
)(0
.376
)(0
.434
)(0
.399)
Any
rele
vance
?/10
0021
.789
***
6.95
2***
2.3
80**
(0.9
31)
(1.0
72)
(0.9
85)
Fix
edE
ffec
ts:
Fou
nd.f
XX
XX
XX
XX
Char
ityc
XX
XX
Con
gres
st
XX
XX
XX
XX
XX
XX
Fou
nd.f×
Char
ityc
XX
XX
Obse
rvat
ions
4,00
3,36
34,
003,
363
4,00
3,36
34,
003,
363
4,00
3,36
34,
003,
363
4,00
3,36
34,
003,
363
4,00
3,36
34,
003,3
63
4,0
03,3
63
4,0
03,3
63
R-s
quar
ed0.
013
0.01
40.
013
0.01
30.
060
0.06
00.
060
0.06
00.
461
0.4
61
0.4
61
0.4
61
Not
es:
Rob
ust
stan
dard
erro
rsin
par
enth
eses
.**
*p<
0.01
,**
p<
0.05
,*
p<
0.1
61
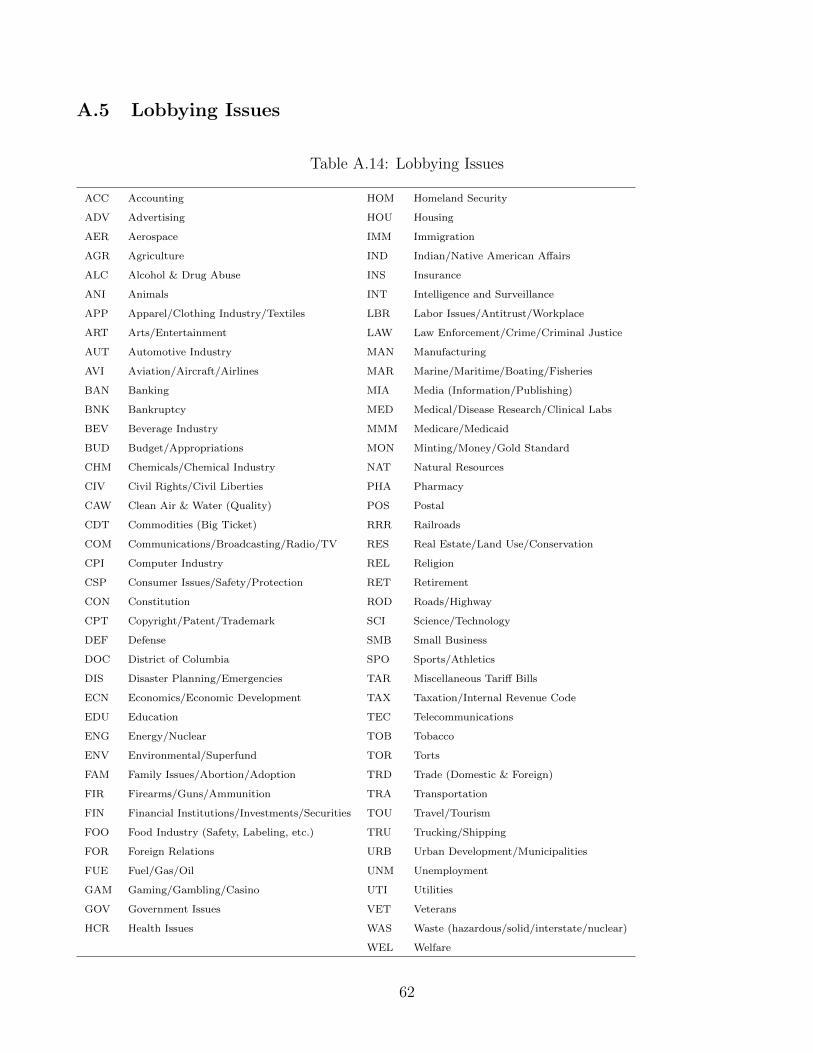
A.5 Lobbying Issues
Table A.14: Lobbying Issues
ACC Accounting HOM Homeland Security
ADV Advertising HOU Housing
AER Aerospace IMM Immigration
AGR Agriculture IND Indian/Native American Affairs
ALC Alcohol & Drug Abuse INS Insurance
ANI Animals INT Intelligence and Surveillance
APP Apparel/Clothing Industry/Textiles LBR Labor Issues/Antitrust/Workplace
ART Arts/Entertainment LAW Law Enforcement/Crime/Criminal Justice
AUT Automotive Industry MAN Manufacturing
AVI Aviation/Aircraft/Airlines MAR Marine/Maritime/Boating/Fisheries
BAN Banking MIA Media (Information/Publishing)
BNK Bankruptcy MED Medical/Disease Research/Clinical Labs
BEV Beverage Industry MMM Medicare/Medicaid
BUD Budget/Appropriations MON Minting/Money/Gold Standard
CHM Chemicals/Chemical Industry NAT Natural Resources
CIV Civil Rights/Civil Liberties PHA Pharmacy
CAW Clean Air & Water (Quality) POS Postal
CDT Commodities (Big Ticket) RRR Railroads
COM Communications/Broadcasting/Radio/TV RES Real Estate/Land Use/Conservation
CPI Computer Industry REL Religion
CSP Consumer Issues/Safety/Protection RET Retirement
CON Constitution ROD Roads/Highway
CPT Copyright/Patent/Trademark SCI Science/Technology
DEF Defense SMB Small Business
DOC District of Columbia SPO Sports/Athletics
DIS Disaster Planning/Emergencies TAR Miscellaneous Tariff Bills
ECN Economics/Economic Development TAX Taxation/Internal Revenue Code
EDU Education TEC Telecommunications
ENG Energy/Nuclear TOB Tobacco
ENV Environmental/Superfund TOR Torts
FAM Family Issues/Abortion/Adoption TRD Trade (Domestic & Foreign)
FIR Firearms/Guns/Ammunition TRA Transportation
FIN Financial Institutions/Investments/Securities TOU Travel/Tourism
FOO Food Industry (Safety, Labeling, etc.) TRU Trucking/Shipping
FOR Foreign Relations URB Urban Development/Municipalities
FUE Fuel/Gas/Oil UNM Unemployment
GAM Gaming/Gambling/Casino UTI Utilities
GOV Government Issues VET Veterans
HCR Health Issues WAS Waste (hazardous/solid/interstate/nuclear)
WEL Welfare
62