nber working paper series on mutual fund … · on mutual fund investment styles louis k.c. chan,...
TRANSCRIPT
NBER WORKING PAPER SERIES
ON MUTUAL FUNDINVESTMENT STYLES
Louis K.C. ChanHsiu-Lang ChenJosef Lakonishok
Working Paper 7215http://www.nber.org/papers/w7215
NATIONAL BUREAU OF ECONOMIC RESEARCH1050 Massachusetts Avenue
Cambridge, MA 02138July 1999
This paper has been presented at the American Finance Association 1999 meetings and the University ofRochester. We thank Ray Ball, Eugene Fama, Wayne Ferson, Jason Karceski, Mark Laplante, Scott Ritter,and Jerry Warner for comments, and Martin Gruber, the discussant. All opinions expressed are those of theauthors and not those of the National Bureau of Economic Research.
© 1999 by Louis K.C. Chan, Hsiu-Lang Chen, and Josef Lakonishok. All rights reserved. Short sections oftext, not to exceed two paragraphs, may be quoted without explicit permission provided that full credit,including © notice, is given to the source.
On Mutual Fund Investment StylesLouis K.C. Chan, Hsiu-Lang Chen, and Josef LakonishokNBER Working Paper No. 7215July 1999JEL No. G11, G23
ABSTRACT
We provide an exploratory investigation of mutual funds’ investment styles. Funds’ styles
tend to cluster around a broad market benchmark. When funds deviate from the benchmark they are
more likely to favor growth stocks with good past performance. There is some consistency in styles,
although funds with poor past performance are more likely to change styles. Some evidence suggests
that growth funds have better style-adjusted performance than value funds. The results are not
sensitive to style identification procedure, but an approach based on fund portfolio characteristics
performs better in predicting future fund returns.
Louis K.C. Chan Hsiu Lang ChenDepartment of Finance Department of FinanceCollege of Commerce and College of Commerce and Business Administration Business AdministrationUniversity of Illinois Urbana-Champaign University of Illinois Urbana-Champaign1206 South Sixth Street 1206 South Sixth StreetChampaign, IL 62820 Champaign, IL [email protected]
Josef LakonishokDepartment of FinanceCollege of Commerce and Business AdministrationUniversity of Illinois Urbana-Champaign1206 South Sixth StreetChampaign, IL 62820and [email protected]
Many crucial investment decisions rest on identifying and selecting portfolio managers who are
expected to deliver superior performance. Professional investmentmanagers, however, follow a vari-
ety of approaches. Some rely solely on quantitative models. Others are more qualitatively-oriented
and consider information from sources such as firm managers, press reports and security analysts'
recommendations. They adopt different criteria for stock selection — identifying underpriced se-
curities, seeking growth potential, or following past price trends, to use a handful of examples.
The bewildering variety of approaches complicates the already difficult problem of evaluating the
performance of investment managers.
One segment of the institutional investment community, namely, pension funds, has responded
to the proliferation of investment approaches by paying more attention to a manager's investment
style. The focus on style stems from several motivations. Taking a manager's style into account
helps in performance evaluation by giving a clearer picture about the manager's skill. For example,
a manager who invests in small stocks should not necessarily deserve all the credit if theportfolio
did well in a particular period; rather, small stocks in general may have done better than the market
benchmark. A second stimulus arises from plan sponsors' desires to control the risk of the overall
portfolio. A plan sponsor might select a few activemanagers who are expected to achieve superior
performance, but this may be scant comfort if they all follow similar styles. In this case they would
tend to select similar stocks, resulting in an overall portfolio that is highly undiversified relative
to a broad-based benchmark. By picking managers with different styles, a sponsor can avoid large
deviations in performance away from a general index.
The focus on style has gradually carried over into another group of institutional investors,
mutual funds. Investor interest in mutual funds has exploded in recent years. At the end of
1990, fund net assets stood at 246 billion dollars but soared to 1.3 trillion dollars by 1995 and 2.4
trillion dollars by 1997. In part, the growth has been fueled by the increase in defined contribution
or 401(k) pension assets. Administrators of such plans have a fiduciary responsibility to provide
an appropriate variety of asset classes to participants. As a result, many administrators screen
1
funds and present to employees a menu of funds representing different styles. More generally,
individual investors are becoming more educated and sophisticated about allocating their assets
across mutual funds with different objectives. To a growing extent, therefore, fund managers and
fund investors alike recognize the importance of differentiating funds in terms of their investment
styles. For example one leading vendor of information on mutual funds, Morningstar, classifies
funds by investment style in terms of two dimensions: market capitalization and value-growth
orientation. Consulting firms and software vendors are also providing investors with the tools to
identify investment style.'
Academic research has generally lagged behind investors' interest in fund styles. To help cor-
rect the imbalance, this paper provides an exploratory investigation of the investment styles of
mutual funds. In doing so we hope to improve our understanding of the behaviorof this large and
growing group of investors. Specifically, we begin by documenting the characteristics of fundport-
folios. When placed alongside results on the pension fund industry (see, for example, Lakonishok,
Shleifer and Vishny (1997)), our findings help uncover reasons why so few institutional investors
demonstrate consistently superior performance. We also provide evidence on consistency in fund
styles over time, and the forces that may drive managers to change styles. In addition to being an
important practical issue to fund investors, shifts in style may reflect situations where managers'
behavior are influenced by considerations other than the maximization of portfolio risk-adjusted
performance. Although the issue of fund performance is not our main concern, our analysis also
lets us check whether differences in style are associated with differences in performance. Finally,
this paper provides a comparative evaluation of the performance of different methodologies for styleidentification.
In studying the distribution of fund styles we intend to provide some clues to resolve an apparent
paradox in fund performance. Previous academic research on mutual funds has extensively studied
their investment performance. Important contributions have been made by, among others, Jensen1Hemmerick (1998), for example, reports on software provided over the Internet, based on work by William Sharpe,
to analyze fund style.
2
(1968), Ippolito (1989), Elton, Gruber, Das, and Hlavka (1993), and Malkiel (1995). Other studies
examine whether there is persistence in performance (Grinblatt and Titman (1992), Hendricks,
Patel and Zeckhauser (1993), Brown and Goetzmann (1995), Elton, Gruber and Blake (1996)). In
general the findings do not seem to indicate that funds as a group out-perform passive benchmarks.
This evidence is even more striking when juxtaposed against the voluminous research documenting
an assortment of return anomalies. For example, a portfolio of "value" stocks (with high ratiosof book-to-market value of equity) generated on paper returns that have in the past averaged five
percent per year in excess of the S&P 500 index. The puzzle then is why there is such a scarcity of
funds with consistently superior performance.
One place to look for possible explanations is in the pension fund industry. A growing area of
research indicates that institutional investors' behavior may be colored by considerations beyond
the maximization of portfolio return or diversification. In thecase of defined-benefit pension plans,
for instance, Lakonishok, Shleifer and Vishny (1992) point out that many parties influence the
process of investing pension assets, including corporate managers, treasurers, external consultants
and money managers. Given the multiplicity of such interests, an agency problem arises. One result
is that external investment managers are evaluated not only in terms ofinvestment performance, but
also along dimensions such as prudence, which in practice is influenced by what other managers are
doing. Accordingly, a manager's holdings, as well as the return on the portfolio, are scrutinized.
For example, Lakonishok, Shleifer and Vishny (1994) speculate that money managers' concerns
about their careers lead them to tilt toward investing in growth stocks.2
Based on the evidence for pension fund managers, one conjecture is that there are similar non-2The agency problem in pension fund management shows up in other forms as well. For example, Lakonishok,
Shleifer, Thaler and Vishny (1991) find evidence that managers tend to rebalance their portfolios atyear-end away
from poorly-performing (and hence potentially embarrassing) stocks toward larger, more successful firms (which are
easier to justify to plan sponsors). Similarly, the pressures of relative performancebenchmarking may create anincentive for institutions to herd (buy or sell the same stocks at the same time), as studied by Lakonishok, Shleifer
and Vishny (1992).
3
performance considerations that affect mutual fund managers' choice of investment styles.3 To the
extent that these choices degrade performance, then a result is the general underperformance of
mutual funds. Mechanically extrapolating the argument about non-performance distortions within
the pension fund industry to mutual funds would not be appropriate, however. Unlike a pension
fund, there are typically fewer intermediaries such as firm managers, treasurers or consultants
between investors and mutual fund managers. On this account mutual fund managers should be
able to concentrate more on maximizing return for a given level of risk. However, other influences
may also come into play. Managers' personal career concerns, together with the relatively short
horizons over which they are evaluated, may induce them to play it safe and not deviatesubstantially
from popular benchmarks (such as the S&P 500). Theremay be room for distortions because some
investors are slow to move away from poorly-performing funds. Their inertia may reflect search
costs (see, for example, Sirri and Tufano (1998)), or cognitive biases (Goetzmann and Peles (1997)).
Our examination of the investment styles followed by U.S. equity mutual funds checks for the
importance of non-performance distortions (because of agency or other reasons). Taking at face
value the evidence on return anomalies, an outside observer might expect to find that mutual funds
should aggressively pursue certain investment strategies that have been documented to produce
superior returns in the past. An alternative hypothesis is that managers face high personal career
risks for adopting these styles. Instead, they choose portfolios that do not deviate markedly from
market benchmarks (Lakonishok, Shleifer and Vishny (1997) refer to such behavior as "bunching
at the center"). In so doing they hope to avoid being penalized for under-performance, but sacrifice
the opportunity for out-performance.
A second task of this paper is to see if there is consistency in fund styles. The concept of
investment style rests on the premise that fund managers select from a well-defined domain such as
3Some evidence is accumulating about the incentives faced by mutual fund managers and how they shape funds'
behavior. Grinblatt, Titman and Wermers (1995) investigate herding behavior for mutual funds. Brown, Harlow and
Starks (1996), Chavalier and Ellison (1997) find that a mutual fund's past performance affects its futurerisk-taking
behavior. Karceski's (1998) model suggests that funds tend to favor growth stocks over value stocks.
4
small stocks or growth stocks. It is possible that managers structure their portfoliosvery differently.
For example, they may choose stocks they believe to be underpriced regardless ofunderlying traits
such as size or book-to-market. In this case, the same manager would tend to drift between stocks
with very different features, and hence the idea of a coherent style would not be meaningful. At
this most basic level, therefore, it is important to check for consistency in styles toverify that they
correspond to meaningful dimensions of fund behavior. In practical terms, an investor structuring
a portfolio of funds would be concerned if fund managers deviate from their declared styles. This
would introduce additional variability in the overall portfolio relative to a benchmark. A final
motivation for checking on style consistency is in the context of the above discussion of distortions
in investment behavior. In particular, in some situations a manager may have an incentive to
deviate from his declared style, in hopes of recovering from past losses or simply to follow the
crowd and adopt whichever style has been successful. For these reasons we check to see if there is
any consistency in fund style, and whether funds alter their styles in response to past performance.
A final contribution of this paper is on the methodological front. While there is little disagree-
ment on the importance of style identification, there is scant scientific evidence on how this is to
be done most informatively. One approach (Sharpe (1992), Carhart (1997)) which iscommonly
used by practitioners and academics is to relate the past history of fund returns to observable in-
dices or factors (see also Brown and Goetzmann (1997)). Each index represents a dimension of the
behavior of returns corresponding to a particular style (for example, small stocks or value stocks).
The fund's estimated sensitivities or loadings are taken as measures of its style. Alternatively, the
characteristics of the stocks held by a fund serve as another indicator of the types of firms in which
the fund invests, and hence its style. Grinblatt and Titman (1989) use suchan approach to evaluate
fund performance. While each method has its strengths and limitations, there has been little work
evaluating the performance of each approach on actual fund data. On a related note, Daniel and
Titman (1997) find that stock characteristics rather than factor loadings explain the cross-sectional
behavior of average returns. We confront the different approaches to style classification on a broad
5

sample of funds. Style measures based on factor sensitivities are compared against measures using
portfolio holdings.
Our basic finding is that mutual funds tend to adopt styles that cluster around a broad index
such as the Standard & Poor's 500 index. Few funds take extreme positions relative to the index.
When they choose to stray from the benchmark, however, they are more prone to favor growth
stocks and stocks with good past performance. These results from the mutual fund industry,
together with related evidence from the pension fund industry, are consistent with explanations
related to agency or behavioral factors.
Funds overall display some consistency in the styles they follow, suggesting that the dimensions
we use are meaningful portrayals of fund behavior. However, funds who have performed poorly in
the past are more prone to subsequent shifts in style. Such style drifts are particularly notable in
the case of value funds which have experienced poor past performance (compared to growth funds
with poor returns).
Our basic findings are not sensitive to the procedure used to identify fund style. A fund's
portfolio characteristics, and its factor sensitivities, generally give similar readings of its style.
Confronting the two approaches in those cases where they differ, however, we find that the approach
based on portfolio characteristics tends to do a better job in predicting future fund performance.
The rest of the paper is organized as follows. Section 1 describes the data and gives some details
on the characteristics of mutual fund portfolios. Section 2 provides another perspective on funds'
styles in terms of their exposures to common return factors. As a bridge to prior research, we
also provide some results on average fund performance classified by style in this section. Section 3
deals with funds' style consistency and its relation to past performance. A comparison of the two
approaches to style analysis is contained in section 4. A final section concludes.
6
1. Mutual fund portfolio characteristics
1.1. Data
Our analysis is based on two datasets from Morningstar, Inc. The sample includes all domestic
equity funds existing at the end of 1997. Data on defunct funds is available as well, but begins
only in 1989. Given that our focus is on fund styles and not fund performance, the presence of a
survivorship bias in the earlier years of the sample period may be a less worrisome concern. The
first dataset reports monthly fund returns from January 1976 to December 1997. A second dataset
reports funds' portfolio holdings, beginning in 1983. After merging the two datasets and checking
against the Compustat file, there are 3,336 funds with information on returns and holdings as of
the end of 1997.
Table I reports the number of funds at the end of each calendar year over the sample period.
The size of the sample grows over time, with particularly high growth during the 1990s. In addition,
the table compares the performance of the sample with the return on several market indices. To
measure aggregate fund performance, we compute monthly returns on the equally-weighted portfolio
of funds and then compound to get calendar year returns. The verdict on aggregate performance
is familiar — net of expenses, the fund sample fails to match the performance of the overall market.
The average return on the fund portfolio is 16.32 percent, which is lower than the return on any
of the other market indices. In particular, funds' average under-performance relative to the S&P
500 index is 1.6 percent. This is not too far from estimates of funds' expense ratios that have been
reported in other studies. For example, Carhart (1997), Gruber (1996), Sirri and Tufano (1998)
all report average expense ratios between 1.1 and 1.4 percent. Note that the evidence suggests
under-performance even before taking into account the survivorship bias that affects this sample
before 1989.
4Part of the mutual funds' portfolios may also be held as cash, representing a drag on performance relative to
equities over most of this period.
7
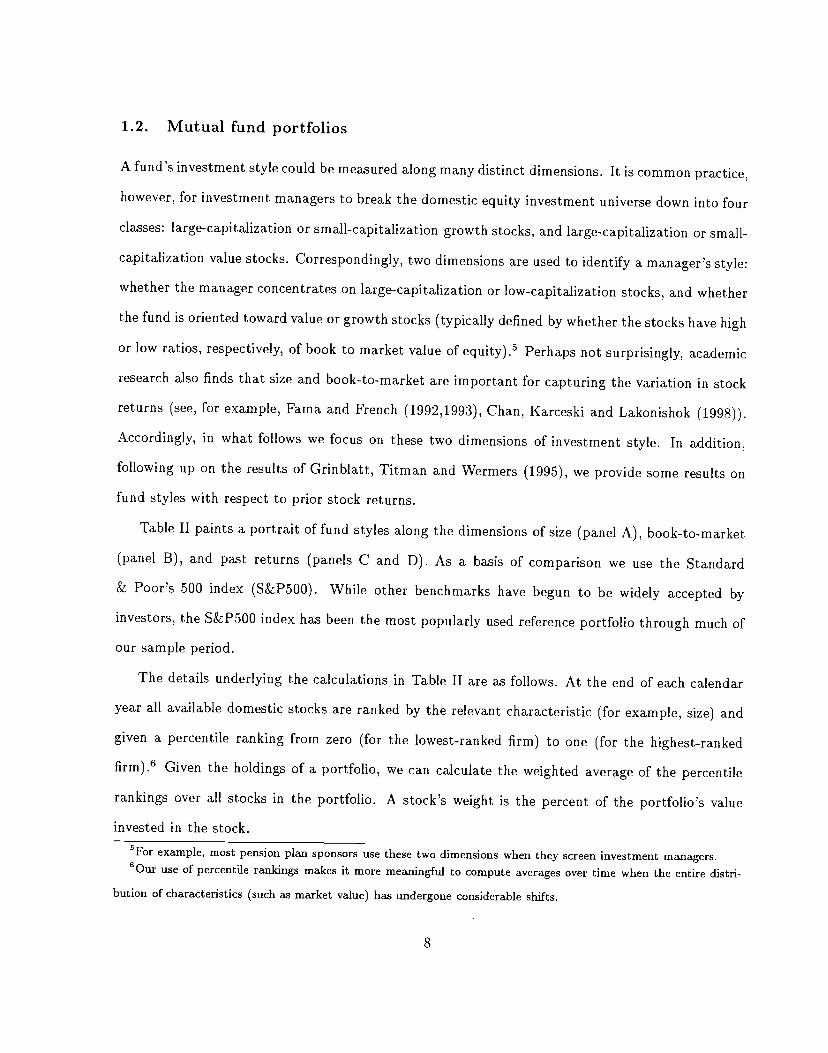
1.2. Mutual fund portfolios
A fund's investment style could be measured along many distinct dimensions. It is common practice,
however, for investment managers to break the domestic equity investment universe down into four
classes: large-capitalization or small-capitalization growth stocks, and large-capitalization or small-
capitalization value stocks. Correspondingly, two dimensions are used to identify a manager's style:
whether the manager concentrates on large-capitalization or low-capitalizationstocks, and whether
the fund is oriented toward value or growth stocks (typically defined by whether the stocks havehigh
or low ratios, respectively, of book to market value of equity) . Perhaps not surprisingly, academic
research also finds that size and book-to-market are important for capturing the variation in stock
returns (see, for example, Fama and French (1992,1993), Chan, Karceski and Lakonishok (1998)).
Accordingly, in what follows we focus on these two dimensions of investment style. In addition,
following up on the results of Grinblatt, Titman and Wermers (1995), we provide some results on
fund styles with respect to prior stock returns.
Table II paints a portrait of fund styles along the dimensions of size (panel A), book-to-market
(panel B), and past returns (panels C and D). As a basis of comparison we use the Standard
& Poor's 500 index (S&P500). While other benchmarks have begun to be widely accepted by
investors, the S&P500 index has been the most popularly used reference portfolio through much of
our sample period.
The details underlying the calculations in Table II are as follows. At the end of each calendar
year all available domestic stocks are ranked by the relevant characteristic (for example, size) and
given a percentile ranking from zero (for the lowest-ranked firm) to one (for the highest-ranked
firm).6 Given the holdings of a portfolio, we can calculate the weighted average of the percentile
rankings over all stocks in the portfolio. A stock's weight is the percent of the portfolio's value
invested in the stock.
5For example, most pension plan sponsors use these two dimensions when theyscreen investment managers.6Our use of percentile rankings makes it more meaningful to compute averages over time when the entire distri-
bution of characteristics (such as market value) has undergone considerable shifts.
8
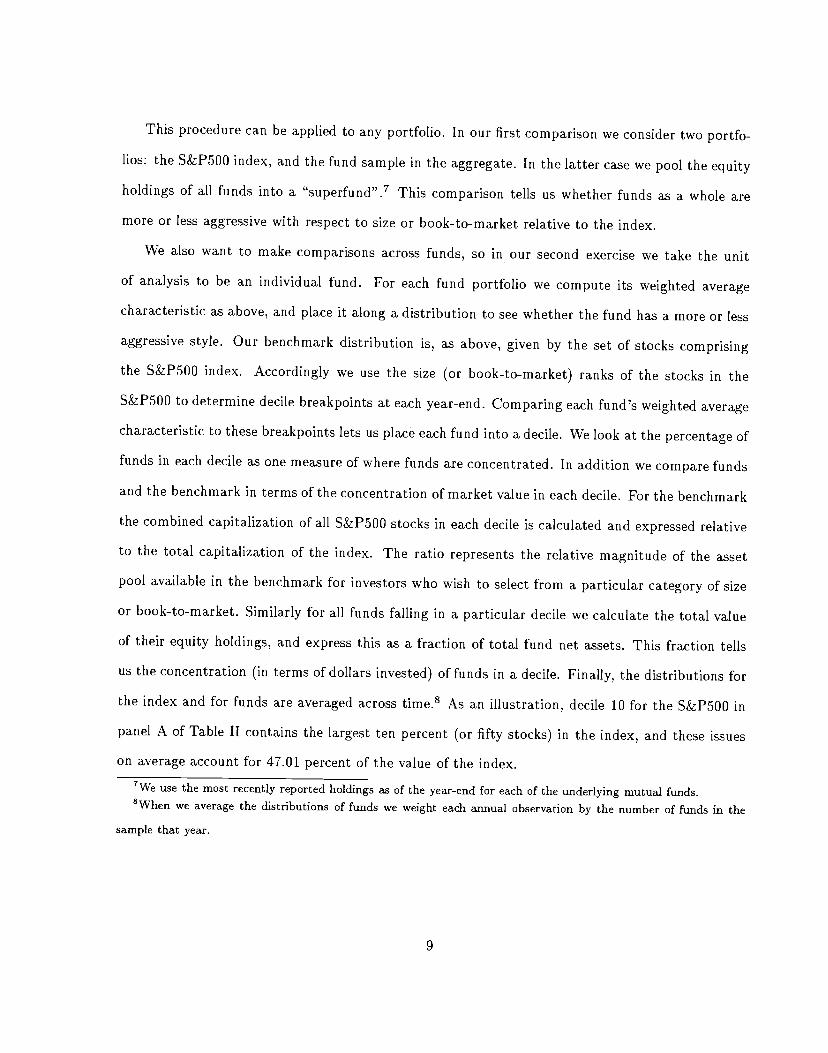
This procedure can be applied to any portfolio. In our first comparison we consider two portfo-
lios: the S&P500 index, and the fund sample in the aggregate. In the lattercase we pool the equity
holdings of all funds into a "superfund".7 This comparison tells us whether funds as a whole are
more or less aggressive with respect to size or book-to-market relative to the index.
We also want to make comparisons across funds, so in our second exercise we take the unit
of analysis to be an individual fund. For each fund portfolio we compute its weighted average
characteristic as above, and place it along a distribution to see whether the fund hasa more or less
aggressive style. Our benchmark distribution is, as above, given by the set of stocks comprising
the S&P500 index. Accordingly we use the size (or book-to-market) ranks of the stocks in the
S&P500 to determine decile breakpoints at each year-end. Comparing each fund's weighted average
characteristic to these breakpoints lets us place each fund into a decile. We look at the percentage of
funds in each decile as one measure of where funds are concentrated. In additionwe compare funds
and the benchmark in terms of the concentration of market value in each decile. For the benchmark
the combined capitalization of all S&P500 stocks in each decile is calculated and expressed relative
to the total capitalization of the index. The ratio represents the relative magnitude of the asset
pool available in the benchmark for investors who wish to select from a particular category of size
or book-to-market. Similarly for all funds falling in a particular decile we calculate the total value
of their equity holdings, and express this as a fraction of total fund net assets. This fraction tells
us the concentration (in terms of dollars invested) of funds in a decile. Finally, the distributions for
the index and for funds are averaged across time.8 As an illustration, decile 10 for the S&P500 in
panel A of Table II contains the largest ten percent (or fifty stocks) in the index, and these issues
on average account for 47.01 percent of the value of the index.
7We use the most recently reported holdings as of the year-end for each of the underlying mutual funds.5When we average the distributions of funds we weight each annual observation by the number of funds in the
sample that year.
9
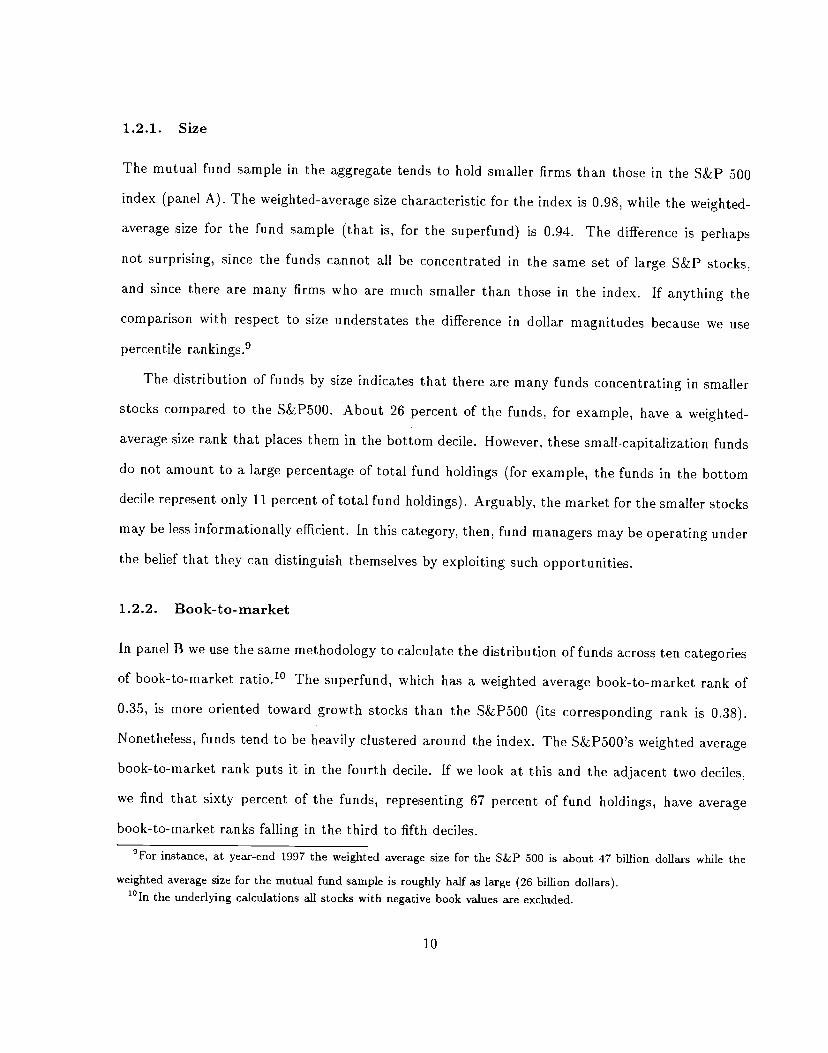
1.2.1. Size
The mutual fund sample in the aggregate tends to hold smaller firms than those in the S&P 500
index (panel A). The weighted-average size characteristic for the index is 0.98, while theweighted-
average size for the fund sample (that is, for the superfund) is 0.94. The difference is perhaps
not surprising, since the funds cannot all be concentrated in the same set of large S&P stocks,
and since there are many firms who are much smaller than those in the index. If anything the
comparison with respect to size understates the difference in dollar magnitudes because we use
percentile ran kings.9
The distribution of funds by size indicates that there are many funds concentrating in smaller
stocks compared to the S&P500. About 26 percent of the funds, for example, havea weighted-
average size rank that places them in the bottom decile. However, these small-capitalization funds
do not amount to a large percentage of total fund holdings (for example, the funds in the bottom
decile represent only 11 percent of total fund holdings). Arguably, the market for the smaller stocks
may be less informationally efficient. In this category, then, fund managers may be operating under
the belief that they can distinguish themselves by exploiting such opportunities.
1.2.2. Book-to-market
In panel B we use the same methodology to calculate the distribution of funds across tencategories
of book-to-market ratio.10 The superfund, which has a weighted average book-to-market rank of
0.35, is more oriented toward growth stocks than the S&P500 (its corresponding rank is 0.38).
Nonetheless, funds tend to be heavily clustered around the index. The S&P500's weighted average
book-to-market rank puts it in the fourth decile. If we look at this and the adjacent two deciles,
we find that sixty percent of the funds, representing 67 percent of fund holdings, have average
book-to-market ranks falling in the third to fifth deciles.
9For instance, at year-end 1997 the weighted average size for the S&P 500 is about 47 billion dollars while the
weighted average size for the mutual fund sample is roughly half as large (26 billion dollars).'°In the underlying calculations all stocks with negative book values are excluded.
10
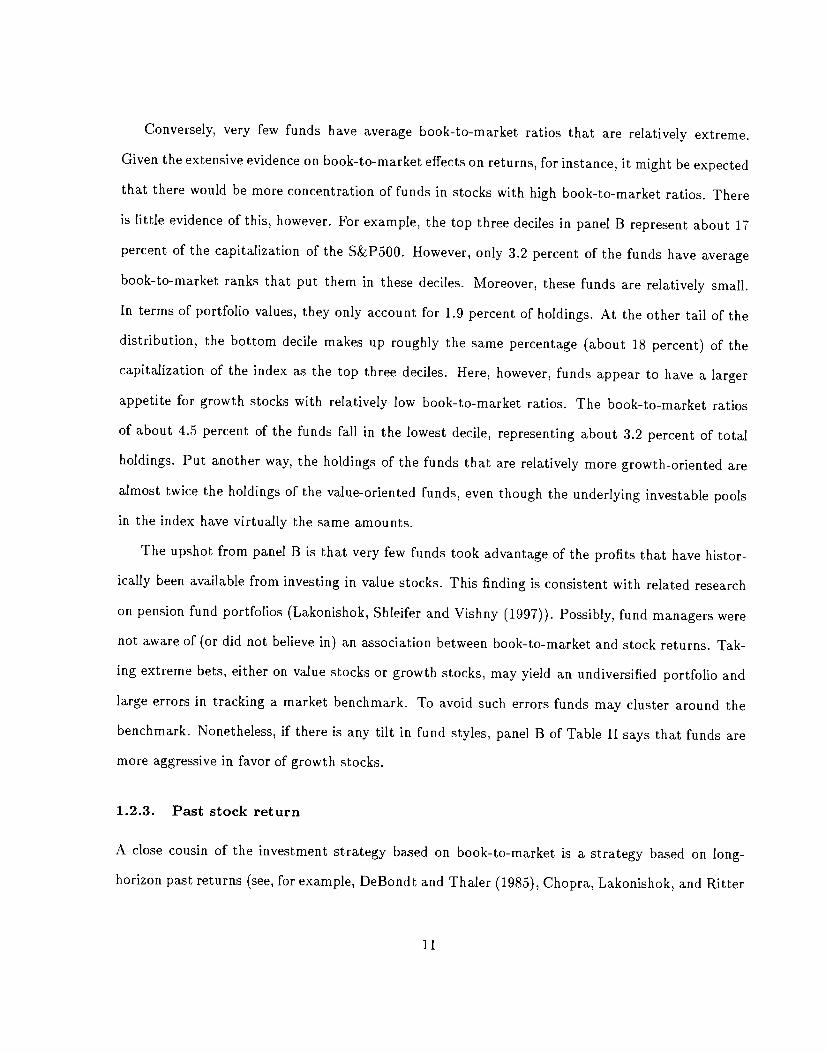
Conversely, very few funds have average book-to-market ratios that are relatively extreme.
Given the extensive evidence on book-to-market effects on returns, for instance, it might beexpected
that there would be more concentration of funds in stocks with high book-to-market ratios. There
is little evidence of this, however. For example, the top three deciles in panel B represent about 17
percent of the capitalization of the S&P500. However, only 3.2 percent of the funds haveaverage
book-to-market ranks that put them in these deciles. Moreover, these funds are relatively small.
In terms of portfolio values, they only account for 1.9 percent of holdings. At the other tail of the
distribution, the bottom decile makes up roughly the same percentage (about 18 percent) of the
capitalization of the index as the top three deciles. Here, however, funds appear to have a larger
appetite for growth stocks with relatively low book-to-market ratios. The book-to-market ratios
of about 4.5 percent of the funds fall in the lowest decile, representing about 3.2percent of total
holdings. Put another way, the holdings of the funds that are relatively more growth-oriented are
almost twice the holdings of the value-oriented funds, even though the underlying investable pools
in the index have virtually the same amounts.
The upshot from panel B is that very few funds took advantage of the profits that have histor-
ically been available from investing in value stocks. This finding is consistent with related research
on pension fund portfolios (Lakonishok, Shleifer and Vishny (1997)). Possibly, fund managers were
not aware of (or did not believe in) an association between book-to-market and stock returns. Tak-
ing extreme bets, either on value stocks or growth stocks, may yield an undiversified portfolio and
large errors in tracking a market benchmark. To avoid such errors funds may cluster around the
benchmark. Nonetheless, if there is any tilt in fund styles, panel B of Table II says that funds are
more aggressive in favor of growth stocks.
1.2.3. Past stock return
A close cousin of the investment strategy based on book-to-market is a strategy based on long-
horizon past returns (see, for example, DeBondt and Thaler (1985), Chopra, Lakonishok, and Ritter
11
(1992)). Hence another characteristic which funds may be taking into account when selecting their
portfolios is a stock's past rate of return. Some funds may target stocks which have had low past
returns in hopes of capturing the subsequent reversals. Panel C of Table II reports the distribution
of funds classified by past three-year returns. Specifically the characteristic under consideration is
the weighted average (across all of a fund's holdings) of the return beginning fouryears and ending
one year ago.
In panel C the superfund and the S&P500 index have the same weighted average rank on past
three-year return (0.63). The index is periodically revised, however, and stocks that have done well
are more likely to be introduced. Accordingly, the fact that the two portfolios share the same rank
is more impressive than may first seem, given that there are delays in turning over fund portfolios.
When we compare funds' willingness to take relatively extreme bets, the results for past losers
(with low past returns) parallel those for deep-value stocks. The bottom four deciles contain roughly
27 percent of the value of the index. However, funds falling into these deciles account for only 3
percent of fund holdings. In short, there are few takers for strategies based on either deep-value or
long-term reversals.
Strategies that focus on deep-value stocks and past losers share a common feature. They both
select stocks that appear to be very unattractive by many popular yardsticks. Value stocks, for
example, have relatively low past growth rates in earnings or sales, are generally concentrated in
unremarkable industries such as utilities, finance or steel, and are less likely to be recommended
by security analysts.11 Long-term past losers are more likely to be in financial distress. In other
words, a fund manager would be hard-pressed to provide a persuasive conventional rationale to
investors as justification for investing in such stocks. The evidence in Table II is consistent with
the conjecture that fund managers shun strategies based on such apparently unattractive stocks,
possibly due to personal career risks.
From this perspective, stocks which have performed well in the past should be easier to justify,
"Stickel (1.997) finds that analysts issue stronger buy recommendations for stocks with positive earnings and price
momentum and higher forecasts of long-term growth in earnings.
12
and hence relatively more attractive to fund managers. The results in panel C confirm a sharp
disparity between funds' appetites for long-term past losers and past winners. The top two deciles
are comparable to the bottom four deciles in terms of percentages of the value of the index (the top
two deciles represent about 25 percent). This end of the distribution is more popular with funds.
Funds placed in these two deciles hold about 10 percent of total fund equity investments.
More intriguingly, there is one set of past winners where the evidence on profitability and the
availability of an attractive story happily coincide. In particular, Jegadeesh and Titman (1993),
Chan, Jegadeesh and Lakonishok (1996) find price continuations over intermediate horizons. In
panel D we provide results based on the weighted average of the past year's return on a fund's
holdings. In the aggregate funds are more tilted toward past winners than the index. The weighted
average rank for the superfund is 0.62 compared to 0.60 for the index. Further, quite a few funds
position themselves in the upper deciles of the distribution. About 11 percent of the funds fall
in the top two deciles, and they make up roughly 9 percent of total fund holdings. Grinblatt,
Titman and Wermers (1995) also find that funds tend to follow profitable momentum strategies.
Our suggestion here is that the attractiveness of this strategy dovetails neatly with behavioral or
agency considerations as well.
Since funds who invest in small firms may be more specialized, they may also tend to be
more aggressive in terms of their orientation either toward book-to-market or past return. Our
preliminary examination of this issue, however, indicates that this is not the case. Overall, there is
no strong evidence that small-cap funds take more aggressive styles on either end of the distribution
for book-to-market and for past return, compared to large-cap funds.
1.2.4. Interpretation
To sum up, when we look at the distribution of fund styles, funds generally do not deviate notably
from a widely-followed benchmark such as the S&P500. While there aremany small-capitalization
funds, the bulk of fund assets is invested in the largest stocks. While funds generally tend not to
13
take extreme bets (relative to the S&P500 benchmark) in terms of either book-to-market ratiosor
past return, they have a relatively stronger tendency to favor glamour stocks and past winners.
Put another way, funds seemed to be averse to investment strategies involving deep value stocks or
long-term past losers. Viewed in this light, it may not be a complete surprise that historically few
mutual funds consistently out-performed market benchmarks.
What is even more striking is that similar findings have been made about the investment styles
of pension fund managers (Lakonishok, Shleifer and Vishny (1997)). In the pension fund industry
multiple intermediary parties are involved in investment decision-making. Accordingly there is more
scope for money managers to follow their own self-interests, with adverse consequences for portfolio
performance. The key finding in this section is that in the mutual fund industry intermediaries
play a smaller role and yet the evidence for non-performance distortions persists.
Several reasons may explain why both pension fund and mutual fund managers have some
preference for glamour stocks and past winners.12 Since glamour stocks generally have a record of
good past returns, a tilt toward glamour may appear to be safe from the standpoint of personal
career risk. To the extent that funds tend to herd, possibly as a result of the focus on relative
performance, selecting stocks that have done well in the past would also represent a prudent choice.
Fund managers' decisions may be swayed by analyst recommendations. Research reports from
brokerage firms are widely disseminated and there is some evidence that analysts are more likely
to favor glamour stocks and past winners (Stickel (1997)). Additionally, the fact that analysts
recommend such stocks may provide a convenient rationalization for a manager to tilt toward
such stocks. Another possibility is the perception that value strategies take a long time to become
profitable, whereas glamour stocks and past winners at least have price momentum working in their
12 should be noted that some mutual ftmd managers also provide money management services to pension plans.
To maintain good relations with clients a manager generally seeks to avoid large variation across the performance
of the different accounts. In many cases this might mean that the same stocks are selected for different clients'
portfolios. As a result the non-performance considerations apparent in the pension plan accounts spill over to the
mutual fund accounts.
14
favor over the intermediate term. Finally there may be an element of hubris in fund managers'
disposition toward glamour stocks. Insofar as a relatively larger component of the valuations of
growth stocks is tied to intangible future prospects, there may be more room for superior analysis
to detect and take advantage of such opportunities.
Another possible explanation for funds' tendency to bunch at the center is that fundmanagers
follow strategies that cannot be easily summarized by a single characteristic such as book-to-market
or past stock return. Instead they may focus on many other security characteristics so that the
end-result is a portfolio that does not deviate too much from a diversified benchmark index. It
is also possible that managers realize that superior long-term performance is unachievable in an
efficient market and hence are closet indexers. Finally, in the earlier part of the sample period,
fund managers may not have been aware of the existence of strategies based on deep value or
overreaction, and they may have been slow in adjusting their approaches.
2. Mutual fund factor exposures
In this section we check that our conclusions about fund styles are robust by taking anotherap-
proach to the analysis of fund styles. Fama and French (1992,1993) find that three factors the
market and mimicking portfolios for size and book-to-market — can explain the cross-section of
average returns and the common variation in returns. The sensitivity of a fund's return to these fac-
tors can serve as indicators of the investment strategies it follows. A fund whose return is strongly
associated with the returns on value stocks, for instance, can be thought of as a value-oriented
fund. Accordingly, a fund's exposures to the three factors is another way to identify a fund's style.
In particular, the style measures are taken as the estimated coefficients from three-factor model
regressions of the form
— rft = a + I3ipftmt — rft] + /32SMB + i33HML + Et (1)
based on monthly returns. Here rt is the return in month t for fund p, rft is the return on a
15
one-month Treasury bill, rmt is the return on the value-weighted portfolio of stocks thatappear on
both the CRSP and Compustat databases, and SMB, HML are the returns on zero-investment
factor-mimicking portfolios for size and book-to-market.13 In our context, the estimates of /32p
and !33p serve as measures of fund p's orientation toward firm size and book-to-market. A positive
(negative) /2p coefficient would mean the fund is oriented toward small stocks or large stocks,
respectively. Similarly, a positive (negative) coefficient /33p indicates that the fund has a tilt toward
value (growth) stocks.
Table III provides another perspective on the distribution of fund styles from the standpoint
of the three-factor model (equation (1)). Panel A of the table gives the distribution of funds'
loadings on the factors. At each calendar year-end, we estimate the three-factor model for all funds
with a complete history of returns over the prior three years. Based on the estimated coefficients,
funds are then assigned to deciles. Within each decile we calculate the equally-weighted average
of the coefficient estimates; the reported values are the weighted averages over all years of the
coefficients (each year's weight is the relative number of funds in the sample that year). As a basis
of comparison, panel B of the table reports estimates of the three-factor model applied to popular
market style indices including the Russell 1000 Growth Index (denoted RiG), the Russell 1000
Value Index (R1V), the Russell 2000 Growth and Value Indexes (R2G and R2V, respectively), and
the Standard & Poor's 500 index. The Russell indices are the most commonly used style-based
benchmarks for performance evaluation.14
The results for funds' style for size based on sensitivities generally agree with our earlier findings
based on funds' holdings. In terms of the number of funds, a large fraction of fund portfolios loads
more heavily on small stocks than does the S&P500 index. The S&P500 index has an average
'3We thank Gene Fama for supplying the data on returns for the market and the factor-mimicking portfolios.'4Whjle historical returns are available for all these composites, data on the historical composition of the indices
(required for calculating portfolio characteristics) is less readily available for the Russell indices. Accordingly the
comparisons based on portfolio characteristics in the previous section use only the S&P500 index. We defer a
discussion of the relative merits of each approach to style identification to a later section of the paper.
16
sensitivity to the size factor of -0.215. On average 94 percent of funds have sensitivities above
this value. Conversely not many funds have stronger sensitivities to returns on large stocks than
the S&P500. Only about six percent of funds on average load more negatively on the size factor
(that is, covary more strongly with large stocks) than does the S&P 500. This finding may be one
reason why a typical fund finds it difficult to keep up with the S&P500 even when large stocks
substantially outperform small stocks (as in 1998).
Funds generally do not select portfolio exposures that are strongly tilted toward either valueor
growth. The distribution of fund loadings on the book-to-market factor is roughly centered around
zero, close to the sensitivity of the S&P500. To evaluate the extent of departures away from
the market benchmarks, note that the bottom two deciles of funds have average HML loadings
less than the sensitivity of the Russell 1000 growth index, RiG (-0.405). At the other tail, the
sensitivity of the Russell 1000 value benchmark is 0.374, and only the top decile of funds has an
average HML sensitivity larger than this. As in panel B of Table 2, then, funds tend to cluster
around the benchmark and, insofar as they take extreme positions, they tilt toward growth rather
than value.
To sharpen the last point, note that the Russell value and growth indexes do not represent
portfolios that are especially slanted toward extreme value or growth. For instance, effectively half
of the market capitalization of the Russell 1000 index (the thousand largest stocks) are assigned to
the value index and half to the growth index.'5 In this sense, a fund does not have to take avery
extreme position toward value or growth to appear more aggressive than the corresponding Russell
indexes. Even so, fund managers do not choose to depart very much from the benchmarks.
15Specificaily, every stock in the Russell 1000 index receives a weight between zero and one in the growth and value
indexes, such that the stock's combined weight in the two indexes adds to one. Currently, stocks are ranked by a
composite measure of value based on the book-to-market ratio arid security analysts' forecasts of long-term growth
in earnings. Stocks ranked below the first quartile of the value measure receive a full weight of one in the value index
(hence zero weight in the growth index); stocks above the third quartile of the value measure get zero weight in the
value index (full weight in the growth index). A stock at the median is given a weight of 0.5 in each index.
17
2.1. Fund style and fund performance
The bulk of earlier research on fund styles has focused on how to adjust for style when evaluating
performance. However, the relation between a fund's style and its performance appears to have
received little prior attention. One commonly voiced belief, at least among practitioners in the
pension fund industry, is that growth-oriented managers are more likely to out-perform their style
benchmarks than are value-oriented managers.16 Although the issue of fund performance is not the
main focus of this paper, this section provides a bridge to the earlier literature by seeing if there is
any difference across styles with respect to mutual fund performance.
In particular, Table IV checks whether funds with some styles tend to out-perform funds with
other styles, relative to either a three-factor model benchmark (panel A) or a four-factor model
with an extra momentum factor included (panel B).'7 The table provides estimates of aiphas and
loadings for portfolios of equity funds that are sorted by size and book-to-market characteristics.
Specifically, at the end of each year from 1984 to 1996 all funds are sorted by their value-weighted
average size rank characteristic and assigned to one of three portfolios. The first group comprises
funds ranked in the top 20 percent by their size characteristic; the second group includes funds
ranked in the middle 60 percent; the third group includes funds ranked in the bottom 20 percent by
size. Within each size classification all funds are also sorted by their value-weighted average book-
to-market rank characteristic and assigned to one of three portfolios. The first portfolio includes
funds ranked in the top 20 percent; the second portfolio includes funds ranked in the middle 60
percent; the third portfolio contains funds ranked in the bottom 20 percent. The categories are
chosen so that we can break out funds who take relatively extreme positions with respect to size and
book-to-market. For each of the resulting nine portfolios, equally-weighted returns are calculated
over the subsequent twelve months, and the process is repeated. At the end of the sample period
'6See, for example, Coggin and Trzcinka (1997), who look at pension funds.'7The momentum factor is measured as the difference between the return on the top and bottom quintile portfolio
of stocks ranked by past one-year return. Equally-weighted portfolios are formed at the end of each calendar-year
from all domestic common stocks listed on the New York and American stock exchanges.
18
the three or four factor model is applied to the complete history of returns on each portfolio.
The evidence in panel A provides some indication that growth managers do better than value
managers on a style-adjusted basis. The difference between the alphas of the growth and value
managers, for example, is positive in each of the three size categories, averaging 0.143 percent per
month (or 1.7 percent per year). In particular, the difference is largest for the small-cap funds and
amounts to 0.302 percent per month. One possible explanation for the performance differential
between the two groups is that growth funds buy stocks with good past performance and hence
benefit from momentum effects. On the other hand momentum effects work against value funds,
who are generally invested in past losers.
Panel B confirms that growth and value funds' sensitivities to the momentum factor differ in the
hypothesized direction. For instance small-cap growth funds have an exposure to the momentum
factor of 0.084, and small-cap value funds have an exposure of -0.026. Adjusting for the momentum
factor using a four-factor model benchmark, as in panel B, reduces the performance differential
between the two groups. The annualized difference in the alphas, averaged across all three size
categories, is 1.2 percent in panel B. Nonetheless, the style-adjusted alphas still slightly favor growth
managers. Intriguingly, therefore, growth managers appear to generate stronger performance than
value managers. Growth stocks may predominantly represent companies with few tangible assets
and where expectations about the future are more important (such as science and technology
stocks). In such cases perhaps growth fund managers add value through specialized knowledge.
The gap between growth and value is particularly notable for small-cap funds: the difference is
0.235 percent per month. Possibly, inefficiencies may be more prevalent among smaller stocks
because they receive less coverage and attention, or because of limits to arbitrage, for example.
3. Consistency in fund style
The premise of an investment style is that a manager's style reflects the nature of the stocks
selected in the portfolio. The style dimensions that we use (and which are widely used in practice),
19
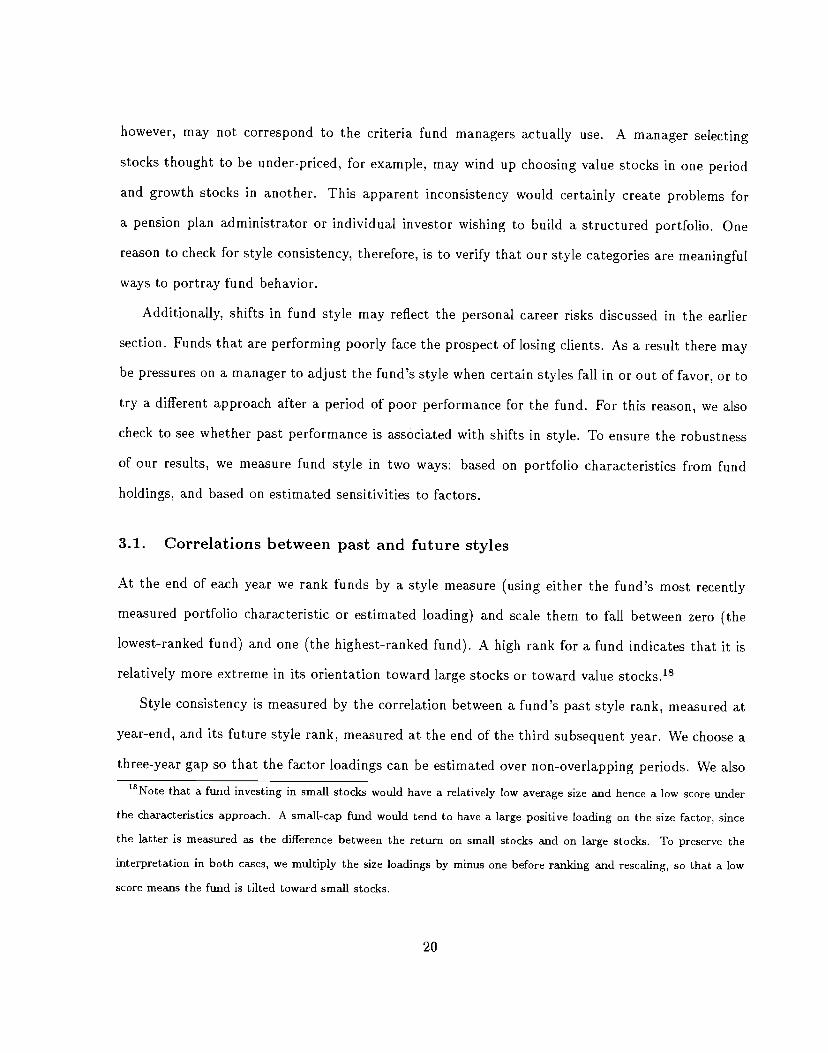
however, may not correspond to the criteria fund managers actually use. A manager selecting
stocks thought to be under-priced, for example, may wind up choosing value stocks in one period
and growth stocks in another. This apparent inconsistency would certainly create problems for
a pension plan administrator or individual investor wishing to build a structured portfolio. One
reason to check for style consistency, therefore, is to verify that our style categories are meaningful
ways to portray fund behavior.
Additionally, shifts in fund style may reflect the personal career risks discussed in the earlier
section. Funds that are performing poorly face the prospect of losing clients. As a result there may
be pressures on a manager to adjust the fund's style when certain styles fall in or out of favor, or to
try a different approach after a period of poor performance for the fund. For this reason, we also
check to see whether past performance is associated with shifts in style. To ensure the robustness
of our results, we measure fund style in two ways: based on portfolio characteristics from fund
holdings, and based on estimated sensitivities to factors.
3.1. Correlations between past and future styles
At the end of each year we rank funds by a style measure (using either the fund's most recently
measured portfolio characteristic or estimated loading) and scale them to fall between zero (the
lowest-ranked fund) and one (the highest-ranked fund). A high rank for a fund indicates that it is
relatively more extreme in its orientation toward large stocks or toward value stocks.'8
Style consistency is measured by the correlation between a fund's past style rank, measured at
year-end, and its future style rank, measured at the end of the third subsequent year. We choose a
three-year gap so that the factor loadings can be estimated over non-overlapping periods. We also
18Note that a fund investing in small stocks would have a relatively low average size and hence a low score under
the characteristics approach. A small-cap fund would tend to have a large positive loading on the size factor, since
the latter is measured as the difference between the return on small stocks and on large stocks. To preserve the
interpretation in both cases, we multiply the size loadings by minus one before ranking and rescaiing, so that a low
score means the fund is tilted toward small stocks.
20
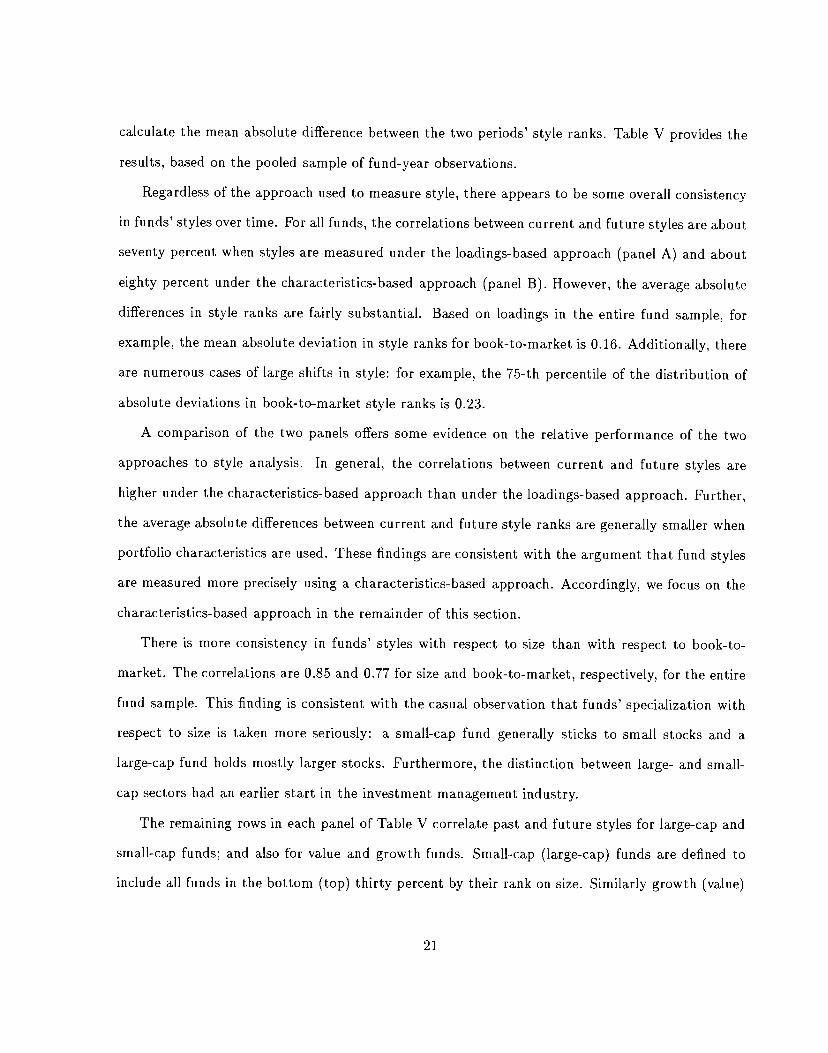
calculate the mean absolute difference between the two periods' style ranks. Table V provides the
results, based on the pooled sample of fund-year observations.
Regardless of the approach used to measure style, there appears to be some overall consistency
in funds' styles over time. For all funds, the correlations between current and future styles are about
seventy percent when styles are measured under the loadings-based approach (panel A) and about
eighty percent under the characteristics-based approach (panel B). However, the average absolute
differences in style ranks are fairly substantial. Based on loadings in the entire fund sample, for
example, the mean absolute deviation in style ranks for book-to-market is 0.16. Additionally, there
are numerous cases of large shifts in style: for example, the 75-th percentile of the distribution of
absolute deviations in book-to-market style ranks is 0.23.
A comparison of the two panels offers some evidence on the relative performance of the two
approaches to style analysis. In general, the correlations between current and future styles are
higher under the characteristics-based approach than under the loadings-based approach. Further,
the average absolute differences between current and future style ranks are generally smaller when
portfolio characteristics are used. These findings are consistent with the argument that fund styles
are measured more precisely using a characteristics-based approach. Accordingly, we focus on the
characteristics-based approach in the remainder of this section.
There is more consistency in funds' styles with respect to size than with respect to book-to-
market. The correlations are 0.85 and 0.77 for size and book-to-market, respectively, for the entire
fund sample. This finding is consistent with the casual observation that funds' specialization with
respect to size is taken more seriously: a small-cap fund generally sticks to small stocks and a
large-cap fund holds mostly larger stocks. Furthermore, the distinction between large- and small-
cap sectors had an earlier start in the investment management industry.
The remaining rows in each panel of Table V correlate past and future styles for large-cap and
small-cap funds; and also for value and growth funds. Small-cap (large-cap) funds are defined to
include all funds in the bottom (top) thirty percent by their rank on size. Similarly growth (value)
21

funds are those in the bottom or top thirty percent based on ranks for book-to-market. There
is more consistency within each of these style classes than for the sample as a whole, suggesting
that the dimensions we use are informative about funds' investment approaches. For example, the
correlation between past and future styles with respect to size is 0.89 for large-cap funds, compared
to 0.85 for the overall sample.
3.2. Style consistency and past performance
While most funds may be consistent in following a particular style, there may be specific instances
where funds are more prone to switch styles. In particular, a fund manager with poor past per-
formance may be more likely to cave in to pressures to drop a style that has apparently been
unsuccessful and try something different. To test this conjecture, we sort funds into portfolios on
the basis of a two-way within-group classification. The first sort is by a fund's past performance
(the compound return on the fund over the past two years) while the second sort is by the fund's
portfolio characteristic (either size or book-to-market).
In the classification by past fund return, there are four groups: group 1 (winners) comprises
the twenty percent of funds with the highest past return; group 2 comprises funds ranked in the
eighth to sixth deciles by past fund return; group 3 comprises funds ranked in the fifth to third
deciles of past return; group 4 (losers) includes the twenty percent of funds with the lowest past
return. The second sort by portfolio characteristic assigns a fund to one of three groups. Group 1
includes funds ranked in the top thirty percent on the relevant characteristic (either size or book-to-
market); group 2 includes the intermediate forty percent of the ranked funds; group 3 includes the
funds ranked in the bottom thirty percent by the characteristic. For each of the resulting twelve
portfolios, the simple average of the size or book-to-market characteristic across all component
funds is calculated at the portfolio formation year-end to give the portfolio's past style and at the
end of the subsequent year to give its future style. Each fund's characteristic is based on its most
recently reported holdings prior to the year-end. The average across all portfolio formation years
22
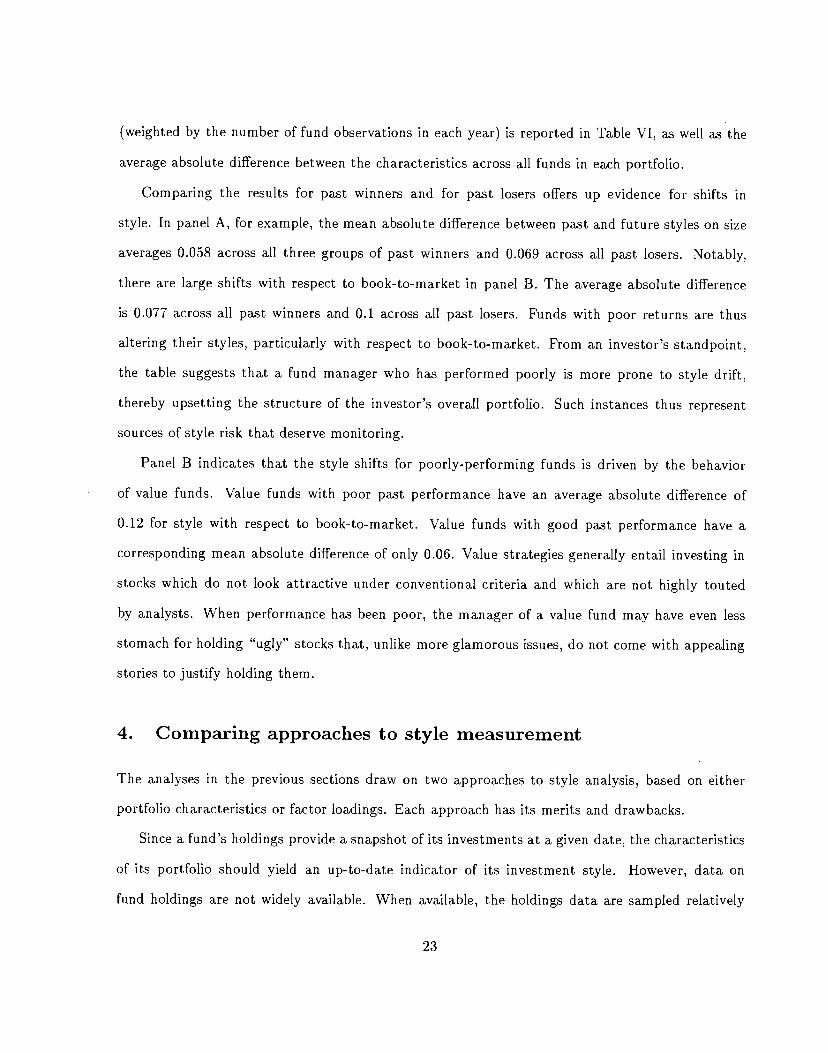
(weighted by the number of fund observations in each year) is reported in Table VI, as well as the
average absolute difference between the characteristics across all funds in each portfolio.
Comparing the results for past winners and for past losers offers up evidence for shifts in
style. In panel A, for example, the mean absolute difference between past and future styles on size
averages 0.058 across all three groups of past winners and 0.069 across all past losers. Notably,
there are large shifts with respect to book-to-market in panel B. The average absolute difference
is 0.077 across all past winners and 0.1 across all past losers. Funds with poor returns are thus
altering their styles, particularly with respect to book-to-market. From an investor's standpoint,
the table suggests that a fund manager who has performed poorly is more prone to style drift,
thereby upsetting the structure of the investor's overall portfolio. Such instances thus represent
sources of style risk that deserve monitoring.
Panel B indicates that the style shifts for poorly-performing funds is driven by the behavior
of value funds. Value funds with poor past performance have an average absolute difference of
0.12 for style with respect to book-to-market. Value funds with good past performance have a
corresponding mean absolute difference of only 0.06. Value strategies generally entail investing in
stocks which do not look attractive under conventional criteria and which are not highly touted
by analysts. When performance has been poor, the manager of a value fund may have even less
stomach for holding "ugly" stocks that, unlike more glamorous issues, do not come with appealing
stories to justify holding them.
4. Comparing approaches to style measurement
The analyses in the previous sections draw on two approaches to style analysis, based on either
portfolio characteristics or factor loadings. Each approach has its merits and drawbacks.
Since a fund's holdings provide a snapshot of its investments at a given date, the characteristics
of its portfolio should yield an up-to-date indicator of its investment style. However, data on
fund holdings are not widely available. When available, the holdings data are sampled relatively
23
infrequently. Operationally, the need to cross-reference these data with information (such as the
book value of equity or earnings) from stocks' financial statements adds an additional layer of
complexity.
The merit of the loadings-based approach is that it is grounded on the behavior of realized
returns on the fund. Data on fund returns are more readily accessible. On the other hand, a long
record of past returns is needed for the factor loadings to be estimated reliably. In this respect the
return earned on the fund several years ago may say little about its current style.
In general we find that the two approaches give similar readings of a fund's investment style. For
the whole fund sample, for instance, the correlation between the characteristics-based style rank
and loadings-based rank is 83 percent for size and 76 percent for book-to-market. In specific cases,
however, the two approaches can give very different readings. These instances are all the more
interesting because they provide a natural arena to stress-test the two approaches and evaluate
their performance. With this in mind we examine instances where the two approaches are most at
odds with one another (for example, a fund is deeply value-oriented based on loadings but deeply
growth-oriented based on portfolio characteristics). The evidence in the previous section suggests
that funds display less persistence with respect to book-to-market, so we focus on this dimension
of fund style.
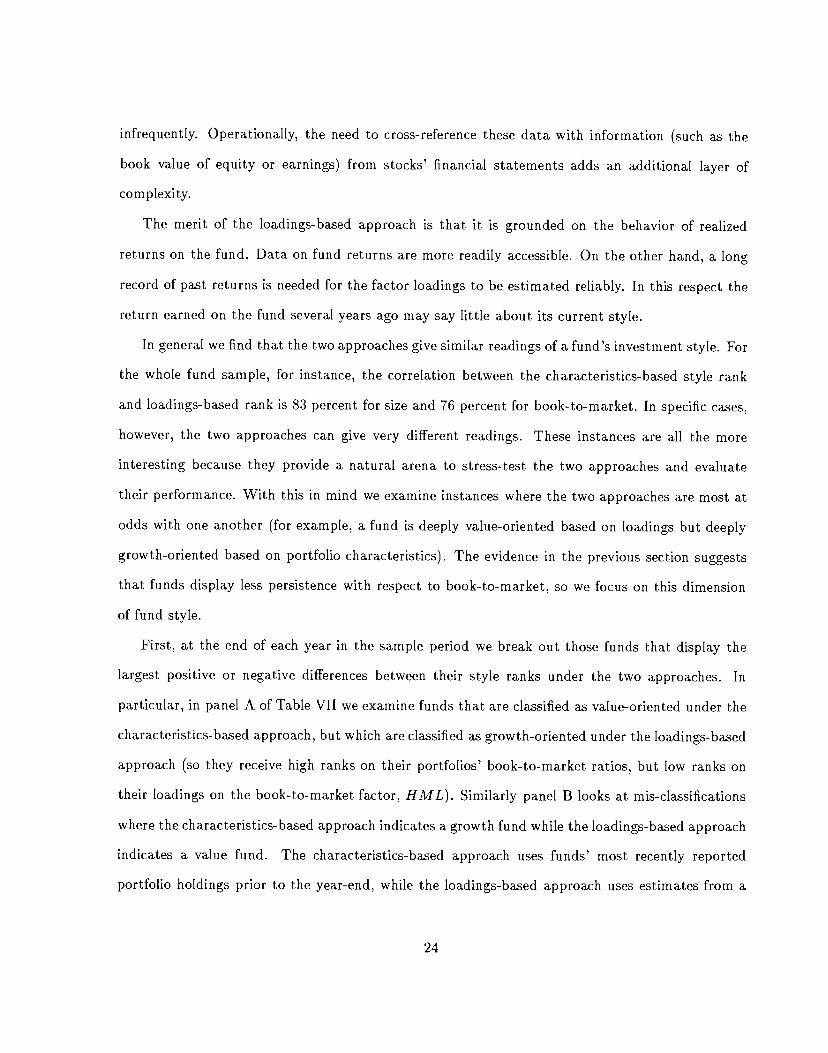
First, at the end of each year in the sample period we break out those funds that display the
largest positive or negative differences between their style ranks under the two approaches. In
particular, in panel A of Table VII we examine funds that are classified as value-oriented under the
characteristics-based approach, but which are classified as growth-oriented under the loadings-based
approach (so they receive high ranks on their portfolios' book-to-market ratios, but low ranks on
their loadings on the book-to-market factor, HML). Similarly panel B looks at mis-classifications
where the characteristics-based approach indicates a growth fund while the loadings-based approach
indicates a value fund. The characteristics-based approach uses funds' most recently reported
portfolio holdings prior to the year-end, while the loadings-based approach uses estimates from a
24
three-factor model from the prior three-year period.
We then see which approach does a better job in predicting the subsequent returns on these
two sets of funds. Again, to magnify potential contrasts we look at the forecasting performance in
those months where there is a large differential between the returns on value and growth stocks.
Specifically, out of the following two years we pick out the two months with the highest realized
returns, and the two months with the lowest realized returns, on HML, the Fama-French mimicking
portfolio for book-to-market (so we are looking at roughly the ten percent most extreme observations
in each tail of the distribution).19 The approach that gives the lower average forecast error would
be the one that does a better job in describing mutual fund styles. Returns are predicted in
our experiment as follows. In the characteristics-based approach, we match each stock in a fund's
portfolio with an equally-weighted portfolio of stocks falling in the same quintile of size and book-to-
market. The predicted return for the stock is the future return realized on the matching portfolio.20
In the loadings-based approach, the predicted return uses the fund's three-factor model loadings
estimated over the prior three years and the realized future returns on the mimicking portfolios.
Note that under either approach the relevant parameters (either characteristics or loadings) are
measured over a period that is disjoint from the prediction period.
The characteristics-based approach yields smaller mean errors for the experiment in panel A.
The funds in panel A earn an average return of 5.19 percent in those subsequent two months where
growth stocks do best relative to value stocks.21 The fitted return under the characteristics-based
19Since we focus on months with extreme returns, the behavior of the cash portion of funds' portfolios becomes
important. Accordingly, we limit our sample of funds to those which are holding less than five percent of their
portfolios in cash. Additionally, to mitigate the impact of the idiosyncratic component of fund returns, we only
consider funds with at least twenty five stocks in their portfolios.20Stocks eligible for the matching portfolios comprise all domestic equities listed on the NYSE, Amex and Nasdaq
markets. These are ranked independently by size and book-to-market each calendar year-end and assigned to quintiles,
where the quintile breakpoints use only NYSE issues.2tThe average style rank on book-to-market for the sample of funds in panel A is 0.68 based on holding character-
istics and 0.30 based on loadings.
25
approach is 5.12 percent with an average error of 0.07 percent. On the other hand the loadings-based
approach yields a fitted return of 6.14 percent and the error averages -0.95 percent. Conversely,
in those subsequent two months where value stocks do best relative to growth stocks, the funds'
actual returns average -2.38 percent. Given fitted returns of -1.89 percent and -3.39 percent for the
characteristics-based and loadings-based approaches, respectively, the average error is also lower
when characteristics are used.22 The average absolute errors in panel A also tend to be lower under
the characteristics-based approach (for example, 1.40 percent versus 1.70 percent in the two months
with the lowest average HML).23
Panel B of the table also yields a favorable verdict for the characteristics-based approach.24
In particular, over the two months with the lowest values of HML, the average prediction error
under the characteristics-based approach is -0.62 percent, which is lower than the 0.94 percent
error under the loadings-based approach. In the two months with the highest values of HML, the
corresponding mean errors are -0.16 percent and -1.07 percent. In short, when the two approaches
give conflicting readings on a fund's style, the approach based on characteristics more closely
matches funds' subsequent actual performance.
22As other studies (see, for example, Chan, Karceski and Lakonishok (1998)) have found, months with the largest
out-performance of value stocks relative to glamour stocks are generally down-market months. As a result the fund
returns for the two months with the highest values of HML are generally negative. As a further illustration of this
point, the average return on the Russell 1000 Growth index is -2.31 percent for these months while the average return
on the Russell 1000 Value index is -0.24 percent.
23The noise component in monthly returns is large. Although this averages out across months when we work with
mean errors, this will not be the case when we work with the absolute errors. This helps explain why the differences
across the two approaches are smaller when we compare the average absolute errors.240n average, the funds in this panel have an average style rank of 0.29 on book-to-market based on fund holdings,
and an average style rank of 0.68 based on loadings.
26
5. Conclusion
Mutual funds represent a large and growing segment of the institutional investor community. Within
this segment, however, fund managers are by no means homogeneous in terms of their investment
choices. Recognizing that fund managers follow a wide variety of approaches, investors are in-
creasingly aware of the importance of a fund's investment style. The evaluation of an investment
manager's style is already widespread practice in the pension fund industry. Investment style anal-
ysis is important for evaluating fund performance and also for controlling the risk of the investor's
overall portfolio.
This paper provides an exploratory investigation of mutual fund investment styles. Previous
empirical research on the sources of return covariation, as well as standard practice in the investment
management industry, give us some guidance in terms of which dimensions of style we consider,
and on our procedures for style identification. We concentrate on two style dimensions: size (equity
market capitalization), and book-to-market, although we also provide some results based on past
stock return. We employ two procedures for style identification: one is based on the characteristics
of fund portfolio holdings, while the other is based on estimated loadings from factor models. The
analysis uses an integrated dataset that reports a fund's return and identifies its equity holdings as
well.
Beginning with the aggregate portfolio held by funds (the "superfund"), we find that the overall
portfolio has a lower rank on size compared to the S&P500 index. This is not surprising, given
the large number of smaller stocks that are not in the index. More notably, the superfund has a
general tilt toward growth. The superfund's weighted-average book-to-market rank is 0.35 while the
corresponding rank for the index is 0.38. Similarly, additional characteristics based on past stock
return indicate that the aggregate portfolio tends to favor stocks with superior past performance.
For example the superfund has a weighted-average rank with respect to past one-year return of
0.62, above the rank of 0.60 for the index.
We also study the distribution of fund styles in order to judge the extent to which individual
27
funds deviate from the benchmark. We find that most mutual funds adopt styles that do not differ
markedly from an overall market index. For example, when we look at the distribution of funds
in terms of their book-to-market ratios, sixty percent of the funds are clustered within the two
deciles adjacent to where the S&P500 falls. These funds account for 67 percent of total fund equity
holdings.
Few funds take extreme positions away from the index. Lack of diversification may be one
reason why funds stay away from the extremes. Moreover, an extreme position would produce
large deviations from the return on a broad benchmark. Since it is common practice to measure
fund performance against a benchmark, such deviations may be a source of personal career risk to
a fund manager. When funds deviate from the index, they are more likely to favor growth over
value and high past return over low past return. Using factor sensitivities to measure fund styles
yields similar conclusions. For example, only ten percent of funds on average have larger exposures
to the book-to-market factor than the Russell 1000 Value index, even though the latter index does
not represent an overly aggressive bet on value stocks. Roughly twice as many funds, on the other
hand, are more aggressive on the growth dimension than the Russell 1000 Growth index.
Evidently a fund manager who chooses to be bold finds it safer to err on the side of growth.
Intriguingly, similar findings — bunching at the center and a tendency to favor glamour stocks —
have been found for pension fund manager styles (see Lakonishok, Shleifer and Vishny (1997)).
These aspects of mutual fund behavior may be one reason why so few funds consistently beat pas-
sive benchmarks. We conjecture that the glamour bias may, at least in part, be due to agency as
well as behavioral considerations. Growth stocks generally have a favorable history of past returns
and hence may appear to be safe choices as far as managers' personal career risks are concerned.
Herding pressures, arising for example from the practice of relative performance evaluation, would
also motivate managers to select stocks that have done well in the past. Hubris may lead man-
agers to think that they have superior abilities to detect intangible growth opportunities thereby
predisposing them toward growth stocks.
28
There is generally consistency in fund styles across time, especially with respect to size. Corre-
lations between past and future fund styles are between seventy to eighty percent. The degree of
persistence provides some evidence that our style dimensions capture meaningful aspects of fund
behavior.
Drifts in style show up more strongly in the case of funds with low past returns. Such funds
are more likely to alter their styles, and hence from the standpoint of an investor are a source
of style risk that deserves monitoring. In particular, the average absolute difference between past
and future style ranks on book-to-market for past winner funds is 0.077 while the corresponding
difference for past loser funds is 0.1. The manager of a poorly performing fund may face stronger
pressures to try something different, or to follow the crowd and adopt whichever style has been
more successful. There is some evidence that managers of value funds that have done poorly are
more prone to adjust their styles. Such managers drop the book-to-market ranks of their portfolios
from 0.648 to 0.572. Managers of growth funds with poor past performance, on the other hand,
barely move toward value.
Our comparison of value and growth managers also uncovers some signs that value managers,
on a style-adjusted basis, on average do worse than growth managers. Under a three-factor model,
for example, the average difference between the aiphas of growth and value funds is 1.7 percent per
year. In part, managers of growth funds hold stocks with strong past returns and hence benefit from
the momentum effect. Adjusting for the momentum factor accounts for some of the performance
differential, but the results still tend to favor growth managers by about 1.2 percent per year on
average. The difference in alphas is particularly notable (2.82 percent per year under a four-factor
model) for small-capitalization funds.
The two approaches to style identification (portfolio characteristics and factor sensitivities)
generally give similar readings of a fund's style (the correlation between the style ranks from the
two approaches is 83 percent for size and 76 percent for book-to-market). However when they
give different indications of fund style, the approach based on characteristics on average gives more
29

accurate predictions of future fund returns. Although the approach based on factor sensitivities is
directly based on the behavior of fund returns, it requires a relatively long time series (and hence
may not provide a sufficiently timely measure) and is subject to measurement error.
In summary, the analysis of investment styles helps to sharpen our understanding of the behavior
and performance of mutual funds. Ultimately such analyses may also provide valuable clues for
understanding patterns in trading activity and the determination of stock prices.
30
References
Brown, Keith C., W. V. Harlow, and Laura T. Starks, 1996, Of tournaments and temptations: An
analysis of managerial incentives in the mutual fund industry, Journal of Finance 51, 85—110.
Brown, Stephen J., and William N. Goetzmann, 1995, Performance persistence, Journal of Finance
50, 679—698.
Brown, Stephen J., and William N. Goetzmann, 1997, Mutual fund styles, Journal of Financial
Economics 43, 373—399.
Carhart, Mark M., 1997, On persistence in mutual fund performance, Journal of Finance 52, 57—82.
Chan, Louis K. C., Jason Karceski, and Josef Lakonishok, 1998, The risk and return from factors,
Journal of Financial and Quantitative Analysis 33, 159—188.
Chan, Louis K. C., Narasimhan Jegadeesh, and Josef Lakonishok, Momentum strategies, Journal
of Finance 51, 1681—1713.
Chevalier, Judith, and Glenn Ellison, 1997, Risk taking by mutual funds as a response to incentives,
Journal of Political Economy 105, 1167—1200.
Chopra, Navin, Josef Lakonishok, and Jay R. Ritter, 1992, Measuring abnormal performance: do
stocks overreact?, Journal of Financial Economics 31, 235—268.
Coggin, T. Daniel, and Charles Trzcinka, 1997, Analyzing the performance of equity managers: A
note on value versus growth, in T. Daniel Coggin, Frank J. Fabozzi, and Robert D. Arnott,
eds.: The Handbook of Equity Style Management (Second edition, Frank J. Fabozzi Associates,
New Hope, Penn.), 167—170.
Daniel, Kent, and Sheridan Titman, 1997, Evidence on the characteristics of cross sectional varia-
tion in stock returns, Journal of Finance 52, 1—33.
Daniel, Kent, Mark Grinblatt, Sheridan Titman, and Russ Wermers, 1997, Measuring mutual fund
performance with characteristic-based benchmarks, Journal of Finance 52, 1035—1058.
31

DeBondt, Werner F. M., and Richard Thaler, 1985, Does the stock market overreact?, Journal of
Finance 40, 793—805.
Elton, Edwin J., Martin J. Gruber, and Christopher R. Blake, 1996, The persistence of risk-adjusted
mutual fund performance, Journal of Business 69, 133—157.
Elton, Edwin J., Martin J. Gruber, Sanjiv Das, and Matthew Hlavka, 1993, Efficiency with costly
information: A reinterpretation of evidence from managed portfolios, Review of Financial Stud-
ies 6, 1—22.
Fama, Eugene F., and Kenneth R. French, 1992, The cross section of expected stock returns,
Journal of Finance 47, 427—465.
Fama, Eugene F., and Kenneth R. French, 1993, Common risk factors in the returns on stocks and
bonds, Journal of Financial Economics 33, 3—56.
Goetzmann, William N., and Nadav Peles, 1997, Cognitive dissonance and mutual fund investors,
Journal of Financial Research 20, 145—158.
Grinblatt, Mark, and Sheridan Titman, 1989, Mutual fund performance: An analysis of quarterly
portfolio holdings, Journal of Business 62, 393—416.
Grinblatt, Mark, and Sheridan Titman, 1992, The persistence of mutual fund performance, Journal
of Finance 42, 1977—1984.
Grinblatt, Mark, Sheridan Titman, and Russ Wermers, 1995, Momentum investment strategies,
portfolio performance, and herding: A study of mutual fund behavior, American Economic
Review 85, 1088—1105.
Hemmerick, Steve, 1998, Taking MPT to the masses: New Internet-based service aimed at 401(k)
participants, Pensions & Investments, February 23 1998.
Hendricks, Darryll, Jayendu Patel, and Richard Zeckhauser, 1993, Hot hands in mutual funds:
Short-run persistence of performance, 1974—88, Journal of Finance 48, 93—130.
32
Ippolito, Richard A., 1989, Efficiency with costly information: A study of mutual fund performance,
Quarterly Journal of Economics 104, 1—24.
Ippolito, Richard A., 1992, Consumer reaction to measures of poor quality: Evidence from the
mutual fund industry, Journal of Law and Economics 35, 45—70.
Jensen, Michael C., 1968, The performance of mutual funds in the period 1945—1964, Journal of
Finance 23, 389—416.
Karceski, Jason, 1998, Return-chasing behavior, beta's death, and the book-to-market effect, work-
ing paper, University of Florida.
Lakonishok, Josef, Andrei Shleifer, Richard Thaler, and Robert W. Vishny, 1991, Window dressing
by pension fund managers, American Economic Review 81, 227—231.
Lakonishok, Josef, Andrei Shleifer, and Robert W. Vishny, 1992, The structure and performance of
of the money management industry, Brookings Papers on Economic Activity: Microeconornics,
339—39 1.
Lakonishok, Josef, Andrei Shleifer, and Robert W. Vishny, 1994, Contrarian investment, extrapo-
lation, and risk, Journal of Finance 49, 1541—1578.
Lakonishok, Josef, Andrei Shleifer, and Robert W. Vishny, 1997, What do money managers do?,
working paper, University of Illinois at Urbana-Champaign.
Malkiel, Burton C., 1995, Returns from investing in equity mutual funds, 1971—1991, Journal of
Finance 50, 549—572.
Sharpe, William F., 1992, Asset allocation: Management style and performance measurement,
Journal of Portfolio Management 18, 7—19.
Sirri, Erik R., and Peter Tufano, 1998, Costly search and mutual fund flows, Journal of Finance
53, 1589—1622.
Stickel, Scott E., 1997, The financial characteristics of Wall Street darlings and dogs, working
paper, La Salle University.
33

</ref_section>
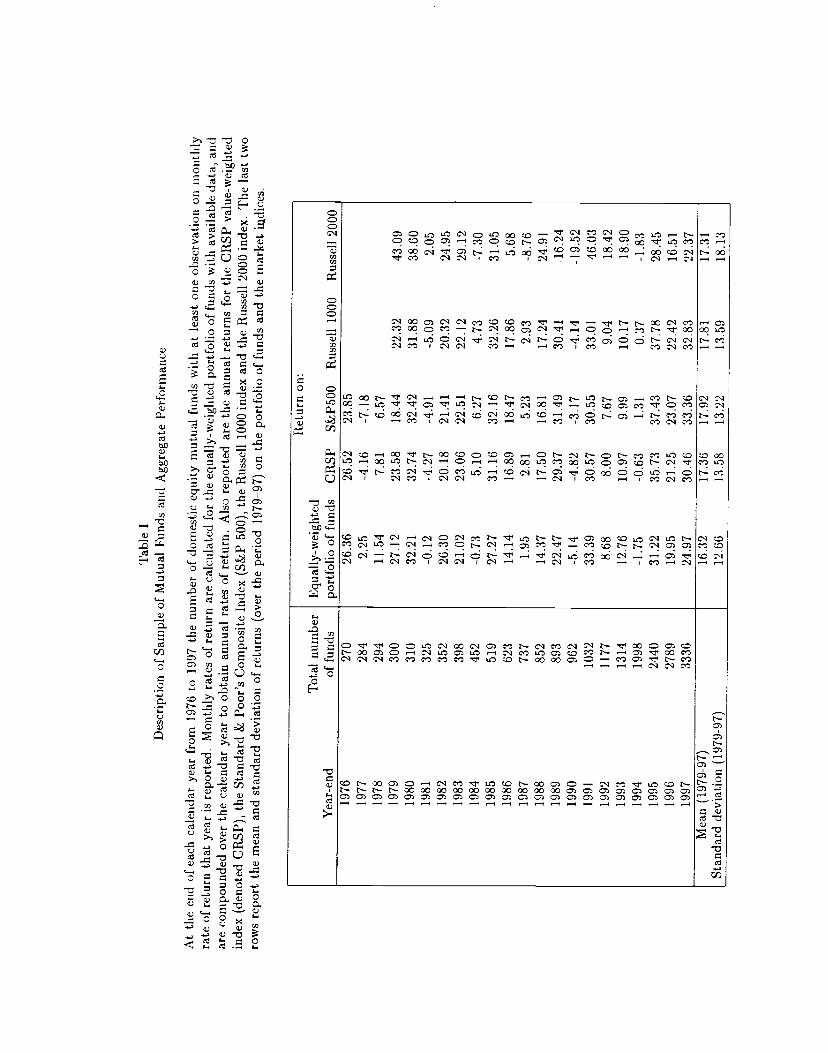
Tab
le I
Des
crip
tion
of S
ampl
e of
Mut
ual
Fund
s an
d A
ggre
gate
Per
form
aiic
e
At
time
end
of e
ach
cale
ndar
yea
r fr
om 1
976
to 1
997
the
num
ber
of d
omes
tic e
quity
mut
ual
fund
s w
ith a
t lea
st o
ne o
bser
vatio
n on
mon
thly
ra
te o
f ret
urn
that
year
is r
epor
ted.
Mon
thly
rate
s of
retu
rn a
re c
alcu
late
d fo
r th
e equ
ally
-wei
ghte
d por
tfol
io o
f fun
ds w
ith a
vaila
ble d
ata,
and
ar
e co
mpo
unde
d ove
r the
cal
enda
r ye
ar to
obt
ain
annu
al r
ates
of r
etur
n. A
lso
repo
rted
are
the
annu
al r
etur
ns f
or t
he C
RSP
val
ue-w
eigh
ted
inde
x (d
enot
ed C
RSP
), t
he S
tand
ard
& P
oor's
Com
posi
te In
dex
(S&
P 50
0), th
e R
usse
ll 10
00 i
ndex
and
the
Rus
sell
2000
inde
x. T
he l
ast t
wo
row
s re
port
the
mea
n an
d st
anda
rd d
evia
tion
of re
turn
s (o
ver
the
peri
od 1
979—
97) o
n th
e po
rtfo
lio o
f fun
ds a
nd t
he m
arke
t. in
dice
s.
Yea
r-en
d T
otal
num
ber
of f
unds
E
qual
ly-w
eigh
ted
port
folio
of f
unds
C
RSP
Ret
urn
on:
S&P5
00
Rus
sell
1000
R
usse
ll 20
00
1976
27
0 26
.36
26.5
2 23
.85
1977
28
4 2,
25
-4.1
6 -7
.18
1978
29
4 11
.54
7.81
6.
57
1979
30
0 27
.12
23.5
8 18
.44
22.3
2 43
.09
1980
31
0 32
.21
32.7
4 32
.42
31.8
8 38
.60
1981
32
5 -0
.12
-4.2
7 -4
.91
-5.0
9 2.
05
1982
35
2 26
.30
20.1
8 21
.41
20.3
2 24
.95
1983
39
8 21
.02
23.0
6 22
.51
22.1
2 29
.12
1984
45
2 -0
.73
5.10
6.
27
4.73
-7
.30
1985
51
9 27
.27
31.1
6 32
.16
32.2
6 31
.05
1986
62
3 14
.14
16.8
9 18
.47
17.8
6 5.
68
1987
73
7 1.
95
2.81
5.
23
2.93
-8
.76
1988
85
2 14
.37
17.5
0 16
.81
17.2
4 24
.91
1989
89
3 22
.47
29.3
7 31
.49
30.4
1 16
.24
1990
96
2 -5
.14
-4.8
2 -3
.17
-4.1
4 -1
9.52
19
91
1032
33
.39
30.5
7 30
.55
33.0
1 46
.03
1992
11
77
8.68
8.
00
7.67
9.
04
18.4
2 19
93
1314
12
.76
10.9
7 9.
99
10.1
7 18
.90
1994
19
98
-1.7
5 -0
.63
1.31
0.
37
-1.8
3 19
95
2440
31
.22
35.7
3 37
.43
37.7
8 28
.45
1996
27
89
19.9
5 21
.25
23.0
7 22
.42
16.5
1 19
97
3336
24
.97
30.4
6 33
.36
32.8
3 22
.37
Mea
n (1
979-
97)
16.3
2 17
.36
17.9
2 17
.81
17.3
1 St
anda
rd d
evia
tion
(197
9-97
) 12
.66
13.5
8 13
.22
13.5
9 18
.13
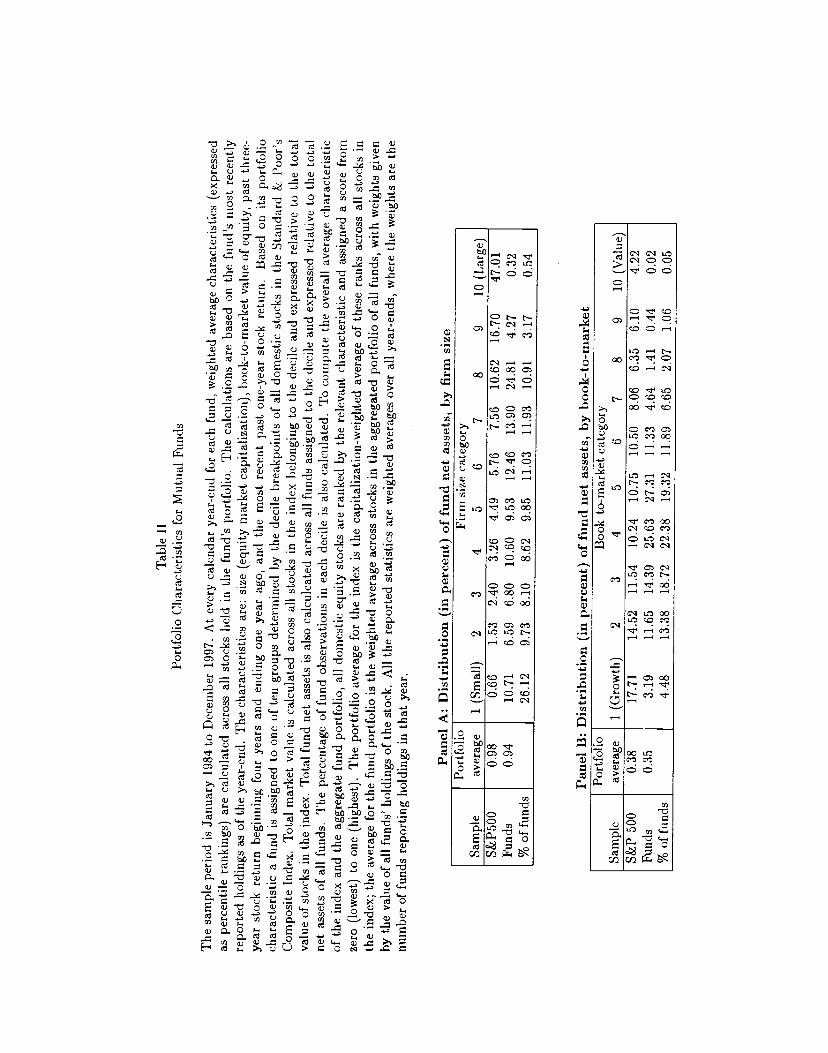
Tab
le 11
Port
folio
Cha
ract
eris
tics f
or M
utua
l Fu
nds
The
sam
ple
peri
od is
Jan
uary
198
4 to
Dec
embe
r 199
7. A
t eve
ry c
alen
dar
year
-end
for
eac
h fu
nd, w
eigh
ted
aver
age
char
acte
rist
ics
(exp
ress
ed
as p
erce
ntile
ran
king
s) a
re c
alcu
late
d ac
ross
all
stoc
ks h
eld
in t
he f
und'
s po
rtfo
lio.
The
cal
cula
tions
are
bas
ed o
n th
e fu
nd's
mos
t re
cent
ly
repo
rted
hol
ding
s as
of th
e ye
ar-e
nd. T
he c
hara
cter
istic
s ar
e: s
ize
(equ
ity m
arke
t ca
pita
lizat
ion)
, boo
k-to
-mar
ket v
alue
of e
quity
, pas
t th
ree-
ye
ar s
tock
ret
urn
begi
nnin
g fo
ur y
ears
and
end
ing
one
year
ago
, an
d th
e m
ost
rece
nt
past
one
-yea
r st
ock
retu
rn.
Bas
ed o
n its
por
tfol
io
char
acte
rist
ic a
fund
is
assi
gned
to o
ne o
f ten
gro
ups
dete
rmin
ed b
y th
e de
cile
bre
akpo
ints
of a
ll do
mes
tic s
tock
s in
the
Sta
ndar
d &
Poo
r's
Com
posi
te In
dex.
Tot
al m
arke
t va
lue
is c
alcu
late
d ac
ross
all
stoc
ks in
the
inde
x be
long
ing
to th
e de
cile
and
exp
ress
ed
rela
tive
to th
e to
tal
valu
e of s
tock
s in
the
ind
ex.
Tot
al fu
nd n
et a
sset
s is
als
o ca
lcul
cate
d acr
oss a
ll fu
nds
assi
gned
to
the
deci
le a
nd e
xpre
ssed
rel
ativ
e to
the
tota
l ne
t ass
ets
of a
ll fu
nds.
T
he p
erce
ntag
e of
fund
obs
erva
tions
in e
ach
deci
le i
s al
so c
alcu
late
d. T
o co
mpu
te th
e ov
eral
l ave
rage
cha
ract
eris
tic
of th
e in
dex
and
the
aggr
egat
e fun
d po
rtfo
lio, a
ll do
mes
tic e
quity
sto
cks
are
rank
ed b
y th
e re
leva
nt c
hara
cter
istic
and
ass
igne
d a
scor
e fr
om
zero
(lo
wes
t) t
o on
e (h
ighe
st).
The
por
tfol
io a
vera
ge f
or t
he in
dex
is t
he c
apita
lizat
ion-
wei
ghte
d av
erag
e of
thes
e ra
nks
acro
ss a
ll st
ocks
in
the
inde
x; t
he a
vera
ge f
or th
e fu
nd p
ortf
olio
is th
e w
eigh
ted
aver
age a
cros
s sto
cks
in th
e ag
greg
ated
por
tfol
io o
f all
fund
s, w
ith w
eigh
ts g
iven
by
the
val
ue o
f all
fund
s' h
oldi
ngs o
f the
stoc
k. A
ll th
e re
port
ed s
tatis
tics
are
wei
ghte
d av
erag
es o
ver
all y
ear-
ends
, whe
re t
he w
eigh
ts a
re th
e nu
mbe
r of f
unds
rep
ortin
g ho
ldin
gs in
that
yea
r.
Pane
l A:
Dis
trib
utio
n (i
n pe
rcen
t) o
f fun
d ne
t as
sets
, by
fir
m s
ize
Sam
ple
Port
folio
av
erag
e 1
(Sm
all)
Firm
siz
e ca
tego
ry
2 3
4 5
6 7
8 9
10 (
Lar
ge)
S&P5
00
0.98
0.
66
1.53
2.
40
3.26
4.
49
5.76
7.
56
10.6
2 16
.70
47.0
1 Fu
nds
0.94
10
.71
6.59
6.
80
10.6
0 9.
53
12.4
6 13
.90
24.8
1 4.
27
0.32
%
of f
unds
26
.12
9.73
8.
10
8.62
9.
85
11.0
3 11
.93
10.9
1 3.
17
0.54
Pane
l B:
Dis
trib
utio
n (i
n pe
rcen
t) o
f fun
d ne
t as
sets
, by
boo
k-to
-mar
ket
Port
folio
B
ook-
to-m
arke
t cat
egor
y Sa
mpl
e av
erag
e 1
(Gro
wth
) 2
3 4
5 6
7 8
9 10
(V
alue
) S&
P 50
0 0.
38
17.7
1 14
.52
11.5
4 10
.24
10.7
5 10
.50
8.06
6.
35
6.10
4.
22
Fund
s 0.
35
3.19
11
.65
14.3
9 25
.63
27.3
1 11
.33
4.64
1.
41
0.44
0.
02
% o
f fun
ds
4.48
13
.38
18.7
2 22
.38
19.3
2 11
.89
6.65
2.
07
1.06
0.
05
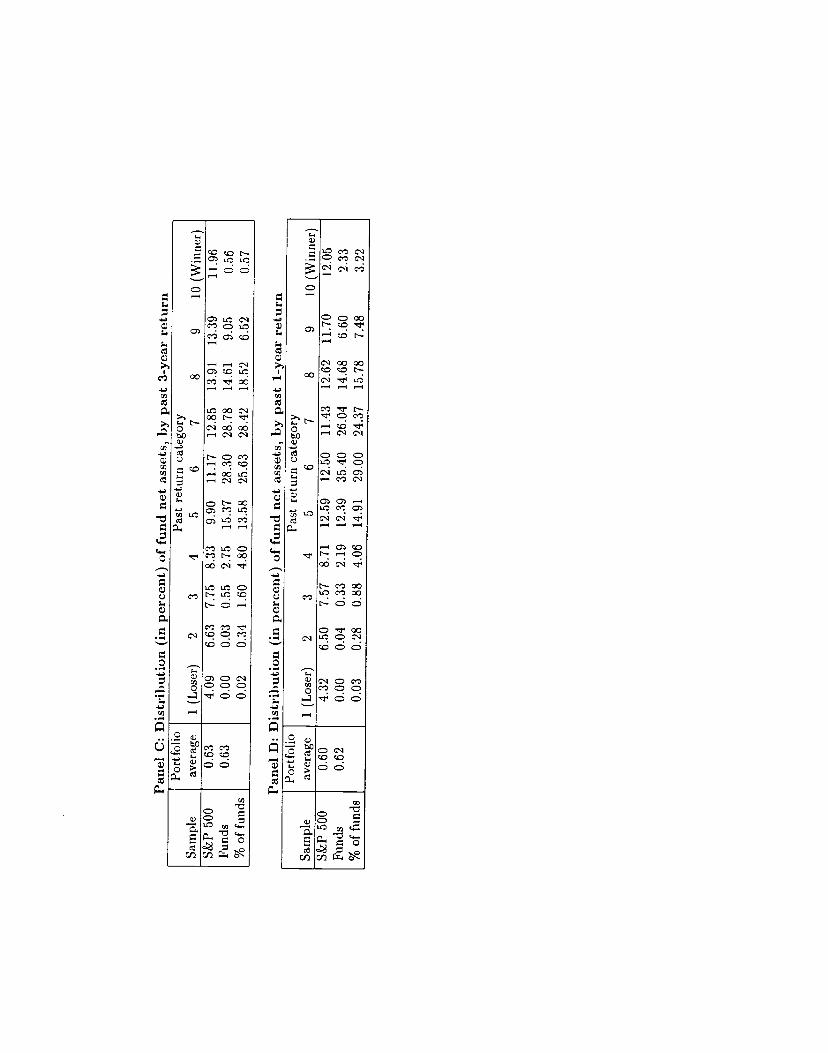
Pane
l C:
Dis
trib
utio
n (i
n pe
rcen
t) o
f fu
nd n
et a
sset
s, b
y pa
st 3
-yea
r re
turn
Sam
ple
Port
folio
av
erag
e Pa
st r
etur
n ca
tego
ry
1 (L
oser
) 2
3 4
5 6
7 8
9 10
(W
inne
r)
S&P
500
Fund
s %
of f
unds
0.63
0.
63
4.09
6.
63
7.75
8.
33
9.90
11
.17
12.8
5 13
.91
13.3
9 11
.96
0.00
0.
03
0.55
2.
75
15.3
7 28
.30
28.7
8 14
.61
9.05
0.
56
0.02
0.
34
1.60
4.
80
13.5
8 25
.63
28.4
2 18
.52
6.52
0.
57
Sam
ple
Port
folio
av
erag
e Pa
st r
etur
n ca
tego
ry
1 (L
oser
) 2
3 4
5 6
7 8
9 10
(W
inne
r)
S&P
500
Fund
s %
of f
unds
0.60
0.
62
4.32
6.
50
7.57
8.
71
12.5
9 12
.50
11.4
3 12
.62
11.7
0 12
.05
0.00
0.
04
0.33
2.
19
12.3
9 35
.40
26.0
4 14
.68
6.60
2.
33
0.03
0.
28
0.88
4.
06
14.9
1 29
.00
24.3
7 15
.78
7.48
3.
22
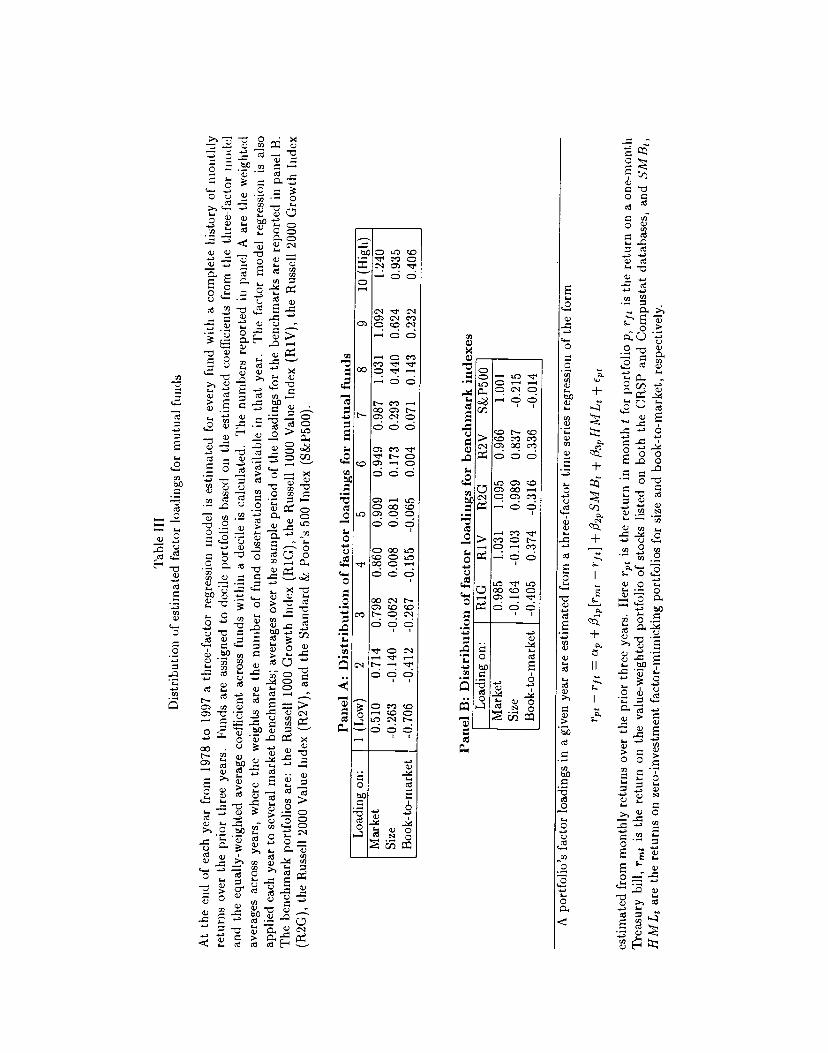
Tab
le II
I D
istr
ibut
ion
of es
timat
ed f
acto
r loa
ding
s for
mut
ual
fund
s
At
the
end
of e
ach
year
fro
rri
1978
to
1997
a t
hree
-fac
tor
regr
essi
on m
odel
is
estim
ated
for
eve
ry f
und
with
a c
ompl
ete
hist
ory
of m
oiith
ily
retu
rns
over
the
pri
or t
hree
yea
rs.
Fund
s ar
e as
sign
ed t
o de
cile
por
tfol
ios
base
d on
the
est
imat
ed c
oeff
icie
nts
from
the
thre
e-fa
ctor
iiio
del
and
the
equa
lly-w
eigh
ted
aver
age
coef
fici
ent
acro
ss fu
nds
with
in a
dec
ile is
cal
cula
ted.
The
num
bers
rep
orte
d in
pan
el A
are
the
wei
ghte
d av
erag
es a
cros
s ye
ars,
whe
re th
e w
eigh
ts
are
the
num
ber
of f
und
obse
rvat
ions
ava
ilabl
e in
tha
t ye
ar.
The
fac
tor
mod
el r
egre
ssio
n is
als
o ap
plie
d ea
ch y
ear t
o se
vera
l m
arke
t be
nchm
arks
; ave
rage
s ove
r the
sam
ple
peri
od o
f the
load
ings
for
the
benc
hmar
ks a
re r
epor
ted
in p
anel
B.
The
ben
chm
ark
port
folio
s ar
e:
the
Rus
sell
1000
Gro
wth
Ind
ex (
RiG
), th
e R
usse
ll 10
00 V
alue
Ind
ex (
R1V
), th
e R
usse
ll 20
00 G
row
th I
ndex
(R
2G),
the
Rus
sell
2000
Val
ue In
dex
(R2V
), a
nd th
e St
anda
rd &
Poo
r's 5
00 I
ndex
(S&
P500
).
Pane
l A:
Dis
t rib
utio
n of
fac
tor l
oadi
ngs
for
mut
ual f
unds
L
oadi
ng o
n:
1 (L
ow)
2 3
4 5
6 7
8 9
10 (
Hig
h)
Mar
ket
0.51
0 0.
714
0.79
8 0.
860
0.90
9 0.
949
0.98
7 1.
031
1.09
2 1.
240
Size
-0
.263
-0
.140
-0
,062
0.
008
0.08
1 0.
173
0.29
3 0.
440
0.62
4 0.
935
Boo
k-to
-mar
ket
-0.7
06
-0.4
12
-0.2
67
-0.1
55
-0.0
65
0.00
4 0.
071
0.14
3 0.
232
0.40
6
Pane
l B:
Dis
trib
utio
n of
fact
or lo
adin
gs f
or b
ench
mar
k in
dexe
s L
oadi
ng on
: R
iG
R1V
R
2G
R2V
S&
P500
M
arke
t 0.
985
1.03
1 1.
095
0.96
6 1.
001
Size
-0
.164
-0
.103
0.
989
0.83
7 -0
.215
B
ook-
to-m
arke
t -0
.405
0.
374
-0.3
16
0.33
6 -0
.014
A p
ortf
olio
's fa
ctor
load
ings
in a
giv
en y
ear
are
estim
ated
fro
m a
thr
ee-f
acto
r tim
e se
ries
reg
ress
ion
of th
e fo
rm
rpt
— F
ft =
cip
+ /3
ip[i
'mt
— rf
t) +
/i2S
MB
+ /3
3HM
L +
er,t
estim
ated
fro
m m
onth
ly re
turn
s ov
er th
e pr
ior
thre
e ye
ars.
Her
e is
the
retu
rn i
n m
onth
t fo
r po
rtfo
lio p,
r/t i
s th
e re
turn
on
a on
e-m
onth
T
reas
ury
bill,
rm
t is
the
ret
urn
on t
he v
alue
-wei
ghte
d po
rtfo
lio o
f st
ocks
lis
ted
on b
oth
the
CR
SP a
nd C
ompu
stat
dat
abas
es,
and
SMB
, H
ML
are
the
ret
urns
on
zero
-inv
estm
ent
fact
or-m
imic
king
port
folio
s for
siz
e an
d bo
ok-t
o-m
arke
t, re
spec
tivel
y.
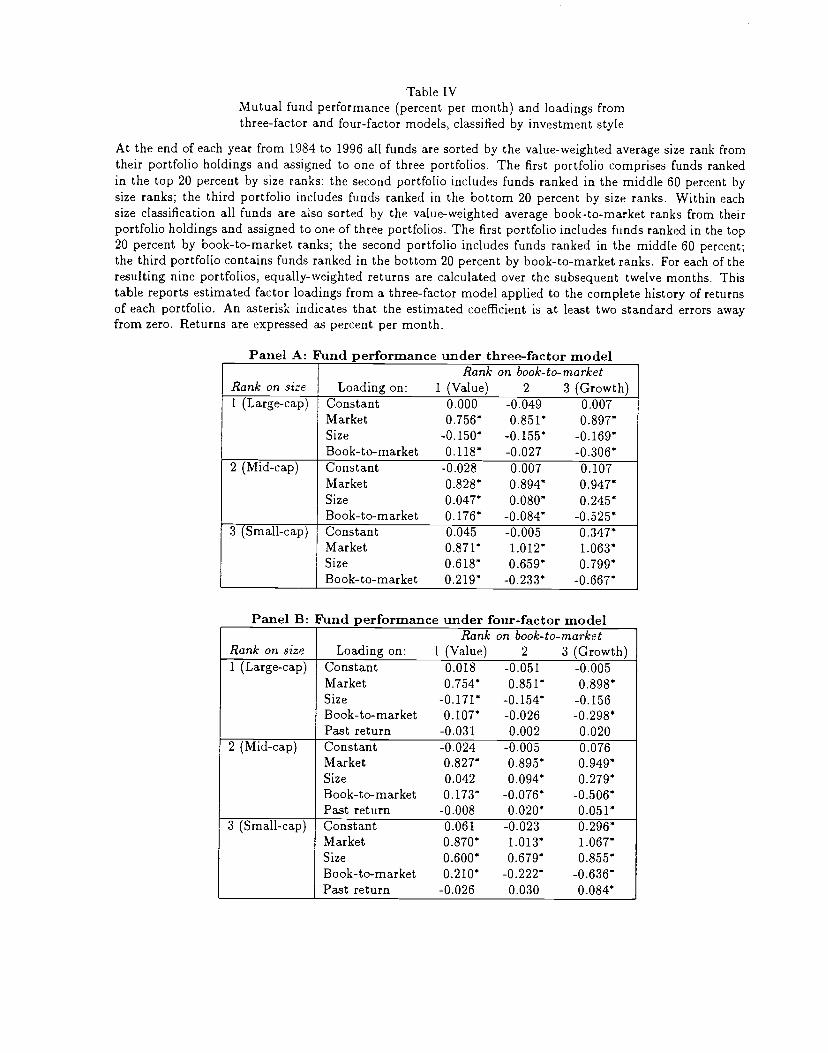
Table IVMutual fund performance (percent per month) and loadings fromthree-factor and four-factor models, classified by investment style
At the end of each year from 1984 to 1996 all funds are sorted by the value-weighted average size rank fromtheir portfolio holdings and assigned to one of three portfolios. The first portfolio comprises funds rankedin the top 20 percent by size ranks; the second portfolio includes funds ranked in the middle 60 percent bysize ranks; the third portfolio includes funds ranked in the bottom 20 percent by size ranks. Within eachsize classification all funds are also sorted by the value-weighted average book-to-market ranks from theirportfolio holdings and assigned to one of three portfolios. The first portfolio includes funds ranked in the top20 percent by book-to-market ranks; the second portfolio includes funds ranked in the middle 60 percent;the third portfolio contains funds ranked in the bottom 20 percent by book-to-market ranks. For each of theresulting nine portfolios, equally-weighted returns are calculated over the subsequent twelve months. Thistable reports estimated factor loadings from a three-factor model applied to the complete history of returnsof each portfolio. An asterisk indicates that the estimated coefficient is at least two standard errors awayfrom zero. Returns are expressed as percent per month.
Panel A: Fund performance under three-factor model
Rank on sizeRank on book-to-market
Loading on: 1 (Value) 2 3 (Growth)1 (Large-cap) Constant 0.000 -0.049 0.007
Market 0.756 0.851* 0.897*Size 0.150*Book-to-market 0.118* -0.027 0.306*
2 (Mid-cap) Constant -0.028 0.007 0.107Market 0.828* 0.894* 0.947*Size 0.047* 0.080* 0.245*Book-to-market 0.176* 0.525*
3 (Small-cap) Constant 0.045 -0.005 9347*Market 0.871* 1.012* 1.063*Size 0.618 0.659* 0.799*Book-to-market 0.219
Panel B: Fund performance under four-factor modelRank on book-to-market
Rank on size Loading on: 1 (Value) 2 3 (Growth)1 (Large-cap) Constant 0.018 -0.051 -0.005
Market 0.754 0.851* 0.898*Size -0.171 -0.156Book-to-market 0.107* -0.026Past return -0.031 0.002 0.020
2 (Mid-cap) Constant -0.024 -0.005 0.076Market 0.827 0.895* 0.949*Size 0.042 0.094* 0.279*Book-to-market 0.173* 0.076* 0.506*Past return -0.008 0.020* 0.051*
3 (Small-cap) Constant 0.061 -0.023 0.296*Market 0.870* 1.013 1.067*Size 0.600* 0.679* 0.855*Book-to-market 0.210* -0.222 -0.636Past return -0.026 0.030 0.084*

In panel A, each portfolio's factor loadings are estimated from a three-factor time series regression of theform
— rft = + /3ip[rmt — rft] + I32SMB + 133HML +
using monthly returns over the sample period. Here rpt is the return in month t for portfolio p, rft is thereturn on a one-month Treasury bill, rmt is the return on the value-weighted portfolio of stocks carried onboth the CRSP and Compustat databases, and SMB, HML are the returns on zero-investment factor-mimicking portfolios for size and book-to-market. In panel B, each portfolio's factor loadings are estimatedfrom a four-factor time series regression of the form
rpt — = + I3ip[rmt — rft] + i32SMB + /3aHML + i34WML +
where WML is the return on a zero-investment factor-mimicking portfolio for price momentum (return overthe prior year).
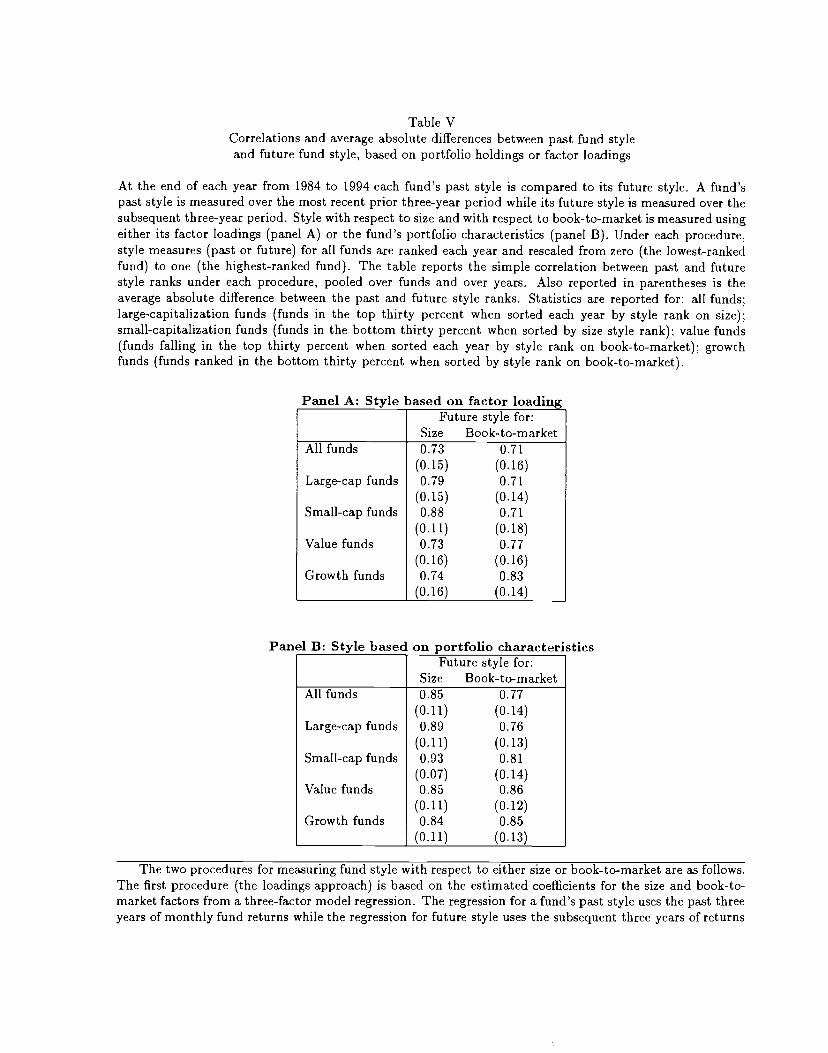
Table VCorrelations and average absolute differences between past fund styleand future fund style, based on portfolio holdings or factor loadings
At the end of each year from 1984 to 1994 each fund's past style is compared to its future style. A fund'spast style is measured over the most recent prior three-year period while its future style is measured over thesubsequent three-year period. Style with respect to size and with respect to book-to-market is measured usingeither its factor loadings (panel A) or the fund's portfolio characteristics (panel B). Under each procedure,style measures (past or future) for all funds are ranked each year and rescaled from zero (the lowest-rankedfund) to one (the highest-ranked fund). The table reports the simple correlation between past and futurestyle ranks under each procedure, pooled over funds and over years. Also reported in parentheses is theaverage absolute difference between the past and future style ranks. Statistics are reported for: all funds;large-capitalization funds (funds in the top thirty percent when sorted each year by style rank on size);small-capitalization funds (funds in the bottom thirty percent when sorted by size style rank); value funds(funds falling in the top thirty percent when sorted each year by style rank on book-to-market); growthfunds (funds ranked in the bottom thirty percent when sorted by style rank on book-to-market).
Panel A: Style based on factor loadingFuture style for:
Size Book-to-marketAll funds 0.73 0.71
(0.15) (0.16)Large-cap funds 0.79
(0.15)0.71
(0.14)Small-cap funds 0.88
(0.11)0.71
(0.18)Value funds 0.73
(0.16)0.77
(0.16)Growth funds 0.74
(0.16)0.83
(0.14)
Panel B: Style based on portfolio characteristicsFuture style for:
Size Book-to-marketAll funds 0.85 0.77
(0.11) (0.14)Large-cap funds
Small-cap funds
0.89
(0.11)0.93
(0.07)
0.76(0.13)0.81
(0.14)Value funds 0.85
(0.11)0.86
(0.12)Growth funds 0.84
(0.11)0.85
(0.13)
The two procedures for measuring fund style with respect to either size or book-to-market are as follows.The first procedure (the loadings approach) is based on the estimated coefficients for the size and book-to-market factors from a three-factor model regression. The regression for a fund's past style uses the past threeyears of monthly fund returns while the regression for future style uses the subsequent three years of returns

on the fund. The second procedure (the portfolio characteristics approach) is based on the fund portfolio'sweighted average firm size or book-to-market (where the weights are the proportion of fund net assets heldin each stock), using the most recent prior data on its holdings. A fund's future style under this procedure isbased on its most recent value-weighted average characteristic known at the end of the third year followingthe evaluation year. Under either procedure, the measures (portfolio characteristics or estimated loadings)for all funds are ranked at the evaluation year and rescaled from zero (the lowest-ranked fund) to one (thehighest-ranked fund). Simple correlations, and average absolute differences, between past and future stylesmeasured under each procedure are estimated using style measures pooled over funds and over years.
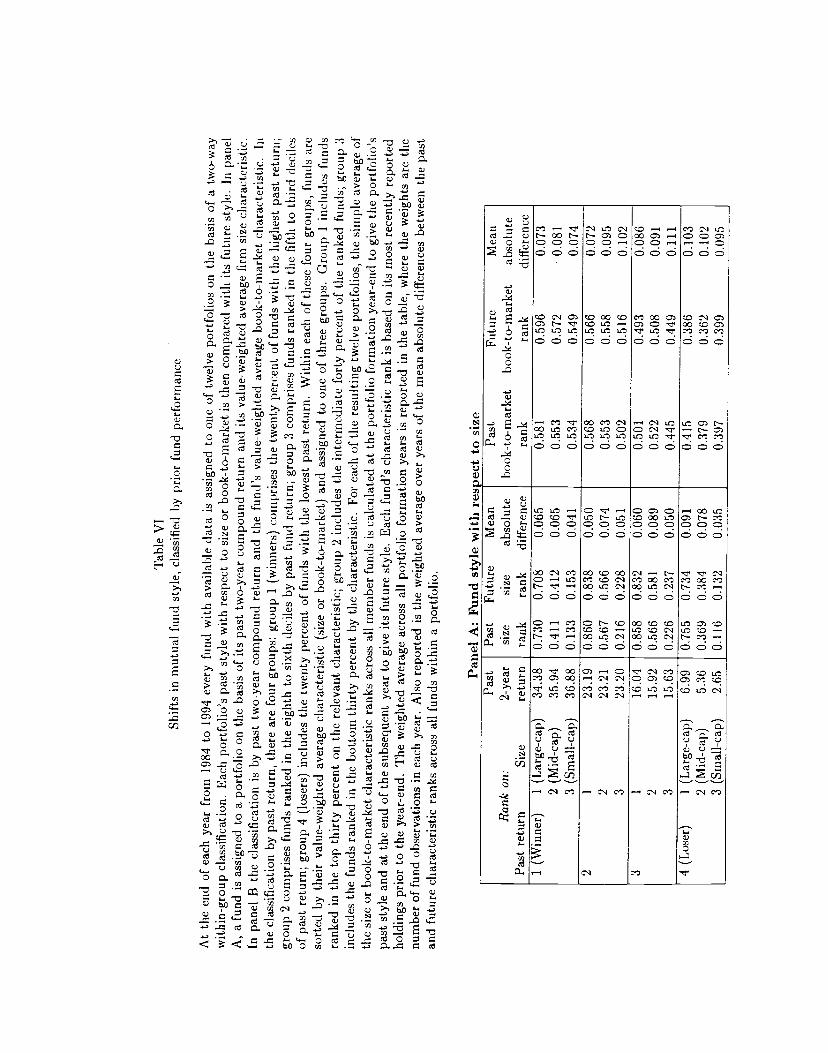
Tab
le V
I Sh
ifts
in m
utua
l fu
nd s
tyle
, cla
ssif
ied
by p
rior
fund
per
form
ance
At
the
end
of e
ach
year
fro
m 1
984
to 1
994
ever
y fu
nd w
ith a
vaila
ble
data
is a
ssig
ned
to o
ne o
f tw
elve
por
tfol
ios
on t
he b
asis
of
a tw
o-w
ay
with
in-g
roup
clas
sifi
catio
n.
Eac
h po
rtfo
lio's
pas
t st
yle
with
resp
ect t
o si
ze o
r bo
ok-t
o-m
arke
t is
then
com
pare
d w
ith it
s fu
ture
sty
le.
In p
anel
A
, a
fund
is a
ssig
ned
to a
por
tfol
io on
the
basi
s of
its
past
tw
o-ye
ar co
mpo
und
retu
rn a
nd i
ts v
alue
-wei
ghte
d av
erag
e fi
rm si
ze c
hara
cter
istic
. In
pan
el B
the
cla
ssif
icat
ion
is b
y pa
st t
wo-
year
com
poun
d re
turn
and
the
fun
d's
valu
e-w
eigh
ted
aver
age
book
-to-
mar
ket c
hara
cter
istic
. Ii
i th
e cla
ssif
icat
ion
by p
ast
retu
rn,
ther
e ar
e fo
ur g
roup
s:
grou
p 1
(win
ners
) com
pris
es th
e tw
enty
per
cent
of f
unds
with
the
hig
hest
pas
t ret
urn;
gr
oup
2 co
mpr
ises
fund
s ra
nked
in th
e ei
ghth
to s
ixth
dec
iles
by p
ast
fund
ret
urn;
gro
up 3
com
pris
es f
unds
ran
ked
in t
he f
ifth
to
thir
d de
cile
s of
pas
t re
turn
; gro
up 4
(lo
sers
) in
clud
es t
he tw
enty
per
cent
of f
unds
with
the
low
est
past
ret
urn.
With
in e
ach
of th
ese
four
gro
ups,
fund
s ar
e so
rted
by
thei
r va
lue-
wei
ghte
d av
erag
e ch
arac
teri
stic
(si
ze o
r bo
ok-t
o-m
arke
t) a
nd a
ssig
ned
to o
ne o
f thr
ee g
roup
s. G
roup
I i
nclu
des
fund
s ra
nked
in th
e to
p th
irty
per
cent
on
the
rele
vant
cha
ract
eris
tic; g
roup
2 i
nclu
des
the
inte
rmed
iate
for
ty p
erce
nt o
f th
e ra
nked
fun
ds;
grou
p 3
incl
udes
the
fund
s ra
nked
in
the
botto
m th
irty
per
cent
by
the
char
acte
rist
ic.
For
each
of t
he r
esul
ting
twel
ve p
ortf
olio
s, th
e si
mpl
e av
erag
e of
th
e si
ze o
r bo
ok-t
o-m
arke
t cha
ract
eris
tic ra
nks
acro
ss al
l mem
ber f
unds
is c
alcu
late
d at
the p
ortf
olio
form
atio
n ye
ar-e
nd to
giv
e the
por
tfol
io's
pa
st s
tyle
and
at th
e en
d of
the
subs
eque
nt y
ear
to g
ive i
ts fu
ture
styl
e. E
ach
fund
's c
hara
cter
istic
rank
is b
ased
on
its m
ost r
ecen
tly r
epor
ted
hold
ings
pri
or to
the
year
-end
. T
he w
eigh
ted
aver
age
acro
ss a
ll po
rtfo
lio fo
rmat
ion
year
s is
repo
rted
in
the
tabl
e, w
here
the
wei
ghts
are
the
nu
mbe
r of f
und
obse
rvat
ions
in ea
ch y
ear.
Als
o re
port
ed is
the
wei
ghte
d av
erag
e ov
er y
ears
of t
he m
ean
abso
lute
dif
fere
nces
bet
wee
n th
e pa
st
and
futu
re c
hara
cter
istic
rank
s ac
ross
all
fund
s w
ithin
a p
ortf
olio
.
Pane
l A:
Fund
sty
le w
ith r
espe
ct to
siz
e Pa
st
Ran
k on
: 2-
year
Pa
st r
etur
n Si
ze
retu
rn
Past
Fu
ture
M
ean
size
si
ze
abso
lute
ra
nk
rank
di
ffer
ence
Past
Fu
ture
M
ean
book
-to-
mar
ket
book
-to-
mar
ket
abso
lute
ra
nk
rank
di
ffer
ence
1
(Win
ner)
1
(Lar
ge-c
ap)
34.3
8 2
(Mid
-cap
) 35
.94
3 (S
mal
l-ca
p)
36.8
8
0.73
0 0.
708
0.06
5 0.
411
0.41
2 0.
065
0.13
3 0.
153
0.04
1
0.58
1 0.
596
0.07
3 0.
553
0.57
2 0.
081
0.53
4 0.
549
0.07
4 2
1 23
.19
2 23
.21
3 23
.20
0.86
0 0.
838
0.05
0 0.
567
0.56
6 0.
074
0.21
6 0.
228
0.05
1
0.56
8 0.
566
0.07
2 0.
553
0.55
8 0.
095
0.50
2 0.
516
0.10
2 3
1 16
.04
2 15
.92
3 15
.63
0.85
8 0.
832
0.06
0 0.
566
0.58
1 0.
089
0.22
6 0.
237
0.05
0
0.50
1 0.
493
0.08
6 0.
522
0.50
8 0.
091
0.44
5 0.
449
0.11
1 4
(Los
er)
1 (L
arge
-cap
) 6.
99
2 (M
id-c
ap)
5,36
3
(Sm
all-
cap)
2.
65
0.75
5 0.
734
0.09
1 0.
369
0.38
4 0.
078
0.11
6 0.
132
0.03
5
0.41
5 0.
386
0.10
3 0.
379
0.36
2 0.
102
0.39
7 0.
399
0.09
5
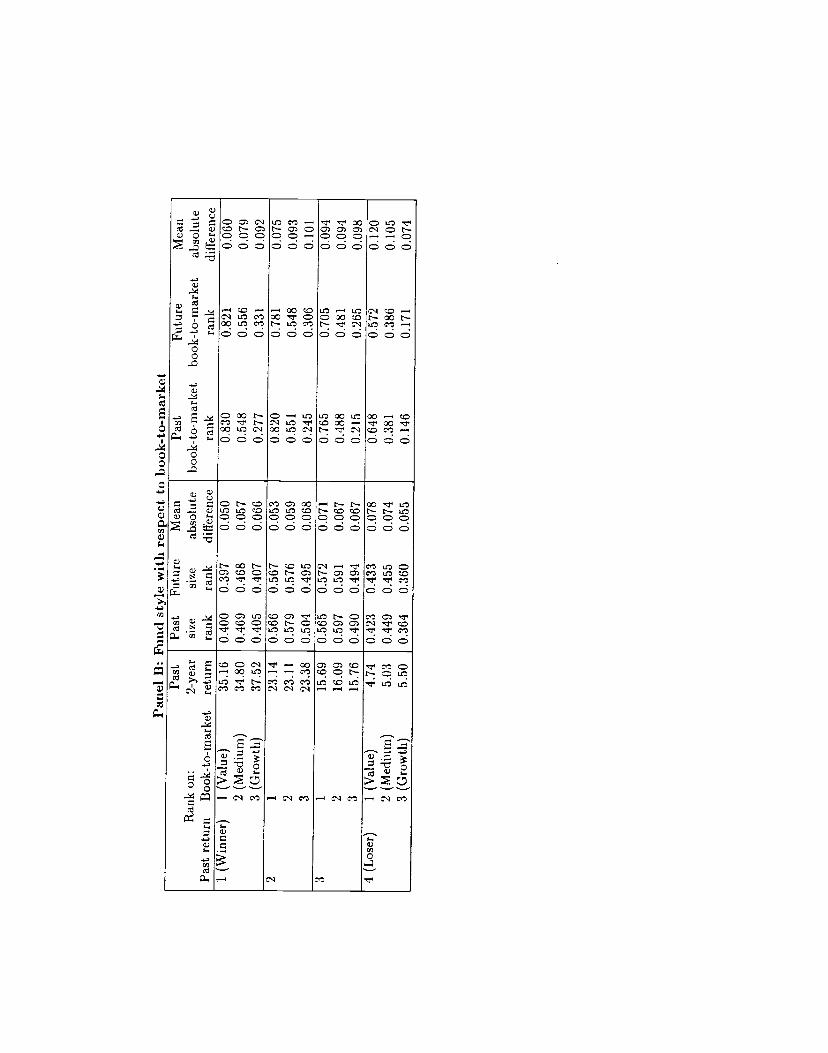
Pane
l B:
Fund
sty
le w
ith re
spec
t to
book
-to-
mar
ket
Past
R
ank
on:
2-ye
ar
Past
ret
urn
Boo
k-to
-mar
ket
retu
rn
Past
Fu
ture
M
ean
size
si
ze
abso
lute
ra
nk
rank
di
ffer
ence
Past
Fu
ture
M
ean
book
-to-
mar
ket
book
-to-
mar
ket
abso
lute
ra
nk
rank
di
ffer
ence
1
(Win
ner)
1
(Val
ue)
35.1
6 2
(Med
ium
) 34
.80
3 (G
row
th)
37.5
2
0.40
0 0.
397
0.05
0 0.
469
0.46
8 0.
057
0.40
5 0.
407
0.06
6
0.83
0 0.
821
0.06
0 0.
548
0.55
6 0.
079
0.27
7 0.
331
0.09
2 2
1 23
.14
2 23
.11
3 23
.38
0.56
6 0.
567
0.05
3 0,
579
0.57
6 0.
059
0.50
4 0.
495
0.06
8
0.82
0 0.
781
0.07
5 0.
551
0.54
8 0.
093
0.24
5 0.
306
0.10
1 3
1 15
.69
2 16
.09
3 15
.76
0.56
5 0.
572
0.07
1 0.
597
0.59
1 0.
067
0.49
0 0.
494
0.06
7
0.76
5 0.
705
0.09
4 0.
488
0.48
1 0.
094
0.21
5 0.
265
0.09
8 4
(Los
er)
1 (V
alue
) 4.
74
2 (M
ediu
m)
5.03
3
(Gro
wth
) 5.
50
0.42
3 0.
433
0.07
8 0.
449
0.45
5 0.
074
0.36
4 0.
360
0.05
5
0.64
8 0.
572
0.12
0 0.
381
0.38
6 0.
105
0.14
6 0.
171
0.07
4
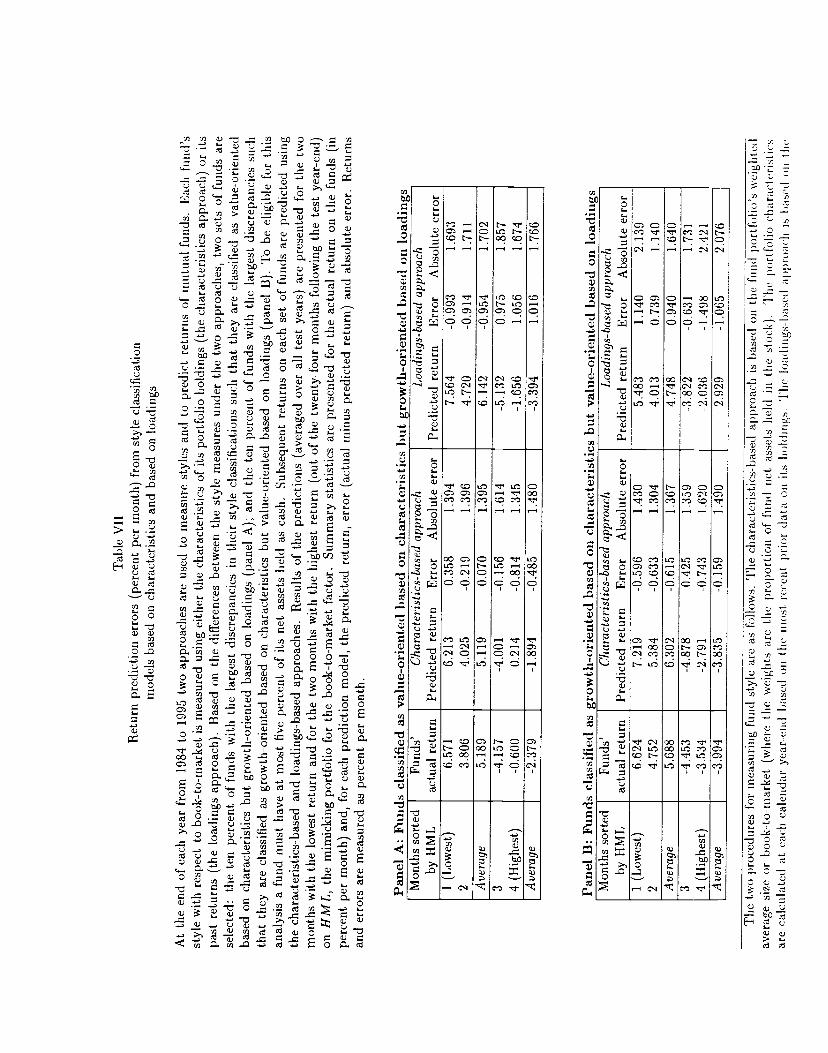
Tab
le V
II
Ret
urn
pred
ictio
n er
rors
(pe
rcen
t pe
r m
onth
) fr
om s
tyle
cla
ssif
icat
ion
mod
els
base
d on
cha
ract
eris
tics
and
base
d on
load
ings
At
the
end
of e
ach
year
fro
m 1
984
to 1
995
two
appr
oach
es a
re u
sed
to m
easu
re s
tyle
s an
d to
pre
dict
ret
urns
of
mut
ual
fund
s. E
ach
fund
's
styl
e w
ith re
spec
t to
book
-to-
mar
ket i
s m
easu
red
usin
g ei
ther
the
cha
ract
eris
tics
of it
s po
rtfo
lio h
oldi
ngs
(the
cha
ract
eris
tics
appr
oach
) or
its
pa
st r
etur
ns (
the
load
ings
app
roac
h).
Bas
ed o
n th
e di
ffer
ence
s be
twee
n th
e st
yle
mea
sure
s un
der
the
two
appr
oach
es, t
wo
sets
of f
unds
are
se
lect
ed:
the
ten
perc
ent
of fu
nds
with
the
larg
est d
iscr
epan
cies
in
the
ir s
tyle
cla
ssif
icat
ions
suc
h th
at th
ey a
re c
lass
ifie
d as
val
ue-o
rien
ted
base
d on
cha
ract
eris
tics
but g
row
th-o
rien
ted
base
d on
loa
ding
s (p
anel
A);
and
the
ten
perc
ent
of f
unds
with
the
larg
est d
iscr
epan
cies
such
th
at t
hey
are
clas
sifi
ed a
s gr
owth
-ori
ente
d ba
sed
on c
hara
cter
istic
s bu
t va
lue-
orie
nted
bas
ed o
n lo
adin
gs (
pane
l B
). T
o be
elig
ible
for
thi
s an
alys
is a
fun
d m
ust
have
at
mos
t fi
ve p
erce
nt o
f its
net
ass
ets
held
as
cash
. Su
bseq
uent
retu
rns
on e
ach
set
of f
unds
are
pre
dict
ed u
sing
th
e ch
arac
teri
stic
s-ba
sed
and
load
ings
-bas
ed ap
proa
ches
. R
esul
ts o
f the
pre
dict
ions
(ave
rage
d ov
er a
ll te
st y
ears
) ar
e pr
esen
ted
for
the
two
mon
ths
with
the
low
est
retu
rn a
nd f
or t
he tw
o m
onth
s w
ith t
he h
ighe
st r
etur
n (o
ut o
f tIm
e tw
enty
-fou
r mon
ths
follo
win
g th
e te
st y
ear-
end)
on
HM
L, t
he m
imic
king
por
tfol
io fo
r th
e bo
ok-t
o-m
arke
t fac
tor.
Sum
mar
y st
atis
tics
are
pres
ente
d fo
r th
e ac
tual
ret
urn
on t
he f
unds
(in
pe
rcen
t per
mon
th) a
nd, f
or e
ach
pred
ictio
n m
odel
, th
e pr
edic
ted
retu
rn, e
rror
(ac
tual
min
us p
redi
cted
ret
urn)
and
abs
olut
e er
ror.
Ret
urns
an
d er
rors
are
mea
sure
d as
per
cent
per
mon
th.
Pane
l A
: Fu
nds
clas
sifi
ed a
s va
lue-
orie
nted
bas
ed o
n ch
arac
teri
stic
s but
gro
wth
-ori
ente
d ba
sed
on lo
adin
gs
Mon
ths
sort
ed
by H
ML
Fu
nds'
ac
tual
ret
urn
Cha
ract
erzs
tics-
base
d app
roac
h Pr
edic
ted
retu
rn
Err
or
Abs
olut
e er
ror
Loa
dzng
s-ba
sed
appr
oach
Pr
edic
ted
retu
rn
Err
or
Abs
olut
e er
ror
I (L
owes
t)
2 6.
571
3.80
6 6.
213
0.35
8 1.
394
4,02
5 -0
.219
1.
396
7.56
4 -0
.993
1.
693
4.72
0 -0
.914
1.
711
Ave
rage
5.
189
5.11
9 0.
070
1.39
5 6.
142
-0.9
54
1.70
2 3 4
(Hig
hest
)
-4.1
57
-0.6
00
-4.0
01
-0.1
56
1.61
4 0.
214
-0.8
14
1.34
5 -5
.132
0.
975
1.85
7 -1
.656
1.
056
1.67
4 A
vera
ge
-2.3
79
-1.8
94
-0.4
85
1.48
0 -3
.394
1.
016
1.76
6
Pane
l B
: Fu
nd s
clas
sifi
ed a
s gr
owth
-ori
ente
d bas
ed o
n ch
arac
teri
stic
s but
val
ue-o
rien
ted
base
d on
loa
ding
s M
onth
s sor
ted
Fund
s'
Gha
ract
eris
tics-
base
d ap
proa
ch
Loa
ding
s- ba
sed
appr
oach
by
HM
L
actu
al r
etur
n Pr
edic
ted
retu
rn
Err
or
Abs
olut
e er
ror
Pred
icte
d re
turn
E
rror
A
bsol
ute
erro
r -
1 (L
owes
t)
6.62
4 7.
219
-0.5
96
1.43
0 5.
483
1.14
0 2.
139
2 4.
752
5.38
4 -0
.633
1.
304
4.01
3 0.
739
1.14
0 A
vera
ge
5.68
8 6.
302
-0.6
15
1.36
7 4.
748
0.94
0 1.
640
3 -4
.453
-4
.878
0.
425
1.35
9 -3
.822
-0
.631
1.
731
4 (H
ighe
st)
-3.5
34
-2.7
91
-0.7
43
1.62
0 -2
.036
-1
.498
2.
421
Ave
rage
-3
.994
-3
.835
-0
.159
1.
490
-2.9
29
-1.0
65
2.07
6
The
two
proc
edur
es f
or m
easu
ring
fund
sty
le a
re a
s fo
llow
s. T
he c
hara
cter
istic
s—ba
sed
appr
oach
is b
ased
on
the
fund
1)o
rtfo
hlo'
s wei
ghte
d av
erag
e si
ze o
r bo
ok—
to—
mar
ket
(whe
re t
he w
eigh
ts a
re t
he p
ropo
rtio
n of
fun
d ne
t as
sets
hel
d um
th
e st
ock)
. ('h
me
porl
.foh
io (
'litr
actc
ris(
iCs
are
calc
ulat
ed a
t eac
h ca
lend
ar y
ear-
-end
ba
sed
on t
he i
iiost
rec
ent
prio
r da
ta o
ii its
hol
ding
s.
'Ihie
loa
diiig
s—lo
eed
appt
Oa(
li IS
hitS
('d o
il t
estim
ated
coe
ffic
ient
s fo
r th
e si
ze a
nd b
ook-
to-m
arke
t fac
tors
from
a t
hree
-fac
tor
mod
el r
egre
ssio
n us
ing
the
past
thre
e ye
ars
of u
ioiit
hly
fund
re
turn
s. U
nder
eith
er p
roce
dure
, th
e m
easu
res
(por
tfol
io ch
arac
teri
stic
s or
est
imat
ed lo
adin
gs) f
or a
ll fu
nds
are
rank
ed a
t th
e ev
alua
tion
year
an
d re
scal
ed f
rom
zer
o (t
he lo
wes
t-ra
nked
fund
) to
one
(th
e hi
ghes
t-ra
nked
fund
).
Giv
en a
fun
d's
styl
e cl
assi
fica
tion,
fu
ture
fun
d re
turn
s ar
e pr
edic
ted
unde
r ea
ch a
ppro
ach.
Und
er t
he h
oldi
ngs-
base
d ap
proa
ch, e
ach
stoc
k in
a f
und'
s po
rtfo
lio is
mat
ched
with
a p
ortf
olio
of s
tock
s ha
ving
the
sam
e qu
intil
e ra
nk o
n si
ze a
nd o
n bo
ok-t
o-m
arke
t. 'i'
he f
und'
s pr
edic
ted
retu
rn i
s th
e va
lue-
wei
ghte
d re
turn
on
the
mat
chin
g po
rtfo
lio g
iven
the
com
pone
nt st
ocks
' rea
lized
futu
re r
etur
ns.
Und
er th
e re
turn
s-ba
sed
appr
oach
, a f
und'
s pr
edic
ted
retu
rn i
s ba
sed
on th
e es
timat
ed lo
adin
gs o
ver t
he p
rior
thr
ee-y
ear p
erio
d an
d th
e m
imic
king
por
tfol
ios'
rea
lized
fut
ure
retu
rns.