nber working paper series health care capital …
TRANSCRIPT

NBER WORKING PAPER SERIES
HEALTH CARE CAPITAL FINANCINGAGENCIES: THE INTERGOVERNMENTAL
ROLES OF QUASI-GOVERNMENTAUTHORITIES AND THE IMPACT
ON THE COST OF CAPITAL
Alec Ian GershbergMichael Grossman
Fred Goldman
Working Paper 7221http://www.nber.org/papers/w7221
NATIONAL BUREAU OF ECONOMIC RESEARCH1050 Massachusetts Avenue
Cambridge, MA 02138July 1999
We are extremely grateful to Abeni Crooms for her prodigious efforts as the research assistant who had the majorresponsibility for carrying out our survey of health care financing authorities. We are also grateful to Patricia Kocagil,Sara Markowitz, Mitch Strohminger, and Christian Lomax for additional research assistance. We are indebted to anumber of people for making data available to us, for advising us with regard to the use of the data and theinterpretation of certain variables, and for discussing the tax-exempt hospital bond market with us: Marc A. Katz,Melissa Marsh, Lou Herman, John H. Van Gorkom, Joe Tannenbaum, Jack Ashby, Stephen J. Stern, Terry Partingtonand Lisa Winkler-Pieta. Papers based on some of the material in this study were presented at the 1994 and 1998 NorthAmerican Meetings of the Regional Science Association International and at the 1996 Meetings of the Urban AffairsAssociation, as well as the 1998 Barnard Columbia Urban Issues Workshop. We would like to thank the participantsin those sessions for useful comments. In particular, we received helpful comments and support from Roger Bolton andEster Fuchs. Finally, we are grateful to two anonymous referees for additional insight. The research was supported bya grant to the National Bureau of Economic Research from the Agency for Health Care Policy and Research, USDHHS,grant No. R01 HS06095-04. Of course, responsibility for all errors and interpretations lies solely with the authors, notwith either NBER or AHCPR. All opinions expressed are those of the authors and not those of the National Bureauof Economic Research.
© 1999 by Alec Ian Gershberg, Michael Grossman, and Fred Goldman. All rights reserved. Short sections of text,not to exceed two paragraphs, may be quoted without explicit permission provided that full credit, including © notice,is given to the source.

Health Care Capital Financing Agencies: The Intergovernmental Roles of Quasi-Government Authorities and the Impact on the Cost of CapitalAlec Ian Gershberg, Michael Grossman, and Fred GoldmanNBER Working Paper No. 7221July 1999JEL No. I10, I11, I18
ABSTRACT
During the decade 1983-1992, approximately 1.4 trillion dollars of municipal bonds were sold
in 87 thousand separate issues, primarily to finance capital projects for education, electric power,
transportation, health care, housing and other public and private purpose activities. Approximately
two-thirds of these financings were originated by financing authorities, quasi-government agencies
which are the creation of state legislatures. Despite the growing role played by quasi-public
authorities in capital finance, their impacts have not been studied systematically. We first describe
the issuers of tax-exempt debt in the health sector and then derive measures for describing the mix
of issuers between state and local levels, and between both government and quasi-government
sectors. We present abbreviated test results of the impact that different mixes have on the cost of
capital. First, competition is good: using a Herfindahl index analysis we show that states with less
concentrated issuers have a lower cost of capital than those with a more concentrated market,
including state-level finance monopolies. On the other hand, we cannot assert unequivocally that
market deconcentration in and of itself should be a goal. For instance, there are economies of scale
in the health care finance industry that allow larger (often state-level) issuers to lower the cost of
capital.
Alec Ian Gershberg Michael GrossmanNew School University City University of New York Graduate School66 Fifth Avenue 365 Fifth AvenueNew York, NY 10011 New York, NY 10016-4309and NBER and [email protected] [email protected]
Fred GoldmanNew School University66 Fifth AvenueNew York, NY 10011and NBER
1
Health Care Capital Financing Agencies:The Intergovernmental Roles of Quasi-Government Authorities
and the Impact on the Cost of Capital
INTRODUCTION: BOND ISSUERS AND THE MUNICIPAL BOND MARKET
Despite the fact that most municipal bonds in the U.S. are issued by quasi-public
authorities, we know very little about how these authorities work. States differ drastically in
the level of decentralization of the relevant finance functions. They also probably differ in
the level of competition inherent in the institutional arrangements the state-governments
themselves create through political processes. There are three basic state regimes: in the
health care sector for instance, twelve states have virtual state-level monopolies; nineteen
have only local issuers; and nineteen have both state-level and local issuers. There has
been little systematic exploration of the general impact of quasi-public authorities on either
the cost of capital or the selection and shape of public and non-profit projects that receive
financing. We present results that indicate that concentration of the issuers at the state
level raises the cost of capital, but at the same time issuer size and experience may lower
it. So, while there is some evidence of the potential benefits of decentralization, it is not
unqualified, and the true effects are certainly complex and difficult to unravel. There has
been no exploration of the impact of these three state-level arrangements, nor of the
political or regulatory policies that might increase competition in the industry and, thus,
lower the cost of capital in the health care sector.
Healthcare financing agencies are either state and local governments which choose
to issue healthcare bonds (e.g., Pueblo County, Colorado, or the State of Ohio) or quasi-
government entities usually known as healthcare financing authorities (e.g. Wisconsin
Health and Educational Facilities Authority or the Texarkana Health Facilities Development

2
Corporation) which are created by state and local governments specifically to issue tax-
exempt healthcare bonds. The generic term for both types is "healthcare financing agency,"
and we have chosen to use the word "authorities" to refer specifically to the quasi-
government entities. This paper first describes the issuers of tax-exempt debt in the health
sector and then derives measures for describing the mix of these issuers among both state
and local levels and between both government and quasi-government sectors. The policy
regime for health care capital finance is set at the state level, and varies greatly from state
to state. This variation occurs with respect to two main characteristics: 1) the extent to
which financing is centralized at the state level or decentralized to the local level and 2) the
extent to which financing is performed by government or quasi-government entities. As a
consequence of these variations, the regimes also vary in terms of 1) the concentration of
the market for bonds in one, a few, or many potential issuers and 2) (potentially) the level
of competition inherent in the market’s institutional arrangements. Thus, we raise a
fundamental question: Do differences in the market structure of this industry across states
lead to differences in the interest rates on the debt that the health care financing agencies
issue on behalf of hospitals? We present abbreviated results from an attempt to answer this
question using two widely-used measures of concentration: the four firm concentration ratio
and the Herfindahl index.
During the decade 1983-1992, approximately 1.4 trillion dollars of municipal bonds
were sold in 87 thousand separate issues, primarily to finance capital projects for
education, electric power, transportation, health care, housing and other public and private
purpose activities.1 Approximately two-thirds of these financings were originated by
financing authorities, quasi-public agencies that are the creation of state legislatures.2 In

3
some cases the authorities are simply conduits for financings, doing no more than issuing
bonds, turning the proceeds over to the project beneficiary, and often ceasing to exist once
the financing is complete. In other cases, the authorities may become permanent state or
local agencies, actively pursuing and shaping projects and working with potential
beneficiaries to plan capital projects. And, the authorities may refuse to issue bonds for
some projects and beneficiaries, citing, for example, concerns over the creditworthiness of
the beneficiary. This study focuses on the health care sector but will yield insights for other
sectors in which quasi-government authorities play a role in capital finance.
While hospitals and other healthcare institutions receive the proceeds from bond
offerings, they do not issue or sell the bonds. The bonds are issued on their behalf by a
financing agency and sold to (or by) an underwriter (i.e., an investment banker) who in turn
resells them. Proceeds from the bond sale are then transferred to the healthcare
institution, on whose behalf the bonds were issued, to meet the purpose of the bond
offering.3 In addition, financing agencies arrange interest payments and repay the bonds
with monies received from the healthcare institution. However, the role of the healthcare
financing agency may go far beyond that of a simple conduit for funds, as we discuss.
To our knowledge, there has never been a study of healthcare financing agencies.
We have been unable to find a single study of healthcare financing agencies in the social
science and health services research literature, and there are only passing references to
them in the healthcare capital financing literature.4 In this study, we discern a taxonomy of
health-care capital financing agencies, particularly with respect to the intergovernmental
mix of issuers outlined above. We then discuss the impacts of this taxonomy and the
concentration of market structure on the cost of capital.

4
HISTORICAL DESCRIPTION OF HEALTH CARE BOND ISSUERS & PROCEDURES
The financing agencies are responsible for matching hospitals with investment
bankers (i.e., the underwriters that will sell the bonds). Although it is the hospital which
ultimately agrees to an underwriter, the financing agency chooses the pool of underwriters
from which the hospital must select. The pool can vary in size, change over time, and may
be unrestricted for some agencies. Also, the financing agency can influence and may even
decide whether the bond deal will proceed as a competitive issue (based on sealed bids by
acceptable underwriters), a negotiated issue (where the hospital chooses a particular
underwriter from a pool of acceptable ones), or a private placement (where the underwriter
is bypassed altogether). While the choices given to the hospitals by the financing agencies
are interesting because of their potential impact on hospitals' capital costs, they are equally
interesting as, potentially, the outcome of competition among financing agencies. This is
because on a state or local basis there may be more than one financing agency from which
the hospital is permitted to choose. So, the hospital chooses the financing agency (which
is a virtual state-wide monopoly in twelve states), and then the hospital chooses an
underwriter based on those acceptable to the financing authority.
It is not melodramatic to indicate that for the past two decades, healthcare financing
agencies have been one of the most powerful, albeit hidden, forces shaping the healthcare
system. Yet, they emerged from state and local legislatures, in acts and amendments to
acts, simply as a response to Internal Revenue Service rulings which allow public and
nonprofit institutions to obtain capital at lower cost than their private, for-profit
counterparts. Most healthcare capital now comes from the sale of tax-exempt healthcare
bonds.5 Healthcare bonds in 1993 accounted for about 11 percent of the nation's

5
municipal bond market, and an average of 10 percent over the 1980-1993 period6. Over
the same period, $179 billion (in constant 1982-4 dollars) of healthcare bonds were
issued in about 8800 separate financings (see Table 1). We believe that few public
finance and health services researchers and policymakers are aware of these agencies and
we believe that many of the features of the tax-exempt capital acquisition process, in
general, are not well understood. This, we feel, is an unfortunate oversight in the public
finance and health services research literatures.
Table 1 describes health care bond issues by issuer type.7 In particular, we are
concerned with issuers that we can classify as government and quasi-government. The
government issuers are described in the table under three categories: State, County, and
City/Town/Village. The quasi-government issuers, on the other hand, are: District, State
Authority, and Local or County Level Authority.8
Elrod and Wilkinson write that "Several states have active state healthcare financing
authorities whose services can be extremely valuable. These authorities are familiar with
the project finance process and are active issuers of tax-exempt bonds. This position
enables them to help hospitals assemble a financing team, investigate borrowing options,
negotiate legal terms and conditions, prepare for bond rating agency presentations, and
close the bond issue in an efficient manner."9 This suggests that there is variation in the
participation and efficiency of financing agencies, perhaps in a way which affects the costs
of capital. Certainly, one way to delineate this variation, at the state level, is the proportion
of real par value of bonds in the sector flowing through government versus quasi-
government entities, and the proportion of real par value in each category of finance
entities flowing through state versus local level entities. We do this in the next section.

6
Typically, the procedure for financing through an authority is as follows: The
financing authority is given title to the facility for the life of the bond issue and leases it
back to the healthcare institution. The institution, in turn, pays rent on the lease which is
equal to the debt service on the bond. In addition to leaseback arrangements, this may be
accomplished by loan or installment sale mechanisms. When the bond is retired,
ownership title returns to the healthcare institution.
From the hospitals' perspective, there are obvious advantages to having access to
tax-exempt capital markets. However, it is not clear why, on balance, the benefit to
hospitals was also advantageous to state and local governments that would become
identified with these financings. They, too, borrowed in tax-exempt bond markets.
Problems with a hospital's debt would draw attention to the state and local area debt and,
perhaps, jeopardize state and local area credit ratings. Also, new tax-exempt hospital
bonds would add to the total supply of tax-exempt bonds and raise capital costs for all tax-
exempt issuers. Brown writes that "Once investment brokerage firms convinced state
legislatures to establish bonding authorities that could issue tax-exempt bonds on behalf of
hospitals without requiring hospitals to pass ownership title to the state, access to capital
increased even more dramatically."10 We do not know of evidence that links investment
bankers with the creation of the authorities, and Brown does not cite any, although it is
reasonable to expect that expansion of the market for hospital bonds is in their interest.
Cohodes and Kinkead write, similarly, that "Responding to appeals from hospital industry
and the investment banking houses, state legislatures created finance authorities to issue
tax exempt bonds on behalf of hospitals."11 And, they observe, "it is ironic that perhaps the
most important capital subsidy in the hospital industry sprang not from the federal

7
government but from state legislatures. Moreover, this occurred with little or no public
debate or analysis of the implications for public policy objectives."
In general, the budgetary and political advantages for state and local governments to
do bond deals through authorities are clear. Richard Sandomir provides this telling
quotation from former New York State Governor Mario Cuomo regarding the potential use of
a sports finance authority to finance a new baseball stadium: “Theoretically and practically,
the state can borrow the money. But politically, when you present your budget, you don’t
have to say, ‘I borrowed $800 million for a stadium. The authority did it.’ It’s off budget.”12
Authorities help governments circumvent debt caps and requirements for referenda. They
may also help them provide services now for which the bills come due later.
Whatever the causes, actors, and methods in this capital policy, two results are
clear: The agencies were created and the primary source of healthcare capital is now tax-
exempt capital markets. As mentioned above, presently there are twelve states with
hospital finance authorities that have monopolies for issuing tax-exempt bonds. There are
nineteen states where hospitals can select from state-level authorities or an alternative,
local issuer. The remaining states have only non-state-level issuers.13 Overall, non-state-
level issuers issued 67 percent of tax-exempt hospital bonds issued during 1993. This
distribution of financing authorities is significant for the research we have undertaken. We
have, in effect, a natural experiment in the issuing of hospital bonds, healthcare bonds,
and, for that matter, municipal bonds, in general. There are states with state-wide
monopoly issuers; states with statewide issuers and local competitor issuers; and states
with only local competitor issuers.14
We know from our discussions with investment bankers, financing authority officials,

8
and other key players in this market that there can be intense competition among financing
authorities for the "right" to issue a hospital's bonds. After all, the authorities were created
for the purpose of issuing bonds, and they derive fee income and revenues, in general,
from the issuance of bonds. An example of concern with fees and competition has recently
surfaced in the debate over whether state authorities should have disclosure rules for their
hospital bond issues that are trading in the secondary market. As Nemes reports in
Modern Healthcare, disclosure would require more staff at state authorities, and "The
additional staffing would translate into higher issuance fees for hospital issuers (i.e., the
state authorities).”15 Moreover, "The other concern expressed by some [state-wide] hospital
financing authority executives relates to the possibility they might lose some issuing
business to local and county authorities..."
Taken together, these anecdotes imply legitimate concerns over the level of
competition in issuing health care debt for capital projects. As stated above, this issuing
takes place in 51 different state level regimes (including the District of Columbia). Do the
alternative market structures of finance authorities affect the interest rates on the bonds
they issue? This is the most important long-run question of the research undertaken.
TOWARDS A TAXONOMY OF STATE-LEVEL BOND ISSUER REGIMES
The previous section described and categorized health care bond issuers, and raised
relevant questions related to their activities, especially with regard to the state-level mix of
different kinds of issuers. We now turn our attention to a few simple measures developed
to help begin generating answers. We present a few simple measures of centralization and
decentralization that show the vast differences in state-level health care finance regimes
and institutional arrangements. Tables 2 through 5 present three proportions that motivate

9
this project.
Proportion #1 is the Quasi-Public Authority Share of the Total Health Care Bond Market.16
It is computed by dividing the par value of Quasi-Government issues by the par value of
the Total (Quasi-Government + Government) Health Care Bond Market.
Proportion #2 is the Local Authority Share of Total Quasi-Public Bond Issues. It is
computed by dividing the par value of issues through Districts plus Local or County Level
Authorities by the par value of Total (District + Local or County Level Authority + State
Authority) Quasi-Government bond issues.
Proportion #3 is the Local Government Share of Total Government Issues. It is computed
by dividing the par value of issues through Local (County + City/Town/Village) government
issuers by the par value of Total (County + City/Town/Village + State) government issues.
Looking at the 1980-1993 averages in Table 2 as an example of how to interpret
these proportions, we see that approximately 80% of the total par value of health care
bonds was issued by quasi-government authorities. Of that 80%, a little less than half
(46%) flowed through Local Authorities, while slightly more than half (54%) flowed through
State Authorities. Finally, of the approximately 20% of total par value issued directly by
pure governments, nearly all (93.5%) flowed through local governments. State
Governments play a relatively small role as direct issuers of health care bonds. As far as
trends over the 14-year period, there does appear to be a slight rise from 1980 to 1985 in
the role of quasi-public authorities, but it is far from striking.17 The Local Authority Share of
Total Quasi-Public Bond Issues fluctuates above and below the period average of 46%, and
it is difficult to discern a clear time-related trend. The Local Government Share of Total
Government Issues rises considerably from 1980 to 1985, and then remains high from that
10
point on. Still, at the national level, the trends are not clear, and it is thus necessary to
turn to a state-level analysis, where we clearly see that states show highly variable mixes
between government and quasi-government issues, as well as the jurisdictional level at
which the issues took place.
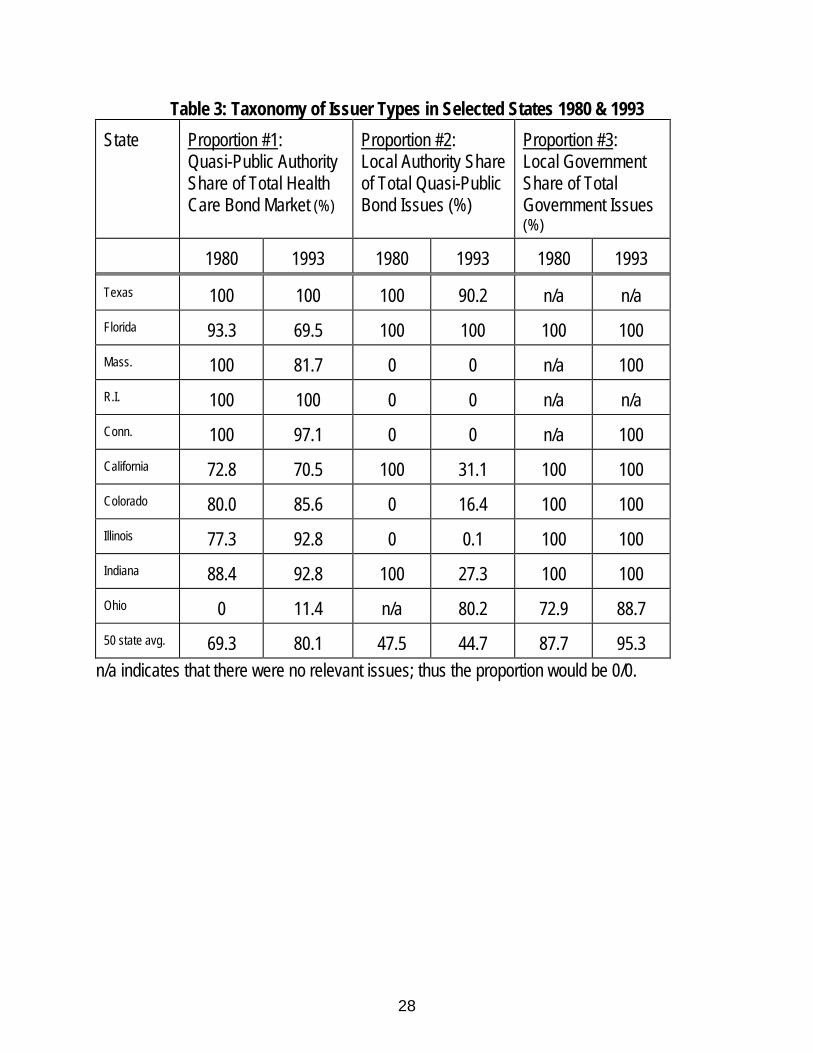
Table 3 gives the same three proportions for states selected to paint a picture of the
range of the mix of financing structures. Looking for instance at Proportions #1 and #2,
Connecticut, Massachusetts, and Rhode Island show either a total or near total dominance
by state level authorities (and while the tables do not show the number of authorities, they
are dominated by a single issuer). In those instances where pure governments do issue, it
occurs only at the local level (Proportion #3). While it may appear that this occurs only in
relatively small, New England states, Table 3 shows a very similar pattern in 1993 for the
much larger Midwest state of Illinois.
On the other hand, Texas and Florida show a very different taxonomy. Texas is also
dominated by quasi-government authorities, but nearly exclusively by Local Authorities.
When pure governments do issue, that too is only at the local level. The state government
never issues bonds directly. Though not quite as extreme, Florida too is dominated by local
quasi-government issuers. Thus, these results hold up one’s expectations for two states
well-known for their anti-regulatory state-level practices. California and Colorado show a
range of government and quasi-government issuing, with quasi-government generally
tending to issue a larger share. Both states tend to rely much more on state rather than
local quasi-government entities, but again government issues, when they occur, are done
at the local level. Indiana is a particularly interesting example in terms of the dynamic
between state and local quasi-government issuers: While quasi-government issuers have

11
dominated over pure government issuers, there was no state authority until 1984. The
state authority was created in 1984, and then rather rapidly took over the lion's share of
the market. Ohio stands alone as an example of a state where not only do governments
dominate over quasi-government issues, but also the state government did, at least in the
early 1980s, play a significant role. Even in 1993, the 11.3% share of government issues
by the state government (Proportion #3, 100-88.7=11.3) is a figure higher than found in
other states. On the other hand, of those issues done through the quasi-government
sector, the tendency is slightly toward local authorities (Proportion #2, 44.7% state or
55.3% local).
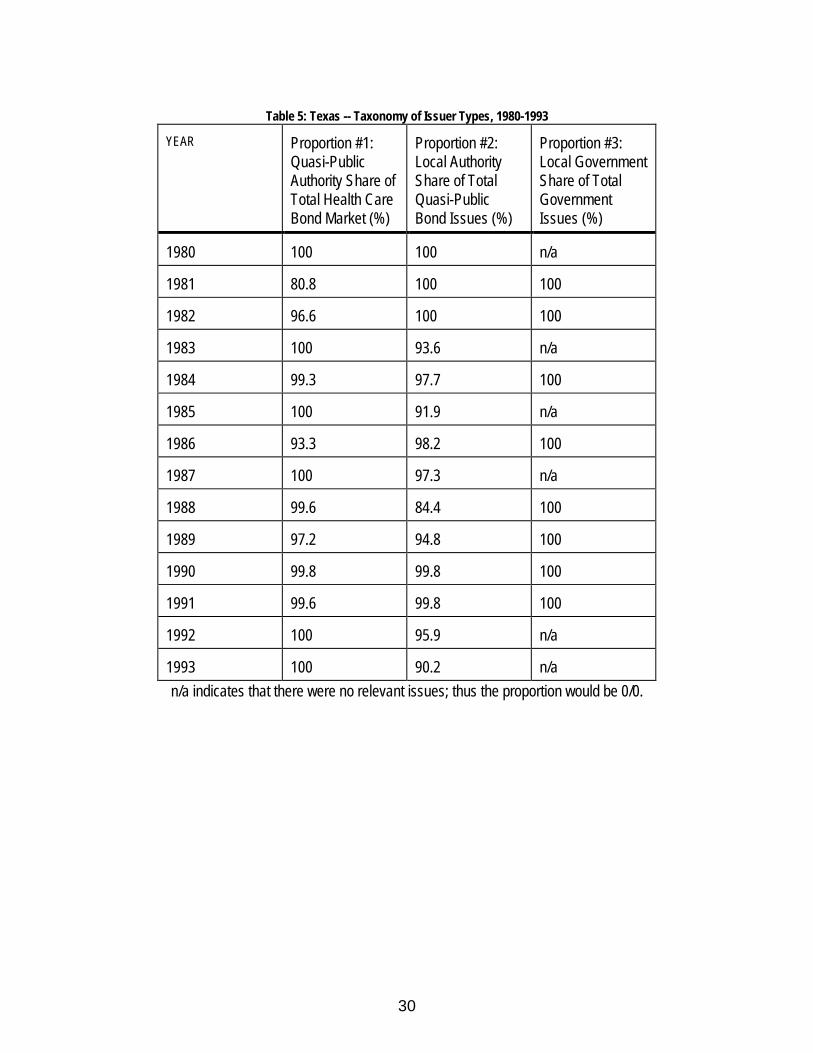
We turn briefly to the trends in a few states over time to show in more detail how
they can both differ and change. Tables 4 and 5 present the trends over time in California
and Texas, respectively. As mentioned above, these two states have very different finance
regimes. California was highly decentralized until 1981, when the state’s health finance
authority made its first issue. After that, state-level authorities quickly dominated the
market. Texas, on the other hand has been consistently decentralized.
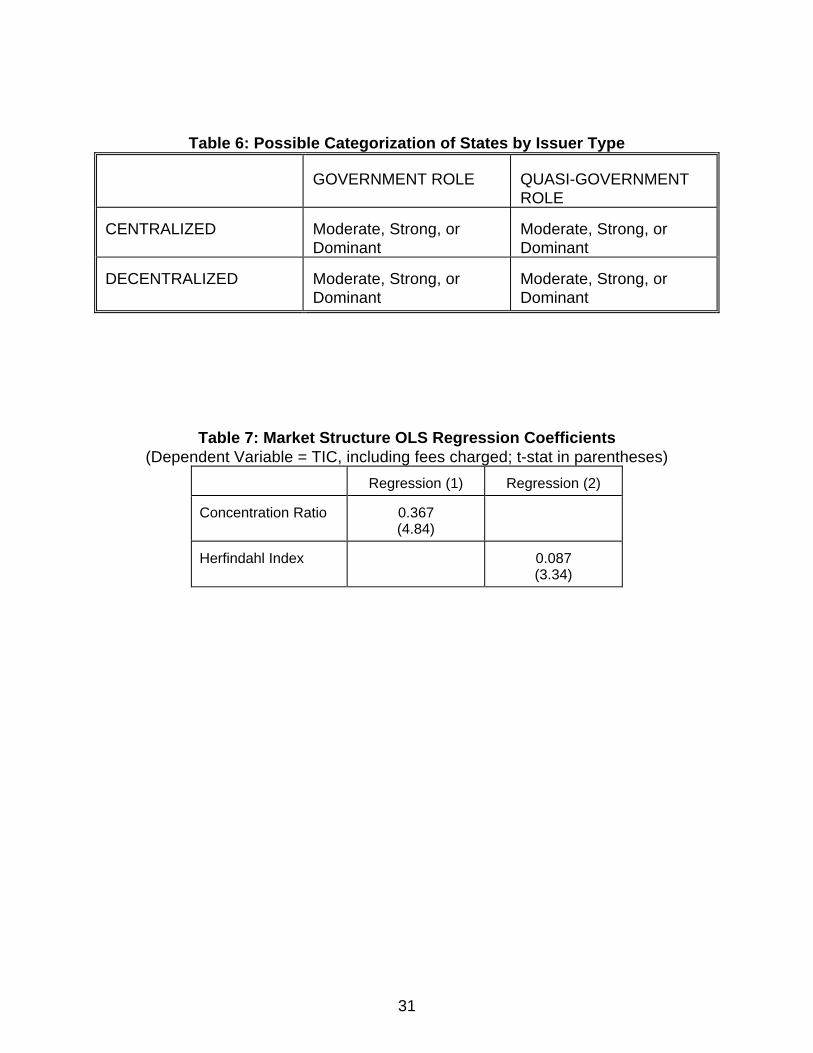
Thus, we could begin to conceive of a taxonomy of health care financing agencies
that would roughly categorize states along the following lines:
INITIAL RESULTS OF ANALYSIS OF THE EFFECTS OF ISSUER CONCENTRATION
While the above taxonomy helps us understand the nature of state-level health care
capital finance regimes, the inevitable question must be asked: So what? We believe this
effort is important for two main reasons. First, we would like to test the impact that
different taxonomies have on the cost of health care capital. Second, we would like to
12
explore the causes of development of each state's taxonomy, presuming that the
development is not entirely random. Why do states look like they do? We will return to this
second interest briefly in the conclusions. For the moment we concentrate on the impact of
different taxonomies have of the cost of health care capital.
We have extended Grossman et al. in a manner that examines the impact of market
structure on the cost of capital.18 More specifically, we have used two widely-used
measures of concentration19: the four firm concentration ratio and the Herfindahl index.
The former is defined as the fraction of industry output accounted for by the four largest
producers. The latter is defined as the sum of the squared share of each producer in total
output. 20 For both measures real par value is used as output in this context. Using a large
sample of our database for all health care bonds issues from 1980 to 1993, we have
incorporated these measures into regression analyses of the determinants of the cost of
capital (as measured by the True Interest Cost, or TIC) for hospital bond issues.
We have performed a series of regressions with the TIC as the dependent variable.
Independent variables include Issue and Issuer Characteristics (including the Issuer’s
history of real par values and all standard characteristics of bond issues); National
Characteristics (including the rate and variability of treasury bonds); State Characteristics
(including the two measures of market concentration, and state tax rates); County
Characteristics (including unemployment and urbanization data); and Hospital
Characteristics (including Medicare and Medicaid shares and profitability margins). We
report here results based on a sub-sample of all hospital bond issues for 1980 to 1993 by
government and quasi-government issues for which the most complete TIC data (inclusive
of fees charged) have been collected, n=4576.21 Here, we report the findings regarding
13
the effect of market share only, and use them to raise questions for future investigation.
All coefficients are positive and statistically significant. These results imply that
reductions in concentration lower the cost of capital; thus, decentralized states are better
off.22 Moreover, we calculate that a one standard deviation increase in issuers or reduction
in concentration reduces the tic by approximately 12 basis points. While this may appear
small at first, the effect is larger than that associated with a one standard deviation
increase in the hospital’s overall operating margin or its potential profitability under
Medicare’s prospective payment system. It is approximately equal to the premium
associated with the inclusion of a call provision. Moreover, the cost of a bond’s aggregate
debt service during its life of twenty to thirty years to maturity is several times its par value.
A reduction in the interest rate of only a few basis points could yield substantial savings
over time. For example, a ten basis point reduction would have subtracted $200 million
from the costs of the 1,152 hospital bonds issued in 1993.23
CONCLUDING DISCUSSION AND DIRECTIONS FOR FUTURE RESEARCH
While these results are certainly thought-provoking, we cannot yet say “bond issuer
concentration is unequivocally bad.” In fact, we also report that issuer experience lowers
the cost of capital, which implies that larger, more experienced issuers (which promote
market concentration) have some advantages. We calculate that one standard deviation
increase in issuer experience leads to approximately a 6 basis point reduction in the tic.24
Taken together, these results lead us to three main gaps in our understanding of health
care capital finance authorities. We will need to fill these gaps in order to understand the
true impact of market structure on the cost of capital and, thus, develop realistic policy
recommendations.
14
1) We need to better understand the nature of competition between issuers. First,
are local authorities sometimes the equivalent of local monopolies? In other words,
if a state has many local issuers, can a hospital seek bond issues with authorities
outside of its local jurisdiction? What is the nature of competition between state and
local level authorities in those states in which both are operating? This is a critical
question: do beneficiaries perceive that they have a choice between local and state
level authorities. Do local authorities benefit from closer working relationships with
beneficiaries? Do local authorities emphasize maximizing profits less than state
authorities do?
2) What goals do states have when they establish their financing regimes? Are
larger, state-level issuers in more concentrated markets pursuing (or are they
designed by state policymakers in order to pursue) goals other than simply issuing
debt to hospitals at the lowest cost? Is a slightly higher cost of capital perhaps a
price paid for the pursuit of some other economic development goals?
3) What policy changes could affect market structures? Any policy changes would
obviously have to consider the varied histories of market structure in each state.
Still, is there a role for federal policy? This is especially important given that much
of the recent health care debate focused on shifting control from Federal
government to state and local governments and increasing the amount of
competition in the market. For this reason, it is surprising that this debate has
largely ignored the tax-exempt hospital bond market. The evolution of this market
since the late 1960s, described in this paper, provides a natural experiment to study
the effects of some of these potential changes.

15
Thus, it will be important to explore the causes of development of each state's
taxonomy, presuming that the development is not entirely random. Why do states look like
they do? This will require the development of political economy theory that would allow us
to use measures such as the proportion of state versus local control of the market as
dependent variables in quantitative analysis. Finally, however, we feel that given the size of
the sector ($31 billion in 1993 alone) and the near complete lack of either description or
analysis at the level of the bond issuers, the taxonomy and results presented in this study
paint a far clearer picture than currently available of how health care capital is financed in
an era where the health sector is clearly a salient concern.
Appendix: Full Regression Model of Determinants of Hospital Bond Cost of Capital
Our study highlights the effects of two common measures of market concentration,
the Herfindahl Index and the Concentration Ratio, on the cost of health care capital. The
dependent variable is the cost of capital, for which we use the true interest cost (tic). See
Grossman et al. (1996) for a full definition of and computation method for the tic. Nearly all
of the necessary data for the tic were contained in our SDC database described in the
study. However, in order to compute most accurately the tic, we needed to know the fees
that were charged by the finance authorities. This information was not available, so we
devised and implemented a national survey of all health care finance authorities to
determine the level of fees charged.
To obtain information on fees charged by issuers and changes in fees over time, we
conducted a survey of all issuers classified as state authorities, local authorities, and
districts. The survey universe consisted of 999 issuers. Those receiving questionnaires
issued 4,824 bonds whose total real par value amounted to $130 billion in 1982-84
16
dollars during the period 1980 through 1993. Of the 999 issuers in the survey, 359
returned the questionnaire. Thus, the response rate of 36 percent in terms of issuers was
relatively modest. The respondents, however, accounted for 65 percent of all issues done
by the survey universe and for 71 percent of their real par value. These response rates are
much more impressive. They indicate that our survey includes most of the large issuers
both in terms of the number of bond deals and their total par value.
Regressions were estimated with a sample drawn from the 5,799 issues where tics
exclusive of fees can be computed. 1,213 issues were done by state and local authorities
who received the survey and did not respond and 10 were done by issuers who responded
but did not report information on fees. Thus, the sample (n =4,576) excludes these
issues. Measures of the number of issuers and the concentration of par value among
issuers are based on all 6,701 hospital issues in the full database. The mean and standard
deviation of the dependent variable, the true interest cost inclusive of fee in the sample, are
8.223 and 2.340, respectively.
Table A1 presents the definitions, means, and standard deviations of the
independent variables. Table A2 presents the standard OLS regression results. This model
follows closely other common models of the determinants of interest rates and cost of
capital for hospitals, most notably Grossman, Goldman, Nesbitt, and Mobilia (1993, see
also note #18). There are, however, a few variable definitions and omissions that may
need additional discussion. First, while the database includes refinancings, a dummy for a
refinancing was not significant and is therefore excluded from these results. Second, we do
not know the number of bids for competitive bids and therefore include only a dummy for
negotiated. While most studies include the number of bids, they are also generally limited
17
to much smaller numbers of observations than we have.25 Third, we do not include bond
ratings because given our detailed specification we consider them to be endogenous.
Regressions with the ratings included were not substantively different, however. Finally, we
have not included a variable for issue size because we consider it to be an endogenous
variable and we are presenting a reduced form equation.
The concentration ratio is employed as a regressor in regression (1), while the
Herfindahl index is employed in regression (2). The discussion of the results here is limited
to the market structure effects as summarized by Table 7 in the main body of the text.
Consider the regression coefficients for the tic inclusive of fee. All have the expected signs
and are statistically significant. To gauge the magnitude of the concentration effects, we
consider how much the tic inclusive of fee would fall if each issuer had approximately the
same share in real par value. The concentration ratio and the Herfindahl index have means
of 0.83 and 0.45, respectively. These are the means of the actual variables rather than
the antilogarithms of the means of their logarithms, presented in Table A2. Based on the
number of different issuers in the issue year, there were 13 different issuers per state who
issued bonds in a typical year in the period from 1980 through 1993. If each issuer had
the same share in real par value, the Herfindahl index would equal 0.08, and the
concentration ratio would equal 0.31. A two standard deviation reduction in the natural
logarithm of the Herfindahl index would produce an actual index of 0.08, and a three
standard deviation reduction in the natural logarithm of the concentration ratio would
produce an actual ratio of 0.35. Therefore, we use a two standard deviation reduction in
the case of the Herfindahl index and a three standard deviation reduction in the case of the
concentration ratio.

18
For the Herfindahl index, the average two standard deviation effect amounts to 14
basis points for the tic inclusive of fee. For the concentration ratio, the average three
standard deviation effect amounts to 34 basis points for the tic inclusive of fee. We view
an average of the two figures for each tic as the best estimate of the impact of inequality in
market shares. Thus, departures from equality in market shares raise the tic inclusive of
fee by 24 basis points.
19
NOTES
1. Bond Buyer. The Bond Buyer 1994 Yearbook. (New York: Thompson Publishing Corporation), 1994.
2. Author’s calculation from various issues of the Bond Buyer yearbook 1988 to 1995, excluding general
purpose bond issues.
3. This procedure is necessary in order to satisfy Internal Revenue Service rules allowing interest
payments to pass to investors free from the federal income tax (i.e., tax advantaged). Tax advantaged
bonds can be issued at lower interest rates than their taxable counterparts. For decades, state and local
government agencies have used the proceeds from bond offerings to finance public healthcare and public
hospital capital projects. However, in a 1963 ruling by the Internal Revenue Service, hospitals classified as
501 (C)-3 private, nonprofit institutions were permitted to issue tax-exempt bonds under the condition that
the hospital transfers ownership to a unit of government when the debt is repaid. Thus, the voluntary
hospital sector could finance capital projects with tax-exempt debt, although the nonprofit hospitals did not
view tax-exempt financings favorably. If hospitals could find a mechanism which would allow tax-exempt
bonds to be issued on their behalf on more favorable terms (than the eventual loss of their facility!), and if
there existed agencies which would issue the bonds, the hospitals would have access to low cost, long-
term financing for large capital projects. Of course, a mechanism was developed, although we have not
seen references to its origins.
4. See for example, Nemes, Judith. "Some Bond Authorities Fight Disclosure Rules," Modern Healthcare,
22, No. 24 (June 15, 1992), 33-34; Nemes, Judith. "Dealing with the Authorities." Modern Healthcare, 21,
No. 41 (October 14, 1991a), 22-29; and Nemes, Judith. "Hospital Bond Deals Often Overpriced-Study."
Modern Healthcare, 21, No. 27 (July 8, 1991b), 40-41. In addition, for a related discussion of a health-care
specific capital construction program see Stern, Stephen J., and Sage, William M. “The California Health

20
Facility Construction Loan Insurance Program,” Municipal Finance Journal 13, no. 1, 1994, 30-50.
However, the agency discussed by Stern and Sage is not an issuing entity for debt and is much narrower
in its scope than, say, the California Health Facilities Authority. It does not, for instance, focus on hospitals.
We wish to thank Stephen Stern and Terry Partington (Deputy Executive Director of the California Health
and Educational Facilities Authority) for their insight into the relationship between CAL-MORTGAGE and
the California Health and Educational Facilities Authority.
5. As other sources of healthcare capital have dwindled, notably philanthropy, internal reserves, and
government grants, tax-exempt debt has become the principal source of capital. For hospitals, in
particular, tax-exempt bonds have become the single-most important source of capital, accounting for
about 70 percent of all hospitals' capital financing. See discussions in Cohodes, Donald R., and Kinkead,
Brian M. Hospital Capital Formation in the 1980s. (Baltimore: Johns Hopkins University Press), 1984;
Elrod, James L., Jr., and Wilkinson, James A. Hospital Project Financing and Refinancing under
Prospective Payment. (Chicago: American Hospital Publishing, Inc.), 1985; and Vladek, Bruce. "Capital
Issues, Capital Punishment," United Hospital Fund President's Letter (May 1987). Moreover, tax-exempt
debt is growing in importance for other institutional healthcare providers such as nursing homes, continuing
care residences, and mental health facilities.
6. Bond Buyer. The Bond Buyer 1994 Yearbook. (New York: Thomson Publishing Corporation), 1994.
7. Note that the data used in this paper are derived from a database we have constructed of all new issues
of municipal securities (new financings and refinancings) from 1980-1993. The data were purchased from
Securities Data Company (SDC) and each bond issue is an observation. The empirical analysis in this
project is based on approximately 6,000 new hospital bond financings (whose proceeds are used to invest
in land, plant, and fixed and moveable equipment) and refinancings (whose proceeds are used to retire

21
existing debt prior to maturity) for the period from 1980 through 1993. Thus the empirical analysis excludes
non-hospital health care bonds, such as bonds for nursing homes, except where indicated. Data on issue
characteristics are merged with hospital, national, state, and local market area characteristics from a
variety of sources. State- and year-specific descriptors of the industry that issues hospital bonds (for
example, the number of issuers and the percentage of real par value accounted for by the four largest
issuers) are constructed from the SDC database. Information on the fees charged by the financing
authorities are taken from a survey of the authorities that was conducted as part of the project. For a more
detailed description of the database, an appendix is available from the authors.
8. Note that the inclusion of Districts is somewhat problematic, since they represent issuers linked
generally to a single hospital. However, Districts share with the other two types of quasi-governmental
issuers the fact that they are sanctioned by state legislatures and they are clearly not pure government
issuers. A further discussion of this issue lies outside the scope of the present study, and since Districts
play a smaller role, particularly with respect to relative par value of total issues, their inclusion in the quasi-
government sector does not significantly change our discussion. In addition, as part of our study, we
implemented a survey of all quasi-public issuers, and our survey includes Districts. Thus all together, we
surveyed 1290 (220+115+955) quasi-government finance authorities for information on: finance activities
and services performed, governance structure, fees and charges, and selection of underwriters. 999 of
these issued bonds for at least one hospital from 1980-1993. The response rate of 36 percent in terms of
issuers was relatively modest. The respondents, however, accounted for 65 percent of all issues done by
the survey universe and for 71 percent of their real par value. These response rates are much more
impressive. They indicate that our survey includes most of the large issuers both in terms of the number of
bond deals and their total par value. Clearly, the small issuers who responded to the survey may not be
representative of the universe of small issuers. The only survey data used for our empirical analysis related

22
to the fees charged by bond issuers and enabled us to compute accurately the cost of capital for each
bond issue.
9. Elrod and Wilkinson, Hospital Project Financing..., pp. 37-38.
10. Brown, Jonathan Betz. Health Capital Financing. (Ann Arbor, Michigan: Health Administration Press),
1988, p.15.
11. Cohodes and Kinkead, Hospital Capital Formation..., p. 19.
12. Sandomir, Richard. “Sports Agency Suggested to Handle Yankees,” The New York Times, Metro
Section, March 28, 1996.
13. The twelve Monopoly states are CO, CT, ID, MA, MD, MT, NH, RI, SD, VT, and WA. The nineteen
states with state-level and local authorities are AZ, CA, DE, GA, IL, IN, KY, LA, MI, MO, MS, NC, NE, NJ,
NY, OK, TX, WI, and WV. The District of Columbia is counted as a state regime in this study.
14. In describing these alternative market structures, we use the terms monopoly and competition because
they are used in the health care finance literature (for example, Nemes 1991a). That is, we attempt not to
use them with prejudice. Indeed, as we discuss in more detail below (and as others have also discussed,
see Grossman, Michael, Fred Goldman, Alec Ian Gershberg, Patricia Kocagil, Paul Thompson, Steven
Renn. Economic Analyses of Health Care Financing Authorities. Final Report, Grant #R01 HS06095-04,
Agency for Health Care Policy and Research, USDHHS, November 1996, Section IV) state health care
finance authorities may compete with other state authorities and state and local governments in monopoly
states. Moreover, as Grossman et al., Economic Analyses... (1996, Section V) point out, economic theory
does not necessarily predict an inverse relationship between the number of issuers in a state and either
fees charged by issuers or interest rates.

23
15. Nemes, "Some Bond Authorities Fight Disclosure Rules," pp. 33-34. We thank an anonymous referee
for pointing out that the issue of potential disclosure is less one of initiation by agencies, state/local
governments, or even the beneficiaries than it is in response to SEC secondary market disclosure
requirements. Yet, the point remains that there has been some attention paid to accountability of quasi-
government finance authorities.
16. Recall that the Quasi-Government issuers were earlier defined as three categories of issuers shown in
Table 1: Districts, State Authorities, and Local or County Level Authorities. The Government Issuers were
defined as State, County, or City/Town/Village government issuers. The analysis thus excludes
Universities, Indian Tribes, and Not-for-Profit Cooperatives. So, while we use the term "Total Health Care
Bond Market" for the aggregate sum of all six categories of issuers, actually this is not quite the case. Still,
given the relatively small size of the excluded issuers, the term seems justified.
17. Remember that, in anticipation of the 1986 tax law changes, 1985 was a very big and important year in
the bond market. 1986 was consequently very light, and the market took a few years to rebound to its 1984
levels.
18. Grossman, Michael, Fred Goldman, Susan Nesbitt, & Pamela Mobilia. "Determinants of Interest Rates
on Tax-exempt Hospital Bonds," Journal of Health Economics, 12 (1993), 385-410. For additional studies
on the determinants of the cost of capital in the health care sector, see Austen, Eileen, Corman, Hope and
LiCalzi, Gregory. "The Determinants of Net Interest Cost in Negotiated Underwriting of Tax-Exempt
Hospital Bonds." American Business Review, 3, No. 2 (Jan.1986), 16-20; Carpenter, Caryl E. "The
Marginal Effect of Bond Insurance on Hospital, Tax-Exempt Bond Yields." Inquiry, 28 (Spring 1991), 67-73;
and Cleverley, William O., and Rosegay, William H. "Factors Affecting the Cost of Hospital Tax-Exempt
Revenue Bonds." Inquiry, 19 (Winter 1982), 317-326.

24
19. For example see Tirole, Jean. The Theory of Industrial Organization. (Cambridge, Massachusetts:
MIT Press), 1988, or Scherer, F. M., and Ross, David. Industrial Market Structure and Economic
Performance. Third Edition. (Boston: Houghton Mifflin Company), 1990.
20. The Herfindahl index ranges from 1 in the case of pure monopoly to 1/nj in the case of nj firms, each of
whom produces the same output. The fewer are the number of firms and the more concentrated output is
among them, the larger is the value of the index.
21. See the appendix for a brief presentation of the model and results. An additional appendix is available
from the authors with an extended exposition of the model and results.
22. Technically, we should probably use the term “deconcentrated” rather than “decentralized,” since it is
entirely possible for a state to have many state-level issuers, which would thus be picked up by the
measures of concentration. However, in practice, deconcentrated states are also decentralized because
they have local issuers. Therefore, the term “decentralization” is also appropriate.
23. This is the present value of the reduced interest cost. For another summary measure of the impact of
concentration on interest rates, we calculate the TIC would fall 31 basis points if each issuer in a state had
approximately the same share in real par value.
24. While this effect may seem modest, it is consistent with some of the work of Robert Bland, who also
has shown that the relationship between issuer experience and interest rates is far from clear cut. Bland,
Robert L. “The Interest Cost Savings from Experience in the Municipal Bond Market,” Public Administration
Review, January/February 1985, 233-237, reports that experience lowers interest rates and argues that
“Not only are experienced issuers better informed, but they will also be better negotiators,” (p. 234) and our
findings are consistent; however, we still find that negotiation raises the interest rate. Roden, Peyton
25
Foster, and Bland, Robert L. “Issuer Sophistication and Underpricing in the Negotiated Municipal Bond
Market,” Journal of Financial Research 9, No. 2, summer 1986, 163-170, also report that issuer
sophistication reduces interest costs. On the other hand, Bland, Robert L. “The Interest Savings from
Optimizing Issue Size and Frequency of Participation in the Municipal Bond Market,” Public Budgeting and
Finance 4, No. 4, Winter 1984, 53-59, suggests that the “greater the supply of bonds bearing the issuer’s
name, the greater amount of search by underwriters for the most willing investors and, thus, the higher the
interest rate.” (p. 53) This is particularly relevant given our measure of issuer’s experience given in the
appendix. However, we do not find that issuer experience as measured by the par value of previous issues
raises the cost of capital. We find that is lowers it. Clearly this is an area for fruitful additional research.
25. For an example of a study that both includes the number of bids and has a relatively small number of
observations, see Simonson, William, and Robbins, Mark D. “Does It Make a Difference Anymore?
Competitive Versus Negotiated Municipal Bond Issuance,” Public Administration Review 56, No. 1: 57-64.

26
Table 1: All Health Care Bond Issues by Issuer Type, 1980-1993
ISSUERTYPE
# ofISSUES
# ofISSUERS
TOTAL REALPAR VALUE(Millions of 1982-4 dollars)
AVERAGE REALPAR VALUE(Millions of 1982-4dollars)
% GENERALOBLIGA-TIONBONDS
% NEGO-TIATED
State 62 9 2248.95 36.273 32.26 51.61
County 1104 427 15095.90 13.674 20.56 79.80
GOVERNMENT
City, Town,orVillage
1384 643 17328.54 12.521 7.37 88.01
District 472 220 6035.17 12.786 40.25 78.39
StateAuthority
2576 115 76035.70 29.517 .58 93.13
QUASI-GOV’T
Local orCountyLevelAuthority
3075 955 59064.48 19.208 2.24 92.46
Indian Tribe 1 1 2.60 2.597 100.00 100.00
University 62 26 2420.10 39.034 3.23 66.13
OTHER Not-for-Profit
Cooper-ative
36 29 662.25 18.396 8.33 75.00
Total/Avg. 8772 2425 178893.68 20.394 7.17 89.06

27
Table 2: Nationally Aggregated Taxonomy of Issuer Types 1980-1993
Year Proportion #1:Quasi-PublicAuthority Share ofTotal Health CareBond Market (%)
Proportion #2:Local AuthorityShare of TotalQuasi-PublicBond Issues (%)
Proportion #3:Local GovernmentShare of TotalGovernmentIssues (%)
Real Par Value ofQuasi-PublicAuthority Issues(millions real $1982-4 )
1980-1993 Avg. 80.3 46.1 93.5 141135.35
1980 69.3 47.5 87.7 2689.5
1981 78.2 48.2 87.3 4362.5
1982 75.9 41.8 72.0 7219.02
1983 74.3 55.1 85.9 7578.71
1984 83.2 53.5 96.5 8314.06
1985 83.1 46.3 98.9 24135.43
1986 82.2 54.0 100 6742.23
1987 76.7 44.1 .93.2 8723.64
1988 79.2 47.2 98.3 8806.25
1989 83.0 39.3 94.4 10385.48
1990 82.7 38.8 97.8 8817.5
1991 80.9 48.1 98.3 10927.32
1992 81.5 44.3 94.1 13460.44
1993 80.1 44.7 95.3 18973.3
28
Table 3: Taxonomy of Issuer Types in Selected States 1980 & 1993
State Proportion #1:Quasi-Public AuthorityShare of Total HealthCare Bond Market (%)
Proportion #2:Local Authority Shareof Total Quasi-PublicBond Issues (%)
Proportion #3:Local GovernmentShare of TotalGovernment Issues(%)
1980 1993 1980 1993 1980 1993
Texas 100 100 100 90.2 n/a n/a
Florida 93.3 69.5 100 100 100 100
Mass. 100 81.7 0 0 n/a 100
R.I. 100 100 0 0 n/a n/a
Conn. 100 97.1 0 0 n/a 100
California 72.8 70.5 100 31.1 100 100
Colorado 80.0 85.6 0 16.4 100 100
Illinois 77.3 92.8 0 0.1 100 100
Indiana 88.4 92.8 100 27.3 100 100
Ohio 0 11.4 n/a 80.2 72.9 88.7
50 state avg. 69.3 80.1 47.5 44.7 87.7 95.3n/a indicates that there were no relevant issues; thus the proportion would be 0/0.

29
Table 4: California -- Taxonomy of Issuer Types, 1980-1993
YEAR Proportion #1:Quasi-PublicAuthority Share ofTotal Health CareBond Market (%)
Proportion #2:Local AuthorityShare of TotalQuasi-PublicBond Issues (%)
Proportion #3:Local GovernmentShare of TotalGovernmentIssues (%)
1980 72.8 100 100
1981 66.7 12.2 100
1982 65.5 14.5 100
1983 68.1 17.2 100
1984 62.4 29.9 100
1985 63.6 19.3 100
1986 88.5 23.1 100
1987 49.5 17.5 100
1988 76.6 19.8 100
1989 76.6 28.6 100
1990 78 18.4 100
1991 61.7 14.1 100
1992 65.8 25.1 100
1993 70.5 31.1 100
30
Table 5: Texas -- Taxonomy of Issuer Types, 1980-1993
YEAR Proportion #1:Quasi-PublicAuthority Share ofTotal Health CareBond Market (%)
Proportion #2:Local AuthorityShare of TotalQuasi-PublicBond Issues (%)
Proportion #3:Local GovernmentShare of TotalGovernmentIssues (%)
1980 100 100 n/a
1981 80.8 100 100
1982 96.6 100 100
1983 100 93.6 n/a
1984 99.3 97.7 100
1985 100 91.9 n/a
1986 93.3 98.2 100
1987 100 97.3 n/a
1988 99.6 84.4 100
1989 97.2 94.8 100
1990 99.8 99.8 100
1991 99.6 99.8 100
1992 100 95.9 n/a
1993 100 90.2 n/a
n/a indicates that there were no relevant issues; thus the proportion would be 0/0.
31
Table 6: Possible Categorization of States by Issuer Type
GOVERNMENT ROLE QUASI-GOVERNMENTROLE
CENTRALIZED Moderate, Strong, orDominant
Moderate, Strong, orDominant
DECENTRALIZED Moderate, Strong, orDominant
Moderate, Strong, orDominant
Table 7: Market Structure OLS Regression Coefficients(Dependent Variable = TIC, including fees charged; t-stat in parentheses)
Regression (1) Regression (2)
Concentration Ratio 0.367(4.84)
Herfindahl Index 0.087(3.34)

32
Table A1Definitions, Means, and Standard Deviations of Independent Variables
(Entire sample of 5,799 issues. First figure is mean; second is standard deviation)A. Issue and Issuer Characteristics
Negotiated(0.910, 0.286)Private placement(0.029, 0.167)
Dichotomous variables that identify negotiated issues and privateplacements, respectively; omitted category pertains to competitiveissues
Call(0.856, 0.351)
Dichotomous variable that identifies callable issues
Put(0.106, 0.308)
Dichotomous variable that identifies putable issues
Fixed(0.883, 0.321)
Dichotomous variable that identifies issues with fixed coupon rates
Length(24.594, 8.882)
Length in years between the date of final maturity and the date of issue
Multi(0.233, 0.423)
Dichotomous variable that identifies issues for multihospital systems
Teach(0.126, 0.332)
Dichotomous variable that identifies issues for hospitals that haveteaching status
Pool(0.058, 0.233)
Dichotomous variable that identifies pooled financings
Rank(10.366, 13.034)
Rank of primary underwriter in terms of total par value of issuesunderwritten; ranges from 1 (highest par value) to 50 (lowest par value)
No rank(0.264, 0.441)
Dichotomous variable that identifies issues in which primary underwriteris not one of the 50 leading underwriters
General(0.074, 0.262)
Dichotomous variable that identifies general obligation bonds
Issuer’s history of real parvalues(707.021, 1486.450)
Total real par value of all previous issues in millions of 1982-84 dollars;includes nursing home and life care issues
B. National CharacteristicsT bond rate(9.032, 1.979)
Yield on 30-year U.S. Treasury bond on week of issue as a percentage
Variability(0.170, 0.114)
Standard deviation of previous variable based on an eight-week periodending with the week of issue
C. State CharacteristicsConcentration ratio(-0.248, 0.280)
Natural logarithm of four largest issuer concentration ratio based on realpar value in issue year; logarithm of fraction of real par value accountedfor by four largest issuers
Herfindahl index(-1.202, 0.820)
Natural logarithm of Herfindahl index based on real par value; logarithmof sum of squared share of each issuer in total real par value
State income tax(0.052, 0.035)
State income tax rate in highest tax bracket as a fraction
Mandatory rate setting(0.102, 0.301)
Dichotomous variable that identifies issues in states with mandatory rate-setting programs

33
Table A1 (continued)
D. County CharacteristicsUnemployment26
(7.274, 3.013)Unemployment rate of persons aged 16 and over as a percentage
Rurali(0.192, 0.384)
Dichotomous variable that identifies rural counties
E. Hospital CharacteristicsMedicare sharei
(0.448, 0.135)Fraction of inpatient days accounted for by Medicare inpatient days
Medicaid sharei
(0.097, 0.092)Fraction of inpatient days accounted for by Medicaid inpatient days
Medicaid share*DRGi
(0.033, 0.064) Medicaid share*otheri
(0.047, 0.082)
Fraction of inpatient days accounted for by Medicaid inpatient daysmultiplied by a dichotomous variable that identifies issues in states usinga DRG reimbursement methodology under Medicaid (MedicaidShare*DRG) and fraction of inpatient days accounted for by Medicaidinpatient days multiplied by a dichotomous variable that identifies issuesin states using a Medicaid reimbursement system with prospective rate ofincrease controls or with negotiation and fixed contracting (MedicaidShare*Other); omitted category pertains to issues in states usingretrospective cost-based reimbursement under Medicaid
Asset ratioi
(2.177, 1.862)Ratio of total assets to total liabilities
Medicare share*PPSi
(0.041, 0.101)Fraction of inpatient days accounted for by Medicare inpatient daysmultiplied by PPS profitability margin (PPS); interacted with adichotomous variable that equals 1 for the years 1984 through 1988since PPS began in October 1983
Operating margini
(0.009, 0.058)Net patient revenue minus operating expenses divided by net patientrevenue
Hospital’s history of real parvaluesi
(63.019, 160.129)
Total real par value of all previous issues in millions of 1982-84 dollars
F. Unknowns
Hospital history of real parvalue unknown(0.141, 0.348)
Hospital name unknown; this variable and the next four are dichotomousindicators
Asset ratio unknown(0.290, 0.454)
Value of the asset ratio is unknown
PPS margin unknown(0.397, 0.489)
Includes cases where PPS margin is known but Medicare share isunknown
Operating margin unknown(0.347, 0.476)
Value of the operating margin is unknown
Other variable unknown(0.279, 0.449)
Identifies issues in which the unemployment rate, the rural indicator, thefraction of Medicare patients days, and the fraction of Medicaid patientdays are unknown; if one variable is unknown, all are unknown
i Mean and standard deviation pertain to issues for which variable is known.

34
Table A2Determinants of Hospital Bond Cost of Capital: OLS Regression Coefficients
(Dependent Variable = TIC, true interest cost, including fees charged)(t-statistic in parentheses, intercepts not shown, n=4,576)
Tic Inclusive of FeeRegressions
(1) (2)A. Issue and Issuer CharacteristicsNegotiated 0.607
(6.87)0.597
(6.74)Private placement 0.816
(5.78)0.804
(5.68)Call 0.081
(1.36)0.084
(1.41)Put -1.173
(-7.01)-1.180
(-7.04)Fixed 1.612
(10.05)1.612
(10.03)Length 0.022
(8.79)0.022
(8.59)Multi -0.086
(-1.77)-0.079
(-1.62)Teach -0.280
(-4.69)-0.283
(-4.74)Pool -0.050
(-0.52)-0.050
(-0.52)Rank 0.008
(4.86)0.008
(4.90)No rank 0.424
(7.55)0.424
(7.54)General -0.616
(-7.35)-0.611
(-7.29)Issuer’s history of real par values -0.00004
(-2.93)-0.00004
(-2.86)B. National CharacteristicsT bond rate 0.820
(63.97)0.822
(64.16)Variability 1.684
(8.41)1.699
(8.47)C. State CharacteristicsState income tax -2.980
(-5.28)-2.831
(-5.02)Mandatory rate setting -0.020
(-0.28)-0.013
(-0.18)Concentration ratio 0.367
(4.84)Herfindahl index 0.087
(3.34)

35
Table A2 (concluded)
D. County CharacteristicsUnemployment 0.017
(2.15)0.016
(2.02)Rural 0.084
(1.33)0.102
(1.63)E. Hospital CharacteristicsMedicare share 0.009
(0.05)-0.001
(-0.01)Medicaid share 1.068
(2.48)1.128
(2.62)Asset ratio -0.027
(-2.13)-0.026
(-2.03)Medicare share*PPS -0.903
(-3.64)-0.872
(-3.51)Medicaid share*DRG -1.452
(-2.79)-1.538
(-2.95)Medicaid share*other -1.207
(-2.62)-1.286
(-2.79)Operating margin -1.274
(-3.08)-1.258
(-3.04)Hospital’s history of real par values -0.0004
(-3.24)-0.0004
(-3.25)F. UnknownsHospital history of real par valueunknown
-0.165(-2.17)
-0.164(-2.16)
Asset ratio unknown -0.203(-1.05)
-0.194(-1.00)
PPS margin unknown 0.041(0.58)
0.046(0.66)
Operating margin unknown 0.292(3.67)
0.296(3.72)
Other variable unknown 0.118(0.52)
0.097(0.43)
R-square 0.717 0.716F-statistic 348.31 347.01