nber working paper series efficiency and equity in schools ... · efficiency and equity in schools...
TRANSCRIPT

NBER WORKING PAPER SERIES
EFFICIENCY AND EQUITY IN SCHOOLS AROUND THE WORLD
Eric A. Hanushek
Javier A. Luque
Working Paper 8949
http://www.nber.org/papers/w8949
NATIONAL BUREAU OF ECONOMIC RESEARCH
1050 Massachusetts Avenue
Cambridge, MA 02138
May 2002
The opinions in this paper do not necessarily represent those of Banco Central de Reserva del Peru. An
anonymous referee provided useful comments that sharpened the analysis. This project was supported by the
Smith Richardson Foundation and the Packard Humanities Institute. The views expressed herein are those
of the authors and not necessarily those of the National Bureau of Economic Research.
© 2002 by Eric A. Hanushek and Javier A. Luque. All rights reserved. Short sections of text, not to exceed
two paragraphs, may be quoted without explicit permission provided that full credit, including © notice, is
given to the source.

Efficiency and Equity in Schools around the World
Eric A. Hanushek and Javier A. Luque
NBER Working Paper No. 8949
May 2002
JEL No. I2, H4, J0
ABSTRACT
Attention to the quality of human capital in different countries naturally leads to concerns about
how school policies relate to student performance. The data from the Third International Mathematics
and Science Study (TIMSS) provide a way of comparing performance in different schooling systems.
The results of analyses of educational production functions within a range of developed and developing
countries show general problems with the efficiency of resource usage similar to those found previously
in the United States. These effects do not appear to be dictated by variations related to income level of
the country or level of resources in the schools. Neither do they appear to be determined by school
policies that involve compensatory application of resources. The conventional view that school resources
are relatively more important in poor countries also fails to be supported.
Eric A. Hanushek Javier A. Luque
Hoover Institution Banco Central de Reserva del Peru
Stanford University Lima, Peru
Stanford, CA 94305
and NBER
Efficiency and Equity in Schools around the World
By Eric Hanushek and Javier Luque
The emphasis on human capital policy that has become a centerpiece of government
programs around the world is now accepted as a natural and enlightened view of policy.
Important contributions by Theodore Shultz, Gary Becker, and Jacob Mincer set the case for the
importance of human capital for individual productivity and earnings, for the distribution of
economic success, and ultimately for the growth of national economies. The implications of this
work has been extended into the developing world by a strong and consistent focus of the World
Bank – propelled in large part by a series of influential studies by George Psacharopoulos. This
work builds on that, considering what countries can do to improve the human capital of their
populations.
The central focus is how systematic policy actions of governments affect student
performance. Building upon the testing and surveys of the Third International Mathematics and
Science Study (TIMSS), we consider specifically how families and schools contribute to within
and between country variations in student performance. We then go beyond this to investigate
whether school in the different countries work to narrow or widen performance differences.
School quantity and quality
Empirical work in human capital has concentrated on the private returns to the quantity
school obtained by individuals. The standard Mincer formulation shows how investment can be
translated into observed differences across individuals (Mincer (1970, 1974)). If investment
declines linearly and if all of the costs of investment are forgone earnings, the simple relationship
between log earnings and years of schooling yields a direct estimate of the rate of return on a year
of schooling. This elegant characterization has the overwhelming virtue that it can be applied
using commonly available data not only for the United States but many countries of the world. In

2
fact, the exploitation of this generalizability provides clear information about the importance of
variations in returns of schooling around different regions of the world (Psacharopoulos (1973,
1981, 1985, 1994)).
The arguments behind government involvement differ somewhat from those for
individuals. Indeed, a general finding that the returns to schooling are high does not necessarily
mean that this is an area for governmental intervention. Intervention is typically justified by
some sort of market failure (such as externalities or credit constraints) or by other goals such as
adjusting the income distribution. In fact, at least for the U.S., education has long been thought of
as a tool for providing skills to disadvantaged individuals in order to improve their income
outcomes. Much of the support for schooling policies internationally also reflects potential gains
in terms of the income distribution.
Recent arguments have also provided other support for government interventions based
on externalities emanating from the growth process. The general endogenous growth model
suggests that the level of education in the economy affects a nation’s growth.1 This structure
induces an externality that individuals will not take into account in their own decision process.
Empirical work has underscored the importance of quantity of schooling in these areas.2
The strongest and most consistent support comes for the relationship between schooling and
individual earnings. While relying on more limited evidence, considerable support also exists for
the importance of schooling in affecting the distribution of earnings and growth.
The central feature of this analysis, however, is how quality of schooling enters. Nobody
believes that all schools within a country or across countries are the same in terms of knowledge
1 The endogenous growth models come a variety of forms; see Nelson and Phelps (1966), Romer (1986, 1990), and Rebelo (1991). 2 Some controversy still exists about the form of growth models and about the importance of endogenous growth models. A variety of approaches have been used to test the underlying models, but important questions remain. See Mankiw, Romer, and Weil (1992); Benhabib and Spiegel (1994); Barro and Sala-I-Martin (1995); Bils and Klenow (2000).

3
imparted and quality in general. Such differences, while often difficult to deal with, have obvious
implications for understanding the basic issues addressed here.
The economic effects of differences in the quality of graduates of our elementary and
secondary schools are much less understood than the effects of quantity, particularly with regard
to the performance of the aggregate economy. The incomplete understanding of the effects of
educational quality clearly reflects difficulties in measurement. Although quality of education is
hard to define precisely, we mean the term quality to refer to the knowledge base and analytical
skills that are the focal point of schools. Moreover, to add concreteness to this discussion, we
will tend to rely on information provided by standardized tests of academic achievement and
ability. Relying on standardized tests to provide measures of quality is controversial—in part
because of gaps in available evidence and in part because of the conclusions that tend to follow
(as discussed below).3 Nevertheless, such measures appear to be the best available indicators of
quality and do relate to outcomes that we care about.
A variety of studies of the labor market focus directly on how individual differences in
cognitive ability affect earnings (and modify the estimated returns to quality).4 The most recent
direct investigations of cognitive achievement have suggested substantial labor market returns to
measured individual differences in cognitive achievement. For example, Bishop (1989, 1991),
O'Neill (1990), Grogger and Eide (1993), Murnane, Willett, and Levy (1995), Neal and Johnson
(1996), Currie and Thomas (2000), and Murnane et al. (2000) each find that the earnings
3A substantial part of the controversy relates to the implications for effectiveness of expenditure or
resource policies, as discussed below. The contrasting view emphasizes measuring "quality" by the resources (i.e., inputs) going into schooling. Most recent along this line is Card and Krueger (1992a); see also the reviews of the discussion in Burtless (1996) and Betts (1996).
4 The early work was subsumed under the general topic of "ability bias" in the returns to schooling. In that, the simple question was whether the tendency of more able individuals to continue in school led to an upward bias in the estimated returns to school (because of a straightforward omitted variables problem). See, for example, Griliches (1974) or Hanushek (1973). More recently, see Blackburn and Neumark (1993, 1995) and Taber (2001). The correction most commonly employed was the inclusion of a cognitive ability or cognitive achievement measure in the earnings function estimates. While focusing on the estimated returns to years of schooling, these studies generally indicated relatively modest impacts of variations in cognitive ability after holding constant quantity of schooling.

4
advantages to higher achievement on standardized tests are quite substantial. These results are
derived from quite different approaches. Bishop (1989) worries about the measurement errors
that are inherent in most testing situation and demonstrates that careful treatment of that problem
has a dramatic effect on the estimated importance of test differences. O'Neill (1990), Bishop
(1991), Grogger and Eide (1993), and Neal and Johnson (1996) on the other hand, simply rely
upon more recent labor market data along with more representative sampling and suggest that the
earnings advantage to measured skill differences is larger than that found in earlier time periods
and in earlier studies (even without correcting for test reliability). Currie and Thomas (2000)
provide evidence for a sample of British youth and rely on a long panel of representative data.
Murnane, Willett, and Levy (1995), considering a comparison over time, demonstrate that the
results of increased returns to measured skills hold regardless of the methodology (i.e., whether
simple analysis or error-corrected estimation). Murnane et al. (2000) provides further evidence of
the effects of cognitive skills (although offers some caution in the interpretation of strength of
effects)
An additional part of the return to school quality comes through continuation in school.
There is substantial evidence that students who do better in school, either through grades or
scores on standardized achievement tests, tend to go farther in school (see, for example, Dugan
(1976); Manski and Wise (1983). Rivkin (1995) finds that variations in test scores capture a
considerable proportion of the systematic variation in high school completion and in college
continuation. Indeed, Rivkin (1995) finds that test score differences fully explain black-white
differences in schooling. Bishop (1991) and Hanushek, Rivkin, and Taylor (1996) find that
individual achievement scores are highly correlated with school attendance. A significant portion
of the effect of early test scores on closing the black-white income gap in Neal and Johnson
(1996) comes through the relationship of achievement on subsequent school attainment.
Behrman et al. (1998) find strong achievement effects both on continuation into college and on
quality of college; moreover, the effects are larger when proper account is taken of the
5
endogeneity of achievement. Hanushek and Pace (1995), using the High School and Beyond
data, find that college completion is significantly related to higher test scores at the end of high
school.
This work, while less complete than might be desired, leads to a conclusion that
variations in cognitive ability, as measured by standardized tests, are important in career success.
Variation in measured cognitive ability is far from everything that is important, but it is
significant in a statistical and quantitative sense.
The linkage of individual cognitive skills to aggregate productivity growth has been more
difficult to establish. There is no clear consensus on the underlying causes of improvements in the
overall productivity of the United States economy, nor on how the quality of workers interacts
with economic growth. The analysis of the impact of schooling quality on cross-country
differences in growth by Hanushek and Kimko (2000), however, suggests that quality may be
very important and could even dominate effects of the quantity of schooling differences across
countries. The concern in such work is the direction of causality. While a series of specification
tests indicates that there is a causal relationship between quality and growth, the exact magnitude
of the effect is open to question.
The available evidence suggests that human capital quality is important. Quality
measured by cognitive achievement tests directly influences individual and aggregate
productivity. Moreover, at least through the growth mechanism and through the redistributive
goals of government, externalities point to a natural role for government. But, even if the
evidence on externalities were ignored, governments around the world are the primary supplier of
educational services. Thus, without having to answer questions about the rational for action, it is
clear that the efficiency and equity of governmental supply are important public policy issues.

6
Resources and measurement
An important issue throughout the discussions of school quality has been the relationship
between outcome measures of quality (earnings, test scores, and the like) and the resources
devoted to schools. This issue has two facets. First, when direct quality measures are generally
not available, can simple measures of the resources devoted to schools be used as a substitute for
a quality measure? Second, if government is to intervene, can it do effectively so by altering the
level and distribution of resources going to schools?
Most of the research attention has actually gone to the latter issue – the relevance of
resources as a policy tool. On that score the U.S. evidence has been reasonably clear. The
resources devoted to schools are not closely or consistently related to student outcomes. While
there has been some controversy over this analysis, the data indicate that a minority of studies
finds significant and positive relationships with performance.5
The general structure of the production function estimation designed to pinpoint causality
has focused on a model such as:
O = f(X, R) (1)
Where O is student outcomes, R is a vector of school resources, and X is a vector of
other inputs into schooling including, importantly, family background of students. The analysis
of causal mechanisms has been focused on separating the various inputs into student
performance.
The proxy question – i.e., whether measures of resources are an indicator of quality
differences regardless of the mechanism – has been looked at separately, although there is
5 For discussions of the basic results of estimation of the effects of resources, see Hanushek (1986, 1997). For discussions of the controversies, see Hedges, Laine, and Greenwald (1994), Greenwald, Hedges, and Laine (1996) and Hanushek (1996).

7
obvious overlap. In this collection, other studies have looked at just the simple resource-outcome
relationship. While these have not been systematically reviewed in the way that the studies
identifying causal factors have, they appear to give somewhat stronger support, at least in the
United States, to the proxy relationship.6 This stronger relationship could simply reflect a
positive relationship between resources and other factors such as might arise if wealthier parents
on average both contribute more directly to performance and put more resources into their
schools.
In the growth setting, there is no direct evidence of the proxy relationship. The attempts
to look at resources tended to give incorrect signs and to be poor proxies (Hanushek and Kimko
(2000)).
Empirical work on quality in an international setting has, however, been even rarer than
in the United States. Few international data sets have had information on outcomes and
resources, although – when available – there seems to be slightly stronger relationships of
resources and outcomes in the production function setting of equation 1 (Heyneman and Loxley
(1983); Hanushek (1995); Vignoles et al. (2000)). When these data have been available, it has
been difficult to summarize because the data sets have tended to be very specialized and to be
very different across studies. And, little is known about the value of proxy relationships across
countries.
International resource-quality estimates
The primary objective of this work is to provide a consistent set of estimates for
educational production functions from a set of developing and developed countries. This analysis
6 In their selective review of studies relating resources to earnings, for example, Card and Krueger (1996) tend to find positive relationship. This review mixes some studies that consider family backgrounds with others, including Card and Krueger (1992b), that do not. Betts (1996) provides a further review of these prior estimates.

8
is made possible by recent international testing and data collection, which provide scores on
common examinations across countries.
Such comparative analysis has been largely precluded in the past, although some work
does exist. Perhaps the largest and most influential study is Heyneman and Loxley (1983). They
analyze data from the Second International Mathematics and Science Study along with other
country specific tests. Their primary conclusion is that resource variations appear to be more
closely related to student performance in developing countries than in the United States (an issue
we return to below).
To put the resource issue into perspective, it is perhaps most useful to begin with
aggregate differences across countries. The comparison of cognitive achievement across
countries capitalizes on seven voluntary international tests of student achievement in mathematics
and science that were conducted over the past three decades. The International Association for
the Evaluation of Educational Achievement (IEA) administered five and the International
Assessment of Educational Progress (IAEP) administered two. 7 The IEA, since its establishment
in 1959, has a long and unique role in developing comparative education research for almost all
aspects of primary and secondary education. On the other hand, the IAEP, starting in 1988, builds
on the statistical techniques and procedures developed in the United States for the National
Assessment of Educational Progress (NAEP), the main national testing instrument in the United
States since 1969. While the IAEP is geared to the U.S. curriculum, the IEA has an international
focus not associated with the curriculum in any particular country.
The concentration on mathematics and science corresponds to the theoretical emphasis on
the importance of research and development activities as the source of growth (e.g., Romer
7 Details of participating countries, test administration, and sample sizes of the testing prior to the mid1990s can be found in Hanushek and Kim (1995). Barro and Lee (2001) expand international quality measures by including reading and literacy scores along with more recent TIMSS data. We do not include reading and literacy because of concerns about valid testing across languages and doubts about putting these scores into a common one dimensional scale with science and mathematics tests. Reading literacy assessments, for example, are available for 30 countries in 1991 (U.S. Department of Education (1995)).

9
(1990)). Able students with a good understanding of mathematics and science form a pool of
future engineers and scientists. At least for the United States, Bishop (1992) provides separate
confirmation of the importance of mathematics in determining individual productivity and
income. Additionally, while some test information exists for other subjects, it cannot be
compared readily with the mathematics and science scores and therefore is not used here.
An overview of the testing results is best seen from figure 1. This figure shows the
country results on each of the math and science tests from the beginning in the early 1960s
through the Third International Mathematics and Science Study in 1995. For this, all of the
scores in each year are normalized to a world mean of 50 (see Hanushek and Kim (1995);
Hanushek and Kimko (2000)). While a different array of countries has participated in the tests,
some sense of the overall pattern can be seen from the figure.8 There is an aggregate tendency for
East Asian countries to perform better and for developing countries to score worse. Nonetheless,
the performance of individual countries does seem to drift to some extent.
The simplest way to view the pattern is to estimate an “international production function”
that pools the data across time and countries. One reason for pursuing this is that the very large
differences in resources across countries offers promise that any real resources effects could be
detected. Here we present the analysis through 1990, as demonstrated by Hanushek and Kimko
(2000).9 Specifically, there is no pattern to scores and resources, at least after controlling for
differences in families over time. Table 1 reproduces the estimated resource effects on
achievement for a sample including all country-years of test data that also had complete input
data. Of the three separate resource measures—expenditure per pupil, proportion of GDP
devoted to public education, and pupil-teacher ratio in primary schools, all three go in the wrong
direction.
8 An alternative approach to setting the international mean is to benchmark the U.S. tests to the scores on the U.S. National Assessment of Educational Progress. In reality, however, this has little impact since the pattern of the NAEP scores mirrors quite closely the pattern of U.S. rankings on math and science scores in figure 1. See Hanushek and Kimko (2000).

Figure 1.
Performance on International Mathematics and Science Examinations
aggr
egat
e te
st s
core
(sca
led)
test year1970 1981 1985 1988 1991 1995
20
50
80
IranIndia
Chile
Thailand
Italy
Belgium
France
NetherlandsUnited States
FinlandUnited Kingdom
Sweden
Germany
AustraliaHungary
New Zealand
Japan
Nigeria
Swaziland
ThailandLuxembourg
United States
Hungary
IsraelCanada
New Zealand
United KingdomSwedenBelgium
FinlandFrance
Hong Kong
Netherlands
Japan
Philippines
Italy
United StatesCanada
FinlandSwedenThailandAustralia
NorwayPoland
KoreaJapan
HungaryNetherlandsSingaporeHong Kong
United Kingdom
United StatesIreland
Spain
CanadaUnited Kingdom
Korea
Mozambique
Brazil
Jordan
Portugal
IrelandSlovenia
United StatesSpain
CanadaUnited Kingdom
Israel
FranceItaly
SSURHungary
TaiwanSwitzerland
KoreaChina
Kuwait
Israel
South Africa
Colombia
Iran
LithuaniaPortugalCyprus
ItalyRomaniaGreeceIcelandSpainLatviaDenmark
ThailandFranceNorway
Russian FederatNew Zealand
GermanyUnited KingdomUnited States
HungarySwitzerland
IrelandCzech Republic
SwedenAustraliaSlovenia
Slovak RepublicAustria
NetherlandsHong Kong
Belgium
Japan
KoreaSingapore
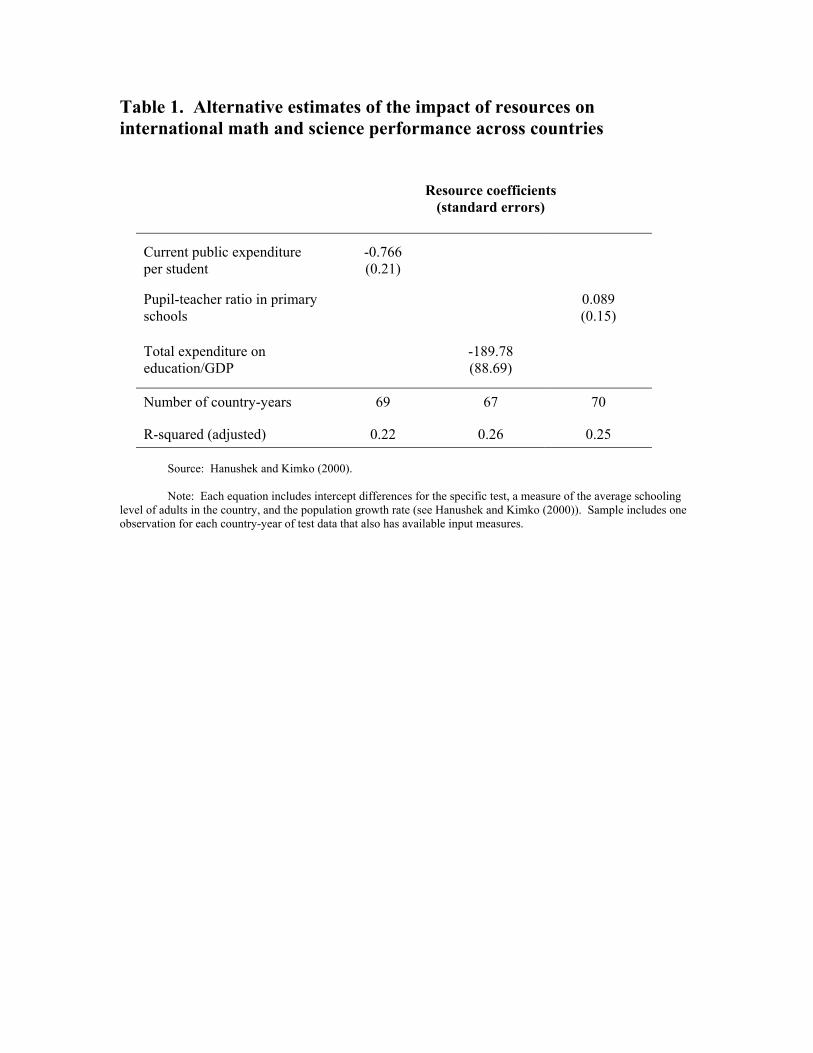
Table 1. Alternative estimates of the impact of resources on international math and science performance across countries
Resource coefficients
(standard errors)
Current public expenditure per student
-0.766 (0.21)
Pupil-teacher ratio in primary schools
0.089 (0.15)
Total expenditure on education/GDP
-189.78 (88.69)
Number of country-years
69
67
70
R-squared (adjusted)
0.22
0.26
0.25
Source: Hanushek and Kimko (2000). Note: Each equation includes intercept differences for the specific test, a measure of the average schooling
level of adults in the country, and the population growth rate (see Hanushek and Kimko (2000)). Sample includes one observation for each country-year of test data that also has available input measures.

10
There are good reasons to be cautious about these results, however, since the simplified
production function estimates do not measure any organizational or structural differences in the
school systems of the various countries. These factors – if important and if correlated with
resources – will bias the estimated coefficients.10 Because these estimates can be biased and
because they can mask substantial within-country variation, we go on to consider variations in
scores for individual countries.
Cross-country estimation has also been conducted for the TIMSS international testing by
Woessman (2000, 2001). He combines the microlevel TIMSS information with data about
characteristics of the overall system – centralization, private school options, unionization, and the
like – and concludes that organizational features and not resources tend to drive country level
performance.
We pursue a different approach. The availability of internationally comparable measures
of quality allows us to study the human capital production function at a country level. In this
study, we focus on what policies seem associated with increased performance on student tests
within each country. Performance will be measured as outcomes on math tests from the Third
International Math and Science Survey (TIMSS). This analysis expands previous evidence, which
was generally available only at a country level, to provide internationally comparable results.
TIMSS Data
This study relies on data from the Third International Math and Science Study (TIMSS),
a testing and data collection program conducted by the International Association for the
Evaluation of Educational Achievement (IEA) in 1995.11 It involved more than 40 countries in
three different targeted populations: 9 year olds, 13 year olds, and 17 year olds. Here we focus
9 The most important point of this estimation is that it excludes the TIMSS data, the subject of this analysis. 10 As Hanushek, Rivkin, and Taylor (1996) discuss in the context of U.S. production function estimates, the aggregation of data to the national level will exacerbate any omitted variables bias.
11
largely on the first and second populations where the country sample is larger and where the data
are more complete. TIMSS involved gathering information about student achievement and
student backgrounds in the different participating countries, as well as teacher and school
characteristics.
The design of TIMSS involved collecting information in each country for 150 schools per
age group. At the school level, the standard procedure was to collect two separate individual
classrooms corresponding to the two adjacent grades with the largest numbers of students of the
target age group. These students were tested, and data about their family backgrounds were
collected. Teachers and principals then supplied information about the students, the teachers, and
the school.
Great care was taken to ensure representative samples of schools and students. There
were nonetheless a number of countries that did not comply with all the TIMSS design in terms
of sample selection. This selective sampling, which was carefully monitored by the IEA, leads to
some doubts about the overall country averages, but it is probably less serious for the analysis
done here. For discussion and analysis, see Marlin and Mullis (1996).
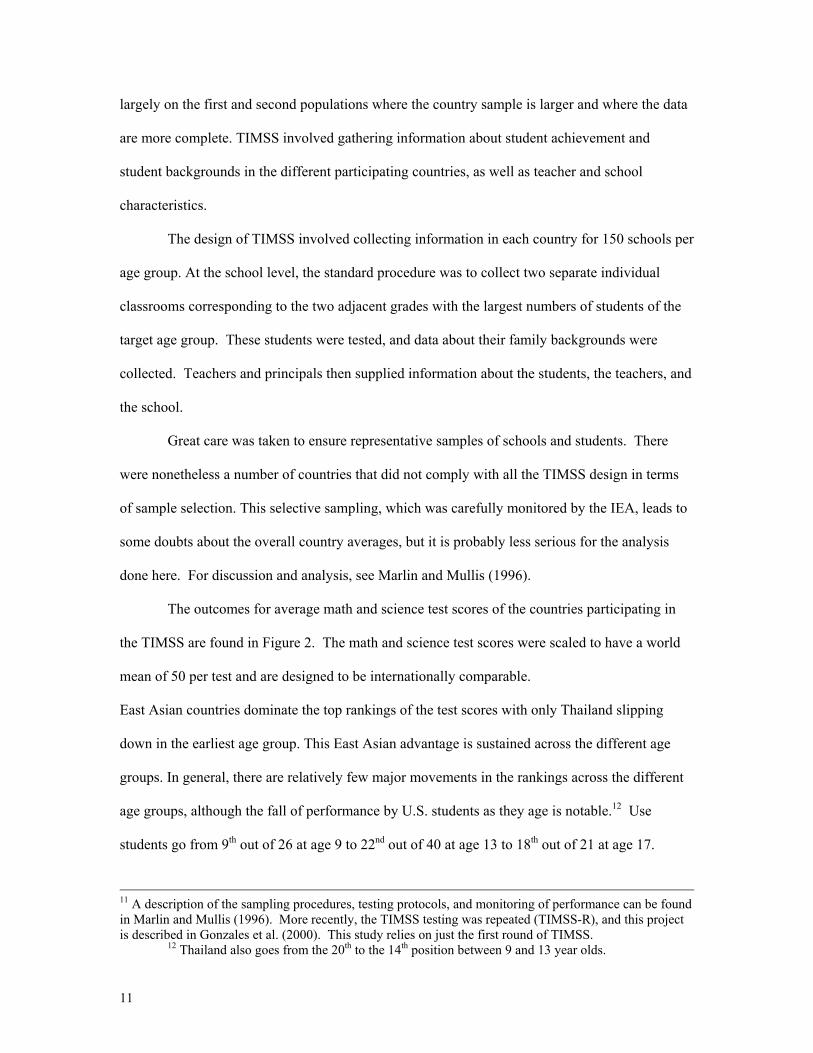
The outcomes for average math and science test scores of the countries participating in
the TIMSS are found in Figure 2. The math and science test scores were scaled to have a world
mean of 50 per test and are designed to be internationally comparable.
East Asian countries dominate the top rankings of the test scores with only Thailand slipping
down in the earliest age group. This East Asian advantage is sustained across the different age
groups. In general, there are relatively few major movements in the rankings across the different
age groups, although the fall of performance by U.S. students as they age is notable.12 Use
students go from 9th out of 26 at age 9 to 22nd out of 40 at age 13 to 18th out of 21 at age 17.
11 A description of the sampling procedures, testing protocols, and monitoring of performance can be found in Marlin and Mullis (1996). More recently, the TIMSS testing was repeated (TIMSS-R), and this project is described in Gonzales et al. (2000). This study relies on just the first round of TIMSS.
12 Thailand also goes from the 20th to the 14th position between 9 and 13 year olds.
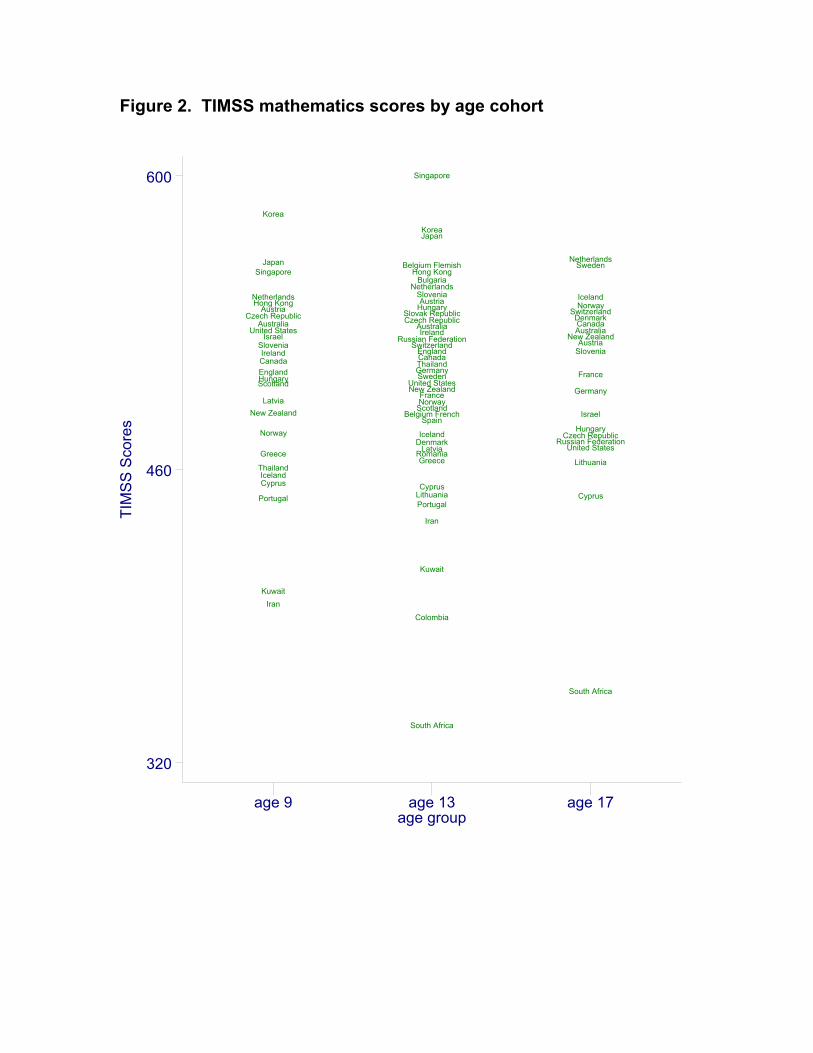
Figure 2. TIMSS mathematics scores by age cohort
TIM
SS S
core
s
age groupage 9 age 13 age 17
320
460
600
IranKuwait
Portugal
CyprusIceland
Thailand
Greece
Norway
New ZealandLatvia
ScotlandHungaryEnglandCanadaIreland
SloveniaIsrael
United StatesAustralia
Czech RepublicAustria
Hong KongNetherlands
SingaporeJapan
Korea
South Africa
Colombia
Kuwait
Iran
PortugalLithuaniaCyprus
GreeceRomaniaLatviaDenmarkIceland
SpainBelgium French
ScotlandNorwayFrance
New ZealandUnited States
SwedenGermanyThailandCanadaEngland
SwitzerlandRussian Federation
IrelandAustralia
Czech RepublicSlovak Republic
HungaryAustria
SloveniaNetherlands
BulgariaHong Kong
Belgium Flemish
JapanKorea
Singapore
South Africa
Cyprus
Lithuania
United StatesRussian Federation
Czech RepublicHungary
Israel
Germany
France
SloveniaAustria
New ZealandAustraliaCanada
DenmarkSwitzerland
NorwayIceland
SwedenNetherlands

12
Education production functions
Most of the public discussion of TIMSS has relied upon national average scores. Here,
however, we employ the extensive school data for each country. The large samples and consistent
data across countries provide an opportunity to compare international schooling experiences of a
wide group of countries.
Our primary goal is assessing the role of school inputs (such as teacher characteristics
and class size) and student background characteristics, on student performance. One objective is
ascertaining the possibility for using pure resource policies in the schools of different countries to
affect labor force quality. The second point of our analysis is consideration in more detail of the
dependence of educational outputs on family backgrounds. Household characteristics have been
found in the U.S. literature to be one of the most important predictors of educational performance.
Does this hold across countries and across different schooling structures?
Our starting point is a standard linear production function defined in terms of
achievement levels. We later consider alternative estimation approaches designed to deal with a
variety of potential problems.
Consider the simple formulation:
cij
cij
cS
cij
cF
ccij SaFaaO ε+++= 0 (2)
where i refers to an individual student, j to the classroom, and c to the country for the student. F
and S are multidimensional measures of family and school factors, respectively. The relationship
is specified to hold for a specific country and age level and aF and aS are country specific
parameters relating the various factors to student outcomes. We aggregate the individuals to a
classroom level, both for data reasons and for conceptual ones.13 The nonschool factors (F)
13 The appropriate way to estimate such models has been the subject of considerable past
discussion. As a general rule, value-added models which contain information about past student performance levels are superior to the level formulations employed here. The TIMSS data, however, do

13
common across the estimation include: geographical location and various aggregations of student
family background such as the percentage of students whose parents have not completed
secondary education or the percentage with various capital goods in the home as a measure of
wealth.14 The school factors (S) considered include: total enrollment, teacher characteristics of
teacher degree level and teacher experience, grade level, and class size.15 Teacher education is
measured by indicator variables for having a bachelor’s degree or having a master’s degree and
by a separate indicator variable for whether or not the teacher had specialized teacher training.
Ordinary least squares are used to estimate the education production functions across classrooms
for each country level and for the 9- and 13-year-old samples separately.
The analysis relies on all countries that have sufficient data for estimation of national
production functions. There are 18 countries for 9-year-olds and 33 countries for 13-year-olds
that have complete data and that are amenable to analysis. Descriptive statistics for the data are
displayed in Appendix Tables A1 and A2.
Basic results
The summary of the production function results is presented in table 2. This table
aggregates the estimated production parameters for school factors (S), which are estimated
separately for each country and age group, to see if there are patterns to international
performance. The summary indicates the sign and statistical significance (10 percent level) of the
not support such estimation. The estimates here rely on a similarity of schooling resources over a student’s career. See Rivkin, Hanushek, and Kain (2001). 14 Family background data can be found from two sources – the student reports when they took the tests or the principal responses about various aggregate characteristics. The data from the two sources differ in detail and scope. Our analysis has considered both sources of data, and the overall results are not affected much by the source of data. Nonetheless, the school-based data are available for a smaller set of countries, so we present results just for the analysis based on individual student information about family background. 15 The age groups can be sampled at different grade levels, and this is controlled for by inclusion of a grade level dummy variable. The estimated models also include dummy variables for rural and urban areas. The class size measure comes from the teacher survey and pertains to the actual size of the specific classroom. At times some of the family or school information is missing, and we include a dummy for these cases with no information in order to not diminish the overall sample size in each country.

Table 2. Distribution of estimated production function parameters across countries and age groups, by sign and statistical significance (10 percent level)
Dependent variable: classroom average TIMSS mathematics score Age 9 population Age 13 population Negative Positive Negative Positive
Significant Not significant
Not significant Significant
Number of
countries Significant Not significant
Not significant Significant
Number of
countries
Class Size 3 11 2 0 17 2 8 6 17 33
Teacher with at least a bachelor’s degree
0 3 12 0 15 2 11 12 2 32
Teacher with special training 0 7 4 1 12 0 12 11 2 25
Teacher experience 0 7 6 4 17 3 9 17 4 33
School enrollment 0 9 5 3 17 2 9 15 6 32
Note: Bold indicates the number of statistically significant results with the expected sign of the effect. Because these estimates rely on actual class size, its expected sign is negative while the estimates for teacher education and experience have an expected positive sign. No clear expectation exists for school enrollment

14
estimated parameters.16 Entries in bold indicate parameters that are statistically significant and
that have the expected sign.17 Prior analyses, done mostly for the USA, show small or no impact
of the common school inputs on educational outcomes. Does that hold for alternative systems
with varying organizational structure and incentives?
The results in Table 2 provide a slightly stronger indication of an association between
resources and student performance than found in the United States, although the estimates lack
the precision needed to have much confidence in any effects. We begin our description with the
estimated class size effect. Class size effect seems to have a different pattern at the different ages
and grades. For the younger age group, smaller classes have the expected negative sign in 14 out
of 17 countries, but the effect is statistically significant (at the 10 percent level) for just three
countries. The effect on the 13-year-olds is different. In over half of the countries the impact is
positive and statistically significant with only 2 countries showing a negative and statistically
significant effect. On the basis of sign of effect, these results are in line with the literature that
stresses the impact of smaller classes for younger children, although the imprecision of the
estimates introduces considerable uncertainty. We are interested in the causal effects of lowering
class sizes, but a possible explanation for the positive results is the use of compensatory policies
that place lower achieving students in smaller classes. We return to consider that possibility in the
next section.
The level of teacher’s education, measured by whether or not the teacher has at least a
university degree, provides little consistent impact on student performance. For the younger age
group, the estimates tend at least to be positive, but none are statistically significant even at the 10
percent level. For older group, positive and negative results are evenly distributed. Importantly,
16 Because of the relatively small samples for each country – typically around 300 classrooms for each age group, a loose 10 percent significance level is used throughout in an effort to provide added information about the distribution of results. 17 The estimated parameters include total enrollment in the school, but there are no clear expectations for the sign of this variable. Note that parameter estimates are obtained for varying numbers of countries, reflecting the fact that some countries did not report complete information. Further, when specific

15
policy generally dictates more education for teachers of older children. The second measure of
teacher preparation is an indicator variable for whether the teacher had specialized teacher
training (in addition or in place of a university degree). There is little indication that this
specialized training has any impact, although the variations in its definitions across countries
make aggregation of these results difficult. However it is organized in the various countries it
appears to have little impact on classroom success of teachers.
The teacher experience effects tend to be skewed toward positive achievement, ignoring
statistical significance. But only a small number of the estimates are significant even at the 10
percent level for either age group. Total school size tends to be positively related to performance
in the older age group, although there is a large variation across countries. Note that this finding
is not simply a reflection of schools in isolated or rural areas, because all regressions include an
indicator of geographic region.
In addition to the school factors, a variety of family background measures are included.
These results (not shown) are quite consistent across countries. Children from favored families
(indicated by separate measures of having more than 25 books at home, a calculator, a computer,
a study desk, or a dictionary) consistently perform better. Additionally, living with their mother;
and, for the older age group, having a mother and father with at least secondary education also
contribute positively to achievement. (Parental education measures are unavailable for the
younger group). We return below to the persistence of educational effects across generations.
Interestingly, the pattern of results for the school resource factors is virtually unchanged
when the family background factors are ignored (not shown). In other words, even if thinking
just about proxying overall quality differences of inputs by simple measures of schools, use of the
school resource measures is not successful.
variables were missing for individual schools, a dummy variable indicating missing data was included in the estimation.

16
Diminishing Returns?
Given the substantial variation in education and degree level of teachers across countries,
it is useful to see whether the pattern of student achievement results is related to the overall level
of training. In particular, having a university degree might be more important in a country where
a minority of teachers complete a degree than in a country where all teachers have degrees. Table
3 displays the training of teachers in each country (ranked by increasing prevalence of a
university degree) along with the estimated effects on student performance. The results show no
pattern of impacts related prevalence of degree or substitution of teacher training for university
degrees.
The preceding estimation also aggregates the results from a wide variety of countries –
rich and poor along with those having large and small initial class sizes. This aggregation could
potentially mark important and systematic differences across countries. For example, rich
countries that devote considerable resources to their schools may find diminishing marginal
returns to added resources, while those with relatively few resources devoted to schools may find
that added resources have large effects.
Two different investigations suggest that differential effect of resources across countries
by current level of development is not the predominant factor in the array of results. As shown in
Figure3, the estimated effects of class size reductions are not systematically larger in poorer
countries (as measured by GNP/capita). For 13 year olds (not shown), there is a slight positive
relationship between income and the size of the coefficient, but the vast majority shows positive
rather than the hypothesized negative effect. Thus, while the data are thin for very poor countries,
there is no apparent differential effect by level of national income. Similarly, a similar exercise
suggests that there is a small positive relationship between average class size and the class size
coefficient when looking across countries for the younger age group.

Table 3. Distribution of Teacher qualifications and Estimated Effect on Outcomes
Note: a. Statistical significance: * .10 level; ** .05 level; *** .01 level
Level of qualifications Estimated effect on student performance
University degree Specialized teacher training
University degree
Specialized teacher training Sign Signif.a Sign Signif.a
Age 9 Slovenia 4% 100% + Iran 7% 86% - + * Netherlands 10% 100% + Norway 10% 95% + - *** Greece 14% 100% + Cyprus 18% 84% + - Hong Kong 25% 64% + - New Zealand 29% 99% + - Scotland 32% 99% - *** - *** Portugal 36% 93% - + Iceland 53% 94% + - *** Ireland 58% 89% + - Czech Republic 66% 100% + Latvia 77% 99% + - Canada 82% 98% - + United States 100% 96% + Age 13 Slovenia 5% 92% - *** - *** Netherlands 23% 88% - *** - *** Norway 31% 96% - *** - *** Iceland 41% 90% - + Romania 43% 92% + + Switzerland 47% 92% - + Russian Federation 48% 98% - + Sweden 51% 68% + - England 54% 80% - *** - *** France 58% 53% - - Hong Kong 59% 54% - *** - *** Thailand 61% 93% - * - New Zealand 63% 96% + - Spain 65% 10% - + Colombia 73% 93% + - Canada 83% 99% - *** - *** Latvia 83% 94% + - *** Cyprus 83% 79% + - United States 85% 97% + - Lithuania 85% 98% + * - Scotland 87% 100% - Ireland 92% 95% - ** + ** Portugal 94% 68% - + Czech Republic 96% 98% + - Korea 98% 100% + Slovak Republic 98% 99% - + Greece 99% 13% + + *
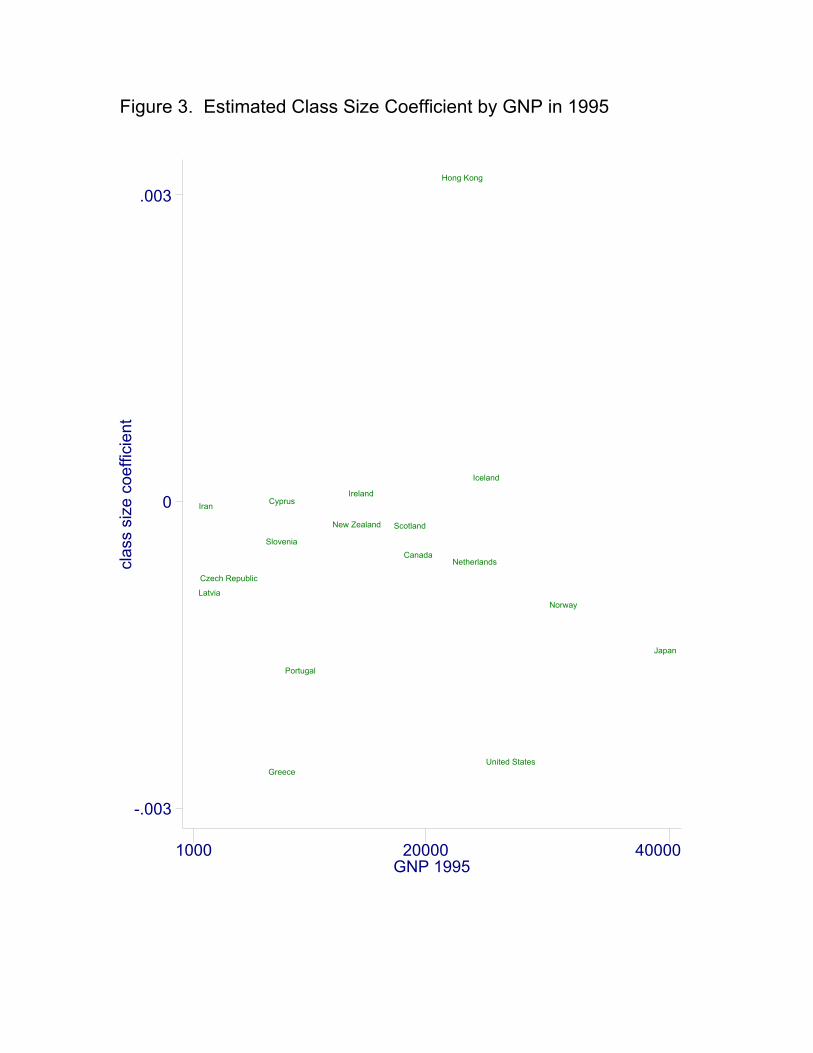
Figure 3. Estimated Class Size Coefficient by GNP in 1995
clas
s si
ze c
oeffi
cien
t
GNP 19951000 20000 40000
-.003
0
.003
Canada
Cyprus
Czech Republic
Greece
Hong Kong
Iceland
IranIreland
Japan
Latvia
Netherlands
New Zealand
Norway
Portugal
Scotland
United States
Slovenia

17
In general, the data provide little support for the thesis that diminishing marginal returns
are driving the results.
Selection and compensatory policies
The general lack of support for the importance of class size, including the large number
of estimates with the wrong sign, could simply reflect active assignment policies within schools.
In particular, if principals tended to place students who have specific problems or are simply
doing poorly in smaller classes, these compensatory placement policies could yield results with
the incorrect sign. In such case, being in a small class may simply identify prior poor performance
as recognized by the principal. Of course, others have identified an opposite relationship –that
families with greater wealth buy superior schools with smaller class sizes.
A variety of approaches have previously been used to deal with such problems. The
simplest and most straightforward has been estimation of value-added models. In these,
achievement at any point in time is related to prior achievement along with the flow of family and
school resources. Since the prior achievement captures the incentive for compensatory policies
unless assignment is based on things not captured by prior achievement, the impact of class size
can be directly estimated. This approach, however, does not lead to stronger results for class size
effects in the United States (see Hanushek (1997, 1999)). An alternative approach has been the
use of various versions of instrumental variables. These include school level class size in
Akerhielm (1995) and specific demographic interactions (Angrist and Lavy (1999); Hoxby
(2000)). Case and Deaton (1999) in an alternative approach rely on arbitrary decision making by
whites for black schools in South Africa. The evidence from past instrumental strategies is,
again, mixed, although there tend to be more estimates of the expected direction.

18
The requirements for appropriate instruments are typically difficult to meet, and the
results tend to hold just for specific circumstances.18 Nonetheless, while instrumental variables
approaches have conceptual appeal, within these international estimates using the TIMSS data it
is difficult to find suitable instruments.19
To understand the potential for estimates deriving from compensatory placement, we
employ two alternative but complementary strategies. First, we consider schools where
compensatory placement is not feasible. Specifically, by looking at just rural schools –ones that
are much more likely to have only a single classroom in a given grade – we can isolate the impact
of class size variation per se. Simply put, if there is not a possibility of allocating students across
classrooms, the class size cannot be a reflection of assignment. Second, by including a variable
indicating whether the classroom is identified by the principal as being smaller than the average
for the grade, we are able to remove the average achievement effect of compensatory setting (if in
fact compensatory allocations prevail). We can then observe the impact of class size adjusted for
average compensatory policies within schools.
Table 4 (9 year olds) and 5 (13 year olds) display the results of these two investigations
of by country. While the overall pattern of estimated class size effects is very similar, these
alternative approaches yield a few changes. For the younger students in Table 4, negative impacts
of larger classes become statistically significant in the rural schools of Canada and Slovenia and,
in Hong Kong, the estimate goes from positive significant to negative significant. On the other
hand, Cyprus becomes positive and significant for rural schools. The precision of estimates also
falls in several countries. For the older students in Table 5, some positive effects turn into
18 An appropriate instrument must be correlated with the variable of interest (here, class size) but uncorrelated with the selection rule of schools in terms of unmeasured achievement. Angrist and Lavy (1999), for example, make use of a peculiarity in Israeli schooling policy (“Maimondides’ rule”) in order to look exogenous variations in class size. Hoxby (2000) capitalizes the “lumpiness” of classrooms to observe variation in class size induced to demographic differences. 19 Woessman and West (2002) use an instrumental approach in an alternative recent analysis of the TIMSS data. They rely on grade average class size instead of the number of students in the specific tested classroom along with removing a school fixed effect to deal with school selection.

Table 4. Sign and statistical significance of alternative estimates of class effects allowing for compensatory placement, age 9 cohort
Full sample Rural sample Within school small classesa
Sign
of c
lass
si
ze e
stim
ate
Stat
istic
al
Sign
ifica
nceb
Sign
of c
lass
si
ze e
stim
ate
Stat
istic
al
Sign
ifica
nceb
Sign
of s
mal
l cl
ass
indi
cato
r
Stat
istic
al
Sign
ifica
nceb
Sign
of c
lass
si
ze e
stim
ate
Stat
istic
al
Sign
ifica
nceb
Canada - - ** - ** - * Cyprus - + * + + Czech Republic - - - * - Greece - ** - - - ** Hong Kong + *** - *** - ** + *** Iceland + - - + Iran - + - *** - Ireland + + - - Japan - *** - + - * Latvia - - - - Netherlands - - + - * New Zealand - + + + Norway - - + - Portugal - + - - Scotland - - + + United States - *** - * - - *** Slovenia - - ** - - Notes: a. Estimates based on full sample with inclusion of an indicator variable for whether the classroom has fewer students than the average for the grade. b. Statistical significance: * .10 level ** .05 level
*** .01 level
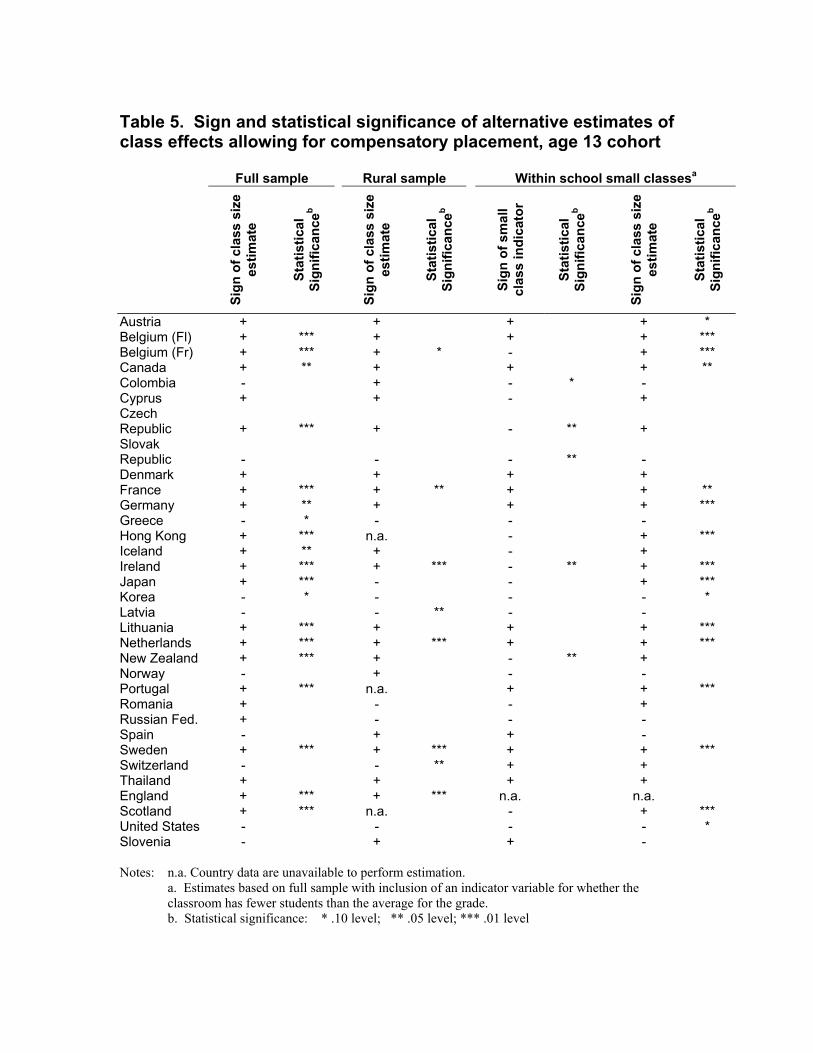
Table 5. Sign and statistical significance of alternative estimates of class effects allowing for compensatory placement, age 13 cohort
Full sample Rural sample Within school small classesa
Sign
of c
lass
siz
e es
timat
e
Stat
istic
al
Sign
ifica
nceb
Sign
of c
lass
siz
e es
timat
e
Stat
istic
al
Sign
ifica
nceb
Sign
of s
mal
l cl
ass
indi
cato
r
Stat
istic
al
Sign
ifica
nceb
Sign
of c
lass
siz
e es
timat
e
Stat
istic
al
Sign
ifica
nceb
Austria + + + + * Belgium (Fl) + *** + + + *** Belgium (Fr) + *** + * - + *** Canada + ** + + + ** Colombia - + - * - Cyprus + + - + Czech Republic + *** + - ** + Slovak Republic - - - ** - Denmark + + + + France + *** + ** + + ** Germany + ** + + + *** Greece - * - - - Hong Kong + *** n.a. - + *** Iceland + ** + - + Ireland + *** + *** - ** + *** Japan + *** - - + *** Korea - * - - - * Latvia - - ** - - Lithuania + *** + + + *** Netherlands + *** + *** + + *** New Zealand + *** + - ** + Norway - + - - Portugal + *** n.a. + + *** Romania + - - + Russian Fed. + - - - Spain - + + - Sweden + *** + *** + + *** Switzerland - - ** + + Thailand + + + + England + *** + *** n.a. n.a. Scotland + *** n.a. - + *** United States - - - - * Slovenia - + + - Notes: n.a. Country data are unavailable to perform estimation.
a. Estimates based on full sample with inclusion of an indicator variable for whether the classroom has fewer students than the average for the grade. b. Statistical significance: * .10 level; ** .05 level; *** .01 level

19
negative, but not significant (Japan, Romania and Russian Federation). In general the positive
results become less significant in the smaller samples of rural schools.
The identification of class sizes that are below the grade average provides an indication
of the tendency toward compensatory policies in each country. Across all countries at the
different grade levels, the estimated effects are almost evenly split between compensatory and
“elitist” placement, but the statistically significant differences favor compensatory placement.
Four of 17 countries for the younger age group and five of 32 countries for the older age group
show lower achievement in the classrooms with smaller than the grade average for the school
class sizes (holding constant the class size). Importantly, identification of such within school
placements does little to change the sign or significance of the estimated class size effects.
These alternative approaches to assessing the importance of compensatory class size
policies do not indicate that the overall results are heavily influenced by selection effects. Thus,
other explanations must be found for the patterns of results, particularly the predominantly
perverse effects found for the samples of 13-year-olds.
Families and Schools
One issue of some significance is how the education systems of various countries impact
on the distribution of outcomes. The results here, mirroring those in most other studies, show that
family background exerts a very strong effect on student performance. Students from
disadvantaged families and from families where the parents themselves have less education tend
to systematically perform worse on the TIMSS tests than do students who do not have those
deficits.
Heyneman and Loxley (1983) focused attention on the relative importance of family
background and school factors. In this work, which parallels that of Coleman et al. (1966), they
compare the amount of variance explained by family background with that explained by school
factors. Their analysis suggests that measured school resources explain a considerably higher

20
proportion of the variance in poor countries, leading them to conclude that school resources are
more important in developing countries.
In table 6, we reproduce their analysis for the consistent database from TIMSS.
Heyneman and Loxley (1983) approach the problem by looking at the marginal addition to
explained variance that is provided by school factors. In other words, employing the methodology
of Coleman et al. (1966), they first remove all of the variance in test scores that can be attributed
to family backgrounds. They then add school factors and look at the addition to explained
variance (column 1). In their analysis, the latter is a substantial percentage of the total explained
variance (column 3). When we do a similar analysis as shown in the next to last column (lower
bound of variance explained by school factors), we do not reproduce their results. First, the
proportion explained by the addition of school factors is relatively modest, particularly for the
sample of 9 year olds. Second, there is no clear relationship with income of the countries. The
countries have been ordered from poorest to richest, but there is not a simple monotonic pattern in
the relative importance of school factors.
Substantial criticism was leveled at the original Coleman Report for this methodology
(e.g., Hanushek and Kain (1972)). Specifically, this methodology attributes any “common
explained variance” to family factors. In other words, when family and school factors are
positively correlated, the first regressions with only family variables include the effect of family
background plus a portion of the schools effect that is proxied by the collection in family factors.
The importance of such correlation is shown by column 2 and by the final column (upper bound
of variance explained by school factors). In column 2, family factors are ignored, effectively
reversing the calculation by attributing all of the common explained variance to school factors.
When this is done, school factors appear to explain a majority of the total explained variance in
most countries.

21
Importantly, regardless of how the calculations are done, there is no clear pattern by
wealth of the country. In other words, it does not appear that school resources are differentially
important in poorer countries.
A more fundamental problem with this approach is the reliance on comparisons of
explained variance to derive conclusions about the importance of resources. The variance
explained by a set of regressors combines information about the impact of each factor (i.e., its
coefficient), the correlation with other inputs, the observed variance of each, and the observed
variance of the test score outcomes. The latter three factors are a function of the particular sample
and institutional structure. For example, if all of the schools in a country had precisely the same
class size, class size could not explain any of the observed variance in test scores – regardless of
how important class size might be for student learning. Similarly, if student backgrounds showed
relatively little variation within a country, families would offer little explanation for test score
variations even though they were very important.
A more subtle issue also arises, since concentration on explained variance neglects
consideration of how school resources are estimated to affect performance. For example, the
previous summaries of the estimated parameters (table 2) showed that 17 out of the 33 estimates
for class size effects for the age 13 population were positive. A number of these are statistically
significant, and, while they will contribute to the test score explanation, this evidence would
hardly be appropriate for arguing about the importance of school resources in developing
countries.20
A slightly different issue is whether the schooling system tends to reduce achievement
gaps found at entry to schooling. Specifically, if we take the distribution of achievement at entry
20 An alternative approach to assessing the role of measured school resources is to compare their impact to some objective standard such as the academic deficit of disadvantaged students. Our estimates allow us to calculate the percentage change in achievement that can be expected from a reduction in class size. These can be compared to average difference in performance for disadvantaged students (measured according to our SES measures). The estimates uniformly show unrealistically large changes in resources to eliminate the gaps. For example, the best cases for class size reduction imply a necessity to reduce class size by ten

Table 6. Additional Explanatory Power of School Inputs (Countries ordered by increasing GDP/capita)
Variance explained by school
factors (∆R2) Importance of school factors
Entered after
family Entered before
family
Total explained
variance (R2) Lower bound Upper bound (1) (2) (3) (1)/(3) (2)/(3) Age 9 Iran 0.01 0.47 0.68 1% 69% Latvia 0.03 0.32 0.55 5% 59% Czech Republic 0.03 0.39 0.49 6% 79% Slovenia 0.02 0.50 0.64 2% 78% Cyprus 0.07 0.58 0.61 11% 95% Greece 0.02 0.39 0.57 3% 68% Portugal 0.03 0.24 0.49 7% 48% New Zealand 0.01 0.22 0.62 2% 35% Ireland 0.02 0.41 0.67 3% 61% Scotland 0.01 0.36 0.59 1% 62% Canada 0.02 0.36 0.54 4% 65% Hong Kong 0.04 0.51 0.66 6% 77% Netherlands 0.04 0.60 0.68 5% 88% Iceland 0.01 0.45 0.56 1% 81% United States 0.03 0.30 0.66 5% 45% Norway 0.01 0.56 0.68 1% 82% Japan 0.02 0.63 0.67 3% 94% Age 13 Romania 0.07 0.19 0.39 17% 49% Lithuania 0.05 0.38 0.54 9% 71% Colombia 0.05 0.20 0.62 8% 32% Russian Federation 0.04 0.17 0.40 9% 42% Latvia 0.03 0.21 0.34 8% 61% Thailand 0.11 0.44 0.56 19% 79% Slovak Republic 0.04 0.29 0.46 9% 62% Czech Republic 0.02 0.24 0.58 4% 42% Slovenia 0.01 0.36 0.57 2% 63% Cyprus 0.02 0.33 0.69 3% 47% Greece 0.04 0.37 0.67 6% 56% Korea 0.03 0.42 0.63 5% 68% Portugal 0.05 0.36 0.58 8% 62% Spain 0.02 0.34 0.61 3% 56% New Zealand 0.03 0.21 0.58 5% 36% Ireland 0.11 0.32 0.55 21% 57% England 0.19 0.22 0.36 54% 61% Scotland 0.08 0.26 0.57 14% 47% Canada 0.05 0.19 0.32 15% 59% Hong Kong 0.15 0.30 0.66 22% 45%

Sweden 0.14 0.29 0.43 32% 67% Netherlands 0.11 0.45 0.70 16% 64% Belgium (Fl) 0.05 0.21 0.52 9% 40% Belgium (Fr) 0.07 0.37 0.72 10% 52% Iceland 0.05 0.22 0.36 14% 62% France 0.05 0.36 0.54 9% 66% Austria 0.04 0.21 0.33 11% 64% United States 0.02 0.11 0.45 4% 23% Germany 0.02 0.22 0.75 3% 30% Denmark 0.09 0.44 0.51 18% 87% Norway 0.05 0.42 0.57 9% 74% Japan 0.10 0.36 0.41 25% 88% Switzerland 0.03 0.19 0.45 6% 42%

22
to school to reflect just nonschool factors, does schooling provide a set of independent inputs that
become increasingly important and reduce the impact of families? The presence of two adjacent
cohorts at different points in the schooling process allows an evaluation of the impact of schools
on the link between family characteristics and educational outcomes. To look at the effect over
time of families, we normalize the test scores for each age group to have a mean of 0 and standard
deviation of 1. We then pool the age 9 and age 13 cohorts and test whether the family background
effects are the same across ages.21 The results change slightly depending on which family
background measure is used, the effect for the presence of 25 or more books at home is
illustrative. For seven of the twelve countries (those with sufficient data for the estimation), the
differential effects of family inputs indicate a significant lessening influence of families (Canada,
Czech Republic, Hong Kong, Iceland, Ireland, Latvia, New Zealand, and Norway). The only
country that significantly goes in the opposite direction is Portugal. These results generally hold
up for other measures of family wealth or home environment.
Conclusions Strong evidence indicates that quality of human capital is very important for individual
success and for nations as a whole. Until recently, however, it has been difficult to look at quality
across nations in a consistent manner. Most of the evidence about the determination of quality
has been restricted to the United States. The availability of a common performance measurement
for students in different countries permits an investigation of the operations of school systems in
up to 37 countries.
This analysis considers policies that might be used to promote higher quality schools
within countries. The particular emphasis is the power of resource policies such as improving
or more standard deviations in order to close the achievement gap between poor and the rest of the countries.
23
teacher education or reducing class sizes. These policies have proven ineffective in the United
States, but this situation does not necessarily hold elsewhere. If there are diminishing marginal
impacts of school resources, the United States could simply be working on a “flat” portion of the
production function, while other countries might not be.
Across the sampled TIMSS countries, the overall strength of resources in obtaining better
student performance appears rather limited, but it is more positive than in the corresponding
analyses of U.S. achievement. Certain countries also do stand out as having significant effects,
and these should be investigated in more detail. Nonetheless, the results defy many
generalizations. It simply does not appear to be the case that outcomes related to school resource
differences are more positive in the poorer countries or in the countries that begin with lower
levels of resources.
A common concern from this estimation is that the estimated effects might simply be an
artifact of direct policy actions in different nations. The strongest potential case involves class
sizes. If schools systematically use reduced class size in a compensatory manner to make up for
past learning difficulties of individual students, a positive relationship between class size and
student performance could simply reflect the selection of students and not the true causal impact
of reduced class size. To investigate this possibility, two separate approaches are used. First,
because rural schools tend to be small and tend to have a single class in each grade, the ability to
allocate students in a compensatory manner is sharply limited. Estimation of models just for rural
schools provides no more general support for class size policies than the prior estimation across
all schools. Second, the principal of schools identified if the particular sampled classroom had a
class size below average for the grade in the school. We separate out the average achievement
differences for within-school small classrooms and then investigate the impact of class size
21 In a separate analysis, we also calculate coefficients of variation for each country and age group. While overall these show no narrowing of the distribution, these measures are subject to the underlying variation of test measurement and thus are difficult to interpret.

24
differences. While a number of countries appear to place lower achieving students in small
classrooms, allowing for this does not change the pattern of class size effects.
Looking beyond simple resource policies appears necessary. Variations in performance
across countries do suggest that a variety of organizational and incentive issues are likely to be
more important than concentration on just resources to schools, a result supported by Woessman
(2000, 2001).
Finally, we investigate whether the schooling systems in various countries appear to
ameliorate the impact of poorer family backgrounds. It has been conventionally held, particularly
following Heyneman and Loxley (1983), that schools and school resources are more important
than families in developing countries. Our analysis, using alternative methods, does not support
the notion that school resource impacts vary systematically with country income or development.
Further, when we investigate the impact of family backgrounds comparing younger with older
students, we find mixed evidence that the impact of families tends to decline with age. This
analysis is, nonetheless, relatively imprecise and should not be taken as conclusive.
References Akerhielm, Karen. 1995. "Does class size matter?" Economics of Education Review 14,no.3
(September):229-241. Angrist, Joshua D., and Victor Lavy. 1999. "Using Maimondides' rule to estimate the effect of class size on
scholastic achievement." Quarterly Journal of Economics 114,no.2 (May):533-575. Barro, Robert J., and Jong-wha Lee. 2001. "International data on educational attainment: Updates and
implications." Oxford Economic Papers 53,no.3 (July):541-563. Barro, Robert J., and Xavier Sala-I-Martin. 1995. Economic Growth. New York: McGraw-Hill, Inc. Behrman, Jere R., Lori G. Kletzer, Michael S. McPherson, and Morton Owen Schapiro. 1998. "The
microeconomics of college choice, careers, and wages: Measuring the impact of higher education." Annals of the American Academy of Political and Social Science 559(September):12-23.
Benhabib, Jess, and Mark M. Spiegel. 1994. "The role of human capital in economic development:
Evidence from aggregate cross-country data." Journal of Monetary Economics 34,no.2:143-174. Betts, Julian R. 1996. "Is there a link between school inputs and earnings? Fresh scrutiny of an old
literature." In Does money matter? The effect of school resources on student achievement and adult success, edited by Gary Burtless. Washington, DC: Brookings:141-191.
Bils, Mark, and Peter J. Klenow. 2000. "Does schooling cause growth?" American Economic Review
90,no.5 (December):1160-1183. Bishop, John. 1989. "Is the test score decline responsible for the productivity growth decline?" American
Economic Review 79,no.1:178-197. ———. 1991. "Achievement, test scores, and relative wages." In Workers and their wages, edited by
Marvin H. Kosters. Washington, DC: The AEI Press:146-186. ———. 1992. "The impact of academic competencies of wages, unemployment, and job performance."
Carnegie-Rochester Conference Series on Public Policy 37(December):127-194. Blackburn, McKinley L., and David Neumark. 1993. "Omitted-ability bias and the increase in the return to
schooling." Journal of Labor Economics 11,no.3 (July):521-544. ———. 1995. "Are OLS estimates of the return to schooling biased downward? Another look." Review of
Economics and Statistics 77,no.2 (May):217-230. Burtless, Gary. 1996. Does money matter? The effect of school resources on student achievement and adult
success. Washington, DC: Brookings. Card, David, and Alan B. Krueger. 1992a. "Does school quality matter? Returns to education and the
characteristics of public schools in the United States." Journal of Political Economy 100,no.1 (February):1-40.
———. 1992b. "School quality and black-white relative earnings: A direct assessment." Quarterly Journal
of Economics 107,no.1 (February):151-200.

———. 1996. "Labor market effects of school quality: Theory and evidence." In Does money matter? The effect of school resources on student achievement and adult success, edited by Gary Burtless. Washington, DC: Brookings:97-140.
Case, Anne, and Angus Deaton. 1999. "School inputs and educational outcomes in South Africa."
Quarterly Journal of Economics 114,no.3 (August):1047-1084. Coleman, James S., Ernest Q. Campbell, Carol J. Hobson, James McPartland, Alexander M. Mood,
Frederic D. Weinfeld, and Robert L. York. 1966. Equality of educational opportunity. Washington, D.C.: U.S. Government Printing Office.
Currie, Janet, and Duncan Thomas. 2000. "Early test scores, socioeconomic status, school quality, and
future outcomes." Department of Economics, UCLA (mimeo) (September). Dugan, Dennis J. 1976. "Scholastic achievement: its determinants and effects in the education industry." In
Education as an industry, edited by Joseph T. Froomkin, Dean T. Jamison and Roy Radner. Cambridge, MA: Ballinger:53-83.
Gonzales, Patrick, Christopher Calsyn, Leslie Jocelyn, Kitty Mak, David Kastberg, Sousan Arafeh, Trevor
Williams, and Winnie Tsen. 2000. Pursuing excellence: Comparisons of international eighth-grade mathematics and science achievement from a U.S. perspective, 1995 and 1999. Washington, DC: National Center for Education Statistics.
Greenwald, Rob, Larry V. Hedges, and Richard D. Laine. 1996. "The effect of school resources on student
achievement." Review of Educational Research 66,no.3 (Fall):361-396. Griliches, Zvi. 1974. "Errors in variables and other unobservables." Econometrica 42,no.6
(November):971-998. Grogger, Jeffrey T., and Eric Eide. 1993. "Changes in college skills and the rise in the college wage
premium." Journal of Human Resources 30,no.2 (Spring):280-310. Hanushek, Eric A. 1973. "Regional differences in the structure of earnings." Review of Economics and
Statistics 55,no.2 (May):204-213. ———. 1986. "The economics of schooling: Production and efficiency in public schools." Journal of
Economic Literature 24,no.3 (September):1141-1177. ———. 1995. "Interpreting recent research on schooling in developing countries." World Bank Research
Observer 10,no.2 (August):227-246. ———. 1996. "A more complete picture of school resource policies." Review of Educational Research
66,no.3 (Fall):397-409. ———. 1997. "Assessing the effects of school resources on student performance: An update." Educational
Evaluation and Policy Analysis 19,no.2 (Summer):141-164. ———. 1999. "The evidence on class size." In Earning and learning: How schools matter, edited by Susan
E. Mayer and Paul Peterson. Washington, DC: Brookings Institution:131-168. Hanushek, Eric A., and John F. Kain. 1972. "On the value of `equality of educational opportunity' as a
guide to public policy." In On equality of educational opportunity, edited by Frederick Mosteller and Daniel P. Moynihan. New York: Random House:116-145.
Hanushek, Eric A., and Dongwook Kim. 1995. "Schooling, labor force quality, and economic growth."
Working Paper 5399, National Bureau of Economic Research (December).

Hanushek, Eric A., and Dennis D. Kimko. 2000. "Schooling, labor force quality, and the growth of
nations." American Economic Review 90,no.5 (December):1184-1208. Hanushek, Eric A., and Richard R. Pace. 1995. "Who chooses to teach (and why)?" Economics of
Education Review 14,no.2 (June):101-117. Hanushek, Eric A., Steven G. Rivkin, and Lori L. Taylor. 1996. "Aggregation and the estimated effects of
school resources." Review of Economics and Statistics 78,no.4 (November):611-627. Hedges, Larry V., Richard D. Laine, and Rob Greenwald. 1994. "Does money matter? A meta-analysis of
studies of the effects of differential school inputs on student outcomes." Educational Researcher 23,no.3 (April):5-14.
Heyneman, Stephen P., and William Loxley. 1983. "The effect of primary school quality on academic
achievement across twenty-nine high and low income countries." American Journal of Sociology 88(May):1162-1194.
Hoxby, Caroline Minter. 2000. "The effects of class size on student achievement: New evidence from
population variation." Quarterly Journal of Economics 115,no.3 (November):1239-1285. Mankiw, N. Gregory, David Romer, and David Weil. 1992. "A contribution to the empirics of economic
growth." Quarterly Journal of Economics 107,no.2 (May):407-437. Manski, Charles F., and David A. Wise. 1983. College choice in America. Cambridge: Harvard University
Press. Marlin, Michael O., and Ina V. S. Mullis. 1996. Third international mathematics and science study:
Quality assurance in data collection. Boston: Center for the Study of Testing, Evaluation, and Education Policy, Boston College.
Mincer, Jacob. 1970. "The distribution of labor incomes: a survey with special reference to the human
capital approach." Journal of Economic Literature 8,no.1 (March):1-26. ———. 1974. Schooling Experience and Earnings. New York: NBER. Murnane, Richard J., John B. Willett, Yves Duhaldeborde, and John H. Tyler. 2000. "How important are
the cognitive skills of teenagers in predicting subsequent earnings?" Journal of Policy Analysis and Management 19,no.4 (Fall):547-568.
Murnane, Richard J., John B. Willett, and Frank Levy. 1995. "The growing importance of cognitive skills
in wage determination." Review of Economics and Statistics 77,no.2 (May):251-266. Neal, Derek A., and William R. Johnson. 1996. "The role of pre-market factors in black-white differences."
Journal of Political Economy 104,no.5 (October):869-895. Nelson, Richard R., and Edmund Phelps. 1966. "Investment in humans, technology diffusion and economic
growth." American Economic Review 56,no.2 (May):69-75. O'Neill, June. 1990. "The role of human capital in earnings differences between black and white men."
Journal of Economic Perspectives 4,no.4 (Fall):25-46. Psacharopoulos, George. 1973. Returns to education: An international comparison. San Francisco, CA:
Jossey-Bass Inc.

———. 1981. "Returns to education: An updated international comparison." Comparative Education Review 17,no.3:321-341.
———. 1985. "Returns to education: A further international update and implications." Journal of Human
Resources 20,no.4 (Fall):585-604. ———. 1994. "Returns to investment in education: A global update." World Development 22:1325-1344. Rebelo, Sergio. 1991. "Long-run policy analysis and long-run growth." Journal of Political Economy
99,no.3 (June):500-521. Rivkin, Steven G. 1995. "Black/white differences in schooling and employment." Journal of Human
Resources 30,no.4 (Fall):826-852. Rivkin, Steven G., Eric A. Hanushek, and John F. Kain. 2001. "Teachers, schools, and academic
achievement." Working Paper No. 6691, National Bureau of Economic Research (revised) Romer, Paul. 1986. "Increasing returns and long-run growth." Journal of Political Economy
94(October):531-556. ———. 1990. "Endogenous technological change." Journal of Political Economy 99,no.5,pt. II:S71-S102. Taber, Christopher R. 2001. "The rising college premium in the eighties: Return to college or return to
unobserved ability?" Review of Economic Studies 68,no.3 (July):665-691. U.S. Department of Education. 1995. Digest of education statistics. 1995 ed. Washington, DC: National
Center for Education Statistics. Vignoles, Anna, Rosalind Levacic, James Walker, Stephen Machin, and David Reynolds. 2000. ""The
relationship between resource allocation and pupil attainment: A review"." DP 02, Centre for the Economics of Education, London School of Economics and Political Science (November).
Woessman, Ludger. 2000. "Schooling resources, educational institutions, and student performance: The
international evidence." Kiel Working Paper No. 983, Kiel Institute of World Economics, Kiel, Germany, December 200
———. 2001. "Why students in some countries do better." Education Matters 1,no.2 (Summer):67-74. Woessman, Ludger, and Martin R. West. 2002. "Class-size effects in school systems around the world:
Evidence from between-grade variation in TIMSS." Research Paper PEPG/02-02, Program on Education Policy and Governance, Harvard University (March).

Appendix Table A1. Descriptive statistics for Age 9 cohort
Cla
ss s
ize(
stud
ents
)
Not
w
orki
ng
Live
s w
ith m
othe
r
Mor
e th
an 2
5 bo
oks
at
hom
e
Hou
se w
ith c
alcu
lato
r
Hou
se w
ith c
ompu
ter
Hou
se w
ith s
tudy
de
sk
Hou
se w
ith d
ictio
nary
Teac
her e
xper
ienc
e (in
yea
rs)
Canada 22.8 14% 91% 78% 81% 51% 73% 80% 18.9Cyprus 26.4 16% 87% 52% 72% 32% 82% 77% 17.6Czech Republic 19.1 7% 97% 83% 93% 31% 77% 76% 22.6Greece 20.0 22% 95% 49% 56% 21% 82% 85% 16.8Hong Kong 36.2 20% 94% 47% 91% 35% 74% 94% 14.8Iceland 14.4 23% 87% 82% 75% 73% 85% 70% 14.5Iran 31.9 8% 74% 18% 37% 8% 23% 27% 16.2Ireland 21.8 12% 96% 67% 82% 72% 69% 90% 20.6Japan 31.4 15% 16.1Latvia 18.7 8% 93% 76% 74% 21% 92% 78% 20.5Netherlands 21.2 21% 89% 70% 81% 69% 84% 76% 17.4New Zealand 28.9 19% 88% 79% 86% 52% 73% 89% 15.5Norway 17.4 14% 95% 81% 68% 51% 86% 67% 18.9Portugal 19.3 27% 94% 37% 76% 31% 60% 83% 21.8Thailand 19.4 13% 93% 23% 43% 4% 41% 32% 20.0Scotland 23.3 23% 91% 71% 84% 83% 71% 86% 15.1United States 23.5 15% 93% 73% 91% 51% 81% 89% 16.4Slovenia 21.9 8% 97% 70% 73% 44% 85% 79% 19.2 Note: blank entries indicate no data available.
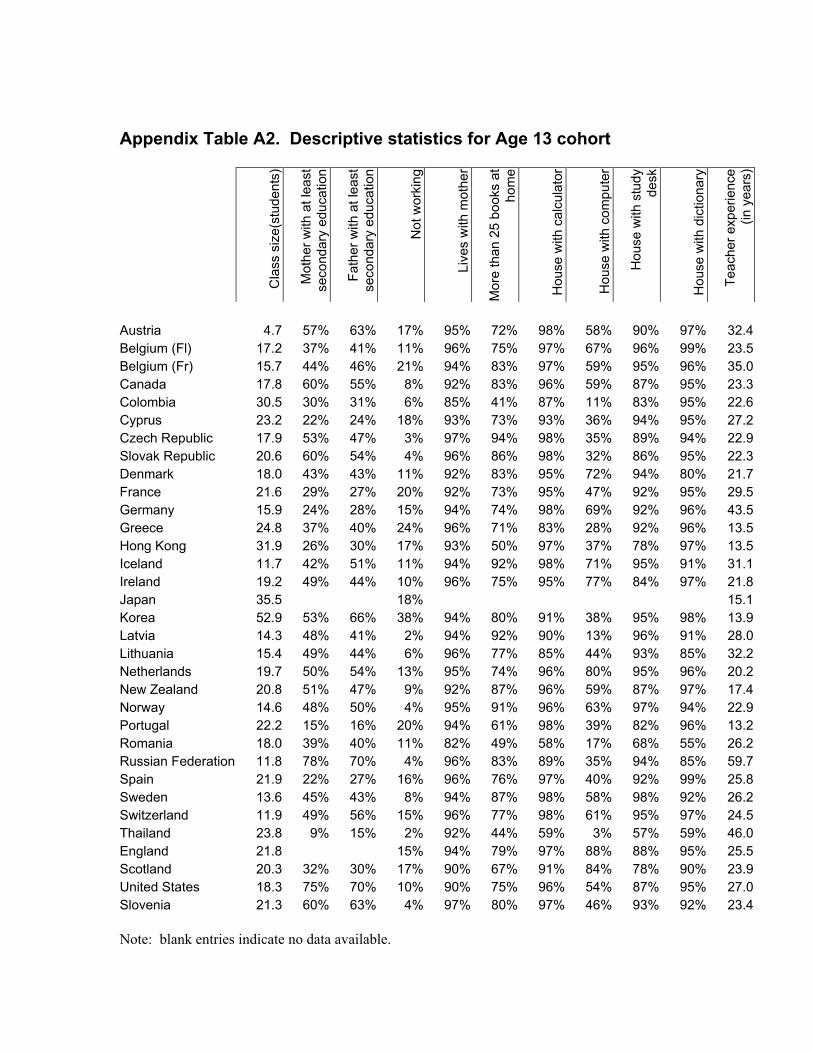
Appendix Table A2. Descriptive statistics for Age 13 cohort
C
lass
siz
e(st
uden
ts)
Mot
her w
ith a
t lea
st
seco
ndar
y ed
ucat
ion
Fath
er w
ith a
t lea
st
seco
ndar
y ed
ucat
ion
Not
wor
king
Live
s w
ith m
othe
r
Mor
e th
an 2
5 bo
oks
at
hom
e
Hou
se w
ith c
alcu
lato
r
Hou
se w
ith c
ompu
ter
Hou
se w
ith s
tudy
de
sk
Hou
se w
ith d
ictio
nary
Teac
her e
xper
ienc
e (in
yea
rs)
Austria 4.7 57% 63% 17% 95% 72% 98% 58% 90% 97% 32.4Belgium (Fl) 17.2 37% 41% 11% 96% 75% 97% 67% 96% 99% 23.5Belgium (Fr) 15.7 44% 46% 21% 94% 83% 97% 59% 95% 96% 35.0Canada 17.8 60% 55% 8% 92% 83% 96% 59% 87% 95% 23.3Colombia 30.5 30% 31% 6% 85% 41% 87% 11% 83% 95% 22.6Cyprus 23.2 22% 24% 18% 93% 73% 93% 36% 94% 95% 27.2Czech Republic 17.9 53% 47% 3% 97% 94% 98% 35% 89% 94% 22.9Slovak Republic 20.6 60% 54% 4% 96% 86% 98% 32% 86% 95% 22.3Denmark 18.0 43% 43% 11% 92% 83% 95% 72% 94% 80% 21.7France 21.6 29% 27% 20% 92% 73% 95% 47% 92% 95% 29.5Germany 15.9 24% 28% 15% 94% 74% 98% 69% 92% 96% 43.5Greece 24.8 37% 40% 24% 96% 71% 83% 28% 92% 96% 13.5Hong Kong 31.9 26% 30% 17% 93% 50% 97% 37% 78% 97% 13.5Iceland 11.7 42% 51% 11% 94% 92% 98% 71% 95% 91% 31.1Ireland 19.2 49% 44% 10% 96% 75% 95% 77% 84% 97% 21.8Japan 35.5 18% 15.1Korea 52.9 53% 66% 38% 94% 80% 91% 38% 95% 98% 13.9Latvia 14.3 48% 41% 2% 94% 92% 90% 13% 96% 91% 28.0Lithuania 15.4 49% 44% 6% 96% 77% 85% 44% 93% 85% 32.2Netherlands 19.7 50% 54% 13% 95% 74% 96% 80% 95% 96% 20.2New Zealand 20.8 51% 47% 9% 92% 87% 96% 59% 87% 97% 17.4Norway 14.6 48% 50% 4% 95% 91% 96% 63% 97% 94% 22.9Portugal 22.2 15% 16% 20% 94% 61% 98% 39% 82% 96% 13.2Romania 18.0 39% 40% 11% 82% 49% 58% 17% 68% 55% 26.2Russian Federation 11.8 78% 70% 4% 96% 83% 89% 35% 94% 85% 59.7Spain 21.9 22% 27% 16% 96% 76% 97% 40% 92% 99% 25.8Sweden 13.6 45% 43% 8% 94% 87% 98% 58% 98% 92% 26.2Switzerland 11.9 49% 56% 15% 96% 77% 98% 61% 95% 97% 24.5Thailand 23.8 9% 15% 2% 92% 44% 59% 3% 57% 59% 46.0England 21.8 15% 94% 79% 97% 88% 88% 95% 25.5Scotland 20.3 32% 30% 17% 90% 67% 91% 84% 78% 90% 23.9United States 18.3 75% 70% 10% 90% 75% 96% 54% 87% 95% 27.0Slovenia 21.3 60% 63% 4% 97% 80% 97% 46% 93% 92% 23.4 Note: blank entries indicate no data available.