nber working paper series does immigration … · does immigration affect the long-term educational...
TRANSCRIPT

NBER WORKING PAPER SERIES
DOES IMMIGRATION AFFECT THE LONG-TERMEDUCATIONAL OUTCOMES OF NATIVES?
QUASI-EXPERIMENTAL EVIDENCE
Eric D. GouldVictor Lavy
M. Daniele Paserman
Working Paper 10844http://www.nber.org/papers/w10844
NATIONAL BUREAU OF ECONOMIC RESEARCH1050 Massachusetts Avenue
Cambridge, MA 02138October 2004
We thank Joshua Angrist and seminar participants at the Hebrew University, the conference on “Inequality,Minorities and Social Exclusion” at Bar-Ilan University, and the CEPR conference on “Inequality in LabourMarkets.” Vadim Krimsky provided expert research assistance. All errors are our own. The views expressedherein are those of the author(s) and not necessarily those of the National Bureau of Economic Research.
©2004 by Eric D. Gould, Victor Lavy, and M. Daniele Paserman. All rights reserved. Short sections of text,not to exceed two paragraphs, may be quoted without explicit permission provided that full credit, including© notice, is given to the source.

Does Immigration Affect the Long-Term Educational Outcomes of Natives? Quasi-ExperimentalEvidenceEric D. Gould, Victor Lavy, and M. Daniele PasermanNBER Working Paper No. 10844October 2004JEL No. I20, J24
ABSTRACT
This paper uses the mass migration wave to Israel in the 1990s to examine the impact of immigrant
concentration in elementary school on the long-term academic outcomes of native students in high
school. To identify the causal effect of immigrant children on their peers, we exploit random
variation in the number of immigrants across grades within the same school. The results suggest that
the overall presence of immigrants had essentially no effect on the quality of the high school attended
by native Israelis and on dropout rates, and at most a mild negative effect on high school
matriculation rates. However, when we break up the sample by parents' education and by ethnic
origin, we find that disadvantaged children were more likely to have been adversely affected by a
higher immigrant concentration in elementary school. Focusing on the impact of Ethiopian
immigrants who are from a much lower socio-economic background, we find stronger evidence of
adverse effects, especially for disadvantaged students and in classes where immigrant concentration
was particularly high.
Eric D. GouldDepartment of EconomicsHebrew UniversityMount Scopus91905 [email protected]
Victor LavyDepartment of EconomicsHebrew UniversityMount Scopus91905 Israeland [email protected]
M. Daniele PasermanDepartment of EconomicsHebrew UniversityMount Scopus91905 [email protected]

1
1. Introduction
An increasingly important issue faced by Western countries at the turn of the 21st
century is the social tension created by growing numbers of immigrants from less developed
countries. Questions about the effects of immigration on the labor market, on the wage
distribution, on the welfare system, and on crime and personal security, are hotly debated in
both the United States and Europe. Social tensions may manifest themselves particularly
acutely inside the school system. A disproportionate share of school resources is likely to be
devoted to immigrants, for at least two important reasons. First, the gap in fertility rates
between immigrants and the native-born implies that a large and growing share of the school
population is made up by immigrants or immigrants’ children. For example, in 2003, more
than 50 percent of first-grade children in California’s public schools were classified as
Hispanic/Latino, as opposed to only 42 percent among eighth-graders.1 Second, immigrant
children have to cope with the difficulties associated with the adoption of a new language, and
therefore may necessitate more one-to-one teaching, remedial classes, adjunct teachers, and so
forth. It is then natural to ask whether the presence of immigrants in a school has adverse
effects on the academic achievements and human capital accumulation of native students.
This question is linked to the broader issue of how the environment and peers affect
individual outcomes. Despite the important theoretical advances in the analysis of social
interactions, question marks still abound, mainly because of the inherent difficulty in
providing convincing empirical evidence on their existence and magnitude. The main problem
is that if members of the same group are observed to behave similarly, it is generally
impossible to infer whether this is due to true peer effects, or to individuals sorting themselves
endogenously into groups that share common characteristics. In the classroom context, since
essentially all the variation in the quality of one’s peers is due to the endogenous choices of
parents and school administrators, the identification problem is particularly acute.
1 Source: California Department of Education.

2
In this paper, we exploit a unique opportunity to identify peer effects in the classroom
using the mass migration wave from the former Soviet Union ("FSU") to Israel in the early
1990's. In particular, we examine the impact of immigrant concentration in fifth grade on the
long-term academic outcomes of native students in high school. The focus on the long-term
outcomes of natives, around seven years after their exposure to the “treatment,” is one of the
distinguishing features of this paper.
The population under investigation is that of Jewish children who were enrolled in 5th
grade during the 1993-1994 school year. The extent of the exposure of native children to
immigrant peers is determined primarily by the residential distribution of immigrants across
the country. Upon landing in Israel, immigrants were directed either to temporary housing
made available by a selected number of municipalities, or to dedicated absorption centers
located throughout the country. The initial absorption locality was chosen by FSU immigrants
before their arrival in Israel, and they tended to locate in poorer areas where housing costs
were low. As a result, although immigrants can be found over the whole spectrum of Israeli
public schools, schools with larger immigrant concentrations also tended to have native
students with lower average achievements. This non-random sorting of immigrants into
locations invalidates an estimation strategy based on a simple regression of native outcomes
on the fraction of immigrants in the same school.
Instead, we exploit random variation in the number of immigrants across grades within
the same school. More specifically, we argue that conditional on the total number of
immigrants in a given school in grades 4 to 6, the actual number of immigrants in grade 5 is
determined by random factors such as variation in the year of birth among the pool of
immigrant children in the school district. This natural experiment is best thought of as the
random drawing of balls from an urn in which one third of the balls are marked with the
number “4”, one third with the number “5”, and one third with the number “6”. Conditional
on the total number of balls drawn, the number of “5” balls is as good as randomly assigned.

3
Conditioning on the total number of immigrants in the advanced grades in elementary school
removes much of the heterogeneity across schools that may confound our estimates: schools
that absorbed the same number of immigrants are likely to be similar among themselves, not
only in their propensity to absorb immigrants, but also in other characteristics.
Indeed, a set of balancing tests indicate that, conditional on the number of immigrants in
grades 4 to 6 and the total number of children (natives and immigrants) in grade 5, there is
essentially no correlation between observable background covariates (such as parental
education) and the percentage immigrants in 5th grade. This finding justifies our identifying
assumption that there is no correlation between unobservable characteristics of native children
and the percentage immigrants in 5th grade, after conditioning on the same set of controls.
We use administrative panel data on school enrollment and test scores to follow each 5th
grade child from the 1993-1994 school year until the 2000-2001 school year, the year this
cohort was scheduled to graduate from high school. After regressing the high school
achievements of native students on the percentage of immigrants in their 5th grade, we find
that the concentration of immigrants in elementary school has essentially no effect on the
quality of the high school attended by native children and on their dropout rates, while it has
at most a mild effect on high school matriculation rates. However, after performing the
analysis separately on different samples of natives according to their parents’ years of
schooling and ethnic origin, a consistent pattern emerges whereby disadvantaged children
appear more likely to have been adversely affected by a higher concentration of immigrants
among their peers. We also replicate our analysis looking only at the concentration of
Ethiopian immigrants who arrived in May 1991 in “Operation Solomon.” We do find stronger
evidence of adverse effects in this specification, and especially so for disadvantaged students
and in schools where the immigrant concentration was particularly high.
In spite of some unique characteristics of the mass migration wave to Israel, we believe
that the paper is relevant beyond the local context for several reasons. First, the number of

4
immigrants to Western Europe and the United States from the former communist countries of
Central and Eastern Europe has also risen steeply in the past decade. This number is expected
to grow following the enlargement of the European Union. As a result, it is likely that a large
fraction of future immigrants to Western European countries will share many of the
characteristics of immigrants to Israel. Second, as more Western countries debate whether to
move toward a more skill-biased immigration policy, it may be important to learn and
implement the lessons from the highly skilled migration wave to Israel. We should also keep
in mind that the number of highly skilled immigrants in the West is already non-negligible. In
the United States in the year 2000, the fraction of recent immigrants with a college degree is
slightly larger than that of natives (22.0 percent versus 20.9 percent), and in some states it is
substantially larger.2
While there is a vast literature on the effects of immigration on native labor market
outcomes,3 the question of whether immigration affects natives’ educational outcomes has
received relatively little attention. Exceptions include Betts (1998), who examines whether
immigration reduces the contemporaneous high school graduation rate of natives, and Hoxby
(1998) and Borjas (2004), who look at whether immigrants crowd-out natives from slots in
college and graduate programs. In a similar vein, Betts and Fairlie (2003) investigate whether
immigration in California induced native flight from public to private schools. Closely related
to our paper is also the literature on desegregation and classroom peer effects: Angrist and
Lang (2002) study the effects of Metco, a long-running desegregation program that sends
minority children out of the Boston public school district to a large and affluent suburban
district. Overall they find little evidence that the test scores of non-Metco students are affected
by the presence of disadvantaged peers, although there seems to be some evidence of a
2 In Ohio, the fraction of immigrants with a college degree is 37.4 percent, versus 17.6 percent among natives; in Michigan, it is 33.2 percent among immigrants versus 17.2 among natives; in Pennsylvania, it is 33.1 percent among immigrants versus 19.0 among natives. Source: 2000 Census of Population.
5
negative effect on the test scores of non-Metco minority students. Guryan (2001) studies the
effects of desegregation from the 1950s to the 1980s, and concludes that black dropout rates
fell as a result of desegregation, while desegregation did not affect the dropout rates of whites.
Hoxby (2000a) uses an identification strategy similar to our own, exploiting idiosyncratic
variation in gender and race composition of adjacent cohorts in Texas public schools, and in a
wide range of specifications she finds that children’s elementary school test scores are
affected by those of their peers, with intra-race peer effects appearing to be particularly
strong.4 In contrast to Hoxby, our focus is on the effect of immigrants on natives and we
examine long-run effects, rather than the contemporaneous effects of peers.
Sacerdote (2001) and Zimmermann (2003) study peer effects in a university setting, and
find that academic and social outcomes of college students are affected by the quality of
randomly assigned roommates. Recent years have also seen a flurry of research that uses
exogenous variation created by true or natural experiments to study the effects of peers and
the environment at the neighborhood level on a variety of educational, health, and economic
outcomes (Katz, Kling and Liebman, 2001; Edin, Fredriksson and Åslund, 2003; Oreopoulos,
2003; Jacob, 2003; Weinberg, Reagan and Yankow, 2004). In our previous study (Gould,
Lavy and Paserman, 2004), we found that Ethiopians who arrived during Operation Solomon
generally benefited from attending better schools. However, before claiming that sending
immigrants to better-performing schools represents a net gain from the point of view of
society, it is crucial to assess whether children in immigrant or minority-receiving schools are
affected by the influx of disadvantaged peers, as we set out to do in the current study.
The rest of the paper is structured as follows: the next section presents a brief
background of the immigration to Israel in the 1990s and describes our data. Section 3
3 See for example Card (1990, 2001); Altonji and Card (1991), Lalonde and Topel (1991), Hunt (1992), Borjas, Freeman and Katz (1996), Borjas (2003); in the Israeli context, see Friedberg (2001) and Cohen-Goldner and Paserman (2004a, 2004b). 4 An identification strategy based on random variation in cohort size at the school level is also used by Angrist and Lavy (1999) and Hoxby (2000b) to estimate the effects of class size on student achievements.

6
describes the empirical methodology and the identification strategy. Section 4 presents the
basic results on the effect of immigration on natives’ long-term scholastic achievements.
Section 5 repeats the analysis using the percentage of Ethiopian immigrants from Operation
Solomon as the explanatory variable. Section 6 concludes.
2. Background and Data
The mass migration from the former Soviet Union to Israel since 1989 can be viewed as
a unique laboratory for the social sciences. More than one million immigrants moved to Israel
since 1989, increasing its population by a remarkable 20 percent within a decade. The
migration wave was also highly concentrated, with approximately 330,000 immigrants
arriving in 1990 and 1991. The fall of the Berlin wall in November 1989 was the trigger that
started the whole process, as a number of factors combined to induce migration. First, the
Soviet Union lifted its emigration restrictions. Second, the political instability and the
uncertain economic climate in the beginning of the 1990s greatly increased the incentives to
migrate. Third, Israel was one of the few viable options, as it imposed no entry restrictions
and no lengthy waiting periods. Along with the mass migration from the former Soviet Union,
the early 1990s also saw the exodus of 15,000 Ethiopian Jews in the context of Operation
Solomon in May 1991, and increasing immigration rates from other countries, mainly the
United States and Argentina.
Not surprisingly, there are large differences in the family background of immigrants
from Ethiopia versus the former Soviet Union, and the overall immigrant population is quite
different in family background from native Israelis. These differences are displayed in Table
1, which shows the background characteristics of 5th grade students in 1994 according to data
collected by the Ministry of Education, and the characteristics of households with children
between the ages of 8 and 12 from the 1995 Census. Table 1 reveals that immigrant children
from the former Soviet Union generally have parents who are more educated than native

7
Israeli children (a little more than one additional year of education for each parent), but come
from smaller families (1.10 siblings versus 2.41 for native Israelis). In contrast, Ethiopian
immigrant children come from much larger families (an average of 4.28 siblings) but have
parents with only one or two years of education. However, the vast majority of immigrants
during this period came from the former Soviet Union, so the characteristics of the overall
immigrant population are dominated by the characteristics of the Russian immigrants.
While it appears that native Israeli children were exposed to a new immigrant population
with more favorable family background characteristics, it is also true that the new immigrant
population displayed several signs of social and economic distress. Compared to native
Israeli children, Table 1 reveals that immigrant children came from poorer households which
tend to rent rather than own their own homes, and where the head of the household is much
more likely to be unemployed or female. Once again, the Ethiopian immigrants display much
larger signs of weakness compared to the Russians, but both groups of immigrants are less
favorable compared to the native Israeli population. So, while it is true that the overall
immigration wave of this period flooded the country with immigrants who were generally
more educated than the average Israeli, the overall picture reveals that these immigrants
displayed several signs of socio-economic difficulties, which made them weaker in many
ways than the native population.
To examine whether the influx of this immigration wave into elementary schools
influenced the high school outcomes of native Israeli children several years later, we link
detailed information on each child's school environment in the 5th grade to the achievements
of each student throughout high school. The data comes from administrative records collected
by Israel’s Ministry of Education on the universe of Israeli elementary schools in the 1993-
1994 school year, the first year a computerized file is available. The data is based on reports
from school authorities to the Ministry of Education at the beginning of the school year. The
file contains an individual identifier, a school and class identifier, and detailed demographic

8
information on all immigrant pupils in grades 1 to 6, and all pupils in grades 1, 2, and 5. We
are able to exactly identify pupils by their country of origin and date of immigration (month
and year), so we know precisely who is a native Israeli student and how many immigrant
children were present in the 5th grade class of each elementary school. We focus our attention
on the 5th grade cohort in 1993-1994 for two reasons. First, the data for native Israeli pupils
is incomplete for 4th and 6th grades. Second, 5th grade students in the 1993-1994 school year
had enough time within our sample period (which ends with the 2000-2001 school year) to
finish high school if they progressed through the system without repetition.
We link the elementary school records to individual data on high school enrollment and
matriculation exam outcomes in the 1998-1999, 1999-2000, and 2000-2001 school years.
Therefore, we are able to follow each native Israeli student from 5th grade in 1993 all the way
through the advanced stages of high school. We study three different high school outcomes:
the quality of the high school attended (measured by the average passing rate of high school
students in the same school on the matriculation exams from 1996-1998), dropping out before
completing 12th grade, and passing the matriculation exams. The latter outcome is
particularly important in Israel since it is required to attend college. Similar high school
matriculation exams are found in many countries and in some states in the United States.
Examples include the French Baccalaureate, the German Certificate of Maturity
(Reifezeugnis), the Italian Diploma di Maturità, the New York State Regents examinations,
and the recently instituted Massachusetts Comprehensive Assessment System.
Table 2 presents summary statistics for various measures of the 5th grade learning
environment faced by native Israeli students. We classify the learning environment variables
into two groups, “peer characteristics” and “school characteristics”. The “peer
characteristics” describe the family background of the native Israeli 5th grade students in the
school. The “school characteristics” contain additional aspects measured at the school level
(average scores for the 4th and 5th grade students on the 1991 standardized math and verbal

9
tests5 and a 1991 socio-economic index of students in each elementary school6), and several
characteristics of the population in the school's district (income per capita, unemployment
rate, welfare recipiency rate, and local high school passing rate on matriculation exams).7 All
of the “school characteristics” are taken from data from the 1991 school year, which is two
years before the sample of native students used in Table 2 attended 5th grade.
Summary statistics are presented in four columns in Table 2, whereby the sample used
in each column is defined by the total number of immigrants absorbed into the elementary
school in grades 4 to 6. For example, the first column presents summary statistics only for the
native Israeli 5th graders who attended an elementary school in 1993-1994 where the total
number of post-1989 immigrants in grades 4 to 6 was between 1 and 10. The next column
uses a range of immigrants in 4th to 6th grades between 11 and 20, and the next two columns
use ranges of 21-30 and 31-40 respectively.
A close inspection of the numbers in Table 2 reveals why it is important to break down
the sample in this manner. When comparing the means across columns, a clear pattern
emerges: schools with larger numbers of total immigrants in grades 4 to 6 are increasingly
worse off in terms of the characteristics of the native Israeli students in the same school. For
example, as the number of immigrants in the school increases, the parental education of native
students falls, the percent of students with origins from Asia and Africa (which is widely
considered to be a disadvantaged ethnic group in Israel) increases, the average math and
verbal scores of the elementary school fall, and the socio-economic index of the school falls.
5 In June of 1991, near the end of the school year, all fourth and fifth grade students were given achievement
tests designed to measure mathematics and Hebrew reading skills. The scores used here consist of the average score on some of the basic and all of the more advanced questions in the test, so that scores are scaled from 1 to 100. The low average and the high variation of scores on this achievement test generated considerable public controversy in Israel, leading to the abandonment of the national testing program in 1992. This is the same data used in Angrist and Lavy [1999].
6 The socioeconomic index is based on a function of the pupils’ fathers’ education and continent of birth, and of family size. The raw index is recorded as the percentage of students in the school who come from what is defined to be a disadvantaged background. Our socioeconomic status index is obtained by standardizing this variable and multiplying it by –1, so that high socioeconomic status schools have a high value of the index.
7 This data was originally collected from a variety of administrative sources by Shitrit and Dor [1994] and Applebaum, Dor and Heimburg [1996].

10
In addition, immigrants represent only 4.04 percent of the 5th grade class when the total
number of immigrants in 4th to 6th grades is between 1 and 10, but increases to 15.47 percent
when there are 31-40 immigrants in the same three grades. Overall, a clear pattern emerges
where larger numbers of immigrants in grades 4 to 6 are associated with larger concentrations
of immigrants in 5th grade, weaker native Israeli students based on their family background,
and weaker schools based on the performance of students in the school in previous years.
These results are not very surprising since new immigrants were not placed or directed to
areas where the best schools and most-educated parents are likely to be. Instead, immigrants
typically started out in areas with lower-cost housing, and therefore native Israelis from
disadvantaged backgrounds and lower-performing schools were more likely to attend schools
with higher concentrations of immigrants.
The lower panel of Table 2 presents the high school outcomes of native Israeli students
according to the number of immigrants in grades 4-6 in their school in 1993-1994 while they
were in 5th grade. Not surprisingly, the lower panel of Table 2 indicates that native students
who attended schools with a larger concentration of immigrants in 5th grade also had lower
outcomes in high school: they attended lower quality high schools,8 dropped out of high
school more often, and were less likely to pass the matriculation exams.
However, it is impossible to determine that natives who attended elementary schools
with more immigrants achieved less in high school because of the increasing presence of
immigrants, or whether a larger concentration of immigrants is simply correlated with other
observed and unobserved background and school-level characteristics which are responsible
for their success or failures. Because the enrollment of immigrants across schools was not
random, it is not valid to draw inferences about a causal relationship when we know that a
disproportionate number of immigrant students winded up with native Israeli students who
8 While the assignment of children to elementary schools is based on zoning, enrollment in high schools is determined by a selection process reflecting choices by students, parents, and schools. Therefore, the quality of high school attended can be reasonably viewed as an outcome variable.
11
were weaker in family background and were attending elementary schools with lower
performance records. Therefore, our empirical strategy will try to overcome this
identification problem by comparing the exposure of immigrants in the fifth grade, while
holding the number of total immigrants in the school to within a narrow range.
3. Identification Strategy
To estimate a causal effect of the presence of new immigrants on their native Israeli
peers, we need variation in the presence of immigrant children in the classroom that is
uncorrelated with the background and school characteristics of the native children. It is clear
from Table 2 that immigrant students were not distributed into schools in a manner
uncorrelated with the background characteristics of the native Israelis. The presence of
immigrant students in the 5th grade class is not a random event – native students in poorer and
lower achieving schools are more likely to attend schools with larger concentrations of
immigrant students. In general, the non-random assignment of children to schools, either
because of the choice of schools exercised by the families, or because of the endogenous
matching of pupils to schools done by education authorities, makes it difficult to identify the
effect of one group of peers on the outcomes of others. As such, the identification of a causal
link between peers has proven to be a difficult task in the literature. To overcome this
obstacle, our strategy is to exploit random variation in the number of immigrants in 5th grade
conditional on the school absorbing a given range of immigrant students in grades 4 to 6.
Methodology
Formally, we define the treatment variable t as the percentage of immigrant students in
grade 5 in a given school:
.5 gradein children ofNumber
5 gradein immigrants ofNumber 100×=t

12
We have a random sample of units, indexed by i=1,2,…,N. For each unit, we postulate
the existence of a potential outcome, Yi(t), for ]100,0[∈t . We observe for each unit the actual
treatment Ti and a set of covariates Xi. The observed outcome for unit i is
( ) ( )∑∈
==Tt
iiobs
i tYtTy .1
Assumption 1 (Conditional random assignment):
Y(t) independent of T | X, for all t ∈ [0,100].
Assumption 2 (Constant linear treatment effect):
tYtY ii β+= )0()( .
The first assumption is at the heart of our identification strategy: in our case, the critical
conditioning covariates are the number of immigrant children in grades 4 to 6, and the total
number of children in grade 5. We know that schools that absorbed large numbers of
immigrants are different in terms of student and school characteristics relative to schools that
absorbed fewer immigrants. However, holding constant the number of immigrant children in
grades 4 to 6, the number of immigrants in grade 5 (the numerator in the treatment variable) is
determined solely by random variation in birth years among the pool of immigrant children in
a school district. Since the treatment variable is the immigrant ratio, we must also condition
on the total number of children in grade 5. Once again, our argument is based on the
assumption that among schools of the same size that absorbed the same number of immigrant
children, variation in the percentage of immigrants in grade 5 is determined primarily by
random variation in the size of each immigrant cohort.
We now consider the expectation of the observed outcome, conditional on the actual
treatment received and on the covariates:
( ) ( ) ( )
( ) ( )[ ]
( )[ ] ( )[ ] ,|0,|0
,|1
,|1,|
txXYExXtTtYE
xXtTtYEtT
xXtTtYtTExXtTyE
Tt
Tt
obs
ββ +====+=
====
======
∑
∑
∈
∈

13
where the last equality follows from the conditional random assignment assumption. The
above formulation illustrates that, conditional on any particular value of the covariates, we can
obtain a consistent estimate of the treatment effect β by running a regression of the observed
outcome on a constant and the treatment variable.
In practice, this approach is not feasible, because the two key conditioning covariates are
essentially continuous, so that there are not enough observations for any given value of X. For
example, there are few native students who attended schools with a particular number of total
students in grade 5 and a particular number of total immigrants in grades 4 to 6. Therefore, we
divide the sample into eight different intervals defined by the number of immigrants in grades
4 to 6 in a given school: the first interval includes schools with 1 to 5 immigrants in grades 4
to 6, the second interval includes schools with 6 to 10 immigrants in grades 4 to 6, and so on.
Then, within each interval, we regress the outcome variable on the treatment and on a flexible
function of the key conditioning variables. This control function, as it is known in the
literature, is meant to capture the term ( )[ ]xXYE =|0 in equation (1). In practice, the control
function will include the number of immigrants in grades 4 to 6, the total number of children
in grade 5, the squares of these two variables, the interaction between the two, and, in some
specifications, additional individual and school characteristics entered linearly. Note that since
the exact functional form of ( )[ ]xXYE =|0 is unknown, estimating equation (1) on the full
sample imposes the specific functional form assumption globally, and may be misleading.
Instead, by dividing the sample into narrow intervals on the basis of the number of immigrants
in grades 4 to 6, we are less likely to induce bias in our estimates by our local approximation
to ( )[ ]xXYE =|0 .
Summing up, within each interval we run the following regression to explain the high
school outcome of native Israeli student i who attended elementary school j:

14
( ) ( )( )( ) ,5 gradein children of # 6, to4 gradesin immigrants of #
BackgroundFamily
Grade5th in ImmigrantsPercent Outcome SchoolHigh
1
0
ijj
i
jij
uf ++
+
+=
λ
αλ
where the treatment parameter, β, is identified by the conditional random assignment
assumption described above. Since the percent of immigrants in 5th grade does not vary at the
individual level, the standard errors are adjusted for clustering at the elementary school level.
The average treatment effect can be calculated by simply taking the weighted average of the
coefficients within each interval. Alternatively, one can pool all intervals together, and then
regress the outcome variable on the treatment effect, a dummy variable for each one of the
intervals, and the interactions of this dummy with each one of the conditioning variables. This
specification is equivalent to running separate regressions within each sub-sample, but
constraining the coefficient on the treatment variable to be the same across sub-samples. It is
potentially more efficient, as data from the whole sample is pooled together to obtain one
single estimate of the treatment effect. In the tables that follow, we refer to this model as the
“fully interacted” model.
Balancing Tests
To determine whether the data supports our identification strategy, we now test whether
there is a significant relationship between the percent of immigrants in grade 5 and the
observable characteristics of native Israeli children in the various sub-samples of schools
defined by the total number of immigrant children in grades 4 to 6. This is done by regressing
various measures of the native student’s background or elementary school environment on the
percent of immigrant students in the school's 5th grade for the eight sub-samples. If the
assignment of immigrant students across the 4th, 5th and 6th grades within the same school is
indeed random once we condition on the narrow range of total immigrants in the school and
on the control function, then we should find no such significant relationship.
15
The balancing tests described above do not necessarily provide a proof of random
assignment, as the assumption requires there to be no correlation between the percentage
immigrants in 5th grade and both observable and unobservable background characteristics.
However, the lack of a significant relationship between the presence of percentage immigrants
in 5th grade and observable characteristics suggests that it is unlikely that such a relationship
exists between percentage immigrants in 5th grade and unobservable characteristics. The
results of these tests are presented in Table 3.
Each coefficient in Table 3 represents the estimate from a single regression for each of
the various measures of the native student's background and elementary school environment
on the percent of immigrants in 5th grade. Out of the 64 coefficients, only five of them are
significant at the ten percent significance level or lower. The other 59 coefficients point to no
systematic relationship between observable characteristics and the percent of immigrants in
5th grade. Furthermore, the remaining five coefficients which do turn out to be statistically
significant do not tell a consistent story about whether students are positively or negatively
selected into schools with larger percentages of immigrants in the 5th grade (holding constant
the range of immigrant students in grades 4 to 6). For example, the second column reveals
that higher proportions of immigrants in 5th grade are significantly associated with larger
families and lower class sizes, which leads to contradicting inferences about negative or
positive selection. A similar phenomenon is found in column three where a higher proportion
of immigrants is significantly related to smaller families and larger class sizes. These
coefficients not only contradict the direction of the selection, but they also contradict the
direction of the same variable which was significant in column two but with the opposite sign.
That is, four of the five significant coefficients out of 64 are contradicted within their own
sample and across samples.
Overall, there does not appear to be a consistent or significant relationship between the
observable characteristics of native students and the percentage of immigrants in 5th grade,

16
once the number of total immigrants in grades 4 to 6 is limited to a narrow range. As such,
the samples appear to be balanced on the observable characteristics of the students and
schools, and therefore, provide a unique opportunity to exploit variation in the concentration
of immigrants in 5th grade in order to identify the effect of new immigrants on their peers.
4. Basic Results
Using the identification strategy and the regression specification described above, Table
4 presents the basic estimates of the long-run effects of immigrants on the high school
achievements of native Israeli students. Each entry in the table represents the coefficient
estimate from a separate regression on the treatment variable (the percentage of immigrant
children out of all 5th graders), for the three high school outcomes of interest: the quality of
high school attended (measured by the average matriculation rate in the school between 1996
and 1998), the probability of dropping out before completing 12th grade, and the probability of
receiving a matriculation diploma at the end of high school.
The estimates reported in the first panel of the table are from regressions that include
only the treatment variable and the flexible control function (the number of immigrants in
grades 4 to 6 and its square, the number of children in grade 5 and its square, and the
interaction between these two variables). The eight first columns in the table correspond to the
eight samples used in Table 3 for the balancing tests. We should note that the sample size in
each of the columns includes only native Israeli pupils, and therefore, it is identical to the
sample size reported in each of the columns of Table 3, respectively. The average 5th grade
cohort size is about 60-70 students, with six to seven recent immigrants. The implied average
proportion of recent immigrants in the 5th grade varies from 5 to 20 percent in the eight
samples.
Many of the reported point estimates in the first panel of Table 4 are small with large
estimated standard errors, indicating that they are not statistically different from zero.

17
However, the pattern of signs consistently points in the direction of an adverse effect of
immigrants on natives’ high school outcomes. Almost all of the estimates obtained from the
16-20, 26-30 and 31-35 samples are significant at the 5 or 10 percent level. In the last two
columns of the table, we present two alternative estimates of the treatment effect, and their
associated t-statistics. Column 9 is simply the weighted average of the eight within-interval
treatment effects, whereas column 10 presents the treatment effect obtained from the fully
interacted model discussed in Section 3. The point estimates for the effect of immigrant
concentration on the high school quality and on the matriculation rate are remarkably similar
according to the two methods, while the effect on the dropout rate is larger in the fully
interacted model. The estimates indicate that immigrant concentration in elementary school
has a negative effect on the quality of high school attended and on high school matriculation
rates, and a positive effect on the dropout rate. However, all the coefficients are small and
statistical significance is marginal at most. The point estimates imply that a 10 point increase
in the percentage immigrants in grade 5 lowers the matriculation rate of the high school
attended by 1.1-1.3 percentage points, raises the dropout rate by 0.5-1.0 percentage points,
and lowers the individual matriculation rate by 1.8-1.9 percentage points.
When background characteristics of the student (father's and mother's schooling, number
of siblings, ethnic origin) and of the elementary school (test scores and socio-economic index
in 1991, a dummy for religious elementary school, class size in 1994) are added as controls to
the regressions, in the lower panel of the table, almost all of the estimates of the treatment
remain statistically insignificant. However, six of the estimates of the effect of the percentage
of immigrants on the matriculation rate are negative and their weighted average is negative
and just marginally insignificant. The average estimated effect is relatively small: a 10 percent
increase in the proportion of immigrants in the class induces a 1.4-1.5 percentage point
decline in the school average matriculation rate. The fact that the estimated effect does not
change very much as a result of adding the background characteristics as controls may be

18
interpreted as additional evidence that the treatment and control samples are relatively
balanced in these observable measures, once one conditions on grade size and number of
immigrants in grades 4 to 6. Overall, the evidence in Table 4 suggests that the effect of
immigrants in 5th grade on the high school achievements of natives is likely to be negative,
but not very significant statistically or in magnitude.
Heterogeneous Effects
Up to now, we have only attempted to estimate the effect of immigrants on the overall
population of natives. However, the effect of immigrants on the outcomes of natives may
vary with the background characteristics of the native student. We now examine the effect of
immigrants on disadvantaged native students who are possibly more likely to be affected by
the presence of immigrants in the classroom.9 We use two measures to identify disadvantaged
native students. The first is based on parental schooling, while the second is based on ethnic
background. In the next section, we investigate whether there are differential effects on the
outcomes of natives when the treatment variable is defined as the percentage of disadvantaged
immigrants in the 5th grade.
Table 5 presents the estimates when each of the basic eight samples was stratified by the
mother’s years of schooling, below or above 10. Panel A in the table presents the results for
natives with less educated mothers and panel B presents the results obtained for the natives
with more-educated mothers. The point estimates for each sub-sample are generally
imprecise, but the weighted average estimates for the effect of immigrant concentration on the
dropout rate and the matriculation rate for natives with less-educated mothers are significantly
different from zero. Also, the estimated effect in panel A is relatively large: a 10 percent
increase in the proportion of immigrants leads to a 2 percentage points increase in the drop out
rate (versus a mean of 8 percent) and to a 4.5 percentage point reduction in the matriculation

19
rate (relative to a mean of 58 percent in the sample). The proportion of immigrants in the
classroom has no effect on the drop-out rate of children with more-educated mothers and the
effect on matriculation rates is one-third the size of the coefficient found with the sample of
natives with less-educated mothers. The effect on the quality of high school attended is
negative and more statistically significant with the more advantaged sample, but the
magnitudes of the coefficients are very similar for both advantaged and disadvantaged natives.
Overall, the weighted-average results point to a stronger effect of the immigrants on the
disadvantaged natives, and similar results are found in the fully interacted model in the last
column.
An alternative way to identify disadvantaged students is to stratify the sample by ethnic
origin. Israeli society is quite clearly divided along ethnic lines in terms of socio-economic
status. For example, Israeli children of Asia-Africa origin (defined by themselves or their
parents being born in an African or Asian country) have the lowest average background
characteristics (parental schooling, income and other social and family attributes). Table 6
presents estimates based on a sample that includes children whose ethnic origin is Asia-Africa
(panel A) and estimates from a sample of all other Israeli children (Panel B).10 The results
presented in the first panel show clearly that native Israeli students from Africa-Asia origin
experience significantly lower human capital outcomes as the proportion of immigrants in the
classroom increases. The most dramatic effect is on the matriculation rate: the estimated
coefficients across the row (the row for the matriculation rate in Panel A) are all negative,
three of them are individually significant and the weighted average of the eight estimates is -
0.0045 with a t-statistic of 3.5. This point estimate implies that a 10 percentage point increase
in the proportion of immigrants reduces the matriculation rate of the Africa-Asia ethnic group
9 A number of papers have shown that the outcomes of disadvantaged students are more responsive to changes in school resources (Angrist and Lavy, 1999; Krueger, 1999; Hoxby, 2000b; Jepsen and Rivkin, 2002). 10 Children in our sample belong to the 1983-1984 cohort, meaning that their parents would typically have been born between 1950 and 1965. Therefore, our ethnic origin indicator is likely to identify quite accurately children of parents who immigrated from North African countries in the later 1950s and 1960s.

20
by 4.5 percent, an effect that amounts to around 15 percent of the respective mean. In contrast
to this relatively large effect for native students of Asia-Africa origin, there is no significant
effect using the sample of all the other Israeli students. This pattern of results is also seen in
the last column using the fully interacted model.
In Table 7, we define students as disadvantaged if they have both a low-educated mother
and they are of Asia-Africa origin. Despite the fact that the number of students in this
intersection is relatively small, we still find large and significant effects of immigrant
concentration on high school achievements. For this very disadvantaged group, a ten percent
increase in immigrant concentration raises the dropout rate by 2.0-3.2 percentage points, and
lowers the matriculation rate by 4.0-5.6 percentage points, while there is essentially no effect
on high school quality. These effects are larger than those found in either of the previous two
tables.
Table 8 performs the analysis separately for males and females. The results suggest that
female students are negatively affected by the presence of immigrants in terms of their drop-
out rate and matriculation rate, but no significant effect is detected for males using these
outcomes. However, the males seem to experience a large negative effect when it comes to
the quality of the high school attended relative to females.
Comparison with OLS
It is now natural to ask how our results would have changed had we adopted a more
naïve methodology. We explore this issue in Table 9. The last two columns of the table
reproduce the estimates from Tables 4-6 in the fully interacted model and in the “weighted
average” model, for the full sample (Panel A), for students with low-educated mothers (Panel
B), and for students of Asia-Africa origin (Panel C). Column 1 presents the estimates and
associated t-statistics from a simple bivariate regression of the high school outcome variables
on percentage immigrants in grade 5. Not surprisingly, the point estimates in this specification

21
are substantially larger than those obtained with the quasi-experimental approach, reflecting
the non-random selection of immigrants across schools. In columns 2 through 5, we
progressively add more control variables to assess how the estimates vary and how they
compare to the ones obtained in the quasi-experimental approach. In columns 2 and 3, we add
individual level and traditional school level control variables (a religious dummy, average
class size in 1994, school test scores and socioeconomic index in 1991). In column 4 we add
linearly the two key conditioning variables, whose inclusion stems directly from the structure
of the assignment mechanism discussed in Section 3 (i.e., the number of children in grade 5
and the number of immigrant children in grades 4 to 6). In column 5, the key conditioning
variables are included together with their squares and their interaction. This is the same
flexible polynomial control function used in the previous tables.
The table reveals that inclusion of the basic individual and school-level control variables
takes care of a large fraction of the selection bias, lowering substantially all of the coefficients
and t-statistics. However, we also note that in a number of specifications and samples, there is
a marked difference between the naïve OLS estimates of columns 2 and 3, and the quasi-
experimental estimates that take into account the structure of the assignment mechanism. For
example, in both the full sample and the two sub-samples, the naïve OLS coefficient for the
quality of high school attended is small and insignificant, while it becomes substantially larger
and statistically significant in the quasi-experimental specifications. A similar pattern emerges
for the effect of the treatment on high school matriculation rates, but only in the
disadvantaged samples: a 10 percent increase in immigrant concentration lowers matriculation
rates by 1.3 percent (2.3 percent) in the low-education (Asia-Africa) sub-sample according to
the naïve estimates, but the effect increases to 2.5-4.5 percent (3.4-4.5 percent) when we
control for the number of immigrants in the school. It appears that carefully taking into
account the mechanism generating variation in immigrant concentration across schools

22
generates somewhat larger estimates of the treatment effect, which we believe to be more
credible than those obtained in a more naïve specification.
Overall, the results in this section show a clear pattern of stronger and more negative
effects of immigrants on the human capital outcomes of natives coming from a more
disadvantaged background. In the next section, we probe further into the above finding that
disadvantaged native students experience large and significant peer effects on their human
capital outcomes by exploiting the unique episode generated by the mass exodus of extremely
disadvantaged immigrants from Ethiopia in May 1991.
5. Peer Effects in Schools that Absorbed Immigrants from Ethiopia
In May 1991, fifteen thousand Ethiopian Jews were brought to Israel in an overnight
airlift and sorted in a hurried and haphazard fashion to absorption centers across the country.
This operation, known as Operation Solomon, created variation in the quality of schools faced
by Ethiopian children, which was uncorrelated with the family background characteristics of
each immigrant child. This natural experiment was used by Gould, Lavy, and Paserman
(2004) to show that variation in elementary school quality had a significant impact on the
achievements of Ethiopian immigrant children in high school. In contrast, this section
examines whether the presence of Ethiopian children in the classroom in 5th grade had an
impact the achievements of native Israeli students in high school. This empirical context
allows us to examine the presence and dimension of peer effects of immigrants on natives in a
situation where the newcomers are from a much poorer social and economic background
relative to the recipient group. This represents a sharp contrast to the experiment exploited in
the previous section in which the immigrants (mostly from the former Soviet Union) were
equally or even more educated than the average adult native Israelis, even though their
economic status was inferior.

23
We adopt the same identification strategy we used in the previous section when
analyzing peer effects for all immigrants. Namely, to identify the causal effect of Ethiopian
immigrants on their peers, we exploit random variation in the number of immigrants across
grades within the same school. The identifying assumption is again that the proportion of
Ethiopians in 5th grade, conditioned on a given number of Ethiopian students in 4th to 6th
grade, is determined exogenously by random factors such as variation in the dates of birth
among the pool of immigrant children in a school district.
Table 10 presents balancing tests for four samples defined by narrow ranges for the total
number of May 1991 Ethiopian immigrants between grades 4 and 6. We restrict attention to
schools with no more than 20 Ethiopian immigrant children, as the data becomes extremely
sparse beyond this cut-off point. The treatment is now the percentage of these Ethiopian
students in the school’s 5th grade. The summary statistics at the bottom of the table indicate
that as the number of Ethiopian immigrants in grades 4 to 6 increases, so does the average
number and percentage of Ethiopians in grade 5. For example, schools with 1 to 5 Ethiopians
in grades 4 to 6 had on average 2.3 percent Ethiopians in grade 5, whereas in schools with 16
to 20 Ethiopians the percentage rises to 13.41.
The first three columns of Table 10 show insignificant coefficients for the relationships
between parental education levels of native students and the percentage of May 1991
Ethiopian immigrants in their 5th grade class. Of the 24 coefficients presented in these three
columns only one, the coefficient on class size in the third column, is significant at the 5
percent level, while the second highest t-statistic is 1.52. All the point estimates in these three
columns are also very small, another indication that these samples are balanced, and do not
reveal any systematic differences related to the proportion of May 1991 Ethiopian immigrants.
However, some systematic differences according to the proportion of Ethiopian students are
evident in column 4 of Table 10. In particular, significant coefficients are found for mother’s
and father’s years of schooling and for the socioeconomic index in 1991. These results

24
indicate that schools in this sample that absorbed more May 1991 Ethiopian students in 5th
grade tended to have native students from less-educated families and from a weaker socio-
economic background. However, it is unlikely that these differences reflect selection, because
this should also show up in differences in number of siblings and in average test scores of the
school as well. Since no such differences are observed (in fact, some of the signs reflect
positive selection) and since this sample is very small, including only 16 schools, we are
therefore inclined to relate to these minor differences as not representing systematic
differences due to variation in the proportion of May 1991 Ethiopian immigrants in 5th grade.
In any case, some caution should be exercised in interpreting the results in the last column.
Table 11 presents the analysis of the native outcomes in high school using the treatment
defined as the percentage Ethiopians in the 5th grade. The first panel presents the results for
all native children. The first column reveals that when the proportion of Ethiopian students is
small, their presence does not affect the outcomes of native students. However, the
coefficients in the next three columns show an adverse effect on natives in schools where the
fraction of Ethiopian immigrants was relatively high. For example, the coefficients in
columns 2-4 in Panel A are all large and statistically significant for the matriculation rate.
These results suggest that peer effects seem to exist only at higher intensity levels of
treatment. Taking the weighted average of the effects does not yield precise estimates, mostly
because the weighted average is dominated by the first sample where the intensity of the
treatment is weak and the estimated effect is minor. In fact, the weighted average of the effect
on matriculation rates in the last three columns is -0.011 (t-statistic of 5.29). Significant
negative results are also obtained using the fully interacted model in the last column of the
table.
Panel B of Table 11 presents the results for the sample of native children with low
mother’s year of schooling (below 10 years) drawn for each of the four basic samples. These
results also show a significant negative peer effect on the matriculation rate, and the

25
magnitudes of the coefficients are generally larger than the coefficients using the sample of all
native students. For example, in the second column, the effect for the low education sample is
more than twice as large as for the whole sample (-0.016 versus -0.007). This result is fully
consistent with the results presented in Tables 5-7 where we found the peer effect of
immigrants to be stronger and more precisely estimated among native students from low
educated families. It is also important to note that the “no adverse peer effect” result seen at
low levels of treatment intensity (low proportion of Ethiopian students in class) is evident also
in the second panel. In fact, in schools with 1 to 5 Ethiopian immigrants, the results appear to
be reversed: the proportion of Ethiopian immigrants lowers native Israelis’ drop out rates (the
effect is significant at the 10 percent level), and it raises matriculation rates. This suggests that
even the most disadvantaged students are not affected from the presence of immigrants in the
classroom as long as their proportion is small.
Panel C in Table 11 restricts the analysis to only native students from Asia-Africa ethnic
origin. The basic results are again very much in line with those presented in panel B and
discussed above: relatively large and negative peer effect of Ethiopian immigrants on the
matriculation probability of disadvantaged native students. However, similar to Panel B, the
significant results are mainly found at higher levels of immigrant concentration (columns 2
and 3 versus column 1) and in the fully interacted model (the last column).
6. Conclusion
In this paper we have estimated the impact of immigrant concentration in elementary
school on the high school outcomes of native Israelis, using a natural experiment generated by
random variation in the distribution of immigrants across grades within a given school.
Overall, we find that the percentage of immigrants in elementary school has essentially no
effect on dropout rates, while it has at most a mild effect on the quality of the high school
attended and on high school matriculation rates. However, splitting the sample by parents’

26
years of schooling and ethnic origin reveals a consistent pattern: disadvantaged children
appear more likely to have been adversely affected by a higher concentration of immigrants
among their peers. Interestingly, when we define the treatment as the percentage of
disadvantaged immigrants, the estimated treatment effects are even larger, particularly at high
levels of treatment intensity.
Our paper represents one of the first attempts to study the consequences of natives and
immigrants interacting in the same social and learning environment, while paying particular
attention to issues of identification and causality. The finding that exposure to immigrants
during elementary school yields detrimental effects on disadvantaged children into their high
school years is a new result, given that most of the literature focuses on contemporaneous peer
effects, rather than long term outcomes.
In many respects, our findings can be of general interest beyond the local Israeli context.
The empirical episode we study allows us to examine how immigrants from a relatively
educated and skilled background from the former Soviet republics affect the human capital
outcomes of natives. The lessons learned from this analysis are becoming increasingly
relevant to Western countries that are expected to absorb growing numbers of immigrants
from Central and Eastern Europe.
Our findings lead to at least two policy implications. First, any negative effect that arises
from integrating immigrants with native students in regular schools is mitigated when their
proportion is relatively small, suggesting that it is beneficial to spread the immigrants in as
many schools as possible. Second, absorbing immigrants in schools may require additional
resources to offset the crowding out of resources or the negative peer effects. These policy
lessons are equally relevant in an environment of highly educated immigrants since their
economic and language inferiority may put them at a disadvantage relative to native students.
Our finding may also have implications for income inequality. The most important
dividing line in schooling in the US is high school completion. In Israel and in many

27
European countries, the crucial threshold is passing the matriculation exams, which opens the
door to a college education. Angrist and Lavy (2004) estimated the returns to a year of
schooling in Israel at about 8.3 percent, while holders of the Israeli matriculation certificate
earn a further 24 percent. The returns to the matriculation certificate partly reflect the
increased likelihood of higher education. But even in a sample limited to those with exactly
12 years of schooling, holders of the matriculation certificate earn 13 percent more. The effect
of immigrants on the matriculation outcomes of natives may therefore have severe
implications for the income of disadvantaged natives as well as for income inequality.

28
References
Altonji, Joseph G., and Card, David. “The Effects of Immigration on the Labor Market Outcomes of Less-Skilled Natives.” In Immigration, Trade and Labor, edited by John M. Abowd, and Richard B. Freeman. Chicago: University of Chicago Press, 1991.
Angrist, Joshua D. and Lang, Kevin. “How Important are Classroom Peer Effects? Evidence from Boston’s Metco Program.” NBER Working paper no. 9263, October 2002.
Angrist, Joshua D. and Lavy, Victor. “Using Maimonides' Rule to Estimate the Effect of Class Size on Scholastic Achievement.” Quarterly Journal of Economics, 114(2), May 1999, pages 533-75.
Angrist, Joshua D. and Lavy, Victor "The Effect of High Stakes High School Achievement Awards Evidence from a Group Randomized Trial", Draft, September, 2004.
Betts, Julian R. “Educational Crowding Out: Do Immigrants Affect the Educational Attainment of American Minorities?”, in Daniel S. Hamermesh and Frank D. Bean (Eds.), Help or Hindrance? The Economic Implications of Immigration for African-Americans, New York: Russell Sage Foundation, 1998.
Betts, Julian R. and Fairlie, Robert W. “Does Immigration Induce ‘Native Flight’ from Public Schools into Private Schools.” Journal of Public Economics, 87(5-6), May 2003, pp. 987-1012.
Borjas, George J. "Do Foreign Students Crowd Out Native Students from Graduate Programs?" NBER Working Paper 10349, 2004.
Borjas, George J., Freeman, Richard B, and Katz, Lawrence. “Searching for the Effect of Immigration on the Labor Market”, American Economic Review, 86(2), May 1996, pp. 246-251.
Borjas, George J. “The Labor Demand Curve Is Downward Sloping: Reexamining the Impact of Immigration on the Labor Market.” Quarterly Journal of Economics, November 2003.
Card, David. “The Impact of the Mariel Boatlift on the Miami Labor Market.” Industrial and Labor Relations Review, 43(1), January 1990, pp. 245-257.
Card, David. “Immigrant Inflows, Native Outflows, and the Local Labor Market Impacts of Higher Immigration.” Journal of Labor Economics, 19(1), January 2001, pp. 22-64.
Cohen-Goldner, Sarit and Paserman, M. Daniele. “Mass Migration to Israel and Natives’ Transitions from Employment.” Mimeo., Hebrew University, 2004a.
Cohen-Goldner, Sarit and Paserman, M. Daniele. “The Dynamic Impact of Immigration on Natives’ Labor Market Outcomes: Evidence from Israel.” Mimeo., Hebrew University, 2004b.
Edin, Per-Anders, Peter Fredriksson, and Olof Åslund, “Ethnic Enclaves and the Economic Success of Immigrants – Evidence from a Natural Experiment,” Quarterly Journal of Economics, CXVIII (2003), 329-357.
Friedberg, Rachel M. “The Impact of Mass Migration on the Israeli Labor Market.” Quarterly Journal of Economics, 116(4), November 2001, pp. 1373-1408.
Gould, Eric D.; Lavy Victor and Paserman, M. Daniele. “Immigrating to Opportunity: Estimating the Effects of School Quality Using a Natural Experiment on Ethiopians in Israel.” Quarterly Journal of Economics, May 2004.
Hanushek, Eric, John F. Kain, and Steven G. Rivkin, “New Evidence About Brown V. Board of Education: The Complex Effects of School Racial Composition on Achievement,” NBER Working Paper No. 8741, 2002.
Hoxby, Caroline M. “Do Immigrants Crowd Disadvantaged American Natives Out of Higher Education?” in Daniel S. Hamermesh and Frank D. Bean (Eds.), Help or Hindrance?

29
The Economic Implications of Immigration for African Americans. New York: Russell Sage Foundation, 1998.
Hoxby, Caroline M. “Peer Effects in the Classroom: Learning from Gender and Race Variation.” NBER Working Paper No. 7867, August 2000a.
Hoxby, Caroline M. “The Effects of Class Size on Student Achievement: New Evidence from Population Variation.” Quarterly Journal of Economics; 115(4), November 2000b, pages 1239-85.
Jacob, Brian A., “Public Housing, Housing Vouchers and Student Achievement: Evidence from Public Housing Demolitions in Chicago,” NBER Working Paper No. 9652, 2003.
Jepsen, Christopher, and Steven Rivkin. “What is the Tradeoff between Smaller Classes and Teacher Quality?” NBER Working Paper No. 9205, September 2002.
Katz, Lawrence F., Jeffrey R. Kling, and Jeffrey B. Liebman, “Moving to Opportunity in Boston: Early Results from a Randomized Mobility Experiment,” Quarterly Journal of Economics CXVI (2001), 607-654.
Krueger, Alan B. “Experimental Estimates of Education Production Functions”, Quarterly Journal of Economics, CXIV (1999), 497-532.
LaLonde, Robert and Topel, Robert. “Labor Market Adjustments to Increased Immigration.” In Immigration, Trade and Labor, edited by John M. Abowd, and Richard B. Freeman. Chicago: University of Chicago Press, 1991.
Oreopoulos, Philip, “The Long-Run Consequences of Living in a Poor Neighborhood,” Quarterly Journal of Economics, CXVIII (2003), forthcoming.
Sacerdote, Bruce, “Peer Effects with Random Assignment: Results for Dartmouth Roommates,” Quarterly Journal of Economics, CXVI (2001), 681-704.
Weinberg, Bruce A., Patricia B. Reagan, and Jeffrey J. Yankow, “Do Neighborhoods Affect Hours Worked: Evidence from Longitudinal Data,” Journal of Labor Economics, XXII (2004), forthcoming.
Zimmerman, David J., “Peer Effects in Academic Outcomes: Evidence from a Natural Experiment,” Review of Economics and Statistics, LXXXV (2003), 9-23.

30
Table 1: Background Characteristics of Immigrants and Natives
A: Ministry of Education data:
Immigrants from:
All
Immigrants Former Soviet Union Ethiopia Other Native Israelis
Father’s years of schooling
11.45 (5.49)
13.04 (3.62)
1.80 (3.30)
14.21 (4.46)
12.03 (3.56)
Mother’s years of schooling
11.58 (5.31)
13.25 (3.26)
1.39 (2.90)
13.72 (3.70)
12.05 (3.41)
Number of siblings
1.54 (1.73)
1.10 (1.16)
4.28 (2.61)
1.98 (1.35)
2.41 (1.57)
Number of children 7,159 5,477 945 737 54,700
B: Census 1995 data Immigrants from:
All
Immigrants Former Soviet Union Ethiopia Other Native Israelis
Father’s years of schooling
12.69 (4.50)
13.51 (3.20)
2.57 (4.61)
13.50 (4.32)
11.67 (3.83)
Mother’s years of schooling
12.53 (4.52)
13.45 (3.09)
1.92 (4.20)
13.40 (3.95)
11.59 (3.98)
Female headed household
0.176 (0.381)
0.179 (0.383)
0.248 (0.432)
0.093 (0.290)
0.085 (0.278)
Home ownership
0.533 (0.499)
0.561 (0.496)
0.482 (0.500)
0.338 (0.473)
0.693 (0.461)
Household head unemployed
0.071 (0.256)
0.067 (0.252)
0.096 (0.295)
0.086 (0.281)
0.037 (0.189)
Household monthly income
3895.85 (3911.46)
4258.76 (3738.91)
751.01 (1184.43)
3497.91 (5371.44)
5899.36 (6963.88)
Number of households 8,910 7,321 737 852 68,725
Notes: The Ministry of Education sample includes the universe of children enrolled in 5th grade during the 1993-1994 school year. The Census data includes all households with at least one child between the ages of 8 and 12 in 1995.

31
Table 2: Summary Statistics
Number of immigrants in grades 4 through 6 1-10 11-20 21-30 31-40
Number of schools 271 144 164 124 Total number of children in
grade 5 13,014 13,707 9,943 7,329
Average number of children in grade 5 66.23 76.00 83.47 87.24
Average percentage immigrants in grade 5 4.04 8.00 11.51 15.47
Peer characteristics (non-immigrants)
Father’s years of schooling 12.58 (3.65)
12.19 (3.52)
11.93 (3.30)
11.86 (3.32)
Mother’s years of schooling 12.62 (3.46)
12.18 (3.36)
12.00 (3.12)
11.79 (3.27)
Number of siblings 2.43 (1.69)
2.46 (1.54)
2.38 (1.54)
2.33 (1.43)
Fraction Asia-Africa 0.243 (0.429)
0.293 (0.455)
0.318 (0.466)
0.314 (0.464)
Class Size 30.06 (6.04)
31.05 (5.74)
32.47 (5.17)
32.96 (5.45)
School characteristics
Standardized Math Score in 1991
0.342 (0.775)
0.155 (0.842)
0.109 (0.806)
0.087 (0.820)
Standardized Verbal Score in 1991
0.401 (0.773)
0.131 (0.806)
0.014 (0.743)
-0.009 (0.819)
Socioeconomic Index in 1991
0.388 (0.759)
0.181 (0.824)
0.149 (0.812)
0.109 (0.831)
Income per capita in school locality in 1991 978.50 892.69 891.53 897.24
Unemployment rate in school locality in 1991 2.94 1.63 1.44 1.45
Welfare recipiency rate in school locality in 1991 23.06 29.19 30.77 29.19
High school matriculation rate in school locality in
1991 47.96 46.63 46.49 46.69
Outcome Variables
Quality of high school attended
0.660 (0.214)
0.638 (0.223)
0.623 (0.230)
0.617 (0.229)
Fraction dropping out before completing 12th
grade
0.078 (0.268)
0.092 (0.289)
0.094 (0.292)
0.099 (0.299)
Fraction eligible for high school matriculation
0.621 (0.485)
0.587 (0.492)
0.582 (0.493)
0.558 (0.497)
Notes: Authors’ calculations based on Ministry of Education data.

32
Table 3: Balancing Tests
Number of immigrants in grades 4 to 6: 1-5 6-10 11-15 16-20 21-25 26-30 31-35 36-40 Mother’s years of schooling
0.0629 [1.3489]
0.0012 [0.0361]
0.0117 [0.4163]
0.0069 [0.2231]
0.0298 [1.1584]
-0.0271 [-1.1779]
-0.0331 [-1.0622]
-0.0336 [-1.0103]
Father’s years of schooling
0.0656 [1.3065]
0.0040 [0.1083]
0.0187 [0.6837]
0.0007 [0.0233]
0.0288 [1.1206]
-0.0382 [-1.5967]
-0.0283 [-0.7903]
-0.0556 [-1.5909]
Number of Siblings
-0.0039 [-0.1256]
0.0380 [2.2346]
-0.0318 [-2.1248]
0.0195 [1.2789]
-0.0117 [-0.6016]
0.0217 [1.4417]
0.0123 [0.5703]
0.0049 [0.2733]
Fraction Asia-Africa
-0.0013 [-0.3034]
-0.0003 [-0.1093]
-0.0027 [-0.8887]
0.0037 [1.1824]
-0.0001 [-0.0167]
0.0021 [0.7134]
-0.0000 [-0.0075]
-0.0077 [-2.1873]
Standardized math score in 1991
0.0095 [0.4521]
-0.0155 [-0.8047]
-0.0219 [-1.1500]
-0.0161 [-1.1771]
0.0121 [0.6949]
-0.0035 [-0.1869]
-0.0201 [-1.1266]
0.0071 [0.3676]
Standardized verbal score in 1991
0.0140 [0.6283]
-0.0101 [-0.5539]
0.0046 [0.2258]
-0.0226 [-1.6172]
0.0035 [0.2069]
-0.0043 [-0.2651]
-0.0162 [-0.9549]
0.0137 [0.7370]
Socioeconomic index in 1991
0.0022 [0.0939]
-0.0202 [-1.0747]
0.0157 [0.8789]
-0.0222 [-1.6124]
-0.0192 [-1.0303]
-0.0199 [-1.0432]
-0.0023 [-0.1392]
0.0170 [0.8795]
Class size in 1994
-0.1516 [-1.1409]
-0.2140 [-2.4166]
0.2724 [2.7043]
0.0209 [0.2145]
0.0909 [0.8973]
0.0808 [0.7738]
0.0222 [0.2931]
0.0719 [0.7631]
Number of schools 123 148 153 91 99 65 72 52
Number of children 5,031 7,983 8,346 5,361 5,857 4,086 4,159 3,170 Average number of children in 5th grade 42.20 57.38 59.46 66.34 67.85 73.17 69.50 74.13
Average number of immigrants in 5th grade 1.04 3.06 4.39 6.56 7.59 9.65 11.14 12.40
Average Percentage Immigrants in 5th grade 3.48 6.97 9.05 12.19 13.35 14.93 19.04 20.09
Standard deviation of % Immigrants in 5th grade 4.73 5.84 5.98 9.70 7.89 7.75 9.88 11.18
Notes: Entries in the table represent the coefficients from separate regressions of the relevant dependent variable on the percentage immigrants in 5th grade. All regressions control for number of immigrants in grades 4 to 6, number of children in grade 5, their squares, and the interaction between the two. Robust t-statistics, adjusted for clustering at the school level, in brackets.

33
Table 4: Outcomes for Native Israelis
Treatment: Percentage immigrants in grade 5 Number of immigrants in grades 4 to 6:
1-5 6-10 11-15 16-20 21-25 26-30 31-35 36-40 Weighted Average
Interacted Model
A: No Individual
Controls
Quality of high school attended
-0.0004 [-0.1206]
-0.0000 [-0.0043]
-0.0013 [-0.5597]
-0.0008 [-0.3881]
-0.0003 [-0.1546]
-0.0041 [-1.7649]
-0.0044 [-1.8814]
0.0013 [0.5054]
-0.0011 [-1.1502]
-0.0013 [-1.4827]
Dropped out before completing 12th grade
-0.0025 [-1.1875]
0.0014 [0.9102]
-0.0005 [-0.2974]
0.0042 [3.0127]
0.0001 [0.0682]
0.0023 [1.7280]
0.0027 [1.5803]
-0.0030 [-1.4617]
0.0005 [0.8429]
0.0010 [1.6345]
Passed HS matriculation exam
0.0033 [0.6875]
-0.0017 [-0.4865]
-0.0022 [-0.7251]
-0.0033 [-1.1538]
0.0006 [0.2581]
-0.0038 [-1.8040]
-0.0062 [-1.9465]
0.0026 [0.7880]
-0.0018 [-1.2924]
-0.0019 [-1.6471]
B: With Individual
Controls
Quality of high school attended
0.0001 [0.0340]
-0.0004 [-0.1643]
-0.0025 [-1.6935]
0.0004 [0.3317]
-0.0008 [-0.6251]
-0.0046 [-1.5800]
-0.0029 [-2.2075]
0.0003 [0.2029]
-0.0013 [1.8585]
-0.0012 [-2.1779]
Dropped out before completing 12th grade
-0.0023 [-1.2629]
0.0014 [0.9386]
0.0006 [0.4276]
0.0028 [2.6960]
0.0003 [0.2878]
0.0011 [1.1133]
0.0006 [0.4480]
-0.0015 [-0.9381]
0.0005 [0.8492]
0.0007 [1.3827]
Passed HS matriculation exam
0.0002 [0.0438]
-0.0014 [-0.5359]
-0.0038 [-1.5762]
-0.0011 [-0.5927]
-0.0012 [-0.7159]
-0.0021 [-0.8740]
-0.0027 [-1.5703]
0.0017 [0.8737]
-0.0015 [-1.6033]
-0.0014 [-1.8450]
Number of schools 123 148 153 91 99 65 72 52 803 803 Number of children 5,031 7,983 8,346 5,361 5,857 4,086 4,159 3,170 43,993 43,993
Notes: Entries in the table represent the coefficients from separate regressions of the relevant dependent variable on the percentage immigrants in 5th grade. All regressions control for grade size, the number of immigrants in grades 4 to 6, their squares, and the interaction between the two. Individual controls are mother’s years of schooling, father’s years of schooling, dummy indicators for whether parents’ schooling is missing, number of siblings, a dummy for whether the number of siblings is missing, age in 1994, a gender dummy, a dummy for whether the elementary school is religious, class size in 1994, math scores in 1991, verbal scores in 1991, and school socioeconomic index in 1991. Robust t-statistics (adjusted for clustering at the school level) in brackets.

34
Table 5: Outcomes for Native Israelis – By Mother’s Education
Treatment: Percentage immigrants in grade 5 Number of immigrants in grades 4 to 6:
1-5 6-10 11-15 16-20 21-25 26-30 31-35 36-40 Weighted Average
Interacted Model
A: Mother’s years of
schooling < 10
Quality of high school attended
-0.0038 [-1.1750]
-0.0004 [-0.1572]
-0.0018 [-0.7511]
0.0003 [0.1883]
-0.0007 [-0.3679]
-0.0031 [-1.0549]
0.0010 [0.4122]
0.0008 [0.3424]
-0.0012 [-1.2763]
-0.0006 [-0.7194]
Dropped out before completing 12th grade
0.0018 [0.3931]
0.0033 [1.1056]
0.0049 [1.6481]
0.0018 [0.8646]
0.0002 [0.0715]
0.0019 [0.8681]
-0.0004 [-0.1299]
-0.0035 [-1.6005]
0.0020 [1.6995]
0.0011 [1.1925]
Passed HS matriculation exam
-0.0097 [-1.3098]
-0.0051 [-1.1874]
-0.0084 [-2.3503]
0.0015 [0.4571]
-0.0020 [-0.6962]
-0.0053 [-0.9792]
-0.0008 [-0.2871]
0.0016 [0.3848]
-0.0045 [-2.6166]
-0.0025 [-1.7764]
Number of children 957 1,361 1,675 1,060 1,222 725 902 774 12,549 12,549
B: Mother’s years of schooling ≥ 10
Quality of high school attended
0.0004 [0.1903]
-0.0006 [-0.2771]
-0.0031 [-2.0564]
-0.0000 [-0.0288]
-0.0011 [-0.6851]
-0.0039 [-1.5894]
-0.0036 [-2.6941]
-0.0003 [-0.2006]
-0.0016 [-2.1654]
-0.0016 [-2.5608]
Dropped out before completing 12th grade
-0.0029 [-1.5794]
0.0006 [0.4283]
-0.0004 [-0.2890]
0.0026 [2.6116]
0.0008 [0.7575]
0.0009 [0.7176]
0.0002 [0.2279]
-0.0008 [-0.4600]
0.0000 [0.0580]
0.0004 [0.8639]
Passed HS matriculation exam
-0.0010 [-0.9639]
-0.0011 [-0.4546]
-0.0027 [-1.0486]
-0.0022 [-1.0834]
-0.0011 [-0.5209]
-0.0008 [-0.3274]
-0.0026 [-1.5209]
0.0020 [0.9164]
-0.0010 [-0.9639]
-0.0011 [-1.3311]
Number of children 4,074 6,622 6,671 4,301 4,635 3,361 3,257 2,396 35,317 35,317 Notes: Entries in the table represent the coefficients from separate regressions of the relevant dependent variable on the percentage immigrants in 5th grade. All regressions control for grade size, number of immigrants in grades 4 to 6, their squares and the interaction between the two. Additional controls: mother’s years of schooling, father’s years of schooling, dummy indicators for whether parents’ schooling is missing, number of siblings, a dummy for whether the number of siblings is missing, age in 1994, a gender dummy, a dummy for whether the elementary school is religious, class size in 1994, math scores in 1991, verbal scores in 1991, and school socioeconomic index in 1991. Robust t-statistics (adjusted for clustering at the school level) in brackets.
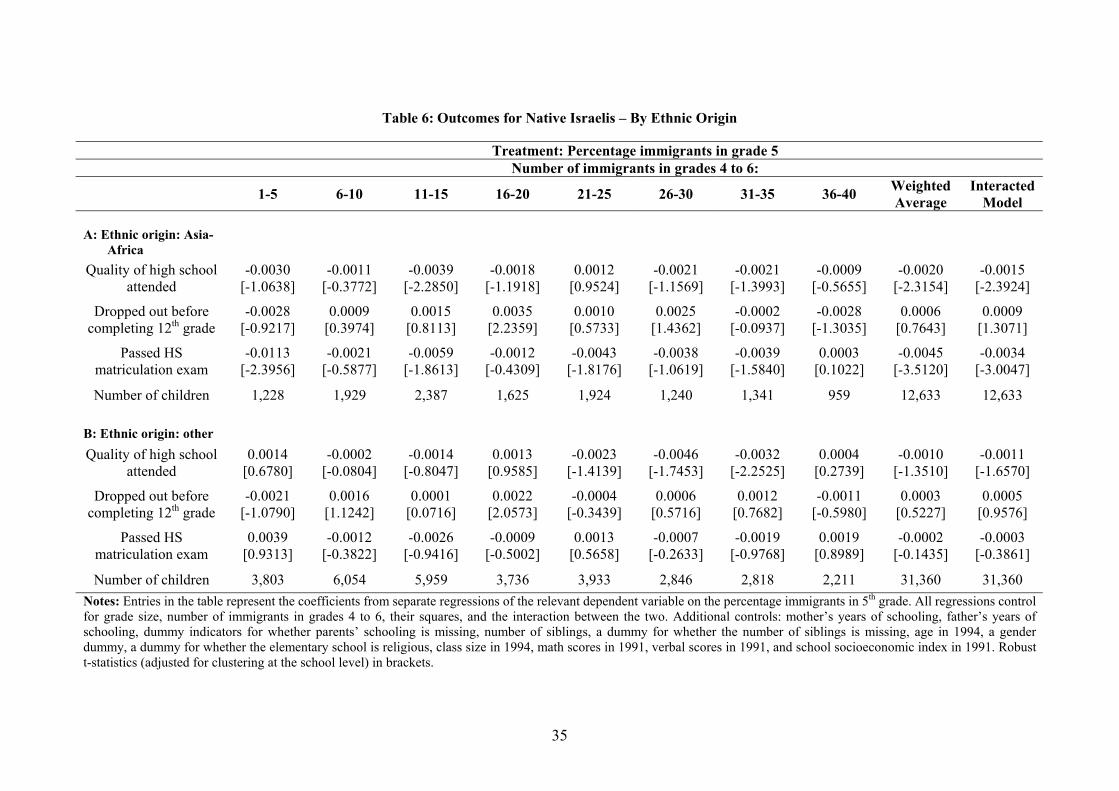
35
Table 6: Outcomes for Native Israelis – By Ethnic Origin
Treatment: Percentage immigrants in grade 5 Number of immigrants in grades 4 to 6:
1-5 6-10 11-15 16-20 21-25 26-30 31-35 36-40 Weighted Average
Interacted Model
A: Ethnic origin: Asia-
Africa
Quality of high school attended
-0.0030 [-1.0638]
-0.0011 [-0.3772]
-0.0039 [-2.2850]
-0.0018 [-1.1918]
0.0012 [0.9524]
-0.0021 [-1.1569]
-0.0021 [-1.3993]
-0.0009 [-0.5655]
-0.0020 [-2.3154]
-0.0015 [-2.3924]
Dropped out before completing 12th grade
-0.0028 [-0.9217]
0.0009 [0.3974]
0.0015 [0.8113]
0.0035 [2.2359]
0.0010 [0.5733]
0.0025 [1.4362]
-0.0002 [-0.0937]
-0.0028 [-1.3035]
0.0006 [0.7643]
0.0009 [1.3071]
Passed HS matriculation exam
-0.0113 [-2.3956]
-0.0021 [-0.5877]
-0.0059 [-1.8613]
-0.0012 [-0.4309]
-0.0043 [-1.8176]
-0.0038 [-1.0619]
-0.0039 [-1.5840]
0.0003 [0.1022]
-0.0045 [-3.5120]
-0.0034 [-3.0047]
Number of children 1,228 1,929 2,387 1,625 1,924 1,240 1,341 959 12,633 12,633
B: Ethnic origin: other Quality of high school
attended 0.0014
[0.6780] -0.0002
[-0.0804] -0.0014
[-0.8047] 0.0013
[0.9585] -0.0023
[-1.4139] -0.0046
[-1.7453] -0.0032
[-2.2525] 0.0004
[0.2739] -0.0010
[-1.3510] -0.0011
[-1.6570]
Dropped out before completing 12th grade
-0.0021 [-1.0790]
0.0016 [1.1242]
0.0001 [0.0716]
0.0022 [2.0573]
-0.0004 [-0.3439]
0.0006 [0.5716]
0.0012 [0.7682]
-0.0011 [-0.5980]
0.0003 [0.5227]
0.0005 [0.9576]
Passed HS matriculation exam
0.0039 [0.9313]
-0.0012 [-0.3822]
-0.0026 [-0.9416]
-0.0009 [-0.5002]
0.0013 [0.5658]
-0.0007 [-0.2633]
-0.0019 [-0.9768]
0.0019 [0.8989]
-0.0002 [-0.1435]
-0.0003 [-0.3861]
Number of children 3,803 6,054 5,959 3,736 3,933 2,846 2,818 2,211 31,360 31,360 Notes: Entries in the table represent the coefficients from separate regressions of the relevant dependent variable on the percentage immigrants in 5th grade. All regressions control for grade size, number of immigrants in grades 4 to 6, their squares, and the interaction between the two. Additional controls: mother’s years of schooling, father’s years of schooling, dummy indicators for whether parents’ schooling is missing, number of siblings, a dummy for whether the number of siblings is missing, age in 1994, a gender dummy, a dummy for whether the elementary school is religious, class size in 1994, math scores in 1991, verbal scores in 1991, and school socioeconomic index in 1991. Robust t-statistics (adjusted for clustering at the school level) in brackets.

36
Table 7: Outcomes for Native Israelis – By Mother’s Education and Ethnic Origin
Treatment: Percentage immigrants in grade 5 Number of immigrants in grades 4 to 6:
1-5 6-10 11-15 16-20 21-25 26-30 31-35 36-40 Weighted Average
Interacted Model
A: Mother’s years of schooling < 10 AND Ethnic Origin: Asia-Africa
Quality of high school attended
-0.0111 [-1.6259]
0.0019 [0.5391]
-0.0045 [-1.4600]
-0.0026 [-1.2787]
0.0029 [1.4538]
0.0007 [0.1937]
0.0020 [0.5659]
0.0006 [0.1627]
-0.0018 [-1.2143]
-0.0001 [-0.1029]
Dropped out before completing 12th grade
0.0059 [0.8572]
0.0021 [0.5700]
0.0073 [2.4263]
0.0048 [1.5807]
0.0035 [1.2407]
0.0049 [1.4442]
-0.0036 [-1.0156]
-0.0107 [-4.1609]
0.0032 [2.0727]
0.0020 [1.5012]
Passed HS matriculation exam
-0.0140 [-1.5604]
-0.0016 [-0.2591]
-0.0101 [-2.5427]
-0.0019 [-0.5075]
-0.0044 [-1.4686]
-0.0020 [-0.3016]
-0.0020 [-0.4750]
-0.0030 [-0.6893]
-0.0056 [-2.6438]
-0.0040 [-2.3935]
Number of children 334 498 652 416 557 298 366 289 3410 3410
B: Mother’s years of schooling ≥10 OR Ethnic Origin: Other
Quality of high school attended
0.0004 [0.1898]
-0.0007 [-0.3225]
-0.0024 [-1.5817]
0.0005 [0.3948]
-0.0015 [-1.0061]
-0.0047 [-2.0323]
-0.0032 [-2.3973]
0.0003 [0.2546]
-0.0015 [-2.0775]
-0.0014 [-2.4069]
Dropped out before completing 12th grade
-0.0025 [-1.3963]
0.0012 [0.7882]
-0.0003 [-0.1933]
0.0021 [2.1599]
-0.0002 [-0.2233]
0.0006 [0.5507]
0.0010 [0.7357]
-0.0005 [-0.3107]
0.0001 [0.2052]
0.0004 [0.8887]
Passed HS matriculation exam
0.0010 [0.2586]
-0.0016 [-0.5953]
-0.0028 [-1.1549]
-0.0012 [-0.5934]
-0.0007 [-0.3568]
-0.0021 [-0.8832]
-0.0028 [-1.5471]
0.0026 [1.2923]
-0.0011 [-1.1666]
-0.0011 [-1.3728]
Number of children 4697 7485 7694 4945 5300 3788 3793 2881 40559 40559 Notes: Entries in the table represent the coefficients from separate regressions of the relevant dependent variable on the percentage immigrants in 5th grade. All regressions control for grade size, number of immigrants in grades 4 to 6, their squares, and the interaction between the two. Additional controls: mother’s years of schooling, father’s years of schooling, dummy indicators for whether parents’ schooling is missing, number of siblings, a dummy for whether the number of siblings is missing, age in 1994, a gender dummy, a dummy for whether the elementary school is religious, class size in 1994, math scores in 1991, verbal scores in 1991, and school socioeconomic index in 1991. Robust t-statistics (adjusted for clustering at the school level) in brackets.

37
Table 8: Outcomes for Native Israelis – By Gender
Treatment: Percentage immigrants in grade 5 Number of immigrants in grades 4 to 6:
1-5 6-10 11-15 16-20 21-25 26-30 31-35 36-40 Weighted Average
Interacted Model
A: Males Quality of high school
attended -0.0037
[-1.6721] -0.0004
[-0.1773] -0.0033
[-1.7888] -0.0001
[-0.0323] -0.0018
[-1.4939] -0.0033
[-1.6831] -0.0025
[-1.5833] 0.0006
[0.3268] -0.0021
[-2.8394] -0.0017
[-2.6655]
Dropped out before completing 12th grade
-0.0042 [-1.6777]
0.0007 [0.2796]
-0.0011 [-0.5258]
0.0029 [1.8646]
-0.0005 [-0.2894]
0.0007 [0.5212]
0.0009 [0.4608]
-0.0033 [-1.4359]
-0.0005 [-0.6117]
-0.0001 [-0.1281]
Passed HS matriculation exam
-0.0012 [-0.2485]
0.0003 [0.0925]
-0.0047 [-1.5904]
0.0004 [0.1729]
-0.0013 [-0.5154]
0.0019 [0.7541]
-0.0034 [-1.6483]
0.0022 [0.9270]
-0.0012 [-0.9884]
-0.0008 [-0.7941]
Number of children 2,626 3,966 4,339 2,652 2,977 2,046 2,163 1,590 22,359 22,359
B: Females Quality of high school
attended 0.0034
[1.3556] -0.0008
[-0.3161] -0.0022
[-1.3844] 0.0010
[0.7077] 0.0001
[0.0754] -0.0040
[-1.4941] -0.0031
[-1.8608] -0.0002
[-0.1388] -0.0007
[-0.8143] -0.0009
[-1.3288]
Dropped out before completing 12th grade
0.0006 [0.3540]
0.0021 [1.6090]
0.0021 [1.1706]
0.0024 [1.9453]
0.0014 [1.2467]
0.0006 [0.5934]
0.0006 [0.4193]
0.0000 [0.0138]
0.0015 [2.5538]
0.0014 [2.6416]
Passed HS matriculation exam
0.0008 [0.1620]
-0.0038 [-1.1421]
-0.0031 [-1.0074]
-0.0020 [-0.8821]
-0.0013 [-0.6761]
-0.0062 [-2.2807]
-0.0018 [-0.8210]
0.0015 [0.4653]
-0.0021 [-1.7013]
-0.0021 [-2.1477]
Number of children 2,402 4,012 4,001 2,705 2,876 2,040 1,995 1,579 21,610 21,610 Notes: Entries in the table represent the coefficients from separate regressions of the relevant dependent variable on the percentage immigrants in 5th grade. All regressions control for grade size, number of immigrants in grades 4 to 6, their squares, and the interaction between the two. Additional controls: mother’s years of schooling, father’s years of schooling, dummy indicators for whether parents’ schooling is missing, number of siblings, a dummy for whether the number of siblings is missing, age in 1994, a gender dummy, a dummy for whether the elementary school is religious, class size in 1994, math scores in 1991, verbal scores in 1991, and school socioeconomic index in 1991. Robust t-statistics (adjusted for clustering at the school level) in brackets.

38
Table 9: Comparison of Methods
(1) (2) (3) (4) (5) (6) (7)
OLS OLS OLS OLS OLS Fully interacted model
Weighted Average Model
A: Full Sample Quality of high school attended
-0.0041 [-7.5179]
-0.0030 [-6.0698]
-0.0005 [-1.1508]
-0.0003 [-0.5240]
-0.0012 [-2.0865]
-0.0012 [-2.1779]
-0.0013 [-1.8585]
Dropped out before completing 12th grade
0.0025 [6.9866]
0.0015 [4.6704]
0.0006 [1.9942]
0.0008 [1.6883]
0.0005 [0.9160]
0.0007 [1.3827]
0.0005 [0.8492]
Passed HS matriculation exam
-0.0061 [-9.2099]
-0.0033 [-6.1093]
-0.0013 [-2.5999]
-0.0015 [-2.0916]
-0.0015 [-1.9777]
-0.0014 [-1.8450]
-0.0015 [-1.6033]
B: Mother’s years of schooling <10
Quality of high school attended
-0.0039 [-5.3894]
-0.0031 [-4.8960]
-0.0002 [-0.3610]
0.0001 [0.1274]
-0.0005 [-0.5007]
-0.0006 [-0.7194]
-0.0012 [-1.2763]
Dropped out before completing 12th grade
0.0030 [3.6436]
0.0019 [2.5723]
0.0007 [0.9812]
0.0016 [1.5872]
0.0009 [0.7936]
0.0011 [1.1925]
0.0020 [1.6995]
Passed HS matriculation exam
-0.0046 [-4.7928]
-0.0034 [-3.8583]
-0.0013 [-1.4304]
-0.0029 [-2.4341]
-0.0028 [-2.0409]
-0.0025 [-1.7764]
-0.0045 [-2.6166]
C: Ethnic Group: Asia-Africa
Quality of high school attended
-0.0033 [-5.9450]
-0.0025 [-4.8518]
-0.0007 [-1.4656]
-0.0008 [-1.3133]
-0.0016 [-2.3576]
-0.0015 [-2.3924]
-0.0020 [-2.3154]
Dropped out before completing 12th grade
0.0027 [5.3665]
0.0017 [3.6639]
0.0012 [2.4051]
0.0012 [1.7794]
0.0008 [1.0415]
0.0009 [1.3071]
0.0006 [0.7643]
Passed HS matriculation exam
-0.0052 [-6.8231]
-0.0032 [-4.4805]
-0.0023 [-3.1966]
-0.0032 [-3.3338]
-0.0035 [-3.3669]
-0.0034 [-3.0047]
-0.0045 [-3.5120]
Individual controls No Yes Yes Yes Yes Yes Yes School controls No No Yes Yes Yes Yes Yes
Control function None None None Linear Flexible polynomial
Flexible polynomial
Flexible polynomial
Interval dummies and interactions No No No No No Yes -- Notes: Entries in the table represent the coefficients from separate regressions of the relevant dependent variable on the percentage immigrants in 5th grade. Individual controls: mother’s and father’s years of schooling, dummy indicators for whether parents’ schooling is missing, number of siblings, a dummy for missing number of siblings, age in 1994, gender. School controls: religious school dummy, class size in 1994, math scores in 1991, verbal scores in 1991, and school socioeconomic index in 1991. Linear control function: number of children in grade 5 and number of immigrants in grades 4 to 6. Flexible polynomial control function: number of children in grade 5, number of immigrants in grades 4 to 6, their squares, and the interaction between the two. Robust t-statistics (adjusted for clustering at the school level) in brackets.

39
Table 10: The Impact of May 1991 Ethiopian Immigrants -- Balancing Tests
Number of Ethiopian immigrants in grades 4 to 6: 1-5 6-10 11-15 16-20
Mother’s years of schooling -0.0741 [-1.0498]
-0.0194 [-0.4335]
-0.0438 [-0.4837]
-0.0462 [-3.3963]
Father’s years of schooling -0.0759 [-0.9641]
-0.0204 [-0.4876]
-0.0841 [-1.0610]
-0.0469 [-2.7201]
Number of Siblings
-0.0330 [-0.7081]
-0.0538 [-1.5223]
-0.0399 [-0.9015]
-0.0088 [-0.5053]
Fraction Asia-Africa
-0.0081 [-0.9349]
-0.0010 [-0.2577]
0.0091 [1.0298]
0.0064 [1.7347]
Standardized math score in 1991 -0.0066 [-0.1514]
0.0372 [1.5055]
0.0046 [0.1477]
0.0126 [0.8993]
Standardized verbal score in 1991 -0.0244 [-0.5807]
0.0051 [0.2021]
0.0131 [0.6484]
-0.0039 [-0.4435]
Socioeconomic index in 1991 0.0155 [0.2959]
0.0049 [0.1663]
-0.0360 [-0.9839]
-0.0325 [-2.6015]
Class size in 1994
0.3424 [1.3459]
0.1359 [0.7982]
0.4289 [2.0185]
0.3289 [3.6307]
Number of schools 95 48 20 16
Number of children 4,411 3,600 858 606 Average number of children in 5th grade 57.17 45.54 52.40 52.43
Average number of Ethiopian immigrants in 5th grade 0.89 2.58 4.50 6.13
Average Percentage Ethiopian Immigrants in 5th grade 2.30 6.83 9.48 13.41
Standard deviation of % Ethiopian Immigrants in 5th grade 3.33 28.57 5.88 12.69
Notes: Entries in the table represent the coefficients from separate regressions of the relevant dependent variable on the percentage immigrants in 5th grade. All regressions control for number of May 1991 Ethiopians in grades 4 to 6, the number of children in grade 5, their squares, and the interaction between the two. Robust t-statistics, adjusted for clustering at the school level, in brackets.

40
Table 11: The Impact of May 1991 Ethiopian Immigrants – Outcomes
Treatment: Percentage Ethiopian immigrants in grade 5 Number of Ethiopian immigrants in grades 4 to 6:
1-5 6-10 11-15 16-20 Weighted Average Interacted Model
A: All native children
Quality of high school attended -0.0020 [-0.5104]
0.0030 [1.2597]
-0.0081 [-3.1083]
-0.0047 [-2.9496]
-0.0016 [-0.7186]
-0.0021 [-1.5436]
Dropped out before completing 12th grade
-0.0039 [-0.8552]
0.0011 [0.5625]
0.0026 [1.0307]
0.0020 [1.6791]
-0.0013 [-0.5184]
0.0009 [0.7127]
Passed HS matriculation exam 0.0045 [0.7862]
-0.0071 [-2.8673]
-0.0189 [-3.5520]
-0.0033 [-2.4028]
-0.0019 [-0.6020]
-0.0056 [-3.2138]
N 4,411 1,683 858 606 7,558 7,552
B: Mother’s years of schooling < 10
Quality of high school attended -0.0033 [-0.5433]
0.0005 [0.1328]
-0.0199 [-2.8450]
0.0018 [0.9497]
-0.0037 [-1.0634]
-0.0018 [-0.8369]
Dropped out before completing 12th grade
-0.0147 [-1.7961]
0.0031 [0.6682]
0.0030 [0.6004]
0.0033 [1.8792]
-0.0063 [-1.3874]
0.0006 [0.2438]
Passed HS matriculation exam 0.0212 [2.7300]
-0.0162 [-3.1356]
-0.0396 [-8.5441]
-0.0013 [-0.4330]
0.0023 [0.5350]
-0.0072 [-2.1084]
N 1,414 700 313 232 2,659 2,659
C: Ethnic Origin: Asia-Africa Quality of high school attended -0.0005
[-0.1375] 0.0023
[0.8136] -0.0104
[-2.5757] -0.0038
[-1.8149] -0.0011
[-0.5565] -0.0016
[-1.0644] Dropped out before completing
12th grade -0.0053
[-1.1079] 0.0005
[0.1762] 0.0034
[1.1944] 0.0068
[4.5562] -0.0017
[-0.6286] 0.0024
[1.4196]
Passed HS matriculation exam 0.0019 [0.2463]
-0.0100 [-2.9127]
-0.0199 [-2.6894]
-0.0016 [-0.8336]
-0.0040 [-0.9244]
-0.0063 [-2.8536]
N 1,553 735 320 249 2,857 2,857 Notes: Entries in the table represent the coefficients from separate regressions of the relevant dependent variable on the percentage Ethiopian children who immigrated in May 1991. All regressions control for grade size, the number of May 1991 Ethiopians in grades 4 to 6, their squares, and the interaction between the two. See Table 4 for the full list of additional controls. Robust t-statistics (adjusted for clustering at the school level) in brackets.