nber working paper series china’s embrace of globalization ... · china’s embrace of...
TRANSCRIPT

NBER WORKING PAPER SERIES
CHINA’S EMBRACE OF GLOBALIZATION
Lee BranstetterNicholas Lardy
Working Paper 12373http://www.nber.org/papers/w12373
NATIONAL BUREAU OF ECONOMIC RESEARCH1050 Massachusetts Avenue
Cambridge, MA 02138July 2006
This paper is part of a larger research project, China’s Great Transformation: Origins, Mechanisms, andConsequences of the Post-Reform Economic Boom. We are grateful to the project editors, Loren Brandt andThomas Rawski, and to participants at the University of Toronto and University of Pittsburgh conferenceson China’s economic transition for comments and suggestions. We particularly thank Yasheng Huang andBarry Naughton for detailed comments on an earlier draft. The views expressed herein are those of theauthor(s) and do not necessarily reflect the views of the National Bureau of Economic Research.
©2006 by Lee Branstetter and Nicholas Lardy. All rights reserved. Short sections of text, not to exceed twoparagraphs, may be quoted without explicit permission provided that full credit, including © notice, is givento the source.

China’s Embrace of GlobalizationLee Branstetter and Nicholas LardyNBER Working Paper No. 12373July 2006JEL No. O53, O19, F43, F14
ABSTRACT
As China has become an increasingly important part of the global trading system over the past twodecades, interest in the country and its international economic policies has increased amonginternational economists who are not China specialists. This paper represents an attempt to providethe international economics community with a succinct summary of the major steps in the evolutionof Chinese policy toward international trade and foreign direct investment and their consequencessince the late 1970s. In doing so, we draw upon and update a number of more comprehensivebook-length treatments of the subject. It is our hope that this paper will prove to be a useful resourcefor the growing numbers of international economists who are exploring China-related issues, eitherin the classroom or in their own research.
Lee BranstetterHeinz School of Policy and ManagementDepartment of Social and Decision SciencesCarnegie Mellon University2504B Hamburg HallPittsburgh, PA 15213and [email protected]
Nicholas LardyInstitute for International Economics1750 Massachusetts Avenue, NWWashington, DC [email protected]

3
I. Introduction
This essay summarizes China’s progressive opening to foreign trade and investment in the
years since 1978. These reforms led China’s foreign trade to soar from $21 billion in 1978, when
China at best was a marginal player in global trade, to more than $1.1 trillion in 2004, when
China became the world’s third largest trading economy (National Bureau of Statistics 2005, 161;
World Trade Organization 2005, 16). We will briefly review the history of Chinese trade and
investment policy from 1978-2001 and note the impact of important policy changes on expansion
of trade and investment. Because accession to WTO marked an important watershed in the
evolution of Chinese policy in this realm, we will also include a discussion of the key features of
the agreement under which China joined the WTO and an assessment of the progress China has
made to date in implementing its obligations. The WTO accession agreement opens up important
components of the service sector of the Chinese economy, and these will receive special emphasis.
We will also address the high-profile debate over China’s currency regime and discuss the
implications of China’s expanding trade and foreign investment for the rest of the world.
In providing this overview, we will be emphasizing several themes. First, China
achieved a greater degree of openness to foreign trade in manufactures prior to WTO accession
than is generally acknowledged, even in much of the best recent scholarship. In fact, the drive to
liberalization of trade and FDI regimes seems to have dramatically accelerated in the late 1990s.1
Second, the additional openings mandated under China’s WTO accession agreement will likely
make China’s economy the most open of any large developing country, and, to date, China has
made reasonable progress toward meeting her obligations. Third, developments in Chinese trade
and investment have generally conformed to patterns of Chinese comparative advantage, yielding
important benefits to China and her trading partners. Fourth, China’s current exchange rate
regime is no longer compatible with macroeconomic fundamentals. In addition to laying out the 1 This point was stressed in Lardy (2002), and much of the argument presented here is anticipated in that study.

4
key features of this issue, we discuss policy options and steps the government has taken so far.
Finally, China’s growth as a trading nation has recently reached the point where developments in
China have global impact. China’s impact is particularly strong in East and Southeast Asia, but
the degree to which this impact is on balance a positive one depends on the relative development
of the trading partner in question.
II. The Move to Freer Trade Prior to WTO Accession The Pre-Reform Trade Regime Up through the 1970s, Chinese trade took place within the context of a planned economy
and therefore nearly all trade was subject to very exacting quantitative guidelines. The State
Planning Commission’s import plan covered more than 90 percent of all imports. The export
plan was similarly comprehensive, specifying the physical quantities of more than 3,000
individual commodities. Prior to 1978, a handful of foreign trade corporations owned and
controlled by the Ministry of Foreign Trade were responsible for carrying out the import and
export plans. In this context, neither exports nor imports were sensitive to exchange rates or
relative prices.2 Furthermore, the composition of Chinese trade had little connection to Chinese
comparative advantage, with capital-intensive goods, including refined petroleum products,
playing a large role in Chinese exports well into the early 1980s. As a consequence, the volume
of Chinese trade, relative to world trade, declined sharply from 1.5 percent in 1953 to 0.6
percent in 1977 (Lardy 1994, 2).
Trade Liberalization
China gradually reformed its trade regime over the 1980s and 1990s. However, progress
was neither simple nor straightforward. As the authorities phased out the direct quantitative
planning of imports and exports, they began to rely more heavily on a complicated welter of
2 For more comprehensive examinations of the pre-reform trade regime and early trade and FDI reform, see Lardy (1992, 1994).

5
alternative trade policies, including conventional tools such as tariffs and quotas, and less
conventional instruments, limiting trading rights and tougher commodity inspection requirements.
The government actually raised import tariffs on most commodities in the early years of
the reform period. By 1982, the average statutory tariff rate was a relatively high 56 percent.
The government reduced this level to 43 percent in 1985, but then maintained that level
throughout the next seven years. Beginning in 1992, however, tariff levels fell in a series of
adjustments that brought the average tariff level down by two-thirds, to roughly 15 percent on the
eve of WTO accession (Lardy 2002, 34). In addition to tariffs, the government restricted trade in
a wide range of commodities by quotas and import licenses. This range of commodities actually
expanded over the course of the 1980s – by the end of the decade, nearly half of Chinese imports
was regulated by licenses or quotas. However, these restrictions were also dramatically cut in the
1990s. The share of imports they regulated fell to about 18 percent by 1992, and by 2001 it had
fallen further to about 8.45 percent (Lardy 2002, 39).
Throughout the reform period, the government restricted the right to engage in foreign
trade. Nevertheless, there was a rapid and substantial expansion in the number of domestic firms
granted trading rights, as show in Table 1. From the initial 12 firms directly controlled by the
Ministry of Foreign Trade, this expanded to about 800 firms by 1985. A decade later, the number
of trading firms stood at 12,000. By 2001, this has expanded further to 35,000. With such a large
number of potential suppliers of trading services, it is likely that the market for such services had
become reasonably competitive by the mid-1990s (Lardy 2002, 40-42).
The Export Processing Regime
China’s openness to imports expanded even faster than the decline in formal barriers
might suggest. A major reason has to do with the special privileges extended to firms involved in
export processing, which were set up in 1979. Initially, this legal framework provided various
incentives for the processing of raw materials for export and the assembly of imported goods to
produce finished goods for export. In 1987, the government expanded these incentives to provide

6
for duty-free import of all raw materials, parts, and components used in the production of goods
for export. Also joint ventures and wholly foreign-owned companies have generally been
allowed to import capital goods duty-free throughout the reform period. As an increasingly open
FDI regime brought in more foreign investment, this allowed a larger and larger fraction of
China’s imports to escape the formal trade barriers. Finally, in the second half of the 1990s, the
Chinese government began to exempt certain categories of domestic firms and other
organizations from import duties (Lardy 2002, 36; Naughton 1996, 307).
By the first half of 2000, less than 40 percent of imports were subject to any tariff. Thus,
actual tariff revenues have been far lower than the average statutory rates would suggest. As
shown in Figure 1, tariff revenues as a share of the value of imports peaked in the 1980s at about
16 percent of import values and fell steadily thereafter, reaching a low of about 3 percent by 1994.
A substantial portion of this decline reflects the enormous expansion of foreign direct investment,
the increasing importance of export processing, and the exemption of selected industries and
organizations from import tariffs altogether. It also reflects widespread violations of Chinese
trade laws (Lardy 2002, 36-38).
China’s Porous Protectionism in the 1990s3
In principle, by the mid-1980s, China had two trade regimes – a very open one for
foreign firms and domestic enterprises engaged in export processing, and a more restrictive trade
regime for all other enterprises. Feenstra (1998) called China’s trade regime an example of “one
country, two systems,” and claimed that the maintenance of special privileges for export
processing firms was contrary to both the letter and the spirit of WTO rules.
A dualistic trade regime of this type could, in principle, generate two sets of problems.
The first is akin to the problem of “trade diversion” in the economic analysis of customs unions.
Domestic Chinese enterprises in some industries might have a comparative advantage at
exporting a particular commodity or producing a certain good for the domestic market with 3 The reference to “porous protectionism” is taken from Kennedy (2004).
7
imported components. They might nevertheless be supplanted by FIEs due to the FIEs’ legislated
advantages. In theory, welfare is reduced relative to what would have prevailed under a more
even-handed trade regime, even one with a higher level of overall effective protection, because
production is undertaken by a set of producers with higher social costs. (Naughton 1996, 298-
315). The second potential problem is that a large segment of the Chinese economy could remain
effectively protected from foreign competition, but this is masked by the overall trade statistics,
which largely reflect the success of the export processing regime. The notion that large swathes
of the Chinese economy were effectively closed off to foreign competition provided the
intellectual foundation for the belief that credible implementation of China’s WTO commitments
would generate destabilizing shocks.
In practice, it is clear that the authorities have never been able to separate China’s two
trade regimes as completely as the letter of the law would suggest. Substantial quantities of parts
and components imported on a duty-free basis have been illegally sold in the domestic market,
and there have been substantial illegal sales in the domestic market of goods embodying duty-free
imports. In addition to “leakage” into the domestic market of goods imported under the export
processing regime, there has been a significant degree of outright smuggling, much of it via Hong
Kong.4
Lardy (2002) notes that despite China’s virtual ban on imports of U.S. citrus products,
U.S. oranges and other fruits were widely available from vendors on street corners in cities
throughout China in the 1990s. The value of oranges smuggled into China via Hong Kong
annually was a minimum of $43.5 million and more likely several times that amount. Hong Kong
re-exports of cigarettes (another banned item) and 35mm film to China were $242 million and
$159 million in 1998 – these numbers were large multiples of the amount of imports from Hong
4 China’s customs service launched a crackdown in 1998, leading to a large increase in the recorded imports of high-tariff items. The campaign eventually resulted in the arrest of high-level officials and an 80% increase in the absolute value of recorded tariff revenue in 1999. In 2000, tariff revenue increased an additional 30%, but did not keep pace with the 36% increase in import volume recorded in 2000. Tariff revenue as a fraction of import value remains at a very low level. See Lardy (2002, 37-38)

8
Kong recorded by Chinese trade statistics.5 Hong Kong was America’s fourth largest market for
U.S. pork in 1999, but more than half of that product subsequently made its way into China.6
Fisman and Wei (2004) conduct an interesting systematic study of the discrepancies between
Hong Kong and mainland Chinese trade statistics, which they term the “evasion gap.” Their
estimates suggest that an increase in the total import tax rate of 1 percent increases the evasion
gap by 3 percent!7
“Leakage” of goods and components into the domestic economy via the export
processing regime and outright smuggling increased the de facto level of openness in the
economy as a whole. Furthermore, measurable developments in Chinese trade in the latter half of
the 1990s suggests some decline in the “dualism” of China’s trade regime in these years.
Between 1995 and 2000, what the Ministry of Commerce classifies as ordinary imports grew 130
percent, from $43.7 billion to $100.08 billion. Over the same period, the sum of imports of duty-
free parts and components used in processing and the duty-free imports of capital goods of joint
venture firms grew only 37 percent, from $78.33 billion to $107.32 billion. Growth in ordinary
imports has continued to be quite rapid since WTO accession, although it may slow in coming
years, as the current unsustainable investment boom subsides. Growing linkages between firms
engaged in export processing and local firms caused the ratio of value added in export processing
to double over the 1990s (Lardy 2002, 9, 38, 180). This reflected both the displacement of
imported parts and components by locally produced parts and rising wages. This suggests that
the view of the export sector as an enclave with little connection to the local economy became
increasingly out of date by the eve of China’s accession to the WTO.
5 These statistics, reported in Lardy (2002, 163), were taken from the Hong Kong Trade and Development Council, Business Stat Online (stat.tdc.org.hk), and Customs General Administration, China Customs Statistics Yearbook, 1998, 6 See Jeff Bater, “Citrus, Wheat Recently Shipped to China,” Dow Jones Newswires, April 3, 2000 (http://interactive.wsj.com). 7 Hong Kong also plays a complicated role in mediating China’s exports to the rest of the world. For an exploration of this and its implications for trade statistics, see Feenstra et al. (1999) and Feenstra and Hanson (2004).
9
Foreign Exchange Reform and Tax Policy
The expansion of foreign trade was also abetted by changes in foreign exchange and tax
policy. Prior to reform, the regime maintained an overvalued exchange rate in order to subsidize
the import of capital goods that could not be produced domestically. Overvaluation led to excess
demand for foreign exchange, necessitating an extensive system of rigid exchange controls. Key
elements of this control system included a 100 percent foreign exchange surrender requirement
for exporters, tight limitations on the rights of individuals to hold foreign currency, and strict
controls on the outflow of foreign capital.
Over the course of the reform period, the government relaxed all of these restrictions.
The authorities devalued the official exchange rate in stages, from RMB 1.5 to the dollar in 1981
to 8.7 in 1994. Following a modest appreciation, the government effectively fixed the excahange
rate at RMB 8.3 to the dollar in 1995, a rate that was not changed until the summer of 2005. The
IMF estimates that the Chinese currency lost about 70 percent of its value against the dollar in
real terms over the period from 1980 and 1995, substantially enhancing the international
competitiveness of China-based export operations.8 In addition to substantial real devaluation,
Chinese exporters were allowed to retain part of their foreign exchange earnings, individuals were
allowed to hold foreign exchange, and capital outflow restrictions were relaxed.
Over the course of the reform period, China has come to increasingly rely on indirect
taxes to fund government expenditures. The World Trade Organization allows the rebate of
indirect taxes to exporters, in order to eliminate the disadvantage exporters in such countries face
relative to those based in countries that rely on direct taxes on income. The system of indirect
taxes in the 1980s was complex and a rebate program for exporters was correspondingly difficult
to administer effectively. As the value-added tax, which had only two basic rates, became more
8 This change was measured on the basis of the real effective exchange rate, i.e. on a trade-weighted basis and adjusted for the rate of inflation in China relative to its major trading partners (International Monetary Fund 1996, 50a)
10
important as a revenue source, the export tax rebate became easier to administer in some respects,
but the government still encountered difficulties.
The system was subject to extensive fraud as firms claimed rebates for goods that were
never exported. In addition, the government lacked the revenue to rebate all taxes and fell
considerably behind in rebate payments to exporting firms. The central government clamped
down on corruption and cut the rebate rates for exporters in 1995 and 1996. The export
slowdown experienced in the wake of the Asian financial crisis prompted the government to
reverse course, raising the amount of the tax rebated to 100 percent for some commodities and
accelerating the actual payment of rebates due. This arguably helped promote the extremely high
rates of export growth recorded after the Asian crisis began to abate, but it exacerbated the central
government’s financial problems.
International versus Intranational Trade
A number of studies have documented the existence and importance of interprovincial
protectionism in China (Wederman, 2003). Young (2000, 1091-1135) goes so far as to suggest
that China’s internal market has become substantially less integrated over the reform period, as
local governments have sought to shield local producers from competitors based elsewhere in
China.9 This assertion is undermined by extensive evidence. Naughton (1999) demonstrates that
interprovincial trade flows were quite substantial, even in the early 1990s. The level of
interregional trade implied by Naughton’s data is hard to reconcile with provincial autarky. Bai
et al. (2004), using more recent and more disaggregated data on the province-level industrial
composition, find evidence of increasing specialization in industrial structure over the course of
the 1990s, a direct contradiction of Young’s finding. They concede that there is clear evidence of
local protectionism, but conclude that it has substantially diminished over time. Huang and Wei
9 Branstetter and Feenstra (2002) present estimates of a formal political economy model in which provincial governments are presumed to protect locally based firms from both foreign competition and competitors outside the province. These estimates suggest a substantial decrease in the protectionist tendencies of the government through the mid-1990s.

11
(2001) have examined the speed of convergence towards the law of one price for identical
products in different cities in China over the 1990s and found that it is comparable to what
Parsley and Wei (1996) or O’Connell and Wei (2003) found for the United States. Finally,
foreigners who have traveled widely within China in recent years cannot fail to note both the
massive program to build major inter-provincial highways and the increasing visibility of both
foreign and domestic brand names with virtually nationwide distribution and advertising.
International integration appears to be proceeding together with intranational integration.
III. The Opening to FDI Prior to WTO Accession
Liberalization of Foreign Direct Investment
Despite rising interest in foreign direct investment in China after the 1972 visit of U.S.
President Richard Nixon, a number of severe restrictions on FDI remained in place – including a
ban on external financing of FDI projects – such that there was very little inward investment until
policies were dramatically changed in 1979. In that year a new Law on Joint Ventures was
passed, providing a basic framework under which foreign firms were allowed to operate.
Restrictions on external debt and equity finance were relaxed, and, as has been already indicated,
restrictions on foreign trade were reduced. Provincial and local governments were allowed
considerable freedom in regulating the joint ventures that were established within their
jurisdictions. In the same year, four “special economic zones” were established in which foreign
firms were offered preferential tax and administrative treatment and given an unusually free hand
in their operations.10
These “experiments” in attracting foreign direct investment were quite successful. In
1984, the government, in a bid to attract FDI, granted similar exemptions from taxes and
administrative procedures to 14 additional administrative units, mostly municipalities on China’s
Pacific coast. This granted units, known variously as “Opened Cities” or “Export and
10 These SEZs included Shenzhen (across the border from Hong Kong), Zhuhai (across the border from Macau), and Shantou (on the Guangdong coast facing Taiwan) and Xiamen (directly across the Taiwan Straits from Taiwan).

12
Technology Development Zones,” the authority to approve FDI projects under $30 million (a
threshold later raised to $50 million) at the local level.
The next major regulatory change in FDI came in 1986, with the implementation of a
legal regime change that Feenstra (1998, 6) has dubbed the “22 Regulations.” These changes
represented a major liberalization that applied throughout China. “Foreign invested enterprises”
were made eligible for reduced business income tax rates regardless of location, and were given
increased managerial autonomy. Tight controls on the remittance of profit in foreign currencies
were lifted. Finally, and most importantly, the 22 Regulations designated two categories of
foreign investments as being eligible for additional special benefits – “export oriented” projects
(defined as projects exporting 50 percent or more of their production value) and “technologically
advanced” projects (defined as projects which upgrade domestic production capacity through the
use of ‘advanced’ technology).
The 22 Regulations also set up an approval process for foreign direct investment projects
which remained in place until WTO accession, albeit with some modification. While the formal
regulatory framework implies substantial centralization of power over the approval process and
subsequent regulatory oversight of FIEs, there is considerable debate as to how much the central
government intervened in the oversight of FIEs after they are established. In practice, there
seems to be a considerable degree of de facto local autonomy in regulating FIEs. Investments
below a certain threshold size required only local approval, and this lead to the partition of large
numbers of FDI projects into sub-projects that fell below the threshold, in order to streamline and
accelerate the approval and negotiation process.11
The Rise, Fall, and Rise of FDI since 1989
The next major shift in FDI in China marked not so much a regulatory shift as a change
in the composition of foreign investors. FDI in China slowed briefly after the Tiananmen
11 See Rosen (1999, 56-59) for a discussion of the threshold and evidence supporting the view that such partitions took place. Huang (2004, 260-302) regards the small size of many FDI projects in China as a reflection of distortions in the economy.

13
Incident, but the inflows resumed and quickly grew in the 1990s.12 Whereas FDI in China in the
1980s had been overwhelmingly dominated by Hong Kong and Taiwan-based investors seeking
to exploit relatively low cost labor in the SEZs for export processing, in-flows diversified in the
1990s. Hong Kong and Taiwan-based investors continued to play an important role, but Japanese,
American, and European firms also increased their FDI into China, much of it focused on the
domestic market. Figure 2 illustrates the growth over time in contracted FDI and actual foreign
investment. Figure 3 shows variation over time in the number of FDI contracts approved and in
the nature of the entity created. Of particular interest is the growth in wholly-owned foreign
enterprises relative to equity joint ventures. Figure 4 breaks down growth in actual investment
flows by the nationality of the investing country.13
As Figure 2 shows, contracted FDI peaked in the early 1990s and declined sharply for the
rest of the decade.14 These contracts contained multi-year business plans, so it is not surprising
that there is a lag between the approval of a contract and the actual investment associated with it.
Nevertheless, the sharp divergence in these two time series hints at some problems that foreign
investors, particularly Western firms with little previous experience in China, encountered as they
rushed to enter the market in this period.15 The FDI boom began when China was in the midst of
12 Barry Naughton (1996, 278-280), among others, suggests that there was a de facto loosening of the official regulations on foreign direct investment which allowed multinationals to skirt the official export requirements. Essentially, export requirements were increasingly ignored or the definition of a “technologically advanced” project was broadened to allow even not particularly technology-intensive firms to set up plants to serve the Chinese market. 13 Because of official restrictions on direct Taiwanese investment in the mainland, some Taiwanese FDI gets routed through Hong Kong or through “tax haven” nations such as the Cayman Islands. Such “tax haven” jurisdictions are a prominent component of the “other nations” category shown in Figure 4. 14 In 1994, foreign-invested enterprises collectively accounted for about 17% of all fixed asset investment, prompting some scholars such as Huang (2003, 1-62) to refer to the “dependency” of Chinese investment on foreign firms. By 2000, the ratio of FIE investment to total investment had fallen to 10%. By 2003, even in the context of a substantial increase in FDI, the share of FIEs in domestic investment had fallen further, to 7%. 15 It is likely that the contracted amounts were subject to some over-reporting, as local officials vied to take credit for bringing FDI to their jurisdictions. However, the existence of a likely systematic upward bias in these numbers makes their decline in the mid-to-late 1990s all the more striking.

14
an unsustainable expansion, brought on in part by rapid credit creation.16 Demand growth was
rapidly outstripping supply, leading to a surge in inflation that peaked in 1994, when consumer
prices shot up by one-fourth. Zhu Rongji, then serving as vice premier and governor of the
central bank, initiated contractionary monetary and fiscal policies that reduced aggregate demand
and moderated price inflation. By 1996, growth and inflation were down to more sustainable
levels. Then the Asian crisis hit, leading to yet slower growth in domestic demand, a dramatic
slowdown in export growth, and domestic price deflation. The scale and number of FDI projects
approved in the early 1990s appear to have been motivated in part by an extrapolation of the
(unsustainable) expansion of domestic demand observed in those years. Firms also appear to
have been unprepared for the barriers they encountered in attempting to distribute their goods
within China.17 In the context of the domestic demand retrenchment that followed, it is
unsurprising that many ventures proved to be spectacularly unprofitable.
The speed with which FDI increased in the early 1990s also generated problems. Western
firms, primarily targeting the local market, were hoping to establish dominant market positions in
advance of their rivals. However, they were all competing for specialized resources (multilingual
Chinese managers, skilled labor, Western-style office space, etc.) whose supply was relatively
fixed in the short run. Predictably, costs for these scarce resources rapidly exceeded the
projections of some of these firms.18 Most foreign firms targeting the domestic market were
required to form a joint venture with a local Chinese firm, usually an SOE. The supply of well-
run, effectively managed SOEs was also quite limited. In their eagerness to set up operations, 16 Debates about the true size of the Chinese economy in the early 1990s suggested that real domestic demand was substantially larger than comparisons at market exchange rates would suggest. Some of the adjustment factors then favored have since been rejected as overoptimistic. See Studwell (2002, 158-162) for an account of how this academic debate was presented in the business press. Later research also confirmed that Chinese statistics increasingly overstated the true rate of growth. See Lardy (2002, 11-14). 17 Rosen (1999, 159-196) suggests, based on FIE manager interviews, that barriers to distribution arising from the inadequacy of transport infrastructure, institutional constraints preventing FIEs from controlling their own distribution channels, and the control of local governments over the important distribution channels were among the most serious barriers to serving the domestic market in the latter 1990s. 18 Again, Rosen (1999, 85-115) and Studwell (2002, 115-133) provide evidence of these cost increases. While not solely driven by foreign investors, the commercial real estate markets in Shanghai and some other major Chinese cities went through a pronounced “boom and bust” in the mid-to-late 1990s.

15
many firms forged alliances with enterprises that turned out to be far less efficient, amenable to
Western direction, or politically connected than they thought. The survey and interview evidence
presented by Rosen (1999, 17-83) suggests that many Western investors were unprepared for the
cultural clashes, administrative difficulties, and operational inefficiencies created by their “forced
marriages” to Chinese SOEs.19 Figure 3 illustrates a sharp downturn in the number of contracts
signed and a striking shift toward wholly owned foreign enterprises, as this option became
feasible in an expanding number of industries and situations.
The deep disillusionment harbored by some Western expatriates by the end of the 1990s
has been vividly captured by Studwell (2002, 137-153). Much of the reporting in the popular
press echoed this pessimism, stressing the difficulties multinational firms were having making
money in China.
Even as actual FDI levels had begun to fall, reformers in the Chinese government were
negotiating terms for WTO accession that dramatically expanded the freedom with which foreign
firms could operate in China. Prior to the signing of the agreement, more categories of FIEs were
allowed to sidestep joint ventures entirely and set up wholly foreign-owned enterprises.
Interference in supply chain management, product development, and operations was scaled back.
The final bilateral agreement with the U.S., signed in November 1999, signaled a dramatic
change in the Chinese operating environment. Contracted FDI increased almost immediately, and
levels of actual utilization began to follow suit, as can be seen in Figure 2.
A pickup in demand growth also spurred FDI. Chinese export growth rapidly expanded
as the regional economy recovered from the effects of the East Asian crisis.20 While the veracity
of the official GDP growth rates in the immediate aftermath of the East Asian crisis have been
19 Some of the operational inefficiencies were related to the “performance requirements” then in place in FIE contracts. Firms were often asked to meet targets for export of final output or localization of parts procurement than ran counter to what profit maximization would dictate. See Rosen (1999, 69-75). 20 Plans to eliminate the duty-free import of capital goods for export processing were abandoned, VAT rebates for exporters were expanded and payments were accelerated, and the government seems to have directed the banking sector to support export growth. See Lardy (2002, 18).
16
questioned, even the most pessimistic views suggest that Chinese GDP growth was more resilient
than that of other large economies in the region, possibly inducing firms that might have invested
elsewhere to focus on China.21 The austerity regime put in place in the mid-1990s was reversed
after the Asian crisis, interest rates were cut several times, lending by state banks was expanded,
and the government also sought to use a sizable fiscal stimulus to boost domestic demand.22
Export growth slowed sharply again in 2001, with the worldwide slowdown generated by the
September 11 attacks, but rapidly rebounded in 2002. While difficult to measure with precision,
estimates of the profits of foreign enterprises provided in Figure 5 appear to be consistent with
this pattern as they declined steadily through 1998, then rebounded sharply thereafter.23
Domestic demand was rapidly expanding again by the end of 2002 as investment
spending surged to high levels. Dramatic increases in the availability of consumer credit spurred
a sharp rise in purchase of automobiles, apartments, and other “big ticket” items. For firms such
as GM, that had rapidly built up technologically advanced production capacity in the mid-to-late
1990s under weak demand conditions, the surge in demand seemed to vindicate their aggressive
China expansion strategies.24 The impact of more expansionary monetary and fiscal policy on the
Chinese economy had been partially offset from 1998 through mid-2001 by a substantial
restructuring of state-owned manufacturing enterprises. Most small and medium scale state-
owned operations were sold off to their managers or to manager and worker investment groups,
21 Rawski (2001) suggests that growth in 1998 might have been less than one-half of the officially recorded level. 22 The Wall Street Journal reported that American firms had lost money in China in the 1980s, received minimal earnings on their Chinese affiliates throughout much of the 1990s, but earned much higher profits on their China operations beginning in 1999. By 2003, American corporate earnings from China and Hong Kong combined were roughly equal to their earnings from Japan – a much larger economy. See Andrew Higgins, “As China Surges, It Also Proves a Buttress to American Strength,” Wall Street Journal Online, January 30, 2004. 23 These estimates aggregate together foreign enterprises primarily engaged in export processing and foreign enterprises that primarily serve the domestic market. The profitability of the former is generally thought to have been relatively high throughout the period, whereas the profitability of the latter is thought to have fluctuated substantially. ROA is calculated on a pre-tax basis, using official statistics. 24 Chinese automobile sales grew an average of less than 1% per year during the 1998-2001 period. Then they surged 68% in 2002 and another 55% in 2003. Growth slowed sharply in 2004 and only partially recovered in 2005. See METI (2003), the National Statistics Bureau web site, and Wonacott (2004).

17
hundreds of state factories were shut down, and the larger remaining state-owned units began
laying off excess workers at an astonishing pace. When the dust settled the number of workers
employed in state-owned manufacturing establishments had fallen by about three-quarters, from
around 35 million in 1992 to less than 10 million in 2002, with most of the decline occurring in
the late 1990s (National Bureau of Statistics 2004b, 134). Once this period of retrenchment
waned, however, the economy began growing at a pace increasingly reminiscent of the boom of
the early 1990s. Even the uncertainty created by the outbreak of SARS, a previously unknown
and fatal respiratory ailment that rapidly spread throughout East Asia, failed to stall growth
momentum in 2003. By late 2003, however, the Chinese government was once again taking steps
to try to limit overinvestment and excessive growth, primarily through direct administrative
measures rather than higher interest rates or a revalued exchange rate.25 While these measures
appeared to have had some success, the scale of expansion in lending and investment suggested
that some of the progress made in scaling back non-performing loans in the late 1990s and early
2000s was likely undone in the investment boom of 2002-2004.26
Did Trade and FDI Drive Growth in the 1990s?
The rapid growth of Chinese exports in the decade prior to WTO accession, the relatively
large share of GDP the export sector has come to represent, and the persistent and growing trade
imbalance with the United States might suggest that net exports, and the FDI that contributed to it,
has been an important driving factor in Chinese economic growth in the 1990s. Many
accusations of “neo-mercantilism” on the part of the Chinese government are predicated on this
view.
25 An early casualty of these administrative controls was the automobile industry. The Chinese boom in sales was a boon to the large multinational assemblers, such as Volkswagen and GM. However, as of July 2004, sales were just 3.7% over the previous year’s levels – a sharp decline relative to industry expectations of 25-30% growth. Press reports suggested that production volumes, prices, and industry profits were all dropping sharply. See Taylor (2004) and the National Bureau of Statistics. 26 Similarly pronounced cycles of rapid growth followed by substantial slowdown can be seen in the trade statistics and in measures of domestic investment. For one theory-based analysis of the macroeconomic instability of the reform period, see Brandt and Zhu (2000).

18
In a narrow growth accounting sense, it is simply not true that net exports have been a
consistently important driver of growth in the 1990s, as is illustrated in Figure 6, using
components of the national income and product accounts taken from IMF International Financial
Statistics data. Growth in imports has broadly kept pace with growth in exports. In the eleven
years shown in this chart, net exports contributed positively to GDP growth in seven years and
detracted from it in four, but with few exceptions, the net impact was modest compared either to
capital investment or to private consumption. FDI, much of it export-related, has contributed to
capital formation, but as we have already noted, that contribution has also been relatively modest,
declining from a peak of 17 percent in 1994 to about 7 percent in 2003. Recognition of these
facts helps place useful bounds both on the degree to which recent growth can be ascribed to
trade and to the prospects for further “trade-driven” growth.
That being said, there is no question that expanding trade and FDI have contributed to
Chinese living standards since the reform period began and particularly in the last decade.
Chinese consumers have benefited from price declines and an increase in the quality and variety
of goods consumed, and China has been able to alter its pattern of industrial production to
conform to its comparative advantage. These are the static gains stressed by classical trade theory.
While difficult to quantify with precision, they are certainly substantial. Moreover, these gains
are shared with China’s trading partners, who have also benefited from cheaper imports, export
sales to China, and returns from investment in Chinese enterprises.
China’s increasing openness to trade and FDI also has fostered a much greater degree of
competition in Chinese product (and, increasingly, service) markets than would have otherwise
existed. This has provided a powerful disciplining force constraining the expansion of inefficient
enterprises, even when such enterprises received extensive support from other features of the
institutional environment, such as the problematic banking system. As foreign producers have
been allowed steadily greater freedom to operate in the Chinese market, this competitive pressure
has intensified, increasing the likelihood that market share gains are concentrated in the most
19
efficient firms. This, in turn, arguably raises the marginal productivity of capital and labor
throughout the economy, although it is clearly difficult to quantify this impact.
China has arguably gained in other dimensions as well, although these benefits are also
difficult to quantify. The ability to import technology embodied in capital goods and components
has certainly contributed to output expansion. Chinese workers and managers have also benefited
from training in foreign technology and management practices. While the Chinese economy as a
whole does not appear to exhibit exceptional performance in terms of total factor productivity
growth, it is clear that the relative labor productivity of Chinese workers has increased
substantially, particularly in the export sector. This has been partially reflected in wage increases
and will be eventually reflected in an appreciation of the real exchange rate. Given the level of
China’s openness to trade, the improvement in terms of trade that would result from such an
appreciation would confer nontrivial welfare effects.27
Huang (2003) has suggested that the prominence of FIEs in Chinese production and trade
reflects systematic discrimination against indigenous private Chinese firms, making it difficult for
them to acquire capital, defend their property rights, and engage in foreign trade. We would not
contest the view that the repression of the private sector has generated welfare-reducing
distortions, and we agree that misallocation of capital by the Chinese financial system has created
serious problems (Lardy 1998). That being said, we do not regard the prominent position of FIEs
as simply reflecting distortions in the Chinese economic system. While it is possible that FIEs
would play a less prominent role in a counterfactual world in which these distortions did not exist,
we believe that even under these alternative circumstances, foreign investors would find China an
attractive place in which to locate export processing operations. The fundamental attractors of a
27 Whalley and Xin (2006) estimate that the expansion of FIEs may have accounted for more than 40% of Chinese GDP growth in 2003 and 2004 and that the absence of FDI inflows in those years would have reduced growth by about 3.4 percentage points. They suggest that a slowdown in FDI inflows could cause GDP growth to drop significantly. The growth decomposition on which this calculation is based rests on a number of assumptions that can be called into question. (For example, foreign supplied capital is assumed to be the only non-labor input to the FIE sub-economy.) We regard Whalley and Xin’s calculations as an upper bound estimate of the impact of FIEs on China in recent years.

20
large, low-cost labor force, relatively good export infrastructure, and the ability to purchase inputs
at world prices, would still exist under this counterfactual scenario. In addition, China’s internal
market might, if anything, be even more attractive, and growing even more rapidly, under a
counterfactual scenario in which the financial system was not burdened by a large stock of
nonperforming loans to state-owned enterprises. Despite recent rapid growth in the size,
investment, and legal recognition of the private sector in China, FIEs continue to play an
important role in mediating China’s foreign trade. We expect this to continue, at least in the
short-to-medium run.28
IV. China’s WTO Accession Agreement and its Implementation
A significant portion of the tariff reduction and other trade liberalization measures that
the Chinese government undertook in the 1990s were essentially part of China’s WTO accession
process. To gain credibility with its negotiating partners that it was seriously committed to
opening up its economy, China chose to unilaterally liberalize. Then in its key final bilateral
negotiations with the United States in 1999 China agree to additional market opening
commitments that were incorporated into China’s final WTO accession package. In this process
China agreed to a set of conditions that were far more stringent than the terms under which other
developing countries had acceded. Indeed, in certain respects China’s liberalization
commitments exceed those of advanced industrial countries. Why did China’s leadership agree to
such commitments, given that they were expected to entail substantial short-term adjustment
costs?
The most plausible answer to this question was the one given by Premier Zhu Rongji at
the time of his visit to the United States in April 1999. On that trip Premier Zhu, perhaps for the
28 Wells (1991) among others has pointed out that while the Asian NIEs were able to expand their exports of labor-intensive manufactures under largely contractual arrangements, the growth of labor-intensive manufacturing exports elsewhere in Asia, such as in the ASEAN countries, has been driven to a much greater extent by FDI. Wells (1991) and the discussion contained therein provide a number of reasons why FDI has been more important in the period since the mid-1980s, even in countries that lacked China’s legal and institutional discrimination against private firms.
21
first time, openly expressed the view that China’s membership in the WTO was an essential
element of his reform strategy. He had come to the view that more competition was an essential
source of pressure that would ultimately force state-owned enterprises and banks to take
additional structural reforms. In his joint press conference with President Clinton he stated “The
competition arising [from WTO membership] will also promote a more rapid and more healthy
development of China’s national economy.”29
Premier Zhu and most of those around him came to believe that China had no viable
alternative to becoming even more deeply involved in the globalizing economy. Long Yongtu,
China’s chief WTO negotiator, clearly understood that a growing array of goods were being
produced in global rather than national production networks. He also had the insight to realize
that simply reducing import barriers was insufficient if China wanted to benefit from
globalization. Rather, he said “Countries with planned economies have never been part of
economic globalization. China’s economy must become a market economy in order to become
part of the global economic system, as well as the economic globalization process.”30 In short,
China’s top political leadership made extensive commitments to the WTO in order to advance
their domestic reform agenda.
Here we briefly summarize the most important features of China’s WTO accession
agreement, and note the progress China has made in terms of meeting its commitments. A more
thorough treatment of the agreement is available in Lardy (2002). China’s commitments
regarding its service sector will be examined in the next section.
Trade in Manufactures
29 The White House, Office of the Press Secretary, “Joint Press Conference of the President and Premier Zhu Rongji of the People’s Republic of China,” April 8, 1999. 30 Long Yongtu, “PRC Trade Official Long Yongtu on China, Economic Globalization , WTO Entry,” People’s Daily, July 10, 2000, www.peopledaily.com.cn accessed August 1, 2000.

22
China agreed in 1999 to lower its average tariff levels on industrial products to 8.9
percent. Most of these new tariff levels have already been phased in as of the time of this writing
in mid-2005, some even well in advance of the timetable required under WTO obligations.
Tariffs on some important classes of goods, such as information technology products, have
already been cut to zero. Even more significantly, China agreed to eliminate all quotas, licenses,
tendering requirements, and other nontariff barriers to imports of manufactured goods by 2005.
China has agreed to modify its import registration system to make it consistent with the WTO
Agreement on Import Licensing. By and large, these obligations have been met. Recent U.S.
criticism has focused on preferential VAT tax treatment for domestically produced fertilizer and
semiconductors, which constituted a de facto import tariff for foreign producers exporting to
China. These tax preferences were eliminated for semiconductors in 2004. China eliminated the
last import quota, that on automobiles, on January 1, 2005. However, China has the right to
maintain indefinitely a fairly high 25 percent import tariff on automobiles. This is expected to
limit growth in auto imports.
China will retain the state monopoly on foreign trade for a small number of commodities,
which nevertheless includes critical imports such as crude oil, refined petroleum products,
fertilizer, cotton, grain, and vegetable oil, and key exports such as tea, tungsten, silk, cotton
products, and fossil fuels.31 Outside this narrow set of categories, China promised to abolish by
the end of 2004 the designated trading system, by which trade in a broader range of commodities
is limited to a small number of trading companies designated by the central government. More
generally, China agreed to provide the right to import and export to all firms active in China,
foreign and domestic. The USTR (2004, 2005), in its annual reports on foreign barriers to U.S.
trade, acknowledged China’s progress in meeting these obligations.
31 China is not unique in mandating a state monopoly in trade for a limited range of products, and such practices are not prohibited under the Uruguay Round Agreement.

23
Parties opposed to China’s WTO accession suggested that China would use
discriminatory product standards to keep out imports of industrial products. In December 2001,
the Chinese government promulgated a new, compulsory product certification system that
required domestic and foreign products in over one hundred product categories to obtain the
China Compulsory Certification (CCC) mark. The certification process involves on-site
inspection of foreign manufacturing plants, undertaken at producer expense. U.S. firms have
complained about the inconsistent and arbitrary enforcement of these rules, which has included
the blockage at the border of product samples intended for testing by Chinese government
officials. However, there is no evidence that these practices have become a major constraint to
trade in the affected categories (USTR 2004).
FDI in the Manufacturing Sector
The pre-WTO regime regulating foreign direct investment contained explicit provisions
requiring some FIEs to achieve a certain degree of local content, balance their trade by offsetting
imports of components with exports of final products, or meet their foreign exchange
requirements through exporting. In addition, FIE approvals were often contingent on technology
transfer to domestic partners or the establishment of research centers in China. The WTO
Agreement on Trade-Related Investment Measures (TRIMs) explicitly precludes WTO members
from imposing restrictions on investment that create trade restrictions or distortions. The
measures that are precluded include local content requirements, trade balancing requirements, and
foreign exchange balancing requirements. China agreed to fully enforce the provisions of the
TRIMs agreement upon accession, and it also agreed not to enforce provisions of existing
contracts with foreign firms that are inconsistent with TRIMs. As we have already noted,
however, many of these provisions were not strongly enforced even prior to WTO, and the de
facto investment regime became steadily more open in the late 1990s.
China agreed in principle to cease the practices of pressuring foreign firms to transfer
technology to local partners and to increase the domestic content of automobiles assembled in
24
China. While TRIMs rules out forced technology transfer, there is an extensive set of practices
“encouraging” technology transfer that are arguably permissible under TRIMs, and many of these
practices appear to persist in China, drawing some criticism from foreign firms and the USTR.
State-owned firms are free to “request” technology transfers as part of a sales contract, and
international competition among vendors eager to expand in the Chinese market provides these
Chinese customers with extensive leverage.32 The National Development and Reform
Commission’s new plan for industrial policy in the automobile industry published in May 2004
continues to include provisions that discourage the import of auto parts.33 This has drawn some
criticism from foreign automobile firms.
However, the most serious dispute over “forced technology transfer” since WTO
accession was recently resolved on terms favorable to foreign industry. In May 2003, China
issued two mandatory standards for encryption over Wireless Local Area Networks (WLANs),
applicable to domestic and imported equipment containing WLAN (also known as Wi-Fi)
technologies. These standards, which were originally scheduled to become fully effective in June
2004, incorporate the WLAN Authentication and Privacy Infrastructure (WAPI) encryption
technique for secure communications. This component of the standards differed significantly
from the internationally recognized standards that U.S. companies have adopted for global
production. China sought to enforce the use of these standards by providing the necessary
algorithms only to a limited number of Chinese companies. Accordingly, U.S. and other foreign
manufacturers would have to work with and through these companies, some of which were their
competitors, and provide them with technical product specifications, if their products were to 32 See Kranhold, “China’s Price for Market Entry: Give Us Your Technology, Too,” February 26, 2004, Wall Street Journal Online Edition. The article details how GE’s power generation business was pressured to transfer sensitive turbine technology in return for contracts with state-owned utilities. The willingness of foreign competitors to transfer technology in return for business was a key factor in GE’s decision to do so. No one suggests that this policy is in violation of China’s obligations under its WTO accession agreement. Boeing is another U.S. firm that has shown a willingness to voluntarily transfer technology in order to gain a competitive advantage over arch-rival Airbus. 33 The Chinese government revised the draft plan circulated in 2003 to eliminate a requirement that foreign companies use separate distribution channels for domestic and imported automobiles (United States Trade Representative 2005, 77).
25
continue to be sold on the Chinese market. The U.S. IT industry quickly enlisted top-level
government support in opposing this measure, viewing it as a TRIMs-inconsistent attempt to
force transfer of sensitive technology to competitors and as a WTO-inconsistent attempt to
misuse product standards to restrict trade. After several months of high-level consultation, the
Chinese government quietly dropped the proposed mandatory standards (Kennedy 2004).
While foreign investors generally have viewed favorably China’s implementation of its
WTO obligations, an important exception is the area of intellectual property rights. In principle,
China is bound under the TRIPs agreement to enact and enforce adequate standards of intellectual
property protection. After bilateral negotiations with the United States, China enacted a patent
law in 1993, which would seem to be fully in compliance with TRIPs, but lack of enforcement
continues to be an issue for foreign firms. While central government officials regularly affirm
their commitment to better enforcement, foreign investors claim that local officials take a far
more permissive view of patent and trademark infringement.34
As part of its pathbreaking commitment to open up the distribution services sector, China
also agreed to allow foreign firms much greater control over the advertising, distribution, and
after-sales service of their goods, both those produced in China and those imported from outside
the country. The increasing participation of foreign distributors in China is expected to improve
the efficiency of the sector, ameliorating one of the persistent problems faced by foreign firms
seeking to market goods outside the major cities.
Agricultural Trade
China also agreed to significant liberalization of its agricultural markets. China pledged
to reduce the average statutory import tariff rate for agricultural products from 21 percent to 15
percent (Rosen, Rozelle, and Huang 2004, 8, 41). Prior to WTO accession, China, like many
34 In September 2004, the American Chamber of Commerce in China issued a statement praising the Chinese government for what was viewed as a largely faithful implementation of its WTO obligations. At the same time, the chamber singled out intellectual property rights as a critical exception. See Charles Hutzler and Phelim Kyne, “U.S. Businesses Urge China to Rein in Piracy,” September 17, 2004, Wall Street Journal Online Edition.

26
other countries, limited imports of sensitive agricultural commodities with quotas and other
nontariff barriers that created effective rates of protection far higher than the 21 percent average
statutory rate. Bound by the Agreement on Agriculture in the Uruguay Round, China is required
to eliminate nontariff barriers to the import of agricultural products and replace them with tariffs
that provide equivalent protection, as part of the goal of making agricultural protectionism more
transparent and setting a common basis among countries for negotiating future tariff reductions.
The agreement requires countries to offer minimum “access opportunities” for
agricultural commodities subject to tariffication. These take the form of limited levels of imports
that are admitted at relatively low tariff rates, with all imports above that level subject to much
higher tariff rates. China is noteworthy in terms of the relatively large amount of imports that
will be admitted at lower rates and the very low tariff rates being charged on these levels. China
agreed to impose tariffs of only 1 percent on “minimum access” levels of imports for wheat, corn,
rice, and cotton. The minimum access levels are themselves considerably higher than the actual
level of imports of these products in 1998. On the other hand, even when fully phased in,
minimum access requirements would be a small share of projected domestic consumption, and
China’s commitments with regard to rice fall short of the standards specified in the WTO
Agricultural Agreement. China’s compliance with this agreement remains an area of contention
with its trading partners, particularly the U.S. 2002 trade data showed that quota fill-rates for
wheat, corn, and cotton were 7 percent, 0.1 percent, and 22 percent, respectively. However, U.S.
agricultural exports to China grew substantially in 2003. U.S. cotton exports increased by 430
percent and soybean exports increased by 218 percent over 2002 levels.35
Health standards have been frequently employed as a de facto nontariff barrier to
agricultural imports. China agreed to be bound by the WTO Agreement on Sanitary and
Phytosanitary standards. Bilateral agreements with the United States prior to WTO accession
resulted in the removal of blanket bans on imports of citrus fruit, wheat, U.S. leaf tobacco, and 35 Data are from United States International Trade Commission Database at http://dataweb.usitc.gov.
27
meat from certain U.S. regions that had been justified on the basis of health standards.36 Since
joining the WTO, however, China has issued more than 100 new quality and health standards for
foods. U.S. exporters complain that many of these have not been publicly documented with the
WTO in detail, as WTO obligations require, and that they are both designed to block imports and
applied in ways that discriminate against imports. Phytosanitary barriers continue to block
imports of stone fruit, several varieties of apples, pears, fresh potatoes, and processed food
products containing certain food additives, according to the USTR. AQSIQ, the new agency in
charge of administering these quality standards, has de-listed four U.S. meat processing plants
and continues to hold up imports of citrus products from four counties in the State of Florida.
Imports of wheat from the Pacific Northwest, while permitted, are apparently singled out for
special treatment by quarantine officials, discouraging imports. U.S. soybean imports were
disrupted by the announcement of a ban on imports from four companies trading U.S. soybeans
due to detections of phytophthora sojae, which is ubiquitous in China. The suspension of imports
was delayed after high-level U.S. government intervention. U.S. exporters are also concerned
about new regulations on agricultural biotechnology, testing, and labeling. Transgenic soybean
imports have been formally approved, but approval was still pending on six corn varieties as of
late 2003.
China also agreed to significant limitations on agricultural subsidies. China has agreed to
limit its domestic agricultural subsidies to 8.5 percent of the value of agricultural output and its
subsidies of any particular crop to no more than 8.5 percent of the value of that crop. The limit
for developing countries under the Agricultural Agreement is 10 percent. China is forced to
include investment subsidies and subsidies for inputs such as fertilizer in calculating total
agricultural subsidies, unlike most developing countries. China also agreed to eliminate export
subsidies for agricultural products upon accession, something that neither the United States nor
36 However, as already noted, there was a substantial amount of smuggling of these “banned” products into China via Hong Kong. The growth in legal exports to China is likely to be partially offset by the decline in exports to Hong Kong.
28
the EU has agreed to do. This was significant given that China employed export subsidies of
about $500 million per year in the base period used for negotiation in the Uruguay Round.
A Double Standard for China?
Finally, China accepted an accession protocol that would allow Chinese trading partners
to impose restrictions on Chinese exports under conditions that are substantially weaker than
those WTO members must ordinarily meet before imposing import restrictions. Restrictions can
be imposed solely on Chinese exports, even when exports of the same product from other
countries have increased, and they can be maintained without an effective time limit, whereas the
WTO Agreement on Safeguards imposes an 8-year time limit. Furthermore, China has accepted
limitations on its ability to retaliate that are more stringent than the limitations contained in the
Safeguards Agreement. In addition to this transitional arrangement, China has agreed to a special
textile safeguard that would allow its trading partners to limit the growth of textile and apparel
products to 7.5 percent per year after the phase-out of the WTO Agreement on Textiles and
Clothing, the successor agreement to the Multifiber Arrangement negotiated under GATT. The
textile provision will remain in place until 2008.
China has also agreed to accept discriminatory terms in its protocol of accession in
antidumping. Under U.S. trade law, China has for many years been treated as a nonmarket
economy in antidumping cases. That means that the U.S. Department of Commerce does not
compare prices of goods sold in the U.S. market to prices prevailing in China or in third countries,
because key inputs may be supplied to Chinese firms at below-market prices. Instead the
Department of Commerce calculates “normal value” by soliciting information from Chinese firms
on input quantities, using input prices of a third country where input prices are believed to be
market determined, then adding to these direct production cost calculations estimates of
“reasonable amounts” for administration, sales, other costs, and a profit margin. Alternatively,
the Department of Commerce can simply use as a standard for “normal value” the cost of
production in a third country. This creates a double standard that could easily be abused by

29
domestic producers in competition with Chinese exporters. Nevertheless, the Chinese
government has allowed the U.S. and other trading partners to use the “nonmarket economy”
methodology in antidumping investigations for up to fifteen years after accession.37
WTO Accession: A Watershed, not a Sea Change
While negotiations over China’s WTO entry were ongoing in the late 1990s, a number of
studies were conducted estimating the impact of WTO accession on Chinese trade, employment,
and growth. Some predicted that China would incur significant restructuring costs in meeting its
WTO commitments.38 Other studies forecast fairly dramatic increases in imports as import tariffs
were reduced. There was a tendency for these studies to overestimate the impact of WTO,
because many were based on conditions that existed in the mid-1990s, and did not take into
account the dramatic acceleration of reform in the years immediately preceding China’s WTO
entry.
As we have already stressed, China cut tariffs, broadened trading rights, and liberalized
its FDI regime even prior to formal WTO accession. The Chinese government also launched a
major effort to restructure state-owned manufacturing industries, engineering a dramatic decline
in SOE manufacturing employment and an improvement in profitability. Steps were also taken to
eliminate or reduce import price differentials prior to WTO accession. The government
substantially cut the prices for wheat and corn in 1999, two years before WTO accession, driving
prices toward international levels, and starting the process of moving farmers out of grain and
into less land intensive crops.39 Steps were also taken to hasten the convergence of prices to
37 Kennedy (2004) studies China’s own use of the antidumping law it adopted in 1997, providing statistics and interview-based qualitative evidence on the 30 investigations launched by the middle of 2004. Kennedy finds that foreign respondents won a partial or complete victory in over forty percent of all concluded AD cases. Kennedy attributes the surprisingly evenhanded application of China’s AD law to the interests of import-using industries in maintaining adequate supplies of key inputs. 38 One study predicted that the opening in agriculture alone would eliminate employment for 8 million wheat farmers, 30% of the number engaged in wheat production. Substantial reductions in employment and output were also forecast for natural rubber, plastics, and rolled steel. See Zhang, Zhang, and Wan (1998). 39 See Foreign Agricultural Service, People’s Republic of China: Grain and Feed Annual Report 2000, GAIN Report CH0009, U.S. Department of Agriculture, February 2000, p. 2, 7. See also Trish Saywell

30
world levels for petroleum products, transportation services, wholesale electricity prices, and
water and natural gas.40 Because the structural change and price convergence the WTO-
mandated liberalizations would generate were already underway prior to formal accession, the
impact of WTO per se, has arguably been smaller than some might have predicted.
That being said, the combination of China’s pre-WTO and post-WTO reforms is making
it arguably the most open large developing economy. By 2005, China’s average statutory tariff
on industrial products will be 8.9 percent. For Argentina, Brazil, India, and Indonesia, the
respective percent figures are 30.9, 27.0, 32.4, and 36.9.41 China has agreed to bind all tariffs as
the new statutory rates are phased in, meaning that it has committed to not raise any existing
tariffs on industrial products above existing levels as some are reduced. India, in contrast, has
only bound two-thirds of its tariffs.42 China’s FDI regime is one of the most open and welcoming
of any country in the world, and China has made liberalization commitments in all of the service
industries covered by the WTO General Agreement on Trade in Services. Only a handful of
members come close to meeting this standard. Former U.S. Trade Representative Charlene
Barshefsky described China’s commitment to liberalize its distribution system as “broader
actually than any World Trade Organization member has made.”43 China also has made
relatively strong commitments to liberalize financial and telecommunications services.
This high degree of openness is evidenced by the sharp increase in Chinese imports in
recent years, which, in turn, has had an increasingly powerful impact on the East Asian regional
economy and, indeed, on the global economy. However, important macroeconomic imbalances,
and Kathy Wilhelm, “Seeds of Change,” Far Eastern Economic Review, June 29, 2000, pp. 44-46, and Stephanie Hoo, “China’s Wheat Farmers Already Shifting Crop Mix Pre-WTO,” Dow Jones Newswires, June 16, 2000. 40 See the discussion of these policy initiatives in Lardy (2002), pp. 26-27. 41 General Agreement on Tariffs and Trade, The Results of the Uruguay Round of Multilateral Trade Negotations: Market Access for Goods and Services: Overview of the Results, app. table 6. 42 Gary Hufbauer and Daniel Rosen, “American Access to China’s Market: The Congressional Vote on PNTR,” International Economic Policy Briefs, 00-3, www.iie.com, May 1, 2000. 43 Charlene Barshefsky, “U.S. Trade Policy in China,” Hearings before the Senate Finance Committee on the Status of China’s Application to Join the World Trade Organization, April 13, 1999, www.fnsg.com.

31
clearly not sustainable in the long run, are also playing an important role in driving this growth.
These issues are addressed in the next sections.
V. China’s Liberalization in the Services Sector
China made pathbreaking commitments in its accession to the WTO to open up its
service sector to foreign investment and competition. The promised openings were especially
significant in distribution, telecommunications, and financial services but commitments were also
made in professional, audiovisual, and construction services (Lardy 2002, 66-75).
Prior to China’s entry into the WTO the Chinese government severely restricted the
ability of foreign firms to distribute goods in China. They could import inputs, equipment, and
other materials directly related to their manufacturing or processing operations. But to import
products made outside of China they had to use an agent and generally these goods could not be
sold in the same distribution channels these firms used to sell goods they made in China. Thus,
for example, it was cumbersome for companies like General Motors or Volkswagen to import and
distribute vehicles made outside of China.
Complying with the terms of its entry, China by the end of 2004 had phased out all
geographic, ownership, and most other types of restrictions on wholesaling and retailing, as well
as related distribution services such as franchising, commission agents, and repair and
maintenance services.44 As a result, China is “in full compliance with its WTO commitments on
trading rights for all Chinese-foreign joint ventures, wholly foreign-owned enterprises and foreign
individuals (United States Trade Representative 2005, 75).
China agreed to substantially open its market in banking, insurance, securities, fund
management, and other financial services. In banking many restrictions, such as the number of
cities in which foreign banks can operate, were lifted from the beginning of 2005. However, not
until five years after accession, at the end of 2006, will Chinese regulators have to offer full
44 According to China’s distribution commitments, certain product restrictions will not be lifted until the beginning of 2007 and China has denied in perpetuity the right of foreign firms to engage in the wholesale distribution of salt and tobacco or the retail distribution of tobacco products.

32
national treatment to foreign banks, meaning that any remaining restrictions that apply only to
foreign banks must be eliminated. Most importantly, at that time foreign banks will be able to
offer domestic currency services to Chinese citizens for the first time.
Liberalization has resulted in a significant increase in foreign bank presence in China.
Even prior to China’s accession to the WTO foreign banks operated more than 150 branch banks
in more than 23 cities. They accounted, however, for only 1.5 percent of all bank assets in 2000
(Lardy 2002, 115-116). From the time China became a member of the WTO to the end of 2004
China authorized an additional 31 foreign branch banks to open for business.45 However, the
assets of foreign banks as a share of all financial institutions had increased to only 1.8 percent by
year-end 2004.46 The slow pace of penetration of the market reflects the remaining limitations on
the scope of business these banks can conduct and regulatory requirements that increase the cost
of providing banking services (United States Trade Representative 2005, 103).
If foreign banks have made only slow progress in building their businesses through
opening branches, they have moved much more rapidly to invest in China’s domestic banking
institutions. This too got underway prior to China’s accession to the WTO but has accelerated
since. The Asian Development Bank and the International Finance Corporation (the investment
banking arm of the World Bank) paved the way for foreign ownership of Chinese banks by
investments that they made as early as 1996 (Lardy 1998, 67, 167). By 2005 about a dozen
foreign banks had taken stakes in various city commercial banks and national shareholding banks.
This process was facilitated by China’s unilateral decision in late 2003 to increase the limit on the
stake that could be held by a single foreign financial institution in a Chinese bank from 15 percent
to 20 percent (Chinese Bank Regulatory Commission 2003). Even more important, as part of the
restructuring and public listing of some of the large state-owned commercial banks, the state sold
45 A complete list of all foreign branch banks licensed to operate in China is contained in each issue of The People’s Bank of China Quarterly Statistical Bulletin. 46 At year-end 2004 assets of foreign branch banks were RMB 516 billion out of financial system total assets of RMB 28,205 billion. People’s Bank of China Quarterly Statistical Bulletin, 2005 No. 2, pp. 13, 49.
33
off strategic stakes to foreign investors in the Construction Bank of China and the Bank of
China.47
As in the case of banking, China by the beginning of 2005 had swept away geographic
restrictions on where foreign insurance companies can do business. In line with its prior
commitments, the government also has largely lifted restrictions on the types of products that
foreign insurers can provide, allowing these firms to offer property and casualty insurance, health
insurance, as well as group policies, pensions and annuities. However, foreign firms are
restricted to operating in joint ventures with Chinese partners with the foreign share limited to 51
percent in a nonlife insurance business and 50 percent in life insurance.48 Measured by premium
income China’s overall insurance market is growing rapidly, but the share of the industry
controlled by foreign firms remains relatively small at 2 to 3 percent (United States Trade
Representative 2005, 76).
China’s liberalization of its securities and fund management sector is somewhat more
restricted than the opening in banking and insurance, since foreign ownership restrictions are
somewhat more severe.49 Moreover, joint venture securities firms are not allowed to trade in A
shares, the largest source of income in the Chinese securities industries. Nonetheless a number of
joint venture securities and fund management firms have been launched. In the fund management
business well known western firms such as UBS, JP Morgan, Credit Suisse First Boston,
Prudential Financial and Schroder Investment Management have all established joint ventures.
In telecommunications China agreed to ease foreign investment restrictions and, more
importantly, agreed to embrace procompetitive principles such as transparent licensing, cost- 47 Investors in the Construction Bank were Bank of America and Temasek, a Singaporean government investment vehicle. UBS and Royal Bank of Scotland took strategic stakes in the Bank of China. It seemed in mid-2005 that the process of selling stakes to foreign investors in the Industrial and Commercial Bank of China, far and away China’s largest bank, were also well advanced though no specific transactions had been formally confirmed. 48 The sole exception is AIG. It received its first license to sell insurance as a wholly foreign-owned company in 1992 and still wholly owns all of its life insurance operations. 49 Foreign firms are limited to a maximum one-third ownership stake in joint venture securities businesses. In fund management the foreign share was initially restricted to one-third but this was raised to 49 percent beginning three years after accession in December 2004.

34
based pricing, and the right of interconnection. While China did formally separate the regulatory
and operating functions of the Ministry of Information Industry, the successor to the old Ministry
of Posts and Telecommunications, and promulgated Regulations on Foreign-Invested
Telecommunications Enterprises, which provides the promised regulatory environment for
foreign investment in the sector, to date there has been practically no foreign participation in the
telecommunications market (United States Trade Representative 2005, 110-112).
A number of East Asia’s earlier success stories, such as Japan and South Korea, have
been characterized as possessing a dual economy (McKinsey & Co, 1994; IMF, 2005). On the
one hand, there are export-oriented manufacturing sectors that have been forced to contend with
the best competitors in the world for decades. These sectors tend to have productivity levels that
compare favorably with those of the U.S. On the other hand, the domestically oriented service
sectors, in which competition has been muted by government regulations and restrictions on entry,
are much less competitive. The low productivity of these sectors drags down living standards for
the economy as a whole. China’s early opening to FDI in its service sector holds out the
possibility that its own service industries will be characterized by a considerably higher level of
competition and productivity than was true of Japan or Korea at a similar stage of development.
Early inroads by efficient foreign firms could ensure that only efficient domestic firms are able to
expand as the market develops. This will prevent the emergence of a dual economy or, at least,
will constrain the degree to which it constitutes a drag on living standards going forward.
While we certainly believe the early opening of the service sector will be to China’s
benefit, the implementation of this opening is an ongoing process, there are important limits to
what China has promised in its WTO accession agreement, and the long-run effects are difficult
to predict. Large swathes of the service economy (education, health care, power generation) will
remain largely closed to participation by foreign for-profit enterprises, much as they are in many
Western countries. Even in the opened sectors, in the short-to-medium run, Western service
providers may find it challenging to translate their business models to a Chinese context in which

35
the income level of the population, the economic geography of consumer purchasing power, and
the tastes of consumers are likely to be radically different from those found in the providers’
home markets. This will be particularly true in financial services, where important features of the
regulatory regime, including the closure of the capital account, will starkly limit the potential
profitability of foreign firms for the foreseeable future.
Openness to FDI in services in Japan – which has existed in many service sectors for
some time – has not yet eliminated the dual economy. Although Japanese income levels are close
to American ones, many American firms have struggled to adapt to the different tastes of
Japanese consumers, constituting less of a threat to Japanese incumbents than one might have
hoped. Barriers to exit for uncompetitive enterprises have also been a factor inhibiting
productivity growth in the low-productivity sectors. Some of the barriers – such as government
credit subsidies to less efficient firms – are hardly unknown in China. Convergence of the
productivity of the Chinese services sector to American levels is likely to take many years.
VI. The Structure of China’s Exports
Does China’s rapidly growing trade conform roughly to its comparative advantage or
have supporting industrial and other government policies allowed firms to move up the
technology ladder much more rapidly than would occur for a market economy with factor
endowments similar to China? This question has been posed by both academic economists such
as Schott (2006) and Lall and Albaladejo (2004) and by trade and industry associations based in
Washington. Schott, for example, finds that over time Chinese exports exhibit rising
sophistication relative to countries with similar aggregate endowments and that it exports more
products in common with the capital and skill abundant members of the OECD than its peers.50
Preeg (2004, 9), a researcher with the Manufacturers Alliance, charges that China’s emergence as
a major supplier of information technology, communication, and electronic products is a
50 However, Schott qualifies this finding by documenting a decline in the prices of Chinese exports relative to OECD exports of similar products.

36
consequence of policies described as “high tech mercantilism,” that poses a major challenge to
U.S. commercial and security interests. Similarly the American Electronics Association (2003)
has analyzed China’s growing exports of high tech products and pointed to the threat they
represent to US industry.
There is no doubt that the structure of China’s exports has changed dramatically over the
past two decades. A decade and a half ago China’s leading exports were crude oil, refined
petroleum products and apparel. In a seemingly complete transformation China has emerged in
recent years as a major producer and exporter of electronic and information technology products,
such as consumer electronics, office equipment and computers, and communications equipment.
Globally it is now the second largest producer of these items, after only the United States. Its
global exports of these products soared from only $39 billion in 1999 to $142 billion in 2003.51
The U.S. is a major purchaser of such goods, with imports from China more than doubling from
$25 billion in 1999 to $59 billion in 2003. In 2000 China ranked behind Japan, Mexico, and the
EU as a supplier of high-tech goods to the United States, but by 2002 it had displaced all three to
become the single largest supplier (American Electronics Association 2003). Does this imply that
traditional notions of comparative advantage are useless in thinking about the evolution of
China’s trade structure?
We strongly disagree, and this point merits a small digression. The “infant industry
argument,” the classic case for temporary protection of domestic industry in the hopes of
fostering economic development, dates back at least to Alexander Hamilton (1791), and was
endorsed, if cautiously, by some of the great nineteenth-century economists, notably including
John Stuart Mill (1848). The international economics literature of the 1980s produced rigorous
mathematical models in which temporary protection could, in principle, allow domestic firms to
acquire technological capabilities that would have been impossible for them to acquire without
51 Ministry of Information Industry, 2003 Electronic and Information Industry Economics Statistical Communique, www.mii.gov.cn/mii/hyzw/tongji/2004-040501.htm, downloaded April 20, 2004. “China IT exports rose 45% on-year in 1999,” China Online, February 8, 2000.

37
government intervention, raising national welfare in the process.52 Recent work by Brandt,
Rawski, and Sutton (2005), with its strong implicit endorsement of China’s protectionist policies
in the automobile industry, appeals strongly to these ideas, if not to the formal models themselves.
Yet, it is important to point out that the theorists who launched this intellectual revolution
within the discipline of international trade were not refuting the principle of comparative
advantage. Instead, they were extending it, by allowing the technical capabilities of domestic
firms – an attribute which could evolve over time – to influence comparative advantage. While
demonstrating the possibility that government intervention could lead to gains over time, they
remained remarkably unanimous in their skepticism that these gains were very large or that
government intervention in practice could actually achieve the gains suggested by theory, and
they remained sensitive to the potential costs of these interventions. The notion that the principle
of comparative advantage has been rendered obsolete by “dynamic” theories of international trade
has been flatly contradicted by the authors of these theories themselves (Krugman 1994, 245-280).
In any case, the critique that Chinese industrial and other policies have allowed China’s
firms to leapfrog ahead and bend or even suspend the law of comparative advantage falls short on
three levels. First, most of the electronic and information technology products, which the
Manufacturers Alliance and the American Electronics Association classify as high technology or
advanced technology, should not be considered high-tech. The single biggest US import product
from China in the consumer electronics, office equipment and computers, and communications
equipment categories, respectively, is DVD players, notebook computers, and mobile telephones.
Each of these is a high volume, commodity product sold primarily by mass merchandisers of
electronic products. For example, in 2003 the United States imported more than 31 million DVD
players from China with an average unit cost of under $80, more than 7.5 million notebook
computers with an average unit cost of $550, and more than 20 million mobile telephones with an
52 Important contributors to this research stream include, among others, James Brander, William Ethier, Gene Grossman, Elhanan Helpman, Paul Krugman, and Barbara Spencer.

38
average unit cost of less than $100.53 The huge volumes and low unit costs of these products
undermine the argument that these are high-tech products.
Second, China is able to export huge quantities of electronic and information technology
products only because it imports most of the high value-added parts and components that go into
these goods. China, in short, does not in any real sense manufacture these goods. Rather it
assembles them from imported parts and components. For example, domestic value-added
accounts for only 15 percent of the value of exported electronic and information technology
products. All the rest is import content. In short, for many of these products it is doubtful that
China is supplying anything but the labor required to produce these goods. China’s provision of
relatively low-wage “assembly services” is completely consistent with its underlying comparative
advantage. Schott’s analysis of the growing relative sophistication of China’s export bundle
does not account for the importance of imported parts and components for a growing share of
China’s exports. On the other hand, Lall and Albaladejo’s analysis of China’s competitive threat
to East Asian manufactured exports does take into account China’s growing import of inputs for
export activities. This leads them to the view that even though China is the biggest gainer of
market share of exports of high tech products in the decade to 2000 that there is
“complementarity rather than competition between China and its neighbors” in the export of high
tech products.
China’s dependence on imported parts and components is reflected in Figure 7, showing
both China’s exports and imports of electronic and information technology products. While
China exported $142 billion in electronic and information technology products in 2003, China’s
imports of these products, overwhelmingly parts and components rather than finished goods, were
over $127 billion. In short, China’s net exports of electronic and information industry products in
2003 were a relatively small $15 billion.
53 United States International Trade Commission, USITC Interactive Tariff and Trade DataWeb, dataweb.usitc.gov.

39
Imported semiconductors and microprocessors constitute an unusually large share of the
imported parts and components that firms in China use in the assembly of electronic and
information industry products. Semiconductors and microprocessors are, of course, among the
most sophisticated components of electronic and information technology products. China’s
imports of microprocessors and semiconductors quadrupled from $12 billion in 1999 to over $47
billion in 2003. The entire global market for semiconductors in 2003 was $166 billion, meaning
that demand from China alone accounted for more than one-quarter of global output. The degree
to which China is an assembler of imported parts and components, rather than a true manufacturer
of consumer electronic and information technology products, is reflected in the modest volume of
China's domestic production of semiconductors and microprocessors compared to the value of its
imports of these products. Although domestic semiconductor production is growing rapidly, it is
from an extremely small base. In 2003 domestic production was only $4.6 billion, less than one-
tenth of the value of imports.54 Investment in domestic production of semiconductors has
increased significantly in recent years, which will provide the capacity for a further rapid rise in
domestic production. However, given the continued expansion of capacity in China for
manufacturing consumer electronics and information technology products, China is likely to
remain far and away the world's largest importer of semiconductors and microprocessors for
years to come.
Third, most exports of electronic and information products are assembled not by Chinese-
owned firms but by foreign firms that are using China as an export platform. Taiwanese firms
that have relocated to the mainland dominate the production of electronic and information
technology products that are exported from China. The importance foreign firms play in China's
emergence, for example, as the largest supplier of computers to the US market, is confirmed by
both aggregate data and by the ranking of the top-200 export companies compiled by the Chinese
Ministry of Commerce. In 2003, for example, foreign firms accounted for 92 percent of China's 54 Liu Baijia, “Semiconductor sector shake-up,” China Daily, September 8, 2004, p. 11.

40
$41 billion in exports of computers, components, and peripherals and 74 percent of China's $89
billion in exports of electronics and telecommunications equipment (Gilboy 2004, 39).
The dominance of foreign firms in these sectors is confirmed by firm level data on
China’s largest exporters. In 2003 Hong Fu Jin Precision Industry, a wholly-owned subsidiary of
Taiwan's Hon Hai Precision Industry Company (better known by its trade name Foxconn), with
exports of $6.4 billion, was China's number one ranked export company for the third successive
year. Hon Hai Precision Industry is Taiwan's largest contract electronics manufacturer, churning
out videogame consoles, mobile phones, and other electronics products for Sony, Apple, Nokia,
and many other brands. Coming in second was Tech Front (Shanghai) a subsidiary of Taiwan's
Quanta Computer Inc., the world's largest producer of notebook computers. Quanta is the single
largest supplier for Dell Computer Company. Tech Front's exports in 2003 were $5.2 billion.
Rounding off the top three exporting firms in China, with exports of $3.1 billion, was
Magnificent Brightness, owned by Taiwan's Asutek Computer, another global heavyweight in the
production of notebook computers. In all there are 28 Taiwan-owned firms on the list of China’s
200 largest exporting firms in 2003. All are electronics manufacturers.55
In short, the rapidly changing commodity composition of China's exports does not appear
to constitute evidence that Chinese firms are leapfrogging ahead technologically, because these
exports are not primarily driven by the expanding “knowledge stock” or innovative capabilities of
domestic firms. Indeed there may be a growing technology gap between foreign firms operating
in China and domestic Chinese companies. In part this is because foreign firms in the electronics
and information technology space in China are almost entirely wholly foreign-owned companies
rather than joint ventures. Wholly foreign-owned firms have strong incentives to protect their
technology from competitors, both domestic and foreign, thus limiting the diffusion of technology
to indigenous firms. Furthermore, there is evidence suggesting that many indigenous Chinese
55 "Top Three China Exporters All Taiwan-Invested," Chinese Economic News Service, June 28, 2004, http://news.cens.com.
41
firms spend little on research and development to develop new technologies on their own (Gilboy
2004, 40). We do not discount the possibility that individual indigenous Chinese firms will, in
short order, emerge as important players in technology-intensive industries through the
development of proprietary technologies. However, the aggregate transition of the Chinese
economy as a whole from net importer of technology-intensive goods to net exporter is likely to
take many decades.
VII. China’s Exchange Rate Regime: The Need for Further Change
Dooley, Folkerts-Landau, and Garber (2003) have argued that China is similar to other
Asian countries that have long managed their exchange rates by intervening in foreign exchange
markets to limit appreciation of their currencies in order sustain growth-oriented trade surpluses.
Is China's currency undervalued? If so what is the appropriate Chinese response? What
difference would this response make to China’s global trade and its bilateral trade with the United
States?
First, while China's currency is now almost certainly undervalued, it is worth underlining
that in contrast with Japan and several other countries in the region, this is a relatively recent
phenomenon. Moreover, to a considerable extent the recent very large build up of foreign
exchange reserves in China reflects short-term speculative capital inflows rather than a
fundamental disequilibrium.
What is the evidence for the judgment that the currency is undervalued in recent years?
Between 1994, when China pegged its currency to the dollar, through 2001 China's current
account surplus averaged only 1.8 percent of its GDP. But this number rose to an average of 3.1
percent in 2002-03 and then 4.2 percent in 2004. And unlike its Southeast Asian neighbors, in the
five years since the Asian financial crisis (1999-2003) China also had a capital account surplus.
This surplus averaged 1.3 percent of GDP in 1999-2001. But it rose to an average of 3.2 percent
in 2002-03 and then 6.7 percent in 2004 (National Bureau of Statistics 2003, 17, 88; National
Bureau of Statistics 2004a, 17, 86; National Bureau of Statistics 2005, 18, 89). It must be noted

42
that while China’s nominal exchange rate vis a vis the U.S. dollar was unchanged, from the
beginning of 2002 onward the trade weighted value of the renminbi depreciated significantly as
China’s current and capital account surpluses grew. 56
Although China nominally maintains a relatively closed capital account, prior to 2001
unrecorded capital outflows largely offset these current and capital account surpluses. As a
result, China's build up of foreign exchange reserves was modest by Asian standards. But in
2001 these outflows shrank significantly and in 2002-2004 unrecorded capital inflows soared.57
To continue to keep the currency pegged at 8.28 yuan to the dollar, in the face of significant
surpluses on both the current and capital accounts as well as unrecorded capital inflows, China's
authorities since 2001 have had to purchase massive amounts of foreign exchange and reserves
have risen accordingly. For example in 2004 alone reserves increased by $206.3 billion an
amount equivalent to 12.5 percent of gross domestic product (National Bureau of Statistics 2005,
18, 89).
The Chinese authorities, through their own actions, have implicitly admitted that the yuan
is undervalued. Until July 21, 2005 they chose to try to reduce the pressure on the currency
through a series of ad hoc measures, rather than making any change to their exchange rate.
Beginning January 1, 2004, for example, the government reduced by an average of 3 percentage
points the rate at which it rebates the value-added tax on products that are exported (United States
Trade Representative 2004, 63). That tends to make Chinese exports more expensive in
international markets. But, unlike a currency revaluation, lowering the rebate rate on the value-
added tax on exports does not lower the price of imports in the domestic market. The authorities
also have signaled an easing in the approval process for outward-bound foreign direct investment;
56 This was the inevitable consequence of the depreciation of the dollar on a trade weighted basis over the same period, largely as a result of the appreciation of floating currencies such as the Euro, the pound, and the Canadian and Australian dollars. 57 Unrecorded capital outflows average $15.1 billion in the three years 1998-2000. In 2001 outflows dropped to $5.9 billion. In 2002 through 2004 unrecorded inflows were $7.8 billion, $18.4 billion, and $27.0 billion, respectively (National Bureau of Statistics 2003, 88; National Bureau of Statistics 2005, 89).

43
liberalized the regulations governing outbound Chinese tourism; and allowed one domestic
financial institution to issue dollar-denominated debt. In March and August 2004 the relevant
regulators announced that the national social security fund and domestic insurance companies
could invest in offshore markets. They are contemplating approving a qualified domestic
institutional investor (QDII) program that would allow individual Chinese investors to invest in
securities traded on foreign markets. Each of these measures tends to increase the demand for or
reduce the supply of foreign exchange, thus lessening the build-up in official foreign exchange
reserves.
The United States policy of encouraging China to liberalize its capital account and adopt
a floating exchange rate system, first articulated by Treasury Secretary Snow in the fall of 2003,
is certainly appropriate as a long-term objective. The Chinese authorities over the years have
repeatedly expressed the goal of moving toward a convertible currency and a much more flexible
exchange rate regime. There is no debate on the long-term desirability of such a policy. A
flexible exchange rate regime would not only help to equilibrate China's international accounts
but would also give the authorities considerably more ability to use monetary policy to moderate
the cyclical character of domestic demand.
In the short and medium run, however, a convertible currency with a floating exchange
rate is a risky option for China. Chinese households hold more than 12 trillion yuan (an amount
roughly equal to China's GDP) in domestic savings deposits. Very few Chinese savers have had
an opportunity to diversify the currency composition of their financial savings. Eliminating
capital controls could lead to a substantial move into foreign-currency denominated financial
assets, most likely held outside of Chinese banks. Given the well-known weaknesses of China's
banks, such a move could precipitate a domestic banking crisis. As a result, the authorities do not
anticipate relaxing capital controls on household savings until they have fully addressed the
solvency problems of the major state-owned banks. This process is well underway but is likely to
take a minimum of 3 to 5 years to complete.
44
If the renminbi continued to be undervalued for 3 to 5 years there would be substantial
adverse effects on China's trading partners and China's central bank would continue to be very
constrained in using interest rates as a macroeconomic policy tool. These competing risks
suggest that the best approach might be to revalue the currency in the short term and only much
later, after completing the transformation of the domestic banking system, move to eliminate
capital controls and, at the same time, float the currency. How large an initial revaluation of the
currency is called for? The tentative judgment of Goldstein and Lardy in 2003 was that the
renminbi was undervalued by an amount in the range of 15 to 25 percent. They estimated that a
revaluation in this range in 2003 would have led to an overall equilibrium in China’s balance of
payments, thus ending the build up of foreign exchange reserves. Goldstein and Lardy also
argued that at the same time the authorities revalue the currency they should take two additional
steps. First, they should significantly widen the band within which they permit market forces to
determine the value of the currency. Second, at the new parity the authorities should peg the
Chinese currency to a basket of currencies rather than solely to the US dollar (Goldstein and
Lardy 2003a; Goldstein and Lardy 2003b).
The authorities went part way to meeting these objectives in July 2005 when they
announced a new managed floating exchange rate system that entailed an initial 2.1 percent
revaluation of the currency to a new parity of 8.11 to the US dollar; allowing the currency to trade
on the foreign exchange market vis a vis the US dollar in a range of plus or minus 0.3 percent on
an intraday basis; and a policy of setting the opening price in the market each day at the price
prevailing at the previous day’s close; and that the currency would not be pegged rigidly to the
dollar, but rather with reference to a basket of currencies (People’s Bank of China 2005).
The significance of this announced reform will become clear only over time. The US
Treasury immediately advanced the view that the new system of managed floating would allow
the currency to move by the maximum of 0.3 percent per trading day or up to 6 percent per

45
month.58 This interpretation seems dubious, however, for two reasons. First, the Chinese
authorities have described their exchange rate regime as a managed float since January 1994, so
this was not really new. Second, the plus minus 0.3 percent intraday trading range and the
provision to open each day’s trading at the prior day’s closing price has also been a feature of the
system since 1994.59 However, from the middle of 1995 through July 2005 the nominal exchange
rate barely moved. Since July 2005, there has been some additional appreciation, but it has been
quite modest and gradual.
It will take time to make a judgment of the significance of the July 2005 announcement.
Perhaps it will usher in an era in which the value of the Renminbi is largely determined by supply
and demand in the market, as some of the language of the announcement by the People’s Bank
seemed to imply. That would lead to further appreciation of the currency and over time could
lead to greater flexibility in the currency as well, for example, if the band around the parity was
widened. Both would be highly desirable not only because they would contribute to the reduction
of global economic imbalances but also because they would allow the authorities greater
flexibility in the use of interest rate policy as a tool of macroeconomic management.
VIII. China’s Impact on the World
Surging import demand generated by the booming Chinese economy in 2003 and 2004
helped power an economic expansion throughout East and Southeast Asia.60 With China’s
imports from emerging East Asia rising much faster than its exports to the region, its trade deficit
with the rest of East Asia ballooned from $34 billion in 2001 to $47 billion in 2002 to $70 billion
in 2003. Growth in exports to China and Hong Kong accounted for 50 percent of overall export
growth in Korea and 66 percent of overall export growth in Taiwan. China was even credited
58 Paul Blustein, “China’s currency change may ultimately mean little,” Washington Post, July 24, 2004. 59 Technically prior to July 21 the opening price each day was to be at the weighted average of prices in trading on the previous day. Since July 21 the opening price is supposed to set at the closing price of trading on the previous day. 60 The country’s imports surged 40% in dollar terms in 2003 and were on track for similar growth in 2004. See East Asia and Pacific Regional Overview, the World Bank, pp. 17-18.
46
with helping revive the long-moribund Japanese economy. In 2003, Japanese exports to China
grew over 33 percent in 2003, accounting for nearly 44 percent of total export growth, and
helping to generate the highest real GDP growth since the mid-1990s.61
While other countries in the region have eyed the rise of China as a trading power
somewhat warily, fearing that China’s export success and ability to attract FDI might be coming
at their expense, China was widely seen in 2003 as an increasingly important locomotive of
growth in the region. By the fall of 2004, the locus of concern had shifted from fear of an
increasingly dynamic Chinese competitor to fear that the Chinese import boom would grind to a
halt as government efforts to slow runaway economic growth unintentionally engendered a “hard
landing.” The tone of popular commentary in the Asian business press had shifted markedly from
a depiction of China as a “threat” to praise of a booming Chinese economy as an engine of
growth for all of Asia.
On the other hand, in 2004, an election year, China’s growing trade surplus with the
United States and mounting fears over jobs lost continued to generate political pressure for
protection. The Bush Administration had already launched an antidumping investigation against
Chinese color TV exporters and levied quotas on textile in late 2003. In late 2004 the U.S.
government faced pressure from a coalition of industrial and textile groups seeking to force China
to change its exchange rate policy.62 The bilateral trade deficit with China had displaced the
deficit with Japan as America’s largest in 2000, and it continued to increase rapidly in absolute
value.
However, China’s expanding trade surplus with the U.S. largely reflects a reallocation of
assembly activity from other East Asian countries to China. Much of this assembly is actually
61 See “Trade Surplus Surpasses 10 Trillion Yen,” (in Japanese) in the Nihon Keizai Shimbun, Evening Edition, January 22, 2004, and “China Surpasses Japan to Become the World’s Third Largest Trading Economy,” (in Japanese) C. H. Kwan, RIETI Researcher, on-line report available at www.rieti.go.jp/users/china-tr/jp/ssqs/040323ssqs.htm. 62 See Schroeder and King, “Coalition to Press White House to Fight China’s Trade Practices,” September 9, 2004, Wall Street Journal Online Edition.
47
undertaken by foreign-invested enterprises from the aforementioned economies, which continue
to source components from their home base. As a consequence, China’s expanding surplus with
the United States, and to a lesser extent, Europe, mirrors its large deficit with the rest of East Asia.
China’s emerging industrial structure is thus largely complementary with that of the more
advanced East Asian countries, and China’s continued export expansion represents, for the most
part, an opportunity rather than a threat. The implications of China’s advance for the less
developed ASEAN countries are less unambiguously positive in the short to medium run, a point
we shall also discuss.
Figure 8, which shows US exports to and imports from China, illustrates the expansion of
the U.S. bilateral trade deficit with China. Beginning in 1990, exports of U.S. businesses to
China grew more rapidly than to any other large export market. 63 By 2003 U.S. exports to China
had increased five fold to almost $30 billion and China had become the 6th largest foreign market
for U.S. goods (Lardy 2004, 27).64 However, imports grew even more rapidly so the bilateral
trade deficit has continued to widen in absolute terms. By 2003 the ratio between imports and
exports was 5.4 to 1 meaning that U.S. exports to China have to grow by more than five times the
growth of imports to keep the trade imbalance from worsening further. Thus it is quite likely that
the bilateral US trade deficit with China will continue expand. Given the rapid growth in this
imbalance, it is easy to see how trade with China has become a lightning rod for protectionist
interests within the United States.
The relative asymmetry of China’s trade flows with the U.S. is cast into even sharper
relief by a comparison with the evolution of the Chinese trade balance with the EU and Japan,
two other major export destinations, as in Figure 9. While the bilateral surplus with the EU has
expanded in recent years, trade with both economies is substantially more balanced than that of
63 See Nicholas Lardy, “Issues in China’s WTO Accession,” hearing before the U.S.-China Security Review Commission, May 9, 2001. 64 Exports were $4.78 billion in 1990 and $28.29 billion in 2003. Bureau of Economic Analysis, “US International Trade in Goods and Services Annual Revision for 2004,” June 10, 2005 http://www.bea.doc.gov/bea accessed August 8, 2005.

48
the United States. The U.S. almost single-handedly accounts for China’s modest but robust
current account surplus. If one examines China’s trade with the rest of the world except the U.S.,
that is a large and growing deficit, as shown in Figure 10.
To a great extent, American imports of manufactured goods, especially labor-intensive
products, from China have displaced American imports of manufactured goods from other
locations in Asia, notably Hong Kong, Taiwan, and South Korea. As a result the combined
shares of the U.S. global trade deficit accounted for by the China, Japan, Hong Kong, Taiwan,
and South Korea fell from 52.3 percent in 1985 to only 39.4 percent in 2003 (Lardy 2005, 129).
The causes of this transformation are rising wages in non-China Asia and China’s liberalization
of its foreign investment environment. In the 1980s and 1990s, as wages in these countries rose
and China liberalized its foreign direct investment environment, Asian entrepreneurs moved a
growing share of their labor-intensive production to China. Figure 4 illustrates the continuing
importance of Asian firms in FDI in China. By 2003, China’s Asian trading partners collectively
accounted for about 70 percent of the cumulative foreign direct investment in China. As one can
see in the figure, Hong Kong and Taiwan firms have played a conspicuously large role. Unlike
U.S. or European firms that tend to invest in China in order to serve the local market, Asian firms
tend to use China as an export platform.
They have been quite successful at this. At the end of the 1990s, the two most important
categories of goods the U.S. imported from China were baby carriages, toys, games and sporting
goods and footwear. The rapid growth of U.S. imports in these categories largely reflects the
displacement of alternative sources of supply in Asia. Figure 11 illustrates this truth for footwear.
From 1986 through 1988 almost 60 percent of U.S. footwear imports were from Taiwan and
South Korea; China was the source of only 2 percent of U.S. footwear imports. By 1999, the
relative importance of the two sources of supply had reversed completely. Figure 12 shows a
similar pattern for toys and sporting goods. The degree to which increases in imports from China
directly displaced imports from Hong Kong, South Korea, and Taiwan is quite striking.
49
To say that this production transfer has come at the “expense” of firms or workers in
Hong Kong or Taiwan is somewhat misleading. By and large, this transfer of production has not
created large losses, either for the investing economies or their firms.65 The relationship between
these economies and China has been, to a great extent, a complementary one. However, there is
also a set of goods in which these countries, as well as Japan and the United States, compete with
China. The technological ambitions of the Chinese government, and the desire to expand in
sectors such as contract semiconductor manufacturing, suggest that this margin of competition
may grow over time.
As we have already indicated, a similar process of “export displacement” is now at work
with DVD players, computer peripherals, and laptop computers. In 2002, China became the
largest single source of U.S. imports of consumer electronics products and information
technology hardware (Lardy 2004). However, as we have already stressed, much of this export
growth is being spearheaded by foreign, particularly Taiwanese, companies. While these final
goods contain high-tech components, Chinese factories specialize in providing relatively low-
skill assembly services, importing the more sophisticated components from Taiwan, South Korea
or, significantly, Japan. In 2002, China ran a massive trade deficit of $25 billion in its trade with
Taiwan. Two-thirds of these imports are parts and components, subsequently assembled into
final goods in factories owned by Taiwanese firms and investors (Lardy 2004). In 2003, as China
ramped up its exports of IT products, imports of electronic components from Japan surged by 60
percent.66
Recent economic analysis based on trade data and the use of simulation models also
suggests a complementarity between Chinese growth and the more developed Asian economies.
65 In 1981, Hong Kong’s manufacturing sector employed more than 900,000 workers in Hong Kong. By 2000, Hong Kong-invested companies employed 5 million workers in China, many in Guangdong province. In that year, Taiwanese firms employed an estimated 3 million workers on the mainland. See Lardy (2002, 56-57) for a discussion and Naughton (1998) for a discussion of these issues with particular emphasis on electronics. 66 See Nihon Keizai Shimbun, “Trade Surplus Exceeds 10 Trillion Yen.”

50
Much of the recent analysis has been undertaken in the context of forecasting the impact of
China’s WTO accession. Ianchovichina and Walmsley (2001) calibrate and simulate a multi-
country, multi-sector model of international trade, finding that China’s WTO access, while
improving that country’s imports, reduces the exports of Vietnam, the Philippines, Thailand,
Indonesia, and Malaysia. On the other hand, Japan and the NIES benefit, mainly due to increased
exports to China. Yang and Vines (2000), in the context of a different simulation model, also
find that Chinese export growth causes ASEAN exports to drop while those of Japan and the
NIES rise.67
Eichengreen, Rhee, and Tong (2004) undertake a regression study using disaggregated
trade data over the 1990-2002 period. They attempt to account for the endogeneity of Chinese
exports while allowing for differential effects on different commodity types. They find evidence
of a crowding out of exports from Asian countries due to Chinese export growth, but this is
largely limited to consumer goods. In contrast, Chinese growth has a strong positive impact on
Asian exports of capital goods and equipment to China. On net, the advanced Asian economies
benefit from Chinese growth, while the ASEAN countries lose.68 This finding is consistent with
earlier work suggesting China’s comparative advantage is similar to that of its ASEAN
neighbors.69 While GDP growth eventually revived in most of Southeast Asia after the financial
crises of 1997-1998, the robust inward FDI flows of the pre-crisis years did not – although real
67 An IMF study (2004) uses a computable general equilibrium model to capture the geographical and sectoral structure of trade flows. This analysis finds that Chinese export growth generates small negative effects on the exports and output of all regions, but the impact is stronger on the ASEAN countries than the more developed Asian economies. 68 This finding contrasts with the earlier work of Ahearne, Fernald, Loungani, and Schindler (2003). Using aggregate trade data, these authors found little evidence of a statistically significant relationship between Chinese exports and the exports of its Asian neighbors, although the estimated coefficients tended to be positive. 69 A comparison of correlation coefficients on revealed comparative advantage indices in 53 labor intensive products for China and twenty-five other countries suggested significant positive correlations between China and Thailand, Vietnam, and Indonesia. See Boltho et. al., (1994), “China’s Emergence: Prospects, Opportunities, and Challenges,” Policy Research Working Paper 1339, the World Bank.
51
FDI actually increased in China. Complaints among the ASEAN countries that China’s success
at attracting FDI came at their expense arguably held a grain of truth.70
The observation that China’s rapid export growth has, to date, largely displaced export-
oriented assembly elsewhere might suggest that this process is bound to slow down in the near
future. After all, once China accounts for a large majority of global supply within a given
category, exports can only grow at something approximating the total growth rate of global
demand for the product, and that is likely to be considerably slower than the growth rates China
has registered in the recent past. A slowdown in growth of China’s exports of footwear and toys
and sporting goods is probably not far away. The transfer of production of consumer electronics
and IT hardware has proceeded so rapidly that a growth slowdown in this category may not be far
off either.
However, China stands ready to benefit more than any other country from the abolition of
the WTO Agreement on Textiles and Clothing, the successor to the Multifiber Agreement
negotiated under GATT. Under this arrangement, textile and apparel exports from any one
country were sharply limited, allowing fledgling apparel industries in nations such as Bangladesh,
Saipan, and Mauritius to flourish. This agreement ended on December 31, 2004. Already, major
apparel importers in the United States are seeking to consolidate their production operations in a
smaller number of low-cost countries. With its low labor costs, relatively high productivity, and
excellent infrastructure, China is likely to dramatically increase its share of global apparel exports,
at the expense of other producers in Latin America, Africa, South Asia, and Southeast Asia.
China currently accounts for only 13.1 percent of American imports of apparel products. If
China-based producers were able to collectively achieve, over the next several years, a market
share in apparel similar to their current market share in footwear, this would guarantee years of
double-digit growth in a very broad category of manufactures.
70 See the April 2004 East Asia Report, World Bank.

52
The expansion of China’s role as a mediator of Asian trade with the U.S. has, up to this
point, arguably served the interests of all parties. However, there are also limits to the continued
growth of this pattern of trade, at least in the long run. The sustainability of the U.S. current
account deficit is being increasingly questioned by policymakers, academics, and financial
analysts.71 U.S. trade with Asia is an important component of this deficit, and Asian central
banks, including China’s, have played an increasing role in financing it. The currency reform put
forward in the previous section is part of an inevitable and essential appreciation of the major
Asian currencies.72 However, the role of Japanese, Taiwanese, Hong Kong, and Korean
companies in China’s export flow also creates an interesting constellation of interests regarding
necessary changes in China’s exchange rate regime.
On the one hand, there is a margin along which producers in these countries directly
compete.73 Producers within this zone of competition would tend to support a revaluation of the
renminbi.74 However, as we have already stressed, this zone of competition is limited. There is
another large set of producers in these countries that has, and continues to make, large
investments in export-oriented production capacity in China. A sufficiently large revaluation of
the renminbi could undermine the competitiveness of this capacity and reduce the profits for the
foreign investors.
A recent survey by the Nihon Keizai Shimbun indicated that most large export-oriented
Japanese firms do not perceive a large renminbi revaluation to be in their interest, precisely
71 See the special symposium in the 2001 volume of Brookings Papers on Economic Activity for a thoughtful exchange on this issue, including Cooper (2001). See also Obstfeld and Rogoff (2000) and Mann (2002, 2004). Stephen Roach, chief economist of Morgan Stanley, has argued in many fora for a “global rebalancing” of demand. Well known investor Warren Buffet authored a stern warning about the implications of the growing U.S. current account deficit in late 2003 in Fortune magazine. 72 See Catherine Mann (2004) and Bergsten (2004). 73 Attempts by China to encourage the development of capital and technology-intensive industries such as semiconductor fabrication and telecommunications equipment manufacturing have received extensive coverage in the popular press. On the former industry, see Jason Dean, “Long a Low-Tech Power, China Sets its Sights on Chip Making,” Wall Street Journal Online, February 17, 2004. On the latter, see Ben Dolven, “China’s Telecom Vendors are Thriving Abroad,” Wall Street Journal Online, Feburary 19, 2004. 74 In fact, a substantial renminbi revaluation would be a quid pro quo for their support of a revaluation of their own currency. See Lardy and Goldstein (2003).

53
because they have already exploited low-cost Chinese production sites as part of their global
network.75 This sentiment may be broadly shared throughout the developed economies of Asia.
The U.S. has made little headway in its efforts to get other countries in the region to pressure
China to revalue its currency. This partly reflects the divided interests of industrial producers in
these countries.76 That division extends to the United States. The National Association of
Manufactures did not endorse the filing of a trade complaint by a coalition of U.S., industrial, and
agricultural groups accusing China of manipulating its currency.77 Large-scale U.S.-based
retailers, such as Wal-Mart, which sourced 8 percent of its global purchases from China in 2002,
and bought an estimated $15 billion of Chinese merchandise in 2003, have a clear incentive in
minimizing the dollar-denominated production costs of their goods.78 Zhao and Xing (2003a,b)
use a formal model of production outsourcing to show how an advanced country can suffer a
welfare loss when its currency depreciates against that of a less developed country to which it has
outsourced production. The intuition behind this model is clear – cheap imports are good, and
making them more expensive lowers welfare and the profits of firms investing in China to serve
markets like the U.S. Unfortunately, the evidence increasingly suggests that the current exchange
rate arrangements are no longer consistent with macroeconomic fundamentals.
If not remedied, this could contribute to a real misallocation of resources within China.
At the moment, a Chinese producer seeking to serve a customer in California is eligible for an
almost complete rebate of the value-added tax (15 percent), and he is able to convert dollars into a
domestic currency that could be as much as 25 percent undervalued. This creates a sizeable price
wedge between an export sale and a domestic sale of the same product to a customer in Xinjiang.
A de facto export subsidy of this magnitude, if maintained long enough, could distort the
75 See “Japanese Firms Committed to China,” January 20, 2004, Nihon Keizai Shimbun. 76 It also reflects the fact that other countries in the region, including Japan, have massively intervened in foreign exchange markets to prevent revaluation of their own currencies. 77 See Michael Schroeder and Neil King, “Coalition to Press White House to Fight China’s Trade Practices,” Wall Street Journal Online, September 9, 2004. 78 See Peter Wonacott, “Behind China’s Export Boom, Heated Battle Among Factories,” Wall Street Journal Online, November 13, 2003.

54
industrial development of the Chinese economy. This is particularly true if we believe that, in at
least some product markets, titanic per capita income differences between the export markets and
the home market mean that the types of products that could sell well domestically are not
necessarily the same types of products that will sell well abroad, and vice versa. Japan, Taiwan,
and South Korea also resisted the appreciation of their own currencies. Is it possible that the
difficulty these countries have had weaning themselves from export-led growth since the 1980s
reflects an overdevelopment of the export sector that was, itself, a function of a long undervalued
exchange rate? The longer a currency’s undervaluation encourages an overexpansion of the
export sector, the greater the power of the lobbying groups that would seek to halt or limit
adjustment become, and the more economically costly that adjustment becomes. To the extent
that our reading of Asian economic history is correct, we can only hope that it is not repeated.
IX. Conclusions
China’s adoption of one of the developing world’s most open trade and FDI regimes
stands as one of the most significant accomplishments of the reform era. China achieved a
greater degree of openness to foreign trade in manufactures prior to WTO accession than is
generally acknowledged, and the drive to liberalization of trade and FDI regimes seems to have
dramatically accelerated in the late 1990s. The additional openings mandated under China’s
WTO accession agreement will likely make China’s economy the most open of any large
developing country, and, to date, China has made reasonable progress toward meeting her
obligations. As we have noted, developments in Chinese trade and investment have generally
conformed to patterns of Chinese comparative advantage, yielding important benefits to China
and her trading partners.
While it would be inaccurate to describe China’s growth as export-driven, given the
limited direct contribution of net exports to overall macroeconomic growth, China’s embrace of
globalization has increased the degree of competition in her product markets, raised the
productivity of factor accumulation, enhanced consumer welfare in China, and benefited
55
consumers around the world. Some of China’s key leaders pursued this embrace with a
commendable mixture of pragmatism and courage, for which future generations will owe them
thanks.
It is difficult to forecast with confidence the full impact of China’s opening of its service
sector to foreign direct investment, in part because there is so little precedent for a developing
country to offer such a degree of market access. The possibility of greater participation by the
world’s leading services firms holds out the promise of preventing the development in China of
the kind of dual economy seen in Japan and Korea. The extent to which this promise will be
realized remains to be seen, but we anticipate that the Chinese consumer and the overall economy
will benefit from this opening, which appears to be taking place in line with China’s obligations
under its accession agreement.
The one area in which international economic policy has shown less progress in recent
years is the currency regime. In all fairness to the Chinese leadership, the undervaluation of the
currency only emerged since 2002. However, the costs of delaying significant revaluation of the
currency are escalating. And we do not refer here solely to the unprecedented accumulation of
foreign exchange reserves or the deterioration of relationships with key trading partners. So long
as the currency regime remains little changed, the PBOC will remain acutely constrained in its
pursuit of prudent macroeconomic policies to restrain excessive growth.
It is also possible – indeed likely – that productive capacity that was built up in some
industries in the investment boom that got underway in late 2002 will not be viable at exchange
rates closer to long run equilibrium levels. While China’s embrace of globalization has arguably
tended to enhance the efficiency with which it has accumulated capital, the leadership’s
attachment to a fixed nominal exchange rate against a dollar that began to depreciate at the
beginning of 2002 tended to undermine that historically positive connection. The reforms
announced in the summer of 2005 are potentially an important watershed since the longer a

56
significantly undervalued currency is maintained, the greater is the likely extent of resource
misallocation.

57
Bibliography
Ahearne, A., J. Fernald, P. Loungani, and J. Schindler, 2003, “China and Emerging Asia: Comrades or Competitors?” International Finance Discussion Paper no. 789, Board of Governors, Federal Reserve System.
American Electronics Association. 2003. Tech Trade Update 2003. Washington:
American Electronics Association. Bai, C. E., Y. Du, Z. Tao, and S. Tong, 2004, “Local Protectionism and Regional
Specialization: Evidence from China’s Industries,” Journal of International Economics, vol. 63, no. 2, pp. 397-418.
Barshefsky, C., 1999, “U.S. Trade Policy in China,” Hearings before the Senate Finance
Committee on the Status of China’s Application to Join the World Trade Organization, April 13, 1999, www.fnsg.com.
Bater, J., 2000, “Citrus, Wheat Recently Shipped to China,” Dow Jones Newswires, April 3, 2000, (http://interactive.wsj.com). Behar, Richard, 2000, “Beijing’s Phony War on Fakes,” Fortune, October 30, pp. 189-208. Bergsten, F., 2004, “The Risks Ahead for the World Economy,” the Economist Online, September 9, 2004. Boltho et al., 1994, “China’s Emergence: Prospects, Opportunities, and Challenges,” Policy Research Working Paper 1339, the World Bank. Brandt, L., T. Rawski, and J. Sutton, 2006, “Industrial Organization,” working paper, University of Toronto. Brandt, L. and X. Zhu, 2000, “Redistribution in a Decentralized Economy: Growth and
Inflation in China under Reform,” Journal of Political Economy, vol. 108, no. 2, pp. 422-439.
Branstetter, L. and R. Feenstra, 2002, “Trade and FDI in China: A Political Economy Approach,” Journal of International Economics, vol. 58, no. 2, pp. 335-358. Chinese Bank Regulatory Commission, 2003 “Measures Governing Investment in Shares of Chinese Financial Institutions by Overseas Financial Institutions,” in Almanac of China’s Finance and Banking 2004. Beijing: China’s Banking and Finance Compilation Committee, pp. 322-323. Cooper, R., 2001, “Is the U.S. Current Account Deficit Sustainable? Will it be Sustained?” Brookings Papers on Economic Activity, 2001, vol. 1., pp. 217-226. Dean, J., 2004, “Long a Low-Tech Power, China Sets its Sights on Chipmaking,” Wall Street Journal Online, February 17, 2004. Dolven, B., 2004, “China’s Telecom Vendors Are Thriving Abroad,” Wall Street Journal Online, February 19, 20004.

58
Dooley, Michael P., David Folkerts-Landau, and Peter Garber. 2003. "An Essay on the
Revived Bretton Woods System," National Bureau of Economic Research, Working Paper 9971.
Eichengreen, B., Y. Rhee, and H. Tong, 2004, “The Impact of China on the Exports of Other Asian Countries,” NBER Working Paper no. 10768. Feenstra, R., 1998, “One Country, Two Systems: Implications of WTO Entry for China,” working paper. Feenstra, R., W. Hai, W. Woo, and S. Yao, 1999, “Discrepancies in International Data:
An Application to China-Hong Kong Entrepot Trade,” American Economic Review, May 1999, pp. 338-343.
Feenstra, R. and G. Hanson, 2004, “Intermediaries in Entrepot Trade: Hong Kong Re-
Exports of Chinese Goods,” Journal of Economics and Management Strategy, 13(1), pp. 3-35.
Fisman, R. and S. J. Wei, 2004, “Tax Rates and Tax Evasion: Evidence from Missing Imports in China,” Journal of Political Economy, forthcoming. Foreign Agricultural Service, U.S. Department of Agriculture, 2000, People’s Republic of China: Grain and Feed Annual Report 2000, GAIN Report CH0009. General Agreement on Tariffs and Trade, 1996, The Results of the Uruguay Round of Multilateral Trade Negotiations: Market Access for Goods and Services. Gilboy, George J. ”The Myth Behind China's Miracle." Foreign Affairs. 83. 4, pp.33-48. Goldstein, Morris and Nicholas Lardy. 2003a. "A Modest Proposal for China's renminbi,"
Financial Times. August 26. Goldstein, Morris and Nicholas Lardy. 2003b. "Two-Stage Currency Reform for China,"
Asian Wall Street Journal. September 12. Grub, Phillip Donald and Jian Hai Lin, 1991, Foreign Direct Investment in China, New York:
Quorum Books. Hamilton, Alexander, 1791. “Report on Manufactures,” reproduced in S. McKee, Ed.,
Papers on Public Credit, Commerce, and Finance by Alexander Hamilton, Columbia University Press, New York.
Higgens, A., 2004, “As China Surges, It Also Proves a Buttress to American Strength,” Wall Street Journal Online, January 30, 2004. Hoo, S., 2000, “China’s Wheat Farmers Already Shifting Crop Mix Pre-WTO,” Dow Jones Newswires, June 16, 2000. Huang, L. and S. J. Wei, 2001, “One China, Many Kingdoms? Understanding Local Protection Using Individual Price Data,” working paper.

59
Huang, Y., 2003, Selling China: Foreign Direct Investment During the Reform Era, Cambridge University Press, New York. Hufbauer, G. and D. Rosen, 2000, “American Access to China’s Market: The
Congressional Vote on PNTR,” International Economic Policy Briefs, 00-3, www.iie.com, May 1, 2000.
Hultzer, C. and P. Kyne, 2004, “U.S. Businesses Urge China to Rein in Piracy,” Wall Street Journal Online, September 17, 2004. Ianchovichina, E. and T. Walmsley, 2003, “Impact of China’s WTO Accession on East Asia,” unpublished manuscript, World Bank. International Monetary Fund, 1996, People’s Republic of China—Recent Economic Developments. International Monetary Fund, 2004, “China’s Emergence and Its Impact on the Global Economy,” World Economic Outlook (April) International Monetary Fund, 2005, “Republic of Korea: 2004 Article IV Consultation – Staff Report.” Kennedy, S., 2004, “Holey Protectionism!” China Economic Quarterly, Q3, 2004. Kennedy, S., 2004, “China’s Porous Protectionism: The Changing Political Economy of Trade Policy,” working paper, Indiana University. Kranhold, 2004, “China’s Price for Market Entry: Give Us Your Technology, Too,” Wall Street Journal Online, February 26, 2004. Lall, Sanjaya and Manuel Albaladejo. 2004. “China’s Competitive Performance: A
Threat to East Asian Manufactured Exports.” World Development. 32.9, pp. 1441-1466. Lardy, N., 1992, Foreign Trade and Economic Reform in China, 1978-1990, Cambridge University Press, Cambridge. Lardy, N., 1994, China in the World Economy, Institute for International Economics, Washington. Lardy, N., 1998, China’s Unfinished Economic Revolution, Brookings Institution, Washington. Lardy, N., 2002, Integrating China into the Global Economy, Brookings Institution, Washington, D.C. Lardy, N., 2004, “The Economic Dimension of the U.S.-China Relationship,” in U.S.-China Relations and China’s Integration with the World. Washington: The Aspen Institute. Lardy, N., 2005 “China: The Great New Economic Challenge?” in The United States and the World Economy: Foreign Economic Policy for the Next Decade, edited by C. Fred

60
Bergsten. Washington: Institute for International Economics. Mann, Catherine, 2002, “Perspectives on the U.S. Current Account and Sustainability,”
Journal of Economic Perspectives, vol. 16, no. 3, pp. 131-152. Mann, Catherine, 2004, “Managing Exchange Rates: Achievement of Global Re-
balancing or Evidence of Global Co-dependency,” Business Economics, July 2004, pp. 20-29.
McKinsey & Co. Global Institute, 2000, “Why the Japanese Economy is Not Growing,” special report. Mill, John Stuart, 1848, Principles of Political Economy, in J. M. Robson, Ed., Collected Works of John Stuart Mill, Vol. III, University of Toronto Press, Toronto. Ministry of Economy, Trade, and Industry, 2003, Trade and Commerce White Paper (in Japanese), Economy and Industry Survey Group, Tokyo. National Bureau of Statistics, 2003, China Statistical Abstract 2003. Beijing: China Statistics Press. National Bureau of Statistics, 2004a, China Statistical Abstract 2004. Beijing: China Statistics Press. National Bureau of Statistics, 2004b, China Statistical Yearbook 2004. Beijing: China Statistics Press. National Bureau of Statistics, 2005, China Statistical Abstract 2005. Beijing: China Statistics
Press. Naughton, Barry, 1988, “The Third Front: Defense Industrialization in the Chinese Interior,” The
China Quarterly, 115, September, 351-386. Naughton, Barry, 1995, Growing Out of the Plan: Chinese Economic Reform, 1978-1993. New
York: Cambridge University Press. Naughton, Barry, 1996, “China’s Emergence and Prospects as a Trading Nation,” Brookings
Papers on Economic Activity, 2: 1996, pp. 273-343. Naughton, Barry, ed., 1998, The China Circle: Economics and Technology in the PRC, Taiwan,
and Hong Kong, the Brookings Institution, Washington, D.C. Naughton, Barry, 1999, “How Much Can Regional Integration Do to Unify China’s Markets?”
mimeo, UCSD. Obtsfeld, M. and K. Rogoff, 2000, “Perspectives on OECD Economic Integration: Implications
for U.S. Current Account Adjustment,” working paper. People’s Bank of China, 2005, “Public Announcement of the People’s Bank of China on
Reforming the RMB Exchange Rate Regime,” July 21, at www.pbc.gov.cn accessed July 21, 2005.

61
Pomfret, Richard W. T., 1991, Investing in China: Ten Years of the Open Door Policy. Ames:
Iowa State University Press. Prasad, E., ed., 2004, “China’s Growth and Integration into the World Economy: Prospects and Challenges,” IMF Occasional Paper no. 232. Preeg, Ernset. H. 2004. The Threatened U.S. Competitive Lead in Advanced Technology
Products (ATP). Washington: Manufacturers Alliance/MAPI. March. Rawski, T., 2001, “What’s Happening to Chinese GDP Statistics?” China Economic Review, vol. 12, no. 4., pp. 347-354. Rosen, D., 1999, Behind the Open Door: Foreign Enterprises in the Chinese Marketplace, Institute for International Economics, Washington, D.C. Rosen, D., Scott Rozelle, and Jikun Huang, 2004 Roots of Competitiveness: China’s Evolving Agriculture Interests. Washington: Institute for International Economics. July. Sachs, Jeffrey D. and Wing Thye Woo, 1997, “Understanding China’s Economic Performance,”
NBER Working Paper no. 5935, February. Saywell, T. and K. Wilhelm, 2000, “Seeds of Change,” Far Eastern Economic Review, June 29, 2000, pp. 44-46. Schott, Peter K. 2006. “The Relative Sophistication of Chinese Exports.” NBER Working Paper
No. 12173.. Schroeder, M. and N. King, 2004, “Coalition to Press White House to Fight China’s Trade Practices,” Wall Street Journal Online, September 9, 2004. Studwell, J., 2002, The China Dream: The Quest for the Last Great Untapped Market on Earth, Atlantic Monthly Press, New York. Tsai, K., 2002, Back Alley Banking: Private Entrepreneurs in China, Cornell University Press, Ithaca, New York. United States Trade Representative, 2004, National Trade Estimate Report on Foreign Trade Barriers. United States Trade Representative, 2005, National Trade Estimate Report on Foreign Trade Barriers. Wedeman, Andrew Hall, 1995, From Mao to Market: Rent Seeking, Local Protectionism, and Marketization in China, Cambridge University Press, Cambridge. Wells, L., 1991, “Mobile Exporters: New Foreign Investors in East Asia,” in K. Froot, ed., Foreign Direct Investment, NBER and University of Chicago Press, Chicago. Whalley, John and Xian Xin, “China’s FDI and Non-FDI Economies and the Sustainability of Future High Chinese Growth,” NBER Working Paper no. 12249.

62
World Bank, 2004, East Asia and Pacific Regional Overview. Taylor, A., 2004, “Shanghai Auto Wants to be the World’s Next Great Car Company,” Fortune, October 4, 2004, pp. 103-110. Wonacott, P., 2004, “A Fear Amid China’s Car Boom,” Wall Street Journal Online, February 2, 2004. Wonacott, P., T. Zaun, and N. Shirouzu, 2004, “Car Makers’ Price War in China Narrows Margins,” Wall Street Journal Online, January 9, 2004. World Trade Organization, 2005, “Developing countries’ goods trade share surges to 50-year peak,” Press Release/401, April 14. Xinjiang Statistical Bureau , 1998, “China’s Regional Economy in the 17 Years Since Reform
and Liberalization” electronic database on diskette. Young, Alwyn, 2000, “The Razor’s Edge: Distortions and Incremental Reform in the People’s
Republic of China,” Quarterly Journal of Economics, 115 (4), pp. 1091-1036. Zhang, S., Y. Zhang, and Z. Wan, 1998, Measuring the Costs of Protection in China, Institute for International Economics, Washington, D.C. Zhao, L. and Y. Xing, 2003, “Global Outsourcing and Currency Devaluation,” Hokkaido University working paper. Zhao, L. and Y. Xing, 2003, “Reverse Imports, Foreign Direct Investment, and Exchange Rates,” Hokkaido University working paper.
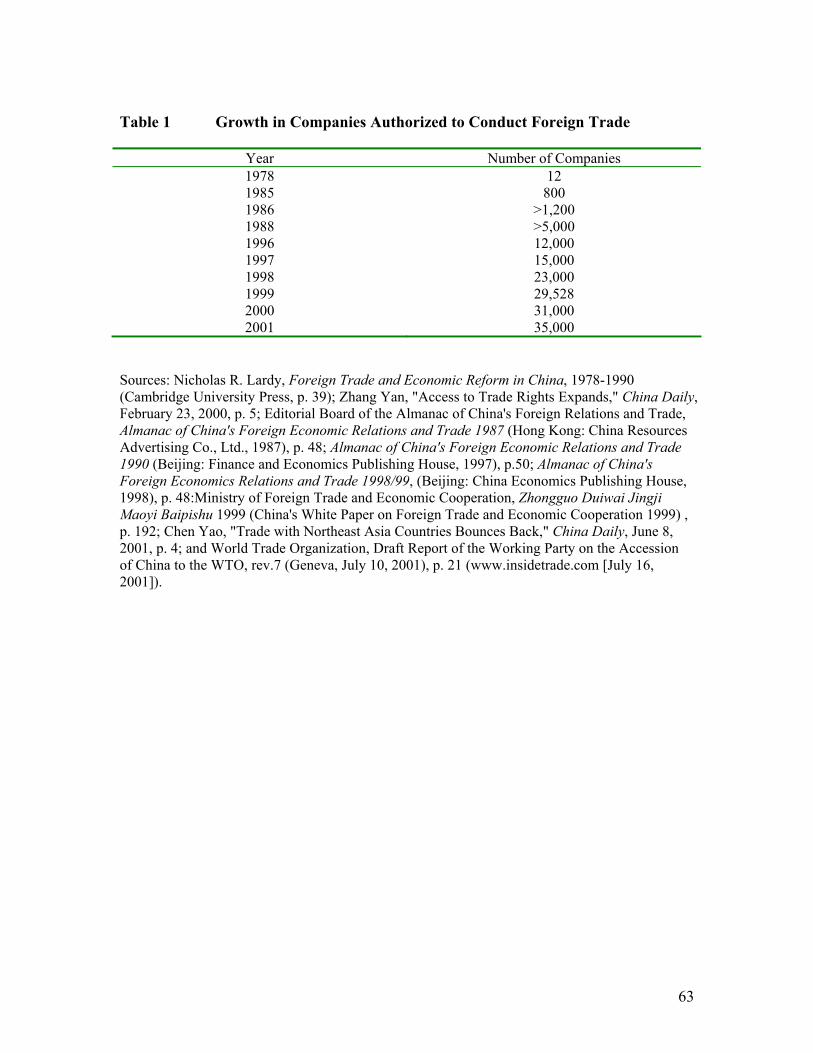
63
Table 1 Growth in Companies Authorized to Conduct Foreign Trade
Year Number of Companies 1978 12 1985 800 1986 >1,200 1988 >5,000 1996 12,000 1997 15,000 1998 23,000 1999 29,528 2000 31,000 2001 35,000
Sources: Nicholas R. Lardy, Foreign Trade and Economic Reform in China, 1978-1990 (Cambridge University Press, p. 39); Zhang Yan, "Access to Trade Rights Expands," China Daily, February 23, 2000, p. 5; Editorial Board of the Almanac of China's Foreign Relations and Trade, Almanac of China's Foreign Economic Relations and Trade 1987 (Hong Kong: China Resources Advertising Co., Ltd., 1987), p. 48; Almanac of China's Foreign Economic Relations and Trade 1990 (Beijing: Finance and Economics Publishing House, 1997), p.50; Almanac of China's Foreign Economics Relations and Trade 1998/99, (Beijing: China Economics Publishing House, 1998), p. 48:Ministry of Foreign Trade and Economic Cooperation, Zhongguo Duiwai Jingji Maoyi Baipishu 1999 (China's White Paper on Foreign Trade and Economic Cooperation 1999) , p. 192; Chen Yao, "Trade with Northeast Asia Countries Bounces Back," China Daily, June 8, 2001, p. 4; and World Trade Organization, Draft Report of the Working Party on the Accession of China to the WTO, rev.7 (Geneva, July 10, 2001), p. 21 (www.insidetrade.com [July 16, 2001]).

64
Figure 1 Tariff Revenues as a Fraction of Import Value, 1978-2002
0.00%
2.00%
4.00%
6.00%
8.00%
10.00%
12.00%
14.00%
16.00%
18.00%
1978 1979 1980 1981 1982 1983 1984 1985 1986 1987 1988 1989 1990 1991 1992 1993 1994 1995 1996 1997 1998 1999 2000 2001 2002
Sources: China Statistical Yearbook 1993, 1998, 2000; Xinhua News Service; Guoji Shangbao (International Business Daily) Figure 2 Foreign Direct Investment in China
Note: Contracted amounts refers to the total value of the approved investment project, where this total is attributed to the year in which approval is conferred. In practice, of course, these investments are often phased in over a series of years. Actual investment tracks the inflow of FDI on an annual basis. Data are taken from publications of the Ministry of Foreign Trade and Economic Cooperation, which was later incorporated into the Ministry of Commerce.
020406080
100120140160180
1984
1986
1988
1990
1992
1994
1996
1998
2000
2002
2004
U.S
. $ b
illio
ns
Contracted Amounts
Actual Investment

65
Figure 3 Counts of FDI contracts by Contractual Form
Source: Ministry of Foreign Trade and Economic Cooperation, Ministry of Commerce, People’s Republic of China Figure 4 Inward FDI in China by Source Country
Source: Ministry of Foreign Trade and Economic Cooperation, Ministry of Commerce, People’s Republic of China
0
10000
20000
30000
40000
50000
60000
86 88 90 92 94 96 9820
0020
02
U.S
. $ m
illio
ns
Ho ng Ko ng
T aiwan
Jap an U SAEuro p e
Ot her
0
10000
20000
30000
40000
50000
60000
70000
80000
90000
1990 1991 1992 1993 1994 1995 1996 1997 1998 1999 2000 2001 2002
Wholly Ow ned Foreign Enterprise
Contractual JV
Equity JV
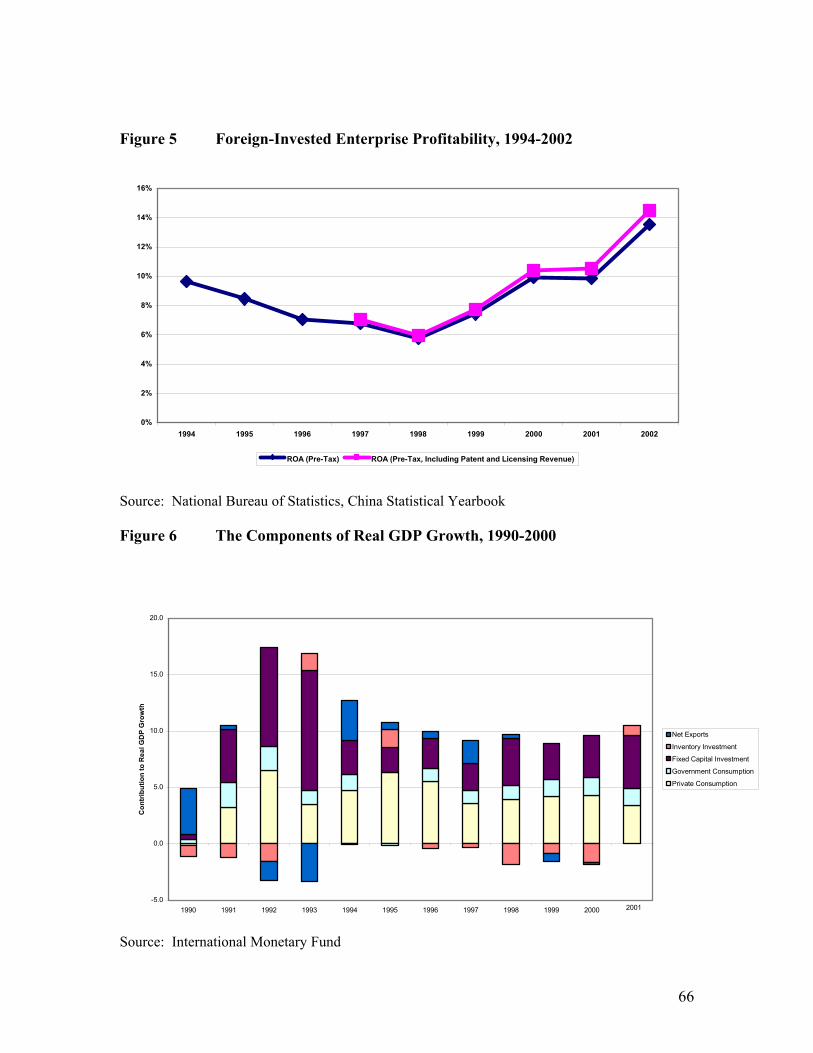
66
Figure 5 Foreign-Invested Enterprise Profitability, 1994-2002
0%
2%
4%
6%
8%
10%
12%
14%
16%
1994 1995 1996 1997 1998 1999 2000 2001 2002
ROA (Pre-Tax) ROA (Pre-Tax, Including Patent and Licensing Revenue)
Source: National Bureau of Statistics, China Statistical Yearbook
Figure 6 The Components of Real GDP Growth, 1990-2000
-5.0
0.0
5.0
10.0
15.0
20.0
1990 1991 1992 1993 1994 1995 1996 1997 1998 1999 2000
Con
trib
utio
n to
Rea
l GD
P G
row
th
Net Exports
Inventory Investment
Fixed Capital Investment
Government Consumption
Private Consumption
2001
Source: International Monetary Fund

67
Figure 7 Exports and Imports of High-Tech Products
0
20
40
60
80
100
120
140
160
1995 1996 1997 1998 1999 2000 2001 2002 2003
US$
Bill
ion
Exports Imports
Sources: Chinese Ministry of Information Industries, China General Customs Administration
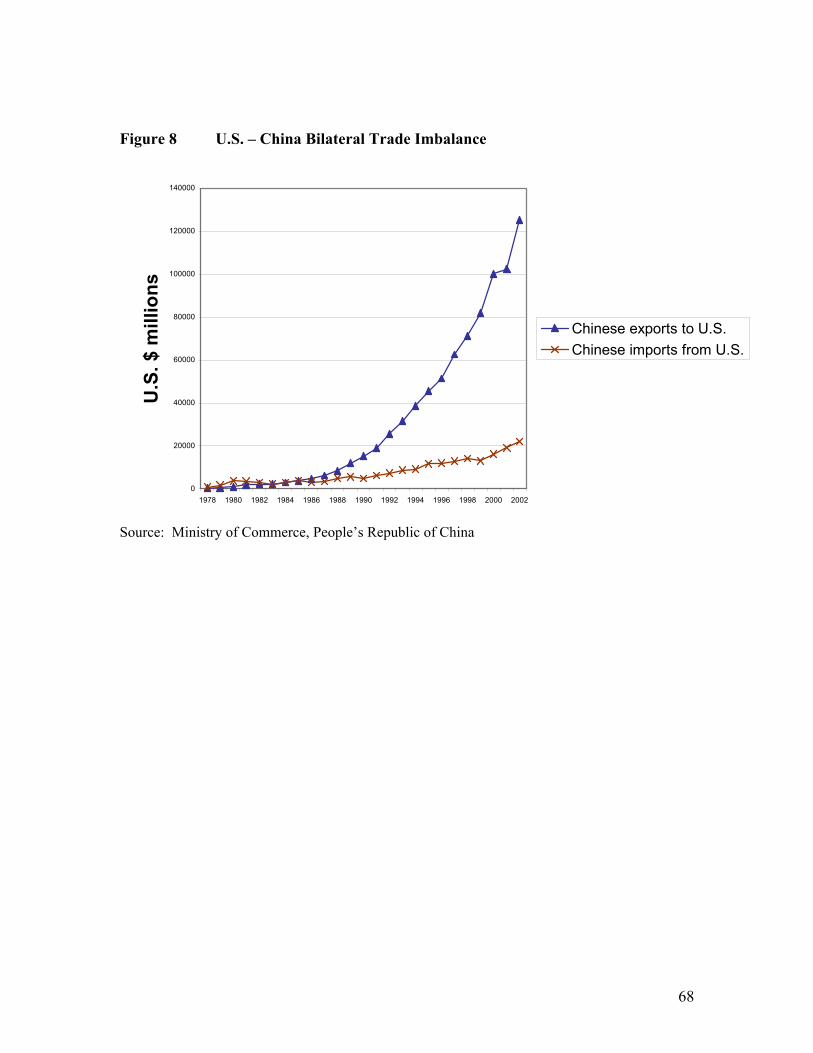
68
Figure 8 U.S. – China Bilateral Trade Imbalance
0
20000
40000
60000
80000
100000
120000
140000
1978 1980 1982 1984 1986 1988 1990 1992 1994 1996 1998 2000 2002
U.S
. $ m
illio
ns
Chinese exports to U.S.Chinese imports from U.S.
Source: Ministry of Commerce, People’s Republic of China

69
Figure 9 Chinese Bilateral Trade with the EU and Japan
-10000
-8000
-6000
-4000
-2000
0
2000
4000
6000
8000
1985
1986
1987
1988
1989
1990
1991
1992
1993
1994
1995
1996
1997
1998
1999
2000
2001
2002
U.S
. $ m
illio
nsTrade Balance with Europe
Trade Balance with Japan
Source: Ministry of Commerce, People’s Republic of China

70
Figure 10 China’s Trade with the U.S. versus ROW
Figure 11 Trade Displacement in Footwear
Source of US Footwear Imports, 1985-2001
0
10
20
30
40
50
60
70
1985
1986
1987
1988
1989
1990
1991
1992
1993
1994
1995
1996
1997
1998
1999
2000
2001
*
Perc
ent (
%)
China South Korea & Taiwan*Jan-Sept data
Source: U.S. Department of Commerce
China's Trade Balance, 1994-2002
-100,000
-80,000
-60,000
-40,000
-20,000
0
20,000
40,000
60,000
80,000
100,000
120,000
1994 1995 1996 1997 1998 1999 2000 2001 2002US$
mill
ion
Trade Balance w/U.S. Total Trade Balance Trade Balance w/World (minus U.S.)

71
Figure 12 Trade Displacement in Toys and Sporting Goods
Source of US Toys, Games and Sporting Goods Imports, 1985-2001
0
10
20
30
40
50
60
70
1985
1986
1987
1988
1989
1990
1991
1992
1993
1994
1995
1996
1997
1998
1999
2000
2001
*
Perc
ent (
%)
China Hong Kong, South Korea, Taiwan *Jan-Sept data
Source: U.S. Department of Commerce