nber working paper series · nber working paper series ... environmental and institutional factors...
TRANSCRIPT

NBER WORKING PAPER SERIES
ASSESSING THE IMPACT OFORGANIZATIONAL PRACTICES ON THE
PRODUCTIVITY OF UNIVERSITYTECHNOLOGY TRANSFER OFFICES:
AN EXPLORATORY STUDY
Donald SiegelDavid Waldman
Albert Link
Working Paper 7256http://www.nber.org/papers/w7256
NATIONAL BUREAU OF ECONOMIC RESEARCH1050 Massachusetts Avenue
Cambridge, MA 02138July 1999
A previous version of this paper was presented at the April 1999 NBER Conference on OrganizationalChange and Performance Improvement in Santa Rosa, CA. We thank Leanne Atwater, Susan Helper, AdamJaffe, Robert Sauer, Jonathan Silberman, Jerry Thursby, Marie Thursby, Steve Zylstra, and seminarparticipants at the NBER, Purdue, LSU, and the University of Nottingham for their insightful comments andsuggestions. We are also deeply indebted to the many administrators, scientists, managers, and entrepreneurswho agreed to be interviewed. Martha Cobb and Melissa Zidle provided capable research assistance.Financial support from the Alfred P. Sloan Foundation through the NBER Project on Industrial Technologyand Productivity is gratefully acknowledged. The views expressed in this paper are those of the authors andnot those of the National Bureau of Economic Research.
© 1999 by Donald Siegel, David Waldman, and Albert Link. All rights reserved. Short sections of text, not

to exceed two paragraphs, may be quoted without explicit permission provided that full credit, including ©notice, is given to the source.Assessing the Impact of Organizational Practices on theProductivity of University Technology Transfer Offices:An Exploratory StudyDonald Siegel, David Waldman, and Albert LinkNBER Working Paper No. 7256July 1999JEL No. D23, L31, O31, O32
ABSTRACT
We present quantitative and qualitative evidence (field research) on universitytechnology transfer offices (TTOs). These offices negotiate licensing agreements with firmsto commercialize university-based technologies. A stochastic frontier production functionframework is used to assess the relative productivity of 113 university TTOs. Our fieldresearch provided a useful reality check on the specification of the econometric model. Theempirical findings imply that licensing activity is characterized by constant returns to scale.Environmental and institutional factors appear to explain some of the variation in TTOefficiency.
Relative productivity may also depend on organizational practices in universitymanagement of intellectual property, which potentially attenuate palpable differences in themotives, incentives, and organizational cultures of the parties to licensing agreements.Unfortunately, there are no existing data on such practices, so we rely on inductive, qualitativemethods to identify them. We present detailed information on our use of these methods. Thisinformation may be useful to economists who are contemplating fieldwork. Based on 55interviews of managers/entrepreneurs, scientists, and administrators at five researchuniversities, we conclude that the most critical organizational factors are likely to be rewardsystems for faculty, TTO staffing and compensation practices, and actions taken byadministrators to extirpate informational and cultural barriers between universities and firms.
Donald Siegel David WaldmanSchool of Management School of ManagementArizona State University West Arizona State University WestPhoenix, AZ 85069-7100 Phoenix, AZ [email protected] [email protected]
Albert N. LinkDepartment of EconomicsUniversity of North Carolina at GreensboroGreensboro, NC [email protected]

3
I. INTRODUCTION
Universities have been criticized in some circles for being more adept at developing
new technologies than moving them into private sector applications. This is potentially
problematic since success in university/industry technology transfer (henceforth, UITT)
could be a critical factor in sustaining the global competitiveness of U.S. firms. Some
federal agencies have responded to this concern by providing incentives for universities to
form partnerships with firms.1 Expectations regarding a quicker commercial "payoff' to basic
research have risen accordingly. To build political support for their institutions, university
leaders frequently cite the role of technology transfer in stimulating local economic
development. Facing tighter budgets, these administrators often promise to deliver more
"bang for the buck" in technology transfer. The private sector has also chimed in,
expressing frustration with obstacles that impede the process of commercialization, such as
disputes that arise with the university regarding intellectual property rights.
These concerns have raised the visibility of UITT in the public policy arena. In recent
years, universities have attempted to formalize UITT and capture a larger share of the
economic rents associated with technological innovation by establishing technology transfer
offices (henceforth, TTOs). TTOs facilitate technological diffusion through the licensing to
industry of inventions or intellectual property resulting from university research. Many
institutions established a TTO in the aftermath of the University and Small Business Patent
Procedure Patent Procedures Act of 1980, otherwise known as the Bayh-Dole Act.
1 For instance, as noted in Cohen et at. (1998), NSF has established Science and Technotogy Centers and otherprograms that require universities to attract matching funds from industry.

4
Bayh-Dole dramatically changed incentives for firms and universitieg to engage in
U ITT. It simplified the UITT process by instituting a uniform patent policy and removing
many restrictions on licensing. Furthermore, it allowed universities to own the patents that
arise from federal research grants. The framers of Bayh-Dole asserted that a streamlined
federal UITT policy and university ownership and management of intellectual property would
accelerate commercialization because universities would now have greater flexibility in
negotiating licensing agreements and firms would be more willing to engage in them.2
It appears that Bayh-Dole has indeed resulted in a more rapid rate of technological
diffusion. According to the Association of University Technology Managers (AUTM (1997)),
the annual number of patents granted to U.S. universities surged from about 300 in 1980 to
approximately 2,000 in 1996, while licensing of new technologies has increased almost
twofold since 1991. Annual streams of revenue accruing from these licenses have risen
from about $160 million in 1991 to $611 million in 1997, now constituting about 2.5% of
university R&D expenditures (GAO (1998)). Major products in a wide variety of industries
have been developed through UITT, such as the Boyer-Cohen "gene-splicing" technique
that launched the biotechnology industry, diagnostic tests for breast cancer and
osteoporosis, internet search engines, music synthesizers, computer-aided design (CAD),
and environmentally-friendly technologies.
Despite the potential importance of UITT as a mechanism for generating local
technological spillovers and as a source of revenue to the university, there is little
2 "We came to the realization that this failure to move from abstract research into useful commercial innovation waslargely a result of the government's patent policy and we sought to draft legislation which would change this policy

5
systematic empirical evidence on any dimension of the performance or prdductivity of UITT
activity. The purpose of this paper is to fill this void.
Our measures of relative productivity are constructed from benchmarking surveys
conducted by AUTM for the years 1991-1994. We adjust these estimates of relative
efficiency to reflect environmental and institutional factors that can influence the rate of
technological diffusion at a given university. We postulate that relative performance in UITT
may also depend on organizational practices in university management of intellectual
property, which potentially attenuate palpable differences in the motives, incentives, and
organizational cultures of the parties to licensing agreements (university administrators/TTO
directors, managers/entrepreneurs, and academic scientists).
Unfortunately, there are no existing data on such practices, nor is it precisely
clear which organizational factors are most critical to effectiveness in UITT. Therefore,
we rely on inductive, qualitative methods (field research) to identify these variables,
which are typically ignored in conventional productivity studies. The field research also
provided a useful reality check on the specification of our econometric model.
Accordingly, we conducted 55 structured, face-to-face interviews of UITT stakeholders
(15 administrators, 20 managers or entrepreneurs, and 20 scientists affiliated at five
universities). We sought feedback from these individuals on the nature of the UITT
"prod uction process," the barriers to effective U ITT, recommendations to improve the
process, and the importance of networks and relationships in UITT.
The remainder of this paper is organized as follows. In Section II, we describe a set
in a way to quickly and directly stimulate the development and commercialization of inventions" (Bayh (1996)).

6
of internal and external factors that influence the extent of UITI activity at given university.
Differences in the actions, motives, and organizational environments of the parties to
licensing agreements are also considered. We conjecture that these differences can
potentially undermine efforts to commercialize university-based technologies. This
discussion serves to underscore the potential importance of organizational practices as a
determinant of the extent of UITT activity at a given university. Section III outlines the
method for assessing the relative productivity in UITT. Preliminary empirical results are
presented in Section IV. Section V describes our qualitative research design and methods.
Section VI presents the qualitative findings. The final section consists of preliminary
conclusions and suggestions for additional research.
II. DETERMINANTS OF UITT
Internal Inputs
Figure 1 presents a schematic of the process of the transfer of a technology from a
university to a firm or entrepreneur, through the negotiation of a licensing agreement. It also
identifies the three key stakeholders involved at each stage of the transfer: academic
scientists, TTO personnel/university administrators, and firm/entrepreneurs.
The first stage of the process is scientific discovery. According to the Bayh-Dole Act,
the scientist is then required to file an invention disclosure with the TTO. Our field research,
which is described in greater detail in Sections V and VI, revealed that this rule is rarely
enforced. Thus, TTO personnel must spend a portion of their time encouraging faculty
members to disclose inventions.

7
Once the invention is formally disclosed, the TTO must simultaneoii%ly evaluate
the commercial potential of the technology and decide whether to patent the innovation.
Often, interest in the technology by an industry partner provides sufficient justification
for filing a patent. In other instances, the TTO must make these judgements before
industry expresses an interest in the technology. Furthermore, universities must decide
whether to seek global or domestic patent protection. Domestic protection is
substantially cheaper, but often much less valuable to potential licensees, particularly
when foreign markets are perceived to be highly lucrative relative to the U.S. market.
As confirmed in our interviews, this decision poses a dilemma for many TTOs because
they have limited resources for filing patents.
If the patent is awarded, the TTO will often attempt to market the technology. Faculty
members are frequently involved in the marketing phase because they are often in a good
position to identify potential licensees and because their technical expertise often makes
them a natural partner for companies that wish to commercialize the technology, It is
important to note that Figure 1 potentially overstates the role of patents in U ITT. As
reported in Jensen and Thursby (1998) and confirmed in our field research, many firms will
frequently license a technology before it is patented. Furthermore, according to AUTM,
university technology managers tend to view patents as both as an input and output of
UITT. This implies that the key "raw material" in UITT is the invention disclosure. Invention
disclosures constitute the pool of available technologies for licensing.
The final stages of UITT involve the negotiation of a licensing agreement with firms or

8
individual entrepreneurs. These agreements could include such benefits t the university as
royalties, "follow-on" sponsored research agreements, or an equity stake in a new venture
based on the licensed technology. We discovered on our field visits that many universities,
especially public institutions, are quite sensitive to the charge that they are "giving away"
university-based, taxpayer-funded technologies that yield substantial windfall profits. As a
result, many TTOs are adopting a hard line in licensing negotiations.
Interviews with university administrators revealed that TTO involvement does not end
with the licensing agreement. It is quite common for ITOs to devote substantial resources
to the maintenance and renegotiation of licensing agreements. This is attributed both to the
embryonic nature of the technologies and to the fledgling nature of many of the firms that
license university-based technologies.
We wish to stress that our qualitative analysis greatly improved our ability to
model the "production process" of U ITT, by helping us identify the appropriate set of
outputs and inputs to include in the production function. For instance, we began this
project with the view that there are multiple outputs of UITT. Discussions with university
administrators, the "producers" in our model, revealed that licensing activity is by far the
most critical output, so we have now focused our attention on this critical dimension of
UITT performance. Our qualitative work also revealed that we had greatly
underestimated the importance of faculty involvement or "buy-in" to UITT. This
stemmed, in part, from our literal interpretation of the language contained in the Bayh-
Dole Act. As noted earlier, Bayh-Dole stipulates that faculty members working on
See AUTM (1997) pp. 20-2 1.
9
federal research grants must disclose their inventions to the TTO. During ur
interviews, however, we discovered that this provision is rarely enforced, so that
disclosure is actually not mandatory. -
Thus, invention disclosures are essentially an intermediate input. The number
of disclosures will depend, to some extent, on the efforts of the TTO to elicit disclosures
and faculty interest in UITT. This, of course, raises the critical issue of organizational
incentives for faculty and TTO personnel to engage in these activities. Consistent with
the findings of recent theoretical and empirical studies summarized in Lazear (1999),
we hypothesize that human resource management and other organizational practices
that influence such incentives could explain some of the variation in UITT performance
across universities.
In sum, our analysis reveals that the following internal factors should be
considered (internal) inputs of UITT: invention disclosures (a proxy for the set of
available technologies), labor employed by the TTO, and (external) legal fees incurred
to protect the university's intellectual property.4
Environmental/Institutional Variables
University licensing activity may also depend on a vector of environmentaland
institutional variables. For instance, the presence of a medical school on campus and the
public status of the university may be important institutional factors. Pressman et al. (1995)
This amount includes expenditures in support of prosecution, maintenance, litigation, and interference costsrelating to patents and/or copyrights (see AUTM (1997)).

10
report that over 60% of university licenses result from a biomedical inventin. Public
universities may have less flexible UITT policies than private universities regarding the
formation of startup companies and interactions with private firms. Furthermore, public
universities may be less focused on UITT as a source of revenue than private universities.
An example of an environmental variable is a measure of state-level economic growth,
which can be viewed as a proxy for the ability of firms in the local region to sponsor R&D
projects at the university.
In explaining the relative efficiency of TTOs, it may also be important to control for the
R&D activity of local firms. A plethora of recent studies provide support for the notion that
university research generates local technological spillovers. Bania, Eberts, and Fogarty
(1993) find that there is a positive relationship between university R&D and the number of firm
startups in the same SMSA. Jaffe, Trajtenberg, and Henderson (1993) report that patents
(new technologies) generated within the same state (and SMSA) are more likely to be cited
by firms in the same state or SMSA. Zucker, Darby, and Brewer (1998), Zucker and Darby
(1996), and Audretsch and Stephan (1996) directly examine interactions between academic
scientists and local firms and find that these formal and informal linkages play an important
role in promoting innovation in biotechnology.
Organizational Factors
An understanding of the potential importance of organizational practices
begins with a consideration of the actions, motives, and organizational cultures of
UITT stakeholders. As shown in Table 1, we assert that a primary motive of

university scientists is recognition within the scientific community, which eranates
from publications in top-tier journals, presentations at prestigious conferences, and
federal research grants. This is an especially strong motive for untenured faculty
members. Other possible motives include financial gain and a desire to secure
additional funding for graduate assistants, post-doctoral fellows, and laboratory
equipment/facilities. The norms, standards, and values of scientists reflect an
organizational culture that values creativity, innovation, and especially, an
individual's contribution to advances in knowledge (basic research).
The TTO must work with scientists and managers or entrepreneurs to
structure a deal. We hypothesize that the primary motive of the TTO is to protect
and market the university's intellectual property. Secondary motives include
promoting technological diffusion and securing additional research funding for the
university via royalties, licensing fees, and sponsored research agreements.
Recall that a primary reason for the federal government's relinquishment of
intellectual property rights, as stipulated in Bayh-Dole, was to accelerate the
commercialization of university-based technologies. Many managers and
scientists remarked that TTOs were especially committed to their role as guardian
of the university's intellectual property. As such, technology licensing officers tend
to be somewhat inflexible and conservative in structuring deals. This inflexibility is
consistent with the bureaucratic organizational culture of the university.
Firms and entrepreneurs seek to commercialize university-based
technologies for financial gain. They are also concerned about maintaining
11

12
proprietary control over these technologies, which can potentially be achieved
through an exclusive worldwide license. The entrepreneurial organizational culture
of most firms (especially startup companies and high tech firms) rewards
timeliness, speed, and flexibility. Reflecting the values of this culture, a number of
the managers we visited with stressed the importance of "time to market" as a
determinant of success in UITT, in part, because they are convinced that there are
significant first mover advantages in high technology markets.
It is apparent from Table 1 that there are palpable differences in the motives,
incentives, and organizational cultures of UITT stakeholders that could potentially
impede technological diffusion. Therefore, we hypothesize that some of the
variation in UITT performance across universities can be attributed to
organizational behaviors that potentially help to resolve these differences. Our
inductive, qualitative analysis, described in Sections V and VI, will help us identify
these factors.
III. ASSESSING RELATIVE PRODUCTIVITY IN UITT
In the previous section, we identified a set of potential determinants of U ITT, which
be can expressed in equation form as:
(1) UITT = f (tNT, ENV, ORG)
where tNT denotes a vector of internal inputs used to generate UITT output, ENV
represents a vector of environmental and institutional variables, ORG is a vector of
organizational practices.

13
To assess relative productivity in UITT, we use the stochastic frontier estimation
(henceforth, SFE) methodology developed by Aigner, Lovell, and Schmidt (1977) and
Meeusen and Van den Broeck (1977). SFE generates a production (orcost) frontier with a
stochastic error term that consists of two components: a conventional random error ("white
noise") and a term that represents deviations from the frontier, or relative inefficiency.
SFE can be contrasted to data envelopment analysis (DEA), a non-parametric
estimation technique that has also been used extensively to compute relative productivity in
service industries (see Charnes et al. (1994)). Thursby and Kemp (1998) use DEA to
assess the relative efficiency of university TTOs. DEA and SFE each have key strengths
and weaknesses. DEA is a mathematical programming approach that does not require the
specification of a functional form for the production function. It can also cope more readily
with multiple inputs and outputs than parametric methods. On the other hand, DEA models
are deterministic and highly sensitive to outliers. SFE allows for statistical inference but
requires restrictive functional form and distributional assumptions. We believethat SEE
and DEA should be viewed as complements, not substitutes.
In SFE, a production function of the following form is estimated:
(2) y, =xJ3+e1
where the subscript I denotes the ith university, y represents output, x is a vector of
inputs, 13 is the unknown parameter vector, and is an error term with two
components, = V - U1, where U, represents a non-negative error term to account
for technical inefficiency, or failure to produce maximal output, given the set of
inputs used. V1 is a symmetric error term that accounts for random effects. The
standard assumption (see Aigner, Lovell, and Schmidt (1977)) is that the 15 and V,
have the following distributions: U, i.i.d. N(O,a2), u, � 0
V i.i.d. N(0,y2)
That is, the inefficiency term (U) is presumed to have a half-normal distribution,
which indicates that universities are either "on the frontier" or below it. An
important parameter in this model is y = 2/ (o.2÷ a2), the ratio of the standard
error of technical inefficiency to the standard error of statistical noise, which is
bounded between 0 and 1. Note that y = 0 under the null hypothesis of an absence
of inefficiency, signifying that all of the variance can be attributed to statistical
noise.
In recent years, SFE models have been developed that al!ow the technical
inefficiency term to be expressed as a function of a vector of environmental and
organizational variables. This is consistent with our notion that deviations from the
frontier (which measure relative inefficiency in UITT) are related to institutional and
organizational factors. Following Reifschneider and Stevenson (1991), we assume
that the U are independently distributed as truncations at zero of the N( m12)
distribution with
(3) rn =z,ö
where z is a vector of environmental, institutional, and organizational variables that
are hypothesized to influence efficiency and ö is a parameter vector.5
Following Battese and Coelli (1995), we derive maximum likelihood
14

estimates of the parameter vectors 3 and ö from simultaneous estimation d1 the
production function and inefficiency term equations, using the FRONTIER
statistical package (See Coelli (1994)). Based on these parameter values, we will
compute estimates of relative productivity.
Our empirical specification of equation (2) is based on the knowledge
production function framework developed by Griliches (1979), here extended to
university licensing, our proxy for UITT output. We assume a three-factor, log-
linear Cobb-Douglas production function, relating licensing to three inputs:
invention disclosures, TTO staff, and legal expenditures:
(4) ln(LICENSE) 13 + ln(INVDISC,) + j2 ln(STAFF) + ln(LEGAL,) + V - U
where LICENSE = average annual licensing agreements or revenueINVDISC = average annual invention disclosures
STAFF = average annual TTO employeesLEGAL = average annual external legal expenditures
with the technical inefficiency (Ui) term expressed as:
(5) Ui = + k k ENV1 + m 4m ORG1 ÷ p1
where ENV and ORG are defined as in equation (1) and j.i is a classical
disturbance term. As noted in the previous section of the paper, we do not have
systematic measures of ORG. The equation we actually estimate contains only the
following environmental and institutional factors:
(5a) U = + öM MED + 8 PUBLIC + 6R lNDRD+ 6 INDOUTJ +
Battese and Coelli (1995) have recently extended this model to incorporate panel data.
15
16
where MED and PUBLIC are dummy variables denoting whether the univsity has
a medical school and whether it is a public institution, respectively: and INDRD and
INDOUT are average annual industry R&D intensity and average annual real
output growth in the university's state (j), respectively, during the sample period.6
The characteristics of our data and parameter estimates of equations (4)
and (5a) are presented in the following section.
IV. DATA and RESULTS
Our primary data source is a comprehensive survey conducted by AUTM.
The survey was completed by TTO directors at 183 academic institutions for the
years 1991-1994. We eliminated teaching hospitals, research institutes, and
Canadian institutions, leaving us with 113 U.s. universities. This is by no means a
random sample of research universities, as evidenced by the fact that 80 out of 89
U.S. "Research 1" institutions are included in our final sample.'
The AUTM file contains annual data on the number of licensing agreements
(LICENESE1), royalty income generated by licenses (LICENSE2), invention
disclosures (INVDISC), number of full-time-equivalent employees in the TTO
(STAFF), and legal expenditures on UITT (LEGAL). Our data sources for state-
level industrial R&D (INDRD) and real output growth (INDOUT) are NSF and the
6 An alternative is to use MSA-level R&D data on industrial innovations and R&D employment, provided inAnselin, Varga, and Acs (1997). Unfortunately, these data (from 1982) do not correspond to our sample period.
Source: Carnegie Foundation for the Advancement of Teaching-To qualify for Research I status, a university mustaward 50 or more doctoral degrees and receive at least $40 million annually in federal research grants.

17
BEA.8 P
Several difficulties with the output data should be noted. First, licensing
agreements vary substantially in their significance, making it dangerous-to draw
inferences about aggregate technology flows based on the number of deals. To
address this concern, we use licensing revenue as an additional measure of
output. Another limitation is that we focus only on two UITT outputs: (I) licensing
agreements and (2) royalties. Sponsored research and the formation of startup
companies can also be viewed as outputs of U ITT. However, it is important to note
that startups and sponsored research agreements are often corollaries to licensing
agreements. Along similar lines, one could also assume a broader view of
technology transfer and consider patents, invention disclosures, and even students
as UITT outputs. Given the uncertainty surrounding this issue, we asked UITT
stakeholders to identify the outputs of UITT in our field research.
Descriptive statistics for the inputs and outputs of the licensing production
function are presented in Table 2. The average university in our sample generates
12 licensing agreements per year, earns $1.6 million in licensing income,
generates 46 invention disclosures, employs eight workers in the TTO, and spends
$300,000 on external legal fees to protect its intellectual property.
Table 3 contains two sets of parameter estimates of the stochastic frontier
8 Source: NSF-Research and Development in Industry (1991-1994), U.S. BEA (1999)-Gross State Product datareported in Fixed Reproducible Tangible Wealth.
A similar problem is encountered with patents. Jaffe, Trajtenberg, and Henderson (1993), Trajtenberg, Henderson,and Jaffe (1997) and Henderson, Jaffe, and Trajtenberg (1998) weight patents on the basis of the number of

production function and inefficiency models outlined in the previous section
(equations (4) and (5a)) for two dependent variables: average annual number of
licensing agreements and average annual licensing revenues, respectively.
Columns (1) and (4) present OLS results, which are used to obtain starting values
for the regression parameters in the SFE model.'° Columns (2) and (5) contain
maximum-likelihood estimates of the SFE model without the environmental and
institutional variables, while Columns (3) and (6) present the coefficients of the "full"
version of the SFE model, including the inefficiency model with environmental and
institutional variables.
The production function model appears to fit quite well, based on the R2
values. Across all variants, the estimated elasticity of licensing output with respect
to invention disclosures is positive and highly significant. The results also imply
that hiring more staff in the TTO results in more licensing agreements (columns (1)-
(3)), but not additional licensing revenue (columns (4)-(6)). This result suggests
that university administrators have established TTO incentives in a manner that is
consistent with the spirit of Bayh-Dole, i.e., to maximize the number of licensing
agreements.
On the other hand, the findings imply that spending more on (external)
lawyers reduces the number of licensing agreements, but increases licensing
revenue. One interpretation of this result is that using outside lawyers provides a
citations they receive.10 Coelli (1994) points out that, except for the intercept term, the OLS estimates are consistent, albeit inefficient.
18
19
signal that the university is aggressively protecting its intellectual propertytThis
results in fewer, but more lucrative, licensing agreements. Of course, it is difficult
to assess the validity of this hypothesis without additional information or the
composition of the ITO staff. That is because substantial external legal expense
could actually reflect outsourcing of legal functions or defensive actions in the
aftermath of a major lawsuit.
The F statistics imply that the production process for licensing agreements is
characterized by constant returns to scale. This finding is consistent with the results of
a recent study by Adams and Griliches (1996). The authors examined the research
productivity of universities, using papers and citations as outputs and R&D
expenditures as inputs, and found evidence of constant returns to scale.
It appears that licensing revenue, on the other hand, is subject to increasing
returns. An implication of this finding is that a university employing a revenue
maximization strategy should spend more on lawyers. Perhaps this would free up TTO
staff to spend more time "matching" scientists to firms. These results should be
interpreted with caution because licensing revenue, even when computed over a four-
year period, can be a somewhat misleading indicator of the current performance of a
ITO, because royalty streams may reflect transactions that were consummated many
years ago. For instance, the University of Florida has consistently ranked among the
top 10 U.S. universities in licensing income due to Gatorade.
Next, we focus on parameter estimates of the "full" SFE model (SFE2),
including the inefficiency equation (eq. (5a)). For the most part, the coefficients on

20
the environmental and institutional variables have the appropriate signs, bat are
uniformly insignificant. The findings do imply, however, that universities in states
with higher levels of industrial R&D activity are less inefficient, that is, closer to the
frontier. Thus, our evidence suggests that there may be an association between
R&D conducted by local private firms and UITT activity at research universities in
the same state. Despite the lack of significance of many of the individual
coefficients, the y values are highly statistically significant, indicating that the (null)
hypothesis that inefficiency effects are absent from the model can be decisively
rejected.
Further evidence that external factors provide some explanatory power is shown
on the bottom of Table 3, which contrasts the mean technical efficiency in the versions
of the model excluding (columns (2) and (5)) and including (columns (4) and (6)) the
environmental and institutional variables. The latter set of findings indicate that these
external factors explain some of the variation in technical inefficiency across
universities, 20.8% and 15.4%, respectively.11
As noted in the previous section, we hypothesize that some of the variation in
relative productivity can also be attributed to organizational practices in university
management of intellectual property. These practices could potentially serve to mitigate
conflict caused by palpable differences in the motives, incentives, and organizational
cultures of scientists, firms, and administrators. Unfortunately, there are no existing
That is, the mean technical efficiency is closer to one when we include these variables in the stochastic frontier
model (.051(1 - .76) =.208 and .04/(1 - .74)) .154).

21
data on organizational practices in U ITT, nor is it even precisely clear wharneeds to be
measured.
Accordingly, we outline our inductive, qualitative approach to the
examination of organizational issues in the next section of the paper. We also
provide detailed information on qualitative research methods as they relate to field
studies, given that most economists are unfamiliar with these techniques. This
information may also be beneficial to economists who are contemplating fieldwork.
V. Qualitative Research Methods-Field Studies
As shown in Table 4, a researcher who wishes to conduct an interview-
based, field study confronts four key methodological issues:12
1) Sample Selection2) Nature of Interview Questions3) Procedures for Conducting Interviews4) Qualitative Data Analysis
That is, in designing the qualitative component of this study, we had to select an
appropriate sample of organizations and individuals to visit, formulate a set of
interview questions, determine how to conduct the interviews, and choose an
appropriate method for analyzing the qualitative data (from the interviews). Table 4
summarizes how we addressed each of these issues. In doing so, we borrowed
heavily from long-standing literatures in the fields of management, psychology, and
sociology, where qualitative methods are prevalent.
12 This is by no means an exhaustive list of such concerns. For a comprehensive review of qualitative research
To assess the nature and relevance of organizational factors in UITI, we
interviewed TTO stakeholders affiliated with five research universities in the
Southwest and Southeast. This clearly constitutes a convenience sample of
universities because of our familiarity with these institutions and the surrounding
regions. However, as noted in Yin (1989), convenience samples of organizations
are common in inductive, exploratory studies, especially when researchers have
limited funding.
Note that our focus on these two regions precludes an examination of major
hubs of technology transfer activity, such as Cambridge/Boston (MIT, Harvard, and
Boston University) or the San Francisco Bay area (Stanford and UC-Berkeley). We
contend, however, that the schools we visited are probably far more representative
of the modal university experience with technology transfer, as compared to top-tier
schools that have more favorable environmental conditions for promoting the
commercialization of university R&D.
Table 5 presents some information on the characteristics of the five
universities that we examined. Our sample consists of private and public
universities, land grant institutions, and universities with and without a medical
school. There is also considerable variation with respect to the size of the TTO,
the extent of licensing activity, and relative productivity (technical efficiency).13
Note also that each of these schools established a TTO soon after the enactment
methods, see Miles and Huberman (1994) and Yin (1989).13 That is, some institutions are close to the frontier, while others are highlyinefficient.
22
of Bayh-DoIe (1980). p
Returning to the issues outlined in Table 4, another sample selection
concern is the representativeness of the interviewees. Recall that ourgoal is to
examine what may be three different perspectives on UITT organizational issues
(scientists, administrators, and managers/entrepreneurs). Given this objective, we
attempted to draw a sample of respondents that best reflected representative
attitudes of these stakeh older groups.
Potential respondents were selected in two ways. First, we identified the
TTO director and other administrators with UJIT responsibilities, such as a Vice
Provost, Vice President, or Vice Chancellor for Research.14 Second, to identify
managers/entrepreneurs and scientists, we solicited feedback from two nonprofit
organizations that serve as technology transfer "facilitators" in each region. By
design these facilitators have a balanced view on U ITT. Furthermore, they are
well connected to all UITT stakeholders because they have interacted extensively
with them. These facilitators helped us selectmanagers and scientists with
different perspectives on UITT.15
In sum, a stratified approach (Miles and Huberman (1994))was used for the
selection of interviewees, so that they would be drawn from each of the constituent
groups described above. At each of the five universities, we conducted interviews
with academic scientists, TTO directors, and high-level university administrators
14 Typically, the TTO director reports to a Vice President, Vice Provost, or Vice Chancellor for Research.' In one region, a facilitator had published a voluminous report on UITT, which contained the names, phone
23

who oversee the TTO. Within the surrounding region of the university we iso met
with founders of startup firms, directors of business development, intellectual
property managers and other research executives of large companies, and
executives of patent management firms and nonprofit organizations with an interest
in UITT. We conducted 55 interviews: 20 managers/entrepreneurs, 15
administrators (5 TTO directors and 10 top-level administrators), and 20 scientists.
Although there were only 55 face-to-face meetings, we actually interviewed 98
individuals, since multiple respondents were present at some meetings.
Another methodological issue concerns the nature of the interview
questions. In formulating our list of questions, we adopted a "semi-structured"
approach, as suggested by Miles and Huberman (1994), whereby interviewees
within each of three stakeholder categories were asked the same questions.
According to these authors, the best approach for an inductive study is to ask
open-ended questions, such as "What are the outputs of U ITT?," "What are the
barriers to effective U ITT?," and "How would you improve the process?" We asked
such questions to all stakeholders (scientists, administrators, managers, and
entrepreneurs), although some queries were tailored to a particular group. For
example, TTO directors were asked about managerial practices in the TTO;
administrators were asked broader questions about the university's strategic goals
for UITT.
As shown in Table 4, we also had to establish interview procedures.
numbers, and addresses of these potential respondents.
24

Sekaran (1992) contends that face-to-face interviews are best when cond'bting an
inductive study on a controversial topic. She notes that in-person interviews offer
several advantages. First, it is often easier to clarify questions and sense any
discomfort on the part of a respondent in a face-to-face interview, rather than by
telephone. Second, qualitative researchers report that eye contact often elicits
more accurate and comprehensive information because it can raise the
interviewee's comfort level. Eye contact may also help to build trust, which can be
important if the issue under consideration is sensitive. Finally, there may also be a
guilt effect. That is, interviewees may feel obliged to "reward" researchers who
have traveled long distances to visit them by providing more candid and
provocative information.
To further improve the quality of information collected during the interviews,
we employed a team approach, by pairing an economist with a management
professor.16 Although the two economists on this paper have previously conducted
field studies (Link and Scott (1998) and Siegel (1999)), management professors
have much more extensive experience and training in qualitative research
techniques. Economists who are contemplating fieldwork should draw on the
expertise of colleagues in other disciplines. Also, the use of teams (regardless of
expertise) can also enhance the overall effectiveness of a face-to-face interview by
increasing the likelihood that a researcher can respond to a clarifying question or
establish a rapport with the interviewee.
25

26
Following Waldman et al. (1998), we also employed three tactics in'
conducting our interviews that have been shown to increase the accuracy and
reliability of qualitative data. The first is neutral probing of answers, to avoid unduly
influencing the respondent when following up on a resp'onse to an open-ended
question. Second, we provided a pledge of confidentiality, to increase the
likelihood that interviewees provide candid and forthright responses. Finally, each
interviewee had prior knowledge of the goals of our study and the credentials of the
interviewers. According to Yin (1989), this serves two useful purposes. First, it
indicates the researchers' concern and respect for the value of the respondent's
time. Second, it reduces uncertainty and suspicion regarding the intentions of the
researchers.
The final methodological issue is qualitative data analysis, or how to
organize, examine, and display the information we collected during the lengthy
interviews, which lasted, on average, for about one hour. Not surprisingly, there
was considerable variation in the duration of interviews, given the open-ended
nature of the questions. Interviews were tape recorded and then transcribed by a
third (clerical) party. Eisenhardt (1989) contends that a third-party transcription
ensures a complete and unbiased recording of interview data.'
Once we generated the 55 transcripts, we implemented the three stages of
5 professors (2 management professors and 3 economists) conducted the 55 interviews (see Siegel et al. (1999)).17
Following Bryman (1989), interviewees were also promised a study report of aggregated findings.

qualitative analysis of interview data outlined in Miles and Huberman (1 994.18
These are data reduction, data display, and conclusion drawing/verification. Data
reduction involves the selection, simplification, and transformation of raw data
(interview responses) into an analyzable form. The first step was the development
of a list of general categories for content analysis. These categories were largely
based on general research questions, such as identifying the barriers to U ITT.
As demonstrated by Miles and Huberman (1994), it is common for coding
categories to be modified because of a poor fit or the need to add and combine
classifications. Indeed, an initial review of fifteen transcripts indicated that
comments relevant to one of our initial categories (i.e., aspects of the TTO) should
be combined with other categories. We also followed the advice of Miles and
Huberman (1994) by having multiple assessors of interview transcripts. The
authors assert that the use of multiple assessors reduces the degree of bias in
interpreting such transcripts.
Thus, for each transcript, all comments were independently categorized by
at least two members of the research team into four areas: (1) UITT outputs, (2)
networks/relationships in UITT, (3) barriers to UITT, and (4) proposed
improvements to the UITT process. The researchers' lists of comments within a
topic area were then compared, and discrepancies were discussed between the
two researchers until agreement was reached regarding comments that were
18 See Miles and Huberman (1994), pp. 10-12.
27
28
pertinentto each category.19
Following identification of relevant comments in each topic area, each
researcher then worked with five interview transcripts to generate a list of more
specific themes within the four categories. The research team then met and
discussed the themes that emerged. There was a great deal of similarity in the
lists of themes that emerged from the separate samples of comments.
After a consensus was reached regarding the themes, we returned to the lists of
comments pertinent to the each of the four general categories and sorted them into the
themes identified for that respective category. For data display purposes, we tabulated
frequency counts for each major theme that emerged. In Tables 6-9, we display
percentages of respondents who identified a particular theme relating to UITT outputs,
relationships/networks, barriers to effective U ITT, and suggested improvements to the
UITT process. For example, as shown in the first column on Table 6, seventy-five
percent of the managers/entrepreneurs we interviewed identified licenses as an output
of U ITT. Note that these analyses are conducted separately for each stakeholder
group. Proportion tests of differences (Z-tests) were computed to compare whether the
proportion of respondents mentioning a theme in a given group differs from the
proportion of respondents mentioning a theme in another group. For instance, Z12
compares managers/entrepreneurs (Group 1) and TTO directors/university
administrators (Group 2).
19 These methods are similar to those employed by Butterfield, Trevino, and Ball (1996), who identifiedunique "thought units" pertinent to their subject of interest (employee discipline).

p
VI. QUALITATIVE FINDINGS
Table 6 demonstrates that licenses and royalties were identified as outputs
of UITT by a substantial majority of TTO directors and university administrators.
Managers and entrepreneurs also frequently mentioned licenses, but stressed
informal aspects of UITT a bit more, as well the economic development aspects of
U ITT. Scientists emphasized product development and somewhat surprisingly,
failed to mention sponsored research agreements.
Another key finding is that there is considerable heterogeneity in stakeholder
perspectives regarding UITT outputs. There appears to be a "Rashomon" effect,
as demonstrated by the numerous output categories identified by respondents and
by the many significant differences between each class of interviewee (16 out of 30
Z statistics are significant at the 5% level). This result is perhaps not surprising,
given that university management of intellectual property through a TTO is a recent
and somewhat controversial development. Some interviewees perceived the
mission of the TTO (protection and marketing of the university's intellectual
property) as being inconsistent with the traditional "public domain" philosophy
regarding the dissemination of information that typically pervades research
universities.
As shown in Table 7, respondents in each stakeholder category mentioned
personal relationships in UITT much more frequently than contractual relationships.
29

30
One scientist phrased it in this manner:
"I would say right now that I feel that the one-on-one interaction is somewhat moresuccessful in effectively transferring technology [than is research formally sponsoredby a consortium]"
-
This raises the possibility that the formation of "social networks" could be
important in U ITT. These networks include academic and industry scientists,
graduate students and post-doctoral fellows who do most of the experimental work
in laboratories, former graduate students who have accepted positions in industry,
entrepreneurs, and perhaps, university administrators and TTO directors. As
defined by Liebeskind et al. (1996), social networks, like markets, involve
exchanges between legally distinct entities. However, unlike markets, social
networks support these exchanges without using competitive pricing or legal
contracting. Instead, they rely on shared norms among the exchange partners,
where information is the currency of exchange.2°
Moreover, in a high technology business context, organizations must devise
arrangements that enable them to source a critical input--patentable/licensable
scientific knowledge -- in a highly efficient manner. Efficiency here refers to rapid
development and availability of scientific knowledge with relatively low sunk costs,
i.e., internal R&D costs. Liebeskind et a!. (1996) provided evidence of how the
existence of social networks can increase organizational learning and flexibility in
biotechnology.
20 Powell (1990) argued that social networks are the most efficient organizational arrangement for sourcing

31
Table 7 also indicates that knowledge transfer appears to work in beth
directions. Sixty-five percent of the scientists we interviewed noted that interacting
with industry has influenced their basic research. Some scientists explieitly
mentioned that these interactions improved the quantity and quality of their basic
research. A representative comment from a scientist was:
"There is no doubt that working with indust,y scientists has made me a betterresearcher. They help me refine my experiments and sometimes have a differentperspective on a problem that sparks my own ideas. Also, my involvement with firmshas allowed me to purchase better equipment for my lab, which means I can conductmore experiments."
This observation is consistent with the findings of Zucker and Darby (1996), who
observed an increase in the scholarly output of "star" academic scientists who become
involved in commercialization efforts in biotechnology.21
As shown in Table 8, all three groups identified a lack of understanding
regarding university/corporate/scientific norms as a barrier to effective UITT
(90.0%, 93.3%, and 75.0%). It appears that these cultural and informational
barriers are pervasive. That is, university scientists and administrators often do not
understand or appreciate the industry environment, and vice versa. An illustrative
comment from a scientist was:
"Industry has a lack of understanding of what an academic institution does and a lackof understanding of what a university faculty members responsibility is to theirinstitution. There are some companies I don't even deal with because their approachto dealing with an academic entity is so poor. They feel that basically we owe themby our position at the university because the state pays our salaries."
information because information is difficult to price and communicate through a hierarchical structure.21 Mansfield (1995) reported similar results for a variety of scientific fields.

32
Our qualitative evidence is consistent with the view that UITT stakeolders
operate under different organizational environments and cultures, which implies
that they have different norms, standards, and values. For example, Nelson (1998)
noted how universities and firms differ in their perspective on the role of
knowledge. Managers and entrepreneurs usually do not share the academic
values of publishing results and sharing information with colleagues and the
general public. Instead, new knowledge and technology is to be kept proprietary
and exploited to achieve or sustain a competitive advantage.
Table 8 also indicates widespread belief that there are insufficient rewards for
faculty involvement in UITT. Sixty percent of the university administrators and seventy
percent of the scientists reported this as a barrier. In their comments, administrators
and scientists specifically referred to two types of (pecuniary and non-pecuniary)
rewards: a) tenure and promotion policies and b) the university's royalty and equity
distribution formula. The latter refers to the split in licensing or equity income among
the inventor(s), the department or college of the inventor(s), and the TTO or another
general research fund within the university. For example, at one school we visited, the
formula was 40%-inventor, 40%-inventor's department, and 20%-'invention
management fund," which is managed by the TTO.22 An administrator at a university
with a relatively low payout rate to inventors noted that:
"Some faculty members have complained about the low share of revenue theyreceive. They may be right. We hope to bring that up to say 40% in the near future.I don't think we'll have much of a struggle on that one."
22 Jensen and Thursby (1998) surveyed 62 TTOs and found that the mean payout rate to inventors is 40%.

33
pThe vast majority of interviewees also specifically commented on the fact that
tenure and promotion decisions continued to be made almost strictly on the basis of
publications and grants. For example, one scientist remarked:
"Technology transfer has not played a role in the performance evaluation process.Performance evaluation is based on publications."
From this scientist's perspective, the existing reward structure at his university is
inconsistent with the organizational objective of increasing UITT, a goal that is
featured prominently in that university's mission statement and promotional
brochures.
Managers/entrepreneurs (80.0%) and scientists (70.0%) also frequently
pointed to university bureaucracy and inflexibility as barriers to effective U ITT.
Many scientists and managers provided us with examples of rigid, cumbersome,
and unclear policies and procedures that impede U ITT. Faculty members who had
tried to form startup companies were especially vocal on this point. A typical
remark from a scientist was:
"I don't think they understand the flexibility within the framework and what they cando. / think they have a set of forms and a set of ways of doing things, and if itdoesn't fit nicely into that, then they make you go through a whole bunch of hoops."
Staffing practices within the TTO are also a matter of concern. Recall that a
university technology licensing officer is responsible for coordinating the activities
that result in the consummation of an agreement between the university (and its
scientists) and a firm. Fifty-five percent of the managers and entrepreneurs we
interviewed expressed dissatisfaction with the marketing and negotiation skills of

34
TTO personneL An intellectual property manager stated:
"These guys (TTOs) need to be marketing facilitators rather than lawyers. Theyneed to be able to step into the company and into their customer's shoes and lookback."
Other respondents noted that TTOs are either too narrowly focused on a small set
of technical areas, or too concerned with the legal aspects of licensing.
There is also a strong belief on the part of industry (80.0%) that universities
exercise their intellectual property rights too aggressively. Of course, this is not a
surprising observation given the inherently adversarial nature of negotiations. One
former TTO director, now in industry, stated:
"I think the frustration for commercial licensees who go to a university is that it seemsas though the attitude they are hitting at the university is 'oh we've got this wonderfulthing and we're going to drag every nickel out of you that we can get for it'."
Table 9 presents some suggested improvements to the UITT process, as
provided by our respondents. These recommendations are fairly consistent with
the impediments identified in Table 8. With virtual unanimity, respondents
suggested that universities and industry should devote more effort to developing
better mutual understanding. Several respondents noted that this could easily be
achieved through such events as "Town Hall" meetings involving the three
stakeholder groups, as well as by targeting each individual group with additional
information to help facilitate U ITT. For example, one university scientist pointed
out that new faculty orientations at his university did not include a module on
technology transfer issues:

35
"It's appalling that new faculty members don't receive any in formation o how to getinvolved in technology transfer at their orientation sessions. What does that tellabout this school's priorities?"
Another consistent theme was that universities should modify reward
systems to be consistent with technology transfer objectives. Although we do not
have systematic measures of the intensity of feeling regarding a particular theme,
our perusal of the transcripts reveals that the recommendations regarding changes
in reward systems were by far the most direct and vivid of the suggested
improvements to the UITT process. Many university administrators specifically
mentioned the need to reward UITT activities more in promotion and tenure
decisions. One department chair phrased it as follows:
"It's the height of hypocrisy for universities to claim that they value technologytransfer, or that it's supposed to be a top institutional priority, and then fail to reward itin their promotion and tenure decisions. At some point, we've got to resolve thisdiscrepancy."
More importantly, several managers/entrepreneurs and administrators discussed
the need for incentive compensation for university technology managers. A
representative comment from a manager was:
"The TTO people need to push the deals through ... You've got to look at how theyare rewarded. Perhaps if they were paid on the basis of the number of deals theycomplete or the revenue they generate for the university, you would see moretechnologies licensed. / guess that they are so terrified of negative publicity if a baddeal goes through, that they're afraid to make this change."
Our respondents noted that some private universities, and even some public
institutions, such as the University of Washington and Wayne State University,
have recently instituted incentive compensation programs in the TTO. Other
universities are known to be contemplating implementing these programs.'
Table 9 also demonstrates that, to a lesser extent, there was support for the
notion that universities should devote additional resources to UITT, altheugh most
of these recommendations were somewhat nebulous. Many respondents also
suggested that universities provide more education and/or community outreach to
overcome informational and cultural barriers. A predictable recommendation from
managers and entrepreneurs is that universities should be less aggressive in
exercising intellectual property rights.
VII. CONCLUSIONS AND SUGGESTIONS FOR ADDITIONAL RESEARCH
In this paper, we present quantitative and qualitative evidence on several
aspects of U ITT. A stochastic production function framework is used to assess the
relative productivity of university TTOs. Our parameter estimates of this stochastic
frontier imply that licensing activity, our proxy for U ITT, is characterized by constant
returns to scale. The deviations from the frontier, which represent technical
inefficiency, are assumed to be a function of a vector of environmental and
institutional variables. We find that these variables do indeed explain some of the
variation in relative productivity across universities.
We hypothesize that some of the remaining variation in relative efficiency
can be attributed to organizational practices in university management of
intellectual property. Unfortunately, this hypothesis cannot be formally tested
because there are no systematic measures of these factors. Thus, an analysis of
36

UITT organizational practices is fertile ground for an inductive, exploratoryield
study. As a first step towards identifying these practices, we conducted 55 face-
to-face interviews of key UITT stakeholders at five research universitiesq We
believe that our fieldwork also greatly improved our ability to model the UITT
process, by providing a critical reality check on the specification of the econometric
model.
The qualitative results imply that the most critical organizational factors are
reward systems for faculty involvement in U ITT, compensation and staffing
practices in the TTOI and actions taken by administrators to extirpate informational
and cultural barriers between universities and firms. More specifically, it appears
that the propensity of faculty members to disclose inventions, and thus, increase
the "supply" of technologies available for commercialization, will be related to
promotion and tenure policies and the university's royalty and equity distribution
formula. ITO compensation practices could also be relevant because UITT activity
will depend on the efforts of technology licensing officers to elicit invention
disclosures and market them effectively to private companies. Thus, we expect
that, ceteris paribus, licensing activity will be higher at universities that have
implemented some form of incentive compensation program for technology
licensing officers.23
Staffing practices in the TTO may also help explain why some universities
Lazear (1999) and Ichniowski, Shaw, and Prennushi (1997) report a positive correlation between incentive
compensation and worker and plant productivity, respectively.
37

38
are proficient than others in managing intellectual property. According to ltarker
and Zilberman (1993), TTOs usually hire either a mix of scientists and lawyers or a
mix of scientists and entrepreneurs/businessmen. In the former case, legal
functions, such as the adjudication of disputes involving intellectual property rights
and negotiating royalty agreements, are performed in-house. In the latter case,
such functions are usually outsou iced. Parker and Zilberman suggest that the
entrepreneur/business model for TTOs may be more conducive to helping
scientists form their own start-ups. It also seems reasonable to assume that TTO s
staffed in this manner would be more effective in the marketing phase of UITT. A
sizable percentage of the managers we interviewed suggested that universities hire
more licensing professionals with stronger technical and marketing skills.
Our findings regarding informational and cultural barriers suggest that "boundary
spanning" could be an important skill for university technology licensing officers.
Boundary spanning behavior has been studied extensively in the management
literature. 24 In the context of U ITT, boundary span fling refers to actions taken by
university technology managers to serve as a bridge between "customers"
(entrepreneurs/firms) and "suppliers" (scientists), who operate in distinctly different
environments. Without effective boundary spanning, the needs of customers may not
be adequately communicated to suppliers. Similarly, the capabilities and interests of
suppliers may not be adequately communicated to customers. Effective boundary
spanning on the part of the TTO would involve adept communication with both
39
stakeholder groups in an effort to forge alliances between scientists and firThs.
The most natural extension of our exploratory study would be to survey UITT
stakeholders at each university in an attempt to measure the organizational factors we
have identified.25 Some variables, such as the university's royalty and equity
distribution formula are easy to measure with a survey and may even be available on
the worldwide web. Other variables, such as measures of the skills of TTO personnel,
tenure and promotion policies, and other policy variables will be more perceptual in
nature. In designing these surveys, we need to mindful of the considerable
heterogeneity in stakeholder perspectives on UITT that was revealed in our interviews.
This finding underscores the importance of surveying scientists,
managers/entrepreneurs, and administrators separately to generate a moreaccurate
and unbiased view of the organizational environment.
Taking stock of organizational practices in university management of intellectual
property will be useful in several respects. First, given the embryonicnature of the ITO
enterprise, there is a need to document the nature of these practices. Many
administrators expressed a strong interest in benchmarking their intellectual property
management practices relative to peer institutions.
Perhaps the most important benefit of collecting this information is that it can be
used to determine the fraction of the variance in relative productivity that can be
attributed to organizational practices. We can also identify specific practices that
24 See Caidwell and O'Reilly (1982), and Katz and Tushman (1983).25 We can use an existing survey instrument to measure boundary-spanning skills (Caldwelland O'Reilly (1982)).
40
enhance UITT performance. These results could have important managerTal and policy
implications. Finally, we can use this information to examine the determinants and
consequences of the adoption of complementary organizational practices. Recent
theoretical (Milgrom and Roberts (1990, 1995) and Athey and Stern (1997)) and
empirical (lchniowski, Shaw, and Prennushi (1997)) studies highlight the importance of
clusters or "mixes" of complementary organizational practices in enhancing productivity,
due to interaction effects. It would be interesting to see if such synergies arise in the
context of U ITT.
Finally, we also envision several extensions to the econometric analysis.
First, we would like to add some additional environmental and institutionalfactors
as explanatory variables in the inefficiency equation. These include the age of the
TTO, a measure of the strictness of state and university technology transfer
policies (serving as a proxy for the degree of intellectual property protection at the
university), local venture capital activity, and more detailed data on industrial R&D
in the local region. Second, with more recent data on UITT outputs and inputs, we
could examine whether the efficiency frontier is shifting over time. Given the
relatively embryonic nature of the TTO enterprise, it is reasonable to assume that
the absolute (mean) level of technical efficiency has risen in recent years, as
university administrators learn how to manage intellectual property more
effectively. A final extension to our empirical analysis would be include multiple
outputs of UITT, such as the number of startups and sponsored research
agreements resulting from U ITT. This requires a "distance" function approach,
41
which has been implemented in several recent studies in the stochastic frd'ntier
literature.26
26 See Lovell (1994) and Grosskopfet al. (1997). This class of models assumes that the relationshipbetween output
and inputs can be represented by a transformation function 1, where O=T(x,y) and y denotes a vectorof outputs
(O=y-f(x) for the single output case).

42
References
Adams, J. D., and Z. Griliches. 1996. Research Productivity in a System ofUniversities. NBER Working Paper #6120, November, 1996.
Aigner, D.J., Lovell, C. A. K., and P. Schmidt. 1977. Formulation and Estimation ofStochastic Frontier Production Functions. Journal of Econometrics, 6: 2 1-37.
Anselin, L, Varga, A., and Z. Acs. 1997. Local Geographic Spillovers betweenUniversity Research and High Technology Innovations. Journal of UrbanEconomics, 42: 422-448.
Association of University Technology Managers (AUTM). 1997. The AUTMLicensing Survey, Fiscal Year 1996.
Athey, S. and S. Stern. 1998. An Empirical Framework for Testing Theories aboutComplementarity in Organizational Design. NBER Working Paper No. 6600,June 1998.
Audretsch, D. B. and M. P. Feldman. 1996. R&D Spillovers and the Geography ofInnovation and Production. American Economic Review, 86(2): 630-640.
Audretsch, D. B. and P. E. Stephan. 1996. Company-Scientist Locational Links:the Case of Biotechnology. American Economic Review, 86(2): 641-652.
Bania, N., Eberts, R., and M. S. Fogarty. 1993. Universities and the Startup ofNew Companies: Can We Generalize from Route 128 and Silicon Valley?Review of Economics and Statistics, 76(4): 761-766.
Battese, G. E. and T. Coelli. 1995. A Model for Technical Inefficiency Effects in aStochastic Frontier Production Function for Panel Data, EmpiricalEconomics, 20: 325-332.
Bayh, B. 1996. Keynote Address: Sixteen Years of Bayh-Dole, MIT Conferenceon Intellectual Property Rights: Corporate Survival and Strategic Advantage,Dec. 9-10, 1996.
Butterfield, K., Trevino, L., and C. Ball. 1996. Punishment from the Manager's Perspective:A Grounded Investigation and Inductive Model. Academy of Management Journal,39: 1479-1512.
Bryman, A. 1989. Qualitative Research Methods and Organization Studies. London: Unwin
Hyman.

43
p
CaIdwell, 0. F. and C. A. O'Reilly. 1982. Boundary Spanning and Individual Perforrtiance.Journal of Applied Psychology, 67(1): 124-127.
Charnes, A., CooperW. W., Lewin A., and L M. Seiford, eds. 1994. Data EnvelopmentAnalysis: Theory, Method, and Applications, Boston, MA: Kiuwer AcademicPublishers.
Coelli, T. 1994. A Guide to FRONTIER Version 4.1: A Computer Program for FrontierProduction and Cost Function Estimation. mimeo, Department of Econometrics,University of New England, Armidale.
Cohen, W. M., Florida, R., Randazzese L., and J. Walsh. 1998. Industry and the Academy:Uneasy Partners in the Cause of Technological Advance, in Challenges to ResearchUniversities. (R. G. Noll, ed.), Washington, D.C.: Brookings Institution Press.
Eisenhardt, K. M. 1989. Making Fast Strategic Decision in High-Velocity Environments.Academy of Management Journal, 32: 543-576.
General Accounting Office (GAO). 1998. Technology Transfer: Administration of theDole Act by Research Universities. Washington, D.C.: U.S. General AccountingOffice.
Griliches, Z. 1979. Issues in Assessing the Contribution of R&D to Productivity Growth.Bell Journal of Economics, 10: 92-116.
Grosskopf, S., Hayes, K. J., Taylor, L. L., and W. L. Weber. 1997. Budget-ConstrainedFrontier Measures of Fiscal Equality and Efficiency in Schooling. Review ofEconomics and Statistics, 79(1): 116-124.
Henderson, R., Jaffe, A. B., and M. Trajtenberg. 1998. Universities as a Source ofCommercial Technology: a Detailed Analysis of University Patenting 1965-1988.Review of Economics and Statistics, 80(1): 119-127.
lchniowski, C., Shaw, K., and G. Prennushi. 1997. The Effects of Human ResourceManagement Practices on Productivity: A Study of Steel Finishing Lines. AmericanEconomic Review, 87(3): 291-31 3.
Jaffe, A. B. 1989. Real Effects of Academic Research. American Economic Review, 79(3):957-970.

44
Jaffe, A. B., Trajtenberg, M., and R. Henderson. 1993. Geographic Localiz'ation ofKnowledge Spillovers as Evidenced by Patent Citations. Quarterly Journal ofEconomics, 108(3): 577-598.
Jensen, R., and M. Thursby. 1998. Proofs and prototypes for sale: Thelale of universitylicensing. NBER Working Paper No. 6698, August 1998.
Katz, R., and M. Tushman. 1983. A Longitudinal Study of the Effects of Boundary SpanningSupervision on Turnover and Promotion in Research and Development. Academy ofManagement Journal, 26: 437-456.
Lazear, E. P. 1999. Personnel Economics: Past Lessons and Future Directions. NBERWorking Paper No. 6957, February 1999.
Liebeskind, J. P., Oliver, A. L., Zucker, L. and M. B. Brewer. 1996. Social Networks,Learning, and Flexibility: Sourcing Scientific Knowledge in New Biotechnology Firms.Organization Science, 7: 428-443.
Link, A. and J. Scott. 1998. Evaluating Technology-Based Public Institutions: Lessons fromthe National Institute of Standards and Technology, in Policy Evaluation in Innovationand Technology. (G. Papaconstantinou, ed.), Paris: OECD.
Lovell, C. A. K. 1994. Resources and Functionings: A New View of Inequality in Australia, inModels and Measurement of Welfare and Inequality. (W. Eichorn, ed.), Berlin:Springer-Verlag Press.
Mansfield, E. 1995. Academic Research Underlying Industrial Innovations: Sources,Characteristics, and Financing. Review of Economics and Statistics, 77(1): 55-65.
Miles, M. B., and A. M. Huberman. 1994. Qualitative Data Analysis (2nd ed.). ThousandOaks, CA: Sage Publications.
Milgrom, P. and J. Roberts. 1990. The Economics of Modern Manufacturing. AmericanEconomic Review, 80(3): 511-28.
Milgrom, P. and J. Roberts. 1995. Complementarities and Fit: Strategy, Structure, andOrganizational Change in Manufacturing. Journal of Accounting and Economics,19(2-3): 179-208.
Meeusen, W. and J. Van den Broeck. 1977. Efficiency Estimation from Cobb-DouglasProduction Functions with Composed Errors, International Economic Review, 18:435-444.

45
National Science Foundation. Research and Development in Industry, 19l,1992, 1993,1994. Washington D.C.: Government Printing Office.
Nelson, R. R. 1998. Technology Transfer, in Theory and Practice. Mimeo, ColumbiaUniversity.
-
Parker, D. D. and D. Zilberman. 1993. University Technology Transfers: Impacts on Localand U.S. Economies. Contemporary Policy Issues, 11(2): 87-99.
Powell, W. 1990. Neither Market nor Hierarchy: Network Forms of Organization. Researchin Organizational Behavior, 12: 295-336.
Pressman, L., Guterman, S., Abrams, I., Geist D., and L. Nelsen. 1995. Pre-ProductionInvestment and Jobs Induced by MIT Exclusive Patent Licenses: A Preliminary Modelto Measure the Economic Impact of University Licensing. Journal of the Associationof University Technology Managers, 7: 77-90.
Reifshcneider, D and R. Stevenson. 1991. Systematic Departures from the Frontier: AFramework for the Analysis of Firm Inefficiency, International Economic Review,32(3): 715-723.
Sekaran, U. 1992. Research Methods for Managers: A Skill-Building Approach (2'ed.),New York, N.Y.: John Wiley and Sons.
Siegel, 0. 1999. Skill-Biased Technological Change: Evidence From A Firm-LevelSurvey, Kalamazoo, Ml: W. E. Upjohn Institute for Employment Research,forthcoming.
Siegel, D., Waldman, D., Atwater, L., Link, A. and J. Silberman. 1999. Toward a Theory ofthe Effective Transfer of Scientific Knowledge from Academicians to Practitioners:Qualitative Evidence from the Commercialization of University Technologies, mimeo,Arizona State University West, March 1 999.
Thursby, J. and S. Kemp. 1998. An Analysis of Productive Efficiency of UniversityCommercialization Activities. Mimeo, Purdue University, May 1998.
Trajtenberg, M., Henderson, R., and A. Jaffe. 1997. University Versus Corporate Patents: AWindow on the Basicness of Invention. Economics of Innovation and NewTechnology, 5(1): 19-50.
U.S. Department of Commerce, Bureau of Economic Analysis. 1999. Fixed ReproducibleTangible Wealth, Computer-Readable Data Set, Washington, D.C.: GovernmentPrinting Office.

46
p
Waldman, D. A., Lituchy, 1., Gopalakrishnan, M., Laframboise, K., Galperin, B., andZ.Kaltsounakis. 1998. A Qualitative Analysis of Leadership and QualityImprovement. Leadership Quarterly, 9: 177-201.
Yin, R. K. 1989. Case Study Research: Design and Methods (2nd ed.). Newbury Park, CA:Sage Publications.
Zucker, L. G., Darby, M. R, and M. B. Brewer. 1998. Intellectual Human Capftal and theBirth of U.S. Biotechnology Enterprises. American Economic Review, 88(1): 290-306.
Zucker, L. G., and M. R. Darby. 1996. Star Scientists and Institutional Transformation:Patterns of Invention and Innovation in the Formation of the Biotechnology Industry.Proceedings of the National Academy of Sciences, 93: 709-716.

</ref_section>

FIG
UR
E 1
An
Exa
mpl
e of
a T
rans
fer o
f Tec
hnol
ogy
from
a U
nive
rsity
to a
Fir
m o
r Ent
repr
eneu
r
Eva
luat
ion
of
Mar
ketin
g of
N
egot
iatio
n L
icen
se
Scie
ntif
ic
to F
irm
ove
Inve
ntio
n In
vent
ion
for
I P
aten
t I
Tec
hnol
ogy
to
I of
Pa
tent
ing
Firm
s
nse
(an
exis
ting
firm
D
iscl
osur
e I
or st
artu
p)
I I
1•1
Uni
vers
ity
Uni
vers
ity
Uni
vers
ity
Uni
vers
ity
Uni
vers
ity
Uni
vers
ity
Uni
vers
ity
Sci
entis
t S
cien
tist
Sci
entis
t S
cien
tist
Sci
entis
t, S
cien
tist,
Sci
entis
t, an
d T
TO
an
d IT
O
and
ITO
IT
O, a
nd
TT
O, a
nd
TT
O, a
nd
Firm
! Fi
rm!
Firm
l
Ent
repr
eneu
r E
ntre
pren
eur
Ent
repr
eneu
r

Tab
le 1
Cha
ract
eris
tics
of U
nive
rsity
/Ind
ustr
y T
echn
olog
y T
rans
fer
(UIT
T)
Stak
ehol
ders
Prim
ary
Seco
ndar
y O
rgan
izat
iona
l St
akeh
olde
r A
ctio
ns
Mot
ive(
s)
Mot
ive(
s)
Cul
ture
Fina
ncia
l G
ain
and
a D
esir
e to
Sec
ure
Uni
vers
ity
Dis
cove
ry o
f R
ecog
nitio
n w
ithin
the
Add
ition
al R
esea
rch
Scie
ntis
t N
ew K
now
ledg
e Sc
ient
ific
Com
mun
ity
Res
earc
h Fu
ndin
g Sc
ient
ific
Wor
ks w
ith
Faci
litat
e T
echn
olog
ical
Tec
hnol
ogy
Facu
lty a
nd F
irm
s!
Prot
ect a
nd M
arke
t D
iffu
sion
an
d
Tra
nsfe
r E
ntre
pren
eurs
to
the
Uni
vers
ity's
Se
cure
Add
ition
al
Off
ice
Stru
ctur
e D
eal
Inte
llect
ual
Prop
erty
R
esea
rch
Fund
ing
Bur
eauc
ratic
Mai
ntai
n Con
trol
Firm
! C
omm
erci
aliz
es
of Pr
opri
etar
y E
ntre
pren
eur
New
Tec
hnol
ogy
Fina
ncia
l G
ain
Tec
hnol
ogie
s E
ntre
pren
euri
al
Sour
ce: t
he A
utho
rs

Table 2
Descriptive Statistics for Inputs and Outputs of the Stochastic Frontier Production Function (Equation (4))pt
Variable Name Description Mean Median Standard Deviation
LICENSE1Average AnnualLicensing Agreements 12.2 6 19.8
LICENSE2
Average AnnualLicensing Revenue($000) 1610.4 294.5 4890.5
INVDISCAverage AnnualInvention Disclosures 45.9 24 68.6
STAFFAverage Annual TTOEmployees 7.7 4 15.4
LEGAL
Average AnnualExternal LegalExpendituresOnUITT(000) 303.7 116.4 631.2
N1 13 universities, 199 1-1994.
Source: AUTM (1997)
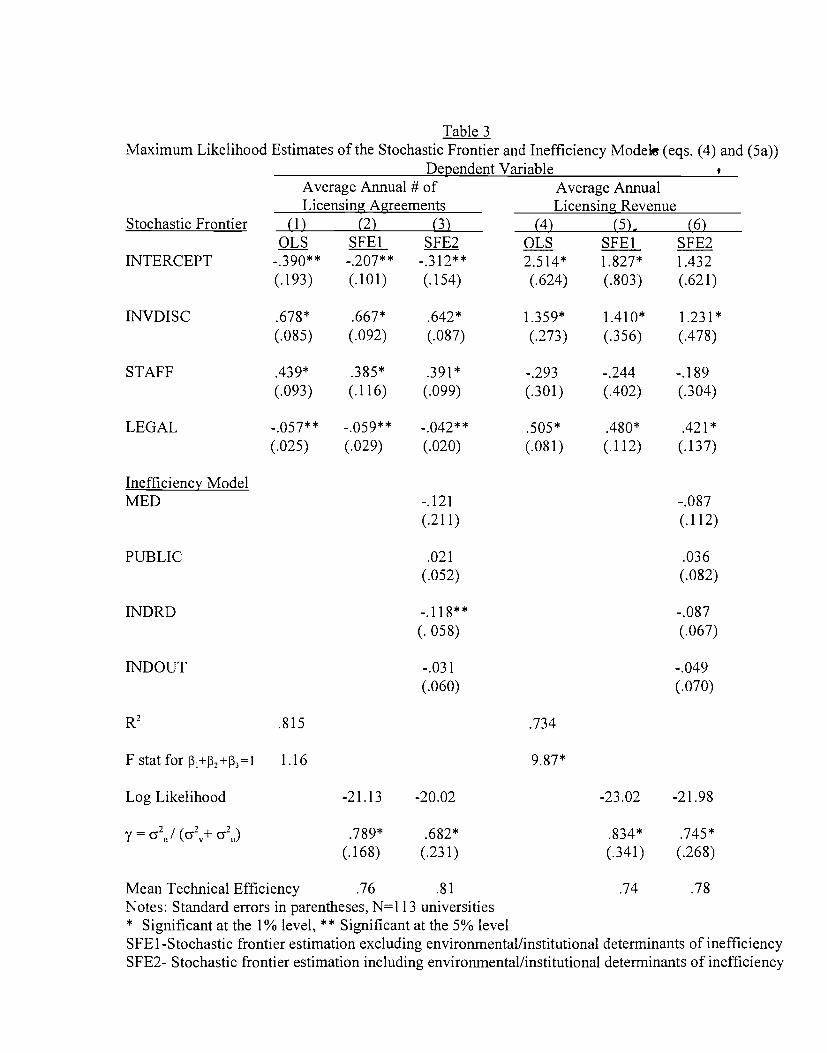
Table 3Maximum Likelihood Estimates of the Stochastic Frontier and Inefficiency Models (eqs. (4) and (5a))
Dependent VariableAverage Annual # of Average AnnualLicensing Agreements Licensing Revenue
Stochastic Frontier (1) (2) (3) (4) (5).. (6)OLS SFE1 SFE2 OLS SFE1 SFE2
INTERCEPT .390** .207** .312** 2.514* 1.827* 1.432
(.193) (.101) (.154) (.624) (.803) (.621)
INVDISC .678* .667* .642* 1.359* 1.410* 1.231*
(.085) (.092) (.087) (.273) (.356) (.478)
STAFF •439* .385* .391* -.293 -.244 -.189
(.093) (.116) (.099) (.301) (.402) (.304)
LEGAL .057** .059** .042** .505* .480* .421*
(.025) (.029) (.020) (.081) (.112) (.137)
Inefficiency ModelMED -.121 -.087
(.211) (.112)
PUBLIC .021 .036(.052) (.082)
INDRD .118** -.087
(.058) (.067)
IINDOUT -.031 -.049(.060) (.070)
R2 .815 .734
Fstatforl3+p2+f33=1 1.16 9.87*
Log Likelihood -21.13 -20.02 -23.02 -21.98
.789* .682* .834* •745*
(.168) (.231) (.341) (.268)
Mean Technical Efficiency .76 .81 .74 .78Notes: Standard errors in parentheses, N=1 13 universities* Significant at the 1% level, ** Significant at the 5% levelSFE 1-Stochastic frontier estimation excluding environmental/institutional determinants of inefficiencySFE2- Stochastic frontier estimation including environmental/institutional determinants of inefficiency

Table 4p
Four Key Methodological Issues in a Field Study and How We Addressed Them
Nature of Procedures for Qualitative
Sample Selection Interview Questions Conducting Interviews Data Analysis
• Semi-StructuredOf (some questions
were the samefor each group;some weretailored to aparticular group)
• Face-to-FaceInterviews Recording
AndTranscriptionof Interviewsby Neutral
Third Party
Identification• Open-endedto Questions
• TeamApproach
•
•of Themes
fromTranscriptsby MultipleAssessors
of• NeutralProbing
•Themes
• Pledge ofConfidentiality
• FrequencyTablesDisplayingImportantThemes
Z-tests• IntervieweesHad PriorKnowledge ofthe Goals ofthe Study andBackgroundsof theResearchers
ComparingProportion ofResponsesBetweenStakeholderGroups

Table 5p
Characteristics of the Universities in our Field Study
University University University University UniversityA B C D E
Organizational Status Private Public Public Public Public
Medical School Yes Yes No No Yes
Land Grant Institution No No Yes No Yes
TTO Established in 1984 1985 1982 1985 1988
STAFF 13.3 10.8 10.0 2.7 8.1
LICENSE1 27.0 15.8 25.8 2.8 12.8
LICENSE2 985.7 567.0 1274.6 344.3 150.8
Tecimical Efficiency 87.7 81.1 92.9 70.2 79.2

Table 6Outputs of University/Industry Technology Transfer (UITT) as Identified by Interviees in Our Field Study
Type of Interviewee
(1) (2) (3)Managers! TTO Directors! University
Outputs Entrepreneurs Administrators Scientists Z12 Z13 Z23
Licenses 75.0 86.7 25.0 -1.37 2.14** 3.24*
Royalties 30.0 66.7 15.0 -1.74 0.91 2.61*
Patents 10.0 46.7 20.0 2.91* -0.84 2.23**
Sponsored ResearchAgreements 5.0 46.7 0.0 2.72* 0.44 333*
Startup Companies 5.0 33.3 10.0 2.07** -0.56 1.64
Invention Disclosures 0.5 33.3 5.0 2.8l* -0.99 2.28*
Students 25.0 26.7 15.0 -0.22 0.88 1.22
Informal TransferOf Know-how 70.0 20.0 20.0 2.69* 3.31* 0.03
ProductDevelopment 40.0 6.7 35.0 2.08** 0.12 2.01**
Economic Development 35.0 20.0 0.0 0.52 2.98* 2.03**
Number of Interviews 20 15 20
Note: The values presented in columns (1) —(3) are the percentages of respondents who identified a particular itemas an output of UITT. The values displayed in the last three columns are test statistics for differences in meanpercentages between each class of interviewee.
** p < .05* p < .01

Table 7Aspects of Relationships/1.etworks in
University/Indust, Technology Transfer (UffT) as Identified byInterviewees in Our Field Study
iye of Interviewee
(1) (2) (3)Relationships! Managers! TTO Directors! UniversityNevork Entrepreneurs Administrators Scientists Z12 Z13 Z23
Personal Relationships 75.0 66.7 80.0 0.68 -0.42 -1,63TTO as a FacilitatorOf Relationships BetweenScientists And Firms 26.3 75.0 40.0 2.65* -0.91 1.92
Knowledge TransferFrom Industry toFaculty Members 25.0 20.0 65.0 0.35 2.46* 297*ConferencetExpos!Town Hall MeetingsOn TT issues 35.0 80.0 15.0 2.34** 1.59 3.56*
Contractual Relationships is.o 6.7 0.0 0.84 1.80 1.02
Number of Interviews 20 15 20
Note: The values presented in columns (1) —(3) are the prcntages of respondents who identified a particular itemas an aspect of relationships/networks in UITT.The values displayed in the last threecolumns are test statisticsfor differences in mean percentages between each class of interviewee.
** p < .05*
p <.01

Table 8Barriers to University/Industry Technology Transfer (UITI') as Identified by Interviees in Our Field Study
Type of Interviewee(1) (2) (3)
Managers! TTO Directors! UniversityBarriers Entrepreneurs Administrators Scientists Z12 Z13 Z23
Lack of UnderstandingRegarding University,Corporate, or ScientificNorms and Environments 90.0 93.3 75.0 -0.25 1.19 1.30
Insufficient Rewards ForUniversity Researchers 31.6 60.0 70.0 -1.29 2.46* -1.03
Bureaucracy and Inflexibility ofUniversityAdministrators 80.0 6.6 70.0 3.96* 0.74 3.51*
Insufficient ResourcesDevoted to TechnologyTransferByUniversities 31.6 53.3 20.0 -0.95 0.93 2.05**
Poor Marketing/Technical/Negotiation Skills of TTOs 55.0 13.3 25.0 2.07** 1.91 -0.71
University Too AggressiveIn Exercising IntellectualProperty Rights 80.0 13.3 25.0 3.30* 2.94* -0.91
Faculty Members!Administrators HaveUnrealistic ExpectationsRegarding the Value ofTheirTechnologies 25.0 40.0 10.0 -0.94 1.13 1.90
"Public Domain"Mentality of Universities 40.0 8.3 5.0 1.86 2.60* 0.38
Number of Interviews 20 15 20Note: The values presented in columns (I) (3) are the percentages of respondents who identified a particular itemas a barrier to UITT. The values displayed in the last three columns are test statistics for differences in meanpercentages between each class of interviewee.** p < .05
* p < .01

Table 9Suggested Improvements to the University/Industry Technology Transfer (UITT) Prcess, as Identified by
Interviewees in Our Field StudyType of Interviewee
(1) (2) (3)Managers! TTO Directors! University
Improvements Entrepreneurs Administrators Scientists Z12 Z13 Z23
Universities and IndustryShould Devote More Effort toDeveloping BetterMutual Understanding 80.0 93.3 75.0 -0.96 0.33 1.28
Modify Reward SystemsTo Reward TechnologyTransfer Activities 85.0 80.0 80.0 0.35 0.36 -0.00
Universities Need to ProvideMore Education to OvercomeInformational And CulturalBarriers 85.0 86.7 60.0 -0.09 1.70 1.74
Universities Should DevoteAdditional Resources toTechnologyTransfer 45.0 46.7 60.0 0.11 -1.00 -1.25
Universities Should be lessAggressive in ExercisingIntellectual Property Rights 55.0 10.0 15.0 2.52* 2.62* -0.36
Increase Formal and InformalNetworking Between Scientistsand Practitioners 35.0 26.7 40.0 0.65 -0.34 -1.09
Universities Need GreaterTechnical Expertise andMarketingSkillsintheTTO 50.0 20.0 25.0 1.76 1.54 -0.37
Number of Interviews 20 15 20
Note: The values presented in columns (1) —(3) are the percentages of respondentswho identified a particular item
as a suggested improvement to UITT. The values displayed in thelast three columns are test statistics for
differences in mean percentages between each class of interviewee.** p < .05
* p < .01