navigating the world of performance - tools and …nemug.com/dawn may presentation.pdfjob watcher...
TRANSCRIPT


Performance Disclaimer
“it depends …” Performance information and recommendations in this
presentation are based on measurements, analysis, and projections in a controlled environment for specific performance workloads. Your results may vary significantly and are dependent on
the application and configuration. This information is provided along with general
recommendations for you to better understand system performance. Information is provided *AS IS* without warranty of any
kind.
© Copyright IBM Corporation 2015 2

Revised January 9, 2003
Set Performance Objectives and Create a Baseline
Collect Performance Data
Real-time Monitoring
Reports
Analyze Performance Data
Tuning
Historical Trending
Capacity Planning
Performance Management Life-cycle
© Copyright IBM Corporation 2015 3

Factors that Affect Performance
User expectations
Hardware capabilities and configuration
Software
Workload
Network
© Copyright IBM Corporation 2014 4

Keep Current on PTFs
• It’s always good practice to keep current on the latest fixes from IBM
• PTFs address defects• PTFs introduce new capabilities
– IBM i Technology Refresh Updates
– IBM i Group PTFs HTTP Server Java Performance tools Database …
– PTFs for performance data collectors – job watcher, disk watcher, PEX
5© Copyright IBM Corporation 2014

© Copyright IBM Corporation 2014 6
IBM i Performance Tools
Job Watcher
Disk Watcher
Performance Explorer
Collection Services
Navigator for i

This image cannot currently be displayed.
Where Do I Start When Managing Performance?
© Copyright IBM Corporation 2014 7
1. IBM i Systems Management User Interfaces
2. Performance Data Collectors Collection Services Job Watcher Disk Watcher Performance Explorer
3. Automated Monitoring – Your First Line of Defense Navigator for i System Monitors System i Navigator System Monitors IBM System Director Monitors
4. Monitor Historical Performance Trends PM for Power Systems System i Navigator Graph History

© Copyright IBM Corporation 2014 8
5. Modeling / Sizing Batch model IBM Systems Workload Estimator
6. Basic Performance Analysis Performance Data Investigator
7. Advanced Performance Analysis Job Watcher Disk Watcher Performance Explorer iDoctor Suite

IBM i Systems Management Interfaces
© Copyright IBM Corporation 2014 9

Green Screen
I’m not going to spend much time on the old-fashioned stuff….
© Copyright IBM Corporation 2014 10

© Copyright IBM Corporation 2014 11
Also known as ....– iSeries Navigator– Operations Navigator
Windows client application Part of the iAccess for Windows product
7.1 is the last release No enhancements
Collection Services Management Central Monitors Real-time monitoring
Graph history Observe performance metrics over time
Database tools
System i NavigatorI’m also not going to spend very much time on the middle-aged stuff….

7.1 is the final release of System i Navigator. It is not refreshed for 7.2.
© Copyright IBM Corporation 2014 12

© Copyright IBM Corporation 2014 13
IBM Navigator for i
Web application Included with IBM i 6.1 and later
Monitors
Performance tasks: Performance Data Investigator
Health indicators Collection Services Database Job Watcher Disk Watcher Performance Explorer
Collection Manager Reports Sizing
I will spend most of the time on the current stuff….
http://systemname:2001

Navigator Performance Tasks
© Copyright IBM Corporation 2014 14
All Performance Tasks• Investigate Data• Active Jobs• Disk Status• System Status• Collections• Reports• Define, start, stop and
manage performance data collectors• Collection Services
• Disk Watcher
• Job Watcher

Navigator Performance Tasks
© Copyright IBM Corporation 2014 15
Major enhancements in 7.2 Database content package enhancements Monitors Sizing
Batch Model
Major enhancements in 7.1 Database content package Many new perspectives Reports
In December 2014, much function previously on 7.2 was taken back to 7.1 (and to 6.1)http://www.ibmsystemsmag.com/Blogs/i-Can/December-2014/Navigator-for-i-Enhancements-Are-Available/

Performance Data Collectors
© Copyright IBM Corporation 2014 16

Performance Instrumentation and Data Collection
The Advantage
• IBM develops the software stack, top to bottom– Instruments the software with performance metrics– Performance metrics are component-specific
• IBM develops the performance data collectors that harvest those performance metrics
• IBM i has an integrated database – DB2– This is a BIG DEAL– Performance data is stored in the database automatically
No “add on” application is necessary – it’s all in the Operating System
– Applications mine the performance data in the DB2 files using SQL
© Copyright IBM Corporation 2014 17
IBM i has the best performance instrumentation and data collection capabilities in the industry!

Performance Instrumentation and Data Collection
Operating System Components identify and save metric data
Performance Collectors harvest metric data
Metric data is stored in DB2 files
Instrumentation
Analysis applications mine this data
Collectors
Integrated DB2
Analysis
© Copyright IBM Corporation 2014 18

© Copyright IBM Corporation 2014 19
Navigator for i and Performance Data Collectors
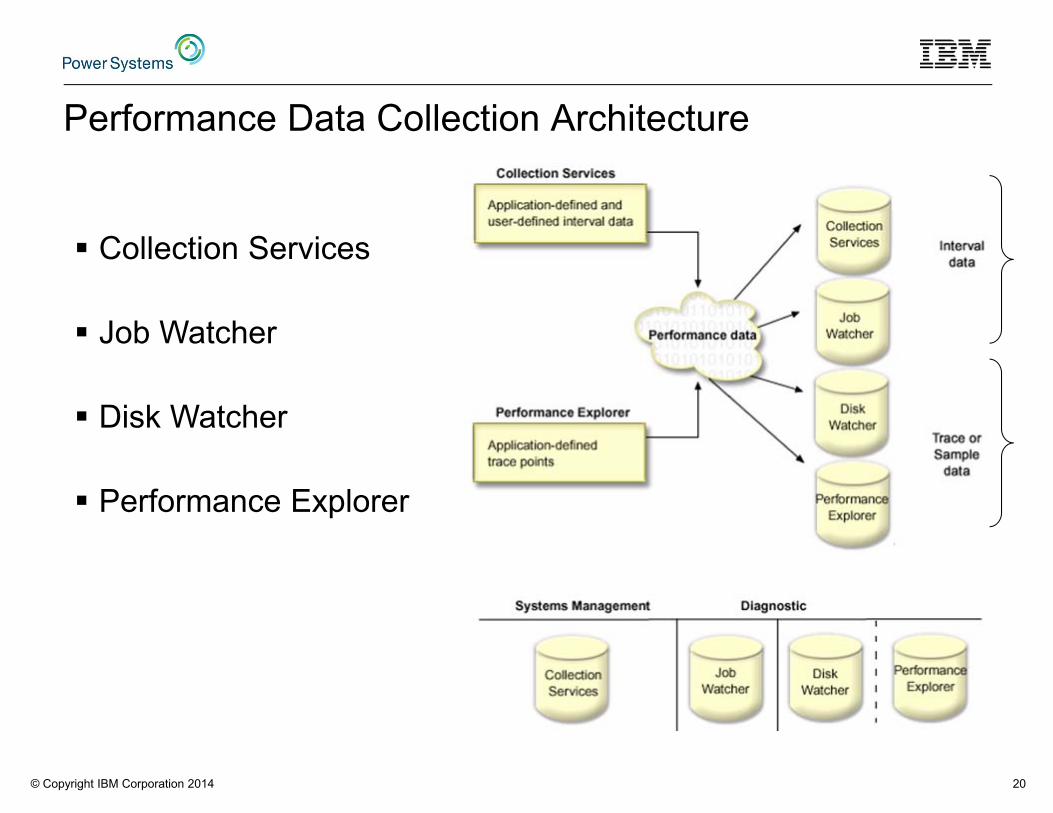
Performance Data Collection Architecture
© Copyright IBM Corporation 2014 20
Collection Services
Job Watcher
Disk Watcher
Performance Explorer

Collect System-wide Performance Data
Collect Performance Data 24/7
If something goes wrong, you have data that will help analyze the problem, fix it, and prevent it from happening in the future
If you can’t solve the problem, you have information that makes it easier for IBM Support to solve the problem faster
To provide a reliable baseline so you can understand the impact that a software, network, or environmental change had on the performance of your system
To provide historical information that enables you to plan for future growth based on real trends, not guesses.
© Copyright IBM Corporation 2014 21

Create a Baseline
A baseline is the expected performance characteristics over a defined period of time– The baseline provides the data to compare with to identify changes that
occur
– You may need multiple baselines due to varying business periods• Day-to-day operations• Month-end• Year-end
The baseline is the reference point for– Capacity planning and trending– Identifying impacts of changes in workloads, applications, operating
system, hardware
© Copyright IBM Corporation 2014 22

Create a Baseline
Use Collection Services data for the baseline
The baseline can be simple or complex, depending upon the need
– Identify the metrics that are key to optimal performance
• Average response time
• Batch window
• Average CPU utilization
• Disk used percentage
• Number of interactive transactions
© Copyright IBM Corporation 2014 23

Key Performance Indicators
Performance Indicators gauge how well a system is performing over time
Key Performance Indicators (KPIs) A selection of metrics that make sense to your business Easily measured Track over time to determine if they are static, increasing or decreasing Track against predefined thresholds
Two recommended categories: Hardware resource utilization Throughput
© Copyright IBM Corporation 2014 24

Hardware Resource Utilization & Throughput
Hardware Resource Utilization Total CPU Utilization CPU usage by job priority (batch & interactive) Memory faults per second by memory pool (database & non-database) Disk (arm utilization, response time, wait time, space utilization)
Throughput A business transaction varies per business
IBM i defined metrics for components that typically make up a business transaction: OLTP transactions (5250 and/or HTTP) per hour (peak & average) Average response time per transaction CPU usage per transaction Disk I/O per transaction Elapsed time of batch jobs
© Copyright IBM Corporation 2014 25

Patterns in Performance Data
Performance data typically has patterns
– Daily, weekly, monthly, yearly
– Understand your typical patterns
– Recognize change
© Copyright IBM Corporation 2014 26

What is Collection Services?
© Copyright IBM Corporation 2014 27
IBM i function that collects system and job level performance dataIBM recommends you always run Collection Services● Collects data from many system resources including:
• Jobs• Disk Units• Buses• Pools• Communication lines
● Collects data at regular intervals from 15 seconds to 1 hour
● Produces database files used by • Performance Data Investigator• Performance Tools for i• PM for Power Systems
● Provides the data for • System Monitors• IBM Systems Director - IBM i Monitors

Performance Data Management
© Copyright IBM Corporation 2014 28
Collection Services will automatically expire data – but you should keep important collections for comparison
• Keep seven to ten days of data• Keeping the management collection objects is more important than the DB2 files
• Keep data from key time periods & events– end-of-month or end-of-year processing– baseline prior to installing a new release or upgrading applications
To keep management collection objects Copy management collection objects to a separate library to prevent them from being
automatically expired
Use the Change Management Collection (CHGMGTCOL) command to set the expiration date or to make them permanent
Change the management collection properties via Navigator for i

Performance Data Management
Review your Collection Services collection interval• Default is 15 minutes• Smaller intervals == more data
Review your Collection Services cycle interval• Default is once daily at midnight
• Select a frequency to best manage your collections• One (possibly large) daily collection• Multiple (smaller) collections within a day
• Select a time that will have minimal impact on critical business functions• Be aware of save windows versus cycle times
• You cannot cycle the collection at the same time the collection library is being saved
© Copyright IBM Corporation 2014 29

Performance Data Management• Store data centrally if you have multiple physical or logical partitions
• Easier to analyze and backup • Resource-intensive analysis won’t impact production partitions
• Copy Performance Collection (CPYPFRCOL)• Save Performance Collection (SAVPFRCOL)• Restore Performance Collection (RSTPFRCOL)
• and GUI (at right)
Keep some data online• Respond quickly to reports of poor or degrading performance• Can be on partition it was created on or centralized partition
Back up key performance data as you would business data
© Copyright IBM Corporation 2014 30

Each category can be turned on/off and interval times can be set individually
Collection Services Data Categories
© Copyright IBM Corporation 2014 31
● System Bus● Memory Pool and Pool Tuning● Hardware Configuration● Subsystem● System CPU● System level data● Jobs – MI tasks and threads● Jobs – Operating System● Disk Storage● IOP● Local Response Time● Communication (Base, Station,
SAP)● APPN● ARM● SNA
● SNADS Transaction● TCP/IP Base● TCP/IP Interface● Integrated xSeries Server (IxS)● Extended Adaptive Cache● User-defined Transactions ● Domino ● HTTP Server (Powered by Apache) ● Data Port Services ● LPAR● WAS● JVM *New in 6.1● Removable Storage *New in 7.1● External Storage *New in 7.1● System Internal Data *New in 7.1● SQL * New in 7.2

IBM Navigator for i - Collection Services Configuration
© Copyright IBM Corporation 2014 32

Collection Services Properties
© Copyright IBM Corporation 2014 33
Check this box if you plan to use:• Performance Data Investigator• Performance Tools• Navigator System Monitors• IBM Systems Director MonitorsThey all require data in the database files
Create performance summary data also creates the system monitor summary files

Commands for Performance Data Collections
© Copyright IBM Corporation 2014 34
Commands exist, but the graphical interface is recommended
CFGPFRCOL - Configure Performance Collection CHKPFRCOL - Check Performance Collection CPYPFRCOL – Copy Performance Collection CVTPFRCOL – Convert Performance Collection DLTPFRCOL – Delete Performance Collection ENDPFRCOL - End Performance Collection RSTPFRCOL – Restore Performance Collection SAVPFRCOL – Save Performance Collection STRPFRCOL - Start Performance Collection

Job Watcher Job Watcher returns real-time information about a selected set of jobs,
threads, or LIC tasks
Job Watcher collects additional types of data that Collection Services does not, as well as more frequent intervals
– Job Watcher has more overhead than Collection Services
Data collected by Job Watcher includes – Wait times
– CPU
– I/O activity
– Call Stacks
– SQL statements
– Communications statistics
– Activation Group statistics© Copyright IBM Corporation 2014 35
Run Job Watcher when you need detailed performance data for diagnostic purposes.
There are clients that run Job Watcher 24x7to always have diagnostic data available.
Need to manage the data carefully.

Job Watcher
Job Watcher collects more detailed performance data than Collection Services and at more frequent intervals
– CPU and I/O (like Collection Services)
– Call Stacks
– SQL Statements
– Detailed Wait information: Objects being waited on, even record number of files
Holder of object
Job Watcher does not collect everything that Collection Services collects.
– It does not always collect information about every thread
Thread must use CPU during interval
Thread must exist for entire interval
Data is written to DB2 files© Copyright IBM Corporation 2014 36
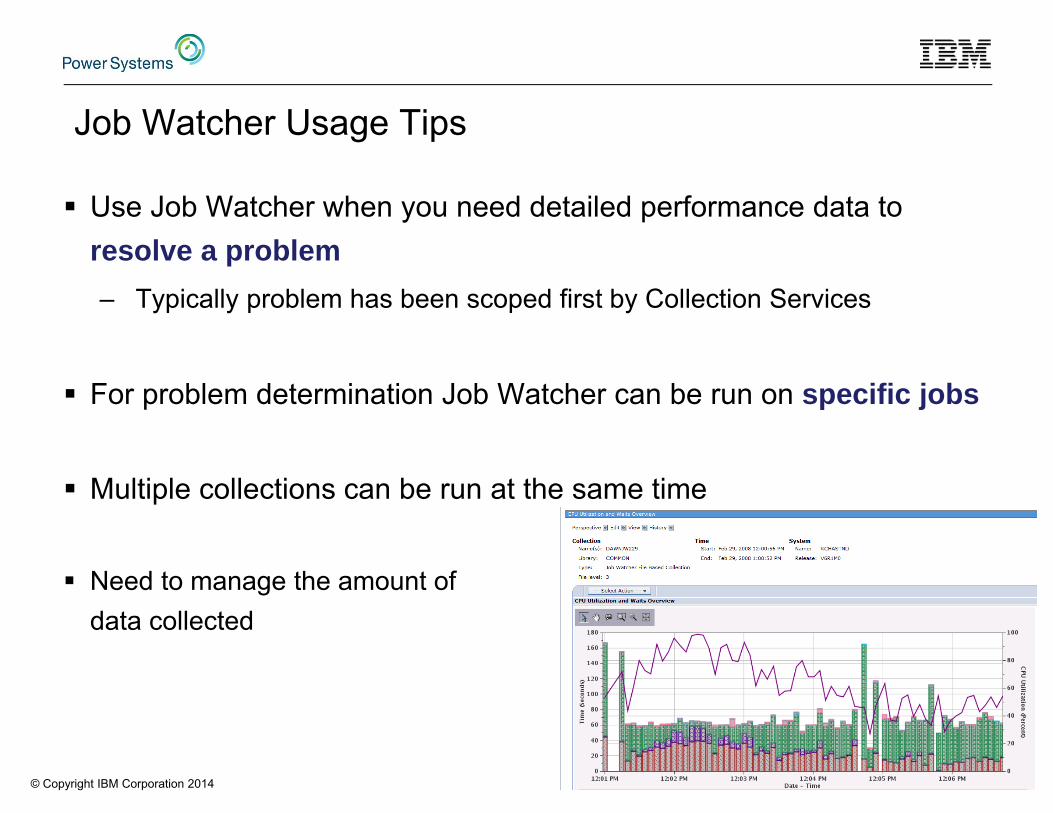
Job Watcher Usage Tips
Use Job Watcher when you need detailed performance data to resolve a problem– Typically problem has been scoped first by Collection Services
For problem determination Job Watcher can be run on specific jobs
Multiple collections can be run at the same time
Need to manage the amount of data collected
© Copyright IBM Corporation 2014 37

Disk Watcher
• Disk Watcher is a performance data collector for detailed disk performance
– Near real-time diagnosis of disk performance issues
– Statistical and Trace data
– Data is written to DB2 files
© Copyright IBM Corporation 2014 38
Run Disk Watcher when you need detailed performance data for disk I/O analysis.

Disk Watcher Disk Watcher collects detailed disk performance data
– Can collect data on all disks, or a subset– Sampling mode to get higher level information Similar to Collection Services but more granular (shorter intervals) Response times, IO types, IO rates, etc. by disk unit
– Trace mode can be used to collect metrics for every I/O operation (or subset based on response time filter) Object being accessed Job or thread doing the IO Program being run Disk unit handling the request
Disk Watcher can help you answer questions such as: – Are long I/O operations associated with a certain hardware resource? – Who or what is experiencing a high level of page faulting? – Who or what is causing a large number of I/O operations?
© Copyright IBM Corporation 2014 39

Disk Watcher Usage Tips Use Disk Watcher when you suspect a disk performance problem and can’t
resolve it after reviewing Collection Services data
Balance the need for data and the amount of resources you are willing to consume.
– On very large systems limiting the collection to subset of ASPs or disk units will produce a more manageable amount of data and consume fewer resources (CPU, memory, etc.)
– However, limiting collection may reduce ability to identify problem areas
Avoid using very short interval time unless disk units are very busy– Consider 60 seconds as a good starting point
Typically want to use trace mode with *RESIDENT object information (OBJINF on ADDDWDFN) but certain problems may need *ALL.
Special considerations: You cannot run Disk Watcher when another Storage Management function such as
ASP Balance or Disk Reorganization is active
Storage Management trace buffers use storage in the machine pool© Copyright IBM Corporation 2014 40

Performance Explorer
Performance Explorer helps identify the causes of performance problems that cannot be resolved using one of the other performance data collectors
– Collects more detailed information about a specific application, program, or resource
Performance Explorer is typically used for two main reasons:
– Detailed performance trace data is needed to identify the performance problem
– Analyzing the performance of applications
Performance Data Investigator supports profile collections only iDoctor is required for PEX Analysis
© Copyright IBM Corporation 2014 41
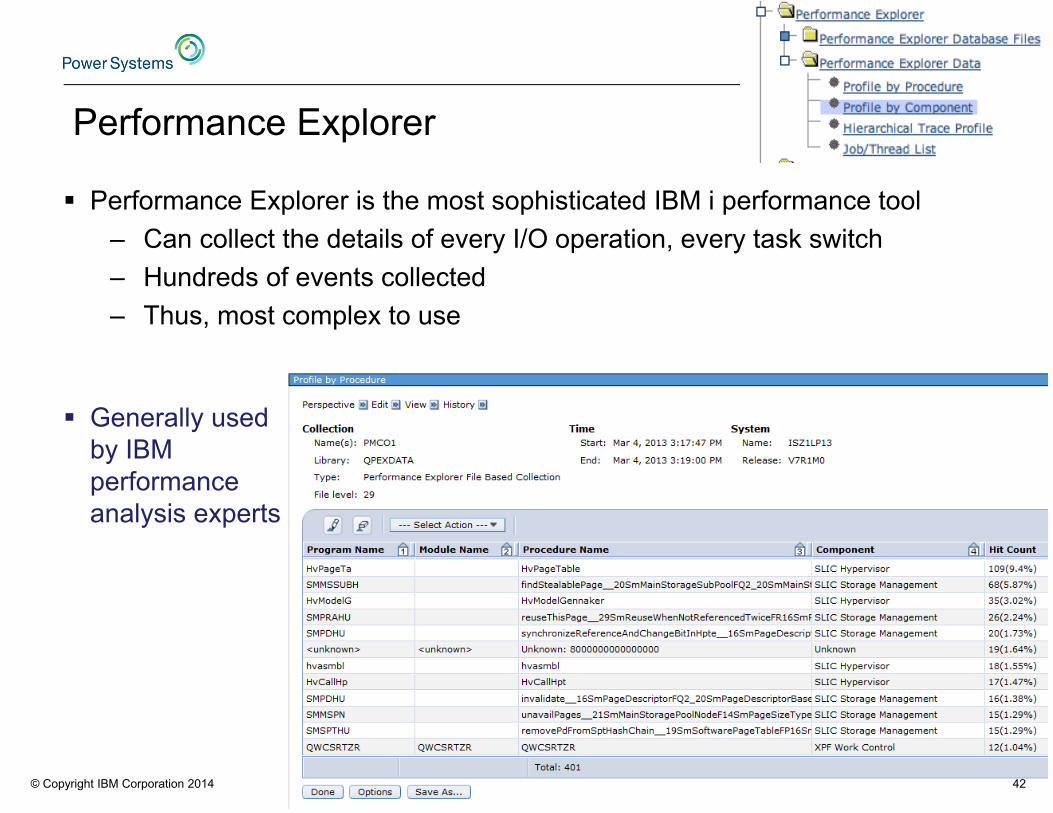
Performance Explorer
Performance Explorer is the most sophisticated IBM i performance tool– Can collect the details of every I/O operation, every task switch– Hundreds of events collected– Thus, most complex to use
Generally used by IBM performance analysis experts
© Copyright IBM Corporation 2014 42

Performance Data Collectors and Interfaces
Green Screen
System i Navigator
(client)
Performance Data
Investigator (PDI)
iDoctor
Collection Services Some Some Yes Yes
Disk Watcher Some Yes Yes
Job Watcher Some Yes Yes
Performance Explorer (PEX) Some Some Yes
© Copyright IBM Corporation 2014 43

Performance Data CollectorsPositioning
© Copyright IBM Corporation 2014 44
CollectionServices
• Sample data• Designed for 24x7• Collects every 15
minutes (default)• No information
concerning specific I/O operations
• Wait information
PerformanceExplorer (PEX)
• Trace, statistics, or profile data
• Information collected for every I/O event
• Collection and analysis can be complex
DiskWatcher
• Statistics and Trace data
• Detailed information focused on I/O operations to disk
Less detail
moredetail
JobWatcher
• Sample data• Support for very
small intervals• Focus on job data
• Call Stacks• SQL Statements
• Wait information
Performance DataCollection vs Visualization
The performance data collection capability is built into the operating system
– Everyone can collect all types of IBM i performance data
The visualization of the data may require additional products
– Visualization is the display of charts or tables of performance data
– The Performance Data Investigator is part of the operating system Everyone can visualize Collection Services data
© Copyright IBM Corporation 2014 45

Relationship Between Collectors And Consumers
© Copyright IBM Corporation 2014 46
System i Navigator

Manage Your Performance Data with Navigator
© Copyright IBM Corporation 2014 47

Collection Options
© Copyright IBM Corporation 2014 48
Monitoring
© Copyright IBM Corporation 2014 49

Why Monitor?
Who wants to react to unexpected situations?
Being proactive can help you prevent small problems from becoming big ones
Being predictive can help you prevent even small problems
© Copyright IBM Corporation 2014 50

Real-time Monitoring
Several tools available for real-time monitoring:– Watches
– CL Commands
– IBM Navigator for i
– Management Central Monitors
– IBM Systems Director
– Tivoli Monitoring
© Copyright IBM Corporation 2014 51

Watches
Watches provide a programmatic interface to be notified when the following occur:– Message– Licensed Internal Code Log (LIC Log)– Problem Activity Log Entry (PAL entry)
Start Watch (STRWCH) command or API (QSCSWCH) End Watch (ENDWCH) command or API (QSCEWCH)
When the condition being watched occurs, your program gets control and you can take any action you want
© Copyright IBM Corporation 2014 52
http://www.ibmsystemsmag.com/Blogs/i-Can/Archive/i-can-automate-monitoring-with-watches/

Monitoring the Old Fashioned Way…
• Work With …. – System Status– Disk Status– Active Jobs– System Activity
• It’s manual.
• Why not let the system do it for you?
© Copyright IBM Corporation 2014 53

CL Commands
Commands can be used for real-time performance monitoring• Work with Active Jobs (WRKACTJOB)• Work with Disk Status (WRKDSKSTS)• Work with System Status (WRKSYSSTS)• Work with System Activity (WRKSYSACT)• Work with Shared Storage Pools (WRKSHRPOOL)
• These commands are sampling based• Enter the command• Allow the system to collect data for a minimum of 5 minutes• Refresh (F5) the display to see the performance data• Restart (F10) will restart the elapsed time counter
© Copyright IBM Corporation 2014 54

IBM Navigator for i• Recommended starting points for
manual monitoring: Graphical User Interface views of
• System Status• Disk Status• Active Jobs
Health Indicators• Graphical view of general health
based upon Collection Services data
• System Resources• CPU• Disk • Memory• Response Time• Database
© Copyright IBM Corporation 2014 55

IBM Navigator for i - Thresholds IBM-supplied defaults for threshold levels on health indicators
– Can be customized for your requirements
With Design Mode, Edit View, thresholds can be added to any chart
© Copyright IBM Corporation 2014 56

Monitoring with System Monitors
• System Monitors gather and present real-time performance data– Monitor the health of your system– Identify potential performance problems before they become serious issues
• System Monitors show high-level performance information– Navigator’s System Monitors use the Performance Data Investigator to visualize
and provide drill-down capabilities– Management Central System Monitors have basic levels of detail
• Thresholds can be defined to trigger an action when a system wide performance metric exceeds the defined “comfort level”
– For example, when CPU Utilization exceeds 80%, send a message to notify the operator
• System Monitors provide powerful capabilities to monitor what is happening on your system
– BUT finding out what caused the problem often requires other performance analysis tools
© Copyright IBM Corporation 2014 57
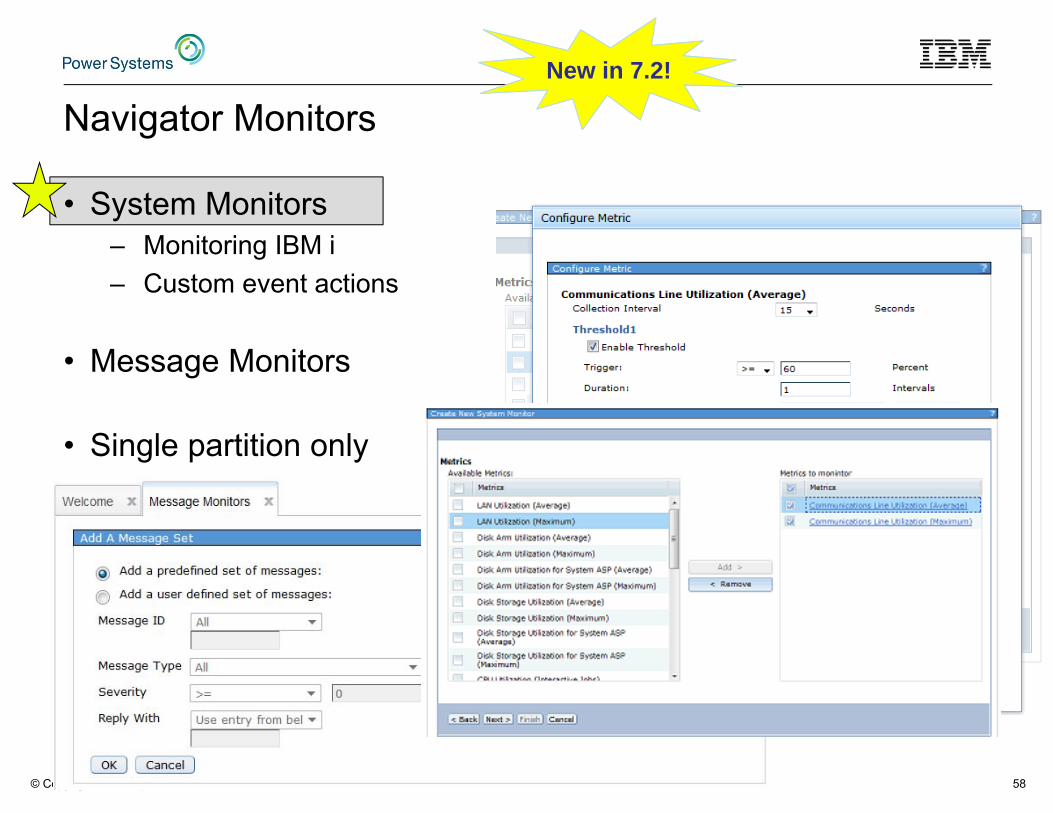
Navigator Monitors
• System Monitors– Monitoring IBM i– Custom event actions
• Message Monitors
• Single partition only
© Copyright IBM Corporation 2014 58
New in 7.2!

Monitors with IBM Navigator for i
© Copyright IBM Corporation 2014 59
List of system monitors on a partition
Select what you want to monitor
Set monitoring intervals
Set thresholds
Define actions taken when a threshold is
reached
Manage event logs

Navigator - System Monitor Metrics
• CPU Utilization (Average)• CPU Utilization (Interactive Jobs)• CPU Utilization(Uncapped)• CPU Utilization(SQL) • Interactive Response Time (Average and Maximum) • Transaction Rate (Interactive) • Batch Logical Database I/O• Disk Arm Utilization (Average and Maximum)• Disk Arm Utilization for User/System/Independent ASP (Average and Maximum)• Disk Storage Utilization (Average and Maximum) • Disk Storage Utilization for User/System/Independent ASP (Average and Maximum) • Communications Line Utilization (Average and Maximum) • LAN Utilization (Maximum and Average) • Machine Pool Faults • User Pool Faults (Maximum and Average) • Spool File Creation Rate • Shared Processor Pool Utilization (Virtual and Physical)• Temporary Storage Utilization
© Copyright IBM Corporation 2014 60
Red are new with 7.2 Navigator Monitors

Create New System Monitor
© Copyright IBM Corporation 2014 61

Management Central Monitors
Management Central Monitors are part of System i Navigator– Monitors have been added to Navigator in 7.2– Management Central Monitors on 6.1 and 7.1
For performance management, use the System Monitors– Real-time performance of multiple partitions– Performance metrics CPU Utilization Disk Utilization Faulting Etc....
– Thresholds can be defined for automated notification
– System monitors use Collection Services for the performance data© Copyright IBM Corporation 2014 62

System i Navigator Monitor Metrics
© Copyright IBM Corporation 2014 63
CPU Utilization (Average) Communications IOP Utilization (Average)CPU Utilization (Interactive Jobs) Communications IOP Utilization (Maximum)CPU Utilization (Interactive Feature) Communications Line Utilization (Average)CPU Utilization Basic (Average) Communications Line Utilization (Maximum)CPU Utilization (Secondary Workloads) LAN Utilization (Average)CPU Utilization (Database Capability) LAN Utilization (Maximum)Interactive Response Time (Average) Machine Pool FaultsInteractive Response Time (Maximum) User Pool Faults (Average)Transaction Rate (Average) User Pool Faults (Maximum)Transaction Rate (Interactive) Disk Storage (Average)Batch Logical Database I/O Disk Storage (Maximum)Disk Arm Utilization (Average) Disk IOP Utilization (Average)Disk Arm Utilization (Maximum) Disk IOP Utilization (Maximum)
● You can monitor one or many performance metrics in each monitor
● System Monitors use Collection Services as their data source

Select 'New Monitor...' and specify General properties
New Monitor with System i Navigator Monitors
© Copyright IBM Corporation 2014 64
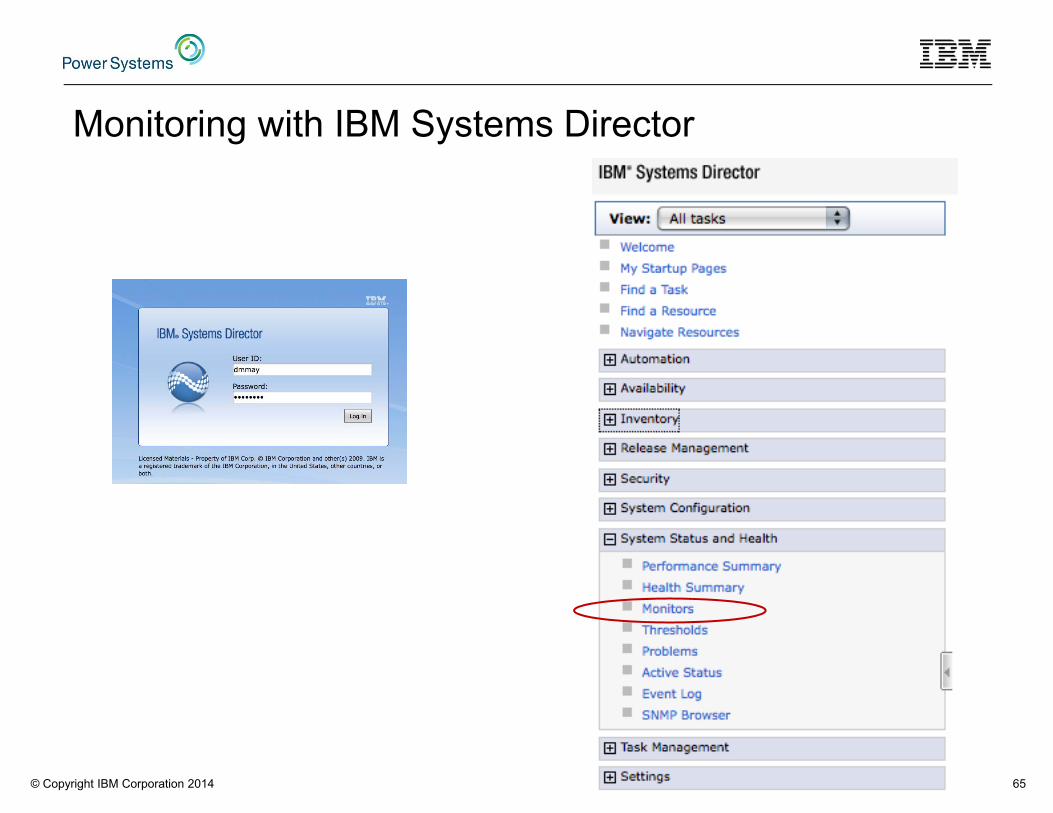
Monitoring with IBM Systems Director
© Copyright IBM Corporation 2014 65

IBM i Monitors 30+ Metrics for common monitoring scenarios
© Copyright IBM Corporation 2014 66

IBM Tivoli Monitoring Enterprise-level monitoring and automation
is accomplished with IBM Tivoli Monitoring– Predefined or customized situations– Policies for automation
– Monitoring agent for IBM i provides a wealth of information that can be monitored
Operating system CPU Disk Network Virtual and physical memory Paging information
.... and much, much more
© Copyright IBM Corporation 2014 67IBM Tivoli Monitoring IBM i OS Agent Reference Version 6.3 Fix Pack 2.pdf
Memory and Faulting
© Copyright IBM Corporation 2014 68

Memory Rules of thumb – starting point from which you can fine tune to
determine appropriate thresholds for your environment
Memory• Faulting is normal and expected• How much is too much?
• It depends….
• Use the Performance Adjustor if your workloads are slow to change• E.g., Daytime versus over night• Rapidly changing workloads are not well suited for the Performance
Adjustor
• QPFRADJ – Automatically manages the shared memory pools without any user
interaction
© Copyright IBM Corporation 2014 69

Memory - Pool Faulting Guidelines
Machine Pool Faulting Guidelines• The machine pool faulting rate should be less than 10/faults per second
• Add memory to the machine pool if the fault rate of that pool is more than 10 faults per second and the amount of memory used in the pool is high
• Disk utilization should be less than 40%
User Pool Faulting Guidelines• Paging guidelines no longer published
Track response time, throughput, and CPU utilization against the faulting rates to determine a reasonable faulting rate Determine how much the faulting is affecting the interactive response
time or batch throughput. Data is available with the Performance Data Investigator
© Copyright IBM Corporation 2014 70

Faulting Considerations• You can have really high faulting rates but very fast disk drives• …or fairly low faulting rates and very slow response time on your drives
• Use disk wait information to assess– Use Collection Services with the Performance Data Investigator and
look at Page Faults perspectives Shows the Disk Faults Wait Time See how big of a component this is at a system and/or job level in
order to assess whether there is a problem General guideline: limit the amount of
time spent waiting on disk faults to 25% of the runtime of an average job on the system
© Copyright IBM Corporation 2014 71

Tuning Make the most efficient use of the system's resources
• Iterative: measure, analyze, adjust
Basic strategy• Set up initial tuning values• Measure: observe system performance with these tools (or their GUI)
• WRKSYSSTS• WRKDSKSTS• WRKSYSACT• WRKACTJOB
• Analyze: review values, compare with performance goals• Interactive throughput and response time• Batch throughput for active batch jobs
• Auxilliary input/output (AuxIO)• CPU percentage (CPU%)
• Adjust: if performance does not meet expectations, tune system based on new data• Measure and compare all key performance measurements• Analyze and evaluate adjustments one at a time• Review performance 72

Tuning, continued
General tips:– Let the system tune itself automatically (IBM recommended) Set system value QPFRADJ to 3
» Automatic adjustment
– Work with Shared Pools – WRKSHRPOOL Allows additional control over automatic adjustment of pools based
on faulting and size parameters
© Copyright IBM Corporation 2014 73
Work with Shared Pools System: MYSYSTEM
Main storage size (M) . : 4051.50
Type changes (if allowed), press Enter.
Defined Max Allocated Pool -Paging Option--Pool Size (M) Active Size (M) ID Defined Current *MACHINE 800.00 +++++ 800.00 1 *FIXED *FIXED *BASE 2536.01 601 2536.01 2 *FIXED *FIXED *INTERACT 715.22 170 715.23 3 *FIXED *FIXED *SPOOL .25 1 .25 4 *FIXED *FIXED *SHRPOOL1 .00 0 *FIXED

Tuning – Work with Shared Pools Tune the Tuner
– You can tune the values to influence the behavior of the performance adjuster– Focus on pool priority and setting the minimum and maximum values
© Copyright IBM Corporation 2014 74
Work with Shared Pools System: MYSYSTEM
Main storage size (M) . : 4051.50
Type changes (if allowed), press Enter.
-----Size %----- -----Faults/Second------Pool Priority Minimum Maximum Minimum Thread Maximum *MACHINE 1 9.74 100 10.00 .00 10.00 *BASE 1 4.99 100 12.00 1.00 200 *INTERACT 1 10.00 100 12.00 1.00 200 *SPOOL 2 1.00 100 5.00 1.00 100 *SHRPOOL1 2 1.00 100 10.00 2.00 100 *SHRPOOL2 2 1.00 100 10.00 2.00 100 *SHRPOOL3 2 1.00 100 10.00 2.00 100 *SHRPOOL4 2 1.00 100 10.00 2.00 100 *SHRPOOL5 2 1.00 100 10.00 2.00 100 *SHRPOOL6 2 1.00 100 10.00 2.00 100
More...

Expert Cache
• Expert cache dynamically adjusts the size and type of I/Os to maximize the use of main storage and minimize the number of disk I/Os
• Paging Option controls expert cache– *CALC enables expert cache for that pool
• In general, enable Expert Cache on most user pools
© Copyright IBM Corporation 2014 75
-Paging Option--
Defined Current
*FIXED *FIXED
*FIXED *FIXED

Tuning – Pool Properties via NavigatorYou can also do memory pool tuning through the GUI
© Copyright IBM Corporation 2014 76

Tuning, continued
General tips:
– If QPFRADJ = 0 (off) use WRKSYSSTS to manually adjust pools and activity levels Minimize wait-to-ineligible transitions in interactive pools
< 10% of active-to-waits Increase MAXACT by 5 or 10 to reduce wait-to-ineligible transitions Repeat until they are less than 10% of the active-to-wait
Tune faulting in user pools Sum of faults for all user pools should be less than the number
of processors times the processors percent busy Example: four processors running at 50% busy Get faults to less than 200 faults/seconds (4 * 50)
© Copyright IBM Corporation 2014 77
Set the maximum activity level high enough to avoid transitions to ineligible, but not higher than necessary (especially for pools running SQL).

Tuning, continued...
– Favor output over input so existing jobs are not adversely impacted
– Do not mix different types of jobs and priorities in the same pool Remove batch jobs from *BASE by creating another batch pool Route batch jobs to *SHRPOOL1 One batch job to a pool is ideal. This can be done by modifying the
job description for the routing data, and the subsystem description for the routing entry
– Java runs best in it's own pool with a minimum size big enough that there is no faulting
– On a shared production/development partition Create a second interactive pool *SHRPOOL2 for programmers Change programmers' job description routing data and subsystem
description routing entries so their jobs run in SHRPOOL2
© Copyright IBM Corporation 2014 78

Tuning, Work with Memory Pools - GUI
• Active Memory Pools will show you performance metrics– Hint: You need to customize the columns to see all the metrics in the
table view
© Copyright IBM Corporation 2014 79
Increase pool size to reduce faulting
Increase max activity to reduce ineligibles

Tuning .... Work With System Statustext-based interface
Work with System Status MYSYSTEM 04/22/10 10:15:01
% CPU used . . . . . . . : 1.6 System ASP . . . . . . . : 246.6 G Elapsed time . . . . . . : 00:02:47 % system ASP used . . . : 70.2142 Jobs in system . . . . . : 1013 Total aux stg . . . . . : 246.6 G % perm addresses . . . . : .022 Current unprotect used . : 8297 M % temp addresses . . . . : .059 Maximum unprotect . . . : 9656 M
Sys Pool Reserved Max ----DB----- --Non-DB--- Act- Wait- Act-Pool Size M Size M Act Fault Pages Fault Pages Wait Inel Inel1 800.00 274.01 +++++ .0 .0 .0 .0 13.5 .0 .0 2 2536.01 2.51 601 .3 .8 1.1 12.8 11730 .0 .0 3 715.23 <.01 170 .0 .0 .1 .1 5.3 .0 .0 4 .25 .00 1 .0 .0 .0 .0 .0 .0 .0
© Copyright IBM Corporation 2014 80
Increase pool size to reduce faulting
Increase max activity to reduce ineligibles

Memory
• Memory perspectives are now available
• Similar information from what you get on WRKSYSSTS….
© Copyright IBM Corporation 2014 81
New!

Memory• In a graphical view!• Leverage PDI with CS data to expand your tuning tools
© Copyright IBM Corporation 2014 82
New!
Note the change in pool sizes.QPFRADJ is on.

Memory Charts
• Memory Pool Sizes and Fault RatesView 1: Memory Pool Sizes and Fault Rates (001-004)View 2: Memory Pool Sizes (All Pools)View 3: Fault Rates (All Pools)
• Memory Pool Activity LevelsView 1: Memory Pool Activity Levels and Ineligible Transitions Per Second (001-004)View 2: Memory Pool Activity Levels (All Pools)View 3: Ineligible Transitions Per Second (All Pools)
• DB and Non-DB Page FaultsView 1: DB and Non-DB Page Faults Overview (All Pools)View 2: DB Page Faults (All Pools)View 3: Non-DB Page Faults (All Pools)
• Drilldown:– Memory Metrics for One Pool
View 1: Memory Metrics Overview for One PoolView 2: DB and Non-DB Page Faults for One PoolView 3: DB and Non-DB Pages Read/Written for One Pool
© Copyright IBM Corporation 2014 83
3 views or charts in each perspective

Memory PerspectivesMemory Pool Sizes and Fault Rates – View one: (Pools 001-004)
© Copyright IBM Corporation 2014 84
Memory Pool Activity Levels – View one: Memory metrics overview for one pool

Memory Perspectives – DB and non-DB Page Faults
3 views
© Copyright IBM Corporation 2014 85

Memory - Drilldown
© Copyright IBM Corporation 2014 86

CPU Considerations
CPU Utilization Guidelines depend upon the number of processors defined to the partition
IBM Lab Services uses the following guidelines (but of course….it depends!)
– 70% 1-way– 76% 2-way– 81% 4-way– 85% 8-way– 87% 12-way– 91% 24-way– 93% 32-way
for high-priority for work, not considering lower-priority batch jobs
© Copyright IBM Corporation 2014 87
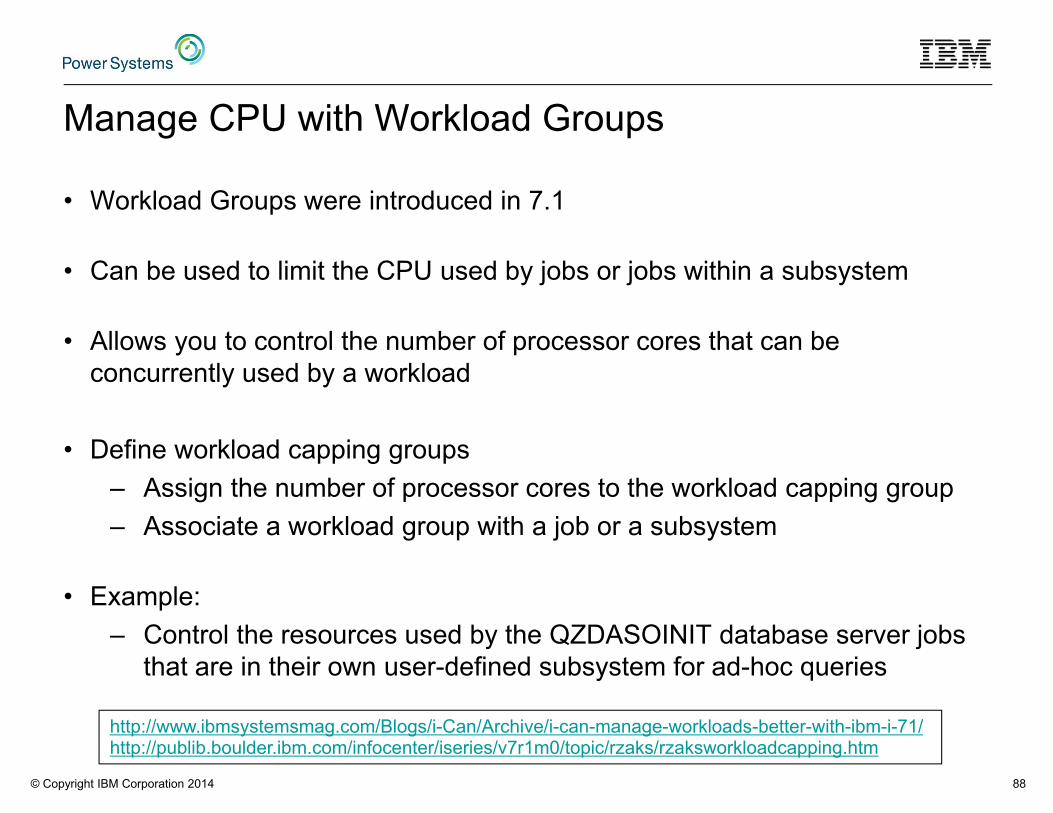
Manage CPU with Workload Groups
• Workload Groups were introduced in 7.1
• Can be used to limit the CPU used by jobs or jobs within a subsystem
• Allows you to control the number of processor cores that can be concurrently used by a workload
• Define workload capping groups– Assign the number of processor cores to the workload capping group– Associate a workload group with a job or a subsystem
• Example:– Control the resources used by the QZDASOINIT database server jobs
that are in their own user-defined subsystem for ad-hoc queries
© Copyright IBM Corporation 2014 88
http://www.ibmsystemsmag.com/Blogs/i-Can/Archive/i-can-manage-workloads-better-with-ibm-i-71/http://publib.boulder.ibm.com/infocenter/iseries/v7r1m0/topic/rzaks/rzaksworkloadcapping.htm

Disk Response Time Disk Response Time may be the most important component in overall
system performance in today's system• Very fast processor technology, while disk performance has not yet made as
much progress• Solid State Drives will have some impact here
• Rules of thumb for categories:• Good: Average response time less than 5 milliseconds• Normal: Average response time between 5 and 10 milliseconds• Requires analysis: anything over 10 milliseconds
• Alternatively - Establish disk response time objectives for a given application• This becomes your benchmark• Dividing the total disk response time per transaction by the average
number of synchronous disk I/Os per transaction• Online Transaction Processing (OLTP) objectives will vary from batch
processing because it may be more disk I/O intensive© Copyright IBM Corporation 2014 89
http://www.ibmsystemsmag.com/Blogs/i-Can/Archive/i-can-measure-disk-response-times/

Disk Response Time Groups
Disk Response Time Groups were added in 6.1, enhanced in 7.1
– Response time measured at the I/O Device Driver level
– Counts are incremented in the appropriate response time group
– Can get a histogram of the disk response times and easily identify if you have slow disk operations
– 7.1 Time is in microseconds instead of milliseconds Read and write times into separate groups Data is stored in separate file, QAPMDISKRB
© Copyright IBM Corporation 2014 90

Disk Response Time Groups - comparison
© Copyright IBM Corporation 2014 91
Range 1: 0 < 15us;Range 2: 15us < 250us;Range 3: 250us < 1,000us;Range 4: 1,000us < 4,000us;Range 5: 4,000us < 8,000us;Range 6: 8,000us < 16,000us;Range 7: 16,000us < 64,000us;Range 8: 64,000us < 256,000us;Range 9: 256,000us < 500,000us;Range 10: 500,000us < 1,024,000us;Range 11: >= 1,024,000us;
Range 1: 0 < 1ms;Range 2: 1ms < 16ms;Range 3: 16ms < 64ms;Range 4: 64ms < 256ms;Range 5: 256ms < 1,024ms;Range 6: >= 1,024ms;
7.1
6.1

Performance Data Investigator - Disk Response Time Charts
© Copyright IBM Corporation 2014 92

Monitor Historical Performance Trends
© Copyright IBM Corporation 2014 93

Monitor Historical Performance Trends
Historical performance data allows you to
• Identify Trends
• Plan for the future
You have two options for historical performance data
• Graph History
• PM for Power Systems
© Copyright IBM Corporation 2014 94

Graph History
• Graph History in System i Navigator allows you to view performance data over…..
– Days, weeks, or months
– 7 days if you are not collecting performance data with PM
– One year if you are collecting performance data with PM
• Graph History is not available in Navigator for i …. YET…– It is the only performance function where you still need System i
Navigator
© Copyright IBM Corporation 2014 95

Graph History and PM Agent
• PM for Power Systems needs to be running to view Graph History data that is older than one week
– You do not need to send PM data to IBM to use Graph History but the collection facility on your system needs to be running
• If you send PM data to IBM, you will have access to performance graphs via the web to help you analyze performance
– PM for Power Systems has additional detail not found in Graph History
© Copyright IBM Corporation 2014 96

Collection Services – Graph History Configuration
© Copyright IBM Corporation 2014 97
Check bottom 2 boxes if you plan to use Graph History
Collection Services configuration can be done with the System i Navigator client.
System i Navigator configuration is required to use graph history

Viewing Data Using Graph History
© Copyright IBM Corporation 2014 98

What to view Length of time to view
Options
© Copyright IBM Corporation 2014 99
Click Refresh to view the data

Layout
© Copyright IBM Corporation 2014 100

Data is summarized over time
Detailed data and property data are both available
Detailed data is available but no property data is available
No detailed data is available
© Copyright IBM Corporation 2014 101
Property Data
Detailed Data

Dynamic HelpGlide over a graph point
More informationRight-click on graph data point
Zoom (in/out)Slider bar
Summarized information
Viewing Data
© Copyright IBM Corporation 2014 102

Export to PC format
Exporting Data
© Copyright IBM Corporation 2014 103

Performance Management for Power Systems
• PM for Power Systems– If you don’t want to manage the collection of performance data yourself
• By default PM will be active and collect performance data
• Activating PM does not mean that you have to transmit performance data to IBM
– The data remains on your system unless you explicitly request that it be sent to IBM
– There are many good reasons to transmit to IBM even if you don’t purchase additional PM services Easy to understand reports that help you manage performance Trending information to help you plan for future upgrades
© Copyright IBM Corporation 2014 104

PM for Power Systems
Performance Management for Power Systems is an IBM offering that provides a historical view of performance– Send your performance data to IBM
– IBM will store up to two years of performance data You can use the supplied graphs to view the trends of key performance
metrics
– Performance data sent to IBM can later be used to size your next upgrade
© Copyright IBM Corporation 2014 105

Starting Performance Management
© Copyright IBM Corporation 2014 106
● Can be started with System i Navigator or the CFGPM400 CL Command● Transmission of data to IBM requires a Service Agent connection● Complete instructions located in the Information Center (7.1 link below):
http://pic.dhe.ibm.com/infocenter/iseries/v7r1m0/topic/rzahx/rzahxpm400cfg.htm

PM for Power Systems
© Copyright IBM Corporation 2014 107
http://www-03.ibm.com/systems/power/support/perfmgmt/
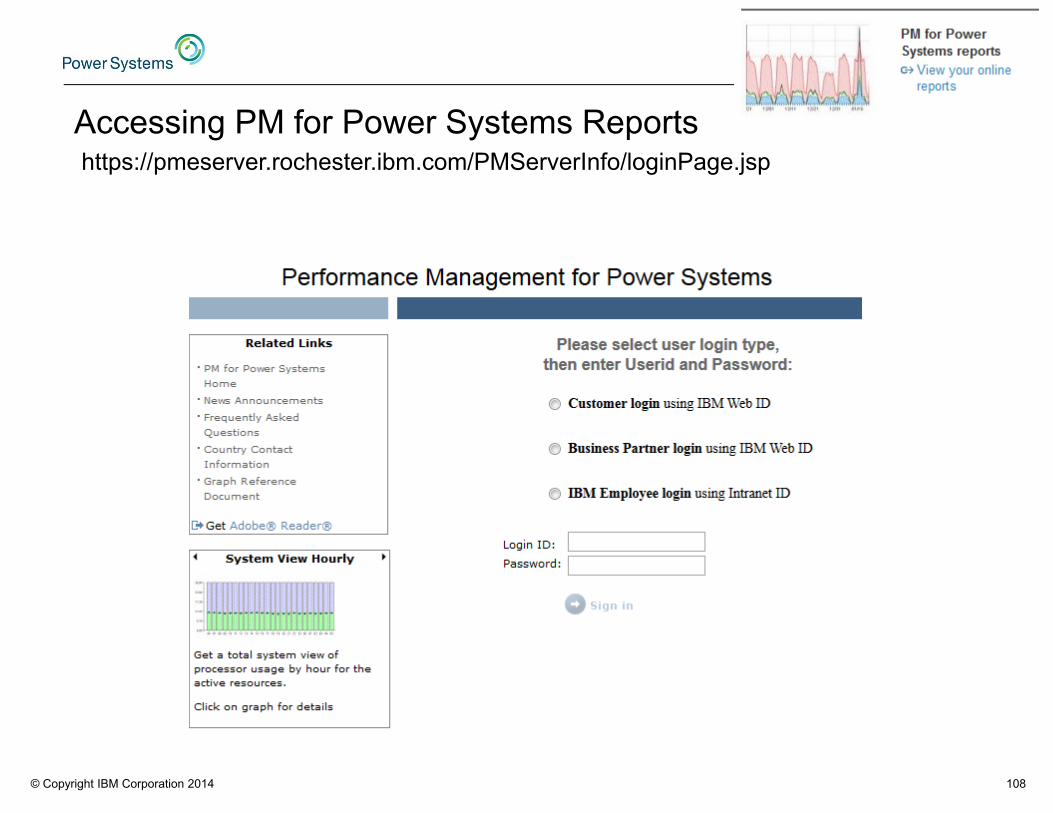
Accessing PM for Power Systems Reports
© Copyright IBM Corporation 2014 108
https://pmeserver.rochester.ibm.com/PMServerInfo/loginPage.jsp

PM for Power Systems Enterprise View
© Copyright IBM Corporation 2014 109
Click here for customized graphs Click here for detailed performance reports

Viewing Customized Graphs
© Copyright IBM Corporation 2014 110

Monthly Reports
© Copyright IBM Corporation 2014 111
Modeling and Sizing
© Copyright IBM Corporation 2014 112

Batch Model
© Copyright IBM Corporation 2014 113
Measure a batch workload • Adjust hardware, processor, storage (SSD), system
settings
• Model how these changes effect the Workload performance
New in 7.2!
Batch Model functions and content package require the installation of IBM Performance Tools for i (5770-PT1) Option 1 - Manager Feature

Batch Model
© Copyright IBM Corporation 2014 114
New function under Performance task in IBM Navigator for i
• Analyze Batch Model• Calibrate Batch Model• Change Batch Model Calibration• Change Batch Model• Create Batch Model• Merge Batch Model• Reset Batch Model
How to use the Batch Model performance toolhttps://www.ibm.com/developerworks/ibmi/library/i-how-to-use-the-batch-model-performance-tool/

Measured vs Modeled - Workload Timeline Overview
© Copyright IBM Corporation 2014 115
Compare Measured vs Modeled Workload Timelines

Batch Model Exceptional Wait Detailed Overview
Investigate the waits that make up the “exceptional wait” time
© Copyright IBM Corporation 2014 116

Measured vs Modeled Resource Utilization OverviewCompare the Measured vs Modeled Resource Utilization
© Copyright IBM Corporation 2014 117

IBM Systems Workload Estimator
© Copyright IBM Corporation 2014 118
Web applicationhttp://www-912.ibm.com/estimator
Used to size a new partition, an upgrade, or a consolidation of several partitions

Size Next UpgradeSend data directly to the IBM Workload Estimator
© Copyright IBM Corporation 2014 119
Using the Performance Data Investigator
you can send measured data from Collection Services
and input it to the IBM Workload Estimator (WLE)
Intended for a one-time sizing activity
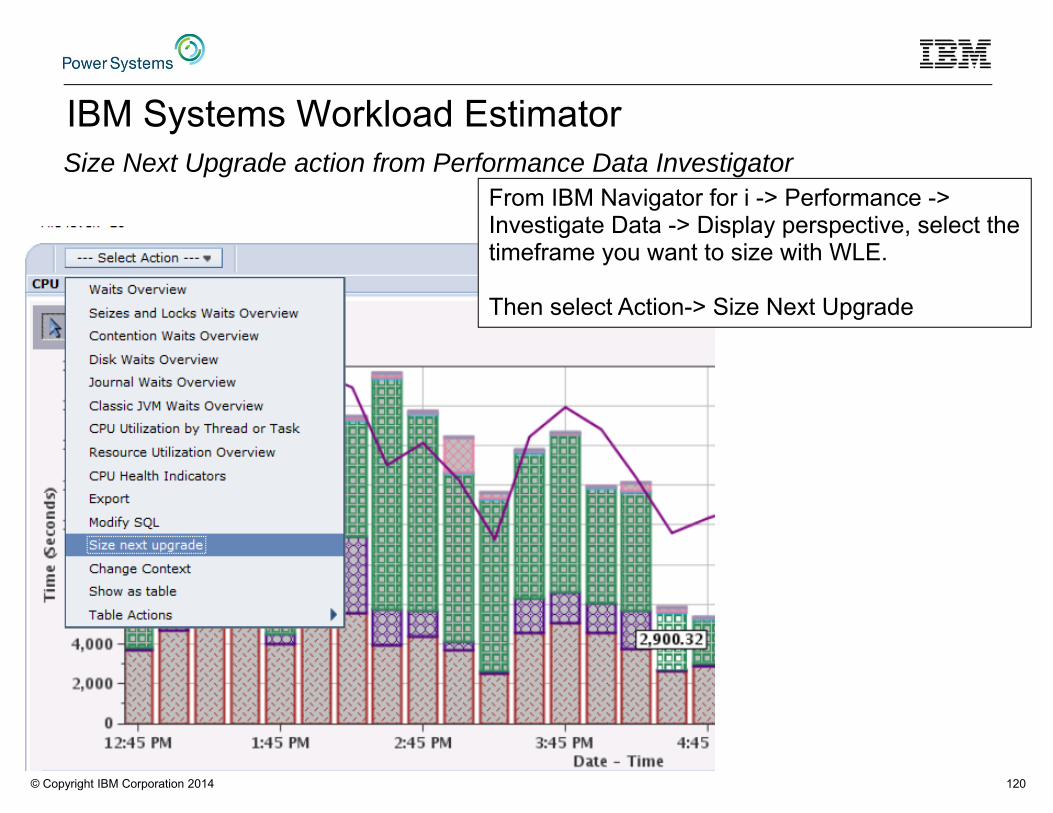
IBM Systems Workload Estimator
© Copyright IBM Corporation 2014 120
Size Next Upgrade action from Performance Data InvestigatorFrom IBM Navigator for i -> Performance -> Investigate Data -> Display perspective, select the timeframe you want to size with WLE.
Then select Action-> Size Next Upgrade

Size Next Upgrade…
© Copyright IBM Corporation 2014 121

IBM Systems Workload Estimator – Example Results
© Copyright IBM Corporation 2014 122

Capacity Planning
Goal of capacity planning is to make your system most efficient with regard to– Utilizing resources– Fulfilling user requests
IBM Systems Workload Estimator (WLE) is the IBM tool for capacity planning– Submit input from the PM for Power Systems data– Select a specific workload to size from the Performance Data Investigator– Manual input
Use WLE to:– Size a new system– Size an upgrade– Size a consolidation of several systems
WLE provides current and growth recommendations for– Processor– Memory– Disk
© Copyright IBM Corporation 2014 123

Capacity Planning Cycle
Review current performance
Select representative data– Is the data variable due to business cycle or seasonal economic
conditions? Identify seasonal processing peaks
– Are there peaks within peaks? Eliminate exceptional and unusual conditions
Estimation– Gather realistic projects of the business factors that affect performance– Focus on how the business factors will cause changes in the workload– Account for pent up demand– Using a sizing tool such as the Workload Estimator
© Copyright IBM Corporation 2014 124

Basic Performance Analysis
© Copyright IBM Corporation 2014 125

Go Perform
© Copyright IBM Corporation 2014 126
Why would you bother…?

Basic Performance Analysis
• Become familiar with your Collection Services performance data to understand your performance characteristics
– Be proactive!
• When a performance problem occurs you often need to use performance analysis tools to identify the cause of the problem to correct it
• Performance tasks in Navigator – Manage performance collections– Performance Data Investigator
© Copyright IBM Corporation 2014 127

Performance Tools plug-in in System i Navigator
● The Performance Tools plug-in presents more detail than System Monitors which provides more capability to analyze the cause of a performance issue
– Graphs are similar to System Monitor graphs– Multiple data views allow you to analyze performance in many ways– Summary statistics provide an overall view of system performance– Drill down to the time interval when a problem occurred and use the
power of the GUI to sort performance data by any available metric
© Copyright IBM Corporation 2014 128
Don’t waste your time…

IBM Navigator for i - Performance Tasks
Browser-based performance tasks – Manage performance data collections
– Graphical user interface for collecting performance data
– Graphically view and analyze performance data.• Health Indicators• Monitor• Collection Services• Database• Job Watcher• Disk Watcher• Performance Explorer• Batch Model
– And much more!
© Copyright IBM Corporation 2014 129

Investigate Data
© Copyright IBM Corporation 2014 130

Investigate Data - Collection Services
© Copyright IBM Corporation 2014 131

CPU Utilization and Waits Overview
Start with CPU Utilization and Waits Overview
• Shows CPU Utilization (red line)
• Shows Wait Information (stacked bars)
• Green bars are disk time
• Can easily identify when the CPU utilization dropped that disk time went up
• Drill down for further analysis
– Type of disk operations
– Contributing jobs
© Copyright IBM Corporation 2014 132

Reports
• Performance reports are useful for comparing your measurements over time to compare to your baseline
– Historically, the Performance Tools LPP gave you the ability to generate text-based reports
– You can create graphical reports in PDF format with PDI
• Create reports to track your key performance metrics over time
© Copyright IBM Corporation 2014 133

PDI Report (PDF example)
© Copyright IBM Corporation 2014 134

Advanced Performance Analysis
© Copyright IBM Corporation 2014 135

Advanced Performance Analysis
• Advanced and detailed analysis is necessary to fully diagnose some performance problems
• IBM i has sophisticated data for this purpose– Job Watcher
– Disk Watcher
– Performance Explorer
• And two user interfaces:– Performance Data Investigator
– iDoctor© Copyright IBM Corporation 2014 136

Analyze Performance Data
Start with Collection Services data• Whether investigating a reported problem, monitoring how your system
is running, or looking for improvement candidates, it can help • Use it to understand resource usage, what is or is not being used, how
did it change, when did it happen, what is affected etc. Scope the problem
Where to start• Health Indicators perspectives - Are any resources constrained? • Collection Services perspectives:
• CPU Utilization and Waits Overview• Any periods of high CPU or wait time? • Does any type of wait stand out?
• CPU utilization by Thread or Task – See who is using CPU time. • Resource Utilization Overview – time based comparison of disk busy,
physical I/O, faulting, CPU, logical DB I/O and 5250 transactions. Does anything stand out here?
© Copyright IBM Corporation 2014 137

Analyze Performance Data (continued) Using the Collection Services data you should know what you
need to investigate further• excessive CPU consumption, locking issues, disk utilization, … • when it happened • what resources were involved (jobs, disk units, ….)
Collection Services cannot tell you details like what programs, instructions were running, objects, files, records, SQL statements being used, who is holding locks and who is waiting…
You need to use tools like Job watcher, Disk Watcher and/or PEX for this in depth information.
• Based on the Collection Services information you can focus these tools to collect only the data you need.
• Generally, Job Watcher is used when you cannot identify the root cause with Collection Services 138

IBM iDoctor for i
• Product developed by the IBM Rochester Support Center for deep, detailed performance analysis
• Major components– Job Watcher
Job Watcher Collection Services Investigator Disk Watcher Plan Cache Analyzer - graphical analysis of the system's SQL
Plan Cache – PEX Analyzer– Heap Analyzer – Classic JVM heap analysis– VIOS Investigator
• http://www-912.ibm.com/i_dir/idoctor.nsf© Copyright IBM Corporation 2014 139
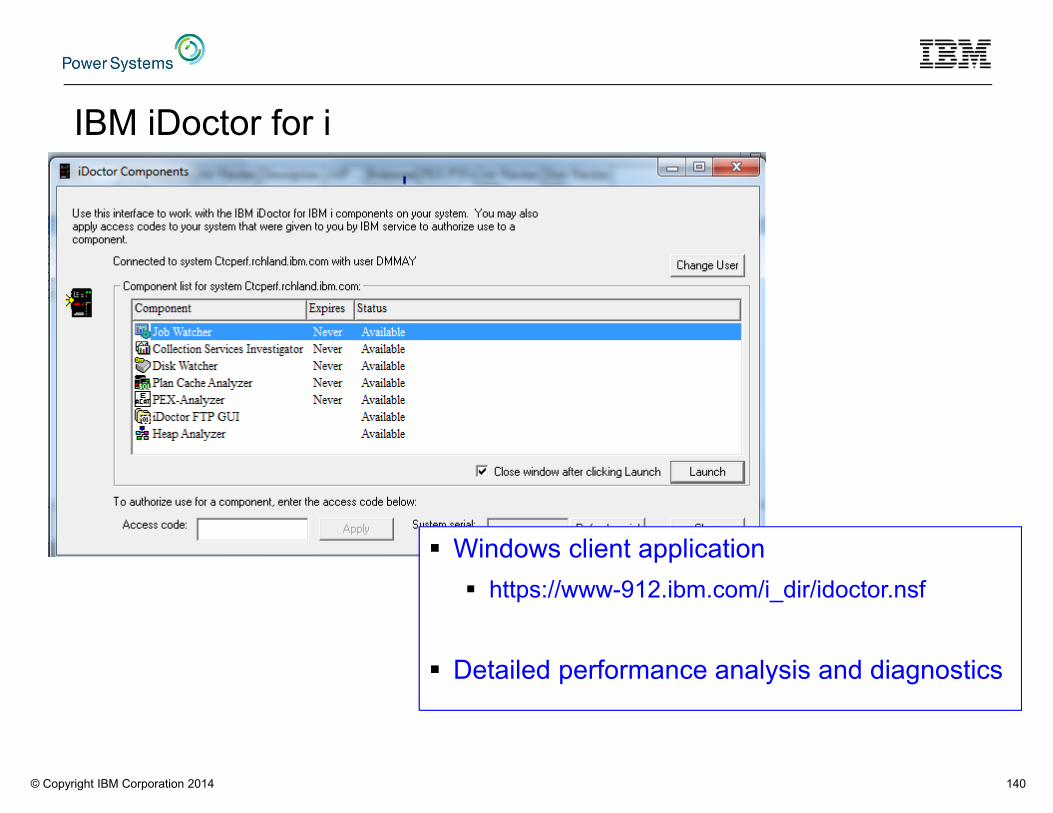
IBM iDoctor for i
© Copyright IBM Corporation 2014 140
Windows client application https://www-912.ibm.com/i_dir/idoctor.nsf
Detailed performance analysis and diagnostics

iDoctor versus Performance Data Investigator
© Copyright IBM Corporation 2014 141
• You have two graphical interfaces for performance data analysis…– Which should you use? It depends….
Feature iDoctor PDI
Interface Windows client Browser
Wait Analysis Yes Yes
Collection Services Yes Yes
Job Watcher Yes Yes
Disk Watcher Yes Yes
Performance Explorer Yes Profile collections only
Database Yes Yes
Job Watcher Monitors Yes No
Customizable Yes Yes
User Defined graphs and queries
Yes Yes
Update Frequency Monthly Twice Yearly
Support Defect only Standard SWMA
Chargeable Yearly license Collection Services at no additional charge with iDisk Watcher, Database, and Performance Explorer included with base PT1 productJob Watcher is an additional option of PT1 and has an additional charge
Experimental Features Yes (e.g., VIOS Investigator)
No
Multinational language support No Yes

© Copyright IBM Corporation 2014 142

IBM i Performance FAQ - a MUST read!
© Copyright IBM Corporation 2014 143
http://www.ibm.com/common/ssi/cgi-bin/ssialias?subtype=WH&infotype=SA&appname=STGE_PO_PO_USEN&htmlfid=POW03102USEN&attachment=POW03102USEN.PDF
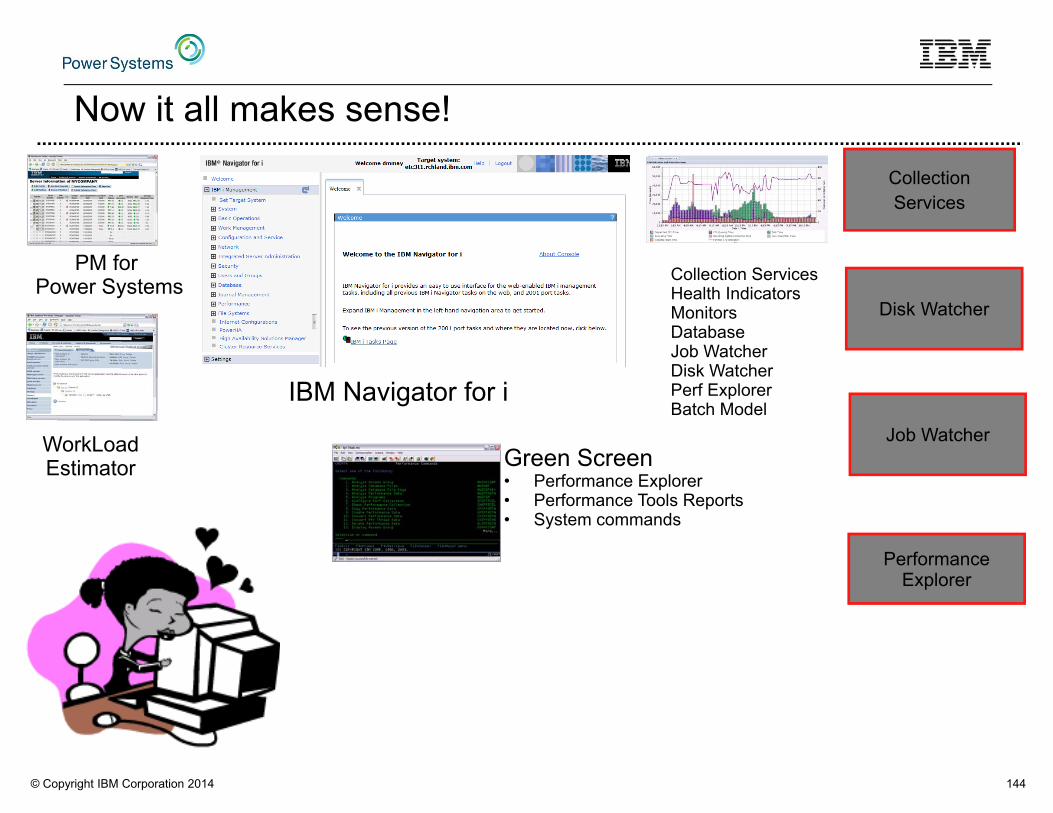
CollectionServices
Green Screen• Performance Explorer• Performance Tools Reports• System commands
Performance Explorer
Job Watcher
Disk Watcher
IBM Navigator for i
Now it all makes sense!
© Copyright IBM Corporation 2014 144
WorkLoadEstimator
PM for Power Systems Collection Services
Health IndicatorsMonitorsDatabaseJob Watcher Disk WatcherPerf ExplorerBatch Model

www.ibm.com/power/i
© Copyright IBM Corporation 2014 145

References
© Copyright IBM Corporation 2014 146

© Copyright IBM Corporation 2014 147

IBM i Performance on developerWorks
developerWorkshttp://www.ibm.com/developerworks/ibmi/
Performance Tools Additional performance tools resources Performance on the Web Performance Data Collectors
Forumhttps://www.ibm.com/developerworks/forums/forum.jspa?forumID=2751
IBM i Performance Data Investigatorhttp://www.ibm.com/developerworks/ibmi/library/i-pdi/index.html
IBM i Performance Data Investigator – Edit Perspectiveshttp://www.ibm.com/developerworks/ibmi/library/i-pdiedit/index.html
IBM i Wait Accountinghttp://www.ibm.com/developerworks/ibmi/library/i-ibmi-wait-accounting/
How to use the Batch Model performance toolhttps://www.ibm.com/developerworks/ibmi/library/i-how-to-use-the-batch-model-performance-tool/
© Copyright IBM Corporation 2014 148

IBM i Web Sites with Performance Information• IBM Knowledge Center
– http://www-01.ibm.com/support/knowledgecenter/ssw_ibm_i_71/welcome.html– http://www-01.ibm.com/support/knowledgecenter/ssw_ibm_i_72/rzahg/ic-homepage.htm
IBM i Performance ManagementThis web site has a lot of GREAT references and papers – see the resources tabhttp://www-03.ibm.com/systems/power/software/i/management/performance/index.htmlPerformance Capabilities Referencehttp://www-03.ibm.com/systems/resources/systems_power_software_i_perfmgmt_pcrm_feb2013.pdf
Performance Management for Power Systemshttp://www-03.ibm.com/systems/power/support/pm/index.html
IBM Workload Estimatorhttp://www.ibm.com/systems/support/tools/estimator
iDoctorhttp://www-912.ibm.com/i_dir/idoctor.nsf
Job Waits Whitepaperhttps://www-912.ibm.com/i_dir/idoctor.nsf/3B3C112F7FBE774C86256F4000757A8F/$FILE/Job_Waits_White_Paper_61_71.pdf © Copyright IBM Corporation 2014 149

http://www.ibmsystemsmag.com/Blogs/i-Can/
Blogs
© Copyright IBM Corporation 2014 150
http://www.ibmsystemsmag.com/Blogs/You-And-i/
http://ibmsystemsmag.blogs.com/isight/
http://db2fori.blogspot.com/
http://blogs.systemideveloper.com/?q=blog/6

© Copyright IBM Corporation 2014 151
http://www.ibmsystemsmag.com/Blogs/i-Can/
http://www.ibmsystemsmag.com/Blogs/i-Can/Archive/health-indicators-in-the-performance-data-investig/http://www.ibmsystemsmag.com/Blogs/i-Can/Archive/ibm-i-storage-allocation-perspectives/http://www.ibmsystemsmag.com/Blogs/i-Can/Archive/ibm-i-performance-analysis/http://www.ibmsystemsmag.com/Blogs/i-Can/Archive/ibm-power-virtualization-performance-powervp/http://www.ibmsystemsmag.com/Blogs/i-Can/Archive/view-memory-pools-and-faulting-with-the-performanc/http://www.ibmsystemsmag.com/Blogs/i-Can/Archive/ibm-i-wait-accounting/http://www.ibmsystemsmag.com/Blogs/i-Can/Archive/viewing-job-level-sql-metrics-with-the-performance/http://www.ibmsystemsmag.com/Blogs/i-Can/Archive/anticipating-the-future/http://www.ibmsystemsmag.com/Blogs/i-Can/Archive/job-level-sql-metrics-in-collection-services/http://www.ibmsystemsmag.com/Blogs/i-Can/Archive/performance-reports-with-the-performance-data-inve/http://www.ibmsystemsmag.com/Blogs/i-Can/Archive/ibm-i-performance-frequently-asked-questions/http://www.ibmsystemsmag.com/Blogs/i-Can/Archive/commands-to-manage-performance-collections/http://www.ibmsystemsmag.com/Blogs/i-Can/Archive/performance-data-investigator/http://www.ibmsystemsmag.com/Blogs/i-Can/Archive/performance-data-collectors-in-ibm-i/http://www.ibmsystemsmag.com/Blogs/i-Can/Archive/performance-data-investigatorbetter-than-ever/http://www.ibmsystemsmag.com/Blogs/i-Can/Archive/job-performance-information/http://www.ibmsystemsmag.com/Blogs/i-Can/Archive/cpf1240-and-cpf1241-messages-contain-summary-perfo/http://www.ibmsystemsmag.com/Blogs/i-Can/Archive/i-can-find-all-my-performance-collections-in-one-p/http://www.ibmsystemsmag.com/Blogs/i-Can/Archive/lesser-known-features-of-work-with-system-activity/http://www.ibmsystemsmag.com/Blogs/i-Can/Archive/customizing-a-perspective-in-pdi/http://www.ibmsystemsmag.com/Blogs/i-Can/Archive/new-systems-director-navigator-service-packs/http://www.ibmsystemsmag.com/Blogs/i-Can/Archive/ibm-systems-director-navigator-for-i-work-manageme/http://www.ibmsystemsmag.com/Blogs/i-Can/Archive/i-can-collect-more-performance-data-in-71/http://www.ibmsystemsmag.com/Blogs/i-Can/Archive/i-can-measure-disk-response-times/http://www.ibmsystemsmag.com/Blogs/i-Can/Archive/i-can-understand-scaled-cpu-time/http://www.ibmsystemsmag.com/Blogs/i-Can/Archive/i-can-use-power7-features-with-ibm-i-611/http://www.ibmsystemsmag.com/Blogs/i-Can/Archive/i-can-analyze-command-performance/http://www.ibmsystemsmag.com/Blogs/i-Can/Archive/i-can-tell-you-why-youre-waiting/http://www.ibmsystemsmag.com/Blogs/i-Can/Archive/i-can-display-cpu-utilization-for-all-partitions/http://www.ibmsystemsmag.com/Blogs/i-Can/Archive/i-can-investigate-performance-data/

http://www-03.ibm.com/systems/power/software/i/management/performance/index.html
Performance Management on IBM i Web Site
© Copyright IBM Corporation 2014 152

153
www.ibm.com/systems/services/labservices
IBM i Performance and Optimization Services
© Copyright IBM Corporation 2014 153
The IBM i Performance and Optimization team specializes in resolving a wide variety of performance problems. Our team of experts can help you tune your partition and applications, including:
Reducing batch processing times
Resolving SQL query and native IO performance problems
Tuning RPG, COBOL, C, and Java (including WebSphere Application Server) programs
Removing bottlenecks, resolving intermittent issues
Resolving memory leaks, temporary storage growth problems, etc.
Tuning memory pools, disk subsystems, system values, and LPAR settings for best performance
Optimizing Solid State Drive (SSD) performance
Tuning client interfaces such as ODBC, JDBC, .Net and more
Skills transfer and training for performance tools and analysis also available!
Contact Eric Barsness at [email protected] for more details.

IBM i Performance Analysis WorkshopManaging and analyzing the data can be quite complex. During this workshop, the IBM Systems Lab Services IBM iteam will share useful techniques for analyzing performance data on key IBM i resources, and will cover strategies for solving performance problems. It will aid in building a future foundation of performance methodology you can apply in your environment.
Overview:– Topics covered include:
Key performance analysis concepts Performance tools Performance data collectors (Job Watcher, Disk Watcher, etc.) Wait accounting
– Core methodology and analysis of: Locks Memory I/O subsystem CPU
– Concept reinforcement through case studies and lab exercises– May include discussions on theory, problem solving, prevention and best practices
Workshop details:– Intermediate IBM i skill level– 3 day workshop, public or private (on-site)
For public workshop availability and enrollment:http://www-03.ibm.com/systems/power/software/i/support/workshops/performance-analysis.html
For additional information regarding private workshops, please contact Mike Gordon, STG Lab Services, at [email protected]
© Copyright IBM Corporation 2014 154
Learn the science and art of performance analysis, methodology and problem solving
IBM Systems Lab Services - ibm.com/systems/services/labservices - [email protected]

Performance and Scalability Services
© Copyright IBM Corporation 2014 155
The IBM i Performance and Scalability Services Center can provide facilities and hardware IN ROCHESTER to assist you in testing hardware or software changes
“Traditional” benchmarks Release-to-release upgrades Assess application performance when migrating to a new release of IBM I Stress test your system Determine impact of application changes Proofs of Concept (e.g. HA alternatives; SSD analysis, external storage, etc.) Evaluate application scalability Capacity planning
… all with the availability of Lab Services IBM i experts and development personnel
To request any of these services, submit at: http://www-03.ibm.com/systems/services/labservices/psscontact.html

IBM i Solid State Drive Performance ServicesEvaluate the benefits of SSD technologies with IBM i based applications
© Copyright IBM Corporation 2014 156
Features Three options to best meet client needs:
1. Data collection on the client system with analytical services to determine the benefit SSDs will provide. The analysis also identifies which specific objects should be stored on SSDs to optimize benefits.
2. Remote access to a fixed Power IBM iconfiguration to load and test client workloads on both SSDs and traditional disk drives (HDDs). Assessment is made of the delta between workload performance on SSDs and HDDs.
3. Hardware configured to client specifications with client workloads run on a system in the Performance and Scalability Services Center in Rochester, MN. Client has onsite access to state of the art test center. Optimal SSD configuration for current and future workload requirements is determined from analysis of workload runs.
Typical Benefits “Real data” available to assess if SSDs are for you.
Multiple offerings provide flexibility in the scope and depth of the analysis you choose to perform.
With the assistance of our Lab Services experts, clients will learn how to optimize the use of SSDs to meet their processing and business requirements.
Contact To initiate these services, submit a request form at url:
http://www.ibm.com/systems/services/labservices/psscontact.html
www.ibm.com/systems/services/labservices - [email protected]
Why IBM® Rochester?
Deep skills in IBM i implementation and integration Experience in system, database, and application performance gleaned
from hundreds of engagements with clients across most industries Ability to deliver skills transfer as part of your service engagement
IBM, the IBM logo, and ibm.com are trademarks of IBM Corp., registered in many jurisdictions worldwide. Other product and service names might be trademarksof IBM or other companies. A current list of IBM trademarks is available on the Web at “Copyright and trademark information” at www.ibm.com/legal/copytrade.shtml.

A Redbooks publication!
© Copyright IBM Corporation 2014 157
http://www.redbooks.ibm.com/redbooks/pdfs/sg247808.pdf

Redbooks and Redpapers on IBM i Performance Tools IBM i 7.1 Technical Overview with Technology Refresh Updates
http://publib-b.boulder.ibm.com/abstracts/sg247858.html?Open IBM Systems Director Navigator for IBM i (Chapter 9)
http://www.redbooks.ibm.com/abstracts/sg247789.html?Open IBM eServer iSeries Performance Management Tools
http://www.redbooks.ibm.com/Redbooks.nsf/RedbookAbstracts/redp4026.html?Open A Systems Management Guide to Performance Management for System i and System p
servershttp://www.redbooks.ibm.com/abstracts/sg247122.html?Open
Sizing IBM i5/OS Work on IBM System i5 Partitionshttp://www.redbooks.ibm.com/abstracts/sg246656.html?Open
Application and Program Performance Analysis Using PEX Statisticshttp://www.redbooks.ibm.com/abstracts/sg247457.html?Open
Managing OS/400 with Operations Navigator V5R1 Volume 5: Performance Managementhttp://www.redbooks.ibm.com/abstracts/sg246565.html?Open
IBM iDoctor iSeries Job Watcher: Advanced Performance Tool (this is a bit outdated)http://www.redbooks.ibm.com/abstracts/sg246474.html?Open
Best Practices for Managing IBM i Jobs and Output (and a few other special tips)http://www.redbooks.ibm.com/Redbooks.nsf/RedbookAbstracts/redp4454.html?Open
i5/OS Diagnostic Tools for System Administrators: An A to Z Reference for Problem Determinationhttp://www.redbooks.ibm.com/Redbooks.nsf/RedbookAbstracts/sg248253.html?Open
IBM eServer iSeries Systems Management Handbookhttp://www.redbooks.ibm.com/Redbooks.nsf/RedbookAbstracts/redp4070.html?Open© Copyright IBM Corporation 2014 158

Articles IBM Systems Magazine, IBM i - “Sky High Performance “, Aug 2009
http://www.ibmsystemsmag.com/ibmi/august09/coverstory/26021p1.aspx
SystemiNetwork - “Performance Data Investigator Consolidates Functions in One Place”, June 2009
http://systeminetwork.com/article/performance-data-investigator-consolidates-functions-one-place
SystemiNetwork - “IBM Systems Director Navigator for i: Performance Tasks Overview”, June 2009
http://systeminetwork.com/article/ibm-systems-director-navigator-i-performance-tasks-overview
IBM Systems Magazine, IBM i – “A Command Performance”, Nov 2008http://www.ibmsystemsmag.com/ibmi/november08/administrator/22426p1.aspx
IBM Systems Magazine, IBM i - “Introducing IBM Systems Director Navigator for i5/OS”, Aug 2008http://www.ibmsystemsmag.com/ibmi/august08/administrator/21503p1.aspx
IBM Systems Magazine, IBM i – “A Collective Effort”, Nov 2006http://www.ibmsystemsmag.com/ibmi/november06/trends/7201p1.aspx
IBM Systems Magazine, IBM i - “Mission: Performance Management”, Nov 2006http://www.ibmsystemsmag.com/ibmi/november06/features/7129p1.aspx© Copyright IBM Corporation 2014 159

Articles on Job Watcher
“Web Power”http://www.ibmsystemsmag.com/i5/november08/administrator/22431p1.a
spx
Introduction to Job Watcher Green Screen Commandshttp://www.ibmsystemsmag.com/i5/november08/tipstechniques/22521p1.
aspx
Top 10 Hidden iDoctor Gemshttp://www.ibmsystemsmag.com/ibmi/enewsletterexclusive/23868p1.aspx
Using iDoctor for iSeries Job Watcher to Determine Why Jobs Waithttp://www.ibmsystemsmag.com/ibmi/october05/technicalcorner/8896p1.
aspx
© Copyright IBM Corporation 2014 160

Articles on Disk Performance
© Copyright IBM Corporation 2014 161
A New Way to Look at Disk Performance http://www.ibmsystemsmag.com/ibmi/administrator/performance/A-New-Way-to-Look-at-Disk-Performance/
• Analyzing Disk Watcher Datahttp://www.ibmsystemsmag.com/ibmi/tipstechniques/systemsmanagement/Analyzing-Disk-Watcher-Data/
• Using Wait State Accounting to Determine Disk Performancehttp://iprodeveloper.com/systems-management/using-wait-state-accounting-determine-disk-performance
• Understanding Disk Performance, Part 2: Disk Operation on i5/OShttp://iprodeveloper.com/systems-management/understanding-disk-performance-part-2-disk-operation-i5os
• Understanding Disk Performance Metricshttp://iprodeveloper.com/systems-management/understanding-disk-performance-metrics
• Planning for Solid State Driveshttp://ibmsystemsmag.blogs.com/i_can/2012/01/planning-for-solid-state-drives.html
Moving Data to Solid State Driveshttp://ibmsystemsmag.blogs.com/i_can/2013/03/moving-data-to-solid-state-drives.htmlhttp://www.ibmsystemsmag.com/ibmi/storage/disk/data_ssd/
Customer use of SSDshttp://www-912.ibm.com/s_dir/slkbase.NSF/DocNumber/592252201
A Look at System i Integrated DASD Configuration and Performance under i5/OS• Redpaper REDP-3919-00
http://www.redbooks.ibm.com/abstracts/redp3919.html

Systems Management References• Navigator for i on developerWorks
https://www.ibm.com/developerworks/mydeveloperworks/wikis/home?lang=en#/wiki/IBM%20i%20Technology%20Updates/page/IBM%20Navigator%20for%20i
• IBM Application Runtime Experthttp://www-03.ibm.com/systems/power/software/i/are/index.htmlhttp://www.ibm.com/developerworks/ibmi/library/i-applicationruntime/index.html
• Uncovering Application Runtime Expert – IBM i 7.1http://www.redbooks.ibm.com/abstracts/redp4805.html?Open
• Web Performance Advisorhttp://www.ibmsystemsmag.com/ibmi/administrator/performance/Web-Performance-Advisor-Helps-Solve-Mysteries/
• IBM Systems Directorhttp://www-03.ibm.com/systems/software/director/http://pic.dhe.ibm.com/infocenter/director/pubs/index.jsp
• IBM Tivoli Monitoringhttp://www-01.ibm.com/support/knowledgecenter/SSTFXA_6.3.0.2/com.ibm.itm.doc_6.3fp2/welcome.htm?lang=en
• IBM Tivoli Monitoring Agent for IBM iIBM Tivoli Monitoring IBM i OS Agent Reference Version 6.3 Fix Pack 2.pdf© Copyright IBM Corporation 2014 162

This document was developed for IBM offerings in the United States as of the date of publication. IBM may not make these offerings available in other countries, and the information is subject to change without notice. Consult your local IBM business contact for information on the IBM offerings available in your area.Information in this document concerning non-IBM products was obtained from the suppliers of these products or other public sources. Questions on the capabilities of non-IBM products should be addressed to the suppliers of those products.IBM may have patents or pending patent applications covering subject matter in this document. The furnishing of this document does not give you any license to these patents. Send license inquires, in writing, to IBM Director of Licensing, IBM Corporation, New Castle Drive, Armonk, NY 10504-1785 USA. All statements regarding IBM future direction and intent are subject to change or withdrawal without notice, and represent goals and objectives only. The information contained in this document has not been submitted to any formal IBM test and is provided "AS IS" with no warranties or guarantees either expressed or implied.All examples cited or described in this document are presented as illustrations of the manner in which some IBM products can be used and the results that may be achieved. Actual environmental costs and performance characteristics will vary depending on individual client configurations and conditions.IBM Global Financing offerings are provided through IBM Credit Corporation in the United States and other IBM subsidiaries and divisions worldwide to qualified commercial and government clients. Rates are based on a client's credit rating, financing terms, offering type, equipment type and options, and may vary by country. Other restrictions may apply. Rates and offerings are subject to change, extension or withdrawal without notice.IBM is not responsible for printing errors in this document that result in pricing or information inaccuracies.All prices shown are IBM's United States suggested list prices and are subject to change without notice; reseller prices may vary.IBM hardware products are manufactured from new parts, or new and serviceable used parts. Regardless, our warranty terms apply.Any performance data contained in this document was determined in a controlled environment. Actual results may vary significantly and are dependent on many factors including system hardware configuration and software design and configuration. Some measurements quoted in this document may have been made on development-level systems. There is no guarantee these measurements will be the same on generally-available systems. Some measurements quoted in this document may have been estimated through extrapolation. Users of this document should verify the applicable data for their specific environment.
Revised September 26, 2006
Special notices
© Copyright IBM Corporation 2014 163
IBM, the IBM logo, ibm.com AIX, AIX (logo), AIX 5L, AIX 6 (logo), AS/400, BladeCenter, Blue Gene, ClusterProven, DB2, ESCON, i5/OS, i5/OS (logo), IBM Business Partner (logo), IntelliStation, LoadLeveler, Lotus, Lotus Notes, Notes, Operating System/400, OS/400, PartnerLink, PartnerWorld, PowerPC, pSeries, Rational, RISC System/6000, RS/6000, THINK, Tivoli, Tivoli (logo), Tivoli Management Environment, WebSphere, xSeries, z/OS, zSeries, Active Memory, Balanced Warehouse, CacheFlow, Cool Blue, IBM Systems Director VMControl, pureScale, TurboCore, Chiphopper, Cloudscape, DB2 Universal Database, DS4000, DS6000, DS8000, EnergyScale, Enterprise Workload Manager, General Parallel File System, , GPFS, HACMP, HACMP/6000, HASM, IBM Systems Director Active Energy Manager, iSeries, Micro-Partitioning, POWER, PowerExecutive, PowerVM, PowerVM (logo), PowerHA, Power Architecture, Power Everywhere, Power Family, POWER Hypervisor, Power Systems, Power Systems (logo), Power Systems Software, Power Systems Software (logo), POWER2, POWER3, POWER4, POWER4+, POWER5, POWER5+, POWER6, POWER6+, POWER7, System i, System p, System p5, System Storage, System z, TME 10, Workload Partitions Manager and X-Architecture are trademarks or registered trademarks of International Business Machines Corporation in the United States, other countries, or both. If these and other IBM trademarked terms are marked on their first occurrence in this information with a trademark symbol (® or ™), these symbols indicate U.S. registered or common law trademarks owned by IBM at the time this information was published. Such trademarks may also be registered or common law trademarks in other countries.
A full list of U.S. trademarks owned by IBM may be found at: http://www.ibm.com/legal/copytrade.shtml.
Adobe, the Adobe logo, PostScript, and the PostScript logo are either registered trademarks or trademarks of Adobe Systems Incorporated in the United States, and/or other countries.AltiVec is a trademark of Freescale Semiconductor, Inc.AMD Opteron is a trademark of Advanced Micro Devices, Inc.InfiniBand, InfiniBand Trade Association and the InfiniBand design marks are trademarks and/or service marks of the InfiniBand Trade Association. Intel, Intel logo, Intel Inside, Intel Inside logo, Intel Centrino, Intel Centrino logo, Celeron, Intel Xeon, Intel SpeedStep, Itanium, and Pentium are trademarks or registered trademarks of Intel Corporation or its subsidiaries in the United States and other countries.IT Infrastructure Library is a registered trademark of the Central Computer and Telecommunications Agency which is now part of the Office of Government Commerce.Java and all Java-based trademarks and logos are trademarks or registered trademarks of Oracle and/or its affiliates.Linear Tape-Open, LTO, the LTO Logo, Ultrium, and the Ultrium logo are trademarks of HP, IBM Corp. and Quantum in the U.S. and other countries.Linux is a registered trademark of Linus Torvalds in the United States, other countries or both.Microsoft, Windows and the Windows logo are registered trademarks of Microsoft Corporation in the United States, other countries or both.NetBench is a registered trademark of Ziff Davis Media in the United States, other countries or both.SPECint, SPECfp, SPECjbb, SPECweb, SPECjAppServer, SPEC OMP, SPECviewperf, SPECapc, SPEChpc, SPECjvm, SPECmail, SPECimap and SPECsfs are trademarks of the Standard Performance Evaluation Corp (SPEC).The Power Architecture and Power.org wordmarks and the Power and Power.org logos and related marks are trademarks and service marks licensed by Power.org.TPC-C and TPC-H are trademarks of the Transaction Performance Processing Council (TPPC).UNIX is a registered trademark of The Open Group in the United States, other countries or both.
Other company, product and service names may be trademarks or service marks of others.Revised December 2, 2010
Special notices (cont.)
© Copyright IBM Corporation 2014 164