navigating change in crisis using data
TRANSCRIPT

Navigating Change in Crisis Using Data
INF
USE ANALYTICS EVERY
WHERE
NAVIGATING CHANGE IN CRISIS USING DATA 2
Executive Summary
COVID-19 came upon us quickly
and rapidly reshaped our lives,
organizations, and businesses. As
governments shut down cities and
countries, the public and businesses
turned to data for answers. This
sparked a widespread need for trusted
sources of insights to lead the way.
It isn’t the first time society has
experienced a scenario of this kind,
but it is the first time there has been
a worldwide pandemic in a very long
time. Pandemics affect politics, lifestyle,
and families and, of course, create
uncertainty around the economy.
There are lessons to be learned
from those events through a close
evaluation of the data and the impact
of the actual event and the years that
followed. Data, up to this point, was
used primarily in hindsight. Today,
it is used in real time to understand
current situations.
As we step into the post COVID-19
pandemic future, data can guide
and help us navigate our decisions.
Companies will use data to shift
resources, enhance outcomes,
support customers, and find new
efficiencies. Data and analytics will
help navigate the growing uncertainty
and give clear opportunities to collect,
analyze, and act on data—in all three
scenarios of pre-pandemic, present
pandemic and past pandemic.
This whitepaper looks at how data
helps us manage the impact of the
COVID-19 virus on our lives; how data
has always been used to address
public health emergencies; how it has
evolved to deal more rapidly with the
current crisis; and how the newest
data analytics technology can not
only mitigate the impact of the crisis
but can also guide us to find a way
through it and provide future benefits
for data-driven organizations.
Change is already among us.
Accelerating data analytics to navigate
this change is what this whitepaper is
all about.
EXECUTIVE SUMMARY // CHANGING TIMES // HISTORICALLY SPEAKING // ACTIONING DATA // MODERN EXAMPLES // SUMMARY

NAVIGATING CHANGE IN CRISIS USING DATA 3
Changing Times
Data surrounds us
The COVID-19 pandemic started in late
2019 and spread to over 177 countries
by mid-April 2020. Each country
experienced different levels of the
outbreak and implemented shutdowns
depending on the severity and speed
of the outbreak and the public health
response in different locations. Within
a few months, the new coronavirus had
changed the way we live, work, and go
about our daily routines.
On January 22, 2020, a dashboard was
shared with the world.
Professor Lauren Gardner, a civil
and systems engineering professor
at Johns Hopkins University, and her
graduate student, Ensheng Dong,
provided researchers, public health
authorities, and the general public
with a user-friendly tool to track the
outbreak as it unfolded.
For the first time in history, the public
and the world at large turned to data
to help them understand what might
happen next in their lives.
EXECUTIVE SUMMARY // CHANGING TIMES // HISTORICALLY SPEAKING // ACTIONING DATA // MODERN EXAMPLES // SUMMARY
Source: Johns Hopkins Univerisity & Medicine Coronavirus Resource Center

NAVIGATING CHANGE IN CRISIS USING DATA 4
Learning to live with COVID-19 Governments across the world
began to use data more than ever
before to make important policy and
economic decisions. They locked
down cities, closed public areas,
and urged people to stay at home.
Businesses and organizations began
crisis management to assess how
they’d sustain operations without
a clear end in sight. New terms
became commonplace, like numbers
of confirmed cases, daily cases, and
flattening the curve.
Strong public demand for expert
voices arose, as people wanted to
hear from the most trusted sources
of information on the pandemic:
doctors (80%), scientists (79%), and
national health officials (71%).
EXECUTIVE SUMMARY // CHANGING TIMES // HISTORICALLY SPEAKING // ACTIONING DATA // MODERN EXAMPLES // SUMMARY
Source: 2020 Edelman Trust Barometer Spring Update: Trust and the Coronavirus

NAVIGATING CHANGE IN CRISIS USING DATA 5
EXECUTIVE SUMMARY // CHANGING TIMES // HISTORICALLY SPEAKING // ACTIONING DATA // MODERN EXAMPLES // SUMMARY
As such, trusted sources began delivering
clear, factual visualizations that provided
good insight into the pandemic, while
there were many sources of incorrect
information meant to incite fear and
alienate certain parts of the population.
Many people turned to these reliable
sources for information on the spread
of the disease and how to behave.
Infectious disease epidemiologist Trevor
Bedford started adding clear, intelligible
visualizations to his tweets that supported
findings and conveyed the state of the
pandemic to followers worldwide.
Source: Trevor Bedford on Twitter
NAVIGATING CHANGE IN CRISIS USING DATA 6
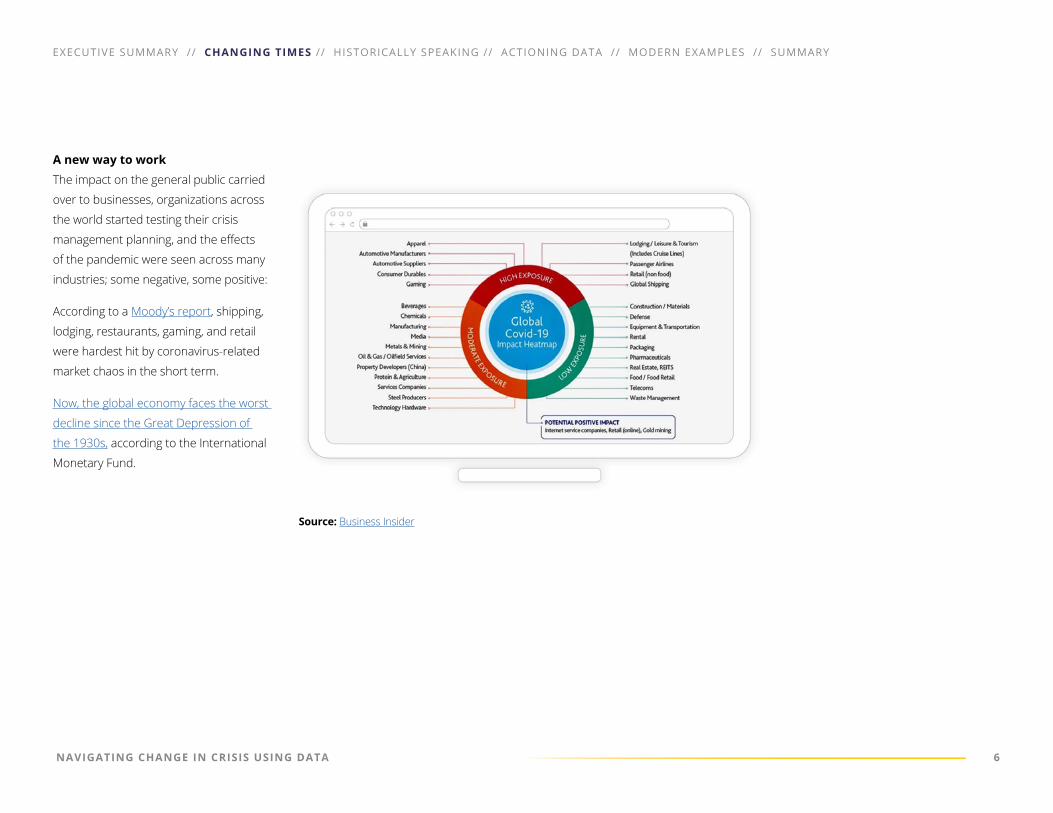
A new way to work
The impact on the general public carried
over to businesses, organizations across
the world started testing their crisis
management planning, and the effects
of the pandemic were seen across many
industries; some negative, some positive:
According to a Moody’s report, shipping,
lodging, restaurants, gaming, and retail
were hardest hit by coronavirus-related
market chaos in the short term.
Now, the global economy faces the worst
decline since the Great Depression of
the 1930s, according to the International
Monetary Fund.
EXECUTIVE SUMMARY // CHANGING TIMES // HISTORICALLY SPEAKING // ACTIONING DATA // MODERN EXAMPLES // SUMMARY
Source: Business Insider

NAVIGATING CHANGE IN CRISIS USING DATA 7
EXECUTIVE SUMMARY // CHANGING TIMES // HISTORICALLY SPEAKING // ACTIONING DATA // MODERN EXAMPLES // SUMMARY
For passenger airlines, the number
of daily flights decreased by 80% in
early 2020 and in some regions, nearly
all passenger traffic was suspended.
Consequently, the industry is in survival
mode. Airlines, airports, and ground-
handling firms are conserving their cash
reserves as their normal revenue streams
have dried up.
On April 21, 2020, the price of US oil turned
negative for the first time in history.
Unemployment claims reached 36 million
in the US alone (in May 2020)—that equals
the net number of jobs created since the
last recession (nine and a half years ago)
and ended with the pandemic’s arrival.
On the positive side: Grocery stores,
packaging, and telecommunications will
survived relatively unscathed, according to
the Moody’s report.
Consumers around the world rushed to
their local grocery stores. From cleaning
supplies and canned goods to the inflated
demand for toilet paper, grocery stores
are responded never-before-seen trends
in consumer behavior.
While consumers bought out stocks of
goods, supermarkets and FMCGs used
data to respond to supply and demand
and to keep a clear picture of how their
business was performing and how aligned
they were with their crisis management
planning.
“In the midst of the COVID-19 pandemic,
maintaining momentum is vital and the art
of decision-making imperative,” said Evan
Castle, head of market intelligence and
strategy at Sisense.
From new regulations to fluctuations
in demand and remote work, business
leaders must face this new economic
reality by addressing three distinct
challenges with clarity: tracking rapidly
changing circumstances, responding to
volatility in both supply and demand, and
maintaining a clear picture of corporate
business performance.
Beyond all of this is the need to
understand how these circumstances
affect our biggest asset of all: people. For
example, in April 2020, The New York
Times reported that 20 million jobs had
been lost in the US in just four weeks.
This number has continued to escalate.
So, from furloughing staff to closing
businesses, from childcare to education,
and from a rise in anxiety about health
to mental well-being issues triggered
by enforced isolation, decisions around
people have remained at the forefront of
the importance of data collection.

NAVIGATING CHANGE IN CRISIS USING DATA 8
EXECUTIVE SUMMARY // CHANGING TIMES // HISTORICALLY SPEAKING // ACTIONING DATA // MODERN EXAMPLES // SUMMARY
”“We have an opportunity to look at the data and to decide the world we want to live and work in, and rebuild it together for the better.”
- GUY LEVY-YURISTAChief Strategy Officer of Sisense

NAVIGATING CHANGE IN CRISIS USING DATA 9
Historically Speaking
Data from the past can chart our future
Disease has plagued humanity since the
earliest days. However, it was not until
the disease reached the agricultural and
farming communities that the scale and
spread increased dramatically.
Data was gathered in order to record
the extent of each disease and, where
possible, examine the conditions
that enabled the diseases to spread,
but this was a slow and painstaking
process. As a result, the data that was
gathered was used to help with a cure
rather than to prevent the spread as it
happened.
Widespread trade created new
opportunities for human and animal
interactions and sped up many
epidemics. Malaria, tuberculosis,
leprosy, influenza, smallpox, and others
first appeared during these early years.
The more civilized humans became, the
more pandemics ocurred.
EXECUTIVE SUMMARY // CHANGING TIMES // HISTORICALLY SPEAKING // ACTIONING DATA // MODERN EXAMPLES // SUMMARY
Source: Visual Capitalist: Visualizing the History of Pandemics

NAVIGATING CHANGE IN CRISIS USING DATA 10
EXECUTIVE SUMMARY // CHANGING TIMES // HISTORICALLY SPEAKING // ACTIONING DATA // MODERN EXAMPLES // SUMMARY
Hindsight is history
One of the first signs of using data to
combat a crisis was in the mid-1800s with
the spread of cholera. Cholera had killed
hundreds of thousands of people across
Europe, Africa, and Asia.
Daily newspaper circulations rose
dramatically using high-speed printing
press technology. This technology allowed
journalists to explore new reporting
techniques, including charting data.
At the time, the chart was so new that
it required four paragraphs to explain
how to read it. People of that era were
simply not used to seeing data in a visual
format. However, the chart was extremely
effective at communicating that cholera
had ravaged New York City over the
summer of 1849.
Data at this level was used in hindsight.
Although considered a technological
advancement, the chart was built on
historical numbers (cases of infection
that had already occurred) and only after
cholera had done its damage to New York
City. The chart could then be used among
professionals to try to understand the
disease and perhaps make changes to
mitigate future breakouts when and if they
occurred. What it couldn’t do is anticipate
future rates of infection under certain
conditions and predict outbreak patterns
under the influence of other variables.
Source: Visual Capitalist: Data Visualization and Cholera: An Unexpected Connection

NAVIGATING CHANGE IN CRISIS USING DATA 11
Looking back
In March 2006, epidemiologist Larry
Brilliant gave a TED Talk about what a
global pandemic would look like and how
it would spread quickly around the world.
In his presentation, he explained the need
for early detection and early response. He
showed how a virus could quickly spread
from one country to another. As such,
the entire world could be infected within
three weeks.
Early detection, early response. That is the
key to preventing a pandemic.
This was not the case with smallpox.
Smallpox, the only virus totally eradicated
from the world, had been around since the
third century BC. The virus spread from
country to country over the centuries with
the growth of civilizations. The basis for
vaccination began in 1796 when British
surgeon Edward Jenner invented the
smallpox vaccine, the world’s first vaccine
against any disease. So why did it take
another 179 years to eradicate this disease
if there was a viable vaccination available?
Finding and isolating the cases of smallpox
was the problem. Data was inconsistent or
not available.
Between 1920 and 1978, the reported
number of smallpox cases was around
11.6 million. It was well known by
authorities that this number was certainly
smaller than the actual number of cases,
although no one knew by how much.
The World Health Assembly was aware
of the underreporting and attempted to
correct it. However, in developing countries
where the disease was the highest, the
public health monitoring system was
dysfunctional, and that led to many
infections and deaths not being recorded.
As such, there was a need to move away
from the general vaccination campaigns
to focusing on actively seeking out cases
and containing outbreaks with quarantine
and vaccination of local people. Using a
surveillance and containment strategy,
teams were equipped with Jeeps and
motorbikes to search villages, markets, and
even houses for cases.
EXECUTIVE SUMMARY // CHANGING TIMES // HISTORICALLY SPEAKING // ACTIONING DATA // MODERN EXAMPLES // SUMMARY

NAVIGATING CHANGE IN CRISIS USING DATA 12
EXECUTIVE SUMMARY // CHANGING TIMES // HISTORICALLY SPEAKING // ACTIONING DATA // MODERN EXAMPLES // SUMMARY
A “smallpox detective” interviews a child while following the trail of infection and outbreak, Ethiopia, 1972.Source: World Health Organization: The Smallpox Eradication Programme – SEP (1966-1980)
NAVIGATING CHANGE IN CRISIS USING DATA 13
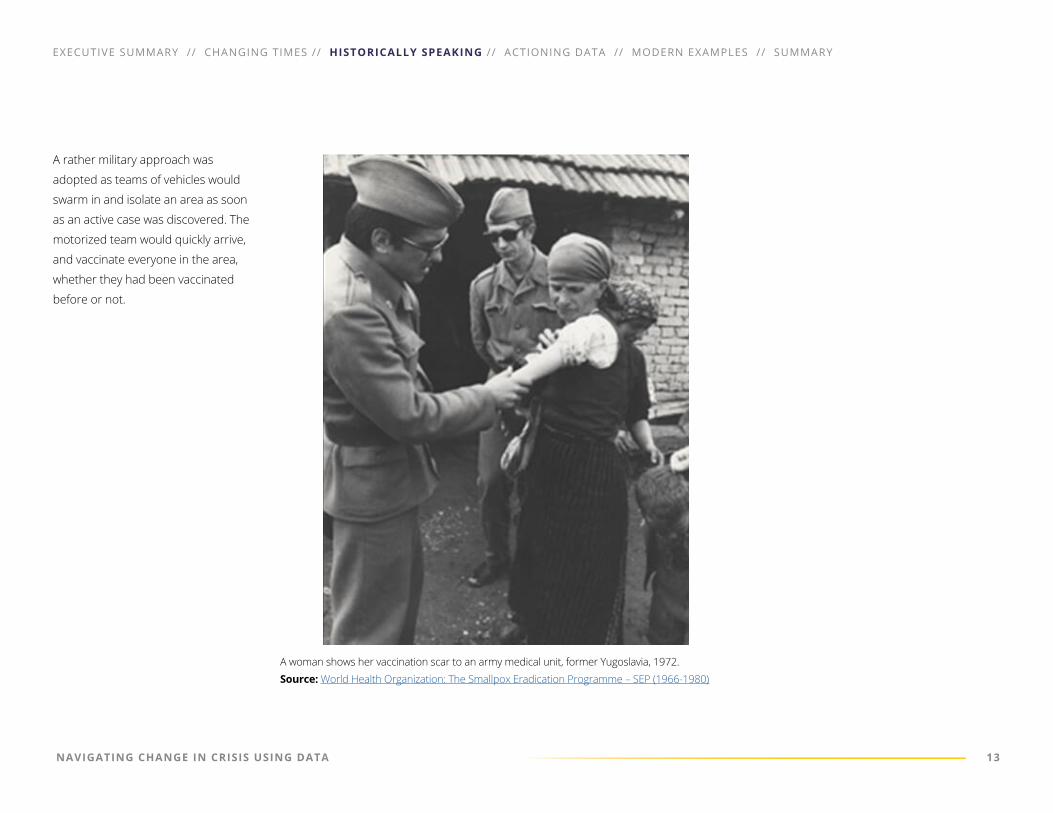
A rather military approach was
adopted as teams of vehicles would
swarm in and isolate an area as soon
as an active case was discovered. The
motorized team would quickly arrive,
and vaccinate everyone in the area,
whether they had been vaccinated
before or not.
EXECUTIVE SUMMARY // CHANGING TIMES // HISTORICALLY SPEAKING // ACTIONING DATA // MODERN EXAMPLES // SUMMARY
A woman shows her vaccination scar to an army medical unit, former Yugoslavia, 1972.Source: World Health Organization: The Smallpox Eradication Programme – SEP (1966-1980)

NAVIGATING CHANGE IN CRISIS USING DATA 14
This door-to-door approach was followed
in South America, Asia, and Africa, the last
remaining countries to finally eradicate
the disease.
In late 1975, according to the CDC, the last
person in Asia to have active smallpox was
isolated. Guards were posted at her home
24 hours a day until she was no longer
infectious. A house-to-house vaccination
campaign within a 1.5-mile radius of her
home began immediately. Members of
the Smallpox Eradication Program team
visited every house, public meeting area,
school, and healer within 5 miles to
ensure the illness did not spread.
EXECUTIVE SUMMARY // CHANGING TIMES // HISTORICALLY SPEAKING // ACTIONING DATA // MODERN EXAMPLES // SUMMARY
Source: Centers for Disease Control and Prevention: Global Smallpox Eradication Map

NAVIGATING CHANGE IN CRISIS USING DATA 15
Essential work must continue
Over the centuries, no matter what the
disease, there was still an essential need
for work to continue.
Power utilities, the food service industry,
and health care organizations cannot stop
their work or allow their workers to work
from home. In general, these teams have
devised a system under which essential
personnel remain working because these
jobs are critical to society. However, the
people doing these jobs could also get
infected by or infect their coworkers,
which could be disastrous and force
companies to shut down completely.
These organizations have emergency
protocols that are practiced and put
into place to address these situations.
Businesses must mitigate the effects
of the pandemic while simultaneously
allowing the operations which support
essential functions to continue.
When dealing with a virus that grows
exponentially, a two-week or two-month
head start makes a difference in the
spread of cases. And even when a
pandemic situation is announced, there
will still be a need for each and every city/
country to continue certain operations. So,
essential workers must continue to work,
even when they face high health risks.
For instance, in 2015, the WHO released a
report that found that, depending on their
role, health workers were up to 32 times
more likely to be infected with Ebola than
adults in the general population.
The question remains: How can
organizations mitigate the circumstances
of spreading disease when employees
have social networks outside of work
environments such as family, friends,
clubs, schools, and the like?
Later on, we discuss how data can help
mitigate the spread while remaining open
for business.
EXECUTIVE SUMMARY // CHANGING TIMES // HISTORICALLY SPEAKING // ACTIONING DATA // MODERN EXAMPLES // SUMMARY

NAVIGATING CHANGE IN CRISIS USING DATA 16
Actioning Data
Using data to make decisions Reliable data helps promote
responsible decision-making in
workplaces and communities around
the world. It influences legislative
action around international travel,
the provision of emergency medical
resources, the bolstering of financial
markets, support for small business
owners and proprietors, and
medicine and treatment for those
who are infected.
Here are a couple of significant
examples that show how data and
analytics, AI, and machine learning
are helping.
The Global Public Health Intelligence
Network (GPHIN) uses a secure,
Internet-based, multilingual early-
warning tool that continuously
searches global media sources such
as news wires and websites to identify
information about disease outbreaks.
The goal is to use leading-edge
communications technology
and automated processes on a real-
time, 24/7 basis, complemented by
human analysis to monitor media
sources worldwide.
According to the WHO, GPHIN is
one of the most important sources
of informal information related to
outbreaks. More than 60% of the
initial outbreak reports come from
unofficial informal sources, including
sources other than the electronic
media, which require verification.
In the throes of the 2008 economic
recession, British Airways cut costs
across the organization. One area
they refused to cut, however, was
their business intelligence program.
British Airways claimed that
continued investment in analytics
during the crisis was a critical factor
in streamlining marketing activities
and thwarting fraudulent bookings
when their business was especially
fragile. They understood the need
to maintain momentum in their
analytics program in the face of an
overwhelming crisis.
EXECUTIVE SUMMARY // CHANGING TIMES // HISTORICALLY SPEAKING // ACTIONING DATA // MODERN EXAMPLES // SUMMARY

NAVIGATING CHANGE IN CRISIS USING DATA 17
EXECUTIVE SUMMARY // CHANGING TIMES // HISTORICALLY SPEAKING // ACTIONING DATA // MODERN EXAMPLES // SUMMARY
Using AI to chart a new path In 2018, HealthITAnalytics released an
article based on studies that show how
data analytics can provide valuable insight
into reducing hospital-acquired conditions.
Health care providers can react quicker
and identify possible deterioration even
before symptoms are detected by the
naked eye by using data analytics to help
flag changes in a patient’s vitals.
Machine learning strategies are
predicting clinical events in the hospital,
such as the development of an acute
kidney injury or sepsis.
At the University of Pennsylvania, a study
using predictive analytics and Electronic
Health Care data identified patients
headed for severe sepsis or shock 12
hours before the onset of the illness.
A separate study at Huntsville Hospital in
Alabama found that combining predictive
analytics and clinical decision support
tools could identify instances of sepsis
and help reduce sepsis mortality. This
analytics-driven strategy showed clear
improvements over the previous electronic
surveillance systems.
Big Data analytics techniques are also
being used to track and control the novel
coronavirus. Researchers have been using
data to expose the nature of the virus—
who is more affected, what measures can
help reduce the spread, and where the
disease will likely go next.
James Hendler, the Tetherless World
Professor of Computer, Web, and Cognitive
Science at Rensselaer Polytechnic Institute
(RPI) and director of the Rensselaer
Institute for Data Exploration and
Applications (IDEA), told HealthITAnalytics:
”“Between recognizing signs and symptoms, tracking the virus, and monitoring the availability of hospital resources, researchers are dealing with enormous amounts of information – too much for humans to comprehend and analyze on their own. It’s a situation that is seemingly tailor-made for advanced analytics technologies.”

NAVIGATING CHANGE IN CRISIS USING DATA 18
Living through it with data at your side
Households and families are also using
this data to prepare for the nuances of
everyday life that will change as a result
of this virus, whether it be securing a
paycheck, buying groceries and essentials,
playing with their kids, inviting the
neighbors over for a barbecue, or walking
the dog.
Johns Hopkins University’s Coronavirus
Resource Center was created to track
critical data for decision-making. Critical
trends are displayed in up-to-date visuals
that give context to the data collected on
Johns Hopkins University’s COVID-19 map.
EXECUTIVE SUMMARY // CHANGING TIMES // HISTORICALLY SPEAKING // ACTIONING DATA // MODERN EXAMPLES // SUMMARY
Source: Johns Hopkins University & Medicine Coronavirus Resource Center: Maps & Trends
NAVIGATING CHANGE IN CRISIS USING DATA 19
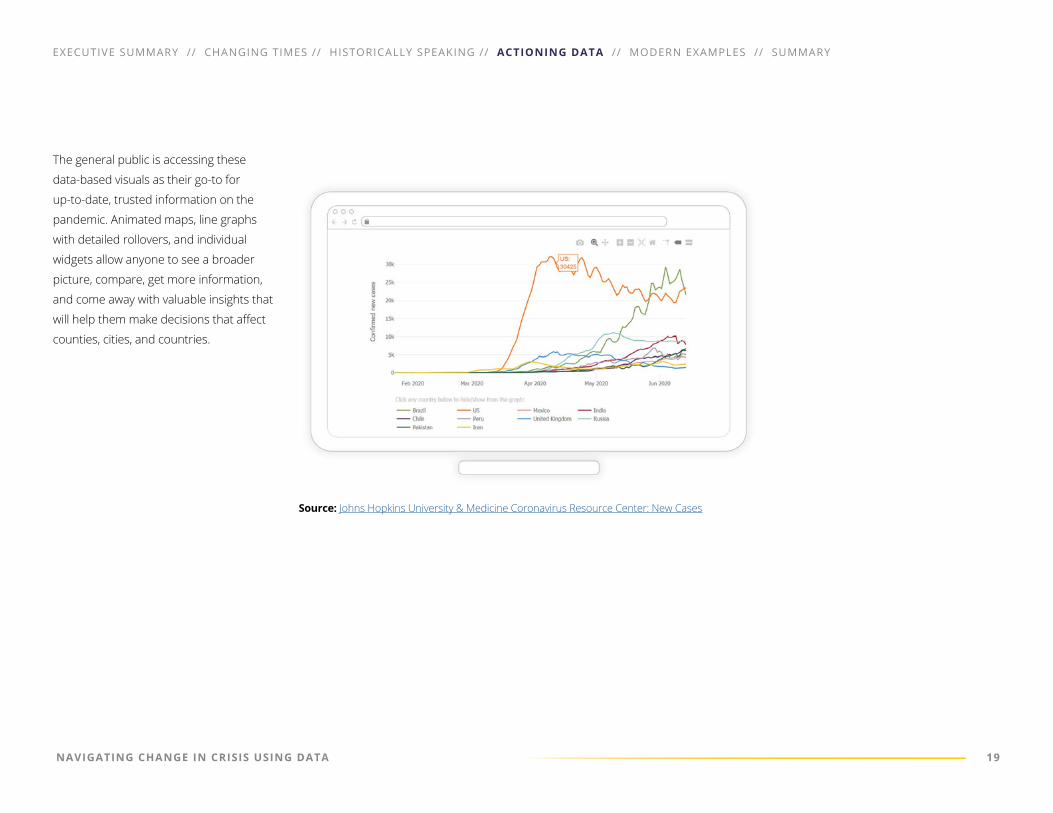
The general public is accessing these
data-based visuals as their go-to for
up-to-date, trusted information on the
pandemic. Animated maps, line graphs
with detailed rollovers, and individual
widgets allow anyone to see a broader
picture, compare, get more information,
and come away with valuable insights that
will help them make decisions that affect
counties, cities, and countries.
EXECUTIVE SUMMARY // CHANGING TIMES // HISTORICALLY SPEAKING // ACTIONING DATA // MODERN EXAMPLES // SUMMARY
Source: Johns Hopkins University & Medicine Coronavirus Resource Center: New Cases

NAVIGATING CHANGE IN CRISIS USING DATA 20
We all know how to read a chart and
determine for ourselves what the
next action should be. Now is the
time to apply the full force of business
intelligence used by data analytics
teams to help navigate the growing
uncertainty.
EXECUTIVE SUMMARY // CHANGING TIMES // HISTORICALLY SPEAKING // ACTIONING DATA // MODERN EXAMPLES // SUMMARY
Source: Johns Hopkins University & Medicine Coronavirus Resource Center: New Cases

NAVIGATING CHANGE IN CRISIS USING DATA 21
Modern Examples of How Data is Helping
EXECUTIVE SUMMARY // CHANGING TIMES // HISTORICALLY SPEAKING // ACTIONING DATA // MODERN EXAMPLES // SUMMARY
Businesses that use data are winning
Nearly every pandemic is first
approached with denial and doubt.
Data visualizations from reliable
sources of data can bring a single
source of truth to the public, wiping
away doubt and minimizing the
response time that is so critical in
lessening the impact of a crisis.
As part of its efforts to address the
challenge of the coronavirus, the UK
government announced that its National
Health Service (NHS) struck the first deal
of its kind with the private hospital sector
to increase the capacity of health care
across England with 8,000 new hospital
beds, 1,200 almost-new ventilators, and
over 10,000 additional nurses (including
more than 700 doctors and over 8,000
other clinical staff).
This huge project will involve real-time
data flowing through dashboards to
better understand the data that could
help solve the crisis and lead toward
better crisis management.
In the midst of the COVID-19 crisis,
maintaining momentum is vital and
the art of decision-making imperative.
Now is the time to apply the full
force of business intelligence used
by analytics teams to help navigate
growing uncertainty. Four clear
opportunities are ripe to collect,
analyze, and act on data:
1. Maximize revenues: Identify
drivers to increase sales by evaluating
existing customers and processes.
2. Drive efficiencies: Identify
underperforming departments
and programs and determine
where to reduce expenses. Use
analytics to correlate and compare
your operations, performance
management, and financial analysis.
3. Collaborate with others: Identify departments and programs
that are under strain and divert
skills and resources from better
resourced and less stretched
areas to collaborate with other
departments under pressure.
4. Predict outcomes: Lastly, look
to forecast trends in supply and
demand and track fast-moving
changes in leading indicators.
The health care sector is facing a
global challenge as it attempts to
identify a cure for the COVID-19
virus and optimize resources for
those already infected. It requires an
unprecedented collaborative effort,
and importantly, data is at the heart of
the solution.
UK health care provider Res Consortium
used Sisense technology to map the
spread of the virus across the country on
a dashboard.
It provides service capacity planners
at both local and regional NHS
clinical commissioning groups with
the information they need to target
resources to areas where the outbreak
becomes more severe or where there
is a higher density of at-risk patients.

NAVIGATING CHANGE IN CRISIS USING DATA 22
EXECUTIVE SUMMARY // CHANGING TIMES // HISTORICALLY SPEAKING // ACTIONING DATA // MODERN EXAMPLES // SUMMARY
The Res Consortium team has analyzed
local cases and the population
characteristics of those areas to model the
relative expected number of cases at local
levels. It has applied the data on the age
and health of these populations to adjust
for the disease impact at these levels.
It shows the areas that could use more
support as the number of cases increases.
“The beauty of the dashboard is that it
builds all elements together, and we can
dynamically adjust for the change in factors,”
said Director of Resconsortium Michael
Stedman. “The speed at which we can work
through the process of data management
to publication enables us to adjust to
local conditions and needs exactly as they
change, which is a critical consideration in
this fast-moving environment.”
As we’ve seen, the ability to collaborate
and to use dashboards as a way to do
this is a skill that is quickly evolving within
the pandemic.
Source: Res Consortium Dashboard COVID-19
NAVIGATING CHANGE IN CRISIS USING DATA 23
EXECUTIVE SUMMARY // CHANGING TIMES // HISTORICALLY SPEAKING // ACTIONING DATA // MODERN EXAMPLES // SUMMARY
Rapid response and rapid detection through AI Social Network Analysis is a modern
way to fight the spread of COVID-19
using data. By using this type of analysis,
businesses can maintain their presence
at work while being ready to mitigate
circumstances when an infectious case is
detected.
These social networks stem from the
mathematicians and not from the online
social media networks. They can be
used to curb the spread of coronavirus
while working through the crisis.
These graphs are a representation of
entities (each is assigned to a node) and
their relationships (each relationship is
represented by a line between two nodes).
There are a lot of theoretical studies about
these graphs and they can be applied to
solve many problems (classic examples
are transportation problems), but here,
our focus is on a very specific type of
graph: those which connect people, and
they are often associated with the study
of social matters. So for our purposes,
social networks are graphs whose nodes
represent people and lines represent
relationships between people.
The graphs will contain as much
information as possible and allow the
company to make informed decisions.

NAVIGATING CHANGE IN CRISIS USING DATA 24
EXECUTIVE SUMMARY // CHANGING TIMES // HISTORICALLY SPEAKING // ACTIONING DATA // MODERN EXAMPLES // SUMMARY
Automate, track, and predict positive outcomes
Premium Retail uses analytics to enable
leading brands to measure sales
performance, observe trends, and track
execution. With a solid data strategy, the
team is able to tie together retail data and
sales performance, analyzing billions of
rows of data from nearly a dozen different
retail data sources.
Best of all, data preparation is 70%
automated. Access to a unified
performance picture enables their
retail customers to make near-real-time
decisions on product placements, ensure
compliance, and benchmark performance
against stores and competitors.
RetailZoom is a consultancy that helps
supermarkets and FMCG companies
in Cyprus unlock their data to reveal
patterns and forecast future performance.
Its team of data scientists supplies
its customers with predictive models
that incorporate transactional and
demographic data to determine the size
and scope of promotional activities.
Constantinos Mavrommatis is the chief
data scientist at RetailZoom. As the crisis
unfolds, he and his team are watching the
retail industry’s response closely. And in
a fast-moving environment, keeping an
eye on changing circumstances is vital
to managing your business through the
evolution of the pandemic.
“We’re watching in real time as our
clients’ use of dashboards is shifting,”
says Constantinos. RetailZoom’s clients
are equipped with dashboards that spot
atypical behavior on a daily and weekly
basis, but until February, usage of these
dashboards was low. That’s the beauty
of building analytics into your business
continuity plan. When things start swinging
outside of the ordinary, a well-modeled
anomaly dashboard is a key to ensuring a
timely response.
Source: Sisense: The Data Behind: Retail Analytics in Times of Crisis
NAVIGATING CHANGE IN CRISIS USING DATA 25
Summary
EXECUTIVE SUMMARY // CHANGING TIMES // HISTORICALLY SPEAKING // ACTIONING DATA // MODERN EXAMPLES // SUMMARY
Countries and communities around
the world are coming together as
one to fight this global pandemic.
The ammunition we have to fight this
war is data. Data is available to us to
analyze and predict and quickly react
to the forces around us. Data-driven decision-making is more important than ever
The decisions we make today will
profoundly impact tomorrow for us,
our children, and grandchildren.
Our goal is to provide ideas around
what a better future could look like.
Data will be at the core of each of
these stories because that is what is
needed, and it is what we do best.
The right data is free from political
bias or gut feel; it’s something that
is indisputable.
We hope you lean into the future with
us because we plan to push the limits
of what we know about the ebbs and
flows of the COVID-19 virus and beyond
that, lay a pathway to what’s next. The
future will be about a new purpose and
a complete pivot that will be driven by
analytics that empower the builders of
tomorrow. We will each get to define
our future.
The virus knows no boundaries. All
of us must work together as a global
community to conquer this pandemic.
Data will help us identify the targets,
react much faster than before, and
rebuild the world into a safe place for
work and life.
Now, more than ever, data will be
the driver of change that ensures the
decisions we make today will create
benefits in the future.
Start free trial

Copyright © 2021 Sisense Inc. All rights reserved.
1359 Broadway, 4th Floor, New York, NY, 10018, United States
This document may not, in whole or in part, be copied, photocopied, reproduced, translated, or reduced to any electronic medium or machine-readable form without prior consent in writing from Sisense, Inc.
TRADEMARKS
Sisense and the Sisense logo are trademarks of Sisense, Inc. in the United States and certain other jurisdictions.
Sisense, Inc. also uses numerous other registered and unregistered trademarks to identify its goods and services worldwide. All other marks used herein are the trademarks of their respective owners, and Sisense, Inc. claims no ownership in such marks.
Sisense.com