naval research laboratory 2012 nrl review n a v a l
TRANSCRIPT

2012 NRL REVIEW
www.nrl.navy.mil
N A V A L R E S E A R C H L A B O R A T O R Y Washington, DC
2012
NRL R
EVIE
W2012 N
RL R
EV
IEW
Na
VaL R
Es
Ea
Rc
h La
bo
Ra
toR
y
Building a workforce and assembling scientific tools for the future.

General information on the research described in this NRL Review can be obtained from the Public Affairs Office, Code 1030, (202) 767-2541. Information concerning Technology Transfer is available from the Technology Transfer Office, Code 1004, (202) 767-7230. Sources of information on the various educational programs at NRL are listed in the NRL Review chapter entitled “Programs for Professional Development.”
For additional information about NRL, the NRL Fact Book lists the organizations and key personnel for each division. It contains information about Laboratory funding, programs, and field sites. The Fact Book can be obtained from the Technical Information Services Branch, Code 3430, (202) 404-4963. The web-based NRL Major Facilities publication, which describes each NRL facility in detail, can be accessed at http://www.nrl.navy.mil.
Approved for public release; distribution is unlimited.
REVIEWED AND APPROVEDNRL/PU/3430--13-560
RN: 13-1231-2584August 2013
Anthony J. Ferrari, Captain, USNCommanding Officer
Senior Science editorJohn D. Bultman
coordinatorJonna Atkinson
conSultantKathy Parrish
deSign, layout, and graphic SupportJonna Atkinson
editorial aSSiStanceSaul Oresky
Kathy Parrish Claire Peachey
photographic productionJamie HartmanJames Marshall Gayle Fullerton
NRL Review Staff
to conduct a broadly based multidisciplinary program of scientific research and advanced
technological development directed toward maritime applications of new and improved materials, techniques, equipment, systems, and ocean, atmospheric, and space sciences and related technologies.
The Naval Research Laboratory provides primary in-house research for the physical, engineering, space, and environmental sciences; broadly based applied research and advanced technology development programs in response to identified and anticipated Navy and Marine Corps needs; broad multidisciplinary support to the Naval Warfare Centers; and space and space systems technology, development, and support.
N R L ’ s M I S S I O N
director oF reSearch Dr. John A. Montgomery
coMManding oFFicer CAPT Anthony J. Ferrari, USN

contents | 2012 NRL REVIEW i
NRL'S INVOLVED! 2 Our People Make a Big Difference 7 NRL's Laboratory for Autonomous Systems Research Open
for Business 12 TacSat-4 Lifts Off: Augmenting SATCOM and Advancing
Operationally Responsive Space 14 Navy's Electromagnetic Railgun Reaches Testing Milestone
thE NaVaL RESEaRch LabORatORy 18 NRL – Our Heritage 19 Highlights of NRL Research in 2011 31 NRL Today
fEatuRED RESEaRch 78 Friend or Foe? How Do You Say It? Shibboleth: Phonological Analysis of Non-
Native Speakers of English 85 Staring Down the Barrel of a Railgun... Electromagnetic Railgun Barrel Damage Experiments 96 Viewing Living Mammalian Cells and Life Processes —
In Living Color, Courtesy of Quantum Dots Spatiotemporal Multicolor Labeling of Mammalian Cells:
Quantum Dots Extend the Utility of Fluorescent Techniques in Biology
103 Herschel Offers a Front-Row Seat to the Merging of Galaxies in the Cold and Dusty Universe
Terahertz Astrophysics with the Herschel Space Observatory112 Finding Oceanic Hot Spots Oceanic Hot Spots — Internal Tides in the Global Ocean122 Using Hi-res Acoustics to VAMP Up Better Estimates of
Methane Hydrate Concentrations Deep-Water Acoustic Anomalies from Methane Hydrate in the
Bering Sea131 Winds at the Edge of Space Wind at the Top of the Atmosphere
ON thE cOVER
contents 2012 NRL Review
Infrared fiberBlossom Point, Maryland Space Physics Simulation Chamber
Semiconductor nanocrystals Fermi team in front of the calorimeter model
RESEaRch aRtIcLESacoustics142 Tailoring Underwater Laser Acoustic Pulses144 Analysis of the Elasticity of Fibrous Brain Structures Using Sound146 Acoustic Array Performance and Ship Radiated Noise Source
Level Estimation in Shallow Waters148 Nonlinear Poroacoustics: From Kinks to Shocks
atmospheric science and technology152 Real-Time Prediction of Tropical Cyclone Intensity Using
COAMPS-TC154 Cirrus Cloud Seeding by Stratospheric Volcanic Aerosol Particles156 Merging Geographic Information Systems Technologies with
Environmental Prediction
chemical/biochemical research160 Laser Trace Vaporization of Explosives161 Heat Sensitization Effects in Aluminum Ship Structure Alloys164 Biosensor Triage for Traumatic Brain Injury
electronics and electromagnetics168 High-Resolution Widesweep Backscatter Ionograms170 Real-Time Electronic Attack (EA) Effectiveness Monitoring172 Diamond for Thermal Management in Power Electronics
information technology and communications176 Estimating Population Attitudes with CogSim177 Maritime Threat Detection179 NRL Flight Tests Autonomous Multi-Target, Multi-User
Tracking Capability
materials science and technology184 Biosensing with a Graphene-Based FET186 Silicon Spintronics at 500 K188 Poro-Vascular Composites190 Low-Cost Processing of Titanium and its Alloys

ii 2012 NRL REVIEW | contents
nanoscience technology194 Trace Vapor Detection with Vertical Silicon Nanowire Arrays195 Ultrafast Optical Control of Entangled Spins197 Enhanced Multiple Exciton Generation in Semiconductor
Nanorods199 Engineering Graphene Mechanics
ocean science and technology204 Bio-Inspired Locomotion for Unmanned Underwater Vehicles206 Extending Optical Visibility Prediction Range with the Help
of Acoustics208 Tomographic Particle Image Velocimetry of Bottom Boundary
Layer Processes210 Rapid Autonomous Fuel Transfer for USVs
optical sciences214 Long Range Automated Hyperspectral Target Detection215 Full Element Simulator/Stimulator for the Virginia Class LWWAA
Sonar System217 Broadband Supercontinuum Generation
remote sensing222 Intense Pulsed Active Detection of Fissile Materials224 Missile Tracking and Range Safety
simulation, computing, and modeling228 Human Eye Simulation229 Towed Antiship Cruise Missile Simulator
space research and satellite technology232 Fermi Finds More Than 100 Gamma-Ray Pulsars233 Blossom Point Tracking Facility — A Unique NRL Asset236 Orbit and Mission Design for the TacSat-4 Satellite240 Autonomous Release of a Snagged Solar Array
SpEcIaL aWaRDS aND REcOgNItION244 Special Awards and Recognition258 Alan Berman Research Publication and NRL Edison (Patent)
Awards262 NRC/ASEE Postdoctoral Research Publication Awards
pROgRamS fOR pROfESSIONaL DEVELOpmENt264 Programs for NRL Employees — Graduate Programs, Continuing
Education, Professional Development, Equal Employment Opportunity (EEO) Programs, and Other Activities
266 Programs for Non-NRL Employees — Postdoctoral Research Associateships, Faculty Member Programs, Professional Appointments, and Student Programs
268 Employment Opportunities
gENERaL INfORmatION270 Technical Output271 Key Personnel272 Contributions by Divisions, Laboratories, and Departments275 Subject Index278 Author Index279 Map/Quick Reference Telephone Numbers
contents2012 NRL Review
7
12
14

NRL’s
Invo
lved! 2
Our People Make a Big Difference
7 NRL’s Laboratory for Autonomous Systems Research Open for Business
12TacSat-4 Lifts Off:
Augmenting SATCOM and Advancing Operationally Responsive Space
14Navy’s Electromagnetic Railgun Reaches Testing MilestoneAn NRL scientist An NRL Scientist o
An employee of the Information Technology Division created a model of the Laboratory for Autonomous Systems Research from Legos. It took him approximately 120 hours, working a few evenings a week, over the course of three months to build the model.

7nrl’s involved! | 2012 NRL REVIEW
NRL’s
LABORATORY FOR AUTONOMOUS SYSTEMS RESEARCH
LABO
RATO
RY FO
R AUTONOMOUS SYSTEMS RESEARCH
• WASHINGTON, D.C. •
Open fOr Business!

8 2012 NRL REVIEW | nrl’s involved!
THE NAVAL RESEARCH LABORATORY in Washington,
D.C., opened the Laboratory for Autonomous Systems Research
(LASR) in 2012. This new laboratory will become a nerve center for
autonomy research for the Navy and Marine Corps. The one-of-a-kind
laboratory provides specialized facilities to support highly innovative
research in intelligent autonomy, sensor systems, power and energy
systems, human–system interaction, networking and communications,
and platforms. The LASR capitalizes on the broad multidisciplinary
character of NRL, bringing together scientists and engineers from
diverse backgrounds to tackle common challenges in autonomy
research at the intersection of their respective fields. The objective
of the LASR is to enable continued Navy and Department of Defense
scientific leadership in autonomy and to identify opportunities for
advances in future defense technology.
GROUNDBREAKING April 8, 2010
RIBBON CUTTING & DEDICATION March 16, 2012
NRL held a groundbreaking ceremony on April 8, 2010, to mark the start of construction of a major new facility: the Laboratory for Autonomous Systems Research.
NRL cut the ribbon on its Laboratory for Autonomous Systems Research (LASR) on March 16, 2012. Left to right, Dr. John Montgomery, NRL’s Director of Research; Dr. John P. Holdren, Director of the White House Office of Science and Technology Policy; CAPT Paul Stewart, NRL’s Commanding Officer; Alan Schultz, Director of LASR; and RADM Matthew Klunder, Chief of Naval Research.
▲ ▲
8 2012 NRL REVIEW | nrl’s involved!

9nrl’s involved! | 2012 NRL REVIEW
LASR DEDICATION AND TOURSMARCH 16, 2012
10 2012 NRL REVIEW | nrl’s involved!
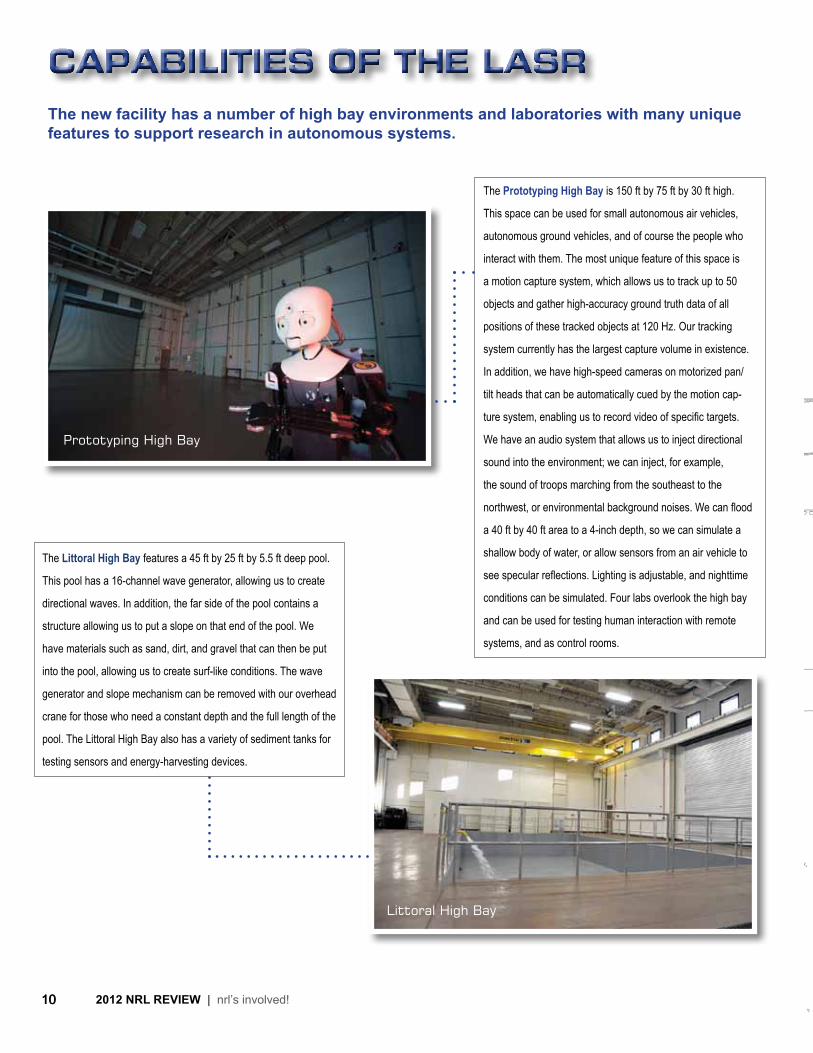
CAPABILITIES OF THE LASRThe new facility has a number of high bay environments and laboratories with many unique features to support research in autonomous systems.
Littoral High Bay
The Littoral High Bay features a 45 ft by 25 ft by 5.5 ft deep pool.
This pool has a 16-channel wave generator, allowing us to create
directional waves. In addition, the far side of the pool contains a
structure allowing us to put a slope on that end of the pool. We
have materials such as sand, dirt, and gravel that can then be put
into the pool, allowing us to create surf-like conditions. The wave
generator and slope mechanism can be removed with our overhead
crane for those who need a constant depth and the full length of the
pool. The Littoral High Bay also has a variety of sediment tanks for
testing sensors and energy-harvesting devices.
The Prototyping High Bay is 150 ft by 75 ft by 30 ft high.
This space can be used for small autonomous air vehicles,
autonomous ground vehicles, and of course the people who
interact with them. The most unique feature of this space is
a motion capture system, which allows us to track up to 50
objects and gather high-accuracy ground truth data of all
positions of these tracked objects at 120 Hz. Our tracking
system currently has the largest capture volume in existence.
In addition, we have high-speed cameras on motorized pan/
tilt heads that can be automatically cued by the motion cap-
ture system, enabling us to record video of specific targets.
We have an audio system that allows us to inject directional
sound into the environment; we can inject, for example,
the sound of troops marching from the southeast to the
northwest, or environmental background noises. We can flood
a 40 ft by 40 ft area to a 4-inch depth, so we can simulate a
shallow body of water, or allow sensors from an air vehicle to
see specular reflections. Lighting is adjustable, and nighttime
conditions can be simulated. Four labs overlook the high bay
and can be used for testing human interaction with remote
systems, and as control rooms.
Prototyping High Bay
10

11nrl’s involved! | 2012 NRL REVIEW 112012 NRL REVIEW | nrl’s involved!
The Desert High Bay contains a 40 ft by 14 ft area of sand 2 ft deep,
and contains 18 ft high rock walls that allow testing of robots and sen-
sors in a desert-like environment. We can introduce blowing sand, and
can control the lighting in that environment.
The Tropical High Bay is a 60 ft by 40 ft greenhouse that contains a
re-creation of a southeast Asian rain forest, with temperatures that aver-
age 80 degrees and 80 percent humidity year round. Rain events of up
to 6 inches per hour can be generated, allowing us to test autonomous
systems, sensors, and communications in these harsh environments.
Desert High Bay
We have specialized laboratories for human–systems interaction, sensors, and power and en-ergy. The four human–systems interaction labs overlook the Prototyping High Bay and can be used, as described earlier, as control rooms for human-subject experiments, or for development of autonomy software. These labs contain eye trackers (useful for studying how people work with advanced inter-faces for autonomous systems) and multi-user/multi-touch displays. The sensor lab contains environ-mental chambers (including a smaller chamber where temperature, humidity, and barometric pressure can be controlled and a large walk-in chamber with control of temperature and humidity), an anechoic chamber, and an aerosol test facility.
Tropical High Bay

12 2012 NRL REVIEW | nrl’s involved!
Against the backdrop of a glowing morn-ing sky, the TacSat-4 tactical satellite, carrying an experimental communica-
tions payload developed by the Naval Research Laboratory (NRL), successfully launched Septem-ber 27, 2011, aboard an Orbital Sciences Mino-taur IV+ launch vehicle from the Alaska Aero-space Corporation’s Kodiak Launch Complex, Kodiak Island, Alaska. Six days after launch, the spacecraft com-pleted the final orbital maneuver burn that placed it into its orbit of 12,000 × 750 km. Well into the checkout phase now, major payload components are fully functional including the 12-foot “umbrella-like” ultra high frequency (UHF) antenna and the advanced thermal loop heat pipe system. Radio frequency (RF) tones have been sent through all 10 UHF channels, the X-band downlink is verified, and both voice and data have been transmitted between user radios via the satellite. TacSat-4 is a Navy-led joint mission to test advances in UHF satellite communication (SAT-COM) technologies, and ultimately to augment the existing SATCOM fleet. The spacecraft pro-vides 10 UHF channels that can be used for any
combination of communication, data transfer, and friendly force tracking. Notably, TacSat-4 supports communications-on-the-move, even to handheld and manpack radios, without the need to stop and point an antenna toward the satellite – an activ-ity that is impractical when on the move and can prove dangerous on the battlefield. “TacSat-4 supports a critical warfighting requirement: communication,” said Chief of Naval Research Rear Adm. Nevin Carr. “We’ve devel-oped a technology that will supplement traditional satellites, giving military personnel on the ground another outlet for data transmission and facilitat-ing ‘comms on the move.’” TacSat-4’s highly elliptical orbit (HEO) pro-vides near-global, but not continuous, coverage including the high latitudes and mountainous areas where geosynchronous SATCOM might not be accessible. HEO brings the satellite higher (as you look up) in the sky than a geosynchronous satellite, allowing troops to communicate from obscured regions, such as mountainous terrain, which can be problematic today. TacSat-4 also advances Operationally Re-sponsive Space (ORS) development areas includ-
TacSat-4 lifts off:
augmenting satcom and advancing operationally
responsive space
(Photo Credit: U.S. Navy/John F. Williams)
(Article reprinted from the Fall 2011 issue of Spectra, the Naval Research Laboratory’s science and technology magazine.)

13nrl’s involved! | 2012 NRL REVIEW
ing spacecraft bus standards, long-dwell orbits, increased launch capability, automated ground operations, and net-centric operations. The Naval Research Laboratory Blossom Point Satellite Tracking and Command Facility provides the command and control for TacSat-4, and NRL maintains its user Virtual Mission Opera-tions Center (VMOC) tasking system, allowing dy-namic reallocation to different theaters worldwide and enabling rapid SATCOM augmentation when unexpected operations or natural events occur. If TacSat-4 military utility is confirmed during the first year of flight operations, operations will be extended, and follow-on acquisition of one to four spacecraft will be considered. This would allow the military to achieve the benefits of a combined HEO and geosynchronous orbit constellation and would provide 24-hour coverage in multiple regions simultaneously. TacSat-4 is managed by NRL’s Naval Center for Space Technology and is NRL’s 100th satellite. The Office of Naval Research (ONR) sponsored development of the payload and funds the first year of operations. The Operationally Responsive
Space Office funded the launch, performed by the Air Force Space and Missile Systems Center (SMC). The TacSat-4 prototype standardized space-craft bus was built by NRL and Johns Hopkins University Applied Physics Laboratory (APL) to mature ORS bus standards. It was developed by an Integrated (government and industry) Sys-tem Engineering Team, the “ISET Team,” with active representation from AeroAstro, Air Force Research Laboratory, Johns Hopkins University APL, ATK Space, Ball Aerospace and Technolo-gies, Boeing, Design Net Engineering, General Dynamics AIS, Microcosm, Microsat Systems Inc., Massachusetts Institute of Technology Lincoln Laboratory, Orbital Sciences, NRL, SMC, Space System Loral, and Raytheon. The bus was funded by the Office of the Director of Defense Research and Engineering (DDR&E).
™
TacSat-4’s “COMMx”payload with 12-foot
“umbrella-like”antenna.
The Minotaur IV+ launch vehicle with TacSat-4 payload awaits ignition on the platform at Kodiak Launch
Complex, Kodiak Island, Alaska. (Credit: U.S. Navy/John F. Williams)
The Naval Research Laboratory Blossom Point Satellite Tracking and Command Facility provides
the command and control for TacSat-4.

14 2012 NRL REVIEW | nrl’s involved!
The Naval Research Laboratory Materials Testing Facility demonstrated on October 31, 2011, the
one-thousandth successful firing of its electromagnetic railgun, reaching a materials testing milestone in the weapon’s technological development and future implementation aboard U.S. Navy warships.
“This test demonstrates continued advances in armature development, rail design, and barrel materials used in high power railgun launch,” said Dr. Robert Meger, head of the NRL Charged Particle Physics Branch. “Firing up to 15 shots per week on the laboratory’s experimental railgun, researchers at NRL perform detailed testing and analysis of rails and armatures, providing S&T expertise to the Navy program that is directly applicable to tests at large-scale power levels.”
Many of the 1000 shots taken on the Materials Testing Facility railgun have been designed to test different barrel designs and to quantify damage generated during high power launch. The innovations and understanding generated by NRL’s science
Without the need for dangerous explosives storage and handling, the electromagnetic railgun can potentially reach targets 20 times farther than conventional weapons.
NAVY’s Electromagnetic
Reaches Testing Milestone

15nrl’s involved! | 2012 NRL REVIEW
and technology (S&T) program have been fed directly into the Office of Naval Research’s Electromagnetic Railgun program and transferred to full-scale tests conducted at the Naval Surface Warfare Center, Dahlgren, Virginia.
A railgun is a form of single turn linear motor. Magnetic fields generated by high currents driven in parallel conductors, rails, accelerate a sliding conductor, known as an armature, between the rails. The velocity generated by the system is limited by rail strength and armature materials and their response to the high currents and extreme pressures generated during launch.
At launch, heat deposited in the armature and near the surface of the rails due to high currents and friction, or viscous heating generated at the sliding interface, leads to temperatures sufficient to melt most metals including the armature material. If the heating and extreme pressures also damage the rail surface, it can destroy the contact surface and condemn the gun barrel. NRL S&T research has pioneered multiple barrel and armature designs that minimize or mitigate this damage even during successive high power launches.
First fired March 6, 2007, at a magnitude of 0.5 megajoules, the railgun system at NRL has been modified and enhanced over the last four years to operate routinely at a 1.5 megajoule launch energy. A megajoule is a measurement of kinetic energy associated with a mass traveling at a certain velocity. In simple terms, a one-ton vehicle moving at 100 mph has approximately one megajoule of kinetic energy.
“A railgun weapons system must be able to launch hundreds of projectiles and withstand extreme pressures, currents, and temperatures,”
said NRL Commanding Officer, Capt. Paul Stewart. “Today’s firing of the one-thousandth shot demonstrates Navy researchers are steadily progressing toward achieving that goal, developing a more effective and efficient future ship combat system.”
The Materials Testing Facility railgun focuses on materials issues for a major Navy effort to develop a long-range, electromagnetic launcher for a future electric ship. The NRL Plasma Physics Division conducts a broad program in laboratory and space plasma physics and related disciplines, high power lasers, pulsed-power sources, intense particle beams, advanced radiation sources, materials processing, and nonlinear dynamics.
(Article reprinted from the Spring 2012 issue of Spectra, the Naval Research Laboratory’s science and technol-ogy magazine.)

The N
aval
Rese
arch L
abora
tory 18
NRL – Our Heritage
19Highlights of NRL Research in 2011
31NRL Today
32NRL Research Divisions
70Research Support Facilities
72Other Research Sites
Plasma Physics Division scientists examine NRL Space Physics Simulation Chamber data from experiments investigating the dynamic behavior of Earth’s radiation belts. The Space Chamber is a unique facility designed for the study of near-Earth space plasma phenomena under carefully controlled, scaled laboratory conditions and for the development and testing of next-generation plasma sensors.
18 2012 NRL REVIEW | the naval research laboratory
The early 20th century founders of the Naval Research Laboratory (NRL) knew the importance of science and technology in building naval power and protecting national security. They knew that success depended on taking the long view, focusing on the long-term needs of the Navy through fundamental research. NRL began operations on July 2, 1923, as the United States Navy’s first modern research institution, and it continues today as one of the Navy’s premier research and development centers.
Thomas Edison’s Vision: The first step came in May 1915, a time when Americans were deeply worried about the great European war. Thomas Edison, when asked by a New York Times correspondent to comment on the conflict, argued that the Nation should look to science. “The Government,” he proposed in a published interview, “should maintain a great research labora-tory....In this could be developed...all the technique of military and naval progression without any vast expense.” Secretary of the Navy Josephus Daniels seized the opportunity created by Edison’s public comments to enlist Edison’s support. He agreed to serve as the head of a new body of civilian experts — the Naval Consulting Board — to advise the Navy on science and technology. The Board’s most ambitious plan was the creation of a modern research facility for the Navy. Congress allocated $1.5 million for the institution in 1916, but wartime delays and disagreements within the Naval Consulting Board postponed construction until 1920.
The Laboratory’s two original divisions — Radio and Sound — pioneered in the fields of high-frequency radio and underwater sound propagation. They pro-duced communications equipment, direction-finding devices, sonar sets, and perhaps most significant of all, the first practical radar equipment built in this country. They also performed basic research, participating, for example, in the discovery and early exploration of the ionosphere. Moreover, the Laboratory was able to work gradually toward its goal of becoming a broadly based research facility. By the beginning of World War II, five new divisions had been added: Physical Optics, Chemistry, Metallurgy, Mechanics and Electricity, and Internal Communications.
World War II Years and Growth: Total employ-ment at the Laboratory jumped from 396 in 1941 to 4400 in 1946, expenditures from $1.7 million to $13.7 million, the number of buildings from 23 to 67, and the number of projects from 200 to about 900. During WWII, scientific activities necessarily were
concentrated almost entirely on applied research. New electronics equipment — radio, radar, sonar — was developed. Countermeasures were devised. New lubricants were produced, as were antifouling paints, luminous identification tapes, and a sea marker to help save survivors of disasters at sea. A thermal diffusion process was conceived and used to supply some of the 235U isotope needed for one of the first atomic bombs. Also, many new devices that developed from booming wartime industry were type tested and then certified as reliable for the Fleet.
Post-WWII Reorganization: The United States emerged into the postwar era determined to con-solidate its significant wartime gains in science and technology and to preserve the working relationship between its armed forces and the scientific community. While the Navy was establishing its Office of Naval Research (ONR) as a liaison with and supporter of basic and applied scientific research, it was also encour-aging NRL to broaden its scope and become, in effect, its corporate research laboratory. There was a transfer of NRL to the administrative oversight of ONR and a parallel shift of the Laboratory’s research emphasis to one of long-range basic and applied investigation in a broad range of the physical sciences.
However, rapid expansion during WWII had left NRL improperly structured to address long-term Navy requirements. One major task — neither easily nor rapidly accomplished — was that of reshaping and coordinating research. This was achieved by transform-ing a group of largely autonomous scientific divisions into a unified institution with a clear mission and a fully coordinated research program. The first attempt at reorganization vested power in an executive com-mittee composed of all the division superintendents. This committee was impracticably large, so in 1949, a civilian director of research was named and given full authority over the program. Positions for associate directors were added in 1954, and the laboratory’s 13 divisions were grouped into three directorates: Elec-tronics, Materials, and Nucleonics.
The Breadth of NRL: During the years since World War II, the Laboratory has conducted basic and applied research pertaining to the Navy’s environments of Earth, sea, sky, space, and cyberspace. Investiga-tions have ranged widely — from monitoring the Sun’s behavior, to analyzing marine atmospheric conditions, to measuring parameters of the deep oceans. Detection and communication capabilities have benefitted by research that has exploited new portions of the elec-
NRL — OUR HERITAGE

the naval research laboratory | 2012 NRL REVIEW 19
HIGHLIGHTs Of NRL REsEARcH IN 2011
tromagnetic spectrum, extended ranges to outer space, and provided a means of transferring information reliably and securely, even through massive jamming. Submarine habitability, lubricants, shipbuilding materi-als, firefighting, and the study of sound in the sea have remained steadfast concerns, to which have been added recent explorations within the fields of virtual reality, superconductivity, biomolecular science and engineer-ing, and nanotechnology.
The Laboratory has pioneered naval research into space — from atmospheric probes with captured V-2 rockets, through direction of the Vanguard project (America’s first satellite program), to inventing and developing the first satellite prototypes of the Global Positioning System (GPS). Today, NRL is the Navy’s lead laboratory in space systems research, as well as in fire research, tactical electronic warfare, microelec-tronic devices, and artificial intelligence.
The consolidation of NRL and the Naval Oceano-graphic and Atmospheric Research Laboratory, with centers at Bay St. Louis, Mississippi, and Monterey, California, added critical new strengths to the Labora-tory. NRL now is additionally the lead Navy center
for research in ocean and atmospheric sciences, with special strengths in physical oceanography, marine geosciences, ocean acoustics, marine meteorology, and remote oceanic and atmospheric sensing.
The Twenty-First Century: The Laboratory is focusing its research efforts on new Navy strategic interests in the 21st century, a period marked by global terrorism, shifting power balances, and irregular and asymmetric warfare. NRL scientists and engineers are working to give the Navy the special knowledge, capabilities, and flexibility to succeed in this dynamic environment. While continuing its programs of basic research that help the Navy anticipate and meet future needs, NRL also moves technology rapidly from concept to operational use when high-priority, short-term needs arise — for pathogen detection, lightweight body armor, contaminant transport modeling, and communications interoperability, for example. The interdisciplinary and wide-ranging nature of NRL’s work keeps this “great research laboratory” at the forefront of discovery and innovation, solving naval challenges and benefiting the nation as a whole.
The scientific community at NRL conducts innovative research across a wide spectrum of technical areas, much of it detailed in the NRL Review chapters ahead. The following is a selection of the many projects pursued during 2011.
Face Recognition: NRL’s Information Technology Division has developed the first face recognition system for automated watch list surveillance. Over the past several decades, especially since the terrorist attacks of September 11, 2001, face recognition has been intensely studied by researchers and industry experts, whose primary goal is to develop systems for identifying terrorists and criminals from security camera video. However, previous systems required the involvement of human operators. NRL’s automated system, performing in realistic environments (e.g., different lighting conditions, different indoor locations), operated with no error on a mid-size problem (involving several hundred people). The system is now being expanded to operate in large, crowded places (e.g., airports, metros) for critical Navy/DoD and Homeland Security applications. This system uses a machine learning process; its performance improves as the amount of training data increases. The system was tested during joint experiments with SOCOM using aerial images of people on the ground. It performed acceptably at ranges twice as far as those used with previously reported systems, and with slanted viewing angles from the aircraft that might have been expected to degrade the system’s performance.
The approach: Identify and enclose the region in face space that belongs to the person of interest by generating two large sets of borderline images, projecting just inside and outside of the decision region. Train a classifier, e.g., a neural network, to construct the decision boundary. In the photos, Jen-nifer Aniston, the leftmost picture, is being morphed toward Angelina Jolie, the rightmost picture. The second left picture is still recognizable as Jen-nifer (positive borderline exemplar), whereas the next picture is not (negative borderline exemplar). Likewise, morphing Jennifer’s image toward many other people will generate sufficient landmarks to identify and enclose the space belonging to Jennifer (shaded area).
20 2012 NRL REVIEW | the naval research laboratory
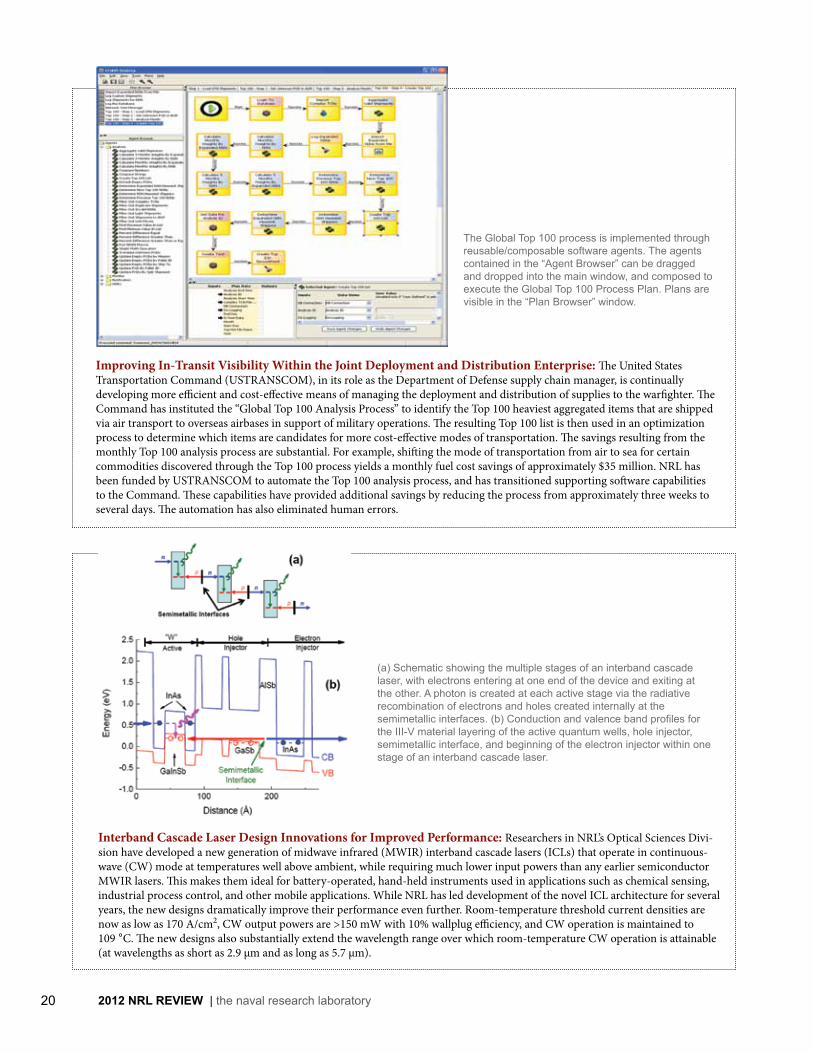
Improving In-Transit Visibility Within the Joint Deployment and Distribution Enterprise: The United States Transportation Command (USTRANSCOM), in its role as the Department of Defense supply chain manager, is continually developing more efficient and cost-effective means of managing the deployment and distribution of supplies to the warfighter. The Command has instituted the “Global Top 100 Analysis Process” to identify the Top 100 heaviest aggregated items that are shipped via air transport to overseas airbases in support of military operations. The resulting Top 100 list is then used in an optimization process to determine which items are candidates for more cost-effective modes of transportation. The savings resulting from the monthly Top 100 analysis process are substantial. For example, shifting the mode of transportation from air to sea for certain commodities discovered through the Top 100 process yields a monthly fuel cost savings of approximately $35 million. NRL has been funded by USTRANSCOM to automate the Top 100 analysis process, and has transitioned supporting software capabilities to the Command. These capabilities have provided additional savings by reducing the process from approximately three weeks to several days. The automation has also eliminated human errors.
The Global Top 100 process is implemented through reusable/composable software agents. The agents contained in the “Agent Browser” can be dragged and dropped into the main window, and composed to execute the Global Top 100 Process Plan. Plans are visible in the “Plan Browser” window.
Interband Cascade Laser Design Innovations for Improved Performance: Researchers in NRL’s Optical Sciences Divi-sion have developed a new generation of midwave infrared (MWIR) interband cascade lasers (ICLs) that operate in continuous-wave (CW) mode at temperatures well above ambient, while requiring much lower input powers than any earlier semiconductor MWIR lasers. This makes them ideal for battery-operated, hand-held instruments used in applications such as chemical sensing, industrial process control, and other mobile applications. While NRL has led development of the novel ICL architecture for several years, the new designs dramatically improve their performance even further. Room-temperature threshold current densities are now as low as 170 A/cm2, CW output powers are >150 mW with 10% wallplug efficiency, and CW operation is maintained to 109 °C. The new designs also substantially extend the wavelength range over which room-temperature CW operation is attainable (at wavelengths as short as 2.9 μm and as long as 5.7 μm).
(a) Schematic showing the multiple stages of an interband cascade laser, with electrons entering at one end of the device and exiting at the other. A photon is created at each active stage via the radiative recombination of electrons and holes created internally at the semimetallic interfaces. (b) Conduction and valence band profiles for the III-V material layering of the active quantum wells, hole injector, semimetallic interface, and beginning of the electron injector within one stage of an interband cascade laser.

the naval research laboratory | 2012 NRL REVIEW 21
Spontaneous Formation of Detonations by Fast Turbulent Flames: Turbulence and turbulent flows appear everywhere in nature. Turbulent energetic reacting flows, such as turbulent flames, are controlling elements in all our energy-generation, weapons, and safety concerns. We are now conducting a basic research effort to understand the structure and dynamics of turbu-lent flames, especially those occurring in high-speed, intensely turbulent flows. One of the most important results is that when the turbulence level is high, and the system is large enough (high Reynolds number), a turbulent flame can transition from a flame to a detonation. The transition occurs on a scale much smaller than the system size, and can occur whether or not there are obstacles or inhomogeneities in the background flow to “help it along.” The basic element is to form a shock on the “right” scale in the particu-lar fuel, and this shock can create appropriate conditions for the transition.
Impedance “box score” distinguishing healthy lithium-ion batteries from unstable batteries subjected to overcharge abuse, using the single-point frequency method.
Frames extracted from the simulation of an initially laminar flame, propagating through a 2 cm channel filled with hydrogen and air. (a) The initially laminar flame moves slowly into unreacted material. (b) Obstacles perturb the flow. The flow interacts with and distorts the flame. The flame accelerates and becomes turbulent. (c) The turbulent flame generates compression waves, which eventually coalesce to form a shock in front of the flame. (d) The shock is continuously strengthened by compression waves coming from behind. (e) The shock reflects from an obstacle, creates a hot spot, or ignition centers, that become spontaneous waves. (f) The spontaneous wave evolves into a detonation, (g) which propagates into the burned region of the flame and around the obstacle into unburned gas.
In Situ Diagnostic Tool to Improve Lithium-Ion Battery Safety: Lithium-ion batteries are crucial power sources in naval environments from space to land to underwater; however, their known safety hazards pose a risk to implementation. NRL has developed a tool to monitor the health of lithium-ion batteries and detect overcharge abuse using single-point impedance spectros-copy. Until now, a full impedance spectrum taken over a broad range of frequencies was needed to infer state-of-health informa-tion of lithium-ion batteries. The NRL innovation is to reduce the spectrum to a single relevant frequency tuned to the unstable chemical compounds within the battery. The tool is preemptive in that it detects irregularities in the impedance behavior during the early stages of cell damage so batteries may be taken off-line prior to becoming highly damaged, unstable, and dangerous. NRL can use these results to design and develop impedance hardware electronics that provide a noninvasive diagnostic tool to prevent catastrophic failure and improve safety of lithium-ion batteries in naval environments.
(a)
(e)(d) (f ) (g)
(c)(b)
9 10 11 35 36 37 38 38 39 40 41
50 51 52 53 54 53 54 55 62 63 64

22 2012 NRL REVIEW | the naval research laboratory
Graphene Valley Filter: Graphene is a promising material for future nanoelectronic applications. In addition to charge and spin, graphene exhibits a valley degree of freedom that could be used to carry information that is either classical or quantum. The hexagonal symmetry of graphene demands that there are exactly two valleys. To exploit the valley degree of freedom, one must be able to separate the electrons in the two valleys. At NRL, we have discovered that a recently observed line defect in graphene has the appropriate symmetry to act as a valley filter. This graphene valley filter could be used to both generate and measure informa-tion stored in the electrons’ valley degree of freedom, and thus opens the door for future valley-based electronics, or valleytronics.
The band structure of graphene (left) contains two valleys colored blue and gold. Electronic waves in graphene scatter at a line defect (center). The probability that an electron transmits through the line defect (right) depends on the angle of incidence, α, and the electron’s valley index, τ.
Critical Degree of Sensitization for Corrosion Fatigue Degradation of AA 5083 Alloy: Aluminum 5083 is an impor-tant alloy for lightweight, fast ship structures because of its high as-welded strength and its resistance to general corrosion and pitting corrosion. However, this aluminum-magnesium alloy can become sensitized to intergranular corrosion in seawater if exposed to moderately high operational temperatures. This phenomenon is a consequence of the formation of a magnesium-rich phase on the grain boundaries, which is anodic relative to the Al matrix. NRL has found that there is a critical degree of sensitiza-tion below which corrosion fatigue and stress corrosion cracking thresholds are stable, but above which these properties degrade rapidly.
Plot of the corrosion-fatigue threshold of aluminum alloy 5083 versus the degree of sensitization (DOS) as measured by the ASTM G67 Nitric Acid Mass Loss test. The H131 and H116 refer to two different tempers of the aluminum-magnesium alloy. The key results in this plot are: (1) The data for all temperature exposures and both tempers all fall approximately along the same curve, and (2) below a DOS of 30 mg/cm2 the thresholds do not change much, but above DOS of 30 mg/cm2 the fatigue properties degrade rapidly. The significance of these findings for ship structure lifecycle is that degradation of 5083 alloy depends on its DOS, and not on the time-temperature details of how it reached that DOS.

the naval research laboratory | 2012 NRL REVIEW 23
Microwave Sintering of Titanium Powders: Titanium (Ti) has many attractive attributes for Naval applications, including high strength, no magnetic signature, and excellent corrosion resistance; however, its use has been limited by high processing costs. NRL is conducting a program aimed at lowering the cost by using microwave sintering of titanium powder into complex and near-net-shape parts. Three different powders have been tested: (a) as-received commercially pure (CP) Ti; (b) as-received CP Ti powder milled to three different tap densities: 28%, 24%, and 20% of theoretical density (TD; higher percentage tap density generally refers to smaller particle size); and (c) as-received titanium alloy (Ti-6Al-4V). Our experiments demonstrate that microwave sintering requires shorter processing times and lower processing temperatures than conventional processing. Milling of the as-received CP titanium powder changed the morphology but did not improve the densification of the sintered product. The titanium alloy powder achieved higher densification than the as-received pure titanium powder, possibly because it has two phases, soft and hard, while CP Ti has just one hard phase, or because of morphology differences. The best results achieved over 99% TD and are promising for the commercial application of microwaves to titanium processing.
(b) (c)
(d)
(e)Left to right: original brass valve; unprocessed Ti powder compact having the same shape; and sintered Ti compact.
Suborbital dust deployment concept: (a) Ballistic rocket releases dust in the path of debris fragments. (b) Debris population is engulfed by dust cloud. Drag on debris is enhanced by hypervelocity collision with dust grains. (c) Debris rapidly descends to altitude x0 km, below which Earth’s natural drag is sufficient to force reentry. The dust cloud also descends under gravity and reenters the atmosphere.
A Concept for Elimination of Small Orbital Debris: Researchers at NRL have developed a novel and low-tech concept for elimination of small orbital debris from low Earth orbit. A recent National Research Council study concludes that we are at the “tipping point” for collisional cascade of orbital debris, which may result in an exponential rise in small debris. Collision with small orbital debris is considered potentially “mission-ending” by the NASA Orbital Debris Program Office. The NRL patent-pending system is specifically targeted at small orbital debris, defined as smaller than 10 cm, which cannot be individually tracked and thus cannot be evaded by spacecraft maneuvering. The NRL concept is based on the deployment of micron scale dust in space. Dust, which naturally fills the near-Earth environment, can be deployed artificially in a narrow altitude band to enhance drag on debris and force reentry; the injected dust will also reenter the Earth’s atmosphere. Under study are orbital and suborbital dust deployment concepts for actively removing debris that (i) has uniformly spread around the Earth or (ii) remains localized over a small volume. System risks and mitigation strategies are also being studied.

24 2012 NRL REVIEW | the naval research laboratory
Demonstration of Intense Pulsed Active Detection (IPAD) of Nuclear Materials: The Pulsed Power Physics Branch of the NRL Plasma Physics Division is studying the use of intense, single-pulse technology to actively detect hidden fissile material. Work in this year has focused on using single intense pulses of bremsstrahlung (X rays). This probing radiation is produced by the interaction of an intense, short-pulse electron beam with a high-atomic-number target. A 50 nanosecond (ns) long, 200 kiloampere (kA), 8 mega-electron-volt (MeV) pulse from the Mercury pulsed power generator operating in negative polarity produced the pulse of intense bremsstrahlung, inducing photofission in fissionable materials. Prompt neutron, delayed neutron, and delayed gamma signatures were detected within a fraction of a second from a depleted uranium (DU) sample following a single pulse using this approach. These exciting measurements were independently validated by a collaborating team of scientists from Atomic Weapons Establishment (UK), Idaho Accelerator Center, NRL Space Science Division, University of Missouri–Kansas City, Brookhaven National Laboratory, and Rapiscan Systems of Sunnyvale, CA.
A technician aligns an array of specialized X-ray, gamma-ray, and neutron diagnostics to characterize the radiation output of the Mercury pulsed power generator in preparation for active detection experiments.
8th Materials on the International Space Station Experiment (MISSE-8): When space shuttle Endeavour made its final voyage to the International Space Station (ISS), it carried with it the 8th Materials on the International Space Station Experiment (MISSE-8). Built under the Air Force Space Test Program, MISSE-8 is a collaboration of NRL, NASA, Department of Energy, and industrial and university partners. The Solid State Devices Branch of NRL’s Electronics Science and Technology Division, working with NRL’s Naval Center for Space Technology, built MISSE-8, which integrates eight different experiments into an astronaut-deployable, suitcase-like structure. Astronauts installed this suitcase on the exterior of the ISS during an “Extra Vehicular Activity,” or EVA, so that the materials could be exposed to the space environment. Two of the MISSE-8 experiments built by the Solid State Devices Branch test advanced solar cells and optical materials for the Department of Defense. The ISS is a unique test platform that allows samples to be exposed to combined effects of space not easily replicated on the ground, and then retrieved to Earth for further study.
Mission Specialist Drew Feustel works with MISSE-8 as it is deployed on May 20, 2011. (Photo credit: NASA)

the naval research laboratory | 2012 NRL REVIEW 25
Impedance-Based Biosensors with Tunable Sensitivity Using Microfluidic Flow Focusing: We demonstrated that the conductive path for impedance-based sensing could be defined by manipulation of multiple laminar flow streams in a micro-channel, as opposed to the physical confines of the channel walls themselves. By leveraging the characteristics of microfluidic flow profiles in this manner, relatively large channels, that are amenable to manipulation of unprocessed biological samples, can utilize sensitive impedance measurements to detect the presence of a very few cells. We demonstrated that we could detect bacteria directly in a label-free configuration or other targets bound to microparticles coated with recognition molecules to impart specific-ity. However, the highest impact product of this project may prove to be the unequivocal demonstration that momentum can play a significant role in hydrodynamic focusing in microfluidic systems — a physical effect not appreciated from prior studies using two-dimensional analytical methods for characterization. In refereed publications and international presentations, we documented both the existence of momentum effects at low Reynolds numbers and approaches to control its impact on hydrodynamic focusing.
An impedance-based biosensor was created on a microscopic slide for the detection of bacteria. The sensitivity of the sensor could be increased by using sheath flow to focus the conducting stream across a planar electrode array.
Acoustic Characterization of a Bimodal Acoustical Metamaterial: We studied the scattering properties of an acoustic metamaterial based on the metafluid elastic theory of pentamode metamaterials. Metafluids were designed to have acoustic propagation and impedance identical to water, and were built using a hexagonal lattice of interconnected elastic nodes with isopropyl inclusions. We measured the acoustic scattering from the metafluid by mapping the pressure intensity generated from a directional source in open water at frequencies ranging from 20 to 60 kHz, just below the homogenization limit of the lattice. Our preliminary results suggest the metafluid behaves in a similar manner to water. The goal of this work is to create metamaterials with anisotropic stiffness that passively guide or transform acoustic wave propagation. Potential applications include acoustic lensing, absorbing coatings, wave diodes, and novel source geometries.
Complex geometries such as the elastic matrix printed from a rapid prototyping machine, with isopropyl inclusions (upper left/center), can be created that behave acoustically as transparent solids. The design geometries are determined through a detailed examination of the dispersion characteristics of the complete structure in a water waveguide (right). Structures such as these metafluids represent a new paradigm of engineered acoustic materials, wherein physical properties not generally found in natural systems can be created.

26 2012 NRL REVIEW | the naval research laboratory
Guided Acoustic Waves in Oil-Filled Underwater Steel Pipes: A theoretical study of guided wave propagation in an oil-filled steel pipe submerged underwater demonstrates that a special class of low-frequency guided waves can effectively penetrate the water to insonify intruding objects in proximity to a pipe. This class of waves exists in addition to the more well known high-speed modes supported mainly by the pipe wall and the low-speed modes supported by the interior fluid. The pipeline itself can therefore be used as part of a long-distance sonar system to acoustically monitor the pipes for intrusions or leakage.
Snapshots of acoustic wave propagation showing the dispersion of a simple pulse into guided waves supported by the oil-steel-water pipe system (left panel). Acoustic scattering of the water-penetrating guided acoustic wave mode by a spherical elastic object exterior to the pipe (right panel).
Surface Velocities from Remote Sensing Imagery: Ocean or river surface velocities are determined from two remote sensing images. A fully constrained nonlinear system of equations is derived without any other approximation and without imposing additional constraints or assumptions. The NRL Remote Sensing Division has developed the powerful Adaptive Velocity Estimation System (AVES) with a global optimal solution (GOS) to retrieve velocities from image sequences based on the fully constrained system. NRL’s AVES is an integration of models, methodologies, and state-of-the-art techniques. It is suited for motion field estimation from visible-band, thermal, or hyperspectral image sequences with complicated coastal land boundaries in ocean/river dynamics studies. The AVES has a wide variety of applications in the disciplines of computer vision and remote sensing.
A velocity field from the AVES-GOS technique using sequential multispectral Landsat and ASTER images yields a dense field of accurate velocity vectors. The Potomac River in MD/VA between Maryland and Mathias Points on 4/2/2003 is shown in late ebb (corroborated by tide tables). The curved red arrows indicate the presence of transient large-scale eddies present in the late-ebb phase of the river flow.

the naval research laboratory | 2012 NRL REVIEW 27
Exploring Underwater Optical Turbulence and its Impacts on EO Sensing: The lack of understanding of the effects of optical turbulence on underwater imaging and optical signal transmission leaves a technical gap in underwater electro-optical sensors and system suites. Through laboratory and at-sea studies, scientists in NRL’s Oceanography Division have obtained concrete evidence that helps to understand turbulence effects and have validated a theoretical model developed as part of this research program. Data was obtained during two field exercises using an NRL-designed and implemented platform, the Image Measurement Assembly for Subsurface Turbulence (IMAST). Using a high-speed camera, passive and active targets, and several oceanographic instruments, the team obtained measurements of optical turbulence structures and related them to the clarity of target images. This research to quantify optical turbulence and mitigate its effects will improve Navy’s next-generation electro-optical systems including active imaging, lidar, and optical communications.
The influence of underwater optical turbulence is clearly visible in the contrast image pairs shown in the bottom panel. These and other images were obtained using the IMAST, shown in the photo and sketch, in horizontal and vertical deployment configurations. The model developed matched the measured results very well, as indicated in the graph, where the impact from turbulence on image degradation is clearly represented in terms of differences in the modulation transfer function (MTF).
Longitudinal Ozone Variations Impact Winter Stratosphere: New results from NRL Space Science Division researchers and collaborators demonstrate that winter weather conditions in the polar stratosphere (15–50 km altitude) are strongly influenced by longitudinal variations in stratospheric ozone heating. This result establishes that both weather and climate models of the lower atmosphere (the troposphere, 0–15 km) must include a realistic representation of the overlying stratosphere that accounts for longitudinal variations in ozone heating.
Polar stereographic plot of ozone mixing ratio at the 3 mb pres-sure level (approximately 40 km altitude) on 6 February 2010. The complex spatial structure in stratospheric ozone over the northern hemisphere in winter, illustrated in the figure, produces longitudinal asymmetries in heating that can impact atmospheric circulation patterns by altering the upward propagation and dissipation of planetary scale Rossby waves.

28 2012 NRL REVIEW | the naval research laboratory
Demonstration of Autonomous Release of a Snagged Solar Array: On-orbit deployment failures of satellite solar arrays and antennas, while historically infrequent in occurrence, can result in huge financial losses and significant performance degradation to high-value commercial, civilian, and military space missions. Deployment failures on two commercial geosynchronous satellites occurred in 2011, with the potential loss of hundreds of millions of dollars over the coming years. If a geosynchronous servicing infrastructure existed on-orbit utilizing one or more robotic servicing satellites, it is possible that such failures could be resolved through a combination of ground and autonomous operations. In this research effort, we developed technologies for autonomous release of a snagged deployable utilizing a servicer satellite with two robotic arms, imaging cameras, and laser illuminators. The research culminated in a successful realistic demonstration of the autonomous release of a snagged solar array using NRL’s dual-platform Proximity Operations Testbed.
A robotic servicer is preparing to autonomously release a snagged array on a geosynchronous satellite mockup. The right servicing arm is initiating insertion of its fiducial tool into the laser-detected gap between the snagged array and the main satellite bus, guided solely by a camera imaging the scene from the left arm.
Achieving Skillful Tropical Cyclone Intensity Forecasts Using COAMPS-TC: A new version of the Navy’s Coupled Ocean/Atmosphere Mesoscale Prediction System (COAMPS®) has been designed and developed specifically for tropical cyclone (TC) prediction, referred to as COAMPS-TC™. The COAMPS-TC system was demonstrated in real time using high resolution in support of the THORPEX Pacific Asian Regional Campaign/Tropical Cyclone Structure 2008 (T-PARC/TCS08) and the Impacts of Typhoons on the Ocean in the Pacific (ITOP) in 2010 field campaigns, as well as the multi-model national high-resolution ensem-ble as part of the NOAA Hurricane Forecast Improvement Project (HFIP). Many new improvements to the COAMPS-TC system have been made and recent real-time demonstrations show the system now is superior to or on par with other state-of-the-science tropical cyclone prediction systems. As an example, during Hurricane Irene, COAMPS-TC provided intensity forecasts that were significantly better than any other operational or real-time product.
Three-dimensional depiction of Hurricane Irene derived from a real-time COAMPS-TC forecast (24-h) at 00 UTC 27 August 2011 showing the near-surface winds and isosurface of the 347 K equivalent potential temperature surface shaded by wind speed (left). The red shading (up to 58 m s−1) highlights the strong winds in the eyewall. The graph shows maximum 10-m wind speed mean absolute error (MAE) (knots; 1 knot = 0.514 m s−1) as a function of forecast time for the 2010 and 2011 seasons in the Atlantic basin for a large homogeneous statistical sample. The numerical models included in this analysis are the Navy’s COAMPS-TC (blue), operational models run by NOAA (HWRF, green; GFDL, yellow), and the Navy’s current operational limited area tropical cyclone model (GFDN, red). The number of cases is shown at the bottom.
0 12 24 36 48 72 96 1200
5
10
15
20
25
Lead time (h)
MAE
(kt)
Intensity error, NHC criteria
COAMPS−TCHWRFGFDNGFDL
Sam
ple
size
Lead time (h)
611532
453 395 336241 182 125

the naval research laboratory | 2012 NRL REVIEW 29
Tether Electrodynamic Propulsion CubeSat Experiment (TEPCE): NRL’s Tether Electrodynamics Propulsion CubeSat Experiment (TEPCE) is a revolutionary spacecraft that will demonstrate electrodynamic propulsion in low Earth orbit. The vehicle is a tethered spacecraft with 1.5 U CubeSats (10 cm × 10 cm × 15 cm) forming the endmasses that when deployed in space will be separated by 1 km of electrically conducting tether. The unique aspect of this propulsion system is it requires no expendable fuel to perform orbit-changing maneuvers. It maneuvers by transmitting a current between the endmasses across the tether. The Earth’s magnetic field exerts a force (called the Lorentz force) on the electrons in the tether, producing a velocity change, both magnitude and direction, of the spacecraft. This propulsion system can be used for a number of missions that may not be possible with conventional propulsion systems. Rendezvous and removal of debris, maintenance of spacecraft, inspection of spacecraft, and a number of other missions can be achieved by virtue of the almost limitless maneuverability of this type of propulsion system.
Upon deployment in space, the 1 km tether will restrain the endmasses in a dumbell configu-ration for the life of the mission. The 30 cm CubeSat is separated into two nearly identical subsatellites that contain electron collectors and emitters for the propulsion system and an impedence probe to measure the electron density of the Earth’s plasma. GPS receivers provide accurate positional data. High voltage electronics force an electrical current to flow against the EMF along the tether.

the naval research laboratory | 2012 NRL REVIEW 31
NRL Today
ORGANIZATION AND ADMINISTRATION
The Naval Research Laboratory is a field command under the Chief of Naval Research, who reports to the Secretary of the Navy via the Assistant Secretary of the Navy for Research, Development and Acquisition.
Heading the Laboratory with joint responsibili-ties are CAPT Anthony J. Ferrari, USN, Commanding Officer, and Dr. John A. Montgomery, Director of Research. Line authority passes from the Commanding Officer and the Director of Research to three Associate Directors of Research, the Director of the Naval Center for Space Technology, and the Associate Director for Business Operations. Research divisions are organized under the following functional directorates:
• Systems• MaterialsScienceandComponentTechnology• OceanandAtmosphericScienceand
Technology• NavalCenterforSpaceTechnology
The NRL Fact Book, published every two years, contains information on the structure and functions of the directorates and divisions.
NRL operates as a Navy Working Capital Fund (NWCF) Activity. All costs, including overhead, are charged to various research projects. Funding in FY11 came from the Chief of Naval Research, the Naval Systems Commands, and other Navy sources; govern-ment agencies such as the U.S. Air Force, the Defense Advanced Research Projects Agency, the Department of Energy, and the National Aeronautics and Space Admin-istration; and several nongovernment activities.
PERSONNEL DEVELOPMENT
At the end of FY11, NRL employed 2753 persons — 38 officers, 56 enlisted, and 2659 civilians. In the research staff, there are 844 employees with doctorate degrees, 338 with master’s degrees, and 451 with bachelor’s degrees. The support staff assists the research staff by providing administrative support, computer-aided design, machin-ing, fabrication, electronic construction, publication and imaging, personnel development, information retrieval, large mainframe computer support, and contracting and supply management services.
Opportunities for higher education and other profes-sional training for NRL employees are available through several programs offered by the Employee Relations Branch. These programs provide for graduate work leading to advanced degrees, advanced training, college course work, short courses, continuing education, and
career counseling. Graduate students, in certain cases, may use their NRL research for thesis material.
For non-NRL employees, several postdoctoral research programs exist. There are also agreements with several universities for student opportunities, as well as summer and part-time employment programs. Summer and interchange programs for college faculty members, professional consultants, and employees of other gov-ernment agencies are also available. These programs are described in the NRL Review chapter “Programs for Professional Development.”
NRL has active chapters of Women in Science and Engineering (WISE), Sigma Xi, Toastmasters Inter-national, and the Federal Executive and Professional Association. An amateur radio club, a drama group, and several sports clubs are also active. NRL has a Recreation Club that provides gymnasium and weight-room facili-ties. NRL also has an award-winning Community Out-reach Program. See “Programs for Professional Develop-ment” for details on all these programs and activities.
NRL has its very own credit union. Established in 1946, NRL Federal Credit Union (NRLFCU) is a sound financial institution that serves about 20,000 NRL employees, contractors, select employee groups, and their families. Focusing on its mission of Trusted Partners for Life, NRLFCU provides many free and low-cost products and services, including free checking with bill pay, Visa CheckCard, and mobile banking; great rates on auto loans, credit cards, mortgages, and more; convenience of direct deposit, online access, three local branches (one of them located in Bldg. 222) and one coming soon to Alexandria, VA; nationwide access via the National Shared Branching Network with over 28,000 surcharge-free ATMs; and personalized full-service investment and brokerage services. For more information, call 301-839-8400 or log on to www.nrlfcu.org. Public transportation to NRL is provided by Metro-bus. Metrorail service is three miles away.
SITES AND FACILITIES
NRL’s main campus in Washington, D.C., consists of 88 main buildings on about 131 acres. NRL also main-tains 10 other research sites, including a vessel for fire research and a Flight Support Detachment. The many diverse scientific and technological research and support facilities are described here. More details can be found in the NRL Major Facilities publication at www.nrl.navy.mil.

32 2012 NRL REVIEW | the naval research laboratory
The revolutionary opportunities available in nanoscience and nanotechnology led to a National
Nanotechnology Initiative in 2001. The NRL Institute for Nanoscience was established in that same year with a current annual budget of $11 million in core research funds. The prospect for nanoscience to provide a dramatic change in the performance of materials and devices was the rationale for identifying this emerging field as one of the DoD strategic research areas for basic research funding on a long-term basis. The mission of the NRL Institute for Nanosci-ence is to conduct highly innovative, interdisciplinary research at the intersections of the fields of materials, electronics, and biology in the nanometer size domain. The Institute exploits the broad multidisciplinary character of the Naval Research Laboratory to bring together scientists with disparate training and back-grounds to pursue common goals at the intersection of their respective fields in systems at this length scale. The Institute provides the Navy and DoD with sci-entific leadership in this complex, emerging area and
Institute for Nanoscience
identifies opportunities for advances in future defense technology. NRL’s nanoscience research programs and accomplishments directly impact nearly all Naval S&T focus areas. The Institute’s current research program empha-sizes multidisciplinary, cross-division efforts in a wide range of science and technology applications:
• Ultra-low-power electronics• Quantum information processing• Chem/bio/explosive sensing• Energy conversion/storage• Photonics/plasmonics• Multifunctional materials• Biomimetics• Biologically based complex assembly
The Institute for Nanoscience building, opened in October 2003, provides NRL scientists access to state-of-the-art laboratory space and fabrication facilities. The building has 5000 ft2 of Class 100 clean room space for device fabrication, 4000 ft2 of “quiet” space with temperature controlled to ±0.5 °C, acoustic isolation at the NC35 standard (35 dB at 1 kHz), floor vibration isolation to <150 mm/s rms at 10 to 100 Hz and <0.3
NRL researchers working in the Institute for Nanoscience clean room.

the naval research laboratory | 2012 NRL REVIEW 33
NRL RESEARCH DIVISIONS
mOe magnetic noise at 60 Hz, and 1000 ft2 of “ultra-quiet” laboratory space with temperature controlled to ±0.1 °C and acoustic isolation at the NC25 standard (25 dB at 1 kHz). Clean room equipment includes a wide range of deposition and etch systems; optical mask aligners; an electron beam writer; a focused ion beam writer; an optical pattern generator for mask making; a plasma-enhanced atomic layer deposition system; a laser machining tool; a wide variety of char-acterization tools; and more.
Metrology.
Transmission electron microscopy.
The Institute for Nanoscience research building.

34 2012 NRL REVIEW | the naval research laboratory
Radar
The aMRFC testbed, located at NRL’s CBd, was developed as a proof-of-principle demonstration system that is capable of simultaneously transmitting and receiving multiple beams from common transmit and receive array antennas for radar, electronic warfare, and communications.
A widely used major facility is the Compact Antenna Range (operated jointly with the Space Sys-tems Development Department) for antenna design and development and radar cross section measure-ments. The range is capable of simulating far-field con-ditions from 1 to 110 GHz, with a quiet zone approxi-mately 7 ft in diameter and 8 ft in length. Instrumenta-tion covers from 1 to 95 GHz. Another strong division capability is in the Computational Electromagnetics (CEM) Facility, which has capabilities for complex electromagnetic modeling, including radar target and antenna structures. The Radar Signature Calculation Facility produces detailed computations of radar cross sections of various targets, primarily ships. The CEM facility includes multiple-CPU supercomputers that are also used to design phased array radar antennas.
The tremendous synergism between the CEM group and the Compact Antenna Range Facility provides the ability to design in the CEM environment, to test in the compact range, and to have immediate feedback between the theoretical and experimental aspects to shorten the development cycle for new designs.
In connection with airborne radar, the division operates a supercomputer-based Radar Imaging Facil-ity and an inverse synthetic aperture radar (ISAR) deployed either in the air, on the ground, or aboard ship for radar imaging data collection. A P-3 aircraft equipped with the AN/APS-145 radar and cooperative engagement capability is also available for deploying experiments.
In connection with ship-based radar, the division operates the Radar Test Facility at the Chesapeake
NRLhas gained worldwide renown as the “birthplace of U.S. radar,” and for more than half a century has maintained its reputation as a leading center for radar-related research and development. A number of facilities managed by
NRL’s Radar Division continue to contribute to this reputation.

the naval research laboratory | 2012 NRL REVIEW 35
NRL RESEARCH DIVISIONS
Bay Detachment (CBD) near Chesapeake Beach, Maryland. The site has radars for long-range air search and surface search functions and features the newly developed W-band Advanced Radar for Low Observable Control (WARLOC), a fully operational high-power coherent millimeter-wave radar operating at 94 GHz. The WARLOC transmitter is capable of producing 10 kW average power with a variety of waveforms suitable for precision tracking and imaging of targets at long range. Waveforms with a bandwidth of 600 MHz can be transmitted at full power. A 6 ft Cassegrain antenna is mounted on a precision pedestal and achieves 62 dB of gain.
The Advanced Multifunction Radio Frequency Concept (AMRFC) testbed is a new installation at CBD operated by the Radar Division, with joint participation of several other NRL divisions as well. The goal of the AMRFC program is to demonstrate the integration of many sorts of shipboard RF functions, including radar, electronic warfare (EW), and communications, by utilizing a common set of broadband array antennas, signal and data processing, and signal generation and display hardware. The testbed consists of separate active transmit and receive arrays that operate over the 6 to 18 GHz band (nominally). Current functionality of the testbed includes a multimode navigation/surface surveillance Doppler radar, multiple communication links (line-of-sight and satellite), and passive and active EW capabilities. Testbed electronics are housed in seven converted 20 ft shipping containers and trailers. The arrays are mounted on a 15° tilt-back in the ends of two of the trailers overlooking the Chesapeake Bay, simulating a possible shipboard installation.
The division also has access to other radar systems: the Microwave Microscope (MWM); the Navy’s relocatable over-the-horizon radar (AN/TPS-71); and an experimental Cooperative Aircraft Identification system. The internally developed MWM has a high-resolution (2 cm) ultrawideband capability that is used to investigate backscatter from surface and volumetric clutter, has through-wall detection capability, and char-acterizes the impulse responses of scattering objects. The division provides direct technical support for AN/TPS-71 and has direct access to data. The Cooperative Aircraft Identification system is used to explore system concepts and engineering developments in connection with target identification.
Compact Range Facility.
Radar antennas in front of and on the roof of the Radar Test Facility.

36 2012 NRL REVIEW | the naval research laboratory
Information Technology
NRL’s Information Technology Division (ITD) conducts basic research, exploratory develop-
ment, and advanced technology demon-strations in the collection, transmission, processing, dissemination, and presenta-tion of information. ITD’s research program spans the areas of artificial intelligence (AI), autonomous systems, high assurance systems, tactical and strategic computer networks, large data systems, modeling and simulation, virtual and augmented reality, visual analytics, human/computer interaction, communica-tion systems, transmission technology, and high per-formance computing.
NRL’s RF Communications Laboratory conducts research in satellite communications systems and modulation techniques, develops advanced systems for line-of-sight communications links, and conducts designs for the next generation of airborne relays. A Voice Communication Laboratory supports the development of tactical voice technology, a Mobile Network Modeling Laboratory supports the modeling, emulation, development, and performance evaluation of Mobile Ad Hoc Networking (MANET) technol-
ogy, and a Dynamic Spectrum Allocation/Cognitive Radio Technology Test Lab provides the capability to perform analysis, testing, and prototype development of dynamic, cognitive, high-speed wireless networked data communication systems. A Freespace Laser Com-munications Laboratory supports the design and devel-opment of prototype technical solutions for Naval laser communications requirements.
The Center for Computational Science (CCS) hosts the High Performance Computing (HPC) and Com-munications efforts at NRL. CCS participates in the DoD HPC Affiliated Research Center (ARC) program providing supercomputer research access to NRL and DoD customers. For high-performance networking, the Center runs the Advanced Technology Demonstration Network (ATDnet) in the Washington, D.C., metro area that provides dark fiber access to research partners. Other research supports high-speed connections (10s to 100s of Gbps) of supercomputer assets to NRL’s corpo-rate IT network as well as the global Defense Research and Engineering Network (DREN). Current efforts range from mapping traditional large shared memory (SHMEM) problems onto scalar computing systems to emerging cloud architectures to extremely large storage (petabytes and beyond).
The Information Management and decision architectures Branch includes research on the structure, transmission, analysis, and visual presentation of large data sets. The 246-million pixel display wall enables users to focus on one region of the data while maintaining the global context and offers a facility for collaborative data exploration.

the naval research laboratory | 2012 NRL REVIEW 37
NRL RESEARCH DIVISIONS
The Cryptographic Technology Laboratory sup-ports the development of certifiable Communications Security (COMSEC) and Information Assurance (IA) products, including programmable cryptographic devices, cryptographic applications, and high assurance cross-domain solutions. The Naval Key Management Laboratory investigates electronic key management and networked key distribution technologies for the Navy and DoD. The Cyber Defense Development Laboratory provides direct support to the Fleet in the areas of computer network defense and visualization, cross-domain solutions, and reverse code analysis.
The Autonomous Systems and Robotics Labo-ratory provides the ability to develop and evaluate intelligent software and interfaces for autonomous vehicles. The Immersive Simulation Laboratory utilizes a collection of commercial off-the-shelf and specially developed components to support R&D in interfaces for virtual simulators, ranging from fully immersive to desktop simulations. The AI Center’s Audio Laboratory combines a state-of-the-art 3D sound environment
and multitask test bed for basic and applied human performance studies and Navy information display research. The Warfighter Human System Integration Laboratory maintains a range of Virtual Environment interface technologies as well as wearable, Wi-Fi physi-ological monitors and associated real-time processing algorithms for use in adaptive operational and train-ing support technologies. The core of the new Visual Analytics Laboratory is a display wall composed of LCD tiles, which enable teams of analysts to explore massive, diverse streams of data, supporting research into the science of analytical reasoning facilitated by visual interfaces. The Service Oriented Architecture Laboratory is used to investigate, prototype, and evalu-ate flexible, loosely coupled Web services that can be rapidly combined to meet dynamically changing warfighter needs. The Behavioral Detection Laboratory supports the development of algorithms, processes, and sensor suites associated with behavioral indicators of deception.
The Navy Center for Applied Research in Artificial Intelligence uses Mobile, Dexterous, Social robots Octavia and Isaac to support research in human–robot interaction and autonomy.
Prototype of the Navy’s future multitask, multimodal watchstation, known as the Common Display System, located inside the NRL Audio Lab’s 48-element spheri-cal loudspeaker array. The Audio Lab’s facilities are used for a wide variety of applied auditory research purposes, including simulations of aural environments in real-world settings, such as Navy combat informa-tion centers and open spaces.

38 2012 NRL REVIEW | the naval research laboratory
Optical Sciences
The Optical Sciences Division has a broad program of basic and applied research in optics and
electro-optics. Areas of concentration include fiber optics and fiber-optic sensing, materials and sensors for the visible and infrared (IR) spectral regions, inte-grated optical devices, signal processing, optical infor-mation processing, panchromatic and hyperspectral imaging for surveillance and reconnaissance, and laser development. The division occupies some of the most modern optical facilities in the country. The newest facility in Optical Sciences is the Advanced Optical Materi-als Fabrication Laboratory, a state-of-the-art cluster system for vacuum deposition of thin films. The facil-ity consists of a series of interconnected high vacuum chambers, allowing complex, multilayer films to be
deposited without breaking vacuum during processing. The system includes a glove box, sample distribution robot, sputtering chambers for chalcogenide materials and oxides, evaporators for metals and dielectrics, and a mask changing module to enable layers to be patterned in situ while eliminating interface effects that result from exposure to air. Three other recently added facilities include the Optical Fiber Preform Fabrication Facility for making doped and undoped, multimode, single-mode, multicore, and photonic crystal glass preforms at temperatures as high as 2300 °C; the Surface Character-ization Facility for ultraviolet and X-ray photoemission spectroscopy, atomic force and scanning tunneling microscopy (STM), and STM-induced light emission measurements; and the molecular beam epitaxial growth system dedicated to infrared lasers and detectors based on GaSb/InAs/AlSb quantum well and superlattice structures. In addition, an extensive set of laboratories
The advanced optical Materials Fabrication Laboratory, a state-of-the-art high vacuum cluster system, consists of a series of interconnected chambers allowing vacuum deposition of complex, multilayer films to be deposited and patterned without breaking vacuum during processing.

the naval research laboratory | 2012 NRL REVIEW 39
NRL RESEARCH DIVISIONS
exists to develop and test new laser and nonlinear frequency conversion concepts and to evaluate non-destructive test and evaluation techniques. Fiber-optic sensor testing stations include acoustic test cells and a three-axis magnetic sensor test cell. There is also an Ultralow-loss Infrared Fiber-Optic Waveguide Facil-ity using high-temperature IR glass technology. The facilities for ceramic optical materials include powder preparation, vacuum presses, and a 50-ton hot press for sintering. The Focal Plane Array Evaluation Facility
Molecular beam epitaxy (MBE) system dedicated to quantum confined GaSb/InAs/AlSb structures for mid-wave infrared laser development.
allows measurement of the optical and electrical charac-teristics of infrared focal plane arrays being developed for advanced Navy sensors. The IR Missile-Seeker Evaluation Facility performs open-loop measurements of the sus-ceptibilities of IR tracking sensors to optical countermea-sures. An ultra-high-vacuum multichamber deposition apparatus is used for fabrication of electro-optical devices and can be interlocked with the Surface Characterization Facility.
The Optical Sciences Surface Characterization Facility includes instrumentation for ultraviolet and X-ray photo-emission spectroscopy (UPS and XPS), atomic force and scanning tunneling microscopy (AFM and STM), and STM-induced light emission (STM-LE) measurements.
MX-20SW hyperspectral sensors.
The Optical Fiber Preform Fabrication Facility includes computer control of the glass composition and standard fiber-optic dopants as well as rare earths, aluminum, and other components for specialty fibers.

40 2012 NRL REVIEW | the naval research laboratory
Tactical Electronic Warfare
The Tactical Electronic Warfare (TEW) Division’s program for electronic warfare (EW) research
and development covers the entire elec-tromagnetic spectrum. The program includes basic technology research and advanced developments and their applicability to producing EW products. The range of ongoing activities includes components, techniques, and subsystems development as well as system conceptualization, design, and effectiveness evaluation. The focus of the research activities extends across the entire breadth of the battlespace. These activities emphasize providing the methods and means to detect and counter enemy hostile actions — from the beginning, when enemy forces are being mobilized for an attack, through to the final stages of the engage-ment. In conducting this program, the TEW Division has an extensive array of special research and develop-ment laboratories, anechoic chambers, and modern computer systems for modeling and simulation work. Dedicated field sites and Learjets allow for the conduct of field experiments and operational trials. This assem-blage of scientists, engineers, and specialized facilities also supports the innovative use of all Fleet defensive and offensive EW resources now available to opera-tional forces.
Learjet with simulators during RIMPaC exercises.
Radio Frequency Countermeasures anechoic chamber for EW testing.

the naval research laboratory | 2012 NRL REVIEW 41
NRL RESEARCH DIVISIONS
TEWD develops and implements advanced visualization tools to support EW systems development and analysis.
XFC (Experimental Fuel Cell) UAV — tube launch sequence.
The Central Target Simulation Facility is a high-perfor-mance, hardware-in-the-loop simulator for real-time closed-loop testing and evaluation of electronic warfare systems and techniques to counter the antiship missile threats.
EATES — Electronic Attack Technique Evaluation System, a stand-alone portable EA testing system.
Deployed EW sub-system to improve emitter detection and classification based on conceptualization and development performed in TEWD.
XFC prototype in flight under fuel cell power.
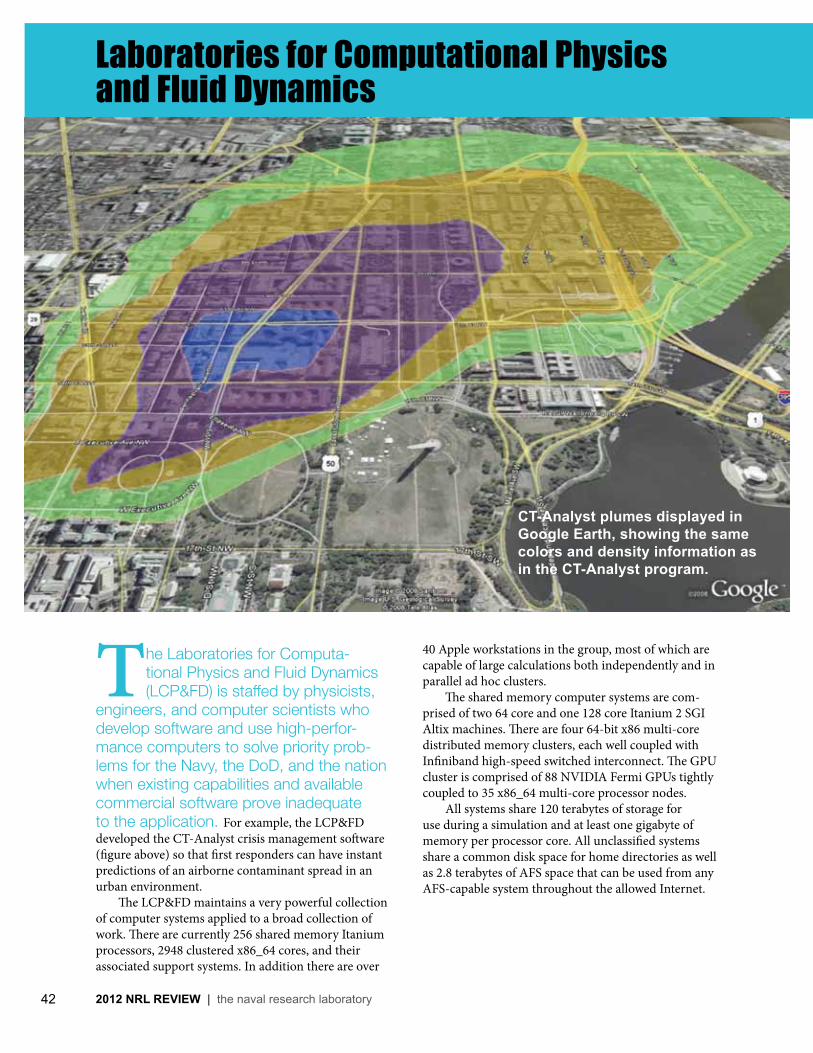
42 2012 NRL REVIEW | the naval research laboratory
Laboratories for Computational Physics and Fluid Dynamics
The Laboratories for Computa-tional Physics and Fluid Dynamics (LCP&FD) is staffed by physicists,
engineers, and computer scientists who develop software and use high-perfor-mance computers to solve priority prob-lems for the Navy, the DoD, and the nation when existing capabilities and available commercial software prove inadequate to the application. For example, the LCP&FD developed the CT-Analyst crisis management software (figure above) so that first responders can have instant predictions of an airborne contaminant spread in an urban environment. The LCP&FD maintains a very powerful collection of computer systems applied to a broad collection of work. There are currently 256 shared memory Itanium processors, 2948 clustered x86_64 cores, and their associated support systems. In addition there are over
CT-analyst plumes displayed in Google Earth, showing the same colors and density information as in the CT-analyst program.
40 Apple workstations in the group, most of which are capable of large calculations both independently and in parallel ad hoc clusters. The shared memory computer systems are com-prised of two 64 core and one 128 core Itanium 2 SGI Altix machines. There are four 64-bit x86 multi-core distributed memory clusters, each well coupled with Infiniband high-speed switched interconnect. The GPU cluster is comprised of 88 NVIDIA Fermi GPUs tightly coupled to 35 x86_64 multi-core processor nodes. All systems share 120 terabytes of storage for use during a simulation and at least one gigabyte of memory per processor core. All unclassified systems share a common disk space for home directories as well as 2.8 terabytes of AFS space that can be used from any AFS-capable system throughout the allowed Internet.

the naval research laboratory | 2012 NRL REVIEW 43
NRL RESEARCH DIVISIONS
The computed flow field inside a rotating detonation engine with mixture plenum (bottom), injector plate and injectors (center), and combustion chamber (top).This new class of en-gines has been investigated computationally and been shown to have the potential to reduce fuel consumption by 25% while providing the same performance as current gas-turbine engines.
The computed exhaust from a supersonic jet aircraft show-ing the density fluctuations and near-field acoustic waves (noise). Computations are being used to develop and assess various means of reducing the exhaust jet noise during take-off and landing on aircraft carriers.
Accelerating unconfined turbulent flame in a methane–air mix-ture shortly before a spontaneous transition to a detonation. Shown is the volume rendering of the reaction rate in a fully resolved numerical simulation of the flame interaction with the driven, homogeneous, isotropic and high-speed turbulence.
Pressure contours resulting from blast interaction with a helmeted head. The shock wave approaches from the front (left) and envelopes the geometry; the boundary between ambient (dark blue) and post-shock (green) air is seen at the top and bottom right. Interacting shock reflections from the face, helmet, and torso generate high pressures (red) on the neck below the chin.

44 2012 NRL REVIEW | the naval research laboratory
Chemistry
NRL has been a major center for chemical research in support of naval operational requirements
since the late 1920s. The Chemistry Division continues this tradition. The Chemistry Division conducts basic research, applied research, and develop-ment studies in the broad fields of diagnostics, dynam-ics, synthesis, materials, surface/interfaces, environ-ment, corrosion, combustion, and fuels. Specialized programs currently within these fields include the synthesis and characterization of organic and inorganic materials, coatings, composites, nondestructive evalu-ation, surface/interface modification and characteriza-tion, nanometer structure science/technology, chemical vapor processing, tribology, solution and electrochem-istry, mechanisms and kinetics of chemical processes, analytical chemistry, theoretical chemistry, decoy materials, radar-absorbing materials/radar-absorbing structures (RAM/RAS) technology, chemical/biologi-cal warfare defense, atmosphere analysis and control,
environmental remediation and protection, corrosion science and engineering, marine coatings, personnel protection, and safety and survivability. The Division has several research facilities.
Chemical analysis facilities include a wide range of modern photonic, phononic, magnetic, electronic, and ionic based spectroscopic/microscopic techniques for bulk and surface analysis.
The Magnetic Resonance Facility includes advanced high-resolution solid-state nuclear magnetic resonance (NMR) spectroscopy techniques to observe nuclei across much of the periodic table and provides detailed structural and dynamical information.
The Synchrotron Radiation Facility has intense, monochromatic X-ray photon beams tunable from 10 eV to 35 KeV available from four beam lines developed by NRL at the National Synchrotron Light Source at the Brookhaven National Laboratory.
The Nanometer Characterization/Manipulation Facility includes fabrication and characterization capability based on scanning tunneling microscopy/
NRL has designed and constructed a state-of-the-art trace explosives detection testbed system that will facilitate the development and evaluation of new materials, sensors, and instrumentation for explosives detection.

the naval research laboratory | 2012 NRL REVIEW 45
NRL RESEARCH DIVISIONS
spectroscopy, atomic force microscopy, and related techniques.
The Materials Synthesis/Property Measurement Facility has special emphasis on polymers, surface-film processing, and directed self-assembly.
The Chemical Vapor and Plasma Deposition Facil-ity is designed to study and fabricate materials such as diamond using in situ diagnostics, laser machining, and plasma deposition reactors.
The Navy Fuel Research Facility performs basic and applied research to understand the underlying chemistry that impacts the use, handling, and storage of current and future Navy mobility fuels.
Fire research facilities include a 11,400 ft3 fire research chamber (Fire I) and the 457 ft ex–USS Shadwell (LSD 15) advanced fire research ship. Com-mensurate support has been devoted to survivability of the new classes of ships, DDX, LPD 17, LCS, CVNX, and LHA(R).
The Marine Corrosion and Coatings Facility located on Fleming Key at Key West, Florida, offers a “blue” ocean environment and unpolluted, flowing seawater for studies of environmental effects on mate-rials. Equipment is available for experiments involving accelerated corrosion and weathering, general corro-
sion, long-term immersion and alternate immersion, fouling, electrochemical phenomena, coatings applica-tion and characterization, cathodic protection design, ballast water treatment, marine biology, and corrosion monitoring.
The Chemistry Division has focused on force pro-tection/homeland defense (FP/HD) since September 11, 2001, especially on the development of improved detection techniques for chemical, biological, and explosive threats. As part of a multidivisional program to develop new technology systems, the Chemistry Division is a major contributor to the NRL Institute for Nanoscience. Nanoscience complements FP/HD in that nanoscience is expected to provide dramatic improvements to chemical/biological detection, pro-tection, and neutralization. Chemistry will approach the nanoscale from the bottom up — building smaller atoms and molecules into nanostructures with new properties and developing the directed assembly of nanostructures into hierarchical systems. The NRL Nanoscience building is linked directly into the Chem-istry building to provide controlled access and auxiliary space for work not requiring a “low noise” environ-ment.
Chemistry Division’s new multipurpose X-ray diffraction system is capable of a range of wide angle and small angle x-ray measure-ments. SmartLab exterior (left, 4 ft × 4 ft × 5 ft) and interior (right) views.
The Chemistry Division’s new state-of-the-art atomic force microscope with 50 picometer (5 × 10–11 m) positioning provides superlative imaging and lithography capabilities. It is currently being used to image graphene, bacterial nano-wires, and polymer samples with high spatial resolution.

46 2012 NRL REVIEW | the naval research laboratory
Materials Science and Technology
The Materials Science and Tech-nology Division at NRL provides expertise and facilities to foster
materials innovation. The Division houses many specialized and unique facilities for carrying out basic and applied materials synthesis and characterization research.
The Magnetoelectronics Fabrication Facility con-sists of a Class 1000 clean room equipped with tools for lithographic construction of magnetoelectronic and spintronic devices. It provides pattern definition, met- allization, dielectric layer deposition, and both reactive and Ar+ ion etching of wafers and small pieces.
The Electrical, Magnetic, and Optical Measurement Facility contains several complementary instruments that allow for the magnetic, electrical, optical, and heat capacity characterization of materials and devices. SQUID (superconducting quantum interference device) magnetometry and vibrating sample magne-tometry are used to determine important properties of superconducting, paramagnetic, diamagnetic, and ferromagnetic materials. The transport properties of materials, namely the temperature- and magnetic-field-
Nonlithographic fabrication of an artificial iImpedance surface (aIS) via laser patterning.
dependent resistivity combined with heat-capacity measurements, allow for a fundamental physical under-standing of electronic properties.
The Materials Processing Facility includes appa-ratuses for powder production by fluid atomization, thermal evaporation, and arc erosion, and a physical vapor deposition system designed to produce and coat submicron powders in situ. Facilities to process powder into bulk specimens by hot and cold isostatic pressing permit a variety of consolidation possibilities. The iso-thermal heat treatment facility and quenching dilatom-eter permit alloy synthesis and single crystal growth. Bulk alloys can be prepared by induction melting, while rapid solidified metals of thin cross section can be made by splat quenching and melt spinning. Ceramic and ceramic-matrix composites processing facilities include a wide variety of conventional, controlled atmospheric furnaces, hot presses, a ball milling appa-ratus, particle size determination capability, and sol-gel and organometallic coating processing capabilities.
The Mechanical Characterization Facility consists of various testing systems, many with automated com-puter control and data acquisition, for determining the mechanical response of materials under controlled

the naval research laboratory | 2012 NRL REVIEW 47
NRL RESEARCH DIVISIONS
loading/deformation and environmental conditions. Basic capabilities include quasi-static tensile and fracture testing, dynamic storage and loss moduli as a function of frequency and temperature, cyclic fatigue crack growth and corrosion fatigue testing, and stress- corrosion cracking testing.
The Thin-Film Materials Synthesis and Processing Facility provides users a wide variety of techniques for growth and processing of thin films (thickness 1 μm or less). Sputter deposition offers a versatile method of depositing metallic and dielectric films and is a primary tool of this facility. Thermal evaporation of metals is implemented in both high-vacuum and ultra-high-vacuum systems. Pulsed laser deposition (PLD) with variable stage temperature and controlled atmosphere allows growth of oxides. Electrolytic deposition offers efficient growth of gold and silver films. Laser direct-write ablation and deposition processes provide unique methods for imposing CAD-defined features via abla-tion of a substrate film and ablative mass transfer to a substrate.
The Micro/Nanostructure Character-ization Facility is capable of performing transmission electron microscopy (TEM), scanning transmission electron micros-copy (STEM), atomic resolution trans-mission electron microscopy (ARTEM), electron energy loss spectroscopy (EELS), Z-contrast imaging, and spectral imaging through the use of a JEOL 2010F transmis-sion electron microscope, an FEI Tecnai G2 30 analytical transmission electron
Electron backscatter diffraction inverse pole figure map shows the grain orientations of the ferrite and austenite phases in a duplex stainless steel 2205 alloy.
microscope, and a JEOL JSM-7001F Variable Pressure scanning electron microscope with secondary and backscattered electron imaging capabilities, as well as energy dispersive spectrometry (EDS) and electron backscatter diffraction (EBSD). In addition, this field-emission microscope operates in low-vacuum mode, which allows for high-resolution imaging of noncon-ductive materials without coatings or any additional preparation. Other standard microstructure character-ization instruments are also available.
Head dynamic response to front blast pressure wave; translucent image of pressure levels in the head.
High-fidelity modeling of the human head under blast loading.

48 2012 NRL REVIEW | the naval research laboratory
Plasma Physics
The Plasma Physics Division is the major center for in-house Navy and DoD plasma physics research. The
Division conducts a broad program in laboratory and space plasma physics and related disciplines, includ-ing high-power lasers, pulsed-power sources, intense particle beams, advanced radiation sources, materials processing, and nonlinear dynamics.
The two largest of the Division’s lasers, Nike and Electra, are krypton fluoride (KrF) lasers operating at 0.25-micron wavelengths and are used for inertial confinement fusion (ICF) energy studies. Nike pro-vides a single, 3 kJ pulse and is used primarily for ICF target physics. Electra is used to develop repetitively pulsed KrF technology. Three ultrashort-pulse, high-intensity lasers, the Table-Top Terawatt (T3) laser, the Ti:Sapphire Femtosecond Laser (TFL), and the new Kilohertz Ti:Sapphire Femtosecond Laser (KTFL) investigate intense laser-target interactions, laser-
NRL’s Materials Testing Facility railgun. The gun has been fired over 1000 times, performing experiments on bore materials under high-power launch conditions.
driven accelerators, laser-triggered discharges, and laser propagation in air, plasmas, and water. The High Energy Laser Laboratory includes four multi-kilowatt, continuous-wave (CW) fiber lasers and investigates laser propagation in the atmosphere and incoher-ent beam combining for directed energy and power beaming applications. The SWOrRD facility uses resonant Raman spectroscopy based on illuminating a target at many wavelengths using a rapidly tunable laser, thus generating two-dimensional signatures of explosives and biological/chemical/nuclear threats.
The Division also has a number of pulsed-power, microwave, and laboratory plasma facilities. The Mate-rials Testing Facility railgun focuses on materials issues for a major Navy effort to develop a long-range, electro-magnetic launcher for a future electric ship. Two large, high-voltage, pulsed-power devices, Gamble II and Mercury, are used to produce intense electron and ion beams, flash X-ray sources, and high-density plasmas.

the naval research laboratory | 2012 NRL REVIEW 49
NRL RESEARCH DIVISIONS
Two-dimensional spectrum of E. coli bacteria using Swept Wavelength Optical resonant Raman Device (SWOrRD).
Space Physics Simulation Chamber.
Simulation of ionospheric plasma dynamics using SAMI3.
The microwave materials processing laboratory includes a 20 kW, CW, 83 GHz gyrotron. Laboratory plasma facilities include the Space Physics Simulation Chamber (SPSC), an 11 m3 space chamber capable of reproducing the near-Earth space plasma environment, and the Large Area Plasma Processing System (LAPPS), designed to study modification of polymers, graphene, and other sensitive materials.
Electra repetitively pulsed krypton fluoride (KrF) laser. Potential applications of this laser and electron beam technology include inertial fusion energy, materials modification, and environmental remediation.

50 2012 NRL REVIEW | the naval research laboratory
Electronics Science and Technology
The Electronics Science and Tech-nology Division conducts a multi-disciplinary basic and applied
research program in solid-state electron-ics; electronic materials including growth, theory, and characterization of semicon-ductors and heterostructures; surface and interface science; microwave and millimeter-wave components and tech-niques; microelectronic device research and fabrication; nanoelectronics science and technologies; vacuum electronics; power electronics; photovoltaics and opto-electronics; and process modeling and simulation. The Division operates twelve major facilities: Ultrafast Laser Facility (ULF), Solar Cell Character-ization Laboratory (SCCL), Compound Semicon-ductor Processing Facility (CSPF), Laboratory for Advanced Materials Synthesis (LAMS), Center for Advanced Materials Epitaxial Growth and Charac-terization (Epicenter), Ultra-Violet Photolithography Laboratory for Submillimeter-Wave Devices (UV-PL), Millimeter-Wave Vacuum Electronics Fabrication Facility (MWVEFF), Advanced Silicon Carbide Epi-
The Electronics Science and Technology division’s advanced Silicon Carbide Epitaxial Research Laboratory (aSCERL).
taxial Research Laboratory (ASCERL), Optoelectronic Scanning Electron Characterization Facility (OSECF), Infrared Materials and Detectors Characterization Laboratory (IR Characterization Lab), Atomic Layer Deposition System (ALD), and High Pressure Multi-Anvil System (HPMAS). The CSPF processes compound semiconductor structures on a service basis, especially if advanced fabrication equipment such as electron beam lithogra-phy for reactive ion etching is required. But most fab-rication can be hands-on by NRL scientists to assure personal process control and history. The LAMS uses metallorganic chemical vapor deposition to synthesize a wide range of thin films, particularly wide bandgap semiconductors such as gallium nitride (GaN) and related alloys. The Epicenter (a joint activity of the Electronics Science and Technology, Materials Science and Technology, Optical Sciences, and ChemistryDivisions) is dedicated to the growth of multilayer nanostructures by molecular beam epitaxy (MBE). Current research involves the growth and etching of conventional III-V semiconductors, ferromagnetic semiconductor materials, 6.1 Å III-V semiconductors, and II-VI semiconductors. The structures grown in this facility are analyzed via in situ scanning tunnel-ing microscopy and angle resolved electron micros-copy. The ASCERL is the focal point of NRL efforts to develop thin film heterostructure materials needed

the naval research laboratory | 2012 NRL REVIEW 51
NRL RESEARCH DIVISIONS
for high-voltage, high-power silicon carbide (SiC) power electronic components in future naval sys-tems. ASCERL employs an EPIGRESS reactor capable of growing thick, low-defect, ultra-high-purity SiC epitaxial layers. The SCCL studies new and emerging solar cell technologies for tactical applications includ-ing terrestrial and space environemnts. The ULF is optimized for the characterization of photophysical and photochemical processes on a timescale of tens of femtoseconds. It includes a synchronously pumped dye laser system for simulating the effects of charge deposited in semiconductors characteristic of space radiation. The UV-PL and MWVEFF are key laborato-ries for developing precision, all-metal structures for electron optics, electron beam-wave interaction (e.g., amplifiers and oscillators), and passive electromag-
Microfabricated circuits for vacuum electronic amplifiers made using UV-LIGA (ultraviolet lithography, electroplating, and molding). NRL’s UV Photolithography Laboratory for Submillimeter-Wave Devices has developed unique techniques to create free-standing, all-copper structures with height-to-width aspect ratios up to 10:1. Clockwise from the top: 220 GHz grating structure designed for a sheet-beam traveling-wave amplifier; 670 GHz multicavity extended interaction klystron; 160 µm diameter beam tunnel fabri-cated using an NRL-proprietary monofilament technique; and 220 GHz serpentine wave-guide circuits designed to generate >50 W with 15 GHz bandwidth.
netic devices. The UV-PL uses lithographic techniques and chemical electroforming to create high height-to-width aspect ratio structures (up to 10:1) with feature sizes as small as 5 μm. These dimensions are compat-ible with devices that can produce coherent electro-magnetic radiation at submillimeter wavelengths. The MWVEFF contains a computer numerically con-trolled (CNC) milling machine and a CNC precision lathe capable of fabricating intricate millimeter-wave vacuum electronic components and a wire electric discharge machining (EDM) tool for fabrication of millimeter-wave and submillimeter-wave components that cannot be fabricated by conventional rotary cut-ting tools. EDM offers a noncontact process for both hard and soft metals as well as SiC and doped silicon.
The NRL sheet electron beam device, devel-oped for a 10 kW W-band (94 GHz) amplifier. A thin sheet beam (0.3 mm x 4 mm) is generated by a unique electron gun (20 kV, 3.5 A, inset right) and is focused by an 8 kG uniform mag-netic field supplied by the permanent magnet structure that comprises the lower 2/3 of the main photo. A sheet beam can carry much higher current than a conventional cylindrical beam of the same voltage, so this W-band amplifier can produce 5 to 10 times the power of comparable state-of-the-art amplifiers. NRL’s award-winning computer code, MICHELLE, was instrumental in designing the electron op-tics (inset upper left). Over 98% of the electron current emitted from the gun is transported through the beam tunnel, in excellent agree-ment with MICHELLE simulations.

52 2012 NRL REVIEW | the naval research laboratory
The Center for Bio/Molecular Science and Engineering conducts cross-disciplinary, bio-inspired
research and development to address problems relevant to the Navy and the DoD by exploiting biology’s well-known ability for developing effective materials and sensing systems. The primary goal is to translate cutting-edge, bio-based discoveries into useful materials, sensors, and prototypes that can be scaled up, are robust, and lead to enhanced capabilities in the field. The challenges include identifying biological approaches with the greatest potential to solve Navy problems and provide new capabilities while focusing on bio-inspired solutions to problems that have not otherwise been solved by conventional means. Studies involve biomaterial development for chemical/biological warfare defense, structural and functional applications, and environmental quality/cleanup. Program areas include optical biosensors, nanoscale manipulations, genomics and proteomics, bio/molecular and cellular arrays, surface modification,
energy harvesting, systems biology, viral particles as scaffolds, and bioorganic materials from self-assembly. The staff of the Center is an interdisciplinary team with expertise in biochemistry, surface chemistry, biophysics, molecular and cell biology, organic synthe-sis, materials science, and engineering. The Center also collaborates throughout NRL and with other govern-ment laboratories, universities, and industry. The Center’s modern facilities include laborato-ries for research in chemistry, biochemistry, systems biology, and physics. Specialized areas include con-trolled-access laboratories for cell culture and molecu-lar biology, an electron microscope facility, a scanning probe microscope laboratory, instrument rooms with access to a variety of spectrophotometers, a multichan-nel surface plasmon resonance (SPR) sensor, and an optical microscope facility including polarization, fluorescence, and confocal microscopes. Additional laboratories accommodate nuclear magnetic resonance (NMR) spectroscopy, liquid chromatography–mass spectrometry (LCMS), and fabrication of microfluidic and micro-optical systems in polymers. The Center maintains a state-of-the-art X-ray diffraction system including a MicroSTAR-H X-ray generator. In com-
Center for Bio/Molecular Science and Engineering
Bio-inspired underwater vehicle developed using fish fins as a model.

the naval research laboratory | 2012 NRL REVIEW 53
NRL RESEARCH DIVISIONS
bination with new detectors and components, the system is ideal for data collection on proteins or very small single crystals of organic compounds and is also capable of collecting data on films and powders. Addi-
tional core facilities have recently been established for fluorescence activated cell sorting (FACS), micro-array analysis, circular dichroism (CD) spectroscopy, and 3D printing and rapid prototyping.
Organic nanoparticles with textured morphology to incorporate multifunctionality.
Seabed energy harvesting devices to power underwater Navy sensors.
Moored and autonomous underwater vehicle (AUV) deployment of immunosensor systems.
Model of the fluorescent dye CY5 coupled to the 5’ end of DNA. The first 10 base pairs are represented by a space-filling (i.e., CPK) model and the rest is a ribbon. The translucent sphere shows the area accessible to the fluorescent dye.

54 2012 NRL REVIEW | the naval research laboratory
Acoustics
The Acoustics Division’s research program spans the domains of quantum and classical physics. It
addresses spatial scales from nanometers to hundreds of kilometers and temporal scales from less than microseconds to the seasonal and long-term variability of the oceans. The Division’s research topics include:1) The study of the impact of riverine, ocean, and
atmospheric fluid dynamics on the phase coherent properties of acoustic signals with the objective of predicting the performance variability of tacti-cal and strategic naval acoustic systems including autonomous unmanned underwater systems and their underwater acoustic communications net-works;
2) The continued development, expansion, and adaptation of full physics underwater acoustic propagation and scattering models and simulation capabilities;
The deployment of the acoustic division’s 10-element vertical source array during a recent at-sea experiment. The towable array transmits a variety of narrowbeam mid-frequency (1.5–9.5 kHz) acoustic signals. The signals propagate through the ocean and are scattered by the ocean surface and bottom, as well as by volumetric scatterers. The signals are received and analyzed to understand their spatial and temporal characteristics. The research supports the Navy’s antisubmarine warfare mission.
3) The measurement and theoretical description of the spatial/temporal variability of the deterministic/statistical properties of acoustic signals scattered from marine organisms, the near-surface ocean volume, the air-sea interface and the sea bottom/subbottom with the objective of reducing the impact of non-target acoustic signal clutter on naval mine countermeasures and antisubmarine warfare system performance;
4) The prediction and measurement of the angle and frequency dependence of acoustic signals scattered and radiated by complex three-dimensional struc-tures with application to advanced manned and unmanned mine countermeasures and antisubma-rine warfare detection concepts;
5) The design from first principles of microelectro-mechanical and nanotechnology based structures (e.g., metamaterials and sensors) that have unique sound transmission, reflection, and transduction properties.

the naval research laboratory | 2012 NRL REVIEW 55
NRL RESEARCH DIVISIONS
The experimental and computational compo-nents of the Division’s research program require the utilization of high-performance computers, the Naval Research Laboratory Institute for Nanoscience experi-mental facilities, the University-National Oceano-graphic Laboratory System’s ships and measurement systems, and the design and use of state-of-the-art laboratory, underwater, and atmospheric research instrumentation.
At-Sea Research: The Division uses autonomous unmanned vehicles, fixed autonomous moorings, and measurement systems attached to ships.
Undersea acoustic propagation and ambient noise measurements are made with a fully autonomous acoustic data acquisition suite composed of two 80 m, 32-channel vertical hydrophone arrays, two 600 m, 96-channel horizontal hydrophone arrays and two 50% duty cycle programmable acoustic sources operating at center frequencies of 300 and 500 Hz. Data (synced with atomic clocks) are acquired by two 32-channel and one 96-channel recording systems which continu-ously acquire 24-bit data (5 kHz sample rate) for a minimum of 30 days.
Ship attached instruments are used to investigate the four-dimensional properties of acoustic signals scattered from the ocean’s surface, bottom, and volume. They include two flex-tensional XF-4 and one ITC 2077 sound sources; a towable, vertically direc-tional source array operating in the 1.5 to 9.5 kHz fre-quency band and a 64-channel broadband (500–3500 Hz) time reversal source-receiver array.
A 53 cm diameter Bluefin autonomous underwa-ter vehicle (AUV), which is instrumented with single crystal transducers, multi-element receiving arrays for synthetic aperture data acquisition, a horizontal towed array, and an onboard data acquisition and processing system, is used to test autonomous unmanned mine countermeasures and antisubmarine warfare concepts.
Underwater acoustic communications network research defines future network capacity by simultane-ously deploying eight moored Benthos modems, two Iver-2 58 in. expandable AUVs and two 8-channel moored/towed remotely controlled acoustic com-munications data acquisition modems in a variety of protocol geometries.
Laboratory Facilities: The Acoustics Division has several nationally unique laboratory facilities.
A salt water tank (6 m × 6 m × 3.5 m) facility is designed to study a variety of physical phenomena under both saline and nonsaline conditions. These include air-sea interface and subsurface bubble acous-tic signal absorption and scatter studies; characteriza-
tion of sound generated by laser pulses; and the effec-tiveness of acoustic metamaterials. The tank has twelve 1.2 × 2.4 m windows for optical access.
In-ground pools (one with a sandy bottom) and an in-air semi-anechoic laboratory are used for mine and antisubmarine warfare research and improvised explosive device detection studies. A 3.7 million liter in-ground pool facility (17 m dia. × 15 m deep) has vibration and temperature control, anechoic interior walls, and automated three-dimensional scattering cross section measurement capabilities. Instrumenta-tion includes compact range scattering, nearfield holography, and scanning laser Doppler vibrometry capabilities.
A sonomagnetic measurement facility is equipped with a vibration-insulating optical table constructed from nonmagnetic materials and a single three-axis magnetometer capable of measuring fields up to ±100 µT with a 1 nT noise floor at 1 kHz.
An ultrasonic measurements laboratory is used for small-scale acoustics experiments designed to measure the effectiveness of acoustic metamaterials. Two 1.2 m cubic water tanks are equipped with overhead X-Y-Z positioning systems and LabVIEW-based data acquisi-tion systems.
A fabrication workshop equipped with a Haas Mini-Mill and an Objet Connex 500 3-D rapid proto-typing machine support the laboratory research facili-ties.
Interior of the salt water experiment tank with no water present.

56 2012 NRL REVIEW | the naval research laboratory
Remote Sensing
The Remote Sensing Division is the Navy’s center of excellence for remote sensing research and
development, conducting a broad program of basic and applied research across the full electromagnetic spectrum using active and passive techniques from ground-, air-, and space-based platforms. Current applica-tions include earth, ocean, atmospheric, astronomy, astrometry, and astrophysical science, and surveillance/reconnaissance activities including maritime domain awareness, antisubmarine warfare, and mine warfare. Special emphasis is given to developing space-based platforms and exploiting existing space systems. Research in ocean and earth science includes mari-time hyperspectral imaging, radar measurements of the ocean surface for the remote sensing of waves and currents, model- and laboratory-based hydrodynamics, and land-based trafficability studies.
Current airborne sensors used for characterization of the littoral environment include visible/near-IR and shortwave hyperspectral imagers, a broadband, visible polarimetric sensor, long- and midwave IR thermal cameras, and an X-band, 2-channel interferometric synthetic aperture radar. As an outgrowth of our airborne sensing program, the Division developed the Hyperspectral Imager for the Coastal Ocean (HICO), the world’s first spaceborne hyperspectral sensor spe-cifically designed for coastal maritime environmental observations. HICO was launched to the International Space Station in September 2009 and is currently pro-viding scientific imagery of varied coastal types world-wide. Ground-based instruments for maritime sensing include the NRL Focused Phased Array Imaging Radar (NRL FOPAIR), an X-band, high-frame-rate polari-metric radar system. New research areas include the exploitation of polarized hyperspectral imaging, and active (lidar-based) sensing of the water column. For radiometric and spectral calibration of the visible and IR imaging sensors, the Division operates a Calibration Facility that includes a NIST-traceable
The NRL HREP (HICo/RaIdS Experiment Payload) being deployed for operations on the Japanese Experiment Module of the International Space Station.

the naval research laboratory | 2012 NRL REVIEW 57
NRL RESEARCH DIVISIONS
integrating sphere and a set of gas emission standards for wavelength calibration. The Division’s Free Surface Hydrodynamics Labo-ratory (FSHL) supports ocean remote sensing research. The lab consists of a 10 m wave tank equipped with a
computer-controlled wave generator and a compre-hensive set of diagnostic tools. Recent work focuses on the physics of breaking waves, their infrared signature, and their role in producing aerosols. Experiments con-ducted in the FSHL are also used to test and validate numerical results and analytical theories dealing with the physics of the ocean’s free surface. Current atmospheric science research areas include the measurement of ocean surface winds and middle atmospheric research. NRL also developed the first spaceborne polarimetric microwave radi-ometer, WindSat, launched in January 2003 and still operational. Its primary mission was to demonstrate the capability to remotely sense the ocean surface wind vector with a passive system. WindSat provides major risk reduction for development of the micro-wave imager for the next-generation DoD operational environmental satellite program. WindSat data are processed at the Navy Fleet Numerical Meteorology and Oceanography Center (FNMOC), and operation-ally assimilated into the Navy global weather model, NOGAPS. In addition, the Remote Sensing Division is exploiting WindSat’s unique data set for other environ-mental parameters such as sea surface temperature, soil moisture, and sea ice concentration. The Water Vapor Millimeter-wave Spectrometer (WVMS) is a ground-based instrument designed to measure water vapor in the middle atmosphere. It is part of the international ground-based Network
for Detection of Atmospheric Composition Change (NDACC), with sensors based in Lauder, New Zealand, Mauna Loa, Hawaii, and Table Mountain, California. The Division has research programs in astronomy and astrophysics ranging in wavelength from the optical to longwave radio (HF), with an emphasis on interferometric imaging. Facilities include the Navy Optical Interferometer (NOI), located near Flag-staff, Arizona, a joint project between the U.S. Naval Observatory and the NRL Remote Sensing Division. The NOI is used for optical astrometry, to investigate unfilled aperture imaging technologies, and to conduct astrophysical research. When completed, it will be the highest-resolution ground-based optical telescope in the world. The Division is also at the forefront of research in low-frequency (<100 MHz) radio astronomy and associated instrumentation and inter-ferometric imaging techniques. The Division developed and installed VHF receivers on the National Radio Astronomy Observatory’s Very Large Array (VLA), has designed the next-generation HF receiver system for the EVLA (Expanded VLA), and developed imaging techniques necessary to correct for ionospheric phase disturbances, important at HF frequencies. The Division is also collaborating with the University of New Mexico and New Mexico Tech on the Long Wavelength Array, a prototype, next-generation, HF imaging array ultimately with 200–300 km baselines. The Division operates the NRL SEALAB (Sensor Exploitation Lab), which is the primary conduit of Division research to the operational community.
Snapshots of breakers generated in the Free Surface Hy-drodynamics Laboratory. At lower right, a wave traveling to-ward the viewer is seen breaking across the width (approx. 3 m) of the tank. In the upper images, waves traveling from left to right are breaking and forming surface turbulence.
The NRL WindSat polarimetric radiom-eter prior to spacecraft integration.

58 2012 NRL REVIEW | the naval research laboratory
Oceanography
The Oceanography Division is the major cen ter for in-house Navy research and development in
oceanography. It is known nationally and inter-nationally for its unique combination of theoreti-cal, numerical, experimental, and remotely sensed approaches to oceanographic problems. The Division’s modeling focus is on a truly integrated global-to-coastal modeling strategy, from deep water up to the coast including straits, harbors, bays, inlets, and rivers. This requires emphasis on both ocean circulation and wave/surf prediction, with additional emphasis on coupling the ocean models to atmospheric, biological, optical, and sediment models. This includes process-ing and analysis of satellite and in-water observa-tions, development of numerical model systems, and assimilation for predicting the ocean environ-ment. This modeling is conducted on the Navy’s and DoD’s most powerful vector and parallel processing machines. The Division’s in-house Ocean Dynam-ics and Prediction Computational Network Facility provides computer services to scientists for program development, graphics, data processing, storage, and backup. It also provides network connectivity to other
Profiling the SEPTR instrument in the oceanography division test pool.
Navy sites, to the DoD High Performance Comput-ing centers, and to the Internet. The computational system enables leading-edge oceanographic numeri-cal prediction research applicable to Navy operations affected by environmental variations at scales of meters to hundreds of kilometers and time scales of seconds to weeks. To study the results of this intense model-ing effort, the Division operates a number of highly sophisticated graphic systems to visualize ocean and coastal dynamic processes. Problems addressed cover a wide scope of physics including parameterization of oceanic processes, construction and analysis of ocean models and forecast systems, basic and applied research of ocean dynamics, surface waves, thermohaline cir-culation, nearshore circulation, estuarine and riverine modeling, arctic ice modeling, internal waves, and ocean/atmosphere coupling. Additional emphasis is on optimization of underwater, airborne, and satellite observing systems, representation of ocean processes affecting temperature, salinity, and mixed-layer depth, uncertainty analysis in coupled systems, ensemble and probabilistic ocean forecasting, targeting ocean obser-vations, representing probability in ocean/acoustic systems, and satellite-observed surface heat fluxes. The

the naval research laboratory | 2012 NRL REVIEW 59
NRL RESEARCH DIVISIONS
end goal is to build cutting-edge technology systems that transition to operational forecast centers. The Division’s Ocean Sciences Branch conducts basic and applied research in ocean physics, air-sea interaction, ocean optics, and marine microbially influenced corrosion. Emphasis of this research is on understanding the oceans’ physical processes and their interactions with the atmosphere and biological/chemical systems at scales ranging from basin-scale to microscale. Numerical and analytical models are devel-oped and tested in laboratory and field experiments. The results of this research support the Navy’s opera-tional capability for predictions of oceanic atmospheric exchanges, acoustic propagation/detection, light transmission/emission, and influences of microbes on marine corrosion. The seagoing experimental programs of the Division range worldwide. Unique measurement systems include a wave measurement system to acquire in situ spatial properties of water waves; a salinity mapper that acquires images of spatial and temporal sea surface salinity variabilities in littoral regions; an integrated absorption cavity and optical profiler system, and towed optical hyperspectral array for studying ocean optical characteristics; self-contained, bottom-mounted, upward-looking acoustic Doppler current profilers (ADCPs) for measuring ocean variability; an in situ volume scattering function measurement system to support remote sensing and in-water optical programs. NRL worked jointly with the NATO Under-sea Research Center (NURC) for development and deployment of the SEPTR instrument, a trawl-resistant, bottom-mounted ADCP system that includes a pop-up profiling float for real-time observation and reporting. A new capability is the addition of an optical sensor on the profiling float. The Oceanography Division has acquired new capabilities for sensing the littoral environment. These include a Vertical Microstructure Profiler (VMP), a Scanfish, four Slocum Gliders, an instrument test pool, a Cytosense Scanning Flow Cytometer and a Shipboard Lidar Optical Profiler. The turbulent dissipation rate can be quickly obtained with very high accuracy from measurements collected by the VMP. The Scanfish allows efficient and rapid three-dimensional mapping of mesoscale oceanic features. The Gliders rely on a low-powered battery-induced change of buoyancy to glide autonomously through the coastal ocean collect-ing both physical and optical data that are uplinked to satellite and then relayed to the laboratory or ship in near real time. A Cytosense Scanning Flow Cytometer makes bio-optical measurements of subsurface particle layers to be used in the development of a cytometer for
use on unmanned glider operations; and the Shipboard Lidar Optical Profiler makes measurements of subsur-face optical and bottom characteristics. In the labora-tory, the Division operates an environmental scanning electron microscope and a newly acquired dual beam environmental scanning electron focused ion beam microscope for detailed studies of biocorrosion in naval materials. The Division’s remote sensing research focuses on radiative transfer theory, optical ocean instrumenta-tion, lasers and underwater imaging and vision, satel-lite and aircraft remote sensing, remote sensing of bio‐optical signatures, and coupled physical bio-optical modeling. The research includes applying aircraft and satellite ocean color and thermal infrared signatures for understanding the bio‐geo‐chemical cycles in the surface ocean. Additional emphasis is on algorithm and model development using satellite (SeaWifs, MODIS, MERIS, NPOESS, OCM, HICO, GEOCAPE, ACE) and aircraft (CASI, AVIRIS, PHILLS) sensors to address the spatial and temporal variability of coastal optical properties. The Division has the capability to download MODIS data directly using an X-band receiving system and is a national leader in the development and analysis of MODIS ocean color data for oceanographic pro-cesses and naval applications in littoral areas. The Divi-sion conducts optical field experiments using advanced in situ and remote sensing instrumentation (ship-towed sensors, sea gliders, and bio-optical/physical moor-ings) to understand remotely sensed signatures for calibration, validation, and refinement of algorithms. The Division also conducts research addressing how remote sensing optical and biological signatures can be fused with in-water bio-optical profiles and assimilated into ocean process models, and includes developing methods and techniques to understand and forecast the ocean optical environment through the combined use of remote sensing products and models.
The X&L band antenna adjacent to the Oceanog-raphy Division building.

60 2012 NRL REVIEW | the naval research laboratory
Marine Geosciences
The Marine Geosciences Division is the major Navy in-house center for research and development in
marine geology, geophysics, geodesy, geoacoustics, geotechnology, and geo-spatial information and systems, with its research focused in three thrust areas: Characterization and Prediction in Seafloor and Terrestrial Regions. Research subthrusts: (1) This year’s airborne work has included developing methods to utilize a prototype ultra-wideband, low-frequency synthetic aperture radar (SAR) for application to the airborne detection of improvised explosive devices and for foliage penetration in densely forested regions. (2)The Division developed an advanced, bias-free geo-detic modeling technique using realistic geologic and geophysical constraints to improve gravity anomaly estimation. The technique was demonstrated for the
eastern area of Afghanistan, where the mountains are too high to safely conduct airborne surveys and almost no ground station gravity data are available. The predicted gravity compares favorably with predictions from the suitably altitude-adjusted GOCO02S grav-ity model and with measured airborne gravity along a track through the eastern region. This new modeling technique will improve earth gravity and geoid models that will better support advanced inertial navigation systems. (3) In a major at-sea experiment, scientists conducted a seismic oceanography investigation across the Agulhas Return Current off South Africa (with Oceanography Division). Analyses reveal clearly vis-ible reflections (temperature contrasts) that are most prominent and concentrated at the strongest portion of the frontal zone, with some reflections that can be traced at tens of meters resolution over distances of tens of kilometers. The observations place new, hard constraints on details of frontal zone mixing that are
The instrument array (above) is deployed in the coastal ocean to measure waves and currents while imaging the seafloor with sonars. a sector scanning sonar image (upper left) reveals a target field placed on the seafloor by divers (photo left).

the naval research laboratory | 2012 NRL REVIEW 61
NRL RESEARCH DIVISIONS
now grossly parameterized. (4) As part of the new Carbon Flux Project, recently acquired data from the Bering Sea have been analyzed with seismic waveform inversion techniques to quantify gas and gas hydrate in the deep-water Aleutian Basin. Each of the large, super chimneys in the area is estimated to hold 0.01 to 0.014 gigatons of carbon (GtC) in the form of methane. There are as many as 1000 super chimneys, holding as much as 14 GtC; by comparison, the atmosphere holds 3.8 GtC as methane. Dynamic Littoral and Riverine Processes. Research subthrusts: (1) The Division continued its modeling of sediment transport phenomena that spans many orders of magnitude, from the discrete particle scale (in which individual sand grains are simulated) to the continuum scale (in which the flow of rivers is resolved). Modeling the relevant physics of the problem at each scale and identifying links between the adjacent scales is crucial to developing the operational forecasts needed by Navy warfighters. (2) Scientists have conducted a series of field experiments with investigators funded by the Of-fice of Naval Research to assess technologies for opera-tional use towards tactical identification of navigational hazards and related environmental conditions. These riverine conditions, which include flow velocity, water surface level, and bathymetry, were obtained at high resolution using a variety of sensing approaches includ-ing acoustic Doppler current profilers, single-beam and multibeam sonars, inexpensive GPS-based drifters, and AUV-based sampling. (3) Division scientists developed
a modified constitutive law on shear strain dependence of strength of soft clays and muds, applicable to a wide range of strain rates, including extension to the never before modeled high strain-rate region. (4) Research included marine biogeochemists studying the impact of the hypoxic zones in the Gulf of Mexico on benthic communities and on surficial sediment characteristics. Geospatial Sciences and Technology. NRL computer scientists developed and hosted advanced geospa-tial services for the National Geospatial-Intelligence Agency, Marine Corps, Army, and Air Force in the Division’s 1400 ft2 geospatial services laboratory. The Division’s Geospatial Hub (GHub) is a content manage-ment system that provides an automatically synchro-nized, Web-based means of organizing and distributing all types of geospatial information including imagery, maps, and weather and scientific data. In 2012, the Division supported security efforts at the summer Olympics by hosting detailed maps of the Olympic venues for security forces. NRL mapping systems have features not found in civilian systems. These include NRL-patented, high-speed data management technol-ogy and support for an unlimited number of different data layers. Scientists delivered new software (EPMA Build 3.0.1) to the Naval Oceanographic Office for use in the Littoral Combat Ship Mine Countermeasures Mission Module to utilize on-scene data/information to update environmental databases and reduce time-lines for detecting mine-like changes on the seabed.
In the Marine Geosciences Division, scientists model sediment transport phenomena that span many orders of magnitude, from the discrete particle scale (far left) where individual grains are simulated, up to the continuum scale (far right) where the flow in rivers is resolved. The goal is to develop reliable forecasting models for operational length and time scales. Consequently, we must simulate the relevant physics of the problem at each scale and identify links between adjacent scales (arrows). Pictures from left to right: a fully resolved simulation of the entrainment of an individual particle into a turbulent boundary layer; simulation of sheet flow transport using a discrete particle model; simulation of sand ripple evolution using mixture theory (SedMix3D); and simulation of flow in a reach of the Kootenai River, Idaho.

62 2012 NRL REVIEW | the naval research laboratory
Marine Meteorology
The Marine Meteorology Division, located in Monterey, California, conducts basic and applied
research in atmospheric sciences. The Division develops meteorological analysis and prediction systems and other products to support Navy, DoD, and other custom-ers operating at theater, operational, and tactical levels. It is collocated with the Fleet Numer-ical Meteorology and Oceanography Center (FNMOC), the Navy’s operational production center for numerical weather prediction (NWP) and satellite imagery inter-pretation. The Division’s Environmental Prediction System Development Laboratory is built around several LINUX clusters (currently up to 176 processors with a planned upgrade to over 5000 processors) supported by approximately 1500 TB of RAID storage and a tape
library capable of expansion to about 10 PB. The Divi-sion also maintains over 100 LINUX servers, including a unique Global Ocean Data Assimilation Experiment (GODAE) server hosting data sets suitable for research and development of ocean and atmospheric data assimilation capabilities. These systems, in combination with DoD Supercomputing Resource Centers (DSRC) and FNMOC assets, enable the Division to efficiently develop, improve, and transition numerical weather analysis and prediction systems and coupled air/ocean systems to operational use, producing guidance that is used by Fleet forces around the globe. These systems also support basic research in atmospheric processes such as air-sea-ice interaction, atmospheric dynamics, and cloud/aerosol physics, as well as development of environmental applications, decision aids, and probabi-listic prediction products. The Division’s state-of-the-art Satellite Data Processing Laboratory allows the direct downlink of real-time NOAA geostationary (GEO) information
3d depiction of Hurricane Katrina 2005 by NRL’s high-resolution operational mesoscale model, CoaMPS®-TC (Coupled ocean/atmosphere Mesoscale Prediction System–Tropical Cyclone).

the naval research laboratory | 2012 NRL REVIEW 63
NRL RESEARCH DIVISIONS
(GOES-WEST/EAST) and data relays from five other geostationary satellites. Data from numerous low Earth orbiting (LEO) platforms are also received in near real time via collaborative interagency agreements. NRL-Monterey processes digital satellite data from 27 LEO sensors and seven GEO platforms to conduct research and development of multisensor data fusion products to support a variety of DoD operations. These activities range from monitoring and analyzing tropical cyclone characteristics to providing special meteorological products in support of combat operations in Southwest Asia. The Mobile Atmospheric Aerosol and Radiation Characterization Observatories (MAARCO) are a pair of mobile laboratories housed in climate-controlled
modified shipping containers with integrated suites of meteorological, aerosol, gas, and radiation instruments. MAARCO can be deployed to operate in strategic areas around the globe, including remote regions, overseas locales, and aboard ships at sea. For added flexibility in field data collection, the modular instruments can be removed and mounted on aircraft and are used to investigate boundary layer meteorology, aerosol micro-physics, aerosol and cloud radiative properties, and electro-optical propagation.
NRL’s Marine Meteorology Division processes satellite data from 27 LEO sensors and seven geostationary platforms and uses that data to conduct research and development of multisensor data fusion products to support a variety of DoD operations.
MAARCO is designed as a stand-alone facility for basic atmo-spheric research and the collection of data to assist in validating aerosol and weather models. Its purpose is to enable research on atmospheric aerosols, gases, and radiation (visible and IR light) in areas of key interest, including remote areas, overseas locales, and aboard ships. This complete mobile laboratory facili-tates deployment in areas with limited facilities, and provides maximum flexibility for integration of additional instrumentation.
The sea surface temperature (shaded, in °C) and surface cur-rents (vectors, ms-1) at 90 hour of the coupled COAMPS®-TC forecast starting at 1200 UTC 15 Sept. 2010, overlaid with the model track (red dots) and the BEST track (black dots).

64 2012 NRL REVIEW | the naval research laboratory
Space Science
The Space Science Division con-ducts a broad-spectrum RDT&E program in solar-terrestrial physics,
astrophysics, upper/middle atmospheric science, and astronomy. Division research-ers conceive, plan, and execute scientific research and development programs and transition the results to operational use. They develop instruments to be flown on satellites, sounding rockets, and balloons; and ground-based facilities and mathematical models. Division major research thrusts include remote sensing of the upper and middle atmospheres, studies of solar activity and effects on the Earth’s ionosphere, and studies of high-energy natural radiation and particles, for applications ranging from astrophysics through force protection.
The Division’s Vacuum Ultraviolet Solar Instru-ment Test (SIT) facility is an ultra-clean solar instru-ment test facility designed to satisfy the rigorous contamination requirements of state-of-the-art solar spaceflight instruments. The facility has a 400 ft2 Class 10 clean room and a large Solar Coronagraph Optical Test Chamber (SCOTCH). The SIT clean room is ideally suited for assembly and test of contamination-sensitive spaceflight instrumentation. It contains a large vibration-isolated optical bench and a 1-ton
capacity overhead crane. The SCOTCH consists of a large vacuum tank and a precision instrument-pointing table. The Division also maintains extensive facilities for supporting ultraviolet (UV) spectroscopy sounding rocket programs. These facilities include a dedicated Class 1000 instrument clean room, and a gray room area for assembling and testing the rocket payloads that incorporates all of the fixtures required for safe handling of payloads. The Division rocket facilities also include a large UV optical test chamber that is additionally equipped with a large vibration- and thermal-isolated optical bench for telescope testing, which allows the laboratory area to be turned into a schlieren facility. The Division also has a unique facility for developing Doppler Asymmetric Spatial Hetero-dyne (DASH) thermospheric wind sensors, which are currently being evaluated and tested in support of potential future space flight missions.
The Division has a wide range of new satellite, rocket, balloon, and ground-based instruments under development. These include the SoloHI heliospheric imager that will image both the quasi-steady flow and transient disturbances in the solar wind when aloft on board the Solar Orbiter mission; the Compact CORonagraph (CCOR), an elegant, externally occulted instrument that uses a single-stage optical design with two lens groups, a polarization analyzer, and a spectral
Cartesian projection of the entire solar atmosphere as observed by the NRL SECCHI twin Extreme Ultraviolet Imagers at a temperature of 1.6 million degrees. SECCHI acquires full maps of the Sun every 10 to 20 minutes.
STEREo aSTEREo B

the naval research laboratory | 2012 NRL REVIEW 65
NRL RESEARCH DIVISIONS
filter to achieve performance comparable to the tra-ditional three-stage Lyot coronagraph but with sig-nificantly lower mass and volume than the traditional design; and the NRL-led SuperMISTI detection system, intended to demonstrate standoff detection, identifica-tion and imaging of radiological/nuclear weapons of mass destruction (WMD) in maritime environments in support of the Office of Naval Research’s Maritime WMD Detection program. Division scientists are also designing innovative high-resolution spectrometers for a possible flight on the Japanese Solar-C mission that will provide unprecedented views of the solar atmo-sphere.
Two Division experiments are measuring the Earth’s thermosphere and ionosphere to improve space weather forecasting for these near-space atmospheric regions which significantly influence the performance of important operational systems such as GPS navi-gation, communication, and space debris tracking. The Remote Atmospheric and Ionospheric Detection System (RAIDS) is a new NRL experiment studying the Earth’s upper atmosphere from a vantage point on the International Space Station (ISS). The RAIDS suite of eight optical sensors passively measures naturally occurring airglow from extreme ultraviolet to near infrared to derive atmospheric composition, density, and temperature. Demonstrating new remote sensing techniques, RAIDS is serving as a pathfinder experi-ment for atmospheric remote sensing from the ISS platform, and has provided the first globally sampled temperature measurements in the 120 to 165 km altitude range. The Special Sensor Ultraviolet Limb
Imager (SSULI) developed by NRL’s Space Science Division and Spacecraft Engineering Department offers a first-of-its-kind technique for remote sensing of the ionosphere and thermosphere from space. Flying on the U.S. Air Force Defense Meteorological Satellite Program (DMSP) F18 (flight 18) satellite, SSULI’s characterization of the Earth’s upper atmosphere and ionosphere provides the necessary scientific data to support military and civil systems. Offering global observations that yield near-real-time altitude profiles of the ionosphere and neutral atmosphere over an extended period of time, SSULI makes measurements from the extreme ultraviolet (EUV) to the far ultravio-let (FUV).
Division scientists, using the Division network of computers and workstations and other connected high performance computing assets, develop and maintain physical models in support of their research. These include NOGAPS-ALPHA, the Advanced Level Physics High Altitude middle atmosphere extension of the Navy Operational Global Atmospheric Prediction System and the Navy Global Environmental Model (NAVGEM; successor to NOGAPS with new dynami-cal core and advanced physics); HiFi, a user-friendly, highly parallel, fully implicit adaptive spectral element code framework designed for model development, magnetohydrodynamics, and multi-fluid numerical modeling in two- and three-dimensional geometries; and GAIM (Global Assimilation of Ionospheric Mea-surements), a physics-based assimilative model of the ionosphere now operational at the Air Force Weather Agency.
Blue-shaded fields on the globe depict the poleward advection of thin stream-ers of ozone-rich subtropical stratospheric air, as predicted by NOGAPS-ALPHA during a sudden stratospheric warming event.

66 2012 NRL REVIEW | the naval research laboratory
Space Systems Development Department
The Space Systems Development Department (SSDD) is respon-sible for the end-to-end definition,
design, development, integration, test, and operation of space systems that satisfy naval and national defense requirements.
The total system engineering philosophy employed by the SSDD enables seamless sensor-to-shooter capabilities to be deployed that optimize the interfaces between command and control, on-orbit satellite col-lection, and onboard and ground processing functions; the dissemination of data to tactical and national users; and the design of tools that provide for the automated correlation and fusion of collected information with other sources.
Research and development is conducted in the areas of space system architectures; advanced mission data processing and data analysis techniques; advanced
Space Systems development department optical Test Facility transmits laser light at both 1064 nm and 1550 nm for both satellite laser ranging and free space optical communication signals.
information systems concepts, including enterprise and cloud computing and networking of space, air, ground, and subsurface sensors; and mission simulation tech-niques. Intelligence collection, advanced RF, optical, and laser communication, satellite laser ranging, digital signal processing, data management, and space naviga-tion systems are constantly improved upon to satisfy evolving requirements. These systems are engineered for maximum reuse and interoperability.
Having conceived of and developed the payload for the first Global Positioning System (GPS) satellite, the SSDD continues to be a center of excellence in the research and development of advanced GPS technol-ogy. Advanced theoretical and experimental investiga-tions are applied to expanding the design and interop-erability of systems used for a wide range of military, space, geodetic, and time dissemination applications. These investigations involve critical precise time gen-eration and measurement technology for passive and

the naval research laboratory | 2012 NRL REVIEW 67
NRL RESEARCH DIVISIONS
active ranging techniques incorporating advanced data transmission and signal design. Precise time and time interval research conducted involves theoretical and experimental development of atomic time/frequency standards, instrumentation, and timekeeping to support highly precise and accurate timescale systems in scientific and military use. Net-centric systems are critically dependent on highly accurate and stable time/frequency standards coordinated to a common time- scale through the diverse dissemination comparison techniques developed within the SSDD.
The PCEF (Precision Clock Evaluation Facility) is one of the major facilities within NRL’s Naval Center for Space Technology. The PCEF was developed to support development of high precision clocks for GPS spacecraft and ground applications, primarily atomic standards. Space atomic clocks are evaluated, qualified, and acceptance tested for space flight using the assets of this facility. Testing performed includes long- and short-term performance evaluation, and environmental testing (including shock and vibration). Investigations of on-orbit anomalies are performed within the PCEF to attempt to duplicate similar effects in space-qualified hardware under controlled conditions. The facility was originally developed to evaluate developments in the Global Positioning System concept development program (Block I) and expanded for the dedicated
The Naval Center for Space Technology’s Precision Clock Evaluation Facility (PCEF).
space clock development conducted during operational system development and deployment. The ability to evaluate and test highly precise atomic clocks, espe-cially in a space environment, requires unique facilities, precise time and frequency references, and precise instrumentation not available anywhere else. The primary time and frequency reference for the PCEF is a specially designed environmental chamber housing a number of hydrogen masers combined with measure-ment equipment permitting a realization of Universal Coordinated Time (UTC) to be maintained as UTC (NRL) in cooperation with the International Bureau of Weights and Measures (BIPM) for reference and research purposes.
In addition to a wide array of test tools and facilities, the Department operates several field sites including the Midway Research Center satellite calibra-tion facility in Stafford, Virginia; the Blossom Point Satellite Tracking and Command Facility in Welcome, Maryland; and the Chesapeake Bay Detachment Radar Range in Chesapeake Beach, Maryland.

68 2012 NRL REVIEW | the naval research laboratory
Spacecraft Engineering Department
The Spacecraft Engineering Department (SED) and the Space Systems Development Department,
together comprising NRL’s Naval Center for Space Technology (NCST), coopera-tively develop space systems to respond to Navy, DoD, and national mission requirements with improved performance, capacity, reliability, efficiency, and life cycle cost.
The SED facilities that support this work include integration and test highbays, large and small anechoic radio frequency chambers, varying levels of clean rooms, shock and vibration tables, an acoustic rever-beration chamber, large and small thermal/vacuum test chambers, a thermal systems integration and test
laboratory, a spin test facility, a static loads test facil-ity, and a spacecraft robotics engineering and control system interaction laboratory. Integration and Test Facilities: The department maintains a wide range of specialized RF chambers for test of antennas, receivers, transmitters, electronics, and other flight systems. There are two main anechoic chambers whose main function is the test and verifica-tion of antennas and flight systems; the tapered chamber is 31 × 31 × 120 ft, with a 100 ft measurement distance; it is instrumented from 100 MHz to 18 GHz for radia-tion patterns, and is regularly used for electromagnetic interference (EMI) measurements as well. The rectangu-lar chamber is 10 × 12 × 20 ft, with a 15 ft measurement distance, and is instrumented from 1 to 220 GHz. There is also a 3 × 3 ft millimeter-wave near-field scanner that is instrumented up to 220 GHz, but capable of measure-ments up to 550 GHz. All the measurement facilities
Lift-off of TacSat-4 — NRL’s 100th satellite.

the naval research laboratory | 2012 NRL REVIEW 69
NRL RESEARCH DIVISIONS
are computer-controlled and fully automated, allowing multiple antennas and polarizations to be measured at the same time. A third RF chamber is dedicated to elec-tromagnetic interference/radio frequency interference (EMI/RFI) testing. This welded steel chamber measures 23 × 23 × 20 ft and provides as much as 120 dB shield-ing effectiveness up to 18 GHz and 100 dB from 18 to 50 GHz. The chamber uses a hybrid anechoic material consisting of wideband pyramidal absorbers and ferrite tiles for performance from 20 MHz to 50 GHz. The EMI chamber is equipped with instrumentation to perform the full range of MIL-STD-461 EMI qualifica-tion testing. A 10 ft high × 11 ft wide sliding bladder door allows easy access of large test items to the main chamber.
The Laminar Flow Clean Room provides a Class 100 ultraclean environment for the cleaning, assembly, and acceptance testing of contamination-sensitive spacecraft components, and integration of complete spacecraft subsystems. The facility is used primarily to support spacecraft propulsion systems but has been used to support all spacecraft electrical, electronic, and mechanical subsystems.
The Vibration Test Facility, which simulates the various vibration loading environments present during flight operations and demonstrates compliance to design specifications, consists of the following shakers: Unholtz-Dickie T5000 50K Flb random 2-in. DA stroke, Ling 4022 30K Flb random 2-in. DA stroke, Ling 2022 16K Flb random 2-in. DA stroke, and a Ling 335 16K Flb random 1-in. DA stroke.
The Acoustic Reverberation Simulation Facility is a 10,000 ft3 reverberation chamber that simulates the acoustic environment that spacecraft will experience during launch. The maximum capable sound pressure level is approximately 152 dB.
The Thermal Fabrication and Test Facility supports the design, fabrication, installation, and verification of spacecraft thermal control systems. It also provides for the analytical thermal design and analysis of any spacecraft. This includes conceptual design, analytical thermal model development, definition of require-ments, worst-case environments and design conditions, and temperature predictions for all cases. The facility provides the means to go from design and analysis to hardware qualification and acceptance testing and then to orbit.
The Spin Test Facility contains two spin balanc-ing machines (one horizontal and one vertical) to handle various types of balancing requirements. Both machines are provided with a plane separation network to obtain correction readings directly in the plane of correction. Moment of inertia (MOI) tables of various capacities are used to verify MOI and center of gravity for units under test.
The Static Loads Test Facility provides the capabil-ity to perform modal survey testing on a wide variety of spacecraft and structures. It consists of two 6 ft × 12 ft × 6 in. thick, ~15,500 lb steel plates (attachable) with floating base, six 75 Flb stinger shakers (1/2-in. DA stroke), two 250 Flb stinger shakers (4-in. DA stroke), and a ~300-channel data acquisition system (expand-able). Spacecraft Robotics Engineering and Controls Laboratory: This facility, which is the largest dual-plat-form motion simulator of its kind, is operated by NCST in collaboration with NRL’s Naval Center for Applied Research in Artificial Intelligence. It supports research in the emerging field of space robotics including autonomous rendezvous and capture, remote assembly operations, and machine learning. It allows full-scale, hardware-in-the-loop testing of flight mechanisms, sensors, and logic of space robotic systems.
Cubesats being prepared for environmental testing.SED’s Tapered Anechoic Chamber.
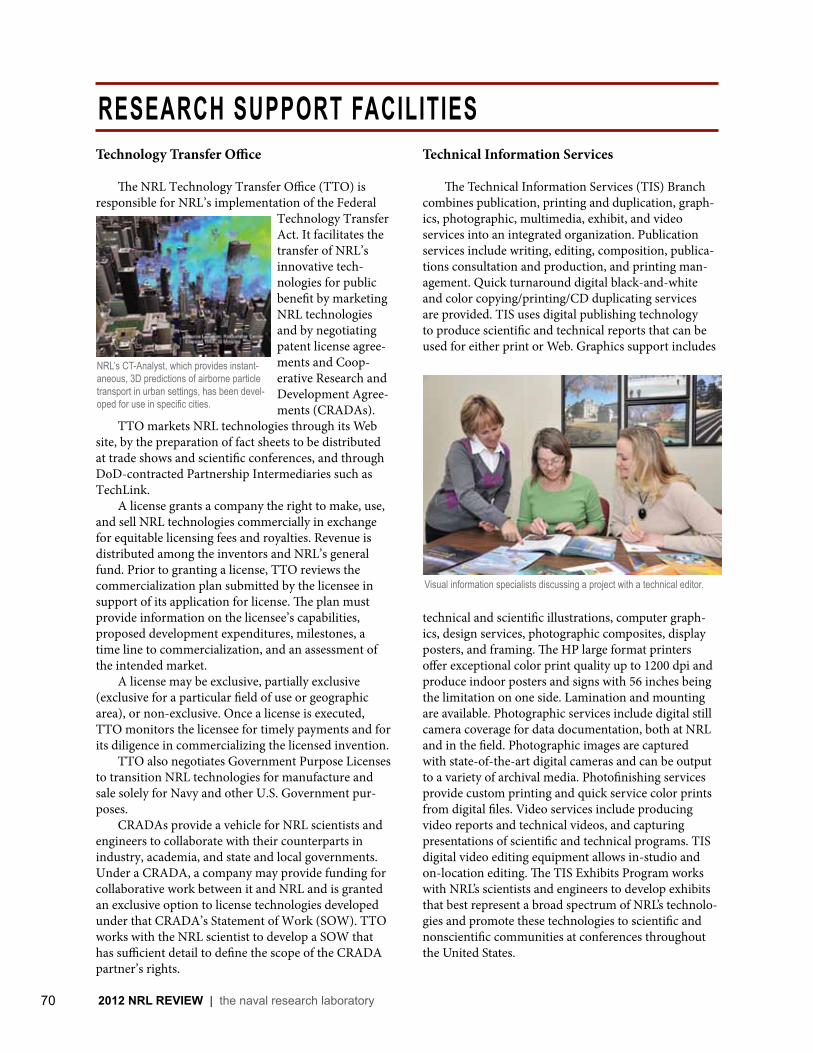
70 2012 NRL REVIEW | the naval research laboratory
Technology Transfer Office
The NRL Technology Transfer Office (TTO) is responsible for NRL’s implementation of the Federal
Technology Transfer Act. It facilitates the transfer of NRL’s innovative tech-nologies for public benefit by marketing NRL technologies and by negotiating patent license agree-ments and Coop-erative Research and Development Agree-ments (CRADAs).
TTO markets NRL technologies through its Web site, by the preparation of fact sheets to be distributed at trade shows and scientific conferences, and through DoD-contracted Partnership Intermediaries such as TechLink.
A license grants a company the right to make, use, and sell NRL technologies commercially in exchange for equitable licensing fees and royalties. Revenue is distributed among the inventors and NRL’s general fund. Prior to granting a license, TTO reviews the commercialization plan submitted by the licensee in support of its application for license. The plan must provide information on the licensee’s capabilities, proposed development expenditures, milestones, a time line to commercialization, and an assessment of the intended market.
A license may be exclusive, partially exclusive (exclusive for a particular field of use or geographic area), or non-exclusive. Once a license is executed, TTO monitors the licensee for timely payments and for its diligence in commercializing the licensed invention.
TTO also negotiates Government Purpose Licenses to transition NRL technologies for manufacture and sale solely for Navy and other U.S. Government pur-poses.
CRADAs provide a vehicle for NRL scientists and engineers to collaborate with their counterparts in industry, academia, and state and local governments. Under a CRADA, a company may provide funding for collaborative work between it and NRL and is granted an exclusive option to license technologies developed under that CRADA’s Statement of Work (SOW). TTO works with the NRL scientist to develop a SOW that has sufficient detail to define the scope of the CRADA partner’s rights.
Technical Information Services
The Technical Information Services (TIS) Branch combines publication, printing and duplication, graph-ics, photographic, multi media, exhibit, and video services into an integrated organization. Publication services include writing, editing, composition, publica-tions consultation and production, and printing man-agement. Quick turnaround digital black-and-white and color copying/printing/CD duplicating services are provided. TIS uses digital publishing technology to produce scientific and technical reports that can be used for either print or Web. Graphics support includes
technical and scientific illustrations, computer graph-ics, design services, photographic composites, display posters, and framing. The HP large format printers offer exceptional color print quality up to 1200 dpi and produce indoor posters and signs with 56 inches being the limitation on one side. Lamination and mounting are available. Photographic services include digital still camera coverage for data documentation, both at NRL and in the field. Photographic images are captured with state-of-the-art digital cameras and can be output to a variety of archival media. Photofinishing services provide custom printing and quick service color prints from digital files. Video services include producing video reports and technical videos, and capturing presentations of scientific and technical programs. TIS digital video editing equipment allows in-studio and on-location editing. The TIS Exhibits Program works with NRL’s scientists and engineers to develop exhibits that best represent a broad spectrum of NRL’s technolo-gies and promote these technologies to scientific and nonscientific communities at conferences throughout the United States.
RESEARCH SUPPORT FACILITIES
NRL’s CT-Analyst, which provides instant-aneous, 3D predictions of airborne particle transport in urban settings, has been devel-oped for use in specific cities.
Visual information specialists discussing a project with a technical editor.

the naval research laboratory | 2012 NRL REVIEW 71
Administrative Services
The Administrative Services Branch is responsible for collecting and preserving the documents that com-prise NRL’s corporate memory. Archival documents include personal papers and correspondence, labora-tory notebooks, and work project files — documents that are appraised for their historical or informational value and considered to be permanently valuable. The
Branch provides records management services, train-ing, and support for the maintenance of active records, including electronic records, as an important informa-tion resource. The Branch is responsible for processing NRL’s incoming and outgoing correspondence and provides training and support on correct correspon-dence formats and practices. The Branch is responsible for NRL’s Forms and Reports Management Programs (including designing electronic forms and maintain-ing a Web site for Lab-wide use of electronic forms), compiles and publishes the NRL Code Directory and Organizational Index, and is responsible for providing NRL postal mail services for first class and accountable mail and for mail pickup and delivery throughout NRL. The Branch also provides NRL Locator Service.
Ruth H. Hooker Research Library
NRL’s Ruth H. Hooker Research Library continues to support NRL and ONR scientists in conducting their research by making a comprehensive collection of the most relevant scholarly information available and useable; by providing direct reference and research support; by capturing and organizing the NRL research portfolio; and by creating, customizing, and deploying a state-of-the-art digital library.
Print and digital library resources include extensive technical report, book, and journal collections dating back to the 1800s housed within a centrally located research facility that is staffed by subject specialists and information professionals. The collections include
44,000 books; 80,000 digital books; 80,000 bound historical journal volumes; more than 3,500 current journal subscriptions; and approximately 2 million technical reports in paper, microfiche, or digital format (classified and unclassified). Research Library staff members provide advanced information consulting; literature searches against all major online databases including classified databases; circulation of materials from the collection including classified literature up to the SECRET level; and retrieval of articles, reports, proceedings, or documents from almost any source around the world. Staff members provide scheduled and on-demand training to help researchers improve productivity through effective use of the library’s resources and services.
The Research Library staff has developed and is continuing to expand the NRL Digital Library. The Digital Library currently provides desktop access to thousands of journals, books, and reference sources to NRL-DC; NRL-Stennis; NRL-Monterey; and the Office of Naval Research.
Library systems provide immediate access to scholarly information, including current issues of journals and conference proceedings that are fully searchable at the researcher’s desktop (more than 4,000 titles). Extensive journal archives from all the major scientific publishers and scholarly societies are now available online. The breadth and depth of content available through TORPEDO, NRL’s locally loaded
digital repository, continues to grow and provides a single point of access to scholarly information by providing full text search against journals, books, conference proceedings, and technical reports from 19 publishers (13.2 million items by March 22, 2012). The NRL Online Bibliography, a Web-based publications information system, is ensuring that the entire research portfolio of written knowledge from all NRL scien-tists and engineers since the 1920s will be captured, retained, measured, and shared with current and future generations.
Librarians working in the Ruth H. Hooker Research Library.
Employees of the Administrative Services Branch working in the mail room.

72 2012 NRL REVIEW | the naval research laboratory
NRL has acquired or made arrangements over the years to use a number of major sites and fa cil ities outside of Washington, D.C., for
research. The largest facility is locat ed at the Stennis Space Center (NRL-SSC) in Bay St. Louis, Mississippi. Others include a facility near the Naval Postgraduate School in Monterey, Cali fornia (NRL-MRY), and the Chesa peake Bay De tachment (CBD) and Scientific Development Squadron One (VXS-1) in Maryland. Addi tional sites are located in Vir ginia, Alabama, and Flori da.
Stennis Space Center (NRL-SSC)
The NRL Detachment at Stennis Space Center, Mississippi (NRL-SSC), consists of NRL’s Oceanog-raphy Division and portions of the Acoustics and Marine Geosciences Divisions. NRL-SSC, a tenant at NASA’s John C. Stennis Space Center (SSC), is located in the southwest corner of Mississippi, about 40 miles northeast of New Orleans, Louisiana, and 20 miles from the Mississippi Gulf Coast. Other Navy tenants at SSC include the Commander, Naval Meteorology and Oceanography Command (CNMOC), the Naval Ocean-ographic Office (NAVOCEANO), Naval Oceanography Operations Command, Naval Oceanography Antisub-marine Warfare Center, Naval Oceanography Mine Warfare Center, Fleet Survey Team, Naval Small Craft Instruction and Technical Training School, Special Boat Team Twenty-two, and Navy Human Resources Service Center Southeast. Other Federal and State agencies at SSC involved in marine-related science and technology
include the National Oceanic and Atmo-spheric Administration (NOAA) National Coastal Data Develop-ment Center and the NOAA National Data Buoy Center, the U.S. Geological Survey, the Environmental Protec-tion Agency (EPA) Gulf of Mexico Program and EPA Environmental Chemistry Laboratory,
the Center of Higher Learning, University of Southern Mississippi Department of Marine Science, and Mis-sissippi State University. NRL-SSC benefits from the collocation of CNMOC and NAVOCEANO, which are major operational users of the oceanographic, acoustic, and geosciences technology developed by NRL-SSC
researchers. NAVOCEANO operates the Navy DoD Supercomputing Resource Center, one of the nation’s High Performance Computing Centers, which provides operational support to the warfighter and access to NRL for ocean and atmospheric science and technol-ogy.
The Acoustics branch and Marine Geosciences and Oceanography Divisions occupy more than 175,000 ft2 of research, computation, laboratory, administrative, and warehouse space. Facili-ties include the sediment core laboratory, transmis-sion electron microscope, moving-map composer facility, underwater navigation control laboratory, computed tomography scanning laboratory, real-time ocean observations and forecast facility, ocean color data receipt and processing facility, environmental microscopy facility, maintenance and calibration systems, Ocean Dynamics & Prediction Computational Network Facility, and numerous labo-ratories for acoustic, geosciences, and oceanographic computation, instrumentation, analysis, and testing. Special areas are available for constructing, staging, refurbishing, and storing seagoing equipment.
Monterey (NRL-MRY)
NRL’s Marine Meteorology Division (NRL-MRY) is located in Monterey, California, on a 5-acre Navy Annex about one mile from the Naval Postgraduate School (NPS) campus. This group has occupied this site since the early 1970s, when the U.S. Navy collocated the meteorological research facility with the operational
OTHER RESEARCH SITES
The JEOL JEM-3010 transmission electron microscope.
Slocum gliders, autonomous underwater vehicles, are equipped with temperature/salinity/pressure sensors and with real-time satellite connection to the Iridium network.
NRL Monterey’s new 15,000 ft2 Marine Meteorology Center. The building was constructed through the MILCON program, Project P-174, and was dedicated on October 12, 2012.
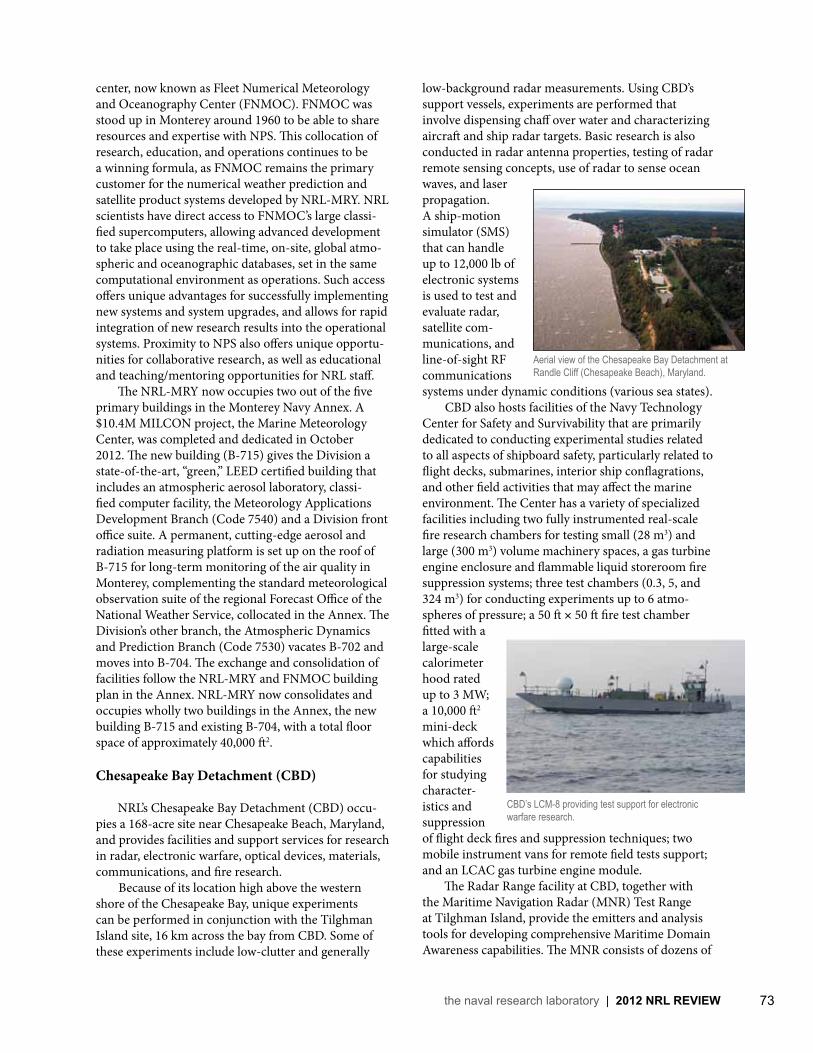
the naval research laboratory | 2012 NRL REVIEW 73
center, now known as Fleet Numerical Meteorology and Oceanography Center (FNMOC). FNMOC was stood up in Monterey around 1960 to be able to share resources and expertise with NPS. This collocation of research, education, and operations continues to be a winning formula, as FNMOC remains the primary customer for the numerical weather prediction and satellite product systems developed by NRL-MRY. NRL scientists have direct access to FNMOC’s large classi-fied supercomputers, allowing advanced development to take place using the real-time, on-site, global atmo-spheric and oceanographic databases, set in the same computational environment as operations. Such access offers unique advantages for successfully implementing new systems and system upgrades, and allows for rapid integration of new research results into the operational systems. Proximity to NPS also offers unique opportu-nities for collaborative research, as well as educational and teaching/mentoring opportunities for NRL staff.
The NRL-MRY now occupies two out of the five primary buildings in the Monterey Navy Annex. A $10.4M MILCON project, the Marine Meteorology Center, was completed and dedicated in October 2012. The new building (B-715) gives the Division a state-of-the-art, “green,” LEED certified building that includes an atmospheric aerosol laboratory, classi-fied computer facility, the Meteorology Applications Development Branch (Code 7540) and a Division front office suite. A permanent, cutting-edge aerosol and radiation measuring platform is set up on the roof of B-715 for long-term monitoring of the air quality in Monterey, complementing the standard meteorological observation suite of the regional Forecast Office of the National Weather Service, collocated in the Annex. The Division’s other branch, the Atmospheric Dynamics and Prediction Branch (Code 7530) vacates B-702 and moves into B-704. The exchange and consolidation of facilities follow the NRL-MRY and FNMOC building plan in the Annex. NRL-MRY now consolidates and occupies wholly two buildings in the Annex, the new building B-715 and existing B-704, with a total floor space of approximately 40,000 ft2.
Chesapeake Bay Detachment (CBD)
NRL’s Chesapeake Bay Detachment (CBD) occu-pies a 168-acre site near Chesapeake Beach, Maryland, and provides facilities and support services for re search in radar, elec tronic warfare, optical devices, materials, com muni cations, and fire research.
Because of its location high above the western shore of the Chesapeake Bay, unique experi ments can be per formed in con junction with the Tilghman Island site, 16 km across the bay from CBD. Some of these experi ments include low-clutter and gener al ly
low-back ground radar measurements. Using CBD’s sup port vessels, experiments are per formed that involve dispensing chaff over water and characterizing aircraft and ship radar targets. Basic research is also con duct ed in radar antenna properties, testing of radar remote sensing con cepts, use of radar to sense ocean waves, and laser propagation. A ship-motion simulator (SMS) that can handle up to 12,000 lb of electronic systems is used to test and evaluate radar, satellite com-munications, and line-of-sight RF communications systems under dynamic conditions (various sea states). CBD also hosts facilities of the Navy Technology Center for Safety and Survivability that are primarily dedicated to conducting experimental studies related to all aspects of shipboard safety, particularly related to flight decks, submarines, interior ship conflagrations, and other field activities that may affect the marine environment. The Center has a variety of specialized facilities including two fully instrumented real-scale fire research chambers for testing small (28 m3) and large (300 m3) volume machinery spaces, a gas turbine engine enclosure and flammable liquid storeroom fire suppression systems; three test chambers (0.3, 5, and 324 m3) for conducting experiments up to 6 atmo-spheres of pressure; a 50 ft × 50 ft fire test chamber fitted with a large-scale calorimeter hood rated up to 3 MW; a 10,000 ft2 mini-deck which affords capabilities for studying character-istics and suppression of flight deck fires and suppression techniques; two mobile instrument vans for remote field tests support; and an LCAC gas turbine engine module.
The Radar Range facility at CBD, together with the Maritime Navigation Radar (MNR) Test Range at Tilghman Island, provide the emitters and analysis tools for developing comprehensive Maritime Domain Awareness capabilities. The MNR consists of dozens of
Aerial view of the Chesapeake Bay Detachment at Randle Cliff (Chesapeake Beach), Maryland.
CBD’s LCM-8 providing test support for electronic warfare research.

74 2012 NRL REVIEW | the naval research laboratory
radars that represent a precise cross section of today’s actual MNR environment. An integrated suite of advanced sensors has been developed for data collec-tion and processing to identify and classify vessels. A suite of similar sensors and processors has been inte-grated into a transportable shelter, the Modular Sensor System (MSS), that can be rapidly deployed to ports or other sites for enhanced maritime awareness reporting.
Scientific Development Squadron One (VXS-1)
Scientific Development Squadron One located at Naval Air Station Patuxent River, MD, is manned by approximately 11 Naval Officers, 55 Enlisted Sailors, and 8 civilians. VXS-1 provides an airborne science and technology (S&T) research platform to the Naval Research Laboratory and Naval Research Enterprise (NRE) efforts. VXS-1 is the sole airborne S&T squad-ron in the U.S. Navy’s inventory and conducts scientific research and advanced technological development for the Department of Defense, the Department of the Navy, Naval Air Systems Command (NAVAIR), the National Science Foundation (NSF), the Missile Defense Agency (MDA), the Joint Improvised Explo-sive Device Defeat Organization (JIEDDO), and many other governmental and nongovernmental agencies. VXS-1 operates and maintains two NP-3Ds, one NP-3D (AEW/CEC), and two RC-12 research aircraft. In addition, the squadron also serves as the Aircraft Reporting Custodian (ARC) for eight Scan Eagle Unmanned Aerial Systems (SE UAS) and the U.S. Navy’s only manned airship, the MZ-3A. VXS-1 routinely conducts a wide variety of S&T missions from remote detachment locations around the globe.
The squadron has completed research detachments to Marine Corps Base Kaneohe Bay, HI; U.S. Coast Guard Station Barbers Point, HI; NAS Point Mugu, CA; Naval Air Weapons Station China Lake, CA; Dakar, Senegal, Cape Verde, Africa; and locally at NAS Patuxent River, MD. In FY11/12, VXS-1 provided flight support for numerous diverse research programs: Office of Naval Research Code 31’s Rough Rhino/Persistent Autono-
mous Surveillance System (PASS), focused on systems integration, sensor fusion, and performance testing of systems in real-world maritime patrol environments; NRL Marine Geosciences Division’s Project PERSEUS, sponsored by JIEDDO, performing multiband synthetic aperture radar (MBSAR) counter-IED capabilities expansion research; numerous multinational detach-ments supporting MDA’s testing and experimentation, vital to the success of air and surface-based missile tracking and interceptor tests; NRL’s Tactical Electronic Warfare (TEW) Division, supporting the Navy’s tactical
electronic warfare requirements; Defense Advanced Research Projects Agency Atomic Clock vibration data collection testing; Office of Naval Research Low Observable/Counter Low Observable program office’s Gimbaled Airborne Tracking Radar II sensor develop-ment testing; and multiple RC-12 detachments sup-porting both the National Oceanic and Atmospheric Administration’s Gravity for the Redefinition of the American Vertical Datum (GRAV-D) survey, and Multiple-Link Common Data Link Systems testing for NRL’s TEW Division. The squadron’s ongoing contribu-tions to the NRE now total over 70,500 flight hours spanning nearly five decades of Class “A” mishap-free operations.
Midway Re search Center
The Midway Research Center (MRC) is a world-wide test range that provides accurate, known signals as standards for performance verification, validation, cali-bration, and anomaly resolution. In this role, the MRC ensures the availability of responsive and coordinated scheduling, transmission, measurement, and reporting of accurate and repeatable signals. The MRC, under the auspices of NRL’s Naval Center for Space Technology, provides NRL with state-of-the-art facilities dedicated to Naval communications, navigation, and basic research. The headquarters and primary site is located on 162 acres in Stafford County, Virginia. The main site
Project Perseus, Iraq, July–October 2010.
Scientific Development Squadron ONE personnel.

the naval research laboratory | 2012 NRL REVIEW 75
consists of three 18.2 m, radome-enclosed precision tracking antennas and a variety of smaller antennas. The MRC has the capability to transmit precision test signals with multiple modulation types. Its normal con-figuration is transmit but can be configured to receive as required. The MRC also provides cross-mission and cross-platform services from worldwide locations using a combination of fixed and transport-able resources and a quick-reaction, unique signals capability. Assets include Pulstar Systems (several worldwide locations), a 45 m tracking antenna in Palo Alto, California, and a 25 m tracking antenna system on Guam. The MRC instrumentation suite includes nanosecond-level time reference to the U.S. Naval Observatory, precision frequency standards, accurate RF and microwave power measurement instrumenta-tion, and precision tracking methodologies. The MRC also contains an Optical Test Facility with two special-ized suites of equipment: a multipurpose Transportable Research Telescope (TRTEL) used for air-to-ground optical communications and for passive satellite track-ing operations, and a satellite laser ranging (SLR) system built around a 1 m telescope as a tool for improving customer ephemeris validation processes.
Pomonkey Facility
The Naval Research Laboratory’s Pomonkey Facil-ity is a field laboratory with a variety of ground-based antenna systems designed to support research and development of space-based platforms. Located 25 miles south of Washington, D.C., the facility sits on approximately 140 acres of NRL-owned land, which protect its systems from encroaching ground-based interferers. Among its various precision tracking anten-nas, the facility hosts the largest high-speed tracking antenna in the United States. Boasting a diameter of 30 m, its range of trackable platforms includes those in low Earth orbit through those designed for deep space missions. The facility’s antenna systems are capable of supporting missions at radio frequencies from 50 MHz through 20 GHz and can be easily configured to meet a variety of mission requirements. The ease of system configuration is due to the facility’s stock of multiple
The NRL Pomonkey Facility.
antenna feeds, ampli-fiers, and downconvert-ers. Other facility assets include an in-house ability to design, fab-ricate, test, and imple-ment a variety of radio frequency components and systems. The facil-ity also hosts a suite of spectrum analysis instrumentation that, when coupled to its antenna systems, pro-vides a unique platform for a variety of research and development mis-sions.
Blossom Point Satellite Tracking and Command Facility
The Blossom Point Satellite Tracking and Command Facility (BP) provides engineering and operational support to several complex space systems for the Navy and other sponsors. BP provides direct line-of-sight, two-way communications services with spacecraft in multiple bands and multiple orbits includ-ing LEO, HEO, GEO, and lunar. Additionally, with BP as a node on the Air Force Satel-lite Control Network (AFSCN), it has the capability to provide cover-age worldwide. BP consists of a satellite mission operations center, multiple antennas, and an infra-structure capable of providing space system command, control, and management. Specific BP resources include the following:
Common Ground Architecture (CGA): CGA is government-owned software that provides infrastruc-ture and reusable components facilitating construction of command, control, and monitoring systems for space vehicle development, integration, test, and operations. CGA with Automated Ground Operations (AGO) software allows for 5×8 (lights out) operations or 24×7 operations. Current missions include 13 satellites with 186 worldwide contacts per day. The GAO-10-55 report
Blossom Point Satellite Tracking and Command Facility.
Midway Research Center satellite calibration facility in Stafford, Virginia.

76 2012 NRL REVIEW | the naval research laboratory
dated October 2009, titled Challenges in Aligning Space Systems Components, lauds BP with CGA as one facility that can control a variety of satellites.
Hardware Architecture: Based on RF, video, and matrix switching with net-centric control and process-ing, virtually any hardware asset can be “switched” into a path to create the correct capability required for any mission. This architecture supports both classified and unclassified operations and missions, and internal LANs support multiple simultaneous mission opera-tions. Salient resources include antennas; receivers; telemetry, tracking, and command (TT&C); command encoder; front-end processors; operations automatic data processing (ADP) resources; and satellite health and monitoring/engineering evaluation and mainte-nance (SHM/EEM).
Marine Corrosion and Marine Coatings Facilities
The Chemistry Division’s Marine Corrosion and Coatings Facility located in Key West, Florida, offers a “blue” ocean environment with natural seawater characterized by historically small compositional variation and a stable biomass. This continuous source of stable, natural seawater provides a site ideally suited
for studies of marine environ-ment effects on materials, including accelerated and long-term expo-sure testing and materials evalu-ation. The site maintains capa-bilities for exten-sive RDT&E
of marine engineering and coatings technologies and supports a wide array of Navy and industrial sponsors. Equipment is available for experiments involving accel-erated corrosion and weathering, general corrosion, long-term immersion and alternate immersion, fouling, electrochemical phenomena, coatings application and characterization, cathodic protection design, ballast water treatment, marine biology, and corrosion moni-toring. In 2009, the facility received a comprehensive refurbishment due to hurricane damage.
Ex-USS Shadwell Research Platform
The Navy Technology Center for Safety and Surviv-ability has a full-scale test ship, the ex-USS Shadwell located at the Joint Maritime Test Detachment (JMTD),
Demonstration of the removal of non-skid coating by heat induction at NRL Key West.
Little Sand Island, Mobile, Alabama. The ex-USS Shadwell is a 457 ft, 9000 ton dock landing ship (LSD). All ship systems germane to damage control are main-tained including heating and air conditioning (HVAC), smoke ejection system (SES), one complete Collective Protection System (CPS) (replicating zone two of the DDG 51 class ships), electrical, lighting, and internal communication systems (including wire-free and WLAN communications). Specialized test areas include
a hangar bay, flight deck with helicopter mockup, sub-marine test area, machinery space, shipboard magazine including a PVLS magazine, and well deck/vehicle stowage areas. Three damage control lockers are also maintained. The data are collected and displayed via a blown fiber gigabit network that is distributed through-out the ship. In addition, Little Sand Island has a wave tank that is used for in situ burn tests and studies for oil spill containment.
Moored in Mobile Bay, Alabama, the ex–USS Shadwell is regularly set ablaze in a controlled environment to further the safety of operational Navy and civilian firefighting measures.

Featu
red Re
searc
h78 How Do You Say It? Shibboleth: Phonological Analysis of Non-Native Speakers of English
W.K. Frost, D.J. Perzanowski, and R.C. Page
85 Electromagnetic Railgun Barrel Damage Experiments
R.A. Meger, B. Huhman, J. Neri, T. Brintlinger, H. Jones, J. Michopoulos, R. Cairns, and S. Douglass
96Spatiotemporal Multicolor Labeling of Mammalian Cells: Quantum Dots
Extend the Utility of Fluorescent Techniques in BiologyJ.B. Delehanty, K.B. Gemmill, I.L. Medintz, C.E. Bradburne, K. Susumu, B.C. Mei, D. Farrell,
H. Mattoussi, J.B. Blanco-Canosa, and P.E. Dawson
103Terahertz Astrophysics with the Herschel Space Observatory
J. Fischer, J.S. Carr, R.L. Lucke, and E.J. Polisensky
112Oceanic Hot Spots — Internal Tides in the Global Ocean
J.G. Richman, J.F. Shriver, E.J. Metzger, P.J. Hogan, G.A. Jacobs, and B.K. Arbic
122Deep-Water Acoustic Anomalies from Methane Hydrate in the Bering Sea
W. Wood, G. Barth, D. Scholl, and N. Lebedeva-Ivanova
131Wind at the Top of the Atmosphere
C.R. Englert, C.M. Brown, D.P. Drob, J.T. Emmert, J.M. Goldspiel, A.W. Nicholas, D.E. Siskind, A.W. Stephan, M.H. Stevens, J.M. Harlander, and K.D. Marr
Members of the NRL Railgun Group

Friend or Foe?
It is 1100 BCE on the eastern banks of the Jordan River. Several checkpoints along the river ensure the safety of the border between Gilead on the eastern
shore and Ephraim on the western shore. Ephraimites recently invaded, but their attempted occupation is failing. Gileadite border patrols and military checkpoint personnel have been warned about enemy deserters attempting to re-cross the Jordan. However, identifying friend or foe is a problem, since both groups are ethnically, linguistically, and culturally related. A commander, familiar with the various dialects in the region, orders all security personnel to interrogate individuals traveling west, by asking them to say the word meaning “stream or ford.” He informs his forces that their enemies, the Ephraimites, will not pronounce this word shibboleth with an initial sh-sound, as in the word “shoe.” Instead, they will say “sibboleth,” since their dialect does not permit words to begin with the sound sh. According to the book of Judges 12:5-6, the Gileadites defeated the Ephraimites and blocked their safe return to their homeland on the other side of the Jordan. Three thousand years later, using a person’s speech for linguistic and cultural identity continues to be of interest to the military and intelligence communities. The Naval Research Laboratory’s Shibboleth project uses the phonological information contained in a speaker’s accent to make determinations about that individual’s native language and dialect.

79featured research | 2012 NRL REVIEW
LANGUAGE AS AN INDICATOR
From Biblical times to World War II, military and intelligence-gathering individuals have been using dialect variation and accents to isolate what are called phonological “shibboleths” to identify individuals’ backgrounds, nationalities, and cultures, and in so doing distinguish friend from foe. For example, U.S. forces stationed in northern Europe used one shibbo-leth to distinguish friendly Dutch-speaking forces and citizens from the potential German-speaking enemy. To the untrained American listener, Dutch and German speakers sound similar, as do their accents when these individuals are speaking English. If a U.S. soldier was doubtful about an individual’s identity or background, he knew that he could easily distinguish between the two nationalities by asking the individual to pronounce the name of the Dutch seacoast town, Schevenigen. A German, untrained in the Dutch language, would have some difficulty replicating the complex word-initial consonant cluster of “Sxevenigen,” instead pronounc-ing it as “Shevenigen.” Today, in our post-9/11 world, quick identification of friends and foes, terrorists and non-terrorists, has become a crucial aspect of national defense and a main component of the global war on terrorism. To aid in the identification of potential threats, various biometric devices are used in conjunction with metal and explosive detectors. Retinal scans and fingerprinting, for example, are used, but these meth-ods take time and resources that may not be readily
How Do You Say It?Shibboleth: Phonological Analysis of Non-Native Speakers of English
W.K. Frost, D.J. Perzanowski, and R.C. PageInformation Technology Division
To assist in the war on global terrorism, the Naval Research Laboratory’s Shibboleth project is investigating the speech of non-native speakers of English. At U.S. military checkpoints around the world, warfighters typically speak in English when they interrogate individuals wishing to cross the checkpoints. The respondents, non-native
English speakers, reply in English. By studying the speech of these non-native speakers, linguists at NRL are determining the phonological rules that characterize or distinguish accents of non-native English speakers. With this information, we can determine the native language of the speakers using rule-based phonological patterns. This helps to identify potential threats when, for example, an individual is trying to hide something or avoid identification by lying about himself or herself. Knowing the phonological identity or correctly identifying the accent of an individual can aid the warfighter in determining whether persons of interest are telling the truth or lying about their identities.
available at a busy or remote border station or check-point. To supplement and enhance these techniques, the Naval Research Laboratory’s Shibboleth project seeks to enable phonological analysis of individuals’ speech to determine a person’s linguistic background, by comparing and contrasting known phonological variations in speech and accents with those of suspect persons. While individuals might hide behind the guise of another nationality, using a forged passport, for example, people have a difficult time hiding their lin-guistic identity. People may attempt to train themselves to speak differently, by mimicking a different dialect or accent, but phonological analyses of their speech pat-terns can detect the disguise or inconsistency. This type of analysis can be used today in countries like Afghani-stan, where six different native languages are dominant in its 34 provinces (Fig. 1). Even for a linguistically trained warfighter who may be familiar with one or two of those languages, this is a daunting situation.
THE PHONOLOGICAL BASES Of LANGUAGE
Speech is the result of various muscle movements in the oral cavity that incorporates the nasal passage, mouth, and lips, and extends to the larynx or pharynx (Fig. 2). These movements, coupled with air expelled from the lungs and modulated by the vocal cords, create differences in sound and produce changes in air pressure. These differences can be seen in a spectro-gram (Fig. 3) that records the amount of air pressure produced over time. The more vividly colored bands

80 2012 NRL REVIEW | featured research
(pink and blue) in the spectrogram, for example, ex-hibit a concentration of air pressure measured in hertz (Hz). Typical human speech ranges from 300 to 3500 Hz. Because varying air pressure and altering the con-figuration of the various speech apparatuses mentioned above causes all human speech sounds, spectrograms offer an excellent depiction of what speech sounds look like when visually mapped to a representation of what is happening inside the human anatomy. A gloss in Fig. 3 indicates where the various sounds or “phones” of the utterance “Show me your I.D.” occur, and the spectro-gram offers a visual representation of the amount of acoustic energy or air pressure measured at the various points along the speech continuum. This provides information about various acoustic features that characterize speech sounds. For example,
the difference between the initial sound or “phone” in pat and bat is what is known as “voicing.” In pat, the initial sound is called “voiceless” because no air is being forced out of the lungs and modulated by the vocal cords. On the other hand, in bat, the initial sound is “voiced” because air is being expelled from the lungs causing the vocal cords to vibrate. Other distinc-tive phonetic features can be used to identify speech sounds. Typically, these features are constrained to a binary representation so that the feature [+/– voice] is realized as [+voice] for the phone b and [–voice] for the phone p.
Coupled with the acoustic depiction of speech sounds is the classification of speech sounds by manner of articulation. This set of classifiers captures how the musculature is manipulated and how various articula-tors, such as the tongue and teeth, are used to produce a particular sound. For example, we say that both b and p are bilabial, since they employ the use of the lips in producing the sounds. Thus, these two phones employ the feature of [+/– bilabial]. Both b and p are [+bila-bial] and with the acoustic feature discussed above, b = [+voice, +bilabial] and p = [–voice, +bilabial]. Using such features, we distinguish these two phones, but we also distinguish them from other phones, such as d = [+voice, –bilabial] and t = [–voice, –bilabial]. Using this system of binary classification, we can distinguish the various speech sounds of the world’s languages. The International Phonetic Association (IPA), founded in Paris in 1886, continues to have as its aim the creation and maintenance of a standard of phonetic representa-tion for all of the sounds of the world’s languages. (See Fig. 4 for a representation of an IPA chart depicting the sounds of American English.) However, human speech does not consist of individual phones uttered, but of sequences of sounds in various combinations. Phonology is the science that constructs rules that characterize how the vari-ous phones of the world’s languages are combined. Languages exhibit rules that either permit or restrict
FIGURE 1Majority languages spoken in the provinces of Afghanistan.
FIGURE 2Cutaway diagram of the human vocal tract.
FIGURE 3Spectrogram of the phrase “Show me your I.D.”

81featured research | 2012 NRL REVIEW
the combination of certain sounds in that language. We have seen examples of some restrictions in histori-cal examples above. The phonologist determines what those permissions and constraints are and characterizes them for various human languages. By doing so, the phonologist is both depicting what is permissible in a particular language and predicting what is impermis-sible. A native speaker of a language intuits these rules, and non-native speakers either have difficulty emulat-ing those speech patterns or never learn them. This gives rise to the tell-tale “shibboleths” in their speech.
SHIBBOLETH: A TOOL fOR ACCENTIDENTIfICATION
The process of automatically determining a speaker’s first language or dialect from the accent per-ceived in a second language has two main components: rule learning and accent classification. Shibboleth, our prototypical tool for phonological analysis, first learns phonological rules from phonetic transcriptions for each language or dialect to which it is introduced, and compiles these rules into rule sets. These rule sets serve as a constantly evolving repository of informa-tion describing the phonological space made up of any dialect in any language. This mechanism enables users in the field to train Shibboleth on previously unmapped languages or dialects and lessens reliance on analyses from trained linguists. Thus far, Shibboleth has used
the data in the George Mason University Speech Accent Archive,1 an archive of speakers from around the world, to create and to modify its rule sets. Training data, used to initialize the learning of these rules sets, shows the phonological representation of the influences of a speaker’s native language or dialect when the sample is compared to the “standard” tran-scription. This can be used to observe differences from a speaker’s native language to a second language learned as an adolescent or adult, or to note when a speaker is speaking a non-standard dialect of a language, such as speakers of one of the regional U.S. dialects, Southern American English. The process of creating rule sets for individual dialects within a language is identical to that for creating rule sets for another language. With a dia-lect, however, the phonological differences will generally be more subtle and harder to detect. The Shibboleth program distinguishes differences by tracking every time a sound or phone varies be-tween a speaker of an unidentified dialect and a generic American speaker. It catalogues both the change itself, the number of times the change occurred, and the en-vironment in which the change occurred. For example, it notes when a speaker switches the l and the r sounds in a word, such as saying “lice” for the word “rice.” It also notes if the speaker did so consistently, or only at the beginning of words. It also notes if this exchange happened every time at the beginning of the word that should have started with an r, or if it only occurred once.
FIGURE 4IPA charts of American English consonants and vowels.

82 2012 NRL REVIEW | featured research
An example of a common phone change in Ameri-can English is the merging of ε and i in some dialects, such as Southern American English. This change would cause the words “pen” and “pin” to become homopho-nous, or sound identical, for speakers of that dialect. This one relatively simple phone change would give rise to 320 rules, creating a combinatorial explosion that the program must process over the course of an utterance. Asking even a trained linguist to manage such a large set of rules is awkward, cumbersome, time-consum-ing and error-prone. Therefore, Shibboleth is being designed to relieve individuals, such as warfighters, of such a burden. Depending upon the specificity of the rule (i.e., if the rule is based on one phonetic feature, such as voicing) or its generality (i.e., if it is based on several features, such as voicing and a particular place of articulation), the amount of evidence for the rule from the speakers, and the probability of the rule, given the sample, each rule in the rule set is assigned a weight using a Bayesian average as an additive smoothing algo-rithm to adjust the score. The use of the Bayesian aver-age adjusts rule scores for rules whose environments occur either much more frequently than the average environment (e.g., the combination ing at the end of words in English) or much less frequently than the average environment (e.g., the cluster thr in English). After analyzing various languages, dialects, or language families, Shibboleth stores the resultant rules in a database, and the system moves on to accent classification. Speech samples in which the speaker’s native language or dialect is unknown or in doubt, such as those of a speaker at a border checkpoint, are compared to the existing rule sets to find the language or dialect that is the most likely match. The strength of the match to the rule set is determined by the deviation from the mean score of the proposed matched rule set, and provides the user with a certainty rating of “high,” “moderate,” or “low.” In addition to pinpointing native languages or dialects, Shibboleth’s rule sets can also be a useful tool in recognizing lesser known or infrequently occurring phonological phenomena across languages or in gathering data on how dialects might change due to an individual subject’s demographic information and background.
LANGUAGE AND DIALECT RESULTS
We have tested Shibboleth on a preliminary data-base of Italian and German rule sets, as well as on four major American English dialects. The results have been largely positive, with Shibboleth correctly determining individual accents at the language level in 82% of the speakers examined, and at the dialect level for 77% of the speakers.
The language differentiation task contained 44 speakers, comprised of 15 native Italian speakers, 15 native German speakers, and 14 native American English speakers, all of whom spoke in English. From a 69-word speech sample, Shibboleth correctly identified 9 of the Italian speakers, 14 of the German speakers, and 13 of the American English speakers, as shown in Fig. 5. A speaker who scored between 0 and 0.1 is considered to have unaccented speech, where 0 is completely unaccented American English. A speaker with a score in any foreign language higher than 0.1 is considered to be a non-native speaker of American English. If multiple scores for a speaker were higher than 0.1, the highest score is considered to be the likely native language of the speaker. It should, therefore, be noted that Shibboleth correctly identified the speakers better than chance in all cases. As mentioned previously, dialect comparisons are more difficult, as the divergence from a standardized sample will be smaller. The dialect differentiation task performed with Shibboleth compared Northern, South-ern, Midland, and Western American English dialects, and the speaker sample was comprised of seven North-ern dialect speakers, seven Southern dialect speakers, four Midland dialect speakers, and four Western dialect speakers. From the same sample, Shibboleth correctly identified with some level of certainty five of the North-ern speakers, five of the Southern speakers, three of the Midland speakers, and all four of the Western speakers. Because of the small sample size, we do not wish to comment on the accuracy of these identifications. Fur-thermore, the certainty on many of these placements was low, indicating the need for additional research to obtain more classification accuracy.
SUmmARy
The Shibboleth program recognizes the likely native language and dialect of an individual by analyz-ing the person’s accent in a second language or dialect, here, American English. It can be trained to recognize the accents of previously unsampled languages and dialects in the field, making it an adaptable tool for the warfighter or border guard who may not have access to other databases or have a specialized language back-ground to make complicated linguistic distinctions of the type outlined here. Initial tests of the system have given positive results, although certainty ratings of the classifications, particularly on dialect variation, need to be strengthened.
ACkNOwLEDGmENTS
The authors thank Steven Weinberger from George Mason University, Stephen Kunath from Georgetown

83featured research | 2012 NRL REVIEW
FIGURE 5Accent scores for (a) native Italian speakers matched against German and Italian rule sets; (b) native German speakers matched against German and Italian rule sets; and (c) native American English speakers matched against German and Italian rule sets.
(a)
(b)
(c)

84 2012 NRL REVIEW | featured research
University, and student interns Danielle Schrimmer and Jodi Lamm. [Sponsored by the NRL Base Program (CNR funded)]
Reference1 S. Weinberger, The Speech Accent Archive, George Mason Uni-
versity (2012). Retrieved from http://accent.gmu.edu.

The railgun is quickly hurtling toward inclusion on future Navy
platforms, thus revolutionizing the design and use of those platforms
and, in turn, Navy strategies and tactics. This hypervelocity,
multimegajoule, hypersonic electric launcher has been demonstrated in
more than a thousand successful launches, promising new capabilities for
the Navy, including long-range fire support, antiship warfare, and ship self-
defense against air threats.
Great power does not come easily. Launching projectiles at extreme
velocities and energies is difficult. In-bore failure of the projectile due
to barrel wear or material fatigue can have catastrophic consequences.
Therefore, attention is now aimed at studying, measuring, analyzing, and
simulating rail and barrel wear-and-tear on the micro level. The Naval
Research Laboratory’s Materials Testing Facility (MTF) is concentrating
on the microscopic nitty-gritty of railgun barrel science and technology in
quantifying rail wear and damage. Using their expertise in armature design,
profilometry, metallography, and modeling and simulation, MTF laboratory
personnel are helping to develop an operational railgun that will perform
in real-world Navy-relevant conditions. With the ability to rapidly modify
the barrel to test designs and materials, MTF staff have continuously
modified and upgraded the railgun system and transferred their results to
NSWC Dahlgren, Virginia, the Navy’s lead lab for railgun research, for full
implementation.
Staring Down the Barrel of
a railgun…

86 2012 NRL REVIEW | featured research
Electromagnetic Railgun Barrel Damage Experiments
R.A. Meger, B. Huhman, and J. NeriPlasma Physics Division
T. Brintlinger, H. Jones, and J. MichopoulosMaterials Science and Technology Division
R. Cairns and S. DouglassSotera Defense Solutions, Inc.
The Navy has invested considerable resources over the last decade in the development of hypervelocity electric launcher technology. The program has been highly successful, demonstrating a multimegajoule hypersonic railgun launch. A prototype weapon system is expected to be on a naval platform within the next decade. The Navy railgun,
when fully developed and coupled with guided projectile technology, will provide new capabilities for multiple Navy missions. These include long-range fire support for littoral missions, naval antiship or small craft surface warfare, and ship self-defense against air threats. High-performance electric launch weapons will thus have a significant effect on Navy strate-gies and tactics. The Naval Research Laboratory is a partner with the Office of Naval Research in this development effort. NRL’s focus is the science and technology behind high-power railguns. To fully exploit the potential of this technology, the reproduc-ibility of the launch and the lifetime of the barrel are important metrics. Single-shot failure or gradual wear of the barrel materials on a shot-to-shot basis can lead to unacceptable barrel lifetime. Damage or wear can lead to lateral acceleration or loss of low-voltage sliding contact, which can affect launch characteristics or rapidly increase wear. Avoiding wear relies on designing armatures and barrels that can withstand the immense forces and high temperatures generated during launch. This requires understanding the wear processes and selecting appropriate designs and materials. The conditions inside a high-power railgun greatly exceed normal engineering constraints. Currents are measured in million amperes (MA), pressures reach hundreds of megapascals (MPa), accelerations exceed 10,000 gravities (10 kilogees), and local temperatures reach the melt temperature of most metals. The NRL program focuses on understanding the launch processes, measuring the conditions during launch, modeling the system, and developing techniques or designs that resolve or mitigate damage mechanisms in the barrel. The NRL railgun program is centered around the Materials Testing Facility (MTF) located on the NRL campus. This facility houses a 6 m long railgun with a 5 cm diameter bore. An 11 megajoule (MJ) capacitive energy store is housed in the laboratory. The railgun is designed to permit rapid modification of the barrel and access for diagnostics to monitor launch performance. Experiments with different rail and armature designs and materials are performed. Over 1000 high-power shots have been fired on the system, which has undergone continuous modification and upgrade over the last 5 years of operation. Results from the experiments are analyzed and compared with state-of-the-art computer modeling, and materi-als are analyzed using detailed metallographic analysis techniques.1 Materials properties are measured and specific bits of physics relevant to the operation are tested using small test stands. This article discusses electromagnetic (EM) launch technology in general and presents examples of barrel damage experiments performed by the NRL program.
EM LAUNCH TECHNOLOGY Railgun technology is based on using electrical rather than chemical energy to accelerate a projectile to high velocity. There are several advantages to using
electrical acceleration. Railguns use magnetic pressure rather than gas pressure to accelerate the projectile. Electrical current is driven through a set of conduc-tors (rails) and the resultant magnetic field accelerates the short circuit (armature) by Lorentz force down the

87featured research | 2012 NRL REVIEW
rails. This mechanism removes the gas expansion limits of propellant guns and allows higher launch velocity. The velocity limits of expanding gases are replaced by the limits of maintaining a low-resistance, high-velocity sliding contact during launch. Electromagnetic acceleration offers the added benefit of allowing the launch parameters to be controlled through the current waveform, which enables optimization or modifica-tion of the launch dynamics. The high launch velocity decreases delivery time, and the high terminal velocity allows one to use kinetic energy rather than explosives for target interaction. The removal of the propellants and explosives simplifies the handling and storage requirements for shipboard applications, and greatly increases onboard safety.
MTF LABORATORY
Figure 1 shows the MTF laboratory including the capacitive energy store and the 6 m railgun. The switch arrays and series inductors can be seen on the individual banks. The figure includes pictures of the target chamber, dual-axis flash X-ray imager, muzzle arc containment, and the breech. The railgun is divided into six 1 m long Type 304 stainless steel containment
segments that are clamped together with vertical thread rods and auxiliary steel supports. The entire structure is mounted on an epoxy laminate base. Current from the different banks is combined and fed into the rails in the breech. The rails are terminated by tungsten copper electrodes at the muzzle, which are designed to arc to electrodes after the armature leaves the gun. Current still flowing in the system is dissipated by the resistance of the muzzle arc and the rails themselves. The muzzle blast is contained by a cylindrical steel structure. Magnetic field probes are located along the length of the gun to measure the location of the armature as it is accelerated down the barrel. Probes are located at the breech and muzzle ends of the gun to monitor the volt-age between the rails. Figure 2 shows a cross section of the railgun. In this example, 0.25 in. thick rectangular steel liners are used for the rail surface. The rails are mounted verti-cally and backed with 1 in. thick copper rails. The rail spacing is set by “T” insulators located on the top and bottom of the core. The figure shows a nominally 1.8 in. × 1.75 in. flat rail core. Epoxy–glass fiber laminated ma-terial is used for the “T” insulator and for the insulators surrounding the rails. The stainless steel containments clamp the core in place. Wedges located inside of the
FIGURE 1The top image shows a view of the NRL Materials Testing Facility with the capacitor bank energy store and the railgun. Bottom images show the target chamber, X-ray imager, and muzzle and breech views of the railgun.

88 2012 NRL REVIEW | featured research
containment are adjusted to provide preload to the rails. Different core designs can be substituted for the square bore design shown in the figure by altering the insula-tors.
CApACiTOR BANk DEsiGN
Figure 1 shows the capacitor banks stacked close to the breech of the railgun. Twenty-two 500 kJ solid-state switched capacitor banks are connected to the railgun.2 The banks are charged in parallel over several minutes from several independent power supplies. A solid-state switch (thyristor stack) is triggered to connect the banks to a series 80 microhenry inductor and the railgun. After peak current, a second switch (diode stack) shorts out each bank, isolating the capacitors from the rail-gun and trapping the energy in the inductor and rail system. A resistor located in the diode leg of the circuit provides a series resistance for the individual bank modules, allowing the decay time of the current from a particular bank to be modified. The different banks can be independently triggered, allowing one to modify the current waveform delivered to the railgun. The use of the resistors and the different bank timings allow one to program the waveform. The goal is to generate a relatively flat-topped current waveform but decrease the muzzle current to minimize muzzle arc damage.
ARMATURE DEsiGN
A critical component of a railgun is the armature that serves as the current path between the two rails. Magnetic fields generated by this current then drive the
armature along the rails due to the Lorentz force. A typical armature design has a “C” shape with the sliding contacts following the body of the armature (see Fig. 3). A projectile would be coupled to the armature and pushed down the bore by the current in the armature. The “C” shape utilizes the magnetic pressure generated by the current to push the legs onto the rail surface. The acceleration on the projectile can be measured in tens of kilogees. At these accelerations, the stress on the ar-
mature body itself can exceed elastic yield levels. Com-plicating this is the resistive heating of the armature. This can soften the metal, which lowers the stress that the armature can withstand before it fails. The legs can literally fall off, resulting in loss of the sliding contact, arc generation, and damage to the rails. Armatures are designed using detailed 3D design codes. An example of a model predicting stress in a simple rectangular leg armature is shown in Fig. 3, where a triangular mesh and von Mises stress values in the armature are gener-ated for a simulated launch. Here, the highest stress is in the throat of the armature, which also coincides with the maximum heating region. Thus, one would expect failure of the armature to start in the throat of this armature where the stress is highest.
FIGURE 2A cross section of the MTF railgun is shown. The rails are mounted vertically with a wedge system to provide uniform compression to the rails. The clamshell design containment holds the system together during launch.
FIGURE 3Top: An armature used in high-power launch experiments is shown. The aluminum “C” shaped armature provides a short circuit between the rails as it is accelerated down the rails. The acrylic bore riders keep the armature centered in the gun. The ballast allows the mass of the armature to be adjusted. Bottom: An example of a simulation of the armature response to high pressure loading experienced during launch.

89featured research | 2012 NRL REVIEW
NRL ExpERiMENTs
A wide range of experiments have been performed on the MTF railgun. Figure 4 shows data recorded during several launches using the armature type shown in Fig. 3. The armature was loaded to 27 cm from the breech end of the 6 m long containment. A current monitor on the breech shows 1.5 MA peak current driven in the rails. Voltages between the rails at the breech and muzzle ends of the railgun are also shown. The breech voltage measures the inductive voltage across the rails as the armature moves down the bore added to the voltage across the rails, armature, and slid-ing contact. The muzzle voltage measures the voltage across the front of the armature. A set of magnetic field pick-up loops spaced along the containment moni-tor the armature position during launch, resulting in the velocity vs location curve. The increase in muzzle voltage starting around 4 m indicates that the sliding contact is degrading at the high-velocity end of the gun. This behavior usually indicates the contact has started to transition into a plasma contact rather than a low-resistance metal-to-metal sliding contact. After each shot, the rails and insulators are inspected using a small-diameter camera inserted from the breech to observe any macroscopic damage from the previous shot. The images on the right side of Fig. 4 are from the dual-axis flash X-ray imager located 5 m downstream of the muzzle end of the gun. The imager provides hori-zontal and vertical snapshots of the armature before it hits a steel target plate. The high-voltage X-ray pulse is triggered using a magnetic field sensor just upstream of the imager. The images show some wear and plastic
deformation of the armature legs. In some cases, the legs break off, resulting in images of armatures tilted at an angle and pieces of leg flying beside the body. Just downstream of the X-ray imager is the target chamber. Inside the chamber is a stack of six half-inch-thick steel plates separated by half-inch spacers. The armature usually penetrates the first three or four plates before stopping. Some information about the energy at impact and the orientation of the armature can be obtained from these witness plates.
pROFiLOMETRY
Much useful information is obtained by analyzing the exterior rail topography, a technique referred to as profilometry. For instance, the launches deposit alumi-num from the armature on the surface down nearly the entire length of the gun. Rail surfaces also erode due to the high-pressure metal-on-metal sliding and the large currents at the rail-armature interface. Quantifying the location and amount of deposition or erosion can offer clues to the conditions at this sliding interface during launch. To do this, the surface profiles are mapped us-ing a laser profilometer. Individual profiles are gener-ated every few centimeters along the length of the rails and compiled into complete, 3D representations of the rails, as seen in Fig. 5.
METALLOGRApHY
After profiling, further materials analysis is per-formed. Small samples of the rails are cut out, mounted in a dielectric material, polished, and analyzed using metallographic techniques. A high-resolution camera
FIGURE 4Data from several launches is shown as a function of location in the bore. Peak current is 1.5 MA and launch velocity is 2.25 km/s. Breech voltage peaks at 1 kV and muzzle voltage runs at 100 V until 4 m, where it starts to ramp up before muzzle exit. On the right are two X-ray images of the armature 5 m downstream from the muzzle.

90 2012 NRL REVIEW | featured research
and a scanning electron microscope (SEM) are used to observe the regions near the rail surface. Energy dispersive X-ray spectroscopy (EDS) is used to identify the composition of small spots on the rails. Differ-ent stains and polishing techniques can be applied to bring out the structure of the metals. Micro-hardness measurements can be made to measure changes in the material near the surfaces. Some steels are particularly interesting because they change their hardness or crys-tal structure depending on temperature and heating or cooling rates of the material. This provides information on the heating and cooling rates of the surface. Figure 6 shows results of a metallographic analysis of the rail shown in Fig. 5. A detailed surface profile is shown from the 93 cm location. An SEM image from a spot 4 mm from the edge of the negative rail is shown. This location is in an edge groove eroded by the ten launches on the rail. There is a 14 µm thick deposit on the rail surface at this location. Different layers of alu-minum and iron aluminide can be seen in the deposit. The EDS analysis from the indicated spot shows peaks associated with the Al and Fe atoms. The signals indi-cate roughly equal amounts of aluminum and iron in the layer. After passage of the armature, a molten mix of aluminum and iron is left on the rail surface. All of these layers likely formed during the cool-down phase of the surface. The presence of the iron-aluminide sug-gests that the surface temperature exceeded the 660 °C melt temperature of the aluminum, possibly approach-ing the melt temperature of the steel.
MODELiNG AND siMULATiON
The ultimate goal of the NRL program is to understand the processes involved in high-power railgun launches. This understanding can then be used to improve the design and lifetime of the barrel and to scale the results. A significant fraction of this relies on developing computational codes that contain the appropriate physics. The multiple and coupled physi-cal fields and the multiple size scales and materials involved along with the geometric complexity present make this a difficult problem. Finite element analy-sis (FEA) codes have made great strides over the last decade. The complete railgun problem, however, is still beyond the state of the art. To model a railgun with an FEA code, one breaks the device into a large number of smaller areas or volumes. A mesh defining the different elements is established, similar to the simplified mesh shown in Fig. 3. The size and shape of the different elements are determined by geometry or other consid-erations. The interactions of the different elements of the mesh are governed by a set of equations represent-ing the conservation laws relevant to the physics of the problem. The problem is reduced to solving a very large number of coupled algebraic equations and keeping track of how they move or change during a single time step. The process is then repeated over and over again. This rapidly becomes a very large problem depending on the number of elements and the number of fields participating in the interaction of the different elements
FIGURE 5Data generated by the laser profilometer is shown. The scanner can resolve ~15 µm changes in the rail surface in a 30 µm spot size. The right graph shows selected transverse profiles along the length of the rails from 310 to 6010 mm. The top panel shows an overlay of the profile and optical imagery. The left graphs show various integrals of the change in the surface profiles.

91featured research | 2012 NRL REVIEW
FIGURE 6Microstructure and deposit composition approximately 1 m down-bore and in the region of maximum edge-groove erosion. The thin deposit here appears to have resulted from the deposit of hot liquid follow-ing the passage of the armature on the last shot. The deposit near the rail interface contained more Fe than that observed at 43 cm down-bore, implying a higher interface temperature, at least 1200 °C.
and the length of each time step required to resolve the changes. NRL is at the forefront of FEA modeling. Figure 7 shows the results from a simulation using COMSOL Multiphysics, a state-of-the-art 3D FEA code.3 This figure shows the magnetic flux density on the surfaces of an armature similar to that in Fig. 3. The aluminum armature is moving at ~1 km/s on a copper rail with ~700 kA current passing through the armature. The local high field regions appear on the edges of the armature and behind the armature on the corners of the rail. The high speed of the sliding armature forces the current and the flux to the edges of the rail. This flux concentration is consistent with the edge grooving damage patterns shown in Fig. 5.
TEsT sTAND ExpERiMENTs
The experiments performed on the MTF railgun provide clues on the physics behind high-power railgun launch. In general, railguns operate at what would be considered extreme levels of pressure, current density, acceleration, temperature, etc. to most scientists and engineers. In many cases, the conditions present in the railgun do not fall in regions where materials properties
are well known. To provide needed information, NRL researchers have developed a series of relatively small test stands. These systems allow one to test materials or processes under conditions approaching those in a rail-
FIGURE 7Image shows the results from an FEA simulation of a moving armature on a flat rail. The fully electromagnetic simulation shows the high magnetic flux concentration on the edges of the rail. The effect of field penetration into the rail material is shown by the low flux in the center of the contact region.

92 2012 NRL REVIEW | featured research
FIGURE 8(a) The system used to investigate surface contact arcing. A load frame is used to provide contact pressure similar to that found at the sliding interface in a railgun (A = load cell; B = current connection; C = diagnostic mount). (b) The current waveform driven in the contact is shown along with optical images of the contact during the current pulse. (c) The photo shows damage done to the conductors after the pulse.
gun. An example is shown in Fig. 8. This test apparatus consists of a load frame capable of pushing contacts together with contact pressures comparable to those found in a railgun. The force is applied to a series of small-diameter electrodes made from materials used in railguns. A capacitor bank is attached to drive current through the contact. Voltage probes and high-speed cameras are used to observe the history of the contact. The experiment illustrates how high currents driven in static contacts can result in arcs at the metal-to-metal interfaces depending on the level of force and amount of current at the contact.
sUMMARY AND CONCLUsiONs
The development of a railgun electric launcher has made great strides over the last decade. If brought to its full potential, the technology will significantly change the design of future Navy platforms and alter how these platforms are used. The NRL program is a part of a large Navy program led by the Office of Naval Research and involving multiple Navy, Department of Defense, and private corporations in the United States. The work described in this article is a sample of the type of research going on to understand and advance the tech-nology. The results generated by the NRL program are transferred to the Navy’s lead lab for railgun research, the Naval Surface Warfare Center at Dahlgren, Vir-ginia. The NRL railgun facility has been operational for over 5 years and has fired over 1000 shots thus far. It
has done numerous experiments on the basic physics of railguns. The MTF railgun has routinely launched pro-jectiles at relevant velocities for Navy mission require-ments. The pressures and current densities generated by the system are similar to mission requirements. The damage observed on the rails is the primary hurdle to a viable weapon system. The key to avoiding or mitigating the damage is developing the understanding of the processes involved. Experiments coupled with modeling and detailed materials science are the keys to developing this understanding.
ACkNOwLEDGMENTs
The authors acknowledge significant contributions to the program from C. Carney, Y. Kucherov, J. Feng, V. DeGiorgi, A. Leung, J. Baucom, and S. Wimmer of NRL; C. Berry of L-3 Communications; T. Kijowski of Sotera Defense Solutions; and J. Sprague of Nova Research, Inc. [Sponsored by ONR and the NRL Base Program (CNR funded)]
References1 R.A. Meger, K. Cooper, H. Jones, J. Neri, S. Qadri, I.L. Singer, J.
Sprague, and K.J. Wahl, “Analysis of Rail Surfaces from a Multi-shot Railgun,” IEEE Trans. Magnetics 41(1), 211–213 (2005).
2 J.M. Neri and T. Holt, “Design of a 500-KJ Capacitor Bank Module for EML Materials Testing,” Proceedings of the 2005 IEEE Pulsed Power Conference, ISBN 0780391896, pp. 241–244 (2005).
3 COMSOL Multiphysics, http://www.comsol.com/ (2011).

The ability to see what is going on inside living bodies has been of
immeasurable use in medicine and biology for many years. However,
traditional CT scans and fluorescence-enhanced optical tomography
do not easily allow for five-color spectral imaging, which would enable
simultaneous labeling of multiple structures both inside and outside of
cells. A novel nanoparticle-based approach under development at the Naval
Research Laboratory uses semiconductor quantum dots (QDs) imported
into live cells via peptides, polymers, and microinjection as bright probes to
achieve multicolor fluorescent labeling. The unique physical, spectral, and
chemical qualities of QDs make them applicable to labeling different parts
of cells noninvasively and without killing the cells. NRL’s approach seems
destined to be a key player in both in vitro and in vivo research that should
yield new treatments, tests, and therapies.
Viewing Living Mammalian Cells and Life Processes — In Living Color, Courtesy of Quantum Dots

97featured research | 2012 NRL REVIEW
INTRODUCTION The labeling of mammalian cells with fluorescent molecules (e.g., organic dyes, fluorescent proteins) is a fundamental technique in basic biology and medical diagnostics as it allows for the direct visualization of organelles/cellular structures and the real-time moni-toring of biochemical processes in vivo.1 Of particular
Spatiotemporal Multicolor Labeling of Mammalian Cells: Quantum Dots Extend the Utility of Fluorescent Techniques in Biology
J.B. Delehanty, K.B. Gemmill, and I.L. MedintzCenter for Bio/Molecular Science and Engineering
C.E. BradburneNational Research Council Postdoctoral Fellow, Center for Bio/Molecular Science and Engineering
K. Susumu Sotera Defense Solutions, Inc.
B.C. Mei University of Massachusetts, Amherst
D. FarrellNational Research Council Postdoctoral Fellow, Optical Sciences Division
H. MattoussiFlorida State University
J.B. Blanco-Canosa and P.E. DawsonThe Scripps Research Institute
The fluorescent labeling of mammalian cells is a fundamental yet very powerful technique in basic biological studies and applied medicine/imaging, as it can provide valuable insight into biochemical processes and cellular homeosta-sis. Multicolor fluorescent labeling, the simultaneous labeling of multiple, disparate intra- and extracellular struc-
tures, has long been a goal of fluorescent labeling, yet remains challenging as it requires (1) the combined use of numerous targeting molecules (e.g., antibodies), (2) multistep bioconjugation chemistries, (3) mixed delivery strategies (e.g., transfec-tion reagents), (4) cellular fixation/permeabilization, and (5) complex spectral deconvolution. In this article, we detail a nanoparticle-based approach that uses semiconductor quantum dots (QDs) as extremely bright fluorescent probes deliv-ered to various cellular targets in live cells using peptides, polymers, and microinjection. The unique photophysical attri-butes of the QDs allow for facile five-color spectral imaging that is not readily achievable with conventional fluorophores. This enabling work has important implications for in vitro cellular labeling/sensing and in vivo imaging applications.
interest has been the development of facile ways to achieve the complex multicolor fluorescent labeling within the same cells, as this can ultimately allow for the spatiotemporal resolution of coordinated biological processes. Two major roadblocks have limited the suc-cessful achievement of this goal to date: (1) the physi-cochemical limitations of traditional fluorophores and (2) the development of robust strategies for specifically

98 2012 NRL REVIEW | featured research
labeling subcellular structures. Organic dyes suffer from photoinstability, pH and ionic sensitivity, susceptibil-ity to chemical degradation, low quantum yields, and solubility issues.2 The approach most often taken for the multicolor labeling of disparate cellular structures is to use differentially labeled primary or secondary antibodies. However, the large size (>150 kDa) and cell impermeability of these antibodies necessitates cellular fixation and permeabilization. These processes preserve cellular structure at the cost of killing the cell; hence, this is not a viable technique for the multicolor labeling of live cells. Recent years have seen the continued develop-ment of new fluorophores (e.g., long-lifetime chelates, metallic nanocrystals, and fluorescent proteins) with optical properties that can potentially circumvent some of the aforementioned issues. Semiconductor quantum dots (QDs) appear to hold exciting promise for use in multiplexing applications.3 Among their advantageous photophysical properties are: (1) size-tunable narrow-symmetric photoluminescence, (2) small size (<25 nmhydrodynamic diameter), (3) excellent chemical/photo-stability, (4) very large two-photon action cross sections, (5) ability to excite multiple QD populations at one wavelength significantly blue-shifted from their emis-sion, and (6) ability to serve as efficient Förster reso-nance energy transfer (FRET) donors.2 Concomitant with the development of new QD materials has been the emergence of a range of delivery modalities (e.g., cell-penetrating peptides [CPPs] and polymer transfec-tion reagents) aimed at the noninvasive and nontoxic delivery of a range of materials (including QDs and other nanoparticles) into live cells.4,5
This report presents an antibody-free, spatiotem-poral methodology for the simultaneous multicolor labeling of distinct intra- and extracellular structures in living cells. We use a multipronged approach that exploits multivalent peptide display on QDs, FRET between QD donors and dye acceptors, innate cellular uptake processes (endocytosis and receptor-ligand bind-ing), and physical microinjection (see the schematic in Fig. 1). Our results show the utility of QDs as the basis of a multicolor, live-cell labeling scheme without the need for conjugation to antibodies or cellular fixation/permeabilization. More generally, they demonstrate our fine control over materials at the nanoscale within the context of cells, with important implications for in vitro/in vivo imaging and sensing.
A STRATEgy FOR MULTICOLOR CELLULAR LABELINg
In this study we used peptides, transfection reagents, and microinjection in a combinatorial fashion to target fluorescent QD materials to specific cellular locations and structures. The peptides used herein are shown in Table 1. The cell-penetrating peptide based on polyar-ginine (polyArg) is described elsewhere.6,7 The RGD3 (Arg-Gly-Asp) peptide contains a trimeric “RGD” repeat that is known to facilitate binding to integrin receptors on the cell membrane.8 Each peptide contains a spacer domain that separates the functional domain from a polyhistidine (His6) tract for peptide assembly to the QD surface. The acceptor peptide bears a terminal cysteine residue for labeling with a dye and subsequent use as FRET acceptor when assembled onto the QD.
FIGURE 1Spatiotemporal strategy for the multicolor QD labeling of A549 cells. Peptides, transfection reagents, and microinjection delivered QDs to cellular structures. In some cases, QD-dye energy transfer (FRET) was used to create discrete “spectral windows.”

99featured research | 2012 NRL REVIEW
The specific spectral windows or “channels” used to image the various fluorescent materials used here are represented graphically in Fig. 2. Here, a distinct “slice” or “window” was selected for each fluorophore so as to accommodate the imaging of the ensemble fluorescent materials within cells without the need for complicated spectral deconvolution. The resulting spectral ensemble consisted of both QDs alone and QD-sensitized proxi-mal dye-labeled acceptors to give a series of five in-creasingly red-shifted emission windows that spanned from 510 to 730 nm. QDs emitting at 520 nm and 635 nm provided the first two discrete emission windows. When appended with proximal dye acceptors, two more windows were established. For example, 550 nm QDs with sensitized proximal Cy3 dyes and 635 nm QDs assembled with Cy5 acceptors each created two more spectral channels. These provided four discrete spectral channels that were collectively excited at 457 nm, thus requiring only one excitation source to excite the QD samples. The final channel corresponded to the nuclear dye, DAPI, excited at 405 nm and imaged at <450 nm.
MULTISTEp, MULTICOLOR LABELINg
To achieve multicolor labeling, we delivered QDs to A549 cells (a human adenocarcinomic alveolar basal ep-ithelial cell line) over a 4-day period while maintaining cellular integrity and viability. We recently showed that PULSin™, a commercially available amphiphilic poly-mer, could mediate the efficient cellular uptake of QDs. After 4 days in culture, a modest portion of the QDs were released to the cytosol while the majority remained entrapped within late endocytic vesicles.6 Our five-step delivery regime outlined in Fig. 1 began with the deliv-ery of 520 nm QDs using the PULSin™ polymer. After 4 days in culture, peptide-mediated QD delivery was then used to deliver QDs to the early endosomal pathway. To achieve this, 635 nm QDs appended with 25 CPP pep-tides per QD were incubated with cells for 30 minutes. The next step used the direct microinjection of QDs into the cellular cytosol. Here, 550 nm QDs appended with Cy3-bearing acceptor peptides (for FRET configuration) or 580 nm QDs with no peptides (non-FRET configura-tion) were injected under microscopic examination over
FIGURE 2Spectral windows. Selected absorption and emission spectra of the QDs and dyes used in this study. DAPI, QD, and dye emission windows are in gray. DAPI (405 nm) and QD-dye (457 nm) excitation are represented by vertical blue dotted lines.
Peptide: Sequence:CPP (Arg)9GlyGlyLeuAlaAibSerGlyTrpLys(His)6
RGD (ArgGlyAspSerGly)2ArgGlyAspGlyLeuAib(Ala)3TrpGlyGly(His)6
Acceptor Cys*GlySerGly(Ala)3GlyLeuSer(His)6
Aib = α-amino isobutyric acid (a synthetic amino acid derivative).Functional peptide modules: cell uptake, membrane-binding, spacer, QD attachment, and *dye-labeling-site.
TABLE 1 — Peptide Sequences Used

100 2012 NRL REVIEW | featured research
a 3-hour period. After microinjection, another QD-dye pair was used to label integrin receptors on the plasma membrane. For this step, 635 nm QDs were first deco-rated with four Cy5-containing acceptor peptides and 20 copies of the integrin-binding RGD peptide. After incubation for 20 minutes, the cells were washed, fixed to preserve cellular structure and labeling, and subse-quently incubated with DAPI for nuclear staining. As evidenced in Fig. 3(panel set A), this delivery regime resulted in cells that were clearly labeled in a spatiotemporal fashion with five distinct fluorophores — four QDs (two engaged in FRET) and one nuclear dye — and these are imaged in six separate spectral windows including differential interference contrast (DIC). As shown in Fig. 3(panel set B), we repeated this same delivery scheme using microinjected 580 nm QDs that were not engaged in FRET. As expected, a very similar staining pattern was observed, highlight-ing the flexibility available in selecting various emission
windows by simply altering the nature of the materials used.
SUMMARy
In this report, we have detailed a facile method for the robust, multicolor labeling of live cells without the need for fixation or permeabilization. The scheme takes advantage of the unique spectral properties of QDs combined with various cellular delivery modalities to label cells in culture over a 4-day period. Further, it eliminates the reliance on elaborate imaging acquisition schemes and complicated deconvolution exercises to spectrally resolve the distinct spectral windows cor-responding to each color. This approach demonstrates the facile nature by which correct materials selection can avail controlled, noninvasive labeling of live cells and shows the fine nature of control over materials at the nanoscale for biological applications. We envision
FIGURE 3Representative images of an A549 cell collected after sequential delivery of the indicated color QDs to specific cellular structures. Each color corresponds to a different QD or QD-dye-labeled cellular structure. The DIC image shows the cellular outline and contour. (A) Image set from cells microinject-ed (cytosol) with 550 nm QD-Cy3 conjugates engaged in FRET. (B) Panel showing 580 nm QDs that were injected into the cytosol yielding a non-FRET emission for that channel. Scale bar is 5 μm.

101featured research | 2012 NRL REVIEW
our approach will have a profound impact on the use of QDs and other nanoparticle materials in Department of Defense applications such as vaccine and therapeu-tics development.
ACkNOwLEDgMENT
This work was supported by the Defense Threat Re-duction Agency (DTRA)/Army Research Office (ARO), the Defense Advanced Research Projects Agency (DARPA), the NRL Base Funding Program, and the NRL Institute for Nanoscience. [Sponsored by DTRA/ARO, DARPA, and NRL]
References1 B.N. Giepmans, S.R. Adams, M.H. Ellisman, and R.Y. Tsien,
“The Fluorescent Toolbox for Assessing Protein Location and Function,” Science 312, 217–224 (2006).
2 K.E. Sapsford, L. Berti, and I.L. Medintz, “Materials for Fluores-cence Resonance Energy Transfer Analysis: Beyond Traditional Donor-Acceptor Combinations,” Angew. Chem. Int. Ed. Engl. 45, 4562–4589 (2006).
3 I.L. Medintz and H. Mattoussi, “Quantum Dot-Based Reso-nance Energy Transfer and its Growing Application in Biology,” Phys. Chem. Chem. Phys. 11, 17-45 (2009).
4 J.B. Delehanty, K. Boeneman, C.E. Bradburne, G. Robert-son, and I.L. Medintz, “Quantum Dots: A Powerful Tool for Understanding the Intricacies of Nanoparticle-Mediated Drug Delivery,” Expert Opin. Drug Del. 6, 1091–1112 (2009).
5 J.B. Delehanty, H. Mattoussi, and I.L. Medintz, “Delivering Quantum Dots Into Cells: Strategies, Progress and Remaining Issues,” Anal. Bioanal. Chem. 393, 1091–1105 (2009).
6 J.B. Delehanty, C.E. Bradburne, K. Boeneman, K. Susumu, D. Farrell, J.B. Blanco-Canosa, G. Dawson, P.E. Dawson, and I.L. Medintz, “Delivering Quantum Dot–Peptide Bioconjugates to the Cellular Cytosol: Escaping from the Endolysosomal System,” Integrat. Biol. 2, 265–277 (2010).
7 J.B. Delehanty, I.L. Medintz, T. Pons, F.M. Brunel, P.E. Dawson, and H. Mattoussi, “Self-Assembled Quantum Dot−Peptide Bio-conjugates for Selective Intracellular Delivery,” Bioconj. Chem. 17, 920–927 (2006).
8 U. Hersel, C. Dahmen, and H. Kessler, “RGD Modified Poly-mers: Biomaterials for Stimulated Cell Adhesion and Beyond,” Biomaterials 24, 4385–4415 (2003).

Herschel Offers a Front-Row Seat to the Merging ofGalaxies in the Cold and Dusty Universe
I n showcasing the universe over the full terahertz range of frequencies for the first time, the Herschel Space Observatory is affording researchers an unprecedented
spectroscopic view of the processes of planet and galaxy formation. Herschel, which hosts the largest single-mirror telescope in space and is in orbit about a point in space a million miles more distant from the Sun than Earth, is a European Space Agency-led effort with significant participation by NASA. Naval Research Laboratory scientists from the Remote Sensing Division contributed to the success of Herschel by measuring and modeling aspects of the telescope performance prior to launch, thereby allowing optimal use during the mission’s predicted 3.8 year lifetime. NRL scientists and collaborators have used Herschel to make spectacular discoveries about how gas-rich spiral galaxies collide, merge, and evolve to form a single, elliptically shaped, gas-poor galaxy. They have witnessed previously unseen massive amounts of high velocity molecular gas outflowing from the central regions of the galaxy merger, that appear to be in the process of clearing away the star-forming fuel in the transformed galaxy. Early analysis suggests that the powerful outflows may be driven by activity generated by central supermassive black holes.

104 2012 NRL REVIEW | featured research
TeraherTz radiaTion — an Underexplored SpecTral domain
The terahertz domain nominally subsumes the far-infrared and submillimeter spectral regions, extend-ing from about ν ~ 0.3 THz (λ = 1 mm) to 10 THz (λ = 30 μm). Sandwiched between two spectral bands with relatively high atmospheric transmission, the long-wave infrared (LWIR) and microwaves at cen-timeter wavelengths, the terahertz spectral domain is at a disadvantage for use on the Earth’s surface due to its relatively poor transmission through the atmo-sphere. Moreover, terahertz detectors achieve their best sensitivities only when operated cryogenically at temperatures near zero degrees Kelvin using superfluid helium. These and other challenges have hampered terahertz technology advances as well as its applica-tion to biology, security and defense, and astrophysics. Large two-dimensional arrays of detectors needed for efficient terahertz astrophysical observations have only recently been developed and are still not comparable in size to those available for optical and near-infrared astronomy. Moreover, the approximately 1000-fold in-crease in wavelength of terahertz waves compared with optical light means that for the same diameter tele-
Terahertz astrophysics with the herschel Space observatory*J. Fischer, J.S. Carr, R.L. Lucke, and E.J. Polisensky
Remote Sensing Division
Naval Research Laboratory scientists are part of a multinational team that designed and built the European Space Agency’s Herschel Space Observatory, home to the largest single-mirror telescope launched to space and the first observatory to cover the wide terahertz frequency range from 0.5 to 6 THz. Herschel, with its powerful suite of
terahertz instrumentation, opens a new window on the cold and dusty universe. Now that Herschel is in operation, NRL scientists and their collaborators are using terahertz spectroscopy to study the distribution of water vapor and other mol-ecules in planet-forming disks around young stars in our galaxy, and to investigate the transformation of merging gas-rich disk galaxies into single gas-poor elliptically shaped galaxies. In this article, we highlight early Herschel results on the most spectacular class of galaxy mergers, the ultraluminous infrared galaxies. Herschel terahertz spectroscopy of these merging galaxies reveals a rich absorption spectrum due to molecules and molecular ions, providing a wealth of information on the cool molecular environment and chemistry in the central regions of the mergers. Perhaps the most spectacular discovery is the existence of massive outflows of molecular gas from the merger centers, in some cases at velocities exceeding 1000 kilometers per second, or 2.2 million miles per hour. The results indicate that the galaxies with the strongest signatures of accreting black hole activity have the highest outflow rates and that the mass of gas expelled from the galaxy is higher than the mass of gas consumed in forming stars. These outflows appear capable of exhausting the galactic reservoirs of star-forming gas, as is necessary if they are to evolve into gas-poor elliptical galaxies.
scope, the spatial resolution of terahertz observations is worse by the same factor! On the other hand, advan-tages for short-range terrestrial applications include transmission through optically opaque materials and unique spectroscopic features of various chemical and biological materials. Military and security applications of interest include spectroscopic detection and identifi-cation of chemical, biological, and nuclear weapons as well as security screening and identification of materi-als such as explosives, pharmaceuticals, and concealed weapons. In astrophysics, the terahertz range is key for understanding the physics of the medium between the stars — the (usually) cool interstellar medium (ISM).
TeraherTz aSTrophySicS iS cool
Terahertz photons dominate the emitting radiation distribution from cold material in the ISM. They can penetrate further through dusty regions that obscure the optical and ultraviolet radiation. The ISM in our own Milky Way galaxy, as well as in distant galaxies, consists of clouds of gas and dust particles that often surround and obscure forming stars and the super-massive black holes in galaxy centers. The gas and dust particles in these clouds are typically colder than
* Herschel is an ESA space observatory with science instruments provided by European-led Principal Investigator consortia and with important participation from NASA.

105featured research | 2012 NRL REVIEW
temperatures here on Earth, where matter is typically at “room temperature” (~300 degrees Kelvin). The small dust particles in interstellar space, estimated to be fractionally about 1/100 of the mass in gas, usu-ally attain their local equilibrium temperatures of 10 to 100 K as a result of ultraviolet heating by stars balanced by radiative cooling. Dust particles at these temperatures produce spectral energy distributions that peak in the far-infrared half of the terahertz spectral range. Interstellar gases in these regions are typically in atomic or molecular form and are excited to similarly low kinetic temperatures, with spectral lines that fall within the terahertz range. Dust temperatures can be determined based on observations of their broadband continuum spectral energy emission, while gas exci-tation is estimated via spectroscopic observations of multiple spectral lines of an abundant gas constituent. The terahertz range includes many important cooling lines of abundant molecules in the ISM, including lines of water, CO, OH, and ammonia. These lines can be used as powerful diagnostics of the excitation, chemis-try, and kinematics of the ISM and can be used to help unravel the intrinsic spectral energy distribution and thus the nature of energy sources that are obscured at shorter wavelengths by dust in the ISM. Even “cooler,” because the universe is expanding, the far-infrared ra-diation from the ISM in distant galaxies that is just now reaching us from earlier epochs of peak star-formation and black hole accretion is Doppler shifted to the “red-der” submillimeter part of the terahertz range.
herSchel — a TeraherTz obServaTory aT The earTh-SUn Second lagrange poinT
In order to study dust-embedded star and planet formation in our galaxy and in the distant universe, the Herschel Space Observatory1 was launched to space by the European Space Agency (ESA) in May 2009 (see Fig. 1). Hosting a 3.5 m diameter telescope, Herschel is the largest single-mirror telescope ever launched to space and the first observatory to cover the full far-infrared to submillimeter spectral range (55 to 670 µm in wavelength / 0.5 to 6 THz in frequency). Herschel was launched to an orbit around the Earth-Sun second Lagrange point, known as L2, a point along the Sun–Earth axis, one million miles more distant from the Sun than the Earth (see Fig. 2). Because an object orbiting L2 always maintains the same approximate relative orientation with respect to the Sun and Earth, which both “shine” at terahertz wavelengths, thermal shield-ing is simplified. The observatory houses a suite of instruments built by a multinational team that includes partners from Europe, the United States (NASA), and Canada. It is named after Sir Frederick William Herschel, who discovered at the beginning of the 19th
century that there is electromagnetic radiation at wave-lengths longer than those visible to the human eye. As one part of our contribution to the Herschel optical system, Naval Research Laboratory scientists in the Remote Sensing Division and our international collaborators carried out prelaunch laboratory mea-surements and modeling efforts to predict how the telescope would be expected to perform in space. Because cryogens needed to cool the detectors limit the observatory to a relatively short lifetime of ~3.8 years, these predictions were vital for maximizing the scientif-ic return of the mission. With sound predictions for the performance of the instrument package, astronomers worldwide were able to design and propose observa-tional programs prior to launch that were well tuned to the sensitivity of the observatory and could make ef-ficient use of the observing time. Because of Herschel’s large primary mirror size, it is passively, radiatively cooled, rather than cryogenically cooled. At its operat-ing temperature of 80 to 90 K, the mirror’s own thermal radiation is the background photon noise determin-
FIGURE 1Herschel was launched aboard an Ariane 5 rocket together with Planck, a mission to map the cosmic microwave back-ground. (Figure courtesy of European Space Agency.)

106 2012 NRL REVIEW | featured research
ing the sensitivity of astronomical observations. A set of NRL-led laboratory measurements of the terahertz emissivity of the aluminum-coated silicon carbide telescope mirror samples, with and without a precisely deposited thin layer of dust to simulate the actual condition of the mirrors after launch,2 enabled predic-tion of the telescope background and thus the ultimate sensitivity of two of the three Herschel instruments. In another NRL-led study, a combination of theoretical and numerical analysis enabled accurate simulation of the interference effects of unwanted back reflection of instrument feedhorn noise from the central scatter cone of the Cassegrain telescope’s secondary mirror surface,3 which was specifically designed to achieve a flat baseline for the third Herschel instrument.
galaxy TranSformaTionS — herSchel diScoverieS
NRL studies with Herschel have centered on a class of galaxies known as ultraluminous infrared galaxies (ULIRGs), galaxies with infrared–submillimeter lumi-nosities greater than that of a trillion Suns. In com-parison, our relatively normal Milky Way galaxy has a total luminosity of just 25 billion times that of the Sun. The high luminosities of ULIRGs are more similar in magnitude to the optical luminosities of quasars, which are compact objects powered by accreting supermas-sive black holes. Studies of these galaxies have shown that they trace a spectacular stage in galaxy evolution: the morphological transformation of merging gas-rich galaxies into gas-poor elliptical galaxies. The Herschel studies of ULIRGs are being carried out in collabora-tion with an international team of astronomers and are aimed at determining the processes involved in this transformation.
Pre-Herschel spectroscopy of nearby ULIRGs showed that their far-infrared spectra are dramati-cally different from the spectra of other infrared-bright galaxies.4 Figure 3 (left) shows the spectra of the 10 brightest far-infrared galaxies. The only ULIRG in this sample, Arp 220, is plotted at the top of the figure. The far-infrared spectra of the other, lower luminosity galax-ies typically consist of continua produced by radiation of warm dust particles and emission lines of neutral and ionized gaseous carbon, oxygen, and nitrogen. In these galaxies, the dust heating and gas excitation are predominantly due to irradiation by the ultraviolet radiation of bright young stars. In contrast, the infrared emission in ULIRGs is thought to be powered by a com-bination of UV heating due to young stars and accre-tion onto central supermassive black holes. As in lower luminosity galaxies, the far-infrared spectra of Arp 220 and other ULIRGs are characterized by warm dust continuum emission, but the gas spectra are dominated by absorption lines of water, OH, and other molecules. These stark differences are due to two different effects of dust absorption of radiation. Because of the strong UV radiation field at the centers of these galaxies, the ratio of ionized to atomic gas increases. The lower density of neutral gas means that there are fewer neutral atoms available to absorb the ultraviolet photons. The lower gas opacity, compared with the dust opacity, results in a smaller fraction of gas ionizations compared with the dust continuum emission.5 A second effect occurs because, due to infall of gas and dust into the galaxy centers during the early stages of the merger, the dust opacities are so high that even the far-infrared emission lines are absorbed.6 New Herschel observations of Arp 220 provide dramatic insight into the chemistry of the “molecular atmosphere” surrounding the nucleus of this galaxy merger. The far-infrared spectrum of Arp 220 observed with the Herschel Photodetector Array Camera and Spectrometer (PACS)7 is shown in Fig. 4. It reveals a rich molecular chemistry, traced by absorption lines of H2O, OH, H2
18O,18OH, HCN, NH, CH, HF, NH2, NH3, H2O+, H3O+, and OH+.8 These lines arise from low energy levels, ranging from the ground state to greater than 600 K, that are populated via far-infrared pump-ing due to the high far-infrared photon densities in the nuclear regions of Arp 220. The high abundances of water- and nitrogen-bearing molecules are indicative of the evaporation of molecules from the mantles of dust grains, while the high abundances of OH are suggestive of the effects of X-rays or cosmic rays from a dust-ob-scured super-starburst or accreting supermassive black hole.8 An equally spectacular result is the discovery of massive amounts of molecular gas flowing outward from the central regions of some ULIRGs,9,10 with out-flow velocities on the order of 1000 km s–1, or 2.2 mil-
FIGURE 2Herschel orbits around the second Lagrange point, L2. In this relatively constant environment, it can be well shielded from emission from the Earth and Sun and can hover without using too much fuel.

107featured research | 2012 NRL REVIEW
lion miles per hour. Figure 3 (right) shows the Herschel PACS velocity-resolved line profiles of the OH and 18OH doublets at 119 and 120 μm in Mrk 231, the most luminous of the local ULIRGs and host to an accreting supermassive black hole. The Doppler velocities are plotted with respect to the shorter wavelength transi-tion of the OH doublet. The observed combination of absorption at negative velocities (Doppler shifted to the blue) and emission at positive velocities (redshifted) is known as a P-Cygni profile and is indicative of an outflow away from a central source, here traced by the OH and 18OH gas. The absorbing gas is moving toward the observer and must be along the line of sight and in front of the nuclear continuum emission, while the
emitting gas is moving away from the observer and may be alongside or behind and laterally displaced from the nucleus. Figure 5 presents the PACS velocity profiles for Mrk 231 and four other ULIRGs that were observed early in the mission in the OH transition at 79 μm. The figure also shows the profile for the lower lu-minosity IR-bright galaxy NGC 253 (lower right panel), whose Infrared Space Observatory (ISO) spectrum was plotted in the far-infrared spectral sequence (Fig. 3, left). The rest frame wavelength of a nearby water line that appears to also trace the outflow is marked. Models for the outflowing gas based on multiple velocity components (black curves) were fit to the data and are plotted in Fig. 5. In all of these cases, P-Cygni profiles
FIGURE 3(Left) The Infrared Space Observatory (ISO) Long Wavelength Spectrometer far-infrared spectra of 10 infrared-bright galaxies, including the bright ULIRG Arp 220 (top), whose spectrum is dominated by molecular absorption of OH and water. The vertical axis, ν Fν, is the power measured at Earth per unit area at a given frequency, ν. The spectra are shifted in order of the relative strength of the [O III] 88 μm line. The excitation potential, the energy required to create the species, is given in electron volts for each species. The Roman numeral next to the atomic species identifier refers to the ionization state, with the convention that [O I] is a forbidden line of neutral oxygen and [O III] is a forbidden line of twice ionized oxygen. (Right) P-Cygni absorption/emission profiles (black histograms) around the OH 119 μm and 18OH 120 μm partially resolved doublets in the ULIRG Mrk 231 are compared with our modeled profiles (red curve).9 Fν is the power measured at Earth per unit frequency per unit area. The velocity scale is with respect to the rest-frame of the leftmost OH doublet component. Outflowing gas in front of the continuum dust emission appears in absorption and is blueshifted because it is moving toward the observer, while gas moving laterally and away from the observer appears in emission.
Far-Infrared Spectra of IR-Bright Galaxies
50 100 150 200Rest Wavelength (μm)
υ
Fυ
Cen A
Arp 220
Arp 299
M 82
NGC 253
NGC 4945
IC 342
M 83
NGC 1068
NGC 2146
[O II
I] E P
=35
eV[N
III]
E P=3
0 eV
[O I]
EP=
0 eV
[O II
I] E P
=35
eV
[N II
] EP=
15 e
V
[O I]
EP=
0 eV
[C II
] EP=
11 e
V
H2O
OH
CH
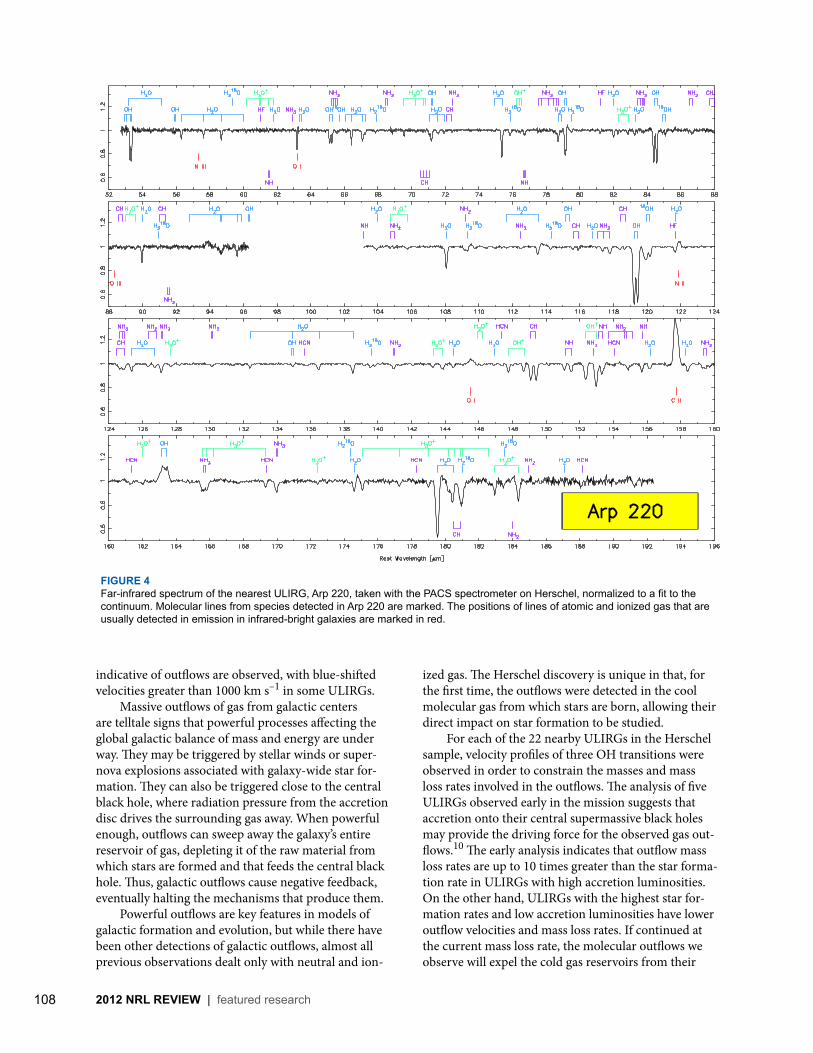
108 2012 NRL REVIEW | featured research
indicative of outflows are observed, with blue-shifted velocities greater than 1000 km s–1 in some ULIRGs. Massive outflows of gas from galactic centers are telltale signs that powerful processes affecting the global galactic balance of mass and energy are under way. They may be triggered by stellar winds or super-nova explosions associated with galaxy-wide star for-mation. They can also be triggered close to the central black hole, where radiation pressure from the accretion disc drives the surrounding gas away. When powerful enough, outflows can sweep away the galaxy’s entire reservoir of gas, depleting it of the raw material from which stars are formed and that feeds the central black hole. Thus, galactic outflows cause negative feedback, eventually halting the mechanisms that produce them. Powerful outflows are key features in models of galactic formation and evolution, but while there have been other detections of galactic outflows, almost all previous observations dealt only with neutral and ion-
ized gas. The Herschel discovery is unique in that, for the first time, the outflows were detected in the cool molecular gas from which stars are born, allowing their direct impact on star formation to be studied. For each of the 22 nearby ULIRGs in the Herschel sample, velocity profiles of three OH transitions were observed in order to constrain the masses and mass loss rates involved in the outflows. The analysis of five ULIRGs observed early in the mission suggests that accretion onto their central supermassive black holes may provide the driving force for the observed gas out-flows.10 The early analysis indicates that outflow mass loss rates are up to 10 times greater than the star forma-tion rate in ULIRGs with high accretion luminosities. On the other hand, ULIRGs with the highest star for-mation rates and low accretion luminosities have lower outflow velocities and mass loss rates. If continued at the current mass loss rate, the molecular outflows we observe will expel the cold gas reservoirs from their
FIGURE 4Far-infrared spectrum of the nearest ULIRG, Arp 220, taken with the PACS spectrometer on Herschel, normalized to a fit to the continuum. Molecular lines from species detected in Arp 220 are marked. The positions of lines of atomic and ionized gas that are usually detected in emission in infrared-bright galaxies are marked in red.

109featured research | 2012 NRL REVIEW
galactic centers within 106 to 108 years. The analysis of the full Herschel ULIRG dataset will enable study of the effects of dust obscuration and ionizing photon rate and will help shed further light on this important stage of morphological transformation in galaxy evolution. TeraherTz aSTrophySicS poST-herSchel
Even with the largest single-mirror primary in space, the diffraction-limited resolution of Herschel at far-infrared wavelengths is not sufficient to spatially re-solve the newly discovered ULIRG molecular outflows. Spatial information is necessary to understand how the outflows are driven and to examine the possible role of dense focusing structures in directing the gas flows. To obtain the angular resolution required to character-ize the spatial structure of these molecular outflows, interferometers are required. The newly operational Atacama Large Millimeter Array (ALMA) in Atacama, Chile, is an international astronomical spatial inter-ferometer that operates at submillimeter wavelengths and will be able to observe molecules in ULIRGs and to study the coldest dust components. Ideally, observa-tions should be carried out at far-infrared wavelengths where ULIRGs emit the bulk of their luminosity. Some-day, astronomers will be able to spatially resolve nearby ULIRGs in the far-infrared by building an interfero-metric array of telescopes like Herschel and flying them in formation in space.
FIGURE 5Observed PACS continuum-normalized spectra of the OH 79 μm doublet transitions (gray shaded) of five ULIRGs and of the infrared-bright lower luminosity galaxy NGC 253. The velocity scale is with respect to the rest-frame of the leftmost OH doublet component. Overplotted are the best fit model fits (solid curve).10 The arrows indicate the rest position of an H2O line at 78 μm.
acknowledgmenTS
The authors would like to thank their collabora-tors for contributions to joint publications referred to in this article. This research was jointly sponsored by the Office of Naval Research and by the NASA Herschel Science Center. PACS has been developed by a consor-tium of institutes led by MPE (Germany) and including UVIE (Austria); KU Leuven, CSL, IMEC (Belgium); CEA, LAM (France); MPIA (Germany); INAF-IFSI/OAA/OAP/OAT, LENS, SISSA (Italy); and IAC (Spain). This development has been supported by the funding agencies BMVIT (Austria), ESA-PRODEX (Belgium), CEA/CNES (France), DLR (Germany), ASI/INAF (Italy), and CICYT/MCYT (Spain). [Sponsored by the NRL Base Program (CNR funded) and NASA/JPL/Caltech]
references1 G.L. Pilbratt, J.R. Riedinger, T. Passvogel, G. Crone, D. Doyle,
U. Gageur, A.M. Heras, C. Jewell, L. Metcalfe, S. Ott, and M. Schmidt, “Herschel Space Observatory. An ESA Facility for Far-Infrared and Submillimetre Astronomy,” Astronomy & Astrophysics 518, L1 (2010).
2 J. Fischer, T. Klaassen, N. Hovenier, G. Jakob, A. Poglitsch, and O. Sternberg, “Cryogenic Far-Infrared Laser Absorptivity Mea-surements of the Herschel Space Observatory Telescope Mirror Coatings,” Appl. Optics 43, 3765–3771 (2004).
3 R. Lucke, J. Fischer, A.M. Polegre, and D.A. Beintema, “Fast Computation of the Narcissus Reflection Coefficient for the

110 2012 NRL REVIEW | featured research
Herschel Far-Infrared/Submillimeter-Wave Cassegrain Tele-scope,” Appl. Optics 44, 5947–5955 (2005).
4 J. Fischer, “The Promise of FIRST Spectroscopy of Normal and Dwarf Galaxies,” Symposium Proceedings, The Promise of the Herschel Space Observatory, eds. G. Pilbratt, J. Cernicharo, A. Heras, T. Prusti, and R. Harris, ESA Publication SP-460, pp. 131–138 (2001).
5 N. Abel, C. Dudley, J. Fischer, S. Satyapal, and P. van Hoof, “Dust-Bounded Ultraluminous Infrared Galaxies: Model Pre-dictions for Infrared Spectroscopic Surveys,” Astrophys. J. 701, 1147–1160 (2009).
6 E. González-Alfonso, H. Smith, J. Fischer, and J. Cernicharo, “The Far-Infrared Spectrum of Arp 220,” Astrophys. J. 613, 247–261 (2004).
7 A. Poglitsch et al., “The Photodetector Array Camera and Spectrometer (PACS) on the Herschel Space Observatory,” Astronomy & Astrophysics 518, L1 (2010).
8 E. González-Alfonso, J. Fischer, J. Graciá-Carpio, E. Sturm, S. Hailey-Dunsheath, D. Lutz, A. Poglitsch, A. Contursi, H. Feuchtgruber, S. Veilleux, H. Spoon, A. Verma, N. Christopher, R. Davies, A. Sternberg, R. Genzel, and L. Tacconi, “Herschel/PACS Spectroscopy of NGC 4418 and Arp 220: H2O, H2
18O, OH, 18OH, OI, HCN and NH3,” Astronomy & Astrophysics 541, A4 (2012).
9 J. Fischer, E. Sturm, E. González-Alfonso, J. Graciá-Carpio, S. Hailey-Dunsheath, A. Poglitsch, A. Contursi, D. Lutz, R. Gen-zel, A. Sternberg, A. Verma, and L. Tacconi, “Herschel/PACS Spectroscopic Diagnostics of Local ULIRGs: Conditions and Kinematics in Markarian 231,” Astronomy & Astrophysics 518, L41 (2010).
10 E. Sturm, E. González-Alfonso, S. Veilleux, J. Fischer, J. Graciá-Carpio, S. Hailey-Dunsheath, A. Contursi, A. Poglitsch, A. Sternberg, R. Davies, R. Genzel, D. Lutz, L. Tacconi, A. Verma, R. Maiolino, and J. de Jong, “Massive Molecular Outflows and Negative Feedback in ULIRGs Observed by Herschel-PACS,” Astrophysical J. Lett. 733, L16 (2011).

Finding Oceanic Hot Spots
The ocean is a dynamic and, at times, a dangerous place,
responding to wind stresses, heating and cooling, and
gravitational attraction from the Sun and the Moon.
Knowing the state of the ocean — where it’s hot, or very
active, and where it’s not — is crucial for optimal Naval operations.
That means the Navy needs to know all the hot spots, those places
in the ocean where large surface (“rogue”) waves might endanger
ships and where large internal waves might seriously damage
submarines and other submersible platforms (such as oil rigs).
Unexpectedly hitting one of these hot spots could seriously impact
Naval operations.
NRL scientists have been working with University of Michigan
researchers to simulate ocean tides concurrently with ocean
circulation at very high resolution anywhere in the world and at any
time. Comparison with observations from satellite altimeter, drifting
buoy, and moored current meter data have proven the accuracy
and reliability of the simulation’s ocean current and tide height
estimates.

113featured research | 2012 NRL REVIEW
FORECASTING THE OCEAN ON A MULTITUDE OF SCALES
The Navy needs to know the state of the ocean — quantities such as the strength of currents, height of the water, clarity of the water, and sound propagation properties, amongst others — on a range of time and space scales at diverse locations around the globe. Large surface waves can affect the operation of ships, and the interaction of the waves with ocean currents can lead to extremely large “rogue waves” that can damage and even sink ships, as seen in Fig. 1(a). The density of the ocean varies in the vertical, which allows internal waves as well as surface waves. These internal waves can have displacement amplitudes greater than 50 m and current speed greater than 2 m s–1. These large internal waves can damage structures and ground submarines. For example, in October 1997, the semisubmersible oil plat-form Stena Clyde was hit by a set of internal waves in the Andaman Sea, which broke the drill pipe, damaged the mooring lines and flotation, and left the platform with a 4-degree list, as seen in Fig. 1(b). Naval opera-tions can occur anywhere on the globe at any time, and the Navy needs to know the changing ocean conditions that can affect operations. To fill this need, Naval Research Laboratory scientists, in collaboration with university research-
Oceanic Hot Spots — Internal Tides in the Global Ocean
J.G. Richman, J.F. Shriver, E.J. Metzger, P.J. Hogan, and G.A. JacobsOceanography Division
B.K. ArbicUniversity of Michigan, Ann Arbor
The ocean flows and undulates in response to wind stress, heating and cooling, and the gravitational attraction of the Sun and Moon. For the first time, Naval Research Laboratory scientists, in collaboration with university colleagues, have simulated ocean tides concurrently within the ocean circulation over the entire globe at very high resolution.1
The surface tides interact with bottom topography to generate internal waves. Surprisingly, the strongest internal tide generation is not where the surface tides are the largest. The strongest interactions occur in limited regions, oceanic internal wave “hot spots.” The internal waves radiate away from the hot spots as focused beams, which propagate for thousands of kilometers, and are an important source of energy for mixing the ocean interior. Both the ocean circulation and the tidal flow of the model compare well to a new set of global observations consisting of satellite altimeter tidal heights, histori-cal moored current meters, and drifting buoys. The new model allows estimates of the ocean currents and tidal elevations anywhere on the globe at any time.
ers, have developed a hierarchy of ocean forecast systems from global scales to river estuaries. The global ocean forecast system is built around the HYbrid Coordinate Ocean Model2,3 (HYCOM). The model is forced by fluxes obtained from the Navy Operational Global Atmospheric Prediction System4 (NOGAPS) and assimilates satellite altimetric sea surface height, radiometric sea surface temperature, and in situ ship, float, and profile temperature and salinity data using the Navy Coupled Ocean Data Assimilation system5 (NCODA) to provide a statistical blending of model and observations. The global ocean model runs on a combination Mercator and tripolar grid with an equatorial grid resolution of 0.08° (8.9 km) and is coupled to a sea ice model at high latitudes. The model reproduces the general circulation of the global ocean, the strength and variability of the western boundary currents, such as the Gulf Stream and Kuroshio, and the mesoscale eddies generated by instabilities of the major currents. The model is validated by compari-son to in situ observations not used in assimilation.6,7 The global model performance is not as good near the coasts, where smaller scale features in the bathymetry and new phenomena, such as tides, become important in determining the state of the ocean. To obtain forecasts in the coastal ocean, another model with finer grid resolution, typically 1 to 3 km, is

114 2012 NRL REVIEW | featured research
nested within the global model. Boundary conditions are obtained from the global model to force the nested model. If higher resolution forecasts for beaches or estuaries are needed, then the process can be repeated with another even finer model obtaining boundary conditions from the first nested model, as depicted schematically in Fig. 2. The hierarchical nested scheme is complicated when the outer model, such as the global model, does not include the same physics needed for the inner model forecast. For the present hierarchical forecast system used by the Navy, the tidal height and currents forced by the gravitational attraction of the Moon and Sun are not included in the global ocean forecast model. For the nested model, the tides are added to the boundary conditions using an indepen-dent model. In the next few years, we plan to move the global ocean forecast system to higher resolution (0.04° or 4.4 km at the Equator). This higher resolution for the global model is close to the present nested coastal model resolution. The question arises: Can the tides be modeled within the global ocean model to provide even
better boundary conditions for even higher resolution nested coastal ocean models? We present the results from our first attempt to model concurrently the ocean circulation and ocean tides. The tides in the global ocean circulation model require different numerical modeling techniques compared to the tide-only mod-els. We show that our global tides compare favorably with the tide-only models and a new altimetric tidal model. In particular, we confirm recent results by other researchers that the surface or barotropic tide interacts strongly with bathymetry to generate internal tides at a few locations — called oceanic hot spots — and that the internal tides generated at these locations travel for thousands of kilometers. The presence of these re-motely generated tides affects the boundary conditions for the nested models, which is now a subject of active research.
TIDES IN THE OCEAN
In the coastal ocean, the ebb and flow of the tidal currents and the twice daily changing height of the water tend to dominate one’s view of the ocean. Tides have a rich history of study by mariners and scientists.8 Sir Isaac Newton was one of the first to realize that the tides are driven by the gravitational attraction of the Sun and Moon. He presented a static equilibrium theory of the tides in his famous Principia in 1687. In his equilibrium theory, the amplitude of the lunar semidiurnal tide would be 0.5 m. A problem with the equilibrium theory is that the Earth rotates faster than a water wave can propagate, so that the gravitational bulge and the water forced by the bulge cannot travel together. Laplace in 1728 recognized that the ocean is a thin layer on top of the Earth and tides could be treated as shallow water waves, leading to Laplace’s Tidal Equa-tions as a mathematical model of the tides. Modern calculations of the tides with bathymetry and coastlines were done by G.I. Taylor and Joseph Proudman in the 1920s to 1940s. Advances in tidal analysis were made by William Thompson (Lord Kelvin), who recognized that the tides could be harmonically analyzed with discrete frequencies related to the geometry of the Sun and Moon. Thus, the principal semidiurnal lunar tide has a period of 12.42 h. The tidal variability can be cal-culated independently for each distinct tidal constitu-ent with a distinct frequency. The tidal amplitudes can be increased dramatically from the equilibrium levels by geometric resonances, such as found in the Bay of Fundy. The tides dissipate approximately 3.5 TW of energy (1 TW is a million megawatts). The energy dissipation can be measured by monitoring the distance between the Earth and Moon and the length of day. Most of this energy is dissipated by the ocean tides. Early tidal mod-els assumed that the energy dissipation occurred over
FIGURE 1(a) A rogue wave with over 20 m height about to strike a container ship south of Africa. Rogue waves damage and sink several ships each year. (b) The semisubmersible oil rig Stena Clyde was damaged extensively by an internal wave in the Andaman Sea, October 18, 1997. The rig was left with a 4° list after the internal wave strike and required extensive repairs and a lengthy period of suspended operations.
(a)
(b)

115featured research | 2012 NRL REVIEW
shallow continental shelves. With the advent of satellite altimetry, showing strong conversion of the barotropic surface tide into baroclinic internal waves,9 a different picture emerges, with approximately 40% of the tidal dissipation occurring in deep water. The internal tides propagate long distances from the oceanic hot spots10 and represent a significant source of energy for deep ocean mixing.11 The generation of the internal tide oc-curs through an interaction of the barotropic flow over topography in the presence of density stratification. For the barotropic shallow water tidal models with a constant density ocean, the dissipation of the surface tide by internal wave generation must be parameter-ized. However, the density of the ocean is predicted by the global ocean forecast model. Thus, concurrently es-timating the tides with the global ocean circulation can provide predictions of the internal tide generation for the ocean. The global forecast model is modified to add the physics required to simulate the tides.1 First, the gravitational attraction of the Sun and Moon are added as a body force via the equilibrium tidal potential, which was first computed by Newton. The astronomi-cal tidal potential is corrected for the solid Earth body tides. The effects of ocean self-attraction and the load-ing of the solid Earth by ocean tides are also accounted for in the ocean tide model.
The conversion of the barotropic surface tide into internal tides depends upon the roughness of the sea floor and the density stratification at the sea floor. The global model, presently, has 32 layers in the vertical and runs at a horizontal resolution of approximately 9 km at the Equator. Thus, only part of the conversion of the barotropic surface tide into internal tides can be directly estimated in the model, and the internal waves with small vertical and horizontal scales must be parameter-ized as in the barotropic shallow water model.
VERIFYING THE TIDES IN THE GENERALCIRCULATION MODEL
The global ocean circulation model with tidal po-tential forcing for the four leading semidiurnal (M2, S2, K2, N2) and four leading diurnal (K1, O1, P1, Q1) con-stituents and realistic atmospheric wind, heat, and fresh-water forcing has been run for a 7-year period (2004 to 2010). The performance of the model for time scales longer than a day has been extensively validated against in situ and satellite observations. Validating the tides for the global ocean is much more challenging. Most of the tidal observations are collected in shallow, coastal regions, where the performance of a relatively coarse resolution global model is poor. In deep water, only 102
FIGURE 2Forecasts from one model can be used to provide initial and boundary conditions for higher resolution models nested inside the larger model. The forecasts for the surface height (in cm) over the entire globe are produced each day. A forecast from a higher resolution model of the Gulf of Mexico also is produced each day. The initial and boundary conditions for the higher resolution Gulf of Mexico model are obtained from the global ocean model.

116 2012 NRL REVIEW | featured research
tide gauges and bottom pressure gauges are available. However, with the launch of satellite altimeters in 1992 — which are capable of measuring the sea surface height with an accuracy of a few centimeters — obser-vations of the global tides were realized. The satellite altimeters do not make direct observations of the tides, but allow a statistical estimate to be obtained. In Fig. 3, we compare the lunar semidiurnal tidal amplitudes and phases for a shallow water model assimilating the altimetric tidal amplitudes and tide gauge observations (TPXO) with the global ocean model (HYCOM), which does not assimilate any data. The white lines on the am-plitude maps are the phases of the tide. The surface tide propagates as a wave around approximately 15 amphi-
dromes. The spacing of the phase lines and amplitudes around the amphidromes agree well between the two maps. The global ocean model reproduces 95% of the variance at the 102 bottom pressure gauges and 97% of the variance in the TPXO shallow water model. The largest errors in the global ocean model tides occur in the Southern Ocean. The global ocean model converts approximately 1 TW of barotropic tidal energy into baroclinic internal tides through the parameterized internal wave drag and generation of resolved internal waves. Internal waves have their largest amplitudes deep in the ocean. However, the internal waves have expres-sions that are visible at the ocean surface and can be
FIGURE 3The ocean sea surface elevation (m) and phase for the principal lunar semidiurnal tide as predicted by (a) the current best forecast from a shallow water model as-similating all available tide data and as predicted by (b) the new global ocean circulation model with astronomical tidal forcing and internal wave generation. Open ocean tidal heights are typically less than 1 m. The amplitudes and phases of tidal elevation in the two maps are very similar, with the largest differences found in the Southern Ocean. Compared to 102 deep-sea pressure gauges, the tides in the ocean circulation model capture 94.5% of the observed tidal variability.
FIGURE 4While the amplitudes of internal tides are largest in the ocean interior — often exceeding 20 m — the surface of the ocean shows the impression of the internal tide. (a) This image is a true-color scene obtained by the Moderate Resolution Imaging Spectroradiometer (MODIS) showing internal waves propagat-ing toward Palawan Island in the Sulu Sea between Borneo and Mindanao in April 2004. The currents from the internal waves affect the surface roughness of the ocean, changing the reflection of sunlight and sunglint, and causing curving light and dark bands in the image. (b) The model sea surface height (cm) shows the same curving bands of elevation as seen in the sunglint image of the Sulu Sea for the same time.

117featured research | 2012 NRL REVIEW
viewed by satellites. Figure 4(a) presents a true-color image obtained by the Moderate Resolution Imag-ing Spectroradiometer (MODIS) over the Sulu Sea near Borneo. The surface tide sloshing through the Sibutu Passage at the bottom of the image generates internal tides that propagate toward Palawan Island in the northwest of the image. The surface currents of the internal tides affect the roughness of the ocean waves, which, in turn, changes the specular reflection of sunlight from the ocean surface, the sunglint. Three curving dark bands can be seen in the image associ-ated with the crests of the internal wave. The internal waves can have interior amplitudes greater than 20 m, while the surface height variations are approximately a centimeter. A map of the model sea surface height for the same time period (Fig. 4(b)) is shown below the
MODIS image. Three curving bands similar to the MO-DIS image are seen in the model sea surface. Despite the small amplitude, the sea surface height variability due to internal tides can be measured from space and provides a set of global observations to verify the model performance. The horizontal wavelength of the internal tide is proportional to the vertical wavelength. For very large vertical wavelength internal tides, the horizontal wavelength is approximately 150 km. Inspecting the amplitude maps in Fig. 3, we observe that the surface tide is dominated by extremely long wavelengths, ex-ceeding 1000 km in deep water. Thus, we can separate the surface and internal tides in the sea surface height by filtering the very long wavelengths to remove the barotropic tides. The picture in Fig. 5 for the internal
FIGURE 5The amplitudes (cm) of the principal lunar semidiurnal tide, M2, obtained from long-term fits to the satellite altimetric sea surface height (a) and the hourly HYCOM sea surface height (b). The data are filtered to show only short wavelength variations, thus removing the barotropic surface tide. The visual similarity between the model and altimetric estimates is very good, showing the “oceanic hot spots,” circled in red, of internal tide generation around major bathymetric features in the deep ocean. Internal tides also are generated at straits and passages, particularly in the western Pacific around the Indonesian and South China Seas, and at the continental margins, for example, off Spain and Northwest Australia. The internal tides can propagate for thousands of kilometers away from the generation regions.

118 2012 NRL REVIEW | featured research
tide amplitudes is very different from the barotropic tide. The strong internal tide generation at the straits and passages into the Indonesian and South China Seas in the western Pacific Ocean and off the continental margins of Spain and Northwest Australia are clearly visible. However, the largest amplitude internal tides are not found only around the continental margins and near straits, such as seen in Fig. 4, nor where the sur-face tide is largest in Fig. 3. The largest internal tides are observed near major bathymetric features in a limited number of regions, the oceanic internal wave hot spots. Inspection of Fig. 5 reveals large amplitude internal tides generated around the major island groups, the Hawaiian–Emperor Seamount Chain and Tuamotu–Society Archipelagos in the Pacific Ocean and the mid-ocean ridge in the Atlantic Ocean. Even small bathy-metric features, such as the Mendocino Escarpment off northern California, can generate large internal tides. The internal tides propagate away from the genera-tion regions for extremely long distances. Again, the comparison between the altimetric observations and the model predictions are very good. Small scale differ-ences in the amplitudes are observed, since the coarse vertical resolution of the model does not represent the actual scattering geometry observed by the altim-eter. However, when we average the amplitudes over regions around the hot spots, we find that the model overestimates the internal tide generation near Hawaii by about 10% and underestimates the internal tides by less than 10% at the other hot spots. Thus, a picture emerges from the ocean circulation model with tides in which the dissipation of the barotropic surface tide is split between bottom drag on the continental shelves and conversion into baroclinic internal tides in a few hot spots near major bathymetric features. The internal tides potentially represent approximately half of the energy needed for mixing in the global ocean. Most of the internal tidal energy is dissipated near the hot spot generation regions, but approximately 20% of the internal tidal energy propagates away from the genera-tion regions as low vertical mode and long horizontal wavelength internal waves that are dissipated far from the hot spots. The hot spots of internal tide generation play an important role in providing kinetic energy for ocean mixing.
THE CHALLENGES AHEAD
For the first time, NRL scientists have shown that tides can be predicted concurrently with the eddying ocean circulation. The ocean circulation model without tides is the operational forecast model for the Navy. The present resolution of the operational model and the preliminary model with tides is about 9 km at the Equator, but will move to 4 km in the near future. At this resolution, the operational global forecast model
will be close to the resolution of the regional models. The barotropic tidal heights in the global ocean model compare well with the observed deep water tides, but not as well near the coasts. The semidiurnal tides in the global ocean model have smaller errors than the diurnal tides. The parameterization for the barotropic to baroclinic tidal energy conversion presently is set to minimize the semidiurnal tidal error. A new formula-tion that properly models the spatial and frequency characteristics of the topographic interaction of the tides is needed. The self-attraction and loading of the tides in the global model is a simplified scalar ap-proximation to the actual self-attraction and loading, which could be improved. The data assimilative shallow water barotropic tidal heights have a much smaller root mean square error (1.6 cm) compared to the global ocean model barotropic tidal heights (5.8 cm). How-ever, the techniques used to assimilate tidal heights in the shallow water models cannot be used in the global ocean circulation model. The present data assimilation scheme for the global ocean forecast model, NCODA, improves the low frequency circulation in the presence of the tides, but does not improve the tides. New tech-niques must be developed to assimilate tidal informa-tion into the global ocean forecast system. The internal tides generated at the oceanic hot spots propagate for long distances and potentially can impact the coastal circulation far from the hot spots. Errors in the baro-tropic tide will affect the generation of the internal tide, which, in turn, can affect the remote impacts of the propagating tide. Evaluating and improving the performance of the tidal forecasts within the global ocean forecast system is the challenge ahead. Improvements in the numerical model for the tides and new data assimilation tech-niques are needed to move the global tides and circula-tion model forward as the operational forecast system for the Navy. [Sponsored by ONR]
References1 B.K. Arbic, A.J. Wallcraft, and E.J. Metzger, “Concurrent Simu-
lation of the Eddying General Circulation and Tides in a Global Ocean Model,” Ocean Model. 32, 175–187 (2010).
2 E.P. Chassignet, H.E. Hurlburt, O.M. Smedstad, G.R. Hal-liwell, P.J. Hogan, A.J. Wallcraft, R. Baraille, and R. Bleck, “The HYCOM (HYbrid Coordinate Ocean Model) Data Assimilative System,” J. Mar. Syst. 65, 60–83 (2007).
3 E.J. Metzger, H.E. Hurlburt, X. Xu, J.F. Shriver, A.L. Gordon, J. Sprintall, R.D. Susanto, and H.M. Aiken, “Simulated and Observed Circulation in the Indonesian Seas: 1/12° Global HYCOM and the INSTANT Observations,” Dyn. Atmos. Oceans 50, 275–300 (2010).
4 T.E. Rosmond, J. Teixeira, M. Peng, T.F. Hogan, and R. Pauley, “Navy Operational Global Atmospheric Prediction System (NOGAPS): Forcing for Ocean Models,” Oceanography 15, 99–108 (2002).
5 J.A. Cummings, “Operational Multivariate Ocean Data Assimi-lation,” Q. J. Roy. Meteorol. Soc. 131, 3583–3604 (2005).

119featured research | 2012 NRL REVIEW
6 H.E. Hurlburt, E.J. Metzger, J.G. Richman, E.P. Chassignet, Y. Drillet, M.W. Hecht, O. Le Galloudec, J.F. Shriver, X. Xu, and L. Zamudio, “Dynamical Evaluation of Ocean Models Using the Gulf Stream as an Example,” in Operational Oceanography in the 21st Century, eds. G.B. Brassington and A. Schiller (Springer-Verlag, New York, 2010), pp. 545–609.
7 P.G. Thoppil, J.G. Richman, and P.J. Hogan, “Energetics of a Global Ocean Circulation Model Compared to Observations,” Geophys. Res. Lett. 38, L15607, doi:10.1029/ 2011GL048347 (2011).
8 D.E. Cartwright, Tides: A Scientific History (Cambridge Univ. Press, Cambridge, 1999).
9 G.D. Egbert and R.D. Ray, “Significant Dissipation of Tidal En-ergy in the Deep Ocean Inferred from Satellite Altimeter Data,” Nature 405, 775–778 (2000).
10 R.D. Ray and G.T. Mitchum, “Surface Manifestation of Internal Tides in the Deep Ocean: Observations from Altimetry and Island Gauges,” Prog. Oceanog. 40, 135–162 (1997).
11 W. Munk, “Once Again: Once Again—Tidal Friction,” Prog. Oceanog. 40, 7–35 (1997).

Using Hi-res Acoustics to VAMP Up Better Estimates of Methane Hydrate Concentrations
Researchers have long speculated that the Bering Sea con-tains quantities of methane gas hydrates (found only in deep water and in permafrost) vast enough to constitute
a potentially game-changing energy source. Key to discerning the concentrations of these “fire in the ice” clathrates is using underwater acoustics to sense sound speed anomalies (velocity-amplitude anomalies or VAMPs) in the Bering Sea’s thick sedi-ment columns — where there are VAMPs, there is methane gas and methane hydrate. In August 2011, a U.S. Geological Survey-led team, of which the Naval Research Laboratory is an impor-tant member, applied the latest high-resolution acoustic sensing technology to extensively survey the remote and largely unex-plored Bering Sea, specifically targeting the VAMPs. The team gathered high-quality data that not only confirm the presence of gas and gas hydrates in the deep-ocean basin of the central Ber-ing Sea, but that also will allow quantitative estimates to be made of the concentrations of those hydrates in the upper few hundred meters of sediment. Methane hydrates were first detected in the Bering Sea as a consequence of the acoustic mapping done as part of the anti-submarine warfare exercises during the Cold War — seems that the potentially hottest new energy source is a Cold War bonus.

132 2012 NRL REVIEW | featured research
The Bering Sea — One Of The LaST frOnTier Ocean BaSinS
In August 2011, a U.S. Geological Survey (USGS)-led team including the Naval Research Laboratory (NRL), the National Oceanic and Atmospheric Admin-istration (NOAA), and other agencies and universities acquired state-of-the-art multichannel seismic data, ocean bottom seismometer (OBS) data, and Navy sonobuoy data, dramatically improving our knowledge of the scantly surveyed Bering Sea. The Bering Sea is approximately 50% larger in area than the Gulf of Mexico, and consists of the wide Beringian Shelf in the north and east, and the Aleutian Basin in the south and west (Fig. 1), which contains an unusually thick sedi-ment column for a deep (3800 m) basin. It is this thick sediment column that has prompted investigations such as the one described here, the funded purpose of which was to assess the potential to define a U.S. extended continental shelf (ECS) maritime zone under the United Nations Convention on the Law of the Sea (UNCLOS). The survey was designed to collect long-offset reflection and refraction seismic data. These data are also very useful for constraining the locations and concentrations of methane gas and methane hydrate
Deep-Water acoustic anomalies from Methane hydrate in the Bering Sea
W. WoodMarine Geosciences Division
G. Barth and D. SchollU.S. Geological Survey, Menlo Park, CA
N. Lebedeva-IvanovaU.S. Geological Survey, Woods Hole, MA
A recent expedition to the central Bering Sea, one of the most remote locations in the world, has yielded observations confirming gas and gas hydrates in this deep ocean basin. Significant sound speed anomalies found using inver-sion of pre-stack seismic data are observed in association with variable seismic amplitude anomalies in the thick
sediment column. The anomalously low sound speeds below the inferred base of methane hydrate stability indicate the presence of potentially large quantities of gas-phase methane associated with each velocity-amplitude anomaly (VAMP). The data acquired are of such high quality that quantitative estimates of the concentrations of gas hydrates in the upper few hundred meters of sediment are also possible, and analyses are under way to make these estimates. Several VAMPs were specifically targeted in this survey; others were crossed incidentally. Indications of many dozens or hundreds of these features exist throughout the portion of the Bering Sea relevant to the U.S. extended continental shelf (ECS) consistent with the United Nations Convention on the Law of the Sea.
— the ice-like combination of methane and water that exists only in deep water (greater than about 350 m) or in permafrost settings. The area surveyed was the isolated area of inter-national waters (known as the “donut hole” between the United States and Russia) in the Aleutian Basin portion of the Bering Sea, located north of the Aleutian island chain and east of Kamchatka (Fig. 1). Velocity-amplitude anomalies (VAMPs) were first seen in this area in seismic data acquired in 1972 by the U.S. Naval Oceanographic Office off the USNS Bent.1 Several in-vestigations prior to this (e.g., Ref. 2) reported no such anomalies. The data analyzed by Scholl and Cooper1 allowed first estimates of numbers of these features, their physical character, and their possible associa-tion with methane and methane hydrate. Later, in the 1980s, digital seismic data were acquired in this area, allowing significantly improved analysis of the geom-etry of these features.3 Particularly intriguing was the number and size of the VAMPs — hundreds of them, up to 5 km across, and potentially holding significant quantities (up to 1 trillion cubic feet, or TCF) of natural gas.4,5 Despite exceedingly careful and unconventional processing techniques, the older data lacked sufficient offset range to analyze the sound speeds with sufficient

133featured research | 2012 NRL REVIEW
accuracy to distinguish gas and gas hydrate concentra-tions within the VAMPs. The new 2011 data shed a bright new light on these features. The data were acquired using the R/V Marcus G. Langseth, a ship designed for high-powered, accu-rate seismic investigation, with an 8 km, 640-channel streamer and a 6600 cu. in., 36-airgun source array. Ocean bottom seismometers and Navy sonobuoys aug-mented the normal incidence data with ultra-long-offset (60 to 80 km) seismic data. The acquisition program was specifically designed to maximize the sediment sound speed accuracy, with OBS data providing detailed P- and S-wave velocity structure in the sediments and upper crust. These phenomenal new, long-offset, multichannel data are ideally suited to analyze distribution and con-centration of methane and methane hydrate in the upper 1 km of Bering Sea sediment. Although a thick sediment column is generally required to generate the methane required to supersaturate the pore fluids with respect to methane, the methane hydrate concentrates methane in the shallower section. The anomalously low sound speed of methane and anomalously high sound speed of meth-ane hydrate can impact deep-water acoustic bottom-loss and reverberation, but these anomalous sound speeds can also be used diagnostically to analyze the distribu-tion and to some extent the concentration of free gas and gas hydrate in these deep-water settings.
A seismic image of one of the VAMPs using the new data is shown in Fig. 2 (note the vertical exaggera-tion, and gain change at 5.2 km). This feature is about 4 km wide and is associated with anomalous reflectivity all the way through the sediments and into an elevated block of basement rock (likely top of oceanic crust) at about 7.8 km depth. Reflections from the top of the sur-rounding oceanic basement occur between about 8.6 and 9.0 km. The VAMPs are similar in shape to seismic chimneys (e.g., Ref. 6), which are also seen in this area (arrows in Fig. 2), but the VAMPs are at least an order of magnitude larger. Like chimneys, they appear to be associated with near-vertical faulting. In the case of the VAMPs, the underlying faults, or at least sharp folds of sediments, appear to be associated with changes in basement relief. It may be that the fluid flux that trans-ports the methane is most active during episodes of tectonic activity. The VAMP in Fig. 2 is associated with a particularly large basement block informally called “Cyrano’s nose.”
Why are MuLTichanneL SeiSMic DaTa anD SpeciaL prOceSSing TechniqueSiMpOrTanT?
Multichannel data provide direct measurements of sound speed. Conventional seismic data processing methods are adequate for estimating sediment thick-
FIGURE 1The Bering Sea contains an area (the “donut hole,” dashed purple curve) of international waters sur-rounded by the exclusive economic zones (EEZs) of the United States and Russia. The dashed black curves represent the negotiated U.S.–Russia border, and red curves represent seismic and other data acquisition lines acquired in the 2011 survey.

134 2012 NRL REVIEW | featured research
ness in this basin, but the Langseth data are of such high quality that careful processing can yield seismic images and velocities that are uncharacteristically accu-rate for these water depths (~4 km). Figure 3(a) shows a common midpoint (CMP) seismic reflection gather. Only a portion near the seafloor is shown to emphasize the curvature of the individual reflection events. Each column or trace in the CMP corresponds to a single source-receiver pair. The traces in this gather are the source-receiver pairs whose midpoints fall within a single 6.25 m wide bin — essentially forming up to 80
individual seismic records at every point along a vertical line into the seafloor. There are thousands to tens of thousands of CMP bins per line, every 6.25 m. Because the seismic energy at long source-receiver offsets travels through more sediment than at shorter source-receiver offsets, the difference in arrival time as a function of offset for a single reflection (curvature of the events in Fig. 3(a)) can be used to measure sedi-ment sound speed. The earlier, single-channel data had no such sound speed information. Once the sediment sound speed (P-wave velocity, or just velocity) is known,
FIGURE 2This example of a VAMP lies over an elevated basement high, informally called “Cyrano’s nose,” in the middle portion of the Aleutian Basin. Seismic data are displayed here with peaks and troughs of the seismic reflection colored blue and red, respectively. High amplitudes are dis-played with bolder colors; clipped positive and negative events are black and yellow, respectively. The brightest feature of the VAMP is the negative reflection at about 4.1 km depth.

135featured research | 2012 NRL REVIEW
the depth to any seismic reflection can be estimated. The velocity profile can also be used to straighten the curved trajectories seen in Fig. 3(a) such that they can be added together or stacked. This increases the signal-to-noise ratio, resulting, for example, in the very high quality stacked image shown in Fig. 2. One aspect of what makes the new Bering Sea data and analysis unique is the detail to which these reflection trajectories can be analyzed. The semblance is a measure of coherency of a reflection with respect to offset. Figure 3(b) shows a semblance plot calculated at every time sample (0.002 s intervals) in the CMP gather from 4.9 to 6.8 s two-way time, and with a velocity increment of 0.1 m/s — a much finer time and velocity spacing than is ordinarily used. The CMP used in Fig. 3(b) comes from the far left edge of the section shown in Fig. 4, away from the large anomaly associated with the VAMP. Warm colors in Fig. 3(b) correspond to semblance peaks — the amplitude scale is relative. Bright spots in the semblance plot correspond to travel time trajectories that are coherent, and therefore indi-cate the arrival time and the root-mean-square (rms) average velocity from the sea surface down to that re-flector. The change in rms average velocity between two interfaces can be inverted to yield an instantaneous or
interval velocity that is diagnostic of the material that makes up the layer, or interval between the interfaces.7 The uncertainty in the interval velocity calculation increases with depth and is inversely proportional to layer thickness.8 More accurate average velocity analy-ses result in higher accuracy interval velocities (better diagnostics) for thinner layers (higher resolution). Another aspect of what makes this analysis note-worthy is the use of an automated velocity inversion, allowing consistent analysis for each CMP. Practical inversion for interval velocity is inherently unstable, and is almost always done by an interpreter. Hand interpretation is time consuming and may therefore only be applied on one out of every hundred or several hundred CMPs. The earth model in the inversion developed and used here consists of interfaces picked on the basis of maximum semblance (small crosses on the semblance peaks in Fig. 3(b)), and a linear gradient of instanta-neous velocity between the interfaces. The two-way times are fixed, and the velocity gradients are inverted for globally (all at the same time) using the technique of very fast simulated annealing (VFSA).9 The cost function, or fitness function, for each attempted model consists of the sum of the absolute difference in average
FIGURE 3(a) This common midpoint (CMP) gather is composed of seismograms corresponding to a single verti-cal reflection point on the seafloor. This particular CMP occurs at the left edge of the seismic profile shown in Fig. 4. The large source-receiver offsets correspond to large angles of incidence, longer path lengths, and, therefore, longer arrival times. (b) The curving events in Fig. 3(a) are matched with theoretical trajectories calculated with a range of the root-mean-square (rms) average velocities from the sea surface to each point below the seafloor. Semblance peaks marked with small crosses (warm colors, relative amplitude) correspond to good matches, forming a curve of travel-time vs rms velocity (fine curve connecting semblance peaks).
(a) (b)

136 2012 NRL REVIEW | featured research
velocity at each interface, so the average velocity profile derived from the interval velocity gradients is always checked against the measured average velocity of the semblance plot and penalized for straying too far. Stability in the automated inversion process is achieved by inverting for interval velocity gradients, not actual interval velocities. Inverting directly for interval velocities of sediment layers that are completely independent tends to result in oscillating over- and underestimate of interval velocity, while still resulting in a similar, overall average velocity. Because the gradi-ent in each layer depends on the interval velocity at the top and bottom of each layer, the gradient of each layer is linked to the gradients of the layer above and below. Starting with a known interval velocity for the water column, and known travel times to each interface, interval velocities can be calculated from the gradients. This method effectively smooths the interval velocity profile and mitigates the problem of alternat-ing over-and underestimate of interval velocity. An example of the average velocity profile obtained from this technique is shown in Fig. 3(b). The fine curve con-necting the semblance peaks corresponds to the rms average velocity calculated from the interval velocity gradients in the model. Figure 4(a) shows a blow-up of the Cyrano VAMP, but depth converted with the velocity profiles obtained
through VFSA at each CMP. The velocity field was smoothed before depth conversion. Figure 4(b) shows the velocity field before smoothing to illustrate the level of noise (instability) still present in the analysis — the instabilities have been mitigated, but not eliminated entirely. Because of the high wavenumber instabilities, only the low wavenumber, background trend in Fig. 4(b) can be attributed to actual geological character.
WhaT The neW DaTa Say aBOuT gaS anD gaS hyDraTe
The dominant characteristic of the VAMPs is their variable amplitude. The very bright reflectivity of the top of the VAMP in Fig. 4(a) at 4.1 km suggests an accumulation of gas has built up at this location, almost certainly methane gas, and very likely capped by methane hydrate–filled pore space. Methane hydrate is stable only at high pressures and low temperatures and would be expected at these sediment and water depths given high enough concentrations of methane (super-saturation). The base of gas hydrate stability (BGHS) in the sediments is a pressure–temperature boundary that forms an upper limit of where free methane gas can ex-ist in the sediment. Where gas accumulates below this boundary, a bottom-simulating reflector (BSR) can be observed in seismic data.
FIGURE 4(a) The Cyrano VAMP is shown here in a true amplitude stacked section. Note the bright reflectivity of the bottom-simulating reflector (BSR) at about 4.1 to 4.15 km depth over the VAMP, the depth expected for the base of gas hydrate stability (BGHS). (b) The interval (instantaneous) velocity field over the Cyrano VAMP shows the low velocity anomaly (cooler colors) caused by free methane gas. Interfaces were not picked by hand, but rather correspond to the brightest, most coherent seismic reflections.
(a) (b)

137featured research | 2012 NRL REVIEW
The depth of the bright reflection over the VAMP in Fig. 4(a) is at 4.1 km, or about 330 m below the seafloor. Using the gas hydrate stability curve of Brown et al.,10 and a bottom water temperature of 1.6 °C (as measured on a CTD [conductivity, temperature, depth] cast to the bottom in this area on the 2011 cruise)11 results in a geothermal gradient of 66 mK/m over the VAMP. This value is somewhat high for a tectoni-cally passive area such as the Aleutian Basin, but not inconsistent with thermal gradients of about 55 mK/m measured in this area,12 possibly due to its back-arc tectonic setting.13 In areas of fluid flux, a higher heat flux is expected, therefore the bright reflection in Fig. 4(a) likely coincides with the base of methane hydrate stability and is likely a BSR associated with increased fluid and methane gas flow at this location. The BSR at the top of the VAMP corresponds ex-actly with the top of the low velocity anomaly shown as black (slower than 1500 m/s) in Fig. 4(b), and contrasts with the expected velocities of 1700 to 1900 m/s seen at the edges of Fig. 4(b). The low velocity zone is tapered downward, suggesting that most gas responsible for the anomaly is located at the top — the BGHS — and trapped by pore-filling gas hydrate. Further, there is a laterally very consistent low velocity zone at about 4.25 km depth or about 475 m below the seafloor. This cor-responds to a geothermal gradient of about 47 mK/m away from the VAMP, and is also consistent with the BGHS, but in a lower flux setting than at the top of the VAMP. Because free gas creates a much stronger negative anomaly than gas hydrate makes a positive anomaly, the free gas will always be easier to detect. Although we would expect to see a positive interval velocity anomaly associated with the gas hydrates above the VAMP, no such anomaly is seen in the velocity inversion for this VAMP. This could mean that the hydrate concentra-tion above the VAMP is only a few percent of the pore space, or that a gas hydrate enriched layer falls below the resolution of even this relatively high-resolution technique. Depending on the concentration, such a layer would have to be less than 5 to 10 m thick to avoid our detection.
greaTer Significance
The data acquired in August 2011 confirm the thick (4 to 5 km) sediment column throughout the deep Bering Sea. There are many conventional seismic chimneys in the area, suggesting active fluid flux for at least several periods in the sedimentary history of the basin. We now have the data and processing techniques (inversion for diagnostic sound speeds) to improve the estimates of gas and gas hydrate concentrations in this and other deep-water settings. Of the hundreds of
super-chimneys — VAMPs — in the Aleutian Basin, the few analyzed to date all indicate zones of significantly reduced P-wave velocity, for which the only reasonable explanation is free methane gas. The size and number of the VAMPs suggests there may be significant quantities of gas and gas hydrate in this still underexplored basin.
acknOWLeDgMenTS
The authors gratefully acknowledge the master and crew of the R/V Langseth, as well as acquisition and preliminary processing by Ray Sliter, Wayne Baldwin, Jorden Hayes, and Tom O’Brien. These data were ac-quired with USGS funding on behalf of the Interagency Task Force on the U.S. Extended Continental Shelf. [WW sponsored by the NRL Base Program (CNR funded)]
references1 D.W. Scholl and A.K. Cooper, “VAMPs; Possible Hydrocarbon-
Bearing Structures in Bering Sea Basin,” AAPG Bulletin 62, 2481–2488, December 1978.
2 G.G. Shor, Jr., “Structure of the Bering Sea and the Aleutian Ridge,” Marine Geol. 1, 213–219 (1964).
3 D.M. Rearic, S.R. Williams, P.R. Carlson, and R.K. Hall, “Acoustic Evidence for Gas-Charged Sediment in the Abyssal Aleutian Basin, Bering Sea, Alaska,” USGS Open File Report 88-677 (1988).
4 D.W. Scholl and P.E. Hart, “Velocity and Amplitude Structures on Seismic-Reflection Profiles — Possible Massive Gas-Hydrate Deposits and Underlying Gas Accumulations in the Bering Sea Basin,” in The Future of Energy Gases, ed. D.G. Howell, USGS Professional Paper 1570, pp. 331-351 (U.S. Government Printing Office, Washington, DC, 1993).
5 G.A. Barth, D.W. Scholl, and J.R. Childs, “Bering Sea Velocity-Amplitude Anomalies: Exploring the Distribution of Natural Gas and Gas-Hydrate Indicators,” AAPG Special Volumes, AAPG Memoir 89: Natural Gas Hydrates, Energy Resource Potential and Associated Geologic Hazards, pp. 324–349 (2009).
6 G.K. Westbrook, K.E. Thatcher, E.J. Rohling, A.M. Piotrowski, H. Pälike, A.H. Osborne, E.G. Nisbet, T.A. Minshull, M. Lanoisellé, R.H. James, V. Hühnerbach, D. Green, R.E. Fisher, A.J. Crocker, A. Chabert, C.T. Bolton, A. Beszczynska-Möller, C. Berndt, and A. Aquilina, “Escape of Methane Gas from the Seabed along the West Spitsbergen Continental Margin,” Geophys. Res. Lett. 36, L15608 (2009), doi:10.1029/2009GL039191.
7 C.H. Dix, “Seismic Velocities from Surface Measurements,” Geophysics 20, 68–86 (1955).
8 Z. Hajnal and I.T. Sereda, “Maximum Uncertainty of Interval Velocity Estimates,” Geophysics 46(11), 1543–1547 (1981).
9 L. Ingber, “Very Fast Simulated Re-annealing,” Mathematical and Computer Modelling 12(8), 967–973 (1989), http://www.ingber.com/asa89_vfsr.pdf.
10 K.M. Brown, N.L. Bangs, P.N. Froelich, and K.A. Kvenvolden, “The Nature, Distribution, and Origin of Gas Hydrate in the Chile Triple Junction Region,” Earth and Planetary Science Letters 139(3-4), 471–483 (1996).
11 G.A. Barth, W. Wood, W. Baldwin, J. Hayes, J. Henderson, N. Lebedeva-Ivanova, T. O’Brien, D.W. Scholl, R. Sliter, and P. Triezenberg, “Cruise Report: Marcus G. Langseth MGL1111: US ECS Studies in the Bering Sea,” USGS Open File Report OF12 (2012).

138 2012 NRL REVIEW | featured research
12 T. Watanabe, M.G. Langseth, and R.N. Anderson, “Heat Flow in Back-Arc Basins of the Western Pacific,” in Island Arcs, Deep Sea Trenches, and Back-Arc Basins, eds. M. Talwani and W.C. Pitman III, Am. Geophys. Union Maurice Ewing Ser. 1, pp. 137–161 (1977).
13 R.D. Hyndman, C.A. Currie, and S.P. Mazzotti, “Subduction Zone Backarcs, Mobile Belts, and Orogenic Heat,” GSA Today 15(2), 4–10 (2005).

In that section of space closest to the Earth but some 100 km in altitude, known as geospace, powerful winds and a complex of physical, chemical, and electromechanical phenomena dominate a dynamic region through
which we travel, navigate, and communicate. Geospace winds (from a hurricane force 100 m/s to an incredible 800 m/s), in particular, can alter satellite trajectories and induce ionospheric electric fields, making an understanding of those winds of high value. This article explains what we know about geospace wind and describes the Naval Research Laboratory activities aimed at improving modeling of geospace winds and in developing new sensors to illuminate this important geospace parameter.
Winds at the Edge of Space

132 2012 NRL REVIEW | featured research
What DRIvEs GEospacE WINDs?
The wind we experience near the Earth’s surface is primarily driven by gradients in air pressure and is steered by the Coriolis force. These two forces also shape wind patterns in the thermosphere (above 90 km), where large, solar-driven day–night differences in temperature (and thus pressure) create wind speeds of ~100 m/s that diverge from the subsolar region and converge on the nightside, as shown in Fig. 1. However, other, more complex forces also drive thermospheric winds and create unique modeling challenges. First, at-mospheric waves and tides propagate up from the lower atmosphere to produce thermospheric wind varia-tions on kilometer scales to global scales; semidiurnal oscillations in the lower thermosphere (~90 to 180 km) are a prominent consequence of this connection with the lower atmosphere. Second, as the atmosphere becomes thinner with increasing height above 100 km, its viscosity becomes very large (due to the increase in mean free path), thereby inhibiting vertical gradients and dissipating upward-propagating waves. Finally, the motion of the ionized portion of the thermosphere (the ionosphere) is constrained by geomagnetic and electric fields. Collisions between ions and neutrals can thus
Wind at the top of the atmosphereC.R. Englert, C.M. Brown, D.P. Drob, J.T. Emmert, J.M. Goldspiel,
A.W. Nicholas, D.E. Siskind, A.W. Stephan, and M.H. StevensSpace Science Division
J.M. HarlanderSt. Cloud State University
K.D. Marr
National Research Council Research Associate, Space Science Division
A t an altitude of 100 km (62 miles), above 99.99997% of the atmospheric mass, pilots and passengers become astro-nauts. This altitude can be defined as the lower boundary of geospace. The notion that the space around our planet is vast and empty, however, is far from true. In fact, this environment, in which the satellites that we rely on for
communication and navigation operate, can vary significantly on short time scales and is governed by complex physical, chemical, and electromechanical phenomena. One such phenomenon is wind. Wind in geospace alters satellite trajectories and induces ionospheric electric fields. Typical wind speeds are 100 m/s (greater than those of a category 5 hurricane) and can reach up to 800 m/s during geomagnetic storms. In this article, we review what we know about wind at the top of the atmosphere, and we describe Naval Research Laboratory activities in improved modeling and the development of new sensors that are shedding more light on this basic geospace parameter.
act as either a retarding force or a driver of the neutral wind. The latter behavior occurs most dramatically at high latitudes, where strong electric fields (generated by the interaction between the solar wind and Earth’s magnetosphere) drive a polar convection pattern of ions, which in turn spins up the neutral wind. During severe geomagnetic storms, such as the one that oc-curred in October 2003, shortly after solar maximum, thermospheric wind speeds in excess of 800 m/s were observed.
Why stuDy GEospacE WINDs?
In addition to being a basic environmental pa-rameter, accurate knowledge of thermospheric winds is important for at least two critical civil and military applications: radio wave propagation and satellite orbit prediction. Winds induce a complex pattern of electric fields and currents in the ionosphere because of the mo-tion they impart to ions and electrons relative to the geomagnetic field. As the “equatorial plasma fountain” in Fig. 2 illustrates, these electric fields fundamentally shape the total amount and distribution of ionization, which in turn affects the propagation of radio waves

133featured research | 2012 NRL REVIEW
FIGURE 1Typical wind patterns in the lower thermosphere (bottom panels) and upper thermosphere (top panels). The left panels show winds at mid and low latitudes, and the right panels show winds over the northern polar region (the outer ring is 50°N). Blue arrows show patterns under quiet space weather conditions; red arrows show typical patterns during fairly strong (Kp index of 7) geospace storms. The winds shown are from NRL’s Horizontal Wind Model (HWM07).
06
Noon
18
00 LST
100 m/s
Northern High Latitudes, 105 km
100 m/s
Northern High Latitudes, 105 km
06
Noon
18
00 LST
200 m/s
Northern High Latitudes, 250 km
200 m/s
Northern High Latitudes, 250 km
0 6 12 18 24Local Solar Time (h)
-60
-30
0
30
60
Latit
ude
Mid and Low Latitudes, Altitude = 105 km100 m/s
0 6 12 18 24
-60
-30
0
30
60La
titud
e
Mid and Low Latitudes, Altitude = 250 km100 m/s
TYPICAL THERMOSPHERIC WIND PATTERNSQuiet Geospace Storm
FIGURE 2The equatorial plasma fountain: an example of how winds influence the distribution of ion-ization. Wind in the lower thermosphere induces an eastward electric field (E) near the geo-magnetic equator. This field, combined with the southward geomagnetic field (B), causes ions and electrons to drift upward (V) to high altitudes. From there, the plasma diffuses downward, under the influence of gravity, along magnetic field lines, creating regions of enhanced ionization ~15° away from the equator. The blue shading in the figure represents low (dark blue) to high (white) ion densities.

134 2012 NRL REVIEW | featured research
incident on the ionosphere. For example, the iono-sphere typically causes a phase delay in GPS signals that amounts to a range error of several meters; wind-induced electric fields cause this range error to vary by ~50% to 100%. Neutral winds can also create and trig-ger ionospheric instabilities and irregularities, which scatter radio waves and render portions of the radio wave spectrum useless for communication. The thermosphere exerts a drag force that is the largest source of uncertainty for the prediction of satel-lite trajectories in low Earth orbit. Since the direction of drag is along the relative motion between the satellite and atmosphere, winds are a key variable for predicting orbital paths and reentry times and locations, particu-larly for satellites with large surface areas such as those with deployable solar panels. Typical wind speeds of ~100 m/s are a non-negligible 1.3% of orbital speed, increasing to 10% during severe geomagnetic storms. Despite the importance of geospace winds, there are currently no routine operational observations of this parameter. To compensate for this deficiency, the Naval Research Laboratory’s Space Science Division (SSD) is pursuing a two-pronged research and develop-ment effort.
hIstoRIcaL WIND MEasuREMENts aND EMpIRIcaL MoDELs
The first component of SSD’s effort is to compile historical measurements of geospace winds starting in the 1970s and encapsulate them into a single empirical, climatological model. This global model, known as the Horizontal Wind Model (HWM),1 extends from the ground to 600 km altitude. HWM incorporates observa-tions made with a wide range of techniques, including in situ satellite data, optical remote sensing data, and data from active techniques such as ground-based lidar (light detection and ranging). Figure 3 summarizes the height coverage afforded by the various methods of measuring geospace winds. HWM uses a vector spherical har-monic expansion to represent the winds as a function of altitude, latitude, local time, longitude, solar activity, and geomagnetic activity. It provides a condensed view of over a million wind observations spanning more than four decades. The most important thermospheric data set in the model is from the Wind Imaging Interferom-eter (WINDII), a Michelson interferometer on board the Upper Atmosphere Research Satellite (UARS) that
FIGURE 3Altitudinal coverage of thermospheric wind measurement techniques. Hashed regions indicate limitations of the technique. For in situ techniques, the region below 200 km is difficult to access routinely, due to strong atmospheric drag on orbiting probes in this region. Inference of winds from incoherent scatter radars (ISRs, which probe ionospheric composition and plasma drift), requires significant physical assumptions; additionally, only the north-south component is derivable in the upper thermosphere. Meteor radars and other medium frequency (MF) radars measure winds in the lower thermosphere by tracking ionized meteor trails or ionospheric irregularities, respectively (below ~100 km, the plasma moves with the neutral wind). Passive optical techniques rely on naturally occurring airglow emissions, which are very weak at night between 100 and 200 km; consequently, little is known about nighttime winds in this region. The plot in the right panel shows typical airglow brightness profiles (from NASA’s UARS/WINDII instrument) for two important emis-sions: 557.7 nm (green line) and 630.0 nm (red line), both of which are from atomic oxygen. The left panel shows typical electron density and neutral temperature profiles.

135featured research | 2012 NRL REVIEW
measured winds between 90 and 275 km altitude from 1991 to 1997.2 WINDII is the only significant source of wind data in the critical ionospheric dynamo region between 110 and 200 km, and SSD’s analysis and mod-eling of this data have greatly improved the accuracy of empirical wind predictions in this region. SSD’s analyses of wind data have also greatly advanced understanding of how geospace storms affect global wind patterns. Geomagnetic activity, caused by the interaction of the solar wind with the upper atmosphere, modifies quiet-time wind patterns in two ways. First, as mentioned above, enhanced convection of high-latitude ions spins up the neutral wind. Second, heating at high latitudes by dissipation of electrical cur-rents creates pressure gradients that drive equatorward winds. At lower latitudes, the equatorward perturba-tions are steered westward by the Coriolis effect (and in the process generate an electric field known as the disturbance dynamo). These effects are quantified in HWM07, which provides the best available empirical representation of winds during geomagnetic storms. Figure 1 illustrates how the wind patterns are influ-enced by geomagnetic storms. HWM07 is widely used in the upper atmospheric research community for several critical purposes: (1) as a benchmark for validating new observations and measurement techniques against past data; (2) as an initial or boundary condition for physics-based models of the atmosphere; and (3) as an a priori specification of neutral winds in ionospheric models (such as NRL’s SAMI3 model of the ionosphere3) and of background winds in simulations of small-scale atmospheric waves. Although HWM07 is an indispensible tool and probably the best available predictor of winds for speci-fied geophysical conditions, it is not an ideal model of thermospheric weather. At a given epoch, measured winds typically deviate from climatological averages by ~30 m/s. These day-to-day and hour-to-hour fluc-tuations are due in part to lower atmospheric waves percolating up into the thermosphere, which can, for example, produce rapid global-scale transport of lower thermospheric constituents.4 To specify and forecast such fluctuations requires an assimilative model of the whole atmosphere, including the thermosphere. NRL’s SSD, along with the NRL Remote Sensing Division and the NRL Marine Meteorology Division, have pioneered the development of high altitude assimilative models (e.g., Ref. 5). However, due to lack of data, these are limited to below the base of the thermosphere (~90 km). A dense network of timely observations will be needed to achieve accurate thermospheric wind fore-casts, and so SSD’s second component of geospace wind research has focused on the development of innovative instruments to measure winds both in situ and remote-ly.
NRL Is DEvELopING NEW tEchNIquEs to MEasuRE WINDs
The NRL Space Science Division is developing two complementary, innovative types of thermospheric wind sensors for future space missions. One is an opti-cal, remote sensing technique called DASH (Doppler Asymmetric Spatial Heterodyne) spectroscopy, which features advantages of state-of-the-art remote sensing techniques, relaxed fabrication tolerances, and reduced instrument complexity. DASH can measure winds and temperatures between ~90 and 350 km, using the Doppler shift and broadening of airglow emissions. The other sensor is an in situ instrument consisting of an extremely compact suite of instruments to measure density, temperature, neutral wind, plasma drift, and the composition of neutrals and ions. The Winds-Ions-Neutral Composition Suite (WINCS) instrument was designed and developed jointly by NRL and NASA/Goddard Space Flight Center for ionosphere-thermo-sphere investigations in orbit between 120 and 750 km altitude. The DASH concept is based on the spatial hetero-dyne spectroscopy (SHS) technique and is optimized for the measurement of thermospheric winds.6 The advantages of remotely measuring winds include the capability of measuring at low altitudes (90 to 250 km) where short satellite orbit lifetimes hamper the use of in situ instrumentation. In addition, wind vector profiles can be measured over extended altitude ranges and with an altitude resolution of several kilometers. Following the conception of the DASH technique in 2005 (U.S. Patent 7,773,229), NRL SSD led an effort that resulted in the first monolithic DASH interferom-eter, shown in Fig. 4(a), and the first DASH ground-based measurements of thermospheric winds.7,8 In 2011, NASA selected a DASH satellite instrument design (shown in Fig. 4(b)) as part of the Ionospheric Connection Explorer (ICON) mission proposal led by the University of California, Berkeley, for a detailed mission study and potential 2013 selection for flight as a NASA Explorer mission. The WINCS design (U.S. Patent Application 13/247,168) is shown in Fig. 5 and features extremely small size (7.6 × 7.6 × 7.1 cm), low weight (0.75 kg total mass), and low power (about 2.0 W). The true benefit of WINCS is the ability to measure space weather pa-rameters with an extremely small and low-cost instru-ment that could be flown on almost any spacecraft, e.g., as the primary instrument on a nanosatellite or as a secondary instrument on a much larger spacecraft. Utilizing WINCS in this way will allow multipoint measurements of the ionosphere-thermosphere (IT) system, resulting in more complete data sets. The most effective employment of WINCS would be on an IT

136 2012 NRL REVIEW | featured research
constellation mission, which would revolutionize our understanding of the IT system dynamics. Such a con-stellation would test our ability to simulate the dynam-ics of the ionosphere and thermosphere on a global scale. The WINCS instrument is manifested on four upcoming flights over the next two years: the U.S. Air Force’s Space Environment Nano-Satellite Experiment (SENSE, a CubeSat), two Department of Defense Space Test Program (STP) missions supported by the Office
of Naval Research (STPSat-3, a small free-flyer satellite, and STP-H4 on the International Space Station), and the CubeSat investigating Atmospheric Density Response to Extreme driving (CADRE), a National Science Founda-tion CubeSat to be flown by the University of Michigan. [Sponsored by ONR]
References1 D.P. Drob et al., “An Empirical Model of the Earth’s Horizontal
Wind Fields: HWM07,” J. Geophys. Res. 113, A12304 (2008), doi:10.1029/2008JA013668.
2 G.G. Shepherd et al., “WINDII, the Wind Imagin Interfero-meter on the Upper Atmosphere Research Satellite,” J. Geophys. Res. 98(D6), 10725–10750 (1993).
3 J.D. Huba et al., “Three-dimensional Equatorial Spread F Modeling: Zonal Neutral Wind Effects,” Geophys. Res. Lett. 36, L19106 (2009).
4 M.H. Stevens, R.R. Meier, X. Chu, M.T. DeLand, and J.M.C. Plane, “Antarctic Mesospheric Clouds Formed from Space Shuttle Exhaust,” Geophys. Res. Lett. 32, L13810 (2005).
5 S.D. Eckermann, K.W. Hoppel, L. Coy, J.P. McCormack, D.E. Siskind, K. Nielsen, A. Kochenash, M.H. Stevens, C.R. Englert, and W. Singer, “High-Altitude Data Assimilation System Experiments for the Northern Summer Mesosphere Season of 2007,” J. Atmos. and Solar–Terr. Phys. 71, 531–551 (2009), doi:10.1016/ j.jastp.2008.09.036.
6 C.R. Englert, D.D. Babcock, and J.M. Harlander, “Doppler Asymmetric Spatial Heterodyne Spectroscopy (DASH): Concept and Experimental Demonstration,” Applied Optics 46, 7297–7307 (2007).
7 J.M. Harlander, C.R. Englert, D.D. Babcock, and F.L. Roesler, “Design and Laboratory Tests of a Doppler Asymmetric Spatial Heterodyne (DASH) Interferometer for Upper Atmospheric Wind and Temperature Observations,” Optics Express 18, 26430–26440 (2010).
8 C.R. Englert, J.M. Harlander, J.T. Emmert, D.D. Babcock, and F.L. Roesler, “Initial Thermospheric Wind Measurements Using a Ground-based DASH Interferometer,” Optics Express 18, 27416–27430 (2010).
FIGURE 4(a) The first monolithic DASH interferometer. This interferometer was successfully used for ground-based thermospheric wind observations in preparation for future satellite applications. (b) Instrument concept for a space-based, remote-sensing instrument using the DASH technique to measure altitude profiles of thermospheric wind and temperature.
FIGURE 5The WINCS payload (7.6 cm × 7.6 cm × 7.1 cm) for the SENSE program (top cover removed).

142 2012 NRL REVIEW | acoustics
Tailoring Underwater Laser Acoustic Pulses
T.G. Jones,1 M. Helle,1 A. Ting,1 and M. Nicholas2
1Plasma Physics Division2Acoustics Division
Introduction: The Naval Research Laboratory is developing a novel Remote Underwater Laser Acoustic Source (RULAS) to enable an airborne laser to remote-ly generate underwater acoustic pulses. Our acoustic source uses patented1 optical compression techniques that produce underwater plasmas, heat them, and cre-ate intense acoustic pulses, all without the need for any hardware in the water. We primarily use Nd:YAG lasers with few-nanosecond pulse duration and a wavelength of 532 nm, which propagates readily through water. Our recent developments enable users to control both the duration and directivity of the acoustic pulses, in real time, by varying basic laser pulse parameters. The RULAS acoustic source is the first of its kind to allow such control, and accordingly it offers numerous po-tential new applications. In a milestone demonstration, we also conducted the first open water laser acoustic generation and propagation experiments, showing that RULAS techniques work in field conditions as well as in the lab. Compact, high-repetition-rate lasers with ap-propriate pulse energy are commercially available and could be steered with rapidly movable mirrors from an airborne platform. Such a setup would be useful for several Navy and commercial applications, including
remote aircraft communications with undersea vessels and equipment such as unmanned underwater vehicles (UUVs), as well as for undersea navigation via remotely generated acoustic beacons. RULAS could also be combined with conventional or advanced opto-acoustic sensors to enable rapid sonar search and detection of underwater mines and vessels, as well as mapping of underwater terrain.
Acoustic Pulse Control Demonstrated: The propagation of acoustic pulses depends on the overall distribution of their component frequencies, in particu-lar the frequency with the highest power within that distribution, denoted fpeak. Since the attenuation of a propagating acoustic pulse is proportional to the square of fpeak, fpeak determines the pulse’s range, with lower fpeak corresponding to a longer range. Important intermedi-ate acoustic range (greater than 100 m) applications require relatively long duration acoustic pulses, and corresponding low fpeak values. We recently developed ways to reduce fpeak by more than an order of magnitude compared to previous experiments, from 200 kHz to 15 kHz. The potential range of a laser-generated signal is thereby increased more than tenfold. In addition, we have learned how to control the acoustic source di-rectivity. We have demonstrated sources with uniform intensity in all directions, or with a 20 dB variation between the direction of the laser beam and angles perpendicular to it, or with intermediate directivity variations. Underwater plasma imaging in our lab experi-ments revealed that fpeak depends on the volume and
FIGURE 1Plots of the acoustic source directivity (peak acoustic pressure, SL, vs acoustic propagation direction, θ) are shown in the top row for three different laser pulse energies. Plots of the peak frequency of the acoustic power spectrum dependence on acoustic propagation direction (fpeak vs θ) are shown in the bottom row for the same three laser energies. These plots illustrate the flexibility of this acoustic source, for which the acoustic pulse duration and radiation pattern can be quickly varied by adjusting basic laser parameters such as pulse energy.

143acoustics | 2012 NRL REVIEW
shape of the underwater plasma. Most important, we found that we can control the plasma volume and shape by varying basic laser parameters including pulse energy, focusing angle, and laser intensity at the water surface. For nanosecond laser pulses, larger energy and shallower focusing angles produce more elongated plasmas. We generated a variety of plasma shapes from near-spherical, with dimension of a few millimeters, to an elongated cylindrical shape, with length of up to 5 cm. These different plasma shapes resulted in acous-tic pulses with dramatically different directivity and frequency content, as illustrated in Fig. 1.
First Open Water Demonstration: Another recent accomplishment was our first open water demonstra-tion of RULAS laser acoustic generation and acoustic propagation. We performed these tests in 2010 and 2011 at the Lake Glendora Test Facility of Naval Surface Warfare Center, Crane Division, using a laser in a float-ing platform on the lake, as shown in Fig. 2. Steering mirrors and a lens focused the laser pulses into the water, with each pulse generating an acoustic source level of about 190 dB (referenced to 1 micropascal at 1 m from the source). Acoustic pulse propagation was measured by boat-mounted hydrophones at distances up to 300 m (approximately 1000 ft). Prior laboratory
acoustic propagation distances were limited to about 3 m. These field experiments verified that there was no significant ultrasonic attenuation during acoustic propagation at these ranges, and included the first in-termediate distance acoustic directivity measurements of the RULAS source.
Summary: Recent development of the Remote Underwater Laser Acoustic Source technology yielded an order of magnitude improvement in acoustic source level (to 235 dB), an order of magnitude reduction in peak acoustic frequency (to 15 kHz), and more than an order of magnitude increase in acoustic range. In addition, a successful first demonstration of RULAS laser acoustic generation and acoustic propagation in an open water environment was performed. These im-provements greatly increased the utility and flexibility of this novel acoustic source, and open water field tests demonstrated its potential for a wide variety of applica-tions. [Sponsored by the NRL Base Program (CNR funded)]
Reference1 T.G. Jones, A.C. Ting, P.A. Sprangle, L.D. Bibee, and J.R. Peñano,
“Remote Underwater Laser Acoustic Source,” U.S. Patent 7,260,023, Aug. 21, 2007.
FIGURE 2In recent field experiments, laser pulses from a Nd:YAG laser (bottom left) housed in a floating struc-ture (top, at right) were focused into the water (bottom right), generating underwater acoustic pulses. Acoustic pulse propagation was measured by hydrophones on a distant boat (top, at left).

144 2012 NRL REVIEW | acoustics
Analysis of the Elasticity of Fibrous Brain Structures Using Sound
A.J. Romano and B.H. HoustonAcoustics Division
Introduction: The noninvasive evaluation of the elastic properties of the human brain is a very active area of research. This is a promising method of analysis in the sense that if the material properties of the brain can be determined with accuracy, they may provide a valuable metric for the evaluation of its state of health including conditions such as traumatic brain injury (TBI), Alzheimer’s disease, multiple sclerosis (MS), and amyotrophic lateral sclerosis (ALS). It has been demonstrated that sound can be used to noninvasively interrogate biological tissues, since the wavelengths of the sound waves in the tissues are directly related to lo-cal elastic stiffness values.1 This method has previously been applied to the brain; however, efforts to date tend to homogenize the brain structures to provide “effec-tive” stiffness and viscoelastic parameters. Here we apply a method that attempts to track waves traveling along white matter pathways such as the cortico-spinal tract (CSTs) and the corpus callosum. These structures
differ from grey matter in that they are comprised of fiber bundles, and can act as waveguides for sound propagation. Two recent technological breakthroughs enabled the creation of our approach. The first was the devel-opment of diffusion tensor imaging (DTI),2 which provides a mapping of the pathways of fibrous struc-tures based on water diffusion. The second was the development of magnetic resonance elastography (MRE),1 which provides a measurement of sound waves throughout biological media. Using the fusion of these two measurement methods, we developed an approach called waveguide-constrained MRE3,4 to investigate the elasticity of fibrous structures. Here, we apply this method to the CSTs of five healthy human volunteers.
Methods: Waveguide-constrained MRE requires a knowledge of the pathways along which elastic waves may travel and a measurement of the dynamic displacements within the volume surrounding the pathways. Given a knowledge of the position vectors of the pathways, a spatial-spectral filter, in the form of a spatially dependent Radon transform, is applied to the measured displacements in an attempt to identify only those waves that are traveling parallel along the fiber at
FIGURE 3MRI of the head and X,Y, and Z displacements at the top and bottom of the field of view.
−80
0
80µm
µm
-12.8 0 12.8−80
0
80
-11.2
11.2
0
ux uy uz
y
x cm -12.8 0 12.8
cm -12.8 0 12.8
cm
-12.8 0 12.8
cm -12.8 0 12.8
cm-12.8 0 12.8
cm
cm
-11.2
11.2
0cm
-11.2
11.2
0cm
-11.2
11.2
0cm
-11.2
11.2
0cm
-11.2
11.2
0cm
6 cm
z

145acoustics | 2012 NRL REVIEW
every point as if it were a zero-order waveguide mode. Further, a Helmholtz decomposition is performed, which separates the total field into its longitudinal and transverse components. Finally, anisotropic inversions are then applied to these filtered displacements, yield-ing local stiffness values. For the MRE measurement, the experiment was made using a standard 1.5T clinical MRI scanner (Sie-mens, Erlangen, Germany). A head-cradle extended-piston driver was used for 50 Hz harmonic head stimu-lation. A single-shot spin-echo echo planar imaging (EPI) sequence was used for acquiring three Cartesian components of the wave field in 30 adjacent transversal slices with a 2 × 2 × 2 mm3 isotropic image resolution and eight time steps over the vibration period. For the fiber position measurement, DTI data was acquired using a single-shot EPI sequence with 12 non-colinear directions. Tensor calculation and tractogra-phy along the CST was performed using the tools from the FMRIB Software Library (FSL).
Results: Figure 3 shows the MRI of the head as well as the positions of the X, Y, and Z displacement components on the top and bottom of the field of view. Figure 4 shows the results from DTI for an evalua-tion of the fiber pathways that comprise the CST of a single volunteer, as well as the results of applying the
spatial-spectral filter to the MRE data along the CST fibers. Figure 5 shows the results of the application of the anisotropic inversion for an evaluation of the local shear stiffness value, C44, within the fiber’s local refer-ence frame for all five volunteers. While estimates for brain shear stiffness vary considerably in the literature, average values of around 2 kPa have been reported for the mean shear modulus within slices of healthy samples that include both grey and white matter. Here, the shear stiffness values along the white matter tracts appear to vary from around 2 to 4 kPa (i.e., shear wave
FIGURE 4a) DTI showing the pathways, and b) the corresponding filtered shear waves along the CST.
(a) (b)
velocities vary from 2.1 to 2.4 m/s) and are spatially dependent as we follow along the right and left CSTs from the bottom to the top of the head, while the compres-sional waves along the fibers have a much higher wave velocity (~5 m/s). Future research will apply this approach to other brain structures and different frequencies.
Acknowledgments: This work was supported by the Office of Naval Re-search. Thanks to Dr. Ingolf Sack and Dr. Michael Scheel of the Department of Radiology, Charité-Universitätsmedizin, Berlin, Germany, for providing all mea-surements used in this work. [Sponsored by ONR]
References1 R. Muthupillai, D.J. Lomas, P.J. Rossman, J.F. Greenleaf, A.
Manduca, and R.L. Ehman, “Magnetic Resonance Elastography by Direct Visualization of Propagating Acoustic Strain Waves,” Science 269, 1854–1857 (1995).
2 P.J. Basser, J. Mattiello, and D. Le Bihan, “MR Diffusion Tensor Spectroscopy and Imaging,” Biophysical Journal 66, 259–267 (1994).
3 A.J. Romano, P.B. Abraham, P.J. Rossman, J.A. Bucaro, and R.L. Ehman, “Determination and Analysis of Guided Wave Propagation Using Magnetic Resonance Elastography,” Magnetic Resonance in Medicine 54, 893–900 (2005).
FIGURE 5Stiffness values for elastic coefficients C44 within the right (a) and left (b) CSTs for all five volunteers.
0
1
2
3
4
5
6
7
8
0
1
2
3
4
5
6
7
8
Re
C4
4 ((
Pa.
m3
)/kg
)R
e C
44
((P
a.m
3)/
kg)
(a)
(b)
0 1 2 3 4 5 6
Vertical Position Along Right CST (cm)
0 1 2 3 4 5 6
Vertical Position Along Left CST (cm)

146 2012 NRL REVIEW | acoustics
4 A.J. Romano, M. Scheel, S. Hirsch, J. Braun, and I. Sack, “Inves-tigation of the Anisotropic Properties of White Matter Tracts in the Human Brain Using Waveguide Constrained MR Elastog-raphy,” 19th Annual Meeting of the International Society for Magnetic Resonance in Medicine, May 2011, Montreal, Canada, poster P1480.
Acoustic Array Performance and Ship Radiated Noise Source Level Estimation in Shallow Waters
S.L. Means, J.S. Rogers, and S.C. WalesAcoustics Division
Introduction: The Navy’s acoustic surveillance and antisubmarine warfare (ASW) mission success depends on the performance of its acoustic signal receiving ar-rays. The array performance is determined by aperture size, the background acoustic noise field generated by surface vessels, and the complexity of the shallow water acoustic propagation channel. Large arrays provide nar-row beams that allow sonar operators to listen between ships (noise windows) and search for submarines. Simulations of array performance used during Naval surveillance and ASW mission training as well as op-erational planning require the realistic representation of surface vessel radiated acoustic noise fields. We describe measured acoustic array performance, the temporal variability of surface vessel radiated acoustic noise fields, and an approach to estimate the source level of ship-radiated noise in shallow water.
Experiment: In 2007, the Office of Naval Research deployed a large-aperture (917 m) linear hydrophone array to collect acoustic data off the coast of Fort Lauderdale, Florida, nominally 12 km offshore, in 263 m of water. The experiment sought to measure the array’s performance in shallow water environments in the presence of commercial and recreational ves-sels. Marine-band radar and Automatic Identification System (AIS) data were collected concurrently to track shipping near the array. Figure 6 illustrates the loca-tion of the array and the karst bathymetry of the Miami Terrace. The data analyzed here were collected in late summer (August and September).
Median Beam Noise and Noise Window Statis-tics: Array performance in terms of median beam noise (MBN) and noise window statistics as a function of bearing, frequency, and aperture is obtained through data analysis. The data are split into categories — week-day day (WDD; 312 hours ), weekday night (WDN; 282 h), weekend day (WED; 136 h), and weekend night
(WEN; 136 h) — so that temporal variations in ship-ping, both commercial and recreational, might be ob-served. Figure 7(a) (top row) shows the MBN received on the quarter, half, and full apertures for the four time categories at 416 Hz, near the upper limit of the array. It is noticed, in general, that the noise levels increase from WEN to WDN to WDD to WED. In particular, the WED seaward-bearing noise levels are elevated above the WDD by ~3 dB. This is due to the many recreation-al vessels distributed over the entire region rather than in commercial shipping lanes. Although not shown here, the levels are more elevated at this frequency (416 Hz) than observed at lower frequencies. This fits known characteristics of recreational and commercial vessels; recreational vessels radiate proportionally more acoustic energy at higher frequencies relative to large, commercial vessels. Noise windows are time periods in which an array may observe “quiet” regions in between passing ships. These windows provide opportunity of enhanced surveillance of low-noise submarines. For this study, a noise window is defined as a time period in which the background noise level drops 3 dB below the MBN. Figure 7(b) illustrates the probability, rate, and duration of the occurrence of noise windows during WDDs on the three apertures at 416 Hz. One sees that the noise window occurrences are strongly dependent on bear-ing due to shipping traffic through Port Everglades; the high-noise bearings of the MBN manifest as lower probabilities and higher rates of noise windows. As
FIGURE 6Experimental site approximately 12 km off the coast of south Florida. The region east of the array has a karst bottom composed of limestone outcrops and sand pools.

147acoustics | 2012 NRL REVIEW
expected, the rate and duration of occurrence are in-versely proportional to each other. Through such analy-sis, one may optimally design an array and detection algorithms for surveillance in a given environment.
Ambient Noise Modeling: The ability to accurately estimate shipping source levels (SLs) from the acoustic noise data is an essential step toward creating a forecast model of the ambient noise field. Individual ship SL estimates are computed by solving the system of linear equations, governed by the sonar equation, that relate source level to transmission loss (TL) and beamformer response. Here, beamformer response is known and transmission loss can be modeled from ship positions determined from AIS reports and local radar data. Since source levels must be positive, they are solved for with a non-negative least squares algorithm. Figure 8(a) shows a conventional beamformed bearing-time record (BTR) taken from a 30-minute segment of array data at 104 Hz. SLs are estimated from the beamformed data in Fig. 8(a), then reconstructed using the computed TL and beamformer response to form the BTR shown in Fig. 8(b). A side-by-side comparison shows 3.5 dB mean squared error between the two surfaces. A suit-able model of the karst bottom (see Fig. 6) developed for this project was necessary to compute TLs of suf-ficient detail to achieve this level of mean squared error.
Summary: The acoustic data obtained on a very large horizontal array over extended time periods along with comprehensive measurements of shipping posi-
FIGURE 7(a) Median beam noise for three apertures and four time period classifications at 416 Hz. (b) Noise window statistics (probability, rate, and duration) of WDD noise for quarter, half, and full apertures at 416 Hz.
(a)
(b)
FIGURE 8(a) Conventional BTR taken from a 30-minute segment of array data. (b) Reconstructed BTR obtained after SL estimation.
(a)
(b)

148 2012 NRL REVIEW | acoustics
tions allowed us to study the performance parameters of large-aperture arrays and develop techniques for ship source level estimation. The understanding of acoustic array performance and the ability to estimate ship-radiated acoustic noise source levels in complex shallow water environments with heavy shipping will serve to improve the reliability of Naval acoustic sur-veillance and ASW operations training and planning. [Sponsored by the NRL Base Program (CNR funded)]
Nonlinear Poroacoustics: From Kinks to Shocks
P.M. Jordan1 and J.K. Fulford2 1Acoustics Division2Acoustics Division (retired)
Nonlinear Poroacoustics: The study of sound propagating in fluid-saturated porous media, often referred to as poroacoustics, is an important subfield of acoustics, and one which has recently experienced a renewal of interest among researchers (see, for ex-ample, Ref. 1 and those therein). If the signal strengths involved are relatively weak and the propagation dis-tances of interest are relatively short, then, just as under
classical acoustics theory, the mathematical models that describe poroacoustic waves involve only linear partial differential equations. If, on the other hand, these conditions are not satisfied, then models based on the linear theory of sound propagation must be set aside, as nonlinear effects, being cumulative over distance traveled, must be taken into account. However, while nonlinear poroacoustic theories are able to capture the salient physics that underlies this class of compressible flow, the mathematical challenges posed by these theo-ries, and by extension the nonlinear model equations derived from them, often dissuade researchers from attempts aimed at finding analytical solutions.
Kinks, Acceleration Waves, and Shocks: Recently, we have succeeded in obtaining what is, possibly, the first exact solution to the set of fully nonlinear, one-dimensional equations governing acoustic propagation in a gas that permeates a class of rigid porous media.2 Employing primarily the methods and tools of classical mathematical analysis, we not only uncovered a host of new analytical results, but our investigation also pre-dicts the existence of unexpected, and possibly exploit-able, nonlinear (physical) phenomena associated with this case of poroacoustic flow. The following are four of the major findings reported in Ref. 2: (i) established the existence of three distinct propagation regimes (see Fig. 9), specifically, kink, acceleration wave, and shock,
FIGURE 9As the value of c is decreased from greater than to less than unity, we observe the transition from smooth, but increasing asymmetric, kink-type waveforms, for c = 1.25 to c = 1.05, to one that admits a corner, and thus an acceleration wave, for c = 1.0, to finally a dual-valued solution profile, which in this case signals the presence of a shock, for c = 0.70. Here, γ = 7/5, corresponding to a diatomic gas, κ = 1, and ƒw = 0.5; see Ref. 2 for the definitions of ƒ, ξ, and the parameters men-tioned above.

149acoustics | 2012 NRL REVIEW
which correspond to c > 1, c = 1, and c < 1, respectively, where the positive constant c denotes the speed of the traveling waveform; (ii) confirmed the finding reported in Ref. 3 of a critical amplitude value associated with poroacoustic acceleration waves, namely, the con-stant α*, which represents the ratio of attenuation (as described by Darcy’s law) to nonlinearity; (iii) derived explicit expressions for the amplitudes of the shock and acceleration waves that occur for c ≤ 1, respectively; and (iv), uncovered the surprising appearance of the famous number φ, known as the Golden Ratio, in the solution corresponding to the case of a diatomic gas, an example of which is air. [Sponsored by the NRL Base Program (CNR funded)]
References1 B. Straughan, Stability and Wave Motion in Porous Media
(Springer, New York, 2008).2 P.M. Jordan and J.K. Fulford, “A Note on Poroacoustic Travel-
ing Waves Under Darcy’s Law: Exact Solutions,” Applications of Mathematics 56, 99–115 (2011).
3 P.M. Jordan, “Growth and Decay of Acoustic Acceleration Waves in Darcy-type Porous Media,” Proc. of the Royal Society A 461, 2749–2766 (2005).

Atmos
pheri
c Scie
nce a
nd Te
chno
logy152
Real-Time Prediction of Tropical Cyclone Intensity Using COAMPS-TCJ.D. Doyle, R.M. Hodur, S. Chen, H. Jin, Y. Jin, J. Moskaitis, A. Reinecke, P. Black, J. Cummings,
E. Hendricks, T. Holt, C.-S. Liou, M. Peng, K. Sashegyi, J. Schmidt, and S. Wang
154Cirrus Cloud Seeding by Stratospheric Volcanic Aerosol Particles
J.R. Campbell, M.D. Fromm, N.A. Krotkov, S.A. Stewart, E.J. Welton, and K. Yang
156Merging Geographic Information Systems Technologies with Environmental Prediction
C. Hutchins, J. Cook, M. Frost, D. Martinez, D. Geiszler, Q. Zhao, P. Harasti, J. Kent, and G. Love
Cathodic protection design: NRL has a physical scale modeling facility to construct detailed physical models of ship and submarine hulls that are outfitted with sensors, materials, and control systems to model corrosion protection systems and the resultant electromagnetic signatures.

152 2012 NRL REVIEW | atmospheric science and technology
Real-Time Prediction of Tropical Cyclone Intensity Using COAMPS-TC
J.D. Doyle,1 R.M. Hodur,2 S. Chen,1 H. Jin,1 Y. Jin,1 J. Moskaitis,1 A. Reinecke,1 P. Black,2 J. Cummings,3 E. Hendricks,1 T. Holt,1 C.-S. Liou,1 M. Peng,1 K. Sashegyi,1 J. Schmidt,1 and S. Wang1
1Marine Meteorology Division2SAIC, Inc.3Oceanography Division
Introduction: The demand for more accurate tropical cyclone (TC) forecasts with longer lead times is greater than ever due to the enormous economic and societal impact of these storms. There has been spec-tacular improvement in TC track prediction; a three-day hurricane track forecast today is as skillful as a one-day forecast was just 30 years ago. However, there has been little progress in improving TC intensity and structure forecasts due to a variety of reasons, ranging from a lack of critical observations under high wind conditions and in the TC environment, to inaccurate representations of TC physical processes in numerical weather prediction (NWP) models. Advances in high-resolution TC model-ing and data assimilation are thought to be necessary to significantly improve the performance of intensity and structure prediction. To this end, the Naval Research Laboratory in Monterey, California, has developed the Coupled Ocean/Atmosphere Mesoscale Prediction System for Tropical Cyclones (COAMPS-TC™), a new version of COAMPS® designed specifically for high-resolution tropical cyclone prediction.
COAMPS-TC System: The COAMPS-TC system is comprised of data quality control, analysis, initialization, and forecast model subcomponents. A TC version of the Navy Atmospheric Variational Data Assimilation System (NAVDAS) has been developed to blend the available atmospheric observations from a plethora of sources, along with synthetic observations that define the TC structure and intensity. The COAMPS-TC atmospheric model uses the nonhydrostatic and compressible form of the dynamical equations; and includes physical parame-terizations of cloud microphysical processes, convection, radiation, boundary layer processes, and surface layer fluxes.1 The COAMPS-TC system allows for moving nested grid families that independently follow individual tropical cyclone centers. The COAMPS-TC system has the capability to operate in a fully coupled air–sea interaction mode using the Navy Coastal Ocean Model (NCOM) and the Simulating WAves Nearshore (SWAN) model.2 The Navy Coupled Ocean Data Assimilation (NCODA) system is used to initialize the ocean.
Real-Time Demonstration of COAMPS-TC: Real-time COAMPS-TC forecasts have been conducted using U.S. Department of Defense High Performance Computing (HPC) platforms over the past several years. An example of the intensity forecast performance of COAMPS-TC for a large number of cases (more than 450 cases at the 24 h forecast time) in the W. Atlantic region for the 2010 and 2011 seasons is shown in Fig. 1 (homogeneous statistical sample). The COAMPS-TC model had the lowest intensity error of any dynamical model for the 36 to 120 h forecast times, which is an important period for forecasters and decision makers. Other numerical models included in this analysis are operational models run by NOAA (HWRF, GFDL), and the Navy’s current operational limited area model (GFDN).
An example of a real-time COAMPS-TC forecast for Hurricane Irene (2011) is shown in Fig. 2. The com-posite National Weather Service (NWS) radar reflectiv-ity (a proxy for the rainfall distribution and intensity) is shown in the top panel near the time of landfall in North Carolina at 1148 UTC 27 August 2011, and the COAMPS-TC predicted radar reflectivity at 36 h valid at 1200 UTC is shown in the bottom panel. The COAMPS-TC forecast shown in Fig. 2 is for the model second grid mesh (15 km horizontal resolution). The model prediction was accurate in the track, eventual landfall location, and storm intensity, as well as the
FIGURE 1Wind speed mean absolute error (MAE) (knots; 1 knot = 0.514 m s–1) as a function of forecast time for the 2010 and 2011 sea-sons in the Atlantic basin for a homogeneous statistical sample. The numerical models included in this analysis are the Navy’s COAMPS-TC, operational models run by NOAA (HWRF, GFDL), and the Navy’s current operational limited area model (GFDN). The number of cases is shown at the bottom. (NHC = National Hurricane Center).
0 12 24 36 48 72 96 1200
5
10
15
20
25
Lead time (h)
MAE
(kt)
Intensity error, NHC criteria
COAMPS−TCHWRFGFDNGFDL
Sam
ple
size
Lead time (h)
611532
453 395 336241 182 125

153atmospheric science and technology | 2012 NRL REVIEW
structure and size, especially important characteristics of this particular storm in such close proximity to the U.S. East Coast. The COAMPS-TC prediction captures the large areal extent of the precipitation field, as well as its asymmetry about the TC center (most of the precipi-tation is north and east of the center). This large shield of heavy precipitation caused severe river flooding as it slowly moved north through the mid-Atlantic and
northeast United States. Overall, the Navy’s COAMPS-TC real-time intensity predictions of Hurricane Irene outperformed other leading operational governmental forecast models, as shown in Fig. 3. All the available models except COAMPS-TC had a tendency to over-intensify Irene, often by a full storm category or more. These real-time COAMPS-TC forecasts were used by forecasters at the National Hurricane Center (NHC) as part of an experimental NOAA multi-model ensemble. The COAMPS-TC consistently provided accurate real-time intensity forecasts during the period of August 23 through 28, 2011, when critical decisions, including decisions on evacuations, were made by forecasters and emergency managers. Prediction of tropical cyclone track and particu-larly intensity remains one of the greatest challenges in meteorology today. The results of this research high-light the promising capability of COAMPS-TC. While COAMPS-TC accurately predicted the evolution of Irene and other tropical cyclones in real time, it has not predicted all TCs equally well. The data collected during the life cycle of these storms provide opportuni-ties to study and obtain a greater appreciation of the complex physics and interactions that occur in these systems, and to use this information to improve our COAMPS-TC modeling system.
Acknowledgments: We acknowledge the support of the Office of Naval Research (ONR) and NOAA (Hurricane Forecast Improvement Project). We ac-knowledge the collaboration with NRL’s Oceanography Division in Stennis, MS, related to the air–sea coupled capability for COAMPS. We also appreciate support for
FIGURE 2The NWS composite radar reflectivity valid at 1148 UTC 27 August 2011 (left panel) (source NOAA) and the COAMPS-TC 36 h forecast radar reflectivity performed in real time and valid at 1200 UTC 27 August (right panel) for Hurricane Irene. The COAMPS-TC reflectivity is shown for the second grid mesh, which has a horizontal resolution of 15 km.
FIGURE 3Wind speed mean absolute error (MAE) (knots) as a function of forecast time for Hurricane Irene for a homogeneous statisti-cal sample. The numerical models included in this analysis are the Navy’s COAMPS-TC, operational models run by NOAA (HWRF, GFDL), and the Navy’s current operational limited area model (GFDN). The number of cases is shown at the bottom. Only forecasts after Irene has moved away from Hispaniola are shown here.
0 12 24 36 48 72 96 1200
5
10
15
20
25
30
35
40
Lead time (h)
Mea
n ab
solu
te e
rror (
kt)
Intensity error, NHC criteria
COAMPS−TCHWRFGFDNGFDL
Sam
ple
size
Lead time (h)
23 21 19 17 1511
73
154 2012 NRL REVIEW | atmospheric science and technology
computational resources through a grant of Depart-ment of Defense High Performance Computing time from the DoD Supercomputing Resource Center at Stennis, MS, and Vicksburg, MS. COAMPS® is a regis-tered trademark of the Naval Research Laboratory. [Sponsored by ONR and NOAA]
References1 J.D. Doyle, Y. Jin, R. Hodur, S. Chen, H. Jin, J. Moskaitis, A.
Reinecke, P. Black, J. Cummings, E. Hendricks, T. Holt, C. Liou, M. Peng, C. Reynolds, K. Sashegyi, J. Schmidt, and S. Wang, “Real Time Tropical Cyclone Prediction Using COAMPS-TC,” conditionally accepted by AOGS (2012).
2 S. Chen, T.J. Campbell, H. Jin, S. Gaberšek, R.M. Hodur, and P. Martin, “Effect of Two-Way Air–Sea Coupling in High and Low Wind Speed Regimes,” Mon. Wea. Rev. 138, 3579–3602 (2010).
Cirrus Cloud Seeding by Stratospheric Volcanic Aerosol Particles
J.R. Campbell,1 M.D. Fromm,2 N.A. Krotkov,3
S.A. Stewart,3 E.J. Welton,3 and K. Yang3 1Marine Meteorology Division2Remote Sensing Division3NASA Goddard Space Flight Center
Introduction: Lower stratospheric (LS) volcanic incursions can indirectly perturb upper tropospheric (UT) cloud fields (i.e., cirrus clouds) long after the initial eruption cycle from gradual particle settling and re-entrainment back into the troposphere. Volcanic sul-fur dioxide and hydrogen sulfide vapor molecules are photo-oxidized in the LS, forming gaseous sulphuric acid, which in turn increases sulfate-based aerosol par-ticle concentrations through nucleation, condensation, and coagulation (i.e., hydrated sulfuric acid solution droplets). These particles, combined with any embed-ded silicate ash aloft, are highly efficient ice nuclei. NRL scientists, in collaboration with colleagues at NASA Goddard Space Flight Center (GSFC), have collected the most compelling observations to date unambiguously linking cirrus cloud seeding to aged stratospheric volcanic particles.1 The August 7 and 8, 2008, Mt. Kasatochi eruption injected gases and ash into the LS over the Aleutian Islands of southwestern Alaska, nearing 17.0 km (all heights above mean sea level). Ten days downwind over south-central Mary-land, Kasatochi aerosols were profiled by ground-based lidar mixing into the UT near a tropopause fold. Driven by enhanced ambient water vapor concentrations, cirrus clouds and ice crystal fallstreaks emerged from within the volcanic layer, likely induced by either ho-mogeneous freezing of sulfate solution droplets or their heterogeneous activation by ash. NASA and NOAA
satellite observations add contextual evidence support-ing these findings.
Kasatochi Particles and Cirrus Cloud Seeding over Maryland: On August 17 and 18, or just a week after the Kasatochi eruption, LS aerosol particles were profiled in zenith-oriented 0.532 µm lidar measure-ments collected at the NASA Micropulse Lidar Net-work (MPLNET) field site on the GSFC campus in Greenbelt, Maryland (Fig. 4). Lidar backscatter is proportional to particle number concentration and cross-sectional area. The LS layer depicted in Fig. 4 thus represents scattering by newly formed sulfate solution droplets and any ash debris aloft. The cold-point tro-popause height measured at nearby Sterling, Virginia, during this period varied between 12.0 and 12.5 km. Hyperspectral ultraviolet composite retrievals of sulfur dioxide concentration over the eastern United States at 1815 UTC on the 17th shown in Fig. 5(a), derived from NASA Ozone Monitoring Instrument (OMI) measurements, depict transient Kasatochi LS filaments approaching central Maryland. Regional wa-ter vapor imagery collected concurrently from a NOAA geostationary satellite (6.47 to 7.02 µm broadband channel) is shown in Fig. 5(b). Subsidence associated with a tropopause fold, marking the intrusion of stable stratospheric air into the baroclinic region beneath the jet stream propagating along the base of a geopo-tential height trough apparent over the east-central United States, is interpreted from a relatively dark band stretching from Nebraska to Maryland. Tropopause folds are turbulent, thus inducing UT/LS exchange. Beginning 2000 UTC on the 17th, with maxi-mum SO2 concentrations reaching the area, increased backscatter was measured with the MPLNET instru-ment above 13.0 km, lasting through 0100 on the 18th. Simultaneously, a segment of the layer was displaced downward into the UT, reaching below 11.0 km by 0500. From 2200 until 0400, strong and transmis-sive signals characteristic of cirrus clouds and ice crystal fallstreaks were profiled from 10.0 to 11.5 km, with tops embedded within the UT-entrained layer. A regional true-color composite image derived from NASA Moderate Resolution Infrared Spectroradiom-eter (MODIS) measurements collected at 1805 UTC on the 17th, in sequence ahead of OMI, is shown in Fig. 6. A relatively narrow band of cirrus clouds and fallstreaks, corresponding with those profiled by the MPL, were oriented from northwestern Virginia across the Chesapeake Bay and extending northeastward over the western Atlantic. Two scenarios for cirrus cloud seeding likely recon-cile this event. First, regional temperatures above 10.0 km were colder than 235 K, or the approximate thresh-old for homogeneous freezing of water that in solution is believed a function of water activity as opposed to

155atmospheric science and technology | 2012 NRL REVIEW
any relation to the nature of the solute itself. In this scenario, the preferential freezing of the larger sulfate solution droplets at higher temperatures occurs versus smaller ones in equal dilution due to the stochastic na-ture of homogeneous nucleation and proportionality of freezing rate with droplet volume. Hygroscopic growth in relatively moist UT air and the subsequent freezing of larger sulfate solution droplets would proceed, with growth sustained by vapor deposition governed by ambient ice supersaturation. Heterogeneous droplet activation through sulfate solution droplet interaction with silicate ash debris is a second potential mechanism. In this scenario, nucle-
FIGURE 4NASA Micropulse Lidar Network zenith measurements of normalized relative backscatter signal for 1200 to 0600 UTC 17 to 18 August 2008 from 9.0 to 15.0 km collected at the Greenbelt, Mary-land, site on the campus of Goddard Space Flight Center.
FIGURE 5(a) NASA Ozone Monitoring Instrument composite measurements of SO2 concentration (reported in Dobson Units, where 1 DU = 2.69 × 10¹⁶ molecules/cm2) over the eastern U.S. collected at 1815 UTC 17 August 2008. (b) Corresponding NOAA GOES water vapor imagery for the region concurrently at 1815 UTC. A star (★) is used to denote the approximate location of the MPLNET ground site in each image.
ation and ice crystal growth are relatively fast and thus constrained to low ice number densities. The reverse is found, and ice number densities are higher, when droplets freeze homogeneously. In Figs. 4 and 6, many of the cells appear opaque, implying that ice number densities were not unusually low within some of the clouds, a finding that would support homogeneous freezing. However, sheared fallstreaks with no parent heads are similarly ap-parent in the available MPLNET/MODIS data, suggesting likely low number densities and implying that perhaps heterogeneous nucleation by ash had occurred. It is plau-sible that both mechanisms were occurring simultane-ously.

156 2012 NRL REVIEW | atmospheric science and technology
Acknowledgments: This work was conducted with the support of the Office of Naval Research (ONR). Cynthia Karengin at NRL Monterey constructed each of the figures. [Sponsored by ONR]
Reference1 J.R. Campbell, E.J. Welton, N.A. Krotkov, S.A. Stewart,
and M.D. Fromm, “Likely Seeding of Cirrus Clouds by Stratospheric Kasatochi Volcanic Aerosol Particles Near a Mid-Latitude Tropopause Fold,” Atmos. Env. 46, 441–448 (2012), doi:10.1016/j.atmosenv.2011.09.027.
Merging Geographic Information Systems Technologies with Environmental Prediction
C. Hutchins,1 J. Cook,1 M. Frost,1 D. Martinez,2 D. Geiszler,3 Q. Zhao,1 P. Harasti,1 J. Kent,3 and G. Love3
1Marine Meteorology Division2CSC3SAIC, Inc.
Synopsis: The Coupled Ocean/Atmosphere Me-soscale Prediction System (COAMPS®) – On-Demand System (COAMPS-OS®) is software developed at NRL that the U.S. Navy uses to run the COAMPS operation-al mesoscale numerical weather prediction system. In 2011, NRL released the first version of the COAMPS-OS Dashboard Viewer (CDV) into operations at the U.S. Navy’s Fleet Numerical Meteorology and Ocean-
FIGURE 6NASA Moderate Resolution Infrared Spectroradiometer true-color composite centered over Maryland collected at 1805 UTC 17 August 2008, with the MPLNET ground site labeled.
ography Center (FNMOC). The CDV is a Geographic Information Systems (GIS) web browser application for creating, viewing, and exporting all COAMPS model visualizations and most products provided by COAMPS-OS.
Rationale: Current technologies used by opera-tional naval forecasters range from static images with zero interaction, to a highly interactive “thick” client, namely, the Joint METOC (Meteorology and Oceanog-raphy) Viewer (JMV). While static images are relatively easy to generate and deliver to the user, forecasters have very little, if any, customization options, and searching for and finding products can be cumbersome, as they are often buried behind many web pages, portals, and links. While JMV is the tool of choice for the shipboard forecaster by providing access to countless products and many tools, the drawback is that it must first be installed on a user’s system and is generally limited to meteorological and oceanographical products. Scien-tists also have limited options for performing necessary model verification within COAMPS-OS. Currently, scientists use static images, similar to naval forecasters, accompanied by statistics from static web pages, with no option to overlay or fuse the products together for a better analysis. It was therefore necessary to provide COAMPS-OS users with an easily accessible and highly interactive web application that allows them to easily explore, visualize, combine, and export weather prod-ucts using the latest technologies.
The Application: The CDV client and server uses open source technologies that leverage the power of many developers and users around the world to bring

157atmospheric science and technology | 2012 NRL REVIEW
the best and latest features to military operators and scientists. The CDV client is built using the Google Web Toolkit (GWT) development framework, which enables NRL scientists to develop a complex web application in the Java programming language, and then convert it into an Asynchronous JavaScript and XML (AJAX) web application. The AJAX application produced by GWT is optimized for all major web browsers (Fig. 7), allowing the CDV to reach many users regardless of the platform. Using AJAX, no installation on a user’s computer is needed; all that is needed for a user to launch and use the CDV is a web browser with an Internet connection. The heart of the CDV client is its GIS web map. The CDV web map uses the OpenLayers open source soft-ware package, which provides an interactive web map similar to Google Maps®. Use of a technology that most people are already familiar with in their daily lives helps keep the CDV’s learning curve low. The current opera-tional version of the CDV web map displays products
using standard protocols and services such as the Web Map Service (WMS). The CDV server provides the CDV client with the necessary web services to explore, visualize, and export COAMPS-OS products. The raw weather and ocean model data are converted on the server into standard GIS formats to be consumed by the CDV client as well as other GIS clients.
Integration and Features: Using standard GIS formats and protocols, the CDV client is able to dis-play data from a variety of sources simultaneously. This
includes more than 60 COAMPS forecast products and ocean products from the Navy Coastal Ocean Model (NCOM) and WAVEWATCH III® (WW3) models. This type of data integration is unprecedented in COAMPS-OS. The CDV also has the ability to display remote sensing data from radar and satellite sources. For scientists, the CDV can display model verification data provided by COAMPS-OS with the actual COAMPS forecast products, providing a rich model forecast veri-fication tool. The CDV client and server can also com-municate with other GIS clients and servers to provide a powerful GIS integration tool (Fig. 8). For example, other WMS supporting applications, such as ArcGIS Explorer®, can communicate with the CDV server and display COAMPS-OS data on its map interface. For military operators, any geospatial intelligence informa-tion exposed as a standard WMS service can be viewed by the CDV, enhancing their environmental situational awareness.
Perhaps one of the best features of the CDV system is its ability to create a product from a variety of source datasets in any way the user desires and export it into three common formats: PNG image, Shapefile, and Keyhole Markup Language (KML). By far the most popular format of the three is KML, the file format of choice in Google Earth®. Never before in COAMPS-OS has a user had the ability to create his own product and view, integrate, and interact with it on the 3D Google Earth globe (Fig. 9). The CDV is continuing to undergo development at NRL in order to provide U.S. military operators with
FIGURE 7A mosaic of the CDV client in four popular web browsers: Google Chrome (top left), Mozilla Firefox (top right), Microsoft Internet Explorer 9 (bottom left), and Apple Safari (bottom right). The data displayed is COAMPS surface air temperature with 500 millibar geopotential height contours.

158 2012 NRL REVIEW | atmospheric science and technology
FIGURE 8Infrared satellite imagery and National Hurricane Center (NHC) forecast of an Atlantic tropical system integrated with COAMPS forecasted sea level pressure. NHC and satellite data were provided by the National Oceanic and Atmospheric Administration’s National Ocean Service nowCOAST WMS service.
FIGURE 9Same meteorological data from Fig. 7 exported to KML using the CDV and displayed in Google Earth.
more features, increased usability, and better access to meteorological and other geospatial intelligence infor-mation. [Sponsored by ONR]

Chem
ical/B
ioche
mica
l Res
earch
160Laser Trace Vaporization of Explosives
M. Papantonakis, C.A. Kendziora, R. Furstenberg, V. Nguyen, J. Großer, and R.A. McGill
161Heat Sensitization Effects in Aluminum Ship Structure Alloys
R.L. Holtz, P.S. Pao, R.A. Bayles, and R. Goswami
164Biosensor Triage for Traumatic Brain Injury
S.H. North, C.R. Taitt, L.C. Shriver-Lake, and F.S. Ligler
168High-Resolution Widesweep Backscatter Ionograms
G. San Antonio
170 Real-Time Electronic Attack (EA) Effectiveness Monitoring
S.L. Beun and J.J. Genova
172Diamond for Thermal Management in Power Electronics
T.J. Anderson, M.J. Tadjer, K.D. Hobart, T.I. Feygelson, J.D. Caldwell, M.A. Mastro,J.K. Hite, C.R. Eddy, Jr., F.J. Kub, and B.B. Pate
An employee of the Chemistry Division received the International Association of Stability, Handling and Use of Liquid Fuels (IASH) Lifetime Achievement Award for research in the chemical behavior, handling, and characterization of Navy mobil-ity fuels.

160 2012 NRL REVIEW | chemical/biochemical research
Laser Trace Vaporization of Explosives
M. Papantonakis,1 C.A. Kendziora,1 R. Furstenberg,1
V. Nguyen,1 J. Großer,2 and R.A. McGill1
1Materials Science and Technology Division2Bundesamt für Wehrtechnik und Beschaffung, Koblenz, Germany
Introduction: The low vapor pressure of many explosives presents a significant challenge for the detection of trace quantities by noncontact methods. We address this limitation by illuminating explosives including TNT, RDX, and ammonium nitrate with an infrared (IR) laser tuned to strong molecular absorp-tion bands to efficiently heat trace amounts present on substrates. This dramatically increases the vapor concentration for immediate detection, obviating the need to manually swab surfaces to collect solid particles and transport them to a nearby detector. The instan-taneously generated vapor produced by laser trace vaporization (LTV)1,2 can be identified by any number of detection or sampling techniques.
Technical Approach: Handling explosives and re-lated materials or improvised explosive devices (IEDs) results in particulate contamination of any contacted surfaces. These particles typically offer a significant residence time and provide a detection target to moni-tor for IED activities. Wavelength-specific light from a miniature IR quantum cascade laser is used to effi-ciently couple energy into a specific molecular bond of an explosive material and rapidly heat the particle. This allows particles of explosives to be instantaneously va-porized without decomposition to form a momentary high-concentration plume suitable for various detec-tion applications. The verification of augmented vapor signatures in this work is accomplished with a commer-cial ion mobility spectrometer (IMS).
Results: The ability to controllably vaporize explo-sive materials can be seen in Fig. 1, where 160 mW of laser power was scanned over a polycarbonate substrate densely coated with submicron particles of RDX. By careful selection of laser power, wavelength, and scan-ning speed, LTV is able to completely vaporize all illu-minated RDX particles without damaging the substrate. Figure 2 shows that vaporization is enhanced when using a wavelength that is strongly absorbed by the explosive material. A thin, IR-transparent substrate was loaded with sufficient TNT material (~500 ng) to pro-vide a background vapor signal detectable with the IMS and then irradiated with wavelengths that were either weakly or strongly absorbed by the TNT. When using a weakly absorbed wavelength, little to no enhancement was seen relative to the background signal. Conversely, when using a wavelength more strongly absorbed by
the TNT, a significant enhancement was seen. However, when thicker substrates were used, wavelength selectiv-ity in the TNT vapor enhancement was not observed. We believe this is due to nonspecific absorption by the substrate, causing it to heat sufficiently to contribute to the TNT vaporization, and in many cases it can mask the effect of direct vaporization of the particles due to resonant absorption. The results discussed above were all accomplished using continuous wave lasers. To examine the effects of using short laser pulses and different particle and sub-strate geometries, we used a software package (COM-SOL) to model these conditions. Figure 3 (left) shows the simulation results of laser heating of a strongly absorbing TNT particle (1/e absorption depth of 1 µm; 69 µm diameter) on a weakly absorbing substrate (1/e absorption depth of 100 µm). The results show that the TNT particle is heated significantly more than the underlying substrate. An infrared camera was used to empirically measure the temperature rise of laser-heated ammonioum nitrate particles with diameters of ~60 microns (Fig. 3, right). The particles reach thermal equilibrium in about 50 ms, well before the end of the 200 ms laser pulse. Together these results suggest that using shorter laser pulses will allow us to heat particles on surfaces while limiting the contribution that sub-strate heating makes to vaporization of the particles.
Conclusion and Future Work: We have demon-strated the efficacy of LTV to vaporize ammonium nitrate, TNT, and RDX on a variety of solid substrates and in the presence of different interferents. We have found that while vaporization of selected materials can be controlled by carefully controlling the laser wave-length, nonresonant heating by the substrate can mask that specificity when continuous wave lasers are used. Our computational modeling suggests that the sub-strate heating can be controlled by using shorter laser pulses, which we believe, when also controlling the
FIGURE 1A laser was scanned over a polycarbonate surface coated with submicron particles of RDX, vaporizing the RDX and writing the letters “NRL.”

161chemical/biochemical research | 2012 NRL REVIEW
laser wavelength, will allow us to selectively vaporize the materials of interest without vaporizing potentially interfering materials in the vicinity of the explosives. The small footprint of quantum cascade lasers pro-vides the opportunity to integrate this technology with existing detectors with only modest hardware modi-fications, which is especially desirable for handheld instruments. Additionally, the flexibility to manufac-ture quantum cascade lasers at a wide range of specific wavelengths allows LTV to be considered for use in the detection of other low vapor pressure materials such as drugs of abuse. [Sponsored by the Department of Homeland Security]
References1 R.A. McGill, C. Kendziora, R. Furstenberg, M. Papantonakis,
J.S. Horwitz, and G.K. Hubler, “Detection of Chemicals with Infrared Light,” U.S. Patent No. 8,222,604, July 17, 2012.
2 R. Furstenberg, J. Großer, C.A. Kendziora, M.R. Papantonakis, V. Nguyen, and R.A. McGill, “Modeling of Laser-Analyte-Substrate Interaction in Photo-thermal Infrared Imaging and Laser Trace Vaporization,” Proc. SPIE 8013, 801318 (2011).
Heat Sensitization Effects in Aluminum Ship Structure Alloys
R.L. Holtz,1 P.S. Pao,1 R.A. Bayles,2 and R. Goswami1 1Materials Science and Technology Division2Chemistry Division
Background: Aluminum-magnesium alloys with 3 to 6 percent magnesium are important ship struc-ture alloys because they exhibit excellent resistance to
FIGURE 2(Left) FTIR transmission spectrum of TNT in the 7 to 8 µm region. The strong absorption mode at 7.391 µm and the weaker one at 7.191 µm were selected to irradiate a sample of TNT on a polyeth-ylene card. (Right) Vapor enhancement of TNT from a polyethylene card as measured by an IMS when irradiated with the two wavelengths. A strong enhancement was seen using the wavelength that was resonant with a TNT absorption mode, while little to no enhancement was observed for the more weakly absorbing wavelength.
FIGURE 3(Left) Simulation results of the temperature rise of both a TNT particle (blue) and its supporting substrate (green) in response to a laser pulse that is short relative to the materials’ thermal time constants. The shape and size of the particle and its stronger optical absorption cause it to achieve a much larger temperature rise than the sub-strate for short pulses. (Right) Measured temperature rise of ammonium nitrate (AN) particles of ~60 µm diameter upon heating with a 200 ms laser pulse. Note that the particles reach thermal equilibrium in about 50 ms.
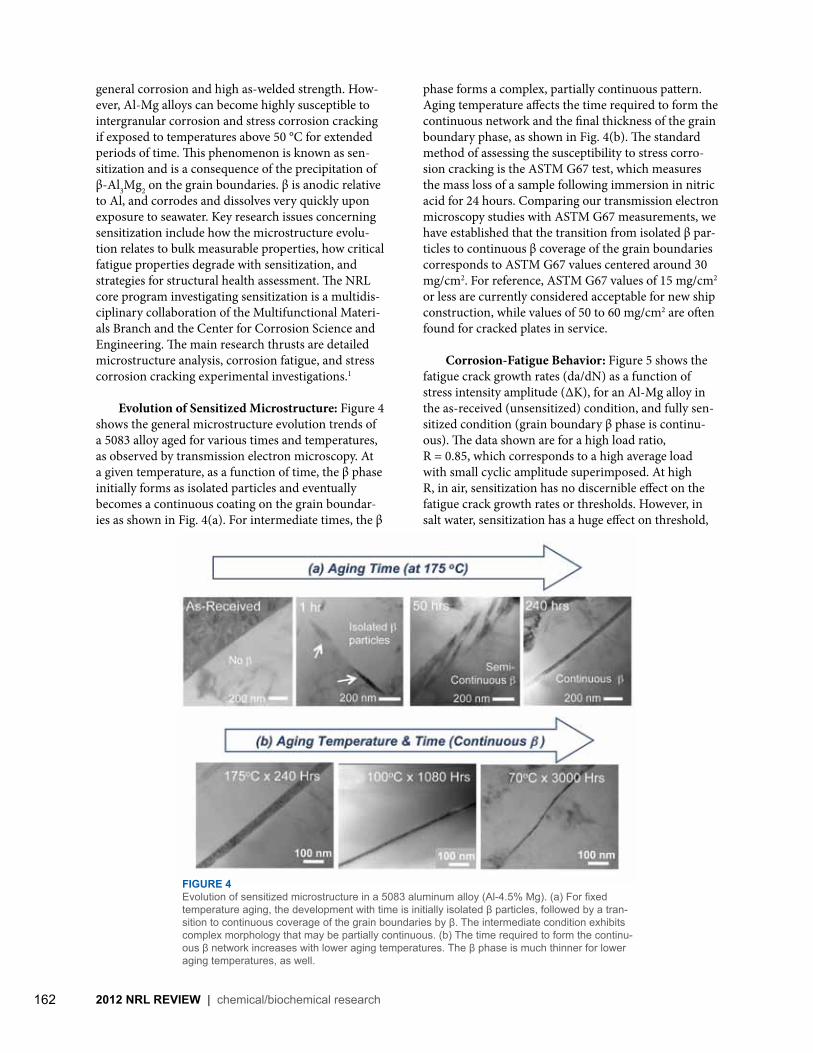
162 2012 NRL REVIEW | chemical/biochemical research
general corrosion and high as-welded strength. How-ever, Al-Mg alloys can become highly susceptible to intergranular corrosion and stress corrosion cracking if exposed to temperatures above 50 °C for extended periods of time. This phenomenon is known as sen-sitization and is a consequence of the precipitation of β-Al3Mg2 on the grain boundaries. β is anodic relative to Al, and corrodes and dissolves very quickly upon exposure to seawater. Key research issues concerning sensitization include how the microstructure evolu-tion relates to bulk measurable properties, how critical fatigue properties degrade with sensitization, and strategies for structural health assessment. The NRL core program investigating sensitization is a multidis-ciplinary collaboration of the Multifunctional Materi-als Branch and the Center for Corrosion Science and Engineering. The main research thrusts are detailed microstructure analysis, corrosion fatigue, and stress corrosion cracking experimental investigations.1
Evolution of Sensitized Microstructure: Figure 4 shows the general microstructure evolution trends of a 5083 alloy aged for various times and temperatures, as observed by transmission electron microscopy. At a given temperature, as a function of time, the β phase initially forms as isolated particles and eventually becomes a continuous coating on the grain boundar-ies as shown in Fig. 4(a). For intermediate times, the β
phase forms a complex, partially continuous pattern. Aging temperature affects the time required to form the continuous network and the final thickness of the grain boundary phase, as shown in Fig. 4(b). The standard method of assessing the susceptibility to stress corro-sion cracking is the ASTM G67 test, which measures the mass loss of a sample following immersion in nitric acid for 24 hours. Comparing our transmission electron microscopy studies with ASTM G67 measurements, we have established that the transition from isolated β par-ticles to continuous β coverage of the grain boundaries corresponds to ASTM G67 values centered around 30 mg/cm2. For reference, ASTM G67 values of 15 mg/cm2 or less are currently considered acceptable for new ship construction, while values of 50 to 60 mg/cm2 are often found for cracked plates in service.
Corrosion-Fatigue Behavior: Figure 5 shows the fatigue crack growth rates (da/dN) as a function of stress intensity amplitude (ΔK), for an Al-Mg alloy in the as-received (unsensitized) condition, and fully sen-sitized condition (grain boundary β phase is continu-ous). The data shown are for a high load ratio,R = 0.85, which corresponds to a high average load with small cyclic amplitude superimposed. At high R, in air, sensitization has no discernible effect on the fatigue crack growth rates or thresholds. However, in salt water, sensitization has a huge effect on threshold,
FIGURE 4Evolution of sensitized microstructure in a 5083 aluminum alloy (Al-4.5% Mg). (a) For fixed temperature aging, the development with time is initially isolated β particles, followed by a tran-sition to continuous coverage of the grain boundaries by β. The intermediate condition exhibits complex morphology that may be partially continuous. (b) The time required to form the continu-ous β network increases with lower aging temperatures. The β phase is much thinner for lower aging temperatures, as well.

163chemical/biochemical research | 2012 NRL REVIEW
as indicated in Fig. 5. This finding led us to systemati-cally investigate the high R behavior in salt water as a function of degree of sensitization for various aging temperatures and times. The high load ratio corrosion-fatigue threshold values for series of specimens aged at
70, 100, and 175 °C are shown in Fig. 6(a), plotted as a function of the ASTM G67 mass loss. Two things are remarkable about these data: (1) The data for all three aging temperatures fall on the same curve, and (2) there is a transition in the behavior at a particular mass loss value of 30 mg/cm2. For degree of sensitization less than 30 mg/cm2, the corrosion-fatigue threshold is not degraded, but above 30 mg/cm2, the threshold degrades rapidly. A similar, though even more abrupt, transition behavior is seen in the stress corrosion crack-ing threshold, which is the cracking threshold for static loading (essentially R = 1), in Fig. 6(b). The transition at 30 mg/cm2 corresponds quite nicely with the transi-tion in the microstructure described in the preceding section. Thus, as long as the β phase is discontinuous, the material retains essentially its full fatigue and stress corrosion thresholds, but when the β phase becomes continuous, the material fails readily if exposed to salt water.
Significance: The commonality of the dependence of corrosion-fatigue and stress corrosion cracking thresholds upon the degree of sensitization regardless of aging temperature has several important implica-tions. It means that the structural health of the material does not depend on the details of the time-temperature aging history; it depends only upon the degree of
FIGURE 5Fatigue crack growth behavior of sensitized and unsensitized 5083 alloy in air and saltwater for load ratio R = 0.85. The thresholds are the stress intensity amplitude values where the crack growth rate approaches zero; i.e., the downward tail of the curves. While sensitization has no effect in air, there is a very large effect on threshold values and crack growth rates in saltwater. The arrow labeled “DOS” indicates the shift of the fatigue threshold with increasing degree of sensitization.
FIGURE 6Threshold behavior of sensitized 5083 alloy. (a) The corrosion-fatigue threshold vs degree of sensitization as measured by the ASTM G67 mass loss. Below a mass loss of 30 mg/cm2, the thresholds are stable, while above 30 mg/cm2, the thresholds degrade rapidly. (b) The stress corrosion cracking thresholds also exhibit a transition at around 30 mg/cm2. In (a) the black plot symbols indicate as-received condition.
sensitization at any given time. This behavior also can be the basis for accelerated sensitization rate testing for manufacture quality control because rapid aging at high temperatures produces the same effects on the material as the very long aging at low temperatures that occurs in service. The existence of a critical degree of sensitiza-tion above which degradation of the corrosion-fatigue and stress corrosion cracking thresholds occurs pro-vides a rational, quantitative basis for structural health assessment. [Sponsored by the NRL Base Program (CNR funded)]
Reference1 R.L. Holtz, P.S. Pao, R.A. Bayles, T.M. Longazel, and R. Gos-
wami, “Corrosion Fatigue of Al 5083-H131 Sensitized at 70, 100 and 175 °C and Relation to Microstructure and Degree of Sensitization,” DoD Corrosion Conference 2011, La Quinta, CA, August 2011 (available at www.corrdefense.org, accessed July 2012).

164 2012 NRL REVIEW | chemical/biochemical research
Biosensor Triage for Traumatic Brain Injury
S.H. North, C.R. Taitt, L.C. Shriver-Lake, and F.S. LiglerCenter for Bio/Molecular Science and Engineering
Traumatic Brain Injury: Traumatic brain injury (TBI) has been labeled the signature injury of the mod-ern battlefield, occurring most commonly in associa-tion with exposure to blasts from improvised explosive devices. While improvements in battlefield medical response and widespread use of body armor have decreased mortality rates in Operations Iraqi Freedom, New Dawn, and Enduring Freedom well below those of previous conflicts, an ever larger number of military per-sonnel are returning home with significant neurological damage. TBI impairs many aspects of brain function, including mood, reactions, memory, perceptions, and motor coordination. To date, researchers and clinicians rely primarily on neuroimaging and behavioral measures for limited diagnosis, prognosis, and treatment of brain injuries. TBI, and especially mild TBI, is difficult to ac-curately diagnose because symptoms are heterogeneous in both their nature and in the timing of their resolution or appearance. The semiquantitative nature of neuroim-aging techniques and the subjectivity of evidence-based tests often leave in-theater medical personnel struggling to determine whether and when warfighters are well enough to return to duty. A rapid method to quantify any compromise to brain function is, therefore, vital to
protect both the injured personnel and their brothers-in-arms. Immunoarray Technology: There is a significant drive toward identification of physiological molecules — or “biomarkers” that can be used as quantitative pre-dictors of the severity and type of TBI. However, as TBI involves many interrelated processes, many of which are shared by other neurodegenerative syndromes, it is unlikely that a single biomarker will be able to provide the sensitivity and specificity needed for the diagnosis of TBI. For this reason, we have taken the approach of assessing time-associated changes for a suite of bio-markers as a whole as an indicator of TBI. Immunoarray-based sensors offer the capability of rapid, sensitive, and simultaneous detection in a variety of different sample matrices, and are well suited to op-erational environments and point-of-care settings. We are using NRL Array Biosensor technology to develop and evaluate TBI biomarker tests for deployment to forward laboratories and aid stations. Antibodies im-mobilized on a glass slide at spatially discrete locations are used to capture the target biomarker molecules from solution (Fig. 7, top), which in turn react with a second detection antibody that is also specific for the antigen. A specially tagged tracer antibody is added, and binds to the detecting antibody to provide a fluorescent signal (Fig. 7, bottom). Carefully optimized antibody pairs guarantee specificity of the reaction and achieve detection into the picomolar range.
FIGURE 7Schematic of the capture antibody array (top) used to detect multiple TBI biomarkers in a single multiplex test (bottom). For each target, a “sandwich” immunoassay format is used (detail).

165chemical/biochemical research | 2012 NRL REVIEW
Biomarker Tests for TBI Diagnosis: Our approach has been to develop array-based tests for biomarkers involved in different physiological processes in TBI. After identifying eight promising TBI biomarkers and screening over 100 different pairs of antibodies for their sensitivity and affinity, we have downselected a core panel of three biomarkers: glial fibrillary acidic protein (GFAP), ubiquitin hydrolase L1 (UCH-L1), and S100β. Each of these biomarkers has been demonstrated to indicate a different aspect of TBI pathophysiology (Fig. 8). As an added benefit, NRL Array Biosensor tech-nology accommodates additional biomarkers as they are validated in clinical studies and the recognition reagents are developed.
Figure 9 shows a representative example of a fully multiplexed assay for our three TBI biomarkers. Using an array of “capture” antibodies specific to each target and immobilized at discrete locations, the sample is analyzed and binding of each biomarker to its appro-priate capture antibody is determined after sequential addition of detection antibodies and tagged tracer antibodies. Results clearly demonstrate detection of UCH-L1, GFAP, and S100β in the appropriate spots, with no significant signals observed in negative con-trols. We have optimized the system to minimize cross-reactivity and to improve sensitivity. By the addition of an enzymatic signal amplification step, we can obtain a 100-fold improvement in sensitivity, overcoming one of the disadvantages of many rapid tests. We are currently validating these tests in spiked serum. After integration into a commercial off-the-shelf (COTS) system, these assays will be tested with commercial sample from TBI patients. We anticipate that these multiplexed assays, once optimized in the COTS system, will be a valuable tool for clinicians and forward-deployed personnel.
FIGURE 8Each of the three candidate biomarkers detected in our tests is representative of a different aspect of TBI pathophysiology. (BBB = Blood Brain Barrier)
FIGURE 9Array-based assay for TBI biomarkers. Each biomarker binds to only its own specific “capture” antibodies; positive and nega-tive controls are shown.
These tests will provide both the critical capability to determine the severity of and formulate a prognosis for TBI, and the opportunity for early intervention and improved clinical outcome. [Sponsored by U.S. Army Defense Medical Research and Development Program]

Electr
onics
and E
lectro
magn
etics168
High-Resolution Widesweep Backscatter IonogramsG. San Antonio
170 Real-Time Electronic Attack (EA) Effectiveness Monitoring
S.L. Beun and J.J. Genova
172Diamond for Thermal Management in Power Electronics
T.J. Anderson, M.J. Tadjer, K.D. Hobart, T.I. Feygelson, J.D. Caldwell, M.A. Mastro,J.K. Hite, C.R. Eddy, Jr., F.J. Kub, and B.B. Pate
NRL employees display one of the silicon wafers they fabricated for surface-enhanced Raman scattering(SERS) sensing. Periodic arrays of gold-coated silicon nanopillars were fabricated on the wafer using electronbeam lithography and reactive ion etching. A device using SERS can detect and identify trace levels ofchemical and biological agents and explosive compounds.

168 2012 NRL REVIEW | electronics and electromagnetics
High-Resolution Widesweep Backscatter Ionograms
G. San AntonioRadar Division
Introduction: High frequency (HF) over-the-ho-rizon radar (OTHR) relies on the refraction of electro-magnetic waves by the ionosphere to detect targets at very long ranges, typically more than 500 nmi (see Fig. 1). A fundamental aspect of successful target detection is the selection of an appropriate operating frequency to ensure a large amount of backscatter energy at the de-sired surveillance range. HF OTHR operates over four octaves of frequency (5 to 30 MHz) and highly variable (spatially and temporally) ionospheric conditions. For
these reasons, all modern HF OTHR systems use sev-eral techniques for real-time monitoring of ionospheric propagation conditions. The widesweep backscatter ionogram (WSBI) is an ionospheric sounding method in which backscatter energy is mapped as a function of range, azimuth, and frequency. This sounding method has been used for over 50 years in various systems.1,2
Recently in 2011, the NRL Radar Division advanced the WSBI sounding method by producing high azimuthal resolution WSBIs using the 2.5 km receive aperture of the Navy’s AN/TPS-71 Relocatable OTHR (ROTHR) system. This represents a more than 5× increase in the azimuthal resolution over any previously produced WSBI sounding. Reference 3 provides further details concerning the history of WSBI sounding systems and the details of the current experimental configuration.
High-Resolution WSBIs: High-resolution widesweep backscatter ionograms (HRWSBIs) have not been used in any previously fielded HF OTHR because
of constraints related to radar receiver hardware. The typical HF OTHR receiver is a single-channel nar-rowband device. In fact, the HRWSBIs that NRL has demonstrated could only be produced using an experi-mental reconfiguration of the ROTHR system. Current work under way in the area of Next Generation (Next-Gen) HF OTHR proposes the use of wideband direct digital receivers that can support multiple simultaneous digital downconversion channels, thus allowing simul-taneous usage of a single receiver aperture for several purposes. The HRWSBI is just one possible function of a NextGen Common Receive Aperture architecture. The goal of the work described in this article was to investigate how the current-generation OTHR hard-ware can be used to investigate a potential NextGen capability and to understand what new information can be learned about the behavior of the ionosphere. Using a very long baseline uniform filled array to produce HRWSBIs has several advantages over lower-resolution measurements: 1. increased azimuthal resolution 2. improved leading edge detection 3. finer ray-tracing for improved geolocation accuracy 4. increased understanding of ionospheric spatial- temporal variation 5. improved target detection via improved frequency selection advice 6. enhanced detection of ionospheric tilts (could cause out-of-plane propagation).
One of the main uses for WSBI measurements is for generating a three-dimensional electron density model of the ionosphere, u(x,y,z). Once obtained, this model can be used in combination with geometric optics ray-tracing algorithms to compute coordinate registration maps linking radar space coordinates (range, azimuth) to ground coordinates (latitude, longi-tude). The process of converting the WSBI backscatter function s(r,θ,f) to u(x,y,z) is a fundamentally ill-posed problem. A large amount of regularization is required under normal circumstances using low-resolution WSBI data, slow(r,θ,f). HRWSBI data, shigh(r,θ,f), should decrease the amount of regularization required and produce estimates of the 3D electron density that are more faithful to the truth, ultimately yielding improved target geolocation. No quantitative results in this area have been produced so far; however, work is under way to incorporate HRWSBIs into current ionospheric modeling tools such as CREDO.4
Results: Several qualitative results have been derived from the experimental HRWSBI collection that was performed in 2011 using the ROTHR system. These results relate to the identification of small-scale
FIGURE 1Illustration of HF OTHR ionospheric refractive propagation behavior.

169electronics and electromagnetics | 2012 NRL REVIEW
ionospheric phenomena. Figure 2 shows a two-dimen-sional slant-range vs azimuth slice through a three-dimensional (frequency, range, azimuth) HRWSBI. This piece of data displays the backscatter propagation at 23.01 MHz. The propagation is characterized by a “skip zone” in which no energy is refracted by the
ionosphere due to the combination of a high elevation angle and high frequency. Backscatter energy begins to appear at what is called the “leading edge” around 2000 km slant range. Beyond the leading edge, there is a region of approximately 1000 km characterized by single-hop propagation followed by an extended region of double-hop propagation. The interesting feature that the HRWSBI reveals is the corrugated and highly structured behavior of the leading edge. This feature is caused by a nonsmooth underside iono-sphere, which is indicative of a traveling ionospheric disturbance (TID). This is also indicated by the leading edge behavior shown in Fig. 3. Another feature that has been identified in the HRWSBIs is shown in Fig. 4. This figure shows a slant-range vs frequency slice for a single high-resolution beam steered to boresight. In this case, the backscatter energy is due to ionospheri-cally refracted electromagnetic waves that backscatter from the surface of the ocean. One of the properties of HF ocean backscatter is that it is mainly composed of a vertical polarization component. When this property is combined with vertically polarized transmit and receive antennas and an ionosphere supporting two character-istic polarizations, the result is a range and frequency polarization “thumbprint” in a HRWSBI. This can be
seen as concentric ellipses of constant polarization in the WSBI.
Summary: This article describes recent experi-mental results obtained by the NRL Radar Division in producing high-resolution widesweep backscatter ionograms using the AN/TPS-71 ROTHR system. Several small-scale ionospheric phenomena have been identified with this sounding method. Further work in the future is planned to quantify the performance gains achievable with respect to geolocation accuracy and optimal frequency selection. This work represents an enabling technology for NextGen OTHR. [Sponsored by the NRL Base Program (CNR funded)]
FIGURE 2High-resolution backscatter ionogram measurement. This backscatter ionogram was measured with an array having a 0.25° beamwidth, which reveals fine details in the ionosphere structure.
FIGURE 4Single high-resolution azimuth beam backscatter ionogram showing propagation polarization fading phenomena only vis-ible using narrow beamwidth measurements.
FIGURE 3Backscatter ionogram illustrating propagation behavior over frequency and azimuth for an isolated range cell. Leading edge variation indicates ionosphere spatial electron density variation.

170 2012 NRL REVIEW | electronics and electromagnetics
References1 T.A. Croft, “Sky-Wave Backscatter: A Means for Observing Our
Environment at Great Distances,” Revs. Geophysics and Space Physics 10(1), 73–155 (1972).
2 G.F. Earl and B.D. Ward, “The Frequency Management System of the Jindalee Over-the-Horizon Backscatter HF Radar,” Radio Science 22(2), 275–291 (1987).
3 G. San Antonio, “High Azimuthal Resolution Widesweep Backscatter Ionogram Measurements: Initial Results,” NRL Tech Memo, 5320–003, Jan. 4, 2012.
4 S.V. Fridman, “Improved WSBI Inversion for ROTHR,” Final Technical Report, AFRL-SN-RS-TR-1998-27, Mar. 1998.
Real-Time Electronic Attack (EA) Effectiveness Monitoring
S.L. Beun and J.J. Genova (NRL retiree)Tactical Electronic Warfare Division
Introduction: Managing the threat posed by anti-ship missiles (ASMs) is a crucial element of the U.S. Navy’s operational objective to project power from both the sea and littoral areas. Rapid reaction ship defense capability against the barrage attack of modern ASMs requires the warfighter to properly allocate hard-kill and soft-kill resources. A high level of situational awareness will result in a proactive engagement that uses assets effectively and efficiently. Situational awareness of the effectiveness of soft-kill or electronic attack (EA) requires the ability to measure the internal decision states of the ASM. Under an Office of Naval Research (ONR)-funded Discovery and Invention (D&I) program, building upon results from a prior investigation funded by the NRL Electro-magnetic Warfare base research program, research was performed to design and fabricate a sensor capable of estimating the ASM’s internal decision state during its terminal phase. This sensor has undergone an in-depth performance analysis and both chamber and field test-ing to verify its capability of real-time assessment.
Background Results: Various methods of real-time EA effectiveness monitoring have been proposed over the years. For example, accurate measures of ASM loca-tion were used to estimate the ASM-to-ship miss dis-tance. However, modern ASMs typically perform fast maneuvers while approaching their targets to reduce the risk of being destroyed by hard-kill. These maneu-vers make it impossible to project the ASM’s flight path to its intended target. An alternate approach exploits the radio frequency (RF) transmissions in the ASM’s beam. It was proposed that these RF transmissions could be used to measure the ASM’s internal decision state during its terminal phase in real time by a spe-
cially designed electronic support (ES) sensor. Previous NRL-led research with the Electrosciences Laboratory at the Ohio State University confirmed these theoreti-cal results and showed that the RF observable is viable under tactical situations.
Sensor Design: The sensor was designed to measure real-time EA effectiveness during the ASM’s terminal phase for a modern low probability of in-tercept (LPI) ASM. To achieve this goal, we analyzed extensively the design performance and error budget of the sensor. The results of the analysis concluded that the design was ready to be fabricated. In addition, the sensor was designed to be a part of the electronic war-fare command and control (EWC2) suite. Therefore, the sensor is not a stand-alone system and needs to receive direction cueing and pulse descriptor words from the ES systems, as depicted in Fig. 5.
The sensor fabrication involved four components: antennas, RF processing, coherent digital processing, and real-time or post-processing analysis. Antenna alignment needed to account for antenna bias, ASM roll, monopulse noise, and ship pitch. The sensor needed the appropriate sensitivity to sense LPI signals. In order to exploit the ASM RF information, observ-able but weak signals need to be detected and properly processed. The fabrication of the sensor focused on choosing the appropriate antennas and antenna control system to fit our design analysis for demonstration testing, and creating a coherent digital processing algorithm neces-sary to observe and reliably use these weak signals. The RF processing was customized for this sensor and included a wideband low noise amplifier system, dual matched tuners, and a local oscillator distribution with isolation. A prototype was fabricated in 2011 by NRL EW Support Measures Branch personnel. Figure 6
FIGURE 5Illustration of how the prototype sensor will fit within the EW command and control suite. The sensor will receive direction cueing and pulse descriptor words (PDW) from the ES sensors.
EWC2 EA
ES
Antennas RF Processing
Digital Processing
Poin�ng & Stabiliza�on
Direc�on Cue
PDW &Pulse Cue
Real Time EA MonitoringMeasurements
EW Command and Control Suite
Prototype sensor

171electronics and electromagnetics | 2012 NRL REVIEW
FIGURE 6Stand-alone prototype sensor.
AntennasRF
Processing
Coherent Digital
Processing
Real-�meor
Post-Processing
FIGURE 7Example of anechoic chamber test results. Horizontal axis is time during an en-gagement, and the vertical axis measures parts of the RF observable. The change in the measured observable indicates that the EA technique performed at that time was successful.
0 1 2 3 4 5 6 7 8 9
x 104
-41.5
-41
-40.5
-40
-39.5
-39
-38.5Coherent Integral Xpol-Copol Ratio
Pulse Number
Volta
ge R
atio (
dB)
31152400z mar11
0 1 2 3 4 5 6 7 8 9
x 104
-150
-145
-140
-135
-130
-125
-120
-115
-110
-105Coherent Integral Xpol-Copol Phase
Pulse Number
phas
e (de
g)
31152400z mar11
Measurement indicates successful EA technique
0
0
RF o
bser
vabl
e #1
RF o
bser
vabl
e #2
00
172 2012 NRL REVIEW | electronics and electromagnetics
shows the general prototype sensor design and hard-ware.
Test Results: The prototype sensor fabricated by EW Support Measures Branch personnel has been used in both anechoic chamber testing and field testing. The anechoic chamber testing occurred in March 2011 in a chamber designed to test coordinated onboard and off-board countermeasures. The test involved the coopera-tion of the Surface EW Systems Branch’s onboard Elec-tronic Attack Test and Evaluation System (EATES) and the Offboard Countermeasures Branch’s digital radio frequency memory (DRFM) offboard systems, along with the Integrated EW Simulation Branch’s coherent radar–guided ASM simulators. Results confirmed pre-vious research and many scenarios were performed to test the ES sensor feasibility. Figure 7 shows an example of the results. Field testing was conducted at NRL’s Chesapeake Bay Detachment (CBD) facility in August 2011. Static tests were conducted with the ASM simulator on the ground, and dynamic flight tests were conducted with the ASM simulator captive-carry on a Learjet. This testing involved coordination of assets and personnel stationed at CBD, on the water in the Chesapeake Bay, across the water on Tilghman Island, and on board the aircraft. Again, tests confirmed the capability of the ES sensor to monitor EA effectiveness in the tested scenarios.
Summary: Previous theoretical research and recent testing of the fabricated ES sensor show that real-time EA effectiveness monitoring is a viable tactical resource for the Navy. The end product of this research is a sen-sor that can produce real-time measurements of the ASM’s decision state, providing a reliable element to situational awareness during an engagement. [Sponsored by ONR]
Diamond for Thermal Management in Power Electronics
T.J. Anderson,1 M.J. Tadjer,2 K.D. Hobart,1 T.I. Feygelson,3 J.D. Caldwell,1 M.A. Mastro,1 J.K. Hite,1 C.R. Eddy, Jr.,1 F.J. Kub,1 and B.B. Pate1
1 Electronics Science and Technology Division2 Universidad Politécnica de Madrid, Spain3 SAIC, Inc.
Introduction: As a wide bandgap semiconductor, gallium nitride (GaN) is attractive for next-generation power converters. The material demonstrates excep-tional chemical and thermal stability, and it is capable
of handling high voltage and high current applications. Transistors based on this material system have a wide range of immediate Naval applications, such as high-power satellite communications and radar, unmanned underwater and aerial vehicles, ship drive components, and hybrid vehicle inverters. The capabilities of GaN-based circuits are limited by the self-heating effect, which generally refers to the resistive heating that oc-curs within the device under biased conditions, and re-sults in degraded performance (such as current density and on-resistance). It is a significant problem for GaN-based electronics — the material is capable of high power density devices, thus the self-heating effect is more pronounced than in most other semiconductors. To mitigate self-heating, diamond has been proposed as a heat sink layer in the material structure, but efforts to date have resulted in poor device performance. Topside diamond approaches are known to degrade the device metallization, and efforts to grow the material struc-ture on diamond substrates have resulted in increased defectivity or severe warping, neither of which is com-patible with large-scale fabrication. The NRL Power Electronics Branch has developed the patented “gate after diamond” approach,1,2 which enables the deposi-tion of large-area diamond with minimal modifications to the process flow, and no adverse impact on device performance.
NRL’s Nanocrystalline Diamond: The NRL diamond program is world renowned. Of particular interest to this work has been the development of the nanocrystalline diamond (NCD) process, in which a substrate is seeded in a suspension of nanocrystalline diamond powder, followed by diamond film growth in a hydrogen and methane atmosphere. The resulting films have a small grain size (~100 nm) and low rough-ness (5 nm rms), are optically transparent, and have a thermal conductivity three times higher than that of Cu (12 to 14 W/m-K).3
Device Fabrication and Characterization: The high electron mobility transistor (HEMT) was used as the test vehicle for this diamond work. The devices were fabricated at NRL using standard compound semiconductor fabrication steps, with the samples be-ing split into two pieces — one to keep as a reference and one to be capped with the NCD layer. Self-heating is typically manifested as a negative slope in the satura-tion region of the VDS–IDS family of curves, shown in Fig. 8. The NCD-capped device demonstrates, in addi-tion to a reduced negative slope, a lower on-resistance and comparable threshold voltage relative to the refer-ence device.
Channel Temperature Measurement: The device operating temperature was initially characterized by

173electronics and electromagnetics | 2012 NRL REVIEW
Raman thermography.4 This measurement technique is based on the observation of a temperature-dependent shift in the characteristic Raman spectrum for GaN. The operating temperature of the transistor is calcu-lated by observing the position of the GaN peak under biased conditions and referring to an experimentally determined calibration equation. As shown in Fig. 9, a linear correlation between DC power and channel temperature was demonstrated, and the NCD-capped device demonstrated a 20% lower operating tempera-ture than that of the reference device. To validate this
measurement, IR imaging was performed on a biased device. Since GaN is transparent, one cannot directly image the active device layer without resorting to po-tentially destructive techniques such as painting the de-vice black. One can, however, observe the temperature of the contact pads and draw some conclusions since they are very close to the channel. Figure 10 shows a reference and NCD-capped HEMT. It is apparent that the pads from the NCD-capped device are slightly hot-ter than those of the reference device. This observation supports the working theory that the diamond acts as a heat sink for the channel. Therefore, under biased con-ditions, more heat is dissipated from the channel to the contact pads, so one would expect the pads to be hotter but the channel to be cooler.
Summary: Reduced performance in GaN-based HEMTs as a result of self-heating has been well docu-mented. Diamond has been proposed as an integrated heat sink layer, but the deposition conditions are harsh and sample size is limited, thus experiments have enjoyed limited success. The Electronics Science and Technology Division’s Power Electronics Branch has developed a “gate after diamond” approach using nano-crystalline diamond. Raman thermography was used to probe the channel temperature, and it was determined that NCD-capped devices had a 20% lower channel temperature at equivalent power dissipation. Electri-cal measurements indicate that NCD-capped devices have a higher current density, and lower on-resistance relative to a reference device, which leads to improved reliability and circuit efficiency. This is the world’s best diamond-capped device at the time of publication.
FIGURE 8Current–voltage characteristics for reference and NCD-capped HEMTs.
FIGURE 9Channel temperature as a function of DC power dissipation.

174 2012 NRL REVIEW | electronics and electromagnetics
FIGURE 10IR images of reference (left) and NCD-capped (right) HEMTs under bias.
Acknowledgments: The authors are sincerely grateful to the microwave HEMT device group at NRL (S. Binari et al.) for insightful discussions and equip-ment use and to the NRL Institute for Nanoscience for equipment use and support. Material was provided by Nitronex Corporation. IR images were taken at the Air Force Research Laboratory (G. Via, E. Heller). [Sponsored by the NRL Base Program (CNR funded)]
References1 F. Kub and K. Hobart, “Gate After Diamond Transistor,” U.S.
Patent 8,039,301, Oct. 18, 2011.2 M.J. Tadjer, T.J. Anderson, K.D. Hobart, T.I. Feygelson, J.D.
Caldwell, C.R. Eddy, Jr., F.J. Kub, J.E. Butler, B. Pate, and J. Meln-gailis, “Reduced Self-Heating in AlGaN/GaN HEMTs Using Nanocrystalline Diamond Heat-Spreading Films.” IEEE Electr. Dev. Lett. 33(1), 23–25 (2012).
3 J.E. Butler and A.V. Sumant, “The CVD of Nanodiamond Mate-rials,” Chem. Vapor Deposition 14(7/8), 145–160 (2008).
4 J.B. Cui, J. Ristein, and L. Ley, “The Electron Affinity of the Bare and Hydrogen Covered Single Crystal Diamond (111) Surface,” Phys. Rev. Lett. 81, 429–432 (1998).

Inform
ation
Tech
nolog
y and
Comm
unica
tions176
Estimating Population Attitudes with CogSimM. Abramson
177Maritime Threat Detection
D.W. Aha, K.M. Gupta, and B. Auslander
179NRL Flight Tests Autonomous Multi-Target, Multi-User Tracking Capability
B.J. Daniel, M. Wilson, J. Edelberg, M. Duncan, S. Frawley, C. Meadows, S. Anderson, and T. Johnson
An employee of the Space Systems Development Department points out some of the many antenna feeds used on the 18 meter antennas at NRL’s Midway Research Center. These customized feeds are quickly interchanged and are used by a variety of clients on these antennas depending on the transmit or receive test being conducted (250 MHz to 18 GHz).

176 2012 NRL REVIEW | information technology and communications
Estimating Population Attitudes with CogSim
M. AbramsonInformation Technology Division
Introduction: Estimating the nonkinetic effects of irregular warfare (IW) actions on the population, such as those described in the U.S. Army counterinsurgency manual,1 is now incorporated into the analysis of IW war games. CogSim is an agent-based population atti-tude model developed at NRL as a prototype to predict coalition formation between several groups based on social science theories, namely the personal construct theory and social learning theory. In this approach, a cognitive agent adapts its belief system, represented in a casual belief map, in response to its social environment characterized by the belief systems of other agents with whom it interacts. The claim of this model is that group mental models will emerge from individual mental models through the learning and adaptation of causal belief maps.
Causal Belief Maps: Causal belief maps are graphi-cal models of perceived cause-and-effect relationships between concepts, events, and actions expressed as directed edges between nodes (Fig. 1). They differ from other graphical representations for problem solving,
such as Bayesian belief nets and influence diagrams, mainly because feedback loops, i.e., cycles, are possible. Causal belief maps are therefore well suited to repre-sent complex models of interactions that evolve over time, such as mental models relating a set of beliefs. Positive or negative causality is specified on the edges to indicate whether an increased strength in a causal node generates an increased or decreased strength in the related node. Fuzzy causal belief maps1 further expand this representation by assigning a value to the edges in the fuzzy causal range [−1, 1] and a value to
the nodes in the fuzzy range [0, 1]. Fuzziness is a type of uncertainty associated with ambiguous rather than probabilistic events and thus can quantify linguistic expressions of beliefs. Given a causal belief map with quantified causal beliefs and randomized initial node strength values, approximated final strength values at the nodes can be inferred through dynamic program-ming as a recursive function of the sum of all values of the incoming edges multiplied by the current value of the causal nodes. Fuzzy causal belief maps have been approximated successfully as an associative neural net-work.1 The output of the inference process after several iterations indicates whether there is a convergence to a fixed set of values, to a cycle of values, or to chaos if no convergence was possible. Particle Swarm Optimization (PSO): The PSO algorithm is based on the cultural learning metaphor2 in which an agent, represented as an n-dimensional feature vector, adapts its solution in the problem space through several iterations of the algorithm from its social interactions in a population and also from past individual performance results. Cultural evolution in PSO is contrasted with genetic evolution where learning occurs only at the population level and not at the agent level. Two types of interaction are usually distinguished: (1) a top-down type of interaction based on normative and social neighborhood knowledge of “best” performance, gbest for a global neighborhood or lbest for a local neighborhood, and (2) a bottom-up type of interaction based on internal or personal cognitive knowledge of the “best,” pbest. Additionally, pbest acts as the agent’s episodic memory of past per-formances. Those cognitive and social influences are modulated by the stochastic parameters φ1 and φ2, re-spectively. The relative strength of φ1 and φ2 can reflect the degree of individualism that is specific to a culture.
CogSim Algorithm: Coalitions are formed when individual members of the population find partners with which they can cooperate.3 Through trials and errors and adaptation, agents discover which partners to cooperate with and self-organize into groups. The fitness of an interaction for an individual in the popula-tion is represented by the strength ratio of the sum of desirable outcomes over the sum of all outcomes in their causal belief map and can be thought of as “happi-ness.” This fitness will drive the interaction preference of an agent toward another agent. Those preferences are visualized by moving the agents closer or farther from each other on a two-dimensional grid in order to reconcile topological distance with ideological and cultural distance. Unlike other models of social interac-tion that assume a fixed neighborhood or a fixed social network, the agents, through this proposed algorithm,
FIGURE 1Counterinsurgency causal belief map based on interpretation of the article To Defeat the Taliban — Fight Less, Win More by N. Fick, The Washington Post, August 12, 2007, and other texts.

177 information technology and communications | 2012 NRL REVIEW
have the capability of redefining their own local neigh-borhood at each iteration. Finally, the causal belief map of the agents is updated from pbest and lbest by adjust-ing the structure of the nodes and the strength of the causal beliefs between nodes. Experiments (Figs. 2 and 3) are shown comparing simulations with and without adaptation. The degree of coalition (Fig. 4) is measured as the inverse total variance of the population in the 2D space obtained with an iterative k-means clustering procedure.
Summary: This approach has shown how to incor-porate belief changes in group formation and provides insight on the mechanism of group formation at a more fundamental level than the stated position and influence of key actors. This approach can be used to model the interactions of agents from different cultures
represented by a set of prescriptive rules (e.g., proverbs or narratives). For example, the impact of a foreign presence in a multiethnic society can be modeled, quantified, and evaluated over several time cycles based on the interaction of cognitive agents. Comparisons between initial and final causal belief map variants can provide structural content insights in addition to pre-dictive trends. This agent-based model can be coupled with a discrete-event simulator to synchronize with the timeline of IW war gaming scenarios. [Sponsored by the NRL Base Program (CNR funded)]
References1 “Counterinsurgency,” Field Manual No. 3-24, MCWP 3-33.5
(Dept. of the Army, Washington, DC), December 2006.2 B. Kosko, Neural Networks and Fuzzy Systems (Prentice Hall,
Englewood Cliffs, NJ, 1992). 3 J. Kennedy and R.C. Eberhart, Swarm Intelligence (Morgan
Kaufmann, San Francisco, CA, 2001). 4 M. Abramson, “Coalition Formation of Cognitive Agents,” in
ICCCD 2008 Proceedings of the Second International Conference on Computational Cultural Dynamics (AAAI Press, Menlo Park, CA) pp. 2–8.
Maritime Threat Detection
D.W. Aha,1 K.M. Gupta,2 and B. Auslander2
1Information Technology Division2Knexus Research Corporation
Introduction: Detecting and preventing small vessel attacks is crucial for protecting Navy personnel and assets in busy maritime locations, as exemplified by the USS Cole bombing and related incidents. While some force protection can be performed unaided, watchstanders increasingly depend on decision aids to combat surveillance data overload. Deployed systems for local maritime surveillance perform perimeter
FIGURE 2Group formation: the filled circles indicate the final state of the simulation after adaptation.
FIGURE 3Dispersion: the filled circles indicate the final state of the simu-lation without adaptation.
FIGURE 4Coalition quality comparison.
-0.1
0
0.1
0.2
0.3
0.4
0.5
0.6
0.7
0 200 400 600 800 1000
Avg
Coa
litio
n Q
ualit
y (o
ver 1
0 ru
ns)
Cycles
Coalition Quality
AdaptiveBaseline

178 2012 NRL REVIEW | information technology and communications
defense, raising alerts when a vessel penetrates an “elec-tronic fence” about a shoreline or asset. Although often effective, this approach cannot detect threats based on analysis of vessel behavior outside of this perimeter, nor reason about intent or coordinated threats. We claim that machine learning methods, and in particular probabilistic relational networks (PRNs), can acquire models of small vessel behaviors to more ac-curately predict maritime threats. PRNs compactly en-code a distribution in a multidimensional space, model variable independencies, and have well-understood mathematical foundations. While we studied methods for classifying the behavior of small maritime vessels1 and identifying anomalous tracks,2 no prior research has applied PRNs to small vessel threat assessment. Therefore, for this task we tested three types of PRNs that vary in the relations they can represent and their methods for learning and inferencing.
Algorithms: We chose hidden Markov models (HMMs), conditional random fields (CRFs), and Markov logic networks (MLNs) because they per-formed well on many tasks. HMMs are graphs whose nodes denote hidden states and whose links denote state transition probabilities. They model the joint distribution p(yt ,xt), for observation xt and state yt at time t, and assume that state transitions depend only on the preceding state and observations depend only on the current state. HMM learning and inferencing is performed using the forward-backward and the Viterbi algorithms, respectively. The basic HMM model cannot easily represent local features and spatial relations. In contrast, CRFs model local features using the condition-al distribution p(y | x) and reason with interdependent features, which exist in this task. We used a gradient descent algorithm to learn CRF parameter settings, and the Viterbi algorithm for inference. CRFs cannot model spatial relations (e.g., the distance between two vessels), whereas MLNs can, by combining first-order logic (FOL) with a probabilistic interpretation to represent states. Unlike FOL, MLNs can model domains where constraint violations have low probability but are not impossible. An MLN is a set of pairs (Fi ,wi) where Fi is a FOL formula and wi ∈ [0,1]. Together with a set of constants C it defines a Markov network ML,C contain-ing one node per grounding of each predicate in the set
of possible groundings L and one feature per grounding of each formula Fi ∈ L. This network can vary widely in shape and size depending on its constraints. We used maximum pseudo log-likelihood estimation for genera-tive training and MC-SAT for inference.
Data: Our data were provided by Spatial Integrated Systems,who conducted exercises during Trident War-rior 2010 in San Diego Harbor, in which two autono-mous unmanned sea surface vehicles (USSVs) were tasked with blocking two human-controlled boats from “attacking” a high-value unit (HVU). Data streams from USSV-mounted sensors were collected and fused to create the corpus’ tracks, which we cleaned and syn-chronized. We manually annotated each track instance as Attacking, Cruising, or Escaping, and computed four features per instance (e.g., the Prior Activity that a vessel performed in the prior time step, and In Front of HVU, which denotes whether the boat is bearing on the HVU). This produced two sets of tracks, each of 53 minutes duration, where an instance corresponds to10 seconds.
Evaluation and Results: We trained and applied the PRNs to predict, at each instance, whether a boat is attacking the HVU, and used precision, recall, the F1 measure, and run-time to assess performance. We used a twofold cross-validation protocol and included two baseline algorithms: Default predicts that every instance is an attack, while Perimeter Rule mimics the perimeter defense strategy. We optimized the window sizes used for the PRNs and the triggering distance for Perimeter Rule. Table 1 displays some of the results, which provide initial support for our claim. As ex-pected, Default had low precision. Perimeter Rule performed well for the first set but not the second set, which contains few Attacking instances. MLNs attained the highest F1 scores for both sets, which may reflect their ability to represent spatial relations and learn weight settings from few training instances. However, they were expensive to train and test, whereas the other PRNs were highly efficient.
Discussion: MLNs were accurate, but required substantial trial and error to create a good rule set. Methods for automatically learning structure, and
TABLE 1 — Comparative Results for Predicting Attack Instances
Trained on Set #1 Trained on Set #2 Algorithm Precision Recall F1 Precision Recall F1 Time
Default 0.04 1.00 0.07 0.02 1.00 0.03 Training Test Perimeter Rule 0.38 1.00 0.55 0.04 0.37 0.08 N/A 0.3
HMM 0.40 0.46 0.43 0.06 0.40 0.10 1.3 0.4 CRF 0.63 0.11 0.19 0.11 0.57 0.18 3.6 0.3 MLN 0.42 1.00 0.59 0.11 1.00 0.19 82.0 47.0

179 information technology and communications | 2012 NRL REVIEW
more efficient learning and inferencing algorithms, are warranted for applying MLNs to this task. In the future, we will address the topic of coordinated attacks, study intent and plan recognition techniques, and test our al-gorithms on board USSVs under real-time conditions.
Acknowledgments: Many thanks to Spatial Inte-grated Systems for providing the data we used in this investigation and to the Office of Naval Research (ONR 33) for sponsoring this research. [Sponsored by ONR]
References1 K.G. Gupta, D.W. Aha, and P. Moore, “Case-Based Collective
Inference for Maritime Object Classification,” in Proceedings of the Eighth International Conference on Case-Based Reasoning (Springer, Seattle, WA, 2009) pp. 443–449.
2 B. Auslander, K.M. Gupta, and D.W. Aha, “A Comparative Eval-uation of Anomaly Detection Algorithms for Maritime Video Surveillance,” in Sensors, and Command, Control, Communica-tions, and Intelligence (C3I) Technologies for Homeland Security and Homeland Defense X, ed. E.M. Carapezza, Proc. SPIE 8019 (SPIE, Bellingham, WA, 2011) 801907.
NRL Flight Tests Autonomous Multi-Target, Multi-User Tracking Capability
B.J. Daniel,1 M. Wilson,1 J. Edelberg,1 S. Frawley,2 C. Meadows,3 S. Anderson,3 T. Johnson,3 and M. Duncan1,4
1Optical Sciences Division2Smart Logic, LLC3Space Dynamics Laboratory4Office of Naval Research
Introduction: The Naval Research Laboratory has demonstrated an autonomous multisensor motion-tracking and interrogation system that reduces the workload for analysts by automatically finding mov-ing objects, then presenting high-resolution images of those objects with little to no human input. Intel-ligence, surveillance, and reconnaissance (ISR) assets in the field generate vast amounts of data that can overwhelm human operators and can severely limit an analyst’s ability to generate intelligence reports in operationally relevant time frames. This multi-user tracking capability enables the system to manage the collection of imagery without continuous monitor-ing by a ground or airborne operator, thus requiring fewer personnel and freeing up operational assets. The Office of Naval Research (ONR)-sponsored multisen-sor motion-tracking and interrogation demonstration leveraged three systems developed under prior ONR programs: N-WAPSS, a wide-area survey sensor; the
ground stations, providing sensor control and motion tracking; and EyePod, an interrogation sensor.
Wide-Area Survey Sensor: The midwave infrared (MWIR) Nighttime Wide-Area Persistent Surveillance Sensor (N-WAPSS) was developed with ONR support for the Angel Fire program and then transitioned to the Air Force Blue Devil program. N-WAPSS is a 16-mega-pixel, large-format camera that captures single frames at 4 Hz and has a step-stare capability with a 1 Hz refresh rate.1 The 16-megapixel imagery is compressed on board the sensor using an NRL-developed hardware implementation of JPEG2000 compression. The com-pressed images are sent to the Tracking Ground Station (TGS) via the high-speed Tactical Reachback Extended Communications (TREC) data link provided by the NRL Information Technology Division. See Fig. 5.
Ground Stations: The ground stations are com-posed of two computers, each with a different task: tracking and command and control. The TGS uses pre-cision geoprojection of the N-WAPSS imagery to detect and track all moving vehicle-sized objects in the field of view in real time2 (see Fig. 6). The tracks are converted to georeferenced cues and sent via a ground-based network to the Command and Control Ground Station (CCGS). The CCGS manages these cues autonomously and tasks the interrogation sensor to image all selected tracks for target classification and identification.3 The low-bandwidth CCGS commands are sent to the inter-rogation sensor via the TREC data link.
Interrogation Sensor: The georeferenced cues are sent to EyePod, a precision jitter-stabilized inter-
FIGURE 5Schematic of the sensor network. The N-WAPSS survey sensor downloads compressed images through the data link to the ground stations for tracking and command and control. The control commands are uploaded through the data link to EyePod, the interrogation sensor.

180 2012 NRL REVIEW | information technology and communications
rogation sensor. EyePod was developed under the ONR-sponsored Fusion, Exploitation, Algorithm, and Targeting High-Altitude Reconnaissance (FEATHAR) program. EyePod has both a visible/near-infrared (VNIR) and a long-wave infrared (LWIR) sensor mounted inside a 9-inch gimbal pod assembly designed for small UAV platforms.4 This demonstration used the VNIR channel to maximize spatial resolution. The capture rate of EyePod was limited by the slew rate of the mechanical gimbal, with typical values between 1 and 4 Hz.
Results: During flight tests in March 2011, the two sensors, data link, and ground stations were employed in a real-time persistent surveillance exercise. In that exercise, multiple real-time tracks generated by the wide-area persistent surveillance sensor were autono-mously cued to the high-resolution, narrow-field-of-view interrogation sensor via an airborne network. Tracks were presented to the user working at the ground station, and the user selected tracks of interest (TOIs). The geodetic coordinates of those tracks were then passed on to the interrogation sensor as they were
FIGURE 6An example intelligence report featuring (from left to right and top to bottom) the full field of view (FOV) of the survey sensor data, the output of the motion tracker, and the autonomously generated high-resolution images of two specified tracks (purple and cyan).
updated each second. The TOIs were imaged at high resolution by a narrow-field-of-view VNIR sensor and were presented to the user for classification and identi-fication. Figure 6 shows a representative data set. The motion tracker was able to maintain lock on up to 12 vehicle-sized targets from the wide-area imagery spanning a 0.25 km2 region. Since this flight test, the tracker has been upgraded to cover more than 2.25 km2 with tens of tracks at real time. Limitations in the slew rate of the interrogation sensor provided a practical limitation of around four simultaneous tracks, granting a refresh rate on each target between 0.5 and 4 Hz.
Conclusions: NRL has demonstrated a capability that will make more efficient use of current ISR assets with a smaller personnel footprint. This architecture creates military intelligence products in operationally relevant time frames to support forces in the field. This architecture also provides for collaboration between wide-area persistent surveillance assets and close-in high-resolution imagers. Future work will be done to automatically classify targets from the high-resolution

181 information technology and communications | 2012 NRL REVIEW
imagery. In addition, the motion-tracking system is be-ing upgraded to allow for stopped vehicle detection.
Acknowledgments: The authors are very grateful to Allen Freeman and Mike Rupar of the NRL Infor-mation Technology Division for the use and operation of their TREC data link, which was extremely reliable and fast. BJD acknowledges the support of the Jerome and Isabella Karle Distinguished Scholar Fellowship. A special thanks goes to Ralph York, Trijntje (Trink)Downes, Bob Leathers, Don Thornburg (Alaire), and Roger Gertz (SDL), for their flight-test support. [Sponsored by ONR]
References1 M. Kruer, J. Lee, J.G. Howard, B. Daniel, and T. Downes, “Dem-
onstration of an Ultra-Wide-Area Vis-MWIR Sensor System for Persistent Surveillance and ISR Applications,” presented at the National Military Sensing Symposium, Nellis AFB, NV, August, 2009.
2 B. Daniel, J. Edelberg, J.G. Howard, E. Allman, J. Lee, and M. Kruer, “Demonstration of a Real-Time Tracking System Applied to Ultra-Wide-Area MWIR Persistent-Surveillance Imagery,” presented at the Military Sensing Symposia (MSS), Battlefield Survivability and Discrimination, Orlando, FL, February 2011.
3 B. Daniel, M.L. Wilson, J. Edelberg, M. Jensen, T. Johnson, and S. Anderson, “Autonomous Collection of Dynamically-cued Multi-sensor Imagery,” Proc. SPIE 8020, 80200A (2011).
4 A. Bird, S.A. Anderson, D. Linne von Berg, M. Davidson, N. Holt, M. Kruer, and M.L. Wilson, “Compact Survey and Inspection Day/Night Image Sensor Suite for Small Unmanned Aircraft Systems (EyePod),” Proc. SPIE 7668, 766809 (2010).

´
Mater
ials S
cienc
e and
Tech
nolog
y184Biosensing with a Graphene-Based FET
C.R. Tamanaha, R. Stine, J.T. Robinson, M. Baraket, S.P. Mulvaney, S.G. Walton, and P.E. Sheehan
186Silicon Spintronics at 500 K
C.H. Li, O.M.J. van ‘t Erve, and B.T. Jonker
188Poro-Vascular Composites
J.P. Thomas, M.H. Merrill, K.M. Metkus, A. Piqué, and R.K. Everett
190Low-Cost Processing of Titanium and its Alloys
A.W. Fliflet, M.A. Imam, and R.K. Everett
An employee of the Space Science Division inspects a large silicon detector for gamma-ray detection. The microfabrication was performed at NRL’s Institute for Nanoscience.

184 2012 NRL REVIEW | materials science and technology
Biosensing with a Graphene-Based FET
C.R. Tamanaha,1 R. Stine,2 J.T. Robinson,3 M. Baraket,4 S.P. Mulvaney,1 S.G. Walton,5 and P.E. Sheehan1
1Chemistry Division2Nova Research, Inc. 3Electronics Science and Technology Division4National Research Council Postdoctoral Research Associate (formerly)5Plasma Physics Division
Introduction: A low-cost sensor that continu-ously and rapidly looks for a range of biomolecules is a longstanding goal for the biosensor community that remains unfulfilled. Such real-time sensors could lead to “more effective point of injury care for Sailors and Marines,” and “enhanced health and warfighter perfor-mance both afloat and ashore.”1
The arduous quest for such an “ultimate” biosen-sor, one that fully meets the Office of Naval Research (ONR) vision of enhancing warfighter health and survivability, has spanned nearly 50 years. One particu-lar application of such a sensor, medical diagnostics, utilizes biosensor technologies based on nucleic acid and immunoassays. Most of these biosensor tech-nologies currently use a label to facilitate detection. A label can be a fluorescent molecule or a magnetic bead or any component that helps signal the presence of the target biomolecule. In particular, fluorescence labels remain the predominant strategy because of their signal strength, availability of multiple emission wavelengths, and their compatibility with multiplexed, high-throughput, in situ and in vivo applications. The difficulty is that labels introduce complexity into the sensor system and, in the case of fluorescence labels, are consumed, whereby detection can only last a de-fined duration. In contrast, “label-free sensing” elimi-nates sample handling to attach the label to the target and alleviates steric hindrance, thus resulting in higher sensitivity, faster response, and ultimately lower costs. A popular approach for label-free sensing is based on the field effect transistor (FET), which consists of two terminals, the source and drain, and a gate that controls the resistance of the device (Fig. 1, top). For sensor applications, the gate terminal is replaced by a material that can sense biomolecules. Typically, it con-sists of covalently bound “probe” biomolecules that can capture the target biomolecule via biological interac-tions such as protein–ligand and DNA hybridization. We refer to these modified structures as biologically active field effect transistors, or BioFETs (Fig. 1, bot-tom). Several promising biosensing advances have used nanoscale one-dimensional materials such as carbon nanotubes as the gate.2 Recently, we demonstrated that
an ideal gate material for BioFETs is chemically modi-fied graphene (CMG).3 Because graphene is only one atom thick, the highly mobile electrons at or near its surface are extremely sensitive to local charge changes. Because most biomolecules are charged, their binding to a graphene-based gate will disrupt the flow of the electrons. Of course, this only works if the graphene is properly biofunctionalized such that protein–ligand interactions or nucleic acid hybridization can occur.
Graphene Biofunctionalization: Unfortunately, pristine graphene is inert, and chemical sites to which biomolecules can be easily covalently tethered must be carefully created. We have pursued two independent pathways: (1) the modification of reduced graphene oxide (rGO), and (2) the implantation of chemical at-tachment sites into chemical vapor deposition (CVD)-grown graphene sheets via ultra-low-temperature gas plasmas. In the first pathway, graphite powder is converted to graphene oxide (GO) using strong oxidizers and sonication to produce a material rich with epoxyl, carboxyl, and hydroxyl groups, which are ideal for biofunctionalization. Unlike graphene, however, GO is electrically insulating, and the traditional method of using hydrazine reduction to restore conductiv-ity strips the GO of these facile attachment points. Faced with the contradictory requirements to retain the oxide functional groups for biofunctionalization
FIGURE 1BioFET concept. The gate electrode of a standard FET (top) is replaced by biological components (bottom). Changes in charge distribution at the gate, due to biomolecular recognition activity, modulate current transport through the semiconductor.

185materials science and technology | 2012 NRL REVIEW
and to remove them to regain conductivity, we found a breakthrough in the form of selective reduction of the GO material.3 A placeholder molecule, the bifunctional cross-linker ethylenediamine (EDA), is reacted with GO’s epoxide groups prior to reduction. The entire film is then reduced and the bound EDA survives the aggressive reduction process to leave behind a primary amine group, an ideal attachment site for coupling to DNA or proteins. This was the critical step because it resulted in a CMG that was both highly conductive and supported covalent attachment of biomolecules. In the second pathway, graphene was produced by low-pressure (1 Torr) CVD on copper foils by the NRL Electronic Materials Branch and then transferred from the copper foil to silicon/SiO2 substrates via wet etching. The material was then treated using an am-monia (NH3)-containing plasma process developed in the NRL Plasma Physics Division.4 As in the previous pathway, the end result is incorporation of primary amines in the CVD graphene sheet that can bind to DNA and proteins. The appeal of this second pathway is straightforward: the direct and controllable addi-tion of chemical attachment points to pristine gra-phene. Such control over attachment point density has been shown to be critical in past efforts at developing biosensor chemistry. This is in sharp contrast to the first approach, which uses nonconductive GO, which, while cheaper to produce, has an abundance of defects that necessitate reduction to regain the conductivity required for biosensing.
Sensor Construction and Measurement: Gra-phene sheets are transferred over pre-patterned interdigitated gold electrodes on SiO2 substrates. The sensing areas encompassing the electrodes are defined by photolithography, and excess graphene is removed via oxygen plasma etch. The non-sensing areas of the gold electrodes are protected by a layer of either Si3N4 or Al2O3. For the rGO BioFET, single-stranded DNA probes are covalently attached via the EDA pathway de-scribed above. For the CVD-grown graphene BioFET, primary amines are introduced by exposure to a low-pressure (75 mTorr) Ar/NH3 plasma. For both types of sensors, primary amine terminated DNA is linked via glutaraldehyde to create probe spots. In each experi-ment, two BioFETs are operated simultaneously using a lock-in amplifier in a differential measurement scheme. One BioFET contains single-stranded DNA probes for a complementary single-stranded DNA target. The other BioFET acts as a reference with probes for a noncomplementary DNA target. Taking the difference of the signals from these two sensors results in specific binding signal only.
Performance: Figure 2 is a performance com-parison of the BioFET sensors constructed by the two
described methods. The sensors were exposed to 1 µM concentration of target and control DNA in a 15 mM phosphate-buffered saline solution. As can be seen, the CVD graphene functionalized with primary amines via controlled plasma exposure shows a 4 times larger signal-to-noise ratio compared to our rGO sensors. In addition, we showed the dose-dependent response on a set of rGO BioFET sensors to changes in comple-mentary DNA concentrations between 1 μM and 10 nM with a projected 2 nM detection limit (Fig. 3).3 More recently, improvements in electronic noise levels and rGO surface biofunctionalization chemistries have resulted in preliminary data indicating high pM sensitivity (unpublished data) — a result that begins to challenge traditional analytical techniques.
Summary: We have developed chemical modifi-cation procedures on graphene for the attachment of biorecognition molecules (e.g., antibodies and DNA),
FIGURE 2Response of aminated graphene DNA sensor to both target and control solutions. Target is complementary to probe; control is noncomplementary to probe. The sensing response is com-pared to that seen from a reduced graphene oxide (rGO) DNA sensor for an identical target solution. It shows an enhancement of the signal-to-noise ratio as compared to the rGO sensor.
FIGURE 3Unoptimized rGO-based dual BioFET DNA detection. Target is complementary to probe on biofunctionalized rGO; control is noncomplementary to probe. Signal is the difference between the reference BioFET and the DNA-functionalized BioFET.

186 2012 NRL REVIEW | materials science and technology
to achieve specific target binding and a signal response without the need for a label (e.g., optical or magnetic). The high electron mobility near or at the surface of graphene-based BioFETs gives these devices their high sensitivity. We have shown that modifying the graphene surfaces to accept biologically sensitive material with native charges that disrupt the flow of the FET’s elec-trons is a winning strategy that has enormous potential for satisfying many of the criteria for an ideal biosen-sor: rapid, sensitive, label-free detection in an inex-pensive, compact, low-power, electronically integrated module. The low inherent cost of these systems makes them especially appealing. Both CVD graphene and rGO are inexpensive to produce and can be transferred to low-cost flexible substrates such as plastics. Current efforts aim to produce such devices and to minimize steps requiring a clean room by using, for instance, ink jet printing to deposit electrodes and isolation layers.
Acknowledgments: We would like to acknowledge ONR, the NRL Institute for Nanoscience, and the De-fense Threat Reduction Agency (DTRA) Joint Science and Technology Office for Chemical and Biological Defense (JST-CBD) for funding. [Sponsored by ONR and DTRA JST-CBD] References1 Naval S&T Strategic Plan, Office of Naval Research, Arlington,
VA, Sept. 2011.2 X. Dong, C.M. Lau, A. Lohani, S.G. Mhaisalkar, J. Kasim, Z.
Shen, X. Ho, J.A. Rogers, and L.-J. Li, “Electrical Detection of Femtomolar DNA via Gold-Nanoparticle Enhancement in Carbon-Nanotube-Network Field-Effect Transistors,” Adv. Mater. 20, 2389–2393 (2008).
3 R. Stine, J.T. Robinson, P.E. Sheehan, and C.R. Tamanaha, “Real-time DNA Detection Using Reduced Graphene Oxide Field Effect Transistors,” Adv. Mater. 22, 5397–5300 (2010).
4 S.G. Walton, E.H. Lock, M. Baraket, D.R. Boris, R.F. Fernsler, S.H. North, C.R. Taitt, J.T. Robinson, F.K. Perkins, and P.E. Sheehan,“Plasma Processing of Ion Energy-sensitive Materials,” 2010 NRL Review (Naval Research Laboratory, Washington, DC, 2011) pp. 187–189.
Silicon Spintronics at 500 K
C.H. Li, O.M.J. van ‘t Erve, and B.T. JonkerMaterials Science and Technology Division
Silicon Spintronics: The control of spin-polarized carrier populations and currents offers a new paradigm for information processing in semiconductors. The International Technology Roadmap for Semiconductors1 has identified the electron’s spin as a new state variable, a “spintronic” approach, to be explored beyond Moore’s Law. Silicon (Si) is an ideal host for such a spin-based technology, because its low atomic mass and crystal
inversion symmetry result in very small spin orbit interactions and long spin lifetimes.
Challenge: Although the steady reduction in device feature size predicted by Moore’s Law has been remarkably successful, critical device dimensions now approach atomic length scales, so that further size scal-ing becomes untenable. Researchers have been forced to look beyond the simple reduction of size to develop future generations of electronic devices. Utilization of the electron’s spin angular momentum as an alternate state variable provides additional functionality and performance for future electronic devices envisioned beyond the current roadmap. Electrical generation, manipulation, and detection of significant spin polar-ization in silicon at temperatures that meet commercial and military requirements are essential to validate spin as an alternative to charge for a device technology beyond Moore’s Law.
Spin Accumulation in Si to 500 K: To make a semiconductor spintronic device, one needs contacts that can both generate a current of spin-polarized elec-trons (spin injector), and detect the spin polarization of the electrons (spin detector) in the semiconductor.2 A material with a spin-polarized density of states such as a ferromagnetic (FM) metal is often used. A thin layer (~2 nm) of silicon dioxide (SiO2), a key element of the vast Si electronics industry because it is easy to form and produces an electrically stable self-interface with the low interface state density necessary for device operation, is placed between the ferromagnetic contact and Si to serve as a tunnel barrier. This facilitates spin injection by controlling the series resistance, and pre-vents intermixing between the ferromagnet and Si. We probe the spin environment directly under the ferromagnet/SiO2 contact using the three-terminal geometry shown in Fig. 4. In this geometry, a spin-polarized current is injected from contact 2 to 1, and a voltage is measured across contacts 2 and 3. Electri-cal spin injection produces spin accumulation in the transport channel under magnetic contact 2 and a cor-responding output voltage. When a magnetic field BZ is applied, the injected spins precess and dephase, and the spin accumulation decreases to zero. This Hanle effect is conclusive evidence of spin accumulation, and allows a direct measure of the spin lifetime and, subsequently, spin diffusion length, critical parameters for device operation. As shown in Fig. 5, we clearly observe Hanle precession of the electron spin accumulation in the Si channel under the contact over a wide range of tem-peratures up to 500 K.
Spin Lifetimes and Diffusion Lengths: The line-shape of the three-terminal Hanle data can be fit to ob-
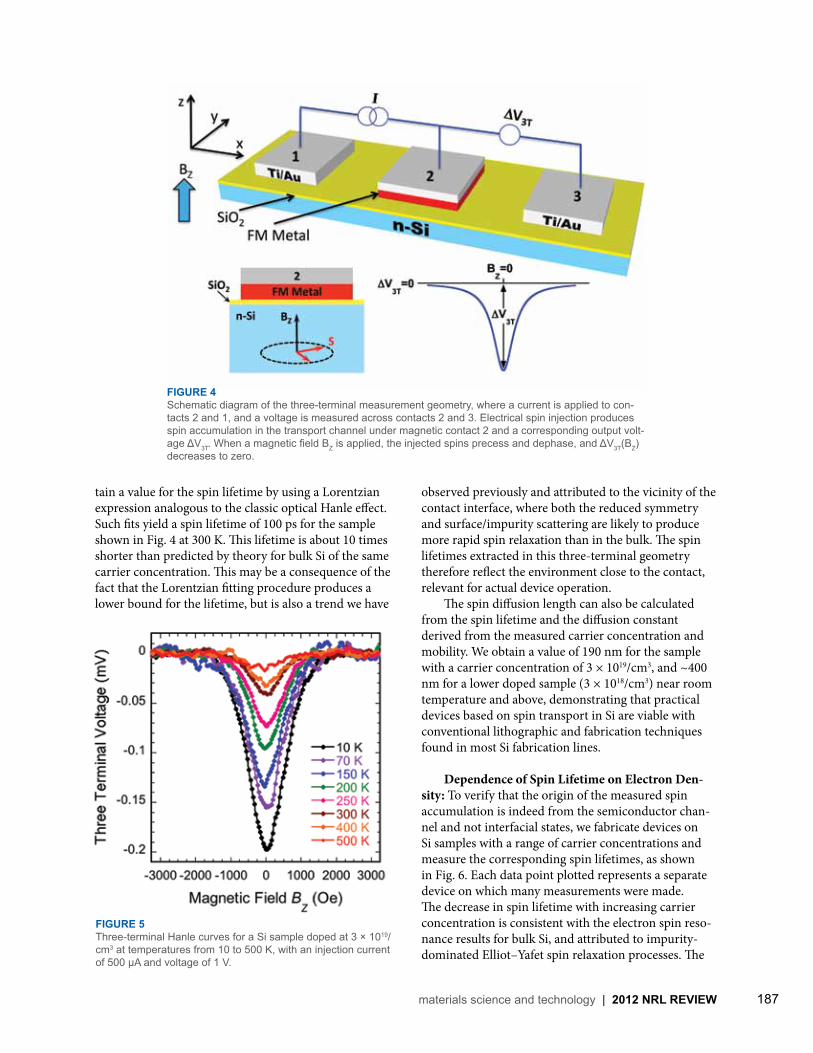
187materials science and technology | 2012 NRL REVIEW
tain a value for the spin lifetime by using a Lorentzian expression analogous to the classic optical Hanle effect. Such fits yield a spin lifetime of 100 ps for the sample shown in Fig. 4 at 300 K. This lifetime is about 10 times shorter than predicted by theory for bulk Si of the same carrier concentration. This may be a consequence of the fact that the Lorentzian fitting procedure produces a lower bound for the lifetime, but is also a trend we have
observed previously and attributed to the vicinity of the contact interface, where both the reduced symmetry and surface/impurity scattering are likely to produce more rapid spin relaxation than in the bulk. The spin lifetimes extracted in this three-terminal geometry therefore reflect the environment close to the contact, relevant for actual device operation. The spin diffusion length can also be calculated from the spin lifetime and the diffusion constant derived from the measured carrier concentration and mobility. We obtain a value of 190 nm for the sample with a carrier concentration of 3 × 10¹⁹/cm3, and ~400 nm for a lower doped sample (3 × 10¹⁸/cm3) near room temperature and above, demonstrating that practical devices based on spin transport in Si are viable with conventional lithographic and fabrication techniques found in most Si fabrication lines.
Dependence of Spin Lifetime on Electron Den-sity: To verify that the origin of the measured spin accumulation is indeed from the semiconductor chan-nel and not interfacial states, we fabricate devices on Si samples with a range of carrier concentrations and measure the corresponding spin lifetimes, as shown in Fig. 6. Each data point plotted represents a separate device on which many measurements were made. The decrease in spin lifetime with increasing carrier concentration is consistent with the electron spin reso-nance results for bulk Si, and attributed to impurity-dominated Elliot–Yafet spin relaxation processes. The
FIGURE 4Schematic diagram of the three-terminal measurement geometry, where a current is applied to con-tacts 2 and 1, and a voltage is measured across contacts 2 and 3. Electrical spin injection produces spin accumulation in the transport channel under magnetic contact 2 and a corresponding output volt-age ΔV3T. When a magnetic field BZ is applied, the injected spins precess and dephase, and ΔV3T(BZ) decreases to zero.
FIGURE 5Three-terminal Hanle curves for a Si sample doped at 3 × 10¹⁹/cm3 at temperatures from 10 to 500 K, with an injection current of 500 μA and voltage of 1 V.

188 2012 NRL REVIEW | materials science and technology
fact that the spin lifetime exhibits a clear dependence on the Si carrier density provides clear evidence that the spin accumulation/precession indeed occurs in the Si channel rather than in localized interface states, a key issue for spin transport in semiconductors. This break-through overcomes a major obstacle in achieving spin manipulation at temperatures well above the require-ments of commercial (85 °C), industrial (100 °C), and military (125 °C) applications in the most widely used semiconductor, and is a major enabling step toward the realization of Si-based spintronic devices.3
[Sponsored by ONR and the NRL Base Program (CNR funded)]
References1 International Technology Roadmap for Semiconductors, www.
itrs.net (2009).2 O.M.J. van ‘t Erve, A.T. Hanbicki, M. Holub, C.H. Li, C. Awo-
Affouda, P.E. Thompson, and B.T. Jonker, “Electrical Injection and Detection of Spin-Polarized Carriers in Silicon in a Lateral Transport Geometry,” Appl. Phys. Lett. 91, 212109 (2007).
3 C.H. Li, O.M.J. van ‘t Erve, and B.T. Jonker, “Electrical Injection and Detection of Spin Accumulation in Silicon to 500 K with Magnetic Metal/Silicon Dioxide Contacts,” Nature Communications 2, 245 (2011).
Poro-Vascular Composites
J.P. Thomas,1 M.H. Merrill,1 K.M. Metkus,2 A. Piqué,1 and R.K. Everett1
1 Materials Science and Technology Division2 NOVA Research, Inc.
Introduction: We are developing a new class of multifunctional composites with controllable surface morphology. These are two-phase (solid-fluid), thin, flexible, skinlike laminates with surface “pore” arrays that are connected to an internal vascular network. They have both structural (skin) and surface (morphol-ogy control) functionality and are called poro-vascular (PV) composites. The solid phase of the PV composite is a laser mi-cromachined polyimide layer. It incorporates an ionic liquid (IL) phase whose height and meniscus shape within the pores can be controlled to vary the meso-scale surface morphology from dimples to domes (see Fig. 7). ILs are neutral mixtures of charged (+ and –) molecular species with low enough vapor pressure to be considered nonevaporating. Fluid height and meniscus shape control are achieved through volumetric pump-ing within the vascular network and electrical polariza-tion for contact angle control on the pore and exterior surfaces via electrowetting-on-dielectric (EWOD).1
Our research has focused on understanding how the IL composition and electrode configuration (layer compositions and thicknesses) influence contact angle control via EWOD; prototype development for wind-tunnel testing (to determine range of drag control); and computational modeling of the effects of surface mor-phology (pore diameter, spacing, and arrangements) on skin-friction drag and on the transition from laminar to turbulent boundary layer flow.
Application: Aerodynamic drag is comprised of skin-friction and form (or pressure) components. Drag forces can lead to a significant waste of energy in mobility applications. For a vehicle to maintain a steady-state velocity in an air environment, the vehicle’s propulsion system must supply power equal to the drag force times the vehicle velocity. Technologies that can reduce and control drag offer opportunities for improv-ing vehicle energy efficiencies and performance. PV composites with reconfigurable surface morphology will allow for new modes of air-vehicle maneuver con-
FIGURE 6Spin lifetime as a function of the Si electron density at 10 K. The symbols distinguish the ferromagnetic metal used: solid symbols correspond to devices with Ni0.8Fe0.2 contacts, while open symbols correspond to Co0.9Fe0.1 contacts.
FIGURE 7Schematic of PV composite surface morphologies for active control of aerodynamic (skin-friction) drag and laminar-to-turbulent transition.
V0
Airflow
ConvectedHeat
Drag Force
Flat Dimpled Domedionicliquid
<1 mm
V = 0V = maxV < max

189materials science and technology | 2012 NRL REVIEW
trol via changes in skin-friction drag and for control of the laminar-to-turbulent transition point on airfoils to achieve reduction in form drag that will increase flight efficiency.2
Fabrication and EWOD Experiments: PV com-posite test samples and prototypes are being fabricated using pulsed UV laser micromachining to create arbi-trary shaped pores, various pore arrays, and different sized (width and depth) vascular trenches or channels in a variety of polyimide and polyetherimide materials (Fig. 8). The laser spot-size can be controlled to achieve machined features as small as 10 μm.
EWOD control of IL contact angle within the pores and on the surface of the PV composite is achieved by applying a thin metal coating or using an intrinsi-cally conductive polyimide pore layer as an electrode. The conductive electrode is electrically insulated by a vapor-deposited Parylene polymer dielectric coating on which a thin layer of Teflon AF is applied to create an intrinsically “nonwetting” (hydrophobic) surface. Small amounts of liquid on the hydrophobic surface collect as spherical drops (lotus-leaf effect) with contact angles greater than 90°. The application of an electric poten-tial between an electrode in the IL and the insulated electrode on the PV composite surface/pores reduces the IL contact angle to less than 90°. This corresponds to a “wetting” state with liquid drops tending to spread out over the surface. Flat test samples have been used for characterizing IL and electrode effects on EWOD. For example, con-tact angle vs applied potential has been measured for a 1-ethyl-3-methylimidazolium methyl sulfate IL from 0 to ±200 V in 10 V steps on Kapton HN films coated with 150 nm of gold, 5 μm Parylene-HT, and 40 or 185 nm of Teflon AF 1600. Figure 9 shows how the contact angle changes with applied potential in comparison with the theoretically predicted (Lippmann–Young) curve. At zero applied voltage, the contact angle is 98° ± 6°. The positive and negative applied voltage behav-iors are roughly similar, with a 20° to 24° decrease in contact angle; hysteresis between the initial and final
FIGURE 9EWOD results for a 1-ethyl-3-methylimidazolium methyl sulfate IL. All points are averages of mul-tiple measurements. The theoretically predicted (Lippmann–Young) curve is shown for comparison. Insets show the IL drop and contact angle at –200, 0, and 200 V.
FIGURE 8Early PV composite prototype (75 × 50 mm) used for fluidic con-trol testing. This prototype uses an external displacement pump for fluid height control.

190 2012 NRL REVIEW | materials science and technology
contact angles is less than 9°. Repeating the same experiments with an aqueous (ideal) solution of 0.1 M NaCl results in an initial contact angle of 118° ± 5° and a total change of nearly 40°. Our findings agree with other researchers who have also reported less efficient EWOD control with ILs.3 The observed difference is hypothesized to be due to interactions between the electrode surface morphology and chemistry and the IL. Ongoing studies using films with different elec-trodes and Parylene types (roughness) but identical surface chemistry (Teflon AF 1600) are exploring this important phenomenology as well as seeking electrode configurations that achieve maximal changes in contact angle vs applied potential. Future plans include fabricating fully functional prototypes for wind-tunnel testing of skin-friction and form drag control after the EWOD experiments above identify one or more optimal electroding configura-tions. [Sponsored by the NRL Base Program (CNR funded)]
References1 F. Mugele and J.-C. Baret, “Electrowetting: from Basics to
Applications,” J. Phys. Condens. Matter 17, R705–R774 (2005).2 J.P. Thomas, M.H. Merrill, K.M. Metkus, A. Piqué, and R.K.
Everett, “Multifunctional Composites with Applications to Energy Performance and Efficiency,” paper AF1438, ICCM18: The 18th International Conference on Composite Materials, Jeju, Korea, August 2011.
3 M. Paneru, C. Priest, R. Sedev, and J. Ralston, “Static and Dynamic Electrowetting of an Ionic Liquid in a Solid/Liquid/Liquid System,” J. Am. Chem. Soc. 132, 8301–8308 (2010).
Low-Cost Processing of Titanium and its Alloys
A.W. Fliflet,1 M.A. Imam,2 and R.K. Everett2
1 Plasma Physics Division2 Materials Science and Technology Division
Microwave Sintering of Metal Powders: Titanium (Ti) has many attractive attributes for Naval applica-tions, including high specific strength, no magnetic signature, and excellent corrosion resistance. However, its use has been limited by high processing costs. In the past few years, the availability of titanium powders, produced by a number of novel processes, has resulted in broad interest in using these lower cost materials for military, industrial, and aerospace applications. Powder metallurgy is an effective, cost-reducing way to produce high-quality, near-net-shape products by sintering at a fraction of the cost of melting and casting. Tradition-ally, sintering is performed in a conventional vacuum furnace and overall processing times can be many hours to days.
The Naval Research Laboratory has been inves-tigating the use of microwave and millimeter-wave systems in material processing for more than a decade.1 Typically, microwave processing improves energy ef-ficiency by direct heating of the work piece via in-depth energy deposition. The in-depth heating permits very rapid processing (cycle times of less than 10 minutes), which is intended to preserve a very fine grain struc-ture in the final product. The fine grain size obtained can lead to excellent mechanical properties and to the possibility of superplastic forming of such materials to net shape components. Generally, the direct heating of metals by microwaves is not effective, due to the high conductivity of the metal surface. This is not the case with powder metal compacts that are not fully dense. These should be more properly treated as artificial dielectrics — a composite of the metal powder and gas/vacuum. Using microwaves to sinter powder compacts offers reduced energy consumption and low “buy to use” ratio, and opens a new domain for making unique alloys that cannot be made by conventional processes.
FIGURE 10(a) Schematic and (b) photograph of the NRL 6 kW, 2.45 GHz microwave system for titanium sintering experiments.
(a)
(b)

191materials science and technology | 2012 NRL REVIEW
Sintering Experiments: Sintering of titanium metal/alloy powder compacts has been carried out in our microwave materials processing system shown in Fig. 10. Microwaves are generated in a 6 kW, 2.45 GHz magnetron (Cober Electronics S6F Microwave Genera-tor) and transported to the heating chamber via S-band waveguide. An impedance-matching three-stub tuner is used to optimize microwave transmission into the chamber. Typically, the coupling impedance drops dur-ing processing as the compact becomes more lossy at higher temperatures and the tuner must be constantly adjusted to minimize the reflected power. A liquid-nitrogen sorption pump, backed up by a mechanical vacuum pump, is connected to the chamber during the sintering process to minimize the risk of oxygen contamination. Compacts of Ti powders were made by compress-ing commercially pure (CP) titanium and titanium alloy, Ti-6Al-4V, powders in a uniaxial or cold isostatic press (CIP). The CIP is of particular interest as it can achieve the highest pressures (up to 100 ksi) and is also capable of forming compacts with complex shapes. Scanning electron micrographs of typical select pow-
FIGURE 11Scanning electron micrographs of powders of (a) commer-cially pure (CP) titanium and (b) titanium alloy, Ti-6Al-4V.
(a)
(b)
ders are shown in Fig. 11. The compacts were heated to peak temperatures of 900 to 1300 °C for hold times of 10 to 60 min. The only limiting factor for increasing the power was the formation of plasma in the chamber, which is generally unfavorable to work piece heat-ing; however, plasma was no longer a problem after the sample had reached a temperature of ~600 °C. Above this temperature, the microwave coupling to the titanium compact is quite efficient and the microwave fields drop below the breakdown value. The surface temperature of the compact was measured with a two-color optical pyrometer. Figure 12(b) shows a powder compact of CP Ti cold isostatically pressed into the approximate shape of a small in-line valve body (Fig. 12(a) shows the original brass valve) and subsequently sintered at 1200 °C with a ramp rate of about 30 °C/min and a hold time of 30 min (Fig. 12(c)). To improve microwave heating efficiency during initial heating, lossy “susceptor” material consisting of a silicon carbide plate and zirconia fiberboard was added to the insulat-ing casket; this technique is called hybrid heating. This
FIGURE 12Photographs with 1-inch marker showing (a) original brass valve, (b) cold isostatically pressed Ti powder compact replicating the brass valve, and (c) sintered compact.
(a)
(b)
(c)

192 2012 NRL REVIEW | materials science and technology
system provided better heating at subsintering tem-peratures and could be used repeatedly. It was found that the compacts could be sintered to near theoretical density (TD) at temperatures rang-ing from 900 to 1300 °C. The alloy Ti-6Al-4V powders achieved 99% TD and the CP Ti powders achieved 98.5% TD. The results indicate that varying the hold time from 10 min to 60 min did not have a significant effect on the final density of the titanium, allowing for fast heating cycles. Experiments have shown that the powder type and the initial compaction pressure also affect the final density. Compaction pressure can be adjusted to achieve the desired final sintered density.
Summary: It is evident that microwave sintering is a potentially low-cost, energy-efficient process for processing powder metallic materials to near-net-shape parts. We believe the economics of microwave pro-cessing will be superior to any conventional process.2 Research will continue to focus on controlling the final density, microstructure, and other properties of the sintered product. [Sponsored by the NRL Base Program (CNR funded)]
References1 D. Lewis III, M.A. Imam, A.W. Fliflet, R.W. Bruce, L.K.
Kurihara, A.K. Kinkead, M. Lombardi, and S.H. Gold, “Recent Advances in Microwave and Millimeter-Wave Processing of Materials,” Materials Science Forum vols. 539–543, pp. 3249–3254 (2007), doi:10.4028/www.scientific.net/MSF.539–543.3249.
2 R.W. Bruce, A.W. Fliflet, H.E. Huey, C. Stephenson, and M.A. Imam, “Microwave Sintering and Melting of Titanium Powder for Low-Cost Processing,” Key Engineering Materials vol. 436, pp. 131–140 (2010), doi:10.4028/www.scientific.net/KEM.436.131.

Nano
scien
ce Te
chno
logy194
Trace Vapor Detection with Vertical Silicon Nanowire ArraysC.R. Field, H.J. In, S.L. Rose-Pehrsson, and P.E. Pehrsson
195Ultrafast Optical Control of Entangled Spins
S.G. Carter, D. Kim, A. Greilich, A.S. Bracker, and D.G. Gammon
197Enhanced Multiple Exciton Generation in Semiconductor Nanorods
P.D. Cunningham, J.E. Boercker, M.P. Lumb, J.G. Tischler, J.S. Melinger, E.E. Foos, and A.R. Smith
199Engineering Graphene Mechanics
M.K. Zalalutdinov, J.T. Robinson, C.E. Junkermeier, J.C. Culbertson, T.L. Reinecke, R. Stine, P.E. Sheehan, B.H. Houston, and E.S. Snow
An employee of the Electronics Science and Technology Division prepares to transfer a sample in a molecular beam epitaxy system for the growth of compound semiconductors.

194 2012 NRL REVIEW | nanoscience technology
Trace Vapor Detection with Vertical Silicon Nanowire Arrays
C.R. Field,1 H.J. In,2 S.L. Rose-Pehrsson,1 and P.E. Pehrsson1
1Chemistry Division2National Research Council Postdoctoral Research Associate
Introduction: Semiconducting nanowires and nanotubes have great potential as chemical and biologi-cal ChemFET-type sensors in a variety of military, industrial, and commercial applications. For example, the proliferation of improvised explosive devices (IEDs) and recent terrorist attempts demonstrate the need for portable and sensitive sensors for detecting explosives vapors and toxic industrial chemicals (TICs). The most common ChemFET configurations use electrical conductivity measurements across single nanowires or a network of nanowires placed randomly on a surface. Nanowire-based ChemFETs are extremely sensitive to vapors because of their large surface-to-volume ratios; however, they have underperformed as portable, field-deployable sensors. The lower than anticipated performance is due to a combination of factors includ-ing variable or uncontrolled doping and dimensions, substrate effects such as adsorption/desorption and trapping on the supporting substrate surface, variable surface structure, occlusion of the analyte by the elec-trodes, 1/f noise from a reduced number of charge car-riers in single nanowire configurations, and shot noise from wire-to-wire junctions in networks of overlapping nanowires.
The SiN-VAPOR Sensor: A superior sensor ap-proach uses an array of aligned, vertical nanowires etched from a single silicon wafer. To that end, we developed the Silicon Nanowires in a Vertical Array with a Porous Electrode (SiN-VAPOR) sensor archi-
tecture. Figure 1 shows a conceptual drawing of the architecture and a scanning electron micrograph of the nanowires and porous electrode. The SiN-VAPOR sen-sor is fabricated using a combination of an inexpensive, easy, and massively parallel wet chemical process called metal-assisted chemical etching (MACE) and a two-stage nanosphere lithography method.1,2 Huge numbers of uniform, vertical silicon nanowires are thereby easily etched out of bulk silicon wafers. Silicon is desirable because it is compatible with the MACE process and conventional fab-line processing. Additionally, sili-con offers a wide range of available surface coating and modification chemistries for conferring selective reactivity. Large arrays of vertical nanowires etched from a single wafer eliminate or mitigate many of the problems associated with single nanowires or random networks by reducing substrate effects and creating a huge sensing surface area while retaining the sensitivity to adsorption observed in single nanowire configura-tions. The doping is known and well controlled, all of the wires are similar in diameter and aspect ratio, there are many more charge carriers than in a single wire, and there are no noisy wire-to-wire junctions. The sec-ond nanosphere lithographic step is used to fabricate a porous top electrode in registry with the massive nano-wire array without complex and tedious alignment, thus permitting rapid and uniform analyte access to all of the wires while simultaneously maintaining electrical contact with every wire in the array.3
Results: The devices are packaged in a standard commercial format and tested in a custom chamber developed to evaluate prototype sensor performance under a variety of environmental conditions. The sen-sors respond to standard chemicals and trace explosive vapors quickly and with extreme sensitivity and low noise. Figure 2 shows the response to ammonia and ni-trogen dioxide, analytes critical to the characterization of vapor sensor prototyping, over the parts-per-billion
FIGURE 1(Left) A conceptual drawing of silicon nanowires in a vertical array with a porous top electrode. (Right) A scanning electron microscopy image of the porous top electrode in alignment with the metal-assist-ed chemical etched silicon nanowire array. The underlying silicon nanowires can be seen through the holes.

195nanoscience technology | 2012 NRL REVIEW
concentration range using the sample chamber and a vapor generation and delivery system. A gas chro-matograph–mass spectrometer (GC-MS) was modi-fied to simultaneously monitor analyte concentration during sensor evaluation. Figure 3 shows the response of the SiN-VAPOR sensor to dinitrotoluene (DNT), a degradation product of TNT and a useful analyte for landmine detection, in humidified air compared to the online GC-MS instrumentation in real time. The SiN-VAPOR sensor responds similarly to the current com-mercially available instrumentation for explosive vapor detection, but in a cellphone-sized form factor versus a device the size of a typical microwave oven.
Summary: The SiN-VAPOR architecture solves multiple problems that have limited the potential of nanowire-based sensing, thus it has created a new class
of extremely capable and flexible sensors with a small footprint, low power requirement, and extremely high performance. This capability has widespread potential for both military and civilian applications, including biochemical/biomedical applications and sensing of chemical and biological agents, explosives (such as those found in IEDs), and toxic industrial chemicals. Its modular configuration is inherently suitable for cus-tomizable plug-and-play electronic platforms. Possible platforms include UAVs and other remotely operated platforms with small power and size footprints. [Sponsored by the Defense Threat Reduction Agency]
References1 H.J. In, C.R. Field, and P.E. Pehrsson,“Periodically Porous Top
Electrodes on Vertical Nanowire Arrays for Highly Sensitive Gas Detection,” Nanotechnology 22, 355501–355507 (2011); doi:10.1088/0957-4484/22/35/355501.
2 C.R. Field, H.J. In, N.J. Begue, and P.E. Pehrsson,“Vapor Detection Performance of Vertically Aligned, Ordered Arrays of Silicon Nanowires with a Porous Electrode,” Analytical Chemistry 83, 4724–4728 (2011); doi:10.1021/ac20079d.
3 H.J. In, C.R. Field, and P.E. Pehrsson, “Method for Forming Periodically Perforated Contact Electrode on Top of a Vertical Nanowire Array Using Close-Packed Nanospheres,” Provisional Patent, Navy Case #100845, U.S. Patent application 13/293,323, filed Aug. 15, 2011.
Ultrafast Optical Control of Entangled Spins
S.G. Carter,1 D. Kim,2 A. Greilich,3 A.S. Bracker,1 and D.G. Gammon1
1Electronics Science and Technology Division2University of Michigan, Ann Arbor3University of Maryland, College Park
Introduction: Quantum entanglement is an essen-tial resource for many applications in quantum infor-mation technology, including quantum computing and quantum communication. These applications promise significant advances in areas of importance to the Navy, such as secure communication and code-breaking. Ac-cording to quantum mechanics, a quantum bit (qubit) can be in a superposition of two states |0〉 and |1〉, and two qubits (labeled A and B) can be in a superposi-tion of four states |0〉A|0〉B, |0〉A|1〉B, |1〉A|0〉B, and |1〉A|1〉B. Special superpositions of two qubit states such as |0〉A|1〉B + |1〉A|0〉B are entangled states, in which the cor-relation between qubits is beyond what is possible clas-sically. The correlation gives rise to potential applica-tions in quantum communication, in which security is guaranteed by quantum mechanics. The parallel nature of quantum superpositions in entangled states allows for the massively parallel processing of quantum infor-
FIGURE 2Response to ammonia and nitrogen dioxide in humidified air at various concentrations in the parts-per-billion (ppb)concen-tration range. The sensor was exposed to 2 min of clean air followed by 2 min of analyte with a 10 min recovery of clean air. The ammonia response is designated as an increase in resis-tance and the nitrogen dioxide exposure results in a decrease in resistance.
FIGURE 3The response to 40 ppb of dinitrotoluene for the SiN-VAPOR sensor (black) and a modified GC-MS for online vapor detection (red) in humidified air (~40% relative humidity).
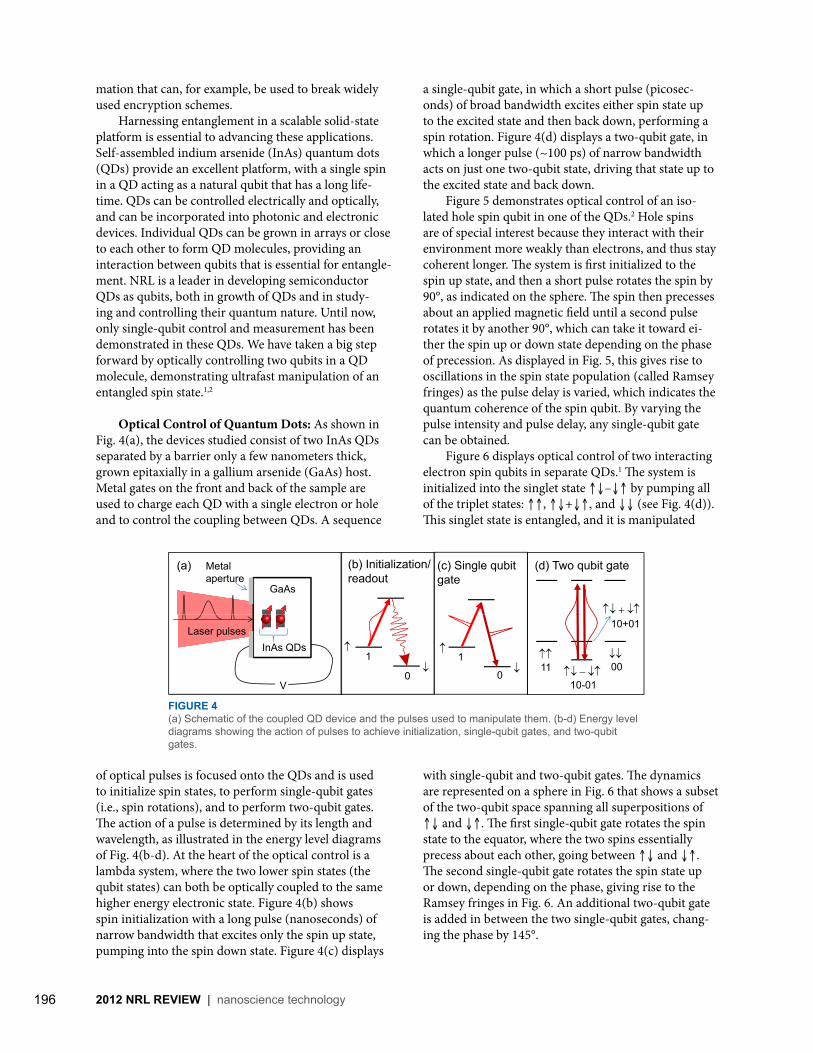
196 2012 NRL REVIEW | nanoscience technology
mation that can, for example, be used to break widely used encryption schemes. Harnessing entanglement in a scalable solid-state platform is essential to advancing these applications. Self-assembled indium arsenide (InAs) quantum dots (QDs) provide an excellent platform, with a single spin in a QD acting as a natural qubit that has a long life-time. QDs can be controlled electrically and optically, and can be incorporated into photonic and electronic devices. Individual QDs can be grown in arrays or close to each other to form QD molecules, providing an interaction between qubits that is essential for entangle-ment. NRL is a leader in developing semiconductor QDs as qubits, both in growth of QDs and in study-ing and controlling their quantum nature. Until now, only single-qubit control and measurement has been demonstrated in these QDs. We have taken a big step forward by optically controlling two qubits in a QD molecule, demonstrating ultrafast manipulation of an entangled spin state.1,2
Optical Control of Quantum Dots: As shown in Fig. 4(a), the devices studied consist of two InAs QDs separated by a barrier only a few nanometers thick, grown epitaxially in a gallium arsenide (GaAs) host. Metal gates on the front and back of the sample are used to charge each QD with a single electron or hole and to control the coupling between QDs. A sequence
of optical pulses is focused onto the QDs and is used to initialize spin states, to perform single-qubit gates (i.e., spin rotations), and to perform two-qubit gates. The action of a pulse is determined by its length and wavelength, as illustrated in the energy level diagrams of Fig. 4(b-d). At the heart of the optical control is a lambda system, where the two lower spin states (the qubit states) can both be optically coupled to the same higher energy electronic state. Figure 4(b) shows spin initialization with a long pulse (nanoseconds) of narrow bandwidth that excites only the spin up state, pumping into the spin down state. Figure 4(c) displays
a single-qubit gate, in which a short pulse (picosec-onds) of broad bandwidth excites either spin state up to the excited state and then back down, performing a spin rotation. Figure 4(d) displays a two-qubit gate, in which a longer pulse (~100 ps) of narrow bandwidth acts on just one two-qubit state, driving that state up to the excited state and back down. Figure 5 demonstrates optical control of an iso-lated hole spin qubit in one of the QDs.2 Hole spins are of special interest because they interact with their environment more weakly than electrons, and thus stay coherent longer. The system is first initialized to the spin up state, and then a short pulse rotates the spin by 90°, as indicated on the sphere. The spin then precesses about an applied magnetic field until a second pulse rotates it by another 90°, which can take it toward ei-ther the spin up or down state depending on the phase of precession. As displayed in Fig. 5, this gives rise to oscillations in the spin state population (called Ramsey fringes) as the pulse delay is varied, which indicates the quantum coherence of the spin qubit. By varying the pulse intensity and pulse delay, any single-qubit gate can be obtained. Figure 6 displays optical control of two interacting electron spin qubits in separate QDs.1 The system is initialized into the singlet state ↑↓–↓↑ by pumping all of the triplet states: ↑↑, ↑↓+↓↑, and ↓↓ (see Fig. 4(d)). This singlet state is entangled, and it is manipulated
with single-qubit and two-qubit gates. The dynamics are represented on a sphere in Fig. 6 that shows a subset of the two-qubit space spanning all superpositions of ↑↓ and ↓↑. The first single-qubit gate rotates the spin state to the equator, where the two spins essentially precess about each other, going between ↑↓ and ↓↑. The second single-qubit gate rotates the spin state up or down, depending on the phase, giving rise to the Ramsey fringes in Fig. 6. An additional two-qubit gate is added in between the two single-qubit gates, chang-ing the phase by 145°.
FIGURE 4(a) Schematic of the coupled QD device and the pulses used to manipulate them. (b-d) Energy level diagrams showing the action of pulses to achieve initialization, single-qubit gates, and two-qubit gates.

197nanoscience technology | 2012 NRL REVIEW
Conclusions: We have fabricated, characterized, and controlled systems of two-spin qubits in adjacent semiconductor QDs. The ultrafast optical gates used to manipulate the entangled spins in this system can be achieved much faster than in any other system, allow-ing many more operations during the qubit lifetime. Also, this solid-state platform has the potential to scale up to many qubits, making it a promising candidate for quantum information technology. [Sponsored by the NRL Base Program (CNR funded)]
References1 D. Kim, S.G. Carter, A. Greilich, A.S. Bracker, and D. Gam-
mon, “Ultrafast Optical Control of Entanglement Between Two Quantum-Dot Spins,” Nature Phys. 7, 223–229 (2011).
2 A. Greilich, S.G. Carter, D. Kim, A.S. Bracker, and D. Gammon, “Optical Control of One and Two Hole Spins in Interacting Quantum Dots,” Nature Photon. 5, 702–708 (2011).
Enhanced Multiple Exciton Generation in Semiconductor Nanorods
P.D. Cunningham,1 J.E. Boercker,1 M.P. Lumb,1 J.G. Tischler,1 J.S. Melinger,1 E.E. Foos,2 and A.R. Smith2
1 Electronics Science and Technology Division2 Chemistry Division
Motivation: In a typical photovoltaic solar cell, only a portion of the energy from the absorbed light is converted to electricity. Regardless of the photon energy absorbed, a photon produces a single electron–hole pair (exciton) that will ultimately possess only the semiconductor bandgap energy. The fraction of photon energy that lies above this bandgap is dissipated as heat
FIGURE 5Ramsey fringes in the spin state population, demonstrating control of a single-hole spin state. The pulse sequence is shown above the plot. The small amplitude of fringes near zero delay is not fully understood. The sphere to the left shows the trajectory of the spin vector as it is rotated by the single-qubit gates and as it precesses in a magnetic field.
FIGURE 6Ramsey fringes in the two-electron spin state population, demonstrating control of two interacting electron spins. The red (black) curve is with (without) a two-qubit control pulse that changes the phase of the spin state. The pulse sequence is shown above the plot. The sphere to the left shows the trajectory of the two-electron spin vector as it is rotated by the single-qubit gates and as its phase changes due to interaction and the two-qubit gate.

198 2012 NRL REVIEW | nanoscience technology
through the vibration of surrounding atoms (phonons) and goes to waste rather than contributing additional excitons (Fig. 7(a)). This is the primary loss mechanism in photovoltaic cells. The process of multiple exciton generation (MEG) allows excess photon energy to be efficiently used. In this process, a high-energy photon creates a “hot” exciton that possesses a surplus of energy above the semiconductor bandgap energy. If this excess energy is greater than the bandgap energy, it can be used to ex-cite a second electron across the semiconductor band-gap, creating a second exciton (Fig. 7(b)). This mecha-nism has the potential to increase the light harvesting capabilities of solar cells, improving their efficiency.
MEG is inefficient in “bulk” semiconductors, such as silicon, and does not contribute in a significant way to the efficiency of photovoltaic cells based upon them. This process has been shown to occur with greater effi-ciency in spherical semiconductor nanocrystals. There, the small size of the particles forces stronger interac-tions between electrons and slows their cooling as a consequence of quantum confinement. Unfortunately, MEG in nanocrystals is not efficient enough to improve the performance of photovoltaic cells. Only a small fraction of solar photons possess the energy required to create two, or more, excitons.
Technical Approach: Previously, nanostructures with other shapes have not been investigated for MEG,
due to the assumption that reducing quantum confine-ment would make this process less efficient. Recent theoretical work suggests that electron-interactions might be increased as a nanostructure is elongated,1 enhancing MEG. We investigated the efficiency of MEG in elongated semiconductor nanorods made of lead selenide (PbSe), a material whose nanocrystals are efficient at this process. We examine the dynamic processes following the absorption of photons by nanorods using ultrafast pump-probe spectroscopy. In these experiments, we excite a solution of nanorods by illuminating them with a pulsed pump laser beam. Absorption of the pump pulse creates excitons in the nanorods. A few picoseconds later, an infrared probe pulse measures the absorbance of the excited nanorods. Each exciton ex-cited makes the nanorod less absorptive to the probe. A single exciton lasts for ~1 µs, until the electron returns to the valence band from the conduction band and a photon is emitted (radiative recombination). This is too long to measure with pump-probe spectroscopy. If two excitons are present due to MEG, then one will recom-bine within about 100 ps, transferring its extra energy back to the other exciton through a process known as Auger recombination. This presence of a fast change in absorbance allows us to easily identify whether MEG takes place. From the magnitude of this change we can precisely determine the number of excitons initially created per absorbed photon (exciton quantum yield).
NRL Discovery: We discovered that MEG is enhanced in nanorods compared to nanocrystals.2
FIGURE 7Diagram of the hot exciton cooling (a) and multiple exciton generation (b) processes.
FIGURE 8PbSe nanocrystals (a), nanorods (b), and the numbers of exci-tons generated per photon in each compared to the bulk (c).

199nanoscience technology | 2012 NRL REVIEW
At a given photon energy, nanorods generated more excitons per photon than similarly sized nanocrystals. Further, multiple excitons could be created with vis-ible light, at photon energies too low for nanocrystals. After measuring the exciton quantum yield for differ-ent photon energies, we concluded that MEG is twice as efficient in nanorods and the required threshold energy is only 2.23 times the bandgap energy (Fig. 8). This approaches the limit of twice the bandgap energy imposed by conservation of energy. We modeled the potential impact of this discovery on photovoltaic cells by conducting detailed balance calculations (Fig. 9). Here, we calculated the highest efficiency an ideal photovoltaic cell could produce if limited only by radiative recombination. We found that while MEG in nanocrystals does not improve the solar-to-electrical power conversion efficiency of pho-tovoltaic cells, the enhanced MEG in nanorods does, by using more of the solar spectrum for MEG. In particu-lar, photovoltaic cells exhibiting efficient MEG, like that demonstrated in these nanorods, showed a significant improvement in efficiency over those with no MEG when operated with a lens that increases the solar light intensity by a factor of more than 100.
Conclusion: We observed multiple exciton genera-tion in semiconductor nanorods for the first time and discovered that the process is enhanced twofold over what is observed in nanocrystals and fourfold over what is observed in the bulk. This enhancement has the potential to significantly improve solar cell efficiencies. [Sponsored by the NRL Base Program (CNR funded)]
FIGURE 9Detailed balance calculations of the photovoltaic power conver-sion efficiency vs the material bandgap (a) and the maximum efficiency vs solar concentration (b).
References1 A.C. Bartnik, A.L. Efros, W.-K. Koh, C.B. Murray, and F.W.
Wise, “Electronic States and Optical Properties of PbSe Nano-rods and Nanowires,” Phys. Rev. B 82, 195313 (2010).
2 P.D. Cunningham, J.E. Boercker, E.E. Foos, M.P. Lumb, A.R. Smith, J.G. Tischler, and J.S. Melinger, “Enhanced Multiple Exci-ton Generation in Quasi-One-Dimensional Semiconductors,” Nano Letters 11, 3476–3481 (2011).
Engineering Graphene Mechanics
M.K. Zalalutdinov,1 J.T. Robinson,2 C.E. Junkermeier,2 J.C. Culbertson,2 T.L. Reinecke,2 R. Stine,3 P.E. Sheehan,3 B.H. Houston,1 and E.S. Snow2
1 Acoustics Division2Electronics Science and Technology Division3Chemistry Division
Introduction: Ultra-thin, high-strength graphene films are currently reshaping the field of nanomechan-ics. Graphene’s thinness alone has led to exciting new applications, but more importantly, its rich chemistry enables approaches to nanofabrication unavailable in conventional microelectromechanical systems (MEMS) materials like silicon. Specifically, chemical modifica-tion and laser irradiation of graphene films can control the connectivity and tension in the films, providing wide-range continuous tuning of key mechanical properties such as stiffness, strength, and in-plane stress.1 This insight enabled us to improve dramatically the performance of radio frequency (RF) resonators by judiciously introducing stress and strength during fabrication. To appreciate the extent of the structural and me-chanical metamorphosis undergone by the chemically modified graphene (CMG) film during fabrication, it is important to understand that the film starts as submi-cron flakes of monolayer graphene oxide (GO),2 with a loosely packed structure reminiscent of papier-mâché. At the end of the processing, it has an elastic modulus comparable to diamond. Thermal treatment of GO at T1 ~ 400 °C removes most of the oxygen, resulting in decreased inter-platelet separation and improved inter-platelet van der Waals bonding. Figure 10(a) shows a cross section of a CMG drum resonator, released by un-dercutting a sacrificial silicon layer in a gas etch (XeF2) through a small, lithographically defined irrigation hole. Subsequent thermal anneal (T2 > 400 °C) then removes fluorine absorbed by the graphene during the XeF2 gas release process. Raman spectroscopy of the re-sulting CMG film reveals a high density of intra-platelet defects in the sp2-carbon lattice, while stress relaxation

200 2012 NRL REVIEW | nanoscience technology
experiments indicate that interlayer bonding is weak, leading to platelets slippage under tensile stress. Remarkably, it is this highly defective, compliant, multilayer graphene film that transforms into a high-strength, high tensile stress, low-loss material. We find that a laser beam focused onto suspended CMG films profoundly changes the structure. An instantaneous transformation from a relaxed, dome-shaped structure into a perfectly flat membrane (Fig. 10(b,d)) indicates that tensile stress is induced within the suspended CMG film during laser irradiation. Figure 11(a) shows a factor of 5 stress-driven increase in the CMG drum resonant frequency after laser treatment by the sharply focused NdYag laser beam (wavelength 513 nm) that was rastered over the drum in a meander-like mo-tion. The ability of CMG resonators to sustain high tensile stress (σmax ~ 1 GPa, estimated from the drum’s resonant frequency) provides strong evidence of inter-platelet structural changes that quench platelet-platelet slippage. From the resonance frequency of cantile-vers micromachined out of laser-treated CMG films (Fig. 12) we extract a Young’s modulus E ~ 800 GPa, an order of magnitude increase over the E ~ 60 GPa measured in the as-released CMG films (Fig. 10(b)). We attribute the superior strength and stiffness of the
laser-treated CMG films to an emerging network of inter-platelet crosslinks induced by the local high tem-perature treatment (T > 1000 °C) under the laser beam. This model aligns with theoretical analysis that predicts the possibility for low-density disordered carbon to recrystallize at elevated temperature and to produce a covalently bonded matrix of graphene sheets.3
The ability to form hybrid sp2–sp3 carbon materials that maintain high tensile stress, combined with stress tunability via laser power, provides a dramatic enhance-ment in performance of our RF drum resonators. The quality factor, defined as the ratio of the energy stored in the resonator to the energy dissipated per cycle (Q = Estored /Edissipated), is affected by both the tensile stress and enhanced film integrity provided by the laser anneal. The increase in the tensile stress results in a higher spring constant and thus Estored, while a reduction in the internal friction from crosslinking reduces Edissipated. Figure 11(b) shows the wide-range tunability in quality factor, attainable through tailoring the laser anneal conditions. The inset in Fig. 11(b) shows the resonance peak for a 21 MHz CMG drum with the record-high quality Q = 31,000, far higher than the Q ~ 2,000 demonstrated for the best pure graphene resonators.4
FIGURE 10(a) Schematic cross section of a CMG drum resonator released in a selective gas (XeF2) etch by undercutting a sacrificial silicon layer (400 nm thick device layer of silicon-on-insulator wafer) through a lithographically defined irrigation hole. (b) Perspective AFM (atomic force microscope) image illustrating the dome shape of the suspended CMG film (dome diameter 17 μm) after high-temperature defluorination. (c) Results of finite element modeling for a temperature distribution over the CMG drum during the laser scan (Plaser = 1 mW, beam diameter 1 μm, dome diameter 17.75 μm). The maximum temperature (red color) directly under the laser beam is estimated as 3000 °C. (d) AFM image of the drum (diameter 17 μm) flattened by the laser anneal (Plaser = 1 mW).
FIGURE 11Fundamental resonance frequency (f) and quality factor (Q) vs laser annealing power for two dome resonators. The arrows on (b) indicate the laser power that provides the highest resonant frequency, i.e., the position of the peak on the f vs Plaser plot, (a). The inset in (b) shows the resonant curve for the highest quality factor drum resonator (Q = 31,000, f = 21 MHz, an-nealed at Plaser = 2 mW).

201nanoscience technology | 2012 NRL REVIEW
This 15-fold enhancement in Q exemplifies the power of precise materials engineering in nanomechanics. We view CMG as a “nano-material-by-design,” which can enable numerous applications from “nano shrink wrap” to self-assembly, muscled by a contracting CMG film. Our preliminary results also indicate that structural transformations in CMG films can be induced by a sharply focused electron beam, opening new possibili-ties for material engineering that can be implemented as an in situ direct writing with nanometer resolution.
Acknowledgments: This work was supported by the Office of Naval Research and was enabled through close collaboration of the Electronics Science and Tech-nology, Chemistry, and Acoustics Divisions at NRL. [Sponsored by ONR]
References1 M.K. Zalalutdinov, J.T. Robinson, C.E. Junkermeier, J.C. Cullb-
ertson, T.L. Reinecke, R. Stine, P.E. Sheehan, B.H. Houston, and E.C. Snow, "Engineering Graphene Mechanical Systems," Nano Letters 12, 4212–4218 (2012).
2 J.T. Robinson, M. Zalalutdinov, J.W. Baldwin, E.S. Snow, Z. Wei, P. Sheehan, and B.H. Houston, “Wafer-scale Reduced Graphene Oxide Films for Nanomechanical Devices,” Nano Letters 8(10), 3441–3445 (2008).
3 C.W. Bauschlicher, Jr., and J.W. Lawson, “Amorphous Carbon and its Surfaces,” Chemical Physics 374, 77–82 (2010).
4 R.A. Barton, B. Ilic, A.M. van der Zande, W.S. Whitney, P.L. McEuen, J.M. Parpia, and H.G. Craighead, “High, Size-De-pendent Quality Factor in an Array of Graphene Mechanical Resonators,” Nano Letters 11(3), 1232–1236 (2011).
FIGURE 12(a) Scanning electron microscope image of a cantilever cut out of a laser- annealed drum (Plaser ~ 1.7 mW, film thickness h = 20 nm) using a focused ion beam (Ga+, 30 keV); (b) The slope of the f 2 vs h2/L4 plot for CMG cantilevers of different geometries (f is the fundamental frequency, L is cantilever length) provides the estimate for the CMG Young's modulus E ~ 800 GPa.

Ocea
n Scie
nce a
nd Te
chno
logy204
Bio-Inspired Locomotion for Unmanned Underwater VehiclesJ.D. Geder, R. Ramamurti, M. Pruessner, B. Ratna, J. Palmisano, and W. Sandberg
206Extending Optical Visibility Prediction Range with the Help of Acoustics
W. Hou, E. Jarosz, S. Woods, W. Goode, and A. Weidemann
208Tomographic Particle Image Velocimetry of Bottom Boundary Layer Processes
J. Calantoni and I.M. Sou
210Rapid Autonomous Fuel Transfer for USVs
G.P. Scott and C.G. Henshaw
At NRL’s Ballast Water Testing Research Facility in Key West, Florida, scientists combine shipboard engineering and marine biology to assess treatment system efficacy in killing or removing small, potentially invasive marine organisms from ships ballast water.

204 2012 NRL REVIEW | ocean science and technology
Bio-Inspired Locomotion for Unmanned Underwater Vehicles
J.D. Geder,1 R. Ramamurti,1 M. Pruessner,2 B. Ratna,2
J. Palmisano,3 and W. Sandberg4
1Laboratories for Computational Physics and Fluid Dynamics2Center for Bio/Molecular Science and Engineering 3NOVA Research, Inc.4SAIC, Inc.
Introduction: As greater levels of remote opera-tion and autonomy are becoming possible, we are increasingly turning to robots for solutions in environ-ments where it is infeasible or unsafe to send human or animal operators to perform a specific function. In fact, the Naval Science and Technology Strategic Plan has singled out autonomy and unmanned systems as an important research focus area to enable future Navy operations. In the undersea realm, unmanned vehicles are cur-rently being deployed for military operations in mine and antisubmarine warfare, scientific operations for mapping and analyzing various underwater environ-ments, and commercial operations in the oil and gas industry, among others. However, of all the missions in which traditional propeller-driven unmanned under-water vehicles (UUVs) have been successfully deployed, none have been in cluttered, nearshore environments where precise positioning and small-radius maneuvers are required in the presence of waves and alternating currents. To tackle the problems that propeller-driven vehicles have in this critical environment, research-ers at NRL1 and elsewhere have studied the fin force production mechanisms used by various fish species to understand how these organisms achieve their high levels of controllability.
Fin Development: At NRL we have drawn inspira-tion from a particular coral reef fish, the bird wrasse, to develop an actively controlled curvature robotic fin. The fin consists of five ribs, each actuated to create a spanwise (from fin root to tip) curvature (Fig. 1(a)). The actuation of each of the five ribs in turn creates a chordwise (from fin leading to trailing edge) curvature (Fig. 1(b)). Active control of fin curvature is a unique feature necessary for enabling generation of desired force vectors for propulsion and control. In addition to fin curvature, other fin parameters contribute to force generation. Through a combination of computational and empirical analyses, we have mod-eled the effects of these parameters on fin force genera-tion.2 Initial studies on a single isolated fin served to characterize thrust and lift production as functions of fin curvature, flapping frequency and amplitude, fin
stroke angle bias, and freestream flow velocity. Subse-quent studies on multiple fins have added to the initial models by quantifying the effects of spacing between fins and stroke angle phase differences on thrust and lift generation. Further, all of the studied stroke param-eters are coupled, and our models have been derived to sufficiently capture how simultaneous variations in multiple parameters affect force production.
Vehicle Development: Following the development and modeling of the bio-inspired robotic pectoral fins, we designed and built a UUV to demonstrate the capa-bility of these fins as effectors of vehicle propulsion and control (Fig. 2). This NRL Bio-UUV includes a basic suite of sensors for testing and validation including an inertial measurement unit, compass, depth gauge, and sonar range finder. It also has onboard power and an onboard processor for determining actuator outputs from the sensor measurements, as well as a radio for wireless data transmission in real time. The four-fin de-sign enables vehicle pitch and roll stability control, tight radius yaw maneuvers, and an opportunity to improve thrust generation from manipulation of multiple fin flow interactions.
Performance: Simulations of vehicle performance have been carried out using the high-fidelity fin models described, along with a 6-degree-of-freedom vehicle model, and sensor and actuator models. Validation of these models through comparison of simulation results with experimental vehicle results demonstrates that we have developed a tool with which to conduct future fin and fin-driven vehicle designs (Fig. 3). With a forward
FIGURE 1(a) One of the five fin ribs showing the actuation of the structure at the rib base creating a deflection at the rib tip. This creates spanwise curvature in each rib. (b) The entire fin showing each of the five ribs deflected with different directions and magnitudes. This creates chordwise curvature across the fin.
(a)
(b)

205ocean science and technology | 2012 NRL REVIEW
speed of about one-half meter per second (greater than one body length per second), a zero turn radius,2 and ability to move vertically through a column of water,3 the NRL Bio-UUV is capable of the precise trajectory control needed in cluttered environments.
Summary: Active-curvature control of a flap-ping fin has enabled the generation of desired three-dimensional force vectors, thereby removing the need for multiple thrusters. The results of our vehicle studies have proven the NRL fin and the subsequent NRL Bio-UUV as capable technologies in our drive to develop an unmanned vehicle for performing critical nearshore operations in confined environments. Further, the tools used to develop the fin and vehicle models can be applied to guide future designs aimed at achieving specific performance metrics. In short, NRL’s research in bio-inspired underwater locomotion is laying the foundation for successful UUV operations in highly dynamic nearshore environments. [Sponsored by the NRL Base Program (CNR funded)]
References1 R. Ramamurti and W.C. Sandberg, “Computations of Insect
and Fish Locomotion with Applications to Unconventional Unmanned Vehicles,” AIAA J. 46(9), 2178–2190 (2008).
2 J.D. Geder, R. Ramamurti, J. Palmisano, M. Pruessner, B. Ratna, and W.C. Sandberg, “Four-Fin Bio-Inspired UUV: Modeling and Control Solutions,” ASME International Mechanical Engineering Congress and Exposition, Denver, CO, Nov. 11–17, 2011.
3 J.D. Geder, R. Ramamurti, J. Palmisano, B. Ratna, and W.C. Sandberg, “Dynamic Performance of a Bio-Inspired UUV: Effects of Fin Gaits and Orientation,” 17th International Unmanned Untethered Submersible Technology Conference, Portsmouth, NH, Aug. 21–24, 2011.
FIGURE 2(a) Functional prototype of, and (b) surface pressure distribu-tion on, the NRL Bio-UUV with four actively controlled curva-ture pectoral fins.
(a)
(b)
FIGURE 3Comparison of simulated and experimental vehicle performance in (a) heading and (b) depth responses. Agreement of these results validates the models derived for the fin and vehicle.
(a) (b)
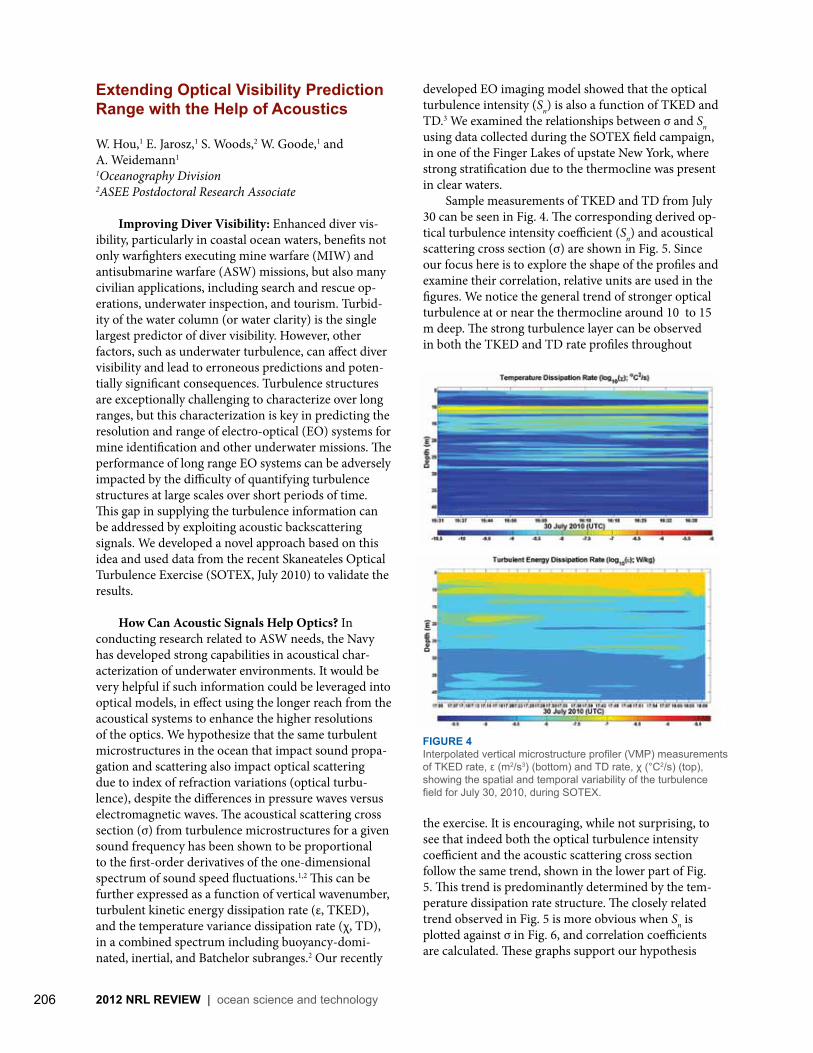
206 2012 NRL REVIEW | ocean science and technology
Extending Optical Visibility Prediction Range with the Help of Acoustics
W. Hou,1 E. Jarosz,1 S. Woods,2 W. Goode,1 and A. Weidemann1
1Oceanography Division 2ASEE Postdoctoral Research Associate
Improving Diver Visibility: Enhanced diver vis-ibility, particularly in coastal ocean waters, benefits not only warfighters executing mine warfare (MIW) and antisubmarine warfare (ASW) missions, but also many civilian applications, including search and rescue op-erations, underwater inspection, and tourism. Turbid-ity of the water column (or water clarity) is the single largest predictor of diver visibility. However, other factors, such as underwater turbulence, can affect diver visibility and lead to erroneous predictions and poten-tially significant consequences. Turbulence structures are exceptionally challenging to characterize over long ranges, but this characterization is key in predicting the resolution and range of electro-optical (EO) systems for mine identification and other underwater missions. The performance of long range EO systems can be adversely impacted by the difficulty of quantifying turbulence structures at large scales over short periods of time. This gap in supplying the turbulence information can be addressed by exploiting acoustic backscattering signals. We developed a novel approach based on this idea and used data from the recent Skaneateles Optical Turbulence Exercise (SOTEX, July 2010) to validate the results.
How Can Acoustic Signals Help Optics? In conducting research related to ASW needs, the Navy has developed strong capabilities in acoustical char-acterization of underwater environments. It would be very helpful if such information could be leveraged into optical models, in effect using the longer reach from the acoustical systems to enhance the higher resolutions of the optics. We hypothesize that the same turbulent microstructures in the ocean that impact sound propa-gation and scattering also impact optical scattering due to index of refraction variations (optical turbu-lence), despite the differences in pressure waves versus electromagnetic waves. The acoustical scattering cross section (σ) from turbulence microstructures for a given sound frequency has been shown to be proportional to the first-order derivatives of the one-dimensional spectrum of sound speed fluctuations.1,2 This can be further expressed as a function of vertical wavenumber, turbulent kinetic energy dissipation rate (ε, TKED), and the temperature variance dissipation rate (χ, TD), in a combined spectrum including buoyancy-domi-nated, inertial, and Batchelor subranges.2 Our recently
developed EO imaging model showed that the optical turbulence intensity (Sn) is also a function of TKED and TD.3 We examined the relationships between σ and Sn using data collected during the SOTEX field campaign, in one of the Finger Lakes of upstate New York, where strong stratification due to the thermocline was present in clear waters. Sample measurements of TKED and TD from July 30 can be seen in Fig. 4. The corresponding derived op-tical turbulence intensity coefficient (Sn) and acoustical scattering cross section (σ) are shown in Fig. 5. Since our focus here is to explore the shape of the profiles and examine their correlation, relative units are used in the figures. We notice the general trend of stronger optical turbulence at or near the thermocline around 10 to 15 m deep. The strong turbulence layer can be observed in both the TKED and TD rate profiles throughout
the exercise. It is encouraging, while not surprising, to see that indeed both the optical turbulence intensity coefficient and the acoustic scattering cross section follow the same trend, shown in the lower part of Fig. 5. This trend is predominantly determined by the tem-perature dissipation rate structure. The closely related trend observed in Fig. 5 is more obvious when Sn is plotted against σ in Fig. 6, and correlation coefficients are calculated. These graphs support our hypothesis
FIGURE 4Interpolated vertical microstructure profiler (VMP) measurements of TKED rate, ε (m2/s3) (bottom) and TD rate, χ (°C2/s) (top), showing the spatial and temporal variability of the turbulence field for July 30, 2010, during SOTEX.

207ocean science and technology | 2012 NRL REVIEW
that a positive correlation exists between the optical turbulence intensity and acoustic scattering cross sec-tions, as demonstrated by the correlation coefficients of 0.93 (multiple days during the exercise ranged from 0.86 to 0.99 using a log–log scale). The result shown here implies a strong relationship between the optical and acoustical signals impacted by turbulent condi-tions. It is worth mentioning that due to differences in deployment requirements to quantify dissipation rates of TKED and TD, profiles have been interpolated to the nearest points in space and time, in order to
have co-incidental measurements at desired depth to calculate impacts on both the optics and acoustics. This procedure likely introduces undesired variances in the presented figures. Efforts are under way to investigate and minimize these noise terms.
Summary: A novel approach that uses acoustic scattering returns to estimate long-range optical signal degradation caused by turbulence is described. Data obtained during the SOTEX field campaign validated the relationship between the acoustic and the optical returns. A strong correlation (>0.9) can be seen during multiprofile observations. When combined with the current active EO imaging system performance model for the Navy’s mine hunting systems, this result enables us to significantly enhance prediction accuracy, as it ad-dresses contributions from turbulence over long ranges, in the presence of particle contributions, for the first time. [Sponsored by the NRL Base Program (CNR funded)]
References1 T. Ross and R. Lueck, “Sound Scattering from Oceanic Turbu-
lence,” Geophys. Res. Lett. 30, 1343 (2003).2 L. Goodman, “Acoustic Scattering from Ocean Microstructure,”
J. Geophys. Res. 95, 11557–11573 (1990).3 W. Hou, “A Simple Underwater Imaging Model,” Opt. Lett. 34,
2688–2690 (2009).
FIGURE 5VMP turbulence measurements of TKED (ε) and TD rates (χ), optical turbulence intensity (Sn) and acoustical scattering cross section (σ) on July 30, 2010. The unit for ε is m2/s3, while χ is °C2/s. Sn and σ are not calibrated.
FIGURE 6Optical turbulence intensity (Sn) vs acoustical scattering cross section (σ) for July 30, 2010. Correlation coefficient is 0.93 on the log-scale plot shown.

208 2012 NRL REVIEW | ocean science and technology
Tomographic Particle Image Velocimetry of Bottom Boundary Layer Processes
J. Calantoni1 and I.M. Sou2
1 Marine Geosciences Division2 National Research Council Postdoctoral Fellow
Introduction: Boundary layer processes are domi-nated by the interaction between fluid turbulence and immersed particles. Fluid turbulence causes airplane travel to be uncomfortable, generates dust storms, and drives sediment transport responsible for beach ero-sion. Developing a set of governing equations for flow and behavior of granular and granular-fluid mixtures has been a long-standing scientific challenge. Here we bring a relatively new technology to bear on an old problem by using state-of-the-art optical techniques for measuring fluid flow and the velocities of grains immersed in the fluid (e.g., sand in water). Our focus is on understanding how fluid turbulence entrains and deposits sediments on seafloor, estuarine, and river beds. Timely and accurate characterization of the bot-tom boundary layer in these operational environments is critical to improving the utilization of Navy sensors and forecasting models.
Experimental Facility: Measurements are per-formed in the laboratory on boundary layer flows gen-erated within a small oscillatory flow tunnel (S-OFT). The S-OFT is equipped with a piston drive system to simulate the action of fluid flow at the seafloor un-der waves in shallow water. As a wave passes, the sea surface moves up and down, which drives fluid motion back and forth over the seafloor. Here, our tunnel test section contains a sediment well that is filled with beach sand. The motion of the water over the sediments generates fluid turbulence, sediment transport, and sometimes forms sand ripples as shown in Fig. 7. Ad-ditionally, the S-OFT contains a pump to drive steady flow that may be combined with the oscillatory flow. A pair of sediment wells on each side of the test section is used to collect transported sediments. Tomographic particle image velocimetry (Tomo-PIV) is a remote sensing technique used in the labora-tory to measure the time-resolved three-dimensional-three-component (3D-3C) velocity vector field.1 Our system uses four high-speed video cameras and a high-repetition laser. Laser light illuminates the flow from above while the cameras image through the sidewall of the S-OFT. The flow is seeded with fine particulate material that essentially follows the motion of the fluid while scattering laser light. Image pairs are acquired at a very precise and narrow time interval.
FIGURE 7Shown is a photograph of the small oscillatory flow tunnel (S-OFT). (A) The laser head is mounted near the open head box shown in the upper left corner. (B) The bank of video cameras used to image the flow is located to the left of the test section. (C) Water flows back and forth across the test section driving boundary layer flow where sand ripples have formed. (D) The oscillatory flow is driven by vertical piston motion contained in the blue headbox that is partially visible on the right side of the image. The inset shows an example of a raw image acquired by one of the video cameras. In the inset, the brighter and larger bed material is readily distinguishable from the fine particulate material above that is used to seed the flow.

209ocean science and technology | 2012 NRL REVIEW
Computationally intensive image processing allows for a construction of the 3D-3C velocity vector field within a relocatable measurement volume (up to 1000 cm3). The system has temporal resolutions from 50 to 100 Hz with millimeter spatial resolution.
Vortex Measurements: The 3D-3C velocity data allow us to visualize the time-dependent and three-dimensional characteristics of turbulent coherent structures such as vortex stretching and bending. Preliminary measurements show a snapshot of a vortex being shed from an idealized sand ripple (Fig. 8). The vortex shown in the upper right panel is depicted by the swirling strength of the flow. The contours of swirl-ing strength illuminate the complex structure of the turbulence at a specific instant in time. Here, the swirl-ing strength is a scalar quantity that allows one to locate the cores of rotating structures in turbulent flows. In the upper left panel, the velocity vectors also highlight the rotation of the flow. The lower panel is an estimate of the instantaneous bed shear stress. Bed shear stress is a quantity commonly used to estimate sediment
transport, but has been notoriously difficult to measure directly.2
Research Applications: The data obtained in our experimental facility will be used to validate simula-tions that predict the fine-scale structure of fluid turbulence responsible for sediment entrainment and deposition. We pursue these studies because we believe that ultimately all large-scale phenomena are governed by physics at the microscale. For example, all changes in bathymetry in the littoral, estuaries, and rivers begin with small amounts of sediment being entrained and deposited from local areas of the bottom. We are currently resolving the 3D-3C Eulerian flow field very near the Kolmogorov length scale, which represents the fundamental length scale for fluid turbulence. Ongoing experiments are focused on phase separation where we attempt to discriminate with a single set of images be-tween seeded particles that allow us to image the flow and the actual sediment particles on the bed (see inset to Fig. 7).
FIGURE 8Shown is a snapshot of a vortex being shed from an idealized sand ripple. The swirling strength is contoured in the upper right panel. The planes roughly intersect the dominant vortex core. A slice of the three-dimensional velocity is shown in the upper left panel where the color contours indicate veloc-ity in and out of the plane, while the vectors highlight the rotation of the flow. The lower panel is an estimate of the instantaneous bed shear stress.

210 2012 NRL REVIEW | ocean science and technology
Summary: The experimental facilities and pre-liminary measurements described here demonstrate a unique capability that will allow us to make detailed measurements of the fundamental processes driving the fluid-sediment bottom boundary in the littoral, estuaries, and rivers. Measurements will be used to validate fluid-sediment phase closure relations in highly resolved three-dimensional models for the direct numerical simulation of small-scale sand ripples. Long-term research is focused on development of robust models to forecast temporal and spatial changes in the littoral, estuarine, and river bottom boundary layers.
Acknowledgments: Equipment was purchased through the Capital Procurement Program of the Naval Research Laboratory. We thank Mr. Sigurd Anderson from Engineering Laboratory Design, Inc. for his excel-lent service in the design and fabrication of the small oscillatory flow tunnel. We thank Dr. Callum Gray from LaVision, Inc. for his tireless efforts to install and calibrate the Tomo-PIV system. [Sponsored by ONR]
References1 G.E. Elsinga, F. Scarano, B. Wieneke, and B.W. van Oudheus-
den, “Tomographic Particle Image Velocimetry,” Experiments in Fluids 41, 933–947 (2006).
2 J.K. Seelam, P.A. Guard, and T.E. Baldock, “Measurement and Modeling of Bed Shear Stress Under Solitary Waves,” Coastal Engineering 58(9), 937–947 (2011).
Rapid Autonomous Fuel Transfer for USVs
G.P. Scott and C.G. HenshawSpacecraft Engineering Department
Introduction: The Naval Research Laboratory has developed a prototype robotic system to autonomously refuel unmanned surface vehicles (USVs) while on the open sea. Even at an active sea state of 3.25 (wave heights over 1 m), the robotic system can successfully transfer fuel from the host vehicle.
Background: Refueling Navy vessels in the open sea is a challenging prospect. Large, conventional vehicles require huge cranes to hoist the required fuel lines and associated cabling between the two vessels. Sailors are required to manually attach and detach the required cabling and react appropriately to anomalies. For USVs, the difficulty is even greater, as these vehicles are more significantly affected by the sea state. If the ships veer too far apart or communication breaks
down during the process, lines can snap and Sailors involved in the process can be injured or killed. The Naval Research Laboratory’s Space Robotics Laboratory and Clemson University have developed an autonomous robotic methodology for refueling USVs. This article addresses the development, control, and testing of a robotic refueling system.
Robotic Refueling System: The team proposed a robotic system that can be controlled manually by Sailors aboard the refueling vehicle or autonomously through visual tracking of the fuel receptacle. This ro-botic system is made up of two primary segments: one rigid and the other flexible. The first is a rigid industrial manipulator that can provide rapid and accurate movement to respond quickly to the movement of the fuel tank on the USV. The Mitsubishi PA10-7CE industrial robotic arm was selected for this task due to its extensive use by NRL. The second is a compliant pneumatic manipulator that provides a flexible connection between the rigid arm and the fuel receptacle to minimize the possibility of damage to either arm or the vessel. The Clemson-de-signed Octarm was selected due to its successful opera-tion in a previous initiative sponsored by the Defense Advanced Research Projects Agency (DARPA). Together, the PA10 and the Octarm make up the robotic refueling system. Shown in Fig. 9, this sys-tem has a maximum reach of nearly 2 m. In total, the system has 7 rigid degrees of freedom and 9 pneumatic degrees of freedom. In between the PA10 and the Octarm is a down-pointing digital video camera that targets a tracking fiducial on the USV. The robotic arm uses this camera and a visual servoing algorithm to autonomously move the system to a configuration that pinpoints the end effector above the fuel receptacle so that it can dock to transfer fuel.
Fuel Transfer: The fuel transfer system is designed and prototyped to transfer fuel to a target fuel tank on the USV without the need for direct human interven-tion. The system provides a self-aligning magnetic con-nection between the host and target systems. Within this magnetic connection is a transferrable “puck” that is attracted more strongly toward the target system than the host system. This magnetic differential allows the puck to connect to the target system and, in the case of waves pushing the systems apart, only separate from the weaker magnetic connection on the host system. A flexible hose is connected though the puck to transfer fuel between the host system and the target system. In the event that the magnetic connection to the robotic system is lost, the flexible hose has signifi-
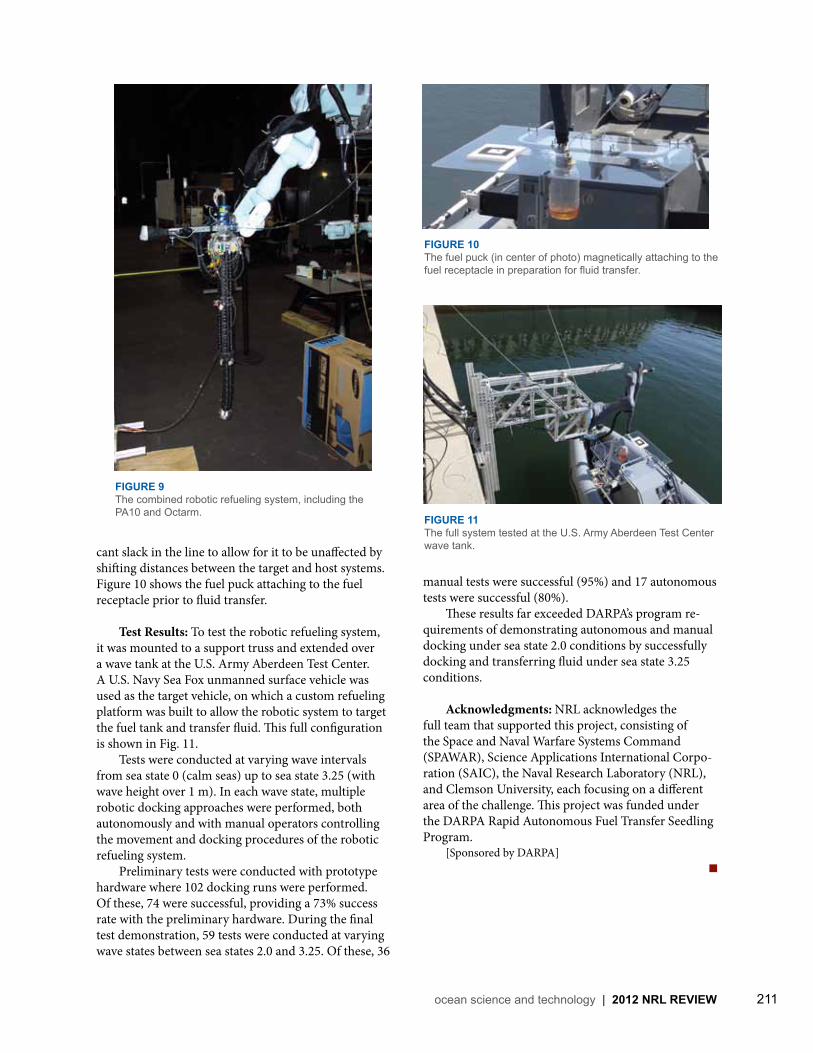
211ocean science and technology | 2012 NRL REVIEW
cant slack in the line to allow for it to be unaffected by shifting distances between the target and host systems. Figure 10 shows the fuel puck attaching to the fuel receptacle prior to fluid transfer.
Test Results: To test the robotic refueling system, it was mounted to a support truss and extended over a wave tank at the U.S. Army Aberdeen Test Center. A U.S. Navy Sea Fox unmanned surface vehicle was used as the target vehicle, on which a custom refueling platform was built to allow the robotic system to target the fuel tank and transfer fluid. This full configuration is shown in Fig. 11. Tests were conducted at varying wave intervals from sea state 0 (calm seas) up to sea state 3.25 (with wave height over 1 m). In each wave state, multiple robotic docking approaches were performed, both autonomously and with manual operators controlling the movement and docking procedures of the robotic refueling system. Preliminary tests were conducted with prototype hardware where 102 docking runs were performed. Of these, 74 were successful, providing a 73% success rate with the preliminary hardware. During the final test demonstration, 59 tests were conducted at varying wave states between sea states 2.0 and 3.25. Of these, 36
FIGURE 9The combined robotic refueling system, including the PA10 and Octarm.
manual tests were successful (95%) and 17 autonomous tests were successful (80%). These results far exceeded DARPA’s program re-quirements of demonstrating autonomous and manual docking under sea state 2.0 conditions by successfully docking and transferring fluid under sea state 3.25 conditions.
Acknowledgments: NRL acknowledges the full team that supported this project, consisting of the Space and Naval Warfare Systems Command (SPAWAR), Science Applications International Corpo-ration (SAIC), the Naval Research Laboratory (NRL), and Clemson University, each focusing on a different area of the challenge. This project was funded under the DARPA Rapid Autonomous Fuel Transfer Seedling Program. [Sponsored by DARPA]
FIGURE 10The fuel puck (in center of photo) magnetically attaching to the fuel receptacle in preparation for fluid transfer.
FIGURE 11The full system tested at the U.S. Army Aberdeen Test Center wave tank.

Optic
al Sc
ience
s214Long Range Automated Hyperspectral Target Detection
J. Neumann, M. Kruer, E. Allman, T. Downes, G. Howard, R. Leathers, M. Yetzbacher,M. Kutteruf, M. Colbert, S. Frawley, Z. Butikofer, C. Meadows, and J. Lee
215Full Element Simulator/Stimulator for the Virginia Class LWWAA Sonar System
A. Davis and C. Kirkendall
217Broadband Supercontinuum Generation
L.B. Shaw, R.R. Gattass, V.Q. Nguyen, P. Pureza, and J.S. Sanghera
An employee of the Optical Sciences Division prepares to study the optical and electronic properties of an organic solar cell.

214 2012 NRL REVIEW | optical sciences
Long Range Automated Hyperspectral Target Detection
J. Neumann,1 M. Kruer,1 E. Allman,1 T. Downes,1 G. Howard,1 R. Leathers,1 M. Yetzbacher,1 M. Kutteruf,1 M. Colbert,2 S. Frawley,2 Z. Butikofer,3 C. Meadows,1 and J. Lee1
1Optical Sciences Division2Smart Logic Inc. 3Space Dynamics Laboratory
Introduction: Intelligence, surveillance, and reconnaissance (ISR) sensors are becoming ubiquitous in military operations. In fact, many people refer to a condition known as “ISR saturation,” in which the vol-ume of still imagery and video becomes so great that it cannot be efficiently processed by decision makers on the battlefield. Hyperspectral imagers, such as the MX-20SW developed at NRL, are powerful because they collect and analyze detailed spectroscopic infor-mation for each pixel in the image and automatically cue operators to areas of interest. This avoids requir-ing the operator to view the entire image to identify the very small fraction that is relevant to Department of Defense operations, thereby helping to solve the problem of ISR saturation. The MX-20SW is par-ticularly valuable because it operates in the shortwave infrared (SWIR) spectral region that yields much lower atmospheric scattering and, hence, longer range than sensors operating in the visible spectrum. In addition, many militarily relevant materials are more spectrally distinct in the SWIR than in the visible. Why Spectral Measurements Are Useful: Com-puter algorithms can analyze each pixel’s spectrum within the high-resolution image to cue operators to those pixels that are most likely to be of interest. For example, in a natural forest scene, much of the vegeta-tion will have spectra that look similar. However, the spectrum of a military vehicle or important chemical compound might look quite different from the forest background. NRL has developed algorithms that can recognize those pixels either by matching their spectral signature if that is known a priori, or by recognizing those pixels that are anomalous compared to the im-age’s background. By automatically drawing attention to those most interesting pixels, the hyperspectral imaging system significantly reduces the workload of the image analysts and increases the amount of ISR imagery the analysts can review by orders of magni-tude.
NRL’s Contribution: NRL is the developer and system integrator for the MX-20SW, an SWIR (900 to 1700 nm), real-time, long-range, airborne hyper-
spectral imaging system for target detection as well as collection of measurement and signature intelligence (Fig. 1). An imaging spectrometer is integrated into a modified MX-20 stabilized gimbal system manufac-tured by L-3 Wescam, which enables it to point pre-cisely anywhere within the full hemisphere under the
airborne platform. Previous implementations required tactical aircraft to either directly overfly or employ restrictive flight routes in order to collect hyperspectral data, whereas the MX-20SW allows for arbitrary flight routes substantially offset from the search target. While this capability presents a distinct tactical advantage for our military’s aircraft, the system must address the scientific concerns associated with light propagation over long distances in the Earth’s atmosphere as well as highly variable viewing geometries. Several design approaches were taken to address these scientific concerns. First, the SWIR band was chosen to mitigate atmospheric scattering, increasing long-range visibility of targets. Second, a large-aperture (12 in. diameter), long focal length (900 mm/1800 mm) lens is used to collect sufficient light at long range. These characteris-tics enable the system to produce high quality spectral imagery (Fig. 2). Finally, a technique called covari-ance equalization is used so that hyperspectral target
FIGURE 1The MX-20SW hyper-spectral imager.

215optical sciences | 2012 NRL REVIEW
detection can remain effective in the oblique viewing geometry. Covariance equalization calculates a statisti-cal transformation between the backgrounds of two different scenes and then applies this same transforma-tion to a known target spectrum taken from one scene in order to predict what the spectrum should be in a second, different scene. Using this technique, varying atmospheric conditions and viewing angles can be nor-malized, such that hyperspectral target detection can remain effective for highly oblique viewing geometries and a wide variety of image backgrounds. All the target detection algorithms are implement-ed on a real-time processor that cues analysts to targets of interest at the rate at which the imagery is collected by the sensor. NRL’s unique algorithm architecture and processing implementation allows results to be gener-ated in minutes, compared to the 8 to 24 hours re-quired by other systems. This near-real-time capability, coupled with the SWIR, long-range, high-resolution, oblique viewing ability, enables the system to deploy operationally on a multisensor platform (Fig. 3). The results from each of the sensors can be fused to provide high confidence to the image analyst that the target of interest has automatically been detected by the comput-er system. Over the course of the MX-20SW program, we have implemented various upgrade programs and built three additional units.
FIGURE 2Example imagery taken by the MX-20SW.
FIGURE 3The MX-20SW installed on the multisensor platform.
[Sponsored by U.S. Army Engineer Research and Development Center (ERDC) Cold Regions Research and Engineering Laboratory]
Full Element Simulator/Stimulator for the Virginia Class LWWAA Sonar System
A. Davis and C. KirkendallOptical Sciences Division
Introduction: In August 2003, the lead ship of the Navy’s latest class of attack submarine, USS Virginia, was christened. On board was the first fiber optic sonar system to be deployed on a U.S. Navy vessel: the Light Weight Wide Aperture Array (LWWAA). The hull-mounted LWWAA sonar system is based on fiber optic sensor technology developed at the Naval Research Laboratory and transitioned to industry for produc-tion.1 The LWWAA sensing system comprises the outboard system consisting of thousands of fiber optic hydrophones and the inboard system consisting of the lasers and receiver electronics to interrogate the sensors and extract the acoustic information from the return-ing light (Fig. 4).

216 2012 NRL REVIEW | optical sciences
Fiber optic sensor systems offer some unique ad-vantages in performance, reliability, and cost, but they also present some unique challenges in simulation and integration testing. The fundamental simulation com-plication arises from the fact that fiber optic systems require three parts: optical source, sensor, and receiver. To simulate the sensors, an optical instrument must be built that accepts signals from the source optics and produces optical outputs appropriate for the receiver. Independent simulation of each individual channel for large-scale systems with thousands of sensors, such as the LWWAA, is not practical due to size and cost con-siderations. For the first ten LWWAA ship sets, array simulators and sensor stimulators (SIM/STIMs) with severely limited scope and capabilities were used for development and integration testing. These SIM/STIMs could not fully characterize the system and ultimately resulted in the Navy performing some of the LWWAA operational verification testing on deployed submarines at considerable cost and inconvenience. In 2008, planning commenced for a technology refresh of the LWWAA launch and receive electro-optic systems; this included a task to design and build a new SIM/STIM with enhanced simulation and stimulation features that would address the missing performance test capabilities. Capabilities: The new SIM/STIM (Fig. 5) is built to optically simulate all the LWWAA sensing elements including all the source and receiver electro-optics with a reduced set of independent channels to control cost. The optical telemetry of the SIM/STIM was designed to
match that of the tactical system, thus linking the laser sources to the correct receivers with optical throughput losses and telemetry lengths matching those found in the tactical system. The range of acoustic signal simula-tion has been expanded to include much higher and lower frequencies to simulate interferers and flow noise. To recreate the effects of the operational environment of the tactical sensors on the optical signal path, the simulation interferometers have the ability to change their optical path length to simulate the effects that depth changes have on the sensing elements. The new SIM/STIM incorporates optical attenuators and polar-ization controllers that allow for full optical simulation of the sensor behavior in the tactical environment. The simulation interferometers incorporate environmental isolation, which prevents external noise interference in and above the frequency band of interest, and incorpo-rate a sufficient number of sensor simulators to allow for rudimentary beam forming.
Utilization: The NRL-built SIM/STIM allows the Navy to test multiple performance requirements of the LWWAA system that previously could only be tested at great cost on a tactical platform or at sea. This new capability will be used to verify the design of the new electro-optic launch and receive systems being developed under the technology refresh program and to verify the performance of production units going forward. The ability to simulate all of the source and re-ceiver electro-optics allows the user to fully exercise the system startup procedures and verify their proper
FIGURE 4USS Virginia (LWWAA panels circled) and the onboard electro-optic system.

217optical sciences | 2012 NRL REVIEW
FIGURE 5Full element SIM/STIM and optical telemetry.
operation, sequencing, and elapsed time. Having all the sensor elements available simultaneously also allows the user to verify the optical telemetry paths and exer-cise the system-level optical performance monitoring and fault location functions. Additionally, producing a full suite of acoustic data streams allows the user to stress-test the interface between LWWAA and the sonar processing system. The enhanced stimulation capabilities of the new SIM/STIM test interferometer allow for a wider range of system performance requirements to be tested. The expanded frequency range allows for more complete in-band testing to be performed in the presence of real-istic out-of-band acoustic signals. The ability to change the simulation interferometer’s path length allows for the testing and verification of system performance as the simulated platform changes depth. These stimula-tion capabilities, coupled with the simulation of all ele-ments, allow the user to verify directly the performance of all the source lasers, the telemetry path cable and connectors, and receiver channels instantaneously. The new SIM/STIM was delivered to Lockheed Martin in October 2010, where it successfully under-went its performance verification testing. It has since been used during the Virginia sonar system technology insertion upgrade to identify system performance is-sues and verify their correction. In the summer of 2012, it will play an important part in the design verification testing of the LWWAA technology refresh project.
Acknowledgment: James McVicker and Paul Karatsinides (Sotera Defense Solutions, Inc.) assisted in the design and fabrication of the electronic and optical subsystems. [Sponsored by NAVSEA]
Reference1 A. Dandridge, A.B. Tveten, and C.K. Kirkendall, “Develop-
ment of the Fiber Optic Wide Aperture Array: From Initial Development to Production,” 2004 NRL Review (Naval Research Laboratory, Washington, DC, 2004), pp. 177–179.
Broadband Supercontinuum Generation
L.B. Shaw, R.R. Gattass, V.Q. Nguyen, P. Pureza, and J.S. SangheraOptical Sciences Division
Introduction: Supercontinuum sources are light sources that generate broadband emission within a spectral region through various nonlinear interactions in optical fiber. While supercontinuum sources based on silica fiber are commercially available spanning from ~0.4 to ~2 µm, emission beyond this wavelength region is limited by significant multiphonon absorption loss in silica. Mid-IR supercontinuum sources operat-

218 2012 NRL REVIEW | optical sciences
ing within the important 2 to 5 µm mid-IR atmospheric transmission band would have many applications in areas of chemical sensing, IR countermeasures, hardware-in-the-loop testing, and free space communi-cations. To generate supercontinuum within the 2 to 5 µm band requires fiber materials with large transparen-cies in this region as well as high nonlinearities. Chalcogenide fiber is based on the chalcogen ele-ments sulfur (S), selenium (Se), and tellurium (Te). Fibers have high transmission in the IR out to ~12 µm depending on composition and low losses (i.e., of less than 1 dB/m). Chalcogenide fibers also have high non-linearities, 100 to 1000 times those of silica. The large mid-IR transmission window coupled with the high in-trinsic material nonlinearities make chalcogenide fibers ideal for supercontinuum generation in the mid-IR.
Supercontinuum Generation Mechanism: Typi-cally, supercontinuum sources operate by pumping near or in the anomalous dispersion region of the non-linear fiber. Pumping near the anomalous dispersion region allows four-wave mixing and soliton dynamics to enhance the efficiency of supercontinuum genera-tion. Typically, microstructured photonic crystal fiber is used in supercontinuum sources as it allows one to tailor the dispersion properties of the fibers to match the pump wavelength of the source. Chalcogenide fiber material zero dispersion point is ~5 µm, and so the use of microstructured fiber structures allows one to shift the dispersion minimum closer to the near-IR, thereby enabling pumping with commercial fiber sources around 1.5 to 2 µm. However, this results in fiber struc-tures with very small core sizes (2 to 3 µm), which can be difficult to fabricate and typically have high intrinsic losses as well as high insertion losses. Power scaling with such small core structures is also problematic, es-pecially with suspended core microstructured fiber, in which the core is effectively thermally isolated from the cladding by an air layer. Consequently, our supercon-tinuum design involves operating in the normal disper-sion region of the chalcogenide fiber. Operating in this region allows standard step index fiber structures to be used, which relaxes the constraints on core size dimen-sions, eases coupling into the fiber, and enables power scaling. The high intrinsic nonlinearity of the chalco-genide fiber material allows efficient supercontinuum generation in the normal dispersion region.
All-Fiber Mid-IR Supercontinuum Source: A high-peak-power pulsed-fiber source operating at 2.5 µm was developed for pumping the chalcogenide fiber to generate mid-IR supercontinuum. Figure 6 shows the pump source, which consists of a commercial erbium (Er) mode-locked fiber laser operating at 1.5 µm with a repetition frequency of 560 kHz. The output of the erbium fiber laser is amplified by an erbium/yt-terbium (Er/Yb) fiber amplifier, Raman shifted to 2 µm, amplified in a thulium (Tm) fiber amplifier, and finally Raman shifted in highly nonlinear fiber to a wavelength of ~2.5 µm. Approximately 700 mW of power at 2.5 µm is obtained at the pump output. The peak power of the fiber pump source is estimated to be greater than 10 kW. The pump source is coupled to a 2 m length of arsenic sulfide (As2S3) fiber made at NRL. The As2S3 glass for the fiber is fabricated from highly purified precursors, leading to a minimum transmission loss of ~0.7 dB/m around 1.5 µm. Broadband mid-IR super-continuum is generated spanning from 1.5 to 5.5 µm. More than 235 mW of power is generated with 10 dB
of spectral flatness from 1.9 to 4.4 µm and 20 dB of spectral flatness from 1.65 to 4.78 µm. Figure 7 shows the spectrum of the generated broadband mid-IR su-percontinuum. These power levels are suitable for many spectroscopic applications, but some applications, such as IR countermeasures, require higher power. For these applications, power scaling of total supercontinuum power can be achieved by increasing the repetition rate of the pump laser source while maintaining the per-pulse peak-power, resulting in an increase in
1547 nm80 ps
560 kHzseed laser
ErAmplifier
ErAmplifier
Er/YbAmplifier
TmAmplifierfil
ter
filte
r
filte
r
200 µW 20 mW200 mW1.55 µm
50 mW2 µm
1.4 W2 µm
700 mW2.4 µm As2S3 Fiber
~10 dB AmplificationRaman Shift to 2 µm
15 dBAmplification
Raman Shift to2.4 µm
HNLF
FIGURE 6Schematic of the supercontinuum source.
FIGURE 7Supercontinuum source spectral output.

219optical sciences | 2012 NRL REVIEW
average power. For example, increasing the repetition rate of the pump laser from 560 kHz to 5.6 MHz while maintaining peak power will allow a tenfold increase in mid-IR average power.
Summary: We have developed an all-fiber broad-band mid-IR supercontinuum source based on chalco-genide fiber. The source exhibits high power and spec-tral flatness over the important 2 to 5 µm atmospheric transmission region. The source is power scalable by increasing the repetition rate and average power of the pump source. [Sponsored by the NRL Base Program (CNR funded)]
222Intense Pulsed Active Detection of Fissile Materials
J.W. Schumer, R.J. Commisso, J.P. Apruzese, R.J. Allen, G. Cooperstein, D.D. Hinshelwood, S.L. Jackson, D. Mosher, D.P. Murphy, P.F. Ottinger, D.G. Phipps, S.B. Swanekamp, B.V. Weber, F.C. Young, and J.C. Zier
224Missile Tracking and Range Safety
D.J. Dowgiallo, S. Rauen, M.A. Davis, W.M. Peters, E.J. Polisensky, E.M. Twarog, and R.W. Harry
Remo
te Se
nsing
A scientist takes current–voltage (I–V) measurements under a triple source AM0 and AM1.5G calibrated solar simulator as part of advanced photovoltaics research. (AM0, or Air Mass Zero, refers to the solar spectrum in space, and AM1.5 to the solar spectrum on Earth.)

222 2012 NRL REVIEW | remote sensing
Intense Pulsed Active Detection of Fissile Materials
J.W. Schumer,1 R.J. Commisso,1 J.P. Apruzese,2
R.J. Allen,1 G. Cooperstein,2 D.D. Hinshelwood,1
S.L. Jackson,1 D. Mosher,2 D.P. Murphy,1 P.F. Ottinger,2 D.G. Phipps,1 S.B. Swanekamp,1 B.V. Weber,1
F.C. Young,2 and J.C. Zier1
1Plasma Physics Division2Engility Corp.
Introduction: Passive and active detection of hid-den fissile material are subjects of intense interest. In active detection, the naturally emitted characteristic radiations associated with radioactive decay are ex-ternally enhanced by inducing fission, thus increasing the strength of these radiations compared with what could be measured passively. One approach to active detection uses the bremsstrahlung produced when an energetic electron beam strikes a high-atomic-number material. Bremsstrahlung photons of energy greater than about 6 mega-electron-volts (MeV) can induce photo-fission in fissionable material, the products of which are detected. Bremsstrahlung-based interrogation using lin-ear accelerators (LINACs) is typically used for active detection, but the LINAC approach requires minutes of exposure to produce a detectable signal above background. The Pulsed Power Physics Branch of NRL’s Plasma Physics Division has pioneered and demonstrated an intense pulsed active detection (or IPAD) approach1–3 using single-pulse, terawatt-level,
pulsed-power technology to achieve an inspection time of a few seconds. We have focused on the use of single intense pulses of bremsstrahlung (x-rays) to induce photo-fission, and have also effectively applied the IPAD approach using both neutrons and characteristic gamma rays generated using energetic ion-beam in-teractions with appropriate targets as the interrogation sources.2
The use of a single, very intense interrogating pulse of either high-energy photons or neutrons has several unique advantages over lower-power systems that repetitively pulse over hundreds of seconds. (1) The short irradiation time leads to a detection time of order seconds (vs minutes for the LINAC-based approach), minimizing the passive background, which is proportional to the detection time.1 Also, the short irradiation time-window (~100 ns) allows for the pos-sibility to measure radiations associated with prompt, short-, and long-lived fission products. (2) Pulsed accelerators driving high-power diodes, when used with a ruggedized commercial off-the-shelf detection system, can rapidly scan moving targets of interest within seconds. (3) Bremsstrahlung can efficiently generate both high-energy photons and neutrons (via photo-neutron processes). This can be useful in scenarios where low- or high-atomic-number shielding is placed around the fissile material. (4) Unique alternative signatures (such as neutron-based activation analyses and delayed-prompt neutron emissions for differentiation of 235U and 238U) may be accessible following a single, intense pulse.
FIGURE 1Top view of the NRL Mercury facility, showing a small sample of the detectors fielded around the depleted ura-nium (DU) plate.

223remote sensing | 2012 NRL REVIEW
(5) Higher signal-to-background and alternative signatures afforded by intense pulsed techniques per-mit tradeoffs between signal and personnel dose (and collateral activation). The systematic study of these tradeoffs for IPAD is one of the main objectives of our work.
Accomplishments: In the past two years, work has focused on using single intense pulses of brems-strahlung as a laboratory test bed. A 50 nanosecond (ns) long, 200 kiloampere (kA), 8 MeV pulse from the NRL Mercury pulsed-power generator produces a pulse of intense bremsstrahlung that induces photo-fission in a 45 kg depleted uranium (DU) plate. The DU plate, located several meters from the bremsstrahlung source, is used as a surrogate for fissile material (see Fig. 1). Exciting experiments with large arrays of vari-ous gamma and neutron detectors have been fielded at Mercury. Fission signatures have been measured and independently validated by collaborating teams of scientists from the NRL Space Science Division, the Atomic Weapons Establishment (UK), the Idaho Accel-erator Center (IAC), the University of Missouri–Kansas City (UMKC), Brookhaven National Laboratory, and Rapiscan Systems of Sunnyvale, California. As shown in Fig. 2, delayed neutron signatures well above background were measured with specially filtered 3He proportional tubes and 6Li-doped scintil-lators within a second or less following a single intense bremsstrahlung pulse. Delayed gammas in the 3 to 7 MeV range from induced fission have been measured using a bismuth germinate oxide (BGO) scintillator and clearly show the presence of the DU plate. Other delayed gamma detectors that have been successfully fielded include a large-area NaI(Tl) array, LaBr(Ce), high-purity germanium, and plastic and liquid scintil-
lators. Prompt neutrons, which are 100 times more abundant and up to 109 times more intense than delayed neutrons, were recorded within 200 ns after the interrogating pulse using a well-shielded, fast-time-response plastic scintillator (see Fig. 3).3 When the DU is present, all these measurements give unambiguously larger signals than both active and passive background, even in the noise environment of a terawatt-level pulsed-power generator. Computational models us-ing a pulsed-power circuit code, a 2D particle-in-cell charged-particle simulation code, and a neutron par-ticle transport code were accurately chained together to reproduce electrical signals, the interrogating radiation, and the detection results, respectively.
Future: The development of an optimized pulsed-power generator with integrated radiation detection system is the eventual goal. Optimization of the brems-strahlung source will lead to smaller pulsed-power gen-erators, deployable collimators, and more manageable personnel shielding. As operational scenarios develop, there could be a need for a repetitively operated pulsed-power generator, requiring serious consideration of available generator architectures, thermal management, size, weight, maintainability, and cost. Detector systems need to integrate fast-gating high-voltage electronics to
FIGURE 3Prompt neutron detection data from a plastic scintillator placed 6 m from the DU, which was 6 m from the Mercury bremsstrahlung source. The signal was apertured by a 15 cm diameter hole in a 2.4 m thick concrete wall (see Fig. 1). The scattered-radiation signals from the bremsstrahlung pulse decay rapidly enough (~150 ns) that the prompt-neutron signal is clearly evident. (TOF = time of flight.)
FIGURE 2The number of delayed neutron counts on the 3He detectors in the first second after the pulse is plotted as a function of distance from the DU; 6Li scintillator detector results are also shown. Comparison of counts with DU vs without DU (or a lead surrogate) shows a clear difference.

224 2012 NRL REVIEW | remote sensing
quickly access the best portion of the fission signature (early time) with detector materials that can recover quickly, have a long life in the harsh radiation environ-ment associated with the generator, and, if possible, be commercially available in large volumes. With an optimized IPAD system, a new tool is available to deci-sion makers, enhancing their ability to prevent a nuclear threat from entering our borders. [Sponsored by ONR Maritime WMD Detection Program, the Defense Threat Reduction Agency (DTRA), and the U.K. Atomic Weapons Establishment through DTRA]
References1 S.B. Swanekamp, J.P. Apruzese, R.J. Commisso, D. Mosher, and
J.W. Schumer, “An Analysis of Intense Pulsed Active Detection (IPAD) for the Detection of Special Nuclear Materials,” IEEE Trans. Nucl. Sci. 58(4), 2047–2053 (2011).
2 S.L. Jackson, R.J. Allen, J.P. Apruzese, R.J. Commisso, D.D. Hin-shelwood, D. Mosher, D.P. Murphy, P.F. Ottinger, J.W. Schumer, S.B. Swanekamp, F.C. Young, G. Cooperstein, A.W. Hunt, H.A. Seipel, and M.A. Gagliardi, “Detectors for Intense, Pulsed Active Detection,” Conference Record, 2010 IEEE Nucl. Sci. Symp., Knox-ville, TN, pp. 516–523 (2010).
3 S.L. Jackson, R.J. Allen, J.P. Apruzese, R.J. Commisso, G. Cooperstein, D.D. Hinshelwood, D. Mosher, J.W. Schumer, S.B. Swanekamp, F.C. Young, J.C. Zier, A.W. Hunt, and E.S. Cardenas, “Detection of Prompt Neutrons from Photo-Fission Induced by a Single, Intense Bremsstrahlung Pulse,” 2011 IEEE Nucl. Sci. Symp., Valencia, Spain.
Missile Tracking and Range Safety
D.J. Dowgiallo,1 S. Rauen,2 M.A. Davis,2 W.M. Peters,1 E.J. Polisensky,1 E.M. Twarog,1 and R.W. Harry3
1 Remote Sensing Division2 Space Systems Development Department3 Spacecraft Engineering Department
Introduction: The tracking of missiles at close range proximity has been an ongoing challenge for many launch environments. The ability to provide ac-curate missile trajectory information is imperative for range safety and early termination of flight. In an effort to provide a potential solution to tracking issues that have plagued many traditional techniques, the Tracking Interferometer Pathfinder System (TIPS) was developed at the Naval Research Laboratory through the joint cooperation of the Space Systems Development Depart-ment’s Advanced Systems Technology and C4I branches and the Remote Sensing Division’s Radio/IR/Optical Sensors and Remote Sensing Physics branches. This partnership provides a unique solution for missile track-ing. In the past, radar and optical techniques have been used for short-range tracking with mixed results. Radar systems have experienced issues with multipathing,
clutter, and range gating. Expended rocket stages con-tribute additional problems in tracking by disguising the primary target. Optical systems have had difficulty with varying cloud cover and nonoptimal viewing conditions. An alternative to the previous methods is a passive interferometer, offering several benefits over other tracking techniques: all-weather operation, con-stant day/night imaging, no moving parts, and no radio frequency emissions.
System Overview: A traditional interferometer is a passive system in which multiple receivers “listen” to a signal at a particular frequency, in this case, at the S-band microwave spectrum. Each receiver uses an antenna that is arranged into an array consisting of many antennas. The arrangement of the antennas in the array affects the resolution and features of how the in-terferometer interprets received signals into a processed image. By varying the positions of antennas in relation to each other (Fig. 4), both constructive and interfering responses are produced. By overlaying interference pat-terns produced by unique antenna pairings, an image can be formed (Fig. 5). The raw images produced can be cleaned by the use of thresholds that filter the data in a noise reduction process. Interferometric techniques make use of sparse arrays by employing multiple antennas to encompass a limited area of a large, equivalent diameter dish an-tenna. Essentially, smaller antennas (7.5 cm in diam-eter) fill in the region of what would be a much larger antenna (3 m diameter in the case of TIPS, which is the largest spacing of antenna pairs). Additional receiver channels will reduce the noise of the imaged scene by providing more antenna pairings that fill in the array, canceling sidelobe noise to provide positive reinforce-ment of the interference patterns. TIPS consists of 16 receiver channels packaged into a single box. Spiral horns are used for their inherently broad beamwidth (60 degrees, half power beamwidth for TIPS), allowing a large field of view. A custom data acquisition system, developed by a vendor for an aircraft-platform interferometer, was leveraged for the analog-to-digital data capture of the 16 channels. In ad-dition to the phase alignment of all channels to a mas-ter reference, an important aspect of the data capture is the time synchronization of the channels for simultane-ous triggering at specific data collection intervals. The data are oversampled at a continuous rate of 200 MHz to minimize target motion in the tracking process. The relatively fast sampling provides a dataset that can then be evaluated for future missions so as to determine the optimal sample rate, thus streamlining data in practice. Typically, interferometers have relied on hardware correlators to process phase and magnitude infor-mation received by the antenna pairs. In the system

225remote sensing | 2012 NRL REVIEW
implemented for tracking purposes, NRL developed a software correlator that uses digital processing tech-niques to rapidly determine phase relationships of the antenna pairs. The software correlator greatly reduces the size, weight, power, and complex tuning that would otherwise be required of a hardware correlator.
Test Deployment: A pathfinder system was requested by the program sponsor with the goal of a field experiment to test the viability and accuracy of the conceived design. The Pacific Missile Range Facility (PMRF), in conjunction with the Kauai Test Facility (KTF), located in Kauai, Hawaii, was chosen as the test site. The test missile to be used included a telemetry transmitter for standard operation. It was recognized in
the design proposal that this internal transmitter would also provide a signal for system keying and allow phase information to be derived. TIPS was designed and built within 6 months at NRL and installed during August 2011 at KTF. The ar-ray was attached to an antenna positioner to allow the boresight of the array to be aligned in a manner that would capture T–0 to T+10 seconds of flight, basically allowing the target to streak across the imaging field of the system (Fig. 6). On August 30, 2011, TIPS tracked a vehicle launched from KTF (Fig. 7). The immediate 10 seconds after launch was the critical window of interest to pro-gram sponsors, as this is the time during which crucial termination protocol measures are implemented. The
FIGURE 4Tracking Interferometer Pathfinder System (TIPS) deployed at the Kauai Test Facility. Inset: A spiral antenna.
FIGURE 5Snapshot of images from August 30, 2011, prior to missile launch. Left, image of telemetry transmitter aboard missile on launch pad with noise reduction applied. Right, raw image of transmitter. Color bar indicates normalized signal intensity values.

226 2012 NRL REVIEW | remote sensing
threshold requirement for a fully developed solution is a total track accuracy of 25 m. The pathfinder sensor was able to achieve tracking accuracies of better than 5 m in T+3 seconds of launch, and better than 25 m across the extended tracking window when compared against best estimate trajectories.
Summary: TIPS successfully demonstrated a mis-sile tracking ability using interferometric techniques. The ability of the interferometer to be unperturbed by factors in the launch environment provides a needed requirement for early missile tracking. The TIPS pathfinder has shown that it can be used as an integral part of a potential range safety program. A follow-on sensor is currently being designed that will extend the accuracy and overall response time for future missions. [Sponsored by the Missile Defense Agency]
FIGURE 6Tiling of the interferometric images to produce a 10-second track.
FIGURE 7The launch platform at KTF shown with a target similar to that used for the TIPS mission.

Simula
tion,
Comp
uting
, and M
odeli
ng228Human Eye Simulation
C.J. Dunay, D.A. Burchick, Sr., and S.A. Moroz
229Towed Antiship Cruise Missile Simulator
M. Michelizzi and C. Maraviglia
An aerospace engineer in the Spacecraft Engineering Department, holds a prototype robotic gripping mechanism in one of the workspaces in the Laboratory for Autonomous Systems Research.
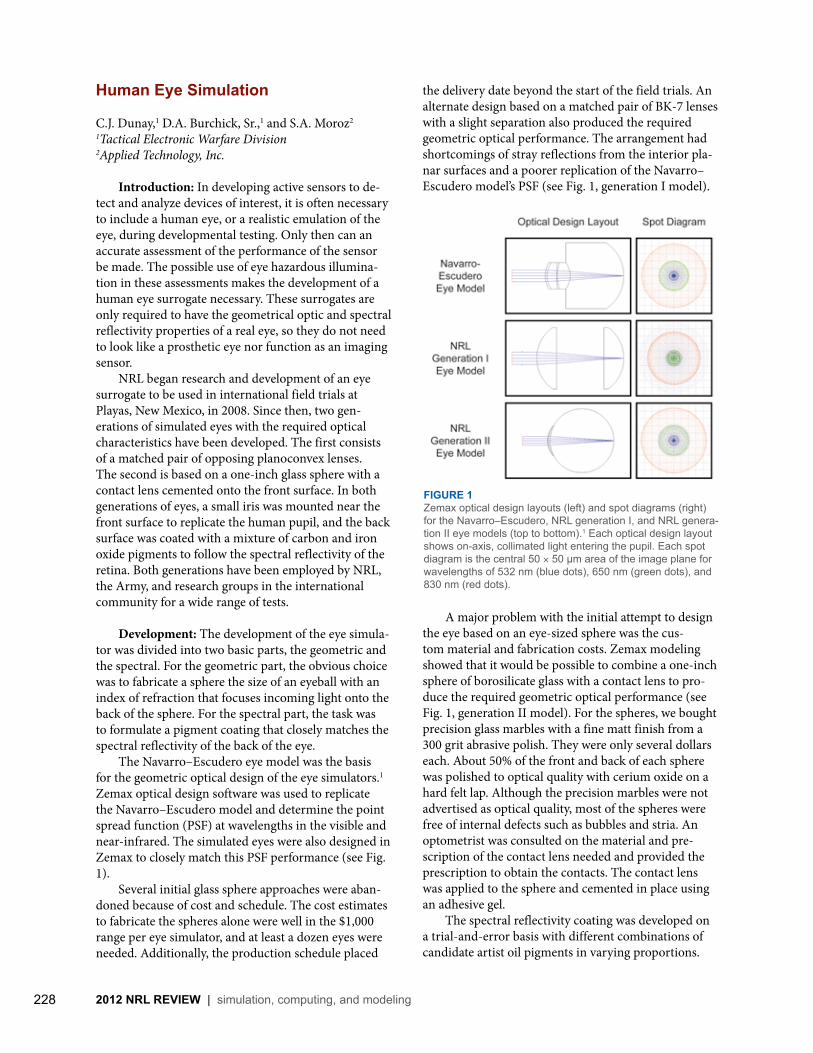
228 2012 NRL REVIEW | simulation, computing, and modeling
Human Eye Simulation
C.J. Dunay,1 D.A. Burchick, Sr.,1 and S.A. Moroz2
1Tactical Electronic Warfare Division 2Applied Technology, Inc.
Introduction: In developing active sensors to de-tect and analyze devices of interest, it is often necessary to include a human eye, or a realistic emulation of the eye, during developmental testing. Only then can an accurate assessment of the performance of the sensor be made. The possible use of eye hazardous illumina-tion in these assessments makes the development of a human eye surrogate necessary. These surrogates are only required to have the geometrical optic and spectral reflectivity properties of a real eye, so they do not need to look like a prosthetic eye nor function as an imaging sensor. NRL began research and development of an eye surrogate to be used in international field trials at Playas, New Mexico, in 2008. Since then, two gen-erations of simulated eyes with the required optical characteristics have been developed. The first consists of a matched pair of opposing planoconvex lenses. The second is based on a one-inch glass sphere with a contact lens cemented onto the front surface. In both generations of eyes, a small iris was mounted near the front surface to replicate the human pupil, and the back surface was coated with a mixture of carbon and iron oxide pigments to follow the spectral reflectivity of the retina. Both generations have been employed by NRL, the Army, and research groups in the international community for a wide range of tests.
Development: The development of the eye simula-tor was divided into two basic parts, the geometric and the spectral. For the geometric part, the obvious choice was to fabricate a sphere the size of an eyeball with an index of refraction that focuses incoming light onto the back of the sphere. For the spectral part, the task was to formulate a pigment coating that closely matches the spectral reflectivity of the back of the eye. The Navarro–Escudero eye model was the basis for the geometric optical design of the eye simulators.1 Zemax optical design software was used to replicate the Navarro–Escudero model and determine the point spread function (PSF) at wavelengths in the visible and near-infrared. The simulated eyes were also designed in Zemax to closely match this PSF performance (see Fig. 1). Several initial glass sphere approaches were aban-doned because of cost and schedule. The cost estimates to fabricate the spheres alone were well in the $1,000 range per eye simulator, and at least a dozen eyes were needed. Additionally, the production schedule placed
the delivery date beyond the start of the field trials. An alternate design based on a matched pair of BK-7 lenses with a slight separation also produced the required geometric optical performance. The arrangement had shortcomings of stray reflections from the interior pla-nar surfaces and a poorer replication of the Navarro–Escudero model’s PSF (see Fig. 1, generation I model).
A major problem with the initial attempt to design the eye based on an eye-sized sphere was the cus-tom material and fabrication costs. Zemax modeling showed that it would be possible to combine a one-inch sphere of borosilicate glass with a contact lens to pro-duce the required geometric optical performance (see Fig. 1, generation II model). For the spheres, we bought precision glass marbles with a fine matt finish from a 300 grit abrasive polish. They were only several dollars each. About 50% of the front and back of each sphere was polished to optical quality with cerium oxide on a hard felt lap. Although the precision marbles were not advertised as optical quality, most of the spheres were free of internal defects such as bubbles and stria. An optometrist was consulted on the material and pre-scription of the contact lens needed and provided the prescription to obtain the contacts. The contact lens was applied to the sphere and cemented in place using an adhesive gel. The spectral reflectivity coating was developed on a trial-and-error basis with different combinations of candidate artist oil pigments in varying proportions.
FIGURE 1Zemax optical design layouts (left) and spot diagrams (right) for the Navarro–Escudero, NRL generation I, and NRL genera-tion II eye models (top to bottom).1 Each optical design layout shows on-axis, collimated light entering the pupil. Each spot diagram is the central 50 × 50 µm area of the image plane for wavelengths of 532 nm (blue dots), 650 nm (green dots), and 830 nm (red dots).

229simulation, computing, and modeling | 2012 NRL REVIEW
Each paint sample was measured using a spectrometer across the visible and near-infrared spectrum. The best match to an average human ocular fundus was found to be a mixture of two-thirds red iron oxide and one-third carbon black (see Fig. 2).2,3 The coating was applied to the back surface of each eye simulator and a miniature iris diaphragm was mounted to the front at a slight angle to reduce stray reflections from the iris leaves (Fig. 3).
Performance Evaluation: Both generations of simulated eyes have been used in development testing in the United States and abroad. They enable a safe and accurate assessment of the ability of an active sensor to detect and analyze devices without a human subject. Norman Comer at the Survivability/Lethality Analysis Directorate of the Army Research Laboratory recently analyzed the NRL simulated eyes and found that they have optical characteristics similar to those of real
FIGURE 2Spectral reflectivity curves for the mixed pigment of 2/3 red iron oxide and 1/3 carbon black (brown curve) and an average ocular fundus (black curve).2,3
FIGURE 3Zemax optical layout and pictures of the NRL generation II simulated eye in a one-inch lens holder mounted on a post.
human eyes. However, the NRL simulated eye pres-ents fewer aberrations than the real human eye. This is probably due to the fact that the ocular fundus has optical depth to it and presents as a semitransparent gel with suspended particles and structure, while the eye simulators have a flat surface without optical depth. Also, the iris leaves, while tilted and anodized to reduce stray reflections, still produce noticeable scatter. Refine-ment of the simulated eye is planned to better match the optical depth and structure of the ocular fundus. [Sponsored by the NRL Base Program (CNR funded)]
References1 I. Escudero-Sanz and R. Navarro, “Off-axis Aberrations of a
Wide-angle Schematic Eye Model,” J. Opt. Soc. Am. A, 16(8), 1881–1891 (1999).
2 F. Delori and K. Pflibsen, “Spectral Reflectance of the Human Ocular Fundus,” Appl. Opt. 28(6), 1061–1077 (1989).
3 R. Flower, D. McLeod, and S. Pitts, “Reflection of Light by Small Areas of the Ocular Fundus,” Invest. Opthalmol. Vis. Sci. 16(10), 981–985 (1977).
Towed Antiship Cruise Missile Simulator
M. Michelizzi and C. MaravigliaTactical Electronic Warfare Division
Introduction: The Fleet operates in an increasingly complex environment with many technological chal-lenges that include a significant threat from antiship cruise missiles (ASCMs). These ASCM threats come in a wide variety of form factors with different strategies to breach ship defenses. Evaluation of antiship mis-sile electronic warfare countermeasure performance relies on the analysis of measurements conducted with ASCM threat simulator systems. For quantifying the ef-fectiveness of the countermeasure and the tactics, these simulators not only need to accurately replicate the potential threat seeker subsystems but also must closely match the flight profile capabilities of the ASCMs. The Naval Research Laboratory has extended its simulation capabilities from flying captive-carry simulators on a relatively slow and high flying P-3 aircraft to adding a capability for testing on a Learjet, which can fly lower and faster. Further extending NRL’s growing simulator tool set for electronic warfare evaluation and assess-ment, NRL has developed an optical sensor–based simulator of a generic ASCM. This simulator can be reeled out and towed by a Learjet for operation down to as low as 25 ft above the water, adding to a fuller understanding of threat behaviors (Fig. 4).

230 2012 NRL REVIEW | simulation, computing, and modeling
Description: The TOWed electro-optic/infrared SIMulator (TOWSIM) was developed through ad-vanced technologies and state-of-the-art fabrication methods (Fig. 5). The simulator makes clever use of a recoverable towed pod that is used for gunnery train-ing. Inside the largely empty towed target body, the NRL team designed and integrated a gimbaled EO/IR sensor that met the flight restrictions for the pod.
Due to the aggressive flight profiles and the risks they present, NRL used rapid prototyping methods to design and build working plastic models of a three-axis gimbal (optical pointing device) that fits inside the pod fuse-lage. Portions of the final design were changed from plastic to machined metal. This provides the required reliability while still allowing for easy replacement in the case of a loss at sea. The installation was designed to be adaptable to multiple simulators and has already been used successfully with two different imagers. The simulator’s embedded processor network pro-vides mode control and data collection. Custom control software on a dedicated compact PC dynamically adjusts both the azimuth and elevation axes to inertially stabilize the sensors during fuselage movements. A
separate roll axis provides for full scene stabilization and enables simulation of multiple threat capabilities. A second PC in the pod compresses the raw data for transmission via Ethernet from the towed simulator pod to the operator station in the Learjet.
Impact: Flight tests with the TOWSIM (Fig. 6) have provided a more accurate simulation of several aspects of threat system capabilities. Since the sen-sor subsystem can be towed at high speed down to 25 ft above the water, the electronic warfare responses properly incorporate the environmental effects of the low-altitude propagation path. The TOWSIM gimbal’s roll axis stabilization keeps the sensor aligned with the horizon in the presence of crosswinds. The scene and mode data collected by the TOWSIM are stored in their entirety for later analysis of the threat processing and countermeasure interactions. With the TOWSIM’s capability to be reeled out to distances significantly separating it from the aircraft, the simulator can be used for testing a wide variety of shipboard countermeasure systems without compro-mising flight crew safety. The separation distance also improves the accuracy of threat signature representa-tion, allowing better examination of the ship’s detection and tracking capabilities. NRL designed the TOWSIM to be modifiable so that different threat sensors can be installed, making it useful for multiple simulations. Changing sensors normally requires a new gimbal mount (readily made with rapid prototyping equipment), wiring changes, and software modifications — all of these parameters are readily accessible for modification. NRL is currently planning to build an additional TOWSIM. [Sponsored by ONR]
FIGURE 4TOWSIM reeled out during October 2010 flight testing.
FIGURE 5Interior layout of TOWSIM.
FIGURE 6TOWSIM held captive before being reeled out from the Learjet during August 2011 flight testing.
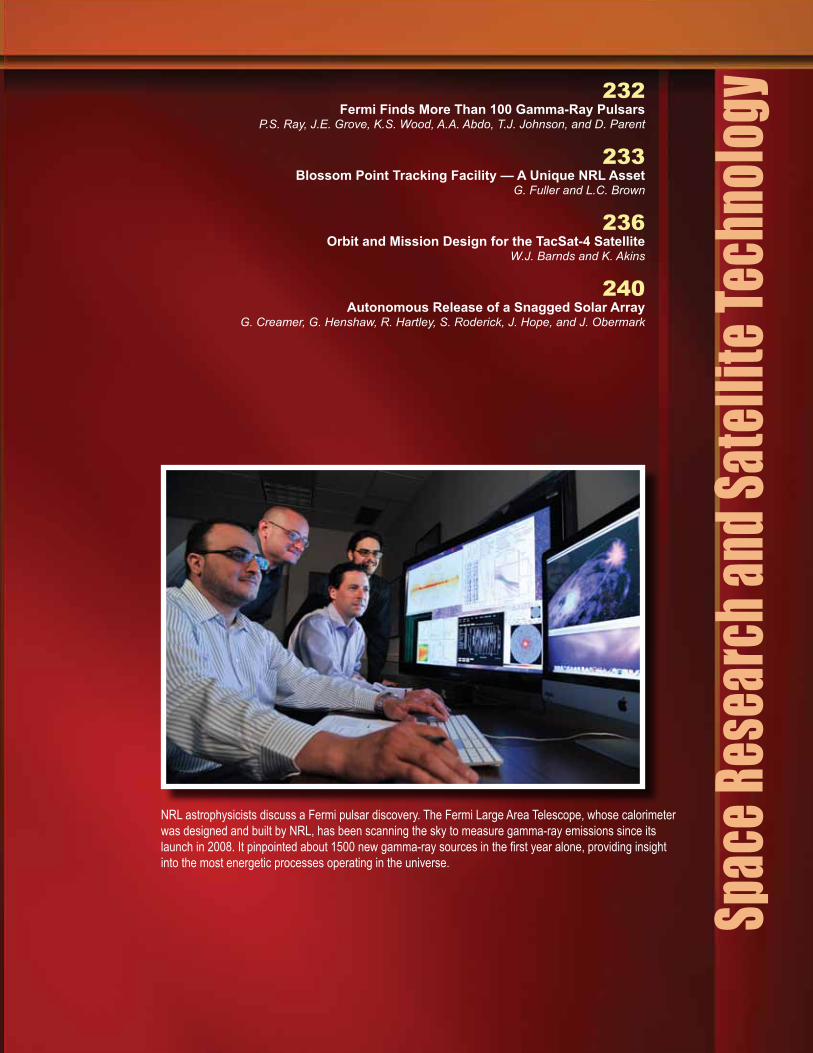
Spac
e Res
earch
and S
atellit
e Tec
hnolo
gy232Fermi Finds More Than 100 Gamma-Ray Pulsars
P.S. Ray, J.E. Grove, K.S. Wood, A.A. Abdo, T.J. Johnson, and D. Parent
233Blossom Point Tracking Facility — A Unique NRL Asset
G. Fuller and L.C. Brown
236Orbit and Mission Design for the TacSat-4 Satellite
W.J. Barnds and K. Akins
240Autonomous Release of a Snagged Solar Array
G. Creamer, G. Henshaw, R. Hartley, S. Roderick, J. Hope, and J. Obermark
NRL astrophysicists discuss a Fermi pulsar discovery. The Fermi Large Area Telescope, whose calorimeterwas designed and built by NRL, has been scanning the sky to measure gamma-ray emissions since itslaunch in 2008. It pinpointed about 1500 new gamma-ray sources in the first year alone, providing insightinto the most energetic processes operating in the universe.

232 2012 NRL REVIEW | space research and satellite technology
Fermi Finds More Than 100 Gamma-Ray Pulsars
P.S. Ray,1 J.E. Grove,1 K.S. Wood,1 A.A. Abdo,2 T.J. Johnson,3 and D. Parent2
1Space Science Division2George Mason University3National Research Council Postdoctoral Research Associate
Pulsars: Neutron stars are the supremely com-pressed remnants of massive stars, left over after supernova explosions. They contain a mass of about 1.5 times that of our Sun in a sphere of diameter approxi-mately equal to the Washington, D.C. Beltway. The conditions of extreme density, gravitational field, and magnetic field cannot be replicated on Earth, so they are superb physics laboratories. They spin with periods ranging from about 10 seconds down to about 1.4 mil-liseconds per rotation, which is faster than a kitchen blender. As they spin, they accelerate particles to high energies and emit beams of radiation, most promi-nently radio waves, and appear to pulse as the beam sweeps across the Earth, much like a lighthouse. Thus the name: pulsar.
Gamma Rays from Pulsars: The last major gamma-ray telescope, the EGRET instrument on NASA’s Compton Gamma-Ray Observatory (which operated from 1991 to 2000) detected gamma-ray pulsations from a total of six young pulsars. Evidently, for the most energetic pulsars, particles accelerated in the magnetospheres could reach high enough energies to emit gamma rays, the most energetic form of light. However, with only these early results, it was unclear exactly where the emission came from or how many pulsars were gamma-ray emitters.
The Fermi Gamma-Ray Space Telescope: In June 2008, Fermi was launched and began surveying the sky in the gamma-ray band. The prime instrument aboard, the Large Area Telescope (LAT), is a gamma-ray telescope vastly more capable than its predecessors. NRL designed and built the LAT calorimeter, which measures the energies of the gamma rays, and both the instrument-level and observatory environmental testing were done at NRL (see Fig. 1). In three years of surveying the gamma-ray sky, the LAT has discovered gamma-ray pulsations from over 116 pulsars using a variety of powerful strategies,1 as we describe below.
Known Radio Pulsars: For pulsars already known in the radio band, the best way to find gamma-ray pulsations is to make use of precise timing observations from ground-based radio telescopes. By collaborating
with radio astronomers around the world, LAT scien-tists were able to detect gamma-ray pulsations from 35 additional young radio pulsars, beyond the six known from EGRET.
Blind Frequency Searches: One important dis-covery using the LAT is that many gamma-ray pulsars are radio quiet, almost certainly because their radio beams are much narrower than the beams of emit-ted gamma rays and thus miss our line of sight. These pulsars can only be found by “blindly” searching for their pulsations directly in the gamma-ray data itself. But the gamma-ray data are exceptionally sparse — the LAT might detect only a handful of photons per day from a typical pulsar. Doing these searches required the development of specialized search algorithms and the application of high-performance computing. But the searches were successful, yielding 35 new pulsars discovered purely via their gamma-ray pulsations (see Fig. 2). While four of these new pulsars have since been detected in the radio band, the rest appear to be truly radio quiet.2
FIGURE 1Photo of the Fermi spacecraft undergoing testing at NRL. The Large Area Telescope is the silver rectangle at the top. The other instruments and spacecraft subsystems are in the lower part.

233space research and satellite technology | 2012 NRL REVIEW
Millisecond Pulsars: The fastest spinning pulsars are those that have been spun up to millisecond periods by the matter falling on them from a companion star in a binary system. These pulsars are nature’s most stable clocks, with pulsation periods that change by only about 1 microsecond in a million years. These millisec-ond pulsars were not known to be gamma-ray emitters before Fermi. Shortly after its launch, the LAT detected pulsations from several known millisecond pulsars; that number has now grown to 40. Perhaps more exciting, a group of radio astronomers, led by NRL, has been searching for new millisecond pulsars by pointing their radio telescopes at unidentified gamma-ray sources discovered during the LAT sky survey. These searches have been spectacularly successful,3 discovering 38 new millisecond pulsars so far. This represents an increase of more than 50% in the number of millisecond pulsars known in our galaxy, many of which are extremely interesting in their own right.
Conclusion: The Fermi LAT, built by an interna-tional collaboration with major contributions from NRL scientists and engineers, has been incredibly successful in its studies of gamma-ray emissions from pulsars. It has increased the number from a small hand-ful of objects to a large population with which impor-tant statistical studies are possible. It has revealed new classes of gamma-ray pulsars that were only suspected previously. Its prowess at pointing out new gamma-ray sources that turn out to be radio millisecond pulsars has yielded more than a half dozen new sources now being used as part of a pulsar timing array with the goal of detecting gravitational waves. Studies of these precise
clocks have potential applications ranging from under-standing the physics of matter at super-nuclear densi-ties, to tests of general relativity, and even autonomous spacecraft navigation. [Sponsored by NASA]
References1 P.S. Ray and P.M. Saz Parkinson, “Pulsar Results with the Fermi
Large Area Telescope,” in High-Energy Emission from Pulsars and their Systems, Proceedings of the First Session of the Sant Cugat Forum on Astrophysics, eds. N. Rea and D.F. Torres (Springer-Verlag, Berlin, 2011), pp. 37–56.
2 P.S. Ray et al., “Precise Gamma-ray Timing and Radio Observa-tions of 17 Fermi Gamma-ray Pulsars,” The Astrophysical Journal Supplement Series 194, 17 (2011).
3 S.M. Ransom et al., “Three Millisecond Pulsars in Fermi LAT Unassociated Bright Sources,” The Astrophysical Journal 727, L16 (2011).
Blossom Point Tracking Facility — A Unique NRL Asset
G. Fuller1 and L.C. Brown2
1 Space/Ground Systems Solutions2 Formerly of the Space Systems Development Department
Introduction: Founded in 1956 as a segment of the first satellite tracking system in the United States, the Blossom Point Tracking Facility (BPTF) has played a sig-nificant role in a number of national space-related suc-cesses. Over the past 50 years, the BPTF has undergone
FIGURE 2Map of the sky in gamma rays with energies above 100 MeV, made with three years of Fermi LAT sky survey data. The map is in galactic coordinates so the center of our galaxy is in the middle and the diffuse emission along the galactic plane is easily seen. The symbols mark the 116 pulsars whose gamma-ray pulsations have been detected with the LAT. The cyan crosses are the previously known gamma-ray pulsars. The green circles and white squares are young pulsars found based on radio tim-ing, or blind searches, respectively. The red diamonds are millisecond pulsars.

234 2012 NRL REVIEW | space research and satellite technology
a series of evolutions that have culminated in it becom-ing a state-of-the-art command and control facility, capable of supporting launch through end-of-mission-life operations. The foundation for this broad range of capabilities is the NRL-developed, government-owned, nonproprietary, Neptune Common Ground Architec-ture (CGA) software system, which has contributed to the successful launch and mission operations of more than 25 satellite systems that comprise more than 80 different spacecraft (see Fig. 3).
Initially developed to support an existing ma-jor program, the capabilities of CGA have matured to include spacecraft support through all phases of program life — system development, ground system and spacecraft integration and test, launch and early-orbit checkout, mission and payload operations, and ultimately, spacecraft decommissioning. This broad range of capabilities is implemented as a layered archi-tecture in CGA, which has been developed to maximize scalability, minimize future development, and provide highly efficient ground control and spacecraft opera-tions. Modular Architecture Reduces Development Costs: This work began in the 1980s, with the core of the software built as generic command and control (C2) code. Such code is mostly used to manage produc-tion machinery in factories and can be found in most supervisory control and data acquisition (SCADA) systems, such as are used in the management of most utility control stations. The software core comprises three layers (see Fig. 4):•Infrastructure — managing process monitoring and
control, symbol processing, data distribution, and message passing.
•Services — managing the scripting language, telem-etry, data analysis, logging, recording, command-ing, and memory processing.
•Human–Computer Interface (HCI) — managing text and graphics, system status, hierarchy, and tracking trends.
Most notable about this core is that nothing in it is spe-cific to satellites, ground stations, or any other specific application. It is pure, generic C2. At the next layer, applications are added to deal with the specifics of handling ground station equip-ment, test equipment, and satellite equipment and data itself. This follows a modular approach, which enables the addition of new spacecraft, new ground equip-ment, or new integration and test equipment, without the need for extensive software development. There is enough commonality that even when a new applica-tion needs to be written, much of it can reuse existing design and software. Through this modular approach and commonality, BPTF realizes a 95% software reuse rate for new programs, as measured in software lines of code (SLOC).
Automation of Spacecraft Operations: In 2006, under the direction of the program sponsor, the Auto-mated Ground Operations software (AGO) was added to the CGA system. AGO, also known as Lights Out, uses the core and applications within the CGA system to effectively determine the state of the spacecraft, ground system hardware and software, and the envi-ronment tasks to be performed. AGO then uses this information to schedule future operations and tasking (see Fig. 5). The operations include correcting anoma-lies on the spacecraft and ground systems, re-allocating and rerouting ground processing, and notifying the appropriate engineers via text message or email when necessary. This eliminates the need for operators to man consoles 24 hours a day, 7 days a week, realizing a significant cost savings to sponsor programs. AGO uses simple rules and hierarchical databases to ascertain that equipment is operating as planned. The hierarchical databases are used to generate infor-mation about the spacecraft and ground system from the raw data collected. These databases effectively determine if everything is within predefined limits. If an out-of-spec condition is detected, AGO follows the procedures described in the database for each known or previously unseen anomaly. The remedy can be as simple as ignoring the condition to as complex as “safing” the spacecraft and notifying the engineers of a catastrophic condition. The procedures executed in response to these conditions are identical to the procedures previously executed by the human operators when they were charged with monitoring the spacecraft and ground systems’ health. The procedures executed were written by the requisite engineers and have been fully tested in the CGA environment. The AGO software does not
FIGURE 3Blossom Point satellite tracking facility today.

235space research and satellite technology | 2012 NRL REVIEW
make any specific determination about what to do in response to an anomaly; it just identifies the conditions and executes the proper procedure in response. This is exactly what operators were trained to do. This approach is possible because the CGA system has access to, and controls all aspects of, the ground system from pass scheduling to dynamic resource planning, allocation, and configuration, to pass plan execution. All aspects of the hardware and software are reconfigurable by the system. The system has been engineered such that no manual patch panels, switches, or human input are required. This allows the software to dynamically reconfigure and replan tasks in response to changing conditions.
FIGURE 4CGA’s layered software architecture is a key enabler of the scalability and high software reuse rate achieved at NRL’s Blossom Point Tracking Facility.
FIGURE 5CGA display of the top level status of all spacecraft and ground systems.
NRL’s AGO system has resulted in major cost savings for Blossom Point. Staff positions have been reduced from 28 operators to 4 spacecraft engineers. Currently, no operator positions are staffed at BPTF. All contacts are performed by the AGO software. In addi-tion, the software is better suited to perform the more mundane tasks of satellite monitoring. It never gets bored, takes a break, or comes to a different conclusion based on the same set of facts. CGA and AGO continue to evolve. NRL is current-ly under contract to deploy this technology to the Air Force Research Laboratory at Kirtland AFB, Albuquer-que, New Mexico, to support a new satellite program being launched in early 2013. Under another current

236 2012 NRL REVIEW | space research and satellite technology
initiative, the system is also being deployed to several universities across the United States for the operation of CubeSat Colony 2 satellites. To date, AGO has support-ed more than 20 spacecraft on orbit, taken over 400,000 satellite contacts, and saved more than 125 man-years of effort. Work performed under NRL contract. [Sponsored by the NRL Base Program (CNR funded)]
Orbit and Mission Design for the TacSat-4 Satellite
W.J. Barnds and K. AkinsSpacecraft Engineering Department
Introduction: On September 27, 2011, at 15:49z (11:49 EDT), the Tactical Satellite-4 (TacSat-4) space-craft successfully lifted off from the launch pad at Alas-ka’s Kodiak Launch Complex en route to high-elliptical Earth orbit. TacSat-4 provides 10 ultra-high-frequency (UHF) channels usable for multiple permutations of communications, data exfiltration, and Blue Force tracking. The unique mission orbit augments geosyn-chronous communications by allowing near-global, albeit noncontinuous, coverage, especially at the high northern latitudes. Key to demonstrating improved access to space was establishing the capability to rapidly deploy the satellite in orbit, activate key onboard sys-tems, and deploy the main payload’s antenna reflector dish within a 3-day period so that the mission could continue into engineering evaluation and checkout (EE&C) in preparation for transition to user demon-strations within 7 days of launch.
The launch itself represented the culmination of an extensive astrodynamics effort undertaken by the Naval Research Laboratory to first identify the optimal mission orbit (see Fig. 6), then to implement a scheme to achieve that orbit as rapidly as practical, and lastly to maintain that orbit flexibly to maximize operational life while ensuring compliance with deorbit requirements. To satisfy these mission imperatives, NRL developed (1) a launch day maneuver plan that used a set of “blind” maneuvers to rapidly raise perigee altitude while efficiently expending available propellants, and (2) an orbit evolution plan minimizing propellant ex-penditures, guaranteeing successful deorbit of the space vehicle (SV) within 25 years of launch, and allowing the greatest flexibility for extended operations. The most challenging phase of the first 3 days was the 3-hour period directly following launch (Fig. 7). Further, under worst-case assumptions, a potential existed for the most critical spacecraft activities to be further compressed into a 30-minute window. Essential activities during this period included validating proper execution of the automated activation sequence (via stored onboard commands); initial subsystem check-outs; deployment of the solar arrays prior to battery depletion; validation of thruster orientation; and execu-tion of a perigee-raising maneuver at the first apogee passage. This last activity, one of the most crucial, had to await completion of the others. Maneuvering Into Orbit: The earliest possible start time for the first maneuver was effectively at the same time as the optimal start for that maneuver (after the checkout burn; see Fig. 7). Moreover, the processing timeline for performing an orbit determination to fix the actual insertion orbit would not support a maneu-
FIGURE 6TacSat-4 daily coverage.

237space research and satellite technology | 2012 NRL REVIEW
ver until approximately 40 minutes after the start time for the optimal burn. To avoid this later limitation, an analysis was performed to assess the use of a priori in-sertion orbit accuracy (from the Minotaur-4+ booster) for maneuver planning efficiency. Booster-estimated er-rors are typically substantially worse than the accuracy achieved after processing on-orbit data, but in this case, the booster predict was sufficiently accurate to allow maneuver planning “in the blind.” Using the expected insertion covariance of the booster, it was determined that the first two perigee-raising maneuvers (on the first and second apogee transits) could be performed efficiently without any need for orbit determination to refine knowledge of the insertion orbit.These two maneuvers would nominally be centered on apogee, to raise perigee altitude optimally from an initial 185 km to 350 km and 500 km altitudes. The maneuver inefficiencies associated with off-nominal insertion would incur less than a 5% propellant penalty, which was acceptable under mission rules. A third perigee-raising maneuver and an apogee-correction maneuver completed the initial orbit transfer plan and placed the SV in the proper orbit to proceed with deployment activities.
Orbit Maintenance: The TacSat-4 orbit mainte-nance strategy was comparatively straightforward (see Fig. 8). To avoid degradation of the germanium coating on the main reflector, the satellite needed to maintain a 600 km minimum operating altitude. To optimize cov-erage for several candidate user groups, a fixed ground track was required with longitude of the ascending node (LAN) at 12 deg east longitude. Although the desired ground track was not at a stable point, applying a small altitude bias created a drifting ground track that closely approximated the desired track with LAN fixed in a range from 9.3 to 15.8 deg east. The altitude was initially biased low to cause the ground track to drift eastward until natural orbit pumping caused a west-ward drift back to the initial longitude. At that point, the orbit was adjusted higher to restart the eastward drift. These annual maintenance maneuvers can be seen in Fig. 8 as the sudden changes in perigee altitude 1 and 2 years into the mission; there are larger decreases in apogee altitude, but the trend is more difficult to discern given the scale. The nature of TacSat-4’s deorbit plan can also be seen in Fig. 8. The orbit inclination is initially at 63.6 deg (above the ideal critical inclination of 63.4 deg shown as the green dashed line) and decreases due to
FIGURE 7Revolution One operations plan: activities in the first 3 hours of orbit. LV Sep = launch vehicle sepa-ration, AD = attitude determination, SA = solar array, AOS = acquisition of signal, OL = open loop, RC-AJ = rate control with attitude jets, RC-RW = rate control with reaction wheels, ISP = inertial sun pointing, SA C/O = solar array checkout, LOS = loss of signal. REEF, LION, POGO, and HULA are stations in the Air Force Satellite Control Network.

238 2012 NRL REVIEW | space research and satellite technology
higher-order gravitational effects. The initial inclina-tion offset drives a decrease in the argument of peri-gee, reducing it from its initial value of 210 deg to 205 deg. Once the inclination moves below 63.4 deg, the argument of perigee begins to rotate in the opposite direction, increasing back to 210 deg approximately 5.5 years after launch. The main benefit of starting with the biased inclination is that the observed lunar-driven decrease in perigee altitude for critically inclined orbits drives perigee altitude decay for a much longer period of time (compared with starting at the nominal critical inclination). The extended period of perigee-decay reduces the amount of propellant required to achieve the requirement to deorbit within twenty-five years of the end of operations.
Deorbit Replanning: In March 2009, analysis of the predicted post-mission decay of TacSat-4’s orbit indicated that TacSat-4 would naturally deorbit in 11 to 23 years. Subsequent to that analysis (May 2009), the NASA Marshall Space Flight Center issued a substan-tial downward revision to their solar activity forecasts for Solar Cycles 24 and 25, which increased predicted orbit lifetime to 20 to 200 years. During January 2011, the predicted intensity for Solar Cycle 24 continued to drop, exhibiting 50% lower sunspot activity than predicted in May 2009. While NASA-Marshall noted in 20111 that “no generally accepted physical solar model is available to accurately predict future solar activity” and did not is-sue explicit guidance for Solar Cycle 26 (then antici-
FIGURE 8TacSat-4 orbit evolution and maintenance, 2011–2021.
FIGURE 9Changes in NOAA solar activity predictions.

239space research and satellite technology | 2012 NRL REVIEW
pated to peak around 2022), their published predic-tions extended through 2030 (as opposed to the data available in March 2009, which only extended through 2023). NASA-Marshall supported this extension by noting that the most recent solar cycle is generally a good indicator of the level of activity to be expected for the next solar cycle (Fig. 9). Although we note that this guidance failed for the transition from Solar Cycle 24 to 25, this guidance represented the most reasonable course of action for Solar Cycle 26 predictions. To achieve deorbit within the required 25-year time frame, the TacSat-4 team changed its approach to achieving and maintaining the mission orbit and achieving reentry. Based on consideration of the long-term dynamics of TacSat-4’s post-mission orbit, the delayed launch date, and solar activity uncertainties post-2022, the TacSat-4 mission operations manager incorporated an end-of-mission perigee-lowering maneuver into the baseline mission plan. Under the current concept of operations, after the third year of
operations, the SV will execute a maneuver to lower perigee below 435 km altitude and command the SV to rotate its solar arrays to a posture designed to maximize the average area-to-mass ratio. Reentry is expected to occur within 7 years of this maneuver.
Multiple Satellite Constellations: NRL’s astro-dynamics effort has extended to exploring options for multiple-satellite constellations, one of which is shown in Fig. 10. Using a combination of surrogate, genetic, and gradient search algorithms, NRL optimized a four-satellite constellation design to minimize average revisit
FIGURE 10Four-satellite constellation.
FIGURE 11Four-satellite constellation coverage.
time for northern latitudes. The constellation is capable of delivering near-continuous coverage for users north of 62 deg latitude (Fig. 11). [Sponsored by ONR] Reference1 R.J. Suggs, H.C. Euler, Jr., and S.W. Smith, “Future Solar Activity Estimates for Use in Prediction of Space Environmental Effects on Spacecraft Oribital Lifetime and Performance,” National Aeronautics and Space Administration, Marshall Space Flight Center, Huntsville, AL, Jan. 2011. Monthly report available at http://sail.msfc.nasa.gov/.

240 2012 NRL REVIEW | space research and satellite technology
Autonomous Release of a Snagged Solar Array
G. Creamer,1 G. Henshaw,1 R. Hartley,2 S. Roderick,3
J. Hope,3 and J. Obermark4
1Spacecraft Engineering Department2Information Technology Division3PTR Group4DCS Corporation
Introduction: Many of satellite failures have been documented over the years,1 some classes of which could potentially have been serviced if an existing servicing infrastructure were in place. An example of a possible servicing mission is the release of a snagged solar array or antenna. Though rare in occurrence, arrays do get snagged, due likely to jammed spring release mechanisms or blockage from shifted thermal blankets, which may occur as a consequence of the high loads imparted during launch. Just recently, a C-band antenna failed to deploy on the Intelsat New Dawn satellite and a solar array failed to deploy on the Telstar 14R satellite. A concept for autonomous release of a snagged solar array has been developed in the Naval Center for Space Technology using a two-armed robotic servicing spacecraft and a variety of navigation and imaging sen-sors. A description of the technologies, hardware suite, and laboratory validation results is presented here.
Terminal Concept of Operations: The terminal concept of operations (CONOPS) begins with the assumption that the servicer spacecraft has achieved close-proximity rendezvous with the target spacecraft to within tens of meters. The CONOPS is divided into three phases: terminal approach, servicer preparation, and array release. During the terminal approach phase, the servicer follows a commanded approach path to-wards the target based on relative position and orienta-tion measurements from its navigation sensor. Transi-tion to the servicer preparation phase occurs once the target spacecraft range approaches the workspace of the servicer robot arms. During this phase, the servicer is maneuvered into a station-keeping capture box near the mounting location of the snagged solar array, and the two arms are positioned in preparation for array release. Lastly, after the arms are appropriately posed, the array release phase commences using localized machine vision to perform the final servicing task.
Localized Machine Vision: For the vast major-ity of satellites with large arrays stowed during launch, there is a small gap of a few centimeters between the edge of the folded array and the main bus structure. The goal of the machine vision logic is to identify the gap using a camera mounted to one of the arms (the imaging arm), and subsequently guide a fiducially marked tool mounted to the other arm (the servic-ing arm) inside the gap, wherein a separation force is imparted to release the array. To accomplish this
FIGURE 12Typical local scene images obtained during array release.

241space research and satellite technology | 2012 NRL REVIEW
task, a background image of the gap and the fiducial tool is first acquired from the camera. The servicing arm then illuminates a 45 deg laser line across the gap and a second image is acquired. The two images are differenced to highlight the laser line, and its broken edges are identified using an edge detection algorithm. Additionally, the top edge of the fiducial tool is detected from the raw background image, and a line defining that edge is extended towards the target to identify the location of the tool relative to the gap. The imaging arm then guides the servicing arm tool inside the gap to perform the array release. Typical camera and pro-cessed images corresponding to each of these steps are shown in Fig. 12.
Laboratory Validation Tests: NRL’s Proximity Operations Testbed was used to validate the CONOPS and array release concept described above. This facility consists of two industrial-sized 6-degree-of-freedom robotic platforms operating in a workspace of approxi-mately 25 × 10 × 3 meters, and is capable of computer-ized emulation of realistic close-proximity spacecraft motion including relative orbital dynamics, attitude dynamics, and control. The target platform represents an approximate full-scale mock-up of the back end
FIGURE 13Integrated servicer platform (top) and target platform (bottom).
of a typical geostationary satellite, including a launch vehicle upper stage marman ring and an apogee kick motor nozzle. Attached to the edge of the target is a simulated snagged array, with Velcro strips holding the array against the target edge and a pneumatic cylinder providing spring release. The servicer platform consists of an imaging arm, a servicing arm, a scanning laser navigation sensor, and end effector hardware including a camera, line laser, release tool, and LED illuminators. Figure 13 shows each platform in its final integrated configuration. A series of tests was conducted to demonstrate the performance of the array release concept. Each test consisted of autonomous implementation of the three CONOPS phases, beginning with terminal approach and ending with array release. These phases are de-picted in the series of photographs in Fig. 14, obtained during a typical test.
Conclusions: A geosynchronous servicer with a general set of tools and sensors could offer servicing capabilities for every high-value asset, with the poten-tial to save years of critical operational life. This novel work has demonstrated the challenges and promise of a class of on-orbit servicing, the autonomous release of a snagged array. [Sponsored by the NRL Base Program (CNR funded)]
Reference1 D.M. Harland and R.D. Lorenz, Space Systems Failures: Disasters
and Rescues of Satellites, Rockets, and Space Probes (Praxis Pub-lishing Ltd., Chichester, UK, 2005).
FIGURE 14Progression of the concept of operations phases in NRL’s Proximity Operations Testbed.

Progra
ms fo
r Prof
essio
nal D
evelo
pmen
t264Programs for NRL Employees — Graduate Programs, Continuing Education, Professional
Development, Equal Employment Opportunity (EEO) Programs, and Other Activities
266Programs for Non-NRL Employees — Postdoctoral Research Associateships, Faculty
Member Programs, Professional Appointments, and Student Programs
268Employment Opportunities
A program manager for the TacSat-4 satellite stands next to the spacecraft at the Alaska AerospaceKodiak Launch complex, Alaska. TacSat-4 was launched September 2011 aboard an Orbital SciencesMinotaur-IV launch vehicle into a highly elliptical orbit (HEO) with an apogee of 12,050 km..

264 2012 NRL REVIEW | programs for professional development
PRogRams foR NRL EmPLoyEEs
The Human Resources Office supports and provides traditional and alternative methods of training for employees. NRL employees are encouraged to develop their skills and enhance their job performance so they can meet the future needs of NRL and achieve their own goals for growth.
One common study procedure is for em ployees to work full time at the Laboratory while taking jobrelated courses at universities and schools local to their job site. The training ranges from a single course to undergraduate, graduate, and postgraduate course work. Tuition for training is paid by NRL. The formal pro grams offered by NRL are described here.
GRADUATE PROGRAMS
The Advanced Graduate Re search Program (formerly the Sabbati cal Study Program, which began in 1964) enables selected profes sion al employees to devote full time to re search or pursue work in their own or a related field for up to one year at an institution or research facility of their choice without the loss of regular sal ary, leave, or fringe bene fits. NRL pays all travel and moving expenses for the em ployee. Criteria for eligi bili ty include professional stature consistent with the applicant’s opportunities and experi ence, a satis factory program of study, and ac ceptance by the facility selected by the appli cant. The pro gram is open to em ploy ees who have completed six years of feder al ser vice, four of which have been at NRL.
The Edison Memorial Graduate Train ing Pro-gram enables employees to pursue graduate studies in their fields at local universi ties. Par tici pants in this program work 24 hours each workweek and pursue their studies during the other 16 hours. The criteria for eligibility in clude a minimum of one year of service at NRL, a bachelor’s or master’s degree in an appropriate field, and professional standing in keeping with the candi date’s opportunities and expe ri ence.
To be eligible for the Select Graduate Training Pro gram, employ ees must have a bachelor’s degree in an appropri ate field and must have demon strated ability and aptitude for ad van ced training. Students accepted into this pro gram receive onehalf of their salary and benefits and NRL pays for tuition and travel expenses.
The Naval Postgrad uate School (NPS), lo cated in Monterey, Califor nia, pro vides gradu ate pro grams to en hance the techni cal prepara tion of Naval officers and civil ian em ployees who serve the Navy in the fields of science, engi neer ing, opera tions analy sis, and manage ment. NRL employees desiring to pursue grad uate studies at NPS may apply; thesis work is
ac complished at NRL. Participants con tinue to receive full pay and bene fits during the period of study. NRL also pays for tuition and travel expenses.
In addition to NRL and university offer ings, application may be made to a number of note worthy programs and fellowships. Exam ples of such opportu nities are the Capitol Hill Workshops, the Legislative Fellowship (LEGIS) program, the Federal Executive Institute (FEI), and the Executive Leader ship Pro gram for Mid-Level Employees. These and other pro grams are announced from time to time, as schedules are published.
CONTINUING EDUCATION
Under graduate and graduate courses offered at local colleges and universities may be subsidized by NRL for em ploy ees interest ed in improving their skills and keep ing abreast of current devel op ments in their fields.
NRL offers short courses to all employees in a number of fields of inter est including administrative subjects, and su pervisory and manage ment tech niques. Labora tory em ploy ees may also at tend these courses at non gov ern ment facili ties.
For fur ther infor ma tion on any of the above Graduate and Continuing Education programs, contact the Workforce Development and Management Branch (Code 1840) at (202) 4048314 or via email at [email protected].
The Scientist-to-Sea Program (STSP) pro vides opportunities for Navy R&D labo ratory/center personnel to go to sea to gain firsthand insight into operational factors affecting system design, performance, and operations on a variety of ships. NRL is a participant of this Office of Naval Research (ONR) program. Contact (202) 7677627.
PROFESSIONAL DEVELOPMENT
NRL has several programs, profes sional soci ety chapters, and informal clubs that en hance the professional growth of employees. Some of these are listed below.
The Counseling & Referral Service (C/RS) helps employees improve job performance through counseling designed to resolve problems that may adversely affect job performance. Such problems may include family or workrelated stress, relationship difficulties, or behavioral, emotional, or substance abuse problems. C/RS provides confidential assessment, shortterm counseling, training workshops, and referral to additional resources in the community. Contact (202) 7676857.

programs for professional development | 2012 NRL REVIEW 265
The NRL Women in Science and Engineering (WISE) Network was formed in 1997 through the merger of the NRL chapter of WISE and the Women in Science and Technology Network. Luncheon meetings and seminars are held to discuss scientific research areas, career opportunities, and careerbuilding strategies. The group also sponsors projects to promote the professional success of the NRL S&T community and improve the NRL working environment. Membership is open to all S&T professionals. Contact (202) 4044389.
Sigma Xi, The Scientific Research Society, encourages and acknowledges original investigation in pure and applied science. It is an honor society for research scientists. Individuals who have demonstrated the ability to perform original research are elected to membership in local chapters. The NRL Edison Chapter, comprising approximately 200 members, recognizes original research by presenting annual awards in pure and applied science to two outstanding NRL staff members per year. In addition, an award seeking to reward rising stars at NRL is presented annually through the Young Investigator Award. The chapter also sponsors several lectures per year at NRL on a wide range of topics of general interest to the scientific and DoD community. These lectures are delivered by scientists from all over the world. The highlight of the Sigma Xi Lecture Series is the Edison Memorial Lecture, which traditionally is given by a internationally distinguished scientist. Contact (202) 7672007.
The NRL Mentor Program was estab lished to provide an innovative approach to profes sional and career training and an environ ment for per sonal and professional growth. It is open to per manent NRL employees in all job series and at all sites. Mentees are matched with successful, experienced colleagues having more technical and/or managerial experience who can provide them with the knowledge and skills needed to maximize their contribution to the success of their immediate organization, to NRL, to the Navy, and to their chosen career fields. The ulti mate goal of the program is to increase job pro ductivity, creativity, and satis faction through bet ter communication, understanding, and train ing. NRL Instruction 12400.1B pro vides policy and proce dures for the pro gram. For more information, please contact [email protected] or (202) 7676736.
Employees interested in develop ing effec tive selfexpression, listening, thinking, and lead er ship potential are invited to join the Forum Club, a chapter of Toast-masters Interna tion al. Members of this club pos sess di verse career backgrounds and talents and to learn to com muni cate not by rules but by practice in an atmosphere of understanding and helpful fellow ship. NRL’s Com manding Officer and Di rec tor of Re search en dorse Toastmasters. Contact (202) 4044670.
EQUAL EMPLOYMENT OPPORTUNITY (EEO)PRO GRAMS
Equal employ ment opportunity (EEO) is a fundamen tal NRL policy for all employees regard less of race, color, national origin, sex, religion, age, sexual orientation, or disability. The NRL EEO Office is a service organization whose major functions include counseling employees in an effort to resolve employee/management conflicts, processing formal discrimination complaints, providing EEO training, and managing NRL’s affirmative employment recruitment program. The NRL EEO Office is also responsible for sponsoring specialemphasis programs to promote awareness and increase sensitivity and appreciation of the issues or the history relating to females, individuals with disabilities, and minorities. Contact the NRL Deputy EEO Officer at (202) 7672486 for additional information on any of their programs or services.
OTHER ACTIVITIES
The awardwinning Community Outreach Program directed by the NRL Public Affairs Office fosters programs that benefit students and other community citizens. Volunteer employees assist with and judge science fairs, give lectures, provide science demonstrations and student tours of NRL, and serve as tutors, mentors, coaches, and classroom resource teachers. The program sponsors student tours of NRL and an annual holiday party for neighborhood children in December. Through the program, NRL has active partnerships with three District of Columbia public schools. Con tact (202) 7672541.
Other programs that enhance the develop ment of NRL employ ees in clude sports groups and the Amateur Radio Club. The NRL Fitness Center at NRLDC, managed by Naval Support Activity Washington Morale, Welfare and Recreation (NSAWMWR), houses a fitness room with treadmills, bikes, ellipticals, step mills, and a full strength circuit; a gymnasium for basketball, volleyball, and other activities; and full locker rooms. The Fitness Center is free to NRL employees and contractors. NRL employees are also eligible to participate in all NSAWMWR activities held on Joint Base Anacostia–Bolling and Washington Navy Yard, less than five miles away. The NRL Show boaters Theatre, organized in 1974, is “in the dark.” Visit www.nrl.navy.mil/showboaters/Past_Productions.php for pictures from past productions such as Annie Get Your Gun, Gigi, and Hello Dolly. Contact (202) 4044998 for Play Reader’s meetings at NRL.

266 2012 NRL REVIEW | programs for professional development
Several programs have been estab lished for nonNRL professionals. These programs encour age and support the participation of visiting scientists and engineers in research of interest to the Labo ratory. Some of the programs may serve as step pingstones to feder al careers in sci ence and technology. Their objective is to en hance the quality of the Labor atory’s research activities through working associations and interchanges with high ly capa ble scien tists and engineers and to provide opportunities for out side scientists and engineers to work in the Navy labora tory environ ment. Along with en hanc ing the Laboratory’s research, these programs acquaint participants with Navy capabili ties and concerns and may provide a path to fulltime employment.
POSTDOCTORAL RESEARCH ASSOCIATESHIPS
Every year, NRL hosts several postdoctoral research associates through the National Research Council (NRC) and American Society for Engineering Education (ASEE) postdoctoral associateship and fellowship programs. These competitive positions provide postdoctoral scientists and engineers the opportunity to pursue research at NRL in collaboration with NRL scientists and engineers. Research associates are guest investigators, not employees of NRL. NRL/NRC Cooperative Research Associateship Program: The National Research Council conducts a national competition to recommend and make awards to outstanding scientists and engineers at recent postdoctoral levels for tenure as guest researchers at participating laboratories. The objectives of the NRC program are (1) to provide postdoctoral scientists and engineers of unusual promise and ability opportunities for research on problems, largely of their own choice, that are compatible with the interests of the sponsoring laboratories and (2) to contribute thereby to the overall efforts of the federal laboratories. The program provides an opportunity for concentrated research in association with selected members of the permanent professional laboratory staff, often as a climax to formal career preparation. NRL/NRC Postdoctoral Associateships are awarded to persons who have held a doctorate less than five years at the time of application and are made initially for one year, renewable for a second and possible third year. Information and applications may be found at http://www.nationalacademies.org/rap. To contact NRL’s program coordinator, call (202) 4047450 or email [email protected].
PRogRams foR NoN-NRL EmPLoyEEs
NRL/ASEE Postdoctoral Fellowship Program: The ASEE program is designed to significantly increase the involvement of creative and highly trained scientists and engineers from academia and industry in scientific and technical areas of interest and relevance to the Navy. Fellowship awards are based upon the technical quality and relevance of the proposed research, recommendations by the Navy laboratory, academic qualifications, reference reports, and availability of funds. NRL/ASEE Fellowship awards are made to persons who have held a doctorate for less than seven years at the time of application and are made for one year, renewable for a second and possible third year. Information and applications may be found at http://www.asee.org/nrl/. To contact NRL’s program coordinator, call (202) 4047450 or email [email protected].
FACULTY MEMBER PROGRAMS
The Office of Naval Research Summer Faculty Research and Sabbatical Leave Program provides for university faculty members to work for ten weeks (or longer, for those eligible for sabbatical leave) with professional peers in participating Navy laboratories on research of mutual interest. Applicants must hold a teaching or research position at a U.S. college or university. Contact NRL’s program coordinator at [email protected]. The NRL/United States Naval Academy Coop-erative Program for Scientific Interchange allows faculty members of the U.S. Naval Academy to participate in NRL research. This collaboration benefits the Academy by providing the opportunity for USNA faculty members to work on research of a more practical or applied nature. In turn, NRL’s research program is strengthened by the available scientific and engineering expertise of the USNA faculty. Contact NRL’s program coordinator at [email protected].
PROFESSIONAL APPOINTMENTS
Faculty Member Appoint ments use the special skills and abilities of faculty members for short periods to fill positions of a scientific, engi neer ing, professional, or analyti cal nature at NRL.
Consultants and experts are employed because they are outstanding in their fields of specialization or because they possess ability of a rare nature and could not normally be em ployed as regular civil servants.

programs for professional development | 2012 NRL REVIEW 267
Intergovernmental Person nel Act Ap point ments temporarily assign person nel from state or local governments or educa tional institu tions to the federal government (or vice versa) to improve public services rendered by all levels of government.
STUDENT PROGRAMS
The student programs are tailored to high school, undergraduate, and graduate students to provide employment opportunities and work experience in naval research.
The Naval Research Enterprise Intern Program (NREIP) is a tenweek program involving NROTC colleges/universities and their affiliates. The Office of Naval Research (ONR) offers summer appointments at Navy laboratories to current college sophomores, juniors, seniors, and graduate students from participating schools. Application is online at www.asee.org/nreip through the American Society for Engineering Education. Electronic applications are sent for evaluation to the point of contact at the Navy laboratory identified by the applicant. Contact NRL’s program coordinator at [email protected].
The National Defense Science and Engineer-ing Graduate Fellowship Program helps U.S. citizens obtain advanced training in disciplines of science and engineering critical to the U.S. Navy. The three year program awards fellowships to recent outstanding graduates to support their study and research leading to doctoral degrees in specified disciplines such as electrical engineering, computer sciences, material sciences, applied physics, and ocean engineering. Award recipients are encouraged to continue their study and research in a Navy laboratory during the summer. Contact NRL’s program coordinator at (202) 4047450 or [email protected].
The Pathways Intern Program (formerly STEP and SCEP) provides students enrolled in a wide variety of educational institutions, from high school to graduate level, with opportunities to work at NRL and explore Federal careers while still in school and while getting paid for the work performed. Students can work fulltime or parttime on a temporary or nontemporary appointment. Students must be continuously enrolled on at least a halftime basis at a qualifying educational institution and be at least 16 years of age. The primary focus of our Non-temporary intern appointment is to attract students enrolled in undergraduate and graduate programs in engineering, computer science, or the physical sciences. Student on nontemporary appointments are eligible to remain on their appointment until graduation and may be noncompetitively converted to a permanent appointment within 120 days after completion
of degree requirements. Conversion is dependent on work performance, completion of at least 640 hours of work under the intern appointment before completion of degree requirements, and meeting the qualifications for the position. The Temporary intern appointment is up to one year in duration and may be extended for one additional year. This program enables students to earn a salary while continuing their studies and offers them valuable work experience. NRL’s Pathways Intern Program opportunities are announced on USAJOBS four times per year. Visit USAJOBS at https://www.usajobs.gov/ to create an account, search for jobs, set up an email notification alert of when positions of interest are posted (see “Saved Searches”) and apply for our intern opportunities when posted. For additional information on NRL’s Intern Program, contact (202) 7678313.
The Student Volunteer Program helps students gain valuable experience by allowing them to voluntarily perform educationally related work at NRL. Applications are accepted yearround. For additional information, contact (202) 7678313.
The Department of Defense Science and Engi-neering Apprenticeship Program (SEAP) provides an opportunity for high school students who have completed at least Grade 9, and are at least 15 years of age to serve as junior research associates. Under the direction of a mentor, for eight weeks in the summer, students gain a better understanding of research, its challenges, and its opportunities through participation in scientific, engineering, and mathematics programs. Criteria for eligibility are based on science and mathematics courses completed and grades achieved; scientific motivation, curiosity, the capacity for sustained hard work; a desire for a technical career; teacher recommendations; and exceptional test scores. The NRL program is the largest in the Department of Defense. For detailed information visit http://seap.asee.org/, or call (202) 7678324, or email [email protected].

NRL offers a wide variety of challenging S&T posi tions that in volve skills from basic and
applied re search to equipment develop ment. The nature of the research and develop ment conducted at NRL requires profes sionals with experience. Typically there is a continuing need for electronics, mechan ical, aerospace, and materials engineers, metallurgists, com puter scientists, and oceanog ra phers with bache lor’s and/or advanced de grees and physical and com puter scientists with Ph.D. degrees.
For more information and current vacancy listings, visit http://hroffice.nrl.navy.mil/
Biologists. Biologists conduct research in areas that include biosensor devel-opment, tissue engineering, molecular biology, genetic engineering, proteomics, and environmental monitoring.
Chemists. Chemists are recruited to work in the areas of combustion, polymer science, bio engi neering and molecular engineering, surface sci ence, materials synthesis, nanostructures, corrosion, fiber optics, electro-optics, micro electronics, electron device technology, and laser physics.
Electronics Engineers and Computer Scien tists. These employees may work in the areas of com munications systems, electromagnetic scat tering, elec-tronics instrumentation, electron ic warfare systems, radio frequen cy/micro wave/milli meter-wave/infrared technol ogy, radar sys tems, laser physics technolo gy, radio -wave prop a gation, electron device technol ogy, space craft design, artificial intelli gence, infor mation pro cess ing, signal process ing, plas ma physics, vacuum sci ence, microelec tronics, electro-op tics, fiber optics, solid-state physics, software engineer ing, comput er de sign/architec ture, ocean acous tics, stress analy sis, and expert sys tems.
Materials Scien tists/Engi neers. These employees are recruited to work on materials, microstructure character iza tion, elec tronic ceramics, solid-state physics, fiber optics, electro-optics, microelectronics, fracture mechan ics, vacuum science, laser phys ics and joining technol ogy, and radio frequen cy/micro wave/millimeter-wave/infra red technol ogy.
EMPLOYMENT OPPORTUNITIESNRL
Mechanical and Aerospace Engineers. These employees may work in areas of spacecraft design, remote sens ing, propulsion, experimental and computational fluid mechanics, experi mental structural mechanics, solid me chan ics, elastic/plastic fracture mechanics, materials, finite-element methods, nondestruc tive evalua tion, characterization of fracture resistance of structur al alloys, combustion, CAD/CAM, and multifunctional material response.
Oceanographers, Meteorologists, and Marine Geophysicists. These employees work in the areas of ocean and atmospheric dynamics, air–sea interaction, upper-ocean dynamics, oceanographic bio-opti cal model ing, oceanic and atmospheric numeri cal modeling and prediction, data assimilation and data fusion, retrieval and application of remote sensing data, benthic pro-cess es, aerogeo physics, marine sedi mentary processes, ad vanced mapping techniques, atmospheric physics, and remote sensing. Oceanogra phers and marine geo physicists are located in Washington, DC, and at the Stennis Space Center, Bay St. Louis, Missis sip pi. Mete orologists are located in Wash ing ton, DC, and Monterey, California.
Physicists. Physics graduates may concentrate on such fields as materials, solid-state physics, fiber optics, electro-optics, microelectronics, vacuum science, plasma physics, fluid mechan ics, signal processing, ocean acoustics, informa-tion process ing, artificial intelligence, electron device technol ogy, radio-wave propagation, laser physics, ultra violet/X-ray/gamma-ray technol ogy, electronic warfare, electromagnetic interac tion, communi ca tions systems, radio frequency/micro wave/milli meter-wave/infrared technology, computa tion al physics, radio and high-energy astronomy, solar physics, and space physics.
for Highly Innovative, Motivated, and Creative Professionals

Gene
ral In
forma
tion270
Technical Output
271Key Personnel
272
Contributions by Divisions, Laboratories, and Departments
275Subject Index
278Author Index
279Map/Quick Reference Telephone Numbers
Scientific Development Squadron One (VXS-1) employees before fliying to Lakehurst, New Jersey, to commission the MZ-3A airship.

270 2012 NRL REVIEW | general information
TECHNICAL OUTPUT
The Navy continues to be a leader in initiat ing new developments and applying these advancements to military require ments. The primary method of informing the scientific and engineer ing community of the advances made at NRL is through the Laboratory’s technical out put — reports, articles in scientific journals, contri butions to books, pa pers present ed to sci en tific societ ies and topical conferenc es, patents, and inven tions.
The figures for calendar year 2011 pre sent ed be low represent the output of NRL facili ties in Wash ington, D.C.; Bay St. Louis, Mississip pi; and Monterey, California.
In addition to the output listed, NRL scientists made more than 2301 oral presentations during 2011.
_______________*This is a provisional total based on information available to the Ruth H. Hooker Research Library on April 2, 2012. Additional publications carrying a 2011 publication date are anticipated. Total includes refereed and nonrefereed publications.
Type of Contribution Unclassified Classified Total
Articles in periodicals, chapters in books, and papers in published proceedings 1472* 0 1472*
NRL Formal Reports 6 6 12
NRL Memorandum Reports 67 8 75
Books 2 0 2
U.S. patents granted 87 2 89
Foreign patents granted 12 0 12
Statutory Invention Registrations (SIRs) 0 0

general information | 2012 NRL REVIEW 271
KEY PERSONNEL
Code Office Phone NumberEXECUTIVE DIRECTORATE
1000 Commanding Officer 76734031000.1 Inspector General 76736211001 Director of Research 76733011001.1 Executive Assistant for the Director of Research 76724451002 Chief Staff Officer 76736211004 Head, Technology Transfer Office 76730831006 Head, Office of Program Administration and Policy Development 76730911008 Office of Counsel 76722441030 Public Affairs Officer 76725411100 Director, Institute for Nanoscience 76732611200 Head, Command Support Division 76736211220 Head, Information Assurance and Communications Security 76707931400 Head, Military Support Division 76722731600 Commander, Scientific Development Squadron One 30134237511700 Director, Laboratory for Autonomous Systems Research 76726841800 Director, Human Resources Office 7673421 1830 Deputy EEO Officer 76752643005 Deputy for Small Business 76762633540 Head, Safety Branch 7672232
BUSINESS OPERATIONS DIRECTORATE3000 Comptroller/Associate Director of Research 76723713200 Head, Contracting Division 76752273300 Head, Financial Management Division 76734053400 Head, Supply and Information Services Division 76734463500 Director, Research and Development Services Division 4044054
SYSTEMS DIRECTORATE5000 Associate Director of Research 7673425 5300 Superintendent, Radar Division 40427005500 Superintendent, Information Technology Division/ 7672903 NRL Chief Information Officer*5600 Superintendent, Optical Sciences Division 7677375 5700 Superintendent, Tactical Electronic Warfare Division 7676278
MATERIALS SCIENCE AND COMPONENT TECHNOLOGY DIRECTORATE6000 Associate Director of Research 76735666040 Director, Laboratories for Computational Physics and Fluid Dynamics 76724026100 Superintendent, Chemistry Division 76730266300 Superintendent, Materials Science and Technology Division 76729266700 Superintendent, Plasma Physics Division 76727236800 Superintendent, Electronics Science and Technology Division 76736936900 Director, Center for Bio/Molecular Science and Engineering 4046000
OCEAN AND ATMOSPHERIC SCIENCE AND TECHNOLOGY DIRECTORATE7000 Associate Director of Research 40486907100 Superintendent, Acoustics Division 76734827200 Superintendent, Remote Sensing Division 76733917300 Superintendent, Oceanography Division 22868846707400 Superintendent, Marine Geosciences Division 22868846507500 Superintendent, Marine Meteorology Division 83165647217600 Superintendent, Space Science Division 7676343
NAVAL CENTER FOR SPACE TECHNOLOGY8000 Director 76765478100 Superintendent, Space Systems Development Department 76704108200 Superintendent, Spacecraft Engineering Department 4043727
Area Code (202) unless otherwise listedPersonnel Locator - 767-3200
DSN-297 or 754
*Additional Duty

272 2012 NRL REVIEW | general information
CONTRIBUTIONS BY DIVISIONS, LABORATORIES, AND DEPARTMENTS
Radar Division
168 HighResolution Widesweep Backscatter Ionograms
G. San Antonio
Information Technology Division
78 How Do You Say It? Shibboleth: Phonological Analysis of NonNative Speakers of English
W.K. Frost, D.J. Perzanowski, and R.C. Page
176 Estimating Population Attitudes with CogSim M. Abramson
177 Maritime Threat Detection D.W. Aha, K.M. Gupta, and B. Auslander
240 Autonomous Release of a Snagged Solar Array G. Creamer, G. Henshaw, R. Hartley, S. Roderick,
J. Hope, and J. Obermark
Optical Sciences Division
96 Spatiotemporal Multicolor Labeling of Mammalian Cells: Quantum Dots Extend the Utility of Fluorescent Techniques in Biology
J.B. Delehanty, K.B. Gemmill, I.L. Medintz, C.E. Bradburne, K. Susumu, B.C. Mei, D. Farrell, H. Mattoussi, J.B. Blanco-Canosa, and P.E. Dawson
179 NRL Flight Tests Autonomous MultiTarget, MultiUser Tracking Capability
B.J. Daniel, M. Wilson, J. Edelberg, S. Frawley, C. Meadows, S. Anderson, T. Johnson, and M. Duncan
214 Long Range Automated Hyperspectral Target Detection
J. Neumann, M. Kruer, E. Allman, T. Downes, G. Howard, R. Leathers, M. Yetzbacher, M. Kut-teruf, M. Colbert, S. Frawley, Z. Butikofer, C. Meadows, and J. Lee
215 Full Element Simulator/Stimulator for the Virginia Class LWWAA Sonar System
A. Davis and C. Kirkendall
217 Broadband Supercontinuum Generation L.B. Shaw, R.R. Gattass, V.Q. Nguyen, P. Pureza,
and J.S. Sanghera
Tactical Electronic Warfare Division
170 RealTime Electronic Attack (EA) Effectiveness Monitoring
S.L. Beun and J.J. Genova
228 Human Eye Simulation C.J. Dunay, D.A. Burchick, Sr., and S.A. Moroz
229 Towed Antiship Cruise Missile Simulator M. Michelizzi and C. Maraviglia
Laboratories for Computational Physics and Fluid Dynamics
204 BioInspired Locomotion for Unmanned Underwater Vehicles
J.D. Geder, R. Ramamurti, M. Pruessner, B. Ratna, J. Palmisano, and W. Sandberg
Chemistry Division
161 Heat Sensitization Effects in Aluminum Ship Structure Alloys
R.L. Holtz, P.S. Pao, R.A. Bayles, and R. Goswami
184 Biosensing with a GrapheneBased FET C.R. Tamanaha, R. Stine, J.T. Robinson, M. Bara-
ket, S.P. Mulvaney, S.G. Walton, and P.E. Sheehan
194 Trace Vapor Detection with Vertical Silicon Nanowire Arrays
C.R. Field, H.-J. In, S.L. Rose-Pehrsson, and P.E. Pehrsson
197 Enhanced Multiple Exciton Generation in Semiconductor Nanorods
P.D. Cunningham, J.E. Boercker, M.P. Lumb, J.G. Tischler, J.S. Melinger, E.E. Foos, and A.R. Smith
199 Engineering Graphene Mechanics M.K. Zalalutdinov, J.T. Robinson, C.E. Junker-
meier, J.C. Culbertson, T.L. Reinecke, R. Stine, P.E. Sheehan, B.H. Houston, and E.S. Snow
Materials Science and Technology Division
85 Electromagnetic Railgun Barrel Damage Experiments
R.A. Meger, B. Huhman, J. Neri, T. Brintlinger, H. Jones, J. Michopoulos, R. Cairns, and S. Douglass

general information | 2012 NRL REVIEW 273
160 Laser Trace Vaporization of Explosives M. Papantonakis, C.A. Kendziora, R. Furstenberg,
V. Nguyen, J. Großer, and R.A. McGill
161 Heat Sensitization Effects in Aluminum Ship Structure Alloys
R.L. Holtz, P.S. Pao, R.A. Bayles, and R. Goswami
186 Silicon Spintronics at 500 K C.H. Li, O.M.J. van ‘t Erve, and B.T. Jonker
188 PoroVascular Composites J.P. Thomas, M.H. Merrill, K.M. Metkus,
A. Piqué, and R.K. Everett
190 LowCost Processing of Titanium and Its Alloys
A.W. Fliflet, M.A. Imam, and R.K. Everett
Plasma Physics Division
85 Electromagnetic Railgun Barrel Damage Experiments
R.A. Meger, B. Huhman, J. Neri, T. Brintlinger, H. Jones, J. Michopoulos, R. Cairns, and S. Douglass
142 Tailoring Underwater Laser Acoustic Pulses T.G. Jones, M. Helle, A. Ting, and M. Nicholas
184 Biosensing with a GrapheneBased FET C.R. Tamanaha, R. Stine, J.T. Robinson, M. Bara-
ket, S.P. Mulvaney, S.G. Walton, and P.E. Sheehan
190 LowCost Processing of Titanium and Its Alloys
A.W. Fliflet, M.A. Imam, and R.K. Everett
222 Intense Pulsed Active Detection of Fissile Materials
J.W. Schumer, R.J. Commisso, J.P. Apruzese, R.J. Allen, G. Cooperstein, D.D. Hinshelwood, S.L. Jackson, D. Mosher, D.P. Murphy, P.F. Ottinger, D.G. Phipps, S.B. Swanekamp, B.V. Weber, F.C. Young, and J.C. Zier
Electronics Science and Technology Division
172 Diamond for Thermal Management in Power Electronics
T.J. Anderson, M.J. Tadjer, K.D. Hobart, T.I. Fey-gelson, J.D. Caldwell, M.A. Mastro, J.K. Hite, C.R. Eddy, Jr., F.J. Kub, and B.B. Pate
184 Biosensing with a GrapheneBased FET C.R. Tamanaha, R. Stine, J.T. Robinson, M. Bara-
ket, S.P. Mulvaney, S.G. Walton, and P.E. Sheehan
195 Ultrafast Optical Control of Entangled Spins S.G. Carter, D. Kim, A. Greilich, A.S. Bracker, and
D.G. Gammon
197 Enhanced Multiple Exciton Generation in Semiconductor Nanorods
P.D. Cunningham, J.E. Boercker, M.P. Lumb, J.G. Tischler, J.S. Melinger, E.E. Foos, and A.R. Smith
199 Engineering Graphene Mechanics M.K. Zalalutdinov, J.T. Robinson, C.E. Junker-
meier, J.C. Culbertson, T.L. Reinecke, R. Stine, P.E. Sheehan, B.H. Houston, and E.S. Snow
Center for Bio/Molecular Science and Engineering
96 Spatiotemporal Multicolor Labeling of Mammalian Cells: Quantum Dots Extend the Utility of Fluorescent Techniques in Biology
J.B. Delehanty, K.B. Gemmill, I.L. Medintz, C.E. Bradburne, K. Susumu, B.C. Mei, D. Farrell, H. Mattoussi, J.B. Blanco-Canosa, and P.E. Dawson
164 Biosensor Triage for Traumatic Brain Injury S.H. North, C.R. Taitt, L.C. Shriver-Lake, and
F.S. Ligler
204 BioInspired Locomotion for Unmanned Underwater Vehicles
J.D. Geder, R. Ramamurti, M. Pruessner, B. Ratna, J. Palmisano, and W. Sandberg
Acoustics Division
142 Tailoring Underwater Laser Acoustic Pulses T.G. Jones, M. Helle, A. Ting, and M. Nicholas
144 Analysis of the Elasticity of Fibrous Brain Structures Using Sound
A.J. Romano and B.H. Houston
146 Acoustic Array Performance and Ship Radiated Noise Source Level Estimation in Shallow Waters
S.L. Means, J.S. Rogers, and S.C. Wales
148 Nonlinear Poroacoustics: From Kinks to Shocks
P.M. Jordan and J.K. Fulford
199 Engineering Graphene Mechanics M.K. Zalalutdinov, J.T. Robinson, C.E. Junker-
meier, J.C. Culbertson, T.L. Reinecke, R. Stine, P.E. Sheehan, B.H. Houston, and E.S. Snow

274 2012 NRL REVIEW | general information
Remote Sensing Division
103 Terahertz Astrophysics with the Herschel Space Observatory
J. Fischer, J.S. Carr, R.L. Lucke, and E.J. Polisensky
154 Cirrus Cloud Seeding by Stratospheric Volcanic Aerosol Particles
J.R. Campbell, M.D. Fromm, N.A. Krotkov, S.A. Stewart, E.J. Welton, and K. Yang
224 Missile Tracking and Range Safety D.J. Dowgiallo, S. Rauen, M.A. Davis, W.M. Peters,
E.J. Polisensky, E.M. Twarog, and R.W. Harry
Oceanography Division
112 Oceanic Hot Spots — Internal Tides in the Global Ocean
J.G. Richman, J.F. Shriver, E.J. Metzger, P.J. Hogan, G.A. Jacobs, and B.K. Arbic
152 RealTime Prediction of Tropical Cyclone Intensity Using COAMPSTC
J.D. Doyle, R.M. Hodur, S. Chen, H. Jin, Y. Jin, J. Moskaitis, A. Reinecke, P. Black, J. Cummings,
E. Hendricks, T. Holt, C.-S. Liou, M. Peng, K. Sashegyi, J. Schmidt, and S. Wang
206 Extending Optical Visibility Prediction Range with the Help of Acoustics
W. Hou, E. Jarosz, S. Woods, W. Goode, and A. Weidemann
Marine Geosciences Division
122 DeepWater Acoustic Anomalies from Methane Hydrate in the Bering Sea
W. Wood, G. Barth, D. Scholl, and N. Lebedeva-Ivanova
208 Tomographic Particle Image Velocimetry of
Bottom Boundary Layer Processes J. Calantoni and I.M. Sou
Marine Meteorology Division
152 RealTime Prediction of Tropical Cyclone Intensity Using COAMPSTC
J.D. Doyle, R.M. Hodur, S. Chen, H. Jin, Y. Jin, J. Moskaitis, A. Reinecke, P. Black, J. Cummings, E. Hendricks, T. Holt, C.-S. Liou, M. Peng, K. Sashegyi, J. Schmidt, and S. Wang
154 Cirrus Cloud Seeding by Stratospheric Volcanic Aerosol Particles
J.R. Campbell, M.D. Fromm, N.A. Krotkov, S.A. Stewart, E.J. Welton, and K. Yang
156 Merging Geographic Information Systems Technologies with Environmental Prediction
C. Hutchins, J. Cook, M. Frost, D. Martinez, D. Geiszler, Q. Zhao, P. Harasti, J. Kent, and G. Love
Space Science Division
131 Wind at the Top of the Atmosphere C.R. Englert, C.M. Brown, D.P. Drob, J.T. Emmert,
J.M. Goldspiel, A. Nicholas, D.E. Siskind, A.W. Stephan, M.H. Stevens, J.M. Harlander, and K.D. Marr
232 Fermi Finds More Than 100 GammaRay Pulsars
P.S. Ray, J.E. Grove, K.S. Wood, A.A. Abdo, T.J. Johnson, and D. Parent
Space Systems Development Department
224 Missile Tracking and Range Safety D.J. Dowgiallo, S. Rauen, M.A. Davis, W.M. Peters,
E.J. Polisensky, E.M. Twarog, and R.W. Harry
233 Blossom Point Tracking Facility — A Unique NRL Asset
G. Fuller and L.C. Brown
Spacecraft Engineering Department
210 Rapid Autonomous Fuel Transfer for USVs G.P. Scott and C.G. Henshaw
224 Missile Tracking and Range Safety D.J. Dowgiallo, S. Rauen, M.A. Davis, W.M. Peters,
E.J. Polisensky, E.M. Twarog, and R.W. Harry
236 Orbit and Mission Design for the TacSat4 Satellite
W.J. Barnds and K. Akins
240 Autonomous Release of a Snagged Solar Array G. Creamer, G. Henshaw, R. Hartley, S. Roderick,
J. Hope, and J. Obermark

general information | 2012 NRL REVIEW 275
SUBJECT INDEx
Accelerator technologies, 222Accent recognition, 78Acoustic Reverberation Simulation Facility,
69Acoustics, 54, 122, 206, 215Active curvature control, 204Active detection, 222Administrative Services, 71Advanced Graduate Research Program, 264Advanced Multifunction Radio Frequency
Concept (AMRFC), 35Advanced Optical Materials Fabrication
Laboratory, 38Advanced Silicon Carbide Epitaxial
Research Laboratory (ASCERL), 50Agentbased model, 176Aluminum alloys, 161Angel Fire, 179Anisotropic inversions, 144Antiship cruise missiles (ASCM), 229Antiship missiles, 170Array performance, 146Astrodynamics, 236Atmosphere, 131Atomic force microscope, 45Atomic Layer Deposition System (ALD), 50Audio Laboratory, 37Automated target detection, 214Autonomous refueling, 210Autonomous robotics, 240Autonomous Systems and Robotics
Laboratory, 37Autonomous unmanned vehicles, 55Autonomy, 204Bed shear stress, 208Behavior Detection Laboratory, 37Bioinspired underwater vehicle, 52Bioinspired, 204Bio/molecular and cellular arrays, 52Bioconjugate, 96BioFET, 184Biomarkers, 164Biosensor, 164, 184Blossom Point Satellite Tracking and
Command Facility, 75, 233Blue Devil, 179Bottom boundary layer, 208Capitol Hill Workshops, 264Carrier multiplication, 197Center for Advanced Materials Epitaxial
Growth and Characterization (Epicenter), 50
Center for Bio/Molecular Science and Engineering, 52
Center for Computational Science, 36Central Target Simulation Facility, 41CFD, 204ChemFET, 194
Chemical Vapor and Plasma Deposition Facility, 45
Chemistry, 44Chesapeake Bay Detachment (CBD), 73Cirrus clouds, 154Class 10 clean room, 64Class 1000 clean room, 46Coalition, 176Coherent structure, 208Common Ground Architecture software,
233Community Outreach Program, 265Compact Antenna Range, 34Compact CORonagraph (CCOR), 64Complex nearnet shapes, 190Compound Semiconductor Processing
Facility (CSPF), 50Computational Electromagnetic (CEM)
Facility, 34Corrosion, 161Counseling and Referral Service (C/RS),
264Coupled modeling, 152Cryptographic Technology Laboratory, 36CTAnalyst, 42Cubesat, 69Cue management, 179Cyber Defense Development Laboratory,
36Cytosense Scanning Flow Cytometer, 59Darcy’s Law, 148Data integration, 156Department of Defense Science and
Engineering Apprenticeship Program (SEAP), 267
Diffusion tensor imaging, 144Edison Memorial Graduate Training
Program, 264Electra, 48Electrical, Magnetic, and Optical
Measurement Facility, 46Electronic Attack Technique Evaluation
System (EATES), 41Electronic attack, 170Electronic warfare, 170, 229Electronics Science and Technology, 50Electrowettingondielectric, 188Endocytosis, 96Entanglement, 195EO/IR sensor, 229ExUSS Shadwell, 45, 76Executive Leadership Program for Mid
Level Employees, 264Explosives detection, 160EyePod, 179Fatigue, 161FEATHER, 179Federal Executive Institute (FEI), 264
Fermi, 232Flapping fin, 204Fleet Numerical Meteorology and Ocean
ography Center (FNMOC), 62, 73Fluid turbulence, 208Fluorescence, 96Focal Plane Array Evaluation Facility, 39Forecasting, 112Foreign accent, 78Form drag, 188Free Surface Hydrodynamics Laboratory
(FSHL), 57Freespace Laser Communications
Laboratory, 36FRET, 96Gallium nitride (GaN), 172Gamble II, 48Gamma rays, 232Genomics and proteomics, 52Geographic information systems, 156Geospatial Hub (GHub), 61Global Assimilation of Ionospheric
Measurements (GAIM), 65Global Positioning System (GPS), 66Graphene, 184, 199Heat sensitization, 161High electron mobility transistor (HEMT),
172High Energy Laser Laboratory, 48High frequency overthehorizon radar
(HF OTHR), 168High Pressure MultiAnvil System (HPMAS), 50Highresolution models, 152Homeland security, 222Hurricanes, 152Hydrophobic, 188Hyperspectral Imager for the Coastal
Ocean (HICO), 56Hyperspectral, 214Immersive Simulation Laboratory, 37Immunoarray, 164Inground pool facility, 55Information Technology, 36Infrared Materials and Detectors Charac
terization Laboratory (IR Characterization Lab), 50
Infrared, 160Institute for Nanoscience, 32Intelligence, surveillance, and reconnais
sance (ISR), 179Interferometer, 224Intergovernmental Personnel Act Appointments, 267Internal waves, 112Ionic liquid, 188Ionosphere, 168IR fiber, 217

276 2012 NRL REVIEW | general information
IR MissileSeeker Evaluation Facility, 39Irregular warfare, 176Kilohertz Ti:Sapphire Femtosecond Laser
(KTSFL), 48Labelfree sensing, 184Laboratories for Computational Physics
and Fluid Dynamics, 42Laboratory for Advanced Materials
Synthesis (LAMS), 50Laboratory for Autonomous Systems
Research, 7Laminar Flow Clean Room, 69Language identification, 78Large Area Plasma Processing System
(LAPPS), 49Largeaperture array, 146Laser acoustic source, 142Lead selenide (PbSe), 197Learjets, 40Legislative Fellowship (LEGIS) program,
264Lidar, 154Light weight wide aperture array
(LWWAA), 215Machine learning, 177Machine vision, 240Magnetic resonance elastography, 144Magnetic Resonance Facility, 44Magnetoelectronics Fabrication Facility, 46Manipulator, 210Marine Corrosion and Coatings Facility,
45, 76Marine Geosciences, 60Marine Meteorology, 62Maritime threat detection, 177Materialbydesign, 199Materials Processing Facility, 46Materials Science and Technology, 46Materials Synthesis/Property Measurement
Facility, 45Mechanical Characterization Facility, 46Mercury, 48Methane hydrates, 122Micro/Nanostructure Characterization
Facility, 47Microwave Microscope, 35Microwave processing, 190Midway Research Center, 74MillimeterWave Vacuum Electronics
Fabrication Facility (MWVEFF), 50Missile tracking, 224Mission operations, 236Mobile Atmospheric Aerosol and Ra
diation Characterization Observatories (MAARCO), 63
Modeling, 131Monterey (NRLMRY), 72Multitarget tracking, 179Multiple exciton generation, 197Multipurpose xray diffraction system, 45MX20SW, 214NWAPSS, 179Nanocrystal, 197Nanocrystalline diamond (NCD), 172Nanomechanics, 199
Nanometer Characterization/Manipulation Facility, 44
Nanorod, 197Nanoscale manipulations, 52Nanowires, 194National Defense Science and Engineering
Graduate Fellowship, 267Naval Key Management Laboratory, 36Naval Postgraduate School (NPS), 264Naval Research Enterprise Intern Program
(NREIP), 267Navy Fuel Research Facility, 45Navy Optical Interferometer (NOI), 57Network sensing, 179Nike, 48NOGAPSALPHA, 65Noise prediction, 146Nonlinear fiber, 217Nonlinear optics, 142Nonlinear waves, 148NRL Focused Phased Array Imaging Radar
(NRL FOPAIR), 56NRL Mentor Program, 265NRL Showboaters Theatre, 265NRL/NRC Cooperative Research Associ
ateship Program, 266NRL/United States Naval Academy
Cooperative Program, 266Numerical inversion, 122Numerical weather prediction, 152Oblique viewing geometry, 214Ocean Dynamics and Prediction Computa
tional Network Facility, 58Oceanography, 58Office of Naval Research Summer Faculty
Research and Sabbatical Leave Program, 266
Optical biosensors, 52Optical Fiber Preform Fabrication
Laboratory, 38Optical Sciences, 38Optics, 206Optoelectronic Scanning Electron
Characterization Facility (OSECF), 50Pathways Intern Program, 267Phonology, 78Plasma Physics, 48Pomonkey Facility, 75Poroacoustics, 148Precision Clock Evaluation Facility (PCEF),
67Probabilistic relational networks, 177Pulsars, 232Quantum cascade laser, 160Quantum dot (QD), 96, 195Quantum information technology, 195Radar, 34Railgun, 14, 85Raman thermography, 172Range safety, 224Remote Sensing, 56, 154Resonator, 199RF Communications Laboratory, 36RF transmissions, 170Robotics, 210
Ruth H. Hooker Research Library, 71Salt water tank facility, 55Satellite Data Processing Laboratory, 62Satellite servicing, 240Satellite tracking system, 233Scanfish, 59Scattering, 206Scientific Development Squadron ONE
(VXS1), 74ScientisttoSea Program (STSP), 264Seafloor characterization, 122Sediment transport, 208Seismic data, 122Select Graduate Training Program, 264Semiconductor spintronics, 186Sensor Exploitation Lab (NRL SEALAB),
57Sensors, 131, 194SEPTR, 59Service Oriented Architecture Laboratory,
37Ship structure, 161Shipboard Lidar Optical Profiler, 59Shipping noise, 146Shocks, 148Shortwave infrared 214Si, 186Sigma Xi, 265Simulated eye, 228Simulators and sensor stimulators
(SIM/STIM), 215Situational awareness, 170Skinfriction drag, 188Slocum Gliders, 59Solar Cell Characterization Laboratory
(SCCL), 50Solar Coronagraph Optical Test Chamber
(SCOTCH), 64Sonomagnetic measurement facility, 55Space flight, 131Space Science, 64Space Systems Development Department,
66Space telescopes, 103Spacecraft Engineering Department, 68Spacecraft Robotics Engineering and
Controls Laboratory, 69Spin accumulation, 186Spin Test Facility, 69Static Loads Test Facility, 69Stennis Space Center (NRLSSC), 72Student Volunteer Program, 267Supercontinuum, 217Surface biofunctionalization, 184Surface Characterization Facility, 38Surface modification, 52Surrogate eye, 228Swirling strength, 208SWOrRD facility, 48Synchrotron Radiation Facility, 44Synthetic aperture radar, 60TableTop Terawatt (T3) laser, 48TacSat4, 12, 236Tactical Electronic Warfare, 40

general information | 2012 NRL REVIEW 277
Tactical Reachback Extended Communications (TREC) data link, 179
Tapered Anechoic Chamber, 69Technical Information Services, 70Technology Transfer Office, 70Terahertz spectroscopy, 103Thermal Fabrication and Test Facility, 69ThinFilm Materials Synthesis and
Processing Facility, 47Tides, 112Titanium powder sintering, 190Toastmasters International, 265TomoPIV, 208TORPEDO, 71TOWed electrooptic/infrared SIMulator
(TOWSIM), 229Tracking Interferometer Pathfinder System
(TIPS), 224Tracking, 179Traumatic brain injury, 164Tropical cyclone modeling, 152Turbulence, 206UltraViolet Photolithography Laboratory
for SubmillimeterWave Devices (UVPL), 50
Ultrafast Laser Facility (ULF), 50Ultralowloss Infrared FiberOptic
Waveguide Facility, 39Ultraluminous infrared galaxies, 103Ultrasonic measurements laboratory, 55Undersea acoustic propagation, 55Underwater acoustics, 142Underwater imaging, 206Unmanned surface vehicle (USV), 210Unmanned systems, 204Unmanned underwater vehicle (UUV), 204UTLS processes, 154Vacuum UltravioletSolar Instrument Test
facility (SIT), 64Vehicle control, 204Vertical Microstructure Profiler (VMP), 59Vibration Test Facility, 69Visual Analytics Laboratory, 37Wband Advanced Radio for Low
Observable Control (WARLOC), 35WAPSS, 179Warfighter Human System Integration
Laboratory, 37Water Vapor Millimeterwave Spectro
meter (WVMS), 57Waveguide constrained elastography, 144Web technologies, 156White matter tracts, 144Wide bandgap, 172Widesweep backscatter ionogram (WSBI),
168WindSat, 57Women in Science and Engineering
(WISE) Network, 265XFC, 41

278 2012 NRL REVIEW | general information
AUTHOR INDEx
Abdo, A.A., 232Abramson, M., 176Aha, D.W., 177Akins, K., 236Allen, R.J., 222Allman, E., 214Anderson, T.J., 172Anderson, S., 179Apruzese, J.P., 222Arbic, B.K., 112Auslander, B., 177Baraket, M., 184Barnds, W.J., 236Barth, G., 122Bayles, R.A., 161Beun, S.L., 170Black, P., 152BlancoCanosa, J.B., 96Boercker, J.E., 197Bracker, A.S., 195Bradburne, C.E., 96Brintlinger, T., 85Brown, L.C., 233Brown, C.M., 131Burchick, Sr., D.A., 228Butikofer, Z., 214Cairns, R., 85Calantoni, J., 208Caldwell, J.D., 172Campbell, J.R., 154Carr, J.S., 103Carter, S.G., 195Chen, S., 152Colbert, M., 214Commisso, R.J., 222Cook, J., 156Cooperstein, G., 222Creamer, G., 240Culbertson, J.C., 199Cummings, J., 152Cunningham, P.D., 197Daniel, B.J., 179Davis, A., 215Davis, M.A., 224Dawson, P.E., 96Delehanty, J.B., 96Douglass, S., 85Dowgiallo, D.J., 224Downes, T., 214Doyle, J.D., 152Drob, D.P., 131Dunay, C.J., 228Duncan, M., 179Eddy, Jr., C.R., 172Edelberg, J., 179Emmert, J.T., 131Englert, C.R., 131Everett, R.K., 188, 190Farrell, D., 96Feygelson, T.I., 172Field, C.R., 194
Fischer, J., 103Fliflet, A.W., 190Foos, E.E., 197Frawley, S., 179, 214Fromm, M.D., 154Frost, M., 156Frost, W.K., 78Fulford, J.M., 148Fuller, G., 233Furstenberg, R., 160Gammon, D.G., 195Gattass, R.R., 217Geder, J.D., 204Geiszler, D., 156Gemmill, K.B., 96Genova, J.J., 170Goldspiel, J.M., 131Goode, W., 206Goswami, R., 161Greilich, A., 195Grosser, J., 160Grove, J.E., 232Gupta, K.M., 177Harasti, P., 156Harlander, J.M., 131Harry, R.W., 224Hartley, R., 240Helle, M., 142Hendricks, E., 152Henshaw, C.G., 210, 240Hinshelwood, D.D., 222Hite, J.K., 172Hobart, K.D., 172Hodur, R.M., 152Hogan, P.J., 112Holt, T., 152Holtz, R.L. 161Hope, J., 240Hou, W., 206Houston, B.H., 144, 199Howard, G., 214Huhman, B., 85Hutchins, C., 156Imam, M.A., 190In, H.J., 194Jackson, S.L., 222Jacobs, G.A., 112Jarosz, E., 206Jin, H., 152Jin, Y., 152Johnson, T., 179Johnson, T.J., 232Jones, T.G., 142Jones, H., 85Jonker, B.T., 186Jordan, P.M., 148Junkermeier, C.E., 199Kendziora, C.A., 160Kent, J., 156Kim, D., 195Kirkendall, C., 215
Krotkov, N.A., 154Kruer, M., 214Kub, F.J., 172Kutteruf, M., 214Leathers, R., 214LebedevaIvanova, N., 122Lee, J., 214Li, C.H., 186Ligler, F.S., 164Liou, C.S., 152Love, G., 156Lucke, R.L., 103Lumb, M.P., 197Maraviglia, C., 229Marr, K.D., 131Martinez, D., 156Mastro, M.A., 172Mattoussi, H., 96McGill, R.A., 160Meadows, C., 179, 214Means, S.L., 146Medintz, I.L., 96Meger, R.A., 85Mei, B.C., 96Melinger, J.S., 197Merrill, M.H., 188Metkus, K.M., 188Metzger, E.J., 112Michelizzi, M., 229Michopoulos, J., 85Moroz, S.A., 228Mosher, D., 222Moskaitis, J., 152Mulvaney, S.P., 184Murphy, D.P., 222Neri, J., 85Neumann, J., 214Nguyen, V., 160Nguyen, V.Q., 217Nicholas, M., 142Nicholas, A.W., 131North, S.H., 164Obermark, J., 240Ottinger, P.F., 222Page, R.C., 78Palmisano, J., 204Pao, P.S., 161Papantonakis, M., 160Parent, D., 232Pate, B.B., 172Pehrsson, P.E., 194Peng, M., 152Perzanowski, D.J., 78Peters, W.M., 224Phipps, D.G., 222Piqué, A., 188Polisensky, E.J., 103, 224Pruessner, M., 204Pureza, P., 217Ramamurti, R., 204Ratna, B., 204
Rauen, S., 224Ray, P.S., 232Reinecke, A., 152Reinecke, T.L., 199Richman, J.G., 112Robinson, J.T., 184, 199Roderick, S., 240Rogers, J.S., 146Romano, A.J., 144RosePehrsson, S.L., 194San Antonio, G., 168Sandberg, W., 204Sanghera, J.S., 217Sashegyi, K., 152Schimidt, J., 152Scholl, D., 122Schumer, J.W., 222Scott, G.P., 210Shaw, L.B., 217Sheehan, P.E., 184, 199Shriver, J.F., 112ShriverLake, L.C., 164Siskind, D.E., 131Smith, A.R., 197Snow, E.S., 199Sou, I.M., 208Stephan, A.W., 131Stevens, M.H., 131Stewart, S.A., 154Stine, R., 184, 199Susumu, K., 96Swanekamp, S.B., 222Tadjer, M.J., 172Taitt, C.R., 164Tamanaha, C.R., 184Thomas, J.P., 188Ting, A., 142Tischler, J.G., 197Twarog, E.M., 224Van ‘t Erve, O.M.J., 186Wales, S.C., 146Walton, S.G., 184Wang, S., 152Weber, B.V., 222Weidemann, A., 206Welton, E.J., 154Wilson, M., 179Wood, K.S., 232Wood, W., 122Woods, S., 206Yang, K., 154Yetzbacher, M., 214Young, F.C., 222Zalalutdinov, M.K., 199Zhao, Q., 156Zier, J.C., 222
LOCATION OF NRL IN THE CAPITAL AREA

general information | 2012 NRL REVIEW 279
LOCATION OF NRL IN THE CAPITAL AREA
395
270 95
295
295
95
WASHINGTON, D. C.
495
66
95
MARYLAND
VIRGINIA
Alexandria
Springfield
Falls Church
Suitland
BethesdaSilverSpring
CollegePark
McLean
PotomacRiver
Arlington
NationalAirport
NAVAL RESEARCH LABORATORY
N A V A L R E S E A R C H L A B O R A T O R Y4555 Overlook Ave., SW • Washington, DC 20375-5320
Quick Reference Telephone Numbers
Additional telephone numbers are listed on page 271.
NRL NRL- NRL- NRL NRL VXS-1 Washington SSC Monterey CBD Patuxent River
Hotline (202) 767-6543 (202) 767-6543 (202) 767-6543 (202) 767-6543 (202) 767-6543Personnel Locator (202) 767-3200 (228) 688-3390 (831) 656-4763 (410) 257-4000 (301) 342-3751DSN 297- or 754- 828 878 — 342Direct-in-Dialing 767- or 404- 688 656 257 342Public Affairs (202) 767-2541 (228) 688-5328 (202) 767-2541 — (202) 767-2541

General information on the research described in this NRL Review can be obtained from the Public Affairs Office, Code 1030, (202) 767-2541. Information concerning Technology Transfer is available from the Technology Transfer Office, Code 1004, (202) 767-7230. Sources of information on the various educational programs at NRL are listed in the NRL Review chapter entitled “Programs for Professional Development.”
For additional information about NRL, the NRL Fact Book lists the organizations and key personnel for each division. It contains information about Laboratory funding, programs, and field sites. The Fact Book can be obtained from the Technical Information Services Branch, Code 3430, (202) 404-4963. The web-based NRL Major Facilities publication, which describes each NRL facility in detail, can be accessed at http://www.nrl.navy.mil.
Approved for public release; distribution is unlimited.
REVIEWED AND APPROVEDNRL/PU/3430--13-560
RN: 13-1231-2584August 2013
Anthony J. Ferrari, Captain, USNCommanding Officer
Senior Science editorJohn D. Bultman
coordinatorJonna Atkinson
conSultantKathy Parrish
deSign, layout, and graphic SupportJonna Atkinson
editorial aSSiStanceSaul Oresky
Kathy Parrish Claire Peachey
photographic productionJamie HartmanJames Marshall Gayle Fullerton
NRL Review Staff
to conduct a broadly based multidisciplinary program of scientific research and advanced
technological development directed toward maritime applications of new and improved materials, techniques, equipment, systems, and ocean, atmospheric, and space sciences and related technologies.
The Naval Research Laboratory provides primary in-house research for the physical, engineering, space, and environmental sciences; broadly based applied research and advanced technology development programs in response to identified and anticipated Navy and Marine Corps needs; broad multidisciplinary support to the Naval Warfare Centers; and space and space systems technology, development, and support.
N R L ’ s M I S S I O N
director oF reSearch Dr. John A. Montgomery
coMManding oFFicer CAPT Anthony J. Ferrari, USN

2012 NRL REVIEW
www.nrl.navy.mil
N A V A L R E S E A R C H L A B O R A T O R Y Washington, DC
2012
NRL R
EVIE
W
2012 NR
L RE
VIE
WN
aVa
L RE
sE
aR
ch
Lab
oR
ato
Ry
Building a workforce and assembling scientific tools for the future.