naval postgraduate school - defense technical … · public reporting burden for this collection of...
TRANSCRIPT
NAVAL
POSTGRADUATE SCHOOL
MONTEREY, CALIFORNIA
THESIS
ENLISTED NAVY RESERVISTS AND THEIR INTENTION TO STAY IN THE NAVY RESERVES UNTIL
RETIREMENT ELIGIBLE
by
Rita Alice Becker
June 2005
Thesis Advisor: Kathryn Kocher Second Reader: Elda Pema
Approved for public release; distribution is unlimited.

THIS PAGE INTENTIONALLY LEFT BLANK
i
REPORT DOCUMENTATION PAGE Form Approved OMB No. 0704-0188
Public reporting burden for this collection of information is estimated to average 1 hour per response, including the time for reviewing instruction, searching existing data sources, gathering and maintaining the data needed, and completing and reviewing the collection of information. Send comments regarding this burden estimate or any other aspect of this collection of information, including suggestions for reducing this burden, to Washington headquarters Services, Directorate for Information Operations and Reports, 1215 Jefferson Davis Highway, Suite 1204, Arlington, VA 22202-4302, and to the Office of Management and Budget, Paperwork Reduction Project (0704-0188) Washington DC 20503. 1. AGENCY USE ONLY (Leave blank)
2. REPORT DATE June 2005
3. REPORT TYPE AND DATES COVERED Master’s Thesis
4. TITLE AND SUBTITLE: Enlisted Navy Reservists and Their Intention to Stay in the Navy Reserves Until Retirement Eligible
6. AUTHOR(S) Rita Alice Becker, LCDR USNR
5. FUNDING NUMBERS
7. PERFORMING ORGANIZATION NAME(S) AND ADDRESS(ES) Naval Postgraduate School Monterey, CA 93943-5000
8. PERFORMING ORGANIZATION REPORT NUMBER
9. SPONSORING /MONITORING AGENCY NAME(S) AND ADDRESS(ES) N/A
10. SPONSORING/MONITORING AGENCY REPORT NUMBER
11. SUPPLEMENTARY NOTES The views expressed in this thesis are those of the author and do not reflect the official policy or position of the Department of Defense or the U.S. Government. 12a. DISTRIBUTION / AVAILABILITY STATEMENT Approved for public release; distribution is unlimited
12b. DISTRIBUTION CODE
13. ABSTRACT (maximum 200 words) This thesis examines factors that influence the retention of enlisted members in pay grades E1-E5 and E6 in the Selected Navy Reserve. Data were extracted from the 2000-2001 Navy Reserve Career Decisions Survey. Chi-square tests of independent were used to assess the relationship of various demographic, unit-type, critical-rate, and reserve experience variables to plans for retention to retirement eligibility. Thirteen factors significantly associated with planned retention for E1-E5’S and ten for E6’S are identified. E6’S indicate a higher retirement intention rate than do E1-E5’S. For both pay grade groups, males indicate a higher retirement intention rate than do females and married members indicate a higher retirement intention rate than do non-married members. E1-E6 Prior Service members indicate a higher retirement intention rate than do E1-E6 Non Prior Service members. For both groups, Reserve Center/Readiness Command unit type is positively associated with planned retention while aviation and shipboard unit types are not significantly related. For E1-E5’S, retirement intent is positively related to serving in a critical rating, while it is not for E-6’S. For E1-E6’S, retention plans are also strongly dependent on opinions about quality of training, accomplishment recognition, family impact, civilian job impact, educational benefits and senior leadership.
15. NUMBER OF PAGES
93
14. SUBJECT TERMS Navy Reserve Retention, Reserve Retention, Military Retention, Navy Reserve Manpower, Attrition
16. PRICE CODE
17. SECURITY CLASSIFICATION OF REPORT
Unclassified
18. SECURITY CLASSIFICATION OF THIS PAGE
Unclassified
19. SECURITY CLASSIFICATION OF ABSTRACT
Unclassified
20. LIMITATION OF ABSTRACT
UL
NSN 7540-01-280-5500 Standard Form 298 (Rev. 2-89) Prescribed by ANSI Std. 239-18

ii
THIS PAGE INTENTIONALLY LEFT BLANK

iii
Approved for public release; distribution is unlimited
ENLISTED NAVY RESERVISTS AND THEIR INTENTION TO STAY IN THE NAVY RESERVE UNTIL RETIREMENT ELIGIBLE
Rita A. Becker
Lieutenant Commander, United States Navy Reserve B.A., Northern Arizona University, 1991
Submitted in partial fulfillment of the requirements for the degree of
MASTER OF BUSINESS ADMINISTRATION
from the
NAVAL POSTGRADUATE SCHOOL June 2005
Author: Rita Alice Becker Approved by: Kathryn Kocher
Thesis Advisor
Elda Pema Second Reader
Douglas A. Brook, Dean Graduate School of Business and Public Policy

iv
THIS PAGE INTENTIONALLY LEFT BLANK
v
ABSTRACT This thesis examines factors that influence the
retention of enlisted members in pay grades E1-E5 and E6 in
the Selected Navy Reserve. Data were extracted from the
2000-2001 Navy Reserve Career Decisions Survey. Chi-square
tests of independent were used to assess the relationship
of various demographic, unit-type, critical-rate, and
reserve experience variables to plans for retention to
retirement eligibility. Thirteen factors significantly
associated with planned retention for E1-E5’S and ten for
E6’S are identified. E6’S indicate a higher retirement
intention rate than do E1-E5’S. For both pay grade groups,
males indicate a higher retirement intention rate than do
females and married members indicate a higher retirement
intention rate than do non-married members. E1-E6 Prior
Service members indicate a higher retirement intention rate
than do E1-E6 Non Prior Service members. For both groups,
Reserve Center/Readiness Command unit type is positively
associated with planned retention while aviation and
shipboard unit types are not significantly related. For
E1-E5’S, retirement intent is positively related to serving
in a critical rating, while it is not for E-6’S. For E1-
E6’S, retention plans are also strongly dependent on
opinions about quality of training, accomplishment
recognition, family impact, civilian job impact,
educational benefits and senior leadership.

vi
THIS PAGE INTENTIONALLY LEFT BLANK
vii
TABLE OF CONTENTS
I. INTRODUCTION ............................................1 A. PURPOSE ............................................1 B. HISTORY AND BACKGROUND .............................1 C. RESERVE CATEGORIES .................................2
1. Ready Reserve .................................2 2. Standby Reserve ...............................3 3. Retired Reserve ...............................3
D. CHARACTERISTICS OF THE NAVY RESERVE: COMPARISON WITH OTHER RESERVE COMPONENTS AND CIVILIAN POPULATION .........................................3 1. Gender ........................................3 2. Marital Status ................................4 3. Prior Service Status ..........................5 4. Representation within Occupations .............6 5. Age ...........................................8
D. SCOPE AND METHODOLOGY ..............................9 E. ORGANIZATION OF STUDY ..............................9
II. LITERATURE REVIEW ......................................11 A. INTRODUCTION ......................................11 B. STUDIES ...........................................12
1. Retention ....................................12 2. Mobilization .................................14 3. Continuation .................................15 4. NRF Unit Retention ...........................15 5. Affiliation ..................................15
III. DATA, MAKEUP OF RESPONDENTS, METHODOLOGY, MODELS AND VARIABLE SELECTION .....................................17 A. DATA ..............................................17
1. Survey Description ...........................17 2. Cleaning the Data ............................18
B. MAKEUP OF RESPONDENTS .............................20 1. Gender .......................................20 2. Rank .........................................20
a. E1-E5 Enlisted Respondents ..............20 b. E6 Enlisted Respondents .................20 C. E1-E5/E6 years of Experience ............20
C. CHI-SQUARE METHODOLOGY ............................21 D. MODELS AND VARIABLE SELECTION .....................22
1. Focus Variable: Retirement Intent ...........22 2. Associated Variables .........................23
a. Demographic and Military Background Variables ...............................24

viii
b. Unit Type Variables .....................28 c. Rate Variables ..........................30 d. Reserve Experience Variables ............30
IV. RESULTS OF CHI-SQUARE ANALYSIS .........................35 A. DEMOGRAPHIC VARIABLES .............................35
1. Male/Female ..................................35 2. Marital Status ...............................36 3. Prior Service Status .........................38
B. UNIT TYPE VARIABLES ...............................39 1. Aviation Unit ................................40 2. Reserve Center/Readiness Command Unit ........41 3. Shipboard Unit ...............................41
C. CRITICAL RATE VARIABLES ...........................42 D. RESERVE EXPERIENCE VARIABLES ......................44
1. Quality of Training ..........................44 2. Accomplishment Recognition ...................45 3. Family Impact ................................46 4. Civilian Job Impact ..........................47 5. Educational Benefits .........................48 6. Senior Leadership (CO/XO) ....................49
V. SUMMARY, CONCLUSIONS, AND RECOMMENDATIONS ..............51 A. LIMITATIONS OF THE STUDY ..........................51 B. SUMMARY AND RECOMMENDATIONS .......................51
1. Gender .......................................51 2. Marital Status ...............................52 3. Prior Service Status .........................53 4. Unit Type ....................................53 5. Critical Rates ...............................54 6. Reserve Experience ...........................54
a. Quality of Training .....................54 b. Accomplishment Recognition ..............55 c. Family Impact ...........................56 d. Civilian Job Impact .....................57 e. Educational Benefits ....................57 f. Senior Leadership (CO/XO) ...............58
C. CONCLUSIONS .......................................59 APPENDIX: CODE BOOK .........................................61 LIST OF REFERENCES ..........................................75 INITIAL DISTRIBUTION LIST ...................................79
ix
LIST OF TABLES
Table 1: FY2001 Enlisted SELRES by Gender ...................3 Table 2: FY2001 Enlisted SELRES and Marital Status ..........4 Table 3: FY2001 SELRES Prior Service Status .................5 Table 4: Enlisted Occupational Areas and Codes ..............6 Table 5: FY2001 Reserve and Active Distribution of
Enlisted Occupations by Service Component ..........7 Table 6: FY2001 SELRES Enlisted by Age and Component ........8 Table 7: Survey Respondent Numbers and Percentages .........17 Table 8: Rank Distribution Chart for Critical Rates ........19 Table 9: E1-E5/E6 comparison accumulated Years as SELRES
and accumulated Total Years of Service ............20 Table 10: Current Career Intention Responses ................23 Table 11: Focus Variable, Retirement intention, used in all
Chi-square Cross-Tabulations ......................23 Table 12: E1-E5/E6 and yes_retire variable ..................23 Table 13: Continuation rates for NAVET and APG/OS members ...27 Table 14: E1-E5/E6 Unit Type Populations ....................28 Table 15: E1-E5/E6 Male/Female and yes_retire variable ......35 Table 17: E1-E5/E6 Male/Female, Married/Non-married and
yes-retire variable ...............................38 Table 18: NPS/Prior Service and yes_retire variable .........39 Table 19: E1-E5/E6 Unit Type with yes_retire variable .......40 Table 20: E1-E5/E6, Critical/Non-Critical Rate with
yes_retire variable ...............................43 Table 21: Training and yes_retire variable ..................44 Table 22: Recognition and yes_retire variable ...............45 Table 23: Family impact and yes_retire variable .............46 Table 24: Civilian job impact and yes_retire variable .......47 Table 25: Educational benefits and yes_retire variable ......48 Table 26: CO/XO leadership and yes_retire variable ..........49

x
THIS PAGE INTENTIONALLY LEFT BLANK

xi
ACKNOWLEDGMENTS
First and foremost I thank God for getting me through
Naval Postgraduate School.
My thesis advisor, Kathy Kocher, is an extremely
patient person who I can not thank enough. You are a kind
person who possesses an incredible passion for helping
people. Professor Kocher, thank you so much for taking the
time to work with me over these past months. I think you
are wonderful!!
My second reader, Elda Pema, loves to teach and is
outstanding at it. Thank you for all of the tutor sessions
taken out of your own time to help our Econometrics class.
Many thanks, Professor Pema for agreeing to be my second
reader when no one else was available.
A special thank-you to my landlady, Carrol, who has
become such a great friend and like a second mom to me. I
will miss you, Carrol.
Lastly, I thank all of the rest of my family and
friends for supporting me through my time at NPS. I really
couldn’t have done it without you.

xii
THIS PAGE INTENTIONALLY LEFT BLANK

1
I. INTRODUCTION
A. PURPOSE
This thesis examines the retirement intent of enlisted
Navy Reservists in the paygrades of E1-E6. Navy Reserve
attrition is approximately 30% annually. “The majority of
Navy reservists who decide to leave the Navy Reserves do so
within their first year of service. The goal of this
thesis is to identify those areas that help to retain Navy
Reservists in order to ensure future enhancement of those
programs and/or conditions.
B. HISTORY AND BACKGROUND
The website of Commander, Navy Reserve Force, Vice
Admiral John G. Cotton states the mission and importance of
the Navy Reserves.
The mission of the U.S. Navy Reserve Force is to provide mission-capable units and individuals to the Navy-Marine Corps Team throughout the full range of operations from peace to war.
In today's environment this new mandate takes on added meaning and responsibilities as the Navy Reserve Force is called on to play an increasingly active role in the day to day planning and operational requirements of the active Navy. The Navy Reserve represents 20% of the Navy's total assets and is a significant force multiplier the fleet must have to meet its growing global commitments. (Ref 1)
In his testimony before the Senate’s Armed Forces
Committee, Vice Admiral Cotton noted that more than 28,000
Navy Reservists have been mobilized since 9/11 and nearly
12,000 served on active duty during the peak of Operation
Iraqi Freedom (OIF) in May 2003. (Ref 2) Additionally,
VADM Cotton quoted the Chief of Naval Operations (CNO) ADM
2
Vern Clark, “Change to make us better is completely
necessary…to make our Navy even better and to build the
21st century Navy, and the Reserve is a key part of our
growth and our future.” (Ref 3)
C. RESERVE CATEGORIES
The United States has approximately 690,000 Navy
Reservists. Navy Reservists fall into one of three
categories: Ready Reserve, Standby Reserve (Active or
Inactive), or the Retired Reserve.
1. Ready Reserve
The Ready Reserve is composed of Selected Reserve
(SELRES), and Individual Ready Reserve (IRR) personnel. In
2002 the Ready Reserve membership was as follows: SELRES
87,913 and IRR 80,541, which together, as the Ready
Reserve, totaled 168,454. (Ref 4) As of May 18, 2005 a
total of 3,574 Navy Reserve SELRES personnel were mobilized
in support of the Global War on Terror. (Ref 5)
The Navy’s SELRES are the principal source of trained
units and personnel to augment the active forces in time of
war or national emergency. SELRES are those members who
are allowed to participate in monthly drills for pay,
extended Active Duty for Special Work (ADSW), or Active
Duty for Training (ADSW). Additionally, Full Time Support
members (primarily those members who man the nation’s Navy
Reserve Centers on an active duty basis) are SELRES. (Ref
6)
The IRR consists of pre-trained personnel who either
drill in a Voluntary Training Unit (VTU) or do not drill.
Most IRR personnel who do not drill have recently served on
active duty. (Ref 6)

2. Standby Reserve
Members of the Standby Reserve will be mobilized if
there are not enough qualified SELRES or IRR members to
meet requirements. The Standby Reserve consists of Active
and Inactive members. Standby Reserve-Active individuals
possess desired mobilization skills. They are in an active
status and eligible to participate in a Navy Reserve
program without pay for retirement point credit. Standby
Reserve-Inactive reservists are in an inactive status. (Ref
6)
3. Retired Reserve
Mobilized retirees will be used primarily to staff
continental United States installations. All naval retired
personnel are grouped into three classes: Class I (retired
less than 5 years, under age 60, and fully eligible for
recall), Class II (retired more than 5 years, under age 60,
and fully eligible for recall), and Class III (Retirees
either over age 60 or disabled).(Ref 6)
D. CHARACTERISTICS OF THE NAVY RESERVE: COMPARISON WITH OTHER RESERVE COMPONENTS AND CIVILIAN POPULATION
1. Gender
Table 1 shows the percentages of male and female
military reservists throughout the Department of Defense
for Fiscal Year 2001 (FY2001) as well as the gender
distribution for civilians 18 to 49 years old.
Table 1: FY2001 Enlisted SELRES by Gender
FY 2001 Selected Reserve Enlisted Members, by Gender and Component, and Civilian Labor Force 18-49 Years Old (Percent)
Army Army Naval Marine Air Air 18 to 49Gender National Reserve Reserve Corps National Force Total DoD Year Old
Guard Reserve Guard Reserve CiviliansMale 87.6 75.0 79.4 95.3 82.4 78.4 83.0 53.4Female 12.4 25.0 20.6 4.7 17.6 21.6 17.0 46.6
3
Source: Office of the Under Secretary of Defense
Personnel and Readiness (Ref 7)
Among the reserve components, the highest percentage
of females is in the Army Reserve at 25.0% with Air Force
Reserve second at 21.6%. The Navy Reserve female
percentage is a close third in rank with 20.6% as the
female manpower proportion. Gender alignment correlates to
unit mission requirements. For example, combat units
normally maintain a higher percentage of males, due to
Congressional laws which do not allow females in front line
combat positions. (Ref 7).
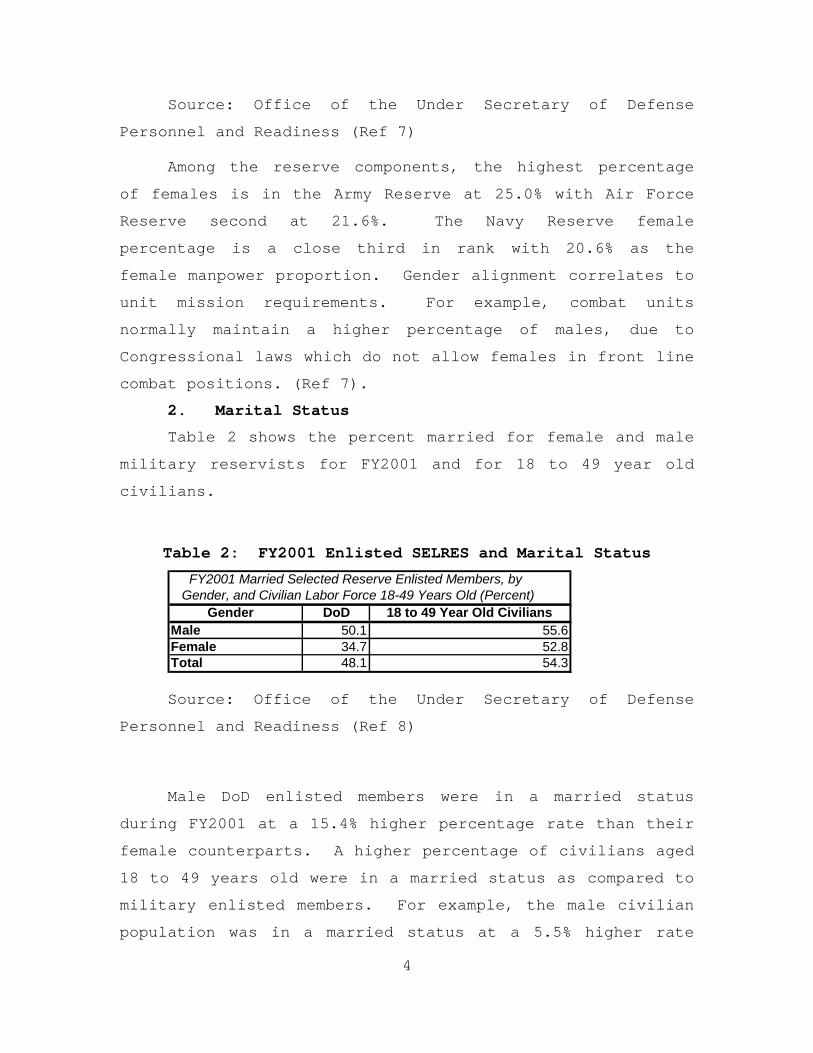
2. Marital Status
Table 2 shows the percent married for female and male
military reservists for FY2001 and for 18 to 49 year old
civilians.
Table 2: FY2001 Enlisted SELRES and Marital Status
FY2001 Married Selected Reserve Enlisted Members, by Gender, and Civilian Labor Force 18-49 Years Old (Percent) Gender DoD 18 to 49 Year Old CiviliansMale 50.1 55.6Female 34.7 52.8Total 48.1 54.3
Source: Office of the Under Secretary of Defense
Personnel and Readiness (Ref 8)
Male DoD enlisted members were in a married status
during FY2001 at a 15.4% higher percentage rate than their
female counterparts. A higher percentage of civilians aged
18 to 49 years old were in a married status as compared to
military enlisted members. For example, the male civilian
population was in a married status at a 5.5% higher rate
4

than the male military enlisted members. In the age group
of 18 to 49, female enlisted members are on average younger
than the same age group (18 to 49) of female civilians.
This may partially account for the fact that the female
civilian population had a status of being married at an
18.1% higher rate than the female military enlisted
members. (Ref 8).
3. Prior Service Status
Table 3 shows FY2001 DoD Non-Prior Service (NPS) and
Prior Service accessions with each corresponding enlisted
end-strength for all Reserve components.
Table 3: FY2001 SELRES Prior Service Status
FY 2001 Selected Reserve Non-Prior Service and Prior Service Enlisted Accessions
Enlisted AccessionsPrior Service
Components Non-Prior Prior Total Percent ofService Service Accession
TotalArmy NationalGuard 33,405 28,942 62,347 46.4Army Reserve 20,801 24,461 45,262 54.0Navy Reserve 3,652 16,002 19,654 81.4USMC Reserve 5,845 3,704 9,549 38.8Air National Guard 5,844 5,198 11,042 47.1Air Force Guard 2,603 5,971 8,574 69.6DoD Total 72,150 84,278 156,428 53.9
Source: Office of the Under Secretary of Defense
Personnel and Readiness (Ref 9)
Prior service accessions are those members who leave
active duty and join the reserves. Prior service
accessions bring to the reserves great amounts of training
and active duty experience. This active duty experience is
invaluable to the reserves; it helps to increase reserve
5

mobilization readiness with little or no training costs.
As Table 3 shows, the Navy Reserve had the highest percent
of prior service accessions (84.1%) during FY2001. After
the late 1990’s, attrition from active duty began to slow
down which created a smaller pool of prior service members
from which the reserve components could recruit. (Ref 9)
4. Representation within Occupations
Table 4 lists the enlisted occupational areas of
reserve and active duty members. Enlisted jobs are
categorized into ten occupational areas numbered 0 to 9.
The Navy numbers their rating groups 1 to 10 with group 7
(Mechanical equipment repair) divided into 7A (aviation)
and 7S (surface).
Table 4: Enlisted Occupational Areas and Codes
Reserve and Active Enlisted Occupational Areas Occupational Code and Area
0 Infantry, Gun Crews, and Seamanship Specialist1 Electronic Equipment Repairers2 Communications and Intelligence Specialists3 Medical and Dental Specialists4 Other Allied Specialists5 Functional Support and Administration6 Electrical/Mechanical Equipment Repairers7 Craftsmen8 Service and Supply Handlers9 Non-occupational
Source: Author, derived from Office of the Under
Secretary of Defense Personnel and Readiness (Ref 10)
Military personnel are placed into occupational areas
based primarily on military requirements, personnel
qualifications, preferences, and personal availability.
Each service has different mission requirements that are
reflected in each service’s occupations. (Ref 10)
6
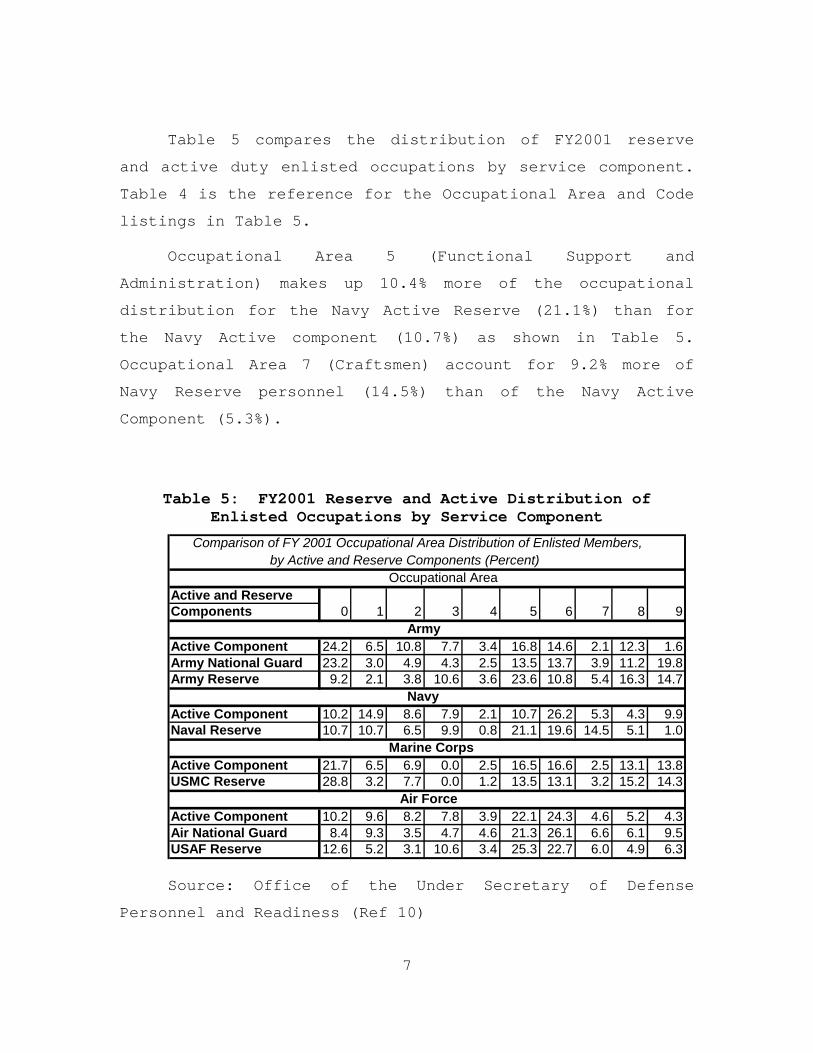
Table 5 compares the distribution of FY2001 reserve
and active duty enlisted occupations by service component.
Table 4 is the reference for the Occupational Area and Code
listings in Table 5.
Occupational Area 5 (Functional Support and
Administration) makes up 10.4% more of the occupational
distribution for the Navy Active Reserve (21.1%) than for
the Navy Active component (10.7%) as shown in Table 5.
Occupational Area 7 (Craftsmen) account for 9.2% more of
Navy Reserve personnel (14.5%) than of the Navy Active
Component (5.3%).
Table 5: FY2001 Reserve and Active Distribution of
Enlisted Occupations by Service Component
7
9
Comparison of FY 2001 Occupational Area Distribution of Enlisted Members, by Active and Reserve Components (Percent)
Occupational Area Active and ReserveComponents 0 1 2 3 4 5 6 7 8
ArmyActive Component 24.2 6.5 10.8 7.7 3.4 16.8 14.6 2.1 12.3 1.6Army National Guard 23.2 3.0 4.9 4.3 2.5 13.5 13.7 3.9 11.2 19.8Army Reserve 9.2 2.1 3.8 10.6 3.6 23.6 10.8 5.4 16.3 14.7
NavyActive Component 10.2 14.9 8.6 7.9 2.1 10.7 26.2 5.3 4.3 9.9Naval Reserve 10.7 10.7 6.5 9.9 0.8 21.1 19.6 14.5 5.1 1.0
Marine CorpsActive Component 21.7 6.5 6.9 0.0 2.5 16.5 16.6 2.5 13.1 13.8USMC Reserve 28.8 3.2 7.7 0.0 1.2 13.5 13.1 3.2 15.2 14.3
Air ForceActive Component 10.2 9.6 8.2 7.8 3.9 22.1 24.3 4.6 5.2 4.3Air National Guard 8.4 9.3 3.5 4.7 4.6 21.3 26.1 6.6 6.1 9.5USAF Reserve 12.6 5.2 3.1 10.6 3.4 25.3 22.7 6.0 4.9 6.3
Source: Office of the Under Secretary of Defense
Personnel and Readiness (Ref 10)
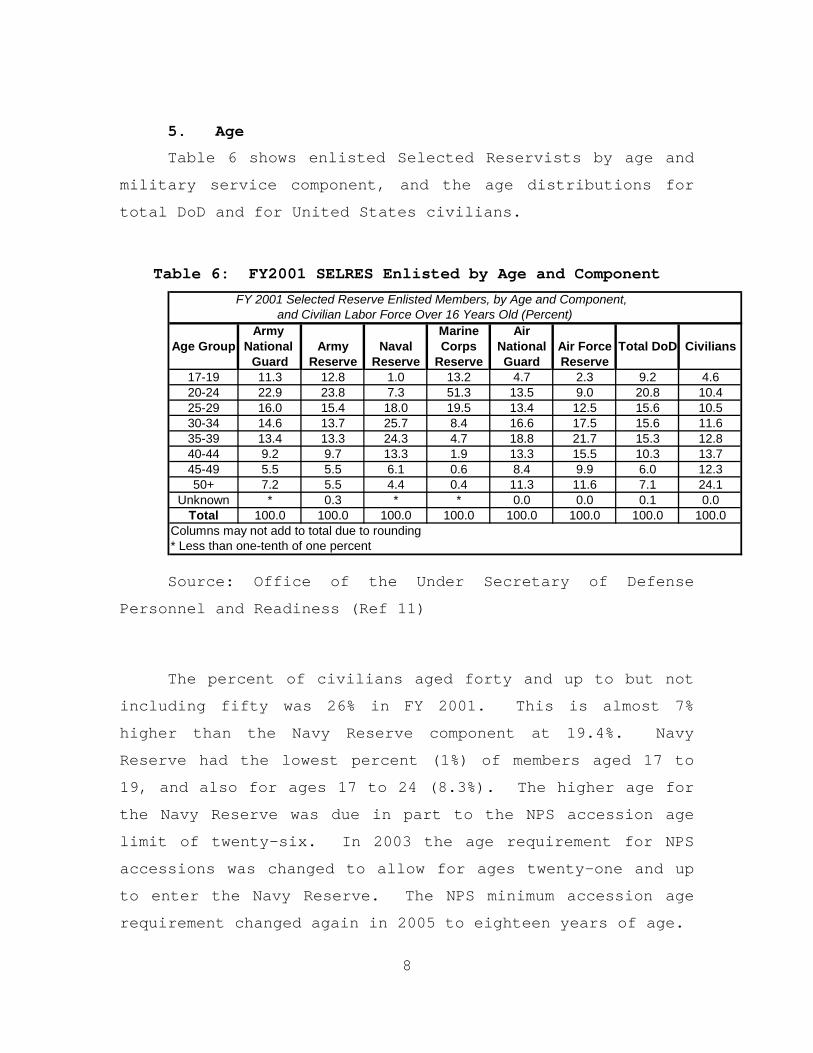
5. Age
Table 6 shows enlisted Selected Reservists by age and
military service component, and the age distributions for
total DoD and for United States civilians.
Table 6: FY2001 SELRES Enlisted by Age and Component
FY 2001 Selected Reserve Enlisted Members, by Age and Component, and Civilian Labor Force Over 16 Years Old (Percent)
Army Marine AirAge Group National Army Naval Corps National Air Force Total DoD Civilians
Guard Reserve Reserve Reserve Guard Reserve17-19 11.3 12.8 1.0 13.2 4.7 2.3 9.2 4.620-24 22.9 23.8 7.3 51.3 13.5 9.0 20.8 10.425-29 16.0 15.4 18.0 19.5 13.4 12.5 15.6 10.530-34 14.6 13.7 25.7 8.4 16.6 17.5 15.6 11.635-39 13.4 13.3 24.3 4.7 18.8 21.7 15.3 12.840-44 9.2 9.7 13.3 1.9 13.3 15.5 10.3 13.745-49 5.5 5.5 6.1 0.6 8.4 9.9 6.0 12.350+ 7.2 5.5 4.4 0.4 11.3 11.6 7.1 24.1
Unknown * 0.3 * * 0.0 0.0 0.1 0.0Total 100.0 100.0 100.0 100.0 100.0 100.0 100.0 100.0
Columns may not add to total due to rounding* Less than one-tenth of one percent
Source: Office of the Under Secretary of Defense
Personnel and Readiness (Ref 11)
The percent of civilians aged forty and up to but not
including fifty was 26% in FY 2001. This is almost 7%
higher than the Navy Reserve component at 19.4%. Navy
Reserve had the lowest percent (1%) of members aged 17 to
19, and also for ages 17 to 24 (8.3%). The higher age for
the Navy Reserve was due in part to the NPS accession age
limit of twenty-six. In 2003 the age requirement for NPS
accessions was changed to allow for ages twenty-one and up
to enter the Navy Reserve. The NPS minimum accession age
requirement changed again in 2005 to eighteen years of age.
8

9
Each reserve component has different mission
requirements and these diverse missions require varying age
ranges. For example, arduous duty associated with ground
combat may require greater numbers of younger members while
occupations that require large amounts of training and
experience may require higher ranking members who are
older. (Ref 11)
D. SCOPE AND METHODOLOGY
This study focuses on several different areas with
regard to Navy Reserve retention. The 2000-2001 Navy
Reserve Career Decisions Survey supplied by Michael A.
White, Ph.D of the Navy Personnel Research, Studies &
Technology (NPRST) office in Millington, Tennessee was the
source of data used in this thesis. Variables requested
from NPRST totaled fifty-six and fell into the following
categories: Demographic, Career in the Navy Reserve, Navy
Reserve job/working conditions, Personal and family life,
and Navy Reserve culture. From the list of fifty-six
variables, fourteen were chosen for analysis. Chi-square
tests of independence were used to conduct statistical
analyses. This type of statistical analysis tests the null
hypothesis of independence between the focus and associated
variable for each set of cross-tabulations.
E. ORGANIZATION OF STUDY
E1-E6 enlisted Navy Reserve survey respondents were
the population studied for this thesis. In an effort to
determine those members in first or second enlistment
categories, the paygrades were divided into the categories
of E1-E5 and E6 Navy Reservists. Active duty members
typically promote into E4 or E5 prior to the end of their
first enlistment. E1-E5 represents Navy Reservists who are

10
in their first term of enlistment; E6 represents Navy
Reservists who are past their first term of enlistment.
Retirement intention was examined by the following
categories: gender, marital status, prior service status,
unit type, critical (undermanned) rates, and reserve
experience.
Chapter II focuses on literature review pertaining to
Naval Reserve and other service retention studies. These
retention studies suggested variables to be included in the
construction of chi-square models.
Chapter III describes the survey organization and data
recoding procedures. Explanation of respondent makeup
includes specific information on gender and rank
categories. Chi-square statistical analysis is explained
including specification of null and alternative hypotheses
and contingency table interpretation and also includes
hypothesized relationships between focus and associated
variables.
Chapter IV presents the results of Chi-square analysis
from cross-tabulations and the resulting relationships
between focus and associated variables.
Chapter V summarizes the focus and associated variable
relationships and suggests policies to improve Navy Reserve
retention based on the results of the study.
11
II. LITERATURE REVIEW
A. INTRODUCTION
Upon the signing of his or her initial contract, a
Navy sailor incurs an eight-year obligation. If the sailor
begins his or her Navy career on active duty, the first
enlistment obligation is normally four years with the
remaining four years to be spent by the sailor making one
of the following choices: another four-year active duty
enlistment, a two-year extension, a four-year contract as a
drilling Selected Reservist with the Navy Reserves, or four
years spent in the IRR. After this initial eight-year
period is completed, the sailor is no longer obligated to
military service. Non-Prior Service members also incur an
eight-year initial obligation, with the first contract
normally being for four years participating in the SELRES
community, and thereafter making a decision to re-enlist
for another four-year period, extending for a two-year
period or spending the remaining obligation in the IRR or
converting to active duty (subject to the availability of
job openings).
This study looks at the intentions of enlisted
drilling selected reservists (SELRES) to stay in the Navy
Reserve until they are retirement eligible. While no prior
studies have looked specifically at Navy Reservist’s
retirement intentions, a number of researchers have looked
at related issues including planned and actual retention,
effects of mobilization, influences on continuation, and
affiliation of veterans of the Navy Reserve.
12
B. STUDIES
1. Retention
Kirby et al. (1997) studied the costs and benefits of
reserve participation and their effect on retention
decisions. Comparisons were made between surveys from
FY1986 and FY1992. The study found that 50% of survey
participants from both fiscal year surveys ranked three
reasons for staying in the selected reserves above all
others: retirement benefits, pride in accomplishment, and
service to country. Enlisted personnel reported an
improvement in their civilian employer’s attitude toward
the reservist’s required drill/annual training time spent
away from their full time employment lessening the
reservist’s stress over being away from their civilian job.
Before Operations Desert Shield and Storm (ODS/S), civilian
employers reportedly felt as though reserve obligations
away from the civilian job were a greater inconvenience to
the employer. After ODS/S, reservists reported that
civilian employers were more understanding of the reserve
requirements, seeing reserve obligations in a more positive
light. Spouses of enlisted reservists were very favorable
toward reserve participation, helping to encourage the
reservists to stay in the reserves. In 1992 when enlisted
members were asked if they would reenlist in the reserves,
there were larger percentages of those who reported no
plans to do so than there were in 1986. In the category of
“No Chance” (of re-enlisting) E-7 reservists replies went
from 7.1% in 1986 to 17.2% in 1992. (Ref 12)
Rickets (1989) conducted a multivariate analysis of
reenlistment intentions of Navy Reservists. She found that
“Bonus payments, unit morale, acquaintances and

13
friendships, mobilization income, and opportunity to serve
one’s country were the non-traditional variables found to
positively influence an individual’s decision to remain in
the reserves.” (Rickets, 1988) As age increased, retention
increased. Education and training were found to have a
positive impact on retention. Satisfaction with pay had a
positive relationship with retention and the author made
the recommendation to keep reserve pay in alignment with
civilian part-time pay in an effort to keep retention at a
higher level. (Ref 13)
Kostiuk et al., (1988) focused on the behavior of navy
veterans stating that they make up the greatest percentage
of affiliates for the Navy Reserve. This study examined
retention rates as they related to pay and affiliation
bonuses for a group of 100 Navy veterans leaving active
duty. The results of the analysis showed affiliation
bonuses and pay changes strongly affected affiliation or
retention and in some cases both and that targeted bonuses
could greatly help to shape manpower levels for critical
rates. (Ref 14)
Kostiuk and Follman (1988) examined the effects of pay
on retention on NAVETs in the Selected Navy Reserve. Women
and non-white personnel were found to be more likely to
affiliate. Paygrade differences also affected retention in
this study. Higher paygrade reservists may be more likely
to remain because they have acquired more training and are
more familiar with Navy service. The different
occupational areas (see Table 4) were examined in relation
to retention. Group 3 (medical/dental) was found to have
the highest retention. First-year retention was most
affected by pay and education level variables. In general,

14
high paygrades are associated with high retention. Gender
has a fairly strong effect in this study with women
remaining in the reserves for a longer period of time than
men. Marital status for this study had very little impact
on retention levels indicating that married life was not
significantly impacted by Navy Reserve service. (Ref 15)
Fithian (1988) analyzed retention decisions of male,
first-term enlisted Selected Army Reservists. The study
found that those who were dissatisfied with in reserve
experience areas such as training, supervision/direction
received during drill time, and unit morale were less
likely to stay in the reserves. Prior service members were
found to have higher retention rates than non-prior service
members, 1.6% higher in National Guard and 25.3% in the
Army Reserve. (Ref 16)
Boykin and Merritt (1979) examined Navy Reserve
retention within Readiness Command Region Seven. This
study found that nearly all of the reservists planned on
staying in the reserves. For example, over half of the
reservists questioned gave themselves a 90% chance of
remaining in the reserves for an additional year and an 80%
chance of staying in until retirement. Married men were
more likely to stay in the reserves than non-married men.
At the time of the survey, only 9% of the SELRES population
in this particular region was female. The two most
important reasons members cited as having influenced them
to affiliate with the Navy Reserves were drill pay and
retirement. (Ref 17)
2. Mobilization
Kirby and Naftel (1998) examined the effect that
mobilization has on enlisted reservists, particularly after
15
Operation Desert Shield/Storm. Reserve pay had a positive
and significant effect on retention for non-prior and prior
service reservists. Retirement benefits were important to
both male and female reservists. (Ref 18)
3. Continuation
Kominiak (1997) studied the reasons why Army
reservists stop participating in drills. The top reasons
noted by the Army reservists involved training and
leadership. Reservists noted that they felt leadership was
lacking when problems needed to be resolved, and after the
reservist had left the unit, little or no attempt was made
to try and gain them back into a drilling status. (Ref 19)
4. NRF Unit Retention
Shiells and Reese (1988) examined retention between
Navy Reserve Force (NRF) ship units and non-NRF ship units.
Regarding differences in unit retention, during FY1986 and
FY1987 42.3% of NRF unit SELRES left their units each year.
Personnel transferred to non-NRF units at the rate of 10.7%
which gave an overall NRF unit attrition of 31.6%. This
compared to an overall SELRES loss rate of 28%.
Continuation rates for NRF unit personnel start out at a
higher percentage (62.5% for paygrades E1-E2), and then
drop to 46.9% for paygrade E4 and increase again to the
highest continuation rate in paygrades E7-E9 (72.3%). (Ref
20)
5. Affiliation
Shiells (1986) examined affiliation of Navy veterans
with the Navy Reserves. Pay was determined to have a
significant and positive impact on Navy veterans
affiliating with the Navy Reserves in six of the eleven
Navy occupational rating groups. Females and non-
caucasians affiliate at a higher level than do males and

16
caucasian personnel, in some cases females and non-
caucasian personnel affiliate at twice the percentage level
as caucasian male NAVETS. (Ref 21)
III. DATA, MAKEUP OF RESPONDENTS, METHODOLOGY, MODELS AND VARIABLE SELECTION
A. DATA
1. Survey Description
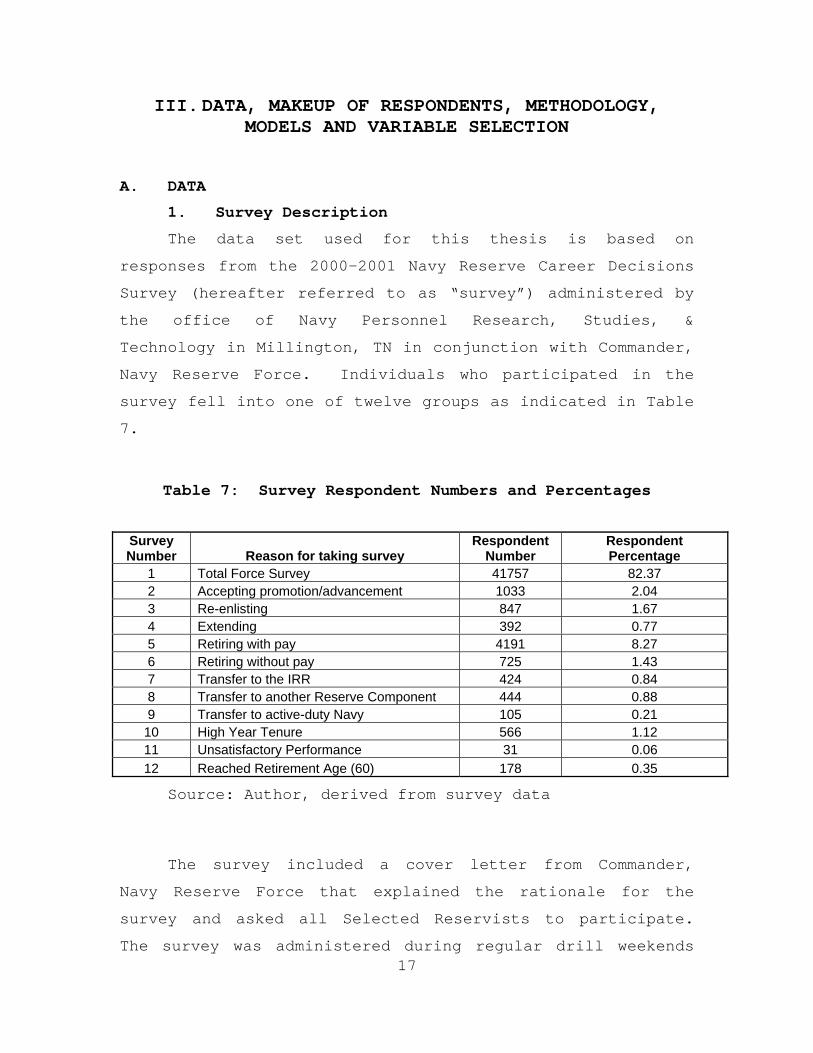
The data set used for this thesis is based on
responses from the 2000-2001 Navy Reserve Career Decisions
Survey (hereafter referred to as “survey”) administered by
the office of Navy Personnel Research, Studies, &
Technology in Millington, TN in conjunction with Commander,
Navy Reserve Force. Individuals who participated in the
survey fell into one of twelve groups as indicated in Table
7.
Table 7: Survey Respondent Numbers and Percentages
Survey Number Reason for taking survey
Respondent Number
Respondent Percentage
1 Total Force Survey 41757 82.37 2 Accepting promotion/advancement 1033 2.04 3 Re-enlisting 847 1.67 4 Extending 392 0.77 5 Retiring with pay 4191 8.27 6 Retiring without pay 725 1.43 7 Transfer to the IRR 424 0.84 8 Transfer to another Reserve Component 444 0.88 9 Transfer to active-duty Navy 105 0.21
10 High Year Tenure 566 1.12 11 Unsatisfactory Performance 31 0.06 12 Reached Retirement Age (60) 178 0.35
Source: Author, derived from survey data
17
The survey included a cover letter from Commander,
Navy Reserve Force that explained the rationale for the
survey and asked all Selected Reservists to participate.
The survey was administered during regular drill weekends

18
at reserve centers across the nation. Participants were
limited to members of the Selected Reserve (SELRES) who
were in an active drilling status. Additionally,
Commander, Navy Reserve Forces sent out an official message
to the SELRES encouraging them to take the survey and
directing their Commanding Officers or Officers in Charge
to allow survey participation during drill time. Response
rate was approximately 70 percent. The survey’s data set
consisted of a total of 50,693 observations (participants)
who responded to 138 questions. The data set created for
this thesis included only enlisted members, which reduced
the total number of observations to 30,889. Variables
totaled 92, some of which were subsets of main questions.
All of the 128 individuals who did not answer the gender
question or any other questions were automatically excluded
from the calculations of this thesis. For this thesis,
only respondents that fell into the category of “Total
Force Survey” were used.
The survey divided the questionnaire items into
several different groups; Demographics, Overview, Your
Career in the Navy Reserve, Navy Reserve Job/Working
Conditions, Personal and Family Life, Navy Reserve Pay and
Benefits, Navy Reserve Culture, Leadership in the Navy
Reserve, and Other Employment Opportunities. With the
exception of the demographic questions, the majority of the
questions asked the member to identify how strongly each
item influenced him or her to stay in the reserves or
leave.
2. Cleaning the Data
Upon receiving the survey data set, several variables
had to be organized into useable formats. For instance,
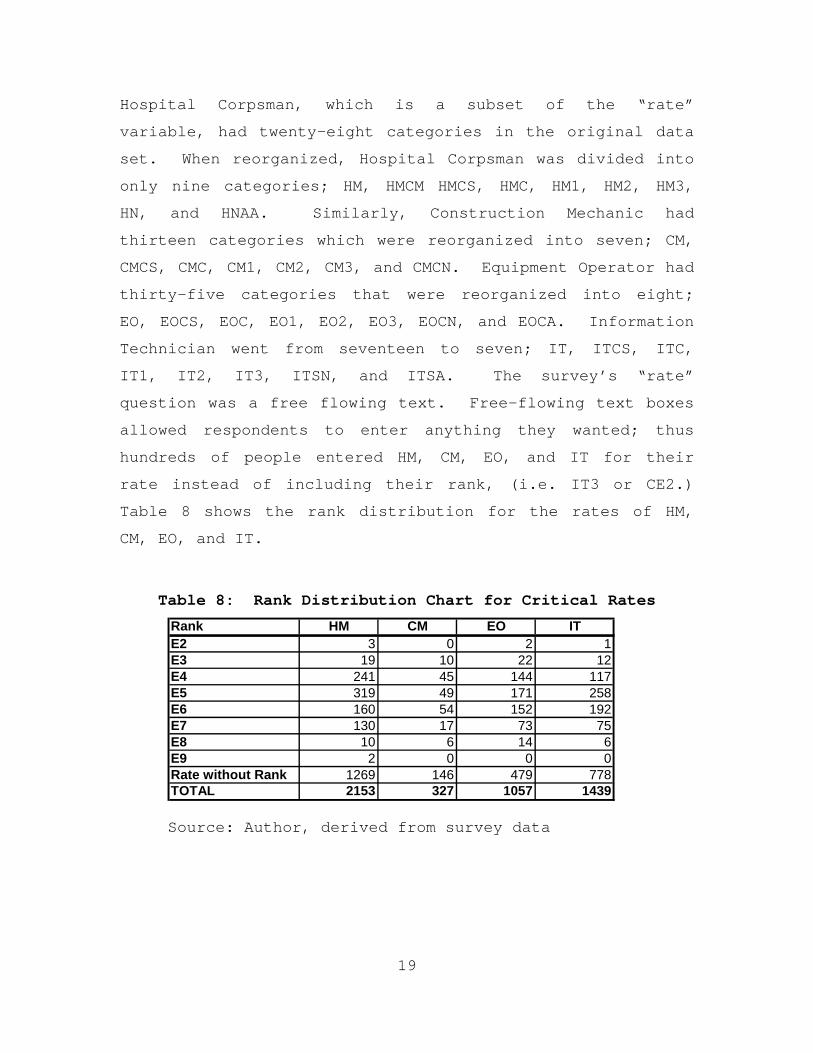
Hospital Corpsman, which is a subset of the “rate”
variable, had twenty-eight categories in the original data
set. When reorganized, Hospital Corpsman was divided into
only nine categories; HM, HMCM HMCS, HMC, HM1, HM2, HM3,
HN, and HNAA. Similarly, Construction Mechanic had
thirteen categories which were reorganized into seven; CM,
CMCS, CMC, CM1, CM2, CM3, and CMCN. Equipment Operator had
thirty-five categories that were reorganized into eight;
EO, EOCS, EOC, EO1, EO2, EO3, EOCN, and EOCA. Information
Technician went from seventeen to seven; IT, ITCS, ITC,
IT1, IT2, IT3, ITSN, and ITSA. The survey’s “rate”
question was a free flowing text. Free-flowing text boxes
allowed respondents to enter anything they wanted; thus
hundreds of people entered HM, CM, EO, and IT for their
rate instead of including their rank, (i.e. IT3 or CE2.)
Table 8 shows the rank distribution for the rates of HM,
CM, EO, and IT.
Table 8: Rank Distribution Chart for Critical Rates
Rank HM CM EO ITE2 3 0 2 1E3 19 10 22 12E4 241 45 144 117E5 319 49 171 258E6 160 54 152 192E7 130 17 73 75E8 10 6 14 6E9 2 0 0 0Rate without Rank 1269 146 479 778TOTAL 2153 327 1057 1439
Source: Author, derived from survey data
19
B. MAKEUP OF RESPONDENTS
1. Gender
Looking at the entire data set of E1-E6 respondents,
24,217 were male and 6,500 were female with 172 missing
observations. E1-E6 males made up 78.8% of survey
respondents and E1-E6 females made up 21.2% of survey
respondents.
2. Rank
a. E1-E5 Enlisted Respondents
In the category of E1-E5 personnel there were
22,311 respondents. Male respondents totaled 17,065 and
5,118 were female.
b. E6 Enlisted Respondents
E6 personnel totaled 8,578 respondents. Among
the E6 respondents, 7,152 were male and 1,382 were female.
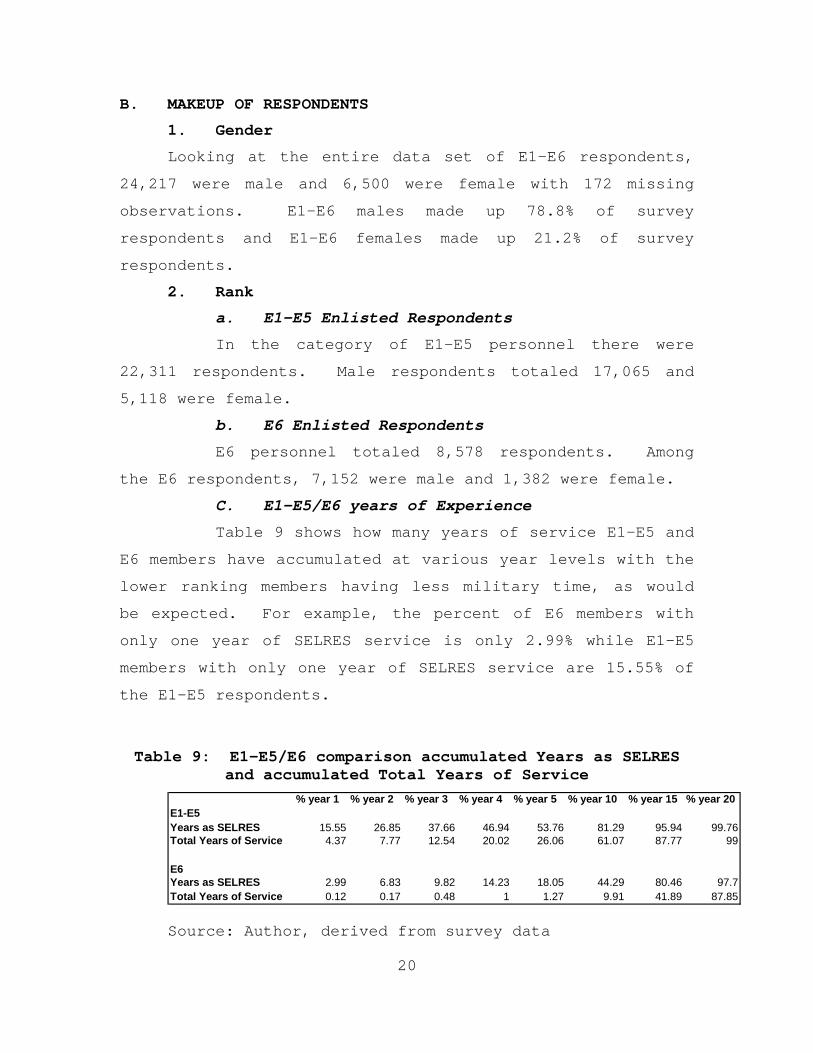
C. E1-E5/E6 years of Experience
Table 9 shows how many years of service E1-E5 and
E6 members have accumulated at various year levels with the
lower ranking members having less military time, as would
be expected. For example, the percent of E6 members with
only one year of SELRES service is only 2.99% while E1-E5
members with only one year of SELRES service are 15.55% of
the E1-E5 respondents.
Table 9: E1-E5/E6 comparison accumulated Years as SELRES and accumulated Total Years of Service
% year 1 % year 2 % year 3 % year 4 % year 5 % year 10 % year 15 % year 20E1-E5Years as SELRES 15.55 26.85 37.66 46.94 53.76 81.29 95.94 99.76Total Years of Service 4.37 7.77 12.54 20.02 26.06 61.07 87.77 99
E6Years as SELRES 2.99 6.83 9.82 14.23 18.05 44.29 80.46 97.7Total Years of Service 0.12 0.17 0.48 1 1.27 9.91 41.89 87.85
Source: Author, derived from survey data
20

21
C. CHI-SQUARE METHODOLOGY
The Chi-square test for a contingency table tests the
null hypothesis of independence between two variables.
“Chi-square can be used to summarize the intersections of
focus and associated variables and understand the
relationship (if any) between those variables.” (Ref 22)
The Chi-square methodology cross-tabulates the variables in
row and column positions and produces corresponding
percentages. The null hypothesis of a Chi-square test
states that the row and column variables are independent of
or not related to each other. For example, with a row
variable of “gender” and column variable of “retirement
intent,” the null hypothesis would state that gender is not
related to retirement intentions; males and females plan on
retiring at approximately the same percentage rate. The
alternative hypothesis states that the row and column
variables are not independent of each other. Using the
same example, the alternate hypothesis would state that
gender is related to retirement intentions; being male or
female makes a difference regarding retirement intentions.
Each row and column binary variable takes no additional
variables into account, as would be the case in multiple
regression.
The Chi-square test will yield a probability value or
“p-value” that determines if the null hypothesis should not
be believed (rejected) or be believed (not rejected.)
Because the tests being conducted are from a sample of the
entire SELRES population, we can never really be 100% sure
that the test results are accurate; there are many SELRES
that didn’t take the survey making the results from this
survey a guess. This is why the null hypothesis is said to

22
be “rejected”, but never said to be “accepted,” as
“acceptance” infers 100% validity of the test results. If
the p-value is very small (normally accepted limits are
10%, 5%, or 1%) the null hypothesis will be rejected in
favor of the alternate hypothesis.
The statistics calculated for this thesis were
constructed through the use of the Chi-square tests on 2X2
contingency tables. In order to use Chi-square tests for
2X2 contingency tables, all variables are recoded as dummy
or binary variables. Dummy variables are constructed
having the value of 1 representing the presence of the
characteristic being studied and a zero representing the
absence of the characteristic. For example, gender is
measured using a variable that identifies male = 1 and
“non-male”, or female, = 0.
D. MODELS AND VARIABLE SELECTION
1. Focus Variable: Retirement Intent
The question that asked about the participant’s
current career intentions along with the statement “I
intend to stay in the Navy Reserves until I am eligible to
retire” became the focus variable for this thesis and is
used in all cross-tabulation equations and Chi-square
tests. Chi-square and cross-tabulation equations are
utilized in order to examine the significance of each
associated variable in relation to the focus variable.
This retirement variable created to represent career
intentions was labeled “yes_retire” and is in binary form.
The retirement variable came from a career intention
question that had six possible responses. Table 10
displays the six possible responses along with respondent
numbers and percentages for each question.

Table 10: Current Career Intention Responses
Question # Question: What are your current career intentions? Response # Response %1 I intend to stay in the Navy Reserves until I am eligible to retire 15709 74.092 I intend to stay in the active-duty Navy until I am eligible to retire 352 1.663 I intend to stay in one of the other services until I am eligible to retire 927 4.374 I intend to stay in the service 2 or more years 2802 13.225 I intend to stay less than 2 years and I will not be retirement eligible 824 3.896 I plan to leave as soon as possible and not join any other service 589 2.78
Source: Author, derived from survey data
Table 11 describes the characteristics of the
dependent variable.
Table 11: Focus Variable, Retirement intention, used in all Chi-square Cross-Tabulations
Variable description Variable name Variable type RangeRetention until yes_retire binary = 1 if member plans to stay in Navy retirement eligible Reserves until retirement eligible
= 0 if otherwise
Source: Author, derived from survey data
Table 12 shows the percent distribution for the
categories of E1-E5 and E6 and the yes_retire variable.
Table 12: E1-E5/E6 and yes_retire variable
Yes retire No retireE1-E5 70.41 29.59E6 86.51 13.49
Source: Author, derived from survey data
2. Associated Variables
23
Associated variables are those that are expected to be
related to the dependent variable. Associated variables
fall into one of four categories; demographic and military
24
background, unit type, rate, or Reserve Experience. A
description of each associated variable follows along with
a hypothesized relationship to the focus variable.
a. Demographic and Military Background Variables
Demographic variables are those that describe the
personal characteristics of the respondents. This thesis
analyzes two demographic variables, gender and marital
status. Two military background variables are also
analyzed, paygrade and years of service (Non Prior
Service).
The variable “gender” refers to being male or
female. The hypothesized relationship for this variable is
that retirement intent will be dependent on gender. By an
overwhelming percent, males are the majority and females
are the minority in all military branches. Males and
females may have different responsibilities in their
civilian lives and think differently about the reserves.
Males may find the reserves to be more appealing than do
females because military service is a male dominated
occupation in many cases requiring higher levels of
physical strength due to its arduous nature. This may be
particularly true in rates that require heavy lifting or
are more physically demanding. Therefore, being either
male or female will make a difference in their decision to
stay in the Navy Reserves until retirement eligible.
“Marital status” reflects the categories of being
married, single, divorced, legally separated, or widowed.
The hypothesized relationship for these variables is that
retirement intention will be dependent on marital status.
It is predicted that being married will result in a higher
25
percentage of respondents that intend to retire in the Navy
Reserves. This may be due to greater responsibilities of
married members; they have a spouse and may have children
to think of when considering required household income.
Available responses for the variable “paygrade”
included E1, E2, E3, E4, E5, or E6. The letter “E”
signifies that the member is enlisted versus being an
officer and together with the attached number, E1-E6
corresponds to a military member’s rank that helps to
determine their pay. Within each rank are steps or years
of service further determining pay amounts; years of
service will be considered as a separate variable. The
hypothesized relationship for these variables is that
retirement intention will be dependent on paygrade.
Paygrade is of course, associated with varying size of
paychecks. As members progress to higher paygrades, their
paychecks also get progressively larger. A larger paycheck
may be more likely to entice the member to stay in the
reserves than a smaller paycheck, thus reaching retirement
becomes a greater possibility.
The variable for “Total Years of Service
Completed” was originally coded in text format and had to
be recoded into numeric format. “Total Years of Service
Completed” indicates the total amount of years the
respondent has completed, a combination of any active duty
service and reserve service. The variable for “Years of
SELRES Service Completed” was also originally coded in text
format and had to be recoded into numeric format. “Years
of SELRES Service Completed” reflects the total years
completed as an actively drilling Selected Reservist.

26
“Years of SELRES Service Completed” variable was
then subtracted from the “Total Years of Service” variable
and those observations for which the difference between the
two variables is less than 1.5 (years) are considered to be
“Non-Prior Service (NPS).” In other words if [(Total Years
of Service Completed) – (Years of SELRES Service
Completed)] < 1.5 then NPS = 1; else NPS = 0. When
calculating the above equation, “1.5” years refers to the
amount of time spent on active duty. For the purpose of
this thesis, members must have completed greater than one
and one half years of active duty service to be considered
“prior service”. For example, a member who joined the Navy
but never finished boot camp, was processed out of the
Navy, and joined the Navy Reserve is considered non-prior
service due to his or her active duty time being less than
one and one half years. “Non-Prior Service” is the term
associated with members of the Non-Prior Service Accession
Course (NPSAC). NPSAC is the program that allows members
to come into the Navy Reserve without prior active duty
experience. They are chosen for various rates based on
their civilian experience. For example, a member who has
civilian construction equipment experience may be chosen
for the rate of Equipment Operator and will become a Seabee
attached to a construction battalion. NPS is the second
military background variable. The hypothesized
relationship between NPS and the focus variable is that the
focus variable will be dependent on NPS. A study that
tests a similar hypothesis is Kostiuk, Follmann, and
Shiells (1988) in which they compare NAVETs to Advanced
Paygrade (APG)/Other Service (OS) members. APG was a non-
prior service Navy Reserve program phased out and replaced
with NPSAC (a program similar in content to APG.) Table 13
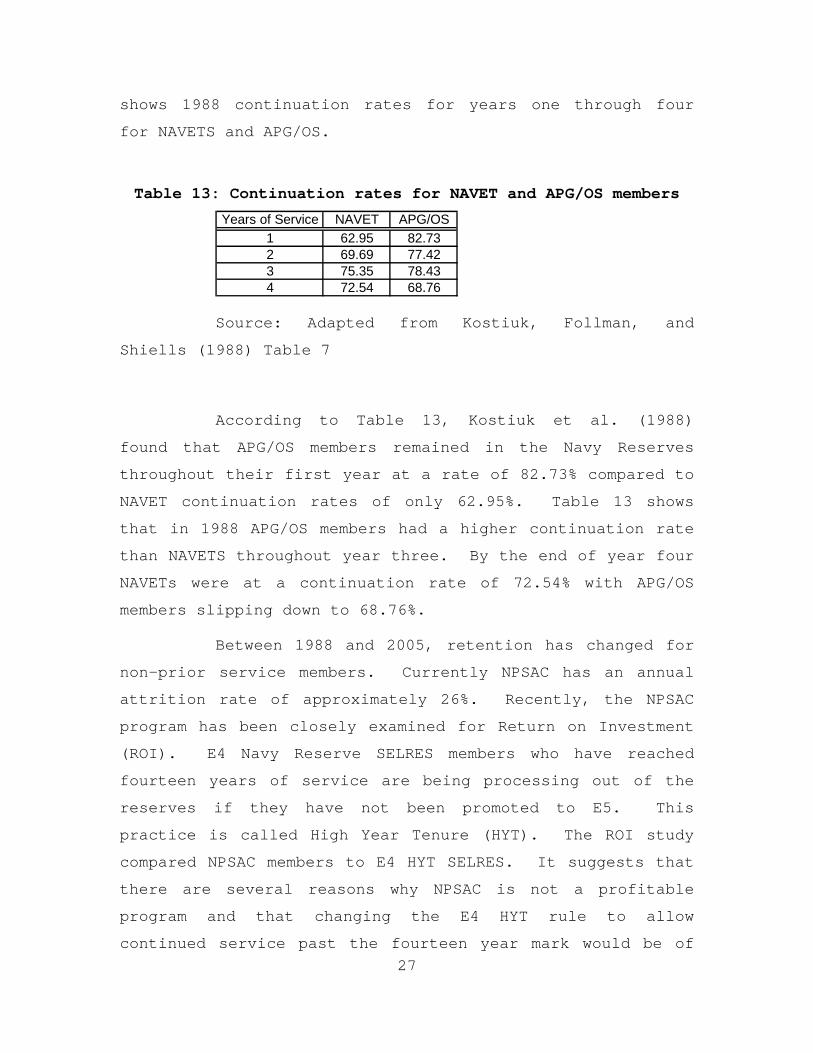
shows 1988 continuation rates for years one through four
for NAVETS and APG/OS.
Table 13: Continuation rates for NAVET and APG/OS members
Years of Service NAVET APG/OS1 62.95 82.732 69.69 77.423 75.35 78.434 72.54 68.76
Source: Adapted from Kostiuk, Follman, and
Shiells (1988) Table 7
According to Table 13, Kostiuk et al. (1988)
found that APG/OS members remained in the Navy Reserves
throughout their first year at a rate of 82.73% compared to
NAVET continuation rates of only 62.95%. Table 13 shows
that in 1988 APG/OS members had a higher continuation rate
than NAVETS throughout year three. By the end of year four
NAVETs were at a continuation rate of 72.54% with APG/OS
members slipping down to 68.76%.
27
Between 1988 and 2005, retention has changed for
non-prior service members. Currently NPSAC has an annual
attrition rate of approximately 26%. Recently, the NPSAC
program has been closely examined for Return on Investment
(ROI). E4 Navy Reserve SELRES members who have reached
fourteen years of service are being processing out of the
reserves if they have not been promoted to E5. This
practice is called High Year Tenure (HYT). The ROI study
compared NPSAC members to E4 HYT SELRES. It suggests that
there are several reasons why NPSAC is not a profitable
program and that changing the E4 HYT rule to allow
continued service past the fourteen year mark would be of

great value to the Navy Reserve. Due to their required
training timeline (governed by Congress), NPSAC members are
not mobilization assets for approximately three years. Due
to their extensive prior service training, NAVETS and
OSVETS are mobilization ready within 2 days of Navy Reserve
affiliation. As the study points out, E4 HYT members are
currently affiliated with the Navy Reserve and are also
mobilization ready. The hypothesized relationship for
prior service status personnel and retention intention is
that retention intention is dependent on prior service
status. (Ref 23)
b. Unit Type Variables
In the Navy Reserve, a large percentage of SELRES
serve in one of three different types of units. Table 14
shows populations of these differing unit types relative to
E1-E5 and E6 rate categories. The hypothesized
relationship for unit type and retention intention is that
retention intention will be dependent on unit type.
Table 14: E1-E5/E6 Unit Type Populations
E1-E5 Personnel # E6 Personnel #
Aviation Unit 3046 Aviation Unit 1375Reserve Center Unit 18436 Reserve Center Unit 6929Shipboard Unit 297 Shipboard Unit 108
Source: Author, derived from survey data
The variable “unit_air” was created to represent
an aviation unit. An aviation unit, for example, may be
attached to a helicopter squadron in Coronado, California
or an F-18 squadron in Virginia Beach, Virginia. Reserve
drill time can be extremely hectic for members who are
28
29
attached to aviation units and aviation units are many
times mobile which means the SELRES can be called upon to
complete extra hours, above and beyond the required amount.
For members who are married, with a full time civilian job,
this schedule may be difficult to maintain thus increasing
attrition compared to other units.
The variable “unit_center” was created to
represent a reserve center unit or a readiness command
unit. A unit attached to a reserve center or readiness
command may, for example, conduct their drill weekends in
Dubuque, Iowa, Phoenix, Arizona, or San Diego, California.
The hypothesized relationship is that the focus variable of
retirement intention will be dependent on “unit_center”.
Although drilling at a reserve center may have a lower
optempo, depending on availability of training equipment
and assignments, SELRES may feel content to drill there,
limiting their travel time and level of arduous duty (as
compared to shipboard and aviation unit work.)
The variable “unit_ship” was created to represent
a shipboard unit. A shipboard unit, for example may be
attached to a minesweeper in Ingleside, Texas or an
aircraft carrier in Everett, Washington. Shiells and Reese
(1988) studied unit retention and the differences between
Navy Reserve Force (NRF) ship units and Non-NRF units.
They report that “[r]esults showed that in fiscal years
1986 and 1987, 42.3 percent of the NRF personnel inventory
left NRF units each year. This compares to an annual loss
rate of 28 percent for all SELRES personnel.” (Ref 20).
Therefore the hypothesized relationship is that retention
intention will be dependent on “unit_ship”.

30
c. Rate Variables
“Rate” is the job that a particular Navy
Reservist holds and for which he or she has been trained.
In this thesis there are four “critical” rates that are
studied. “Critical” refers to the manning level of each
particular rate. To be critical, a rate is considered to
be undermanned and in critical need of additional people to
fill the job vacancies.
The following four rates are studied in this
thesis; Hospital Corpsman, Construction Mechanic, Equipment
Operator, and Information Technician. All four rates are
subsets of the variable of the survey’s “rate” question.
In order to use these rates in equations for this thesis, a
rank inclusive variable was created for each of these four
critical rates. For example, for the rate of Hospital
Corpsman, the variable “total_hm” compiles all of the HM
respondents within the E1-E6 ranks. The same procedure was
used for Construction Mechanic that became “total_cm”,
Equipment Operator that became “total_eo” and Information
Technician that became “total_it”. After these four
variables were created, they were then combined into one
final critical rate variable, “crit_rate”.
It is hypothesized that retirement intention and
“crit_rate” are related. Those in understaffed rates may
experience greater stress in completing their reserve
duties than those in other rates.
d. Reserve Experience Variables
Reserve experience as a category contains those
items that are related to intrinsic and extrinsic
motivation. “Intrinsic motivation” refers to one’s
internal or innate drive to accomplish. “Extrinsic
31
motivation” refers to external factors that influence one’s
desire toward higher performance. Included in this
analysis are responses to six reserve experience
questionnaire items. If the aspect of reserve experience
was considered by the respondent to influence him or her to
stay in the reserves (slightly, moderately, or strongly)
then it was coded as a one and as a zero otherwise.
Experience-type variables are important to examine when
studying job retention. People are motivated by different
types of issues when considering whether or not they want
to stay in a certain job. Pay, stress level, travel time
to work and work experiences are just some of the factors
people will consider with regard to their job retention.
If the “quality of training received at your
drill location” was evaluated as an influence to stay, the
variable “high_training” took on a value of one, and
otherwise a value of zero. The hypothesized relationship
between these variables is that retention intent is
dependent on quality of training. Boykin and Merritt
(1979) studied how strongly training is tied to retention
in the Navy Reserves. They stated that “satisfaction with
training appears about two-thirds of the way down the
list...” and “[a]lthough a large number of reservists don’t
find the training and equipment satisfying, these feelings
aren’t sufficiently strong to discourage reenlistment.”
Although training was not found to be high on the list of
importance in 1979, many reservists feel that training can
be the highlight of the reserve weekend. On-the-job
training can be the most effective way of preparing a
reservist for future field exercises or mobilizations. For
example, a Hospital Corpsman will become more proficient in

32
conducting blood draws when he or she is afforded actual
hands on training time during drill weekend. A Seabee
equipment operator would probably love nothing better
during drill weekend than to operate the machinery on which
he or she is trained. It is hypothesized that reservists
that feel as though they were provided challenging and
interesting training during drill weekend will have higher
retention rates.
The variable “high_recognition” represents the
perceived level of recognition received by the respondent
for his or her Navy Reserve accomplishments as an influence
to stay. The hypothesized relationship between
“high_recognition” and the focus variable is that retention
intention is dependent on recognition. In general, people
enjoy recognition for a job well done. It is hypothesized
that proper accomplishment recognition is related to higher
retention rates.
The variable “family_impact” represents the
impact that being in the reserves has on the respondent’s
family as an influence to stay. This survey was completed
prior to September 11, 2001, the day terrorists struck in
our nation’s homeland. In addition to the respondent
indicating how strongly the impact of being in the reserves
is on his or her family, the family impact question asked
participants to check one of the following: 1) Overall,
being in the Reserves has had a positive impact on my
family, or 2) Overall, being in the Reserves has had a
negative impact on my family. Additionally, the family
impact question asked participants to check as many as
applied to the following four statements: 1) Being in the
Reserves reduces the time I spend with my family, 2) Being
33
in the Reserves conflicts with my spouse’s job, 3) Being in
the Reserves places additional stress on my spouse, and 4)
Being in the Reserves increases the costs of childcare due
to weekend drills. The hypothesized relationship between
family impact and the focus variable is that retention
intent is dependent on family impact. Before 9/11,
mobilizations seldom occurred; participants rarely felt
that the Navy Reserves impacted their family greatly.
The variable “high_civ_job” was created to
represent the question asking about impact the Navy
Reserves has had on the respondent’s civilian job as an
influence to stay. Kirby & Naftel (1998) cited a 1988
study by Geleta, Moll, Morstein, and Paska that found that
approximately one-third of the respondents (3,000 Army
National Guard members) who said they planned to stay in
the Guard would get out if their Guard drill requirements
increased. This change of heart was due to the impact on
civilian jobs and family obligations. Retention intent has
a hypothesized relationship of being dependent on
“High_civ_job”.
Educational benefits are found in several surveys
to be quite important to reservists. The survey question
regarding educational benefits asks how strongly the
benefits influence respondents to stay in or leave the Navy
Reserve. The variable “high_educ_bennies” was created to
represent the question asking about the impact the
educational benefits have had on the respondent’s intent to
retire in the Navy Reserve. The hypothesized relationship
between these variables is that retention intent is
dependent on “educational benefits”. Kirby, Grissmer,
Williamson, & Naftel (1997) studied two previous surveys,

34
1986 and 1992. They found that enlisted members cited
educational benefits to be a major contributor of desire to
reenlist 16% of the time in the 1988 survey with an
increase to 28% of the time in the 1992 survey.
The variable “high_COXO_leadership” represents
leadership exhibited by the respondent’s Commanding Officer
and Executive Officer (CO/XO) as an influence to stay.
This survey question asks about the quality of leadership
at the senior officer level (CO/XO) and how strongly it
influences respondents to stay in or leave the Navy
Reserve. The hypothesized relationship between these
variables is that retention intent is dependent on the
created variable “high_COXO_leadership”. Commanding
Officers and Executive Officers play a vital role in
retention of military members. They set the tone for the
unit; morale can be high or low depending on the attitude
of the unit leadership.

IV. RESULTS OF CHI-SQUARE ANALYSIS
A. DEMOGRAPHIC VARIABLES
1. Male/Female
Table 15 reveals the percentage distribution between
males and females for E1-E5 and E6 respondents cross-
tabulated with the yes_retire variable. Male respondents
in the E1-E5 category plan on staying in the reserves until
retirement eligible 71.23% of the time and 28.77% plan on
getting out before becoming retirement eligible. While
67.73% of E1-E5 females plan on retiring in the Navy
Reserve, 32.27% plan on getting out prior to being
retirement eligible. Regarding E1-E5’s the Chi-square p-
value is significant at the .01 level. The null hypothesis
that there is no difference between being an E1-E5 male or
female with regard to the desire to stay until retirement
eligible is rejected at the 1% level and it can be
concluded that the decision to stay in the reserves until
retirement eligible is dependent on gender.
Table 15: E1-E5/E6 Male/Female and yes_retire variable
E1-E5 Yes retire No retire P-valueMale 71.23 28.77 <.0001Female 67.73 32.27E6 Yes retire No retire P-valueMale 86.79 13.21 0.0951Female 85.13 14.87
Source: Author, derived from survey data
For the rank category of E6, male respondents plan on
staying in the reserves until retirement eligible 86.79% of
the time and 13.21% plan on getting out before retirement
35

36
eligible as shown in Table 15. While 85.13% of E6 females
plan on retiring in the Navy Reserve, only 14.87% plan on
getting out prior to being retirement eligible. The chi-
square statistic for this test is significant at the .10
level. The null hypothesis is rejected at the 10% level,
indicating that the decision to stay in the reserves until
retirement eligible is weakly dependent on gender for those
in rank E6. However, the null hypothesis of no
relationship would not be rejected at the 5% and 1% levels.
It can also be noted that E6 females plan on retiring at a
rate 17.4% higher than do E1-E5 females. Similarly, E6
males plan to retire at a 15.56% higher rate than do E1-E5
males.
2. Marital Status
The “married” variable was created with a value of 1
for married members and a value of 0 for non-married
members. In this survey non-married members include single
(never married,) legally separated, divorced and widowed.
Table 16 indicates that 73.39% of E1-E5 married
members plan on retiring from the Navy Reserve while 26.61%
have no retirement plans. E1-E5 non-married members plan
on retiring at the lower level of 66.6% while 33.4% have no
retirement plans. These differences are very significant
at the .01 level. Looking at E6 married members, 87.59%
say they plan on retiring in the Navy Reserve while 83.85%
of E6 non-married members plan on retiring in the Navy
Reserves. With a p-value of <.0001, these differences are
significant at the .01 level. For the E1-E5 group and the
E6 group, planning to stay to retirement is strongly
related to marital status.

Table 16: E1-E5/E6 Married/Non-married and yes_retire variable
E1-E5 Yes retire No retire P-valueMarried 73.39 26.61 <.0001Non-Married 66.6 33.4E6 Yes retire No retire P-valueMarried 87.59 12.41 <.0001Non-Married 83.85 16.15
Source: Author, derived from survey data
37
The relationship of marital status and planned
retention may differ for men and women. To investigate
this possibility another set of cross-tabulations was
constructed to separate the gender inclusive married/non-
married tables into male and female tables in order to
analyze the relationship between planned retention to
retirement and marital status while controlling for gender.
Table 17 shows that for both E1-E5 males and females and
for E6 males, the association between plans to stay to
retirement and marital status is significant at the .01
level. Interestingly, the chi-square statistic for the
female E6 cross-tabulation of marital status and planned
retention has a p-value of .1043 which is not significant
even at the .10 level, though it is nearly significant at
this level. The null hypothesis that marital status and
planned retention are independent can be rejected for E1-E5
males and females and for E-6 males, but for E-6 females,
there is not a significant difference between married and
non-married members with regard to their plans for Navy
Reserve retirement. Married members (except for female E-6
reservists) consistently have higher planned rates of
retirement from the Navy Reserves. This is consistent with
previous military retirement studies.
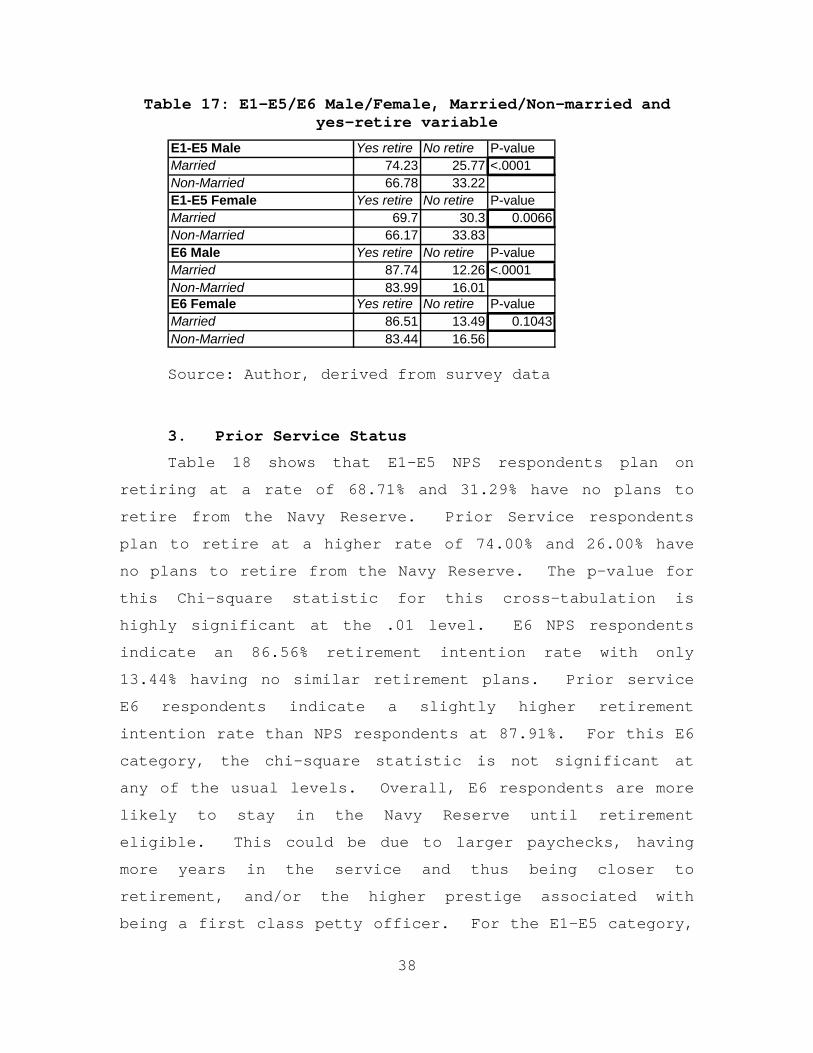
Table 17: E1-E5/E6 Male/Female, Married/Non-married and yes-retire variable
E1-E5 Male Yes retire No retire P-valueMarried 74.23 25.77 <.0001Non-Married 66.78 33.22E1-E5 Female Yes retire No retire P-valueMarried 69.7 30.3 0.0066Non-Married 66.17 33.83E6 Male Yes retire No retire P-valueMarried 87.74 12.26 <.0001Non-Married 83.99 16.01E6 Female Yes retire No retire P-valueMarried 86.51 13.49 0.1043Non-Married 83.44 16.56
Source: Author, derived from survey data
3. Prior Service Status
Table 18 shows that E1-E5 NPS respondents plan on
retiring at a rate of 68.71% and 31.29% have no plans to
retire from the Navy Reserve. Prior Service respondents
plan to retire at a higher rate of 74.00% and 26.00% have
no plans to retire from the Navy Reserve. The p-value for
this Chi-square statistic for this cross-tabulation is
highly significant at the .01 level. E6 NPS respondents
indicate an 86.56% retirement intention rate with only
13.44% having no similar retirement plans. Prior service
E6 respondents indicate a slightly higher retirement
intention rate than NPS respondents at 87.91%. For this E6
category, the chi-square statistic is not significant at
any of the usual levels. Overall, E6 respondents are more
likely to stay in the Navy Reserve until retirement
eligible. This could be due to larger paychecks, having
more years in the service and thus being closer to
retirement, and/or the higher prestige associated with
being a first class petty officer. For the E1-E5 category,
38
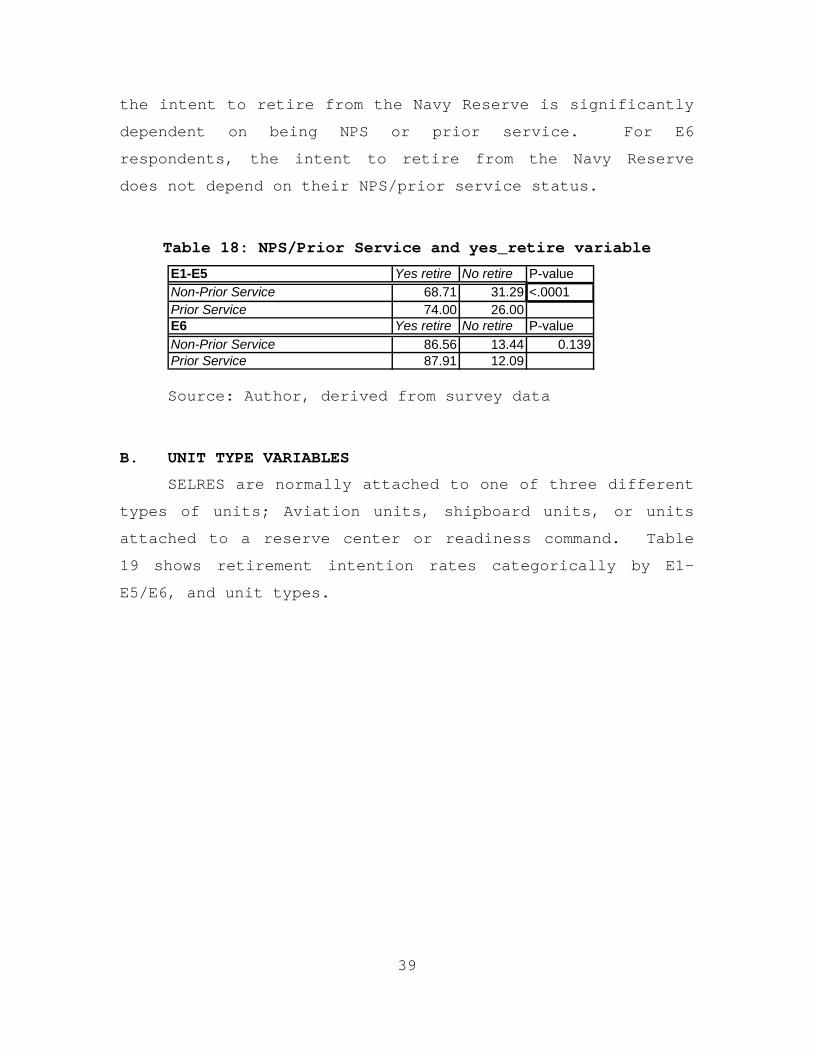
the intent to retire from the Navy Reserve is significantly
dependent on being NPS or prior service. For E6
respondents, the intent to retire from the Navy Reserve
does not depend on their NPS/prior service status.
Table 18: NPS/Prior Service and yes_retire variable
E1-E5 Yes retire No retire P-valueNon-Prior Service 68.71 31.29 <.0001Prior Service 74.00 26.00E6 Yes retire No retire P-valueNon-Prior Service 86.56 13.44 0.139Prior Service 87.91 12.09
Source: Author, derived from survey data
B. UNIT TYPE VARIABLES
SELRES are normally attached to one of three different
types of units; Aviation units, shipboard units, or units
attached to a reserve center or readiness command. Table
19 shows retirement intention rates categorically by E1-
E5/E6, and unit types.
39

Table 19: E1-E5/E6 Unit Type with yes_retire variable
E1-E5 Yes retire No retire P-valueAviation Unit 69.53 30.47 0.2547Non-Aviation Unit 70.55 29.45E6 Yes retire No retire P-valueAviation Unit 85.45 14.55 0.2103Non-Aviation Unit 86.71 13.29E1-E5 Yes retire No retire P-valueReserve Center Unit 71.01 28.99 <.0001Non- Reserve Center Unit 67.54 32.46E6 Yes retire No retire P-valueReserve Center Unit 87.27 12.73 <.0001Non- Reserve Center Unit 83.32 16.68E1-E5 Yes retire No retire P-valueShipboard unit 74.07 25.93 0.1636Non-shipboard unit 70.36 29.64E6 Yes retire No retire P-valueShipboard unit 84.26 15.74 0.4904Non-shipboard unit 86.54 13.46
Source: Author, derived from survey data set
1. Aviation Unit
E1-E5 respondents attached to Navy Reserve aviation
units indicated they plan to retire at a 69.53% rate. E1-
E5 respondents not attached to aviation units plan to
retire at a 70.55% rate. The chi-square statistic for this
cross-tabulation is .2547 which is not significant at any
of the usual levels. For E1-E5 aviation unit respondents,
retirement intent is not dependent on whether the member
was in an aviation unit or a non-aviation unit.
E6 respondents attached to Navy Reserve aviation units
indicated they plan to retire at an 85.45% rate. E6
respondents not attached to aviation units plan to retire
at an 86.71% rate. The chi-square statistic for this
cross-tabulation is .2103 which is not significant at any
40

41
of the usual levels. For E6 aviation unit respondents,
retirement intent is not dependent on whether the member is
in an aviation unit or a non-aviation unit.
2. Reserve Center/Readiness Command Unit
E1-E5 respondents attached to reserve center/readiness
command units indicated they plan to retire at a 71.01%
rate. E1-E5 respondents not attached to reserve
center/readiness command units plan to retire at a 67.54%
rate. The chi-square statistic for this cross-tabulation
is <.0001 which is significant at the .01 level. For E1-E5
reserve center/readiness command unit respondents,
retirement intent is dependent on whether the member is in
a reserve center/readiness command unit or a non-reserve
center/readiness/command unit.
E6 respondents attached to reserve center/readiness
command units indicated they plan to retire at an 87.27%
rate. E6 respondents not attached to reserve
center/readiness command units plan to retire at an 83.32%
rate. The chi-square statistic for this cross-tabulation
is <.0001 which is significant at the .01 level. For E6
reserve center/readiness command unit respondents,
retirement intent is dependent on whether the member is in
a reserve center/readiness command unit or a non-reserve
center/readiness command unit.
3. Shipboard Unit
E1-E5 respondents attached to Navy Reserve shipboard
units indicated they plan to retire at a 74.07% rate. E1-
E5 respondents not attached to shipboard units plan to
retire at a 70.36% rate. The chi-square statistic for this
cross-tabulation is .1636 which is not significant at any
of the usual levels. For E1-E5 shipboard unit respondents,

42
retirement intent is not dependent on whether the member is
in a shipboard unit or a non-shipboard unit.
E6 respondents attached to Navy Reserve shipboard
units indicated they plan to retire at an 84.26% rate. E6
respondents not attached to shipboard units plan to retire
at an 86.54% rate. The chi-square statistic for this
cross-tabulation is .4904 which is not significant at any
of the usual levels. For E6 shipboard unit respondents,
retirement intent is not dependent on whether the member is
in a shipboard unit or a non-shipboard unit.
C. CRITICAL RATE VARIABLES
1. This thesis examines four Navy Reserve critical
rates of Hospital Corpsman, Construction Mechanic,
Equipment Operator, and Information Technician (a
combination of DP and RM). According to Kostiuk et al.
(1988) the following continuation percents signified the
survival rates for each rate group after the first year of
Navy Reserve enlistment. Rate group Medical which
contained Hospital Corpsman had the highest survival rate
after one year at 61.5%. Information Technician which is
an average of Communications/Intelligence group at 54.3%
(containing Radioman) and Administrative/clerical group at
55.2% (containing Data Processor) had a survival rate of
54.75%. Rate group Mechanical equipment repair-surface
containing Construction Mechanic, had a one year survival
rate of 51.4%. Lastly, for this thesis, rate group
Craftsmen containing Equipment Operator, had a survival
rate of 50.4%. (Ref 14)
Hospital Corpsman, Construction Mechanic, Equipment
Operator, and Information Technician were all combined into
one critical rate variable, “crit_rate”. Table 20 shows
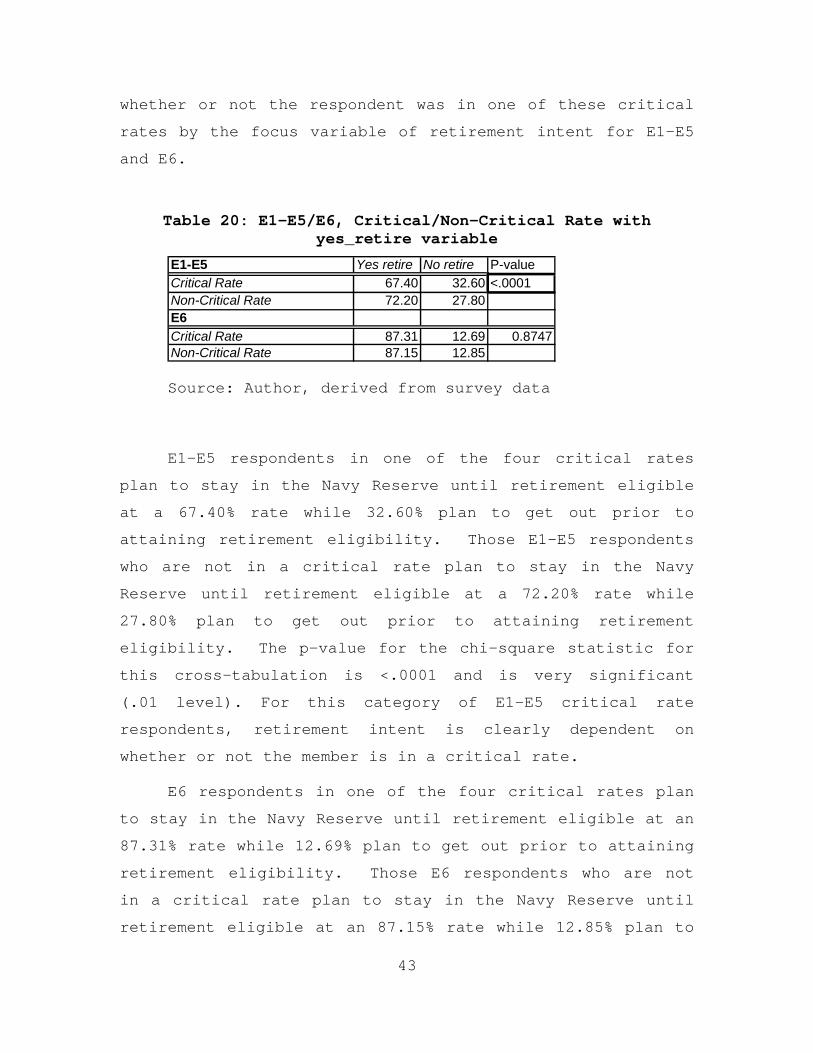
whether or not the respondent was in one of these critical
rates by the focus variable of retirement intent for E1-E5
and E6.
Table 20: E1-E5/E6, Critical/Non-Critical Rate with yes_retire variable
E1-E5 Yes retire No retire P-valueCritical Rate 67.40 32.60 <.0001Non-Critical Rate 72.20 27.80E6Critical Rate 87.31 12.69 0.8747Non-Critical Rate 87.15 12.85
Source: Author, derived from survey data
E1-E5 respondents in one of the four critical rates
plan to stay in the Navy Reserve until retirement eligible
at a 67.40% rate while 32.60% plan to get out prior to
attaining retirement eligibility. Those E1-E5 respondents
who are not in a critical rate plan to stay in the Navy
Reserve until retirement eligible at a 72.20% rate while
27.80% plan to get out prior to attaining retirement
eligibility. The p-value for the chi-square statistic for
this cross-tabulation is <.0001 and is very significant
(.01 level). For this category of E1-E5 critical rate
respondents, retirement intent is clearly dependent on
whether or not the member is in a critical rate.
E6 respondents in one of the four critical rates plan
to stay in the Navy Reserve until retirement eligible at an
87.31% rate while 12.69% plan to get out prior to attaining
retirement eligibility. Those E6 respondents who are not
in a critical rate plan to stay in the Navy Reserve until
retirement eligible at an 87.15% rate while 12.85% plan to
43
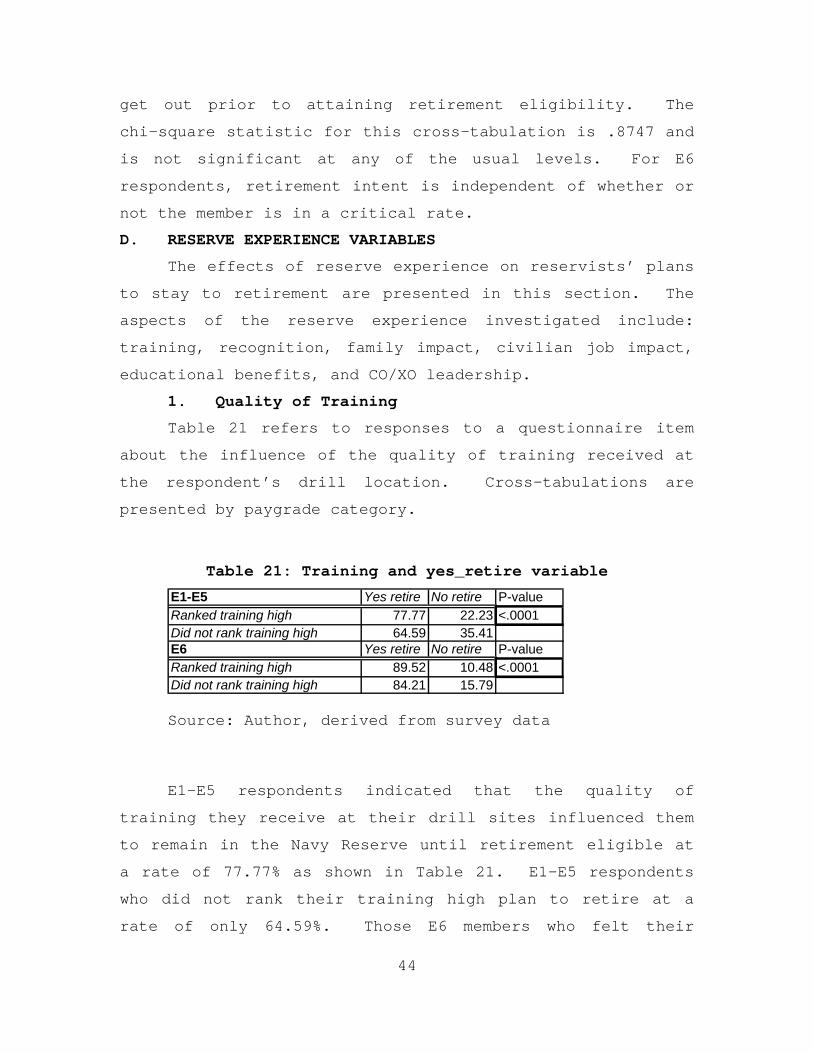
get out prior to attaining retirement eligibility. The
chi-square statistic for this cross-tabulation is .8747 and
is not significant at any of the usual levels. For E6
respondents, retirement intent is independent of whether or
not the member is in a critical rate.
D. RESERVE EXPERIENCE VARIABLES
The effects of reserve experience on reservists’ plans
to stay to retirement are presented in this section. The
aspects of the reserve experience investigated include:
training, recognition, family impact, civilian job impact,
educational benefits, and CO/XO leadership.
1. Quality of Training
Table 21 refers to responses to a questionnaire item
about the influence of the quality of training received at
the respondent’s drill location. Cross-tabulations are
presented by paygrade category.
Table 21: Training and yes_retire variable
E1-E5 Yes retire No retire P-valueRanked training high 77.77 22.23 <.0001Did not rank training high 64.59 35.41E6 Yes retire No retire P-valueRanked training high 89.52 10.48 <.0001Did not rank training high 84.21 15.79
Source: Author, derived from survey data
E1-E5 respondents indicated that the quality of
training they receive at their drill sites influenced them
to remain in the Navy Reserve until retirement eligible at
a rate of 77.77% as shown in Table 21. E1-E5 respondents
who did not rank their training high plan to retire at a
rate of only 64.59%. Those E6 members who felt their
44

training was high plan on Navy Reserve retirement at a rate
of 89.52%. Those E6 respondents whom did not rank their
training high, plan on retiring at a lower rate of 84.21%.
Among reservists in both E1-E5 and E6 categories, the chi-
square statistics are significant at the .01 level, which
leads to the conclusion that for E1-E6 respondents
retirement intent is dependent on perceptions of the
importance of the quality of training received at their
drill site.
2. Accomplishment Recognition
Recognition for a job well done seems to be important
to just about every worker. Table 22 examines Navy Reserve
members and their plans to remain in the Navy Reserves
until retirement eligible based on the importance of level
of recognition for their accomplishments.
Table 22: Recognition and yes_retire variable
E1-E5 Yes retire No retire P-valueHigh level recognition 78.10 21.90 <.0001Not high level recognition 64.10 35.90E6 Yes retire No retire P-valueHigh level recognition 90.28 9.72 <.0001Not high level recognition 83.08 16.92
Source: Author, derived from survey data
E1-E5 respondents indicated they planned to stay in
the Navy Reserve until retirement eligible at a rate of
78.10% based on the influence of the level of recognition
for their accomplishments. Those in the category of E1-E5
specified a retirement intent rate of only 64.10% if they
rated their level of recognition for their accomplishments
as influential. The p-value for the chi-square statistic
45

for this cross-tabulation is <.0001 and is very highly
significant (.01 level). E6 survey participants who
indicated a high level of recognition had a retirement
intent rate of 90.28%, while those E6 members without a
high recognition level tallied an 83.08% retirement intent
rate. The p-value for the chi-square statistic for this
category is <.0001 and is very highly significant (.01
level). Retirement intent is clearly dependent on the
level of accomplishment recognition for respondents in the
ranks of E1-E6.
3. Family Impact
Table 23 examines the importance of the impact that is
felt on family with regard to Navy Reserve service.
Table 23: Family impact and yes_retire variable
E1-E5 Yes retire No retire P-valueGood family impact 80.50 19.50 <.0001Not good family impact 64.70 35.30E6 Yes retire No retire P-valueGood family impact 91.32 8.68 <.0001Not good family impact 84.32 15.68
Source: Author, derived from the survey data
46
E1-E5 respondents who felt the family impact of being
in the Navy Reserve influenced them to stay, had a
retirement intent rate of 80.50%. Those E1-E5 respondents
who did not feel the family impact of being in the Navy
Reserve influenced them to stay, had a retirement intent
rate of only 64.70%. The chi-square statistic for this
cross-tabulation has a p-value of <.0001, highly
significant at the .01 level. E6 respondents indicating
that the importance of family impact from the Navy Reserve

was influential had a retirement intent rate of 91.32%,
while E6 members who did not feel that the Navy Reserve
impact on the family was influential, had a retirement
intent rate of 84.32%. The chi-square statistic for this
cross-tabulation has a p-value of <.0001, and is
significant at all the usual levels. For the inclusive
category of E1-E6, retirement intent is clearly dependent
on the influence of the level of family impact from being
in the reserves.
4. Civilian Job Impact
Table 24 shows the relationship of the importance of
the impact that being in the Navy Reserve has on the
respondent’s civilian job to the reservist’s retirement
intent.
Table 24: Civilian job impact and yes_retire variable
E1-E5 Yes retire No retire P-valueHigh civilian job 79.88 20.12 <.0001Not high civilian job 66.72 33.28E6 Yes retire No retire P-valueHigh civilian job 91.37 8.63 <.0001Not high civilian job 84.90 15.10
Source: Author, derived from survey data
The planned retention rate for E1-E5 respondents who
indicated that the level of impact the Navy Reserve had on
their civilian job had influenced them to stay planned to
stay at a rate of 79.88%. The proportion of those E1-E5
respondents that indicated this impact level did not
influence them to stay planned to stay at a rate of 66.72%.
The p-value for the chi-square statistic for this cross-
tabulation is <.0001 and significant at all the usual
47

levels. Those E6 respondents who indicated that this level
of impact the Navy Reserve had on their civilian job had
influenced them to stay planned to stay at a rate of
91.37%. Those E6 respondents that indicated the impact
level did not influence them to stay planned to stay at a
rate of 84.90%. The p-value for the chi-square statistic
for this cross-tabulation is <.0001 which is highly
significant (.01 level). For the inclusive rank category
of E1-E6, retirement intent is clearly dependent on the
influence of the level of impact the Navy Reserve has on
their civilian job.
5. Educational Benefits
Respondents indicated how strongly educational
benefits influenced them to leave or stay in the Navy
Reserve. Table 25 shows retirement intent rates for the
survey’s E1-E6 participants by the influence of educational
benefits.
Table 25: Educational benefits and yes_retire variable
E1-E5 Yes retire No retire P-valueHigh educational benefits 77.15 22.85 <.0001Not high educational benefits 64.21 35.79E6 Yes retire No retire P-valueHigh educational benefits 91.01 8.99 <.0001Not high educational benefits 83.68 16.32
Source: Author, derived from survey data
E1-E5 respondents who indicated educational benefits
influenced them to stay until retirement eligible planned
to stay to retirement at a rate of 77.15%. E1-E5
respondents, who indicated educational benefits did not
influence them to stay, indicated that they planned to stay
48

to retirement at a rate of 64.21%. The chi-square
statistic for this cross-tabulation is <.0001 and is very
significant (.01 level). E6 respondents who indicated that
educational benefits influenced them to stay planned to
stay until retirement eligible at a rate of 91.01%. E6
respondents, who indicated educational benefits did not
influence them to stay, indicated that they planned to stay
to retirement at a rate of 83.68%. The p-value for the
chi-square statistic for this cross-tabulation is <.0001
and is very significant (.01 level). For the inclusive
category of E1-E6, retirement intent is clearly dependent
on the influence of educational benefits.
6. Senior Leadership (CO/XO)
Respondents indicated how strongly the quality of
leadership at the senior level (CO/XO) influenced them to
leave or stay in the Navy Reserve. Table 26 shows
retirement intent rates for survey’s E1-E6 participants by
the influence of quality of leadership.
Table 26: CO/XO leadership and yes_retire variable
E1-E5 Yes retire No retire P-valueHigh CO/XO leadership 77.29 22.71 <.0001Not high CO/XO leadership 61.08 38.92E6 Yes retire No retire P-valueHigh CO/XO leadership 91.31 8.69 <.0001Not high CO/XO leadership 79.45 20.55
Source: Author, derived from survey data
E1-E5 respondents who felt the quality of leadership
from the senior officer level influenced them to stay in
the Navy Reserve indicated a planned retirement intent rate
of 77.29%. E1-E5 respondents who felt the quality of
49

50
senior leadership did not influence them to stay, indicated
a considerably lower planned retirement intent rate of
61.08%. This is a difference in plans to retire of 16.21%.
The chi-square statistic for this cross-tabulation is
<.0001 and is very significant (.01 level). E6 respondents
who felt the quality of leadership from the senior officer
level influenced them to stay in the Navy Reserve indicated
a planned retirement intent rate of 91.31%. E6 respondents
who felt the quality of senior leadership did not influence
them to stay indicated a planned retirement rate of 79.45%.
The chi-square statistic for this cross-tabulation is
<.0001 and is very significant (.01 level). For the
inclusive category of E1-E6 respondents, retirement intent
is clearly dependent on the influence of leadership at the
senior officer (CO/XO) level.
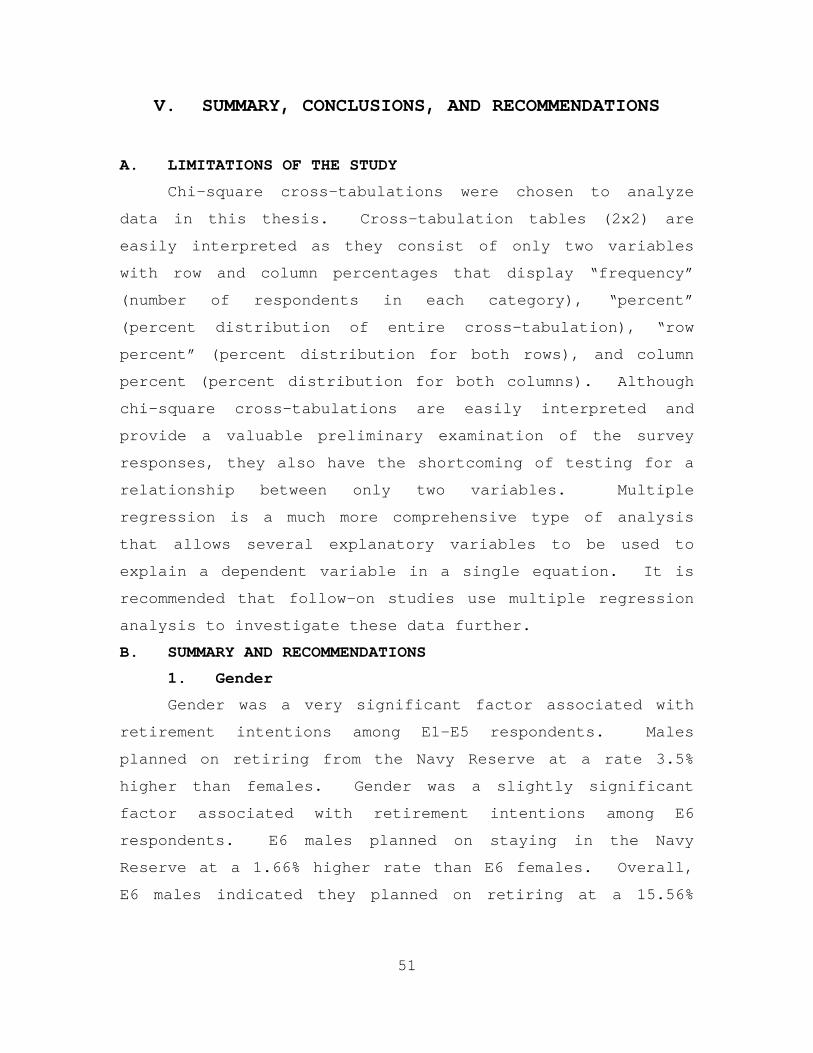
51
V. SUMMARY, CONCLUSIONS, AND RECOMMENDATIONS
A. LIMITATIONS OF THE STUDY
Chi-square cross-tabulations were chosen to analyze
data in this thesis. Cross-tabulation tables (2x2) are
easily interpreted as they consist of only two variables
with row and column percentages that display “frequency”
(number of respondents in each category), “percent”
(percent distribution of entire cross-tabulation), “row
percent” (percent distribution for both rows), and column
percent (percent distribution for both columns). Although
chi-square cross-tabulations are easily interpreted and
provide a valuable preliminary examination of the survey
responses, they also have the shortcoming of testing for a
relationship between only two variables. Multiple
regression is a much more comprehensive type of analysis
that allows several explanatory variables to be used to
explain a dependent variable in a single equation. It is
recommended that follow-on studies use multiple regression
analysis to investigate these data further.
B. SUMMARY AND RECOMMENDATIONS
1. Gender
Gender was a very significant factor associated with
retirement intentions among E1-E5 respondents. Males
planned on retiring from the Navy Reserve at a rate 3.5%
higher than females. Gender was a slightly significant
factor associated with retirement intentions among E6
respondents. E6 males planned on staying in the Navy
Reserve at a 1.66% higher rate than E6 females. Overall,
E6 males indicated they planned on retiring at a 15.56%
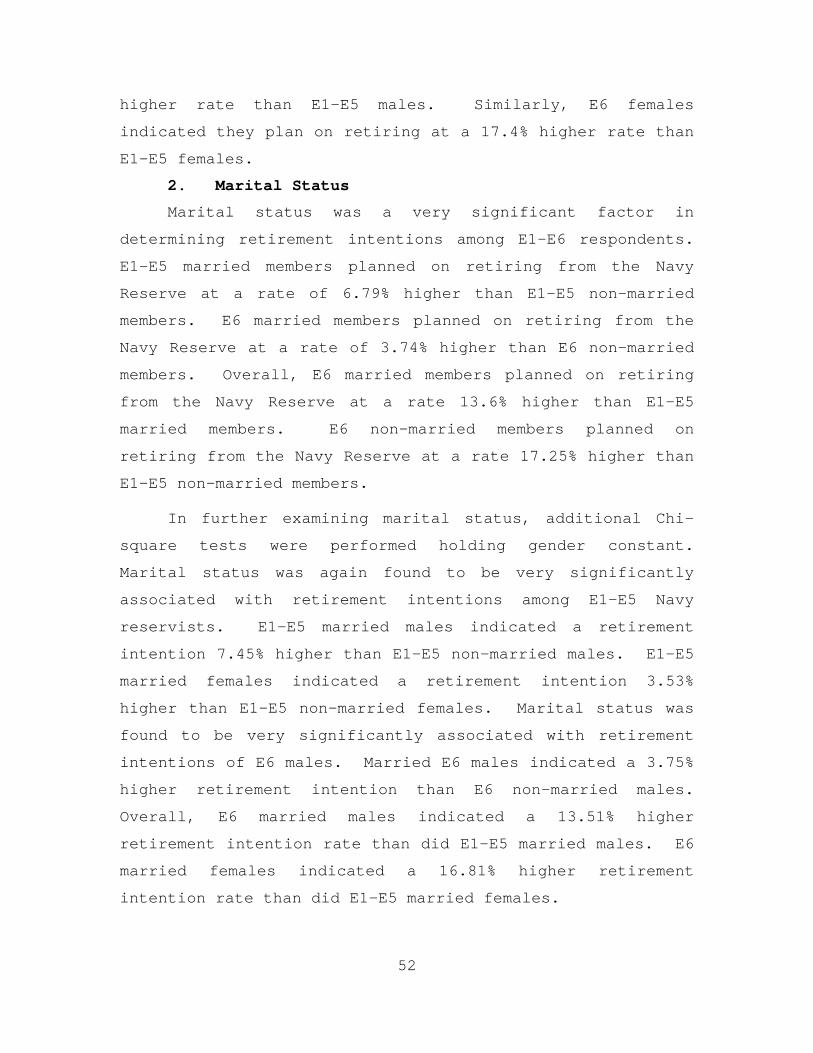
52
higher rate than E1-E5 males. Similarly, E6 females
indicated they plan on retiring at a 17.4% higher rate than
E1-E5 females.
2. Marital Status
Marital status was a very significant factor in
determining retirement intentions among E1-E6 respondents.
E1-E5 married members planned on retiring from the Navy
Reserve at a rate of 6.79% higher than E1-E5 non-married
members. E6 married members planned on retiring from the
Navy Reserve at a rate of 3.74% higher than E6 non-married
members. Overall, E6 married members planned on retiring
from the Navy Reserve at a rate 13.6% higher than E1-E5
married members. E6 non-married members planned on
retiring from the Navy Reserve at a rate 17.25% higher than
E1-E5 non-married members.
In further examining marital status, additional Chi-
square tests were performed holding gender constant.
Marital status was again found to be very significantly
associated with retirement intentions among E1-E5 Navy
reservists. E1-E5 married males indicated a retirement
intention 7.45% higher than E1-E5 non-married males. E1-E5
married females indicated a retirement intention 3.53%
higher than E1-E5 non-married females. Marital status was
found to be very significantly associated with retirement
intentions of E6 males. Married E6 males indicated a 3.75%
higher retirement intention than E6 non-married males.
Overall, E6 married males indicated a 13.51% higher
retirement intention rate than did E1-E5 married males. E6
married females indicated a 16.81% higher retirement
intention rate than did E1-E5 married females.

53
Although E6 married and non-married females indicated a
high retirement intention (86.51% and 83.44% respectively),
marital status was not found to be significantly associated
with retirement intentions among E6 female respondents.
3. Prior Service Status
Prior service experience was very significantly
associated with retirement intentions among E1-E5
respondents. E1-E5 prior service members indicated a 5.29%
higher retirement intention than did E1-E5 non-prior
service members. Overall, E6 NPS respondents indicated a
17.85% higher retirement rate than E1-E5 NPS respondents.
E6 prior service respondents indicated a 13.91% higher
retirement rate than E1-E5 prior service respondents.
Prior service experience was not significantly associated
with retirement intentions among E6 respondents.
The results for prior service status suggest several
policies to improve retention. The Non Prior Service
Accession Course (NPSAC) program does not yield
mobilization assets until approximately three years after
affiliation. NAVET and OSVET affiliates are mobilization
ready after two days of Navy Reserve indoctrination
training. Raising quotas for NAVET/OSVET affiliates and
lowering those of NPSAC would benefit retention.
Additionally, E4 HYT restrictions should be changed to
allow for E4 HYT members to stay in the Navy Reserve,
filling NPSAC quotas and thus helping to maintain a higher
level of mobilization readiness. (Ref 23)
4. Unit Type
Unit type was very significantly associated with
retention intention for E1-E5 respondents whose units were
attached to Reserve Centers or Readiness Commands. Those
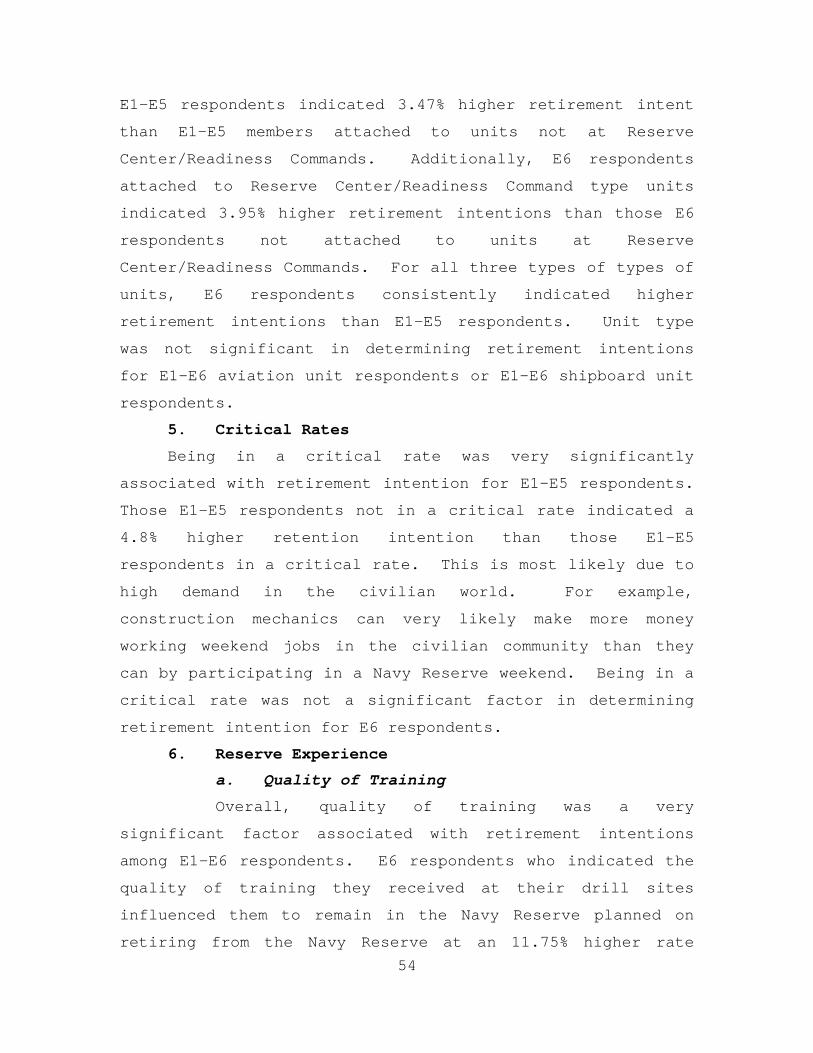
54
E1-E5 respondents indicated 3.47% higher retirement intent
than E1-E5 members attached to units not at Reserve
Center/Readiness Commands. Additionally, E6 respondents
attached to Reserve Center/Readiness Command type units
indicated 3.95% higher retirement intentions than those E6
respondents not attached to units at Reserve
Center/Readiness Commands. For all three types of types of
units, E6 respondents consistently indicated higher
retirement intentions than E1-E5 respondents. Unit type
was not significant in determining retirement intentions
for E1-E6 aviation unit respondents or E1-E6 shipboard unit
respondents.
5. Critical Rates
Being in a critical rate was very significantly
associated with retirement intention for E1-E5 respondents.
Those E1-E5 respondents not in a critical rate indicated a
4.8% higher retention intention than those E1-E5
respondents in a critical rate. This is most likely due to
high demand in the civilian world. For example,
construction mechanics can very likely make more money
working weekend jobs in the civilian community than they
can by participating in a Navy Reserve weekend. Being in a
critical rate was not a significant factor in determining
retirement intention for E6 respondents.
6. Reserve Experience
a. Quality of Training
Overall, quality of training was a very
significant factor associated with retirement intentions
among E1-E6 respondents. E6 respondents who indicated the
quality of training they received at their drill sites
influenced them to remain in the Navy Reserve planned on
retiring from the Navy Reserve at an 11.75% higher rate
55
than those E1-E5 respondents who did not indicate the
quality of training influenced them to stay in the Navy
Reserves.
E1-E5 respondents who indicated that quality of
training received at their drill sites influenced them to
stay in the Navy Reserve planned to stay until retirement
eligible at a rate 13.18% higher than those E1-E5
respondents who did not so indicate. E6 respondents who
indicated that quality of training received at their drill
sites influenced them to stay in the Navy Reserve planned
to stay until retirement eligible at a rate 5.31% higher
than those E6 respondents who did not so indicate.
The results for quality of training suggest
continued practices to improve retention. Unit and Reserve
Center leadership need to be involved to ensure training is
available for all personnel during drill weekend.
Equipment such as Shipboard Simulators, Damage Control
Trainers, and Reserve Intermediate Maintenance Activity
(RIMA) shops are not only excellent training tools, but in
the case of RIMA shops create actual products used aboard
U.S. Navy ships. RIMA is a win-win situation; fleet
products created at a reduced cost during drill weekend
which keep Navy reservists busy and happily employed.
b. Accomplishment Recognition
Overall, accomplishment recognition was very
significantly associated with retirement intentions among
E1-E6 respondents. E6 respondents who indicated the level
of recognition received for their accomplishments
influenced them to remain in the Navy Reserve, planned on
retiring from the Navy Reserve at 12.18% higher rate than
those E1-E5 respondents who did not indicate such.
56
Indicating that the level of recognition received for their
accomplishments influenced them to stay in the Navy Reserve
was significantly associated with plans to stay until
retirement eligible for E1-E6 respondents.
The results for accomplishment recognition
suggest several policies to improve retention. Unit and
Reserve Center leadership need to make every effort to
recognize jobs “well done”. Awards such as “100%
attendance”, “Top Physical Fitness member” and “Sailor of
the Quarter” and “Sailor of the Year” go a long way in
helping to make sailors feel significant in their Navy
Reserve accomplishments.
c. Family Impact
Overall, family impact was a very significant
factor associated with retirement intentions among E1-E6
respondents. E6 respondents who felt the family impact of
being in the Navy Reserve influenced them to stay,
indicated a 10.82% higher retirement rate than E1-E5
respondents who felt the family impact of being in the Navy
Reserve influenced them to stay. Indicating that the
family impact of being in the Navy Reserve influenced them
to stay until retirement eligible was highly significant
for E1-E6 respondents.
The results for family impact suggest supporting
several existing policies for improved retention. Programs
that recognize Navy Reserve spouses can go far in helping
to gain the support of reservist’s families. The annual
Military Spouse Appreciation Day should be taken advantage
of to gather staff families together and celebrate spousal
support. In today’s military, it is also important to
ensure spouses and family members of those Navy Reservists

57
who are mobilized are given the opportunity to gather
together and establish support networks. These types of
activities help to ensure members will want to continue on
in the Navy Reserve.
d. Civilian Job Impact
Overall, civilian job impact was a very
significant factor associated with retirement intentions
among E1-E6 respondents. E6 respondents who felt that the
level of impact the Navy Reserve had on their civilian job
influenced them to stay indicated an 11.49% higher planned
retirement rate than those E1-E5 respondents who indicated
the same regarding their civilian job. E1-E6 respondents
who indicated that the level of impact the Navy Reserve had
on their civilian job influenced them were significantly
more likely to stay until retirement eligible.
The results for civilian job impact suggest
supporting several existing policies to improve retention.
Flex drilling should be considered by the Unit and Reserve
Commanding Officers whenever possible to allow for higher
accommodation of civilian job requirements. Additionally,
Patriot Award nomination forms are available from the
Employer Support of the Guard and Reserve (ESGR) which help
to encourage greater employer support of drilling
reservists.
e. Educational Benefits
Overall, the category of educational benefits was
a very significant factor associated with retirement
intentions among E1-E6 respondents. E6 respondents who
indicated educational benefits influenced them to stay
planned to stay until retirement eligible at a 13.86%
higher rate than E1-E5 respondents indicating the same

58
regarding educational benefits. Indicating that
educational benefits influenced them to stay in the Navy
Reserve was significantly associated with planning to stay
until retirement eligible for E1-E6 respondents.
f. Senior Leadership (CO/XO)
Overall, perception of senior leadership was a
very significant factor associated with retirement
intentions among E1-E6 respondents. E6 respondents who
felt the quality of leadership influenced them to stay
indicated that they planned to retire at a 14.02% higher
rate than E1-E5 respondents who held this same opinion.
E1-E5 respondents who indicated the level of
senior leadership influenced them to stay planned to stay
until retirement eligible at a rate 16.21% higher than
those E1-E5 members who did not so indicate. E6
respondents who indicated that the level of senior
leadership influenced them to stay planned to stay until
retirement eligible at a rate 11.86% higher than those E6
members who did not so indicate.
The results for senior leadership suggest
personnel policies to improve retention. The Commanding
Officer and Executive Officer set the tone for the entire
command. Effective leadership will help to maintain a high
level of morale which is an extremely important factor for
retention. Leadership training could be expanded and
enhanced at various points in officers’ careers. For
example, the Prospective Commanding Officer (PCO) course
could include a leadership refresher section. Reserve
Officer Leadership Courses (ROLC) are conducted at Reserve
Centers throughout the year. These courses were created
for the Part Time Support officer, however, Full Time

59
Support officers can benefit from ROLC as well. Mission is
number one in importance, but every effort should be made
to accomplish that mission while keeping morale high. This
can be done with effective leadership.
C. CONCLUSIONS
The 2000-2001 Navy Reserve Career Decisions Survey
provides a valuable source of information about the
characteristics of Navy Reservists and the factors that
influence their desires to continue in the Navy Reserve.
This thesis is a first step in analyzing the survey
responses to learn how decisions to stay in the Navy
Reserve until retirement are made.

60
THIS PAGE INTENTIONALLY LEFT BLANK
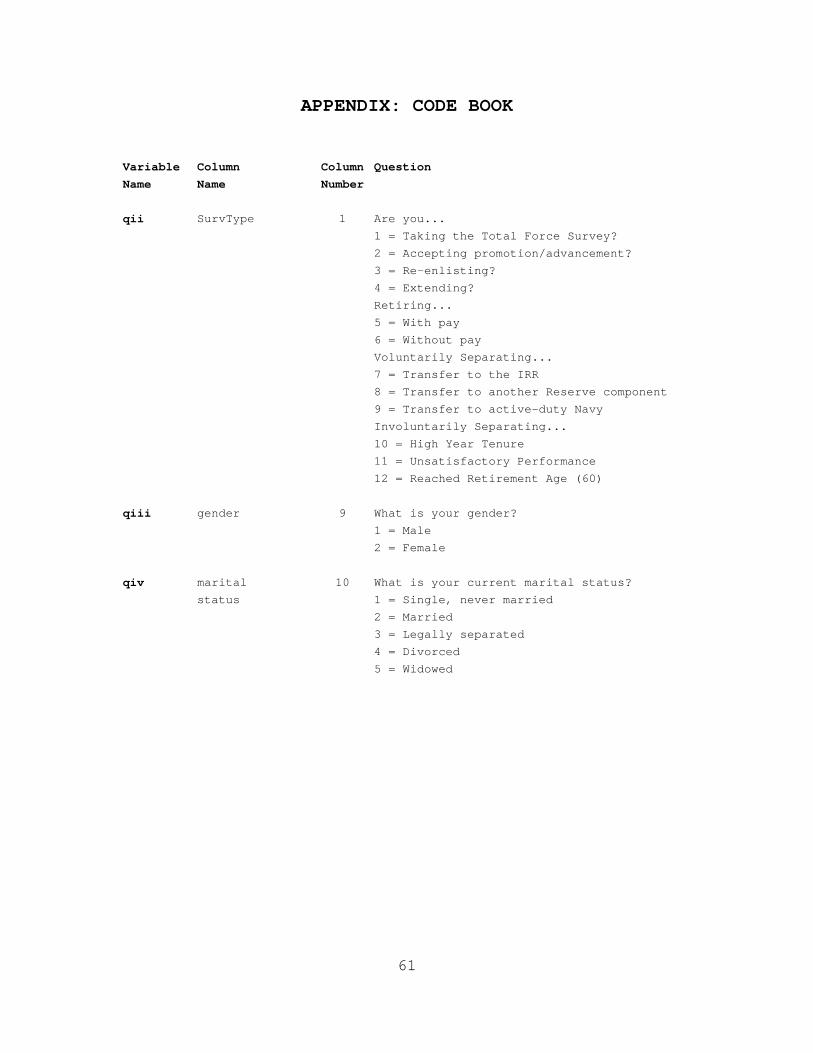
APPENDIX: CODE BOOK
Variable Column Column QuestionName Name Number
qii SurvType 1 Are you...
1 = Taking the Total Force Survey?
2 = Accepting promotion/advancement?
3 = Re-enlisting?
4 = Extending?
Retiring...
5 = With pay
6 = Without pay
Voluntarily Separating...
7 = Transfer to the IRR
8 = Transfer to another Reserve component
9 = Transfer to active-duty Navy
Involuntarily Separating...
10 = High Year Tenure
11 = Unsatisfactory Performance
12 = Reached Retirement Age (60)
qiii gender 9 What is your gender?
1 = Male
2 = Female
qiv marital 10 What is your current marital status?
status 1 = Single, never married
2 = Married
3 = Legally separated
4 = Divorced
5 = Widowed
61

Codebook continued
Variable Column Column QuestionName Name Number
qviii paygrade 2 What is your paygrade?
1 = E-1
2 = E-2
3 = E-3
4 = E-4
5 = E-5
6 = E-6
7 = E-7
8 = E-8
9 = E-9
10 = W-2
11 = W-3
12 = W 4
13 = O-1E
14 = O-2E
15 = O-3E
16 = O-1
17 = O-2
18 = O-3
19 = O-4
20 = O-5
21 = O-6
22 = O-7 or above
qixy Years in 3 (text box)
current
paygrade
qixm Months in 4 (text box)
current
paygrade
qx Years total 5 (text box)
service
qxi Years 6 (text box)
SelRes
qxii Designator 7 (text box)
62

Codebook continued
Variable Column Column QuestionName Name Number
qxiii Rate 8 If you are a Chief Petty Officer, Petty
Officer, or an officially designated
striker, what is your general rating?
1 = Does not apply/I am an Officer
2 = Not rated/I am an AN/SN/FN
(not a Designated Striker)
qxiv Type Unit 11 In what type of unit are you serving?
1 = Unit at Air Site/NAS/NAR
2 = Unit at Reserve/Readiness Center
3 = NRF Ship
nq11 Quality 13 The quality of the training you have
of training received at your drill location
at drill 1 = Influence To Leave (strongly)
site 2 = Influence To Leave (moderately)
3 = Influence To Leave (slightly)
4 = No Effect
5 = Influence To Stay (slightly)
6 = Influence To Stay (moderately)
7 = Influence To Stay (strongly)
nq11a Training 44 Training topics are relevant to my
topics are Reserve job.
relevant 1 = very great extent
2 = great extent
3 = moderate extent
4 = slight extent
5 = not at all
nq11b Training 45 Training I receive develops/improves my
develops/ job skills
improves 1 = very great extent
job skills 2 = great extent
3 = moderate extent
4 = slight extent
5 = not at all
63

Codebook continued
Variable Column Column QuestionName Name Number
nq13 Opportunity 14 Your opportunity to work in your primary
to work on rating/designator
primary/ 1 = Influence To Leave (strongly)
rating 2 = Influence To Leave (moderately)
designator 3 = Influence To Leave (slightly)
4 = No Effect
5 = Influence To Stay (slightly)
6 = Influence To Stay (moderately)
7 = Influence To Stay (strongly)
nq13a Time 46 During drill weekends
working 1 = I've spent too little time working
in primary in my rating/designator
rate/ 2 = I've spent about the right amount
designator of time working in my rating/designator
at drill 3 = I've spent too much time working in
my rating/designator
nq13b Time 47 During annual training (AT)
working 1 = I've spent too little time working in
in primary my rating/designator
rate/ 2 = I've spent about the right amount of
designator time working in my ratin/designator
at AT 3 = I've spent too much time working in my
rating/designator
nq16 Use of job 15 Use of my skills on my Reserve job
skills on 1 = My skills are under used in this job
reserve job 2 = My skills are well used in this job
3 = My skills do not match this job
nq20 Amount of 16 The amount of respect you receive from
respect immediate supervisors
from 1 = Influence To Leave (strongly)
immediate 2 = Influence To Leave (moderately)
supervisors 3 = Influence To Leave (slightly)
4 = No Effect
5 = Influence To Stay (slightly)
6 = Influence To Stay (moderately)
7 = Influence To Stay (strongly)
64
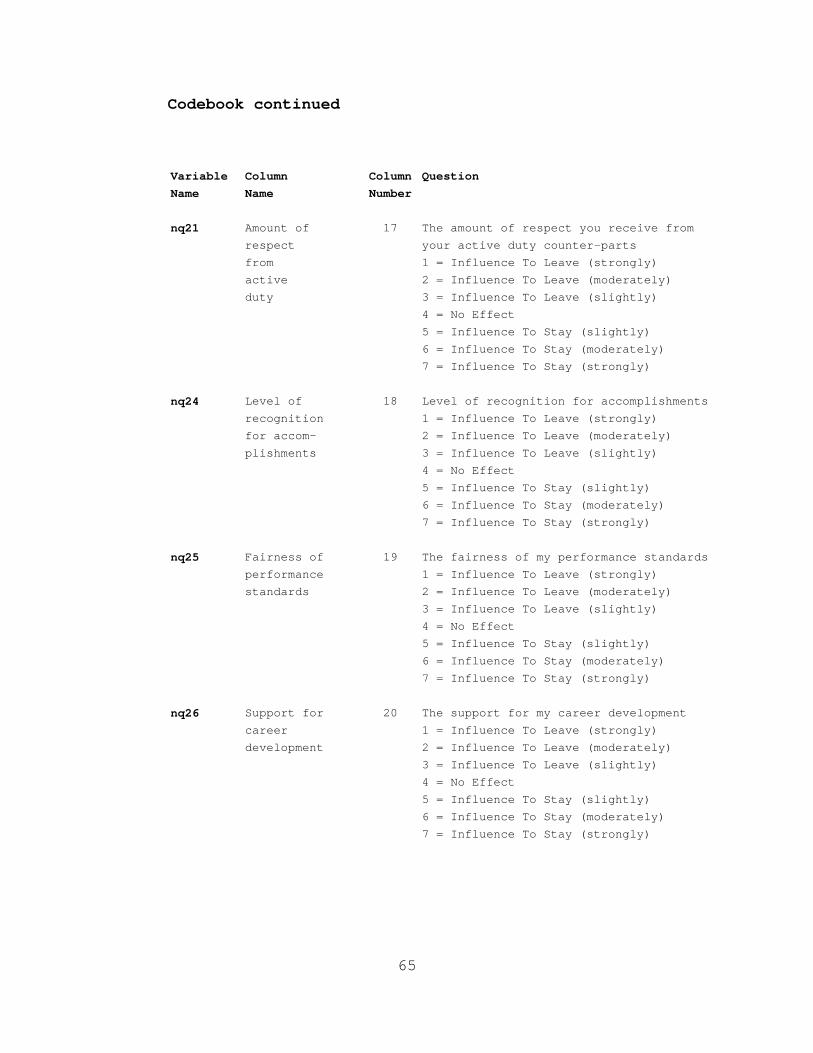
Codebook continued
Variable Column Column QuestionName Name Number
nq21 Amount of 17 The amount of respect you receive from
respect your active duty counter-parts
from 1 = Influence To Leave (strongly)
active 2 = Influence To Leave (moderately)
duty 3 = Influence To Leave (slightly)
4 = No Effect
5 = Influence To Stay (slightly)
6 = Influence To Stay (moderately)
7 = Influence To Stay (strongly)
nq24 Level of 18 Level of recognition for accomplishments
recognition 1 = Influence To Leave (strongly)
for accom- 2 = Influence To Leave (moderately)
plishments 3 = Influence To Leave (slightly)
4 = No Effect
5 = Influence To Stay (slightly)
6 = Influence To Stay (moderately)
7 = Influence To Stay (strongly)
nq25 Fairness of 19 The fairness of my performance standards
performance 1 = Influence To Leave (strongly)
standards 2 = Influence To Leave (moderately)
3 = Influence To Leave (slightly)
4 = No Effect
5 = Influence To Stay (slightly)
6 = Influence To Stay (moderately)
7 = Influence To Stay (strongly)
nq26 Support for 20 The support for my career development
career 1 = Influence To Leave (strongly)
development 2 = Influence To Leave (moderately)
3 = Influence To Leave (slightly)
4 = No Effect
5 = Influence To Stay (slightly)
6 = Influence To Stay (moderately)
7 = Influence To Stay (strongly)
65
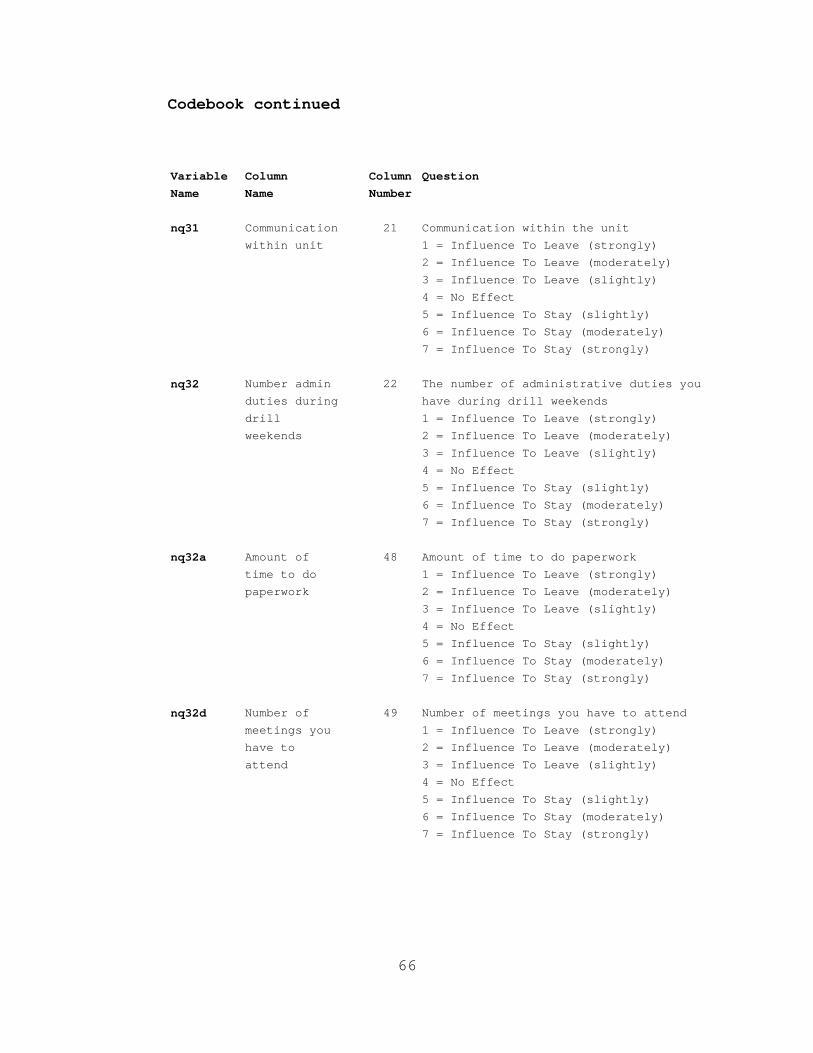
Codebook continued
Variable Column Column QuestionName Name Number
nq31 Communication 21 Communication within the unit
within unit 1 = Influence To Leave (strongly)
2 = Influence To Leave (moderately)
3 = Influence To Leave (slightly)
4 = No Effect
5 = Influence To Stay (slightly)
6 = Influence To Stay (moderately)
7 = Influence To Stay (strongly)
nq32 Number admin 22 The number of administrative duties you
duties during have during drill weekends
drill 1 = Influence To Leave (strongly)
weekends 2 = Influence To Leave (moderately)
3 = Influence To Leave (slightly)
4 = No Effect
5 = Influence To Stay (slightly)
6 = Influence To Stay (moderately)
7 = Influence To Stay (strongly)
nq32a Amount of 48 Amount of time to do paperwork
time to do 1 = Influence To Leave (strongly)
paperwork 2 = Influence To Leave (moderately)
3 = Influence To Leave (slightly)
4 = No Effect
5 = Influence To Stay (slightly)
6 = Influence To Stay (moderately)
7 = Influence To Stay (strongly)
nq32d Number of 49 Number of meetings you have to attend
meetings you 1 = Influence To Leave (strongly)
have to 2 = Influence To Leave (moderately)
attend 3 = Influence To Leave (slightly)
4 = No Effect
5 = Influence To Stay (slightly)
6 = Influence To Stay (moderately)
7 = Influence To Stay (strongly)
66
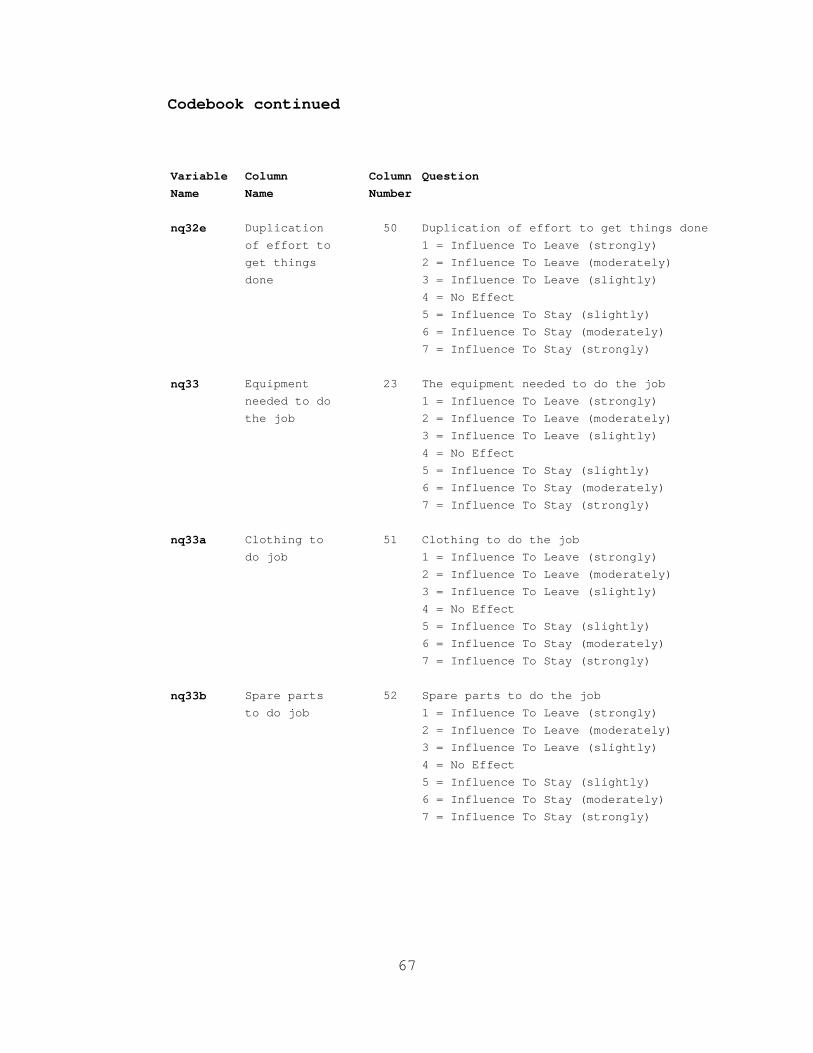
Codebook continued
Variable Column Column QuestionName Name Number
nq32e Duplication 50 Duplication of effort to get things done
of effort to 1 = Influence To Leave (strongly)
get things 2 = Influence To Leave (moderately)
done 3 = Influence To Leave (slightly)
4 = No Effect
5 = Influence To Stay (slightly)
6 = Influence To Stay (moderately)
7 = Influence To Stay (strongly)
nq33 Equipment 23 The equipment needed to do the job
needed to do 1 = Influence To Leave (strongly)
the job 2 = Influence To Leave (moderately)
3 = Influence To Leave (slightly)
4 = No Effect
5 = Influence To Stay (slightly)
6 = Influence To Stay (moderately)
7 = Influence To Stay (strongly)
nq33a Clothing to 51 Clothing to do the job
do job 1 = Influence To Leave (strongly)
2 = Influence To Leave (moderately)
3 = Influence To Leave (slightly)
4 = No Effect
5 = Influence To Stay (slightly)
6 = Influence To Stay (moderately)
7 = Influence To Stay (strongly)
nq33b Spare parts 52 Spare parts to do the job
to do job 1 = Influence To Leave (strongly)
2 = Influence To Leave (moderately)
3 = Influence To Leave (slightly)
4 = No Effect
5 = Influence To Stay (slightly)
6 = Influence To Stay (moderately)
7 = Influence To Stay (strongly)
67
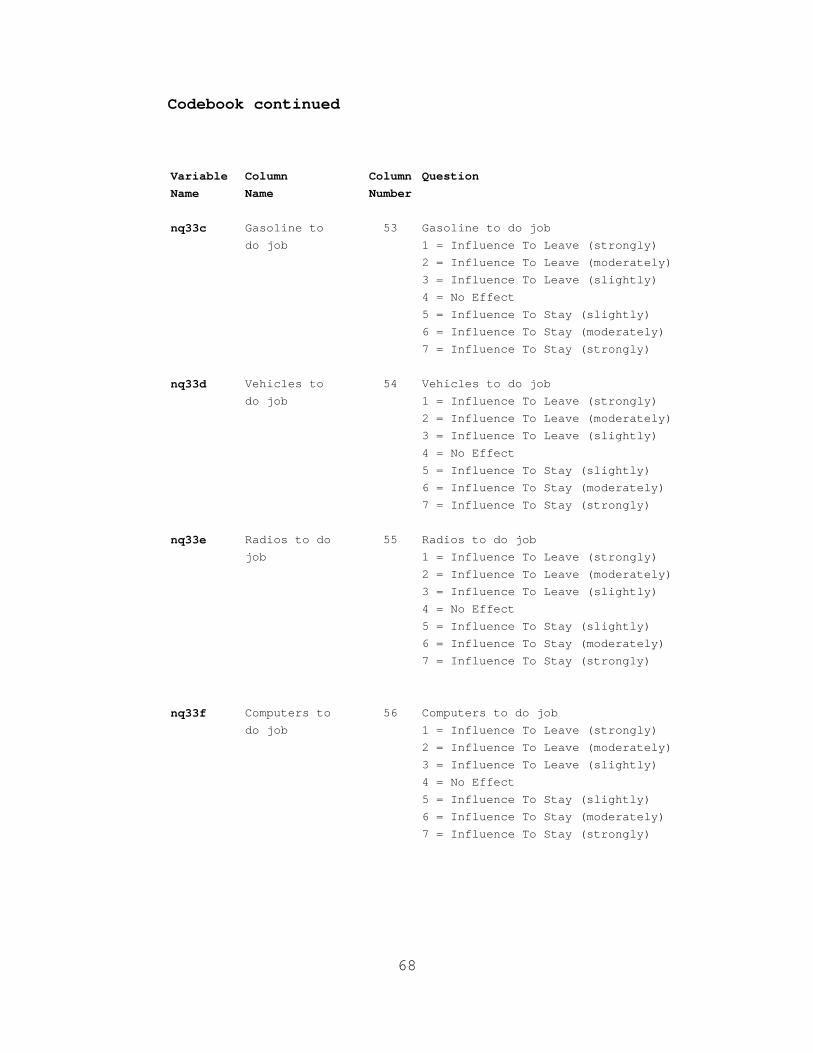
Codebook continued
Variable Column Column QuestionName Name Number
nq33c Gasoline to 53 Gasoline to do job
do job 1 = Influence To Leave (strongly)
2 = Influence To Leave (moderately)
3 = Influence To Leave (slightly)
4 = No Effect
5 = Influence To Stay (slightly)
6 = Influence To Stay (moderately)
7 = Influence To Stay (strongly)
nq33d Vehicles to 54 Vehicles to do job
do job 1 = Influence To Leave (strongly)
2 = Influence To Leave (moderately)
3 = Influence To Leave (slightly)
4 = No Effect
5 = Influence To Stay (slightly)
6 = Influence To Stay (moderately)
7 = Influence To Stay (strongly)
nq33e Radios to do 55 Radios to do job
job 1 = Influence To Leave (strongly)
2 = Influence To Leave (moderately)
3 = Influence To Leave (slightly)
4 = No Effect
5 = Influence To Stay (slightly)
6 = Influence To Stay (moderately)
7 = Influence To Stay (strongly)
nq33f Computers to 56 Computers to do job
do job 1 = Influence To Leave (strongly)
2 = Influence To Leave (moderately)
3 = Influence To Leave (slightly)
4 = No Effect
5 = Influence To Stay (slightly)
6 = Influence To Stay (moderately)
7 = Influence To Stay (strongly)
68
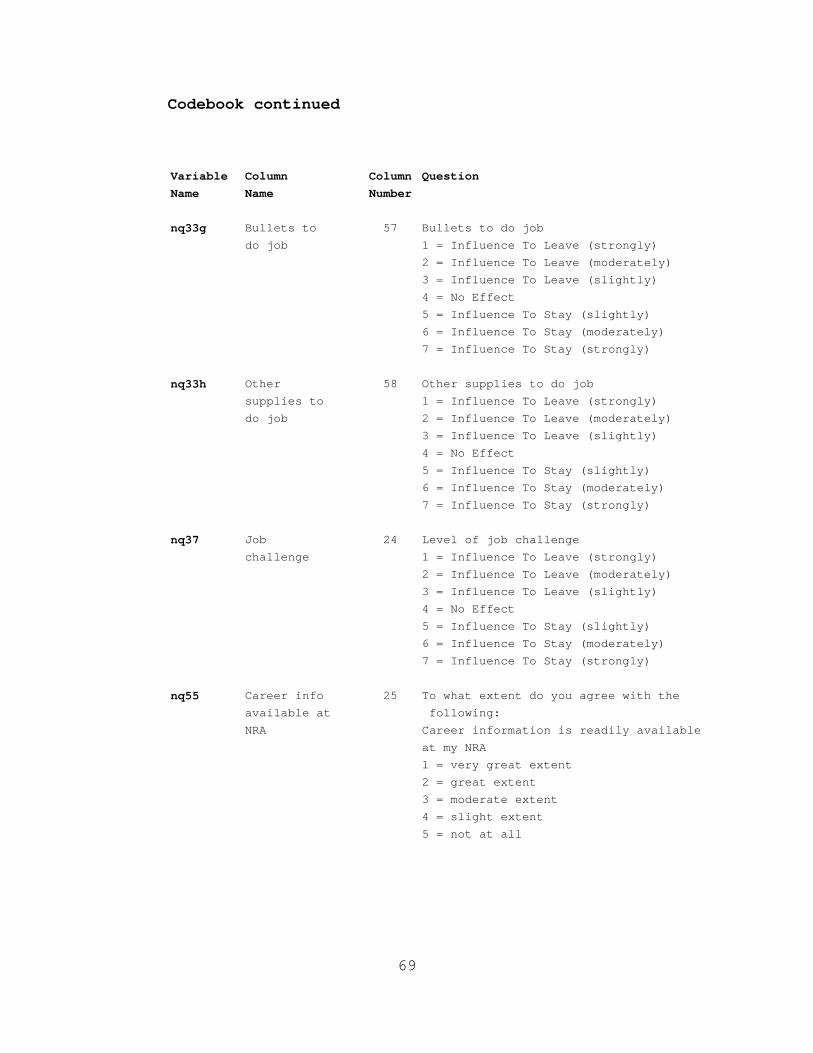
Codebook continued
Variable Column Column QuestionName Name Number
nq33g Bullets to 57 Bullets to do job
do job 1 = Influence To Leave (strongly)
2 = Influence To Leave (moderately)
3 = Influence To Leave (slightly)
4 = No Effect
5 = Influence To Stay (slightly)
6 = Influence To Stay (moderately)
7 = Influence To Stay (strongly)
nq33h Other 58 Other supplies to do job
supplies to 1 = Influence To Leave (strongly)
do job 2 = Influence To Leave (moderately)
3 = Influence To Leave (slightly)
4 = No Effect
5 = Influence To Stay (slightly)
6 = Influence To Stay (moderately)
7 = Influence To Stay (strongly)
nq37 Job 24 Level of job challenge
challenge 1 = Influence To Leave (strongly)
2 = Influence To Leave (moderately)
3 = Influence To Leave (slightly)
4 = No Effect
5 = Influence To Stay (slightly)
6 = Influence To Stay (moderately)
7 = Influence To Stay (strongly)
nq55 Career info 25 To what extent do you agree with the
available at following:
NRA Career information is readily available
at my NRA
1 = very great extent
2 = great extent
3 = moderate extent
4 = slight extent
5 = not at all
69

Codebook continued
Variable Column Column QuestionName Name Number
nq56 Quality of 26 To what extent do you agree with the
career info following:
is high The quality of the career information
available to me is high
1 = very great extent
2 = great extent
3 = moderate extent
4 = slight extent
5 = not at all
nq57 Opp to talk 27 To what extent do you agree with the with career following:
counselor I have the opportunity to talk with my
on drill career counselor on drill weekends
1 = very great extent
2 = great extent
3 = moderate extent
4 = slight extent
5 = not at all
nq63 Impact of 28 The impact of being in Reserves on your
being NR on family
family 1 = Influence To Leave (strongly)
2 = Influence To Leave (moderately)
3 = Influence To Leave (slightly)
4 = No Effect
5 = Influence To Stay (slightly)
6 = Influence To Stay (moderately)
7 = Influence To Stay (strongly)
nq64 Impact of NR 29 The impact of being in Reserves on your
on civilian civilian job
job 1 = Influence To Leave (strongly)
2 = Influence To Leave (moderately)
3 = Influence To Leave (slightly)
4 = No Effect
5 = Influence To Stay (slightly)
6 = Influence To Stay (moderately)
7 = Influence To Stay (strongly)
70
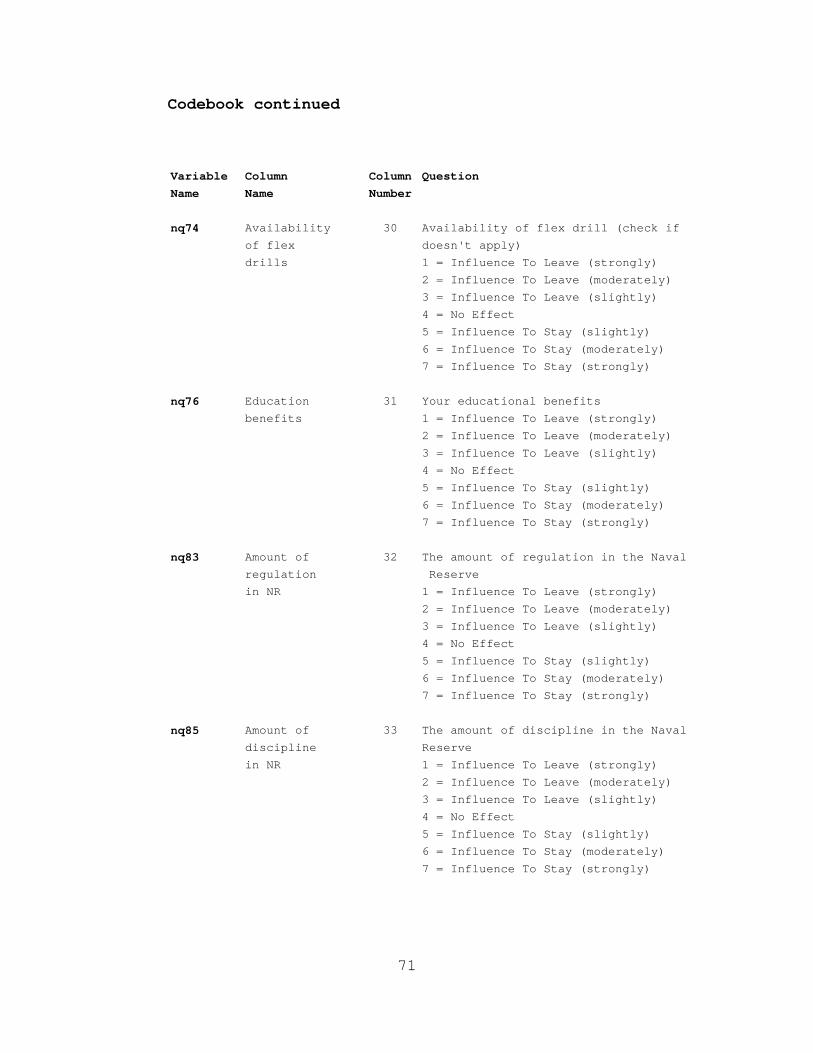
Codebook continued
Variable Column Column QuestionName Name Number
nq74 Availability 30 Availability of flex drill (check if
of flex doesn't apply)
drills 1 = Influence To Leave (strongly)
2 = Influence To Leave (moderately)
3 = Influence To Leave (slightly)
4 = No Effect
5 = Influence To Stay (slightly)
6 = Influence To Stay (moderately)
7 = Influence To Stay (strongly)
nq76 Education 31 Your educational benefits
benefits 1 = Influence To Leave (strongly)
2 = Influence To Leave (moderately)
3 = Influence To Leave (slightly)
4 = No Effect
5 = Influence To Stay (slightly)
6 = Influence To Stay (moderately)
7 = Influence To Stay (strongly)
nq83 Amount of 32 The amount of regulation in the Naval
regulation Reserve
in NR 1 = Influence To Leave (strongly)
2 = Influence To Leave (moderately)
3 = Influence To Leave (slightly)
4 = No Effect
5 = Influence To Stay (slightly)
6 = Influence To Stay (moderately)
7 = Influence To Stay (strongly)
nq85 Amount of 33 The amount of discipline in the Naval
discipline Reserve
in NR 1 = Influence To Leave (strongly)
2 = Influence To Leave (moderately)
3 = Influence To Leave (slightly)
4 = No Effect
5 = Influence To Stay (slightly)
6 = Influence To Stay (moderately)
7 = Influence To Stay (strongly)
71
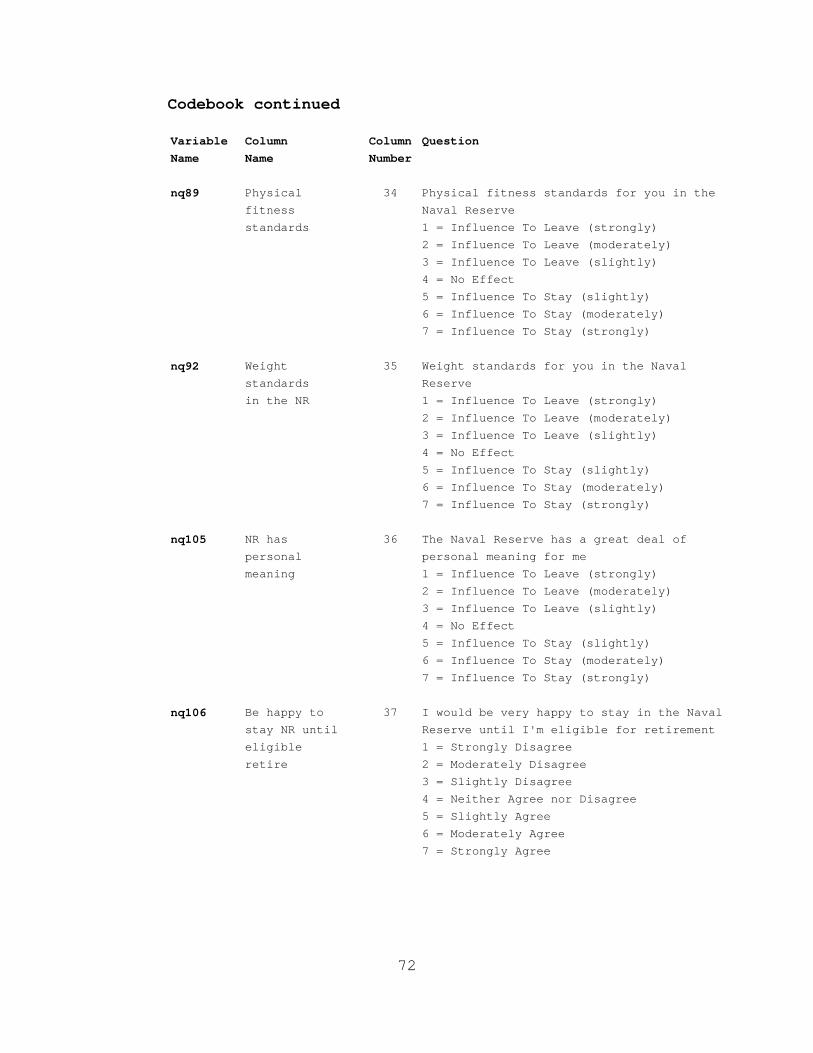
Codebook continued
Variable Column Column QuestionName Name Number
nq89 Physical 34 Physical fitness standards for you in the
fitness Naval Reserve
standards 1 = Influence To Leave (strongly)
2 = Influence To Leave (moderately)
3 = Influence To Leave (slightly)
4 = No Effect
5 = Influence To Stay (slightly)
6 = Influence To Stay (moderately)
7 = Influence To Stay (strongly)
nq92 Weight 35 Weight standards for you in the Naval
standards Reserve
in the NR 1 = Influence To Leave (strongly)
2 = Influence To Leave (moderately)
3 = Influence To Leave (slightly)
4 = No Effect
5 = Influence To Stay (slightly)
6 = Influence To Stay (moderately)
7 = Influence To Stay (strongly)
nq105 NR has 36 The Naval Reserve has a great deal of
personal personal meaning for me
meaning 1 = Influence To Leave (strongly)
2 = Influence To Leave (moderately)
3 = Influence To Leave (slightly)
4 = No Effect
5 = Influence To Stay (slightly)
6 = Influence To Stay (moderately)
7 = Influence To Stay (strongly)
nq106 Be happy to 37 I would be very happy to stay in the Naval
stay NR until Reserve until I'm eligible for retirement
eligible 1 = Strongly Disagree
retire 2 = Moderately Disagree
3 = Slightly Disagree
4 = Neither Agree nor Disagree
5 = Slightly Agree
6 = Moderately Agree
7 = Strongly Agree
72

Codebook continued
Variable Column Column QuestionName Name Number
nq108 Feel 38 I do not feel "emotionally attached" to
emotionally the Naval Reserve
attached to 1 = Strongly Disagree
NR 2 = Moderately Disagree
3 = Slightly Disagree
4 = Neither Agree nor Disagree
5 = Slightly Agree
6 = Moderately Agree
7 = Strongly Agree
nq109 Dedicated to 39 I am dedicated to serving in the
serving in Naval Reserve
the NR 1 = Strongly Disagree
2 = Moderately Disagree
3 = Slightly Disagree
4 = Neither Agree nor Disagree
5 = Slightly Agree
6 = Moderately Agree
7 = Strongly Agree
nq110 Feel strong 40 I do not feel a strong sense of belonging
sense of to the Naval Reserve
belonging 1 = Strongly Disagree
2 = Moderately Disagree
3 = Slightly Disagree
4 = Neither Agree nor Disagree
5 = Slightly Agree
6 = Moderately Agree
7 = Strongly Agree
nq116 Current 41 What are your current career intentions?
career 1 = I intend to stay in the Naval Reserves
intentions until I am eligible to retire
2 = I intend to stay in the active-duty
Navy until I am eligible to retire
3 = I intend to stay in one of the other
services until I am eligible to retire
4 = I intend to stay in the service 2
or more years
5 = I intend to stay less than 2 years and
I will not be retirement eligible
6 = I plan to leave as soon as possible
and not join any other service
73

Codebook continued
Variable Column Column QuestionName Name Number
nq117 Quality of 42 The quality of leadership at the senior
leadership at officer level (CO/XO)
the senior 1 = Influence To Leave (strongly)
officer level 2 = Influence To Leave (moderately)
3 = Influence To Leave (slightly)
4 = No Effect
5 = Influence To Stay (slightly)
6 = Influence To Stay (moderately)
7 = Influence To Stay (strongly)
nq121 Quality of 43 The quality of leadership at the Chief
leadership at Petty Officer level (CPO)
the CPO level 1 = Influence To Leave (strongly)
2 = Influence To Leave (moderately)
3 = Influence To Leave (slightly)
4 = No Effect
5 = Influence To Stay (slightly)
6 = Influence To Stay (moderately)
7 = Influence To Stay (strongly)
74
75
LIST OF REFERENCES
1. Edmunds, Robert G. CDR, USNR. (2003). Transforming the Naval Reserve: How to Stay Relevant and Affordable in the Post-Cold War Environment. Carlisle Barracks, Pennsylvania: U.S. Army War College.
2. Cotton, John G., VADM (2005) Statement of Vice
Admiral John G. Cotton, Chief of Naval Reserve, Before the Senate Armed Forces Committee, Subcommittee on Personnel, On Fiscal Year 2006 National Guard and Reserve Component Programs. (April 13, 2005).
3. Cotton, John G. VADM (2004). Defense Subcommittee
Hearing on the FY05 National Guard & Reserve Budget: Testimony of VADM John G. Cotton, USNR, Chief, Naval Reserve. (April 7, 2004).
4. Hanzlik, Jack CDR, USNR. (2004). Naval Reserve
Historical Info. (November 12, 2004) 5. United States Department of Defense - American
Forces Information Service - News Articles. (2005). National Guard and Reserve Units Called to Active Duty (May 18, 2005). Accessed June 5, 2005 from http://www.defenselink.mil/news/May2005/d20050518.pdf.
6. Bureau of Naval Personnel. (2001) BUPERSINST
1001.39D – Administrative Procedures for Naval Reservists on Inactive Duty.
7. Office of the Under Secretary of Defense, Personnel
and Readiness. (2003). Gender. Accessed June 5, 2005 from http://www.defenselink.mil/prhome/poprep2001/chapter5/c5_resgender.htm.
8. Office of the Under Secretary of Defense, Personnel
and Readiness. (2003). Marital Status. Accessed June 5, 2005 from http://www.defenselink.mil/prhome/poprep2001/chapter5/c5_resmarital.htm.
76
9. Office of the Under Secretary of Defense, Personnel and Readiness. (2003). Characteristics of Selected Reserve Accessions. Accessed June 5, 2005 from http://www.defenselink.mil/prhome/poprep2001/chapter5/c5_accessions.htm.
10. Office of the Under Secretary of Defense,
Personnel and Readiness. (2003). Representation Within Occupations. Accessed June 5, 2005 from http://www.defenselink.mil/prhome/poprep2001/chapter5/c5_repocc.htm
11. Office of the Under Secretary of Defense,
Personnel and Readiness. (2003). Age. Accessed June 5, 2005 from http://www.defenselink.mil/prhome/poprep2001/chapter5/c5_resage.htm
12. Kirby, Sheila Nataraj, Grissmer, David W.,
Williamson, Stephanie, & Naftel, Scott (1997) Costs and Benefits of Reserve Participation: New Evidence from the 1992 Reserve Components Survey. (Document No. MR-812-OSD). Alexandria, Virginia: RAND Corporation.
13. Ricketts, Paula Mary Pat, (1989). A Multivariate
Analysis of Reenlistment Intentions of Naval Reservists. Unpublished master’s thesis, Naval Postgraduate School, Monterey, California.
14. Kostiuk, Peter F., Follman, Dean A., & Shiells,
Martha E. (1988) Utilization Of Personnel Resources Within The Navy Selected Reserve. (Research Memorandum No. CRM 88-155). Alexandria, Virginia: Center for Naval Analyses.
15. Kostiuk, Peter F. and Follman, Dean A. (1988)
Retention of Navy Veterans in the Selected Reserve. (Research Memorandum No. CRM 88-72). Alexandria, Virginia: Center for Naval Analyses.
16. Fithian, Donald D. Jr. (1988) An Analysis of
Retention of First-Term Enlisted Personnel in the Selected Reserves. Naval Postgraduate School M.S. thesis, Monterey, California, (June 1988).
77
17. Boykin, Milton L., Ph.D, Commander, USNR-R, & Merritt, Hardy L., M.P.A., Lieutenant Commander, USNR. (1979). A Preliminary Report: Naval Reserve Personnel Attitude Survey 1979, Readiness Command Region Seven-Retention. Fort Belvoir, Virginia: Defense Information Systems Agency. (October 1979).
18. Kirby, Sheila Nataraj, & Naftel, Scott. (1998).
The Effect of Mobilization on Retention of Enlisted Reservists After Operation Desert Shield/Storm. (Document No. MR-943-OSD). Alexandria, Virginia: RAND Corporation.
19. Kominiak, Aimee L. (1997). Determinants of
Nonparticipation in the United States Army Reserve. Unpublished master’s thesis, Naval Postgraduate School, Monterey, California.
20. Shiells, Martha E. and Reese, David L. (1988).
Retention in the Naval Reserve Force. (Document No. CRM-88-29). Alexandria, Virginia. Center for Naval Analyses (February 1988).
21. Shiells, Martha E. (1986). Affiliation of Navy
Veterans with the Selected Reserve. (Document No. CRM 86-249). Alexandria, Virginia. Center for Naval Analyses (December 1986).
22. Connor-Linton, Jeff, Ph.D. (2003). Chi-Square
Tutorial. Accessed March 2003 from http://www.georgetown.edu/faculty/ballc/webtools/web_chi_tut.html#computing.
23. Ward, John D. CDR. USNR. (2004) Naval Reserve
“Force Shaping”, Personnel Management and Manpower Acquisition: (“Return on Investment” Analysis, and Alternative Approach Examination). Naval Reserve Center, Los Angeles, California. (December 9, 2004).

78
THIS PAGE INTENTIONALLY LEFT BLANK
79
INITIAL DISTRIBUTION LIST
1. Defense Technical Information Center Ft. Belvoir, Virginia
2. Dudley Knox Library Naval Postgraduate School Monterey, California
3. Professor Kathryn Kocher Naval Postgraduate School Monterey, California
4. Professor Elda Pema Naval Postgraduate School Monterey, California
5. CAPT Mark Krause Commander, Navy Reserve Force CNO 0956 Division Director of IM/IT New Orleans, Louisiana
6. LCDR Rita Alice Becker Navy/Marine Corps Reserve Center Phoenix, Arizona