naval postgraduate school - defense … analysis of various accounting methods for cost tracing and...
TRANSCRIPT

NAVAL POSTGRADUATE
SCHOOL
MONTEREY, CALIFORNIA
MBA PROFESSIONAL REPORT
Fleet Readiness Center Mid-Atlantic Worker Cost Comparison
By: Joseph P. Johnson
June 2012
Advisors: Kenneth Euske Stephen Hansen
Approved for public release; distribution is unlimited

ii
THIS PAGE INTENTIONALLY LEFT BLANK
i
REPORT DOCUMENTATION PAGE Form Approved OMB No. 0704-0188 Public reporting burden for this collection of information is estimated to average 1 hour per response, including the time for reviewing instruction, searching existing data sources, gathering and maintaining the data needed, and completing and reviewing the collection of information. Send comments regarding this burden estimate or any other aspect of this collection of information, including suggestions for reducing this burden, to Washington headquarters Services, Directorate for Information Operations and Reports, 1215 Jefferson Davis Highway, Suite 1204, Arlington, VA 22202-4302, and to the Office of Management and Budget, Paperwork Reduction Project (0704-0188) Washington DC 20503.
1. AGENCY USE ONLY (Leave blank)
2. REPORT DATE June 2012
3. REPORT TYPE AND DATES COVERED MBA Professional Report
4. TITLE AND SUBTITLE: Fleet Readiness Center Mid-Atlantic Worker Cost Comparison
5. FUNDING NUMBERS
6. AUTHOR(S) Joseph P. Johnson
7. PERFORMING ORGANIZATION NAME(S) AND ADDRESS(ES) Naval Postgraduate School Monterey, CA 93943-5000
8. PERFORMING ORGANIZATION REPORT NUMBER
9. SPONSORING / MONITORING AGENCY NAME(S) AND ADDRESS(ES) N/A
10. SPONSORING / MONITORING AGENCY REPORT NUMBER
11. SUPPLEMENTARY NOTES The views expressed in this report are those of the author(s) and do not reflect the official policy or position of the Department of Defense or the U.S. Government. I.R.B. Protocol number N/A.
12a. DISTRIBUTION / AVAILABILITY STATEMENT Approved for public release; distribution is unlimited
12b. DISTRIBUTION CODE A
13. ABSTRACT (maximum 200 words)
This report creates a financial view of billets at Fleet Readiness Center Mid-Atlantic (FRCMA). FRCMA is the largest Intermediate Maintenance Facility in the U.S. Navy. FRCMA provides maintenance and repair support to aviation squadrons, and is staffed by military, civilian, and contract employees. This report conducts an analysis of direct and indirect costs to build a wage comparison between a military, contractor, and civilian wage employee. This analysis uses a single pay grade comparison. All available direct and indirect costs are aggregated, and these costs are traced as accurately as possible to each billet. An analysis of various accounting methods for cost tracing and allocation is conducted, along with the methods for tracing and allocating indirect and direct costs to each comparative pay category. A focus on labor costs and overhead allocation is included, along with an analysis of appropriation categories.
14. SUBJECT TERMS Labor cost analysis, labor overhead, overhead, indirect cost, labor indirect expense, depreciation, Fleet Readiness Center, labor model, financial labor analysis, allocation.
15. NUMBER OF PAGES
79
16. PRICE CODE
17. SECURITY CLASSIFICATION OF REPORT
Unclassified
18. SECURITY CLASSIFICATION OF THIS PAGE
Unclassified
19. SECURITY CLASSIFICATION OF ABSTRACT
Unclassified
20. LIMITATION OF ABSTRACT
UU

ii
THIS PAGE INTENTIONALLY LEFT BLANK

iii
Approved for public release; distribution is unlimited
FLEET READINESS CENTER MID-ATLANTIC WORKER COST COMPARISON
Joseph P. Johnson, Lieutenant Commander, United States Navy
Submitted in partial fulfillment of the requirements for the degree of
MASTER OF BUSINESS ADMINISTRATION
from the
NAVAL POSTGRADUATE SCHOOL June 2012
Authors: _____________________________________
Joseph P. Johnson Approved by: _____________________________________
Kenneth Euske, Lead Advisor _____________________________________ Stephen Hansen, Support Advisor _____________________________________ Dr. William Gates, Dean
Graduate School of Business and Public Policy

iv
FLEET READINESS CENTER MID-ATLANTIC WORKER COST
COMPARISON
ABSTRACT
This report creates a financial view of billets at Fleet Readiness Center Mid-Atlantic
(FRCMA). FRCMA is the largest Intermediate Maintenance Facility in the U.S. Navy.
FRCMA provides maintenance and repair support to aviation squadrons, and is staffed by
military, civilian, and contract employees. This report conducts an analysis of direct and
indirect costs to build a wage comparison between a military, contractor, and civilian
wage employee. This analysis uses a single pay grade comparison. All available direct
and indirect costs are aggregated, and these costs are traced as accurately as possible to
each billet. An analysis of various accounting methods for cost tracing and allocation is
conducted, along with the methods for tracing and allocating indirect and direct costs to
each comparative pay category. A focus on labor costs and overhead allocation is
included, along with an analysis of appropriation categories.

v
THIS PAGE INTENTIONALLY LEFT BLANK

vi
TABLE OF CONTENTS
I. INTRODUCTION........................................................................................................1 A. PURPOSE .........................................................................................................1 B. RESEARCH OBJECTIVES ...........................................................................2
II. BACKGROUND ..........................................................................................................5 A. CONGRESSIONAL APPROPRIATION ......................................................5
1. Navy Working Capital Funds (WCFs) ..............................................5 2. Military Appropriation .......................................................................6
III. LITERATURE REVIEW ...........................................................................................7 A. UNDERSTANDING COSTS ..........................................................................7
1. Direct Costs, Indirect and Overhead .................................................7 2. Cost Pools and Allocation ....................................................................9
IV. BURDENED LABOR CALCULATED ...................................................................15 A. MILITARY PAY AND COMPENSATION ESTIMATE (FRCMA) .......15
1. Basic Pay and Allowances .................................................................15 2. Military (FRCMA) Burdened Labor Rate ......................................16
B. CIVILIAN PAY AND COMPENSATION ESTIMATE (FRCMA) .........20 1. Basic Pay and Allowances .................................................................20 2. Civilian (FRCMA) Burdened Labor Rate .......................................21
C. CONTRACTOR PAY AND COMPENSATION (FRCMA) .....................23
V. INDIRECT AND DIRECT COST COMPARISON ...............................................25 A. METHODS OF DISTRIBUTING COSTS AT FRC ..................................25 B. COMPARISON OF OTHER COSTS ..........................................................27
1. Overtime .............................................................................................27 2. Overhead .............................................................................................28 3. Depreciation ........................................................................................33
VI. METHODOLOGY ....................................................................................................39 A. LIMITS OF RESEARCH .............................................................................39 B. MODEL PARAMETERS .............................................................................39
VII. CONCLUSIONS AND IMPLICATIONS ...............................................................43 A. CONSOLIDATED DATA .............................................................................43 B. CONCLUSIONS ............................................................................................46 C. RECOMMENDATIONS OF AREAS FOR FURTHER STUDY .............50
APPENDIX A. MILITARY PAY TABLE .................................................................53
APPENDIX B. CIVILIAN WORKING GRADE (WG) PAY TABLES .................55
APPENDIX C. CIVILIAN EQUIVALENCY TABLE .............................................57
APPENDIX D. SPECIAL WG PAY SCALE FOR FRCMA ...................................59
APPENDIX E. FRCMA NORFOLK FACILITY DATA ........................................61

vii
LIST OF REFERENCES ......................................................................................................63
INITIAL DISTRIBUTION LIST .........................................................................................65

viii
LIST OF FIGURES
Figure 1. Labor Breakdown by Percentage of Total Burden Labor Rate ........................45
ix
LIST OF TABLES
Table 1. Basic Military Hourly Rate (From Appendix A) .............................................16 Table 2. Military Burdened Labor Rate (From 8–9) ........................................................19 Table 3. Civilian Base Hourly Rate (From Appendix D) ..............................................20 Table 4. Civilian Burdened Labor Rate (From 11–14) .....................................................22 Table 5. Scenarios of Military Overtime Analysis (From 17) ........................................27 Table 6. Military Component Service Departments-Norfolk (From 18–19) ....................29 Table 7. Military Overhead Analysis (From 20–23) .........................................................30 Table 8. Civilian Overhead Analysis (From 24–25) .........................................................31 Table 9. Contractor Overhead Analysis (From 27) .........................................................33 Table 10. Straight Line Depreciation (From 28–30) ...........................................................35 Table 11. Military and Civilian Depreciation Analysis (From 33–37) ...............................36 Table 12. Contractor Depreciation Analysis (From 38) ....................................................37 Table 13. Leave Usage Example in Non-Billable Hour Calculations (From 1–2) ............41 Table 14. Consolidated Labor Analysis (From Section IV and V) ..................................44

x
THIS PAGE INTENTIONALLY LEFT BLANK

xi
ACKNOWLEDGMENTS
I greatly appreciate the wonderful support I received from all members of FRC
Mid-Atlantic. Ms. Susie Ainsworth, Mr. Chris Rice, and Ms. Shatonda Davis were
instrumental in gathering the financial information I requested, and I could not have
completed this report without their help. Commander Craig Owen was a personal contact
at FRCMA and I relied heavily on him. He ensured I made the proper contacts and
ensured my site visit was executed without flaw. His expert knowledge and
professionalism were necessary in ensuring the completeness of this project. Also, I
sincerely appreciate the support from Commanding Officer FRCMA, Captain James
CoBell, III, for his support of my site visit.
I want to thank my beautiful daughter, Fiona, for having patience with Daddy as
he spent time away from home and hours in the office. As John Adams said, “I must
study politics and war, that my sons may have liberty to study mathematics and
philosophy, natural history and naval architecture, in order to give their children a right to
study painting, poetry, music, architecture, tapestry, and porcelain.” As she was patient
with this program and my master’s degree program in Military Operations, I hope that
her patience produces knowledge that can be used to make her future one even better than
what was handed down to me.
My enduring respect and thankfulness goes to my wife, Holly, who supported me
during my thesis writing and studies for my MBA. Juggling duties as a mom, wife,
employee, and student, she never wavered in her determination to help me when I needed
it. Thank you so very much, Wife. Calculating your labor rate is impossible, and I’m
thankful I won’t be charged your G&A expense.

xii
THIS PAGE INTENTIONALLY LEFT BLANK

1
I. INTRODUCTION
A. PURPOSE
Department of Defense (DoD) organizations are often very diverse, both in what
they do and how they do it. The diversity of the organization, combined with the
complexity of the mission, often causes difficulty in analyzing the costs associated with
running the organization. Managers of DoD organizations require knowledge of where
and how costs occur. Given the expected decrease in the DoD budget, understanding
where and how costs occur can help managers control costs within their organization in
an environment of decreased funding.
Aggregating costs associated with accomplishing the mission enables cost control
at Fleet Readiness Center Mid-Atlantic (FRCMA). FRCMA is the largest Intermediate
and Depot Maintenance Facility in the U.S. Navy. FRCMA is composed of several
detachments which include Oceana, Norfolk, Washington (D.C.), New Orleans, and
Patuxant River. The senior leadership of FRCMA is located at Naval Air Station Oceana
in Virginia Beach, Virginia. Finance and cost analysis for FRCMA is conducted in
Oceana, with more high level accounting and finance occurring at FRC Southeast
(FRCSE) in Jacksonville, Florida.
FRCMA employs military, civilian, and contract employees to accomplish the
task of maintenance and repair of naval aircraft. Each category of employee incurs
separate and different costs. The intent of this report is to identify the labor costs of each
of the three types of employees. The objective of the report is not to show which
employee is cheaper and, conversely, which is more expensive. Further analysis, as
detailed later in the conclusion, could provide a more refined answer to the question of
which employee is more and less expensive. The objective of this report is to make the
methods of tracing indirect costs and the tracing of indirect costs to each of the three
types of employees more transparent. To facilitate this understanding, this report reviews
standard accounting techniques for allocating indirect costs. Also, this report reviews
Congressional funding appropriations with the intent to form an appreciation of the

2
complexity of paying for costs associated with the three types of employees. Finally, this
report attempts to provide a managerial accounting view of labor costs associated with
activities at FRCMA.
B. RESEARCH OBJECTIVES
The intent of this report is to provide a managerial or cost accounting view of
labor costs associated with FRCMA. To facilitate a transparent labor analysis, this report
examines some identifiable costs of operating FRCMA. Costs, which occur directly and
indirectly with the operations within FRCMA, are included in this report for tracing
purposes. The objective of including these costs is to give managers visibility in costs
identified and to give an appreciation of the limits of scope of this report.
This report creates a basic wage model for military, contractor, and civilian
employees. This model is used to show assumptions, allocation rates, and levels of costs
to each employee category. Also, the model provides a framework for the paper’s
recommendations and conclusions, and provides a reference model for future research.
The intent is not to provide a sole model for use in all FRC applications, but to provide
one perspective on the costs associated with the organization’s employees.
This report analyzes various methods for tracing indirect costs of FRC Mid-
Atlantic. Indirect costs are a normal and necessary part of operating the organization.
The tracing of those costs provides an appreciation of how costs behave and potentially
how to control those costs. Methods for tracing overhead vary across organizations. This
report provides one perspective on the tracing of identified costs. The analysis can
potentially be helpful in future research or help provide the data necessary to develop
additional models.
This report is divided into seven main sections. Sections I and II describe the
purpose, objectives, and background of labor analysis at FRCMA. Section III is a short
literature review of accounting terms and methods which are utilized in this report.
Section IV builds a burdened labor rate for the three types of employees at FRCMA.

3
Section V presents an analysis of other costs associated with labor. Section VI presents
limits of research and model parameters of this report. Section VII presents conclusions
and recommendations for further study, which are based on the findings in Section V.

4
THIS PAGE INTENTIONALLY LEFT BLANK

5
II. BACKGROUND
A. CONGRESSIONAL APPROPRIATION
1. Navy Working Capital Funds (WCFs)
FRCMA is funded by a Working Capital Fund (WCF). Funding employee pay
within the FRC’s varies due to their status as WCF’s. The WCF does not receive yearly
appropriations from Congress for civilian and contractor pay. A WCF receives an initial
appropriation from Congress which establishes the operation. The WCF bills its
customers for services provided and those revenues support the operation.
The DWCF must sell services to customers utilizing rates (stabilized rates) for goods and services to recover cost of operations. The stabilized billing rates are established during the WCF’s budget process and are set to break even (make no profit or loss) over the long run…A significant challenge of the DWCF activities is that they must stabilize their billing rates for an entire fiscal year…the DWCF must predict all costs of resources to produce the services far in advance of the fiscal year. (American Society of Military Comptrollers, 2011)
The WCF should strive to neither make nor lose money in the long run. WCF
funds are termed revolving funds (American Society of Military Comptrollers, 2011).
The WCF sets rates for services to be provided and builds a budget based on planned
revenue received from those services. The standard yearly rate provides stability for the
customers, in that the rates for services do not change throughout the year. Actual
revenues are compared with budgeted revenues, and the WCF changes pricing for
services for the following year. This change in pricing should attempt to drive losses or
gains to zero in the long term. The WCF attempts to stabilize prices “during the
execution period to protect customers from unforeseen fluctuations that would impact
their ability to execute the programs approved by Congress” (American Society of
Military Comptrollers, 2011, p. 2.1.65).
One objective of the WCF is to demonstrate or identify the true cost of services
rendered to the Department of Defense. Cost visibility is important to Congress and the
DoD, and the recovery of those costs is important to the WCF. The understanding of

6
how direct and indirect costs accumulate and how they are distributed is vitally important
to the WCF. It is critical that the WCF accurately track direct and indirect costs as these
costs are utilized to develop a billing rate. Distributing costs incorrectly or not
accounting for all costs could distort the true cost of the product the WCF is offering.
Improper cost distribution could make the products marketed by the WCF incorrectly
priced (Naval Postgraduate School, 2011, pp. 107–109).
2. Military Appropriation
Military personnel receive pay from the Military Personnel Navy and Marine
Corps (MPN, MPMC) Congressional appropriation. This appropriation is a yearly
appropriation, and needs to be passed each year for military personnel to receive pay.
This appropriation funds officer and enlisted pay, bonuses, allowances, and moves.
Those military personnel at FRCMA Norfolk receive their pay and allowances from this
appropriation. There are two exceptions within the FRCMA. The Commanding Officer
and the Production Officer are two WCF billets. The WCF reimburses the government
for the salary cost of those two positions. All other military members, though, are funded
outside of the WCF (Naval Postgraduate School, 2011, p. 97). Generally, funds used to
build facilities for military activities originate from the Military Construction
Appropriation (MCON). Equipment for ship support, aviation support, supply support
equipment, and spares and repair parts originate from the Other Navy Procurement
Appropriations (OPN). Administrative expenses, TAD travel, depot maintenance and
fuel are funded through the Operations and Maintenance Navy (O&MN) Appropriations.
Thus, the WCF customer uses O&MN funds to pay for services rendered by the WCF
depot maintenance (Naval Postgraduate School, 2011, p. 97). No O&MN appropriations
can be used by the WCF to fund its activities, nor can any money from the WCF be used
to augment Navy Appropriations.

7
III. LITERATURE REVIEW
A. UNDERSTANDING COSTS
1. Direct Costs, Indirect and Overhead
Federal Acquisition Regulation (FAR) 31.202 defines a direct cost as “any cost
that can be identified specifically with a particular cost objective” (Defense Systems
Management College, 1999, p. 2-1). A cost objective is “any function for which cost is
accumulated,” (Fultz, 1980, p. 2) or as a “function, organizational subdivision, contract,
or other work unit for which cost data are desired and for which provisions are made to
accumulate and measure the cost of processes, products, jobs, capitalized projects, etc.”
(Defense Systems, 1999, p. 2-1). Direct costs include salaries and wages of personnel
who directly or physically create the product or service an organization sells. Direct
costs also include the materials or services “incorporated into the product or the
production process” (Oyer, 2005, p. 45). Direct costs can be divided into several
categories. Direct labor is work that is “readily identified with the end product” (Defense
Systems, 1999, p. 2-2). Generally, projects are identified as cost objectives, and the labor
used in fabrication (or other direct work) is described as direct labor. Direct Materials
refer to “all material costs that are used in making a product and that are directly
associated with a change in the product” (Defense Systems, 1999, p. 2-2). Costs which
are not materials or labor but still directly attributable to a cost objective are defined as
other direct costs. Other direct costs “have all the properties of direct materials or direct-
labor cost, yet it may or may not be a tangible part of the final product” (Defense
Systems, 1999, p. 2-2). If a cost is identified as directly attributable to the cost objective,
but does not fit into direct labor or materials, it can be defined as other direct costs. Other
direct costs (ODC) or charges are “not generally considered a major component of the
product, nevertheless ODC benefits a particular cost objective, can be measured, and the
amount of the cost is significant enough to warrant its tracking” (Fultz, 1980, p. 7).
FAR 31.203 defines an indirect cost as “any cost not directly identified with a
single, final cost objective; but it is identified with two or more cost objectives or an

8
intermediate cost objective” (Defense Systems, 1999, p. 2-2). Indirect costs are generally
harder to identify in that these costs could relate to multiple activities within the
organization. It is also possible some costs are “not susceptible to measurement at the
unit of output level” and could be classified as indirect (Oyer, 2005, p. 45). Indirect costs
will generally fall into two categories: overhead and general and administrative expense
(G&A) (Defense Systems, 1999, p. 2-3). Once separated and traced as accurately as
possible, indirect costs can be added to direct costs to provide a more accurate sense of
total costs related to a cost objective.
Overhead costs are indirect in nature, as they generally apply to a specific part of
the facility but not necessarily only attributable to one product. Overhead are “expenses
incurred for the common good of several cost objectives and which cannot be reasonably
or cost-effectively charged directly to specific cost objectives, and those expenses that are
so minor as to make it impractical for both cost and time reasons to charge them directly
to a particular cost objective” (Fultz, 1980, p. 9). These indirect costs are generally
accumulated into a “pool” of costs. Overhead costs can be placed into one pool or
separated into several, depending on the nature of the organization and level of
complexity desired. “Generally, the accuracy of cost information and management
visibility are improved by the introduction of additional indirect-cost pools” (Defense
Systems, 1999, p. 3-1). Overhead can be broken down into several cost pools such as
engineering, manufacturing, products, and materials. Overhead for FRCMA will be
analyzed in Section V.
General and administrative (G&A) expenses refer to “those expenses necessary
for the general overall operation of the business” (Fultz, 1980, p. 11). They are also
defined as expenses that “represent the cost of activities necessary to the overall
operation of the business as a whole, but a direct relationship to any particular cost
objective cannot be shown” (Defense Systems, 1999, p. 3-4). Examples of these costs
include management costs, salaries of administrative personnel, office supplies, legal
expenses, human resources, and accounting. The costs associated with G&A are traced
as accurately as possible to the cost objectives for FRC. The proper tracing of G&A is
debatable and possibly controversial. Therefore, various methods are possible, and the

9
assumptions used for tracing in this report are discussed in Section V. The intention of
discovering and separating indirect costs is to “improve the visibility of difficult-to-
control costs and facilitates the monitoring of similar types of expenses” (Defense
Systems, 1999, p. 3-1).
2. Cost Pools and Allocation
When indirect costs are discovered, those costs can be separated into cost pools.
A cost pool is a grouping of similar expenses. The grouping of these expenses into a
similar pool “permits better expense control by management and facilitates cost
analysis”, but there is no “one right way to group these expenses” (Fultz, 1980, p. 16).
Managers must pool indirect costs in a logical and consistent manner, but the
determination of number and complexity of cost pools is a management decision based
on needs. Some guidance to managers comes from Cost Accounting Standards and
standard cost distribution techniques which are detailed below.
The Cost Accounting Standards Board (CASB) was established to ensure fairness
in government procurement. It was also “tasked to issue rules, regulations, and standards
aimed at achieving uniformity and consistency in the cost accounting practices that were
followed by defense contractors and subcontractors” (Defense Systems, 1999, p. 7-1).
There are several rules which attempt to standardize the accumulation of costs. Cost
Accounting Standard (CAS) 401 directs “(1) classification of elements or functions of
costs as direct or indirect, (2) the indirect-cost pools to which each element or function of
cost is charged, and (3) the methods of allocating indirect costs to the contract” (Defense
Systems, 1999, p. 7-3). It is important that when distributing costs, an established or
agreed to method is used consistently. Managers can define the organization’s method of
cost distribution based on control systems, performance evaluations, or accounting
standards. Though, managers should make the cost distribution methods as accurate as
possible for financial accounting and profitability concerns. Both the Federal Acquisition
Regulations and the CAS “emphasize the need for consistent allocation of costs incurred”

10
when distributing direct and indirect costs (Oyer, 2005, p. 48). Although the CAS
discusses allocation, the goal in this report in developing a model is to trace as accurately
as possible indirect costs.
Standard cost distribution techniques help managers properly assign overhead
costs. Initially, overhead costs need to be grouped together or pooled. Each overhead
pool is distributed to a cost objective “in a reasonable proportion to the beneficial or
causal relationship of the pool(s) to cost objectives” (Oyer, 2005, p. 46). It is preferable
to assign costs based on a direct cause and effect relationship. For example, if a company
buys a corporate car for salesmen to use on trips, the costs associated with this car are
likely to be distributed to an overhead cost pool. The costs associated with the company
car are related to many of its products, not just one. Thus, the overhead costs associated
with this car would be distributed to various departments using some form of a cost
driver. A cost driver is a factor that causes overhead costs, in that they are activities that
directly influence the indirect cost as it relates to the direct cost. The cost driver should
be linked to the overhead cost as closely as possible. In the case of a company car, the
number of salespeople using cars could be a cost driver, but the company could instead
use a predetermined overhead rate. While the company car example may have an
identifiable cost driver, not all overhead costs are easily linked with specific cost
objectives. Therefore, it may be beneficial, based on efficiency, for the organization to
spread the overhead costs among various cost objectives. While it may be ideal to track
all indirect costs precisely, the cost of doing so may be greater than the benefit. “Ideally,
a cost allocation base reflects cause and effect relationships between resource spending
and use, but determining these cause and effect relationships could be difficult and
costly” (Hilton, Maher, & Selto, 2008, p. 379). Nevertheless, a predetermined overhead
rate is used that does not actually have a cause and effect relationship; the product costs
will be distorted.
finding a cost …base that approximates cause and effect relationships is justified if the benefits from improved decisions exceed the costs of finding and using the base…if an organization is able to accurately measure cause and effect relationships, it can precisely trace costs rather than approximately allocate them. If it cannot identify causal relationships between resource spending and use but still desired to

11
allocate costs, it must use a less accurate cost allocation base. The more closely the …base reflects a link between resource spending and use, the more useful …costs are likely to be for planning, decision making, and influencing behavior. (Hilton, Maher, & Selto, 2008, p. 379).
When overhead costs are pooled, these costs are spread among the various cost
objectives. The distribution of these costs is based on a rate. The basic formula for an
indirect or overhead cost rate is:
Rate = indirect cost pool expenses base
Activity Based Costing (ABC) uses cost drivers as bases. In ABC, the
organization identifies all the activities performed by the organization in the performance
of its work. Those activities are then classified as they relate to the products of that
company. The costs of those activities are estimated, and then a cost driver is calculated
for each activity. In the prior example, the activity of driving the company car could
have mileage as a cost driver. This cost driver has a rate associated with it, and becomes
a cost driver rate that the company can use for assigning costs to the various products. A
cost driver rate “is the estimated cost of resource consumption per unit of the cost driver
for each activity,” while a cost driver “is a characteristic of an activity or event that
causes that activity or event to cause costs” (Hilton, Maher, & Selto, 2008, p. 53).
Rather than track by activities, some organizations distribute service department
costs to production departments. Two alternate analytical methods include the step
method and the direct method. The direct method attributes the costs of support service
departments to internal customers without taking into account interactions among
support-service departments (Hilton, Maher, & Selto, 2008, p. 383). Using this method,
the costs of service departments are distributed within the organization, often based on
the percentage of service used or quantity of service required (as in square feet of floor
space occupied). All support services recoup their costs through the various production
departments. Yet, this direct method does not compute for service departments that
utilize other service departments. Alternatively, the step method of cost allocation
“recognizes that some support-service departments provide services to other support

12
services as well as to production departments” (Hilton, Maher, & Selto, 2008, p. 386).
The step method begins with the most significant service department and distributes its
cost among the other production and support departments. When that service department
has distributed all costs, then the next significant service department distributes its costs
among the various service and productions departments. When using the step method,
the service department does not attribute costs to itself. Also, if a service department’s
costs have already been distributed, they are not considered when distributing subordinate
service center costs. The direct method is simpler to use than the step method, but the
step method could provide a more accurate distribution of costs because it recognizes
some use of a service department by other service departments (Hilton, Maher, & Selto,
2008, p. 389).
A third method to distribute service department costs is available, but is not used
as much as direct and step. The reciprocal method of allocation recognizes and accounts
for all service department costs among other service departments, regardless of
significance. This method uses the following summation:
Total Dept. Costs = (Direct cost of Dept. + Service costs to be distributed to Dept.)
This creates “one equation for each department in which the unknown element is
the total department cost…this set of equations is then solved using matrix algebra”
(Hilton, Maher, & Selto, 2008, p. 394). It is helpful to utilize a spreadsheet where
utilization percentage, allocation costs, the inverse matrix, and derived cost allocation can
be displayed and explained when using this method.
The attempt to trace indirect and overhead costs is not an absolutely precise
process and is subject to political and economic concerns in the organization.
Consideration must be given to how much cost the chosen process uses and compare that
to the benefit the organization receives from that analysis. When a cost analyst designs a
cost accounting system, the analyst must balance the benefits of complex design with the
costs of a complex design. If the system is changed but the distribution of costs are
unaffected, then the benefits of an advanced system will be overcome by the costs of
maintaining that system (Hilton, Maher, & Selto, 2008, p. 392). Managers must also

13
include performance measurements and internal controls when developing the proper cost
distribution method. Experimentation with various methods of cost distribution could
yield important information to managers, but this experimentation must be balanced with
the cost of doing so.

14
THIS PAGE INTENTIONALLY LEFT BLANK

15
IV. BURDENED LABOR CALCULATED
A. MILITARY PAY AND COMPENSATION ESTIMATE (FRCMA)
1. Basic Pay and Allowances
When comparing labor costs, it is necessary to utilize pay grades that are
equivalent in expertise. This report utilizes the full journeyman level of expertise, which
equates to a Petty Officer 2nd Class (E-5) for military, Working Grade 10 (WG-10) for
government civilian, and a standard rate is applied for a contractor.1 Since both military
and civilian utilize pay levels within grade, the mid-level step or time in service is used.
Time in grade for military E-5 will be “greater than six years,” and pay level “(step) 3”
(Appendices A and D) will be used for WG-10.
Using 2012 military pay tables (Appendix A), the basic pay of an E-5 over six
years of service is $2,662.20 per month. Other pay includes housing allowance
($1,467.00 with dependents) and basic allowance for subsistence ($348.44). Total pay
equals $4,513.64 per month. To determine total available hours per month, multiply
4.33 weeks2 times standard hours per month (40).
4.33 weeks x 40 hours/week = 173.2 hours per month
Table 1 analyzes a method to determine an hourly wage from this basic salary:
1 Data collected from interviews at FRCMA Oceana.
2 If 365 (days) is divided by 7 days, the result is 52.14 weeks. The resulting math implies more weeks in a year than 52. When able, this report will utilize 4.33 weeks in month to compensate. This is a result of 52 weeks per year divided by 12 months per year. Result is 4.33 weeks per month (rounded).

16
Table 1. Basic Military Hourly Rate (From Appendix A)
4.33 weeks x 40 hours/week = 173.2 hours
$4,513.64 ÷ 173.2 hours = $26.06 per hour (rounded)
Medicare / Social Security = $0.9968 3
Total Hourly Rate = $27.06 (rounded)
2. Military (FRCMA) Burdened Labor Rate
Since it is often difficult to accumulate all costs associated with labor, some
businesses use a labor rate to predict total cost of the employee.
A major problem in many organizations is that actual costs, even at the total project level are not obtainable in a timely manner or properly segregated by project. In that case, it is necessary to set up a “feed forward” cost reporting system instead of a “feedback” cost system (which usually comes off the company’s general ledger). In this case resource utilization is tracked as well as percent complete, and the predicted cost is the resources utilized times the estimated resource rate. For labor, the hours worked is tracked each reporting period as well as the percent complete for each work packet. The hours worked are then multiplied by a “burdened” labor rate either as an overall man rate for the project or a rate for each skill level. (Brandon, 1998, p. 19)
The total cost of an employee is difficult to predict. Organizations can use
historical data to estimate the full cost or can estimate a burdened labor rate. A useful
exercise is to accumulate data on expenses and translate those expenses to cost per hour
for an employee. Using an E-5 military member (using cost data from Section IV-A
above), costs can be estimated and translated into cost per hour. The cost per hour must
not just include their basic pay rate, but must also include those hours that are non-
productive or non-billable. Some employees are paid even when their work or time is not
producing income for the organization. This non-income producing time must be
3 7.65% total rate; government portion 3.825%.

17
accounted for. If the cost of that time is not known, then the organization will not know
to charge for that time in the rates to customers. Examples of non-income producing time
would be vacations, office meetings, mandatory education time, and sick leave.
In calculating costs, the organization should collect the expenses specific to each
employee. A basic wage model is built on this information, and can be utilized to track
or improve the model in the future. Using data collected from interviews at FRCMA
Oceana and Norfolk, and information from the Office of Management and Budget, the
model below was constructed to calculate a burdened rate for a military employee which
captures non-billable and other annual costs.
The model is organized into three sections: unbillable hours, other annual
expenses, and calculation of burden rate. The first section captures the un-billable or
non-productive hours in which the employee is paid. The number of office meetings per
year is calculated using an interviewee data rate of 1.5 hours per week spent by military
personnel in mandatory meetings. To determine hours per year, the number of weeks in
the year was multiplied by the number of hours per week. The number of weeks was
determined by subtracting the total holiday/vacation days from 365 days per year and
dividing by seven.4 Since this rate of 1.5 hours per week is an estimate, different
estimates can cause the model to change. The hours spent in mandatory education was
also an interviewee estimate, and is set at a rate of one hour per week in organizational
and U.S. Navy related educational periods.5 Estimated hourly physical training and other
military related activity of one hour per week was based on interviewee estimates, and
this rate can also vary among organizations.6 Collecting actual data for each organization
can produce a more refined model, but benefits of tracking this data must be balanced
with the costs of doing so. From this accumulated data, non-billable (lost time) total
hours and cost can be determined. These non-billable hours are important because they
represent resource utilization. The non-billable hours must be subtracted from the total
4 1.5 hours per week x46.43 weeks; 46.43 weeks determined by 365 days – 40 days (total leave and
holiday) = 325, 325/7=46.43.
5 Hours of education estimated at 1 hour per week x 46.43 weeks = 46 (rounded).
6 Estimated other paid hours include physical training and other military related activities outside of production work; 1 hour per week x 46.43 weeks (rounded).

18
hours paid in a year. By subtracting the non-billable hours from the total hours paid in a
year, the organization can determine a cost per hour to charge the customer to cover all
the expenses related to the employee.
The second section of Table 3 captures other annual expenses which relate to the
employee. The two primary annual expenses used in this model are medical/insurance
and retirement expenses. There could be additional annual expenses for each employee
that could change the model (e.g., cost of living adjustments, bonuses, special pay). This
project includes medical and retirement as the most significant. From the Office of
Management and Budget (OMB), the total accrual of TRICARE medical payments is
$4,459,000,000. Dividing by the total number of Navy personnel (325,700), each
member represents a $13,690 expense to the government.7 OMB data also provides the
budgeted accrual of $4,204,000,000 in retirement benefits, which equates to $12,907.58
per employee.8 This is an average cost per employee, and does not represent a pay grade
specific retirement accrual.
The third section of the model represents a burdened rate for the employee. The
non-billable and other annual expenses are totaled and divided by the total available
billable hours. This cost per hour represents non-billable and annual expenses which,
when added to the basic hourly rate, represents a burdened rate for the employee. Table 2
summarizes the data, and provides a model for estimating the burdened rate for a military
employee.
7 Estimated from Office of Management and Budget Data. Use Tricare total and divide by number of
military personnel. Using 2012 OMB data, Total Tricare Accrual is $4,459,000,000 / 325,700 Navy Personnel = $13,690. Source location: www.whitehouse.gov/sites/default/files/omb/budget/fy2013/assets/mil.pdf. “Department of Defense – Military Programs.”
8 Data taken from same OMB Budget Data. Total Accrued Retirement Benefits $4,204,000,000 divided by 325,700 personnel. www.whitehouse.gov/sites/default/files/omb/budget/fy2013/assets/mil.pdf.

19
Table 2. Military Burdened Labor Rate (From 8–9)
Non-billable Paid Hours: Days: Hrs Cost/Year
Paid Holidays 10 80 $2,164.80
Paid Vacation 30 240 $6,494.40
Office Meeting (Hours/year) 70 $1,894.20
Hours to Attend Education 46 $1,244.76
Other Paid Hours 46 $1,244.76
Total Non-Billable Paid Hours / Expense 482 $13,042.92
Hours Paid in a Year (52 weeks x 40 hrs/week) 2080
- 482 (unbillable)
1598 (billable)
Other Annual Expenses
Medical Benefits / Insurance $13,690.00
Retirement Accrual $12,907.58
Total Other Annual Expenses $26,597.58
Total Burdened Rate for E-5 (greater than 6 years)
Total Non-Billable Expense $13,042.92
Total Other Annual Expenses $26,597.58
Subtotal $39,640.50
Billable Hour Rate (divide by 1598) $24.81
Total Burdened Rate ($27.06 Basic Pay + $24.81) $51.87 (rounded)
Burden Rate Percentage ($51.87/$27.06) 1.91 or 191%

20
B. CIVILIAN PAY AND COMPENSATION ESTIMATE (FRCMA)
1. Basic Pay and Allowances
FRC utilizes a Working Grade (WG) civilian labor scale. Using the WG pay
scale (Appendix B) the base pay of a WG-10 (step 3) is $22.78 per hour. FRC Mid-
Atlantic (FRCMA) Oceana and Norfolk fall under a different pay scale for select WG
billets (see Appendix D). At the WG-10 level, the majority of the billets would fall under
this special pay scale; therefore, this rate is used for analysis in this report. The special
pay rate for a WG-10 (step 3) at FRCMA is $30.74 per hour ($7.96 per hour above
standard rate for the Norfolk-Portsmouth-Newport News-Hampton, Virginia area as
shown in Appendix B). Based on information from FRCMA, the expertise of an E-5 is
approximately equal to a WG-10. Based on information provided by FRCMA staff, the
majority of the contractors fill positions that could be filled by individuals who are at the
pay level of E-5 or WG-10. Table 3 presents civilian hourly rates adjusted for locality
(from Appendix D). The overtime rate is a standard 150 percent increase from base
hourly rate. The holiday rate is a 200 percent increase based on information from the
civilian collective bargaining agreement.9
Table 3. Civilian Base Hourly Rate (From Appendix D)
Base Hourly Rate $30.74
Overtime Hourly Rate (1.5 or 150%) $46.11
Overtime Holiday Rate $61.48
FRCMA utilizes a budgeted civilian rate of $44.14 per civilian hour. This rate
includes labor and non-labor expenses, and includes contractor hours. The rate drops to
$38.46 when non-labor expenses and contractor hours are removed. Since the military
base salary model does not include non-labor in the base hourly rate (e.g., bonuses,
9 From “Collective Bargaining Agreement Between the Naval Air Depot Jacksonville Detachment
Oceana and the International Association of Machinists and Aerospace Workers Local 97” dated 16 April 2004; Article 10, Section 5.

21
special pay, incentive pay), removing non-labor from the civilian rate makes it
comparable to the military rate. Still, this hourly rate is a $7.72 or 25 percent difference
from the rate in Table 4. It was determined from analysis of FRCMA financial
information that the $38.46 rate included budgeted overtime (which is $46.11 per hour),
This would subsequently increase the average hourly rate. The $38.46 is an average cost
using historical base salary and overtime rates for various WG employees. In contrast,
the base rate of $30.74 recognizes no overtime or non-labor expenses. The military base
rate included no overtime or non-labor; therefore, to maintain consistency in analysis, this
report’s labor model utilizes the base rate, as detailed in Appendix D and the above table.
It is important to understand, though, that civilian rates do increase with overtime, and
this overtime expense increases the actual per hour rate expense of civilian employees.
Such overtime expenses should be controlled, as they do not represent a true base hourly
rate. Controlling overtime for civilians will drive the budgeted rate towards the base
hourly rate as detailed in Appendix 4.
2. Civilian (FRCMA) Burdened Labor Rate
Using a similar labor model provided in Section IV-A (Military Burdened Rate),
the below table details expenses associated with a civilian employee. Differences
between the two models include vacation/sick leave and workers’ compensation
categories. The interviewee data suggested civilians attend office meetings, education
periods, and other paid hours in non-productive work at half the military rate. Further
research into these categories could refine the model, as they would present a more
accurate number of non-billable hours. Actually tracking these hours could potentially
change the model’s calculated rates. Again, benefits of tracking this data would need to
be balanced against the costs of doing so. The retirement, life/health insurance, and
workers’ compensation calculations utilized Office of Management and Budget Circular
A-76 percentages to determine rates. As stated in the military section, this rate would not
apply to all civilian employees due to varying wage grades. For consistency, the WG-10
base rate is utilized for these calculations. Table 4 summarizes this data and presents a
burdened rate for civilian employees.

22
Table 4. Civilian Burdened Labor Rate (From 11–14)
Non-billable Paid Hours: Days Hrs Cost/Year
Paid Holidays 10 80 $2,459.20
Paid Vacation 21 168 $5,164.32 10
Paid Sick Leave 13 104 $3,196.96 11
Office Meeting (Hours/year) 35 $1,075.90 12
Hours to Attend Education 23 $707.02
Other Paid Hours 23 $707.02
Total Non-billable Paid Hours / Expense 433 $13,310.42
Hours Paid in a Year (52 weeks x 40 hours per week) 2080
-433 Un-billable
1647 Billable
Other Annual Expenses
Retirement, Life/Health Insurance (32% of 2080× $30.74) $20,460.54 13
Workers’ Compensation (2% of 2080 × $30.74) $1,278.78
Total Other Annual Expenses $21,739.32
Total Burdened Rate for WG-10 (step 3)
Total Non-Billable Hour Expense $13,310.42
Total Other Annual Expenses $21,739.32
Subtotal $35,049.74
Billable Hour Rate (divide by 1647) $21.28
Total Burdened Rate ($30.74 + $21.28) $52.02
Burden Rate Percentage ($52.02 ÷ $30.74) 1.69 or 169%
10 Computed using 6.5 hours per paid period (26 periods) = 21 days.
11 Computed using 4 hours per paid period (26 periods) = 13 days.
12 Using interview information from FRCMA Norfolk, on average, civilian non-production unbillable hours are approximately half that of their military counterparts.
13 Rate from OMB Circular A-76, “A-76 Studies.”

23
A burdened rate of 1.69 is higher than the FRCSE/FRCMA acceleration rate of
53.75 percent or 1.5375. This signals that the rates used above are different than
internal calculations within the Working Capital Fund system. A 2000 report written
by Professor Daniel Nussbaum stated that the costs of civilian labor were between
150–250 percent of base salaries. His estimated burden rate is approximately
1.94 percent. His estimated civilian labor costs were approximately 262 percent using
market and professional rates.14 The model in Table 5 accumulates basic expenses that
do not include other expenses such as overhead and depreciation that would subsequently
drive the burden rate higher than 1.69. Given the model in Table 5 and the 2000 report,
the burdened rate of 1.5375 used by FRCMA is not based on the basic wage rate of
$30.74 (as this model is).
C. CONTRACTOR PAY AND COMPENSATION (FRCMA)
FRCMA utilizes a standard rate of $40.00 per hour for contractor labor. There is
no difference between standard, overtime, or holiday rate. Contract labor expertise is
generally at the full journeyman level, and that expertise equates to a WG-10 (E-5) per
FRCMA estimation. This flat rate per hour wage rate is all inclusive and contains all of
the costs discussed in this report: base pay and allowances, burdened rate, and indirect
costs incurred by the contract company. The rate also includes one other type of cost not
previously mentioned, the profit to the contractor’s organization. This rate can be
utilized for analysis as long as the contract for this price is valid.
14 From Dr. Daniel Nussbaum in an unpublished 2000 report titled, Economics of Consulting Firm
Support Vs. In-House Government Support. Dr. Nussbaum is professor at the Department of Operations Reserach at the Naval Postgraduate School in Monterey, California (Nussbaum, 2000).

24
THIS PAGE INTENTIONALLY LEFT BLANK

25
V. INDIRECT AND DIRECT COST COMPARISON
A. METHODS OF DISTRIBUTING COSTS AT FRC
Cost pooling has been established by FRC Southeast (FRCSE), and has been
formalized in FRC Southeast Instruction 7310.1. The production process within FRCMA
incurs expenses as the employees work on aircraft and aircraft systems. These expenses
are incurred through job order numbers (JONS) assigned to the aviation projects. When
any charges or expense cannot be attributed to a direct project, it is determined to be an
indirect cost. These costs are accumulated in overhead expense accounts, and those costs
are given a cost class code. Currently, there are approximately 167 cost class codes.
Defined by FRCSE instruction, there are two main types of indirect costs: production
expense and general expense. The two types of cost centers used to collect these indirect
costs are production and General and Administrative (G&A) (FRC Southeast, 2011).
As the cost centers incur indirect costs, these costs are accumulated and coded.
The three cost centers at FRCMA are Cost Centers 53, 54, and 55. Various shops within
those cost centers generate indirect costs in production and servicing. Those indirect
costs are coded and show up in one of the three cost centers. The majority of facility costs
fall under Cost Center 54, while the majority of the administrative staff costs fall under
Cost Center 55. This form of pooling costs is direct in nature. Job orders incur indirect
costs to the three cost centers. These costs are directly applied to the cost center.
The driver used by FRCMA in formulating overhead rates is accumulated direct
labor hours. FRCMA Oceana combines civilian and contractor hours to formulate an
indirect rate, and FRCMA also incurs other indirect costs from outside of the
organization. FRCSE (Jacksonville, FL) transfers general and administrative (G&A)
costs to FRCMA. This transfer from FRCSE increases the indirect rate for FRCMA.
FRCMA charges customers a rate of $31.63 of overhead per civilian labor hour; though,
this is not a base civilian rate. This rate includes the transfer fee, non-labor and material
charges, and contractor hours (which spread the overhead costs over more hours). When
analyzed without these charges and hours, a different rate is generated. Since this report

26
attempts to separate costs and distribute them appropriately to each category of
employee, the overhead analysis in Section V-B-2 (Administrative Overhead) will use the
rate of $24.15 since this rate removes contractors and transfer fees. The below charges
used by FRCMA demonstrate the various overhead rates and the transfer of costs:15
Indirect civilian overhead rate, labor only, with contractor hours included.………………………………….$19.08
Indirect civilian overhead rate, labor only, without contractor hours……………………………………..$24.15
Indirect overhead rate, without contractor hours, with FRCSE transfer charge………………………………..…..$26.14
Indirect overhead rate, charged to customer with labor, material, contractor hours, travel, and other costs……………………………......……...$31.63
The labor rate, when analyzed separately, shows $1.99 in transfer costs. This
represents an 8.24 percent increase in the indirect rate. As stated above, contractor hours,
when included, increase the number of direct labor hours (DLH). This increase in the
number of total DLH’s decreases the civilian overhead rate per DLH by $5.07. This
represents a 21 percent decrease in overhead rate per hour.
When transfer costs, contractor hours, and non-labor costs are included, this rate
increases to $31.63. This represents the cost of total overhead charged to the customer.
When compared to the indirect overhead rate for civilians only as shown above, this is a
$7.48 increase (31 percent). When compared to the rate based on total civilian and
contractor hours (before transfer), this is a $12.55 increase (66 percent).
15 Data collected from FRCMA using cost divided by direct labor hours. Total labor cost (civilian) is
$5,996,250. Direct labor hours 248,300 (includes regular hours and overtime). Contractor hours 65,900.
27
B. COMPARISON OF OTHER COSTS
1. Overtime
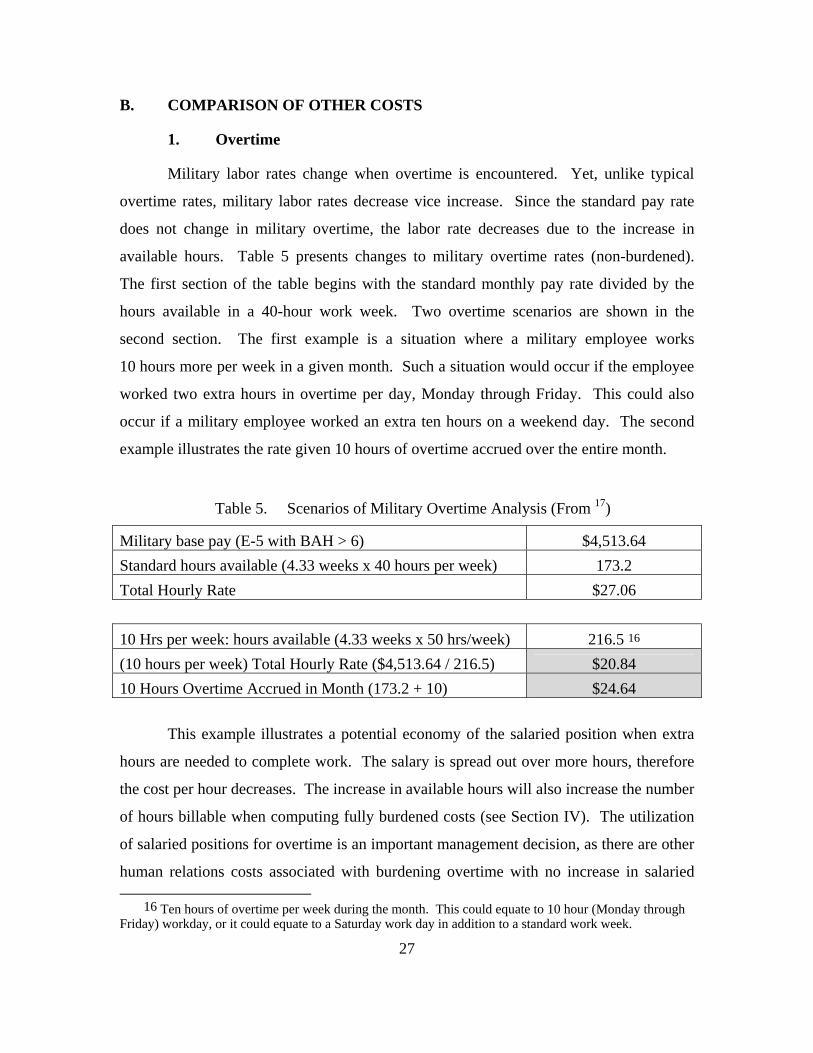
Military labor rates change when overtime is encountered. Yet, unlike typical
overtime rates, military labor rates decrease vice increase. Since the standard pay rate
does not change in military overtime, the labor rate decreases due to the increase in
available hours. Table 5 presents changes to military overtime rates (non-burdened).
The first section of the table begins with the standard monthly pay rate divided by the
hours available in a 40-hour work week. Two overtime scenarios are shown in the
second section. The first example is a situation where a military employee works
10 hours more per week in a given month. Such a situation would occur if the employee
worked two extra hours in overtime per day, Monday through Friday. This could also
occur if a military employee worked an extra ten hours on a weekend day. The second
example illustrates the rate given 10 hours of overtime accrued over the entire month.
Table 5. Scenarios of Military Overtime Analysis (From 17)
Military base pay (E-5 with BAH > 6) $4,513.64
Standard hours available (4.33 weeks x 40 hours per week) 173.2
Total Hourly Rate $27.06
10 Hrs per week: hours available (4.33 weeks x 50 hrs/week) 216.5 16
(10 hours per week) Total Hourly Rate ($4,513.64 / 216.5) $20.84
10 Hours Overtime Accrued in Month (173.2 + 10) $24.64
This example illustrates a potential economy of the salaried position when extra
hours are needed to complete work. The salary is spread out over more hours, therefore
the cost per hour decreases. The increase in available hours will also increase the number
of hours billable when computing fully burdened costs (see Section IV). The utilization
of salaried positions for overtime is an important management decision, as there are other
human relations costs associated with burdening overtime with no increase in salaried
16 Ten hours of overtime per week during the month. This could equate to 10 hour (Monday through Friday) workday, or it could equate to a Saturday work day in addition to a standard work week.

28
compensation. Conversely, salaried positions become less efficient when underutilized.
The cost per hour for military increases as the number of hours available (utilized)
decreases.
Contractor rates do not change with overtime at FRCMA. The standard rate of
$40.00 per hour is utilized regardless of time utilized. Civilian rates increase when
overtime is encountered. Civilian rate for overtime increases from $30.74 to $46.11
(a 150 percent increase), and increases to $61.48 (200 percent increase) per hour for
working on a holiday.
2. Overhead
The computed burdened costs of each type of employee in Section IV do not
include overhead. The number and types of employees vary among the FRCMA
organizations. To illustrate, FRCMA Oceana (Level 3) has no military employees, while
FRCMA Norfolk has 762. Similarly, while all employees at Oceana are either civilian or
contractor, there are only 12 civilians at the Norfolk location. As the following overhead
analysis shows, each type of employee incurs a different overhead rate. Thus, each
FRCMA unit will have a different overhead rate based on the employee makeup of the
unit. For this analysis, FRCMA Norfolk will be utilized to estimate overhead rates for
military since it is primarily staffed by military employees. Additionally, headquarter
costs, information technology support, and other G&A overhead expenses exist in the
Navy that could be distributed to FRCMA Norfolk. These expenses could change the
labor rate model in this report, but are beyond the scope of this project.
The Administrative, Quality Assurance, and Supply departments provide indirect
support to the production departments. These indirect services support many products,
and cannot be traced to one specific product.
Establishing separate indirect cost pools improves visibility of difficult to control costs and facilitates the monitoring of similar types of expenses…Indirect cost pools are categorized as overhead, service center, or general and administrative (G&A) expense pools. The primary distinction between overhead and G&A cost pools is that overhead costs

29
only benefit a part of the business segment…while G&A expense pool benefits the entire organization. (Defense Systems Management College, 1999, pp. 3–1)
This analysis estimates a cost of overhead using the monthly pay (cost to
government) of personnel within each support department. There are 29 total employees
in Administration, 24 employees in Supply, and 22 employees in Quality Assurance.
Using FRCMA Norfolk information on average pay grade, Table 6 estimates overhead
costs. This cost is then used in Table 7 and 8 to further burden military and civilian labor
rates.
Table 6. Military Component Service Departments-Norfolk (From 18–19)
Department Total Employees Cost Emp./Year Total Costs/Yr
Quality Assurance17
22 $98,829.02 18
$2,174,238.44
Supply 24 $93,804.18 $2,251,300.32
Administration 29 $93,804.18 $2,720,321.22
$7,145,859.98
17 Number and Average within Supply and Administration is E-5 pay grade described by FRCMA
Norfolk and Appendix 1. Quality Assurance average pay grade is E-6 as described by FRCMA Norfolk.
18 This represents a burdened labor rate as derived in Section IV. $4,513.64 per month x 12 months=$54,163.68; add un-billable and other annual expenses of $39,640.50; for E-6 in Quality Assurance, this burdened rate is approximately $40,608.14 due to higher base salary of $2,886.30 and BAH of $1,617.00 ($29.08 per hour).

30
Table 7. Military Overhead Analysis (From 20–23)
Yearly Overhead Charge $7,145,859.98 Overhead Charge per Employee ($7,145,859.98 ÷ 68719) $10,401.54
Overhead Analysis: Military Other Expenses20 Medical Benefits / Insurance $13,690.00 21 Retirement Accrual $12,907.58 22 Military Overhead $10,401.54 Total Other Annual Expenses $36,999.12 Overhead Analysis: Military Burdened Rate Total Non-Billable Expense $13,042.92 Total Other Annual Expenses $36,999.12 Subtotal $50,042.04 Billable Hours (divide by 1598) $31.32 Total Burdened Rate ($27.06+ $31.32) $58.38 (rounded) Burden Rate Percentage ($58.38 ÷ $27.06) 2.16 or 216%
As stated in Section V-A, there are four civilian overhead rates. These rates
represent different added overhead expenses and base hours. In general, overhead can
include manufacturing costs, engineering costs, product costs, material costs, and service
center costs. Properly pooling these costs and properly distributing these costs provides
for a more accurate labor rate. This report does not include all these costs due to scope,
but the costs are relevant. If the above overhead were distributed to the types of
employees, this will affect the labor model results of this report. For a beginning analysis
of civilian overhead, this report utilizes the $24.15 overhead rate. Such costs were not
analyzed in the military overhead section and, therefore, are not included here. This
19 Allocation of service using direct method: 762 (total employees) – 75 (total support personnel) =
687.
20 From Military Pay section of this report.
21 Estimated from Office of Management and Budget Data. Using Military Total Pay w/ Tricare Accrual amount, subtract Military Pay and result is Tricare accrual per year. Use Tricare total and divide by number of military personnel. Using 2012 OMB data, Total Tricare Accrual is $4,459,000,000 / 325,700 Navy Personnel = $13,690. Source location: www.whitehouse.gov/sites/default/files/omb/budget/fy2013/assets/mil.pdf. “Department of Defense – Military Programs.”
22 Data taken from same OMB Budget Data. Total Accrued Retirement Benefits $4,204,000,000 divided by 325,700 personnel.

31
report accepts this as a base civilian rate, since it does not include any transfer costs from
FRCSE nor does it include contractor hours. The other rates in Section V-A include
contractor hours, material, transfer, contractual, and other costs. Future analysis can
refine rates to ensure only civilian incurred overhead are included in the model.
Table 8. Civilian Overhead Analysis (From 24–25)
Overhead Analysis: Civilian Other Annual Expenses 23
Retirement, Life/Health Insurance (32% of 2080 × $30.74) $20,460.54 24
Workers’ Compensation (2% of 2080 × $30.74) $1,278.78
Total Other Annual Expenses $21,739.32
Overhead Analysis: Civilian Burdened Rate
Total Non-Billable Expenses $13,310.42
Total Other Annual Expenses $21,739.32
Subtotal $35,049.74
Billable Hour Rate (divide by 1647) $21.28
Overhead Rate Charge $24.15
Total $45.43
Total Burdened Rate ($30.74 + $45.43) $76.17 (rounded)
Burden Rate Percentage ($76.17 ÷ $30.74) 2.48 or 248%
There is another charge that is WCF specific. The Commanding Officer and
Production Officer are military billets that are supported by the WCF. “While the
positions in the Working Capital Funds can be manned by civilian personnel, the military
departments assign military personnel to the working capital fund activities to maintain
revolving fund expertise in the military ranks” (American Society of Military
Comptrollers, 2011, p. 2.1.67). These two billets reside at FRCMA Oceana, but support
23 From Civilian Pay section of this report.
24 Rate from OMB Circular A-76, “A-76 Studies.”

32
the activities at FRCMA Norfolk. This support is general and administrative in nature,
and therefore could be added to the overhead charge for civilian employees. Using the
equivalency rates in Appendix C, an additional charge for a GS-14 and GS-15 25 could be
included. Though, the rates for civilian employees vary according to location. The
differences between standard and locality rates vary almost $20,000 between the two pay
grades. These positions support FRCMA but are necessary across the FRC/WCF
construct. Two additional aspects of research required to refine this report’s model are
determining the actual reimbursed amount, and how the G&A costs of the military
positions are distributed.
Overhead charges for contractors are a challenge. Contract employees incur
overhead within their own company, but the ability to control that overhead by the
government is limited. Regardless, the negotiated flat rate for contracted work represents
the direct and indirect costs of the contractor. Based on interviewee data from FRCMA
Norfolk, the Norfolk Administrative department support for contractors is limited. Even
so, at FRCMA Norfolk, the Quality Assurance and Supply departments do provide
services in production which would include contractor production; therefore, the costs of
those departments are distributed to contractor overhead. The contract support billet is a
collateral duty at FRCMA Norfolk, however, there are likely to be overhead expenses in
contract support elsewhere. Contract support and administration varies among contracts,
but the expenses incurred through this administration could be significant. This report
does not include costs or expenses from this administration, yet it is recommended that
such research is conducted to refine the labor model. The model used for civilians and
military employees utilized billable and non-billable hours. Unlike the military and
civilian analysis above, this research was unable to separate contractor hours into billable
and non-billable hours due to the flat rate feature of the contract. Therefore, the model
for contractors uses direct labor hours to compute overhead rates when comparing
25 O-6 equivalent to GS-15 and O-5 equivalent to GS-14. Using OMB data, GS-15 step 5 Virginia locality is $131,509, while the standard rate is $103,707. GS-14 step 5 Virginia locality is $111,798, while the standard rate is $88,165.

33
contractors with other employees. Using contractor direct labor hour information from
FRCMA Norfolk as a driver, the Table 9 distributes Quality Assurance and Supply
department non-production labor costs to burden contract per hour labor.
Table 9. Contractor Overhead Analysis (From 27)
Total Direct Labor Hours 314,200 26
Total Direct Labor Hours without Contractors 248,300
Contractor Direct Labor Hours (314,200 - 248,300) 65,900
Quality Assurance Overhead Yearly Total $2,174,238.44
Supply Overhead Yearly Total $2,251,30032
Annual Overhead Total without Administration $4,425,538.76
Contractor portion of overhead (65,900 ÷ 314,200hrs) 20.974%
Contractor overhead (20.974% × $4,425,538.76) $928,212.50
Contractor per hour overhead charge ($928,212.50 ÷ 65,900) $14.09 (rounded)
Contractor per hour rate $40.00
Contractor per hour rate with overhead rate applied $54.09
3. Depreciation
Employees within an organization enjoy the necessary objects to conduct their
work. These necessary objects include the tools to complete production (products) and
the building/land to conduct the work. The buildings and tools utilized by FRCMA are
property, plant and equipment (PP&E). FRCMA utilizes PP&E to collect revenue from
customers in aircraft maintenance. Since FRCMA uses these assets to “earn revenue, the
matching principle requires that the company match the expense of the assets’ use against
the revenue” (Nikolai, Bazley, & Jones, 2010). When determining how much to charge
customers, FRCMA must account for the expenses of PP&E in the form of a depreciation
26 Direct labor hour data received from FRCMA Oceana.

34
expense. The expense of utilizing the building spaces and equipment to generate revenue
must be appreciated, and helps in the analysis of labor costs (i.e., the proper price to
charge customers to recoup PP&E expenses).
To determine depreciation, FRCMA should consider the asset(s) costs, service
life, and residual value at the end of its service life. For the purpose of this report, the
depreciable assets analyzed are the facilities that support FRCMA Norfolk. When pooled,
these facilities represent an asset value to be depreciated. The asset value used in this
report came from Appendix E. No equipment inventory was taken and valued at
FRCMA Norfolk. A complete PP&E valuation for depreciation calculations is
recommended to refine this report’s labor model. Using information from FRCMA
Oceana, the building’s original cost would be depreciated over its useful life of
67 years.27 The residual value of FRCMA Norfolk would be the “expected value of the
asset at the end of its service life minus the costs of disposal, such as dismantling,
removing, and selling the asset” (Nikolai, Bazley, & Jones, 2010). It is reasonable to
assume the Department of the Navy does not plan to sell the building, and that the
building will be utilized until it has been exhausted physically and is functionally
obsolete. “In practice, because residual value is difficult to estimate, it often is ignored in
computing the depreciation amount” and is ignored in this report (Nikolai, Bazley, &
Jones, 2010).
The facilities utilized at FRCMA Norfolk are listed in Appendix E and total
$13,274,800.28 Using straight line depreciation, the annual depreciation would be
$198,131 .29 Table 10 illustrates:
27 Per information obtained from FRCMA; building estimated useful life, not including nor assuming
capital improvement programs which extend its useful life.
28 Summed total from facilities listed in Appendix 5.
29 $13,274,800 divided by useful life of 67 years, rounded, assuming no residual value (Nikolai, Bazley, & Jones, 2010).

35
Table 10. Straight Line Depreciation (From 28–30)
Year 2006
Amount $13,274,800
Fraction $Amt. ÷ 67 yrs.
Year Dep. $198,131
Value $13,076,668
2007 $13,274,800 $Amt. ÷ 67 yrs. $198,131 $12,878,537
2008 $13,274,800 $Amt. ÷ 67 yrs. $198,131 $12,680,405
2009 $13,274,800 $Amt. ÷ 67 yrs. $198,131 $12,482,274
Accelerated methods of depreciation are also possible, but since the benefits of
the asset (facilities) are not expected to decrease in each year of use, this report uses the
straight line depreciation method. If FRCMA Norfolk believes that the facilities’ benefits
decline with their use rather than time, an activity method of depreciation could be used.
However, this report does not assume that straight line depreciation of equipment is
reasonable. Equipment and tools are affected by their use, and therefore it would be
reasonable to utilize an activity method of depreciation. A full inventory and valuation of
all PP&E could facilitate a more refined depreciation expense to be used in the labor
model. “A company should use an activity method when the service life of the asset is
affected primarily by the amount the asset is used and not by the passage of time”
(Nikolai, Bazley, & Jones, 2010). The cost, residual value, and total activity level would
be used in calculating the depreciation rate. The total hours estimated to be worked per
year multiplied times the service life would yield the total activity level.
Depreciation Rate = Cost – Residual Value Total Lifetime Activity Level 30
Table 11 utilizes the straight line depreciation method for depreciation expenses
only relating to the facilities in Appendix E. An expense of $198,131 is distributed to
military and civilian employees. The number of personnel used for distribution is 687.
This represents the total number of employees at FRCMA Norfolk minus the service
department personnel.31
30 From “Intermediate Accounting” by Nikolai, Bazley, and Jones (2010): Mason, Ohio, South-
Western Cengage Learning (p. 519).
31 Total military employees (750) minus service and administrative personnel (75) and then adding civilian personnel (12).

36
Table 11. Military and Civilian Depreciation Analysis (From 33–37)
Annual Depreciation $198,131
Depreciation per employee ($198,131 ÷ 687) $288.40
Depreciation Analysis: Military Other Annual Expenses 32
Medical Benefits / Insurance $13,690.00 33
Retirement Accrual $12,907.58 34
Depreciation $288.40
Total Other Annual Expenses $26,885.98
Depreciation Analysis: Military Total Burdened Rate
Total Non-Billable Expense $13,042.92
Total Other Annual Expenses $26,885.98
Subtotal $39,928.90
Billable Hours Rate (divide by 1598) $24.99
Total Military Burdened Rate ($27.06 + $24.99) $52.04
Burden Rate Percentage ($52.05 ÷ $27.06) 1.92 or 192%
Depreciation Analysis: Civilian Other Annual Expenses 35
Retirement, Life/Health Insurance (32% of 2080 × $30.74) $20,460.54 36
Workers’ Compensation (2% of 2080 × $30.74) $1,278.78
Depreciation $288.40
Total Other Annual Expenses $22,027.72
Depreciation Analysis: Total Civilian Burdened Rate
32 From Military Pay section of this report.
33 Estimated from Office of Management and Budget Data. Using Military Total Pay w/ Tricare Accrual amount, subtract Military Pay and result is Tricare accrual per year. Use Tricare total and divide by number of military personnel. Using 2012 OMB data, Total Tricare Accrual is $4,459,000,000 ÷ 325,700 Navy Personnel = $13,690. Source location: www.whitehouse.gov/sites/default/files/omb/budget/fy2013/assets/mil.pdf. “Department of Defense – Military Programs.”
34 Data taken from same OMB Budget Data. Total Accrued Retirement Benefits $4,204,000,000 divided by 325,700 personnel.
35 From Civilian Pay section of this report.
36 Rate from OMB Circular A-76, “A-76 Studies.”

37
Total Non-Billable Expense $13,310.42
Total Other Annual Expenses $22,027.72
Subtotal $35,338.14
Billable Hour Rate (divide by 1647) $21.46
Total Civilian Burdened Rate ($30.74 + $21.46) $52.20
Burden Rate Percentage ($52.20 ÷ $30.74) 1.70 or 170%
As with overhead, contractors present a unique challenge to this report when
analyzing depreciation. The overhead computed in Section V used a different method in
the contractor labor rate. Similar to overhead, the contractors utilize the facilities at
FRCMA Norfolk in production. Therefore, depreciation can be applied to the labor rate
for contractors. To analyze contractor depreciation, the direct labor hour allocation
method can be used. Unlike military and civilian, this report was unable to separate
contractor hours into billable and non-billable as described above due to the flat rate
feature of contractor hours. Therefore, the use of direct labor hours for the model is used
to compare depreciation rates when comparing contractors with other employees. Using
contractor direct labor hours as a driver, Table 12 burdens contractor labor with
depreciation.
Table 12. Contractor Depreciation Analysis (From 38)
Total Direct Labor Hours 314,200 37
Total Direct Labor Hours without Contractors 248,300
Contractor Direct Labor Hours (314,200 - 248,300) 65,900
Contractor portion of depreciation (65,900 ÷ 314,200hrs) 20.974%
Contractor depreciation (20.974% × $198,131) $41,555.99
Contractor per hour depreciation charge ($41,555.99 ÷ 65,900) $0.63
Contractor per hour rate $40.00
Contractor per hour rate with depreciation $40.63
37 Direct labor hour data received from FRCMA Oceana.

38
THIS PAGE INTENTIONALLY LEFT BLANK

39
VI. METHODOLOGY
A. LIMITS OF RESEARCH
Most financial and managerial accounting occurs at the Oceana and FRCSE
locations. Data was aggregated primarily from Oceana with some indirect data obtained
from FRCSE. A site visit was conducted at FRCMA Oceana, but no site visit was done
at FRCSE Jacksonville. Data was collected from the primary financial and accounting
staff at Oceana. No direct access to financial and accounting systems at Oceana or
Jacksonville was used nor deemed necessary for this report.
B. MODEL PARAMETERS
For this study, the cost objective is the employee rather than a product. Direct
labor is included using the basic salary of each category of employee. Other direct costs
include some allowances and subsidies. The major components of direct costs analyzed
are salary and allowances for each type of employee, and these direct costs are identified
and categorized as such in Section IV. Allowances used in military computations are
Basic Allowance for Housing (BAH) and Basic Allowance for Subsistence (BAS). This
report does not identify special, incentive, or bonus pay for military employees due to the
scope of this report. However, such pay could be substantial depending on the makeup of
the organization. The use of BAH for military employees necessitates a similar civilian
comparison; therefore, this report utilizes locality adjusted civilian wage rates (Appendix
D). The inclusion of civilian bonuses and incentive pay was not included due to scope,
but could be substantial depending on the makeup of the organization. Contractor
allowances are not included since those allowances are not readily identifiable in the
available data. Allowances and subsidies are paid by the contractor’s civilian employer,
and are assumed to be part of the contract price per hour labor cost of the contractor. The
government, though, pays for part of the contractors’ allowances and subsidies as part of
the flat rate charged by the contractor. Furthermore, this report did not investigate the
costs associated maintaining the contracts, office space, equipment usage, or other
various costs associated specifically with contract support in the Working Capital Fund.

40
These costs could be substantial and could affect the breakdown of costs within the labor
model. Of note, FRCMA considers all the contractor labor cost per hour (which would
include indirect costs) to be direct in nature.
This report conducts an analysis of labor that includes a breakdown of billable
and non-billable hours. The report includes hours for office meetings, education, and
other non-billable categories. This report uses estimates for some non-billable categories
that are based on descriptions of the process by interviewees. From the interview data,
civilian employees are not tasked to non-production activities (e.g., mandatory physical
training, Navy Knowledge online education, and other military oriented briefs and
training) at the same rate compared to military employees. Using this data and for the
purposes of this report, non-billable hours of the civilian employee are approximately
half of the military allotted time. A specific analysis of non-billable hours could improve
the labor model.
This report recognizes differences between military and civilian vacation/leave
and sick day leave which could affect the labor model. Leave days and sick days are
detailed in this report as non-billable yearly hours. The number of authorized days for
military and civilians are used as the baseline number. Actual leave usage changes the
non-billable hour calculations in this report, but the actual usage of leave by military and
civilians is not analyzed in this report. Also, civilian sick leave could also be used (and
subsequently accrued over the period of employment) or transferred during the year.
Finally, it is recognized that when civilians take leave, only working days are counted
against the leave balance (i.e., Saturday and Sunday do not count). The following table,
Table 13, shows examples of how leave and sick day usage changes non-billable hour
calculations. This table details the difference between when total available
vacation/leave (baseline) is taken by an employee and when only half of the available
vacation/leave is taken by the employee. The cost per year and non-billable totals are
also shown. The difference between these two numbers can impact the labor model and
could be analyzed separately from this report.

41
Table 13. Leave Usage Example in Non-Billable Hour Calculations (From 1–2)
Civilian Non-Billable Paid Hours ($30.74 / Hr) Days Hours Cost/Yr
Paid Vacation (total available taken) 21 168 38 $5,164.32 39
Paid Sick Leave (total available taken) 13 104 $3,196.96
Total Non-Billable 34 272 $8,361.28
Civilian Non-Billable Paid Hours ($30.74 / Hr)
Paid Vacation (half taken in year) 10.5 84 $2,582.16
Paid Sick Leave (half taken in year) 6.5 52 $1,598.48
Total Non-Billable 17 136 $4,180.64
Military Non-Billable Paid Hours ($27.06 / Hr)
Paid Leave (total available taken) 30 240 $6,494.40
Paid Leave (half taken) 15 120 $3,247.20
In the above civilian example, the difference between using only half the available
vacation days is the difference of 136 non-billable hours and $4,180.64 of lost time costs.
This equates to a difference between a fully civilian burdened rate of $52.02 per hour (all
vacation taken) and $47.72 per hour (half available vacation taken). The fully burdened
rates will be explained further in Section IV. The Department of Defense Financial
Regulation details methods for approximating annual and sick leave accrual factors. The
regulation states that “A Defense Working Capital Fund activity may determine its own
allocation leave accrual factors because of variances caused by average length of service,
climate, turnover, and local leave usage experience” (Department of Defense, 2010,
pp. A–E). Accrual methods could differ from the analysis developed in this report, and
could affect the labor model presented in this report.
Contractors are afforded leave by their company, and contract hours are priced at
a flat rate. The non-billable vacation and sick time hours are assumed to be calculated by
the contractor’s company. Therefore, the hourly rate of contractors already includes
these non-billable hours (and costs). The government realizes the costs of contractor
vacation and sick time usage by paying this flat rate, although the vacation costs are not
38 8 Hours per day x number of days.
39 Per hour charge x number of hours.

42
clearly visible to the manager within FRCMA. Since analyzing the rate breakdown of
contractors is outside the scope of this thesis, contractor non-billable hour comparisons
will not be included. Overhead and depreciation costs for contractors used in this report
rely on a direct labor hour analysis vice a non-billable hour breakdown analysis.
Administrative overhead varies among organizations, and also varies between
FRCMA locations. Each site at FRCMA could experience different overheads; therefore,
this report will utilize the FRCMA Norfolk location to conduct a baseline military
overhead analysis. Since the FRCSE/Working Capital Fund sets a standard overhead rate
for civilian employees, this analysis utilizes the given rate. This report does not validate
the rate nor does it assume the rate represents the true cost per hour overhead for civilian
employees. This overhead rate presents a potential separate study to validate if the
overhead rate is accurate. The Fleet Readiness Center construct was intended to integrate
intermediate and depot level production with the units they support. FRCMA Oceana
shares hangar space with three operational squadrons, while FRCMA Norfolk has its own
building. FRCMA Oceana does not pay for facility rent or utilities, while FRCMA
Norfolk does. It is recognized that these factors could create different overhead rates.
All types of employees do not provide equivalent talent and ability to perform
tasks. Productivity, available hours, and knowledge base are all employee aspects that
have financial value. These qualities not only have value, they can potentially reduce
costs. These qualities are not analyzed in this report, though it is understood that the
qualitative aspects of the various employees do have a financial aspect. A separate report
that focusses on talent, working relationships, human resources, and flexibility of
employment would include this data and could attempt to quantify those aspects
financially to improve the labor model presented in this report.
This report analyzes non-billable hours for the three types of employees. For
these hours, most estimates were approximated. Subjective historical trends and some
expert opinion were used to estimate both grade equivalency and non-billable hour
generation. The estimates in this report offer a quick and inexpensive method for data
accumulation. An engineering or bottom-up approach is a more accurate method of
estimation, but it is more time consuming and expensive to conduct.

43
VII. CONCLUSIONS AND IMPLICATIONS
A. CONSOLIDATED DATA
Consolidating data from Section IV and V, Table 14 gives an overview of the per
hour labor rate estimate. Table 14 is divided into Military, Civilian and Contractor
columns. The rows represent the expense/cost value of the categories.
In Panel A, the basic hourly rate is burdened with non-billable hours. This burden
rate is then compared to the basic hourly rate computed in this report. The non-billable
hours affect military burden rates more than civilian and contractors.
In Panel B, overhead and depreciation expenses are summarized. The overhead
and deprecation rates are separated. The expense related to each is added to the initial
burden rate shown in the first section. To the right of the overhead and depreciation
totals is the added expense of overhead and depreciation to the initial burden cost per
hour as shown in the first section. A total burden rate is shown which includes both
depreciation and overhead added to the initial burden. This cost is then compared to the
basic hourly rate to demonstrate a total burden rate for this report. Civilian overhead
expenses as detailed in this report generate a greater expense compared to military and
contractor employees.
Panel C displays potential effects of overtime on labor rates. The first row of
overtime considers a 10 hour accumulation of overtime in one month. The second row
considers 10 hours of overtime every week for a month. The total burden for overtime
takes the change in overtime rate and multiplies it by the total burdened rate as calculated
in the second section. This represents the new total burdened cost per hour with the
appropriate overtime example. Overtime for civilians changes the cost per hour when
compared to military and contractor burdened labor rates in both overtime scenarios.

44
Table 14. Consolidated Labor Analysis (From Section IV and V)
Panel A
Cost Category Military Civilian Contractor
Basic Hourly
Rate $27.06 $30.74 $40.00
Initial Burden $51.87 $52.02 $40.00
Burden Rate 192% 169% 100%
Panel B
Over initial Over initial Over initial
Overhead $58.38 $6.51 $76.17 $24.15 $54.09 $14.09
Depreciation $52.04 $0.17 $52.20 $0.18 $40.63 $0.63
Total Burden $58.55 $76.35 $54.72
Burden Rate 216% 248% 137%
Panel C
Overtime
Total
Burden
Total
Burden
Single 10 Hrs $24.64 $53.31 $46.11 $114.53 $40.00 $54.72
10hrs/week $20.84 $45.09 $46.11 $114.53 $40.00 $54.72
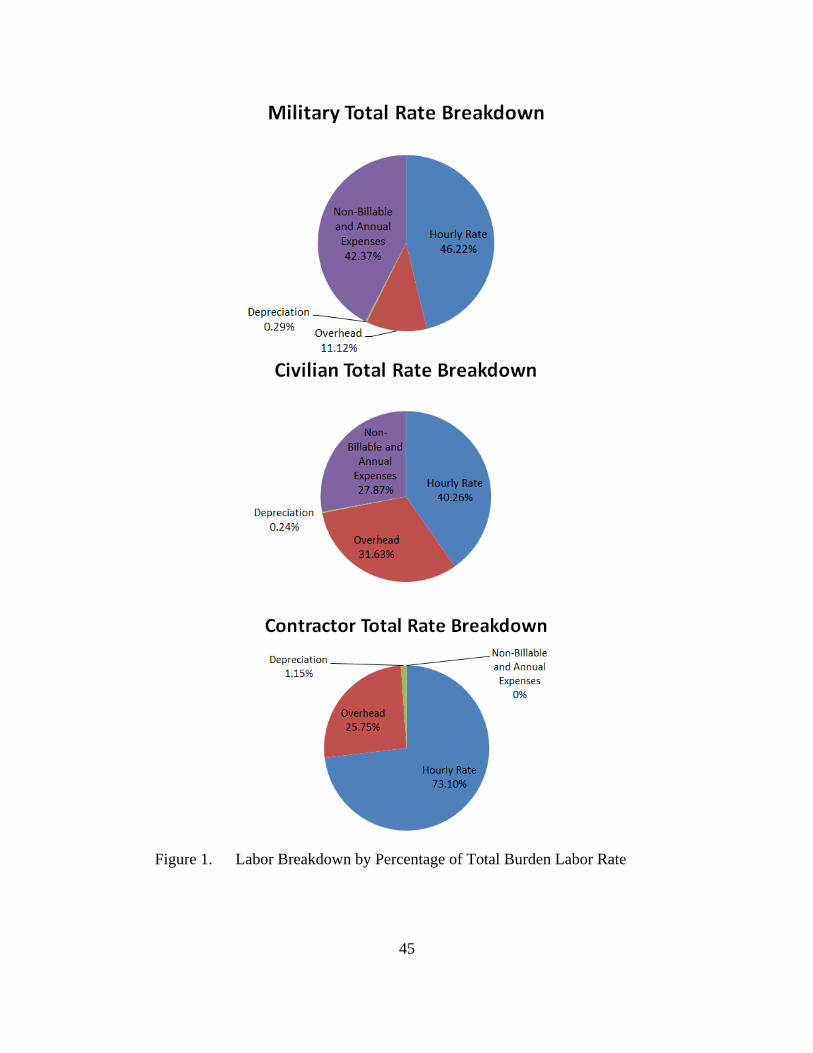
45
Figure 1. Labor Breakdown by Percentage of Total Burden Labor Rate
46
B. CONCLUSIONS
When analyzing labor costs, it is important to focus on as many areas of costs and
benefits as possible. This report focused primarily with the quantitative economic costs,
but there are qualitative costs that managers also need to analyze. The analyzed data in
this report is not a substitute for sound managerial judgment to determine the best sources
of labor. Also, the blanket application of specific sources of labor is not recommended,
as all organizations are different and require different approaches to production. It is
recommended that the manager of any organization follow methodical steps in
determining the correct mix of labor. When determining labor source, “establish
production objectives, formulate assumptions, identify constraints (legal, human
resource), compare alternatives after cost estimates, and estimate benefits for each
alternative” (American Society of Military Comptrollers, 2011). This report attempted to
focus on quantitative economic analysis, but not all labor costs and benefits are measured
and assigned a dollar value. Sound economic analysis should include qualitative labor
costs such as the administrative burden of removing a worker from employment or the
complexity of designing a contract. A qualitative benefit could include the increased
average knowledge base of a type of employee, or the employee’s ease and flexibility of
shifting production priorities. Productivity, available hours, and knowledge base are all
employee aspects that have financial value. A separate report that focusses on talent,
working relationships, human resources, and flexibility of employment could include this
data and attempt to quantify those aspects financially to improve the labor model
presented in this report.
This report used a very general approach to direct and indirect cost distribution. It
is accepted that not every cost was included and that some costs could be dealt with in a
different manner. Such costs could include, but are not limited to, information
technology, security, travel, utility, equipment maintenance, training, contract
administration, lease, insurance, and military specific G&A headquarter costs. However,
the methods of distributing costs and the general approach of this report can provide
useful data for future use. This report provides the manager a reference point when
accumulating additional expenses and a method to distribute those costs.
47
The comparison of labor costs is necessary to give the manager data to make
sound decisions. The data included in this report demonstrates that the basic cost per
hour of an employee goes beyond the basic pay rate. Currently, the aircraft department
billing rate at FRCMA Oceana is $99.84, but this represents a selling price to the
customer not necessarily a cost rate. This report accumulated data showing the highest
labor rate estimated at $76.35. There are several explanations for this difference which
can be used for decision making:
1. There are additional non-labor expenses which increase the rate by $23.49. As
mentioned in Section V, there are different overhead rates when non-labor overhead is
included. When other expenses (such as HRO, utilities, transportation, and material) are
included, the indirect overhead rate for civilians increases to $26.14. Additionally, the
rate charged to customers is $31.63 and represents the full overhead rate used by
FRCMA. Using this full overhead rate increases the $76.35 per hour labor rate to $86.34.
The $86.34 charge would represent a 33 percent increase in the total burden rate.40 This
is an increase in cost, and managers should analyze this cost further. The ability to
manage such an increase in the labor rate is essential.
2. If the $99.84 is a more accurate cost per hour, this would represent a total
burden rate of 324 percent.41 This is different than the accelerated rate of 153.75 percent
used by FRCMA. If the charged rate by FRCMA is equal to the cost experienced by the
organization (and the overhead rate is accurate), then there are basic pay expenses and
other annual expenses which this report does not include (see Section IV). However,
based on the analysis of this report, the labor cost per hour does not equal $99.84.
Therefore, using a $99.84 cost per hour is a WCF charge to the customer to not only
cover cost, but also to keep the net operating result at zero.
The $99.84 is a charge per hour which also represents a WCF requirement to
break even in the long run as detailed in Section II. While direct and indirect costs are
included in this charge, there are other WCF specific inputs which affect the per hour
40 $30.74 divided by $86.34 (as detailed in Section IV).
41 $99.84 divided by basic pay rate of $30.74 (as detailed in Section IV).

48
charge. This is important for managers to understand, in that the ability to compare labor
costs and control labor costs may be limited when using this number. Also, it is possible
that the rate was formulated using a more complex process than this report.
The surcharge (or cost recovery) amount is computed first by estimating sales at the latest acquisition cost or the latest repair cost. Sales in this terminology means the estimated dollar value of items from inventory, or ‘cost of goods sold’ to customers. Next, the cost recovery factor elements (surcharge elements) are estimated. These include the cost of supply operations (payroll, utilities, adjustments, material loss (e.g. depot washout) and obsolescence costs, transportation costs, the AOR recovery amount and any directed adjustments required by Department of the Navy or Department of Defense. These costs are totaled and allocated across the cost of sales as the ‘surcharge’ amount (Naval Postgraduate School, 2011, p. 115).
To understand the total cost per hour of an employee, an engineering or bottom-up
approach to analyzing labor costs may be necessary. The scope of this report did not
allow for an analysis of all surcharge elements. This report was an attempt to begin that
process, beginning with the most basic elements of the cost per hour of a FRCMA (WCF)
employee.
The flexibility of labor must be included in managerial decision making. While
the contractor rate calculated here is lower than the civilian and military rates, it does not
necessarily mean all work should be contracted out. Contract work is very specific in
nature, and the flexibility of contract work may prove too inflexible for some projects. In
the same manner, civilian labor is not as flexible as military labor. As demonstrated in
this report, overtime labor rates significantly change for civilians. To the contrary, labor
rates for military employees go down as the number of available billable hours goes up
(when overtime is encountered). In the determination of overhead and depreciation, the
direct labor hour was used as a cost driver/allocation base. If the manager decided to use
more contract labor, then the number of contract hours would be increased, thus
increasing the percentage of overtime and depreciation expense. This would necessarily
drive the labor rate up for contractors as demonstrated in this report.
One can argue that the manager should utilize all types of labor. Utilizing only
one type of labor based on cost would limit flexibility in production. Though, it is vitally

49
important to utilize specific labor for specific projects. For those projects where overtime
is expected, the utilization of military and contractor labor is recommended. For those
projects where the flexibility of work is important, it is recommended that military and
civilian labor be used (unless a flexible contract can be negotiated). When budget
restraints cause overhead expenses to strain the organization, it is recommended that
contract labor be utilized. The important question when such an issue arises is “are labor
costs for civilians and military employees being reduced as much as possible?” If there
are controls which can reduce the indirect costs, those controls should be utilized as much
as possible to maintain the flexibility of various employees. The issue is not just what the
drivers of overhead are, but whether the manager can control them. Without control,
managers are forced into accepting expenses and may not make the most efficient use of
their employee resources.
There are two main concerns with the data and analysis of this report. First,
depreciation charges are important to analyze, and this report only uses a surface level
analysis of assets to be depreciated. The valuation of the tools utilized by the employees
and a proper evaluation of the property are essential to accurately distribute depreciation.
The charge for depreciation used in this report is likely less than actual based on the
incomplete valuation of PP&E. Including an exhaustive inventory of PP&E, along with
the valuation of those assets, would allow a more refined depreciation charge to be
applied in the labor model. Second, the overhead rate applied to the military appears low.
This report suggests that there are other facility costs and other G&A expenses which
would increase this amount. Such costs would include, but are not limited to, higher
headquarter G&A, information technology support, travel expenses, administrative
supplies, and training expenses. It is a concern that there is a significant difference
between the military overhead rate and the civilian overhead rate. The total civilian
overhead rate includes overtime and non-labor charges which make comparison of
civilian and military overhead rates difficult. Also, there is a question of how the WCF
accurately charges overhead when military labor is utilized. Currently, the WCF
reimburses the government for the military employees used in production at a civilian
wage rate. Based on this report, the overhead rates for civilian and military employees is

50
not equal. Therefore, while the basic wage rate may be reimbursed, the overhead rate is
not an equal translation. A concern also exists that not all overhead utilized by
contractors is captured. Production maintenance overhead is also missing from this
report, and could be applied to the overhead rate of all three categories of employees.
Again, these concerns represent recommendations for further study.
C. RECOMMENDATIONS OF AREAS FOR FURTHER STUDY
It is recommended that FRCSE conduct a strategic review of labor resourcing.
This report concentrated on activities within FRCMA Norfolk and Oceana. Though, a
larger study of the labor costs for the entire FRC construct is required before any
significant labor decisions are made. Decisions on what source to draw labor from occur
after research has been conducted at each FRC location. Each location may require
different labor sources, and each location may require different mixes of employees to be
efficient. Operations research, in combination with business expertise, could provide
advanced techniques to help the FRC make better decisions.
By conducting a strategic resource review, the FRC can compare the budgeted or
expected labor costs with actual labor costs (not just revenue versus expenses). “Benefit-
cost analysis measures the effects of a plan by comparing its expected benefits and costs,
which can be quantitative and qualitative…an organization must be concerned with both
the quantitative and qualitative costs and benefits” (Hilton, Maher, & Selto, 2008).
Further research into all quantitative and qualitative costs must be conducted for strategic
resource decisions to be made. Each FRC organization should be analyzed separately to
provide the “bottom-up” analysis required. Using labor rate information from one
organization on another organization may provide less than optimal results.
Depreciation on all PP&E is required for full labor rate estimating. This report
analyzed the plant portion of the PP&E. An inventory of all equipment, to include tools,
is required. After the inventory is conducted, a valuation of that inventory is necessary.
Finally, the property where the FRC is located needs to be valued. Once these totals are
accumulated, a better estimate of the assets can be used for depreciation purposes. Also,

51
the depreciation methods for the facility may be different than the method for the
equipment. It is recommended that further research be conducted on the assets and
depreciation methods at FRCMA.
A further analysis of overhead is recommended. Overhead data was estimated
based on departmental salaries in this report, but further analysis could produce more
accurate results. Further analysis could provide a better method of distributing the
contractor portion of overhead than direct labor hours. WCF rates for overhead were
used in this report, and further specific analysis of those rates could provide a refinement
of those rates. It would be necessary to analyze FRCSE data.
Finally, it is recommended that the transfer fees associated with overhead rates be
analyzed. The addition of non-labor and G&A transfer costs generate a $1.99 increase in
the overhead rate (from $24.15 to $26.14). When contractor hours are included, this cost
transfer increases the rate by $7.06 (37 percent).42 Understanding the benefits received
from those external organizations may provide FRCMA managers the ability to control
the costs connected with those benefits.
42 Indirect overhead rate with transfers, without contractor hours $26.14. Indirect overhead rate
without transfers, including contractor hours $19.08. $26.14-$19.08=$7.06; $7.06/$19.08 = 37% increase from indirect with contractor hours.

52
THIS PAGE INTENTIONALLY LEFT BLANK
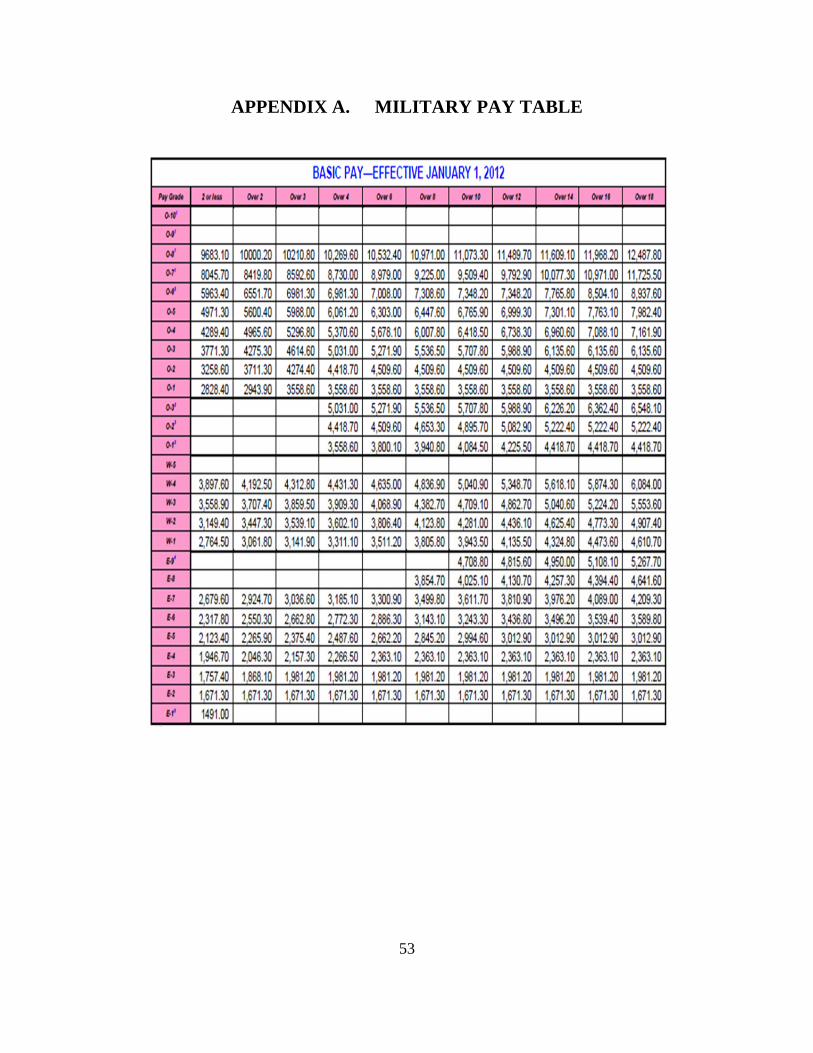
53
APPENDIX A. MILITARY PAY TABLE

54
THIS PAGE INTENTIONALLY LEFT BLANK

55
APPENDIX B. CIVILIAN WORKING GRADE (WG) PAY TABLES
DoD Clvillll'l PcuoMel Uanagell'tl\t Suvtu (AY) Arlln~on, Vu:ginh 2U09·Sl44 h111t Dah: U Jllly t010
S\IBJ&CT : redtul \!.age Sytlltlll Reguh1: :&1\4 Spedal Pud11~ion r .acillt.at:ing \~age ltat:e Schelllllu foe ~he l otfolk·Pott.-.llth·le.,ort It -~ton, Vl (RVS) \lag• A1:ea
TO: Co~M&~~ding Officeu of flll ituy DeputMcntJt and DoD Conponel\tJ Instalhtlont In the Aua
The tthcdllltt shown below have been c~tbl i~hed undec allthot!ty of DoD lnst:tllctlon 51%0 . ~9 1 dated ScpteMbcc 10, 2008, tubject to the liMitation• cont:.ai11ed in CPft 2009-25, daued t~ DeceMbcc %009. Ratet ate ett&bllthtd as cequiced by 5 USC 534~(4), If applicable, and are to be applied In accotd~cc with the ptovls lo~ of 5 CrR Pact 5~! to all c~l tyccs ~••• official duty station ' ' located within the geogtaphlc boundary ot the wage atea dcflnlolon 1hown on oht tcvecte side .
"' 11.-\13 Gude l 1 s
\1)•\11
Pay 5 Level
1 11 . lt lt.5~ 13.1l 13.6! 14.13 13.~1 13.88 14.44 15. 00 1S • .S4 11.69 19 .~ ZO.t6 21.01 !1. 82 2 1,.19 13 .12 14. Z8 14.85 15.40 14. 5t 15.11 15.1~ 16.32 16.95 19 . 5~ 20.4? 21.31 %2.11 !2 .92 3 14. 28 14. 8$ 15. 46 16. 0? 16.69 15.?% 16.3? 1?.0~ 1?.64 1$ . ~5 20. 52 21. ~? t2 .t1 %3.10 t3.91 1 4 1S . l9 15. 80 16. 45 1?.15 17.?? 16.?0 1?.42 18. 11 1 •• ?5 19.5? 21 so zt.3t t3.tt 24.18 t5.08 l s 16.16 16.t1 1?.50 18 .18 18.82 1?.?? 1•.s1 19. 24 19. 98 20 .?3 2t .39 23 . 3~ t4. ~6 25.t4 !6.1? 3
6 17.09 1'1.84 u.se 19.U 19.94 18.?7 19.60 Z0 .34 t 1. 14 21.93 23.40 24.3? 25.35 t5.31 t?.%9 4 ? 18.06 18 .80 19 .58 20.3t 21.09 19 . 85 to.6• t1.st tt . 36 t3 .19 t4 . 39 t5.3? t5.35 t?.4o z• . 4t 5 1 8 19.00 19.?9 20.58 21.3? t2.1G %0.90 t 1.?? Zt. 65 t3.S1 t4 . 4S 25.35 26 .4t 2?. 48 28.53 29 . 49 6 z 9 %0. 00 20.86 21.70 22.$3 23 . 39 21.98 12 .94 13. 89 24.75 %$ . 16 26. 35 21 . 43 28.59 Z9.66 30. ?5 ? 3
10 21.03 21. 90 22.71 23. 65 %4. $3 23 .14 24.10 2&.06 16 .02 26. 98 t? 34 28 . 48 t9 .5t )0 .75 31.90 • 4 -11 zz.o8 t3.oo 23.92 24.14 25.?5 24. %9 25.31 26.32 t7.34 21 .34 28.14 29.41 30.50 31.76 32.94 9 s lt 23.10 24.06 25.02 25.99 26 .95 tS. 4l 15.4? t7.54 21.59 %9 .6& t9 . t8 30 .51 31.15 32.96 34. 18 10 6 1~ t3.98 ts.oo t6 .00 t?.Ol t8.ot %6.41 t?.S1 18.50 Z9.?3 30.t4 30.59 31.9? 33.tt ~4.5Z 25.80 11? 14 t 4.83 Z& . 89 Z5 . 91 2?.94 Z8.97 27 .33 t8.49 Z9. 6Z 20 . ?? 31.91 3l.Z1 33.56 34.89 35.24 37.58 8 15 %5. 6? 26.?2 2? .00 28 .81 29.95 20.24 19.42 30. 5? 31.?8 32 . 9~ 33 .95 35.3? 36.?? 38.20 39 .59 9
\1315 25.90 3? . 4% 38.91 40. 41 41.89 \13•1, 38 . 1$ 39.75 41.32 42.93 44.50 \IS•U 40 .60 42 .31 44.00 45.6? 4? .3?
"'-19 41.56 43.2t 4S.Ot 45.?5 4t .48
,TUfT.!! II IIQAIIV __ n.~~~~~·" ..!.'.!!.n!!ln~----

56
THIS PAGE INTENTIONALLY LEFT BLANK

57
APPENDIX C. CIVILIAN EQUIVALENCY TABLE
APP£NDIXB DEPARn!Th"T OF DEFE..~SE WORKING CAPITAL ~1>S
CI\ 111..\~ ~ MIUT.ut\· EQtn·AI.E~ ·cy R..\ IE
.Fiscal Ye~ ------
The cost of military pmom:.el a»!pleci to actil'me; fuu.nced by :::>efex:ie Wcx:king Captm f\md (DWCF) ts iJxlud.ed m the tow co;t of operations of dt!· \\'otiing. Clp1~ 1 F'~d acm'itto at a\Ua.o equi\'Dlent n:es ~ii!ilaty persounel tlssigned 'to DWCF acti\: ties are to be costed at ci\1.h:!n equivalw rate;. usmg lhe r.ue; m th~ mble belol\1
Cl\ 'I:.l. "'-" ~l'.:.\.:{Y CI\'I:.l:\.'\ G!tA:I! =~·-~ EQUlV.~'TlL~TE
GJW>E ~em OS ~Saw. BY(•) ~
0-9 ES IA\'010
o-s ES :~..#\ ~ I\' G-7 ES IA\'QI V ~ GS-lS
o-·s GS-10: <H GS-13 0.3 GS-1~
G-1 GS-11 G-l G$.()9
wo-s GS-1 ~
\\"().-: GS-1~
\\"0..3 GS-11 W0.1 GS-09 \\'C>l <iS-09
E-9 GS-OS f,.;s ~7
f·1 GS-06 E~ GS-OS f·~ GS-OS E-4 ~
f ·) GS-03 f·~ GS-01 f-~ GS-01

58
THIS PAGE INTENTIONALLY LEFT BLANK

59
APPENDIX D. SPECIAL WG PAY SCALE FOR FRCMA
htut Dttt: Apnl7, 2011
SUBJECT: fcdct~ Wqe S)'llt!D Special Waae Rl!et f« AlrmR MalntrniiiCO and Su~ Positlc-~t lo !he Narf~·PortsmOIIdi-Ne'ro~ 1·H~ Vq Waae Arce
TO: CO~iMA 'OINO OFFICERS OF MIUT AlY OEPARTMOO'S AND 000 COMPONENT INST A1J.A nom IN THE AW
REFERF.NCf (a) U.S. Office oi'Pmoonel ManaJema~tlener, dtttd Scpltmbct2l,2010, tilicb authMrcd ~er.abiU t ol'spedal" fer Abcn~
we WI,~
CRADK
' , • ' II II
ll u 14 IS ,,
Ma~ "-itlons. uxhldl leader aDd ~KWY potitlons u .00.11 on tbe I'M'fiO 'Ide, at tbc 192nd fl&b~ WIIIJ VIIJir.la Air Nil<r O.:atd * US AW F01ee RctcM UDit ll WJ!ey AFB. VA, U S A lilly RCJMt C«a-lllh A vlatkMI Canmaad, U S. Anny A\'UI*I
1.tcis:Ja ~ U ~ AJay RacarU Dntqacc& £atoccNa c-ud a! ron F..at. v A. aDd ~ct orNavr ~led Reatws (' CIIIO'IID VWJIII Btae!ll"ld ~ I VA AII'CI'I.W MarQ 2J,l01110 .&1 WO'td WD cd "'N (b) OpenllnJ Manual, Ftdml \\'tat $)11tm, Subeb~ Sl~ Sp«UU Rala cr R&·e l Uodcr 1111 Ft4cnl Yl'act S) (c) 0o0 0\ihll PC~W~nd MwaMt Service. Wacc and S.laly OMsa Idler, dated Ja~ 1&,2010, Fcdcnl W 5)1' ,.. • Special ~ Faa"~ tafiAa Wa Rate Scbcdll!a (AC.I40R) fer the Ncrfolk·Pons:noo~ N~·llamp!Oa, Vqmia Wep A~tt
htiledcr.dcr !'fllyoCDoDI ~ Sll039, ~10,200\ FtdcnlWescS) ltpraedSp«.al~ racthtatsngW eRatcScllcdulclf<tlhcNtrfolk·P«tmt.~Nm-H V \' eArtt(tt!me(c)}rt ::!CIIdcdby the followina sp« al rates:
WC.RATIS WI.. RATtS WS.RATf.S )
2157 2247 ll37 2427 25.17 U73 24.72 2S 71 26.70 1769 )009 lll4 32S9 ms lS 10 2)27 2424 2511 2611 27.1S 2SS9 2666 27.73 28.79 29.16 31.79 ll 11 }44) lS.76 )70S 2497 2601 2 OS 2&0) 29.13 1141 2161 29.7S 3090 32 ()I 3HI l4 U 3621 3767 )907 2665 27.79 2190 3001 l1.12 293S 30$7 )1.19 ))02 3424 lS 19 3666 ) 13 39.59 4106 21.l! 29S6 30.74 31.92 33.11 llll 3B2 - l3J2 )$.12 3642 3619 }14) )997 41.50 4) ()I
300! )I 33 32 S8 ll.a. 35.09 3303 lH6 lS 14 3722 31~ )712 3167 4022 4176 4UI 31.79 )) II 3443 JS 76 31.03 l496 364l 37.88 39)) 40.79 3W 31.99 40SS 4211 4367 lHS lUI 3613 3767 3901 3614 3U7 1990 4144 41.97 37&0 3938 40.96 42S3 4W
3126 398$ 41.44 4).()1 44.63 31.n 4039 4101 4)62 4$.24 39J6 41~ 4264 4421 4S92
c~ R. ~IG EK ENtcd~• Date: The G111 day or lbc frll pey pcrlod Chid lit~ Much 2UJII Waat an4 aluy Dh111•• ptnt4tt Sew• ht~M: ~24,2010
WO.W Pay
Ltwl
6 7 I 9
10 II 7
a 9

60
THIS PAGE INTENTIONALLY LEFT BLANK

61
APPENDIX E. FRCMA NORFOLK FACILITY DATA
NAVSTA NORfOlK VA N44325 flTREAOCEN MIOlANT OET NORfOlK SP301 AIMO 02 BUilDING 1280 Sf 7/1/2005 ~ 100/(00
NAVSTA NORfOlK VA N44325 flTREAOCEN MIOlANT OET NORfOlK SP304 TEST CEll ElECTRICAl BlDG. 223 Sf 7/1/2005 ~ 50/(00
NAVSTA NORfOlK VA N44325 flTREAOCEN MIOlANT OET NORfOlK SP302 AIMO TIRE STORAGE BUilDING 1248 Sf 7/1/2005 ~ 100/(00
NAVSTA NORfOlK VA N44325 flTREAOCEN MIOlANT OET NORfOlK SP356 AI MD GSE SHOP 21716 Sf 7/1/1987 ~ 2/383/(00
NAVSTA NORfOlK VA N44325 flTREAOCEN MIDlANT OET NORfOlK SP356 AI MD GSE SHOP 21716 Sf 7/1/1987 ~ 2)83/(00
NAVSTA NORfOlK VA N44325 flTREAOCEN MIOlANT OET NORfOlK SP369 STORAGE PAD P 1650 SY 7/1/1941 ~ 99/800
NAVSTA NORfOlK VA N44325 flTREAOCEN MIOlANT OET NORfOlK SP300 NEW MAIN AIMO fRC COMPlEX 140520 Sf 7/1/2005 ~10/(00/(00
NAVSTA NORfOlK VA N44325 flTREAOCEN MIOlANT OET NORfOlK SP300 NEW MAIN AIMO fRC COMPlEX 140520 Sf 7/1/2005 ~10/(00/(00
NAVSTA NORfOlK VA N44325 flTREAOCEN MIDlANT DET NORfOlK SP300 NEW MAIN AIMD fRC COMPlEX 140520 Sf 7/1/2005 ~10/(00/(00
NAVSTA NORfOlK VA N44325 flTREAOCEN MIOlANT OET NORfOlK SP300 NEW MAIN AIMO fRC COMPlEX 140520 Sf 7/1/2005 ~10/(00/(00
NAVSTA NORfOlK VA N44325 flTREAOCEN MIOlANT OET NORfOlK SP300 NEW MAIN AIMO fRC COMPlEX 140520 Sf 7/1/2005 ~10/(00/(00
NAVSTA NORfOlK VA N44325 flTREAOCEN MIOlANT OET NORfOlK SP357 GRNO SUP SHED EQUIP NORTH 4300 Sf 7/1/1987 ~ 77/(00
NAVSTA NORfOlK VA N44325 flTREAOCEN MIOlANT OET NORfOlK SP305 AIMO flAGPOlE 7/1/2005 ~ 5/(00
Total: ~13)74/800

62
THIS PAGE INTENTIONALLY LEFT BLANK

63
LIST OF REFERENCES
American Society of Military Comptrollers. (2011). Enhanced defense financial management training course student guide. Alexandria, VA: American Society of Military Comptrollers.
Brandon, D. D. (1998). Implementing earned value easily and effectively. Project
Management Journal, 29, 11–19. Defense Systems Management College. (1999). Indirect-cost management guide. Fort
Belvoir, VA: Defense Systems Management College Press. Department of Defense. (2010). Financial management regulation. Volume 11B, Chapter
13 130714 A–E. FRC Southeast. (2011, April 1). Working capital fund cost control manual. FRC
Southeast Instruction 7310.1. Jacksonville, FL: FRCSE, DoD. Fultz, J. F. (1980). Overhead: What it is and how it works. Cambridge: Abt Books. Hilton, R., Maher, M., & Selto, F. (2008). Cost management (4th Edition ed.). New
York: McGraw-Hill. Naval Postgraduate School. (2011). Practical financial management: A handbook for the
Defense Department financial manager (Vol. 10th Edition). (L. Potvin, Ed.) Monterey, CA: Naval Postgraduate School.
Nikolai, L., Bazley, J., & Jones, J. (2010). Intermediate accounting. Mason, OH: South-
Western Cengage Learning. Nussbaum, D. D. (2000). Economics of consulting firm support vs. in-house government
support. Monterey, CA: Unpublished. Oyer, D. J. (2005). Pricing and cost accounting (2nd Edition ed.). Vienna, VA:
Management Concepts, Inc. Stickney, C., Weil, R., Schipper, K., & Francis, J. (2010). Financial accounting: An
introduction to concepts, methods, and uses. Mason, OH: South-Western Cengage Learning.

64
THIS PAGE INTENTIONALLY LEFT BLANK

65
INITIAL DISTRIBUTION LIST
1. Defense Technical Information Center Ft. Belvoir, VA 2. Dudley Knox Library
Naval Postgraduate School Monterey, CA
3. CAPT James CoBell III
Commanding Officer FRC Mid-Atlantic NAS Oceana Virginia Beach, VA
4. CAPT Michael Zarkowski Executive Officer FRC Mid-Atlantic NAS Oceana
Virginia Beach, VA 5. CDR Craig Owen
Production Officer FRC Mid-Atlantic NAS Oceana Virginia Beach, VA 6. Dr. Kenneth Euske Graduate School of Business and Public Policy Naval Postgraduate School Monterey, CA 7. Dr. Stephen Hansen Graduate School of Business and Public Policy Naval Postgraduate School Monterey, CA 8. CDR Thomas Williams FMB EA OASN (FM&C) Washington, D.C.