navajo unit operations january 25, 2011 coordination meeting · molas lake red mountain pass scotch...
TRANSCRIPT
Navajo Unit Operations
January 25, 2011
Coordination Meeting

Agenda
•Welcome
•Special Presentation – Colorado Basin River Forecast Ctr
•Review of Water Year 2010 Operations
•Water Year 2011 Current Conditions/Snowpack
•Water Year 2011 Forecasts & Proposed Operations
•Current Reservoir Status
•Navajo Dam Maintenance Activities
•Fish & Wildlife Service/San Juan RIP Update
•Reports from other Agencies
•Questions from Audience
•How To Access Information
•Close
5985
5990
5995
6000
6005
6010
6015
6020
6025
6030
6035
6040
6045
6050
6055
6060
6065
6070
6075
6080
6085
-6,000
-4,000
-2,000
0
2,000
4,000
6,000
8,000
10,000
Jan Feb Mar Apr May Jun Jul Aug Sep Oct Nov Dec Jan
Dail
y W
S E
levati
on
(f
t)
Dail
y In
flo
w, R
ele
ase &
Ch
an
ge-i
n-S
tora
ge (cfs
)
2010-2011
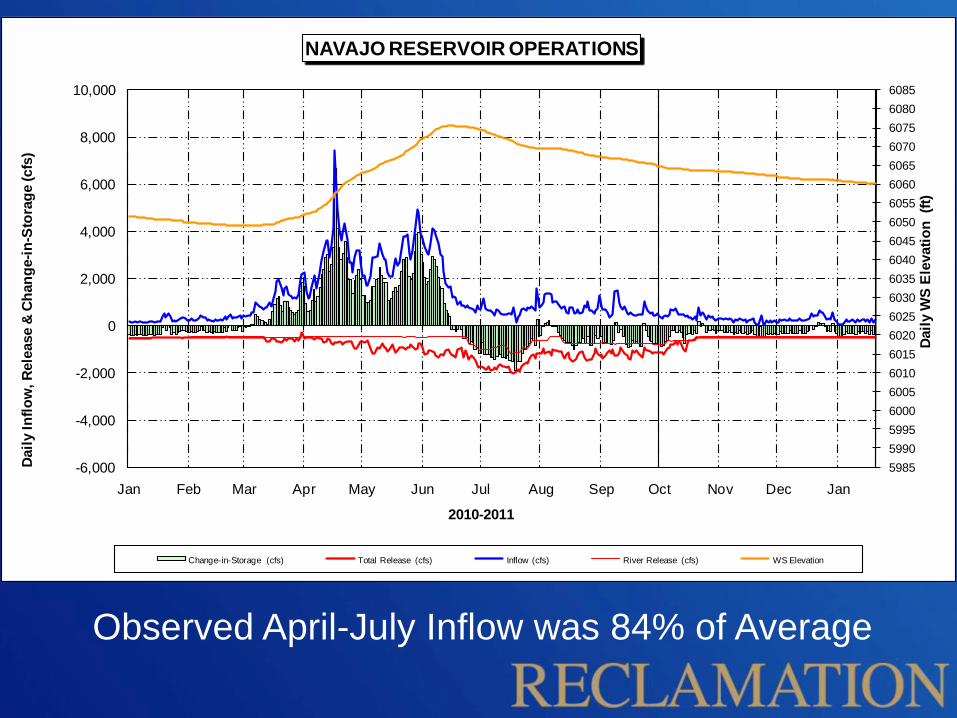
NAVAJO RESERVOIR OPERATIONS
Change-in-Storage (cfs) Total Release (cfs) Inflow (cfs) River Release (cfs) WS Elevation
Observed April-July Inflow was 84% of Average
0
500
1000
1500
2000
2500
3000
3500
4000
4500
5000
6/15/2010 6/29/2010 7/13/2010 7/27/2010 8/10/2010 8/24/2010 9/7/2010 9/21/2010 10/5/2010 10/19/2010
Me
an D
aily
Pro
visi
on
al S
tre
amfl
ow
s (C
FS)
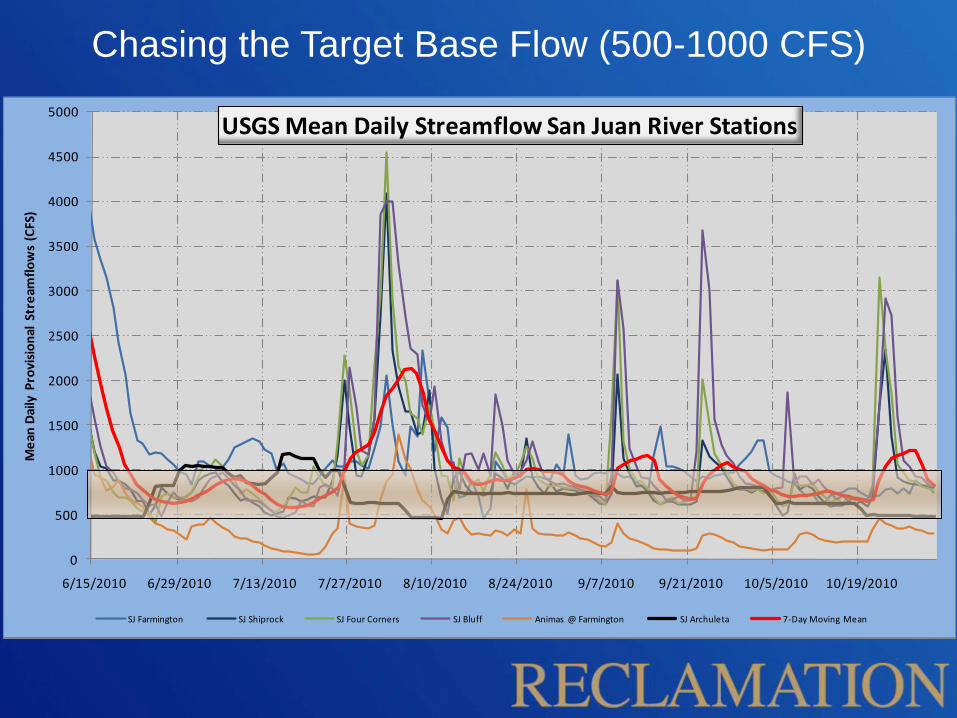
USGS Mean Daily Streamflow San Juan River Stations
SJ Farmington SJ Shiprock SJ Four Corners SJ Bluff Animas @ Farmington SJ Archuleta 7-Day Moving Mean
Chasing the Target Base Flow (500-1000 CFS)


San
Juan
River
Basin
JA
NU
RA
RY
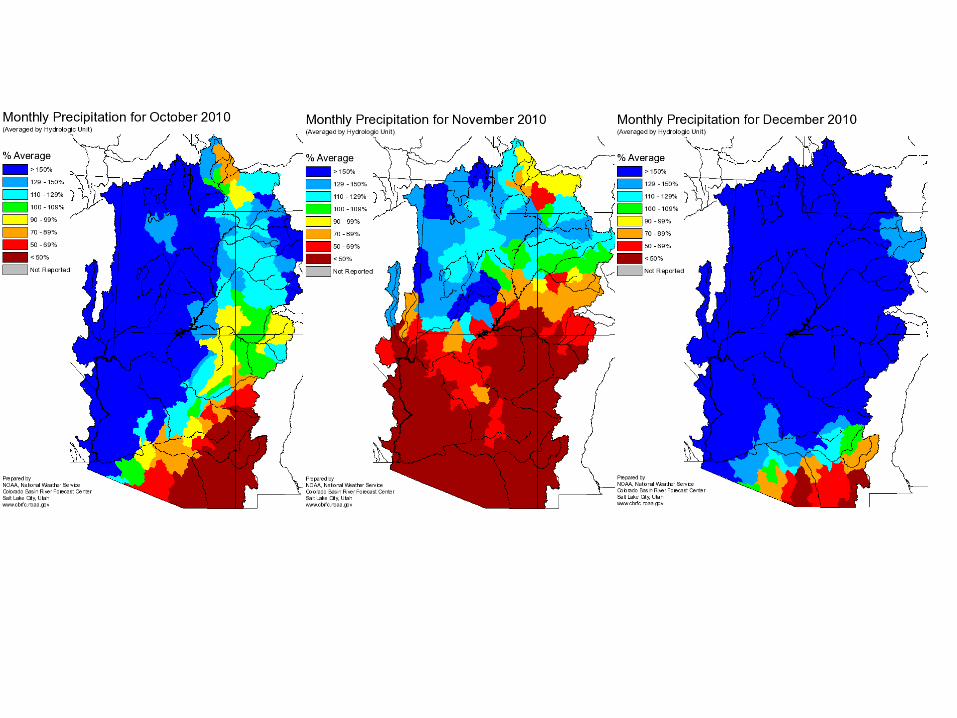
Pre
cip
ita
tio
n

Insert US Map with total precipitation to
show storm tracks

Water Year 2010
San Juan Basin Snowpack Summary(as of 1/24/2011)
LocationsAverage of Applicable
SNOTEL Stations
(SWE – inches)
% Average
San Juan
(Bluff)11.6 105%
Navajo Reservoir 11.8 109%
Vallecito Reservoir 11.7 111%
Animas @
Durango11.1 107%

0
5
10
15
20
25
30
35
Oct Nov Dec Jan Feb Mar Apr May Jun
Snow
Wate
r E
quiv
ale
nt
(inches)
San Juan Basin Multiple Station Snotel Plot
Avg
2002
2003
2004
2005
2006
2007
2008
2009
2010
2011
SNOTEL SITES:
BEARTOWN CASCADE #1CASCADE #2CHAMITA COLUMBUS BASINCUMBRES TRESTLE LILY PONDMANCOSMIDDLE CREEKMINERAL CREEK MOLAS LAKE RED MOUNTAIN PASSSCOTCH CREEK SPUD MOUNTAINSTUMP LAKESUPPER RIO GRANDEUPPER SAN JUAN VALLECITO WOLF CREEK SUMMIT
January 24, 2011 Current Snowpack is (11.6/11) = 105% of Average

Water Year 2011 (as of 1/24/2010)
Navajo Inflows & San Juan Basin Snowpack
EOM Inflow (af) % Average SJ SWE (in.) % Average
October 26,548 52% 0.9 56%
November 12,096 37% 3.2 65%
December 18,785 76% 11.0 136%
January
(Current)8,075 50% 11.6 105%

Mid-January 2011 Forecast
Navajo Reservoir
Modified Unregulated
April-July Inflow Volume
Inflow (af)% of
Average
2010
Forecast
Most Probable 800,000 106%700,000
(93%)
Minimum Probable 500,000 66%400,000
(53%)
Maximum Probable 1,170,000 155%1,120,000
(148%)
Last Year’s SWE above Navajo = 12.8” (11.8” this year) on 1/24

0
100,000
200,000
300,000
400,000
500,000
600,000
700,000
800,000
900,000
1,000,000
1,100,000
1,200,000
1,300,000
1,400,000
Mid
Dec
Jan
Mid
Jan
Feb
Mid
Feb
Mar
Mid
Mar
Apr
Mid
Apr
May
Mid
May
Jun
Mid
Jun
Jul
Mid
Jul
Ap
r-J
ul O
utl
oo
k
Forecast Date
WY2011 CBRFC - Navajo Reservoir Most, Max and Min Inflow Forecasts (acre-feet)
Max Most Min 30 Yr Avg Inf low 2010 Observed
0
200,000
400,000
600,000
800,000
1,000,000
1,200,000
1,400,000
1,600,000
1,800,000
2000 2001 2002 2003 2004 2005 2006 2007 2008 2009 2010 2011
Ap
ril-Ju
ly M
od
Un
reg
In
flo
w
Years
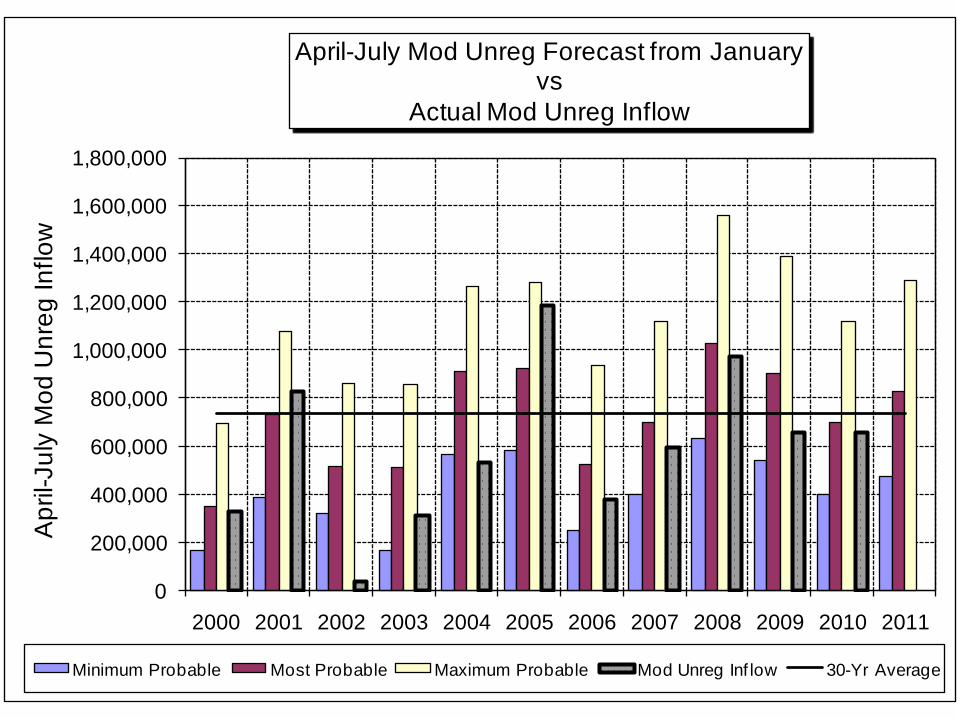
April-July Mod Unreg Forecast from Januaryvs
Actual Mod Unreg Inflow
Minimum Probable Most Probable Maximum Probable Mod Unreg Inf low 30-Yr Average

y = 0.00001887x + 7.74470708
0.0
5.0
10.0
15.0
20.0
25.0
30.0
35.0
- 100,000 200,000 300,000 400,000 500,000 600,000 700,000 800,000 900,000 1,000,000 1,100,000 1,200,000
Max
imu
m A
nn
ual
SW
E (i
nch
es)
April - July Inflow Volume (acre-feet)
Historical April-July Inflows compared to Maximum Annual SWE
Maximum Annual SWE from Historic Record
2010 Maximum SWE w/ most probable forecast
y = 0.00001228x + 2.50801737
0
5
10
15
20
25
- 200,000 400,000 600,000 800,000 1,000,000 1,200,000 1,400,000
Sno
w W
ate
r Eq
uiv
ale
nt -
SWE
(in
che
s)
April - July Modified Unregulated Inflow Volume (acre-feet)
Correlation of Historical SWE from Today's Date and Mod Unreg April-July Inflow
SWE on Today's Date
Today w/ current most probable forecast
Today w/ current min probable forecast
Today w/ current max probable forecast
SNOTEL above Navajo vs. Inflow Forecast
Today’s SWE
Today’s SWE
2010
2010

0
100,000
200,000
300,000
400,000
500,000
600,000
700,000
800,000
Apr-1 May-1 Jun-1 Jul-1 Aug-1
Cu
mm
ula
tiv
e A
pril
-Ju
ly In
flo
w V
olu
me
(a
cre
-fe
et)
Cummulative April - July Observed Inflow of Representative SWE Years
1991 1989 1992 2010 Historic Average Current Observed and Current Most Probable Monthly Forecast

Climate
Prediction
Center
Precip.
Outlooks
8-14 Day
February
Monthly

Climate
Prediction
Center
Seasonal
Precipitation
Outlooks
March-April-May
February-March-April
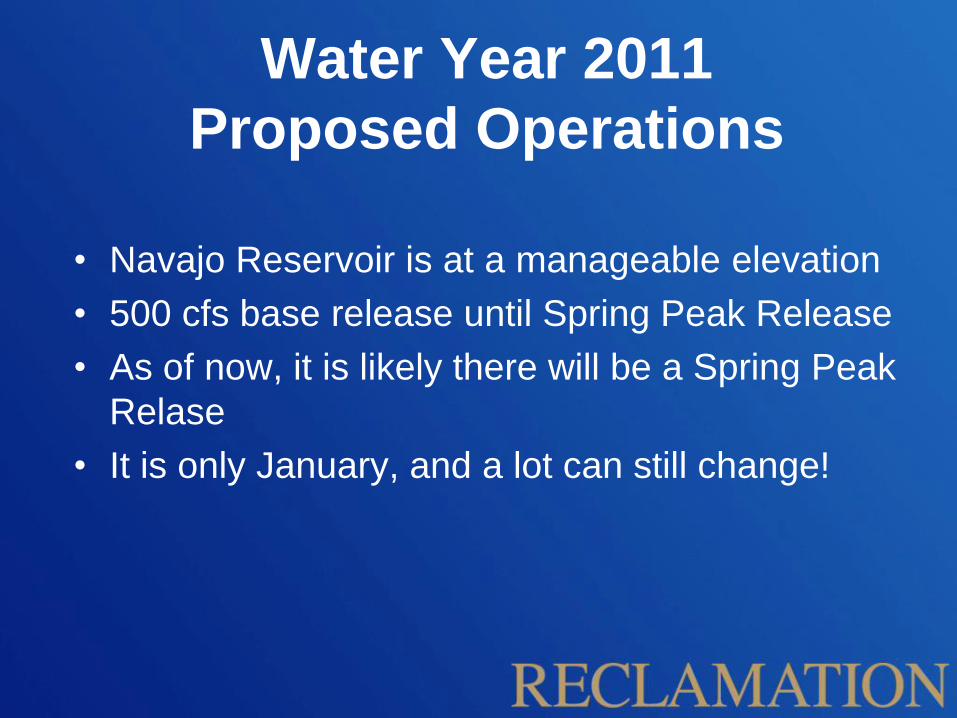
Water Year 2011
Proposed Operations
• Navajo Reservoir is at a manageable elevation
• 500 cfs base release until Spring Peak Release
• As of now, it is likely there will be a Spring Peak
Relase
• It is only January, and a lot can still change!

1
5
14
4
1312
10
9
11
8
3
27
6
AVAILABLE WATER PATH
Min Prob: 510,000 af #5
Most Prob: 749,000 af #8
Max Prob: 1,072,000 af #6
0
500
1000
1500
2000
2500
3000
3500
4000
4500
5000
5500
Rele
ase (
CF
S)
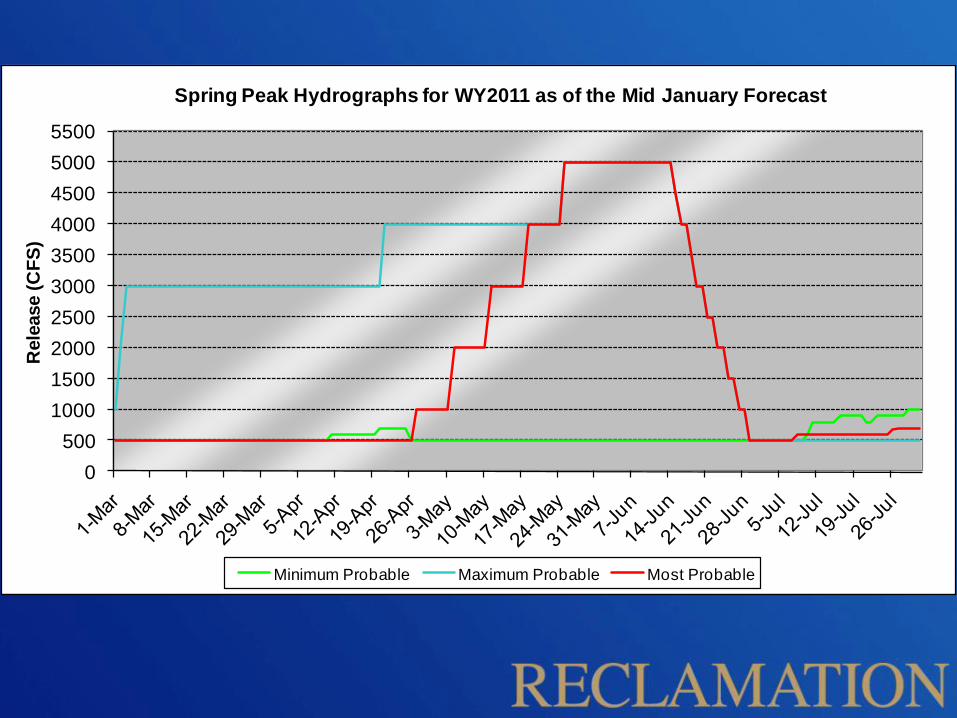
Spring Peak Hydrographs for WY2011 as of the Mid January Forecast
Minimum Probable Maximum Probable Most Probable

0
50,000
100,000
150,000
200,000
250,000
300,000
350,000
*OC
T10
*NO
V10
*DE
C10
JA
N11
FE
B11
MA
R11
AP
R11
MA
Y11
JU
N11
JU
L11
AU
G11
SE
P11
Inflow (af) as of January 2011 Mid Month Forecast
30-Yr Avg Min Prob Most Prob Max Prob

0
50,000
100,000
150,000
200,000
250,000
300,000
*OC
T10
*NO
V10
*DE
C10
JA
N11
FE
B11
MA
R11
AP
R11
MA
Y11
JU
N11
JU
L11
AU
G11
SE
P11
Release (af) as of January 2011 Mid Month Forecast
30-Yr Avg Min Prob Most Prob Max Prob

0
200,000
400,000
600,000
800,000
1,000,000
1,200,000
1,400,000
1,600,000
1,800,000
2,000,000
*OC
T10
*NO
V10
*DE
C10
JA
N11
FE
B11
MA
R11
AP
R11
MA
Y11
JU
N11
JU
L11
AU
G11
SE
P11
Co
nte
nt (a
f)Content (af) as of January 2011 Mid Month Forecast
30-Yr Avg Min Prob Most Prob Max Prob

6,000
6,020
6,040
6,060
6,080*O
CT
10
*NO
V10
*DE
C10
JA
N11
FE
B11
MA
R11
AP
R11
MA
Y11
JU
N11
JU
L11
AU
G11
SE
P11
Co
nte
nt (a
f)Elevation as of January 2011 Mid Month Forecast
Min Prob Most Prob Max Prob

0
1000
2000
3000
4000
5000
6000
7000
8000
9000
10000
9/2
4
10
/8
10
/22
11
/5
11
/19
12
/3
12
/17
12
/31
1/1
4
1/2
8
2/1
1
2/2
5
3/1
1
3/2
5
4/8
4/2
2
5/6
5/2
0
6/3
6/1
7
7/1
7/1
5
7/2
9
8/1
2
8/2
6
9/9
9/2
3
Flo
ws (C
FS
)
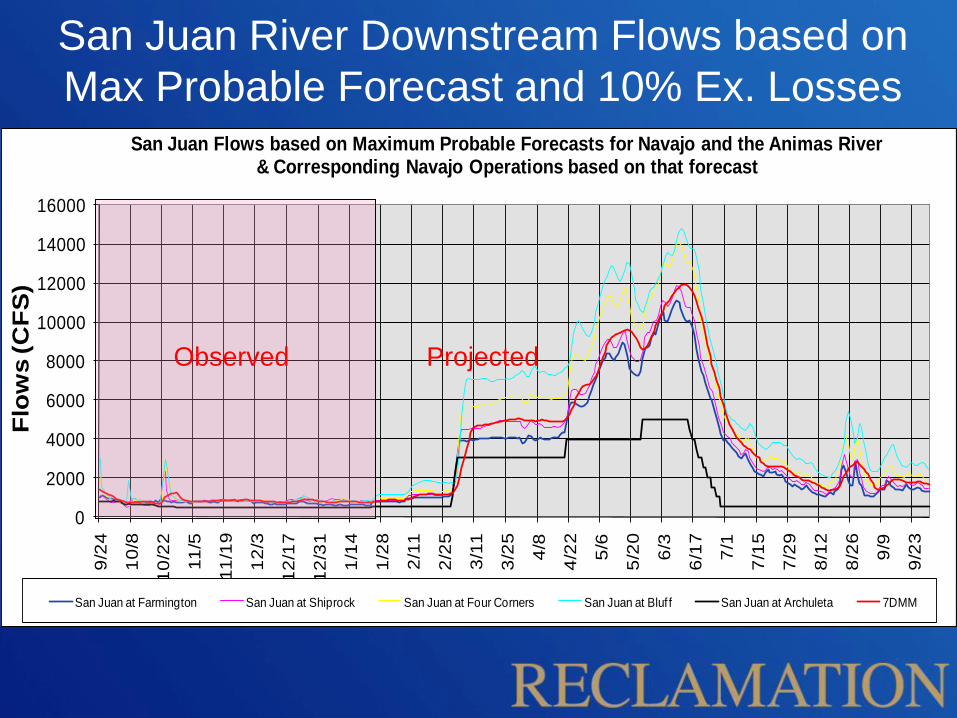
San Juan Flows based on Most Probable Forecasts for Navajo and the Animas River & Corresponding Navajo Operations based on that forecast
San Juan at Farmington San Juan at Shiprock San Juan at Four Corners San Juan at Bluf f San Juan at Archuleta 7DMM
San Juan River Downstream Flows based on
Most Probable Forecast and Median Losses
Observed Projected
0
500
1000
1500
2000
2500
3000
3500
9/2
4
10
/8
10
/22
11
/5
11
/19
12
/3
12
/17
12
/31
1/1
4
1/2
8
2/1
1
2/2
5
3/1
1
3/2
5
4/8
4/2
2
5/6
5/2
0
6/3
6/1
7
7/1
7/1
5
7/2
9
8/1
2
8/2
6
9/9
9/2
3
Flo
ws (C
FS
)
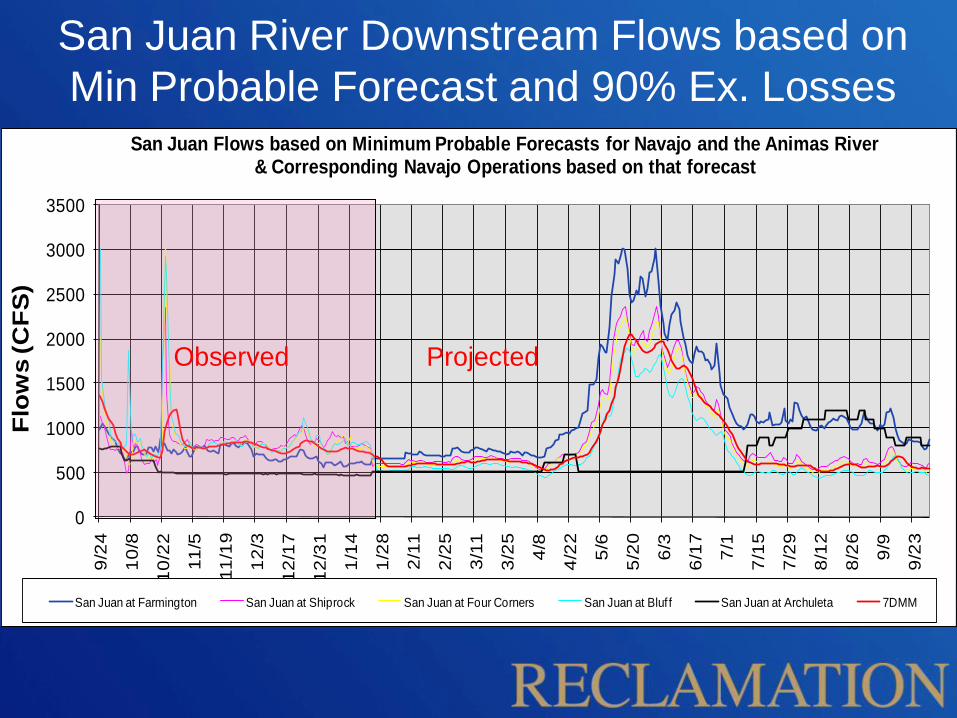
San Juan Flows based on Minimum Probable Forecasts for Navajo and the Animas River & Corresponding Navajo Operations based on that forecast
San Juan at Farmington San Juan at Shiprock San Juan at Four Corners San Juan at Bluf f San Juan at Archuleta 7DMM
San Juan River Downstream Flows based on
Min Probable Forecast and 90% Ex. Losses
Observed Projected
0
2000
4000
6000
8000
10000
12000
14000
16000
9/2
4
10
/8
10
/22
11
/5
11
/19
12
/3
12
/17
12
/31
1/1
4
1/2
8
2/1
1
2/2
5
3/1
1
3/2
5
4/8
4/2
2
5/6
5/2
0
6/3
6/1
7
7/1
7/1
5
7/2
9
8/1
2
8/2
6
9/9
9/2
3
Flo
ws (C
FS
)
San Juan Flows based on Maximum Probable Forecasts for Navajo and the Animas River & Corresponding Navajo Operations based on that forecast
San Juan at Farmington San Juan at Shiprock San Juan at Four Corners San Juan at Bluf f San Juan at Archuleta 7DMM
San Juan River Downstream Flows based on
Max Probable Forecast and 10% Ex. Losses
Observed Projected


Navajo Current Conditions(as of 1/23/11)
Elevation = 6060.0 (103% of Average)
Storage = 1,347,419 af (79% Full)
Inflow = 170 cfs (January Average)
Release = 500 cfs
NIIP = Not currently diverting water
San Juan-Chama Diversion = None

Nearby Reservoirs

Nearby Reservoirs(1/23/2011)
Vallecito
- Elevation = 7642.2 (55% Full, 109% of average)
- Storage = 69,030 af
- Release = 30 cfs
- Inflow = 79 cfs (January Average)
Lemon
- Elevation = 8095.5 (36% Full, 67% of average)
- Storage = 14,146 af
- Release = 11cfs
- Inflow = 12 cfs (January Average)

Animas-La Plata Project
• No pumping in January, first half of February
• Reservoir is 2/3 Full (79,500 af stored)
• Reservoir expected to fill this summer
• Navajo Nation Municipal Pipeline is currently
under construction


Future Navajo Dam
Maintenance Activities:
1. Muck-out Stilling Basin
2. 6x13 Emergency Gate Bonnet
Maintenance•Will occur after Stilling Basin muck-out (Fall 2011)
•Flow will be diverted through auxiliary gate for 1
month to 6 weeks

Stilling Basin Update
•Contract has been awarded to DLM (ABQ)
•Waiting for submittals from contractor
•Notice to proceed has not been given
•Start date is still uncertain
•Estimate is 2-3 weeks to complete
•Release will remain at 500 cfs during work
•Cofferdam (aquadam) approach will provide
minimum disturbance
•NM Game & Fish will remove any remaining fish
in stilling basin prior to dewatering
•Anticipate no impacts to fishery


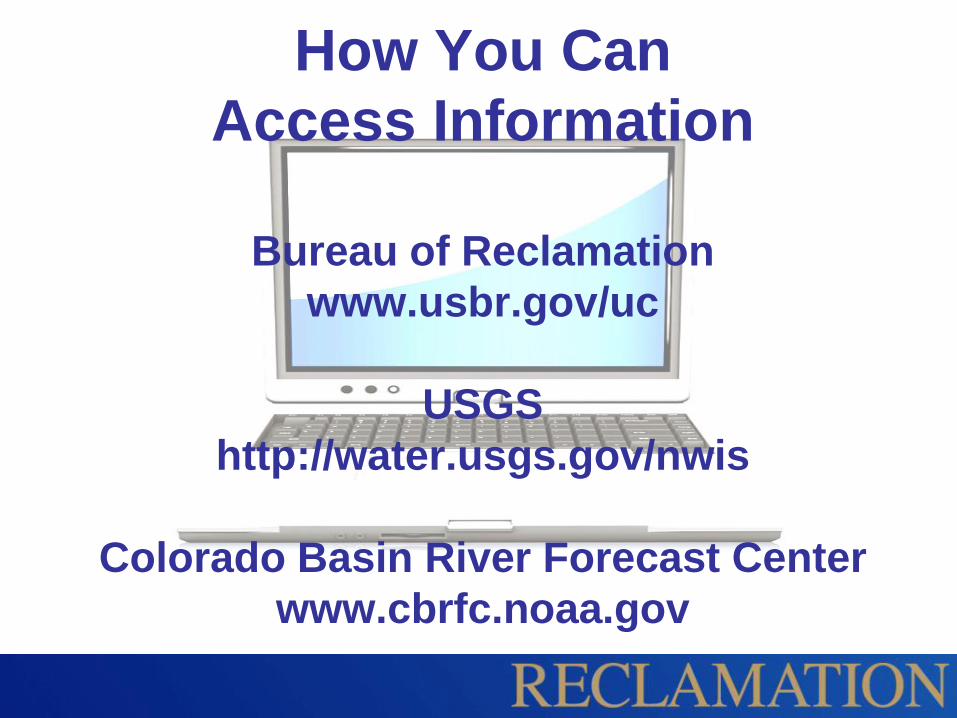
How You Can
Access Information
Bureau of Reclamation
www.usbr.gov/uc
USGS
http://water.usgs.gov/nwis
Colorado Basin River Forecast Center
www.cbrfc.noaa.gov

Reclamation Contacts:
Pat Page970-385-6560, [email protected]
Ryan Christianson970-385-6590, [email protected]
Ruth Swickard970-385-6523, [email protected]

Summary• Several storms in December brought the snowpack to as high as
136% of average, current snowpack is just above average.
• Fall and early winter inflows have been below normal
• Most Probable April – July Inflow Forecast is 106% of average
• Historic snowpack and climate outlooks suggest less inflow
• Based on the most probable forecast, a full hydrograph of 21 days at
5000 cfs with weeklong ramp-ups is scheduled
• If the inflow forecast decreases, the spring peak will be less
• Downstream river flows are expected to be near normal
• Likely Minimum (Base) Release = 500 cfs before and after the
spring peak release
• Target Baseflow is 500 -1000 cfs in Critical Habitat
• Next Operations Meeting: April ?, 2011
