nav1.5 sodium channel assay using the ionworks ht system · experiments described in this...
TRANSCRIPT

P-9333, M-1028, H-7523, G-7528; Fluka Cat. #21115; Fisher Cat. #SS266-1)
Cell culture media> Dulbecco’s Modified Eagle Medium (Gibco
Cat. #11965-092), 10% Fetal Bovine Serum, 1% Penicillin-Streptomycin (Irvine Cat. #s3000, 9366) and 1% Geneticin (Gibco Cat. #10131)
> Tissue culture flasks: Cells grown in T-75 flasks (Corning Cat. #430641)
> PatchPlate Consumables (Molecular Devices Cat. #9000-0688)
> Compound plates (IonWorks HT System assay): Greiner® 384-well plate (Cat. #781280)
> Compound Library: 1564 compounds were generously provided by a Molecular Devices customer. All compounds were tested at a final concentration of 33 µM with a final DMSO concentration of 0.33%.
METHODS
Cell cultureCells were cultured in T-75 flasks and passaged every two to three days at 1:3 to 1:6 dilutions. Cells were also maintained at a lower seeding density (1:50) and passaged every 3–4 days.
ElectrophysiologyCurrents were elicited by a voltage step from a holding potential of -100 mV to -20 mV for 20 ms. Compounds were incubated for 250–650 seconds between the pre- and post- compound reads.
Preparation of antibiotic solution Amphotericin is used to obtain the perforated patch clamp configuration. Aliquots of amphotericin (5.0 ± 0.3 mg) were pre-weighed and stored at 4°C. Prior to cell preparation, 180 µL DMSO was added to an aliquot of amphotericin. The amphotericin and DMSO solution was sonicated until soluble (~1 minute), added to a 50 mL conical tube of internal buffer and vortexed for ~1 minute. The solution was stored in the dark until ready for use.
Primary Screen of a Directed Compound Library Against Nav1.5 Channels Using Population Patch Clamp Technology
By Andrew Wittel, Naibo Yang, Ph.D. and James Costantin, Ph.D., Molecular Devices, 1311 Orleans Drive, Sunnyvale, CA 94089.
INTRODUCTION
Population Patch-Clamp™ (PPC) is a recently introduced technique1 from Molecular Devices that records ensemble averages from cells sealed onto 64 recording sites using a single amplifier per well. PPC reduces the variability inherent to conventional and single-aperture planar patch-clamp techniques caused by a lack of exogenous channel expression, low seal resistances, and unstable recordings. The use of PPC on Molecular Devices’ IonWorks® Quattro Instrument allows the acquisition of a data point from nearly 100% of the individual wells of the PatchPlate™ substrate, allowing the elimination of the quadruplicate addition requirement used in the IonWorks® HT System.(2,3) Together, the increased data consistency and throughput provided by PPC make the IonWorks Quattro System suitable for directed screening of focused compound libraries. This application note describes a proof-of-concept study of 1564 compounds, demonstrating the use of IonWorks Quattro System in a primary screen against the cardiac sodium channel, Nav1.5.
MATERIALS
Cells> Chinese hamster lung (CHL) cells expressing
the Nav1.5 sodium channel
Reagents and buffers> Tetrodotoxin (Sigma Cat. #T-5651)
> Amphotericin (Sigma Cat. #A-4888)
> DMSO (Sigma Cat. #D-2650)
> Versene™ (Gibco Cat. #15050)
> Internal Buffer (in mM): 140 KCl, 2 MgCl2 5 EGTA, 10 Hepes pH to 7.2 with KOH (Sigma Cat. #P-9333, M-1028, E-0396, H-7523, P-5958)
> External Buffer (in mM): 137 NaCl, 4 KCl, 1 MgCl2, 1.8 CaCl2, 10 Hepes, 10 Glucose, pH to 7.4 with NaOH (Sigma Cat. #s S-7653,
IONWORKS qUATTRO AppLICATION NOTE #4
Cell preparation Cells were grown to 70–90% confluence in a T-75 flask and removed from the incubator (37°C, 5% CO2) for 1–2 days after plating. The cells were lifted using Versene solution at 37°C, centrifuged and the resulting cell pellets were resuspended (1–2 million cells/mL) and gently triturated in external buffer for 1 minute using a p200 pipettor before being added to the instrument’s cell boat.
Data analysisConcentration-response curves were fitted to a four parameter logistic equation:
% of control = 100 (1 + ([drug]/IC50)p)-1,
where IC50 is the concentration of drug required to inhibit current by 50% and p is the Hill slope.
Z' factors were calculated using:
pRIMARy SCREEN Of A DIRECTED COMpOUND LIbRARy AgAINST NAv1.5 CHANNELS USINg
pOpULATION pATCH CLAMp TECHNOLOgy
Z' = 1 – (3 x SD positive + 3 x SD negative)/ || mean of positive - mean of negative ||
Positive control wells contained 100 µM tetrodotoxin (TTX) and negative control wells contained external buffer, all control wells contained 0.33% DMSO.
RESULTS
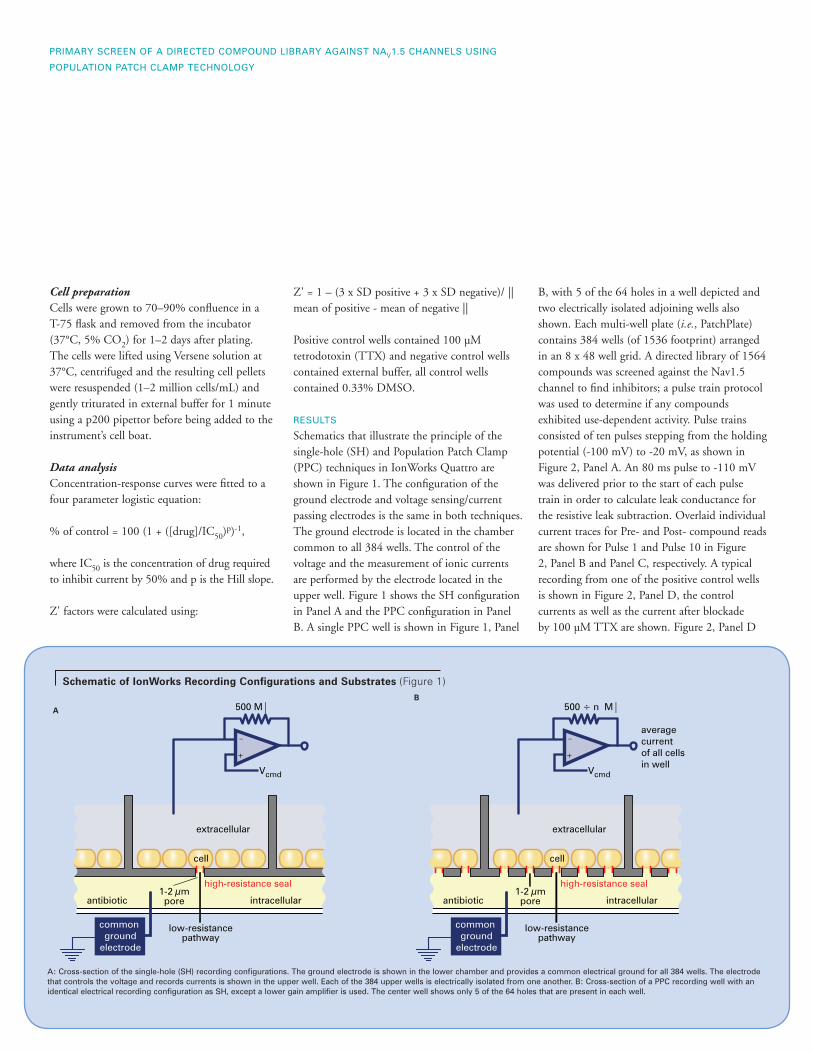
Schematics that illustrate the principle of the single-hole (SH) and Population Patch Clamp (PPC) techniques in IonWorks Quattro are shown in Figure 1. The configuration of the ground electrode and voltage sensing/current passing electrodes is the same in both techniques. The ground electrode is located in the chamber common to all 384 wells. The control of the voltage and the measurement of ionic currents are performed by the electrode located in the upper well. Figure 1 shows the SH configuration in Panel A and the PPC configuration in Panel B. A single PPC well is shown in Figure 1, Panel
B, with 5 of the 64 holes in a well depicted and two electrically isolated adjoining wells also shown. Each multi-well plate (i.e., PatchPlate) contains 384 wells (of 1536 footprint) arranged in an 8 x 48 well grid. A directed library of 1564 compounds was screened against the Nav1.5 channel to find inhibitors; a pulse train protocol was used to determine if any compounds exhibited use-dependent activity. Pulse trains consisted of ten pulses stepping from the holding potential (-100 mV) to -20 mV, as shown in Figure 2, Panel A. An 80 ms pulse to -110 mV was delivered prior to the start of each pulse train in order to calculate leak conductance for the resistive leak subtraction. Overlaid individual current traces for Pre- and Post- compound reads are shown for Pulse 1 and Pulse 10 in Figure 2, Panel B and Panel C, respectively. A typical recording from one of the positive control wells is shown in Figure 2, Panel D, the control currents as well as the current after blockade by 100 µM TTX are shown. Figure 2, Panel D
Schematic of IonWorks Recording Configurations and Substrates (Figure 1)
A: Cross-section of the single-hole (SH) recording configurations. The ground electrode is shown in the lower chamber and provides a common electrical ground for all 384 wells. The electrode that controls the voltage and records currents is shown in the upper well. Each of the 384 upper wells is electrically isolated from one another. b: Cross-section of a ppC recording well with an identical electrical recording configuration as SH, except a lower gain amplifier is used. The center well shows only 5 of the 64 holes that are present in each well.
high-resistance seal
intracellular
extracellular
antibiotic 1-2 µm pore
common ground
electrode
low-resistance pathway
cell
500 M
Vcmd
–
+
A
B
high-resistance seal
intracellular
extracellular
antibiotic 1-2 µm pore
common ground
electrode
low-resistance pathway
cell
500 ÷ n M
average currentof all cells in well
Vcmd
–
+

shows the negative peak amplitude current that was measured (i.e., peak negative current during the 2.5 ms interval between cursors 1 and 2) and the baseline current amplitude that is subtracted (i.e., mean current between cursors 3 and 4) to calculate the measured Na+ current.
Compounds were plated into two sets of five 384-well microplates each, with the ten experimental runs completed in less than two days. All compounds were screened at a final concentration of 33 µM in 0.33 % DMSO. Each compound plate contained positive and negative control wells and Z' factors ranged from 0.64 to 0.80 (mean = 0.70, standard deviation = 0.05). Scatter plots of all compounds tested are shown for pulse 1 (Figure 3, Panel A) and pulse 10 (Figure 3, Panel B). Current inhibition by each compound is plotted as the first replicate (x-axis) against the second replicate (y-axis), thus reproducible results from both replicates fall on the diagonal. Positive controls are shown in green, negative controls in blue. The single errant negative control point (in blue, upper left) of both plots was due to an unexplained loss of the voltage clamp during the first replicate, which was not captured by the filter settings in the software. Compounds that were considered “hits” are shown in red and the remaining compounds that were not hits are shown in black. The criterion for a “hit” was any compound that caused a current reduction of 37% or more in both replicates. Of the 1564 compounds, 40, and 42 compounds were identified as candidate hits in the initial screen for pulse 1 and pulse 10, respectively. The 42 compounds identified as candidate hits at pulse 10 were selected for follow-up pharmacology by performing 10-point dose-response determinations.
Use-dependent compounds can be identified by plotting the amount of block during the first versus the tenth pulse, compounds that exhibit more block during the tenth pulse will plot below the diagonal between negative and positive
IONWORKS qUATTRO AppLICATION NOTE #4
Nav1.5 Ionic Current Measurements (Figure 2)
A
The voltage protocol used to elicit currents is shown (A), a train of 10 depolarizing steps to -20 mv from a holding potential of -100 mv was delivered. Typical negative control current recordings are shown for pulse 1 (b) and pulse 10 (C), the currents before (brown) and after (blue) the addition of the negative control is shown. Typical positive control recordings are shown for the first pulse in the train (D); note the full blockade of the current after the addition of 100 µM TTX. The metrics used to calculate the current magnitude and the percent change in peak currents is shown: the negative peak current between the regions outlined by the lines shown at (1) and (2) is measured and the baseline current between cursors (3) and (4) is subtracted.
Single-Concentration Compound Screen Run in Duplicate (Figure 3)
All compounds that were tested are shown as well as the negative and positive controls tested on each plate. The results of these paired runs are shown with the first replicate on the x-axis and the second replicate on the y-axis. The percent of the control current remaining during the post-compound read is plotted on each axis. positive controls are shown in green and negative controls in blue. Compounds that blocked ionic currents by more than 37% in both replicates were considered a hit and shown in red; the remaining compounds with <37% inhibitory activity are shown in black. The results from pulse 1 (A) and pulse 10 (b) are plotted separately.
0 20 40 60 80 100 120
0
20
40
60
80
100
120
0 20 40 60 80 100 120
rep
licat
e 2
(% c
urre
nt, p
ost
co
mp
oun
d)
replicate 1(% current, post compound)
rep
licat
e 2
(% c
urre
nt, p
ost
co
mp
oun
d)
replicate 1(% current, post compound)
0
20
40
60
80
100
120
C D
B
pulse 1
pulse 10100 µM TTX
control
1 2 3 4
Pulse 1 Pulse 10A B

screening for Use-Dependent Compounds (Figure 4)
The inhibitory activity of all compounds are plotted with the results from pulse 1 plotted on the x-axis and the results from pulse 10 plotted on the y-axis. Use-dependent compounds are more potent during the tenth pulse and therefore plot below the diagonal between positive and negative control.
controls. Approximately five compounds with potential use-dependence are shown in Figure 4.
The potency of the 42 candidate hits identified in Figure 3 was then determined by fitting the dose-response curves as described in the Methods. The curve-fitting results for the 42 candidate hits are shown in Figure 5. For pulse 1, 36 dose-response curves were successfully fit and of these, 31 were considered active (pIC50>4.5). For pulse 10, 39 dose-response curves were successfully fit and of these, 36 were considered active (pIC50>4.5). By examining the data in Figures 4 and 5 there are several candidate compounds that may exhibit use-dependent inhibition. After fitting the dose-response curves, for pulse 1 and pulse 10 respectively, two compounds did show clear use-dependence. The dose-response curves for these two compounds verify that they indeed exhibit use-dependent properties by a leftward shift in the dose-response curves for pulse 10 versus pulse 1, as shown in Figure 6.
The pIC50 values for the dose-response curves run in duplicate are compared in Figure 7. The difference in the two pIC50 values for each compound is plotted as the deviation from zero for pulse 1 (top) and pulse 10 (bottom). In other words, if the pIC50 value for the two replicates were identical, the data for that compound would plot at zero on the y-axis. Thus, the IonWorks Quattro System assay showed a very good reproducibility for the measured potency values of the individual compounds.
DISCUSSION
The screen described here using PPC technology validates the idea that large scale screening of directed libraries can be performed using a direct electrophysiological assay. Forty-two compounds
pRIMARy SCREEN Of A DIRECTED COMpOUND LIbRARy AgAINST NAv1.5 CHANNELS USINg
pOpULATION pATCH CLAMp TECHNOLOgy
200 40 60 80 100 120
20
0
40
60
80
100
120
pul
se 1
0 re
plic
ate
2(%
cur
rent
, po
st c
om
po
und
)
pulse 1 replicate 2(% current, post compound)
Follow-Up Pharmacology on the 42 Candidate Hits (Figure 5)
The results of the pharmacological analysis are shown after curve fitting the dose-response curves. pulse 1 results showed 31 compounds to be active (pIC50>4.5), 5 compounds were found to be poorly active (pIC50<4.5) and 4 dose response curves failed the fitting routine. pulse 10 results showed 36 compounds to be active (pIC50>4.5), 3 compounds to be poorly active (pIC50<4.5) and 3 compounds failed the fitting routine.
failed curve fit
pulse 1 pulse 10
poorly activecompounds
active compounds
4.0
3.5
3.0
2.5
2.0
1.5
1.0
0.5
0
4 53
31
36
# o
f Co
mp
oun
ds
Dose-Response Curves of Compounds Exhibiting Use-Dependence (Figure 6)
Dose-response curves comparing pulse 1 and pulse 10 for two compounds that exhibited use-dependence. Note the leftward shift in the dose-response curves for both compounds during pulse 10.
-7 -6 -5 -40
20
40
60
80
100
120
-7 -6 -5 -40
20
40
60
80
100
120
Compound RC19
log[compound], M
% C
hann
el A
ctiv
ity
log[compound], M
Compound UC13
% C
hann
el A
ctiv
ity
pulse 1 pulse 10 pulse 1 pulse 10

of the 1564 screened were identified as candidate hits in a single concentration screen (33 µM) performed in ten runs (i.e., five compound plates run in duplicate) in less than two working days. The 42 hits were followed up with 10-point dose-response curves (in duplicate), performed in less than one day. Pulse 10 data showed a total of 6 compounds that either exhibited low activity or failed the curve fitting routine, corresponding to a false positive rate of 0.38% (6 of 1564 compounds). The throughput and robustness of this assay suggest that tens of thousands of compounds can be screened in a matter of weeks. Previously, this level of throughput could only be achieved by indirect measures of ion channel activity such as flux, binding or fluorescent based assays. The PPC technique takes advantage of averaging 64 recordings into
one and achieving a near perfect success rate for each recording well. PPC benefits from being a direct electrical measurement of ionic channel activity and thus does not suffer from some of the problems associated with indirect measures of channel activity, namely false positives and false negatives. In this screen we found approximately 0.4% false positives and none of the 320 positive control wells failed to show inhibitory activity, suggesting that there were no false negatives. In conclusion, this proof-of-concept study demonstrates the robustness and practicality of rapidly screening thousands of compounds with a direct electrophysiological assay in a time-frame that is amenable to the ion channel drug discovery process.
REfERENCES
1. A. Finkel, A. Wittel, N. Yang, S. Handran, J. Hughes, J. Costantin. Population Patch Clamp improves data consistency and success rates in the measurement of ionic currents. J Biomol Screen 2006.
2. K. Schroeder, B. Neagle, D.J. Trezise, J. Worley. IonWorks HT: A new high-throughput electrophysiology measurement platform. J Biomol Screen 2003;8:50-64.
3. L. Kiss, P.B. Bennett, V.N. Uebele, K.S. Koblan, S.A. Kane, B. Neagle, et al. High-throughput ion-channel pharmacology: planar-array-based voltage clamp. Assay and Drug Development Technologies 2003;1:127-135.
IONWORKS qUATTRO AppLICATION NOTE #4
A
Reproducibility of pIC50 Values Between Replicate Determinations (Figure 7)
The pIC50 value obtained during the second replicate is plotted against the value obtained during the first replicate. plotted in this way, two identical replicate determinations would equal zero. The results for pulse 1 (A) and pulse 10 (b) are plotted separately.
compound number0 5 10 15 20 25 30 35 40
-1
-0.8
-0.6
-0.4
-0.2
0
0.2
0.40.6
0.8
1
compound number0 5 10 15 20 25 30 35 40
-1-0.8-0.6-0.4-0.2
00.20.40.60.8
1
∆p IC
50 p
ulse
1∆p
IC50
pul
se 1
0
B

SALES OffICES
United States & CanadaMolecular Devices Tel. +1-800-635-5577 fax +1-408-747-3601
BrazilMolecular Devices brazil Tel. +55-11-3616-6607 fax +55-11-3616-6607
China
Molecular Devices beijing
Tel. +86-10-6410-8669
fax +86-10-6410-8601
Molecular Devices Shanghai Tel. +86-21-6887-8820 fax +86-21-6887-8890
GermanyMolecular Devices gmbH Tel. +49-89/96-05-88-0 fax +49-89/9-62-02-34-5
Japan Molecular Devices Japan, Osaka Tel. +81-6-6399-8211 fax +81-6-6399-8212
Molecular Devices Japan, Tokyo Tel. +81-3-5282-5261 fax +81-3-5282-5262
South KoreaMolecular Devices Korea, LLC Tel. +82-2-3471-9531 fax +82-2-3471-9532
United KingdomMolecular Devices Ltd. Tel. +44-118-944-8000 fax +44-118-944-8001
www.moleculardevices.com
fOR RESEARCH USE ONLy. NOT fOR USE IN DIAgNOSTIC
pROCEDURES.
The trademarks used herein are the property of Molecular
Devices, Inc. or their respective owners. Specifications subject to
change without notice.
©2010 Molecular Devices, Inc. printed in U.S.A. 6/10 #0120-1505b