natural versus anthropic causes in …w3.ualg.pt/~jdias/jad/papers/04_polish_jad.pdf · ortega and...
TRANSCRIPT

Polish Geological Institute Special Papers, 11 (2004): 95-102 Proceedings of the Conference "Rapid transgressions into semi-enclosed basins"
NATURAL VERSUS ANTHROPIC CAUSES IN VARIATIONS OF SAND EXPORT FROM RIVER BASINS: AN EXAMPLE FROM THE GUADIANA RIVER MOUTH
(SOUTHWESTERN mERIA)
Joao M. Alveirinho DIAS\ Ramon GONZALEZ2, Oscar FERREIRA!
Abstract. Flood events in many river basins with highly variable discharge values remove accumulated sediments from the riverbed and estuaries. These sediments are exported to the shelf and the adjacent coastlines. Data for rainfall and river discharge for the Guadiana River basin in southwestern Iberia show a strong link with North Atlantic Oscillation (NAO) index patterns. A negative NAO index usually results in more rainfall , and subsequent flooding in the river basin during winter months. During the second half of the 20th century, the flow regime of the Guadiana River and its tributaries have been increasingly constrained by the construction of dams. The consequences were a reduction of coarse-grained sediment export from the upper river basin to the estuary, and a reduction in the number and type of floods.
Key words: Guadiana River, sediment transport, estuarine sand bodies, floods, NAO, anthropic influence.
INTRODUCTION
The supply of sand from river basins to coasts and shelves is vital for the stability of coastlines and the maintenance of shelf sand bodies . The consequences of a reduction in sand supply from river basins to the oceans are large-scale coastal erosion and alteration of sedimentation patterns on the shelves, with consequences not only for natural habitats, but also the economy. The export of sediment from river basins is conditioned by a series of factors. Particularly, climatic variations on an inter-annual to multi-decadal scale have an important geomorphological impact (e.g. Maas, Macklin, 2002; Goy et al., 2003; Viles, Goudie, 2003). The North Atlantic Oscillation (NAO) is the dominant mode of winter climate variability in the North Atlantic region, ranging from central North America to Europe and much into northern Asia. The NAO is a large-scale seesaw in atmospheric mass between the subtropical high and the polar low. The corresponding index is the difference of sea level pressure normalised for the period 1901-1980 between the northern station situated in Stykkissholmur (Iceland) and a southern station whose location varies according to the authors: Ponta De1gada (e.g. Rogers, 1997), Lisbon (e.g. Hurrell, 1995) or Gibraltar (e.g. Jones et aI., 1997). The choice of southern station can make some differences, particularly in
seasons other than winter (e.g. Jones et al., 1997; Visbeck, 2000). A positive phase of the NAO reflects below-normal pressure in the northern North Atlantic and above-normal pressure over the central North Atlantic, leading to strong westerly winds associated with warm and moist air masses across the northern Europe during winter (e.g. Visbeck, 2000). The negative phase reflects the opposite pattern in circulation and air temperature across Europe. Its vast influence on European river discharge patterns is well documented (e .g. Goodess, Jones, 2002; Rimbu et al., 2002).
During the course of the 20th century, anthropic influence in river systems has become an increasing limiting factor of river discharge, and consequently reducing sediment supply to estuaries, adjacent coasts and shelves, as river basins are increasingly dammed and water used for production of electricity, for irrigation, and as a source of drinking water (see Brandt, 2000 for a review on the downstream morphological effects of dam construction). The problem of run-off reduction and related reduction in sediment supply is particularly accentuated in rivers of arid and semi-arid zones, where water supplies show large seasonal variations, with low run-off levels during summer months and flooding during the winter. Prominent examples
1 FCMNCIMA, Universidade do Algarve, Campus de Gambelas, 8000-11 7 Faro, Portugal 2 CIACOMARlClMA, Universidade do Algarve, Avenida 16 de Junbo sin, 8700-3 11 OIMo, Portugal
96 Joao M. Alveirinho Dias et al.
are the Nile River in Egypt (e.g. Summerhayes et al., 1978; Frihy, 1988; Stanley et al., 1998), the Colorado River in the USA (e.g. Bowen, Inman, 1966; Carriquiry, Sanchez, 1999), or the Yangtze River in China (e.g. Chen X. et at., 2001; Chen Z. et at., 2001).
The focus of the present study lies on the GuadianaRiver in southwestern Iberia, which has experienced a similar increase
in anthropic influence during the second half of the 20th century (e.g. Brandao, Rodrigues, 2000; Gonzalez et al. , 2001). Our aim is to relate the alteration in volume of sub- and intertidal sand banks within the Guadiana Estuary and adjacent shelf to both natural and anthropic causes, put the historic evolution of the estuarine mouth into this context, and to discuss the implications of these alterations for the estuary--coast- shelfsystem.
REGIONAL SETTING
HYDROGRAPHIC AND CLIMATIC CHARACTERISTICS
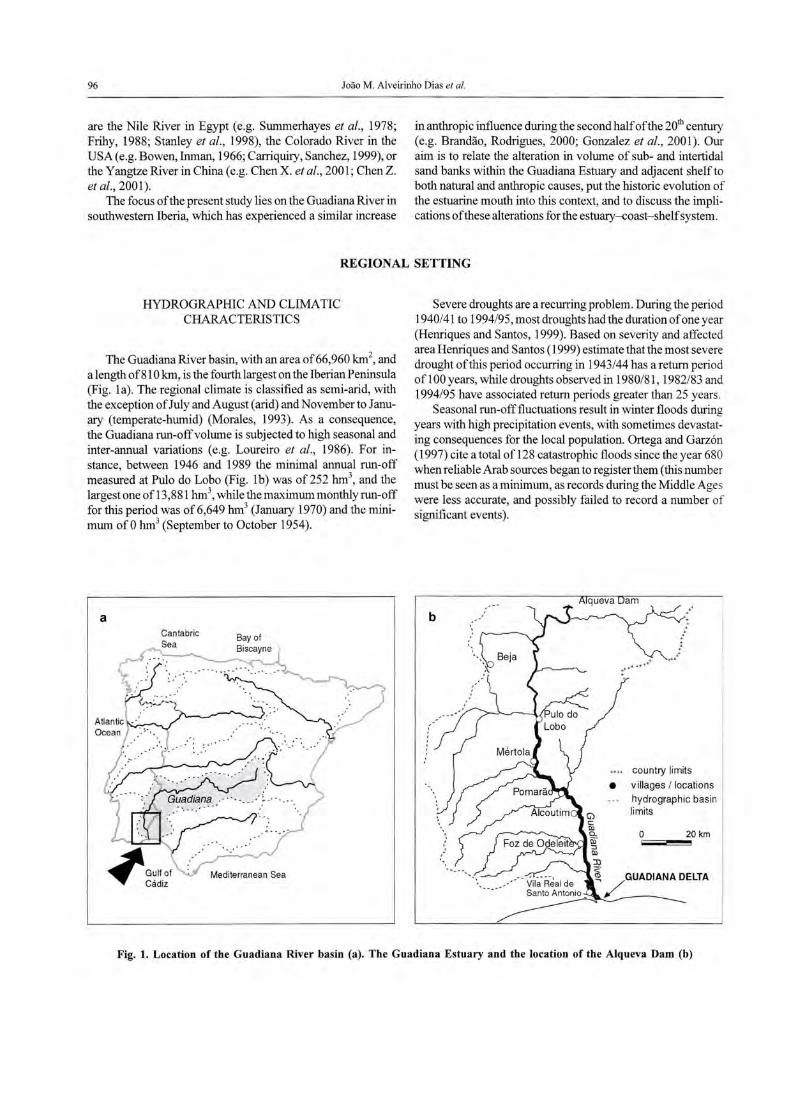
The GuadianaRiver basin, with an area of66,960 km2, and
a length of81 0 km, is the fourth largest on the Iberian Peninsula (Fig. la). The regional climate is classified as semi-arid, with the exception ofJuly and August (arid) and November to January (temperate-humid) (Morales, 1993). As a consequence, the Guadiana run-off volume is subjected to high seasonal and inter-annual variations (e.g. Loureiro et al., 1986). For instance, between 1946 and 1989 the minimal annual run-off measured at Pulo do Lobo (Fig. Ib) was of252 hm3
, and the largest one of13 ,881 hm3
, while the maximum monthly run-off for this period was of 6,649 hm3 (January 1970) and the minimum of 0 hm3 (September to October 1954).
a Cantabric Sea
Severe droughts are a recurring problem. During the period 1940/41 to 1994/95, most droughts had the duration of one year (Henriques and Santos, 1999). Based on severity and affected area Henriques and Santos (1999) estimate that the most severe drought ofthis period occurring in 1943/44 has a return period of 1 00 years, while droughts observed in 1980/81 , 1982/83 and 1994/95 have associated return periods greater than 25 years .
Seasonal run-off fluctuations result in winter floods during years with high precipitation events, with sometimes devastating consequences for the local population. Ortega and Garzon (1997) cite a total of 128 catastrophic floods since the year 680 when reliable Arab sources began to register them (this number must be seen as a minimum, as records during the Middle Ages were less accurate, and possibly failed to record a number of significant events).
b
(j) t:: III Q.
iii' ::J III
JJ
•
.' ."
country limits
villages / locations
hydrographic basin limits
O\;;,;;;;=~~20km
~ /GUADIANA DELTA
Fig. 1. Location of the Guadiana River basin (a). The Guadiana Estuary and the location of the Alqueva Dam (b)

Natural versus anthropic causes in variations of sand export from river basins ... 97
Sm _ . ____ . ' ........ ~.~:.).z'):.: :: .... submerged " _ - .... _ urban areas . '-
~ ~jetty ~~ bedrock
gram
O~, iiiiiiiiiiiiiii~~2km jetty
'--J4
Q'Brii -Bank _
/
I
~ sandy areas L..:::.:.:.::.J (beaches, dunes)
D marsh, lagoons
Fig. 2. Main geomorphological elements of the present day Guadiana Estuary and Delta system
The lower Guadiana River is separated from the upper river basin by the Pulo do Lobo, a near vertical 13 .5 m high waterfall. The estuary begins 15 km down river from this location, at Mertola, the furthest upriver location reached by salt water at spring high tide before the construction of dams (Fig. 1 b). The turbidity maximum is found, depending on the tides, between 20- 35 km up river from the mouth, more or less between Foz de Odeleite and Alcoutim (e.g. Dias, Ferreira, 2001; Fig. 1 b). The Guadiana Estuary is a freshwater-dominated estuary during flood periods, being de Jacto transformed into a river during these periods (Plaza et aZ., 2003), while between spring and autumn the salinity distribution is controlled by tides, with strong vertical mixing occurring during spring tides, and salt-wedge formation during neap tides (Rocha et aZ., 2002).
The river crosses an open coastal plain only in its last 7 km (Fig. 2). This coastal plain is part of an old deltaic plain, dominated by marsh systems formed by the river (Morales, 1997). The mouth of the estuary is a highly dynamic area, with considerable movement of sediments and associated morphological changes. The coastline reached a position close to the present only once about 200 years ago (op. cit.). The western margin of the estuary mouth prograded about 900 m since the beginning ofthe 20th century, 25% of which occurred after the construction of two jetties at the estuary mouth in 1974 (Gonzalez et al. , 2001). During the same period, the barrier island spit marking the eastern margin prograded about 500 m into the main estuarine channel. This westward progradation was accompanied by coastal erosion at a rate of about 3 mlyear since the construction of the jetties (op. cit.).
Tides on the coast adjacent to the estuary are semidiumal mesotidal, with average tidal amplitudes of around 2 m, reaching 3.88 m at spring tides. Tidal currents at the river mouth are about 0.6 mls during peak flood tide, and 1.2 mls during peak ebb tide (InstitUto Hidrogratico, 1998).
The offshore coastal wave regime is primarily dominated by waves from W and SW (approximately 50% of occurrences). The southeastern waves also have a significant influence with ca. 25% of occurrences. The average offshore significant wave height is about 0.9 m, with an average period of 4.6 s, with peak average periods of about 8 s (Costa, 1994). The net annual littoral drift is from W to E. The wave regime results in a net eastward littoral drift, estimated to be, by various authors, in the order of 150,000- 300,000 m3!year in the area of the Guadiana estuary mouth (CEEPYC, 1979; Cuena, 1991; Gonzalez et aZ., 2001; Boski et aZ., 2002).
ESTUARINE MOUTH SAND BODIES
Because of its relatively moderate river outflow levels during summer months compared to tidal currents, the lowermost Guadiana Estuary accumulates sand in its bed and in the vicinity of its mouth during this part of the year, in areas where the current energy decreases below the threshold of movement. These sand banks can grow to a size where they hinder the traffic of vessels, as channels and sand banks can quickly change their location. The O'Bril sand bank at the mouth of

98 Joao M. Alveirinho Dias e/ al.
the Guadiana River is a good example ofthis processes (Fig. 2), and will be used in this paper as a proxy for the behaviour of all sand banks within the lowermost Guadiana Estuary.
The existence of the O'Bril Bank can be reliably traced back to at least 1648, as it appears on a map of the Algarve of this date. It shows a cyclic behaviour, as described by Weinholtz de Bivar (1978) and Morales (1997). The bank grows over the course of a few decades on the western margin of the Guadiana Estuary, rotating east to the distal part of the bank, thus partially blocking the mouth of the estuary. Subsequently, a new river channel usually forms close to the western margin splitting the bank into two (or more) segments. This new channel widens in time, initiating a migration of the bank towards the eastern estuary margin. Eventually, the sand bank will attach itself onto the eastern, Spanish shoreline. From here, the remnants of the sandbank slowly erode. The sand is either transported downdrift eastwards, or amalgamated to the coastline. This cycle has occurred several times over the past few hundred years.
KEY POINTS OF ANTHROPIC PRESSURE
The Guadiana River basin has been under growing pressure from anthropic activity. Since Roman times, and particularly the late 19th century, the region has been exploited by mining activities (e.g. Gonyalves, 1988; Garcia, 1996), with lasting impact on vegetation, as large amounts of wood were used for the calcination of ores (Garcia, 1996). Another key anthropic factor responsible for the deterioration of vegetation cover in the river basin was the so-called campanha do trigo (= wheat campaign), an isolationist attempt for self-support ofthe country in the thirties . During this "wheat campaign", huge areas in the interior of the Iberian Peninsula were deforested and used for agricultural purposes. The result was a large increase in soil erosion, resulting in an increase in sedimentation near the estuary mouth between 1938 and ca. 1945 (Gonzalez et at., 2001).
From the 1950s onwards, the river and its tributaries have been increasingly affected by the construction of dams (Fig. 3). Furthermore, large amounts of water have been used for irrigation(Fig. 3). Until 1992 about 9,000 hm3 of water per year were stored in dam lakes, while water used for irrigation reached vol-
12 12 [ 1 0~. __ . __________________ ~~~N.~A~O~.I~n~de~x~ _____ ~ 10
I
ME 81 'b 6! ..- I
..?$. 4 .-Q) I
E
river Volume
.• -----.--~ 8
. i 6
:J 21
~ Ol-+- H'-"'r-l-l---'-I > ·c
I -4 1 ~
i -6 !-.-_~ ... --.-.--,--,---.------,.-_. -_. - ... ·6
1950 1 960 1970 1 980 1990 2000
time (years)
Fig. 3. Volume of water stored in dams in the Guadiana River Basin and amount of water used for irrigation
(no data after 1992 available) (after Loureiro et aI., 1986; CHG,1994)
urnes of around 1,100 hm3/year (CHG, 1994). The inauguration of the Alqueva barrage complex in February 2001, covering an area of ca. 250 km2
, and retaining a maximum capacity of 4,150 x 106 m3 (expected normal volumes are of 3,150 ~ 106 m3), has created the largest artificial lake in western Europe . With the inauguration of this dam, the volume of water that can be retained in dam lakes in the river basin has increased to about 13,000 hm3/year (Fig. 3).
The estuary mouth morphology itself has been heavily influenced by the construction of two large jetties in 1974. the western one with a length of2,090 m, and the eastern submerged jetty with a length of 900 m (see location on Fig. 2) (Gonzalez et at., 2001). The construction of this set of jetties. and others along the southern coast of Portugal has probably led to significant inhibition of the westward littoral drift (e.g. Dias, 1988; Gonzalez et at. , 2001), thus reducing this source of sand, and/or altering its rhythm of supply.
MATERIAL AND METHODS
The Guadiana River discharge levels are for the periods between 1946 and 2000 at Pulo do Lobo (see location on Fig. 1), as available from the INAG (Instituto Nacional da Agua - Portuguese National Institute for Water) web site (http: //snirh.inag.pt/). For the correlation with the North Atlantic Oscillation (NAO), the Winter version of the NAO index computed with pressure data from Lisbon was used; the data was extracted from www.cgd.ucar.edu:80/cas/climind/ nao winter.htrnl.
The extension of the O'Bril Bank was based on the area enclosed by the Portuguese hydrographic zero (2 m below mean sea level), as seen on bathymetric map reproductions published in Weinholtz de Bivar (1978). The maps were georeferenced by ERMapper 6.0 using a series of geographic tiepoints . The projection used is UTM (Datum Lis
bon, Castelo de Sao Jorge) .

Natural versus anthropic causes in variations of sand export from river basins .. . 99
RESULTS
CORRELATION OF THE RIVER VOLUME WITH THE NAO
A plot comparing the NAO Winter Index with the Guadiana River winter run-offvolume between 1946 and 1999 is shown on Figure 4. The data show a strong negative correlation (r = -0.76) between the negative NAO Winter Index and winter flooding events in the Guadiana River basin. Equally, several periods with successive positive NAO indices, particularly 1972-1975, 1980-1983, and 1988-1994 correspond to periods of low river run-off, and in the case of the years 1980/81, 1982/83 and 1994/95, with extreme droughts.
12 , 12
10 ___________ __=_ NAO ~'2';l~ ___ 10
~ 8
'" } 6i o .
-6 1-- ---
1950 1960
- r iver volume
1970 1980 1990
time (years)
8
- 6 z
413 :::J
20-, CD I x
-2
, -4
-6 2000
Fig. 4. Compar ison of the NAO Index and the Guadiana River volume for the second half of the 20th century
a 4000
3500
3000
~ .s 2500 <ll E 2000 :::J "0 >
~ 1500 ·c
1000
500
0 8/3151 1313/5 1 18/3/51 23/3/51 28/3/51
time (days)
214151
ANTHROPIC AL TERA TION OF FLOOD STYLE AND FREQUENCY
Until about 1955, the Guadiana River basin was virtually unhindered by dam structures, with the exception of some very minor constructions in the upper river basin, two of which dates back to Roman times. At present, the high level of river damming, regulating about 81 % of the Guadiana River catchment area after the inauguration of the Alqueva dam in February 2001 (Rocha et al., 2002), has a large influence not only on frequency but also on style of floods in the river basin.
The dam construction began to have a significant influence on natural flood patterns from the mid-sixties onwards. This can easiest be seen ifthe correlation ofNAO Winter Indices with the run-off regime is compared before and after dam construction. The negative correlation of negative NAO with flood frequency is r = - 0.8 1 for the period from 1946 to 1964, and is reduced tor=-O.72 for the period from 1964 to 1998.
Figure 5 shows two typical, comparable flood events measured at Pulo do Lobo. During both floods the river volume peaked between 3,600 and 3,800 m 3/s. The event from March 1951 is characteristic for pre-dam building floods. The flood lasted 13 days (the cut-off point being a drop of the river volume below 500 m3 Is). The build-up was stepped, lasting 5 days, as tributaries fill up after rain falls and flood levels increase as their water reaches the main river channel (Fig. 5a).
The flood of February 2001 shows a typical flood after dam building (Fig. 5b). (note that at this point the Alqueva Dam was not yet inaugurated). The flood lasted 10 days . Water level increased virtually over night, from the 6th to the 7th of February, as dam floodgates were opened when water levels in dam lakes reached critical levels.
b 4000
3500
3000
2500
2000
1500
1000
500
0 2911/01 312101 8/2/01 1312101 18/2/01 2312/01
time (days)
Fig. S. Two flood events of comparable magnitude, measured at Pulo do Lobo
100
Spain
J030 M. Alveirinho Dias et al.
The ratio between build up and decay time ofthe 1951 flood is 0.625, i.e. the decay lasted approximately twice as long as the build up. In comparison, the same ratio is about 0.05 for the 2001 · flood, if half a day for its build up is considered.
Portugal
o
Atlantic Ocean
1km
a
Portugal
c
o 2 km
Spain
Q'Bril Bank
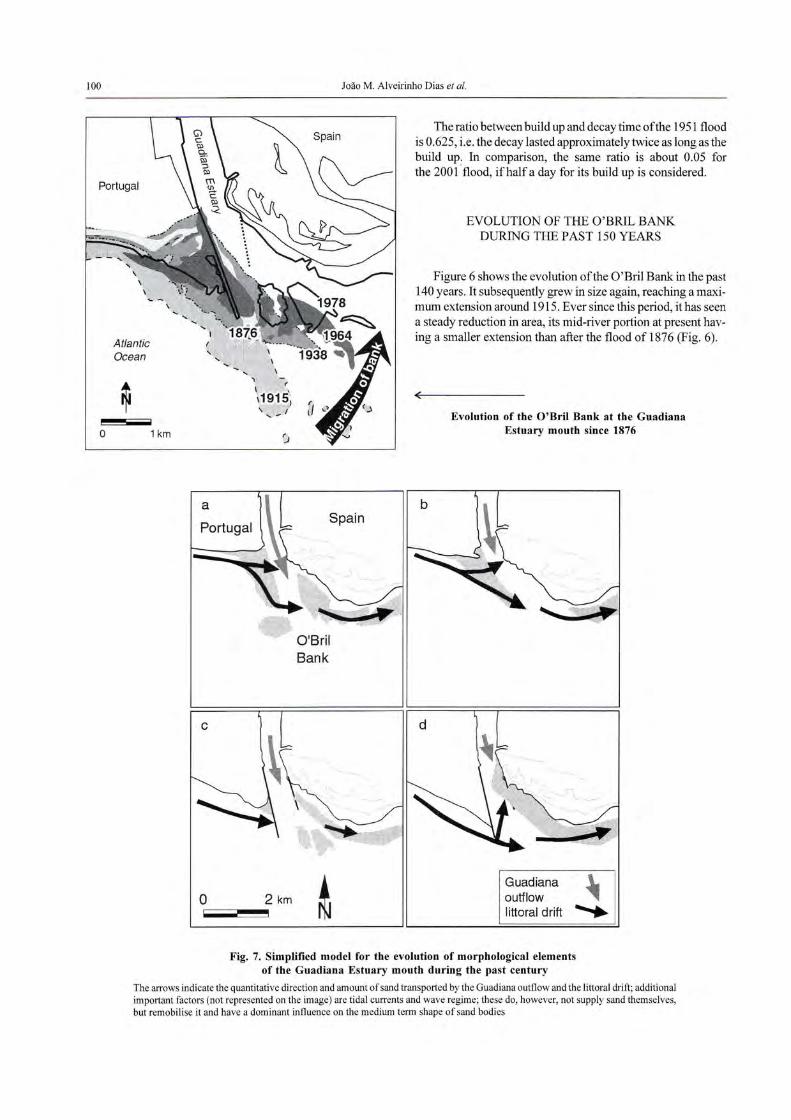
EVOLUTION OF THE O'BRIL BANK DURING THE PAST 150 YEARS
Figure 6 shows the evolution of the O'Bril Bank in the past 140 years. It subsequently grew in size again, reaching a maximum extension around 1915. Ever since this period, it has seen a steady reduction in area, its mid-river portion at present having a smaller extension than after the flood of 1876 (Fig. 6).
(
b
d
Evolution of the O'Bril Bank at the Guadiana Estuary mouth since 1876
Guadiana outflow littoral drift
Fig. 7. Simplified model for the evolution of morphological elements of the Guadiana Estuary mouth during the past century
The atTOWS indicate the quantitative direction and amount of sand transported by the Guadiana outflow and the littoral drift; additional impOltant factors (not represented on the image) are tidal currents and wave regime; these do, however, not supply sand themselves, but remobilise it and have a dominant influence on the medium term shape of sand bodies

Natural versus anthropic causes in variations of sand expOlt from river basins ... 101
The O'Bril Bank reached a minimum extension after the catastrophic flood of January 1876 (the largest in historic times), when river levels rose to about 50 m above low-tide
level in Pomarao (Fig. 1). During the flood the sand bank was almost completely flushed out onto the shelf(Fig. 6). The bank was left with a subtidal area of approximately 0.8 km2 on the Portuguese side, and a total of2.7 km2 including the sand bars on the Spanish side.
In 1915, the bank had reconstituted itself, with an area of 3.7 km2 on the Portuguese side and 5.9 km2 as a whole (Fig. 6) . Subsequently, the size of the O'Bril Bank showed a continuous decrease, losing approximately 48 m2/year in area. Simultaneously, it began rotating northwards (Fig. 6). This process was accelerated after the construction of the jetties in 1972-1974. On the map of 1978, the O'Bril Bank is smaller than after the great flood of 1876, with a size of 0.6 km2 on the Portuguese side, respectively 1.3 km2 including the Spanish side (Fig. 6). The speed of northward rotation of the bank was found to be irregular. It was quickest between 1915 and 1938 with 65 m/year, slowed down to 19 m/year between 1938 and 1964, and increased slightly to 22 m/year between 1964 and 1978. Figure 7 summarises the main acting forces at the estuary mouth and their change in the past 140
years (after Gonzalez et al. , 1999). Figure 7a shows the estuary mouth at the beginning of the 20th century. Sand was supplied by littoral drift and river. The interaction of river flow, tides, and waves led to the above described accumulation of sand and migration patterns. With the reduction in sand supply by river outflow since the mid-fifties (Fig. 7b), the main sand supplier for the sand body became the littoral drift. As the power offloods flushing sand onto the inner shelf was reduced, the sand body saw a strong growth and eastward rotation. The western margin of the Guadiana prograded significantly and saw the growth of an extensive dune field (Gonzalez et al., 2001). To alter sand migration paths across the main estuarine channel and to inhibit the obstruction of (international) shipping ways , two jetties were built in 1972-1974, leading to a strong reduction in the size of the sand bank (Fig. 7c). However, as a consequence of the infilling of the area to the west of the western jetty, and an even more drastic reduction in river outflow and flood frequency, the river mouth is experiencing at present a beginning of sand carried by the littoral drift bypassing the jetty, and a strong accumulation of sand on the eastern estuarine margin (Fig.7d).
DISCUSSION AND CONCLUSIONS
As Viles and Goudie (2003) state, geomorphologists have long argued whether it is possible to untangle the various internal and external forcing factors that cause geomorphic response. This problem is exacerbated by the interconnection of factors such as anthropic behaviour and climatic forcing, where large-scale human activity can be triggered by clecadal climatic trends.
Over the past century, human activity has seen a large shift, completely altering its influence into sedimentation patterns in the river basin. While the late 19th and early 20th
, as well as the 1930s, were dominated by large-scale deforestation, thus dramatically increasing sediment yield in the river basin (cf. Gonzalez et al., 2001), the second half of the 20th century saw a large-scale shutdown of sediment transport by damming in of about 81% of the river basin.
While the large flood of 1876 does not seem to be directly connected to a particularly strong negative NAO index, the subsequent unusually large build up of the O'Bril Bank until 1915 is probably linked to the long positive NAO period from 1904-1915 : Between 1903 and 1914, the NAO Winter Index was positive, only turning negative in 1915 with a value of -0.20. The average NAO Winter Index during this period was
of 1.54, varying between 0.00 and 3.89. The period between approximately 1950 until 1969 saw then a steady decrease in the index, with pronounced flooding occurring in the river basin throughout the 1960s. Between 1958 and 1971, there were only two years with a positive NAO winter index (1961 and 1967). The average NAO Winter Index during this time was - 1.57, with a variation between 1.8 (1961) and -4.89 (1969). This period coincided with a steady decrease of the O'Bril Bank. Simultaneously, the western margin of the Guadiana River mouth, which can be considered the root of the bank, saw a steady increase and progradation (Gonzalez et al., 2001).
During the 1980s and 90s, a long series of increasing positive NAO winter indices, resulting in a low number of floods has coincided with the most far-reaching damming in the river basin (it is no coincidence that 3 exceptional drought periods with a statistical return period of25 years occurred during this period). Between 1980 and 1995, there were only two years with a negative index (1985 and 1987). The average index for these years was 1.84 (varying between - 0.75 and 5.08). Between 1989 and 1995, when there were large scale droughts in the southern central portion of Iberia, the index was always positive, averaging 3.29.

102 Joao M. Alveirinho Dias e/ al.
REFERENCES
BOSKI T ., MOURA D., VEIGA-PIRES C., CAMACHO S., DUARTE D., SCOTT D.B., FERNANDES S.G., 2002 - Postglacial sea-level rise and sedimentary response in the Guadiana Estuary, PortugaVS pain border. SedimentGlY Geology, 150: 103- 122.
BOWEN A.J., INMAN D.L., 1966 - Budget of littoral sands at Point Arguello, California. Tech. Memo. , 19, CERC, US Army, Fort Belvoir, Va.
BRANDAo C., RODRIGUES R., 2000 - Hydrological simulation of the International catchment of Guadiana River. PhYSics and Chemistry of the Earth (B), 25, 3: 329- 339.
BRANDT S .A., 2000 - Classification of geomorphological effects downstream of dams. CATENA, 40: 375-401.
CARRIQUIRY J.D. , SANCHEZ A., 1999 - Sedimentation in the Colorado River delta and Upper Gulf of California after nearly a century of discharge loss. Marine Geology, 158: 125- 145 .
CEEPYC, 1979 - Plan de estudio de la dimimica 1itoral de la Provincia de Huelva. Inform Direcci6n General de Puertos y Costas, Madrid.
CHEN X., ZONG Y., ZHANG E., XU J. , LI S., 200 1 - Human impacts on the Changj iang (Yangtze) River bas in, China, with special reference to the impacts on the dry season water discharges into the sea. Geomorphology, 41 , 2/3: 111- 123 .
CHEN Z., Li J. , SHEN H., ZHANGHUA W., 200 1- Yangtze River of China: historical analysis of discharge variability and sediment flux. Geomorphology, 41 , 2/3: 77-91.
CRG, 1994 - Plan Hidrol6gico 1. Confederaci6n Hidrognifica del Guadiana.
COSTA C., 1994 - Wind-Wave Climatology of the Portuguese Coast. Final Report of Sub-Project A. NATO PO-WAVES Report 6/94-A.
CUENA G.J. , 199 1- Proyecto deregeneracion de las playas de Isla Cristina. Servicio de Costas, MOPT. Unpubl. report.
DIAS J .M.A. FERREIRA 0, 2001 - Projecto EMERGE - Estudo Multidisciplinar do Estmirio do Rio Guadiana. Unpubl. project report.
DIAS J.M.A., 1988 - Aspectos geologicos do litoral Algarvio. Geonovas, 10: 113- 128.
FRIRY O.E, 1988 - Nile Delta shoreline: Aerial photographic study of a 28-year period . J Coastal Research, 4, 4: 597- 606.
GARCiA J.C., 1996 - A Navegayao no Baixo Guadiana durante o Ciclo do Minerio (185 7- 191 7). Ph.D. Thesis, University of Porto.
GONCALVES V.S., 1988 - Megalitismo e metalurgia no Alto
Algarve Oriental: uma aproximayao integrada. Ph.D. Thesis, University of Lisbon.
GONZALEZ R., DIAS J.M.A., FERREIRA 0., 1999 - Evoluyao recente da margem oeste do Rio Guadiana. In: Os Estuarios de Portuga l e os Pianos de Bacia Hidrografica: 147-158. EUROCOAST, Portugal.
GONZALEZ R., DIAS J.M.A., FERREIRA 0., 2001 - Recent rapid evolution of the Guadiana Estuary (Southern Portugal/Spain). J Coastal Research sr, 34: 516- 527.
GOODESS C.M., JONES P.D., 2002 - Links between circulation and changes in the characteristics of Iberian rainfa ll. Intern. J Climatology, 22,13: 1593-1615 .
GOY J.L. , ZAZO C. , DABRIO C.J. , 2003 - A beach-ridge progradation complex reflecting periodical sea. level and climate variability during the Holocene (Gulf of Almeria, Western Mediterranean). Geomorphology, 50: 25 1- 268 .
HENRIQUES R., SANTOS MJ., 1999 - Regional drought distribution model. Physics and Chemistry of the Earth (B), 24, 1/2: 19-22.
HURRELL J.W., 1995 - Decadal trends in the North Atlantic Oscillation and re lationships to regional temperature and precipitation. Science, 269: 676- 679.
INSTlTUTO HlDROGlliICO, 1998 - Tidal Charts 1999, Vol. I. JONES P.D., JONSSON T. , WHEELER, D., 1997 - Extension to
the North Atlantic Oscillation using early insh'umental pressure observations from Gibraltar and South-West Iceland. Int. J Climatol., 17, 1433- 1450.
LOUREIRO J.J .M., NUNES M.N ., MACHADO M., 1986 - Bacia hidrogn'tfica do rio Guadiana. Monografias Hidrol6gicas dos Principais Cursos de Agua de Portugal Continental, M.P.A.T. ,
S.E.A.R.N. Direcyao Geral dos Recursos e Aproveitamentos Hidraulicos: 341 -407.
MAAS G.S ., MACKLIN M.G., 2002 - The impact of recent climate change on flooding and sediment supply within a Mediterranean mountain catchment, southwestern Crete, Greece. Earth Surface Processes and Landforms, 27, 10: 1087-1105 .
MORALES J.A. , 1993 - Sedimentologia del estuario del Guadiana
(S.W. Espana- Portugal). Ph.D . Thesis, Sevilla, Spain, U niversity of Sevilla.
MORALES J.A., 1997 - Evolution and facies architecture of the mesotidal Guadiana River delta (S. W. Spain- Portugal). Marine Geology, 138: 127- 148.
ORTEGA J.A. , GARZON G., 1997 - Inundaciones hist6r icas en el rio Guadiana: sus implicationes climaticas. Cuaternario Iberico: 365- 167 .
PLAZA F., DIAS J. M.A., V ARGAS-YANEZ M., GONZALEZ R. DA SILVA AJ. , 2003 - Variability of the Guadiana Estuary Circul ation. 4th Symposium on the Iberian Atlantic Margin. Vigo, July 2003.
RIMBU N., BORONEANT C., BUT A c., DIMA M., 2002 - Decadal variability ofthe Danube River flow in the lower basin and its relation with the North Atlantic Oscillation. Intern. J Climatology, 22, 10: 11 69- 11 79.
ROCHA C., GAL V Ao H., BARBOSA A., 2002 - Role oftrans ienr silicon limitation in the development of cyanobacteria blooms in the Guadiana estuary, south-western Iberia. Marine Ecology Progress Series, 228: 35-45 .
ROGERS J .c., 1997 - North Atlantic storm track variability and its association to the North Atlantic Oscillation and climate vari ability of Northern Europe. J Climate, 10,7: 1635-1647.
STANLEY D.J., NIR Y. , GALILI E., 1998 - Clay mineral distribution on interpret Nile cell provenance and dispersal: III. Offshore margin between Nile delta and Northern Is~ael. J Coastal Research, 14, I: 196- 217.
SUMMERHAYES C.P., SESTINI G., MARKS N., 1978 - Ni le Delta: Nature and evolution of continental shelf sediments. Marine Geology, 27: 43- 65.
UPPENBRIK J., 1999 - The North Atlantic Oscillation. Science, 283: 948-949.
VILES H.A., GOUDIE A.S. , 2003 - Interannual, decadal and multidecadal scale climatic variability and geomorphology. Earth-Science Reviews, 61 , 112: 105- 13 1.
VISB EC K M. , 2000 - The North At lanti c Oscillation . http://www. ldeo.columbia.eduINAO
WEINHOLTZ de BIVAR M., 1978 - Rio Guadiana, Elementos
para 0 estudo da evoluyao da sua desembocadura. Direcyao Geral de Portos.