natural gas pathways - stanford university gas pathways: ... promoting deployment of natural ......
TRANSCRIPT
Natural Gas Pathways: Towards a Clean and Renewable Energy Future for California Southern California Gas Company 2016

California’s Dual Emissions Challenge Federal Clean Air Act and California Climate Change Initiative
Measures to Reduce Smog and GHG Emissions Drive Today’s Energy and Environmental Agenda
Natural Gas will Play an Increasing Role as a Solution
FEDERAL CLEAN AIR ACT Reduce SMOG by
50-60% before the next 20 years
CA CLIMATE GOALS (AB32) GOVERNOR’S EO: By 2050, reduce GHG emissions to
80% of 1990

THE TRANSPORTATION SECTOR
80% of the region’s SMOG
Nearly 40% of its GHG emissions
We have a CLEAR FOCUS
Major Ozone (NOx) Emissions Sources in South Coast Air Basin
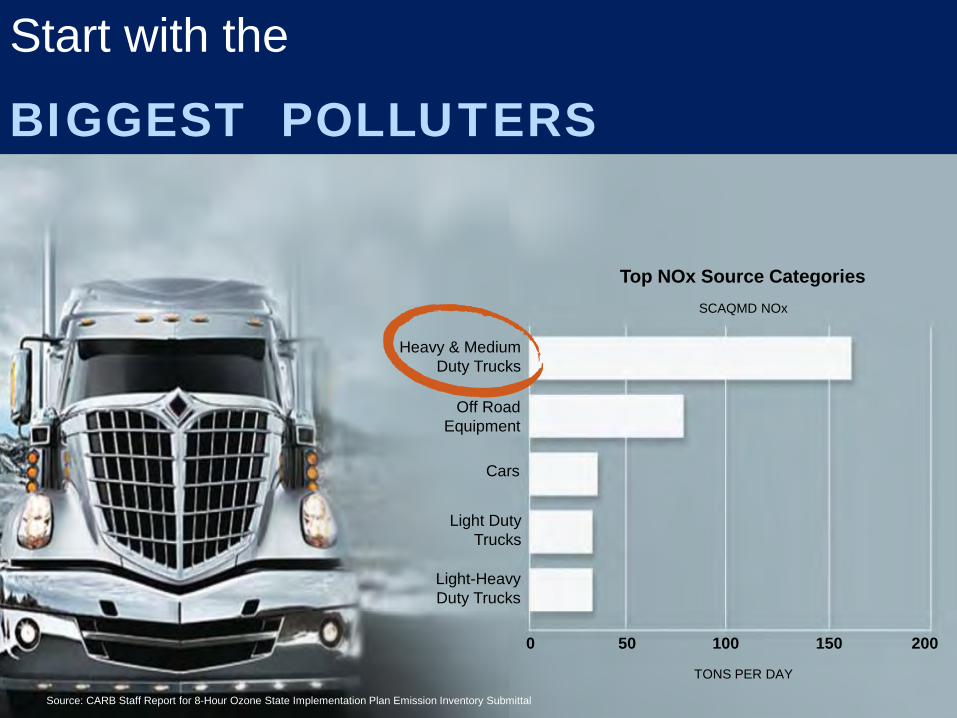
Heavy & Medium Duty Trucks
Off Road Equipment
Cars
Light Duty Trucks
Light-Heavy Duty Trucks
0 50 100 150 200
TONS PER DAY
SCAQMD NOx
Top NOx Source Categories
Source: CARB Staff Report for 8-Hour Ozone State Implementation Plan Emission Inventory Submittal
Start with the
BIGGEST POLLUTERS

• Heavy Duty truck engine with 90% lower NOx emissions TODAY
• Tailpipe emissions are the same as emissions from generating electricity to run a similar electric truck
• For Goods Movement, this truck will meet California’s ambitious 2050 targets decades before any other technology
• RNG already delivering greatest GHG reductions from diesel TODAY?
NGV Game Changer: NEW “NEAR-ZERO” TRUCK ENGINE TO BE READY FOR PRIME TIME
Renewable Natural Gas as Transportation Fuel
> 80% GHG reduction
Near-Zero Emissions Natural Gas Engine
<0.02 g NOx 90% NOx reduction

Technology Transfer and Transportation Pathways
Locomotives Short/Long
Haul
Transit/Fleet Vehicles
Off-road High Horsepower/ Construction Equipment
Marine Vessels Heavy Duty Trucks
Short/Long Haul
CNG LNG
Current Focus Expanding Focus
SoCalGas’ Transportation Pathway focuses on natural gas vehicles in heavy duty sectors, which represent the largest share of both ozone/greenhouse gas problem. Technology transferrable to other sectors:

» 63 LNG vessels in operation worldwide and increasing
» 76 LNG vessels on order worldwide and increasing
» Multiple recent trade journal announcements of new LNG vessels under contract at shipyards, e.g. July 2015 20 LNG-ready Valemax ore carriers on
order $2.3bn Company, Exmar LNG, created;
one-stop shop along the LNG value chain integrating liquefaction, shipping and regasification assets
» IMO-required reduction of bunker fuel sulfur content is the predominant global driver of LNG adoption
"I think the early adopters can drive forward LNG infrastructure…" Roger Frizzell, Carnival Cruise, June 18, 2015
OGV Sector is Signalling for LNG Infrastructure
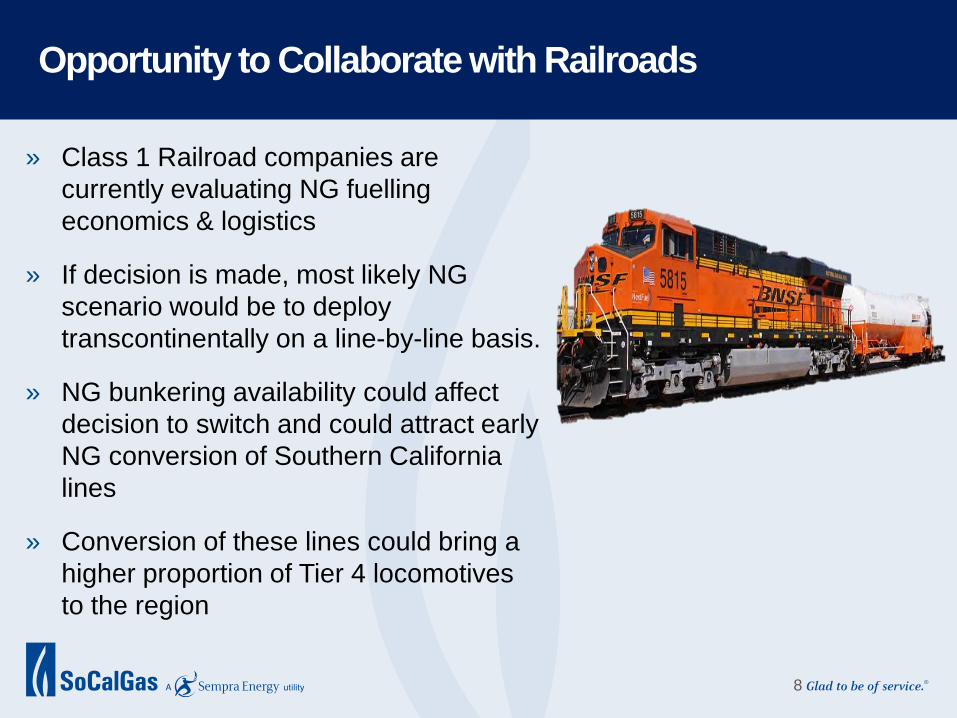
» Class 1 Railroad companies are currently evaluating NG fuelling economics & logistics
» If decision is made, most likely NG scenario would be to deploy transcontinentally on a line-by-line basis.
» NG bunkering availability could affect decision to switch and could attract early NG conversion of Southern California lines
» Conversion of these lines could bring a higher proportion of Tier 4 locomotives to the region
8
Opportunity to Collaborate with Railroads

California is Planning to Meet Criteria Pollutant Goals: HEAVY-DUTY VEHICLE SECTOR
CARB Mobile Source Strategy follows a low NOx path for heavy-duty trucks from 2015 to 2030
SCAQMD calls for near zero emission heavy-duty vehicles
SJVAPCD adopted an action plan promoting deployment of natural gas vehicles and infrastructure
"In contrast, deployment of 350,000 electric trucks over the next 15 years would require technology development and cost that are well beyond what will be needed to deploy low-NOx trucks.“
“In Southern California, clean, zero- and near-zero emission vehicle
technologies are critical to meeting clean air standards. Cummins Westport’s new engine
provides an important tool toward reaching that goal.”
“Heavy-duty natural gas vehicles provide fewer barriers to adoption than electric/hybrid.”

10
6 t/d STATIONARY
SOURCES
3 t/d ENERGY
EFFICIENCY
6 t/d STATIONARY
SOURCE INCENTIVES
79 t/d ON-ROAD / OFF-ROAD
CLEANER TECHNOLOGIES
3 t/d HDV
INCENTIVES
1 t/d VESSEL
AT-BERTH
1 t/d ON-ROAD / OFF-ROAD
AQMP Relies on Incentives for 85% of All Emissions Reductions Needed by 2023: SCAQMD CURRENT SIP/AQMP “FAIR SHARE” STRATEGY FOR 80 PPB
24 t/d CLEANER SHIPS, TRAINS, OTHER
FEDERAL SOURCES
LOCAL MOBILE
SOURCES TBD
Incentive Programs

• The “centerpiece” of the mobile source strategy, a federal HD standard of 0.02 g/brake hp-hr., will not start until 2023
• Incentives must be used prior to 2023
CARB Mobile Source Strategy -- Relies on Incentive Programs: HEAVY-DUTY VEHICLE SECTOR
of new heavy-duty on-road NOx emissions reductions come from incentive programs without funding
REDUCTIONS BY 2023
of new NOx emissions reductions come from incentive programs

12
Natural Gas in Heavy Duty Transportation Sector Can Deliver: 33% NOx reduction (17 TPD) by 2023
Econometric Modeling (NPC Model) Strategy
• Fuel price savings drive natural gas technology adoption by the heavy-duty trucking sector.
• Financial incentives ($15-30K/vehicle) can accelerate and increase the adoption of conventional natural gas technologies, helping air districts (especially South Coast and San Joaquin Valley) meet ozone deadlines.
• Additional financial incentives (<$10K/vehicle) can shift conventional natural gas technology purchases to “NZE” natural gas purchases, maximizing NOx reductions.
• For LA area, NZE incentive period (2018-2023) can deliver 33% NOx reduction (17 TPD) by 2023. Continued NZE adoption program can deliver a 63% reduction (30 TPD) by 2032 in LA area.
SoCalGas Incentives Study (2015) -- Potential for Significant NOx Reductions

In-State Heavy-duty Truck Fleet Composition 1- Incentivized2 Purchases -
52
47
35
17
0
10
20
30
40
50
60
70
0
100,000
200,000
300,000
400,000
500,000
600,000
700,000
800,000
2015
2016
2017
2018
2019
2020
2021
2022
2023
2024
2025
2026
2027
2028
2029
2030
2031
2032
2033
2034
2035
NO
x Em
issi
ons (
tpd)
Vehi
cle
Popu
latio
n
NZE NGV (0.02 g/hp-hr NOx)Conventional NGV (0.2 g/hp-hr NOx)DieselGasolineReference NOxRemaining NOx (Scenario)
-33% -63%
Incentives for Near-Zero Emissions Heavy-Duty Trucks Can Deliver Substantial Emission Reductions
Note: 1. Analysis includes T7 Drayage, T7 Single, T7 Solid Waste Collection Vehicle, T7 Tractor, T7 Tractor Construction, T7 Agriculture, T7 Single Construction, T7 Public, T7 Utility, T7 IS, T6 Instate Heavy, T6 Instate Small, T6 Utility, T6 Public, T6 TS, T6 Agriculture, T6 Instate Construction Heavy, T6 Instate Construction Small, LHDDT, and LHDGT. 2. Maximum incentives range from $15,500 - $35,000/Truck depending on the vehicle type and engine size 3. Assumed penetration rates after the incentive period ends remain at the 2023 level due to further regulatory or other mechanism
In-State Heavy Duty Truck Fleet Composition1-Incentivized2 Purchases

Comparison of Truck Deployment and Benefit ($500 million investment)
Source: “Game Changer Technical Report,” Figure 4, May 2016

0%
10%
20%
30%
40%
50%
60%
70%
80%
90%
100%
2010 2020 2030 2040 2050
Rem
ain
ing
Em
issi
on
s R
elat
ive
to 2
01
0
15
2050 CARB Statewide
GHG Target
75 ppb ozone standard
Current State GHG Pathway -- Focused on Electrification Will Miss Ozone Deadlines
80 ppb ozone standard
Reductions need
to be achieved
Faster & Sooner than current
statewide GHG
reduction goals
CA Statewide CO2 South Coast Target NOx Reduction necessary to meet Federal Ozone Standards
Use of Natural Gas
in Transportation
Sector can help
achieve ozone
standard sooner
South Coast Air Quality Management District
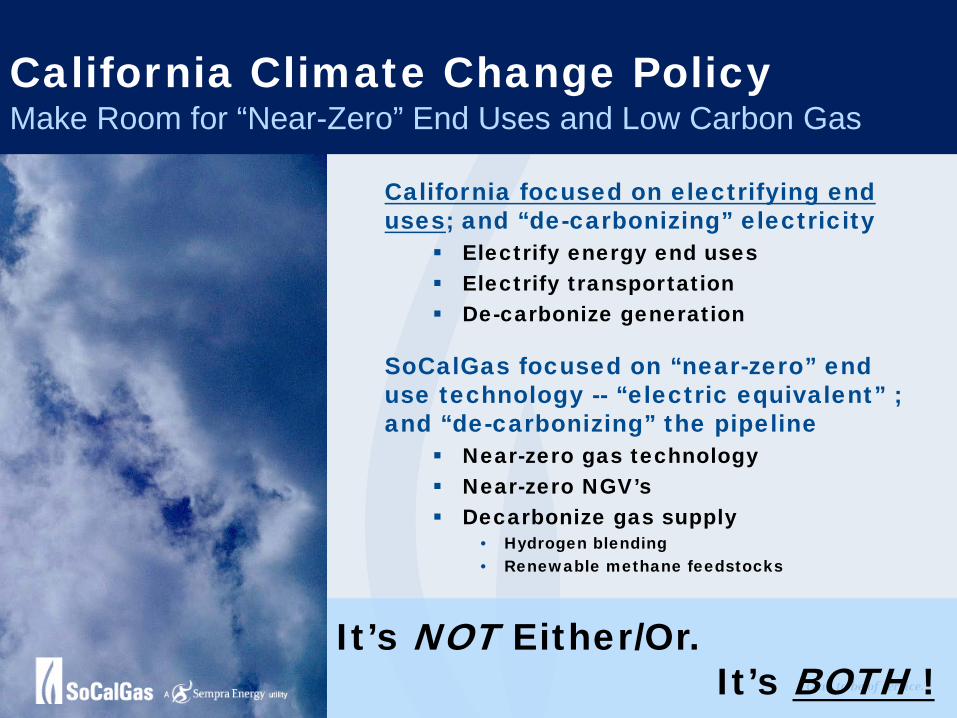
It’s NOT Either/Or. It’s BOTH !
California focused on electrifying end uses; and “de-carbonizing” electricity
Electrify energy end uses Electrify transportation De-carbonize generation
SoCalGas focused on “near-zero” end use technology -- “electric equivalent” ; and “de-carbonizing” the pipeline
Near-zero gas technology Near-zero NGV’s Decarbonize gas supply
• Hydrogen blending • Renewable methane feedstocks
California Climate Change Policy Make Room for “Near-Zero” End Uses and Low Carbon Gas
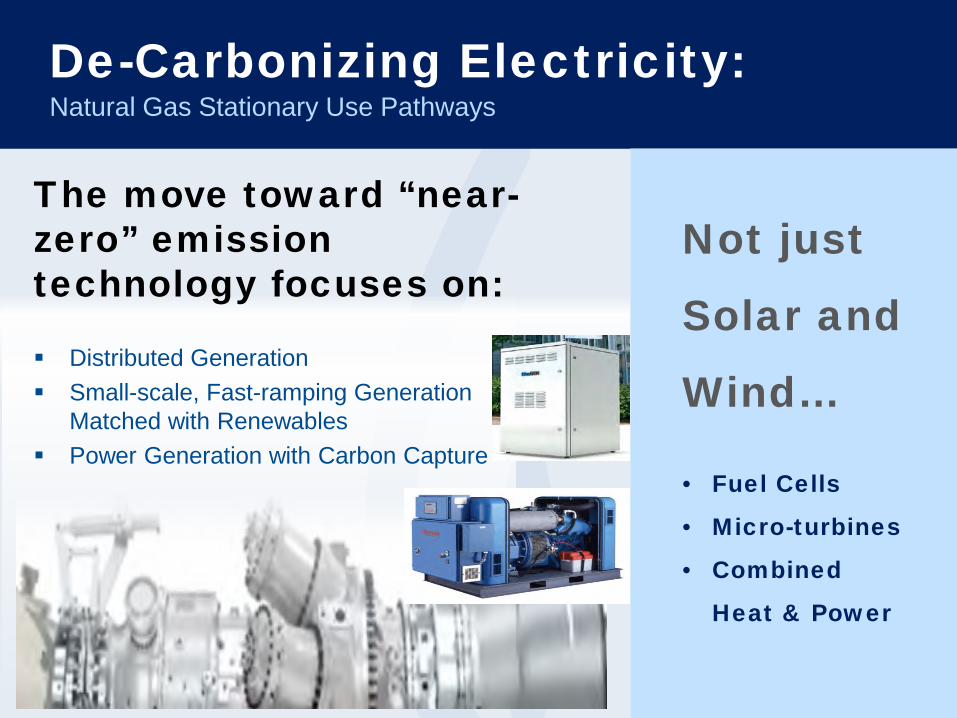
The move toward “near-zero” emission technology focuses on:
Distributed Generation Small-scale, Fast-ramping Generation
Matched with Renewables Power Generation with Carbon Capture
De-Carbonizing Electricity: Natural Gas Stationary Use Pathways
Not just
Solar and
Wind…
• Fuel Cells
• Micro-turbines
• Combined
Heat & Power

De-Carbonizing the Pipeline: Waste or Biomass To Hydrogen or Biomethane
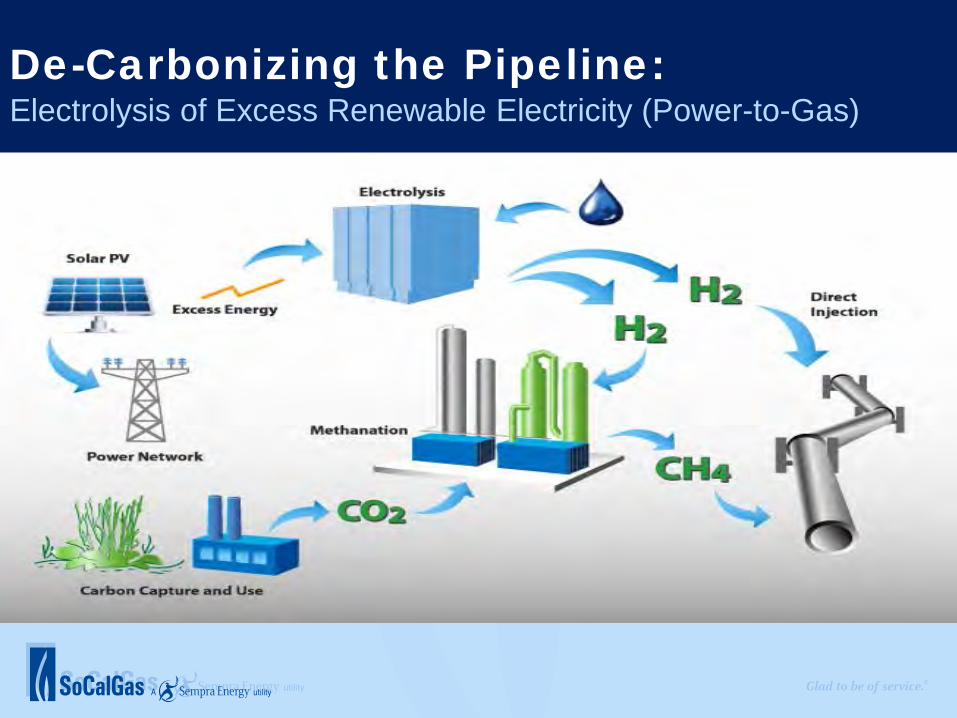
De-Carbonizing the Pipeline: Electrolysis of Excess Renewable Electricity (Power-to-Gas)
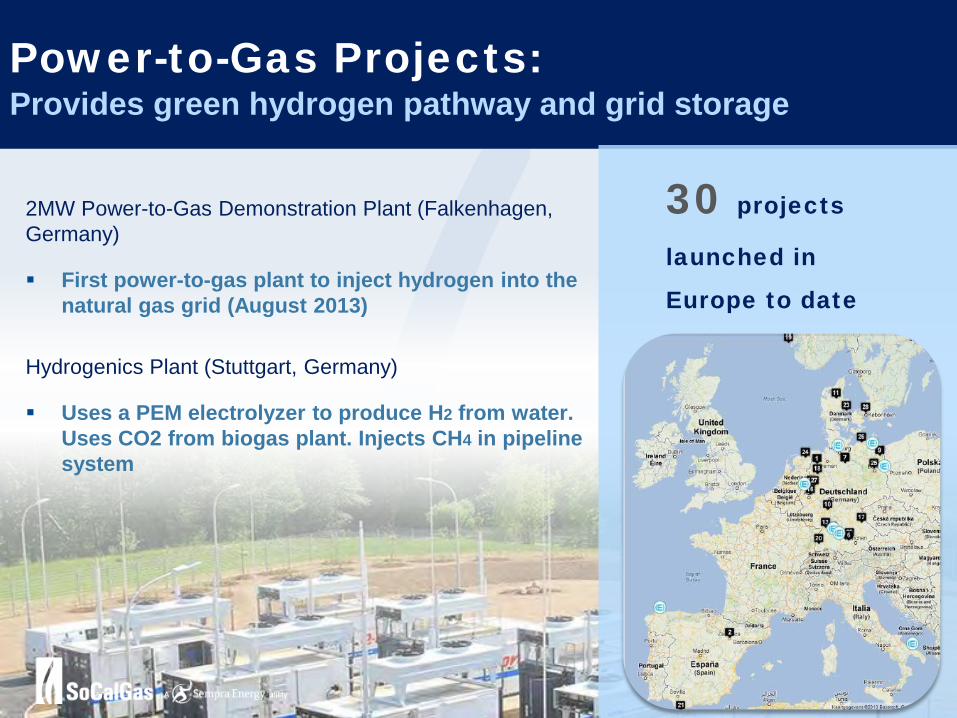
2MW Power-to-Gas Demonstration Plant (Falkenhagen, Germany)
First power-to-gas plant to inject hydrogen into the natural gas grid (August 2013)
Hydrogenics Plant (Stuttgart, Germany)
Uses a PEM electrolyzer to produce H2 from water. Uses CO2 from biogas plant. Injects CH4 in pipeline system
Power-to-Gas Projects: Provides green hydrogen pathway and grid storage
30 projects
launched in
Europe to date

German Energy Agency on Power-to-Gas: “System Solution”
• DENA Website (German Energy Agency)
With the Power-to-Gas Strategy Platform, the Deutsche Energie-Agentur GmbH (dena) – the German Energy Agency – and its partners are supporting the use and development of the Power-to-Gas system solution.
• CAISO (on the “Duck Curve”)
…steps must be taken to mitigate over generation risk. These steps include increasing exports…and requiring renewable generation curtailment. The ability to export power depends on the needs of neighboring entities…the resource mix would also benefit from resources with energy storage capabilities…
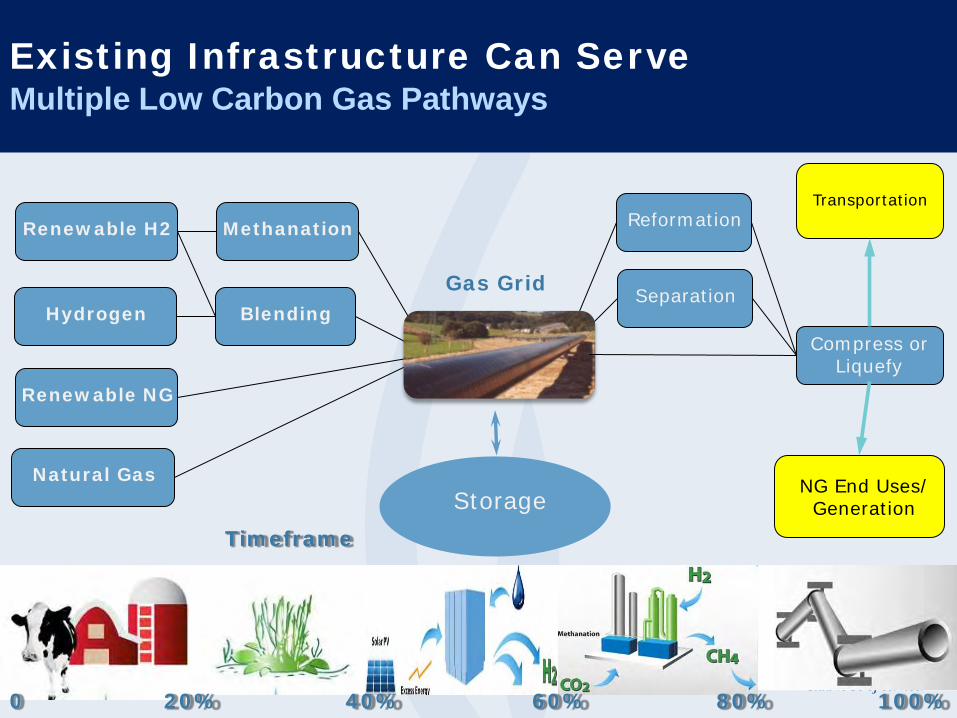
Pipeline
Reformation Transportation
NG End Uses/ Generation
Renewable H2
Renewable NG
Hydrogen
Natural Gas
Methanation
Separation Blending
Gas Grid
Compress or Liquefy
Storage
0 20% 40% 60% 80% 100%
Timeframe
Existing Infrastructure Can Serve Multiple Low Carbon Gas Pathways

• Pipeline de-carbonization works
together with electrification towards Climate Change objectives
• Pipeline de-carbonization offers Cost Effective and Resilient Pathways
• De-carbonization can play an important role Integrating Variable Renewable Generation Resources
• Pipeline de-carbonization reduces emissions in sectors that are otherwise difficult to electrify, including heavy duty vehicles; residential and commercial end uses, and industrial end uses
• Managing “Energy Grid” (gas and electric together) = efficiency and cost avoidance
Strategic use of gaseous fuels supports near- and long-term goals • In nearer term, opportunities for
efficiency, “near zero” technology and new uses for natural gas (transportation)
• In medium- to long-term, new low-carbon sources of gas need development and introduction
Expands upon 2012 Science article
E3 Study: Integration of New Low/Zero Carbon Options
RD&D of cleaner, more efficient natural gas technologies, inc. P2G at UC Irvine.
New State Natural Gas Utilization Policy
Offering Compression Services to facilitate development of NGV market
Offering Biogas Conditioning Services to facilitate development of renewable natural gas market
Offering Distributed Energy Services tariff to facilitate more efficient use of heat and power
Considering LNG, RNG and P2G projects
SoCalGas Facilitating Cleaner Energy Options for Our Customers

» Set emissions standards / avoid technology mandates » Improve balance between short- and mid-term NOx reduction
and long-term GHG reduction goals Technology availability and time urgency Natural Gas for transportation RNG market development (biomethane) and deployment
» Support deployment for natural gas pathway technologies Transportation deployment funding Utility role in refueling infrastructure/joint refueling (CNG/H2/Elec) Intermodal fueling strategy (ports, rail, goods movement) Distributed gas generation (CHP, fuel cells, microturbines) Power-to-gas development and green hydrogen technology
» Support R&D; and methane mitigation R&D funding (HD transportation, DG, RNG, P2G) Low-emission connections and fittings In-home sensing technologies Commercial/industrial leak monitoring
SCG: Sensible Policies & Regulations

26

THANK YOU!
External Affairs and Environmental Strategy 2016

28
Background Slides (E-3 Update)

E-3 2030 Update: Three Scenarios Evaluated
1. Low Carbon Gas Scenario (meets 2030, 2050 GHG targets) Uses renewable gas in buildings, no building retrofits or building electrification
required Uses Renewable CNG in medium and heavy duty vehicles, along with
hydrogen fuel cell and electricity for medium duty vehicles High renewables; electric and fuel cell light-duty vehicles
2. Electrification Scenario (meets 2030, 2050 GHG targets) High building electrification, retrofits to all-electric buildings Uses hydrogen fuel cell, electricity and renewable diesel for medium and
heavy duty vehicles High renewables; electric and fuel cell light-duty vehicles
3. Reference Scenario: reflects 2020 GHG policies only
29

E3 Low Carbon Gas Study
30

Electrification Scenario Involves Extensive Building Retrofits
» The Electrification Scenario: By 2030, 98% of new sales of residential water heaters are electric. 90% of new electric water heater sales are for retrofits in existing buildings, 10% are installed in new construction.
31
90% of residential electric water heater sales replace existing
gas water heaters

Low Carbon Gas Scenario Avoids Extensive Building Retrofits
» The Low Carbon Gas Scenario: does not assume retrofits to all-electric homes, relies on high efficiency gas appliances and electric efficiency
32
No fuel switching or retrofits required
Pipeline Gas
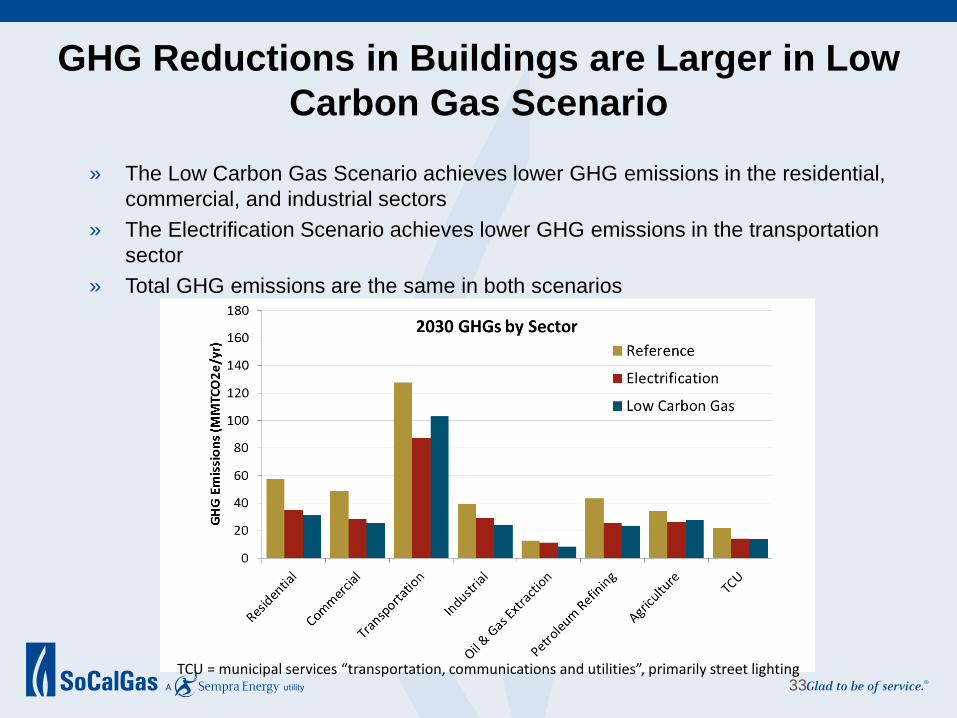
GHG Reductions in Buildings are Larger in Low Carbon Gas Scenario
» The Low Carbon Gas Scenario achieves lower GHG emissions in the residential,
commercial, and industrial sectors » The Electrification Scenario achieves lower GHG emissions in the transportation
sector » Total GHG emissions are the same in both scenarios
33 TCU = municipal services “transportation, communications and utilities”, primarily street lighting
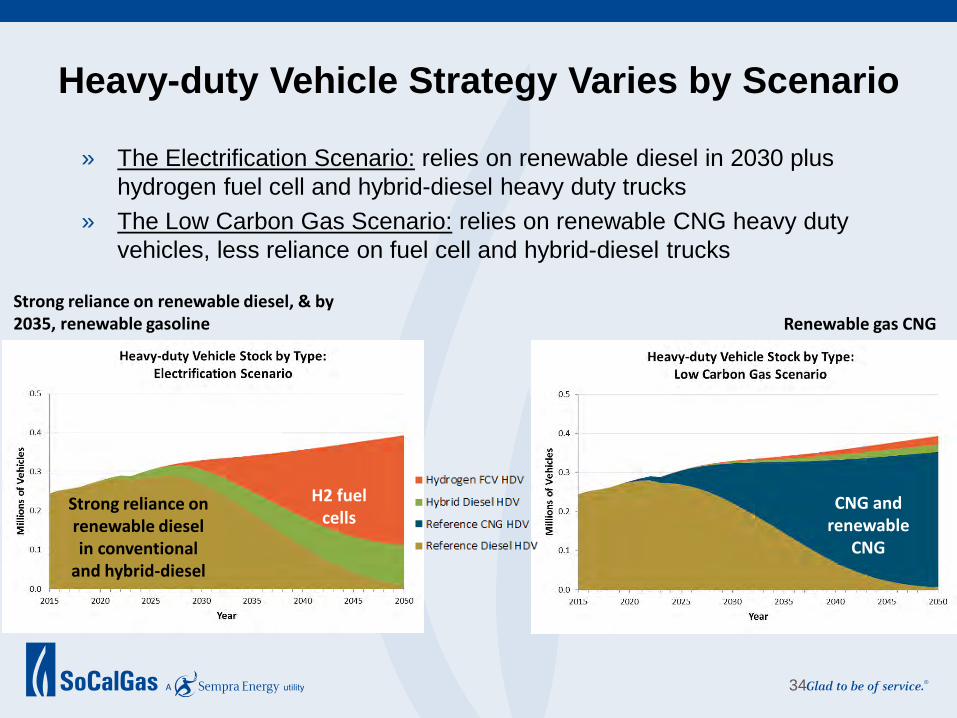
Heavy-duty Vehicle Strategy Varies by Scenario
34
Strong reliance on renewable
gas CNG
Renewable gas CNG
Strong reliance on renewable diesel in conventional
and hybrid-diesel
Strong reliance on renewable diesel, & by 2035, renewable gasoline
H2 fuel cells
» The Electrification Scenario: relies on renewable diesel in 2030 plus hydrogen fuel cell and hybrid-diesel heavy duty trucks
» The Low Carbon Gas Scenario: relies on renewable CNG heavy duty vehicles, less reliance on fuel cell and hybrid-diesel trucks
CNG and renewable
CNG

Economy-wide Costs of Scenarios are Similar, within Uncertainty Range
» Scenarios range from $15 - $22 billion annual cost relative to Reference scenario
in 2030 » Cost range shown is driven by uncertainty in costs of biogas vs. fossil natural gas
and renewable diesel vs. fossil diesel
35
Low fossil diesel costs, high renewable diesel costs
Low diesel costs
Low biogas conversion costs
Note: Cost sensitivity ranges shown here do not reflect the complete range of uncertainty in future costs.
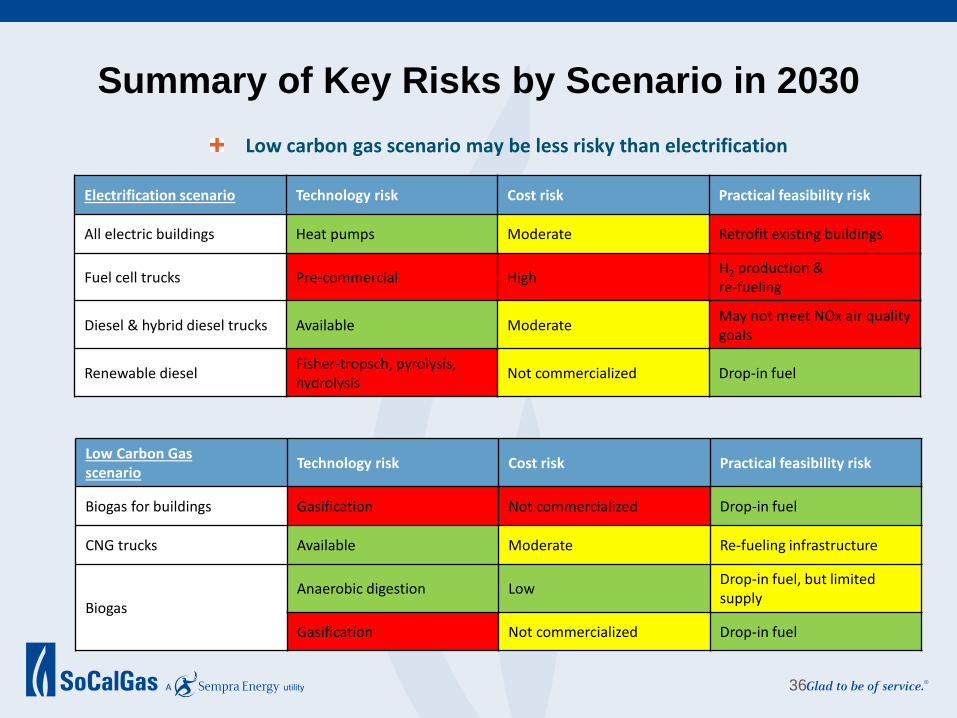
Summary of Key Risks by Scenario in 2030
Electrification scenario Technology risk Cost risk Practical feasibility risk
All electric buildings Heat pumps Moderate Retrofit existing buildings
Fuel cell trucks Pre-commercial High H2 production & re-fueling
Diesel & hybrid diesel trucks Available Moderate May not meet NOx air quality goals
Renewable diesel Fisher-tropsch, pyrolysis, hydrolysis Not commercialized Drop-in fuel
36
Low Carbon Gas scenario Technology risk Cost risk Practical feasibility risk
Biogas for buildings Gasification Not commercialized Drop-in fuel
CNG trucks Available Moderate Re-fueling infrastructure
Biogas Anaerobic digestion Low Drop-in fuel, but limited
supply
Gasification Not commercialized Drop-in fuel
Low carbon gas scenario may be less risky than electrification
37
Background Slides (Power to Gas)
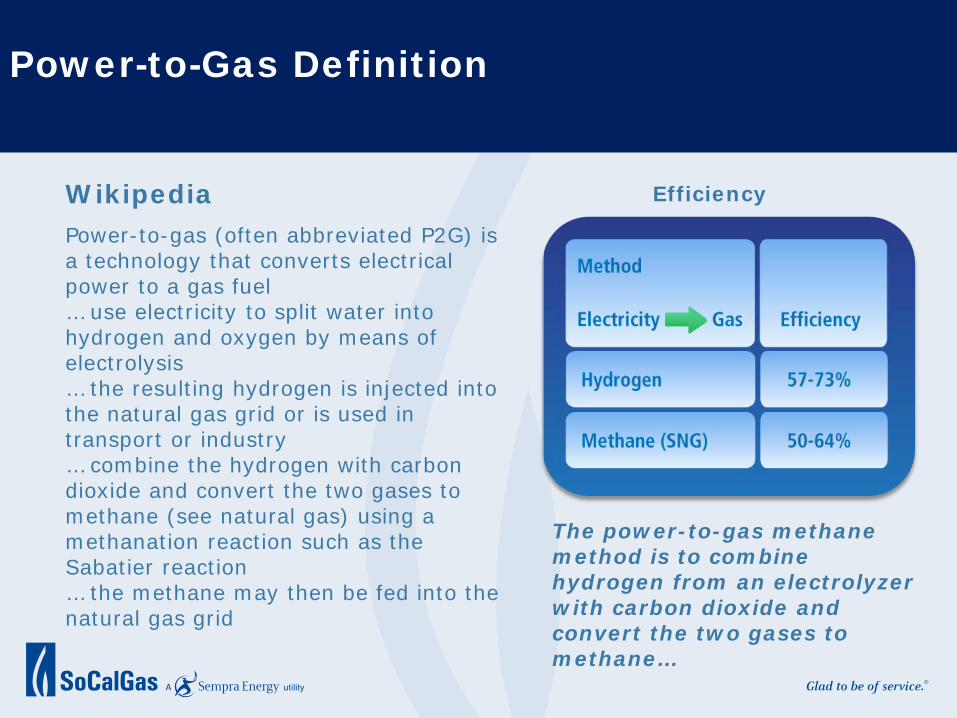
Power-to-gas (often abbreviated P2G) is a technology that converts electrical power to a gas fuel … use electricity to split water into hydrogen and oxygen by means of electrolysis … the resulting hydrogen is injected into the natural gas grid or is used in transport or industry … combine the hydrogen with carbon dioxide and convert the two gases to methane (see natural gas) using a methanation reaction such as the Sabatier reaction … the methane may then be fed into the natural gas grid
Wikipedia
The power-to-gas methane method is to combine hydrogen from an electrolyzer with carbon dioxide and convert the two gases to methane…
Efficiency
Power-to-Gas Definition

39
Gaseous Fuels Provide Unique Storage Functionality

Goleta
Playa Del Rey Honor Rancho
Aliso Canyon
Methane as a Storage Medium SoCalGas’ storage fields are the largest energy storage resource in the region
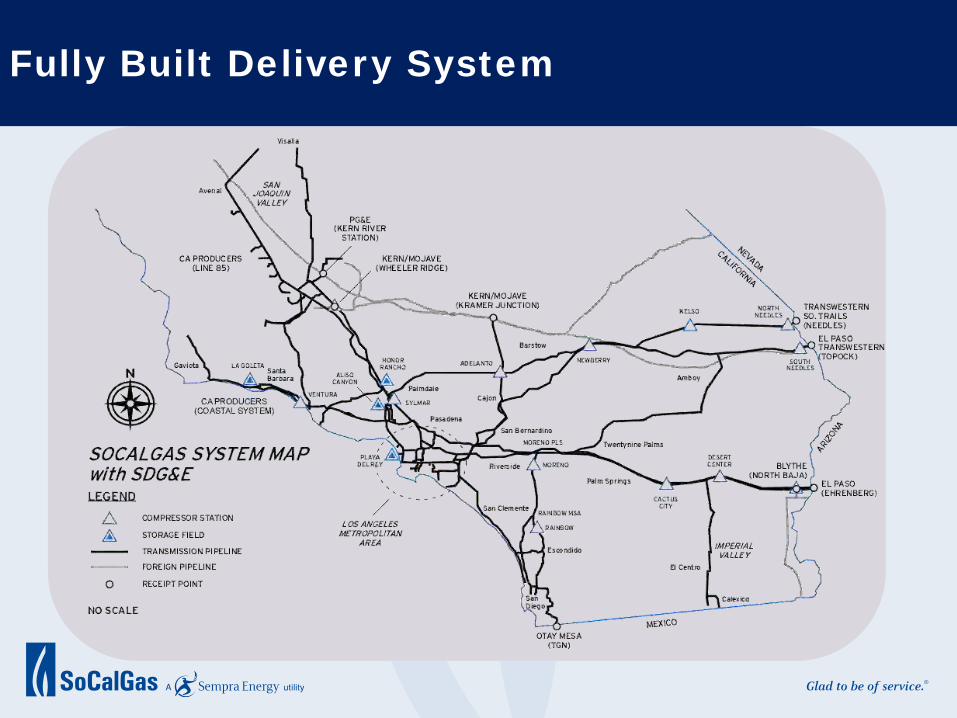
Fully Built Delivery System
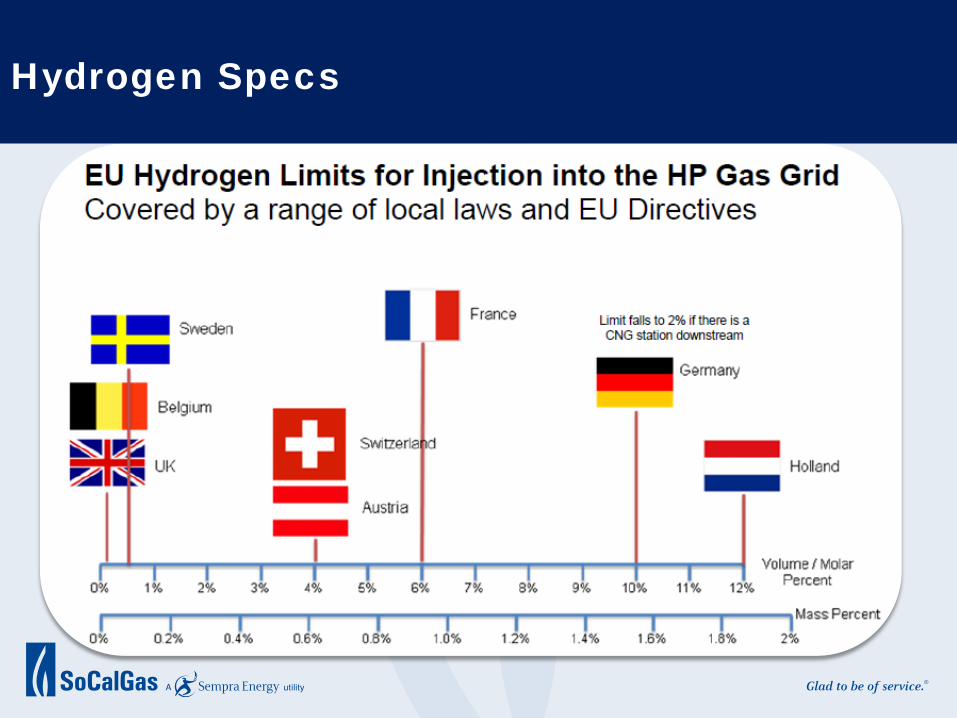
Hydrogen Specs
Background Slides (Methane Emissions)
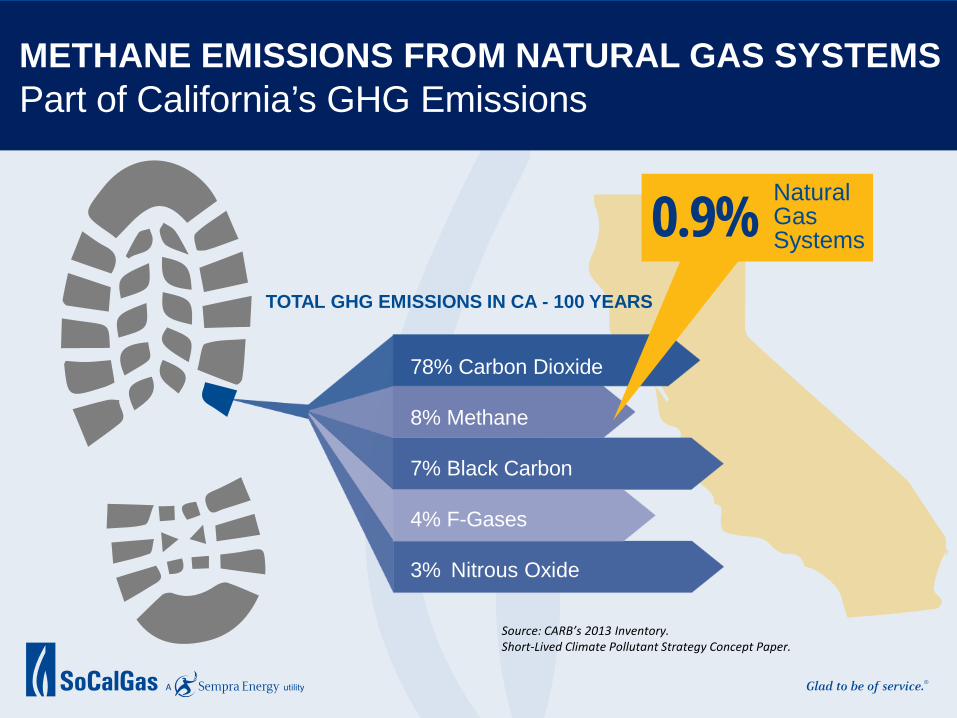
METHANE EMISSIONS FROM NATURAL GAS SYSTEMS Part of California’s GHG Emissions
Source: CARB’s 2013 Inventory. Short-Lived Climate Pollutant Strategy Concept Paper.
78% Carbon Dioxide
8% Methane
7% Black Carbon
4% F-Gases
3% Nitrous Oxide
Natural Gas Systems 0.9%
TOTAL GHG EMISSIONS IN CA - 100 YEARS

.
*Using 20-yr GWP
CALIFORNIA 2013 METHANE EMISSION SOURCES* 2013 118 MMTCO2e
CALIFORNIA’S METHANE INVENTORY
Natural gas systems ~ 9% Agriculture & waste contribute 82% of the state’s methane emissions
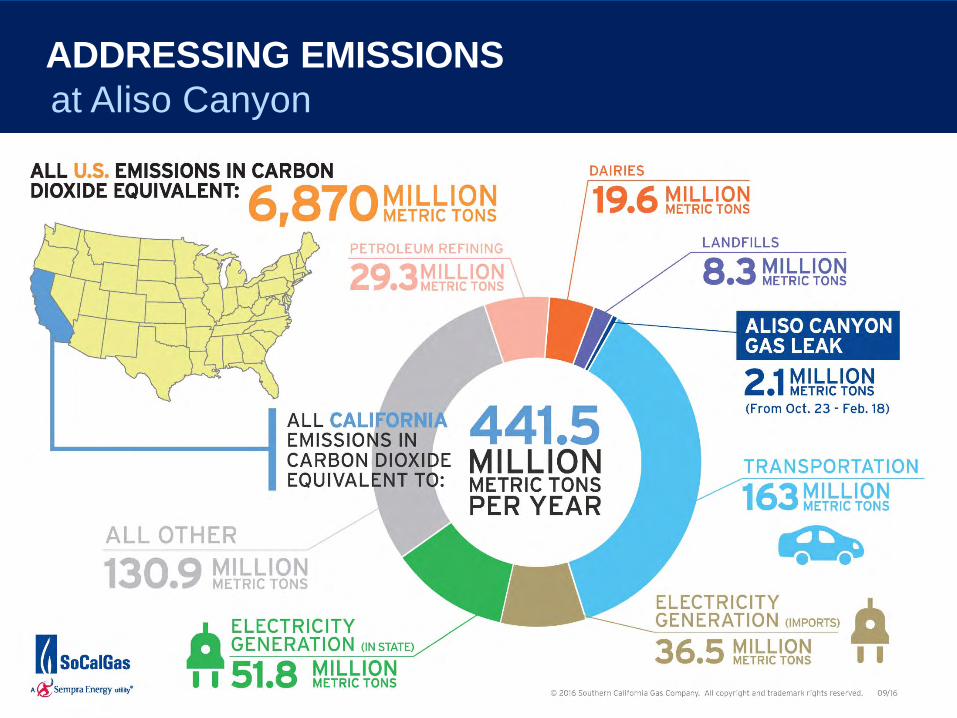
UPDATES AT ALISOUPDATE.COM
ADDRESSING EMISSIONS at Aliso Canyon
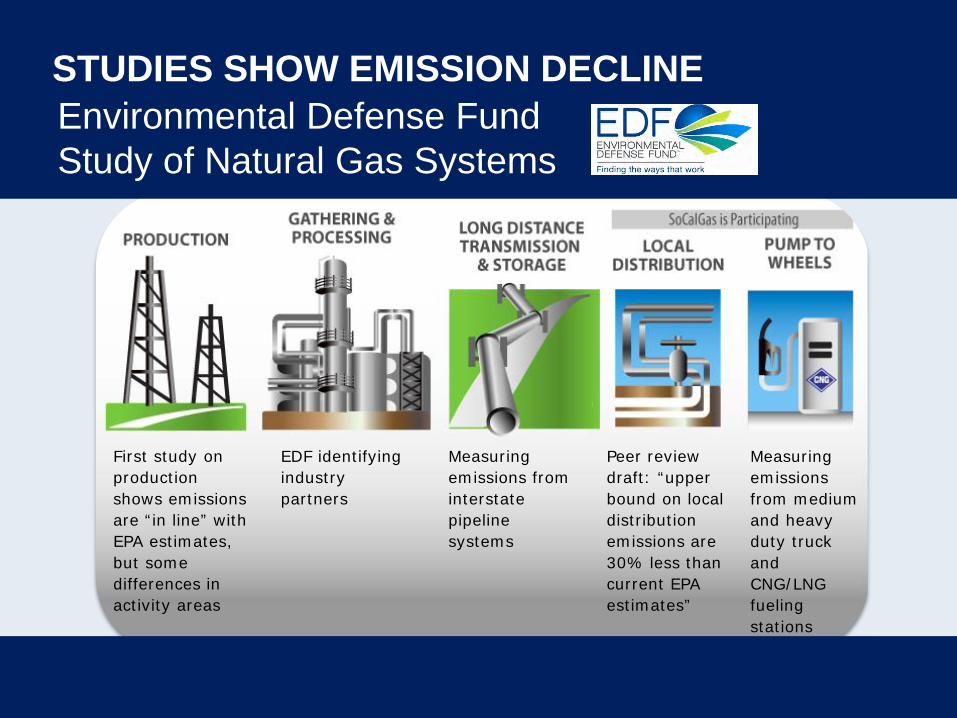
First study on production shows emissions are “in line” with EPA estimates, but some differences in activity areas
Peer review draft: “upper bound on local distribution emissions are 30% less than current EPA estimates”
EDF identifying industry partners
Measuring emissions from interstate pipeline systems
Measuring emissions from medium and heavy duty truck and CNG/LNG fueling stations
47
Environmental Defense Fund Study of Natural Gas Systems
STUDIES SHOW EMISSION DECLINE

0.00%
0.10%
0.20%
0.30%
0.40%
0.50%
0.60%
All U.S. Distribution SoCalGas Territory asReported to ARB
EDF LDC Study SoCalGas EngineeringAnalysis
Leak Rate Comparison 2013
0.52%
0.31%
0.12%
2013 samples that generated new
emission factors
Measured using 20+ year old GRI/EPA emission factors
primarily due to system modernization and better leak detection
STUDIES SHOW LOWER LEAK RATES for SoCalGas

END