natural climate cycle synchronicity ahead
TRANSCRIPT
Page 1 of 23 © Copyright 2007- 2020 Hackett Financial Advisors, Inc
The Hackett Money Flow Commodity Report July 29, 2020
CCoommmmooddiittyy MMaarrkkeett AAnnaallyyssiiss FFoorr HHeeddggeerrss aanndd IInnvveessttoorrss
-Published By Hackett Financial Advisors, Inc.
Shawn Hackett, President 22641 Caravelle Circle Boca Raton, FL 33433
561-573-3766 Email: [email protected]
www.HackettAdvisors.com
ISSN 1937-7207
Growing Financial Success
CONTENTS Orbital Theory of Natural Climate Change Cycles. The Gleissberg Cycle-Historic Chins Floods and Midwest Droughts. Gleissberg Cycle and the Yoshimura Cycle-Impacts to Global Sea Surface Temperatures and Global Air Temperatures. The Hale Cycle and the 3rd Harmonics Solar Cycle Pattern Modulation of Sea Surface Temperatures and Air Temperatures. Culmination Working Natural Weather Cycle Model. Final Takeaways, Long Term Eddy and Bray Solar Cycles and the Implication for the Great Conjunction Coming on December 21st, 2020.
Natural Climate Cycle Synchronicity Ahead
We are at an historic moment in time when earth’s climate is about to change in dramatic and unthinkable ways. We are seeing a rare symmetry and synchronicity of natural weather cycles all pointing in the same phase and direction for the first time since the early 1600’s that preceded the worst weather century for the earth in over 1000 year’s called the Maunder Grande Solar Cycle Minimum. There are some differences but there are many similarities. Please read on to delve further into these cycles and the implications to global food production and prices. If we are even half right about what these weather cycles are suggesting, Global Agriculture as we know it will go through an historic change and metamorphosis.
Subscription includes a minimum of 48 issues. To subscribe, please
contact us via email or phone or register on our website.
https://www.hackettadvisors.com/subscribe.asp
Page 2 of 23 © Copyright 2007- 2020 Hackett Financial Advisors, Inc
The Hackett Money Flow Commodity Report July 29, 2020
CCoommmmooddiittyy MMaarrkkeett AAnnaallyyssiiss FFoorr HHeeddggeerrss aanndd IInnvveessttoorrss
Orbital Theory of Natural Climate Change and Cycles
Through recent tree ring analysis, Ice core analysis and historical records we know that the natural state of climate is that it is always changing and is always in flux naturally. There is no such thing as a stable climate. That is a myth that has never existed and never will. We know well before there were any emissions from humans into the atmosphere, climate has shown great volatility from long periods of warming, cooling, great floods, great droughts, insect infestations, forest fires, epic volcanic eruptions etc. There is nothing happening today with weather that has not already happened in the past a multitude of times. What the history of weather and climate also show very clearly is that it is very cyclical. Meaning there is rhyme and a repeatability to weather that is undeniable. This strongly suggests that there are large natural forces at work driving our climate that are predictable and in perfect symmetry and order with one another. The facts are that earth exists in space and the influences on the earth surface and its atmosphere come from space or more importantly our solar system. It is correct that they call is a SYSTEM. That means that the solar system of planets is a living, breathing, existing symbiotic combination of forces that are abiding in perfect order with the physical laws of the universe. Those physical laws have been expounded upon by some of the smartest scientists, philosophers and mathematicians ever born for thousands of years. Tens of Thousands of papers have been written and published in just the last century on these forces, how they work, and how they correlate with climate on earth. Some very serious work is involved from differential equations, fluid mechanics, astrophysics, nuclear physics, advanced kinetics and string theory. Being a chemist by degree myself, I have had exposure to most of these areas and can appreciate the enormity of their effort and the robustness of their conclusions. The beauty of science is that it is never settled. We never have all the answers and we are always learning something new that will change prior or preconceived notions as we move closer to what the true nature of the universe really is. History is littered with incorrect group scientific consensus and the chastising of those that would dare to suggest an alternative approach or and alternate mechanism for the world that we live in which of course includes earth’s climate.
^back to top^
Page 3 of 23 © Copyright 2007- 2020 Hackett Financial Advisors, Inc
The Hackett Money Flow Commodity Report July 29, 2020
CCoommmmooddiittyy MMaarrkkeett AAnnaallyyssiiss FFoorr HHeeddggeerrss aanndd IInnvveessttoorrss
What I am about to discuss on the pages that follow is my life’s long work and passion for seeking the truth in what drives our climate on earth and provide to you some of the most important factors that determine our long term weather trends and how those trends are shaping up for the next few years and for the next 30 years. My hope is that this discussion will stimulate all of you to do your own research and look for answers and the truth so that society can continue to advance ahead with great preparation, respect and an unrelenting commitment to the scientific process. The Grande conclusion of my lifelong pursuit of climate truth is that earth’s weather is driven by the gravimetric, electric, magnetic and mechanical forces that are emanated by our solar system. Like a well tooled watch, every planet exists with it own array of these forces that are constantly interacting with one another in space and whose forces are constantly changing and thereby constantly altering the impacts to earth atmosphere, the interactions with earth’s surface and with the manner in which our future climate will be changing as the sun is greatly altered by these forces. Each planet rotates around the sun at a different rate, some rotate in a circular fashion while others are more elliptical. Each planet spins around its own axis at different rates. Each planet has a different magnetic field strength and magnetic field distribution. Each planet is of a different size and mass and has different electrical properties. Not only do all these interacting forces impact the earth but it also has a dramatic effect on the sun’s atmosphere and magnetic solar wind output. The sun is the nucleus of the solar system that energizes all the planets and is the driving force for the whole system. Think of the solar system like an electric circuit. The sun provides the energy, the gravimetric forces provide the electric wire connections, each planet is a magnet that repels and attracts depending on its orientation and the motion of the planets supplies the kinetic electrical energy that allows the system to flow into perpetuity creating ever changing angular momentum forces. Just to provide some perspective, Jupiter’s magnetic field strength is 19,500 times stronger than that of earths. That is not a typo. We mentioned earlier how the sun super charges the whole solar system electric circuit. One of the unique factors is that during periods of low solar activity when the suns magnetic field is weakened, cosmic rays are allows to enter the sun instead of being shielded and produces highly charged Gamma rays that increases the intensity of all these planetary solar system forces and helps to create a much greater climate impact on earth’s atmosphere and earth’s surface. Here is a great article on this below: https://www.scientificamerican.com/article/the-sun-is-spitting-out-strange-patterns-of-gamma-rays-and-no-one-knows-why/
^back to top^

Page 4 of 23 © Copyright 2007- 2020 Hackett Financial Advisors, Inc
The Hackett Money Flow Commodity Report July 29, 2020
CCoommmmooddiittyy MMaarrkkeett AAnnaallyyssiiss FFoorr HHeeddggeerrss aanndd IInnvveessttoorrss
We mentioned in our special weather report released to all subscribers on December 2nd, 2019 on how the planetary movements and forces change the center of gravity of the solar system from which the sun rotates called the barycenter. As the center of mass moves further away from the center of the sun the sun wobbles more violently and this has been directly associated with a weakening magnetic field of the sun which reduces the sun’s ability to produce sunspots. We ask that you refer to that report to refresh your memory about some of the foundational elements of the natural cycle climate change construct we outlined. What we want to do in this report is illustrate what we have identified as the key influencing natural orbital cycles that greatly influence temperature, weather volatility and extreme weather events. Let us start off with one of the most diverse and impactful cycles.
The Gleissberg Cycle
Uranus and Neptune meet and align every 172 years. Half of that cycle is 86 years. That half cycle is what is referred to as the Gleissberg cycle. How these two important planets align throughout this cycle has shown profound impacts to climate on our planet from droughts to floods to spikes in sea surface temperatures and crashes in sea surface temperatures. This is a very important point to make. Many incorrectly believe that sea surface temperatures rise and fall as a result of the trend in above ground air temperatures. That is an incorrect assertion. Sea surface temperatures are driven and modulated by the electric, magnetic, gravimetric and thermodynamic forces of the planets and of the sun. The reality is that there is always very cold water beneath the surface in our oceans. What determines whether the surface sea temperatures are warm or cold has more to do with the strength of sea currents and the strength of what is called upwelling forces. When La Nina gets triggered from the forces out in space, an upwelling of cold water displaces the warm surface water that preceded it with an El Nino. Sea surface temperatures determine the air temperatures of the earth. That is why global air temperatures crash during La Nina’s and surge during El Nino’s. These are the shorter-term perturbations of temperature trends. The longer-term temperature and climate trends of which the Gleissberg cycle is one of them is what this report is primarily focused on. The last time Uranus and Neptune aligned close together was in 1993 which began the new 172-year double Gleissberg cycle.
^back to top^
Page 5 of 23 © Copyright 2007- 2020 Hackett Financial Advisors, Inc
The Hackett Money Flow Commodity Report July 29, 2020
CCoommmmooddiittyy MMaarrkkeett AAnnaallyyssiiss FFoorr HHeeddggeerrss aanndd IInnvveessttoorrss
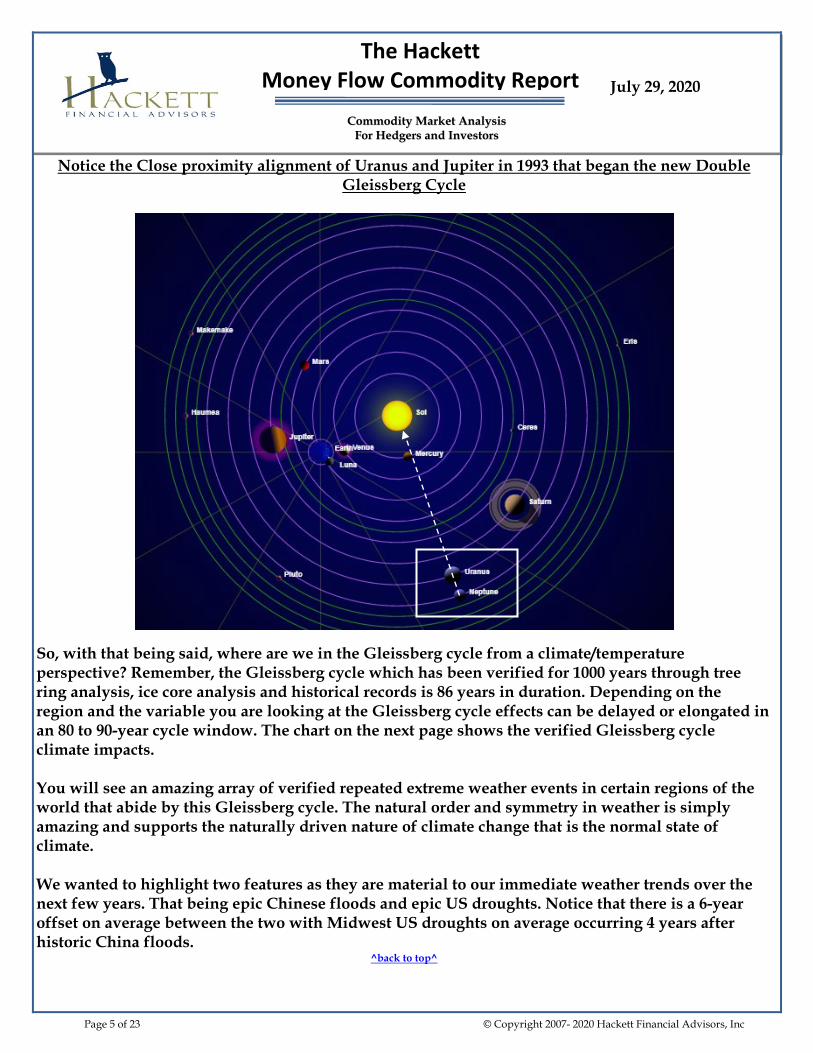
Notice the Close proximity alignment of Uranus and Jupiter in 1993 that began the new Double Gleissberg Cycle
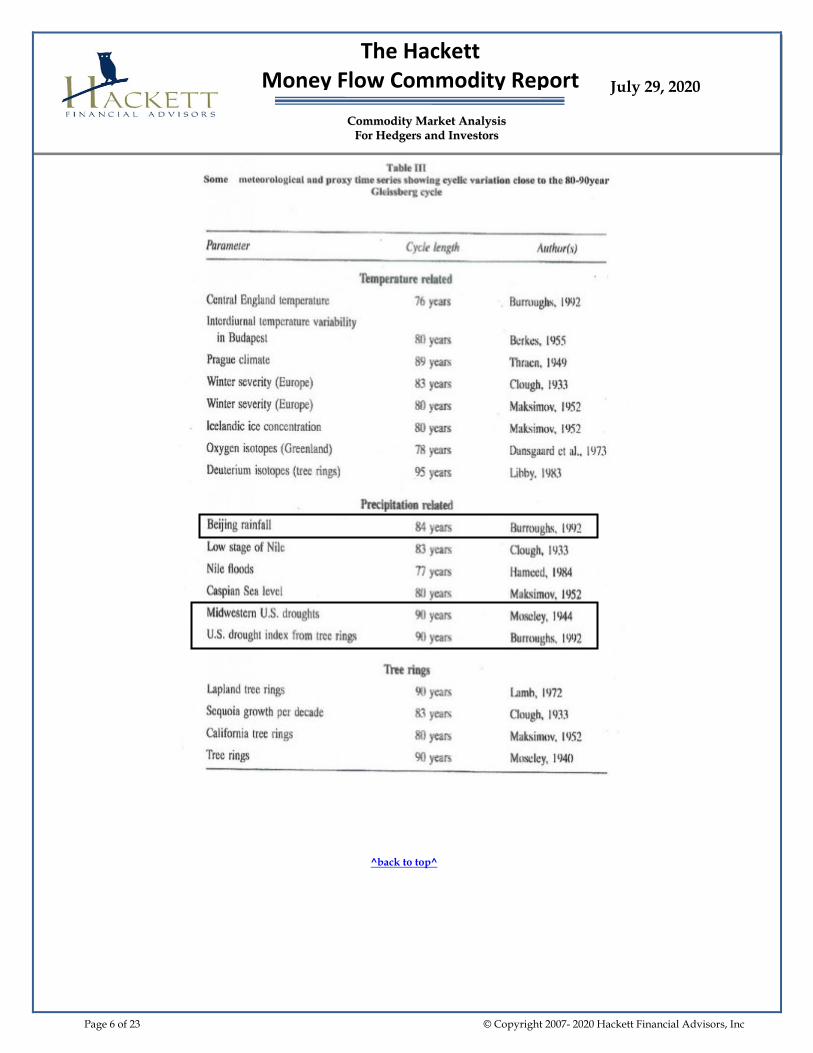
So, with that being said, where are we in the Gleissberg cycle from a climate/temperature perspective? Remember, the Gleissberg cycle which has been verified for 1000 years through tree ring analysis, ice core analysis and historical records is 86 years in duration. Depending on the region and the variable you are looking at the Gleissberg cycle effects can be delayed or elongated in an 80 to 90-year cycle window. The chart on the next page shows the verified Gleissberg cycle climate impacts. You will see an amazing array of verified repeated extreme weather events in certain regions of the world that abide by this Gleissberg cycle. The natural order and symmetry in weather is simply amazing and supports the naturally driven nature of climate change that is the normal state of climate. We wanted to highlight two features as they are material to our immediate weather trends over the next few years. That being epic Chinese floods and epic US droughts. Notice that there is a 6-year offset on average between the two with Midwest US droughts on average occurring 4 years after historic China floods.
^back to top^
Page 6 of 23 © Copyright 2007- 2020 Hackett Financial Advisors, Inc
The Hackett Money Flow Commodity Report July 29, 2020
CCoommmmooddiittyy MMaarrkkeett AAnnaallyyssiiss FFoorr HHeeddggeerrss aanndd IInnvveessttoorrss
^back to top^

Page 7 of 23 © Copyright 2007- 2020 Hackett Financial Advisors, Inc
The Hackett Money Flow Commodity Report July 29, 2020
CCoommmmooddiittyy MMaarrkkeett AAnnaallyyssiiss FFoorr HHeeddggeerrss aanndd IInnvveessttoorrss
Chinese Floods
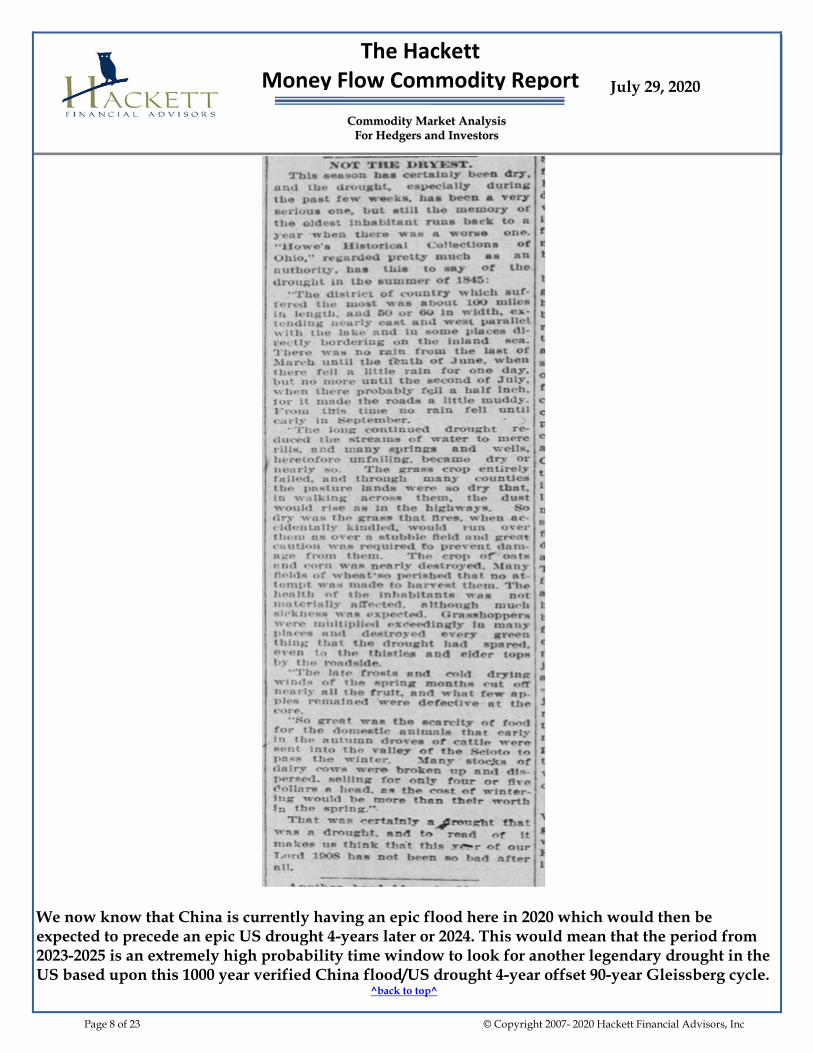
China is a very big country and flooding can happen in parts of the country while droughts can be in another part. We are most interested in floods that occur in the key East Central and East South-Central China areas. These areas follow a reliable 90-year Gleissberg Cycle. Here is a synopsis of the epic floods in 1841: “The rising flow of the upper reaches of the Yellow River between July 23rd and 31st and the strong rainfall that followed from August 3rd to 22nd contributed to Kaifeng, Henan Province being surrounded by floodwaters of 1841 for 68 days in 1841. The most serious flood was in June of the lunar calendar, from 23 July to 1 August. Many states and counties along the Yellow River were seriously affected. In the records, the flood disaster in Kaifeng began with the water rushing into Kaifeng City on 2 August 1841 and ended with the closing of the breached dam on 19 March 1842. The flood of the Yellow River basin in 1841 affected almost 108 counties in Shanxi, Shaanxi, Inner Mongolia, Ningxia, Shandong, Henan and Anhui. The most serious impacts occurred in lunar June, from July 23rd to August 1st. The River in Zhangjiawan breached, and Kaifeng city was surrounded by the flood. In late lunar June, the lower reaches of the Yellow River were cutoff, and the flood then flowed into the Huai River, causing breaching. This flood impacted 61 counties in Shanxi, Shaanxi, Henan, Anhui and other provinces.” 4-Years later an epic drought occurred in the US in 1845. Please see the news article on the next page. The 90-year Gleissberg cycle would then have predicted another epic China flood in 1931 followed by an epic drought in the US in 1935. That is exactly what happened. The 1931 china floods were one of the worst evert seen: ‘In 1931 Central China experienced a devastating flood that inundated an area equivalent in size of England and half of Scotland, affected the lives of an estimated 52 million people, and killed as many as 2 million. In Chinese this event is usually described as the Yangzi-Huai Flood (Jiang-Huai shuizai), yet the disaster was not limited to these two rivers. The Yellow River and Grand Canal also experienced major flooding, whilst there were lessor inundations from as far south as the Pearl River (Zhu Jiang), which flows through the city of Guangzhou (Canton), to as far north as the Songhua and Yalu Rivers, which flow to the north of Korea.[1] Although the flood affected much of the country the core disaster zone was concentrated in eight central provinces. As such, it is referred to here as the 1931 Central China Flood.” Of course, the US dust bowl reached its peak in 1935. The 90-year Gleissberg cycle would then have projected and epic China flood in 2021 to then be followed by an epic drought in the US 4-years later in 2025. Remember, these cycles can be off either 1 year before or 1 year after the target year.
^back to top^
Page 8 of 23 © Copyright 2007- 2020 Hackett Financial Advisors, Inc
The Hackett Money Flow Commodity Report July 29, 2020
CCoommmmooddiittyy MMaarrkkeett AAnnaallyyssiiss FFoorr HHeeddggeerrss aanndd IInnvveessttoorrss
We now know that China is currently having an epic flood here in 2020 which would then be expected to precede an epic US drought 4-years later or 2024. This would mean that the period from 2023-2025 is an extremely high probability time window to look for another legendary drought in the US based upon this 1000 year verified China flood/US drought 4-year offset 90-year Gleissberg cycle.
^back to top^
Page 9 of 23 © Copyright 2007- 2020 Hackett Financial Advisors, Inc
The Hackett Money Flow Commodity Report July 29, 2020
CCoommmmooddiittyy MMaarrkkeett AAnnaallyyssiiss FFoorr HHeeddggeerrss aanndd IInnvveessttoorrss
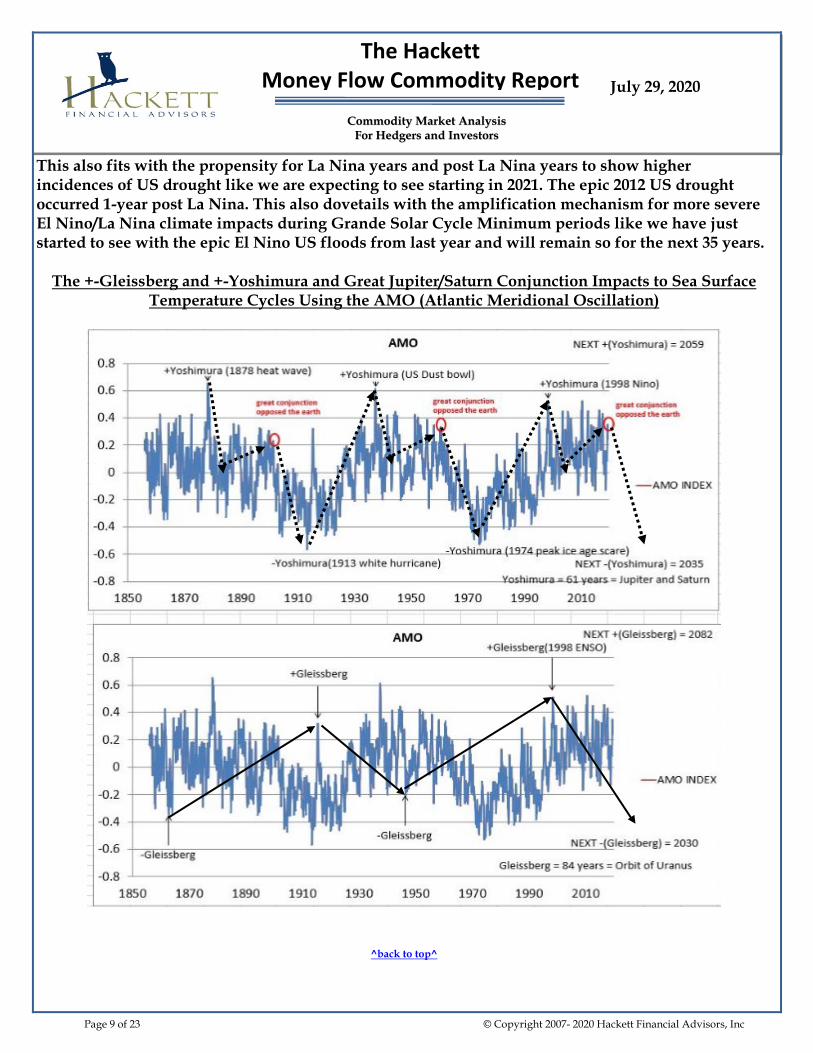
This also fits with the propensity for La Nina years and post La Nina years to show higher incidences of US drought like we are expecting to see starting in 2021. The epic 2012 US drought occurred 1-year post La Nina. This also dovetails with the amplification mechanism for more severe El Nino/La Nina climate impacts during Grande Solar Cycle Minimum periods like we have just started to see with the epic El Nino US floods from last year and will remain so for the next 35 years.
The +-Gleissberg and +-Yoshimura and Great Jupiter/Saturn Conjunction Impacts to Sea Surface Temperature Cycles Using the AMO (Atlantic Meridional Oscillation)
^back to top^

Page 10 of 23 © Copyright 2007- 2020 Hackett Financial Advisors, Inc
The Hackett Money Flow Commodity Report July 29, 2020
CCoommmmooddiittyy MMaarrkkeett AAnnaallyyssiiss FFoorr HHeeddggeerrss aanndd IInnvveessttoorrss
There is also a very interesting Gleissberg 84-year cycle effect on sea surface temperatures and therefore on global temperatures as it relates to the PDO (pacific decadal oscillation) and the AMO (the Atlantic meridional oscillation). For the purposes of this study, we are using the AMO but the PDO follows a similar pattern. There is an 84 year +Gleissberg cycle which helps amplify the AMO sea surface temperatures and global temperatures and there is also a separate 84 year -Gleissberg cycle that helps reduce AMO sea surface temperatures and global air temperatures. The causality on the cycle are the planetary alignments of Uranus and Neptune to each other and to the other planets and how these orientations impacts the sun and the sea currents.
1914 is An Example of the +Gleissberg Cycle with Most Planets Aligned with Uranus and Neptune to Amplify the AMO Sea Surface Temperature and Cause a Warming of Global Temperatures
^back to top^

Page 11 of 23 © Copyright 2007- 2020 Hackett Financial Advisors, Inc
The Hackett Money Flow Commodity Report July 29, 2020
CCoommmmooddiittyy MMaarrkkeett AAnnaallyyssiiss FFoorr HHeeddggeerrss aanndd IInnvveessttoorrss
The +-Yoshimura and the Great Conjunction Sea Surface Temperature Cycle
There are three Jupiter/Saturn configurations that occur every 20 years where Jupiter and Saturn come together and align in close proximity to one another. The first configuration is what is called the Great Conjunction. This is when Jupiter and Saturn are in close proximity to each other when the earth is furthest from the sun. This provides a final burst of increasing sea surface temperatures and global temperature increases after which sea surface temperatures begin a long cooling phase. This what we call the 20-year PDO/AMO sea surface temperature declination cycle that has the most dramatic impacts to rapid cooling of earths temperatures and expansion of weather volatility. The second configuration is called the -Yoshimura cycle when Jupiter and Saturn come into close proximity with each other when the earth so closest to the sun. This tends to cause a significant spike low in sea surface temperatures and in global temperatures. Last is the +Yoshimura cycle configuration when Jupiter/Saturn are in close alignment with each other when Jupiter is closest to the sun. This has the effect of causing a spike high in sea surface temperatures and in global temperatures. Right now, on December 21st, 2020 we are about to enter a Great Conjunction that should cause the final high in sea surface temperatures and in global temperatures from which a rapid cooling effect will begin for both. A synchronous -Gleissberg Cycle and a -Yoshimura Cycle are both expected to reach their maximum cooling impacts in 2030 and 2035 respectively. This means in that 5-year span from both cycles during the 2030 to 2035 period will see a a huge spike low in both sea surface temperatures and with global temperatures that should easily fall below that which was seen at both the 1970-1980 spike temperature lows and at the 1910-1920 spike lows. Remember, that in both of those cases we did not have a Grand Solar Cycle Minimum in effect like we do now. This is the first time that we have had all these natural cycles in a cooling phase since the beginning of the Maunder minimum in 1590.
Natural Weather Cycles Are Set Up Similar to the Devastating Maunder Minimum
^back to top^
2020 Dalton Minimum
Page 12 of 23 © Copyright 2007- 2020 Hackett Financial Advisors, Inc
The Hackett Money Flow Commodity Report July 29, 2020
CCoommmmooddiittyy MMaarrkkeett AAnnaallyyssiiss FFoorr HHeeddggeerrss aanndd IInnvveessttoorrss
So, the bad news is that we expect the period from 2030-2040 to rival that of the Maunder minimum one of the coldest, most volatile and most intense Grande Solar Cycle Minimums seen over the last 1000 years. The good news is that there are a few longer-term solar cycles that are out of alignment, so we are not going to see 80 years of this kind of adverse weather like we saw back in the 1600’s. So, what we see is more of a shorter duration Maunder Minimum like Grand Solar cycle of ~ 35 years instead of the milder Dalton Grande Minimum Solar Cycle that occurred 200 years ago that lasted 50 years. The bad news is that this Grand Solar Cycle Minimum has just begun the worst of which will encompass the period from now into 2035. The next +Gleissberg and +Yoshimura cycles will occur in 2082 and 2060 respectively. So even though the 2030’s will be the trough of the global cooling cycle, it will be a slow grinding trend out for most of the 2040’s. We have no doubt that fears over a never-ending ice age will be rampant at that time. Remember, that most of the Ag price increases will come between now and 2030 even though the worst weather will occur in the 2030’s. This is a result of the shock and awe psychology of markets and innovations. By the time we get to the 2030’s, the weather will have been so bad for long enough and Ag prices will have been so high for long enough that new growing technologies and techniques will surface like indoor vertical farming that will allow for an improvement in supplies and better adjustments to poor growing conditions leaving the Ag markets in a better balance. Hence, the big opportunity is the next 10 years for producers, traders and end-users to manage what will be record price volatility to improve one’s long term business prospects.
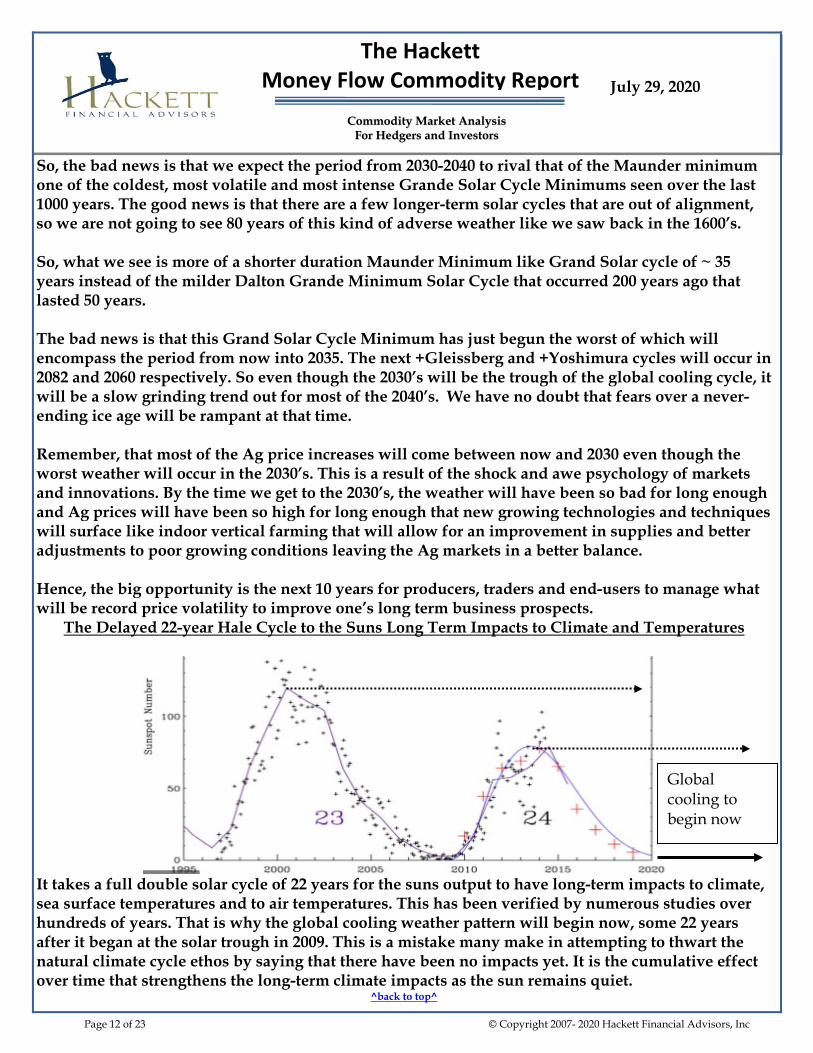
The Delayed 22-year Hale Cycle to the Suns Long Term Impacts to Climate and Temperatures
It takes a full double solar cycle of 22 years for the suns output to have long-term impacts to climate, sea surface temperatures and to air temperatures. This has been verified by numerous studies over hundreds of years. That is why the global cooling weather pattern will begin now, some 22 years after it began at the solar trough in 2009. This is a mistake many make in attempting to thwart the natural climate cycle ethos by saying that there have been no impacts yet. It is the cumulative effect over time that strengthens the long-term climate impacts as the sun remains quiet.
^back to top^
Global cooling to begin now

Page 13 of 23 © Copyright 2007- 2020 Hackett Financial Advisors, Inc
The Hackett Money Flow Commodity Report July 29, 2020
CCoommmmooddiittyy MMaarrkkeett AAnnaallyyssiiss FFoorr HHeeddggeerrss aanndd IInnvveessttoorrss
Solar /Planetary Cycles Follows a 3rd Harmonics Pattern for Solar Climate Influences
In natural recurring synchronized systems whether they be the sound of strings from a guitar or the AC electricity output of a circuit follow a certain harmonic pattern of constructive and destructive wave patterns that can amplify or diminish the strength of the wave signal. The output is a function of the amplitude of the original signal and the time the signal lasts. Solar cycles have been found in advanced mathematical studies to abide by a 3rd harmonic output pattern. That means that each 11-years completed solar cycle can be divided into three 3.6-year cycles that will differ in their total solar output based upon the amplitude of the cycle signal and the resonance of that cycle with the orbital forcing of the solar system. In the chart above, the red line represents the aggregate actual output of the various harmonic systems from the culmination of the original signal when combined with its harmonic resonate pattern. We are interested in the 3rd harmonics system for solar output. You can see that at the left, the peak signal is the strongest and then declines on the next two peaks and then repeats back up. So, we can separate the 11-year solar cycle into three 3.6-year cycle peaks one with high output, one with medium output and one the low output. Each of these three peaks is its own cycle that will move forward with its own series of high or low peaks. When we color code these three distinct cycles and place them over both sea surface temperatures and air temperatures, we get a very highly correlated predictive tool that we can use. This further supports the suns and the solar systems role in impacting earth’s climate.
^back to top^
11-year Solar Cycle
3rd Harmonics of the 11-Year Solar Cycle
2nd Harmonics Pattern
4th Harmonics Pattern
High
Med Low

Page 14 of 23 © Copyright 2007- 2020 Hackett Financial Advisors, Inc
The Hackett Money Flow Commodity Report July 29, 2020
CCoommmmooddiittyy MMaarrkkeett AAnnaallyyssiiss FFoorr HHeeddggeerrss aanndd IInnvveessttoorrss
Remember, this 3rd harmonic tool helps with shorter term temperature/climate forecasting differentials/trends. The longer-term temperatures/climate differentials/trends are determined by the 22-year Hale Solar cycle output and how that output relates the solar system planetary forcing as determined by the positioning and alignments of those planets and their corresponding electrical, gravimetric, magnetic and angular momentum influences. This discovery of the 3rd harmonics nature of solar output gives credence to the natural cycles that are at work and greatly diminish the notion that some aberrant force or variable driven by humans is the culprit. Nature has an amazing natural order in all things that when studied yields tremendous truths about how our planet works and operates. Remember, that this solar cycle 3rd harmonic also integrates the oscillating nature of La Nina/El Nino sea surface temperature conditions that is part of the harmonic constructive/destructive pattern.
The Three 42 Year 3rd Harmonic Solar Output Signals
Each of the above 3rd harmonic solar cycles last 42 years before repeating. That means going from Low to high and then from high to low is a culmination of 42 years before the cycle will repeat all over again which is half the Gleissberg cycle duration. Nature is amazing in its order.
^back to top^
Blue Cycle Starts Here-Low Output
Red Cycle Starts Here-Mid Output
Green Cycle Starts Here-High Output

Page 15 of 23 © Copyright 2007- 2020 Hackett Financial Advisors, Inc
The Hackett Money Flow Commodity Report July 29, 2020
CCoommmmooddiittyy MMaarrkkeett AAnnaallyyssiiss FFoorr HHeeddggeerrss aanndd IInnvveessttoorrss
Last 42 Years of the Three 3rd Harmonic Solar Cycles Relative to the Actual Recorded Ocean Temperatures and the Global Air Temperatures
I have verified these three-3rd harmonic 42-year cycles going back to 1850, the first year that actual measured data exists, and these cycles have been acting in a similar fashion. So, with this short-term climate model we can push these cycles out into the future and predict when global temperatures will rise and fall, when the La Nina’s and El Nino’s will occur and the likely global regional precipitation profiles that are likely to be seen. Notice that the blue solar cycle is at a low output now. The red and the green solar cycles will see their low output in 2023 and 2036 respectively. The last time we had all three solar cycle reached their low output phase in synchronicity like this was the extremely cold 1970’s when fears over an ice age were rampant. Deja Vu. This is what we have been using for years to make the longer-term accurate weather predictions we have been making. So, with these cycles in place, we can confidently state that a major La Nina will occur starting in 2021/2022. We can comfortably state that global temperatures are going to fall rapidly as a result and given that a low output 3rd harmonic solar cycle is in place as we speak, this reduction in global temperatures should fall below that which was seen in the 2010/2011 major La Nina temperature spike low. In our view, this next Major La Nina in 2021/2022 will begin the global cooling cycle that should last 35 years. The winter from the fall of 2021 through the spring of 2022 will rewrite the rules on how adverse winters can be and the humanitarian and economic consequences of such severe winter seasons that will actually get much worse as this global cooling cycle continues onward.
^back to top^
Major La Nina’s solid green lines
Minor La Nina’s spotted green lines

Page 16 of 23 © Copyright 2007- 2020 Hackett Financial Advisors, Inc
The Hackett Money Flow Commodity Report July 29, 2020
CCoommmmooddiittyy MMaarrkkeett AAnnaallyyssiiss FFoorr HHeeddggeerrss aanndd IInnvveessttoorrss
Benner Cycle
Samuel Benner in the late 1800’s who was a farmer was frustrated with the volatility of markets and wanted to try and make sense of them and to see if there were any cycles that conformed to Ag/commodity prices in general. This cycle that he found was later modified by applying Fibonacci analysis to come up with the modern-day version of his incredible work. His empirical Ag cycles incorporate economics, weather, currencies, government policy interventions and geopolitics to come up with the overall general trend one should expect for Ag commodities and commodities in general. The chart above goes from 1967 to the present. The dashed lines represent bull markets in Ag and the spotted lines represent bear markets. Some bull markets are minor, and some are major and same goes for bear markets. It is the fundamental set up that determines what kind of DNA a bull or bear will have. Notice the US Dollar trigger points shown. This cycle suggests a major top completion in the US Dollar in 2020. The recent crash in the US Dollar from a distribution top has confirmed in our view a major top and an extended multi-year bar market which is also an important catalyst for an Ag bull market in prices. Please see the performance of the Benner cycle on the next page.
^back to top^
1967
2041
Bull Market in Ag Markets-dashed lines
Bear Market in Ag Markets-dotted lines
US Dollar tops occur 1 year before these bottom dates
US Dollar bottoms occur at these middle dates.

Page 17 of 23 © Copyright 2007- 2020 Hackett Financial Advisors, Inc
The Hackett Money Flow Commodity Report July 29, 2020
CCoommmmooddiittyy MMaarrkkeett AAnnaallyyssiiss FFoorr HHeeddggeerrss aanndd IInnvveessttoorrss
Bull Market Performance 1967-1975 bull market in Ag= +200%-Removal of gold standard, dysfunctional politics and peak in global cooling weather volatility fed the rally. US Dollar Topped in 1966 the year before the bull began. 1987-1995 Bull market in Ag= +40%-Politics fairly benign and weather also fairly benign. Strong economic demand and mild inflation fueled the rally. US Dollar topped out in 1986 a year before the bull began. 2003-2011 Bull market in Ag= +150%-Unstable geopolitics, Demand bulge from China and corn-based ethanol along with debt expansion on steroids fueled the rally. The US dollar topped out in 2002 a year before the bull began unleashing an inflationary scare. 2021-2029 Bull market in Ag expected= Looking for a move larger than the one seen in the 1970’s exceeding +200%. Federal Reserve/Central bank money printing on steroids, collapsing geopolitics, removal of the US dollar reserve currency status and record setting weather volatility due to severe global cooling from the first Grande Solar Cycle minimum in over 200 years along with other corroborating global cooling cycles.
Bear Market Performance 1975-1987- Bear market in Ag= -30%-Deflation brought on by constrictive Federal Reserve Monetary policy by Paul Volker, improving weather and a global economic slowdown fueled the bear- 1995-2003- Bear Market in Ag= -42%-Deflation brought on by the Asian currency/economic crisis cratered demand. The US dollar bottomed in 1995 just as the bear began. 2011-2021- Bear in Ag Markets= -46%-Deflation brought on by improved weather, reduced global trade and severe economic slowdowns in China and the world- The US dollar bottomed in 2011 just as the bear market began. So if we are remotely correct about what is to take place with all of these natural weather cycles and empirical cycle models, the next 10 years is going to be one for the record books in terms of bull market potency for Ag markets and the inflationary consequences for very high food prices and for food scarcity and how the human race will have to adapt to thrive and conquer.
^back to top^
Page 18 of 23 © Copyright 2007- 2020 Hackett Financial Advisors, Inc
The Hackett Money Flow Commodity Report July 29, 2020
CCoommmmooddiittyy MMaarrkkeett AAnnaallyyssiiss FFoorr HHeeddggeerrss aanndd IInnvveessttoorrss
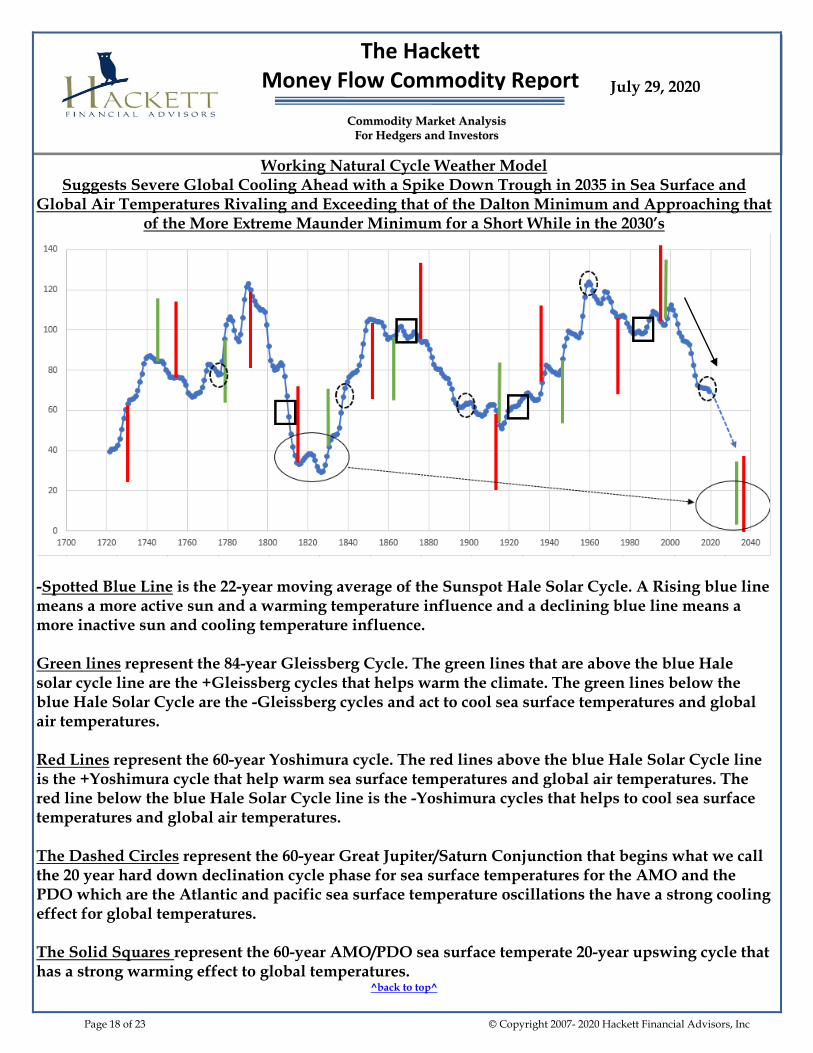
Working Natural Cycle Weather Model Suggests Severe Global Cooling Ahead with a Spike Down Trough in 2035 in Sea Surface and
Global Air Temperatures Rivaling and Exceeding that of the Dalton Minimum and Approaching that of the More Extreme Maunder Minimum for a Short While in the 2030’s
-Spotted Blue Line is the 22-year moving average of the Sunspot Hale Solar Cycle. A Rising blue line means a more active sun and a warming temperature influence and a declining blue line means a more inactive sun and cooling temperature influence. Green lines represent the 84-year Gleissberg Cycle. The green lines that are above the blue Hale solar cycle line are the +Gleissberg cycles that helps warm the climate. The green lines below the blue Hale Solar Cycle are the -Gleissberg cycles and act to cool sea surface temperatures and global air temperatures. Red Lines represent the 60-year Yoshimura cycle. The red lines above the blue Hale Solar Cycle line is the +Yoshimura cycle that help warm sea surface temperatures and global air temperatures. The red line below the blue Hale Solar Cycle line is the -Yoshimura cycles that helps to cool sea surface temperatures and global air temperatures. The Dashed Circles represent the 60-year Great Jupiter/Saturn Conjunction that begins what we call the 20 year hard down declination cycle phase for sea surface temperatures for the AMO and the PDO which are the Atlantic and pacific sea surface temperature oscillations the have a strong cooling effect for global temperatures. The Solid Squares represent the 60-year AMO/PDO sea surface temperate 20-year upswing cycle that has a strong warming effect to global temperatures.
^back to top^

Page 19 of 23 © Copyright 2007- 2020 Hackett Financial Advisors, Inc
The Hackett Money Flow Commodity Report July 29, 2020
CCoommmmooddiittyy MMaarrkkeett AAnnaallyyssiiss FFoorr HHeeddggeerrss aanndd IInnvveessttoorrss
Final Conclusions There are a few takeaways that we wanted to make sure everyone absorbs from this report. They are the following:
-There are no two natural weather cycle periods exactly alike although many rhyme- -The most extreme weather periods occur when there is synchronicity between the key and most important natural weather drivers to sea surface temperatures, to air temperatures and ultimately to changes in upper level air flows that lead to accelerated extreme weather volatility. -Right now, all the key natural weather cycles we have identified have entered into their cooling phase for sea surface temperatures, air temperatures which should lead to a period of record weather volatility and a definitive overall cooling trend- -This extreme period of high rates of change for global cooling temperature trends should begin in 2021 and reach an extreme trough by 2035. By that time, a global cooling scare will be in full display with fears that a more permanent mini ice age is to continue. While these fears will be justified, the good news is that this Global cooling cycle will be much shorter than the Maunder Minimum of the 1600’s that lasted close to 100 years. This one will encompass no more than 35 years. -However, this Grande Solar Cycle will be much worse and extreme than the last one called the Dalton minimum some 200 years ago, but it will be shorter than the 50 years the Dalton encompassed- -The Maunder Minimum was the last time that we had all these key natural weather cycles all in global cooling mode like now. The difference and the reason why this Grande Solar cycle Minimum will be so much shorter is that the longer-term solar cycles are in a warming phase and are helping to counteract the current Grande Solar Cycle Minimum from that which was seen in the Maunder Minimum. Notice how the 1000-year Eddy Solar cycle and the 2500-year Bray Solar Cycle bottomed at the Maunder Minimum and now both are moving higher offsetting the current Grande Solar Cycle Minimum duration
^back to top^
Page 20 of 23 © Copyright 2007- 2020 Hackett Financial Advisors, Inc
The Hackett Money Flow Commodity Report July 29, 2020
CCoommmmooddiittyy MMaarrkkeett AAnnaallyyssiiss FFoorr HHeeddggeerrss aanndd IInnvveessttoorrss
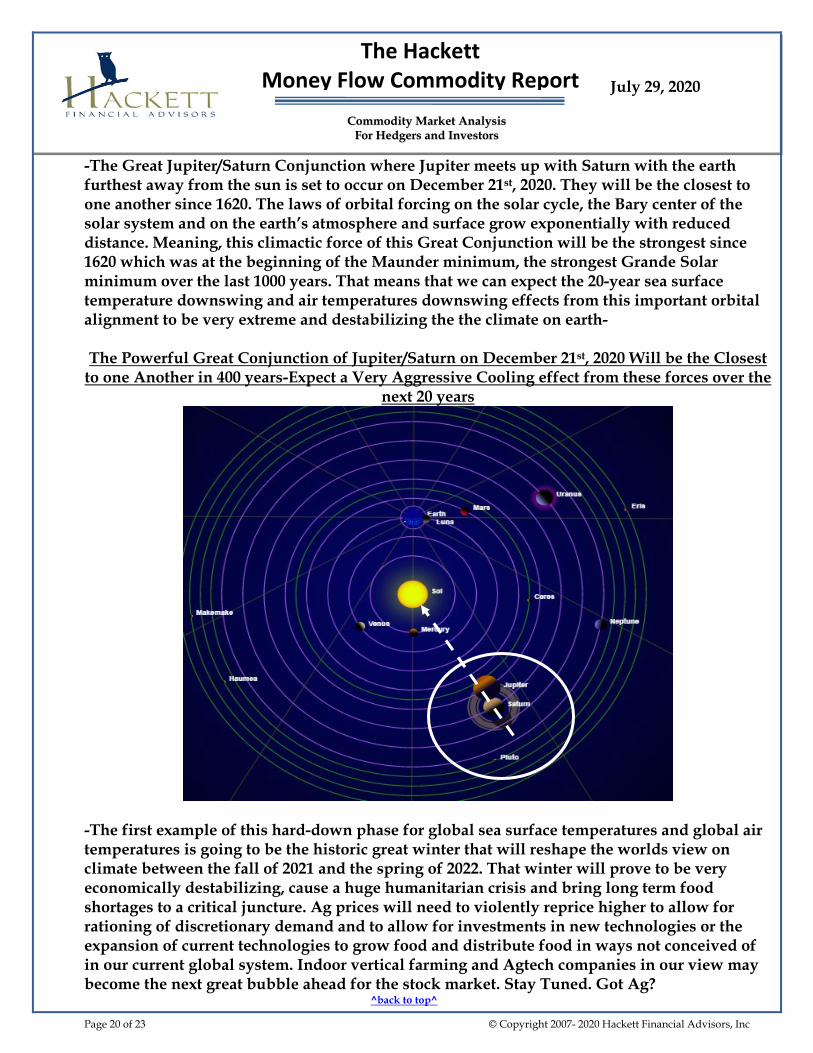
-The Great Jupiter/Saturn Conjunction where Jupiter meets up with Saturn with the earth furthest away from the sun is set to occur on December 21st, 2020. They will be the closest to one another since 1620. The laws of orbital forcing on the solar cycle, the Bary center of the solar system and on the earth’s atmosphere and surface grow exponentially with reduced distance. Meaning, this climactic force of this Great Conjunction will be the strongest since 1620 which was at the beginning of the Maunder minimum, the strongest Grande Solar minimum over the last 1000 years. That means that we can expect the 20-year sea surface temperature downswing and air temperatures downswing effects from this important orbital alignment to be very extreme and destabilizing the the climate on earth- The Powerful Great Conjunction of Jupiter/Saturn on December 21st, 2020 Will be the Closest
to one Another in 400 years-Expect a Very Aggressive Cooling effect from these forces over the next 20 years
-The first example of this hard-down phase for global sea surface temperatures and global air temperatures is going to be the historic great winter that will reshape the worlds view on climate between the fall of 2021 and the spring of 2022. That winter will prove to be very economically destabilizing, cause a huge humanitarian crisis and bring long term food shortages to a critical juncture. Ag prices will need to violently reprice higher to allow for rationing of discretionary demand and to allow for investments in new technologies or the expansion of current technologies to grow food and distribute food in ways not conceived of in our current global system. Indoor vertical farming and Agtech companies in our view may become the next great bubble ahead for the stock market. Stay Tuned. Got Ag?
^back to top^
Page 21 of 23 © Copyright 2007- 2020 Hackett Financial Advisors, Inc
The Hackett Money Flow Commodity Report July 29, 2020
CCoommmmooddiittyy MMaarrkkeett AAnnaallyyssiiss FFoorr HHeeddggeerrss aanndd IInnvveessttoorrss
Hackett Financial Advisors Inc. specializes in the agricultural space where there is far less coverage by the commodity analyst community and where some of the greatest opportunities should remain in the years ahead. While everyone on the planet has an opinion on Crude Oil or Gold there are very few who study agriculture in the manner that we do. We would be happy to see if opening an account with us would fit your needs whether as a commercial operator and/or a professional investor/firm. Apply for an account online with the following link: https://rraos.rjobrien.com/Account/Register We also put God first in our dealings with you and our approach to the markets. Our heart is in the right place and through his honor and grace wonderful things are possible. We take the view that the more successful you are the more you can give back to those in need. It hardly makes any sense to do it for any other reason.
Also remember that you can also open an account with us at Hackett Financial Advisors Inc. We clear all our operations through R.J. O'Brien & Associates which is the oldest and largest independent futures brokerage and clearing firm in the United States. A futures commission merchant (FCM), RJO is a full clearing member of the CME Group (founding member of the Chicago Mercantile Exchange) and all its markets; Intercontinental Exchange (ICE); NYSE Life U.S.; and the CBOE Futures Exchange (CFE).
RJO offers the latest in order entry technology coupled with 24-hour execution and clearing on every futures exchange worldwide. Clearing more than 100,000 client accounts, the firm provides a full range of services to the industry’s largest global network of introducing brokers (IBs) and to commercial, institutional, international and individual’s clients. These include more than 400 IBs and many of the world's largest financial, industrial and agricultural institutions. We do not engage in proprietary trading; all our business focuses on our valued clients.
Our Place in the Industry
Founded in 1914, RJO is one of the last 'boutique' futures firms in the industry. It is a privately held business majority owned by the O'Brien family of Chicago. The O’Brien’s have been instrumental in the development of the futures industry and remain committed to the continued growth of the company and our leadership within the industry.
With client assets of approximately $3.6 billion, RJO is a well-diversified, fully integrated FCM. The firm regularly captures top-tier market share in both agricultural and financial futures products at both the CME and CBOT
^back to top^

Page 22 of 23 © Copyright 2007- 2020 Hackett Financial Advisors, Inc
The Hackett Money Flow Commodity Report July 29, 2020
CCoommmmooddiittyy MMaarrkkeett AAnnaallyyssiiss FFoorr HHeeddggeerrss aanndd IInnvveessttoorrss
If you have any questions about any of the content in this report, please call me at (888) 535-5525 or e-mail me at [email protected] . Thank you for reading and I hope your future investment decisions turn out to be prosperous ones.
Best Regards,
Shawn Hackett, President
The information, tools and material presented on HACKETTADVISORS.COM (this web site), in the HACKETT MONEY FLOW REPORT and in the HACKETT STOCK REPORT are provided for informational purposes only and are not to be used or considered as an offer or a solicitation to sell or an offer or solicitation to buy or subscribe for securities, investment products or other financial instruments, nor to constitute any advice or recommendation with respect to such securities, investment products or other financial instruments. The information presented on HACKETTADVISORS.COM (this web site), in the HACKETT MONEY FLOW REPORT and in the HACKETT STOCK REPORT is prepared for general circulation. It does not have regard to the specific investment objectives, financial situation and the particular needs of any specific person who may receive this information. You should independently evaluate particular investments and consult an independent financial adviser before making any investments or entering into any transaction in relation to any securities mentioned on HACKETTADVISORS.COM (this web site), in the HACKETT MONEY FLOW REPORT and in the HACKETT STOCK REPORT. The use of HACKETADVISORS.COM is at your own sole risk. HACKETTADVISORS.COM is provided on an "as is" and "as available" basis. Hackett Financial Advisors, Inc. makes no warranty that HACKETTADVISORS.COM will be uninterrupted, timely, secure or error free. No charts, graphs, formulae, theories or methods of securities analysis can guarantee profitable results. This document does not purport to be a complete description of the securities or commodities, market or developments to which reference is made.
The information contained in HACKETTADVISORS.COM (this website), in the HACKETT MONEYFLOW REPORT and in the HACKETT STOCK REPORT has been taken from trade and statistical services and other sources, which we believe are reliable. Hackett Financial Advisors, Inc. does not guarantee that such information is accurate or complete and it should not be relied upon as such. The HACKETT MONEY FLOW REPORT and the HACKETT STOCK REPORT are written as weekly tools to help investors make better financial decisions. Any opinions expressed reflect judgments at this date and are subject to change without notice. The principals of Hackett Financial Advisors, Inc. and others associated or affiliated with it may recommend or have positions which may not be consistent with the recommendations made. Each of these persons exercises judgment in trading and readers are urged to exercise their own judgment in trading. Past Performance is not indicative of future results. . FUTURES AND COMMODITIES TRADING AND STOCK INVESTING AND TRADING INVOLVES SIGNIFICANT RISK AND IS NOT SUITABLE FOR EVERY INVESTOR. INFORMATION CONTAINED HEREIN IS STRICTLY THE OPINION OF ITS AUTHOR AND IS INTENDED FOR INFORMATIONAL PURPOSES AND IS NOT TO BE CONSTRUED AS AN OFFER TO SELL OR A SOLICITATION TO BUY OR TRADE IN ANY COMMODITY OR SECURITY MENTIONED HEREIN. INFORMATION IS OBTAINED FROM SOURCES BELIEVED RELIABLE, BUT IS IN NO WAY GUARANTEED. OPINIONS, MARKET DATA AND RECOMMENDATIONS ARE SUBJECT TO CHANGE AT ANY TIME. PAST RESULTS ARE NOT INDICATIVE OF FUTURE RESULTS.
^back to top^

Page 23 of 23 © Copyright 2007- 2020 Hackett Financial Advisors, Inc
The Hackett Money Flow Commodity Report July 29, 2020
CCoommmmooddiittyy MMaarrkkeett AAnnaallyyssiiss FFoorr HHeeddggeerrss aanndd IInnvveessttoorrss
This material has been prepared by a sales or trading employee or agent of Hackett Financial Advisors Inc. and is, or is, a solicitation. This material is not a research report prepared by R.J. O’Brien’s Research Department. By accepting this communication, you agree that you are an experienced user of the futures markets, capable of making independent trading decisions, and agree that you are not, and will not, rely solely on this communication in making trading decisions. DISTRIBUTION IN SOME JURISDICTIONS MAY BE PROHIBITED OR RESTRICTED BY LAW. PERSONS IN POSSESSION OF THIS COMMUNICATION INDIRECTLY SHOULD INFORM THEMSELVES ABOUT AND OBSERVE ANY SUCH PROHIBITION OR RESTRICTIONS. TO THE EXTENT THAT YOU HAVE RECEIVED THIS COMMUNICATION INDIRECTLY AND SOLICITATIONS ARE PROHIBITED IN YOUR JURISDICTION WITHOUT REGISTRATION, THE MARKET COMMENTARY IN THIS COMMUNICATION SHOULD NOT BE CONSIDERED A SOLICITATION. The risk of loss in trading futures and/or options is substantial and each investor and/or trader must consider whether this is a suitable investment. Past performance, whether actual or indicated by simulated historical tests of strategies, is not indicative of future results. Trading advice is based on information taken from trades and statistical services and other sources that Hackett Financial Advisors Inc. believes are reliable. We do not guarantee that such information is accurate or complete and it should not be relied upon as such. Trading advice reflects our good faith judgment at a specific time and is subject to change without notice. There is no guarantee that the advice we give will result in profitable trades.
^back to top^