natural capital and ecosystem service valuation as tools ... · as tools to guide restoration and...
TRANSCRIPT

Natural capital and ecosystem service valuation as tools to guide restoration and climate
adaptation in the Delaware Estuary
Danielle KreegerScience DirectorPartnership for the Delaware Estuary

To be discussed
Making our efforts count:
why are NCV & ESV tools needed?
The Delaware Estuary
brief orientation
Other Applications
climate adaptation
ecological inventories
on the ground projects
Example: Regional Restoration
goals & approach
restoration matrices
NCV & ESV framework
case studies
Caveat – An Ecological Manhattan Project?

The Watershed
13,611 Square Miles

History as a “Working River”
1762 map showing Philadelphia on
the Delaware River
Slides adapted from Jonathan Sharp

Also a “Living River”

Delaware Estuary

Making our efforts countwhy are NCV & ESV tools needed?
$• Limited resources
• Broad CCMP
To have Highest Impact, must avoid redundancy, invest strategically
ESV is broadly applicable as anorganizing framework for prioritization
• Urgency
Complex System
• Large and complex system

Avoiding RedundancyBridge Science Sectors
Academia(40+ universities)
State & RegionalAgencies
Federal Agencies
Non-Profits& NGO’s
City Government
Industry Scientists

AtlanticStates Marine
FisheriesCommission
BenthicInventory
Workgroup*Prospective
Fill Vital Niches: Technical Committees

1. Conferences & Workshops• Delaware Estuary Science Conference (every 2 years)
Working Together

1. Conferences & Workshops
2. Science and Technical Committees
3. Watershed-Level Initiatives• Science Priority Setting (White Paper)
10. Invasive Species (monitoring, management & control)
9. Habitat Restoration and Enhancement (science & policy)
8. Ecosystem Functions (assessment and economic valuation of ecosystem
services)
7. Nutrients (forms, concentrations and relative balance of macro- and
micronutrients)
6. Food Web Dynamics (key trophic connections among functional dominant
biota)
5. Physical-Chemical-Biological Linkages (e.g., sediment budget effects on
toxics & biota)
4. Ecological Flows (effects of base and episodic flows on salt balance & biota)
3. Ecologically Significant Species & Critical Habitats (benthos, reefs,
horseshoe crabs)
2. Tidal Wetlands (status, trends and relative importance of different types)
1. Contaminants (forms, sources, fates & effects for different classes)
Top Ten Technical Needs for the Delaware Estuary
Prioritization

1. Conferences & Workshops
2. Science and Technical Committees
3. Watershed-Level Initiatives• Science Priority Setting (White Paper)• Conceptual Framework for System Traits
Prioritization
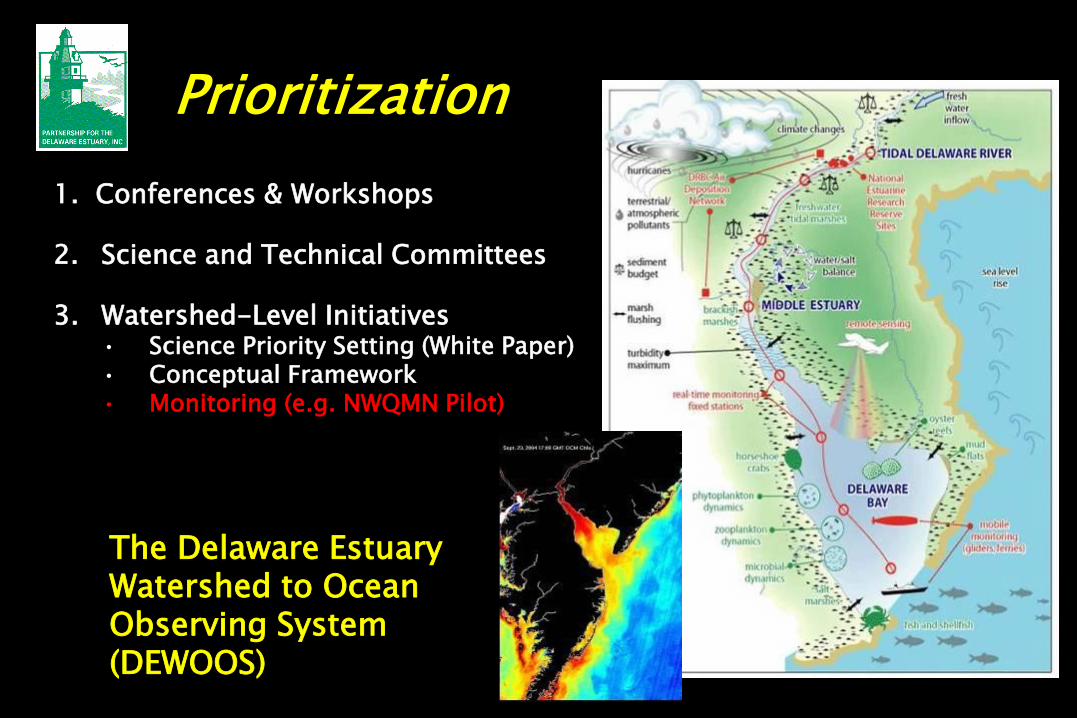
1. Conferences & Workshops
2. Science and Technical Committees
3. Watershed-Level Initiatives• Science Priority Setting (White Paper)• Conceptual Framework• Monitoring (e.g. NWQMN Pilot)
The Delaware Estuary Watershed to Ocean Observing System(DEWOOS)
Prioritization

1. Conferences & Workshops
2. Science and Technical Committees
3. Watershed-Level Initiatives• Science Priority Setting • Conceptual Framework• Monitoring
• Restoration
• State of the Estuary
AAA BBBllluuueeeppprrriiinnnttt fffooorrr aaa RRReeegggiiiooonnnaaalll RRReeessstttooorrraaatttiiiooonnn
IIInnniiitttiiiaaatttiiivvveee iiinnn ttthhheee DDDeeelllaaawwwaaarrreee EEEssstttuuuaaarrryyy
A Publication of the
PPPaaarrrtttnnneeerrrssshhhiiippp fffooorrr ttthhheee DDDeeelllaaawwwaaarrreee EEEssstttuuuaaarrryyy
AAA NNNaaatttiiiooonnnaaalll EEEssstttuuuaaarrryyy PPPrrrooogggrrraaammm www.DelawareEstuary.org
FFFeeebbbrrruuuaaarrryyy 222000000888
Prioritization

Restoration Restore, conserve or otherwise enhance ecosystem structure and function

…But Smartly
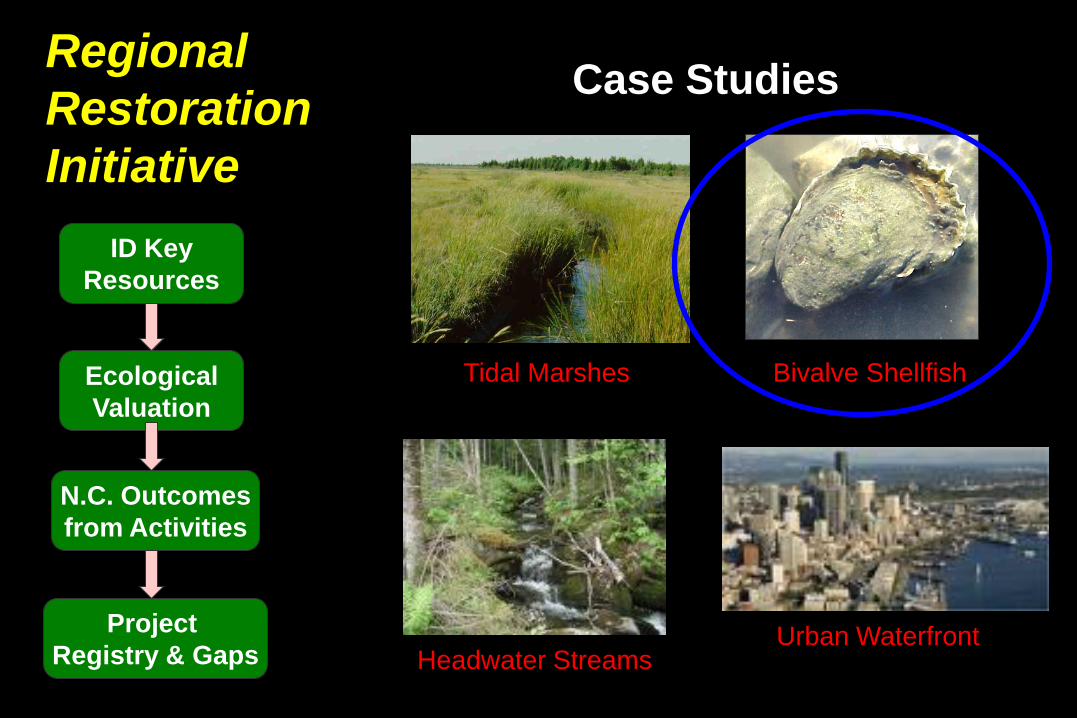
Regional Restoration Initiative
Includes:
• Protection
• Conservation
• Enhancement
• Restoration

Goals:
Characterize the most ecologically significant natural resources in different watershed regions
Assess ecological goods and servicesflowing from these resources
Use a natural capital valuation approach to identify highest value activities that maximize goods and services from these resources
Identify, inventory and rank specific projects that conserve, enhance or restore these resources
Identify high value activities for which we still need projects and work to fill gaps
Regional Restoration Initiative
Principles:
science-based
proactive
timely, responsive
comprehensive
multi-jurisdictional
Project Registry
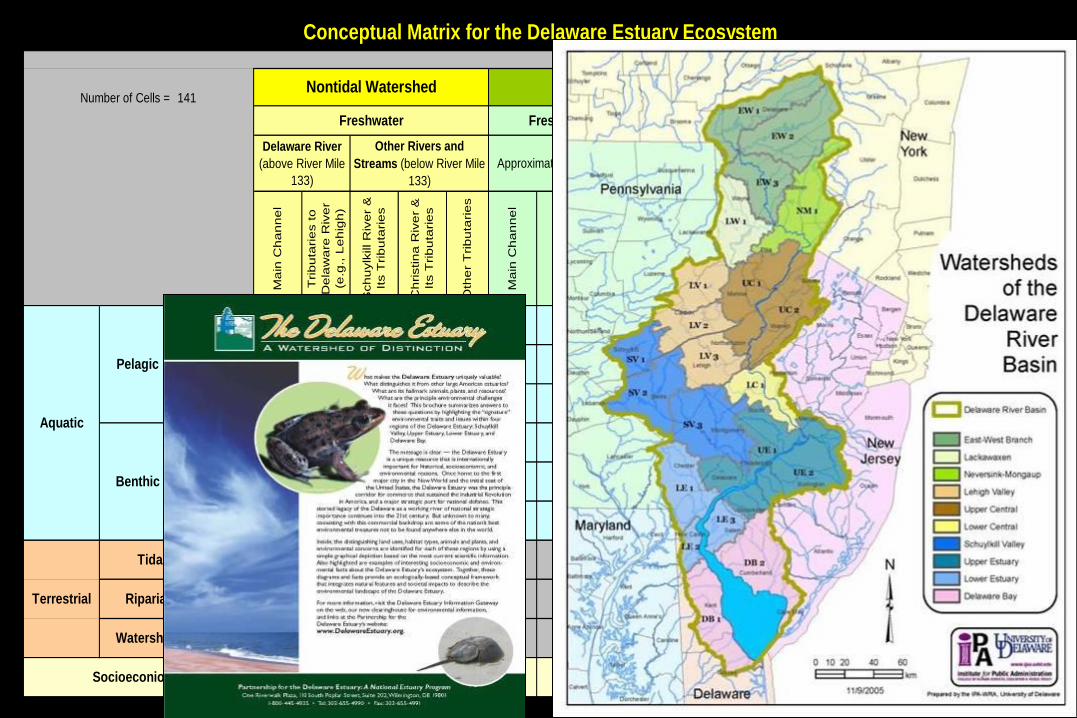
Table 20. A conceptual matrix framework summarizing the principal ecosystem and habitat components of the
Delaware Estuary. The cell numbering is arbitrary and meant to give a unique reference point to every cell.
Number of Cells = 141
Ma
in C
ha
nn
el
Trib
uta
rie
s t
o
De
law
are
Riv
er
(e.g
., L
eh
igh
)
Sch
uylk
ill R
ive
r &
Its T
rib
uta
rie
s
Ch
ristin
a R
ive
r &
Its T
rib
uta
rie
s
Oth
er
Trib
uta
rie
s
Ma
in C
ha
nn
el
Sh
allo
w S
ub
tid
al
Inte
rtid
al E
dg
es,
Sh
ore
lin
es
We
tla
nd
s
Ma
in C
ha
nn
el
Sh
allo
w S
ub
tid
al
Inte
rtid
al E
dg
es,
Sh
ore
lin
es
We
tla
nd
s
Ma
in C
ha
nn
el
Sh
allo
w S
ub
tid
al
Inte
rtid
al E
dg
es,
Sh
ore
lin
es
We
tla
nd
s
Physical 1a 2a 3a 4a 5a 6a 7a 8a 9a 10a 11a 12a 13a 14a 15a 16a 17a
Chemical 1b 2b 3b 4b 5b 6b 7b 8b 9b 10b 11b 12b 13b 14b 15b 16b 17b
Biological 1c 2c 3c 4c 5c 6c 7c 8c 9c 10c 11c 12c 13c 14c 15c 16c 17c
Physical 1d 2d 3d 4d 5d 6d 7d 8d 9d 10d 11d 12d 13d 14d 15d 16d 17d
Chemical 1e 2e 3e 4e 5e 6e 7e 8e 9e 10e 11e 12e 13e 14e 15e 16e 17e
Biological 1f 2f 3f 4f 5f 6f 7f 8f 9f 10f 11f 12f 13f 14f 15f 16f 17f
8g 9g 12g 13g 16g 17g
1h 2h 3h 4h 5h
1i 2i 3i 4i 5i 8i 9i 12i 13i 16i 17i
1j 2j 3j 4j 5j 6j 7j 8j 9j 10j 11j 12j 13j 14j 15j 16j 17j
Watershed Uplands**
Terrestrial
* Tidal buffers refer to upland areas immediately adjacent to tidal wetlands and shorelines that are at an elevation of less than 2 m above mean high tide. These are areas most susceptible to sea level rise
and most important for managing the landward migration of shorelines and wetlands.
** Terrestrial areas are distinguished as being either riparian zone habitat (here termed "riparian buffers") or watershed uplands, which is here taken to include forests, meadows, and developed lands. The
width of the riparian buffer will depend on the data source, with preference for the most widely adopted standards.
Aquatic
Approximately River Mile 58 to 82Approximately River Mile 82 to 133 Approximately River Mile 0 to 58
Pelagic
Benthic
Delaware River
(above River Mile
133)
Other Rivers and
Streams (below River Mile
133)
Conceptual Matrix for the Delaware Estuary Ecosystem
Socioeconiomic
Bay (>8 ppt)
Tidal Buffers*
Riparian Buffers**
Tidal Estuary
Freshwater
Nontidal Watershed
Freshwater (<1 ppt) Brackish (1-8 ppt)


Basic Restoration Matrix
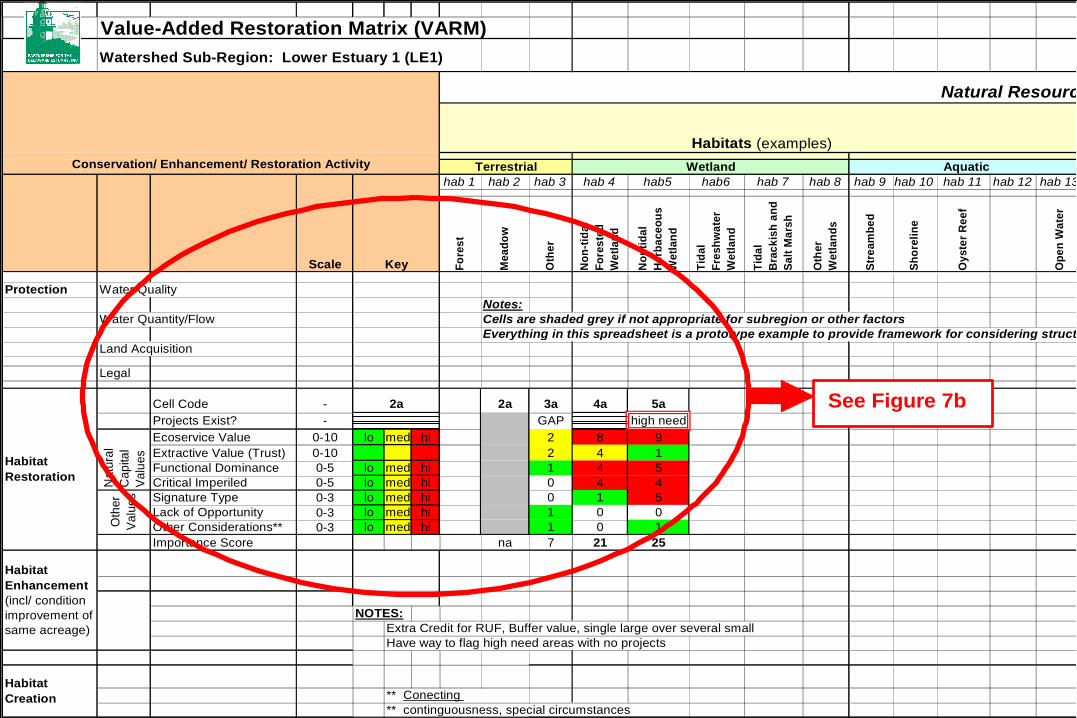
Value-Added Restoration Matrix (VARM)
Watershed Sub-Region: Lower Estuary 1 (LE1)
hab 1 hab 2 hab 3 hab 4 hab5 hab6 hab 7 hab 8 hab 9 hab 10 hab 11 hab 12 hab 13 liv 1 liv 2
Scale Fo
res
t
Me
ad
ow
Oth
er
No
n-t
ida
l
Fo
res
ted
We
tla
nd
No
nti
da
l
He
rba
ce
ou
s
We
tla
nd
Tid
al
Fre
sh
wa
ter
We
tla
nd
Tid
al
Bra
ck
ish
an
d
Sa
lt M
ars
h
Oth
er
We
tla
nd
s
Str
ea
mb
ed
Sh
ore
lin
e
Oy
ste
r R
ee
f
Op
en
Wa
ter
Sh
ore
bir
ds
So
ng
Bir
ds
Protection Water Quality
Notes:
Water Quantity/Flow Cells are shaded grey if not appropriate for subregion or other factors
Everything in this spreadsheet is a prototype example to provide framework for considering structure of restoration matrix; meaningless as to actual content
Land Acquisition
Legal
Cell Code - 2a 3a 4a 5a
Projects Exist? - GAP high need
Ecoservice Value 0-10 lo med hi 2 8 9
Extractive Value (Trust) 0-10 2 4 1
Functional Dominance 0-5 lo med hi 1 4 5
Critical Imperiled 0-5 lo med hi 0 4 4
Signature Type 0-3 lo med hi 0 1 5
Lack of Opportunity 0-3 lo med hi 1 0 0
Other Considerations** 0-3 lo med hi 1 0 1
Importance Score na 7 21 25
NOTES:
Extra Credit for RUF, Buffer value, single large over several small
Have way to flag high need areas with no projects
** continguousness, special circumstances
Habitat
Enhancement
(incl/ condition
improvement of
same acreage)
Habitat
Creation
Habitat
Restoration
Natu
ral
Cap
ita
l
Valu
es
Oth
er
Valu
es
2a
** Conecting
Conservation/ Enhancement/ Restoration Activity
Key
Living Resources (examples)
Terrestrial Wetland Aquatic Birds
Natural Resources
Habitats (examples)
See Figure 7b

Value-Added Restoration Matrix
Regional
Restoration
Initiative
Tidal Marshes Bivalve Shellfish
ID Key
Resources
Ecological
Valuation
N.C. Outcomes
from Activities
Project
Registry & Gaps Headwater Streams
Case Studies
Urban Waterfront

Oysters and Other Bivalve Shellfish
39.1
39.2
39.3
39.4
39.5
39.1
39.2
39.3
39.4
39.5
75.5 75.4 75.3 75.2 75.1
75.5 75.4 75.3 75.2 75.1
Round Island
Upper Arnolds
Arnolds
Upper Middle
Middle
Shell R ock
Ship John
Cohans ey
Nantux ent
Bennies
Bennies Sand
Vexton
Egg IslandLedge
New Beds
BeadonsHawk's Nes t
StrawberryHog Shoal
6.5 - 14.5 ppt
9.0 - 16.5 ppt
14 .0 - 20.0 pp t
17 .0 - 22.5
pp t
UPPER
UPPER CENTRAL
CENTRAL
LOWER
Sea Breeze
From Rutgers HSRL


Others?
DRBC
Crassostrea virginica
Elliptio complanata
Geukensia demissa
11 Other Species of Freshwater Unionid Mussels
Mya arenaria
Rangia cuneata
Corbicula fluminea
Mytilus edulis
Ensis directus
Mercenaria mercenaria

CTUIR Freshwater Mussel Project
DE Living Shorelines 2008
Marsh MusselsFreshwater Mussels
0
5
10
15
20
25
30
35
Millio
ns
o
f P
ou
nd
s
1860 1880 1900 1920 1940 1960 1980 2000
Year
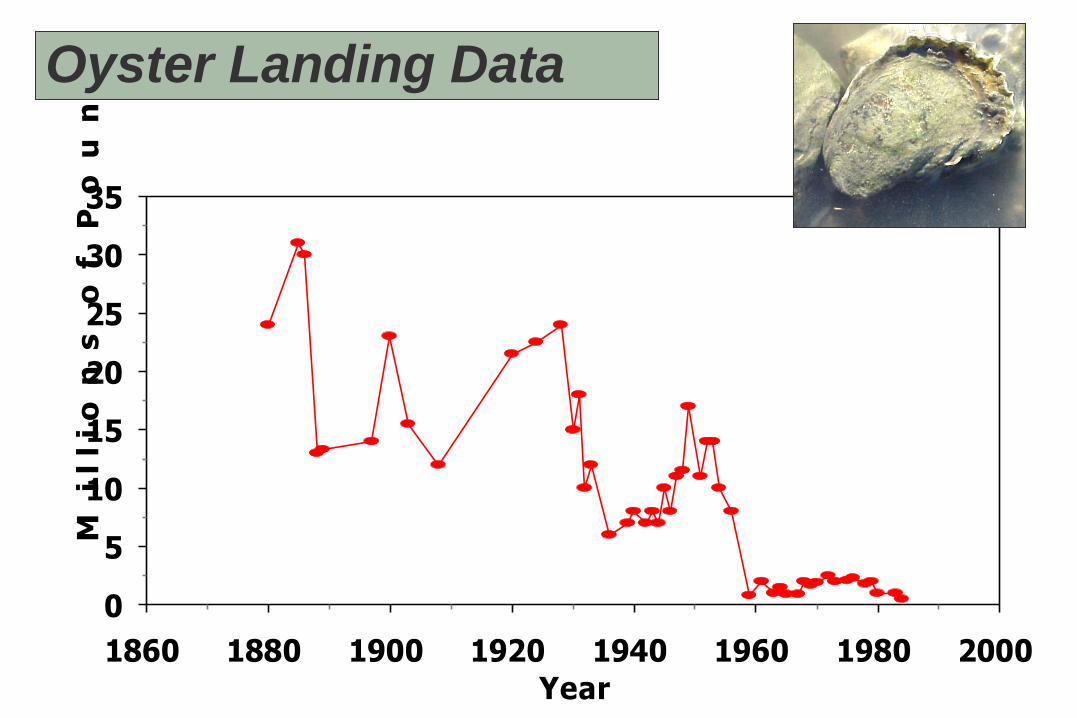
Oyster Landing Data
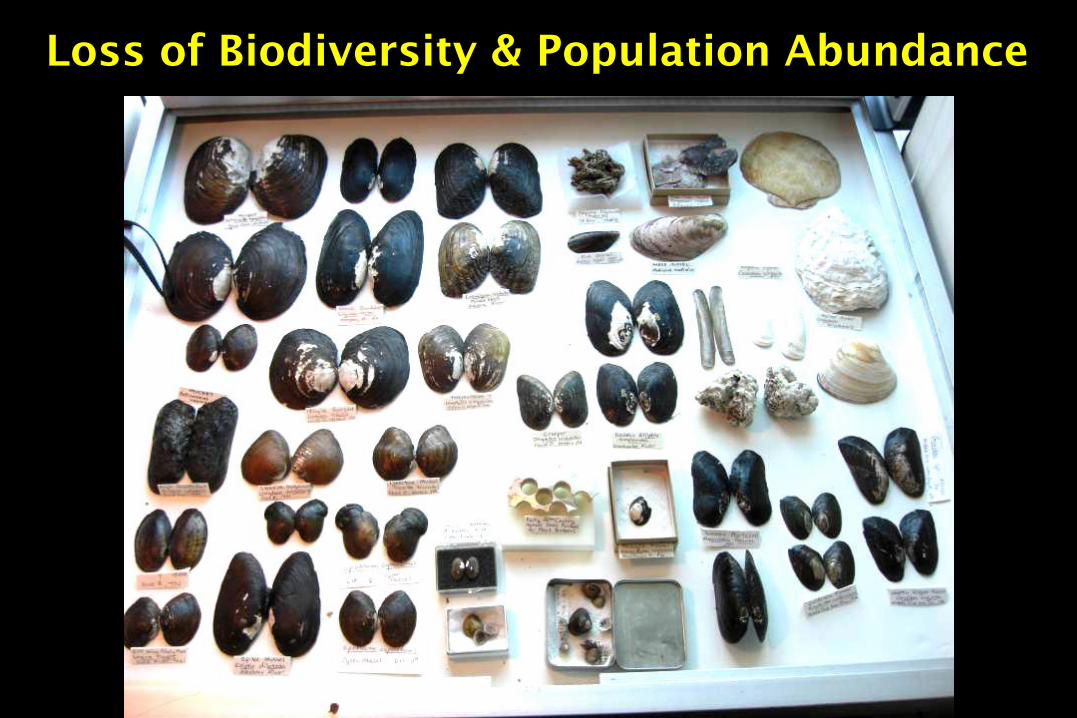
Loss of Biodiversity & Population Abundance

Scientific Name Scientific Name DE NJ PA
ALASMIDONTA HETERODON DWARF WEDGEMUSSEL Endangered Endangered Critically Imperiled
ALASMIDONTA UNDULATA TRIANGLE FLOATER Extirpated ? Threatened Vulnerable
ALASMIDONTA VARICOSA BROOK FLOATER Endangered Endangered Imperiled
ANODONTA IMPLICATA ALEWIFE FLOATER Extremely Rare no data Extirpated ?
ELLIPTIO COMPLANATA EASTERN ELLIPTIO common common Secure
LAMPSILIS CARIOSA YELLOW LAMPMUSSEL Endangered Threatened Vulnerable
LAMPSILIS RADIATA EASTERN LAMPMUSSEL Endangered Threatened Imperiled
LASMIGONA SUBVIRIDIS GREEN FLOATER no data Endangered Imperiled
LEPTODEA OCHRACEA TIDEWATER MUCKET Endangered Threatened Extirpated ?
LIGUMIA NASUTA EASTERN PONDMUSSEL Endangered Threatened Critically Imperiled
MARGARITIFERA MARGARITIFERA EASTERN PEARLSHELL no data no data Imperiled
PYGANODON CATARACTA EASTERN FLOATER no data no data Vulnerable
STROPHITUS UNDULATUS SQUAWFOOT Extremely Rare Species of Concern Apparently Secure
State Conservation Status
Patchy, Impaired ExtirpatedRare
PDE Study Area


Ecosystem Services
1. Structure
Binding of Bottom
Bottom Turbulence
Habitat Complexity
2. Function
Suspended Particulates
Particulate N, P
Light
Sediment Enrichment
Recycle Dissolved Nutrients

Start
8 adult musselsNo mussels
Slide from Catherine Gatenby, USFWS
Clean Water

Later
8 adult musselsNo mussels
Slide from Catherine Gatenby, USFWS
Biofiltration Potential

Susquehanna
Delaware Bay Oysters
Crassostrea virginica
Brandywine River, PA
Geukensia demissa
Delaware Estuary Marshes
Elliptio complanata
Brandywine River, PA

Estimate of Water Processing Potential
Elliptio complanata
4.3 Billion Elliptio
= 2.9 Million Kilos Dry Tissue Weight
= 9.8 Billion Liters per Hour

Geukensia demissaSalt Marshes
208,000 per hectare on average10.5 Billion GeukensiaClearance Rate = 5.1 L h-1 g-1(DK data)
11.7 Million Kilos Dry Tissue Weight
= 59.0 Billion Liters per Hour

Oysters on Seed Bed Reefs
2.0 Billion Crassostrea (Powell, 2003 data)
Mean size = 0.87 g dry tissue weight (DK data)
Clearance Rate = 6.5 L h-1 g-1(Newell et al 2005)
= 11.2 Billion Liters per Hour

Population-Level Water ProcessingB
illi
on
s o
f L
iters
per
Ho
ur
0
10
20
30
40
50
60
Elliptio complanata
Geukensia demissa
Crassostrea virginica
What do we get
back if we rebuild
lost populations?
If we have to
choose, which
activities yield
greatest
outcomes?
Space and time
considerations
are important

•

www.livingclassrooms.org/lbo/dermo/oyster2.jpg
http://www.pac.dfo-mpo.gc.ca/sci/shelldis/images/pmdoy5.jpg
From DRBC
Oyster Disease and Salinity
From Rutgers HSRL
Salt Line Location

Oyster ManagementCan they maintain (or be maintained) until they might see more optimal conditions?
0
100
200
300
400
500
600
700
800
900
1000
53 55 57 59 61 63 65 67 69 71 73 75 77 79 81 83 85 87 89 91 93 95 97 99 1 3 5 7
Year
Num
ber
per
Bush
el
Oyster Spat Mean Oyster Mean Spat
1758 Longer
Growing
Season
Intertidal Niche
Expansion?
To
day
2030
2060
Point of No Return
No Help
With Help
2 Recruitment
Events
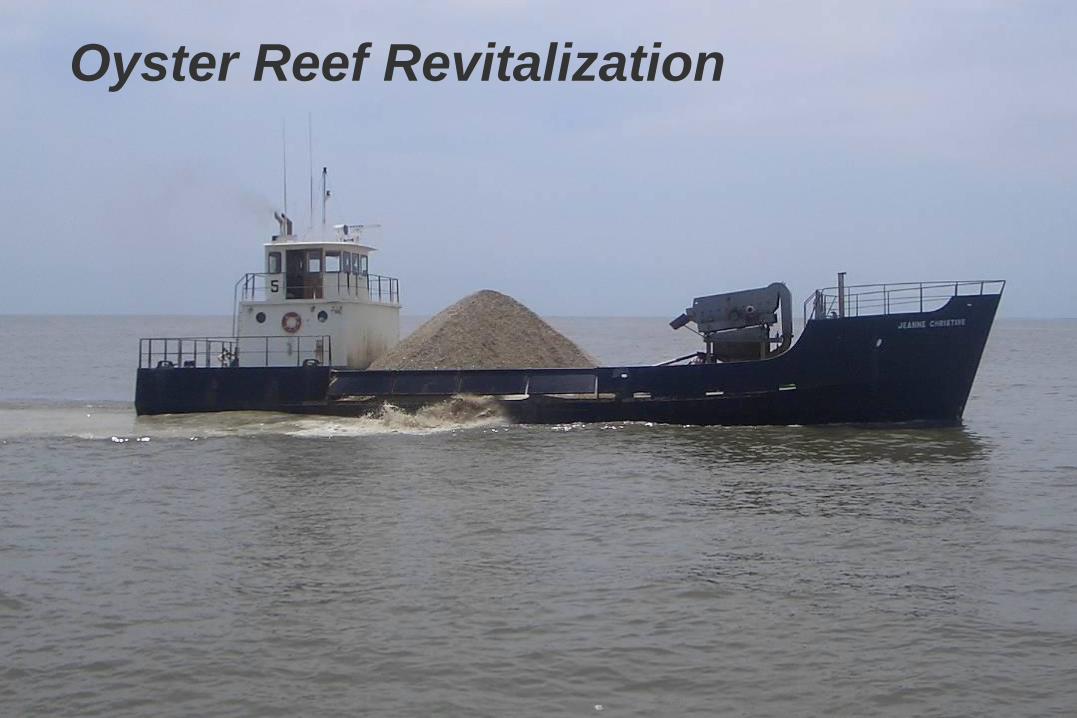
Oyster Reef Revitalization

Oysters
Crassostrea
virginica
Commercial Dockside Product + Secondary Value
Na
tura
l C
ap
ita
l V
alu
eImportance of Bivalves to the
Delaware Estuary Watershed

Oysters
Crassostrea
virginica
Commercial Dockside Product + Secondary Value
Ecosystem
Services
Structural Habitat
biological hot spots
Prey
Biofiltration
top-down grazing, TSS removal, light)
Biogeochemistry
enrichment/turnover, benthic production
Shoreline Protection - nearshore reefs
Shoreline Stabilization - living edges
Na
tura
l C
ap
ita
l V
alu
eImportance of Shellfish to the
Delaware Estuary Watershed

Oysters
Crassostrea
virginica
Commercial Dockside Product + Secondary Value
Ecosystem
Services
Structural Habitat
biological hot spots, bottom-binding
Prey
Biofiltration
top-down grazing, TSS removal, light)
Biogeochemistry
enrichment/turnover, benthic production
Shoreline Protection - nearshore reefs
Shoreline Stabilization - living edges
Cultural-
Historical
Waterman Lifestyle, Ecotourism
Native American - dietary staple Na
tura
l C
ap
ita
l V
alu
eImportance of Shellfish to the
Delaware Estuary Watershed

Oysters
Crassostrea
virginica
Commercial Dockside Product + Secondary Value
Ecosystem
Services
Structural Habitat
biological hot spots, bottom-binding
Prey
Biofiltration
top-down grazing, TSS removal, light)
Biogeochemistry
enrichment/turnover, benthic production
Shoreline Protection - nearshore reefs
Shoreline Stabilization - living edges
Cultural-
Historical
Waterman Lifestyle, Ecotourism
Native American - jewelry, dietary staple
Bioindicator
Watershed Indicators
hallmark resource status/trends
Site-specific Bioassessment
NS&T, caged sentinels
Na
tura
l C
ap
ita
l V
alu
eImportance of Shellfish to the
Delaware Estuary Watershed

OystersMarsh
Mussels
Crassostrea
virginica
Geukensia
demissa
Commercial Dockside Product + Secondary Value
Ecosystem
Services
Structural Habitat
biological hot spots, bottom-binding
Prey
Biofiltration
top-down grazing, TSS removal, light)
Biogeochemistry
enrichment/turnover, benthic production
Shoreline Protection - nearshore reefs
Shoreline Stabilization - living edges
Cultural-
Historical
Waterman Lifestyle, Ecotourism
Native American - jewelry, dietary staple
Bioindicator
Watershed Indicators
hallmark resource status/trends
Site-specific Bioassessment
NS&T, caged sentinels
Na
tura
l C
ap
ita
l V
alu
eImportance of Shellfish to the
Delaware Estuary Watershed

OystersMarsh
Mussels
FW
Mussels
Crassostrea
virginica
Geukensia
demissa
Elliptio
complanata
Commercial Dockside Product + Secondary Value
Ecosystem
Services
Structural Habitat
biological hot spots, bottom-binding
Prey
Biofiltration
top-down grazing, TSS removal, light)
Biogeochemistry
enrichment/turnover, benthic production
Shoreline Protection - nearshore reefs
Shoreline Stabilization - living edges
Cultural-
Historical
Waterman Lifestyle, Ecotourism
Native American - jewelry, dietary staple
Bioindicator
Watershed Indicators
hallmark resource status/trends
Site-specific Bioassessment
NS&T, caged sentinels
ConservationBiodiversity
fw mussels most critically impaired biota
Na
tura
l C
ap
ita
l V
alu
eImportance of Shellfish to the
Delaware Estuary Watershed
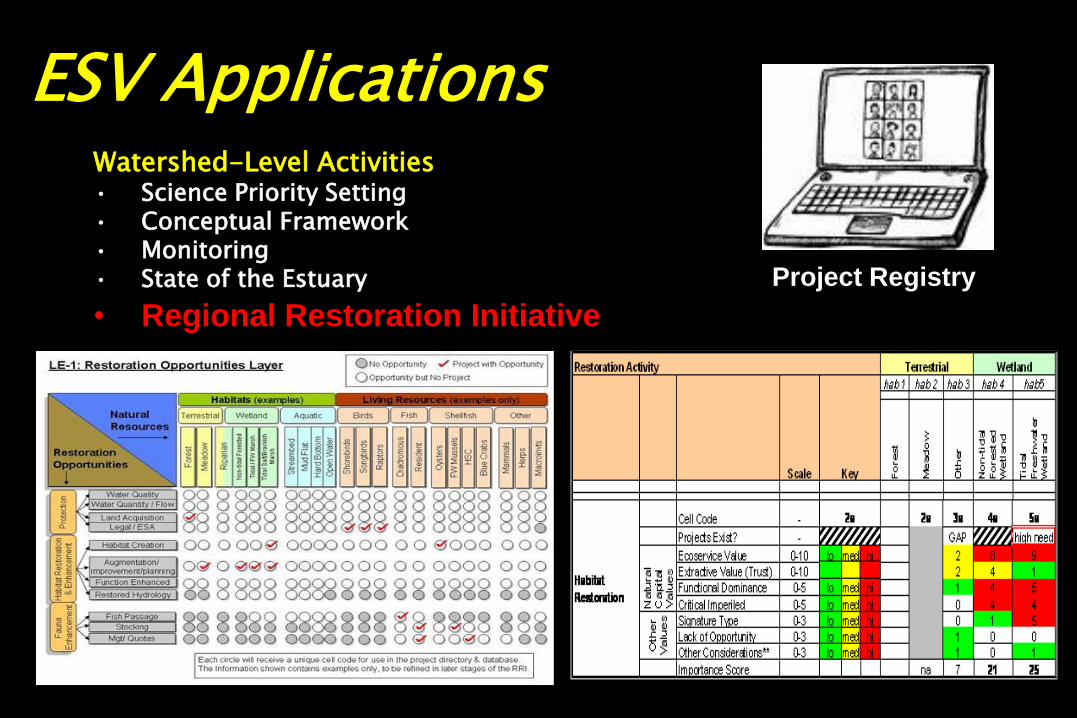
Watershed-Level Activities• Science Priority Setting• Conceptual Framework• Monitoring• State of the Estuary
• Regional Restoration Initiative
ESV Applications
Project Registry

Watershed-Level Activities• Science Priority Setting (White Paper)• Conceptual Framework• Monitoring• State of the Estuary
• Regional Restoration Initiative
Ecological Inventories- Natural Vegetation
Classification System- Delaware Estuary Benthic Inventory
Applications

Applications
Watershed-Level Activities• Science Priority Setting
• Conceptual Framework
• Monitoring
• State of the Estuary
• Regional Restoration Initiative
Ecological Inventories• Natural Vegetation Classification System
• Delaware Estuary Benthic Inventory
Science & Restoration Projects
• Freshwater Mussel Recovery Program

Propagation and Reintroduction
Hatchery

Propagation and Reintroduction
Photos, R. Neves, VA Tech
Propagated Juveniles

Freshwater Mussel Recovery Program
0
200400
600800
1,0001,200
1,4001,600
1,8002,000
Millions of
Liters
Processed
1 2 4 6 8 10 15 30
Years After Planting
Series1
Not including progeny
Goals are Being Set Based on Ecosystem Services

Applications
Watershed-Level Activities• Science Priority Setting (White Paper)
• Conceptual Framework
• Monitoring
• State of the Estuary
• Regional Restoration Initiative
Ecological Inventories• Natural Vegetation Classification System
• Delaware Estuary Benthic Inventory
Science & Restoration Projects• Freshwater Mussel Recovery Program
• Delaware Estuary Living Shorelines
Sea Level Rise

• Reduce wave energy
• Trap silt
• Reduce bank erosion
• Protect salt marsh
Shellfish as Natural Breakwaters
Slide from Dave Bushek, Rutgers
Delaware Estuary Living Shoreline Initiative

Living Shorelines

Applications
Watershed-Level Activities• Science Priority Setting (White Paper)
• Conceptual Framework
• Monitoring
• State of the Estuary
• Regional Restoration Initiative
Ecological Inventories• Natural Vegetation Classification System
• Delaware Estuary Benthic Inventory
Science & Restoration Projects• Freshwater Mussel Recovery Program
• Living Shorelines
Climate Adaptation Planning
• Ready Estuaries Pilot

PDE Climate Ready Approach
Vulnerability
Assessment
Natural Capital
Valuation
Management &
Adaptation Options
Drinking Water
Tidal Wetlands
Bivalve Shellfish
Management
and Policy
Climate
WorkgroupCase Study
Subgroups
Adaptation
Plan
Outreach,
Education,
Messaging

Ecosystem Services in PDE ScienceRegional
Restoration
Initiative
Targeted
On-the-Ground
Projects
Climate
Adaptation
ESV

Summary Ecosystem Services Valuation represents a powerful tool to ensure that functional processes are studied, monitored and used to prioritize CCMP activities in the same way as structural aspects (e.g., acres)
ESV can provide uniform units/currency for quantifying and comparing natural resource benefits across time and space
ESV, together with other natural capital values, can help put natural resources on a more even footing with developed assets
Caveat
ESV may be an Ecological Manhattan ProjectCare must be taken not to excuse the loss of low condition, lower value resources that might otherwise be protected or restored

- End -