natural background radiation in the - ideals
TRANSCRIPT
I I t
I '
r ··i55o. � · N:l.1�1-,
� ,,87
NATURAL BACKGROUND RADIATION IN THE PROPOSED ILLINOIS SSC SITING AREA
Robert H. Gilkeson Richard A. Cahill Craig R. Gendron Douglas Laymon
Steve Padovani Lisa M. Kulju
Mukund Ramamurthi
June 1987
Illinois Department of Energy and Natural Resources
STATE GEOLOGICAL SURVEY DIVISION
NATURAL BACKGROUND RADIATION IN THE PROPOSED ILLINOIS SSC SITING AREA
Robert H . Gilkeson Richard A. Cahill Craig R. Gendron
Douglas Laymon Steve Padovani Lisa M. Kulju
Mukund Ramamurthi
June 1987
ILL INOIS STATE GEOLOGICAL SURVEY Natural Resources Building 615 East Peabody Drive Champaign, Illinois 61820
Illinois Department of Energy and Natural Resources STATE GEOLOGICAL SURVEY DIV ISION .

/j. I� •
EXECUTIVE SUMMARY
The major source of radiation exposure to man is from natural radioactivity in the environment. A rigorous characterization of these natural radiation sources is important for siting the Superconducting Super Collider (SSC). Man interacts with the natural environment in different ways as a function of occupation and life style. Therefore, an accurate understanding of the radiation dose delivered to man requires both broad and discrete characterization of the components of the total radioactivity environment.
This document addresses section 2.2.3.3.6.1 in the DOE Invitation for the Site Proposals for the SSC which states:
Volume 5 shall provide information on available data pertaining to soil/rock and groundwater radioactivity levels in the region of the proposed site.
A large set of data exists to establish a baseline for background radioactivity in the siting area. The major terrestrial sources of background radioactivity are radioactive elements that are members of the decay series of the two primordial radioactive elements, uranium-238 and thorium-232, and the primordial radioactive element, potassium-40. These radioactive elements are distributed in soils (principally unlithified glacial sediments), bedrock, and groundwaters of the proposed study area for the Superconducting Super Collider (SSC).
The surficial soils (glacial sediments) are the source for one significant component of the natural radioactivity environment - gamma radiation at land surface. An airborne total gamma radiation survey flown over the Chicago region (including the proposed siting area) determined a mean value for the terrestrial absorbed dose rate in air of 42 mrad/yr. For comparison, the average for all gamma radiometric surveys in the middle United States is 46 mrad/yr with a range of 35 to 75 mrad/yr.
A national airborne gamma-ray spectrometer survey was conducted by the �ited;�Department of Energy (DOE). The data set from the survey can be 1nterpr�ed to calculate equivalent concentrations of potassium (K), uranium
���s a1�o�hb�� uto ( i :�) p:fEe��ln§!�e��k;·�·6, i��,3·��-?·�i�;�-a�JJ!t� .,�,�����
from 5.5 to 7.0 ppm. These concentrations are low when compared to average values measured in surficial materials around the world.
The surficial glacial sediments are the major source for radon concentrations in indoor atmospheres. Concentrations of radon in groundwater resources in the proposed siting area are low and of no environmental concern. United States Environmental Protection Agency (U.S. EPA) has issued an action guideline of 4 pCi/L for radon in indoor atmospheres. National surveys are underway to characterize regional variations in indoor radon concentrations. Analysis of data for the eight-county region of northeastern Illinois (including the SSC siting area) determined an arithmetic mean of 2.3 pCi/L; a value that is significantly lower than either the national mean of 3.�4 pCi/L or the U.S. EPA action guideline.
i

The average radioactive element concentrations for the major lithologic groups as measured by two separate techniques fall below the state and national levels. Clean sandstones and dolomites have very low concentrations of radioactive elements. The tunnel is to be constructed in Galena and Platteville dolomite. Even the highest concentrations of radioactive elements, which occur in shales and shaly sandstones, are relatively low and of no environmental concern. Bedrock in the proposed siting area does not contain materials of high radioactivity such as coal measures or uraniferous deposits. Rock debris generated during construction of shafts or the tunnel does not pose a radioactivity hazard that requires special handling or disposal.
Underground structures require monitoring to assure that atmospheric radon concentrations do not exceed occupational levels. The low concentrations of uranium and thorium in the dolomite and the low concentrations of radon in groundwater from these rocks are evidence that atmospheric radon concentrations will be readily controlled; conventional ventilation required for other reasons will likely reduce radon concentrations to low values.
U.S. EPA is in the process of setting drinking water standards for radium, uranium and radon. Groundwater resources are important for domestic and public water supplies in the SSC siting area. The majority of domestic supplies and many public supplies are obtained from wells that are 100 to 300 feet deep finished in sand and gravel deposits or in dolomite bedrock. An abundant data base exhibits that groundwaters from these aquifers have low concentrations of radioactive elements and are in compliance with drinking water standards.
Wells more than 1000 feet deep that produce groundwater from confined sandstones in the Cambrian and Ordovician bedrock are an important source of public water supplies in the siting area. In the proposed siting area, this source of groundwater has low values of uranium and radon but commonly exceeds the U.S. EPA interim standard of 5.0 pCi/L for dissolved radium. Concentrations are less than 10 pCi/L over much of the siting area but do exceed 20 pCi/L locally. The U.S. EPA has received expert testimony that the standard is conservative and that concentrations present over the majority of the siting area are of no concern for public health. It is also wellestablished that conventional water treatment methods (such as lime-sludge softening and ion-exchange resins) efficiently reduce radium concentrations to levels below the Drinking Water Standard.
In conclusion, there is a large set of data on the natural radioactivity of soils/bedrock and groundwater in the proposed siting area. An evaluation of this data indicates that the total natural radioactivity environment in the . proposed siting area has low background value and poses no problems for construction and operation of the Superconducting Super Collider in Illinois.
i i
TABLE OF CONTENTS
LIST OF TABLES AND FIGURES
INTRODUCT ION
EXTRATERRESTRIAL RADIATION
TERRESTRIAL RADIATION
Gamma Radiation at Ground Surface
Natural Radioactivity of Geologic Materials in the Proposed
Siting Region
v'.) (IRBORNE RADON CONCENTRATIONS IN THE OUTDOORS, INDOORS,
(,, \le ·AND UNDERGROUND SHAFTS AND TUNNELS
Airborne concentrations of 222Rn outdoors
Airborne concentrations of 222Rn indoors
Airborne concentrations of 222Rn in underground shafts
and tunnels
NATURAL RADIOACTIVE ELEMENTS IN GROUNDWATER
Aquifers in the glacial drift and shallow bedrock
Confined aquifers in the Maquoketa Shale Group and
Galena-Platteville Dolomite
Groundwater from Sandstone Aquifers in the Cambrian
Ordovician Bedrock
SUMMARY
REFERENCES
APPENDIX A: Gross Alpha and Beta Radiation in Groundwater
from Public Water Supply Wells
iii
iv
1
1
2
2
3
11
11
12
13
17
17
18
18
19
20
23

LIST OF TABLES AND FIGURES
TABLES
1. Explanation of Pseudo contours 2. Mean Concentrations of Potassium, Uranium, and Thorium
in Major Bedrock Units in the Proposed SSC Siting Area 3. Concentrations of major radionuclides in major rock types
and soils 4. Summary of Uranium, Thorium, and Potassium Data for Major
Illinois Rock Types 5. 222Rn Concentrations measured in 144 Residences 6. 222Rn Concentrations In Indoor Living Space By Counties
in Northeastern Illinois 7. 222Rn Concentrations In Soil Gas And Atmospheres
at a United States Geological Survey Research Area Near Sheffield, Bureau County, Illinois
8. Concentrations of 222Rn, 238u plus 234u in Groundwater from the glacial drift, dolomite bedrock, and St. Peter Sandstone in the SSC Study Area
FIGURES 1. Radioactive decay series of 238u 2. Radioactive decay series of 232Th 3. Whole�body absorbed dose rates in ARMS areas
� 5
9
10
10 1 2
13
14
1 6
26 27 28
4. Areal surveys over nuclear reactor sites 28 5. Location of Aurora, Rockford, Chicago, and Racine Quadrangles 29 6. A pseudo contour plot of the variation in total count
of gamma radiation from surficial geologic materials in the SSC study area
7. A pseudo contour plot of the variation in concentration of potassium in surficial geologic materials in the SSC study area
8. A pseudo contour plot of the variation in equivalent thorium
30
30
in surficial geologic materials in the SSC study area 31 9. A pseudo contour plot of the variation in equivalent uranium
in surficial geologic materials in the SSC study area 31
iv

Figures 10. Map of the SSC study area showing the location
of three boreholes where geologic materials were characterized for natural radioactivity
11. Spectral gamma ray records showing concentrations of total potassium (%) , equivalent thorium (ppm) and equivalent uranium (ppm) for in situ measurements in three
32
boreholes in the SSC study area 33 1 2. Concentrations of total potassium (%) measured in geologic
materials in SSC-1 34 13. Concentrations of thorium (ppm) measured in geologic
materials in SSC-1 14. Concentrations of uranium (ppm) measured in geologic
materials in SSC-1 15� Concentrations of total potassium (%) measured in
geologic materials in SSC-2 1 6. Concentrations of thorium (ppm) measured in
geologic materials in SSC-2 1 7. Concentrations of uranium (ppm) measured in
geologic materials in SSC-2 18. Concentrations of total potassium (%) measured in
geologic materials in SSC-3 19. Concentrations of thorium (ppm) measured in
geologic materials in SSC-3 20. Concentrations of uranium (ppm) measured in
geologic materials in SSC-3 21. Plot of potassium concentrations measured with
instrumental neutron activation analysis versus equivalent potassium concentrations measured in situ with a borehole spectral gamma radiation sonde
22. Plot of uranium concentrations measured with instrumental neutron activation analysis versus equivalent uranium concentrations measured in situ with a borehole spectral gamma radiation sonde
v
34
3 5
35
36
36
37
37
38
39
40

Figures 23. Plot of thorium concentrations measured with
instrumental neutron activation analysis versus equivalent thorium concentrations measured in situ with a borehole spectral gamma radiation sonde
24. Map of the SSC study area showing the locations where groundwater samples were collected for analyses of natural radioactive elements
25. Stratigraphic column of drift (Quaternary) deposits in northern Illinois
41
42
43 26. Stratigraphic column of bedrock units in the SSC study area 44 27. Map of the region of the SSC study area showing the
variation of dissolved concentration of 226Ra in groundwater from the Cambrian-Ordovician bedrock 45
28. Map of the region of the SSC study area showing the dissolved concentration of 228Ra in groundwater from the Cambrian-Ordovician bedrock 46
29. Map of northern Illinois showing the variation of dissolved concentration of 226Ra plus 228Ra in groundwater from the Cambrian-Ordovician bedrock 47
30. Map of the region of the SSC study area showing the variation of dissolved concentration of 234u plus 238u in groundwater from the Cambrian-Ordovician bedrock 48
31. Map of the region of the SSC study area showing the variation of dissolved concentration of 222Rn in groundwater from the Cambrian-Ordovician bedrock
vi
49

INTRODUCTION
The major source of radi at i on exposure to man i s rad i ati on from natural sources i n the envi ronment. A r i g orous characteri zat i on of these n atural radi at i on sources i s i mportant for s i t i ng the Superconducti ng Super Col l i der (SSC) . Iss ues to be addressed i ncl ude the pre - operat i onal n atural background radi at i on dosage to the publ i c i n the s i t i ng reg i on , the i dent i fi cat i on of any changes i n the natural radi oact i v i ty background that may resul t from constructi on of the SSC, and the assessment of the dosage that natural radi oacti ve el ements present to workers dur i ng con struct i on and operat i on of the fac i l i ty. To accuratel y assess dosage, the natural radi oact i v i ty envi ronment must be eval uated i n a vari ety of ways. Th i s i s because man i nteracts wi th the natural envi ronment i n d i fferent ways as a funct i on of occupati on and l i fe styl e. Therefore, a compl ete understand i ng of the rad i at i on dosage del i vered to man requ i res both broad and d i screte ch aracteri zat i on of the components of the total n atural radi oacti v i ty envi ronment.
The natural rad i ati on env i ronment can be cl ass i fi ed as terrestri al and extraterrestr i al ( cosmi c ) sources. A broad treatment of extraterrestri al radi at i on i s adequate for characteri zat i on of dose i n the s i t i ng regi on. Th i s i s because extraterrestri al rad i at i on vari es as a funct i on of el evat i on. However, the terrestri al sources must be characteri zed both col l ect i vel y and d i scretely because of the d i fferent ways i n wh i ch man i nteracts wi th terrestri al sources of rad i ati on . The terrestri al and extraterrestri al source terms are descri bed separatel y. The natural source terms wi l l be brought together i n a l ater report ( EIS ) to prov i de an assessment of the total dose equ i val ent to man. (Note that the assessment does n ot i ncl ude technol og i cal l y enhanced s ources of rad i at i on s uch a s the nucl ear fuel cycl e.)
EXTRATERRESTRIAL RADIATION
The cosmi c rad i at i on dose cons i sts of pri mary part i cl es of extraterrestri al ori g i n as wel l as secondary part i cl es generated by i nteract i ons of the pri mary part i cl es wi th the atmosphere. The secondary part i cl es are referred to as cosmogen i c rad i onucl i des. The cosmi c radi at i on dose typ i cal l y contri butes about 30 to 50 percent of the total whol e - body dose from al l external envi ronmental rad i at i on ( NCRP, 1975).
The assessment of the cosmi c rad i at i on dose requ i res knowl edge of the compos i t i on , energy spectrum and angul ar d i stri buti on of the cosmi c -ray part i cl e fl ux, the spat i al and temporal vari at i on s of the cosmi c-ray i ntens i ty, and the d i stri but i on of the popul at i on wi th al t i tude and l at i tude. Exi st i ng i nformat i on i n these areas i s suffi c i ent to permi t a reasonabl e est imate of the average popul at i on exposure to cosmi c rad i at i on . The est i mate can therefore be based on the average el evat i on of the proposed SSC s i t i ng area.
Us i ng data of cosmi c- ray part i cl e fl ux dens i t i es and absorbed dose rates i n a i r, an al t i tude profi l e of the l ong-term average cosmi c - ray dose i n the l ower atmosphere may be i nferred ( NCRP, 1975). The ground - l evel el evat i on i n the proposed SSC s i t i ng area vari es from 600 - 950 feet above mean seal evel .
1 .

Us i ng an average el evat i on of 775 feet ( 325 m) , the whol e- body (gonadal ) dose i s cal cul ated to be 28 mrem/yr . The dose has been cal cul ated for a depth of 5 cm i n a 30 -cm cross sect i on of t i ssue, and a 1 0 percent reducti on has been appl i ed to account for the effect of structural sh i el d i ng . The average annual cosmi c rad i at i on dose to the enti re popul at i on of the Un i ted States has been esti mated to be 28 mrem/yr ( Oakl ey and Gol d i n , 1975 ) , wh i l e the average annual dose at sea l evel and i n Denver, CO (e l evat i on 1 600 m) are esti mated to be 26 mrem/yr and 50 mrem/yr, respect i vel y .
The major producti on of cosmogen i c radi onucl i des i s through the i nteract i on of cosmi c rays wi th atmospheri c gases . The four cosmogen i c rad i onucl i des that contri bute a measurabl e dose are carbon - 14 , hydrogen - 3 (tri t i um) , sod i um-22 , and beryl l i um- 7 . The geograph i c and vert i cal product i on rates of these nucl i des i n the atmosphere have been measured (Young et . al , 1 970a) or can be esti mated from cosmi c - ray data (Young et . al , 1 970b).
Very l i ttl e of the popul at i on dose from natural background rad i ati on i s contr i buted by cosmogen i c radi onucl i des . The average dose equ i val ent rate to the whol e body from cosmogen i c rad i onucl i des for a standard adul t i n the Un i ted States i s esti mated to be 0 . 7 mrem/yr, w ith es sent i al l y al l the dose ari s i ng from carbon - 1 4 ( NCRP, 1975) .
TERRESTRIAL RADIATION
The exposure of man to terrestri al rad i at i on ari ses from rad i onucl i des that are d i stri buted i n the geol og i c mater i al s of the earth or have been transferred from the earth to the atmosphere or hydrosphere . Water ( as groundwater or s oi l moi sture ) pl ays an i mportant rol e i n the tran sport of radi onucl i des !8 geol ogi c mater i al s . The s i gn i fi cant natural sources are potas s i um-40 � K) and the decay seri �§ of the two pri mord i al radi onucl i des, thor i um- 2 32 (
232
5Th) and uran i um-238 ( Bu). A th i rd pri mord i al radi onucl i de,
uran i um-235 ( 3 U) , h as a mass abundance rat i o to uran i um-238 of onl y 0 . 0073. Therefore, the uran i um- 235 ( act i n i um) decay seri es i s not s i gn i fi cant for natural rad i at i on exposure ( NCRP, 1 975 ) .
Potas s i um-40, wi th a h al f-l i fe of 1 . 26 x 109 years, decays d i rectl y to the stabl e el ement, cal c i um-40 . Both beta and gamma radi at i on are produced i n the d i s i ntegrat i on . The i sotop i c abundance of potas s i um-40 i s 0 . 0 1 18 percent of total potass i um .
The rad i oact i ve decay seri es of 238u and 232Th are shown i n F i gures 1 and 2, wh i ch present the hal f-l i fe and the mode of d i s i ntegrat i on ( al pha, beta, or gamma ) for seri es nucl i des .
Gamma Rad i ati on at Ground Surface
The natural l y occurri ng radi onucl i des i n near-surface geol og i c materi al s col l ect i vely supp ly a s i gn i fi cant component of the background rad i at i on exposure to the popul at i on . At ground surface, the s i gn i ficant exposure to man comes from the two terrestri al sources of gamma rad i at i on, rad i onucl i des i n the shal l ow geol og i c materi al s and radon daughters present i n the atmosphere (NCRP, 1975 ) . The external radi at i on from al pha and beta emi tters i n the ground or i n
2
the a i r does not contri bute a s i gn i fi cant absorbed dose ( NCRP, 1 975 ) .
Two total gamma rad i ometri c s urveys h ave been fl own over the SSC study area . The purpose of these areal rad i ol og i cal measuri ng system (ARMS ) surveys was to prov i de i nformat i on on the n atural background rad i at i on i n the reg i on surround i ng n ucl ear faci l i t i es . A d i screte anal ys i s of the gamma radi at i on spectrum was n ot performed i n the ARMS survey . Instruments measured the total fl ux of gamma rad i at i on wi th energ i es greater than 50 keV ( Burson , 1974) . Desp i te the l ack of d i screte anal ys i s of the gamma rad i ati on , the data gathered i n these surveys are val uabl e i n asses s i ng the total n atural gamma background radi at i on from terrestri al sources .
The fi rst rad i ometri c survey was fl own i n 1 959 over the Ch i cago reg i on as one of several surveys (ARMS 1 ) performed by the U . S . Geol og i cal Survey . The second s urvey was fl own over the Dresden nucl ear pl ant i n 1 97 1 and was one of several surveys fl own i n the v i c i n i ty of nucl ear power pl ants by the consul t i ng fi rm E . G . and G . , Inc . Most surveys were done before the pl ants were operat i ng; and, i n the others, n o reactor-produced radi onucl i des were detected (NCRP, 1 975) . The surveys were fl own at a he i ght of approxi matel y 500 ft on fl i ght l i nes that were spaced 1 mi apart . Oakl ey ( 1 972 ) anal yzed the rad i ometri c data from ARMS to cal cul ate a whol e- body absorbed dose rate for the Ch i cago reg i on ( fi g . 3) . The mean val ue for the reg i on was 4 . 8 µrad/hr (42 mrad/yr) . For compari son , F i gure 3 shows the cal cul ated absorbed dose rates i n other ARMS 1 areas .
Data from rad i ometri c surveys fl own over nucl ear pl ants were correl ated by Burson ( 1 974) . The resul ts for the Dresden area ( 5 3 mrad/yr) are compared to dose rates cal cul ated for other surveys over reactor areas in F i gure 4 . The majori ty of these surveys were pre - operat i onal . Appl y i ng a hous i ng factor of 0 . 80 ( Oakl ey, 1972 ) and a-gonadal and bone marrow screen i ng factor of 0 . 80 ( Bennett, .1970 ) , and assumi ng a qual i ty factor of un i ty, the cal cul ated gonadal or bone marrow dose equ i val ent rate for the Dresden area measurements are 0 . 8 x 0 . 8 x 53 x 1 µrad/yr = 34 mrem/yr .
Natural Rad i oact i v i ty of Geologi c Materi al s i n the Proposed S i t i ng Regi on
An accurate assessment of the radi oact i ve content i n the subsurface geol og i c materi al s i n the SSC s i t i ng area i s essent i al to the determi n at i on of pos s i bl e heal th h azards due to exposure to these materi al s . Informat i on on the natural radi oact i v i ty of surfi c i al geol ogi c mater i al s i s prov i ded from a nat i onal a i rborne spectral gamma rad i ati on survey conducted by the U. S . Department of Energy . Al though the areal survey d i rectly measured the natural rad i oacti v i ty of mater i al to a depth of onl y 30-60 cm, i t i s often i nterpreted to characteri ze the d i stri but i on of natural rad i oact i v i ty i n geol og i c materi al s to a depth of several meters . A measurement program was conducted to eval uate natural rad i oact i v i ty i n deep geol og i cal materi al s i n the proposed s i t i ng area. Th i s program i ncl uded measurements wi th an i n s i tu spectral gamma ray (SGR) geophys i cal tool in three borehol es and l aboratory anal ys i s of rock ch i ps from the three boreh ol es by i nstrumental neutron act i vat i on anal ys i s ( INAA) .
The a i rb.orne gamma ray spectrometer survey was fl own over Il l i noi s as part of t he U . S . Department of Energy's (DOE) Nat i onal Uran i um Resource Eval uat i on
3

Program ( NURE) . The s urvey methods and resul ts for the reg i on of Il l i noi s that i ncl udes the SSC study area are presented i n a DOE report ( 198la ) for the Aurora Quadrangl e . The l ocat i on of the Aurora Quadrangl e and the SSC study area are shown i n F i g ure 5 .
For the Aurora Quadrangl e, gamma ray spectral data were gathered on eastwest traverse l i nes fl own at 6 -mi l e i nterval s , and on north-south t i e l i nes fl own at 18-mi l e i nterval s . The mean fl i ght al t i tude above l and surface was 393 ft, and mean fl i ght vel oci ty was 96 . 6 mph . Al t i tude attenuat i on coeffi c i ents were used to correct measured count rates at any el evati on to a reference el evat i on of 400 ft . The a i rborne detector measured gamma radi at i on from geol og i c mater i al s and any other mater i al s present on l and surface or buri ed at shal l ow depth . Because of the strong attenuat i on of gamma rays i n materi al s , the measurement recorded by the a i rborne spectrometer i s general l y from mater i al s present to depths of onl y 1 to 2 ft bel ow l and surface .
In the a i rborne spectrometer s urvey, 40K i s d i rectl y meas�3�d by a ��ngl e cl ear peak at 1 . 46 MeV (mi l l i on el ectron vol ts ) . By contrast, Th and Bu do not have any cl ear d i st i nct peaks . The concentrat i ons of these i s otopes are i nter�3gted by measuri ng the act i ���i es of the daughter nucl i des, b i smuth -214 ( for U) and thal l i um- 208 ( for Th) . Because uran i um and thor i um concentrati ons are n ot measured d i rectl y, they are referenced as equ i val ent concentrat i on s . A fundamental assumpt i on i n cal cul at i ng the concentrat i ons of uran i um and thor i um i s ���t a st�j� of equ i l i bri um exi sts between parent and daughter n ucl i des . The U and Th decay seri es are shown i n F i gures 1 and 2 .
The fol l owi ng i nterpretat i on maps of potass i um, uran i um and thor i um vari at i on i n the SSC study area were taken from the NURE report . The maps are pseudo contour pl ots showi ng vari at i on of total gamma rad i at i on , total potass i um ( K) , equ i val ent uran i um ( eU) , and equ i val ent thori um (eTh ) . Tabl e 1 presents scal es for convert i ng the numbers on pseudo contour pl ots i n to concentrati ons . The to4a1 potass i um concentrat i on was cal cul ated from the i sotop i c abundance of K ( 0 . 0 1 18%) . Uran i um and thor i um concentrat i ons are expres sed as equ i val ent uran i um and equ i val ent thor i um to i nd i cate that measurements were on daughter i sotopes wi th an assumpt i on of equ i l i br i um .
4
Tabl e 1 .
Pseudo
Expl anat i on of Pseudo contours
( fi g.6 ) (f ig. 7 ) Total
contour no. Gamma Rad i at i on K (counts/sec) ( percent )
0 750 -800 0 800 -850 0 - .1
1 850 - 900 .1 - .2 900 - 1 000 .2 - .3
2 1000- 1 050 .3 - .4 1050 - 1 100 .4 - .5
3 1 1 00- 1 1 50 .5 - .6 1 1 50- 1 200 .6 - .7
4 1 200 - 1 250 .7 - .8 1 250 - 1 300 .8 - .9
5 1 300- 1 350 .9 - 1 .0 1 350 - 1 400 1 .0 - 1 .1
6 1400- 1450 1 .1 1 .2 1450 - 1 500 1. 2 - 1 .3
7 1 500 - 1 550 1 .3 - 1 .4 1550 - 1 600
8 1 600 - 1 650
( fi g. 8) ( fi g. 9 )
eTh (Tl - 208) eU(B i - 2 1 4 ) ( ppm) (ppm)
0 0 0 - .5 0 - .2
.5 - 1 .0 .2 - .4 1 .0 - 1 .5 .4 - .6 1 .5 - 2.0 .6 - .8 2.0 - 2.5 .8 - 1 .0 2.5 - 3.0 1 .0 - 1 .2 3.0 - 3.5 1 . 2 - 1 .4 3.5 - 4.0 1 .4 - 1 .6 4.0 - 4.5 1 .6 - 1 .8 4.5 - 5.0 1 .8 - 2.0 5.0 - 5.5 2.0 - 2.2 5.5 6.0 2.2 2.4 6.0 - 6.5 2.4 - 2.6 6.5 - 7.0 2.6 - 2.8
2.8 - 3.0
The total count rates of gamma rad i at i on i n the SSC study area ( fi g. 6 ) range from 750 t o 1 550 counts/s. Over most of the area, total gamma rad i ati on ranges from 1 100 to 1 350 counts/s. The l owest counts ( 750 to 1 1 00 counts/ s ) occur i n a n area al ong t h e Fox Ri ver Val l ey. Lower rad i oact i v i ty val ues for al l parameters were measured i n the val l ey and probabl y are due to sh i el d i ng of gamma rad i at i on by water. The h i ghest counts ( 1 400 to 1 550 counts/s ) occur i n a l ocal i ty i n the southwestern part of the study area.
F i gures 7, 8, and 9 present pseudocontour maps for K, eTh , and eU. The concentrati ons of potas s i um-40, uran i um, and thor i um are deri ved by c onvert i ng counts/s data us i ng the detecti on effi c i enc i es cal cul ated for the measurement system and do not d i rectly correspond to real geochemi cal data.
The range of potass i um concentrat i ons in the map area ( fi g. 7) i s from 0.6 to 1 .4%. Over much of the area, concentrat i ons range un i forml y from 0 .9 to 1 .2 %. The l owest concentrat i ons are in the reg i on of the Fox Ri ver Val l ey; the h i ghest ( 1 .2 to 1 .3%) are cl ustered in the southwestern , southeastern , northwestern , and northeastern parts of the study area.
The concentrati on of eTh i n the surfi c i al geol ogi c materi al s i n the SSC study area ( fi g. 8) are from 2.5 to 7.0 parts per mi l l i on (ppm ) . Over most of the area, concentrat i on s vary from 3.5 to 6.0 ppm. The l owest concentrat i ons were measured al ong the Fox Ri ver Val l ey. Val ues are general l y h i gher i n the western part of the study area than i n the eastern , w ith the h i ghest concentrat i ons ( 5.5 to 7.0 ppm) cl ustered i n the southwest.
5
The NURE survey determi ned eU concentrat i ons i n the surfi c i al geol og i c materi al s i n the study area ( fi g . 9 ) t o range from 0 . 6 t o 3 . 0 ppm . Concentrat i on s over most of the area vary from 1 . 0 to 2 . 0 ppm . A north -s outh zone of h i gher concentrati on occurs i n the western hal f of the study area, wi th h i ghest concentrati ons ( 2 . 2 to 3. 0 ppm) present to the sout h . Rel ati ve ly l ower eU concentrat i on s occur i n the Fox Ri ver Val l ey .
W i th i n the SSC study area, the concentrati on s of the three rad i oact i ve el ements are rel at i ve ly l ow . They are comparabl e to val ues that occur throughout the Aurora Quadrangl e , and to concentrati on s measured by NURE surveys fl own over the Rockford Quadrangl e to the north and the Ch i cago Quadrangl e to the east . For exampl e, the average concentrat i ons determi n ed for the Ch i cago Quadrangl e are 1 . 0% for potassi um, 3. 6 ppm for eTh, and 1 . 5 ppm for eU (DOE, 1 98lb ) . The average concentrat i ons for radi oact i ve el ements i n surface materi al s i n n ortheastern Il l i n oi s are rel at i vel y l ow when compared to average val ues measured i n surfi c i al mater i al s ( s oi l s ) around the worl d ( tabl e 3) .
The goal of the NURE program was reg i onal reconna i s sance to determi ne areas of anomal ousl y h i gh concentrat i ons of uran i um . However, the anomal i es generated i n the automat i c reduct i on of data may be the product of many processes or cond i t i ons other than actual accumul at i on s of rad i oact i ve mi neral s . W i th i n the Aurora Quadrangl e , the NURE program defi ned 2 3 an omal i es . Onl y one of these anomal i es i s l ocated wi th i n the SSC study are a . The l ocati on of th i s anomal y i s shown on the eU map ( fi g . 9 ) . Superposit i on of the fl i ght l i ne that detected the anomal y over a topograph i c base map centered the anomal y at a rural cemetery l ocated i n the SW 1/4 of the SW 1/4 of Sect i on 32 , T 38 N, R 7 E , Kane County . The cemetery i s at an el evati on of 710 ft above mean sea l evel on a smal l knol l of anomal ously h i gh rel i ef . The knol l i s 35 to 50 ft h i gher than the surround i ng l andscape . The U. S . Department of Agr i cul ture soi l map for Kane County descr i bes the surfi c i al mater i al s as wel l -drai ned l oam over cal careous l oam t i l l . The rel at i vel y h i gh eU ( 214Bi ) act i v i t i es measured i n the a i rcraft may refl ect a comb i nati on of factors : the l ocal rel i ef, gamma rad i at i on from uran i um i n gran i t i c grave markers, and enh anced fl ux of gamma rad i ati on due to the wel l - drai ned s oi l s on the knol l i n contrast to watersaturated s oi l s l ower on the l andscape . Gran i t i c markers have been documented as a s ource of anomal ous ly h i gh gamma rad i at i on i n cemeteri es by envi ronmental mon i tor i ng i n the v i c i n i ty of Argonne Nat i onal Laboratory ( Gol chert, Duffy, and Sedl et, 1 983) .
In s i tu measurements w i th a spectral gamma ray geophysi cal tool were taken i n three borehol es dri l l ed i n the proposed s i t i ng area . The l ocat i ons of the borehol es are shown i n F i gure 1 0 . The hol es were dri l l ed w ith a i r rotary methods s o that representat i ve sampl es of the bedrock un i ts coul d be col l ected for analys i s by i nstrumental neutron act i vati on i n the l ab .
The spectral gamma ray geophys i cal tool , run by Schl umberger Wel l L oggi ng Co. , Inc . , uses a detect i on system cons i st i ng of a photomul t i pl i er tube and a sod i um i od i de sci nt i l l at i on crystal mounted i n a Dewar fl ask for maxi mum temperature stabi l i ty . Due to l i mi t at i ons of the detector system and the degradati on of gamma energ i es as they travel from the i r poi nt of ori g i n to the detector ( pr i mari l y due to Compton Scatteri ng ) the d i screte spectrum becomes
6
"smeared" and i s referred to as the Potas s i um: Uran i um: Thori um ( KUT) spectrum.
The Schl umberger borehol e system corrects for th i s swaari n� of spec�3�1 i nformat i on by ass i gn i ng i nd i v i dual spectral wi ndows for K, 2 Bu, and Th . The spectral wi ndows are centered at the fol l owi ng energy l evel s for each i sotope:
ISOTOPE Potassi um- 40 Uran i um- 238 (B i - 2 1 4 ) Th ori um- 232 (Tl -208)
ENERGY (MeV) 1 . 46 1 . 76 2 . 62
Potas s i um-40 act i v i t i es are measured d i rectly, and the c�ncentrat i on o� total ootass i um i s cal cul ated from the i sotop i c abundance of OK . However, 38u and 2 3 2Th do not h ave cl ear peaks wi th thei r d i s i ntegrat i ons. Therefore, act i v i t i es of these i so�yijes are �8aermi ned by measurement of the act i v i t i es of the daughter i sotopes, B i and Tl . Concentrat i on s of the parent i s otope are cal cul ated from an assumpt i on of radi oacti ve equ i l i bri um between p arent and daughter nucl i des . The terms equ i val ent uran i um (eU) and equ i val ent thor i um (eTh ) are used i n reference to the concentrat i ons that are n ot measured d i rectl y . (Note that the determi n at i on of uran i um and thor i um concentrati on wi th the Schl umberger borehol e spectral gamma rad i ati on system i s s i mi l ar to the approach used to i nterpret the NURE Ai rborne data ) .
The Schl umberger SGR system operates by pl ac i ng a detector i n a borehol e to count d i s i ntegrat i on events occurri ng i n the geol og i c materi al s . The i nformat i on gathered as the detector i s sl owl y retri eved from a borehol e i s transmi tted to a d i g i tal computer on the surface where process i ng determi nes the concentrat i ons of potass i um, uran i um, and thor i um present in the geol og i c materi al s . The resul ts are d i spl ayed a s a conti nuous record of concentrat i ons vers us depth i n the borehol e .
The spectral gamma ray records for the three boreh ol es i n the SSC s i t i ng area are presented i n F i gure 1 1 , wh i ch presents the SGR l ogs for the borehol es i n a general west to east perspect i ve and correl ates the major strat i graph i c un i ts i n the bedroc k . The correl ati on i s based on study of the compl ete su i te of geophys i cal records performed on the borehol es and study of rock ch i ps col l ected duri ng the dri l l i ng .
The concentrat i ons of potass i um, uran i um (eU) , and thori um (eTh) determi ned by the borehol e method were compared to concentrat i ons determi ned by Instrumental Neutron Act i vati on Analys i s ( INAA) on d i screte sampl es of rock ch i ps col l ected i n the dri l l i ng program . The INAA procedures are referenced i n Harvey et al . ( 1 983 ) .
The l aboratory anal yti cal program i n i t i al l y focused on rock sampl es from boreh ol e SSC-1 . Two separate cri teri a were used to sel ect sampl es for l aboratory anal ys i s . One cri teri on was to sel ect sampl es from zones that d i spl ayed rel ati vel y h i gh radi oact i v i ty on the spectral gamma ray l og. A second cri teri on was to assure an accurate, unbi ased compari son of the KUT concentrat i on shown on the SGR l og to concentrat i ons measured anal yt i cal l y . To accompl i sh th i s cri teri a, rock sampl es from bori ng SSC-I were anal yzed on a 20-
7
foot spac i ng through the depth i nterval of 300 to 800 feet. The anal yt i cal resul ts for bori ng SSC - I are shown i n F i gures I 2 , I3 and I 4 . The three fi gures compare the INAA concentrat i on s for potas s i um, uran i um, and thori um to concentrat i ons determi ned wi th the SGR method .
In contrast to the anal yt i cal program for bor i ng SSC - I , onl y a l i mi ted number of zones from bori ngs SSC - 2 and SSC-3 were sampl ed for l aboratory analys i s. The compari son of INAA concentrat i on s and SGR concentrat i ons for the borehol es i s presented i n F i gures IS to 20.
The good correl at i on between the concentrat i on s determi ned by the INAA and SGR methods i s shown by the regress i on anal yses i n F i gures 2 I , 22, and 23 . There are two poss i bl e expl anat i ons to account for the few marked d i screpanci es that occur between the INAA and SGR data . F i rst, rock fragments, wh i ch were col l ected dur i ng dri l l i ng at fi ve- foot i nterval s , may not be r i gorousl y representat i ve of l ocal vari at i on i n natural rad i oact i v i ty detected by the SGR borehol e sonde. Second, because the roc k fragment sampl es are a i r-1 i fted hundreds of feet to the surface from the rotat i ng dri l l bi t , wi th a subsequent t i me l ag there may be s l i ght ( I - 3 ft ) i naccurac i es i n determi n i ng the depths from wh i ch the sampl es were deri ved .
Tabl e 2 shows the mean concentrat i ons of potassi um, uran i um, and thori um i n the major bedrock un i ts present at the three boreh ol es from l aboratory measurements wi th the INAA method. The excepti on i s val ues for potass i um, equ i val ent uran i um, and equ i val ent thor i um for the S i l ur i an dol omi te, wh i ch are cal cul ated from the spectral gamma radi ati on record from boreh ol e .SSC - 2 .
8
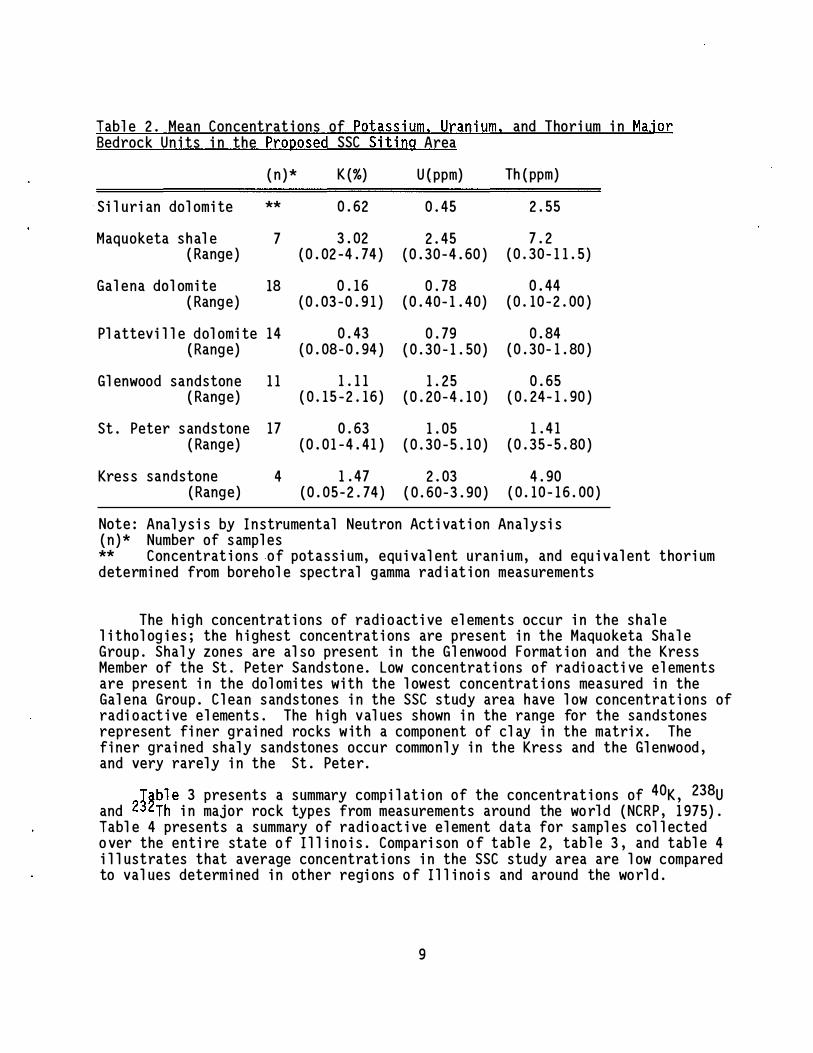
Table 2 . Mean Concentrat i ons of Potassi um, Uran i um, and Thori um i n Major Bedrock Un i ts i n the Proposed SSC S i t i ng Area
( n ) * K ( %) U(ppm) Th (ppm)
Si l uri an dol omi te ** 0 . 62 0 . 45 2 . 55
Maquoketa shal e 7 3. 02 2 . 45 7 . 2 ( Range ) ( 0 . 02 -4 . 74 ) ( 0 . 30-4 . 60 ) ( 0 . 30-1 1 . 5 )
Gal ena dol omi te 18 0 . 1 6 0 . 78 0 . 44 ( Range) ( 0 . 03-0 . 9 1 ) ( 0 . 40-1 . 40) ( 0 . 10-2 . 00 )
Pl attevi l l e dol omi te 14 0 . 43 0 . 79 0 . 84 ( Range) ( 0 . 08-0 . 94 ) ( 0 . 30-1 . 50 ) ( 0 . 30-1 . 80 )
Gl enwood sandstone 1 1 1 . 1 1 1 . 25 0 . 65 ( Range) ( 0 . 1 5 -2 . 1 6 ) ( 0 . 20-4 . 1 0 ) ( 0 . 24-1 . 90 )
St . Peter sandstone 17 0 . 63 1 . 05 1 . 4 1 ( Range) ( 0 . 0 1 -4 . 41 ) ( 0 . 30-5 . 1 0 ) ( 0 . 35-5 . 80 )
Kres s sandstone 4 1 . 47 2 . 03 4 . 90 ( Range) ( 0 . 05-2 . 74 ) ( 0 . 60-3. 90 ) ( 0 . 10-1 6 . 00 )
Note: Anal ys i s by In strumental Neutron Act i vat i on Anal ys i s ( n ) * Number of sampl es ** Concentrat i on s .of potassi um, equ i val ent uran i um, and equ i val ent thori um determi ned from borehol e spectral gamma rad i at i on measurements
The h i gh concentrat i ons of radi oacti ve el ements occur i n the shal e l i thol og i es; the h i ghest concentrat i ons are present i n the Maquoketa Shal e Group . Shal y zones are al so present i n the Gl enwood Format i on and the Kress Member of the St . Peter Sandston e . Low concentrat i ons of radi oacti ve el ements are present i n the dol omi tes wi th the l owest concentrat i ons measured i n the Gal ena Group . Cl ean sandstones i n the SSC study area have l ow concentrat i ons of radi oact i ve el ements . The h i gh val ues shown i n the range for the sandstones represent fi ner grai ned rocks w ith a component of cl ay i n the matri x. The fi ner grai ned shal y sandstones occur commonl y i n the Kress and the Gl enwood, and very rarel y i n the St . Peter .
Tabl e 3 presents a summary comp i l at i on of the concentrat i on s of 40K, 238u and 232Th i n major rock types from measurements around the world ( NCRP, 1 975) . Tabl e 4 presents a summary of radi oact i ve el ement data for sampl es col l ected over the enti re state of Il l i noi s . Compari son of tabl e 2, tabl e 3, and tabl e 4 i l l ustrates that average concentrat i ons i n the SSC study area are l ow compared to val ues determi ned i n other regi ons of Il l i noi s and around the worl d .
9
Tabl e 3 . Concentrat i ons of major rad i onucl i des i n major rock types and s oi l
Rad i oact i ve El ement. ( Concentrat i on ) Materi al s K ( %) U( ppm) Th ( ppm)
Shal e 2 . 7 3. 7 1 2 Sandstone
cl ean <1 <1 <2 di rty Qtz 2 2 -3 3-6 arkose 2 -3 1 -2 2
Carbon ate 0 . 3 2 2 Soi l s 1 . 5 1 . 8 9
Source: Nat i onal Counc i l on Radi at i on Protecti on and Measurements Report No. 45 ( 1975 )
Tabl e 4 . Summary of Uran i um, Thor i um, and Potass i um Data for Major Il l i n oi s Rock Types
Rock type ( n )
Shal e Bl ocher ( 24 ) Sel mi er ( 79 ) Grassy Creek ( 185) Hann i bal (60) Anna (8 ) Energy ( 4 ) Vari ou s ( 1 1 )
Recent Sed i ments
Rad i oacti ve El ement (Concentrat i on ) K ( %) U(ppm) Th ( ppm)
2 . 65 3 . 6 5
3 . 73 4 . 56 2 . 52
2 . 9 1
1 2 1 0
26 7
31 5
6 . 6 1 0
1 0 1 2 1 2 . 5
1 5 9
Lake M i ch i g an ( 286 ) 1 . 82 Il l i n oi s Ri ver ( 1 1 2 ) 2 . 00
2 . 3 5 . 8 1 3
Carbonates L i mestones ( 4 ) Var i ous ( 1 0 )
Sandstones Vari ou s ( 1 4 )
0 . 31 4 . 5 1 . 7
1 . 5
2 . 7
Notes: Resul ts are taken from Frost, Zi erath and Sh i mp , 1 985; Cah i l l , 1 981 ; Cah i l l and Steel e 1 986; DeMari s et al . , 1 983; and G i l keson et al . , 1 978 . ( n ) Number of sampl es anal yzed .
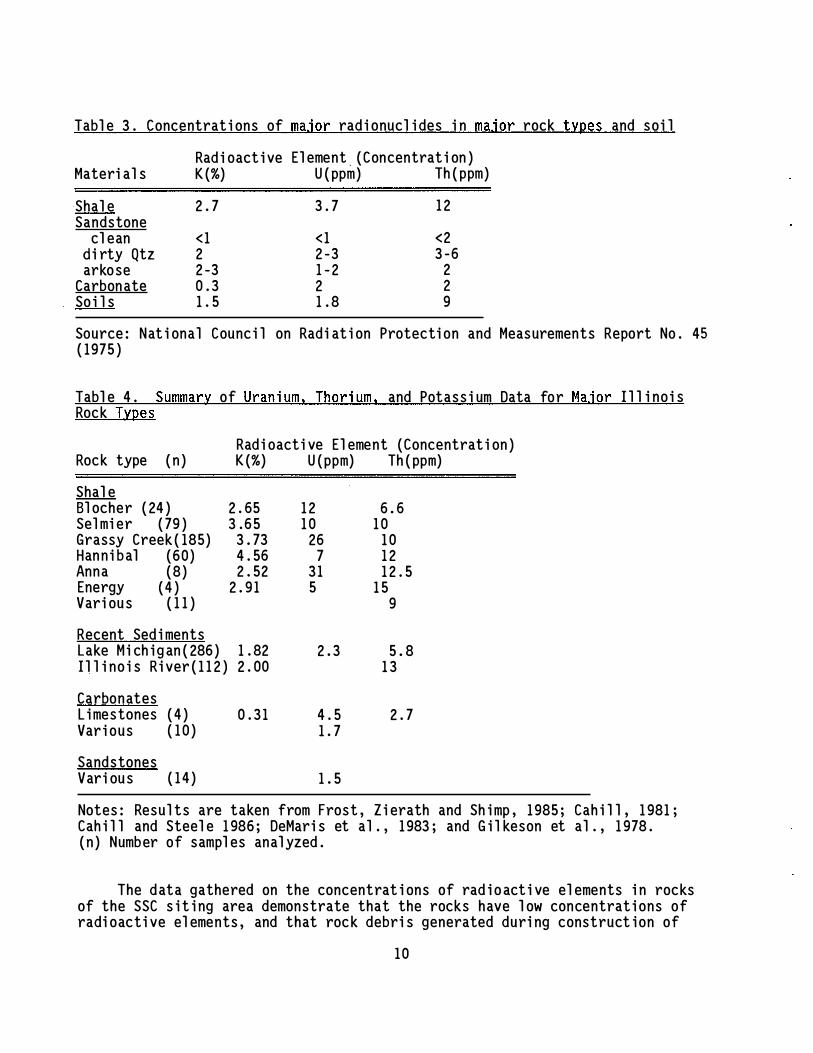
The data gathered on the concentrat i ons of rad i oact i ve el ements i n rocks of the SSC s i t i ng area demonstrate that the rocks have l ow concentrat i ons of radi oacti ve el ements, and that roc k debri s generated duri ng construct i on of
10

shafts or the tunnel does not pose a radi oact i v i ty h azard that requ i res spec i al h andl i ng or d i sposal .
AIRBORNE RADON CONCENTRATIONS IN THE OUTDOORS, INDOORS, AND UNDERGROUND SHAFTS AND TUNNELS
Radon i s a radi oact i ve gas that i s produced n�aural l y i n geol o��� materi al s by the normal decay of i sotopes i n the 2 U ( f��2 1 ) and Th decay seri es ( fi g. ��a The publ i c heal th i mpact of radon - 222 ( Rn , hal f- l i fe 3. 82 days ) i n the U decay seri es i s an i s sue that i s n ow receiv i ng nat i onal attenti on . There i s l ess heal th concern for 220Rn i n the 233Th decay seri es because of i ts very short h al f-l i fe ( 55 s ) . The heal th concern that i s most s i gn i fi cant for any popul at i on exposure, occupati onal or envi ronmental , i s the al pha dose deoosi ted i n the tracheobronchi al reg i on through i nh al at i on of the short - l i ved 222Rn daughters: pol on i um-2 18, l ead - 2 14 , bi smuth - 2 1 4 , and pol on i um-2 14 .
Exposure to 222Rn i s defi ned in terms of the a i r concentrat i on of radon daughters i n un i ts of the worki ng l evel WL ) . One WL i s defined as that concentrat i on of shgrt - l i ved radon u hte that has a potenti al al pha energy rel ease of 1 . 3 x 1 0 MeV per l i ter ��ai r. Cumul at i ve exposure i s defi ned i n worki ng l evel months (WLM ) wh i ch equal s exposure i n worki ng l evel t i mes expos ure durati on i n mul t i pl es of the 1 70 - h our occupat i onal month. The occupati onal standard for radon daughter exposure i n the Un i ted States i s currentl y set at 4 WLM per year.
Secul ar equ i l i bri um between radon and daughter nucl i des i s sel dom found i n ambi ent atmospheres. The daughter nucl i des are chemi cal l y act i ve sol i ds that attach to surfaces such as wal l s , furn i ture, cl oth i ng, and al so to a i rborne part i cl es . The n ucl i des attached to a i rborne part i cl es del i ver the s i gn i fi cant dose to the l ungs. The rat i o of the daughter nucl i des i n atmospheres to the radon concentrat i on general l y ranges from 0. 3 to 0. 5 . Concentrat i ons of radon i n a i r are commonl y expressed as pCi/L. The U. S. EPA has set 4. 0 pC i / L as an act i on l evel gu i del i ne for i ndoor radon concentrat i ons . For an equ i l i bri um factor of 0 . 5, 4. 0 pCi/L radon represents 0 . 02 worki ng l evel s . S i mi l arl y, a radon concentrati on of 200 pCi/L woul d represent 1 worki ng l evel .
Res i dent i al occupancy may d i ffer s i gn i fi cant ly from the standard workrel ated occupati onal month of 170 h ours. Cumul at i ve exposure at a g i ven concentrat i on i s more than 4 t imes that for occupat i onal exposure ( 8766 hours versus 2000 hours on an annual bas i s ) .
Ai rborne concentrat i ons of 222Rn outdoors
The �verage outdoor 222Rn concentrati on over cont i nents i s esti mated to be
���s����ml9�� )
(���n�Cih�i l�;R��a�9�:� �eA
f��r��ld��rp����!���a�����r��e���R�Y
for n�rmal areas of the conti guous �n i ted States l i es i n the range of 100-400 pCi /m and averages about 250 pC i/m or (0 . 25 pCi/ L ) . Measurements taken i n the ���e spr i ng and summer of 1 960 a� Argonne Nat i onal Laboratory found an average
Rn concentrat i on of 300 pCi /m and 260 pC i/m3 at hei ghts of 1 and 4 m above ground surface, respect i vely ( Pearson , 1 967 ) . A cal cul at i on appl y i ng the Nat i onal Counci l on Rad i at i on Protect i on (NCRP) model for pred i cti ng l ung
1 1

cancer deaths from cont i nuous envi ronmental expos ure to radon (NCRP, 1 984) resul ts i n a l i fet i me ri s k of 0 . 06% for an average outdoor radon concentrat i on of 300 pC i/m3.
Ai rborne concentrat i ons of 222Rn i ndoors
There i s a great nati onal concern currentl y for the concentrat i ons of 222Rn that are present i n i ndoor envi ronments . Geol og i c mater i al s i mmed i atel y surround i ng the substructure of a bui l d i ng are the pri nci pal source of i ndoor radon . For h omes wi th groundwater suppl i es , radon rel eased through water use may al so s uppl y a component to the i ndoor envi ronment . ( Radon concentrat i ons i n groundwater are d i scussed i n a separate subsect i on of th i s report . )
Several programs have been i n i t i ated at nat i onal , state, and l ocal , l evel s to measure and eval uate reg i onal i ndoor radon concentrat i ons . The Il l i n oi s Department of Nucl ear Safety has i n i t i ated a program to eval uate i ndoor radon concentrat i ons acros s the state of Il l i noi s , but the survey for the reg i on of the SSC study area i s not yet compl ete .
The fi rst measurements of i ndoor radon i n h omes i n northeastern Il l i noi s came from a study of 144 s i ngl e fami l y h omes l ocated i n the v i c i n i ty of Argonne Nat i onal Laboratory . The val ues shown i n tabl e 5 were prov i ded by Dr . Ri chard Toohey ( personal commun i cat i on , 1 986 ) of Argonne Nat i onal Laboratory . Anal ys i s was based on grab sampl es col l ected dur i ng bri ef v i s i ts to the homes . The sampl es may n ot be representat i ve of the l ong -term average concentrat i on s present i n the i ndoor atmosphere .
Tabl e 5 . 222Rn CONCENTRATIONS MEASURED IN 144 RESIDENCES Basements F i rst Fl oors
pCi / L ( % occurrence ) ( % occurrence)
<l 22 1 -4 5 1
>4 - 1 0 1 9 > 10 8
Note: Anal ys i s on grab sampl es each case, basements and fi rst
37 49 1 3
1 col l ected by Argonne Nat i on al fl oors, 1 24 measurements .
Laboratory . In
Twenty- seven percent of the measurements i n basements were greater than the U. S . EPA gu i del i ne of 4 . 0 pCi/L; the maxi mum concentrat i on measured i n a basement was 50 pCi/L . Fourteen percent of the fi rst fl oor read i ngs exceeded 4 . 0 pCi/L; 36 pCi/L was the maxi mum concentrat i on measured .
The h omes measured i n the Argonne Nat i onal Laboratory Survey are l ocated east and southeast .of the SSC study area . Home construct i on and phys i cal sett i ngs ( assoc i at i ons of l andscapes and geol og i c mater i al s ) are comparabl e to cond i t i ons i n the proposed s i t i ng area .
A nat i onal survey of i ndoor radon concentrat i ons i s underway that i s coord i nated by Dr . Bern i e Cohen, at the Un i vers i ty of Pi ttsburgh, Pi tts burgh, Pennsyl van i a . Measurements are taken i n i ndoor l i v i ng space wi th act i vated charcoal radon mon i tors . The resul ts for e i ght count i es i n northeastern
1 2
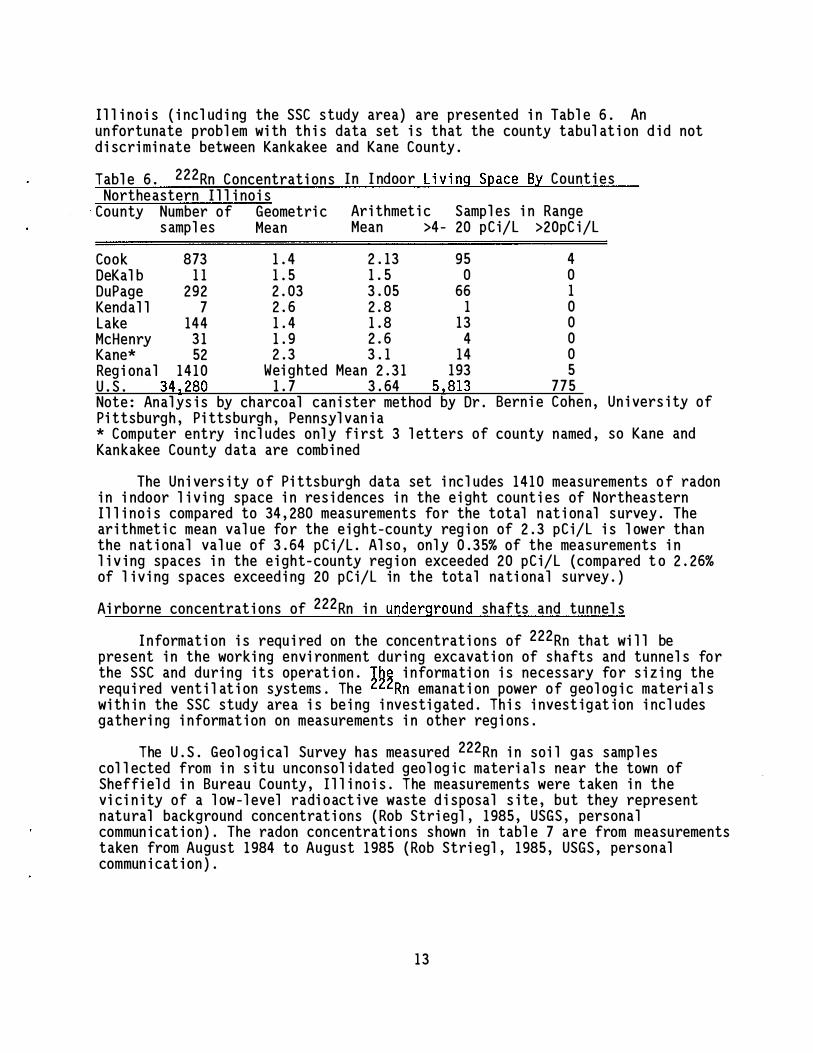
Il l i n oi s ( i ncl ud i ng the SSC study area ) are presented i n Tabl e 6 . An unfortunate probl em wi th th i s data set i s that the county tabul at i on d i d not d i scri mi nate between Kan kakee and Kane County .
Tabl e 6 . 222Rn Concentrati on s In Indoor L i v i ng Space By Count i es Northeastern Il l i noi s
County Number of Geometri c Ari thmet i c Sampl es i n Range sampl es Mean Mean >4 - 20 pCi/L >20pC i /L
Cook 873 1 . 4 2 . 1 3 95 4 DeKal b 1 1 1 . 5 1 . 5 0 0 DuPage 292 2 . 03 3. 05 66 1 Kendal l 7 2 . 6 2 . 8 1 0 Lake 144 1 . 4 1 . 8 1 3 0 McHenry 31 1 . 9 2 . 6 4 0 Kane* 52 2 . 3 3 . 1 14 0 Reg i onal 1 4 1 0 Wei ghted Mean 2 . 31 193 5 U. S . 342280 1 . 7 3. 64 52813 775 Note: Anal ys i s by charcoal can i ster method by Dr . Bern i e Cohen, Pi ttsburgh, Pi ttsburgh, Pennsyl van i a * Computer entry i ncl udes onl y fi rst 3 l etters of county named , Kan kakee County data are combi ned
Un i vers i ty of
so Kane and
The Un i vers i ty of Pi ttsburgh data set i ncl udes 1 4 1 0 measurements of radon i n i ndoor l i v i ng space i n res i dences i n the e i ght count i es of Northeastern Il l i n oi s compared to 34, 280 measurements for the total n at i on al s urvey . The ari thmet i c mean val ue for the e i ght-county reg i on of 2 . 3 pCi/L i s l ower than the nat i onal val ue of 3. 64 pCi/L . Al so, onl y 0 . 35% of the measurements i n l i v i ng spaces i n the e i ght- county reg i on exceeded 20 pCi/L (compared t o 2 . 26% of l i v i ng spaces exceed i ng 20 pCi/L in the total nati onal survey . )
Ai rborne concentrat i ons of 222Rn i n underground shafts and tunnel s
Informati on i s requ i red on the concentrati ons of 222Rn that wi l l be present i n the worki ng envi ronment duri ng excavat i on of shafts and tunnel s for the SSC and duri ng i ts operat i on . The i nformati on i s necessary for s i zi ng the requ i red vent i l at i on systems . The 222Rn emanat i on power of geol og i c materi al s wi th i n the SSC study area i s be i ng i nvesti gated . Thi s i nvest i gat i on i ncl udes gatheri ng i nformat i on on measurements i n other reg i ons .
The U . S . Geol og i cal Survey has measured 222Rn i n soi l gas sampl es col l ected from i n s i tu unconsol i dated geol og i c materi al s near the town of Sheffi el d i n Bureau County, Il l i noi s . The measurements were taken i n the vi ci n i ty of a l ow- l evel radi oact i ve waste d i sposal s i te, but they represent natural background concentrat i ons ( Rob Stri egl , 1 985, USGS, personal commun i cat i on ) . The radon concentrat i ons shown in tabl e 7 are from measurements taken from August 1 984 to August 1 985 ( Rob Stri egl , 1 985, USGS, person al commun i cat i on ) .
1 3

Tabl e 7 . 222Rn Concentrat i ons In Soi l Gas And Atmospheres At A Un i ted States Geol ogi cal Survey Research Area Near Sheffi el d, Bureau County, Il l i n oi s
Strati graph i c Un i t
Peori a Loess Roxanna S i l t Radnor Ti l l Toul on Sand
Measurement i n Soi l Gas (pCi/L)
1000- 2000 1000 - 1 500 1000 - 3000
190- 290 Measurements i n Atmosphere
Underground research tunnel 50- 200 0 . 5 ft above l and surface 1 - 3
The underground research tunnel i s constructed i n the Radnor Ti l l . The 222Rn concentrati on s measured i n the poorl y vent i l ated tunnel are of a l evel for concern , but they are much l ower than the val ues measured i n soi l gas i n the Radnor Ti l l . The contrast i n val ues i s poss i bl y due to s l ow transport of radon from the fi ne -grai ned materi al s . The concentrat i ons measured i n the tunnel coul d easi l y be control l ed by vent i l at i on .
Data on 222Rn concentrati ons i n underground worki ngs other than uran i um mi nes are l i mi ted . Measurements i n coal mi nes found l ow val ues, pri nc i pal l y because vent i l at i on i n operat i ng coal mi nes to control other probl ems , such as methane, i s al so very effecti ve i n control l i ng 222Rn . A study by Rock et al . ( 1 975), of 223 coal mi nes ( 1 , 581 sampl es) found onl y two mi nes to h ave rad i oact i ve aerosol concentrati ons greater than 0 . 2 WL . S i gn i fi cantl y, no measurements i nd i cated concentrat i on s i o excess of 0 . 3 WL . Vent i l at i on i s al so bel i eved to be the reason for very l ow 222Rn val ues measured i n the New York subway system ( Robert T. Beckman , 1 986, personal commun i cati on , U . S . Department of Labor).
Resul ts from mon i tor i ng Newfoundl and fl uor i de mi nes (Dory and Corki l l , 1985) determi ned that geol og i c envi ronments other than uran i um resources may supply h i gh radon concentrati ons to mi ne envi ronments . Radon daughter mon i tor i ng determi ned val ues above 1 00 WL i n poorl y vent i l ated wet stopes i n the fl uori de mi nes . Val ues measured i n wet stopes were s i gn i fi cantl y h i gher than those measured i n dry envi ronments . Groundwater i s a s ource of radon i n the wet envi ronments . The wet envi ronments are due t o fractured and fi ssured rock that i s open to groundwater fl ow . Rad i um i n encrustati ons on the fractures and fi ssures i s a s i gn i fi cant source of radon i n groundwater . The observat i on of wet underground envi ronments hav i ng h i gher radon concentrat i ons i s al so supported by measurements i n caverns . For exampl e, the h i ghest concentrat i ons for Mammoth Cave i n Kentucky ( 2 1 WL) are i n poorl y vent i l ated wet passageways i n the regi on of groundwater i nfi l trati on ( Bob Carson , 1 986, person al commun i cat i on , Mammoth Cave, Kentucky). Val ues i n poorl y vent i l ated dry passageways are much l ower but st i ll often exceed 1 WL . Al so of i nterest are concentrat i on s measured i n a poorl y vent i l ated area at the base of a 256 - ft sh aft excavated for an el evator at Mammoth Cave . Concentrat i ons are general l y 1 . 1 to 1 . 2 WL w i t h maxi mum val ues of 1 . 8 W L measured occas i onal l y .
14
In the SSC study area, the tunnel and research chamber woul d be con structed i n the Gal ena and Pl attev i l l e Dol omi te Groups . The pri nci pal rock un i t for the tunnel i s the Gal ena; al ong the western s i de, con structi on of the tunnel and research chambers woul d al so i ncl ude the upper part of the Pl attev i l l e . Tabl e 2 presents analyses of rad i oact i ve el ements i n dol omi tes from the Gal ena and Pl attev i l l e Group i n the proposed study are a . Carbonates have l ow concentrat i ons of radi oact i ve el ements. Furthermore, the concentrati on s i n the Gal ena - Pl attevi l l e dol omi tes i n the SSC study area are low compared to the mean concentrat i on measured i n carbonate rocks around the worl d (Tabl e 3) .
Uran��� and th�23um are the l ong - l i ved parent i sotopes i n the decay seri es of Rn and Rn; the two radon i sotopes of concern for atmospheri c envi ronments i n the tunnel . The emanat i on of radon from roc k sampl es of the Gal ena-Pl attev i l l e i n the study area i s bei ng i nvesti gated .
The most s i gn i fi cant source of radon to the tunnel atmosphere wi l l be emanati on of radon from the roc k wal l s . An addi t i onal mi nor source of radon wi l l be from i n fl ows of groundwater duri ng the bor i ng of the tunnel and research chambers . Groundwater s ources of radon wi l l be i ns i gn i fi cant after the grouti ng program to seal fractures and crev i ces .
A groundwater sampl i ng program i s be i ng conducted to eval uate the d i s s ol ved radon concentrat i on i n the Gal ena- Pl attev i l l e dol omi tes i n the SSC study area . Th i s program al so i ncl udes the col l ecti on of groundwater s ampl es from wel l s fi n i shed i n the gl aci al dri ft and the S i l uri an dol omi te . The anal yt i cal resul ts are P22�ented i n Tabl e 8 . The l ocati on of wel l s i s presented i n F i gure 24 . Di ssol ved Rn concentrat i ons i n groundwater from wel l s open to the Gal ena - Pl attevi l le dol omi te vary from 1 29 to 740 pCi /L . The mean concentrat i on for measurements from 19 wel l s i s 295 pCi/L . The l ow val ues for d i s s ol ved concentrat i ons of 222Rn i nd i cate that the smal l quant i t i es of groundwater that are expected to i nfi l trate the tunnel wi l l not be a s i gn i fi cant source term for radon i n tunnel atmospheres .
1 5
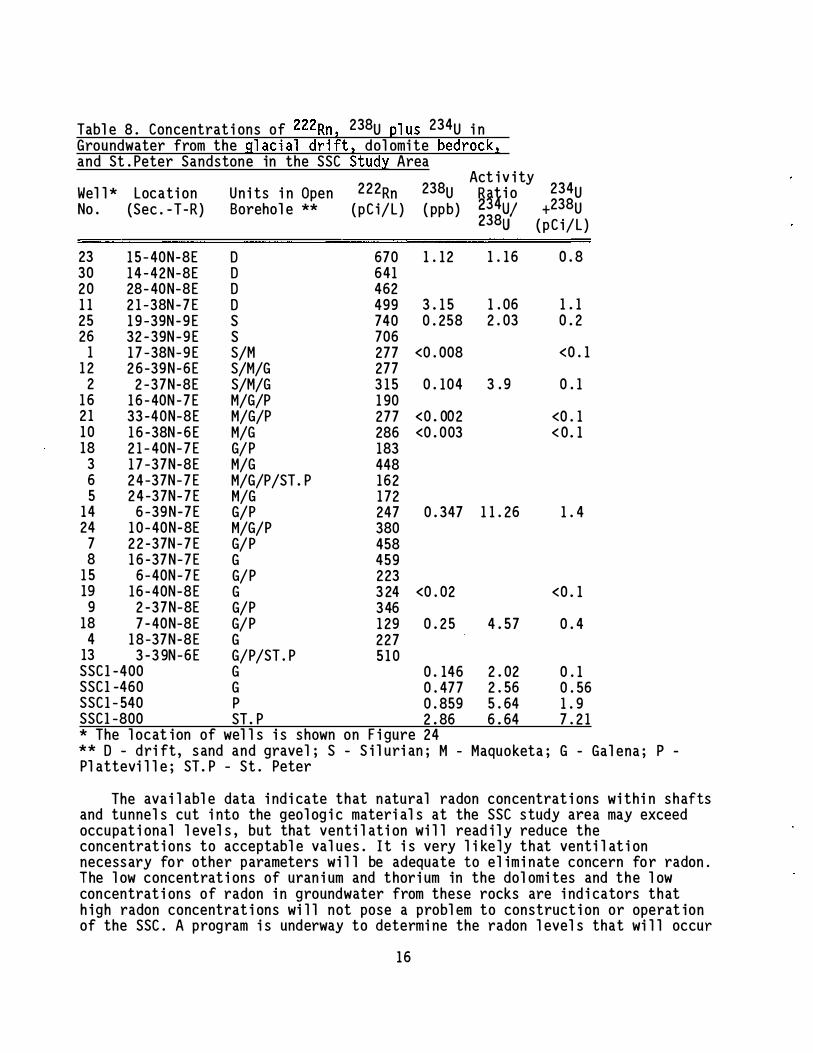
Tabl e 8. Concentrat i ons of 222Rn2 2 38u Ql us 2 34u i n Groundwater from the gl aci al dri ft2 dol omi te bedrock2 and St . Peter Sandstone in the SSC Stud� Area
222Rn 238u Act i v i ty
2 34u Wel l * Locati on Un i ts i n Open R�t i o No. (Sec.-T-R) Borehol e ** (pC i/L) ( ppb) �38W +238u
(pC i/L )
23 1 5 - 40N-8E D 670 1 . 1 2 1 . 1 6 0 . 8 30 1 4 - 42N-8E D 641 20 28- 40N-8E D 462 1 1 2 1 - 38N - 7 E D 499 3 .1 5 1 . 06 1 .1 25 1 9 - 39N -9E s 740 0.258 2 . 03 0.2 26 32 - 39N -9E s 706
1 1 7 - 38N-9E S/M 277 <0 . 008 <0 . 1 1 2 26 -39N-6E S/M/G 277
2 2 - 37N-8E S/M/G 31 5 0 . 104 3 . 9 0 . 1 1 6 1 6 - 40N -7E M/G/P 1 90 2 1 33-40N-8E M/G/P 277 <0.002 <0 . 1 10 1 6 - 38N -6E M/G 286 <0.003 <0.1 18 2 1 - 40N- 7 E G/P 183
3 1 7 - 37N-8E M/G 448 6 24 -37N- 7 E M/G/P/ST.P 162 5 24 -37N- 7 E M/G 1 72
14 6 - 39N-7E G/P 247 0.347 1 1 . 26 1 . 4 24 1 0 - 40N-8E M/G/P 380
7 2 2 - 37N - 7 E G/P 458 8 1 6 - 37N-7E G 459
1 5 6 -40N - 7 E G/P 223 19 16-40N-8E G 324 <0 . 02 <0.1 9 2 - 37N-8E G/P 346
18 7 - 40N-8E G/P 1 29 0.25 4.57 0 . 4 4 18 -37N-8E G 227
13 3- 39N -6E G/P/ST . P 5 1 0 SSCl-400 G 0.146 2.02 0 . 1 SSCl-460 G 0 . 477 2 . 56 0 . 56 SSCl- 540 p 0 . 859 5 . 64 1 . 9 SSCl-800 ST.P 2.86 6.64 7 . 2 1 * The l ocat i on of wel l s i s shown on F i gure 24 ** D - dri ft, sand and gravel ; S - S i l uri an ; M - Maquoketa; G - Gal ena; p -Pl attevi l l e; ST.P - St. Peter
The ava i l abl e data i ndi cate that natural radon concentrat i ons wi thi n shafts and tunnel s cut i nto the geol og i c materi al s at the SSC study area may exceed occupat i onal l evel s , but that venti l ati on wi l l read i l y reduce the concentrat i ons to acceptabl e val ues. It i s very l i ke ly that venti l at i on necessary for other parameters wi l l be adequate to el imi nate concern for radon. The l ow concentrat i ons of uran i um and thori um in the dol omi tes and the l ow concentrat i ons of radon i n groundwater from these rocks are i nd i cators that h i gh radon concentrat i ons wi l l n ot pose a probl em to construct i on or operat i on of the SSC . A program i s underway to determi ne the radon l evel s that wi l l occur
16
i n the tunnel and research chambers .
NATURAL RADIOACTIVE ELEMENTS IN GROUNDWATER
Several aqu i fers are used for groundwater resources i n the SSC study area . Strat i graph i c col umns of geol og i c materi al s i n the gl aci al dri ft and bedrock are presented in F i gures 25 and 26 . The three most s i gn i fi cant aqu i fers are: 1 . ) s and and gravel depos i ts i n the gl ac i al dri ft; 2 . ) fractures and crev i ces i n the shal l ow S i l uri an or Maquoketa dol omi te bedroc k (there i s often hydraul i c connecti on between gl ac i al dri ft and shal l ow bedrock); and 3 . ) deep sandstones (St . Peter and Ironton-Gal esvi l l e)i n the Cambri an and Ordov i ci an bedroc k . Dol omi tes confi ned wi th i n the Maquoketa Shal e Group and the Gal ena- Pl attev i l l e Group that prov i de l i mi ted groundwater suppl i es to a rel at i vely smal l n umber of wel l s are a fourth source of groundwater . Wel l s are often fi n i shed i n the confi ned dol omi tes i n l ocal i t i es where the sand and gravel or shal l ow bedrock do n ot prov i de an adequate domest i c groundwater suppl y .
The natural l y occurri ng radi oacti ve �1§ments �� groundwater that are of publ i c heal th concern are members of the U and 2Th decay seri es . Two radi um i sotopes, 226Ra ( Z 3Bu ser i es) and 228Ra ( 232Th seri es) are of pri mary concern . The U. S . Envi ronmental Protect i on Agency dri n ki ng water standard i s
���t��!�Lo�0�o��:r�0��!n��8��n�����a!��n
2��R��e �:�h���1 �1e��al���s0}��r
al l d i s sol ved radi onucl i des d i scussed i n th i s report are c i ted i n G i l keson et al . , 1 983. U. S . EPA expects to promul gate a uran i um standard for dr i n ki ng water soon . The Agency has i ssued a heal th adv i sory for uran i um of 10 pC i/L, based on con s i derat i ons of radi o- toxi c i ty and chemi cal toxi c i ty (R i chard Cothern, 1 986, personal commun i cat i on , U. S . EPA).
A U . S . EPA dri n ki ng water standard for 222Rn does n ot exi st now Hess et al . ( 1 979) proposed a maxi mum contami nant l evel of 10 , 000 pCi/L for 2 22Rn i n househol d water suppl i es based on a concern for radon rel eased from groundwater to i ndoor a i r . A recent an��2s i s by Nero et al . ( 1 985) esti mates that a groundwater suppl y wi th a Rn concentrat i on of 10 , 000 pCi/L wi l l i ncrease the i ndoor a i r concentrat i on of 222Rn by 0 . 65 pCi/L .
Aqu i fers i n the gl aci al dri ft and shal l ow bedrock
There i s very l i mi ted i nformati on on the concentrat i ons of spec i fi c radi oact i ve nucl i des P2��ent i n groundwater from these aqu i fers . Tabl e 8 presents anal yses for Rn and uran i um i sotopes for groundwater sampl es col l ected from four wel l s i n the SSC study area that produce from the gl aci al dri ft and fo2
2�hree wel l s that are open to the shal l ow bedrock ( S i l ur i an and/or Maquoketa). Rn concentrat i ons are l ow and vary from 277 to 740 pCi /L . Di s sol ved uran i um concentrat i ons are al so l ow and vary from 0 . 2 to 1 . 1 pCi/L for the combi ned concentrat i on of 238u pl us 2 34u .
Uran i um anal yses were performed on groundwater sampl es col l ected from two publ i c supp ly wel l s fi n i shed i n the S i l uri an dol omi te at l ocati ons east of the ��� study ���a i n Cook and DuPage Count i es . The measured concentrat i ons for
U pl us U were 0 . 1 4 pC i/L for Wel l No. 2 at Mt . Pros���t (Cook County) and 0 . 28 pC i/L for Wel l No. 7 at El mhurst (DuPage County). A Rn concentrat i on of
1 7

269 pC i/L was measured i n groundwater from Wel l No. 7 at El mhurst . Rad i um anal yses were performed on groundwater sampl es col l ected from an Aurora test wel l that was constructed to produce groundwater from sand and gravel d2�gs i ts i n the gl aci al dri ft . The anal yt i cal resul ts were 0 . 0 ± 0 . 2 pCi/L for Ra and 0 . 2 ± 0 . 2 pC i/L for 2 28Rn .
Al though data on speci fi c nucl i des are very l i mi ted, there i s a si gn i fi cant data base on measurement of gross al pha and gross beta radi oact i v i ty i n groundwater from publ i c suppl y wel l s i n the SSC study area that are fi n i shed i n these aqu i fers . The anal yt i cal data are presented i n Append i x A . The l ow val ues are evi dence that radi um and uran i um concentrat i ons are l ow and i n compl i ance w ith dri n ki ng water standards .
Confi ned aqu i fers i n the Maquoketa Shal e Group and Gal ena - Pl attev i l l e Dol omi te
Tabl e 8 presents anal yses for 222Rn and/or 234u pl us 2 38u for groundwater sampl es col l ected from wel l s that are ooen
2 to the Maquoketa Shal e Group and/or
the Gal ena- Pl attev i l l e Dol omi te Group . 22 Rn concentrat i on s i n groundwater from these roc k un i ts are l ow ( rang i ng from 1 28 to 439 pCi /L ) . The concentrati on of 234u pl us 238u i s al so l ow, rang i ng from <0 . 1 to 1 . 9 pC i/L, for anal yses or groundwater sampl es col l ected from s i x wel l s and from three depths i n the borehol e of SSC- I .
Actual measurements of spec i fi c nucl i des i n groundwater from the Maquoketa Shal e Group are very l im i ted for n ortheastern Il l i n oi s . The fol l owi ng concentrat i ons were measured at one wel l pro��� i ng groundwater �rom the Maquoketa at a l o��� i on n orthwest of El g i n : Ra, 0 . 2 pCi/L; 2 4u pl us 2 38u, 0 . 003 pCi/L; and Rn, 20 1 pCi/L .
The avai l abl e measurements of gross al pha and beta act i v i t i es for groundwater from confi ned aqu i fers i n the Maquoketa Shal e Group across northeastern i l l i noi s (Append i x A) i nd i cate that rad i um and uran i um concentrat i on s are very l ow . Representati ve exampl es are the Bangs -Un i on Parker wel l , the two wel l s at Lake Mari an i n the Woods, and the Wermes Wel l No. 2 l i sted under Kane County i n Appendi x A. A groundwater sampl e from the Bangs Un i on Parker wel l was anal yzed for rad i um concentrat i ons . The resul ts were 0 . 53 pC i/L for 226Ra and 0 . 62 pC i/L for 228Ra .
Groundwater from Sandstone Aqu i fers i n the Cambri an - Ordov i c i an Bedrock
Research h as been conducted on the d i stri but i on of rad i oac t i ve i s otopes i n groundwater from the deep sandstones i n n ortheastern Il l i noi s ( G i l keson et al . , 1 983, 1 984 ) . The research was concerned wi th i dent i fyi ng geoche���al �2§han i sms respons i bl e for the occurrence of h i gh concentrat i on s of Ra and
Ra i n groundwater produced from publ i c water suppl y wel l s fi n i shed i n the Cambri an and Ordov i c i an bedroc k . A fi nd i ng of the research was that the h i gh radi um concentrati ons were i n groundwater produced from the sandstones, wi th the h i ghest concentrat i ons present i n groundwater from the Ironton - Gal esv i l l e, the major aqu i fer .
F i gures 27 through 31 present the reg i onal d i stri but i on of 226Ra, 228Ra, 234u pl us 238u, and 222Rn i n groundwater from the Cambr i an - Ordov i c i an , wi th the
18

Ironton-Galesville as the significant source of groundwater for most supply wells.
Figures 2 7 and 28 present the regional distribution of 226Ra and 228Ra, respectively. 2 26Ra concentrations vary from 0.5 to greater than 15 pCi/L; concentrations increase from west to east across the region, with the lowest values measured in the southwest where the Maquoketa Shale Group is eroded. Figure 28 shows a few supply wells that also receive groundwater from the Mt. Simon sandstone. An interesting feature is that groundwater from w2��s that reach only the upper sect i on of the Mt. S i mon have somewhat lower Ra concentrations than nearby wells that are not drilled deeper than the Galesville. However, wells that are finished deeo in the Mt. Simon produce brackish groundwater with significantly higher 2 26Ra concentrations. A good example of this relationship is shown in Figure 27 by a cluster of wells in T 38 N, R 8 E.
there are fewer measurements of 228Ra concentrations in groundwater than of 22 Ra. The regional trend is an increase in concentration from west to east, with 228Ra values of less than 2.5 pCi/L in the western part of DeKalb County . Values are generally 5.0 pCi/L and greater within and east of the Fox River Valley. Similar to the observation for 226Ra, 228Ra concentrations are somewhat lower in wells that produce more groundwater from the carbonate sections or are deepened to produce from the upper part of the Mt. Simon. Brackish groundwater from the Mt. Simon has exceptionally high 228Ra concentrations. This is illustrated in Figure 27 by the cluster of wells in T 38 N, R 8 E.
distr������n2�f
i22§R:a�1 �: �����e�� ��i!g�!sg;���d�����n}�o�h�h�et!�g��an-
Ordovician bedrock. This map predicts that the combined concentration of the two nuclides in the SSC study area ranges from 5 to greater than 1 5 pCi/L.
The regional variation of 234u plus 238u concentrations in groundwater from the Cambrian-Ordovician bedrock is shown in Figure 30. Combined concentrations range from 0.02 pCi/L to 2.5 pCi/L and are less than 0.5 pCi/L over most of the region. Values less than 0.1 pCi/L reflect the low solubility of uranium in reducing environments. Concentrations greater than 1.5 pCi/L occur in the s��4heastern part of the region and reflect an anomalous enrichment of U in groundwater. The analyses indicate that the combined concentration of 234u plus 23Bu in potable groundwater from the CambrianOrdovician bedrock is much lower than the U.S. EPA health advisory of 10 pCi/L.
222Rn concentrations in groundwater from supply wells open to the Cambrian-ordovician bedrock are presented in Figure 31. Values range from 44 to 385 pCi/L, with concentrations less than 200 pCi/L over most of the region. The values are very low with regard to the proposed drinking water standard of 10, 000 pCi/L.
SUMMARY
� 1-A.)} <'«<--f-,V�� A large datl)>asel����wut:.!.!h�er!....!e�d�that is pertinent to J(faUiraT--
background ):.'adioicti vi� the region of northeastern Illinois proposed for siting the SSC.
19

W i th i n the SSC study area, the concentrat i on s of the three radi oact i ve el ements are rel at i vel y l ow i n s urfi c i al mater i al . They are comparabl e to val ues that occur through out the Aurora Quadrangl e, and to concentrat i on s measured by NURE s urveys fl own over the Rockford Quadrangl e to the north and the C h i cago Quadrangl e to the east. For exampl e , the average concentrat i ons determi ned for the Ch i cago Quadrangl e are 1 .0% for potassi um, 3.6 ppm for eTh , and 1 .5 ppm for eU (DOE, 1 98lb ) . The average concentrati ons for rad i oact i ve el ements i n surface materi al s i n n ortheastern Il l i noi s are rel at i vel y l ow when compared to average val ues measured i n surfi c i al materi al s ( s oi l s ) around the worl d (Tabl e 3) .
The data gathered on the concentrat i on s of radi oact i ve el ements i n rocks of the SSC s i t i ng area demon strate that the rocks have l ow concentrat i on s of radi oact i ve el ements, and that roc k debr i s generated duri ng con structi on of shafts or the tunnel does not pose a radi oact i v i ty hazard that requ i res spec i al handl i ng or d i sposal .
Measurements of radon i n i ndoor l i v i ng space i n 1 4 10 res i dences i n the e i ght count i es of Northeastern Il l i n oi s by the Un i vers i ty of P i ttsburgh h ad an ari thmet i c mean val ue of 2.3 pCi/L. Th i s i s l ower than the n at i onal val ue of 3.64 pCi/L, wh i ch i s based on 34, 280 measurements. Al s o, onl y 0.35% of the measurements i n l i v i ng spaces i n the e i ght- county reg i on exceeded 20 pC i/L (compared to 2.26% of l i v i ng spaces exceedi ng 20 pC i /L in the total nat i onal survey . )
There i s very l i mi ted i nformat i on on the concentrati on s of speci fi c radi oact i ve n ucl i des present i n groundwater from the gl ac i al dri ft and s hal l ow bedrock aqu i fers i n the SSC s i t i ng area. Tabl e 8 presents anal yses for 2Z 2 Rn and uran i um i sotopes for groundwater sampl es col l ected from four wel l s i n the SSC study area that produce from the gl aci al dri ft and for three wel l s that are open to the shal l ow bedrock ( S i l ur i an and/or Maquoketa ) . Z22 Rn concentrat i ons are l ow and vary from 277 to 740 pCi/L. D i s sol ved uran i um concentrati on s ar� al so 1�� · and vary from 0.2 to 1 .1 pCi/L for the combi ned concentrat i on of 2 Bu pl us U.
The general p i cture that emerges from anal ys i s of the data i s that the natural rad i oact i v i ty i n the s i t i ng area i s n ormal for val ues that occur throughout the mi dwestern reg i on of the Un i ted States.
REFERENCES
Bennett, 8 . G., 1 970. Est i mat i on of Gonadal Absorbed Doses Due to Env i ronmental Gamma Rad i ati on. Heal th Phys i cs v. 19, p. 757.
Burs on , Z . 8 . , 1 974. Popul at i on Exposure to Natural Terrestr i al Gamma Rad i at i on Around Sel ected Nucl ear Power Pl ant S i tes. USAEC Report EGG - 1 183-1638, E.G. and G., Inc., Las Vegas, Nev.
Cahi l l , R. A. 1 98 1 , Geochemi stry of Recent Lake Mi ch i gan Sed i ments, Il l i noi s State Geol og i cal Survey C i rcul ar 5 1 7, 94pp.
20
Cah i l l , R . A . , and J . D . Steel e, 1 986, Inorgan i c Compos i t i on and Sed i mentat i on Rates of Backwater Lakes Assoc i ated wi th the Il l i noi s Ri ver, Il l i n oi s State Geol og i cal Survey Envi ronmental Geol ogy Notes 1 1 5, 6 1pp .
DeMar i s , P . J . , R . A . Bauer, R . A . Cah i l l and H . H . Damberger, 1 983, Geol og i c Invest i gat i on of Roof and Fl oor Strata: Longwal l Demonstrat i on , Ol d Ben Mi ne No. 24: Pred i ct i on of Coal Bal l s i n the Herri n Coal , !SGS Contract/Grant Report 1 983- 2 , 69pp .
Dory, A . B . , and D . A . Corki l l , 1 985, "Pract i cal Approach to Retrospecti ve Est i mat i on of Radon Daughter Concentrat i on i n the Underground M i n i ng Envi ronment . " In: H . Stoches (ed ) , Occupati on al Rad i at i on Safety i n M i n i ng Proceed i ngs of the Intern at i onal Conference i n Toronto, Canada . Canad i an Nucl ear Assoc i at i on , pp . 182 - 1 88 .
Frost, J . K . , D . L . Zi erath, and N . F . Sh imp, 1 985, Chemi cal Compos i t i on and Geochemi stry of the New Al bany Shal e Group (Devon i an -Mi s s i s s i pp i an ) i n Il l i n oi s , ! SGS Con tract/Grant Report 1 985-4, 1 34pp .
Gesel l , T . F . , 1 983, Background Atmospheri c 222Rn Concen trat i ons Outdoors and Indoors: A Rev i ew . Heal th Phys i cs v . 45, pp . 289 - 302 .
G i l keson , R . H . , Keros Cartwri ght, J . B . Cowart, and Ri chard B . Hol tzman , 1 983, Hydrogeol og i c and Geochemi cal Stud i es of Sel ected Natural Rad i oi sotopes and Bari um i n Groundwater i n Il l i noi s . Water Resources Center Report No. 83� 0180, Un i vers i ty of Il l i noi s , Urbana-Champai gn , Il l i noi s , 93 p . State Geol ogi cal Survey Con tract/Grant Report 1 983-6, 93 pp .
G i l keson , R . H . , E . C . Perry, Jr . , J . B . Cowart, and R . B . Hol tzman, 1 984 . Isotop i c Stud i es of the Natural Sources of Radi um i n Groundwater i n Il l i noi s . Water Resources Center Research Report No. 187; Un i vers i ty of Il l i noi s , 50 pp .
G i l keson , R . A . , S . A . Specht, Keros Cartwri ght, and R . A . Gri ffi n , 1 978, Geol og i c stud i es to i dent i fy the source for h i gh l evel s of rad i um and bari um i n Il l i noi s ground -water suppl i es : a prel i m i n ary report . Un i vers i ty of Il l i noi s Water Resources Center Research Report No. 1 35, 2 7 pp . Il l i noi s State Geol og i cal Survey Repr i n t 1978 - L .
Gol chert, N . W . , T . L . Duffy, and J . Sedl et, 1 983, Envi ronmental Mon i tori ng at Argonne Nat i onal Laboratory . Manual Report for 1982, ANL-83- 26, Argonne, Il l . ' 1 04 pp .
Harvey, R . D . , R . A . Cahi l l , C . - L . Chou, and J . D. Steel e, 1 983, Mi neral mat ter and trace el ements i n the Herri n and Spri ngfi el d Coal s , Il l i noi s Bas i n Coal F i el d, ISGS Contract/Grant Report 1 983-4 , 162pp .
Hes s , C . T . , S . A . Norton , W . F . Brutseart, R . E . Caspari um, E . G . Coombs , and A . L . Hess , 1 979 . Radon - 222 i n Potabl e Water Suppl i es i n Ma ine : the Geol ogy, Hydrol ogy, Phys i cs and Heal th Effects . Report of the Land and Water Resources Center, Un i vers i ty of Mai ne at Orono, 1 1 9 pp .
NCRP, 1 975, Natural Bac kground Rad i at i on i n the Un i ted States, Nat i onal Counc i l
2 1

on Rad i at i on Protect i on and Measurements Report No. 45, Bethesda, Md . 163pp .
NCRP, 1 984, Evol ut i on of Occupat i onal and Envi ronmental Exposures to Radon and Radon Daughters i n the Un i ted States . Nat i onal Counc i l on Rad i at i on Protect i on and Measurements Report No. 78 . Bethesda, Md .
Nero, A . V . , and others, 1 985, "Characteri zi ng the Sources, Range, and Envi ronmental Infl uences of Radon 222 and Its Decay Products . " The Sci ence of the Total Env i ronment, No. 45, October 1 985, pp . 2 33- 244 .
Oakl ey, D . T . , 1 972, Natural Rad i at i on Exposure i n the Un i ted States . Report ORP/510 72 - 1 , U. S . Env i ronmental Protect i on Agency, Was h i ngton , D . C .
Oakl ey, D . T . , and A . S . Gol den, 1 975, "Cosmi c ray popul at i on exposure", p . 91 in the Natural Rad i at i on Envi ronment II, Adams , J . A. S . , W . M . Lowder, and T . Gesel l , Eds . (U. S . Atomi c Energy Commi ss i on , Oak Ri dge, Tenn .
Rock, R . L . , G . Sv i l ar, R . T . Beckman, and D . D . Rapp, 1975 . Eval uat i on of Radi oact i ve Aerosol s i n Un i ted States Underground Coal M i nes . M i n i ng Enforcement and Safety Admi n i strat i on Informat i onal Report 1025, U. S . Department of the Interi or, Wash i ngton , D . C . , 1 0 pp .
U . S . DOE, 1 981 a . Ai rborne Gamma Ray Spectrometer and Magnetometer Survey, Aurora Quadrangl e, Il l . H i gh L i fe Hel i copters , Inc . , Puyal l up , Wash . , QEB, Inc . , Lakewood, Col o.
U. S . DOE, 1 98lb . Aeri al Gamma Ray and Magnet i c Survey, Ch i cago Quadrangl e Indi ana, Il l i noi s , and Mi ch i gan . E . G . and G . , Inc . , Sunnyval e , Cal i f .
Young, J . A . , Thomas, C . W . , Wagman , N . A . , and Perki ns , R . W . , 1 970a, "Cosmogen i c radi onucl i de product i on rates i n the atmosphere ", J . Geophys . Res . 75, 2 385 .
Young, J . A . , Thomas, C . W . , Wagman , N . A . , and Perki ns , R . W . , 1 970b . " Short l i ved cosmi c ray produced rad i onucl i des as tracers of atmospher i c processes", p . 506 i n Advances i n Chemi stry Ser i es No. 93: Rad i onucl i des i n the Envi ronment (Ameri can Chemi cal Soc i ety, Wash i ngton ) .
22
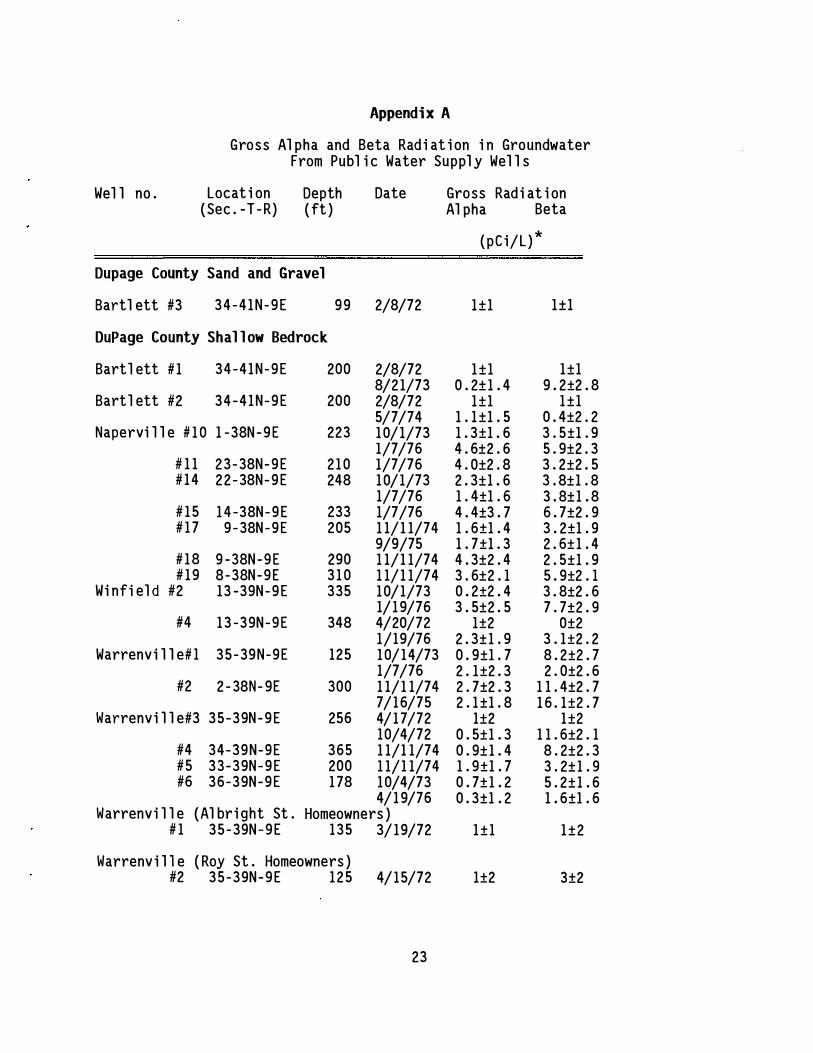
Appendi x A
Gross Al pha and Beta Rad i at i on i n Groundwater From Publ i c Water Suppl y Wel l s
Wel l no . Locat i on Depth Date Gross Rad i at i on (Sec . -T - R) ( ft ) Al pha Beta
(pC i/L ) *
Dupage County Sand and Gravel
Bartl ett #3 34 -4 1N -9E 99 2/8/72 1±1 1±1
DuPage County Shal l ow Bedrock
Bartl ett # 1 34 -4 1N -9E 200 2/8/72 1± 1 1±1 8/2 1/73 0 . 2± 1 . 4 9 . 2±2 . 8
Bartl ett #2 34 -4 1N -9E 200 2/8/72 1±1 1 ± 1 5/7/74 1 . 1 ±1 . 5 0 . 4±2 . 2
Napervi l l e # 1 0 1 -38N -9E 223 10/1/73 1 . 3±1 . 6 3 . 5±1 . 9 1/7 /76 4 . 6±2 . 6 5 . 9±2 . 3
# 1 1 23 -38N-9E 2 1 0 1/7 /76 4 . 0±2 . 8 3 . 2±2 . 5 # 14 2 2 -38N-9E 248 10/1/73 2 . 3±1 . 6 3 . 8±1 . 8
1/7 /76 1 . 4±1 . 6 3 . 8± 1 . 8 # 1 5 1 4 -38N -9E 233 1/7/76 4 . 4±3 . 7 6 . 7±2 . 9 # 1 7 9 - 38N -9E 205 1 1/1 1/74 1 . 6±1 . 4 3 . 2±1 . 9
9/9/75 1 . 7±1 . 3 2 . 6± 1 . 4 # 18 9 -38N-9E 290 1 1/1 1/74 4 . 3±2 . 4 2 . 5±1 . 9 # 1 9 8-38N-9E 3 1 0 1 1/1 1/74 3 . 6±2 . 1 5 . 9±2 . 1
Wi nfi el d #2 13 -39N -9E 335 10/1/73 0 . 2±2 . 4 3 . 8±2 . 6 1/ 1 9/76 3 . 5±2 . 5 7 . 7±2 . 9
#4 1 3 -39N-9E 348 4/20/72 1±2 0±2 1/19/76 2 . 3± 1 . 9 3 . 1±2 . 2
Warrenv i l l e# ! 35 -39N-9E 125 10/14/73 0 . 9±1 . 7 8 . 2±2 . 7 1/7 /76 2 . 1±2 . 3 2 . 0±2 . 6
#2 2 - 38N- 9E 300 1 1/1 1/74 2 . 7±2 . 3 1 1 . 4±2 . 7 7 / 16/75 2 . 1 ±1 . 8 1 6 . 1±2 . 7
Warrenv i l l e#3 35 -39N-9E 256 4/ 1 7/72 1±2 1±2 10/4/72 0 . 5±1 . 3 1 1 . 6±2 . 1
#4 34-39N-9E 365 1 1/1 1/74 0 . 9± 1 . 4 8 . 2±2 . 3 #5 33-39N -9E 200 1 1/1 1/74 1 . 9±1 . 7 3 . 2± 1 . 9 #6 36-39N-9E 1 78 10/4/73 0 . 7± 1 . 2 5 . 2± 1 . 6
4/ 1 9/76 0 . 3±1 . 2 1 . 6±1 . 6 Warrenv i l l e (Al bri ght St . Homeowners )
# 1 35 -39N -9E 135 3/ 19/72 1± 1 1 ±2
Warrenv i l 1 e ( Roy St . Homeowners ) #2 35 -39N-9E 1 2 5 4/ 15/72 1±2 3±2
23
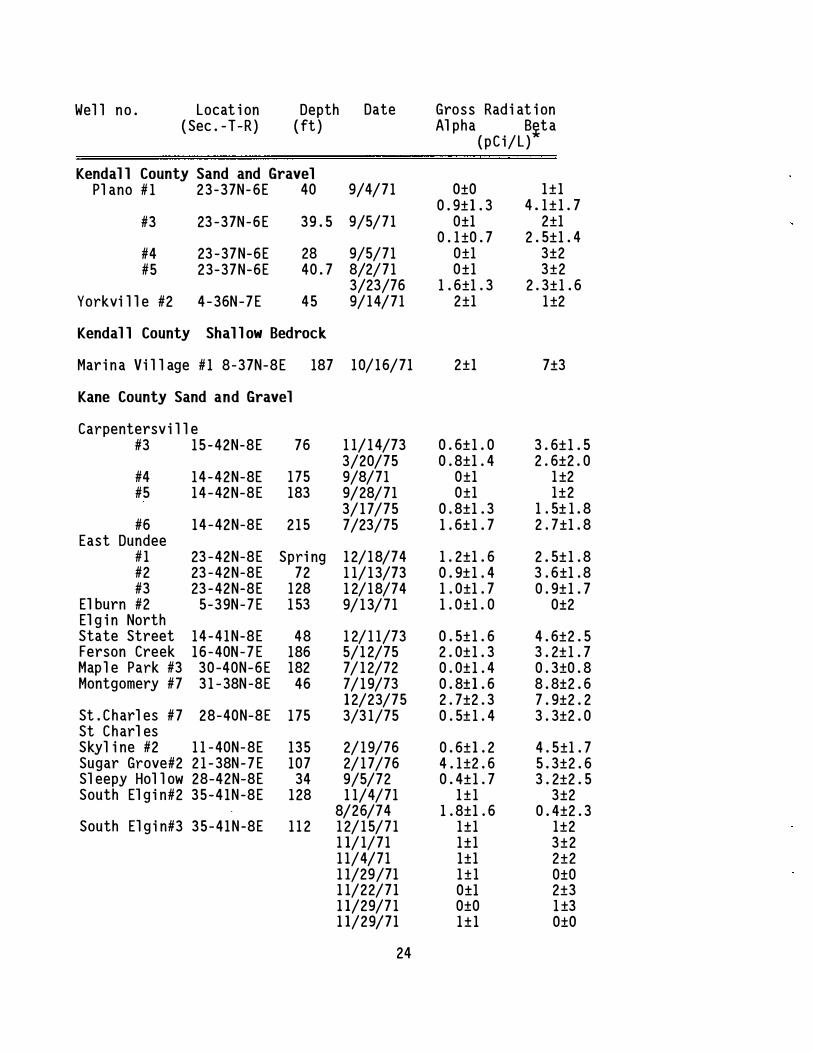
Wel l no . Locat i on Depth Date Gross Rad i at i on ( Sec . -T-R ) ( ft ) Al pha B�ta
(pC i/L )
Kendal l County Sand and Gravel Pl ano # 1 23 -37N- 6E 40 9/4/71 0±0 1± 1
0 . 9±1 . 3 4 . 1 ± 1 . 7 #3 23 -37N -6E 39 . 5 9/5/71 0±1 2±1
0 . 1 ±0 . 7 2 . 5±1 . 4 #4 23 -37N-6E 28 9/5/71 0±1 3±2 #5 23-37N-6E 40 . 7 8/2/71 0±1 3±2
3/23/76 1 . 6±1 . 3 2 . 3± 1 . 6 Yorkvi l l e #2 4 - 36N -7E 45 9/ 14/71 2±1 1 ±2
Kendal l County Shall ow Bedrock
Mar i n a Vi l l age # 1 8-37N-8E 187 10/16/71 2±1 7±3
Kane County Sand and Gravel
Carpentersv i l l e #3 1 5 - 42N-8E 76 1 1/ 1 4/73 0 . 6± 1 . 0 3 . 6± 1 . 5
3/20/75 0 . 8±1 . 4 2 . 6±2 . 0 #4 1 4 - 42N-8E 1 75 9/8/71 0±1 1 ±2 #5 1 4 - 42N-8E 183 9/28/71 0±1 1±2
3/ 1 7/75 0 . 8±1 . 3 1 . 5± 1 . 8 #6 1 4 -42N-8E 2 1 5 7/23/75 1 . 6± 1 . 7 2 . 7±1 . 8
East Dundee # 1 23 - 42N-8E Spri ng 1 2/ 18/74 1 . 2±1 . 6 2 . 5± 1 . 8 #2 23 - 42N-8E 72 1 1/ 1 3/73 0 . 9± 1 . 4 3 . 6±1 . 8 #3 23 - 42N-8E 1 28 1 2/ 18/74 1 . 0±1 . 7 0 . 9± 1 . 7
El burn #2 5-39N -7E 1 53 9/ 1 3/71 1 . 0±1 . 0 0±2 El g i n North State Street 1 4 - 4 1 N-8E 48 1 2/ 1 1/73 0 . 5± 1 . 6 4 . 6±2 . 5 Ferson Creek 1 6 -40N - 7 E 186 5/1 2/75 2 . 0± 1 . 3 3 . 2± 1 . 7 Map l e Park #3 30 -40N-6E 182 7 / 1 2/72 0 . 0± 1 . 4 0 . 3±0 . 8 Montgomery #7 3 1 - 38N -8E 46 7/ 1 9/73 0 . 8±1 . 6 8 . 8±2 . 6
1 2/23/75 2 . 7±2 . 3 7 . 9±2 . 2 St . Charl es #7 28-40N-8E 1 75 3/3 1/75 0 . 5± 1 . 4 3 . 3±2 . 0 St Charl es Skyl i ne #2 1 1 - 40N- 8E 135 2/ 1 9/76 0 . 6±1 . 2 4 . 5±1 . 7 Sugar Grove#2 2 1 - 38N - 7 E 107 2/ 1 7/76 4 . 1±2 . 6 5 . 3±2 . 6 Sl eepy Hol l ow 28-42N-8E 34 9/5/72 0 . 4± 1 . 7 3 . 2±2 . 5 South El g i n#2 35 -4 1N -8E 1 28 1 1/4/71 1 ± 1 3±2
8/26/74 1 . 8±1 . 6 0 . 4±2 . 3 South El g i n#3 35 -41 N -8E 1 1 2 1 2/ 1 5/71 1±1 1±2
1 1/ 1/71 1±1 3±2 1 1/4/71 1±1 2±2 1 1/29/71 1 ± 1 0±0 1 1/22/71 0±1 2±3 1 1/29/7 1 0±0 1 ±3 1 1/29/71 1 ± 1 0±0
24

Wel l n o . L o c a t i on Dep t h D a t e Gross R ad i a t i on ( Sec . - T - R ) ( ft } Al p h a
( pC i / L }*
B e t a
S o u t h E l g i n # 3 3 5 - 4 1 N - 83 1 1 2 1 2/ 2/ 7 1 0 ± 2 5 ± 2 1 2/ 2/ 7 1 0±3 0±0 1 2/ 3/ 7 1 0 ± 1 2 ± 2 1 2/ 1 / 7 1 1 ± 1 1 ± 2 1 2/8/ 7 1 1 ± 1 0 ± 2 1 2/ 9/ 7 1 0 ± 1 1 ± 2 1 2/ 9/ 7 1 1 ± 1 1 ± 2 3/ 2 7 / 7 4 1 . 4 ± 1 . 3 3 . 8± 2 . 8
W e s t D u n d ee # 2 2 2 - 4 2 N - 8 E 87 2/3/ 7 2 0 ± 1 1 ± 1
Kane County Shal l ow Bedrock
E l g i n E s t a t e s 1 2 8 - 4 1 N - 8 E 3 0 0 2/ 1 2/ 7 6 0 ± 1 . l 2 . 6± 1 . 8 H i g h l a n d # 1 1 5 - 40N - 8 E 1 5 2 3/23/ 7 6 2 . 3 ± 1 . 6 2 . 2 ± 1 . 6 Moe c h e r v i l l e f:2 2 6 - 38N - 8 E 1 80 1 2/3/ 7 3 2 . 0± 1 . 4 2 . 3 ± 1 . 7
#3 2 6 - 38N - 8 E 1 96 4/ 2 1 / 7 6 1 . 6± 1 . 3 3 . 4± 1 . 5 M o n t g ome ry 4: 5 3 5 - 3 8N - 8 E 1 86 1 / 2 1 / 7 6 0 ± 1 1 ± 1
# 6 3 1 - 3 8N - 8 E 1 60 1 2/ 2 3/ 7 5 3 . 1 ±3 . 5 4 . 8± 2 . 0 Ogd e n G a rd e n s #3 2 4 - 38 N - 8 E 1 8 5 2/24/ 7 6 1 . 3 ± 1 . 2 3 . 8± 1 . 4 P a r k V i ew # 1 3 5 - 3 8 N - 8 E 2 5 0 3 / 7 6 0 . 0±0 . 0 3 . 4 ± 1 . 6 Pre s t b u ry # 1 1 0 - 38N - 7 E 2 0 0 2/ 2 5/ 7 2 0 . 0±0 . 0 1 ± 2
1 1 /8/ 7 3 1 . 1 ± 1 . 1 2 . 5± 1 . 9 3/ 1 1 / 7 6 0 . 9± 1 . 8 2 . 9 ± 2 . 1
R i v e r G r a n g e L a ke s # 1 9 - 40 N - 8 E 1 80 3 / 7 6 1 . 8± 1 . 5 5 . 0± 1 . 6
Kane C ounty Maquoketa Shal e Group
B a ng s - Un i on Parker S u b # 1 3 4 - 3 8N - 8 E 2 5 0 3/ 2 / 7 6 0 . 4 ± 1 . 5 8 . 7 ± 2 . 4 L a ke M ar i a n i n t h e W o o d s # 1 1 4 - 4 2 N - 8 E 2 0 8 2 / 28/73 2 . 1 ± 1 . 5 1 1 . 6± 2 . 5
f 2 1 1 - 4 2 N - 8 E 2 5 1 2/28/ 7 3 1 . 3 ± 1 . 3 6 . 8± 2 . 2 W e rmes f 2 2 5 - 38N - 8 E 2 53 8/ 7 / 7 4 1 . 9± 1 . 8 8 . 6± 2 . 9
* G r o s s ra d i at i o n a n a l y s i s performed by t h e I l l i n o i s E n v i ronme n t a l Protect i o n A g e n cy . T h e c o e f f i c i e n t o f v a r i at i on i s s h own for e a c h a n a l yt i c a l v a l u e .
2 5

(2 34 U) Uranium -234*
2.48 x 1 05 y
(2 3o Th ) Thorium -230*
(22 6 Ra) Radium -226*
1 .60 x 1 03 y
(222 Rn) Radon-222
3.82 d
(21 s Po) Polonium -218·
3.05 m
(21 4 pb) Lead -214*
(2 1 0 Po} Polonium -210*
1 38.4 d
(206 Pb) Lead -206 (Stable)
1 . 1 7 m
26.8 m )o
5.01 d
(2 34 Pa) Protactinium- 234*
(2 1 4 Bi) Bismuth - 2 1 4*
(2 1 0 Bi) Bismuth -210
1 9.8 m
22.3 y
Note: Vertical direction represents alpha decay; horizontal direction represents beta decay.
* Also gamma emitters
Times shown are half-lives : y = years; d = days; h = hours; m = minutes; s = seconds
Figure 1. Radioactive decay series of 238U.
26
(23S U ) Uranium-238*
(234 Th ) Thorium - 234*
(2 1 4 Po) Poloniu m - 2 1 4
(2 1 0 Pb} Lead -210*

6. 1 3 h 5.75 y 122 8 Th) (228 Ac) Thorium -228* Actinium -228*
1.91 y
1224 Ra) Radium-224*
3.64 d
1220 R n) Radon-220
55 s
12 1 6 Po) Polonium -216
0.16 s
1 0.64 h 60.5 m 12 1 2 Pb) (2 1 2 9i) 64%-+-Lead -212* Bismuth -212*
36% 60.5 m
(20S TI) 3. 1 0 m
ThaUiu m - 208*
Note: Vertical direction represents alpha decay; horizontal direction represents beta decay.
* Also gamma emitters Times shown are half·lives : y = years; d = days; h = hours; m = .minutes; s = seconds
Figure 2. Radioactive decay series of 232Th.
27
(B 2 Th) Thorium-232*
1.41 X 1 01 0 y**
122 8 R a) Radium - 228
12 1 2 Po) Polonium - 2 1 2
0.30 x 1 0-6 s
(20S pb) Lead - 208 (Stable)

t '
�li�i�llii:"�· � ·
][iE� IM
1
dl� �] ���,��c�C-a�r-ls�ba�d-·�N-.M-<.
80 Columbus, Oh. Pittsburgh, Pa.
60
40
20
Cape Kennedy Orlando, Fl.
Galveston, Tx. Camden/Philadelphia
4 8 12 16 0 4 8 12 16 0 4 8 12 16 0 4 8 12 16 0 4 8 12 16 20 24
Figure3. Whole-body absorbed dose rates in ARMS areas (mean denoted by arrow) (from Oakley, 1972).
\ \ I . . � Mo,icello 49. •
Prtrie Island 64•"\.... 1-------� f Lacrosse 2 7 \.._ • .- �!I
\ Q . . .} \ uad C1t1es 4� . j \------1
'-, \
.
I '
I
Figure 4. Aerial surveys over nuclear reactor sites. Numbers shown mean absorbed dose rates in air in mrad/yr (from Burson, 1974).
28

� w - -43° r------'.:------....:;:. ____ _, ROCKFORD RACINE
CHICAGO
41° 1--4--4------J.-.l-----1
Figure 5. Location of Aurora, Rockford, Chicago, and Racine Quadrangles, and the locations of the SSC study area within the Aurora Quadrangle.
29
'

R 6 E R 7 E R B E R 9 E
N� miles � 1 � kilometers
Figure 6. A pseudo contour plot of the variation in total count of gamma radiation from surficial geologic materials in the SSC study area (modified from U.S. DOE, 1981a). A scale for converting pseudo contour numbers to counts per second of gamma radiation is presented in Table 1 .
... ... ... r l'J l'> W"l ll"l T . .. .. .. n W'l n l'> lt'I .. ... ... ., ., ., ., ., If") 37
.. .. .. . ., " " .., N .. .. ., " "' .,
... ' ., " "'
: � "' "' "' "' "' "' "' "' "' "'
... "' ...
R 6 E R B E A 9 E
N� m•los f J � kilometers
Figure 7. A pseudo contour plot of the variation in concentration of potassium in surficial geologic material in the SSC study area (modified from U.S. DOE, 1981 a). Table 1 presents a scale for converting the pseudo contour numbers to concentrations in percent of total potassium.
30

T 40 N
A 6 E
"' .. . , ., .. "' . ,,, ...
A 6 E
A 7 E
A 7 E
"' "' on
"' "' "' ' "' "' on "' , .. V• Vi .. ... .. .. V• Ir· ... .. ,.., ... ... .. ... "' "' .. ,., """ ..
on "' "' .. .. ll W'H(') it' on "' "' "' L "" r"ll ""
on "'
-- -�-�-'!-�-I WIL� · "' "" "' "' "" ' "" "" � � "' II;
1 "° '° "" "" "° II'> II'> � "' ' .. � � � "' : : : :: � : :: : � � � � : : : � � : � " "" "'° "" "° � .. l"J
"'° "" .. "' "" � "° ::: • "" "' "' "6 "" '° "' "' "' "' i "'
A 8 E A 9 E
.. .. .. .. .. on
r
r1 kilometers
T 38 N
T 37 N
Figure 8. A pseudo contour plot of the variation in equivalent thorium in surficial geologic materials in the SSC study area (modified from U.S. DOE, 1981a). Table 1 presents a scale for converting the pseudo contour numbers to concentrations in parts per million of equivalent thorium.
A 6 E A 7 E A 8 E
N� m''" � J � k1lome!ers
Figure 9. A pseudo contour plot of the variation in equivalent uranium in surficial geologic materials in the SSC study area (modified from U.S. DOE, 1981a). Table 1 presents a scale for converting the pseudo contour numbers to concentrations in parts per million of equivalent uranium.
3 1
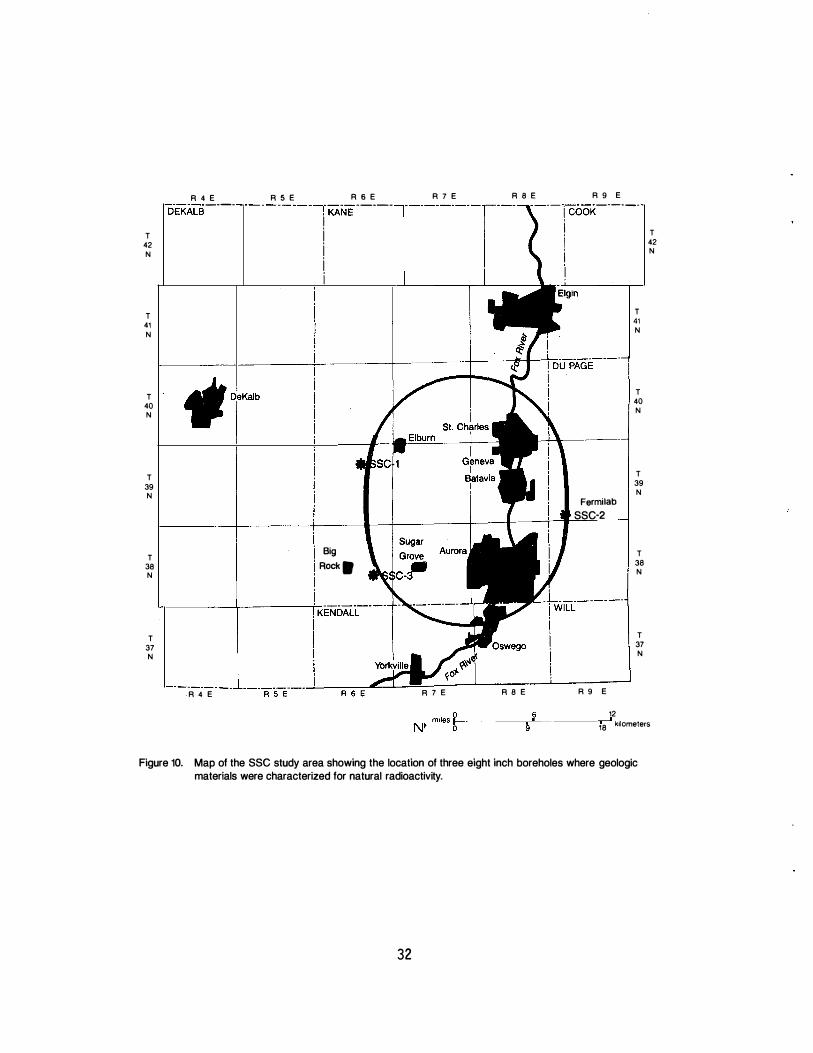
T
42
N
T
41
N
T
40
N
T
39
N
T
38
N
T
37
N
A 4 E
oEi<AL"B ___ _
A 4 E
A 5 E A 6 E - - - - - - - - - -,
KANE -----
' i i i i
Big Rock .
A 7 E
A 7 E
A 8 E A 9 E
-----jcooi< _____ _
i i i j
A 8 E
Fermi lab SSC-2
A 9 E
12
T
41
N
T
40
N
T
39
N
T
38
N
T
37
N
T
42
N
18 kilometers
Figure 10. Map of the SSC study area showing the location of three eight inch boreholes where geologic materials were characterized for natural radioactivity.
32
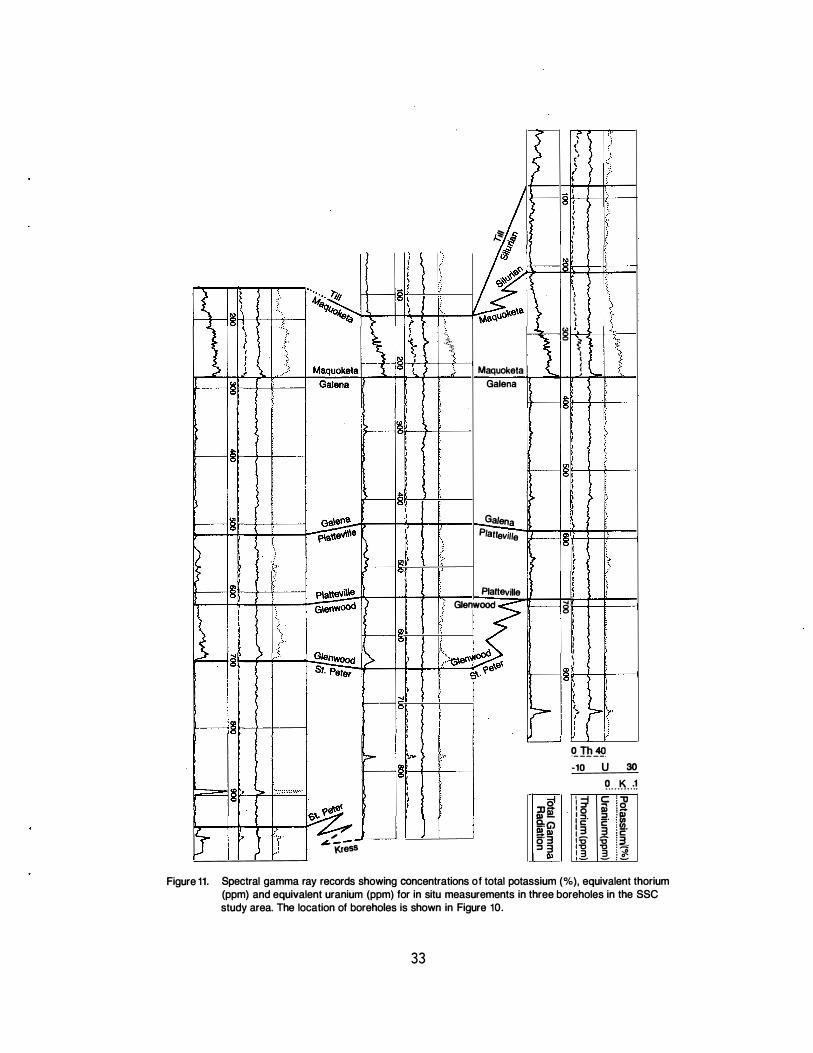
, , <' '
I t • " I
� ' � 8f'c�--+-f.".}---i � ·� -� t:: •'
/;;. � I i I
� � � .... · _____ ,,__ _ __,
�-+---1-+:.-4--4-·':..· ---"��:-;:ao.uo'f..e\e. � \
\
,,. � - - -l(reSS
"'·· § � > -���!� .,
r+-f----+-_.,..·'.·____, Maquoketa 1 Galena
Ga/en a Platteville - §'1t-1 --+--t:�----i
{
Platteville } Glenwood
> } ) I I ( � I
;
r---- s "", �,__+.-r: .
. :-----i l ) I I I I
� !l!! 1r' ---t-t-�'· _ __, � ri
) �
� :o� Ill -E!:G) !!l. 111 5· 3 � 3 �
I I I \ ' ,.., r,,
.
J ··: : E I }
�I!!� -10 u 30
9. . . . � . ... 1 I :;I c i d1 ' o iil , _
1 �- � im I c: 2· , 3 ]. : 2·
, � -0 L�-,:g -0 �� I� �
Figure 11. Spectral gamma ray records showing concentrations of total potassium (%), equivalent thorium (ppm) and equivalent uranium (ppm) for in situ measurements in three boreholes in the SSC study area. The location of boreholes is shown in Figure 10.
33

c: 0
6
5
4
� 3 'E � c: 8
2
0 100
1..: �
I I
I I I
J
1-� . I I I I
I
\� � �- �
I I I I I I I I
6 -
300
_,..,_,.._
Potassium in SSC-1
. . /\
6 •
l\,j
Gamma LO< INAA
�
Ji
. ' � ' ....,
500 Depth in feet
6 ., .! �
'f\� , '
� ' .: ,
� ' • 1 1 l o 1 1 1 1 1 ' • ' 1 1 1 1 , , I I I
I I
I
I
I I '
I I I
� I ' ' I I
I I
I I
• "T"1" .... I
- --- - - - 1 a 700 900
Figure 12. Concentrations of total potassium (%) measured in geologic materials in SSC-1. The plot compares laboratory instrumental neutron activation analyses on rock chips to in situ measurements with a spectral gamma ray sonde.
16
14
12
E' 10 c. s c: 0 � 8
'E � § 6
()
4
2
0 100
I
I I
l
• • : \ I
I \ '
• � I
- /\ /\ -·
300
Thorium in SSC-1
,.
6 Gamma L• la • INAA
I I
I I
I I
.� I
I I I I I
!it. rli ' . - ..
/\ _ /\ ... _!." - �· f'A� I ' . . - - - - - .. ,... _ �
500 700 900 Depth in feet
Figure 13. Concentrations of thorium (ppm) measured in geologic materials in SSC-1. The plot compares laboratory instrumental neutron activation analyses on rock chips to in situ measurements with a spectral gamma ray sonde.
34
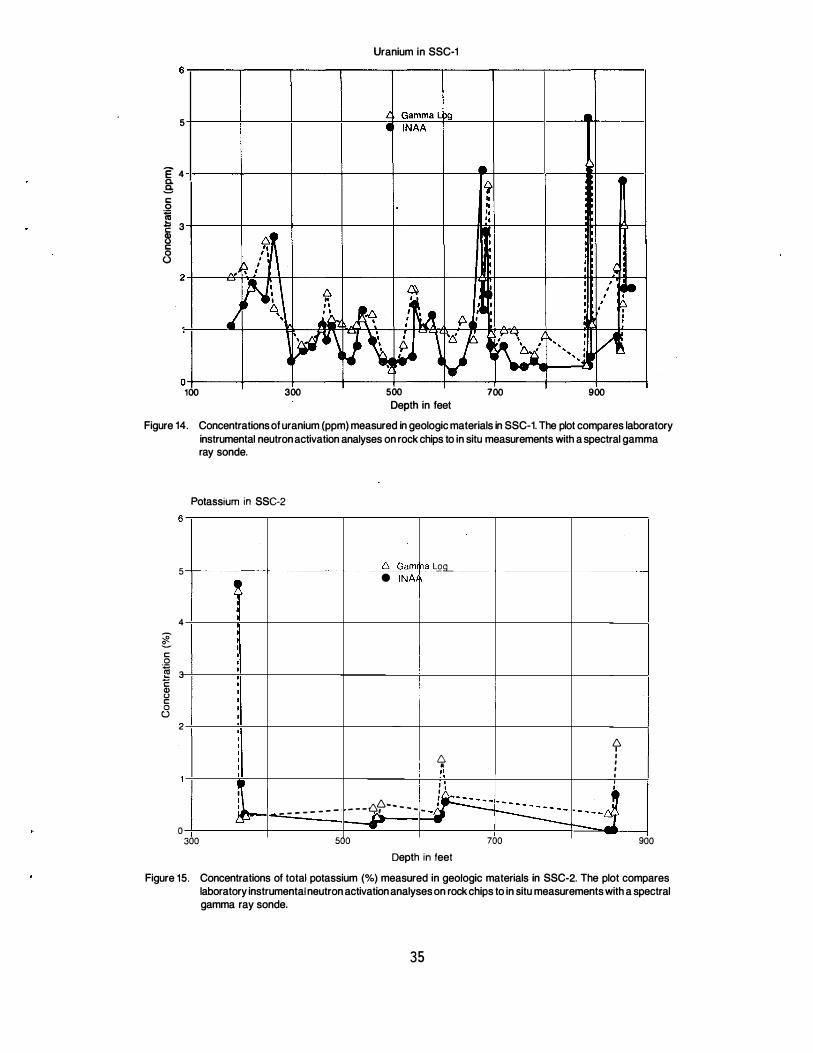
Uranium in SSC-1
5
E 4 c. 'i .9: c: -.Q �
g '• '• c: 3 B c:
8 2
O+-���-r-���+-���+-���+-���+-���r-���r-���t--��--1 100 300 500 700 900
Depth in feet Figure 14. Concentrations of uranium (ppm) measured in geologic materials in SSC-1. The plot compares laboratory
instrumental neutron activation analyses on rock chips to in situ measurements with a spectral gamma ray sonde.
� c: 0
� c Q) u c: 0 ()
Potassium in SSC-2 6
5 --;----------�
�� : : 4
3
2
t I I . ... - - - - - - - -[.'.:>-
_____ j'l_Gall}I � L_g_g_ ____
• INA1,
I I ! I '
6 i • ' ,, ! • '
6 .� • • I - - -i:::>, - - - -""- -
--
--·
i I
� 0 300 500 700
Depth in feet
6 I I I I I
tt - - - -�e
- --
900
Figure 15. Concentrations of total potassium (%) measured in geologic materials in SSC-2. The plot compares laboratory instrumental neutron activation analyses on rock chips to in situ measurements with a spectral gamma ray sonde.
35

Thorium in SSC-2
6 Gamma Loo e INAA I
I I
1 0 4-----�J--+------+------+-------+-------�----_j
I '[ 8 +---___,·�-+------+------+------+------+--------1 s, c:: O I I � I I
c 6 +----�. ---t------+-------+------+------+---�:---1 2l I I · c:: , .
8
- - - -• , - ... .. ... I I " ·
·· · · · · · · · - - A
2 -+--·--e-. -+-----_-
_-
_-_4_-.�-�-...9�"""''---+------+------+----=:.=..l!'-'f-----1 '�- - - - --- - - - - � ! -
-------1---�X-��--1--4·� 0 -+------+------+------=----+--------+--------+--------� 300 500 700 900
Depth in feet
Figure 16. Concentrations of thorium (ppm) measured in geologic material in SSC-2. The plot compares laboratory instrumental neutron activation analyses on rock chips to in situ measurements with a spectral gamma ray sonde.
Uranium in SSC-2
5 +----·--+-------� - ---- _t'.'\ _ _Q�h:>_a [,Q!J_ ____ -·- - --- --+----------' e INA!I-
E 4 --t----;i----+---------+------+------1--------+----llL-� 0.
s, c:: 0
� 3 --t----fj-----t-------+------+------+------+----l-l--c Q) (.) c:: 0 ()
2 -+----"t--.+-------I---,--�!->.----+-------+-------+---+-'--, ' I
h I I
, ' I , ' I
, I , , I , ,' �
� �'--� ---+----+----�- - - - N:
0 -+------+------+------+--�-6=1�A'.,._,,,-=-=:.=.:=-i::�-�---_-_._-_·_·_--+-----�--·_t::b. __ __j 300 500 700 900 Depth in feet
Figure 17. Concentrations of uranium (ppm) measured in geologic materials in SSC-2. The plot compares laboratory instrumental neutron activation analyses on rock chips to in situ measurements with a spectral gamma ray sonde.
36
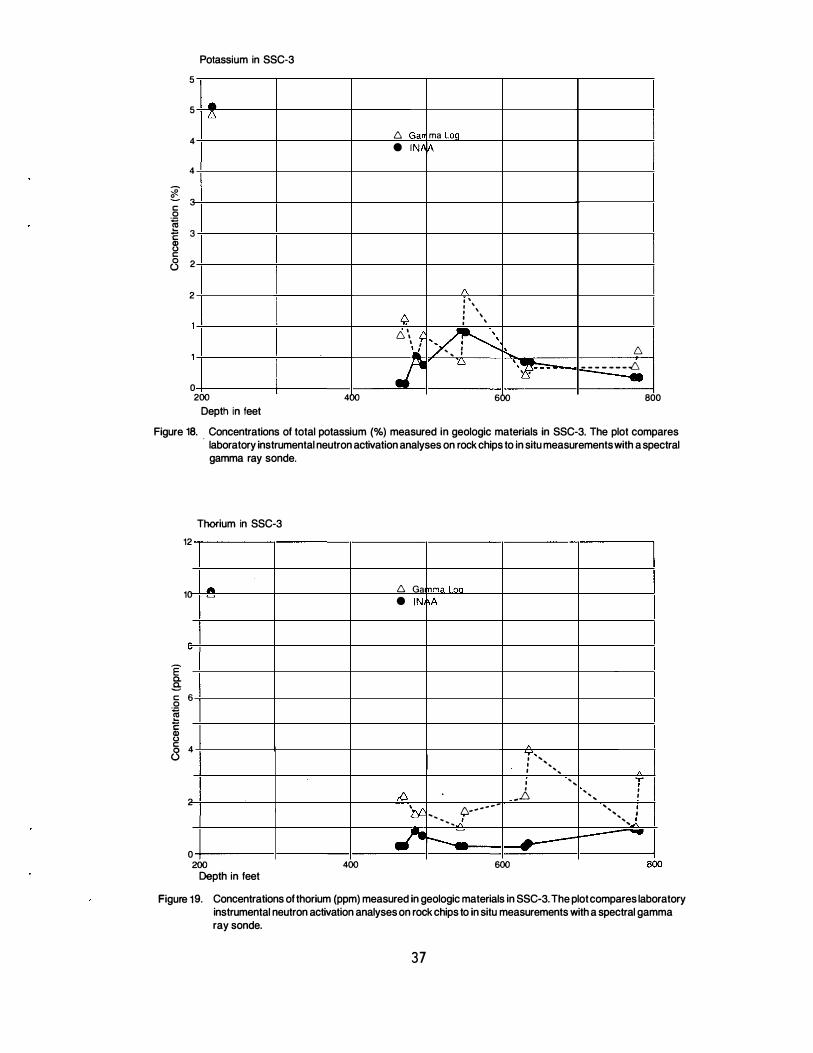
� c: 0 � 'E Cl> 0 c: 0 (.)
Potassium in SSC-3
5
5 • 6
4
4
3
3
2
2
0 200
Depth in feet 400
6 Gan ma Loq • INAfl\
� 6'. i;.
I I ""'
.r
/\ • ' I ' I ' I ' I '
-� ' I ' I "'-D , _ ' tt· - - -
' .
600
6 _ _ _ _ _ _ _ .£', - ---
800
Figure 18. Concentrations of total potassium (%) measured in geologic materials in SSC-3. The plot compares , laboratory instrumental neutron activation analyses on rock chips to in situ measurements with a spectral gamma ray sonde.
12
10
8
E c. E: c: 6 0 � 'E � c: 8 4
2
Thorium in SSC-3
A -
0 200
Depth in feet 400
6 Ga1 nma Loa • IN1 \A
,6. 'y, ;;,-- -- - -
-- .. ... ... _,,:
.r r--..
600
A ,,._
I ' I ', I
I I
_.£::,
--
-- -'
-
A
T - I -- I -- I -- I ....... �
...---- �
800
Figure 19. Concentrations of thorium (ppm) measured in geologic materials in SSC-3. The plot compares laboratory instrumental neutron activation analyses on rock chips to in situ measurements with a spectral gamma ray sonde.
37
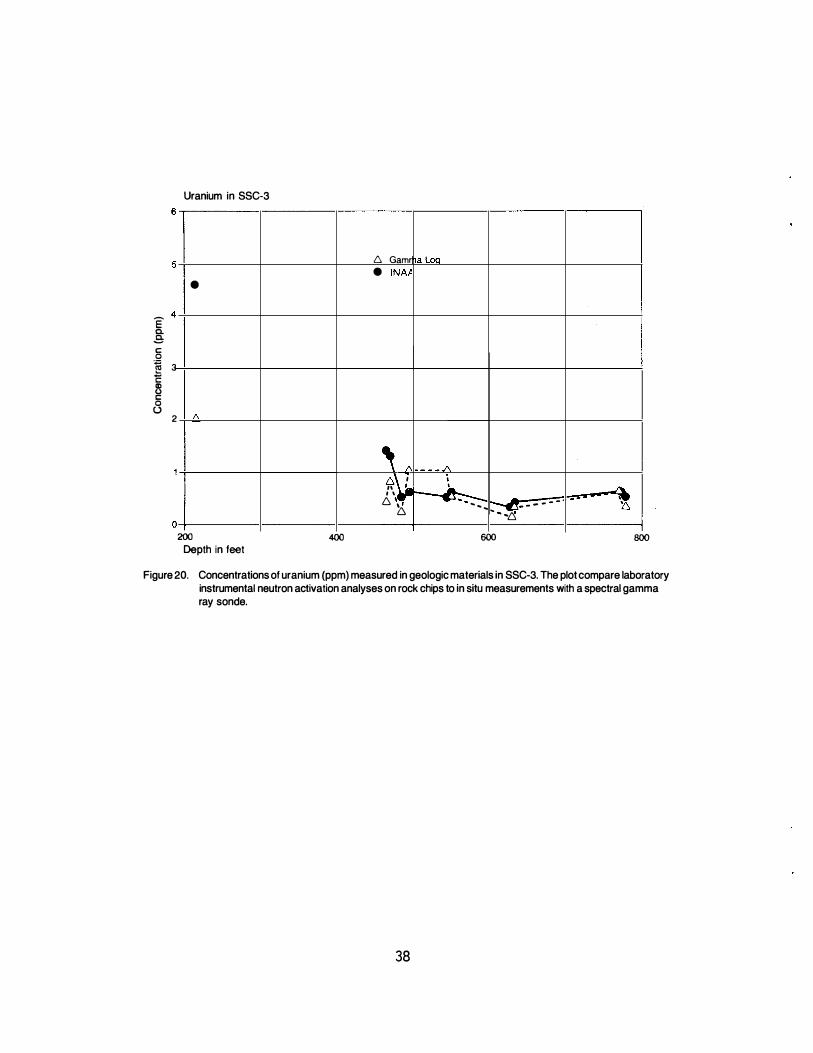
Uranium in SSC-3 6
5 6 Gamr ha Loa • INAt
•
E' 4
a. 8: c 0 � 3 c: II) 0 c 0 u
2 "
' /\ - - -./\ 4\ I ' " � :.. --" ' \ 6 ,.,. -- --- - - - - - - - - ·� h - - - .. �- -
-LS 0 200 400 600 800
Depth in feet
Figure 20. Concentrations of uranium (ppm) measured in geologic materials in SSC-3. The plot compare laboratory instrumental neutron activation analyses on rock chips to in situ measurements with a spectral gamma ray sonde.
38
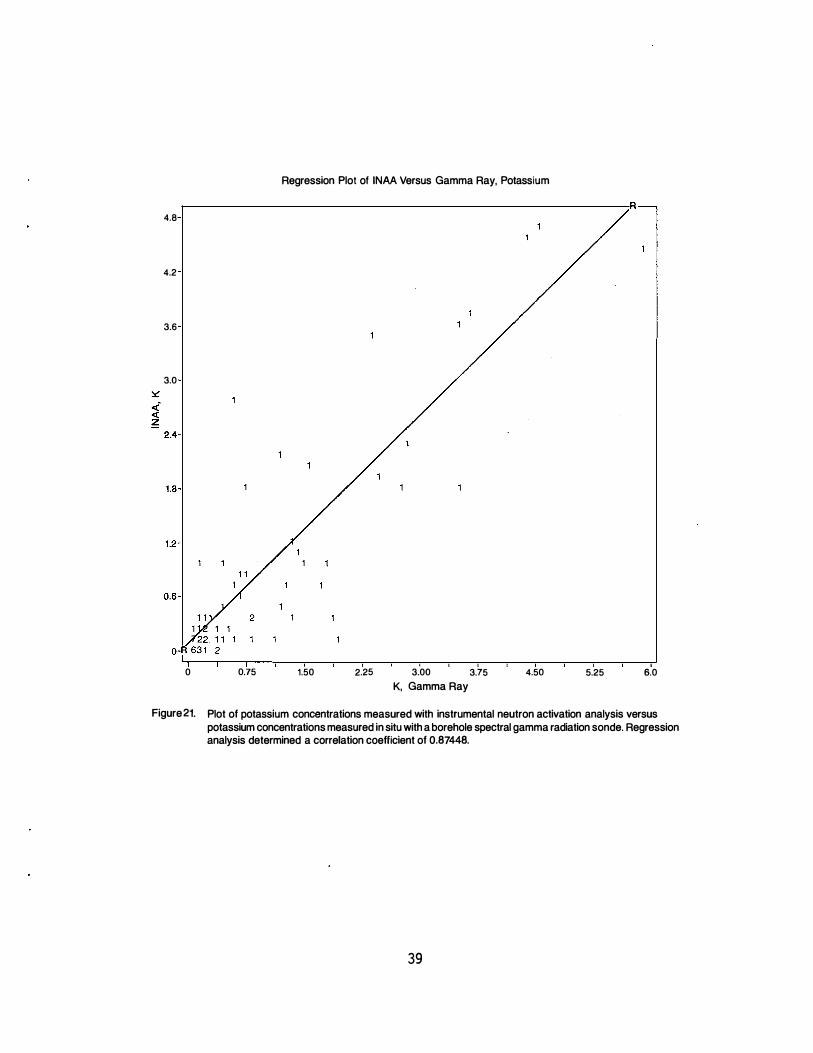
Regression Plot of INAA Versus Gamma Ray, Potassium
4.8
4.2
3.6
3.0
0 0.75 1.50 2.25 3.00 3.75 4.50 5.25 6.0 K, Gamma Ray
Figure 21. Plot of potassium concentrations measured with instrumental neutron activation analysis versus potassium concentrations measured in situ with a borehole spectral gamma radiation sonde. Regression analysis determined a correlation coefficient of 0.87448.
39

6.4
5.6
4.8
4.0
:::> � 3.2 �
2.4
1 .6
0.8
0
0 0.6
Regression Plot of INAA Versus Gamma Ray, Uranium
1.2 1.8 2.4 3.0 eU, Gamma Ray
3.6 4.2 4.8
Figure 22. Plot of uranium concentrations measured with instrumental neutron activation analysis versus equivalent uranium concentrations measured in situ with a borehole spectral gamma radiation sonde. Regression analysis determined a correlation coefficient of 0.66951.
40

Regression Plot of INAA Versus Gamma Ray, Thorium
0 1.6 3.2 4.8 6.4 8.0 9.6 11.2 12.8
eTh, Gamma Ray
Figure 23. Plot of thorium concentrations measured with instrumental neutron activation analysis versus equivalent thorium concentrations measured in situ with a borehole spectral gamma radiation sonde. Regression analysis determined a correlation coefficient of 0.53413.
4 1

T
42
N
T
41
N
T
40
N
T
39
N
T
38
N
T
37
N
R 4 E A S E R 6 E DEKALB ____ l _ _ _ _ _ _ _ _ _ l KANE -----
1 ! . I --i
i i i
i
A 7 E A 8 E A 9 E ---------- --- --·---·icooi< _ _ _ _ _ _
i . ' oo l
11. JJe • . c¢
i i
T .
41
N
1---����-+--���--��1�--���;--����-+-����---:�o·u-PAGE-·-· I • J
------- -- ---------A 4 E A 5 E
i i
•
, KENDALL I i i i i
A 6 E
e z
• N
G
• EE
X e • C, +
A 7 E
N miles � � 0
.v •u
A 8 E
9
i i i .Af\• i BB
A
T
40
N
T
39
N
T
38
N
_ _ l_ _________ • B j WILL
i i T
37
i N
j A 9 E
12
18 kilometers
T
42
N
Figure 24. Map of the SSC study area showing the locations where groundwater samples were collected for analyses of natural radioactive elements. Analytical results are presented in table 8.
42

::!! en w w w Formation Graphic Genetic Interpretation of I- CI: (!) en t:s Log Materials and Description > w (/) Member en en
w Cahokia Fm !.��.�:.ftf]f{; Alluvium - sand, silt, and clay deposited by streams z w () ..... �.� 9 Grayslake Peat · · · · · � · ·· Peat & muck, often interbedded with silt & clay
EI
�=;�·".'*· '�·· - -
Richland Loess - - Loess - windblown silt & clay -- --- --
- - -
Equality Fm - - -- Lake deposits - stratified silty clay and sand - - - - -- - - -
Henry Fm ::f {i�;}�\./����:V· Outwash - sand and gravel
Wadsworth 1 //, .... 1,,,.., , ,
Till - yellowish brown to gray silt & clay loam ';° / '- / I �/ I-/\ I z \ ..-"/�..- /�/I<"'· <( /I "'::_/.J �-.// .:J\ I z
Haeger Till - yellowish brown loam; extensive, Ci5 z E ... � .... :·�·-::�� ...... :�: ·�:·:-. ·; �=. �-�·::-: . .: thick basal sand & gravel 0 u.. /\,-/ \ /-,. \ ...- /� () c: en e Yorkville '-)/' /1' )/' / Till - yellowish brown to gray silt & clay loam � 'O � � L� \ �-, \ �� \
\ /'1\ /'1\ /'1'/ > w Malden �:-)?:�{:?:.:;f?ht; Till - yellowish brown to brownish gray loam till;
a: z extensive basal sand & gravel west of the Fox River c( w z (.) 1 ' / f '/'f\ /'/\ a: � Tiskilwa Till - pinkish brown or grayish brown clay loam w ... :/ .. \ .... ""') \ ..... � \ ___ .. I- en �/+��� Lake deposits-pinkish brown to gray stratified c( w Peddicord Fm :::> ...J .-..-7\ - ,'\ - sand, silt and clay . a a..
Robein Silt �ff\.:�7'. Buried soil developed into alluvium, colluvium or bog deposits - organic rich silt, sand & clay.
/� Sangamonian �.�..::.:.�.�-.�
I ..... . , , ...., .. \ ,
...., .. , ,,
Esmond , .... / // .... / ..... Till - gray silty loam , , > \ ' ' ' \. . . . . . . . ·. · : · ; . · ·.·.· . E Oregon ' , \ ;- 1 \ _,'I\ / I Till - light brown to pink sandy loam and loam
u.. .:·�·:·:·'?.� : : . . ::.� :_. >: ··.:: z 'E Fairdale I -...' I -... ' I -...' / ,
Till - crown loam to clay loam <( � .... /� .... / � .... /� ..... 0 "' Herbert 1.:. /I.: .. / /.�/ I, z a ' /Of� .II/,\ d /� Ill"'" Till - pink sandy loam, locally contains boul€1ers :::i ';!-!.!. � <.�/ .1:1. ::! Kellerville Till - brown loam
-·� - -./"'
Figure 25. Stratigraphic column of drift (Quaternary) deposits in northern Illinois (from Kempton et al., 1985).
43

::E en Group w w I- a: Formation "' > w "' en
Kankakee
z c( a: :::> ..J u; Elwood
C: c: ·- al () ._ Maquoketa .£ co (.) c:
Galena
� Wise Lake
Dunleith
z z Guttenbera <( c( z 0 � Platteville
> 0 a.. c :2: £C <( 0 J: (.) Ancell
Glenwood
lr°;;' St. Peter SS
al 'C al Prairie du Chien c: al (.)
Eminence
Potosi
Franconia z c( a: Ironton-m Galesville ::E c( (,,)
Eau Claire
Mt. Simon
PRECAMBRIAN
Graphic Log
Quaternary deposi� ab�ve
-; -; I
I I I I I I
I I I 6 I
I 6 I / /:),. /
I /'I. I I - I
- - -
--_- ....::::r-=;...
Description
Dolomite, fine grained
Dolomite, fine grained, cherty
c I - I Shale & interbedded dolomite r-'/
I I I
I I I
1:::. / 1:::. I I I I I
I / /
I I I I
I I
I
I
· . . · : . : -�: . · . ·. · i-':""·· :
Dolomite, fine to medium grained
Dolomite, fine to medium grained, cherty
Dolomite, fine to medium grained, with reddish-brown shaly partings
Dolomite, very fine grained
Sandstone, fine to medium grain, well sorted; dolomitic, poorly sorted at top
Dolomite, cherty; sandstone, siltstone, & shale �,iii : : ."l· · ·. ·: .:•(i·'-.. -.. � .. -··I -..
�D-
o-
lo_
m_
i-te
-, -fi
-ne
-to
-m-
ed-
iu_
m_
g-ra
-in_
e_d_,
-sa
_n_d_y
_;
----1 : :_ : : ;/: :.-·- :-:· : ;/." :" '. : contains oolitic chert
I I I I
I I I
Dolomite, fine grained
Sandstone, fine grained, glauconitic
Sandstone, dolomitic, fine to medium grained
Sandstone, siltstone, shale & dolomite; glauconitic
Sandstone, coarse grained, poorly sorted
..._ \ · ..._ ,-. ..._ I ..._ .I / '/ ' /�'/ , Granite, red �';:,�)/'�./ /�/_ Figure 26. Stratigraphic column of bedrock units in the SSC study area (from Kempton et al., 1985).
44
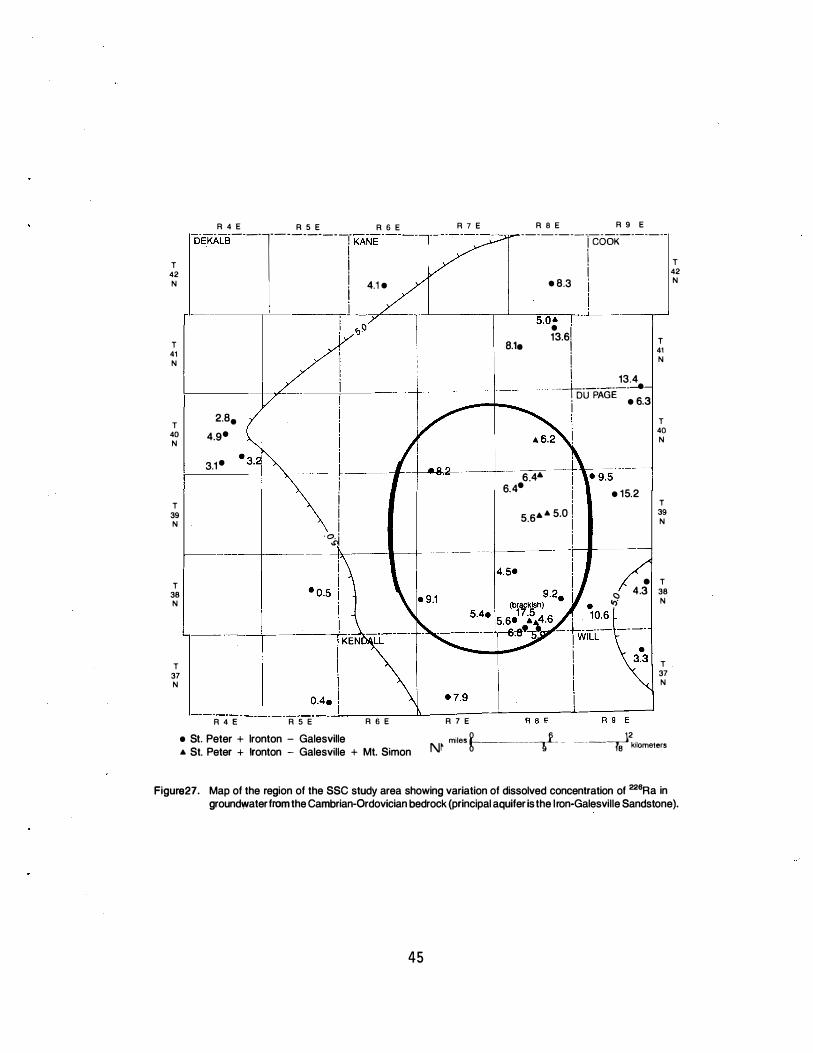
T 42 N
T 41 N
T 40 N
T 39 N
T 38 N
T 37 N
A 4 E A S E A 6 E A 7 E A 8 E A 9 E "™'" _
_
__ 1 _________ 1
KANE----- - - - - - - - -roo,- - - - - -
1 4.1 • • 8.3 i
2.a.
4.9•
3.1 •
A 4 E
---�L _ ___,,<---�--'-------�..__-���_l-----�.---' " 5.0• '
�� • I 13.61 e.1. i
T 41 N
! 13.4 - --tou-PAGE
--6 3 I • .
i i
, ___ __..... '--9-ti�-----i-·-----l -----+- --, 6 .4• i a� i
i i · OJ
5.s• • 5.o
�----4---+---- -----+-----
A S E A 6 E A 7 E
• 15.2
T 40 N
T 39 N
e T <;:) 4 .3 38 '<'i N
T 37 N
• St. Peter + Ironton - Galesville N� miles� _____ 9j_ _ _ -- --�2kilometers
• St. Peter + Ironton - Galesville + Mt. Simon
T 42 N
Figure27. Map of the region of the SSC study area showing variation of dissolved concentration of 226Ra in groundwater from the Cambrian-Ordovician bedrock (principal aquifer is the Iron-Galesville Sandstone).
45

T
39 N
T
38 N
T
37 N
·�---l���...__--t----�--11�----+-�-
i
... 8.4
• 10.1 T 39 N
T 38 N
T
37 N
• St. Peter + Ironton - Galesville N� miles�--·-� - ---------ra-12kilometers ... St. Peter + Ironton - Galesville + Mt. Simon
Figure 28. Map of the region of the SSC study area showing the dissolved concentration of 228Ra in groundwater from the Cambrian-Ordovician bedrock (principal aquifer is the Ironton-Galesville Sandstone).
46
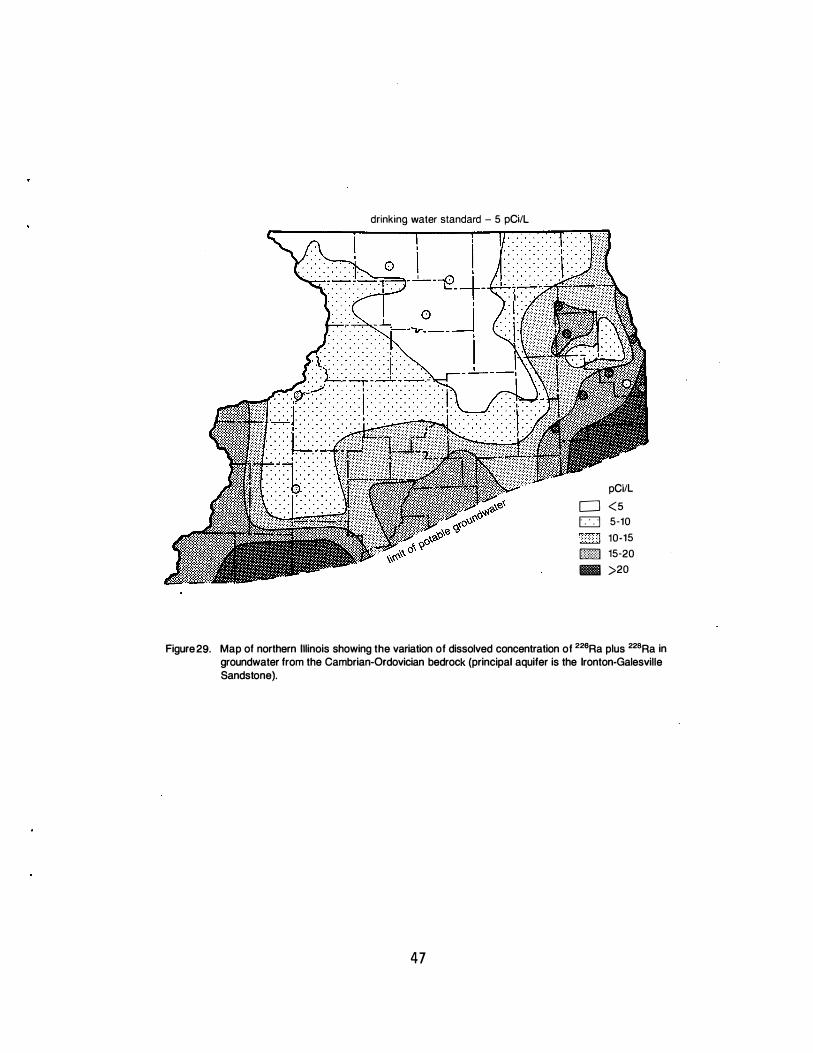
drinking water standard - 5 pCi/L
pCi/L
D <5
D 5-10
1: :::: :1 10-15
wm 15-20
- >20
Figure 29. Map of northern Illinois showing the variation of dissolved concentration of 226Ra plus 228Ra in groundwater from the Cambrian-Ordovician bedrock (principal aquifer is the Ironton-Galesville Sandstone).
47

T
42
N
T
41
N
T
40
N
T
39
N
T
38
N
T
37
N
R 7 E R 8 E R 9 E ---------- - - - - - - - - - -iccioi< _____ _
i i i i
•0.05
• 0.4
. 0.1 1-..iu--�-+����--+���-a-
I 0.1 �-l--�-±�--/--+�
0.3.
, KENDALL I i i
I
• 0.6
0 ,..:
_ _ L--��---i WILL i 1 .4•
i i \
R 9 E
i i _________ ,_L ____ L__ ___ -L __ -1...._�----
R 4 E R 5 E R 6 E R 7 E R 8 E
• Well site (pCi/L)
T
41
N
T
40
N
T
39
N
T
38
N
T
37
N
T
42
N
Figure 30. Map of the region of the SSC study area showing the variation of dissolved concentration of 234U plus 238U in groundwater from the Cambrian-Ordovician bedrock (principal aquifer is the Ironton-Galesville Sandstone).
48

T 42 N
T 41 N
T 40 N
T 39 N
T 38 N
T 37 N
A 4 E A S E A S E _ A 7 E A S E A 9 E oEKAiii ___ r _ _ _ _ _ _ _ l KANE - - - - -r· - - - - - - ----------1 cOoK ______ � I ! • 108 1
•44 so. n•
• Well site (pCi/L)
218 e
I �·---�--' 177/2f "
57• 276 j 99�18 i I --+-____ ___L _______ _ DU PAGE 385
123-j
I
- -.kc---------
T 41 N
T 40 N
T 39 N
T 38 N
, KENDALL 1 WILL
i i i i
I i
144e ! A 6 E A 7 E A 8 E A 9 E
T 37 N
N� miles --� ----�L�e---�·-rs12kilometers Figure 31. Map of the region of the SSC study area showing the variation of dissolved concentration of 222Rn in
groundwater from the Cambrian-Ordovician bedrock (principal aquifer is the Ironton-Galesville Sandstone ) .
49