natural and cultural resources - a passion for discovery 6 - natural and... · natural and cultural...
TRANSCRIPT
Natural and Cultural Resources 6
2008 Site environmental report6-�
DRAFT
6.1 Natural resource MaNageMeNt PrograM
The purpose of the Natural Resource Manage-ment Program at BNL is to promote stewardship of the natural resources found at the Laboratory, as well as to integrate natural resource man-agement and protection with BNL’s scientific mission. To meet this purpose, the Laboratory prepared a Natural Resource Management Plan (NRMP) (BNL 2003a). This plan describes the program strategy, elements, and planned activi-ties for managing the various resources found on site.
6.1.1 Identification and MappingAn understanding of an environmental baseline
is the foundation of natural resource management
planning. BNL uses digital global positioning systems (GPS) and geographic information sys-tems (GIS) to clearly relate various “layers” of geographic information (e.g., vegetation types, soil condition, habitat, forest health, etc.). This is done to gain insight into interrelationships be-tween the biotic systems and physical conditions at the Laboratory. In 2005, efforts were initiated to better understand the distribution of deer on site. A model of deer density was developed using the mapping and spatial analysis tools. The model enables resource managers to track changes in deer density over time, detect interac-tions between components of the ecosystem, and identify locations for management activities.
A wide variety of vegetation, birds, reptiles, amphibians, and mammals inhabit the site.
The Brookhaven National Laboratory Natural Resource Management Program is designed to protect and manage flora and fauna and the ecosystems in which they exist. The Laboratory’s natural resource management strategy is based on understanding the site’s resources and on maintaining compliance with applicable regulations. The goals of the program include protecting and monitoring the ecosystem, conducting research, and communicating with staff and the public on ecological issues. BNL focuses on protecting New York State threatened and endangered species on site, as well as continuing the Laboratory’s leadership role within the greater Long Island Central Pine Barrens ecosystem.
Monitoring to determine whether current or historical activities are affecting natural resources is also part of this program. In 2008, deer and fish sampling results were consistent with previous years. Vegetables grown in the BNL garden plot and by local farmers continue to support historical analyses that there are no Laboratory-generated radionuclides in produce.
The Foundation for Ecological Research in the Northeast completed the development of Freshwater Wetland Monitoring Protocols for the Long Island Central Pine Barrens. This work is discussed in greater detail in this chapter.
The overriding goal of the Cultural Resource Management Program is to ensure that proper stewardship of BNL and DOE historic resources is established and maintained. Additional goals of the program include maintaining compliance with various historic preservation and archeological laws and regulations, and ensuring the availability of identified resources to on-site personnel and the public for research and interpretation.
Chapter 6: natural and Cultural reSourCeS
2008 Site environmental report 6-2
Chapter 6: natural and Cultural reSourCeS
DRAFT DRAFT
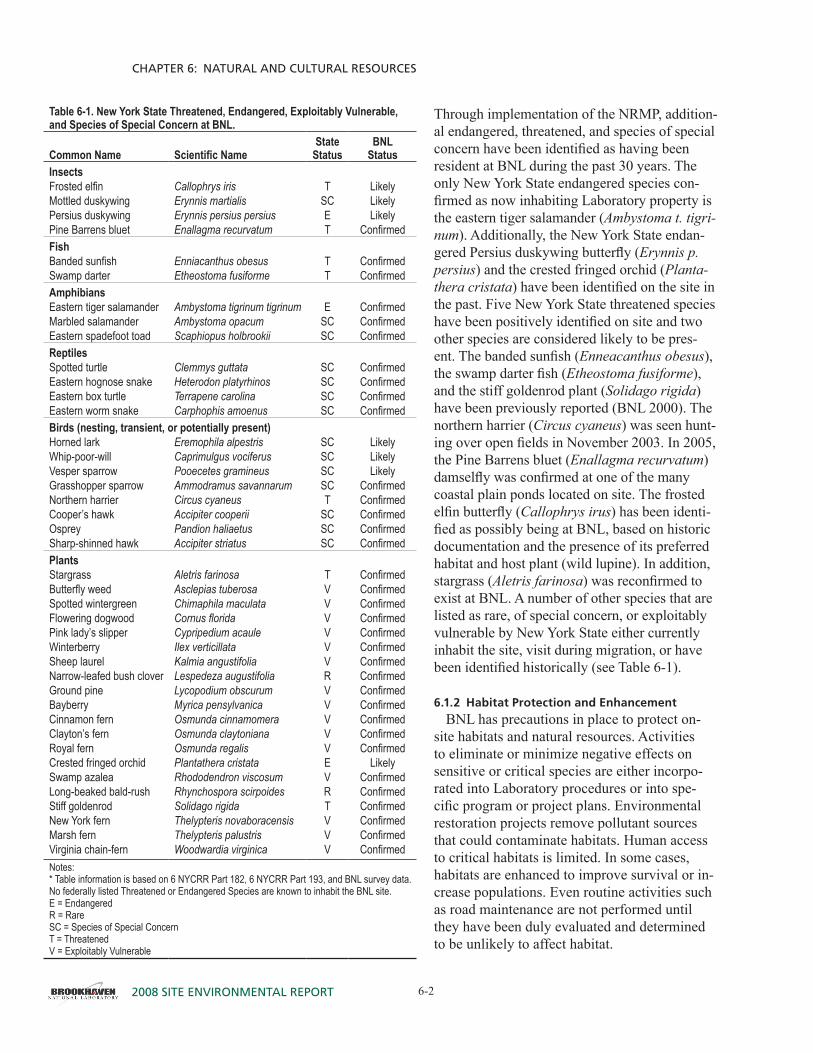
Table 6-1. New York State Threatened, Endangered, Exploitably Vulnerable, and Species of Special Concern at BNL.
Common Name Scientific NameState
StatusBNL
StatusInsectsFrosted elfin Callophrys iris T LikelyMottled duskywing Erynnis martialis SC LikelyPersius duskywing Erynnis persius persius E LikelyPine Barrens bluet Enallagma recurvatum T ConfirmedFishBanded sunfish Enniacanthus obesus T ConfirmedSwamp darter Etheostoma fusiforme T ConfirmedAmphibiansEastern tiger salamander Ambystoma tigrinum tigrinum E ConfirmedMarbled salamander Ambystoma opacum SC ConfirmedEastern spadefoot toad Scaphiopus holbrookii SC ConfirmedReptilesSpotted turtle Clemmys guttata SC ConfirmedEastern hognose snake Heterodon platyrhinos SC ConfirmedEastern box turtle Terrapene carolina SC ConfirmedEastern worm snake Carphophis amoenus SC ConfirmedBirds (nesting, transient, or potentially present)Horned lark Eremophila alpestris SC LikelyWhip-poor-will Caprimulgus vociferus SC LikelyVesper sparrow Pooecetes gramineus SC LikelyGrasshopper sparrow Ammodramus savannarum SC ConfirmedNorthern harrier Circus cyaneus T ConfirmedCooper’s hawk Accipiter cooperii SC ConfirmedOsprey Pandion haliaetus SC ConfirmedSharp-shinned hawk Accipiter striatus SC ConfirmedPlantsStargrass Aletris farinosa T ConfirmedButterfly weed Asclepias tuberosa V ConfirmedSpotted wintergreen Chimaphila maculata V ConfirmedFlowering dogwood Cornus florida V ConfirmedPink lady’s slipper Cypripedium acaule V ConfirmedWinterberry Ilex verticillata V ConfirmedSheep laurel Kalmia angustifolia V ConfirmedNarrow-leafed bush clover Lespedeza augustifolia R ConfirmedGround pine Lycopodium obscurum V ConfirmedBayberry Myrica pensylvanica V ConfirmedCinnamon fern Osmunda cinnamomera V ConfirmedClayton’s fern Osmunda claytoniana V ConfirmedRoyal fern Osmunda regalis V ConfirmedCrested fringed orchid Plantathera cristata E LikelySwamp azalea Rhododendron viscosum V ConfirmedLong-beaked bald-rush Rhynchospora scirpoides R ConfirmedStiff goldenrod Solidago rigida T ConfirmedNew York fern Thelypteris novaboracensis V ConfirmedMarsh fern Thelypteris palustris V ConfirmedVirginia chain-fern Woodwardia virginica V ConfirmedNotes:* Table information is based on 6 NYCRR Part 182, 6 NYCRR Part 193, and BNL survey data.No federally listed Threatened or Endangered Species are known to inhabit the BNL site.E = EndangeredR = RareSC = Species of Special ConcernT = ThreatenedV = Exploitably Vulnerable
Through implementation of the NRMP, addition-al endangered, threatened, and species of special concern have been identified as having been resident at BNL during the past 30 years. The only New York State endangered species con-firmed as now inhabiting Laboratory property is the eastern tiger salamander (Ambystoma t. tigri-num). Additionally, the New York State endan-gered Persius duskywing butterfly (Erynnis p. persius) and the crested fringed orchid (Planta-thera cristata) have been identified on the site in the past. Five New York State threatened species have been positively identified on site and two other species are considered likely to be pres-ent. The banded sunfish (Enneacanthus obesus), the swamp darter fish (Etheostoma fusiforme), and the stiff goldenrod plant (Solidago rigida) have been previously reported (BNL 2000). The northern harrier (Circus cyaneus) was seen hunt-ing over open fields in November 2003. In 2005, the Pine Barrens bluet (Enallagma recurvatum) damselfly was confirmed at one of the many coastal plain ponds located on site. The frosted elfin butterfly (Callophrys irus) has been identi-fied as possibly being at BNL, based on historic documentation and the presence of its preferred habitat and host plant (wild lupine). In addition, stargrass (Aletris farinosa) was reconfirmed to exist at BNL. A number of other species that are listed as rare, of special concern, or exploitably vulnerable by New York State either currently inhabit the site, visit during migration, or have been identified historically (see Table 6-1).
6.1.2 Habitat Protection and enhancementBNL has precautions in place to protect on-
site habitats and natural resources. Activities to eliminate or minimize negative effects on sensitive or critical species are either incorpo-rated into Laboratory procedures or into spe-cific program or project plans. Environmental restoration projects remove pollutant sources that could contaminate habitats. Human access to critical habitats is limited. In some cases, habitats are enhanced to improve survival or in-crease populations. Even routine activities such as road maintenance are not performed until they have been duly evaluated and determined to be unlikely to affect habitat.
DRAFT
2008 Site environmental report6-3
Chapter 6: natural and Cultural reSourCeS
DRAFT
6.1.2.1 Salamander Protection EffortsTo safeguard eastern tiger salamander breed-
ing areas, a map of the locations is reviewed when new projects are proposed. Distribution of the map is limited, to protect the salamander from exploitation by collectors and the pet trade. The map is routinely updated as new informa-tion concerning the salamanders is generated through research and monitoring. The most re-cent update extends the buffer area around tiger salamander habitat from 800 feet to �,000 feet. Other efforts to protect this state-endangered species include determining when adult sala-manders are migrating toward breeding loca-tions, when metamorphosis has been completed, and when juveniles are migrating after meta-morphosis. During these times, construction and maintenance activities near their habitats are postponed or closely monitored. BNL environ-mental protection staff must review any project planned near eastern tiger salamander habitats, and every effort is made to minimize impacts.
Water quality testing is conducted as part of the routine monitoring of recharge basins, as discussed in Chapter 5. In cooperation with the New York State Department of Environmental Conservation (NYSDEC), habitat surveys have been conducted annually since �999. Biologists conducting egg mass and larval surveys have confirmed 26 on-site ponds that are used by eastern tiger salamanders. The study procedure calls for all ponds that had egg masses during the spring surveys to be surveyed again in June and July to check for the presence of larval salamanders. Egg mass surveys of ponds and additional flooded depressions at the Laboratory were conducted in 2008. A PhD candidate and students working through the intern programs offered by DOE and BNL’s Office of Education conducted surveys of tiger salamander ponds, drift fence surveys, and radio telemetry tracking around four ponds. The results of these stud-ies show the extent of egg mass production, the importance of precipitation as a trigger for metamorphic salamanders leaving ponds, and the extent of movements by both adults and metamorphic tiger salamanders. Work toward a comprehensive understanding of eastern tiger salamander movements and habitat require-
ments began in 2004, with funding provided to SUNY Binghamton by NYSDEC. Continued research adds to the understanding of the needs of this state-endangered species. Information acquired from all research is entered into a da-tabase, and portions of the data are linked to a GIS. These data are used to visualize distribu-tions, track reproductive success, and identify areas for focused management or study.
6.1.2.2 Eastern Box TurtleA radio telemetry study of the eastern box
turtle (Terrapene carolina) that was initiated in 2006 was continued in 2007 to investigate the amount of territory overlap between individual turtles. The study was initiated after repeat-edly finding turtles with ear infections and the discovery of three sick turtles simultaneously in 2005. Two of the three turtles died and were subsequently necropsied, with tissues sent to a contract analytical laboratory for virus isolation. Results confirmed the presence of an iridovirus known to affect turtles and amphibians; this posed a great concern, given the endangered status of some amphibians. As the three turtles were found in a primary breeding pond for ti-ger salamanders, further study was warranted. The radiotelemetry study confirmed significant amounts of territorial overlap for five turtles outfitted with transmitters. This finding suggests the likelihood for disease transmission among turtles. Additionally, all five turtles spent some time near the pond and may have released the virus to the water, where it may infect other rep-tiles and amphibians.
Associated with the radiotelemetry study was a study to isolate and identify the iridovirus within eastern box turtles found at BNL. Rou-tine transects of various areas of the Laboratory were established and traversed in order to cap-ture the turtles. When a turtle was found, it was given a unique identification mark, and samples from the mouth and cloaca were taken using cotton swabs. The samples were later tested for iridovirus. Unfortunately, due to difficulties at the contract analytical laboratory, iridovirus could not be isolated in 2006. The study was continued with revisions in 2007 and 2008 in order to assess the potential for turtles to carry
2008 Site environmental report 6-4
Chapter 6: natural and Cultural reSourCeS
DRAFT DRAFT
iridovirus and infect other reptiles or amphib-ians. Revisions included improved procedures for obtaining swab samples and alterations of lab procedures to improve the genetic analy-sis of samples. However, even with improved sampling, only a single turtle tested over the two years and in advanced stages of the disease showed positive results on oral swabs and liver tissue analysis. Cloacal swabs of this animal and both oral and cloacal swabs of all other specimens had negative results, suggesting that swabbing may not be sufficient for early detec-tion of infection (Snyder & Titus, 2007).
6.1.2.3 Other SpeciesAs part of the eastern tiger salamander and
herpetological surveys, information is being gathered on other species found on site. Includ-ing the tiger salamander (see Section 6.�.2.�), sightings of 26 species of reptiles and amphib-ians have been recorded over the past several years. The species include the northern red-back salamander (Plethodon c. cinereus), marbled salamander (Ambystoma opacum), four-toed salamander (Hemidactylium scutatum), red-spotted newt (Notophthalmus viridescens), spring peeper (Pseudacris crucifer), wood frog (Rana sylvatica), gray tree frog (Hyla versicolor), bullfrog (Rana catesbiana), green frog (Rana clamitans), pickerel frog (Rana palustris), Fowler’s toad (Bufo woodhousei fowleri), eastern spadefoot toad (Scaphiopus holbrooki), snapping turtle (Chelydra serpen-tine), painted turtle (Chrysemys p. picta), musk turtle (Sternotherus odoratus), spotted turtle (Clemmys guttata), eastern box turtle (Terrap-ene c. Carolina), northern black racer (Coluber constrictor), eastern ribbon snake (Thamnophis s. sauritus), eastern garter snake (Thamnophis s. sirtalis), northern water snake (Nerodia s. sipedon), northern ring-necked snake (Diado-phis puctatus edwardsi), brown snake (Storeria d. dekayi), northern red-bellied snake (Storeria occiptiomaculata), and eastern wormsnake (Carphophis amoenus). This list indicates that BNL has one of the most diverse herpetofaunal assemblages on Long Island.
Banded sunfish protection efforts include ob-serving whether adequate flow in the Peconic
River is maintained within areas currently identified as sunfish habitat, ensuring that exist-ing vegetation in their habitat is not disturbed, and evaluating all activities taking place on the river for potential impacts on these habitats. A population estimate of reproductive success of the banded sunfish in a protected pond was con-ducted in summer 2007 and compared to values obtained in a similar survey in 2005. Conser-vatively, approximately 3,000 fish remained in the pond after it nearly dried in 2005, based on overall estimates that summer. Hydrologic con-ditions were maintained throughout 2006 and into 2007. The population survey in 2007 result-ed in an estimate of approximately 4,000 fish present. Differences in the two studies may have been responsible for the lower results in 2005. In addition, an increased number of brown bullhead (Ictalurus nebulosus) may have had a more significant negative impact on the sunfish population than previously expected.
6.1.2.4 Migratory BirdsA total of 2�6 species of birds have been iden-
tified at BNL since 1948; at least 85 species are known to nest on site. Some of these nesting birds have shown declines in their populations nationwide over the past 30 years. The Labora-tory conducts routine monitoring of songbirds along six permanent bird survey routes in vari-ous habitats on site. In 2008, monthly surveys were conducted starting at the end of March and extending through the end of September. These surveys identified 70 songbird species, com-pared to 69 species in 2007 and 69 species dur-ing 2006. One of the species identified during the 2008 surveys had not been reported previ-ously. A total of ��� songbird species have been identified during surveys in the past 9 years; 45 of these species were present each year. Varia-tions in the number and species identified reflect the time of sampling, variations in weather pat-terns between years, or actual changes in the en-vironment. The two most diverse transects pass near wetlands by the Biology Fields and the Pe-conic River. The four transects passing through the various forest types (white pine, moist pine barrens, and dry pine barrens) showed a less diverse bird community. Data are stored in an
DRAFT
2008 Site environmental report6-5
Chapter 6: natural and Cultural reSourCeS
DRAFT
electronic database that is linked to the Labora-tory’s GIS.
The eastern bluebird (Sialia sialis) has been identified as one of the declining species of migratory birds in North America. This decline is due to loss of habitat and to nest site com-petition from European starlings (Sturnus vul-garis) and house sparrows (Passer domesticus). BNL’s NRMP includes habitat enhancement for the eastern bluebird. Since 2000, the Labo-ratory has installed more than 56 nest boxes around open grassland areas on site to enhance their population.
Migratory birds occasionally cause safety and health concerns. Birds that typically are of con-cern include Canada geese (Branta canadensis) and several species of songbirds that occasion-ally nest on buildings. Over the past several years, the resident Canada goose population be-gan increasing with the potential to reach large numbers that could result in health and safety is-sues for the Laboratory. In 2007, under a permit from the U.S. Fish & Wildlife Service (FWS), the Laboratory began managing the resident goose population. In the first year, the goose population was estimated at approximately �20 birds and nests were only managed if they posed a health or safety issue; eggs were treated in ten nests, or the nests were removed. At the end of the 2007 nesting season, the goose population reached an estimated �57 birds. Therefore, in 2008, nest management became more aggres-sive and eggs in 30 nests that were found were oiled to prevent development. Even with a more aggressive approach to nest management, �5 goslings were hatched and survived. However, with attrition and mortality associated with off site hunting, the resident population was esti-mated at �48 birds at the end of 2008.
In 2008, the Laboratory continued preparing the area in the central part of the Laboratory for construction of the National Synchrotron Light Source II. This involved demolition of the re-maining warehouses and bottled gas facility. As the buildings were prepared for demolition, sev-eral barn swallow nests (Hirundo rustica) were observed in the rafters of the bottled gas facility. Demolition was halted until nesting was com-pleted and all nestlings had fledged. When it was
confirmed that no more active nests were pres-ent, the building was released for demolition.
6.1.3 Population ManagementThe Laboratory also monitors and manages
other populations, including species of interest, to ensure that they are sustained and to control invasive species.
6.1.3.1 Wild TurkeyThe forested areas of BNL provide good
nesting and foraging habitat for wild turkey (Meleagris gallapavo). The on-site population was estimated at 60 to 80 birds in �999 and had grown to approximately 500 birds in 2004. Since 2004, the population appears to have sta-bilized at approximately 300 birds. The popu-lation across Suffolk County, Long Island, is now sufficiently large for NYSDEC to consider establishing a hunting season to maintain the population at a reasonable number.
6.1.3.2 White-Tailed DeerBNL consistently updates information on the
resident population of white-tailed deer (Odocoi-leus virginianus). As there are no natural preda-tors on site and hunting is not permitted at the Laboratory, there are no significant pressures on the population to migrate beyond their typi-cal home range of approximately � square mile. Normally, a population density of �0 to 30 deer per square mile is considered an optimum sus-tainable level for a given area. This would equate to approximately 80 to 250 deer inhabiting the BNL property, under normal circumstances. This was the approximate density in �966, when the Laboratory reported an estimate of 267 deer on site (Dwyer 1966). BNL has been conducting population surveys of the white-tailed deer since 2000. In February and March 2004, an aerial in-frared survey was conducted of three properties, including Wertheim National Wildlife Refuge (south of BNL), Brookhaven National Labora-tory, and Rocky Point Wildlife Area (northwest of BNL). The results indicated a population of 4�2 deer on site and immediately off site. When a correction for survey accuracy was applied, the on-site population was estimated at 446 animals. This value was much lower than a ground-based
2008 Site environmental report 6-6
Chapter 6: natural and Cultural reSourCeS
DRAFT DRAFT
estimate of �,302, made at the same time using the existing methodology. Because there was a large discrepancy between methods, a review of the ground-based methodology was conducted and the method of estimating was refined. The new method uses the Laboratory’s vegetation map and estimates the deer population based on the habitat in which deer are sighted during sur-veys. The result of this revised method indicated that the deer population was approximately 497, which is considered to be reasonably compa-rable to the aerial survey results. The next step taken was to apply the new population model to historic survey data. Most of the data resulted in much lower yearly estimates, with ranges from approximately �,000 deer in 200� to approxi-mately 400 deer in 2005. The current population estimate is 800 deer, based on surveys con-ducted in November and December 2008. The current estimate reflects a roughly thirty percent increase over the 2007 population estimate of 620 deer. The increase is likely due to the large number of acorns produced in the fall of 2007. The current deer population results in a deer density of 97 deer per square mile.
Deer overpopulation can affect animal and human health (e.g., animal starvation, Lyme disease from deer ticks, collision injuries — both human and animal), species diversity (songbird species reduction due to selective grazing and destruction of habitat by deer), and property values (collision damage to autos and browsing damage to ornamental plantings). In 2007, three deer-related collisions occurred on site, com-pared to �0 accidents in 2006 and 25 accidents documented in 2004. This downward trend in accidents is attributed to a major effort by BNL Safeguards and Security personnel to enforce the 30-mph speed limit on site. Additional em-phasis on vehicle–deer safety is also thought to have helped reduce this type of accident. Deer health continues to be affected due to a scarcity of food. While the population increased in 2008 due to abundant food the previous autumn, the overall health of the deer herd in 2008 began to decline through the summer and into the fall. By December 2008, fawns were dying from starva-tion and exposure. Deer damage to vegetation around buildings continues to be a problem, but
varies depending on the severity of the winter and the availability of browse in the lawns. Damage to landscape plants and pine seedlings was taking place in December 2008 due to lack of available food.
Because the high deer population is a regional problem, the Laboratory is working on the is-sue with other local jurisdictions. As part of this regional approach, an issue and decision paper was prepared for Laboratory management consideration late in 2007. Options for deer management are limited, and most are contro-versial. While a single regional approach would benefit the community, land managers, and the health of the deer population, individual land managing organizations like the Laboratory must implement a regional approach. In 2008, the BNL Policy Council approved moving for-ward with deer management planning. Several meetings were held with employees during the spring months, resulting in the development of an employee survey. The survey was sent out to approximately 2,800 individuals; 829 individu-als responded. Most respondents believe that deer management is needed, but the survey was unclear on the method of deer management. In the fall months, several informational ses-sions were held to introduce the various options available in order to begin moving forward with management. The first step is for BNL to pre-pare an environmental assessment (EA) under the requirements of the National Environmental Policy Act (NEPA). The EA process is sched-uled to begin sometime in 2009.
6.1.4 compliance assurance and Potential Impact assessment
The NEPA review process at BNL is key to ensuring that environmental impacts of a pro-posed action or activity are adequately evaluat-ed and addressed. The Laboratory will continue to use NEPA (or NEPA-like) processes under the Comprehensive Environmental Response, Compensation and Liability Act (CERCLA) Environmental Restoration Program when identifying potential environmental impacts as-sociated with site activities—especially with physical alterations. As appropriate, stakehold-ers such as EPA, NYSDEC, Suffolk County
DRAFT
2008 Site environmental report6-7
Chapter 6: natural and Cultural reSourCeS
DRAFT
Department of Health Services (SCDHS), BNL’s Community Advisory Council, and the Brookhaven Roundtable are involved in re-viewing major projects that have the potential for significant environmental impacts. Formal NEPA reviews are coordinated with the State of New York.
6.2 uPtoN ecologIcal aNd researcH reserve
On November 9, 2000, then-Secretary of Energy Bill Richardson and Susan MacMahon, Acting Regional Director of Region 5 FWS, dedicated 530 acres of Laboratory property as an ecological research reserve. The property was designated by DOE as the Upton Ecological and Research Reserve (Upton Reserve) and was managed by FWS under an Interagency Agree-ment (DOE–FWS 2000). The Upton Reserve, on the eastern boundary of BNL, is home to a wide variety of flora and fauna. It contains wet-lands and is largely within the core preservation area of the Long Island Central Pine Barrens. Based on information from a �994–�995 bio-logical survey of the Laboratory, experts believe the reserve is home to more than 200 plant spe-cies and at least �62 species of mammals, birds, fish, reptiles, and amphibians (LMS 1995).
A transition from FWS management of the Upton Reserve to management by BNL and the Foundation for Ecological Research in the Northeast (FERN) occurred in 2005. During that year, FERN initiated its first pine barrens–wide monitoring program to assess the health of the various forest types within the Pine Barrens, followed by a continuation of the effort in 2006. FERN established 91 permanent plots over the 2-year period of the monitoring program and is currently analyzing the data. One signifi-cant finding from the monitoring is the lack of forest regeneration. In virtually every forest type, there is a lack of survival of trees from seedlings through to saplings. This is likely a result of either deer over-abundance or lack of sunlight penetrating to the understory. Further information on the forest health initiative, as well as other activities of FERN, is available on the FERN website at www.fern-li.org. In 2008, FERN finalized protocols for monitoring wet-
land health throughout the Pine Barrens. These protocols, when implemented, will provide baseline information on the current health of the wetlands found within the Central Pine Barrens. However, this implementation may be delayed indefinitely due to the downturn in the economy.
Research supported by FERN in 2008 includ-ed continued investigation into the microbial world of soils located within a number of the Forest Health Plots. Microbial research carried out by a scientist at Dowling College in 2007 identified several new species of fungus and bacteria that had not previously been known. In 2008, the work was expanded to develop a microbial community profile of the Pine Bar-rens. This work was conducted in conjunction with a Faculty and Student Team from Southern University at New Orleans who have submitted their results for publication. The work is expect-ed to continue in 2009, with genetic analysis of the microbes to further refine the microbial community structure. Additional work funded by FERN includes an aquatic invertebrate sur-vey of the Carmans River and the development of a DVD documenting the various sampling protocols used within the Open Space Steward-ship Program sponsored by the Office of Educa-tion at BNL. Additional information on these projects is provided in Section 6.5.
6.3 MoNItorINg Flora aNd FauNa
The Laboratory routinely monitors flora and fauna to determine the effects of past and pres-ent Laboratory activities. Because soil con-taminated with a radioactive isotope of cesium (Cs-�37) was used in some BNL landscaping projects in the past, traces have now been found in deer and in other animals and plants. At the cellular level, Cs-�37 takes the place of potas-sium (K), an essential nutrient.
Most radionuclide tables in this chapter list data for both Cs-�37 and potassium-40 (K-40), a naturally occurring radioisotope of potassium. Because K-40 is naturally in the environment, it is commonly found in flora and fauna. (In gen-eral, K-40 values do not receive significant dis-cussion in the scientific literature because K-40 occurs naturally.) Studies indicate that Cs-�37 out-competes K and K-40 when potassium salts
2008 Site environmental report 6-8
Chapter 6: natural and Cultural reSourCeS
DRAFT DRAFT
are limited in the environment, which is typical on Long Island.
The results of the annual sampling conducted under the flora and fauna monitoring program follow.
6.3.1 deer samplingWhite-tailed deer in New York State typically
are large, with males weighing, on average, about �50 pounds; females typically weigh one-third less, approximately �00 pounds. However, white-tailed deer on Long Island tend to be much smaller, weighing an average of 80 pounds. The available meat on local deer rang-es from 20 to 40 pounds per deer. This fact has implications for calculating the potential radia-tion dose to consumers of deer meat containing Cs-�37, because smaller deer do not provide sufficient amounts of venison to support the necessary calculations.
In 2008, as in recent years, an off-site deer-sampling program was conducted with the NYSDEC Wildlife Branch and FWS. While most off-site samples are from road-killed deer near the Laboratory, NYSDEC provides a few samples from hunters beyond BNL boundaries, yielding control data on deer living � mile or more from BNL. In addition, FWS occasionally informs Laboratory staff of deer that have died in or near the Wertheim National Wildlife Ref-uge and other FWS properties on Long Island. In all, three deer were obtained on site and �3 were from off-site locations, ranging from adja-cent to BNL along the William Floyd Parkway, to approximately 5 miles away (Baiting Hol-low, New York).
BNL sampling technicians collect the sam-ples and process them for analysis. Samples of meat, liver, and bone are taken from each deer, when possible. The meat and liver are analyzed for Cs-�37, and the bone is analyzed for stron-tium-90 (Sr-90).
6.3.1.1 Cesium-137 in White-Tailed DeerWhite-tailed deer sampled at the Laboratory
contain higher concentrations of Cs-�37 than deer from greater than � mile off site (BNL 2000), probably because they graze on vegeta-tion growing in soil where elevated Cs-�37
levels are known to exist. Cs-�37 in soil can be transferred to aboveground plant matter via root uptake, where it then becomes available to browsing animals.
Removal of contaminated soil areas at BNL has occurred under the Laboratory’s Environ-mental Restoration (ER) Program. All major areas of contaminated soil were remediated by September 2005. In addition, all buildings at the former Hazardous Waste Management Facility (HWMF) were removed in 2003, and the cleanup of the remainder of the facility was completed by fall 2005. Subsequent to the completion of cleanup at the former HWMF, additional minor contamination outside that fa-cility was found and has been characterized and is scheduled for cleanup in 2009.
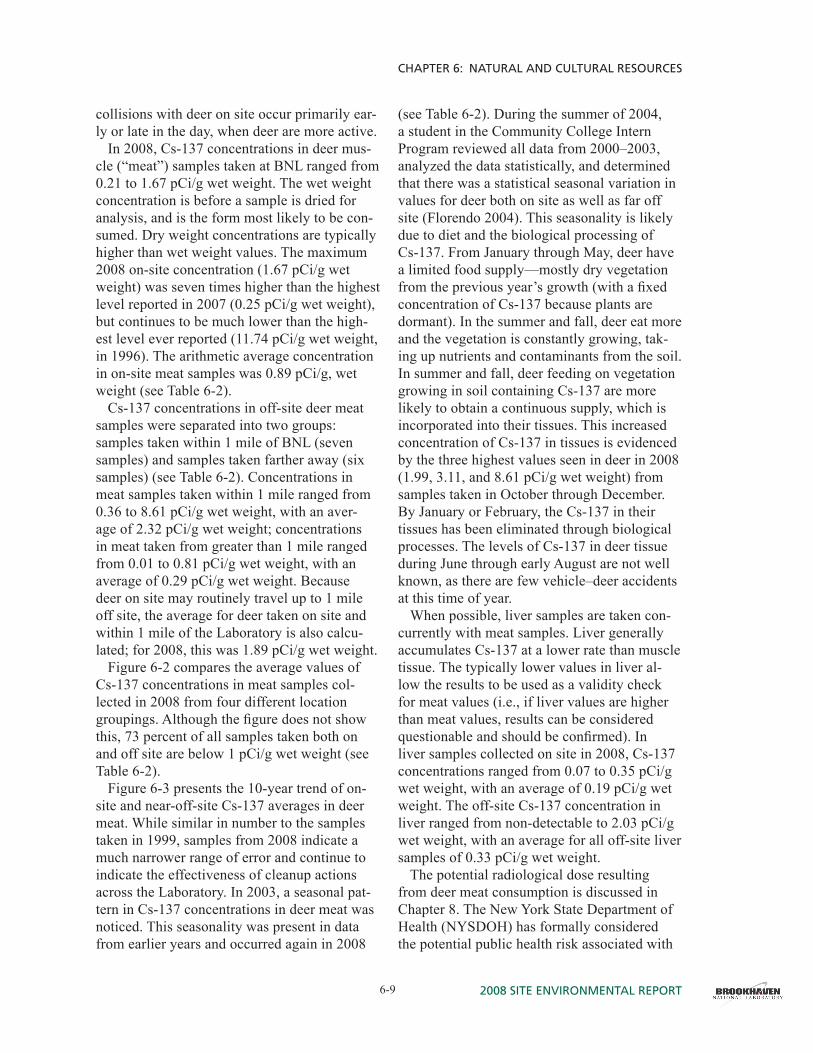
The number of deer obtained for sampling steadily increased between �996 and 2004. However, the numbers of deer obtained be-tween 2005 and 2008 are significantly lower. As mentioned above, the number of deer killed on site and available for sampling has decreased, most likely due to increased safety awareness and better enforcement of speed restrictions that results in drivers driving more slowly and paying better attention to their sur-roundings. In �998, a statistical analysis based on existing data suggested that 40 deer from off site and 25 deer from on site were needed to achieve a statistically sound data set. Since that analysis was completed, BNL has attempted to obtain the required number of deer. The num-ber obtained each year has varied due to the sampling method, which depends on vehicle and deer accidents and people reporting dead deer. The number of deer hit by vehicles var-ies widely from year to year, depending on the population of deer present near major roadways and the traffic density. Figure 6-1 shows the location of all deer samples taken within a 5-mile radius of the Laboratory since 2003. Most of the off-site samples are concentrated along the William Floyd Parkway on the west bound-ary of BNL, whereas the concentration on site is near the front gate area and the constructed portions of the Laboratory. This distribution is most likely due to the fact that people on their way to work see and report dead deer. Vehicle
DRAFT
2008 Site environmental report6-9
Chapter 6: natural and Cultural reSourCeS
DRAFT
collisions with deer on site occur primarily ear-ly or late in the day, when deer are more active.
In 2008, Cs-�37 concentrations in deer mus-cle (“meat”) samples taken at BNL ranged from 0.2� to �.67 pCi/g wet weight. The wet weight concentration is before a sample is dried for analysis, and is the form most likely to be con-sumed. Dry weight concentrations are typically higher than wet weight values. The maximum 2008 on-site concentration (�.67 pCi/g wet weight) was seven times higher than the highest level reported in 2007 (0.25 pCi/g wet weight), but continues to be much lower than the high-est level ever reported (��.74 pCi/g wet weight, in �996). The arithmetic average concentration in on-site meat samples was 0.89 pCi/g, wet weight (see Table 6-2).
Cs-�37 concentrations in off-site deer meat samples were separated into two groups: samples taken within � mile of BNL (seven samples) and samples taken farther away (six samples) (see Table 6-2). Concentrations in meat samples taken within � mile ranged from 0.36 to 8.6� pCi/g wet weight, with an aver-age of 2.32 pCi/g wet weight; concentrations in meat taken from greater than � mile ranged from 0.0� to 0.8� pCi/g wet weight, with an average of 0.29 pCi/g wet weight. Because deer on site may routinely travel up to � mile off site, the average for deer taken on site and within � mile of the Laboratory is also calcu-lated; for 2008, this was �.89 pCi/g wet weight.
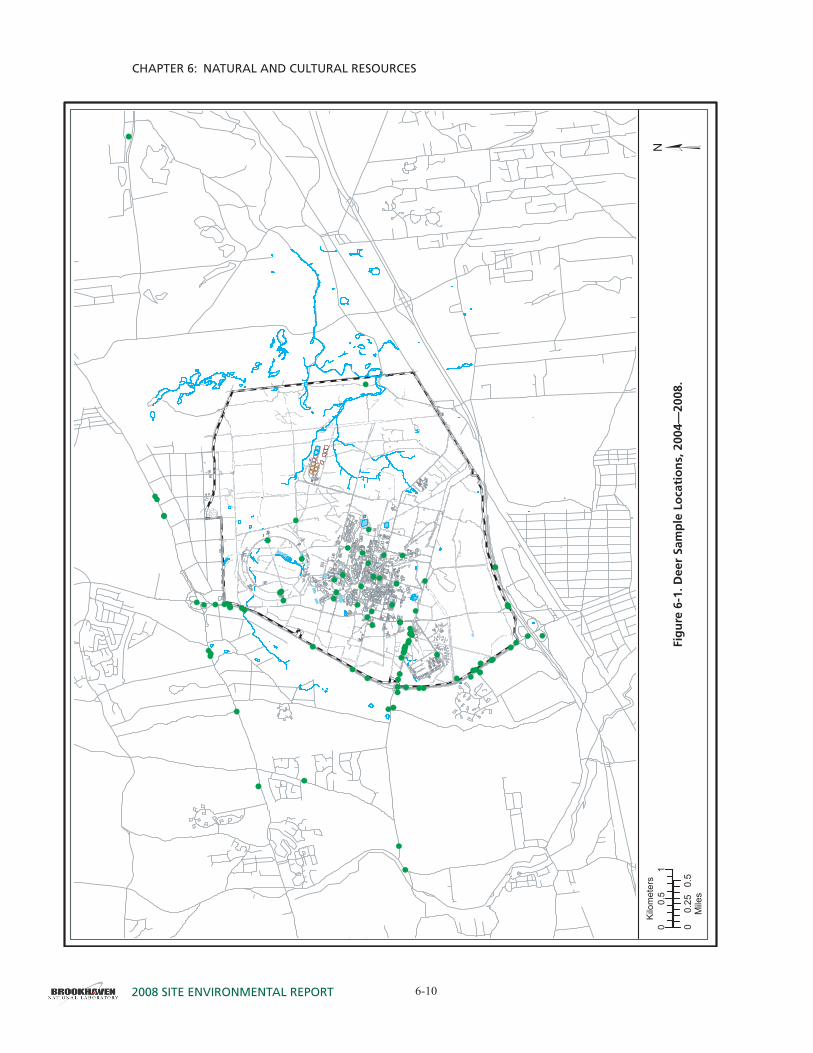
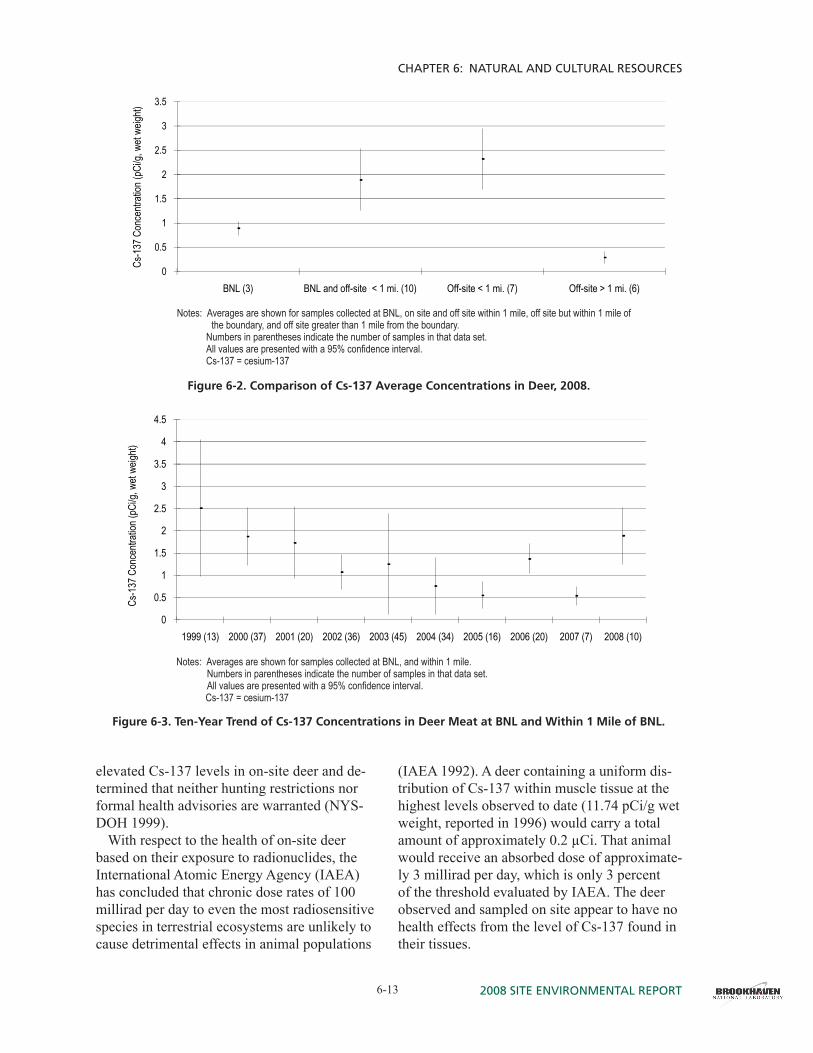
Figure 6-2 compares the average values of Cs-�37 concentrations in meat samples col-lected in 2008 from four different location groupings. Although the figure does not show this, 73 percent of all samples taken both on and off site are below � pCi/g wet weight (see Table 6-2).
Figure 6-3 presents the �0-year trend of on-site and near-off-site Cs-�37 averages in deer meat. While similar in number to the samples taken in �999, samples from 2008 indicate a much narrower range of error and continue to indicate the effectiveness of cleanup actions across the Laboratory. In 2003, a seasonal pat-tern in Cs-�37 concentrations in deer meat was noticed. This seasonality was present in data from earlier years and occurred again in 2008
(see Table 6-2). During the summer of 2004, a student in the Community College Intern Program reviewed all data from 2000–2003, analyzed the data statistically, and determined that there was a statistical seasonal variation in values for deer both on site as well as far off site (Florendo 2004). This seasonality is likely due to diet and the biological processing of Cs-�37. From January through May, deer have a limited food supply—mostly dry vegetation from the previous year’s growth (with a fixed concentration of Cs-�37 because plants are dormant). In the summer and fall, deer eat more and the vegetation is constantly growing, tak-ing up nutrients and contaminants from the soil. In summer and fall, deer feeding on vegetation growing in soil containing Cs-�37 are more likely to obtain a continuous supply, which is incorporated into their tissues. This increased concentration of Cs-�37 in tissues is evidenced by the three highest values seen in deer in 2008 (�.99, 3.��, and 8.6� pCi/g wet weight) from samples taken in October through December. By January or February, the Cs-�37 in their tissues has been eliminated through biological processes. The levels of Cs-�37 in deer tissue during June through early August are not well known, as there are few vehicle–deer accidents at this time of year.
When possible, liver samples are taken con-currently with meat samples. Liver generally accumulates Cs-�37 at a lower rate than muscle tissue. The typically lower values in liver al-low the results to be used as a validity check for meat values (i.e., if liver values are higher than meat values, results can be considered questionable and should be confirmed). In liver samples collected on site in 2008, Cs-�37 concentrations ranged from 0.07 to 0.35 pCi/g wet weight, with an average of 0.�9 pCi/g wet weight. The off-site Cs-�37 concentration in liver ranged from non-detectable to 2.03 pCi/g wet weight, with an average for all off-site liver samples of 0.33 pCi/g wet weight.
The potential radiological dose resulting from deer meat consumption is discussed in Chapter 8. The New York State Department of Health (NYSDOH) has formally considered the potential public health risk associated with
2008 Site environmental report 6-�0
Chapter 6: natural and Cultural reSourCeS
DRAFT DRAFT
00.
51
Kilo
met
ers
00.
250.
5M
iles
Fig
ure
6-1
. dee
r sa
mp
le l
oca
tio
ns,
200
4—20
08.
N

DRAFT
2008 Site environmental report6-��
Chapter 6: natural and Cultural reSourCeS
DRAFT
Table 6-2. Radiological Analyses of Deer Tissue (Flesh, Liver, Bone).
Sample LocationCollection
DateTissueType
K-40 Cs-137 Sr-90pCi/g (Wet Weight) pCi/g (Wet Weight) pCi/g (Dry Weight)
BNL, On SiteRHIC Ring Road 1008 01/18/08 Hind 3.73 ± 0.65 0.78 ± 0.08
Liver 2.53 ± 0.49 0.16 ± 0.04Bone 1.98 ± 0.54
Inbound lane near Motor Pool 11/23/08 Hind 3.45 ± 0.33 1.67 ± 0.13Liver 2.24 ± 0.29 0.35 ± 0.03Bone 2.78 ± 0.36
Behind Fan House C 08/21/08 Hind 3.11 ± 0.37 0.21 ± 0.02Liver* 3.59 ± 0.32 0.07 ± 0.01Bone 1.05 ± 0.39
Offsite < 1 mileWilliam Floyd Pkwy., 0.5 miles north of main gate 05/08/08 Hind 3.08 ± 0.50 0.37 ± 0.05
Liver 3.16 ± 0.44 0.10 ± 0.03Bone 2.67 ± 0.57
William Floyd Pkwy. and LIE 05/08/08 Hind 2.98 ± 0.64 0.36 ± 0.05Liver 3.39 ± 0.54 0.08 ± 0.02Bone 2.36 ± 0.38
Rt. 25, 1 mile east of William Floyd Pkwy. 06/18/08 Hind 3.25 ± 0.62 0.39 ± 0.06
Liver* 2.42 ± 0.63 0.16 ± 0.05Bone 1.41 ± 0.31
William Floyd Pkwy. and LIE 10/29/08 Hind 3.48 ± 0.39 8.61 ± 0.57Liver 2.84 ± 0.32 2.03 ± 0.15Bone 2.12 ± 0.33
Rt.25, 1 mile east of William Floyd Pkwy. 11/21/08 Hind 3.51 ± 0.34 1.41 ± 0.10Liver 2.78 ± 0.35 0.53 ± 0.04Bone 1.55 ± 0.58
William Floyd Pkwy., 0.5 miles north of LIE 12/15/08 Hind 3.80 ± 0.43 1.99 ± 0.13
Liver 2.93 ± 0.35 0.29 ± 0.03Bone 4.51 ± 0.46
William Floyd Pkwy., 0.5 miles north of LIE 12/11/08 Hind 2.88 ± 0.34 3.11 ± 0.17
Liver 2.29 ± 0.31 0.67 ± 0.05Bone 1.25 ± 0.28
Offsite > 1 mileEdwards Ave., Riverhead 02/01/08 Hind 3.22 ± 0.51 0.01 ± 0.02
Liver 2.33 ± 0.51 0.00 ± 0.02Bone 1.94 ± 0.36
Rt. 25, 4 miles east of William Floyd Pkwy. 02/06/08 Hind 3.19 ± 0.56 0.36 ± 0.05
Liver 2.44 ± 0.49 0.10 ± 0.02(continued on next page)

2008 Site environmental report 6-�2
Chapter 6: natural and Cultural reSourCeS
DRAFT DRAFT
Table 6-2. Radiological Analyses of Deer Tissue (Flesh, Liver, Bone).
Sample LocationCollection
DateTissueType
K-40 Cs-137 Sr-90pCi/g (Wet Weight) pCi/g (Wet Weight) pCi/g (Dry Weight)
Bone 0.90 ± 0.27Rt. 25, Calverton Cemetery 04/15/08 Hind 4.22 ± 0.54 0.81 ± 0.11
Liver 2.50 ± 0.55 0.10 ± 0.03Bone 5.55 ± 0.60
Rt. 25, Calverton Cemetery 04/15/08 Hind 3.40 ± 0.59 0.20 ± 0.04Liver 2.56 ± 0.58 0.08 ± 0.03Bone 1.71 ± 0.37
Rt. 25, East of Calverton Cemetery main entrance 05/06/08 Hind 2.76 ± 0.59 0.07 ± 0.02
Liver 2.86 ± 0.53 NDBone 1.51 ± 0.45
Fresh Pond Rd., 1 mile north of Rt. 25 10/24/08 Hind 3.69 ± 0.43 0.28 ± 0.03Liver* 3.02 ± 0.36 0.08 ± 0.02
Bone** 0.98 ± 0.25Averages by TissueFleshAverage for all samples (16 samples) 3.36 ± 2.00 1.29 ± 0.65BNL on-site average (3 samples) 3.43 ± 0.82 0.89 ± 0.15BNL on- and off-site < 1 mile average (10 samples) 3.33 ± 1.51 1.89 ± 0.64
Off-site average (13 samples) 3.34 ± 1.83 1.38 ± 0.64Off-site < 1 mile average (7 samples) 3.28 ± 1.27 2.32 ± 0.62Off-site > 1 mile average (6 samples) 3.41 ± 1.32 0.29 ± 0.13LiverAverage for all samples (16 samples) 2.74 ± 1.82 0.30 ± 0.19BNL on-site average (3 samples) 2.79 ± 0.65 0.19 ± 0.05BNL on- and off-site < 1 mile average (10 samples) 2.82 ± 1.33 0.44 ± 0.18
Off-site average (13 samples) 2.73 ± 1.70 0.33 ± 0.19Off-site < 1 mile average (7 samples) 2.83 ± 1.15 0.55 ± 0.18Off-site > 1 mile average (6 samples) 2.62 ± 1.25 0.06 ± 0.06BoneAverage for all samples (16 samples) 2.14 ± 1.68BNL on-site average (3 samples) 1.94 ± 0.75BNL on- and off-site < 1 mile average (10 samples) 2.17 ± 1.37
Off-site average (13 samples) 2.19 ± 1.50Off-site < 1 mile average (7 samples) 2.27 ± 1.14Off-site > 1 mile average (6 samples) 2.10 ± 0.97Notes:All values are shown with a 95% confidence interval.K-40 occurs naturally in the environment and is presented as a compari-
son to Cs-137.All averages are the arithmetic average.Confidence limits are 2σ signma (95%) propogated error.Cs-137 = cesium-137
K-40 = potassium-40LIE = Long Island ExpresswaySr-90 = strontium-90* = estimated value for Cs-137** = estimated value for Sr-90
(concluded).
DRAFT
2008 Site environmental report6-�3
Chapter 6: natural and Cultural reSourCeS
DRAFT
elevated Cs-�37 levels in on-site deer and de-termined that neither hunting restrictions nor formal health advisories are warranted (NYS-DOH 1999).
With respect to the health of on-site deer based on their exposure to radionuclides, the International Atomic Energy Agency (IAEA) has concluded that chronic dose rates of �00 millirad per day to even the most radiosensitive species in terrestrial ecosystems are unlikely to cause detrimental effects in animal populations
(IAEA 1992). A deer containing a uniform dis-tribution of Cs-�37 within muscle tissue at the highest levels observed to date (��.74 pCi/g wet weight, reported in �996) would carry a total amount of approximately 0.2 µCi. That animal would receive an absorbed dose of approximate-ly 3 millirad per day, which is only 3 percent of the threshold evaluated by IAEA. The deer observed and sampled on site appear to have no health effects from the level of Cs-�37 found in their tissues.
Notes: Averages are shown for samples collected at BNL, on site and off site within 1 mile, off site but within 1 mile of the boundary, and off site greater than 1 mile from the boundary.
Numbers in parentheses indicate the number of samples in that data set. All values are presented with a 95% confidence interval. Cs-137 = cesium-137
Figure 6-2. comparison of cs-137 average concentrations in deer, 2008.
Figure 6-2. Comparison of Cesium-137 Average Concentrations in Deer, 2008.
0
0.5
1
1.5
2
2.5
3
3.5
BNL (3) BNL and off-site < 1 mi. (10) Off-site < 1 mi. (7) Off-site > 1 mi. (6)
Cs-1
37 C
once
ntrati
on (p
Ci/g,
wet
weigh
t)
Notes: Averages are shown for samples collected at BNL, and within 1 mile. Numbers in parentheses indicate the number of samples in that data set. All values are presented with a 95% confidence interval. Cs-137 = cesium-137
Figure 6-3. ten-Year trend of cs-137 concentrations in deer Meat at BNl and Within 1 Mile of BNl.
Notes:Averages are shown for samples collected at BNL, and within 1 mile.Numbers in parentheses indicate the number of samples in that data set.All values are presented with a 95% confidence interval.
Figure 6-3. Ten-year Trend of Cesium-137 Concentrations in Deer Meat at BNL and Within 1 Mile of BNL.
0
0.5
1
1.5
2
2.5
3
3.5
4
4.5
1999 (13) 2000 (37) 2001 (20) 2002 (36) 2003 (45) 2004 (34) 2005 (16) 2006 (20) 2007 (7) 2008 (10)
Cs-1
37 C
once
ntrati
on (p
Ci/g,
wet
weigh
t)
2008 Site environmental report 6-�4
Chapter 6: natural and Cultural reSourCeS
DRAFT DRAFT
6.3.1.2 Strontium-90 in Deer BoneBNL began testing deer bones for Sr-90
content in 2000. In 2008, Sr-90 content ranged from �.05 to 2.78 pCi/g dry weight in on-site samples. Sr-90 in off-site samples ranged from �.4� to 4.5� pCi/g dry weight in samples taken within � mile of BNL, and 0.90 to 5.55 pCi/g dry weight in samples taken more than a mile from BNL. This overlap in values between all samples suggests that Sr-90 is present in the environment at background levels, probably as a result of worldwide fallout from nuclear weapons testing. Sr-90 is present at very low levels in the environment, is readily incorpo-rated into bone tissue, and may concentrate over time. BNL will continue to test for Sr-90 in bone to develop baseline information on this radionuclide and its presence in white-tailed deer.
6.3.2 other animals sampledWhen other animals, such as wild turkey or
Canada geese, are found dead along the roads of the Laboratory and the immediate vicinity due to road mortality, they are tested for Cs-�37 and Sr-90 content. In 2008, there were no samples taken from geese or turkeys. Data tak-en over the past several years indicate that both species do not readily uptake radionuclides from their diet.
6.3.4 Fish samplingIn collaboration with the NYSDEC Fisheries
Division, BNL maintains an ongoing program for collecting and analyzing fish from the Pe-conic River and surrounding freshwater bod-ies. Routine annual on-site sampling of fish resumed in 2007. Large areas of open water on site resulting from the cleanup of the Pe-conic River have resulted in sufficient habitat to support larger fish. During sampling activi-ties in 2007, numerous schools of fry of bass and sunfish were noticed. While low dissolved oxygen levels continue to be a problem for fish, the deeper pools provide areas of cooler, more highly oxygenated water for long-term survival. Fish were sampled early in 2008 to take advan-tage of periods when dissolved oxygen levels are higher, supporting the presence of fish.
As in the past, off-site fish sampling contin-ued in 2008. All samples were analyzed for edible (fillet) content of each of the analytes reported. In 2008, various species of fish were collected off site from Swan Pond, Donahue’s Pond, Forge Pond, Manor Road, and Lower Lake on the Carmans River (see Figure 5-8 for sampling stations). Swan Pond is a semi-control location on the Peconic River system (a tributary of the Peconic not connected to the BNL branch), and Lower Lake on the Carmans River is the non-Peconic control site. Sampling is carried out in cooperation with NYSDEC and through a contract with the Cold Spring Harbor Fish Hatchery and Museum. Sampling is also separated into samples taken as part of the rou-tine surveillance monitoring program, and those taken as part of the post cleanup monitoring for the Peconic River Cleanup project (primarily for mercury analysis).
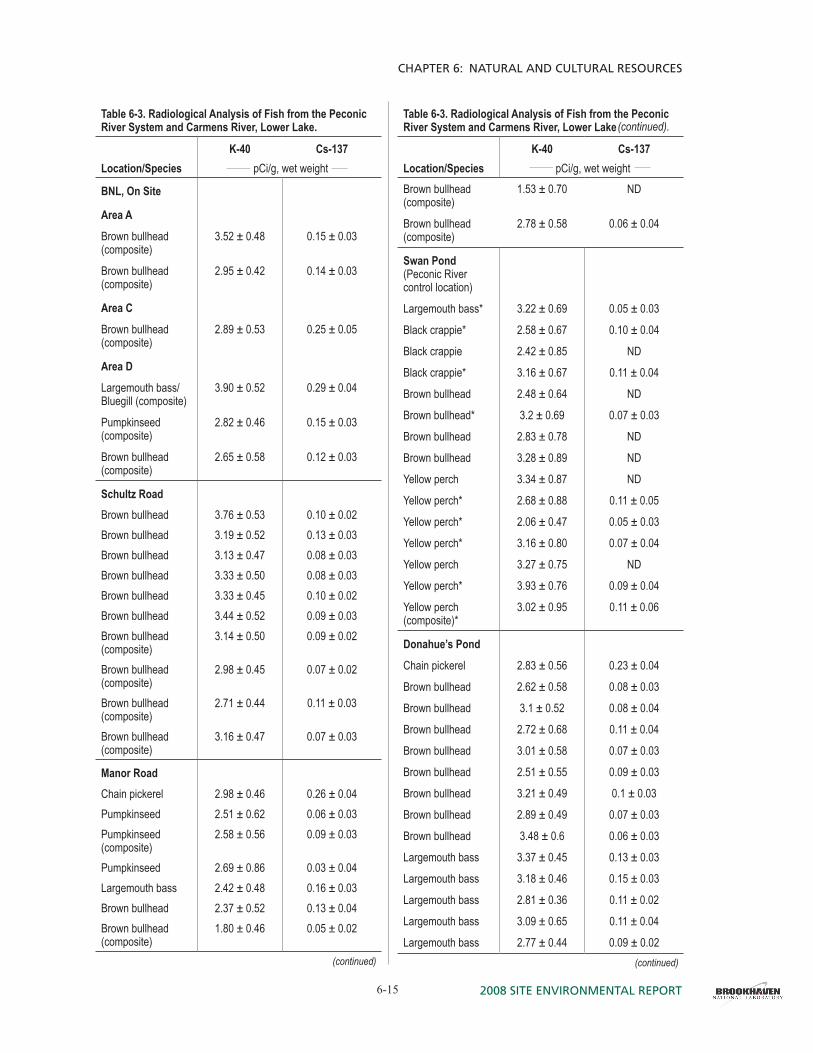
6.3.4.1 Radiological Analysis of FishThe species collected for radiological analy-
sis in 2008 by the Laboratory, NYSDEC, and through contract labor included brown bullhead (Ictalurus nebulosus), chain pickerel (Esox ni-ger), largemouth bass (Micropterus salmoides), bluegill (Lepomis macrochirus), pumpkinseed (Lepomis gibbosus), brown trout (Salmo trutta), and black crappie (Pomoxis nigromaculatus). Gamma spectroscopy analysis was performed on all samples. When fish were not of sufficient mass to conduct all nonradiological and radio-logical analyses, samples of the same species were composited to gain sufficient volume for radiological analysis. Table 6-3 presents spe-cific information on the sampling location, spe-cies collected, and analytical results. All sample results are presented as wet weight concentra-tions. Information on the natural radioisotope K-40 is included as a comparison.
Cs-�37 was detected at low levels in all samples from the Peconic River system, rang-ing from non-detectable for bluegill and brown bullhead from Forge Pond to 0.29 pCi/g wet weight in a composite sample of largemouth bass taken from Area D on site. In 2008, fish taken from Lower Lake on the Carmans River (the non-Peconic control location) had values
DRAFT
2008 Site environmental report6-�5
Chapter 6: natural and Cultural reSourCeS
DRAFT
Table 6-3. Radiological Analysis of Fish from the Peconic River System and Carmens River, Lower Lake.
Location/Species K-40 Cs-137
pCi/g, wet weight
BNL, On Site
Area A
Brown bullhead (composite)
3.52 ± 0.48 0.15 ± 0.03
Brown bullhead (composite)
2.95 ± 0.42 0.14 ± 0.03
Area C
Brown bullhead (composite)
2.89 ± 0.53 0.25 ± 0.05
Area D
Largemouth bass/Bluegill (composite)
3.90 ± 0.52 0.29 ± 0.04
Pumpkinseed (composite)
2.82 ± 0.46 0.15 ± 0.03
Brown bullhead (composite)
2.65 ± 0.58 0.12 ± 0.03
Schultz RoadBrown bullhead 3.76 ± 0.53 0.10 ± 0.02Brown bullhead 3.19 ± 0.52 0.13 ± 0.03Brown bullhead 3.13 ± 0.47 0.08 ± 0.03Brown bullhead 3.33 ± 0.50 0.08 ± 0.03Brown bullhead 3.33 ± 0.45 0.10 ± 0.02Brown bullhead 3.44 ± 0.52 0.09 ± 0.03Brown bullhead (composite)
3.14 ± 0.50 0.09 ± 0.02
Brown bullhead (composite)
2.98 ± 0.45 0.07 ± 0.02
Brown bullhead (composite)
2.71 ± 0.44 0.11 ± 0.03
Brown bullhead (composite)
3.16 ± 0.47 0.07 ± 0.03
Manor RoadChain pickerel 2.98 ± 0.46 0.26 ± 0.04Pumpkinseed 2.51 ± 0.62 0.06 ± 0.03Pumpkinseed (composite)
2.58 ± 0.56 0.09 ± 0.03
Pumpkinseed 2.69 ± 0.86 0.03 ± 0.04Largemouth bass 2.42 ± 0.48 0.16 ± 0.03Brown bullhead 2.37 ± 0.52 0.13 ± 0.04Brown bullhead (composite)
1.80 ± 0.46 0.05 ± 0.02
(continued)
Table 6-3. Radiological Analysis of Fish from the Peconic River System and Carmens River, Lower Lake.
Location/Species K-40 Cs-137
pCi/g, wet weight Brown bullhead (composite)
1.53 ± 0.70 ND
Brown bullhead (composite)
2.78 ± 0.58 0.06 ± 0.04
Swan Pond (Peconic River control location)
Largemouth bass* 3.22 ± 0.69 0.05 ± 0.03
Black crappie* 2.58 ± 0.67 0.10 ± 0.04
Black crappie 2.42 ± 0.85 ND
Black crappie* 3.16 ± 0.67 0.11 ± 0.04
Brown bullhead 2.48 ± 0.64 ND
Brown bullhead* 3.2 ± 0.69 0.07 ± 0.03
Brown bullhead 2.83 ± 0.78 ND
Brown bullhead 3.28 ± 0.89 ND
Yellow perch 3.34 ± 0.87 ND
Yellow perch* 2.68 ± 0.88 0.11 ± 0.05
Yellow perch* 2.06 ± 0.47 0.05 ± 0.03
Yellow perch* 3.16 ± 0.80 0.07 ± 0.04
Yellow perch 3.27 ± 0.75 ND
Yellow perch* 3.93 ± 0.76 0.09 ± 0.04
Yellow perch (composite)*
3.02 ± 0.95 0.11 ± 0.06
Donahue’s Pond
Chain pickerel 2.83 ± 0.56 0.23 ± 0.04
Brown bullhead 2.62 ± 0.58 0.08 ± 0.03
Brown bullhead 3.1 ± 0.52 0.08 ± 0.04
Brown bullhead 2.72 ± 0.68 0.11 ± 0.04
Brown bullhead 3.01 ± 0.58 0.07 ± 0.03
Brown bullhead 2.51 ± 0.55 0.09 ± 0.03
Brown bullhead 3.21 ± 0.49 0.1 ± 0.03
Brown bullhead 2.89 ± 0.49 0.07 ± 0.03
Brown bullhead 3.48 ± 0.6 0.06 ± 0.03
Largemouth bass 3.37 ± 0.45 0.13 ± 0.03
Largemouth bass 3.18 ± 0.46 0.15 ± 0.03
Largemouth bass 2.81 ± 0.36 0.11 ± 0.02
Largemouth bass 3.09 ± 0.65 0.11 ± 0.04
Largemouth bass 2.77 ± 0.44 0.09 ± 0.02(continued)
(continued).
2008 Site environmental report 6-�6
Chapter 6: natural and Cultural reSourCeS
DRAFT DRAFT
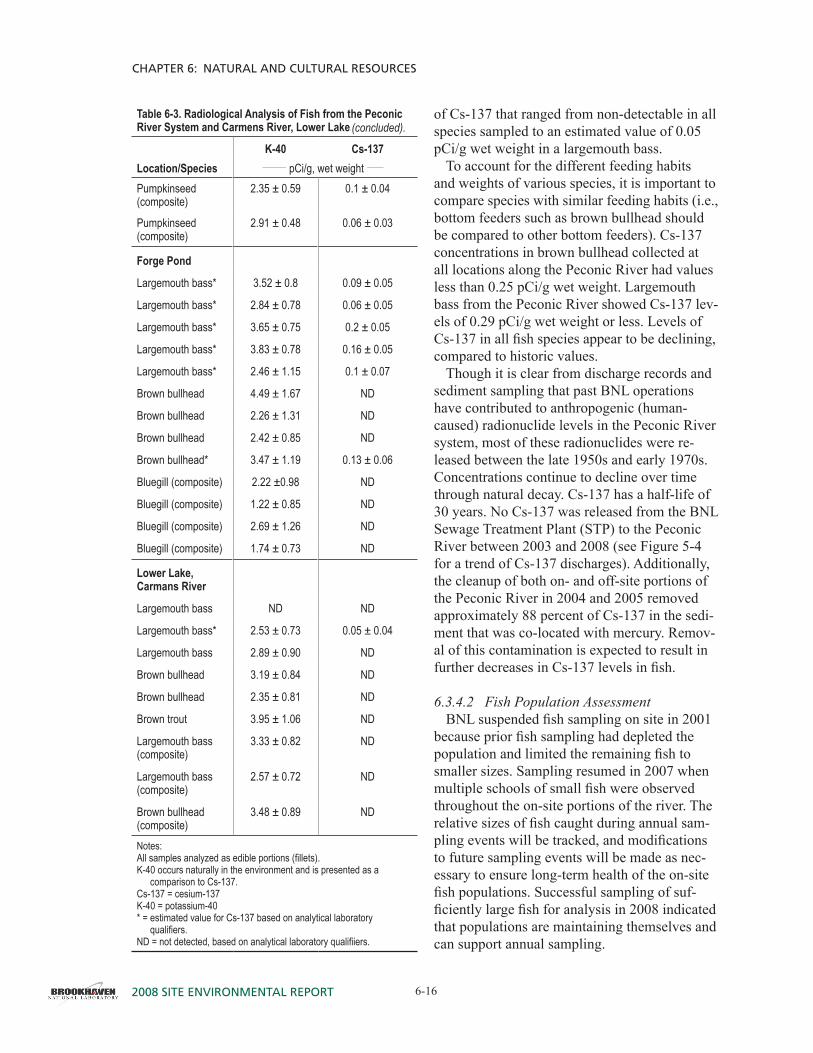
of Cs-�37 that ranged from non-detectable in all species sampled to an estimated value of 0.05 pCi/g wet weight in a largemouth bass.
To account for the different feeding habits and weights of various species, it is important to compare species with similar feeding habits (i.e., bottom feeders such as brown bullhead should be compared to other bottom feeders). Cs-�37 concentrations in brown bullhead collected at all locations along the Peconic River had values less than 0.25 pCi/g wet weight. Largemouth bass from the Peconic River showed Cs-�37 lev-els of 0.29 pCi/g wet weight or less. Levels of Cs-137 in all fish species appear to be declining, compared to historic values.
Though it is clear from discharge records and sediment sampling that past BNL operations have contributed to anthropogenic (human-caused) radionuclide levels in the Peconic River system, most of these radionuclides were re-leased between the late �950s and early �970s. Concentrations continue to decline over time through natural decay. Cs-�37 has a half-life of 30 years. No Cs-�37 was released from the BNL Sewage Treatment Plant (STP) to the Peconic River between 2003 and 2008 (see Figure 5-4 for a trend of Cs-�37 discharges). Additionally, the cleanup of both on- and off-site portions of the Peconic River in 2004 and 2005 removed approximately 88 percent of Cs-�37 in the sedi-ment that was co-located with mercury. Remov-al of this contamination is expected to result in further decreases in Cs-137 levels in fish.
6.3.4.2 Fish Population AssessmentBNL suspended fish sampling on site in 2001
because prior fish sampling had depleted the population and limited the remaining fish to smaller sizes. Sampling resumed in 2007 when multiple schools of small fish were observed throughout the on-site portions of the river. The relative sizes of fish caught during annual sam-pling events will be tracked, and modifications to future sampling events will be made as nec-essary to ensure long-term health of the on-site fish populations. Successful sampling of suf-ficiently large fish for analysis in 2008 indicated that populations are maintaining themselves and can support annual sampling.
Table 6-3. Radiological Analysis of Fish from the Peconic River System and Carmens River, Lower Lake.
Location/Species K-40 Cs-137
pCi/g, wet weight Pumpkinseed (composite)
2.35 ± 0.59 0.1 ± 0.04
Pumpkinseed (composite)
2.91 ± 0.48 0.06 ± 0.03
Forge Pond
Largemouth bass* 3.52 ± 0.8 0.09 ± 0.05
Largemouth bass* 2.84 ± 0.78 0.06 ± 0.05
Largemouth bass* 3.65 ± 0.75 0.2 ± 0.05
Largemouth bass* 3.83 ± 0.78 0.16 ± 0.05
Largemouth bass* 2.46 ± 1.15 0.1 ± 0.07
Brown bullhead 4.49 ± 1.67 ND
Brown bullhead 2.26 ± 1.31 ND
Brown bullhead 2.42 ± 0.85 ND
Brown bullhead* 3.47 ± 1.19 0.13 ± 0.06
Bluegill (composite) 2.22 ±0.98 ND
Bluegill (composite) 1.22 ± 0.85 ND
Bluegill (composite) 2.69 ± 1.26 ND
Bluegill (composite) 1.74 ± 0.73 ND
Lower Lake, Carmans River
Largemouth bass ND ND
Largemouth bass* 2.53 ± 0.73 0.05 ± 0.04
Largemouth bass 2.89 ± 0.90 ND
Brown bullhead 3.19 ± 0.84 ND
Brown bullhead 2.35 ± 0.81 ND
Brown trout 3.95 ± 1.06 ND
Largemouth bass (composite)
3.33 ± 0.82 ND
Largemouth bass (composite)
2.57 ± 0.72 ND
Brown bullhead (composite)
3.48 ± 0.89 ND
Notes:All samples analyzed as edible portions (fillets). K-40 occurs naturally in the environment and is presented as a
comparison to Cs-137.Cs-137 = cesium-137K-40 = potassium-40* = estimated value for Cs-137 based on analytical laboratory
qualifiers.ND = not detected, based on analytical laboratory qualifiiers.
(concluded).
DRAFT
2008 Site environmental report6-�7
Chapter 6: natural and Cultural reSourCeS
DRAFT
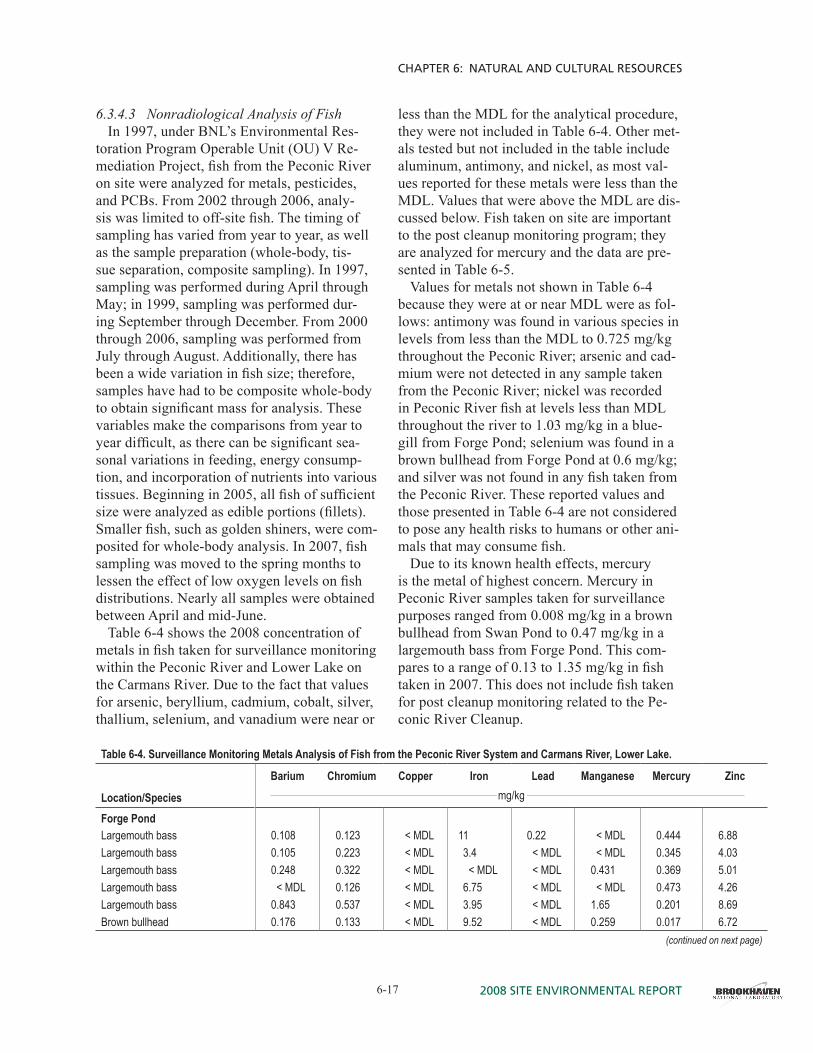
6.3.4.3 Nonradiological Analysis of FishIn 1997, under BNL’s Environmental Res-
toration Program Operable Unit (OU) V Re-mediation Project, fish from the Peconic River on site were analyzed for metals, pesticides, and PCBs. From 2002 through 2006, analy-sis was limited to off-site fish. The timing of sampling has varied from year to year, as well as the sample preparation (whole-body, tis-sue separation, composite sampling). In �997, sampling was performed during April through May; in �999, sampling was performed dur-ing September through December. From 2000 through 2006, sampling was performed from July through August. Additionally, there has been a wide variation in fish size; therefore, samples have had to be composite whole-body to obtain significant mass for analysis. These variables make the comparisons from year to year difficult, as there can be significant sea-sonal variations in feeding, energy consump-tion, and incorporation of nutrients into various tissues. Beginning in 2005, all fish of sufficient size were analyzed as edible portions (fillets). Smaller fish, such as golden shiners, were com-posited for whole-body analysis. In 2007, fish sampling was moved to the spring months to lessen the effect of low oxygen levels on fish distributions. Nearly all samples were obtained between April and mid-June.
Table 6-4 shows the 2008 concentration of metals in fish taken for surveillance monitoring within the Peconic River and Lower Lake on the Carmans River. Due to the fact that values for arsenic, beryllium, cadmium, cobalt, silver, thallium, selenium, and vanadium were near or
less than the MDL for the analytical procedure, they were not included in Table 6-4. Other met-als tested but not included in the table include aluminum, antimony, and nickel, as most val-ues reported for these metals were less than the MDL. Values that were above the MDL are dis-cussed below. Fish taken on site are important to the post cleanup monitoring program; they are analyzed for mercury and the data are pre-sented in Table 6-5.
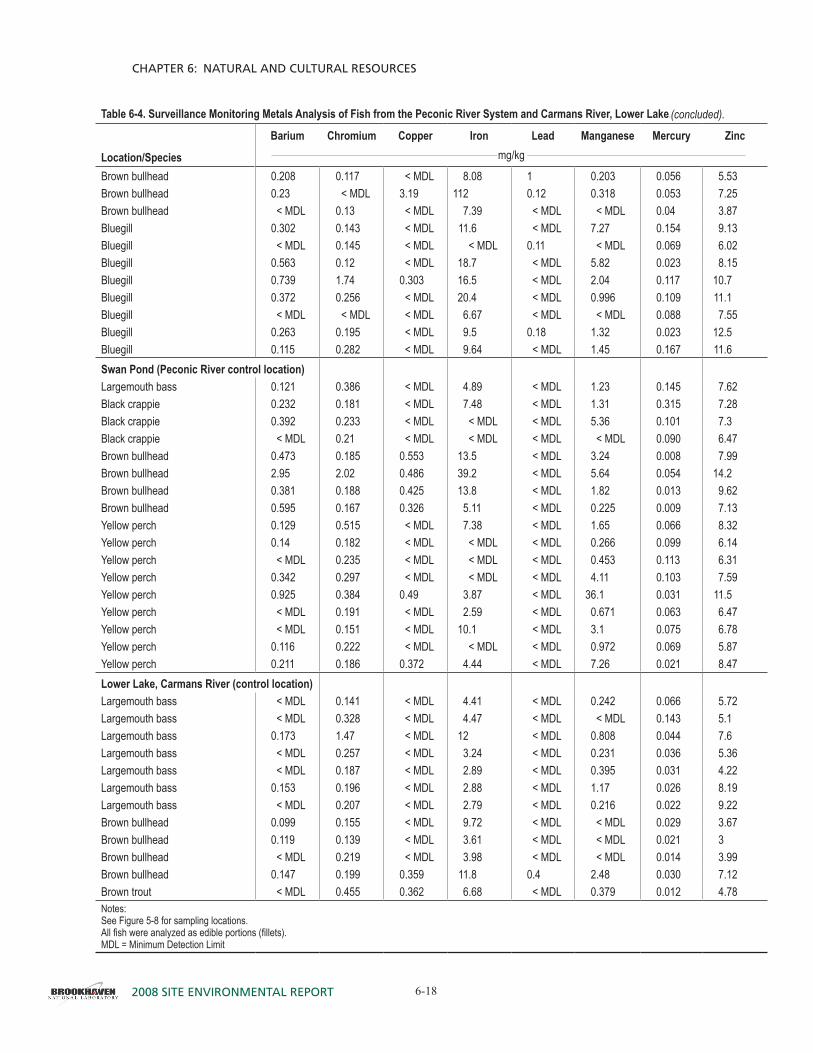
Values for metals not shown in Table 6-4 because they were at or near MDL were as fol-lows: antimony was found in various species in levels from less than the MDL to 0.725 mg/kg throughout the Peconic River; arsenic and cad-mium were not detected in any sample taken from the Peconic River; nickel was recorded in Peconic River fish at levels less than MDL throughout the river to �.03 mg/kg in a blue-gill from Forge Pond; selenium was found in a brown bullhead from Forge Pond at 0.6 mg/kg; and silver was not found in any fish taken from the Peconic River. These reported values and those presented in Table 6-4 are not considered to pose any health risks to humans or other ani-mals that may consume fish.
Due to its known health effects, mercury is the metal of highest concern. Mercury in Peconic River samples taken for surveillance purposes ranged from 0.008 mg/kg in a brown bullhead from Swan Pond to 0.47 mg/kg in a largemouth bass from Forge Pond. This com-pares to a range of 0.13 to 1.35 mg/kg in fish taken in 2007. This does not include fish taken for post cleanup monitoring related to the Pe-conic River Cleanup.
Table 6-4. Surveillance Monitoring Metals Analysis of Fish from the Peconic River System and Carmans River, Lower Lake.
Barium Chromium Copper Iron Lead Manganese Mercury Zinc
Location/Species mg/kg
Forge PondLargemouth bass 0.108 0.123 < MDL 11 0.22 < MDL 0.444 6.88Largemouth bass 0.105 0.223 < MDL 3.4 < MDL < MDL 0.345 4.03Largemouth bass 0.248 0.322 < MDL < MDL < MDL 0.431 0.369 5.01Largemouth bass < MDL 0.126 < MDL 6.75 < MDL < MDL 0.473 4.26Largemouth bass 0.843 0.537 < MDL 3.95 < MDL 1.65 0.201 8.69Brown bullhead 0.176 0.133 < MDL 9.52 < MDL 0.259 0.017 6.72
(continued on next page)
2008 Site environmental report 6-�8
Chapter 6: natural and Cultural reSourCeS
DRAFT DRAFT
Table 6-4. Surveillance Monitoring Metals Analysis of Fish from the Peconic River System and Carmans River, Lower Lake.
Barium Chromium Copper Iron Lead Manganese Mercury Zinc
Location/Species mg/kg
Brown bullhead 0.208 0.117 < MDL 8.08 1 0.203 0.056 5.53Brown bullhead 0.23 < MDL 3.19 112 0.12 0.318 0.053 7.25Brown bullhead < MDL 0.13 < MDL 7.39 < MDL < MDL 0.04 3.87Bluegill 0.302 0.143 < MDL 11.6 < MDL 7.27 0.154 9.13Bluegill < MDL 0.145 < MDL < MDL 0.11 < MDL 0.069 6.02Bluegill 0.563 0.12 < MDL 18.7 < MDL 5.82 0.023 8.15Bluegill 0.739 1.74 0.303 16.5 < MDL 2.04 0.117 10.7Bluegill 0.372 0.256 < MDL 20.4 < MDL 0.996 0.109 11.1Bluegill < MDL < MDL < MDL 6.67 < MDL < MDL 0.088 7.55Bluegill 0.263 0.195 < MDL 9.5 0.18 1.32 0.023 12.5Bluegill 0.115 0.282 < MDL 9.64 < MDL 1.45 0.167 11.6Swan Pond (Peconic River control location)Largemouth bass 0.121 0.386 < MDL 4.89 < MDL 1.23 0.145 7.62Black crappie 0.232 0.181 < MDL 7.48 < MDL 1.31 0.315 7.28Black crappie 0.392 0.233 < MDL < MDL < MDL 5.36 0.101 7.3Black crappie < MDL 0.21 < MDL < MDL < MDL < MDL 0.090 6.47Brown bullhead 0.473 0.185 0.553 13.5 < MDL 3.24 0.008 7.99Brown bullhead 2.95 2.02 0.486 39.2 < MDL 5.64 0.054 14.2Brown bullhead 0.381 0.188 0.425 13.8 < MDL 1.82 0.013 9.62Brown bullhead 0.595 0.167 0.326 5.11 < MDL 0.225 0.009 7.13Yellow perch 0.129 0.515 < MDL 7.38 < MDL 1.65 0.066 8.32Yellow perch 0.14 0.182 < MDL < MDL < MDL 0.266 0.099 6.14Yellow perch < MDL 0.235 < MDL < MDL < MDL 0.453 0.113 6.31Yellow perch 0.342 0.297 < MDL < MDL < MDL 4.11 0.103 7.59Yellow perch 0.925 0.384 0.49 3.87 < MDL 36.1 0.031 11.5Yellow perch < MDL 0.191 < MDL 2.59 < MDL 0.671 0.063 6.47Yellow perch < MDL 0.151 < MDL 10.1 < MDL 3.1 0.075 6.78Yellow perch 0.116 0.222 < MDL < MDL < MDL 0.972 0.069 5.87Yellow perch 0.211 0.186 0.372 4.44 < MDL 7.26 0.021 8.47Lower Lake, Carmans River (control location)Largemouth bass < MDL 0.141 < MDL 4.41 < MDL 0.242 0.066 5.72Largemouth bass < MDL 0.328 < MDL 4.47 < MDL < MDL 0.143 5.1Largemouth bass 0.173 1.47 < MDL 12 < MDL 0.808 0.044 7.6Largemouth bass < MDL 0.257 < MDL 3.24 < MDL 0.231 0.036 5.36Largemouth bass < MDL 0.187 < MDL 2.89 < MDL 0.395 0.031 4.22Largemouth bass 0.153 0.196 < MDL 2.88 < MDL 1.17 0.026 8.19Largemouth bass < MDL 0.207 < MDL 2.79 < MDL 0.216 0.022 9.22Brown bullhead 0.099 0.155 < MDL 9.72 < MDL < MDL 0.029 3.67Brown bullhead 0.119 0.139 < MDL 3.61 < MDL < MDL 0.021 3Brown bullhead < MDL 0.219 < MDL 3.98 < MDL < MDL 0.014 3.99Brown bullhead 0.147 0.199 0.359 11.8 0.4 2.48 0.030 7.12Brown trout < MDL 0.455 0.362 6.68 < MDL 0.379 0.012 4.78Notes:See Figure 5-8 for sampling locations.All fish were analyzed as edible portions (fillets).MDL = Minimum Detection Limit
(concluded).
DRAFT
2008 Site environmental report6-�9
Chapter 6: natural and Cultural reSourCeS
DRAFT
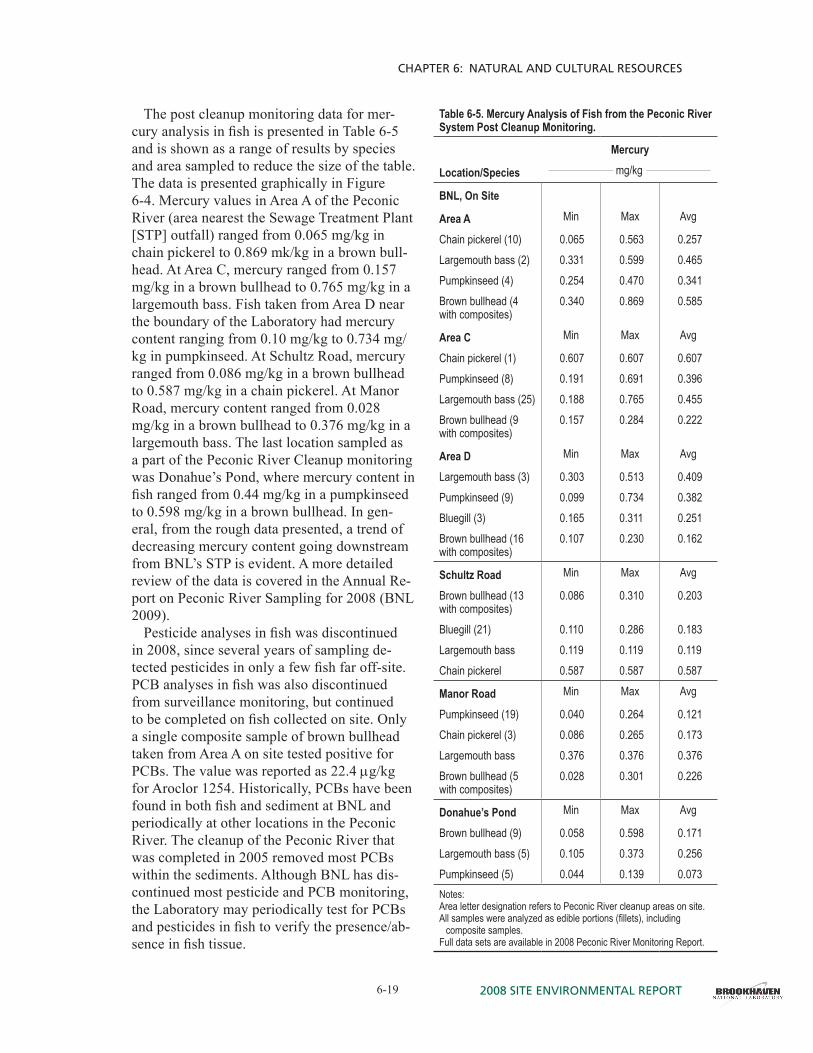
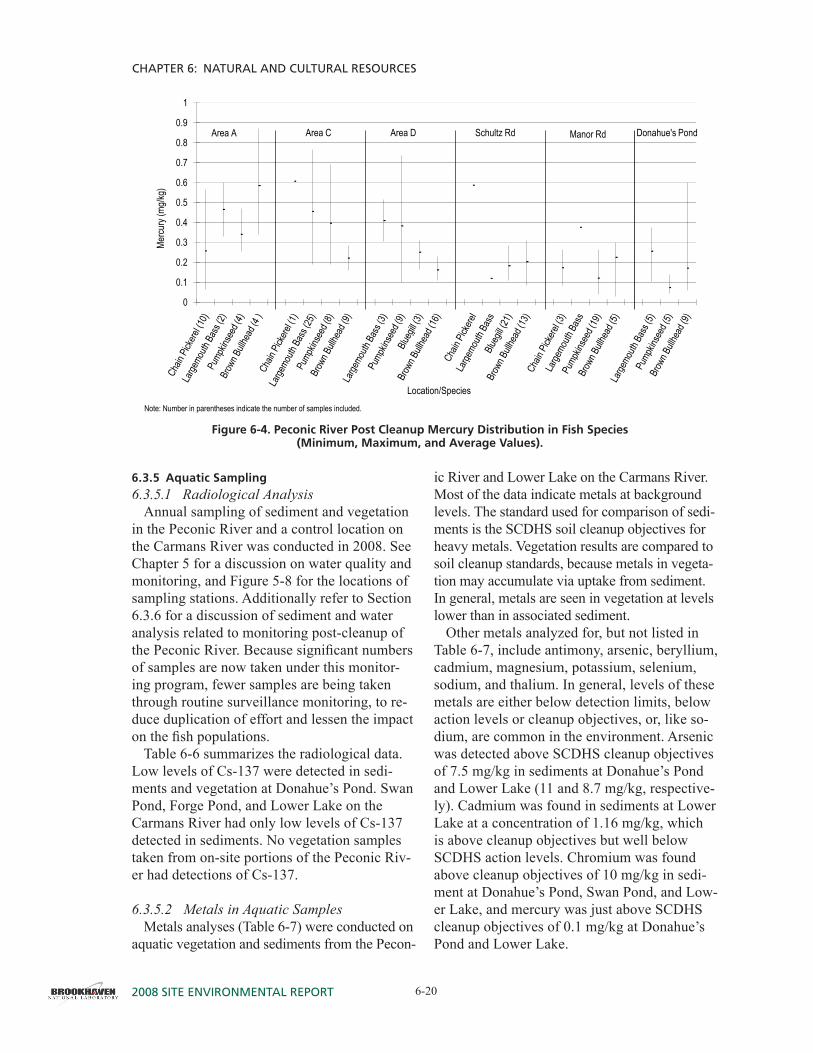
The post cleanup monitoring data for mer-cury analysis in fish is presented in Table 6-5 and is shown as a range of results by species and area sampled to reduce the size of the table. The data is presented graphically in Figure 6-4. Mercury values in Area A of the Peconic River (area nearest the Sewage Treatment Plant [STP] outfall) ranged from 0.065 mg/kg in chain pickerel to 0.869 mk/kg in a brown bull-head. At Area C, mercury ranged from 0.�57 mg/kg in a brown bullhead to 0.765 mg/kg in a largemouth bass. Fish taken from Area D near the boundary of the Laboratory had mercury content ranging from 0.�0 mg/kg to 0.734 mg/kg in pumpkinseed. At Schultz Road, mercury ranged from 0.086 mg/kg in a brown bullhead to 0.587 mg/kg in a chain pickerel. At Manor Road, mercury content ranged from 0.028 mg/kg in a brown bullhead to 0.376 mg/kg in a largemouth bass. The last location sampled as a part of the Peconic River Cleanup monitoring was Donahue’s Pond, where mercury content in fish ranged from 0.44 mg/kg in a pumpkinseed to 0.598 mg/kg in a brown bullhead. In gen-eral, from the rough data presented, a trend of decreasing mercury content going downstream from BNL’s STP is evident. A more detailed review of the data is covered in the Annual Re-port on Peconic River Sampling for 2008 (BNL 2009).
Pesticide analyses in fish was discontinued in 2008, since several years of sampling de-tected pesticides in only a few fish far off-site. PCB analyses in fish was also discontinued from surveillance monitoring, but continued to be completed on fish collected on site. Only a single composite sample of brown bullhead taken from Area A on site tested positive for PCBs. The value was reported as 22.4 µg/kg for Aroclor �254. Historically, PCBs have been found in both fish and sediment at BNL and periodically at other locations in the Peconic River. The cleanup of the Peconic River that was completed in 2005 removed most PCBs within the sediments. Although BNL has dis-continued most pesticide and PCB monitoring, the Laboratory may periodically test for PCBs and pesticides in fish to verify the presence/ab-sence in fish tissue.
Table 6-5. Mercury Analysis of Fish from the Peconic River System Post Cleanup Monitoring.
Mercury
Location/Species mg/kg
BNL, On Site
Area A Min Max Avg
Chain pickerel (10) 0.065 0.563 0.257Largemouth bass (2) 0.331 0.599 0.465Pumpkinseed (4) 0.254 0.470 0.341Brown bullhead (4 with composites)
0.340 0.869 0.585
Area C Min Max Avg
Chain pickerel (1) 0.607 0.607 0.607Pumpkinseed (8) 0.191 0.691 0.396Largemouth bass (25) 0.188 0.765 0.455Brown bullhead (9 with composites)
0.157 0.284 0.222
Area D Min Max Avg
Largemouth bass (3) 0.303 0.513 0.409Pumpkinseed (9) 0.099 0.734 0.382Bluegill (3) 0.165 0.311 0.251Brown bullhead (16 with composites)
0.107 0.230 0.162
Schultz Road Min Max Avg
Brown bullhead (13 with composites)
0.086 0.310 0.203
Bluegill (21) 0.110 0.286 0.183Largemouth bass 0.119 0.119 0.119Chain pickerel 0.587 0.587 0.587
Manor Road Min Max Avg
Pumpkinseed (19) 0.040 0.264 0.121Chain pickerel (3) 0.086 0.265 0.173Largemouth bass 0.376 0.376 0.376Brown bullhead (5 with composites)
0.028 0.301 0.226
Donahue’s Pond Min Max Avg
Brown bullhead (9) 0.058 0.598 0.171Largemouth bass (5) 0.105 0.373 0.256Pumpkinseed (5) 0.044 0.139 0.073Notes:Area letter designation refers to Peconic River cleanup areas on site.All samples were analyzed as edible portions (fillets), including
composite samples.Full data sets are available in 2008 Peconic River Monitoring Report.
2008 Site environmental report 6-20
Chapter 6: natural and Cultural reSourCeS
DRAFT DRAFT
6.3.5 aquatic sampling6.3.5.1 Radiological Analysis
Annual sampling of sediment and vegetation in the Peconic River and a control location on the Carmans River was conducted in 2008. See Chapter 5 for a discussion on water quality and monitoring, and Figure 5-8 for the locations of sampling stations. Additionally refer to Section 6.3.6 for a discussion of sediment and water analysis related to monitoring post-cleanup of the Peconic River. Because significant numbers of samples are now taken under this monitor-ing program, fewer samples are being taken through routine surveillance monitoring, to re-duce duplication of effort and lessen the impact on the fish populations.
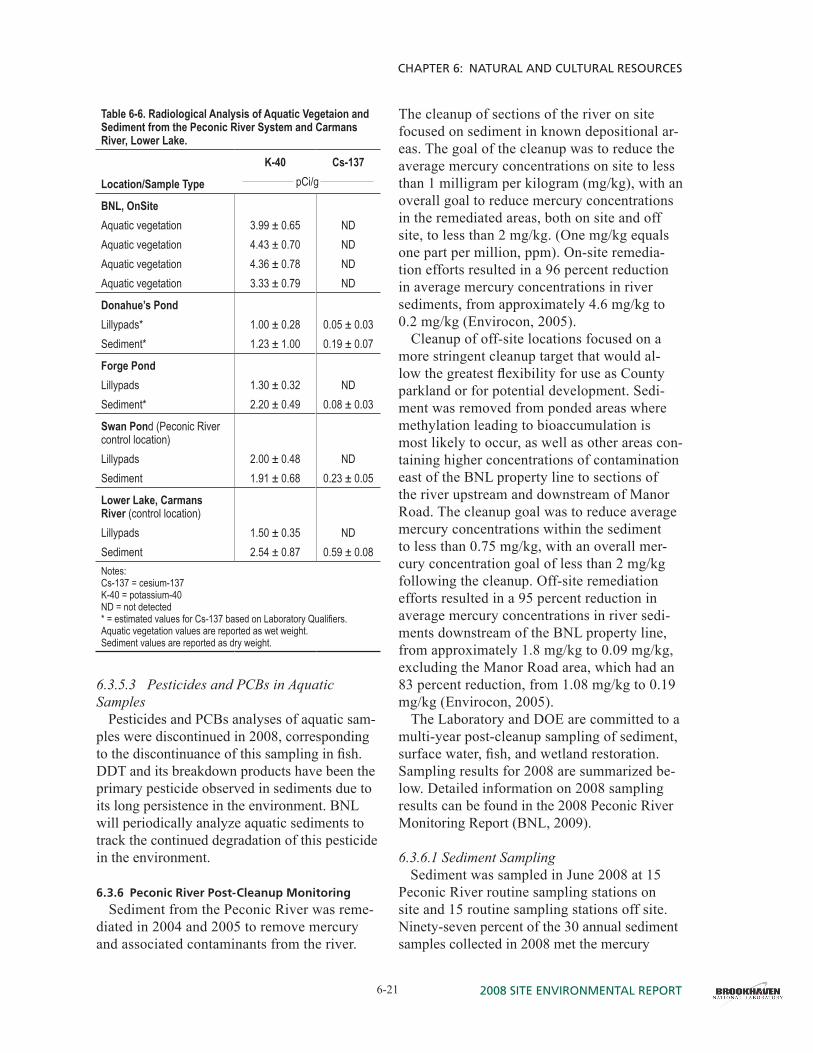
Table 6-6 summarizes the radiological data. Low levels of Cs-�37 were detected in sedi-ments and vegetation at Donahue’s Pond. Swan Pond, Forge Pond, and Lower Lake on the Carmans River had only low levels of Cs-�37 detected in sediments. No vegetation samples taken from on-site portions of the Peconic Riv-er had detections of Cs-�37.
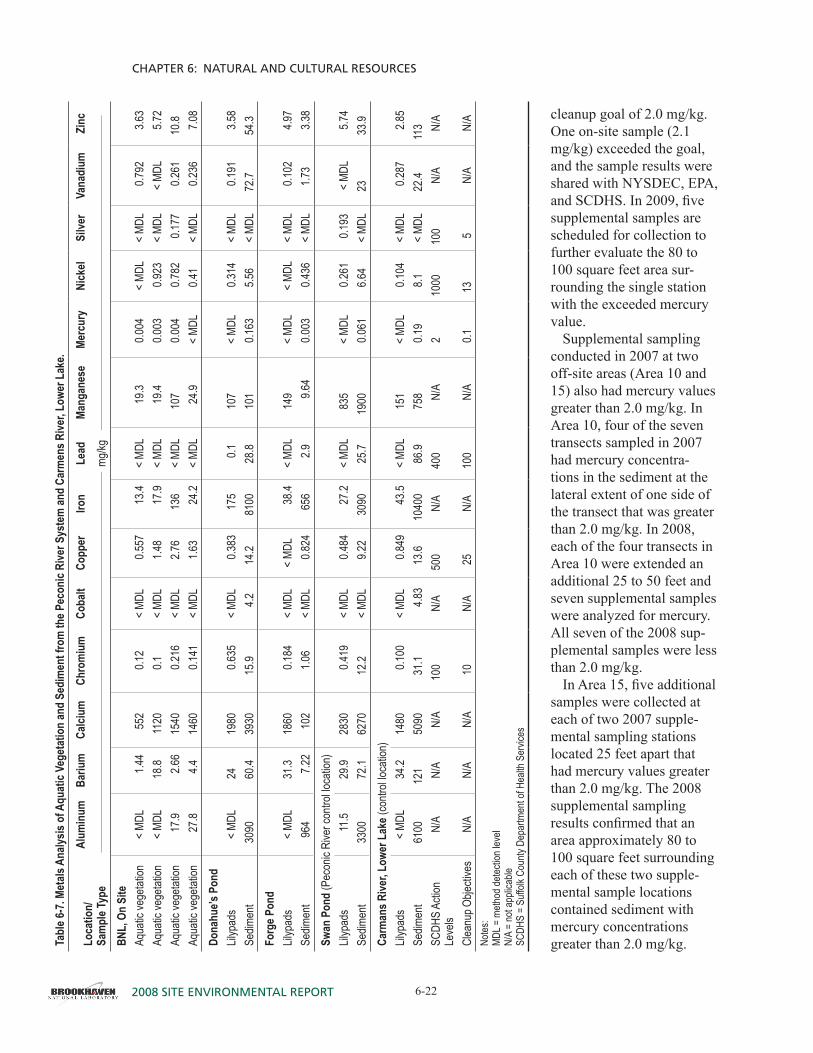
6.3.5.2 Metals in Aquatic SamplesMetals analyses (Table 6-7) were conducted on
aquatic vegetation and sediments from the Pecon-
ic River and Lower Lake on the Carmans River. Most of the data indicate metals at background levels. The standard used for comparison of sedi-ments is the SCDHS soil cleanup objectives for heavy metals. Vegetation results are compared to soil cleanup standards, because metals in vegeta-tion may accumulate via uptake from sediment. In general, metals are seen in vegetation at levels lower than in associated sediment.
Other metals analyzed for, but not listed in Table 6-7, include antimony, arsenic, beryllium, cadmium, magnesium, potassium, selenium, sodium, and thalium. In general, levels of these metals are either below detection limits, below action levels or cleanup objectives, or, like so-dium, are common in the environment. Arsenic was detected above SCDHS cleanup objectives of 7.5 mg/kg in sediments at Donahue’s Pond and Lower Lake (�� and 8.7 mg/kg, respective-ly). Cadmium was found in sediments at Lower Lake at a concentration of �.�6 mg/kg, which is above cleanup objectives but well below SCDHS action levels. Chromium was found above cleanup objectives of 10 mg/kg in sedi-ment at Donahue’s Pond, Swan Pond, and Low-er Lake, and mercury was just above SCDHS cleanup objectives of 0.1 mg/kg at Donahue’s Pond and Lower Lake.
0
0.1
0.2
0.3
0.4
0.5
0.6
0.7
0.8
0.9
1
Mercu
ry (m
g/kg)
Area A Area C Area D Schultz Rd Manor Rd Donahue's Pond
Figure 6-4. Peconic River Post Cleanup Mercury Distribution in Fish Species (minimum, maximum, and average values).
Note: Number in parentheses indicate the number of samples included.
0
0.1
0.2
0.3
0.4
0.5
0.6
0.7
0.8
0.9
1
Mercu
ry (m
g/kg)
Location/Species
Area A Area C Area D Schultz Rd Manor Rd Donahue's Pond
Figure 6-4. Peconic river Post cleanup Mercury distribution in Fish species (Minimum, Maximum, and average values).
DRAFT
2008 Site environmental report6-2�
Chapter 6: natural and Cultural reSourCeS
DRAFT
6.3.5.3 Pesticides and PCBs in Aquatic Samples
Pesticides and PCBs analyses of aquatic sam-ples were discontinued in 2008, corresponding to the discontinuance of this sampling in fish. DDT and its breakdown products have been the primary pesticide observed in sediments due to its long persistence in the environment. BNL will periodically analyze aquatic sediments to track the continued degradation of this pesticide in the environment.
6.3.6 Peconic river Post-cleanup MonitoringSediment from the Peconic River was reme-
diated in 2004 and 2005 to remove mercury and associated contaminants from the river.
The cleanup of sections of the river on site focused on sediment in known depositional ar-eas. The goal of the cleanup was to reduce the average mercury concentrations on site to less than � milligram per kilogram (mg/kg), with an overall goal to reduce mercury concentrations in the remediated areas, both on site and off site, to less than 2 mg/kg. (One mg/kg equals one part per million, ppm). On-site remedia-tion efforts resulted in a 96 percent reduction in average mercury concentrations in river sediments, from approximately 4.6 mg/kg to 0.2 mg/kg (Envirocon, 2005).
Cleanup of off-site locations focused on a more stringent cleanup target that would al-low the greatest flexibility for use as County parkland or for potential development. Sedi-ment was removed from ponded areas where methylation leading to bioaccumulation is most likely to occur, as well as other areas con-taining higher concentrations of contamination east of the BNL property line to sections of the river upstream and downstream of Manor Road. The cleanup goal was to reduce average mercury concentrations within the sediment to less than 0.75 mg/kg, with an overall mer-cury concentration goal of less than 2 mg/kg following the cleanup. Off-site remediation efforts resulted in a 95 percent reduction in average mercury concentrations in river sedi-ments downstream of the BNL property line, from approximately �.8 mg/kg to 0.09 mg/kg, excluding the Manor Road area, which had an 83 percent reduction, from �.08 mg/kg to 0.�9 mg/kg (Envirocon, 2005).
The Laboratory and DOE are committed to a multi-year post-cleanup sampling of sediment, surface water, fish, and wetland restoration. Sampling results for 2008 are summarized be-low. Detailed information on 2008 sampling results can be found in the 2008 Peconic River Monitoring Report (BNL, 2009).
6.3.6.1 Sediment SamplingSediment was sampled in June 2008 at �5
Peconic River routine sampling stations on site and �5 routine sampling stations off site. Ninety-seven percent of the 30 annual sediment samples collected in 2008 met the mercury
Table 6-6. Radiological Analysis of Aquatic Vegetaion and Sediment from the Peconic River System and Carmans River, Lower Lake.
K-40 Cs-137
Location/Sample Type pCi/g
BNL, OnSiteAquatic vegetation 3.99 ± 0.65 NDAquatic vegetation 4.43 ± 0.70 NDAquatic vegetation 4.36 ± 0.78 NDAquatic vegetation 3.33 ± 0.79 ND
Donahue’s PondLillypads* 1.00 ± 0.28 0.05 ± 0.03Sediment* 1.23 ± 1.00 0.19 ± 0.07
Forge PondLillypads 1.30 ± 0.32 NDSediment* 2.20 ± 0.49 0.08 ± 0.03
Swan Pond (Peconic River control location)Lillypads 2.00 ± 0.48 NDSediment 1.91 ± 0.68 0.23 ± 0.05
Lower Lake, Carmans River (control location)Lillypads 1.50 ± 0.35 NDSediment 2.54 ± 0.87 0.59 ± 0.08Notes:Cs-137 = cesium-137K-40 = potassium-40ND = not detected* = estimated values for Cs-137 based on Laboratory Qualifiers.Aquatic vegetation values are reported as wet weight.Sediment values are reported as dry weight.
2008 Site environmental report 6-22
Chapter 6: natural and Cultural reSourCeS
DRAFT DRAFT
cleanup goal of 2.0 mg/kg. One on-site sample (2.� mg/kg) exceeded the goal, and the sample results were shared with NYSDEC, EPA, and SCDHS. In 2009, five supplemental samples are scheduled for collection to further evaluate the 80 to �00 square feet area sur-rounding the single station with the exceeded mercury value.
Supplemental sampling conducted in 2007 at two off-site areas (Area �0 and �5) also had mercury values greater than 2.0 mg/kg. In Area �0, four of the seven transects sampled in 2007 had mercury concentra-tions in the sediment at the lateral extent of one side of the transect that was greater than 2.0 mg/kg. In 2008, each of the four transects in Area �0 were extended an additional 25 to 50 feet and seven supplemental samples were analyzed for mercury. All seven of the 2008 sup-plemental samples were less than 2.0 mg/kg.
In Area 15, five additional samples were collected at each of two 2007 supple-mental sampling stations located 25 feet apart that had mercury values greater than 2.0 mg/kg. The 2008 supplemental sampling results confirmed that an area approximately 80 to �00 square feet surrounding each of these two supple-mental sample locations contained sediment with mercury concentrations greater than 2.0 mg/kg. Ta
ble 6
-7. M
etals
Ana
lysis
of A
quat
ic Ve
geta
tion
and
Sedi
men
t fro
m th
e Pec
onic
Rive
r Sys
tem
and
Carm
ens R
iver,
Lowe
r Lak
e.
Loca
tion/
Sa
mpl
e Typ
eAl
umin
umBa
rium
Calci
umCh
rom
ium
Coba
ltCo
pper
Iron
Lead
Mang
anes
eMe
rcur
yNi
ckel
Silve
rVa
nadi
umZi
ncmg
/kgBN
L, O
n Si
teAq
uatic
vege
tation
< MD
L1.4
455
20.1
2<
MDL
0.557
13.4
< MD
L19
.30.0
04<
MDL
< MD
L0.7
923.6
3Aq
uatic
vege
tation
< MD
L18
.811
200.1
< MD
L1.4
817
.9<
MDL
19.4
0.003
0.923
< MD
L<
MDL
5.72
Aqua
tic ve
getat
ion17
.92.6
615
400.2
16<
MDL
2.76
136
< MD
L10
70.0
040.7
820.1
770.2
6110
.8Aq
uatic
vege
tation
27.8
4.414
600.1
41<
MDL
1.63
24.2
< MD
L24
.9<
MDL
0.41
< MD
L0.2
367.0
8Do
nahu
e’s P
ond
Lilyp
ads
< MD
L24
1980
0.635
< MD
L0.3
8317
50.1
107
< MD
L0.3
14<
MDL
0.191
3.58
Sedim
ent
3090
60.4
3930
15.9
4.214
.281
0028
.810
10.1
635.5
6<
MDL
72.7
54.3
Forg
e Pon
dLil
ypad
s<
MDL
31.3
1860
0.184
< MD
L<
MDL
38.4
< MD
L14
9<
MDL
< MD
L<
MDL
0.102
4.97
Sedim
ent
964
7.22
102
1.06
< MD
L0.8
2465
62.9
9.64
0.003
0.436
< MD
L1.7
33.3
8Sw
an P
ond
(Pec
onic
Rive
r con
trol lo
catio
n)Lil
ypad
s11
.529
.928
300.4
19<
MDL
0.484
27.2
< MD
L83
5<
MDL
0.261
0.193
< MD
L5.7
4Se
dimen
t33
0072
.162
7012
.2<
MDL
9.22
3090
25.7
1900
0.061
6.64
< MD
L23
33.9
Carm
ans R
iver,
Lowe
r Lak
e (co
ntrol
locati
on)
Lilyp
ads
< MD
L34
.214
800.1
00<
MDL
0.849
43.5
< MD
L15
1<
MDL
0.104
< MD
L0.2
872.8
5Se
dimen
t61
0012
150
9031
.14.8
313
.610
400
86.9
758
0.19
8.1<
MDL
22.4
113
SCDH
S Ac
tion
Leve
lsN/
AN/
AN/
A10
0N/
A50
0N/
A40
0N/
A2
1000
100
N/A
N/A
Clea
nup O
bjecti
ves
N/A
N/A
N/A
10N/
A25
N/A
100
N/A
0.113
5N/
AN/
ANo
tes:
MDL =
meth
od de
tectio
n lev
elN/
A =
not a
pplic
able
SCDH
S =
Suffo
lk Co
unty
Depa
rtmen
t of H
ealth
Ser
vices
DRAFT
2008 Site environmental report6-23
Chapter 6: natural and Cultural reSourCeS
DRAFT
BNL and DOE will evaluate remediation efforts of the area with EPA, NYSDEC, and SCDHS.
6.3.6.2 Water Column SamplingIn 2008, surface water was analyzed for total
mercury and methylmercury at 20 Peconic River sampling stations, the STP, and one reference station on the Connetquot River. Samples were taken in June (�8 samples) and July (�� samples). Not all stations could be sampled due to low wa-ter tables. The general trend of total mercury in the June and July water samples decreased with increasing distance downstream from the STP. One June on-site sample and one June off-site sample had elevated total mercury concentra-tions associated with collecting the samples in areas with low water levels and possibly sus-pending sediment into the sample. Post-cleanup Peconic River sediment has mercury concen-trations in parts per million range, whereas the surface water has mercury concentrations in the parts per trillion range. Consequently, if a small amount of sediment is mixed into a surface wa-ter sample, the surface water concentration can be markedly elevated.
Peconic River methylmercury concentrations increased slightly from the STP outfall to the BNL site border. The methylmercury concentra-tions then decreased gradually with increasing distance downstream of the BNL site border. The June methylmercury concentration in Pe-conic River samples were slightly higher then the July samples, but decreased with increas-ing distance downstream of the site border until reaching the historic range of concentrations for the Connetquot River reference station. The July off-site methylmercury concentrations decreased until reaching the range of concentrations of the reference station at Manor Road. The decreas-ing methylmercury concentrations are associ-ated with flow in downstream sections of the river with lower mercury concentrations in the sediment and dilution by flow into the river from ground water and tributaries.
6.3.6.3 Fish SamplingIn 2008, fish were collected from Area A down-
stream of the STP, Area C, Area D near North Street, Schultz Road, the Manor Road area, and
Donahue’s Pond. The average mercury con-centration among all fish was 0.26 mg/kg. The EPA criterion for methylmercury concentration in fish tissue is 0.3 mg/kg. Mercury concentra-tions in fish generally declined with increasing distance downstream of the STP. The 2008 av-erage PCB concentrations for fish collected on site (Area A and D) were close to or below the detection limit for all seven PCB isomers. The 2008 average value for Cs-�37 was substantially lower than in previous years.
6.3.6.4 Wetland SamplingThe annual wetland invasive plant survey and
removal operations were conducted by Roux Associates, Inc. during September 2008. Nine-ty-one 42-gallon bags of Phragmites shoots, stalks, and rhizomes were removed by hand from the previously remediated sections of the Peconic River on the Laboratory property. Al-though no Phragmites were found in the Manor Road cleanup area, four invasive species plants, purple loosestrife, were removed. BNL has now completed two years of wetland monitoring and invasive species control. A formal approval from EPA will be requested in 2009 that all Peconic River federal wetland restoration requirements have been met.
6.3.7 vegetation sampling
6.3.7.1 Farm and Garden VegetablesOn-site sampling of garden vegetables was
completed in 2008 and the 5-year periodic confirmatory sampling of local farm vegetables was also carried out. The data on both farm and garden vegetables are presented in Table 6-8. Samples of zucchini, cucumber, tomato, pep-per, string beans, eggplant, and peaches were analyzed for Cs-�37 content. This radionuclide was not detected in any vegetables sampled from both the on-site garden or local farms, but was detected in soils at very low levels rang-ing from nondetectable at the BNL Garden and Bruno’s Farm to 0.22 pCi/g at Riveroad Farm located approximately 5 miles east of BNL. These values for Cs-�37 in soil are con-sistent with background levels resulting from worldwide fallout from historic above-ground nuclear testing.
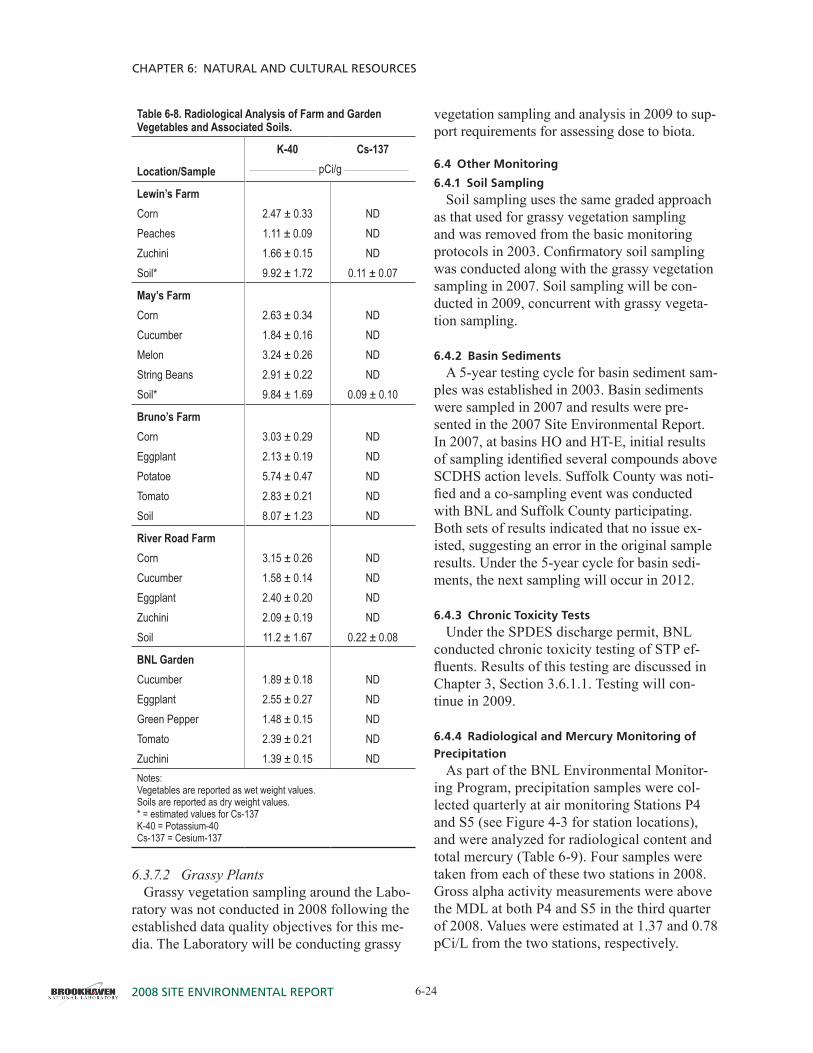
2008 Site environmental report 6-24
Chapter 6: natural and Cultural reSourCeS
DRAFT DRAFT
vegetation sampling and analysis in 2009 to sup-port requirements for assessing dose to biota.
6.4 other Monitoring
6.4.1 soil samplingSoil sampling uses the same graded approach
as that used for grassy vegetation sampling and was removed from the basic monitoring protocols in 2003. Confirmatory soil sampling was conducted along with the grassy vegetation sampling in 2007. Soil sampling will be con-ducted in 2009, concurrent with grassy vegeta-tion sampling.
6.4.2 Basin sedimentsA 5-year testing cycle for basin sediment sam-
ples was established in 2003. Basin sediments were sampled in 2007 and results were pre-sented in the 2007 Site Environmental Report. In 2007, at basins HO and HT-E, initial results of sampling identified several compounds above SCDHS action levels. Suffolk County was noti-fied and a co-sampling event was conducted with BNL and Suffolk County participating. Both sets of results indicated that no issue ex-isted, suggesting an error in the original sample results. Under the 5-year cycle for basin sedi-ments, the next sampling will occur in 20�2.
6.4.3 chronic toxicity testsUnder the SPDES discharge permit, BNL
conducted chronic toxicity testing of STP ef-fluents. Results of this testing are discussed in Chapter 3, Section 3.6.�.�. Testing will con-tinue in 2009.
6.4.4 radiological and Mercury Monitoring of Precipitation
As part of the BNL Environmental Monitor-ing Program, precipitation samples were col-lected quarterly at air monitoring Stations P4 and S5 (see Figure 4-3 for station locations), and were analyzed for radiological content and total mercury (Table 6-9). Four samples were taken from each of these two stations in 2008. Gross alpha activity measurements were above the MDL at both P4 and S5 in the third quarter of 2008. Values were estimated at �.37 and 0.78 pCi/L from the two stations, respectively.
Table 6-8. Radiological Analysis of Farm and Garden Vegetables and Associated Soils.
K-40 Cs-137
Location/Sample pCi/g
Lewin’s FarmCorn 2.47 ± 0.33 NDPeaches 1.11 ± 0.09 NDZuchini 1.66 ± 0.15 NDSoil* 9.92 ± 1.72 0.11 ± 0.07
May’s FarmCorn 2.63 ± 0.34 NDCucumber 1.84 ± 0.16 NDMelon 3.24 ± 0.26 NDString Beans 2.91 ± 0.22 NDSoil* 9.84 ± 1.69 0.09 ± 0.10
Bruno’s FarmCorn 3.03 ± 0.29 NDEggplant 2.13 ± 0.19 NDPotatoe 5.74 ± 0.47 NDTomato 2.83 ± 0.21 NDSoil 8.07 ± 1.23 ND
River Road FarmCorn 3.15 ± 0.26 NDCucumber 1.58 ± 0.14 NDEggplant 2.40 ± 0.20 NDZuchini 2.09 ± 0.19 NDSoil 11.2 ± 1.67 0.22 ± 0.08
BNL GardenCucumber 1.89 ± 0.18 NDEggplant 2.55 ± 0.27 NDGreen Pepper 1.48 ± 0.15 NDTomato 2.39 ± 0.21 NDZuchini 1.39 ± 0.15 NDNotes:Vegetables are reported as wet weight values.Soils are reported as dry weight values.* = estimated values for Cs-137K-40 = Potassium-40Cs-137 = Cesium-137
6.3.7.2 Grassy PlantsGrassy vegetation sampling around the Labo-
ratory was not conducted in 2008 following the established data quality objectives for this me-dia. The Laboratory will be conducting grassy

DRAFT
2008 Site environmental report6-25
Chapter 6: natural and Cultural reSourCeS
DRAFT
Gross beta activity was measured in samples from all four quarters of both stations except for Station P4 during the third quarter of 2008. In general, radioactivity in precipitation comes from naturally occurring radionuclides in dust and from activation products that result from solar radiation. Location P4 had a maximum gross beta activity level of 6.0 pCi/L, with an average of 4.�� pCi/L. Location S5 had a maxi-mum gross beta activity level of 5.7 pCi/L, with an average of 4.24 pCi/L. Gross beta activity values were within the range of values histori-cally observed at these two locations. Beryl-lium-7 (Be-7) was the only radionuclide found above detection levels in precipitation samples. Be-7 was found during the first and third quar-ter sampling periods at station S5 with values of 95 and 79 pCi/L, respectively. Be-7 is pro-duced in the atmosphere by cosmic radiation and is periodically found in precipitation.
Analysis of mercury in precipitation is com-pleted to document the range of mercury depo-sition that occurs on site. This information is compared to Peconic River monitoring data and aids in understanding the sources of mercury within the Peconic River. Mercury was detected in precipitation samples in each quarter and at both sampling stations. Mercury ranged from 4.5 ng/L at station S5 in the fourth quarter to 13.7 ng/L at station P4 during the first quarter.
6.5 WIldlIFe PrograMs
BNL sponsors a variety of educational and outreach activities involving natural resources. These programs are designed to help partici-pants understand the ecosystem and to foster interest in science. Wildlife programs are con-ducted at BNL in collaboration with DOE, local agencies, colleges, and high schools. Ecological research is also conducted on site to update the current natural resource inventory, gain a bet-ter understanding of the ecosystem, and guide management planning.
In 2008, the Environmental Protection Divi-sion (EPD) and FERN hosted 19 interns and one faculty member. Interns consisted of three high school interns, �4 undergraduate interns, and two school teachers during the summer. Two of the undergraduate interns worked with
a faculty member from Southern University at New Orleans, as part of the Faculty and Student Teams Program. Interns worked on a variety of projects: surveying dragonflies and dam-selflies, radio tracking and genetics of red and grey foxes, analyzing the water chemistry of the Carmans and Peconic Rivers, investigating turtle and amphibian diseases, investigating the loss of the southern leopard frog on Long Is-land, assessing population health of the banded sunfish, analyzing soil microbial communities, performing statistical analysis of migratory bird data, and studying the distribution of aquatic invertebrates within the Carmans River. Teach-ers conducted habitat analysis on tiger beetle habitats and developed mapping techniques for small wetlands. Teachers also participated in a week-long workshop on environmental monitoring under the Open Space Steward-ship Program (OSSP), which is managed by the BNL Office of Education Programs. In addition to intern projects, FERN began work on video-based instruction for protocols used within OSSP. A limited discussion concerning each project is presented below, and associated papers and posters are available at www.bnl.gov/esd/wildlife/research.asp.
An intern continued the long-term work on dragonflies and damselflies (Order Odonata) that
Table 6-9. Precipitation Monitoring (Radiological and Mercury).
Be-7 Gross Alpha Gross Beta Mercury
Location/Period pCi/L ng/L
P41st Quarter ND ND 6 ± 1.1 13.72nd Quarter ND ND 5.2 ± 1.3 5.93rd Quarter ND 1.37 ± 0.69* ND 8.84th Quarter ND ND 3.65 ± 0.91* 4.9
S51st Quarter 95 ± 48 ND 5.7 ± 1 11.42nd Quarter ND ND 3.7 ± 1.1* 5.23rd Quarter 79 ± 41 0.78 ± 0.51* 5.6 ± 1.2 10.24th Quarter ND ND 1.97 ± 0.77* 4.5Notes:Method detection limit for mercury is 0.2 ng/L.* = estimated values based on laboratory qualifiers.P4 = precipitaion sampler near BNL Apartments area.S5 = precipitation sampler near BNL Sewage Treatment Plant.
2008 Site environmental report 6-26
Chapter 6: natural and Cultural reSourCeS
DRAFT DRAFT
was started in 2003, by working on the suitabil-ity of new protocols designed to quantify Odo-nate populations at selected ponds on site. These protocols involved repeated timed visits follow-ing set routes around ponds while counting num-bers of individual species within �0-minute time blocks. Odonates are common aquatic insects around the ponds and Peconic River on site. The distribution of aquatic insects is useful for moni-toring the health of aquatic systems.
In 2005, three eastern box turtles were found in one of BNL’s many ponds. All three turtles had a fairly common infection of the ear. The turtles were taken to a wildlife rehabilitator for treatment and care. When two of the turtles subsequently died of their infections, their tis-sues were sent for analysis. In the analysis, an iridovirus implicated in amphibian declines was isolated. This resulted in a summer intern project started in 2006 that continued through 2008, in which samples from eastern box turtles were taken for virus identification. In 2007, range overlap was determined to be important for the potential of infected turtles to encounter non-infected turtles and transmit the virus. The 2008 study collected �9 samples from vari-ous locations of the Laboratory. While not an unqualified success, the study did identify that swabbing the mouth and cloacal cavities for vi-rus isolation is not a suitable methodology, and that tissue samples are necessary.
Another intern continued working with a PhD candidate from Rutgers University on the distri-bution of the southern leopard frog and chytrid fungus on Long Island. The southern leopard frog has had precipitous population declines, possibly due to the fungus. The study attempted to find existing populations of this frog, and also to document whether chytrid fungus is present in other frog species across Long Island. The study also aimed to assess the survival of cage-reared tadpoles within historic leopard frog habitats. Wild populations of the southern leop-ard frog still have not been found in any of the water bodies investigated. A second part of this work, carried out by a high school intern, was to look at the potential for mosquitoes to transmit chytrid between infected frogs and non-infected frogs. While the experiment is an important
one for frog conservation, the results were con-founded by the fact that purchased frogs arrived already containing the chytrid fungus before inoculation.
Two interns continued a project conducted in 2005 and 2007 to look at the population health of the banded sunfish in an isolated pond on site, expanding the project to historic banded sunfish habitats throughout the Peconic River basin. This larger assessment was conducted in concert with a NYSDEC fisheries biologist. The data collected will be used by the State to es-tablish a recovery and management plan for the banded sunfish.
The Faculty and Student Team (FaST), work-ing with faculty at Dowling College, conducted extensive monitoring of approximately 60 forest health plots within the Central Pine Barrens. The work involved collecting soil samples at mul-tiple depths and within multiple forest types to assess their microbial communities. The work is somewhat unique and the goal is to work toward establishing a microbial “fingerprint” of an en-tire forest ecosystem.
Two teachers participating in the Academies Creating Teacher Scientists (ACTS) program worked on developing simple outdoor experi-ments that can be utilized with biology and en-vironmental classes. The teachers worked on analysis of soil components within habitats used by tiger beetles. They also learned methods for mapping entire communities within and around a coastal plain pond. As mentioned above, the teachers also attended a week-long workshop un-der the Open Space Stewardship Program called “Gaining Research Experience in the Environ-ment (GREEN) Institute,” where they shared their expertise with approximately 20 other teachers participating in OSSP so they could discuss the program within their home schools. The OSSP continues to grow throughout Suffolk County to foster a sense of stewardship in students and to gather much-needed environmental data on nu-merous open-space parcels throughout the county.
Another undergraduate student continued working on a project to isolate genetic material from fox droppings as well as trapping foxes to place radio transmitters on them for tracking. In 2008, two red fox kits were trapped, one be-
DRAFT
2008 Site environmental report6-27
Chapter 6: natural and Cultural reSourCeS
DRAFT
ing large enough to tag with a radio collar. The fox was followed for several days until it either ranged too far for tracking or the collar failed. The genetic isolation method using scat is a non-invasive genetic technique being utilized to look at the inter-relatedness of numerous fox families living on site, and to try to distinguish between red and gray fox. Gray fox was once thought to have been extirpated from Long Island, but a gray fox that had been struck by a car was found on site in 2004. Using non-invasive genetics techniques may also allow researchers to esti-mate population size and distribution of these two species.
With funding from the Norcross Foundation, BNL and FERN hosted three summer students who assisted in assessing the distribution of aquatic invertebrates within the Carmans River. This local river is in near-pristine condition and is currently the focus of intense interest for pres-ervation and protection from over development within the watershed. Gaining an understanding of the basic biology and ecology of the river is important for understanding the potential impacts of management activities as well as de-velopment. The project is expected to continue in 2009 to gather further information based on refinements to the 2008 study.
Members of EPD and other BNL departments volunteered as speakers for schools and civic groups and provided on-site ecology tours. EPD also hosted several environmental events in as-sociation with Earth Day. In October, BNL host-ed the Thirteenth Annual Pine Barrens Research Forum for ecosystems researchers to share and discuss their results.
The Laboratory also hosted the annual New York Wildfire & Incident Management Acad-emy, offered by NYSDEC and the Central Pine Barrens Commission. Using the Incident Com-mand System of wildfire management, this academy trains fire fighters in the methods of wildland fire suppression, prescribed fire, and fire analysis. BNL has developed and is imple-menting a Wildland Fire Management Plan. While plans were prepared for conducting a prescribed fire during the Academy, the condi-tions did not meet the requirements of the pre-scription. Post-fire monitoring on previous fires,
conducted in 2007, indicated that prescribed fires have been somewhat effective at opening up the understory to allow forest regeneration. The Laboratory intends to continue the use of prescribed fire for fuel and forest management in the future, and is working with NYSDEC and The Nature Conservancy to prepare additional prescriptions for a larger portion of the northern and eastern sections of the BNL property.
6.6 cultural resource actIvItIes
The BNL Cultural Resource Management (CRM) Program ensures that the Laboratory ful-ly complies with the numerous cultural resource regulations. The Cultural Resource Manage-ment Plan for Brookhaven National Laboratory (BNL, 2005) guides the management of all of BNL’s historical resources. Along with achiev-ing compliance with applicable regulations, one of the major goals of the CRM program is to fully assess both known and potential cul-tural resources. The range of the Laboratory’s cultural resources includes buildings and struc-tures, World War I (WWI) earthwork features, the Camp Upton Historical Collection, scientific equipment, photo/audio/video archives, and in-stitutional records. As various cultural resources are identified, plans for their long-term stew-ardship are being developed and implemented. Achieving these goals will ensure that the con-tributions BNL and the site have made to our history and culture are documented and avail-able for interpretation. The Laboratory has three structures or sites that have been determined to be eligible for listing on the National Register of Historic Places: the Brookhaven Graphite Research Reactor complex, the High Flux Beam Reactor complex, and the WWI train-ing trenches associated with Camp Upton. The BNL trenches are examples of the few surviving WWI earthworks in the United States. Cultural resource management activities performed in 2008 include acquiring storage space for cul-tural resources, and participating in the planning and execution of the 77th Division Casing of the Colors Ceremony.
On September 7, 2008 BNL hosted soldiers from the U.S. Army at a ceremony marking the retiring of the 77th U.S. Army Regional Readi-
2008 Site environmental report 6-28
Chapter 6: natural and Cultural reSourCeS
DRAFT
ness Command. This infantry division began its distinguished 9�-year history at the Laboratory site, formerly Camp Upton, a U.S. Army induc-tion and training center during WWI and WWII. The brigade formally retired its colors on Octo-ber 7. Led by Major General William Terpeluk, the current commander of the 77th brigade, the event began with hundreds of soldiers march-ing in formation across the field under a large American flag proudly draped between two fire trucks. After remarks from U.S. Department of Energy Brookhaven Site Manager Michael Holland, BNL Director Samuel Aronson, and historian Robert Laplander, each unit requested permission to “retire the command.” A U.S. Army band played as each unit marched off the field. The event concluded with a ceremonial 2�-gun cannon salute while Terpeluk furled the division’s flag and an echo of “Taps” played in the background. The division flag was retired at the Center of Military History in Washington, D.C. Soldiers currently serving in the 77th bri-gade have been reassigned to other units.
Additional outreach activities consisted of providing presentations on Laboratory cultural resources and tours of the WWI trenches to several small groups, including 77th Division officers.
referenCeS and BiBliography
BNL. 1999. Record of Decision: Operable Unit I and Radiologically Contaminated Soils. BNL/OU1/12.1/1-57 05-OCT-99. Brookhaven National Laboratory, Upton, NY.BNL. 2000. 1999 Site Environmental Report. BNL-52553. Brookhaven National Laboratory, Upton, NY.BNL. 2003a. Natural Resource Management Plan for Brookhaven National Laboratory. BNL-71870-2003. Brookhaven National Laboratory, Upton, NY.BNL. 2003b. Wildland Fire Management Plan for Brookhaven National Laboratory. BNL-71629-2003. Brookhaven National Laboratory, Upton, NY.
BNL. 2005. Cultural Resource Management Plan for Brookhaven National Laboratory. BNL-73839-2005. Brookhaven National Laboratory, Upton, NY. March 2005.BNL 2007. 2006 Peconic River Monitoring Report. Brookhaven National Laboratory.DOE-FWS. 2000. Interagency Agreement Number AI02-01CH1107 Between the U.S. Department of Interior, U.S. Fish & Wildlife Service, Long Island National Wildlife Refuge Complex, and the U.S. Department of Energy Chicago Operations Office Brookhaven Group.Dwyer, Norval. 1966. Brookhaven National Laboratory. Long Island Forum (reprint), West Islip, NY.Florendo, Esperanza. 2004. “Seasonal Food Intake Affecting Cs-137 Levels in White-tailed Deer at Brookhaven National Laboratory.” CCI Paper. Brookhaven National Laboratory.IAEA. 1992. Effects of Ionizing Radiation on Plants and Animals at Levels Implied by Current Radiation Protection Standards. Technical Report Series No. 332. International Atomic Energy Agency, Vienna.LMS. 1995. Phase II Sitewide Biological Inventory Report, Final. Lawler, Matusky & Skelly Engineers. Pearl River, NY.Merwin, D, Manfra, A. 2007. A Stage I Archaeological Survey for the Proposed NSLS-II at Brookhaven National Laboratory. The Institute for Long Island Archaeology, Department of Anthropology, State University of New York at Stony Brook. NYSDOH. 1996. Radioactive Contamination in the Peconic River. Bureau of Environmental Radiation Protection, New York State Department of Health, Albany, NY.NYSDOH. 1999. Deer Meat Contaminated with Cesium-137 at Brookhaven National Laboratory. Bureau of Environmental Radiation Protection, New York State Department of Health, Albany, NY.QEA. 2004a. Peconic River 2003 Data Summary Report. Quantitative Environmental Analysis, LLC. Montvale, NJ.QEA. 2004b. 2004 Methylmercury Sampling Program Results: Addendum to the Peconic River 2003 Data Summary Report. Quantitative Environmental Analysis, LLC. Montvale, NJ.QEA. 2006. 2005 Peconic River Water Column Sampling Data Summary Report. Quantitative Environmental Analysis, LLC. Montvale, NJ.Snyder, S. and V. Titus. 2007. “Spatial distribution of Iridovirus in the Eastern box turtle population at Brookhaven National Laboratory: Implications for transmittance based on home range size.” SULI Poster, Brookhaven National Laboratory.