nationwide studies of longitudinal follow-up, hba1c context
TRANSCRIPT

ACTAUNIVERSITATIS
UPSALIENSISUPPSALA
2019
Digital Comprehensive Summaries of Uppsala Dissertationsfrom the Faculty of Medicine 1529
Key Features for Successful Swedish Primary Diabetes Care
–Reality or Fiction?
Nationwide studies of longitudinal follow-up, HbA1clevels and all-cause mortality in an organizationalcontext
REBECKA HUSDAL
ISSN 1651-6206ISBN 978-91-513-0548-6urn:nbn:se:uu:diva-371496
Dissertation presented at Uppsala University to be publicly examined in Samlingssalen,Psykiatricentrum ingång 29, Västmanlands sjukhus Västerås, Västerås, Friday, 22 February2019 at 13:15 for the degree of Doctor of Philosophy (Faculty of Medicine). The examinationwill be conducted in Swedish. Faculty examiner: Professor Olov Rolandsson (Umeåuniversity).
AbstractHusdal, R. 2019. Key Features for Successful Swedish Primary Diabetes Care – Reality orFiction? Nationwide studies of longitudinal follow-up, HbA1c levels and all-cause mortalityin an organizational context. Digital Comprehensive Summaries of Uppsala Dissertationsfrom the Faculty of Medicine 1529. 91 pp. Uppsala: Acta Universitatis Upsaliensis.ISBN 978-91-513-0548-6.
Aims To extend knowledge about the changes in Swedish primary diabetes care from 2006 to2013 and investigate associations of personnel resources, organizational features and quality-of-work conditions of primary health-care centres (PHCCs) with individual HbA1c levels andall-cause mortality in people with type 2 diabetes mellitus (T2DM).
Methods Information about organizational features, personnel resources and quality-of-work conditions were collected from responses of PHCC managers to the Swedish NationalSurvey of the Quality and Organisation of Diabetes Care in Primary HealthCare (Swed-QOP)questionnaire. The longitudinal cross-sectional study included 74.3% and 76.4% of PHCCs in2006 and 2013, respectively. Individual clinical data for 230,958 people with T2DM obtainedfrom the Swedish National Diabetes Register were linked to the data from the Swed-QOPquestionnaire. Individual data were linked to socio-economic and comorbidity data. All-causemortality was followed up for a median of 4.2 years for 187,570 people with T2DM.
Results The longitudinal follow-up study showed a decreased median PHCC list size butan increased median number of people with T2DM. The mean European Credit Transfer andAccumulation System (ECTS) credits in diabetes-specific education for registered nurses (RNs)increased. The number of PHCCs providing group education programs and involving the patientin goal setting remained low (I). PHCCs having diabetes teams and group education programswere associated with decreased HbA1c levels. Using call-recall system to general practitioners(GPs) was associated with increased HbA1c levels (II). Seven quality-of-work features wereidentified, of which Individualized treatment was associated with decreased HbA1c levels inpeople with controlled (≤ 52 mmol/mol), intermediate (53–69 mmol/mol) and uncontrolled (≥70 mmol/mol) HbA1c (III). GP staffing was associated with a decreased risk of early death andthe mean ECTS credits in diabetes-specific and pedagogical education of RNs was associatedwith a decreased risk of early death in people aged ≥ 55 years and in men, respectively (IV).
Conclusion This thesis adds to previous work on significant but less pronounced key featuresfor successful organization of primary diabetes care, and indicates that the complexity ofdiabetes disease makes it difficult to identify success factors applicable to all people living withT2DM.
Keywords: Epidemiology, Organization, Personnel resources, Primary health-care, Type 2diabetes mellitus
Rebecka Husdal, Centre for Clinical Research, County of Västmanland, Västmanlandssjukhus Västerås, Uppsala University, SE-72189 Västerås, Sweden. Department of MedicalSciences, Clinical diabetology and metabolism, Akademiska sjukhuset, Uppsala University,SE-75185 Uppsala, Sweden.
© Rebecka Husdal 2019
ISSN 1651-6206ISBN 978-91-513-0548-6urn:nbn:se:uu:diva-371496 (http://urn.kb.se/resolve?urn=urn:nbn:se:uu:diva-371496)

To my family
“Most things still remain to be done.A glorious future!”
Ingvar Kamprad


List of Papers
This thesis is based on the following papers, which are referred to in the text by their Roman numerals.
I Husdal, R., Rosenblad, A., Leksell, J., Eliasson, B., Jansson, S.,
Jerdén, L., Stålhammar, J., Steen, L., Wallman, T., Thors Adolfs-son, E. (2017) Resource allocation and organisational features in Swedish primary diabetes care: Changes from 2006 to 2013. Pri-mary Care Diabetes, 11(1): 20–28
II Husdal, R., Rosenblad, A., Leksell, J., Eliasson, B., Jansson, S., Jerdén, L., Stålhammar, J., Steen, L., Wallman, T., Svensson, A-M., Thors Adolfsson, E. (2018) Resources and organisation in pri-mary health care are associated with HbA1c level: A nationwide study of 230 958 people with Type 2 diabetes mellitus. Primary Care Diabetes, 12 (1): 23-33
III Husdal, R., Thors Adolfsson, E., Leksell, J., Eliasson, B., Jansson, S., Jerdén, L., Stålhammar, J., Steen, L., Wallman, T., Svensson, A-M., Rosenblad, A. (2018) Quality of work features in primary health care are associated with HbA1c level in people with type 2 diabetes mellitus: A nationwide survey. Primary Care Diabetes (Epub ahead of print).
IV Husdal, R., Thors Adolfsson, E., Leksell, J., Eliasson, B., Jansson, S., Jerdén, L., Stålhammar, J., Steen, L., Wallman, T., Svensson, A-M., Rosenblad, A. (2018). Organisation of primary diabetes care in people with type 2 diabetes mellitus in relation to all-cause mortality: A nationwide register-based cohort study (Manuscript).
Reprints were made with permission from the respective publishers.


Contents
Introduction ................................................................................................... 11 History of the Sweden’s primary health-care system ............................... 11 Swedish primary diabetes care ................................................................. 12 The National Diabetes Register: a tool for quality assurance .................. 13 Swedish national diabetes guidelines ....................................................... 14 National perspective of knowledge management ..................................... 15 Type 2 diabetes mellitus: a heterogeneous disease .................................. 16 HbA1c and modifiable risk factors .......................................................... 17 The importance of multifactorial risk-factor control ................................ 17
Micro- and macrovascular complications and all-cause mortality ...... 17 Health expenditure, socio-economic status and ethnicity ........................ 18 Care for people with type 2 diabetes mellitus .......................................... 19
Quality of care – an explanation of the model ..................................... 19 Features of successful organization of primary diabetes care ............. 20 Organization of diabetes care – a complicated matter ......................... 21
Rationale ....................................................................................................... 25
Aims .............................................................................................................. 26
Methods ........................................................................................................ 27 Setting and study design ........................................................................... 29 Participants ............................................................................................... 29 Data collection procedure ......................................................................... 31 Data sources ............................................................................................. 31
Swed-QOP questionnaire ..................................................................... 31 Registries ............................................................................................. 34
Ethical considerations .............................................................................. 35 Statistical analysis .................................................................................... 36
Survival analysis .................................................................................. 37 Handling of missing data ..................................................................... 38 Role of bias .......................................................................................... 38
Results ........................................................................................................... 39 Study I ...................................................................................................... 39 Study II and III ......................................................................................... 41 Study IV ................................................................................................... 47

Discussion ..................................................................................................... 50 Key findings ............................................................................................. 50 Personnel resources .................................................................................. 51 Organizational features ............................................................................ 52 Quality of work ........................................................................................ 54 General discussion .................................................................................... 54
Time to go beyond glycaemic control ................................................. 56 Methodological considerations................................................................. 57
Strengths .............................................................................................. 57 Limitations ........................................................................................... 58
Conclusions ................................................................................................... 60
Future studies ................................................................................................ 61
Svensk sammanfattning (Summary in Swedish) .......................................... 62
Acknowledgements ....................................................................................... 65
References ..................................................................................................... 68
Appendix 1: The 2006 questionnaire in Swedish ......................................... 78
Appendix 2: The 2013 questionnaire in Swedish ......................................... 83

Abbreviations
ACCORD
Action to Control Cardiovascular Risk in Diabetes
ADVANCE Action in Diabetes and Vascular Disease–Preterax and Diamicron Modified Release Controlled Evaluation
BMI Body mass index CI Confidence interval CVD Cardiovascular disease eGFR Estimated glomerular filtration rate ECTS European Credit Transfer and Accumulation System GEE Generalized estimating equations GP General practitioner HR Hazard ratio HSA-ID Health-care address registry identity number ICD-10 International Statistical Classification of Diseases and Related
Health Problems, 10th revision IDF International Diabetes Federation LISA Longitudinal Integration Database for Health Insurance and
Labour Market Studies LOCF Last observation carried forward NDR National Diabetes Register NBHW National Board of Health and Welfare NPR National Patient Register OHA Oral hypoglycaemic agents PHC Primary health care PHCC Primary health-care centre PREM Patient-reported experience measures PROM Patient-reported outcome measures QI Quality improvement RCT Randomized controlled trial RN Registered nurse SALAR Swedish Association of Local Authorities and Regions SD Standard deviation Swed-QOP Swedish National Survey of the Quality and Organisation of
Diabetes Care in Primary Healthcare T1DM Type 1 diabetes mellitus T2DM Type 2 diabetes mellitus VADT Veterans Affairs Diabetes Trial WHO World Health Organization WTE Whole-time equivalent

Thesis at a glance
Study I Study II Study III Study IV
Aim
s
Comparison of the resource allocation and organizational features in Swedish primary diabetes care for people with T2DM between 2006 and 2013.
Examine association between personnel resources and organi-zational features of PHCCs and HbA1c level in people with T2DM.
Describe and analyse associations between PHCCs’ quality of work and HbA1c lev-els in people with T2DM.
Identify associations between personnel re-sources and organiza-tional features in Swe-dish PHCCs and all-cause mortality in peo-ple with T2DM.
Met
hod
s
Longitudinal cross-sectional study of 684 (74.3%) PHCCs in 2006 and 880 (76.4%) PHCCs in 2013 that responded to the Swed-QOP questionnaire.
Cross-sectional study of 846 (73.4%) PHCCs and 230 958 people with T2DM. PHCC-level data was retrieved from the Swed-QOP ques-tionnaire and individual-level clinical data from the Swedish National Diabetes Register. These data were linked to other registries containing individual-level data about socio-economics and comorbidity.
Register-based cohort study with follow-up of all-cause mortality. The final sample comprised 187,570 people with T2DM at 787 PHCCs. Swed-QOP question-naire was used to as-sess the organization of diabetes care.
Res
ult
s
Compared with 2006, time devoted to peo-ple with T2DM and RNs’ diabetes-spe-cific education had increased in 2013. However, providing group education pro-grams and involve-ment of patients in setting treatment tar-gets remained low.
The RNs’ diabetes-specific education level and length of regular visits were associated with lower HbA1c. Having dia-betes teams and providing group edu-cation programs were associated with lower HbA1c levels. Length of regular visits to GPs and computerized call-re-call systems to GPs were associated with increased HbA1c levels.
Seven quality-of-work features were identified. PHCCs having individualized treatment plans were associated with lower HbA1c levels in all groups i.e., con-trolled ( 52 mmol/mol), interme-diate (53–69 mmol/mol), and un-controlled ( 70 mmol/mol).
There was an associa-tion between the WTE GPs per 500 people with T2DM and lower risk of early death. Also, RNs diabetes-specific and pedagogi-cal education were as-sociated with decreased risk of early death. Group education and call-recall systems were associated with increased risk of early death.
Con
clu
sion
s
Although RNs’ dia-betes-specific educa-tion increased, the ar-rangement of group education as well as patient participation remained low.
Evaluating the care for people with T2DM is complex. However, some per-sonnel resources and organizational fea-tures were associated with HbA1c level.
PHCCs’ quality of work may only bene-fit people with con-trolled HbA1c. More strategies are re-quired for people with uncontrolled HbA1c.
A significant but less pronounced decrease in risk of early death was observed when PHCCs had access to sufficient GPs and had RNs with diabetes-specific and pedagogical education.
Note: GP, general practitioner; PHCC, primary health-care centre; RN, registered nurse; Swed-QOP, Swedish National Survey of the Quality and Organisation of Diabetes Care in Primary HealthCare; T2DM, type 2 diabetes mellitus; WTE, whole-time equivalent.

11
Introduction
Diabetes mellitus is recognized as a global epidemic. The prevalence of type 2 diabetes mellitus (T2DM) is increasing dramatically, with projections of even higher growth over coming decades (1). The first point of contact for people with T2DM the primary health care (PHC) system. Research in the PHC setting has increased in the last 50 years with a 13.7-times increase in the number of diabetes articles mentioning PHC. However, there is still scope for more evidence to allow full understanding of the population-level benefits of managing people with T2DM in this setting (2). The World Health Organ-ization (WHO) stated in a report that the PHC system worldwide needs to be strengthened (3), while the International Diabetes Federation (IDF) stated
Europe is making progress, but it is simply too slow and too limited to stem the tide of diabetes (4, p. 13).
This thesis will describe how Swedish primary diabetes care changed between 2006 and 2013 and how the personnel resources and organizational features of primary health-care centres (PHCCs) are related to individual HbA1c levels and all-cause mortality in people with T2DM. No previous large-scale Swe-dish study has examined whether the organization of primary diabetes care increases the possibility that people with T2DM will reach national treatment targets for HbA1c or decreases the risk of early death. Such knowledge may provide support for decision makers to provide equal care for people with T2DM treated within the Swedish PHC system.
History of the Sweden’s primary health-care system The Swedish national system of district medical officers (Provin-sialläkarväsendet) in the 17th century was the beginning of today’s PHC sys-tem. At that time health care was managed by the Swedish government. Gen-eral practitioners (GPs) were responsible for patients with all conditions and mainly worked alone. In 1862, because of legislation establishing local gov-ernment county councils, the responsibility for health care was devolved to each of the county councils. During the first half of the 20th century, the na-tional system of district medical officers was considered to function well. However, after World War II, inpatient care was rearranged and health-care

12
centres were established that were intended to prevent and treat illness in all people. The national system of district medical officers was in severe crisis at that time because of difficulties in recruiting GPs, which were related to high workload and the very limited possibilities for professional advancement.In the 1960s, hospital directors realized that the health-care system needed a rad-ical change because of the overload of patients attending specialist clinics in the hospitals, many of whom could be monitored in less expensive forms of care. One of the most important events of the 1960s was the launch by the Swedish National Board of Health and Welfare (NBHW; Socialstyrelsen) of the PHCCs concept, in which not only GPs but also other health-care profes-sionals were available. In 1976, 677 GP clinics and PHCCs existed and nearly half were staffed solely by one GP. A report by NBHW (Health care facing the 80s: HS 80) described the need for PHCCs to be in the geographical area in which the people lived, and proposed that each municipality should have at least one PHCC (5). According to paragraph 5 of Swedish Health Care Law (SFS, 1982:763), the PHC system was and still is defined as follows:
Primary health care—as part of inpatient care irrespective of the disease, age, or patient groups—should account for the needs for basic medical treatment, care, prevention and rehabilitation that do not require the medical and technical resources of hospitals, or other special skills (6).
In the 1980s, several large PHCCs were established, each including 10–15 GPs. These were subsequently perceived as difficult to manage and PHCCs gradually became smaller and more independent. In addition, more special-ized registered nurses (RNs) were employed to support and guide patients be-tween medical visits (7). Since 2010, when the Swedish government initiated a freedom of choice system (2008:962) (8) which all of Sweden’s county councils are obligated to follow, people could freely choose their PHCC (i.e., private or public PHCC). Competency requirements for PHCCs to be ap-proved were introduced; these mandated that at least 50% of the GPs must be specialized in general medicine and at least 50% of the RNs must be district RNs. However, the Swedish PHC system has no common definition of the details of assignments, which results in regional differences and the freedom for each county council/region to decide on the organization of primary dia-betes care (9).
Swedish primary diabetes care The Swedish Diabetes Association was established in 1943 and contributed to considerable progress in the development of Swedish diabetes care. In 1948 a proposal was sent to the government by the Swedish Diabetes Association that

13
insulin be free of charge regardless of patient income. The proposal was ac-cepted in 1955, concomitant with the introduction of Swedish health insurance (10). During the second half of the 20th century, treatment of diabetes mellitus in the health-care system gained more interest, which was the start of quality improvement (11). However, diabetes mellitus was first formally recognized as a major public health issue in Italy in 1989 with the St Vincent declaration (12). Representatives from all European countries agreed on the following:
Countries should give formal recognition to the diabetes problem and deploy resources for its solution. Plans for the prevention, identification and treatment of diabetes and in particular its complications […] should be formulated at local, national and European levels. (12, p. 360).
Thus, the developments in the field of diabetes mellitus led to the first com-prehensive international action program for diabetes mellitus being adopted by the WHO and IDF (13). The action program included medical, social, ed-ucational and psychological aspects. After the St. Vincent declaration, the Swedish NBHW reviewed the organization of diabetes care in eight of Swe-den’s county councils. The review identified noteworthy differences in the quality of care. Information from this review contributed to the development of the first national Swedish guidelines for diabetes care in 1996 (11). The Swedish National Diabetes Register (NDR) was also introduced at this time (14).
The National Diabetes Register: a tool for quality assurance In the early 1990s, as a response to the St Vincent declaration, the Swedish Society for Diabetology (Svensk Förening för Diabetologi), with support from the NBHW, initiated the Swedish NDR. The aim was to use the registry as a tool for monitoring and quality control of Swedish diabetes care (15). The first people with diabetes mellitus were registered in 1996. The information re-ported to the registry comprises clinical data, risk factor control and the oc-currence of comorbidities in people with diabetes mellitus. GPs or RNs at PHCCs report each individual’s clinical data to the registry at least once a year (14). All clinical data are reported online or by electronic transmission from individual medical charts (16) and all participants had given their informed consent to be registered in the NDR. The number of registered people with diabetes mellitus who are treated in the PHC setting has increased dramati-cally during the past decade. In 2006, about 80% of all PHCCs reported data to NDR but only 115,000 people (50% of all people with T2DM in Sweden)
14
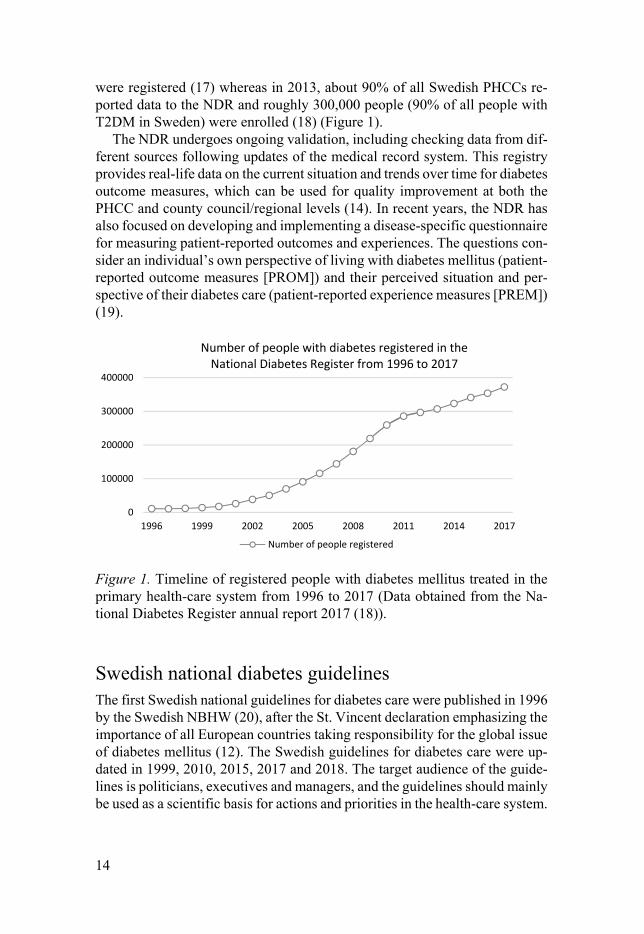
were registered (17) whereas in 2013, about 90% of all Swedish PHCCs re-ported data to the NDR and roughly 300,000 people (90% of all people with T2DM in Sweden) were enrolled (18) (Figure 1).
The NDR undergoes ongoing validation, including checking data from dif-ferent sources following updates of the medical record system. This registry provides real-life data on the current situation and trends over time for diabetes outcome measures, which can be used for quality improvement at both the PHCC and county council/regional levels (14). In recent years, the NDR has also focused on developing and implementing a disease-specific questionnaire for measuring patient-reported outcomes and experiences. The questions con-sider an individual’s own perspective of living with diabetes mellitus (patient-reported outcome measures [PROM]) and their perceived situation and per-spective of their diabetes care (patient-reported experience measures [PREM]) (19).
Figure 1. Timeline of registered people with diabetes mellitus treated in the primary health-care system from 1996 to 2017 (Data obtained from the Na-tional Diabetes Register annual report 2017 (18)).
Swedish national diabetes guidelines The first Swedish national guidelines for diabetes care were published in 1996 by the Swedish NBHW (20), after the St. Vincent declaration emphasizing the importance of all European countries taking responsibility for the global issue of diabetes mellitus (12). The Swedish guidelines for diabetes care were up-dated in 1999, 2010, 2015, 2017 and 2018. The target audience of the guide-lines is politicians, executives and managers, and the guidelines should mainly be used as a scientific basis for actions and priorities in the health-care system.
0
100000
200000
300000
400000
1996 1999 2002 2005 2008 2011 2014 2017
Number of people with diabetes registered in the National Diabetes Register from 1996 to 2017
Number of people registered

15
There are three different types of recommendations. The first type is the rec-ommendations ranked 1–10, which are expected to affect resource allocation in the health-care system, focusing more resources on high priority recom-mendations rather than those with low priority. The second type is those rec-ommendations requiring a greater body of evidence and the third are recom-mendations of inaction. The aim of the guidelines is to assure equal diabetes care for all people with diabetes mellitus (21). At a county council level, the Swedish national guidelines can be translated to regional guidelines for the PHCCs to follow. Each county council has the responsibility of implementing the recommendations provided by the NBWH. However, PHCCs can also cre-ate their own local guidelines (22). Other treatment recommendations for peo-ple with T2DM regarding glucose control (23) and for preventing atheroscle-rosis and heart disease (24) are published by the Swedish Medical Products Agency (Läkemedelsverket).
National perspective of knowledge management The Swedish Association of Local Authorities and Regions (SALAR) is an organization representing local governments of which all of Sweden’s munic-ipalities and county councils/regions are members. Its field of responsibility includes advocating the interests of Sweden’s 290 municipalities and 21 county councils/regions to achieve improved conditions for local and regional self-government (25).
In 2013, Sweden’s health-care regions created knowledge management groups that were tasked with initiating cooperation between the county coun-cils/regions and supporting them with current evidence and indicators of suc-cessful care, and with implementing evidence-based clinical practice. In 2018, the county councils/regions implemented a total of 21 different national pro-grams (the number continues to increase), including their own working group. Diabetes mellitus is included in the national program for endocrine disorders. The task of national program areas and their working groups is to increase knowledge about evidence-based care and quality of care (26). Thus, in 2013, the working group for the national program in endocrinology (i.e., a previous knowledge management group) conducted a benchmarking study for success-ful management of T2DM that identified seven factors relating to different aspects of the organization of primary diabetes care. Success factors 1–3 con-cern the work of PHCCs: 1. A focus on the patient’s targets 2. Using targeted initiatives for persons with poor metabolic control 3. Ensuring that PHCC results are always on the agenda Success factors 4–6 concern the supervisors’ structures, processes and meth-ods at the PHCC:

16
4. Ensuring available knowledge and clear expectations 5. Enabling follow-up and feedback of results 6. Ensuring that the diabetes care area is prioritized with long-term im-
provement initiatives The last success factor describes the overall work of the organization: 7. Ensuring ownership of results and focusing on prevention Results from the benchmarking study suggested that PHCCs operating in ac-cord with these seven success factors performed well (as reported to the Swe-dish NDR) and to a high degree achieved the Swedish national treatment tar-gets for HbA1c levels (27).
Type 2 diabetes mellitus: a heterogeneous disease The prevalence of diabetes mellitus in adults in the total population is expected to increase from 8.4% in 2017 to 9.9% by 2045, with T2DM accounting for 85–90% of all cases (1). In Europe, the prevalence varies from 2.4% to 15% between countries (28) with Sweden in 2013 having a prevalence of 4.8% of the total population including both T2DM and type 1 diabetes mellitus (T1DM) (29).
Several risk factors for the development of T2DM are known, which in-clude a combination of a family history of T2DM (30), older age and sedentary lifestyle (31, 32). T2DM is a chronic disease that occurs when the pancreas produces an insufficient amount of the hormone insulin or when the body re-sponds ineffectively to the insulin it produces. Insulin regulates the blood glu-cose level and controls the transformation of glucose into energy. Lack of in-sulin or unresponsiveness to insulin leads to a high blood glucose level (33). Treatment for T2DM includes adopting a healthy diet in combination with increased physical activity. People with T2DM are usually treated with oral hypoglycaemic agents (OHAs) if dietary changes and physical activity have failed. Insulin deficiency with worsening blood-glucose levels over time re-quires continuous blood glucose-lowering treatment (34). Metformin is the first-line drug prescribed to people with diabetes mellitus. However, if normal glycaemic levels are not reached with metformin, insulin and other glucose lowering drugs should be prescribed (21). The heterogeneity of T2DM was reported in a recent cluster analysis (35) which identified four subgroups of people with T2DM, based on different patient characteristics and risks of com-plications. This new sub-stratification can identify people at elevated risk of complications and thereby help GPs tailor early preventative actions and treat-ment.

17
HbA1c and modifiable risk factors The HbA1c level reflects the blood glucose level during the past 6 to 8 weeks. Monitoring of HbA1c in treatment is the gold standard because of the body of evidence showing that HbA1c as a predictor of micro- and macrovascular complications (36) and all-cause mortality (37). International (38) as well as national guidelines (21) promote individualized targets for HbA1c to maxim-ize the benefits while reducing the risks. The Swedish Medical Products Agency describes the importance of adjusting the treatment target based on age, disease duration and comorbidities (23).
In Sweden, the general treatment goal is an HbA1c level 52 mmol/mol (otherwise called controlled HbA1c) for people with T2DM. An additional treatment goal is that not more than 10% of people with T2DM should have an HbA1c level of 70 mmol/mol (uncontrolled HbA1c or hyperglycaemia) (39). In 2017, about 10% of people with T2DM living in Sweden were re-ported to have an HbA1c level of 70 mmol/mol. However, the proportion of people with T2DM who have uncontrolled HbA1c varies depending on county council/region, ranging from 7% to 14%. On a positive note, the trend of peo-ple with HbA1c 70 mmol/mol has decreased during recent years. Therefore, high-risk people with elevated HbA1c levels are common, but they are a mi-nority of patients. More than half the people with T2DM are > 60 years old with an HbA1c level of 52 mmol/mol, and are therefore likely to be rela-tively healthy (18).
The importance of multifactorial risk-factor control People with T2DM with hyperglycaemia are at increased risk of developing microvascular (i.e., nephropathy, neuropathy and retinopathy) and macrovas-cular (i.e., coronary artery disease and stroke) (36, 40) complications and in-creased risk of early death (41, 42) compared with the general population.
Micro- and macrovascular complications and all-cause mortality The UK Prospective Diabetes Study conducted a randomized follow-up study with 3642 persons newly diagnosed with T2DM. The study found that each percentage point of decrease in the HbA1c level was associated with a risk reduction of 37% for microvascular complications (36). Major randomized controlled trials (RCTs) have extensively evaluated the effects of uncontrolled glycaemia on microvascular, macrovascular and death endpoints; the Action to Control Cardiovascular Risk in Diabetes (ACCORD) (43, 44), Action in Diabetes and Vascular Disease-Preterax and Diamicron Modified Release Controlled Evaluation (ADVANCE) (45) and, Veterans Affairs Diabetes Trial (VADT) (46). The body of evidence from observational studies and RCTs on

18
the effects of HbA1c levels ≤ 52 mmol/mol is inconsistent with regarding car-diovascular (CVD) complications and death (47, 48). However, the Steno-2 study found short and long-term effects of intensified multifactorial risk factor intervention compared with usual care, including a reduced risk of (CVD) and death from CVD causes (49-51). In addition, a recent Swedish cohort study of 271,174 people with T2DM found a step-wise decreased risk of CVD compli-cations and mortality compared with the general population in participants who met the targets for five risk-factor variables (HbA1c level, systolic and diastolic blood pressure, presence of micro- and macro albuminuria, smoking and low-density lipoprotein cholesterol levels) (37).
People with T2DM have a two- to four-times higher risk of early death compared with the general population (52, 53). Globally, diabetes mellitus is the eighth leading cause of death and it was estimated in 2012 that 3.5 million deaths were directly caused by diabetes melliuts or other related complications (3). The risk of early death from any cause may be increased with younger age, impaired glycaemic control and severe renal complications (41). Swedish registry data show that the incidence of death from CVD decreased from 1998 to 2014 (53). Similar trends have been identified in North America and Europe (54-56).
Health expenditure, socio-economic status and ethnicity T2DM is also a large economic burden because of the costs of health services and reduced productivity or inability to work. Expenditure related to diabetes mellitus is estimated to exceed 12% of the global health budget (57) and most of the costs are related to treatment of complications (58). In Sweden, the total health-care costs for glucose-lowering drug treatment of people with T2DM in the PHC increased from 228€ in 2006 to 405€ million in 2014 (59).
Although social welfare overall has improved, people of lower socio-eco-nomic status have been negatively affected compared with people of high so-cio-economic status (60). This can be explained by socio-economic disad-vantages such as unemployment or financial hardship. Poor education may also impact on the adaptation of a healthy lifestyle (61). Socio-economic sta-tus includes several dimensions such as income, education, occupation, mari-tal status and ethnicity. These dimensions act both independently and jointly (62). Socio-economic status has been found to be a strong predictor of diabe-tes-related complications and all-cause mortality. A registry-based Swedish observational study of 217,364 people with T2DM showed that people who were married/cohabiting, had high education and had high income were at lower risk of CVD complications and early death (63). Over recent decades global migration to Western societies has increased, leading to a more ethni-cally diverse population (64). Ethnic differences in T2DM are recognized as

19
a predictor of glycaemic control and all-cause mortality: non-Western popu-lations display poorer glycaemic control compared with native Swedes (65).
Care for people with type 2 diabetes mellitus The care for people with T2DM in Western countries is mainly addressed within the PHC system (4). Even though most countries have national guide-lines for diabetes mellitus, the organization of diabetes care differs between (66) and within (22, 67, 68) countries. Today, caring for people with T2DM has expanded from including only GPs to involving RNs in the main work-force (69). In Sweden, PHCCs have diabetes-responsible GPs and RNs avail-able in-house who have the overall responsibility for the care and treatment of people with T2DM. In general, people with T2DM visit the RNs and GPs once a year for medical check-ups (such as annual screening for albuminuria; meas-urements of HbA1c and systolic blood pressure are performed more fre-quently) and individual counselling. The PHCCs can also include other health-care professionals such as chiropodists, social workers, physiotherapists, psy-chologists and dietitians (22).
Quality of care – an explanation of the model Continuous quality improvement is today a central part of the PHC system. It is no longer enthusiastic volunteers who co-ordinate quality improvement work, but instead it is an integrated part of the daily routine. The meaning of improving the quality of care is to support accountability of the health-care professionals and managers, assure that resources are used efficiently, dimin-ish medical errors, maximize effective care and improve patient outcomes (70).
Identification of quality indicators is important for providing high quality and safe diabetes care. Thus, the Donabedian model (71) is often used as a theoretical framework to explain relationships between quality of care and pa-tient outcomes. This model is divided into three dimensions: structure, process and outcomes, which may be seen as either independent or interrelated. Struc-tural indicators are related to conditions in the organizational aspects of care, equipment and personnel resources for delivering the care required. Process indicators relate to actions of health-care professionals or the organization, such as number of consultations, medical check-ups, and laboratory tests. In general, the required actions by health-care professionals are usually described in the guidelines. The last dimension is patient outcomes, which contains all the effects of health care on patients and can be measured as changes in health status, knowledge or patient satisfaction. Structure and process indicators are often used to measure the impact on patient outcomes. Consequently, good
20
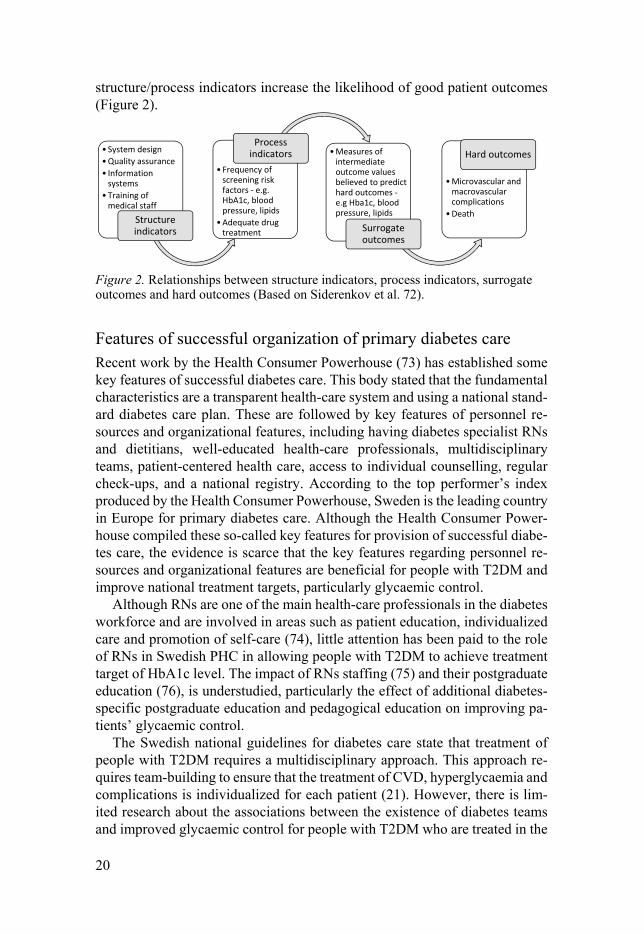
structure/process indicators increase the likelihood of good patient outcomes (Figure 2).
Figure 2. Relationships between structure indicators, process indicators, surrogate outcomes and hard outcomes (Based on Siderenkov et al. 72).
Features of successful organization of primary diabetes care Recent work by the Health Consumer Powerhouse (73) has established some key features of successful diabetes care. This body stated that the fundamental characteristics are a transparent health-care system and using a national stand-ard diabetes care plan. These are followed by key features of personnel re-sources and organizational features, including having diabetes specialist RNs and dietitians, well-educated health-care professionals, multidisciplinary teams, patient-centered health care, access to individual counselling, regular check-ups, and a national registry. According to the top performer’s index produced by the Health Consumer Powerhouse, Sweden is the leading country in Europe for primary diabetes care. Although the Health Consumer Power-house compiled these so-called key features for provision of successful diabe-tes care, the evidence is scarce that the key features regarding personnel re-sources and organizational features are beneficial for people with T2DM and improve national treatment targets, particularly glycaemic control.
Although RNs are one of the main health-care professionals in the diabetes workforce and are involved in areas such as patient education, individualized care and promotion of self-care (74), little attention has been paid to the role of RNs in Swedish PHC in allowing people with T2DM to achieve treatment target of HbA1c level. The impact of RNs staffing (75) and their postgraduate education (76), is understudied, particularly the effect of additional diabetes-specific postgraduate education and pedagogical education on improving pa-tients’ glycaemic control.
The Swedish national guidelines for diabetes care state that treatment of people with T2DM requires a multidisciplinary approach. This approach re-quires team-building to ensure that the treatment of CVD, hyperglycaemia and complications is individualized for each patient (21). However, there is lim-ited research about the associations between the existence of diabetes teams and improved glycaemic control for people with T2DM who are treated in the
• System design
• Quality assurance
• Information systems
• Training of medical staff
Structure indicators
• Frequency of screening risk factors - e.g. HbA1c, blood pressure, lipids
• Adequate drug treatment
Process indicators • Measures of
intermediate outcome values believed to predict hard outcomes -e.g Hba1c, blood pressure, lipids
Surrogate outcomes
• Microvascular and macrovascular complications
• Death
Hard outcomes
21
PHC system (77). In addition, T2DM requires daily self-management by the person to handle their own health. The task of self-management can be com-plicated, and necessitates confidence by the patient and support from health-care professionals (78). Therefore, the participation of the person in setting and negotiating their treatment targets is essential to achieve these (79). Group education programs might also be made available in an attempt to provide support to people with T2DM. Existing research (80, 81) recognizes the criti-cal role of group education programs in improving the participant’s overall knowledge about the disease and glycaemic control. Other recognized facili-tators of the organization of diabetes care are call–recall systems (82) and us-ing national registries to promote individualized appointments (83).
Organization of diabetes care – a complicated matter The past thirty years since the St. Vincent declaration have seen increasingly rapid advances in the field of quality improvement programs that aim to im-prove care for people with T2DM in a primary care setting. In most cases these programs are referred to as multifaceted interventions because they include quality improvement work that targets both health-care professionals and the organizational context. These multifaceted interventions often include aspects of providing individualized treatment, including patient education and profes-sional development of health-care professionals by means of additional post-graduate education or training, as well as organizational features such as using a call–recall system.
The past decade has seen a rapid growth in the number of systematic re-views assessing the impact of the organization of diabetes care on patient out-comes. At the beginning of the 21st century, a Cochrane review by Renders et al. (84) evaluated the effects on HbA1c levels of diverse interventions in the work of health-care professionals or the structure of care. The review included 19 studies assessing HbA1c as patient outcome in PHC, outpatient and com-munity settings, and found that interventions including postgraduate education for health-care professionals in combination with computerized reminders and feedback can improve process outcomes. However, it remained unclear whether these interventions improved HbA1c levels. In 2012, Tricco et al. (85) published a systematic review and meta-analysis assessing the effectiveness of quality improvement strategies for improving HbA1c levels in people treated in the outpatient setting, which included 48 cluster RCTs and 38,664 people with either T1DM or T2DM. The authors reported a mean difference of 0.37% (95% confidence interval [CI] (–0.45;–0.28) reduction in HbA1c af-ter a median follow-up of twelve months. The most effective quality improve-ment strategies included team changes, case management, patient education and self-management, with the largest impact being on those with an HbA1c level > 73 mmol/mol.
22
A previous systematic review by Seidu et al. (86) evaluated the effect on patients’ glycaemic control of interventions targeting PHC- or community-based professionals; the review included 39,439 people with T1DM or T2DM from 30 studies. The authors found that multifaceted interventions with mul-tiple professionals were more effective for improving glycaemic control than interventions targeting single professionals. Similar results were found in a review by Seitz et al. (87) in which the majority of included studies were based on multifaceted interventions. However, these interventions included changes involving both the health-care professional (education, reminder system and feedback) and the organization (shared care, case management, patient-ori-ented care, changes in medical record system), sometimes in combination with patient-centred care. However, regardless of the type of intervention, multi-faceted interventions had more impact than single interventions on reducing HbA1c levels. Finally, an overview of systematic reviews by Worswick et al. (88) showed that most of the focus has been on patient education, followed by telemedicine, then broad-based reviews (multifaceted interventions), health-care professional changes, and lastly, organizational changes.
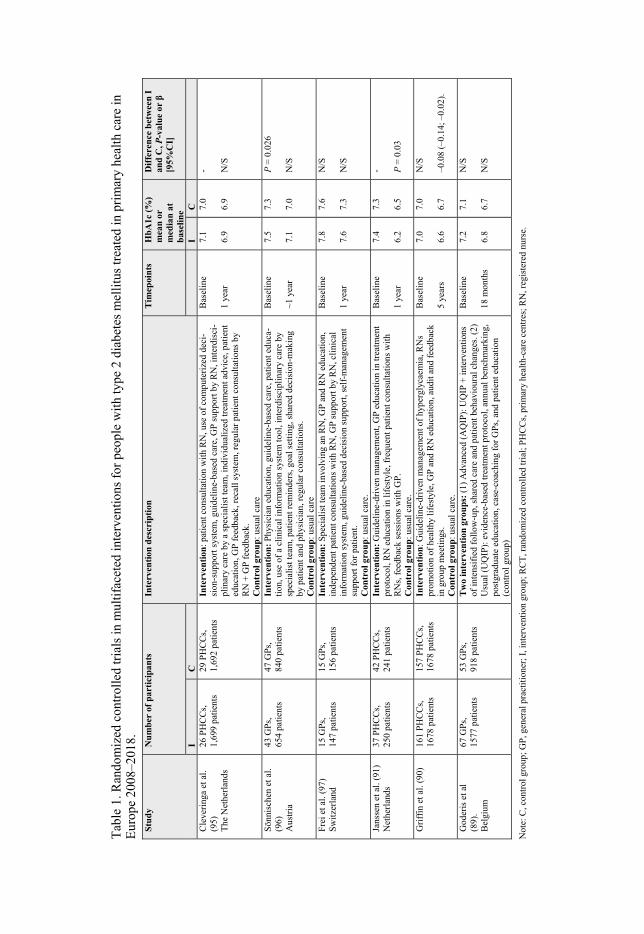
Although extensive research has assessed associations between the organ-ization of diabetes care and HbA1c levels, the PHC system differs between countries, making it difficult to draw any firm conclusions. Therefore, in an attempt to provide a consensus of the available evidence, a summary of the RCTs involving multifaceted interventions for people with T2DM treated in the PHC setting in Europe 2008–2018 is presented in Table 1, as a comple-ment to these reviews (84-88). The interventions have comprised multifaceted interventions including changes in both professionals and the organization. In four of the studies, no significant differences were found between the inter-vention and control groups. One study, by Goderis et al. (89) showed signifi-cant within-group reductions in HbA1c level of 0.4% (95% CI, –0.4 to –0.3) and, although no significant differences were found between groups. An RCT by Griffin et al. (90) conducted in Denmark, the Netherlands and in the UK in the PHC setting screened patients without known T2DM and randomly as-signed them to routine diabetes care or a multifactorial approach. It showed a slightly decreased HbA1c level in the intervention group after five years. In addition, Janssen et al. (91) reported significant effects of an intervention on HbA1c level, however, their RCT was involved in the same cohort as that reported by Griffin et al. The nature of the intervention differs considerably between studies, which make it difficult to draw firm conclusions, but this is consistent with the findings from previous reviews by Tricco et al. (85) and Seidu et al. (86).
23
All-cause mortality in relation to organization of diabetes care A systematic review of diabetes self-management education that included 42 studies and 13,017 people with T2DM showed a decreased risk of early death when self-management education was implemented (92). A multicentre RCT by Krag et al. (93) assessed gender differences in all-cause mortality after 6 years of people with T2DM receiving structured personal care, including 970 patients. The structured personal care included regular follow-up, individual-ized goal setting and postgraduate education for GPs. A reduced risk of early death was found for women who received personal structured care compared with those who received routine care, however, no significant differences were found for men. Other RCTs comprising multifaceted interventions have shown no associations with all-cause mortality (90, 94). However, no previous study has explored how an optimal PHC should be organized to reduce the risk of early death in people with T2DM in a Swedish context.
Tab
le 1
. Ran
dom
ized
con
trol
led
tria
ls in
mul
tifa
cete
d in
terv
entio
ns f
or p
eopl
e w
ith ty
pe 2
dia
bete
s m
elli
tus
trea
ted
in p
rim
ary
heal
th c
are
in
Eur
ope
2008
–201
8.
Stu
dy
Nu
mb
er o
f p
arti
cipa
nts
In
terv
enti
on d
escr
ipti
on
Tim
epoi
nts
H
bA
1c (
%)
mea
n o
r
med
ian
at
bas
elin
e
Dif
fere
nce
bet
wee
n I
an
d C
, P-v
alu
e or
β
[95%
CI]
I C
I C
Cle
veri
nga
et a
l. (9
5)
The
Net
herl
ands
26 P
HC
Cs,
1,
699
pati
ents
29 P
HC
Cs,
1,
692
pati
ents
In
terv
enti
on: p
atie
nt c
onsu
ltat
ion
wit
h R
N, u
se o
f co
mpu
teri
zed
deci
-si
on-s
uppo
rt s
yste
m, g
uide
line-
base
d ca
re, G
P su
ppor
t by
RN
, int
erdi
sci-
plin
ary
care
by
a sp
ecia
list
team
, ind
ivid
uali
zed
trea
tmen
t adv
ice,
pat
ient
ed
ucat
ion,
GP
fee
dbac
k, r
ecal
l sys
tem
, reg
ular
pat
ient
con
sult
atio
ns b
y R
N +
GP
fee
dbac
k.
Con
trol
gro
up:
usu
al c
are
Bas
elin
e 1
year
7.1
6.9
7.0
6.9
- N/S
Sön
nisc
hen
et a
l. (9
6)
Aus
tria
43 G
Ps,
654
pati
ents
47 G
Ps,
840
pati
ents
Inte
rven
tion
: Ph
ysic
ian
educ
atio
n, g
uide
line
-bas
ed c
are,
pat
ient
edu
ca-
tion
, use
of
a cl
inic
al in
form
atio
n sy
stem
tool
, int
erdi
scip
lina
ry c
are
by
spec
iali
st te
am, p
atie
nt r
emin
ders
, goa
l set
ting
, sha
red
deci
sion
-mak
ing
by p
atie
nt a
nd p
hysi
cian
, reg
ular
con
sult
atio
ns.
Con
trol
gro
up:
usu
al c
are
Bas
elin
e ~1
yea
r
7.5
7.1
7.3
7.0
P =
0.0
26
N/S
Fre
i et a
l. (9
7)
Sw
itze
rlan
d
15 G
Ps,
147
pati
ents
15 G
Ps,
156
pati
ents
In
terv
enti
on:
Spec
iali
st te
am in
volv
ing
an R
N, G
P a
nd R
N e
duca
tion
, in
depe
nden
t pat
ient
con
sult
atio
ns w
ith R
N, G
P su
ppor
t by
RN
, cli
nica
l in
form
atio
n sy
stem
, gui
deli
ne-b
ased
dec
isio
n su
ppor
t, se
lf-m
anag
emen
t su
ppor
t for
pat
ient
. C
ontr
ol g
rou
p: u
sual
car
e.
Bas
elin
e 1
year
7.8
7.6
7.6
7.3
N/S
N
/S
Jans
sen
et a
l. (9
1)
Net
herl
ands
37
PH
CC
s,
250
pati
ents
42
PH
CC
s,
241
pati
ents
In
terv
enti
on:
Gui
deli
ne-d
rive
n m
anag
emen
t, G
P e
duca
tion
in tr
eatm
ent
prot
ocol
, RN
edu
catio
n in
life
styl
e, f
requ
ent p
atie
nt c
onsu
ltat
ions
with
R
Ns,
fee
dbac
k se
ssio
ns w
ith
GP
. C
ontr
ol g
rou
p: u
sual
car
e.
Bas
elin
e 1
year
7.4
6.2
7.3
6.5
-
P =
0.0
3
Gri
ffin
et a
l. (9
0)
161
PH
CC
s,
1678
pat
ient
s 15
7 P
HC
Cs,
16
78 p
atie
nts
In
terv
enti
on: G
uide
line-
driv
en m
anag
emen
t of
hype
rgly
caem
ia, R
Ns
prom
otio
n of
hea
lthy
life
styl
e, G
P a
nd R
N e
duca
tion
, aud
it a
nd f
eedb
ack
in g
roup
mee
ting
s.
Con
trol
gro
up:
usu
al c
are.
Bas
elin
e 5
year
s
7.0
6.6
7.0
6.7
N/S
–0
.08
(–0.
14; –
0.02
).
God
eris
et a
l (8
9).
Bel
gium
67 G
Ps,
1577
pat
ient
s
53 G
Ps,
918
pati
ents
T
wo
inte
rven
tion
gro
ups
: (1
) A
dvan
ced
(AQ
IP):
UQ
IP +
inte
rven
tion
s of
inte
nsif
ied
follo
w-u
p, s
hare
d ca
re a
nd p
atie
nt b
ehav
iour
al c
hang
es. (
2)
Usu
al (
UQ
IP):
evi
denc
e-ba
sed
trea
tmen
t pro
toco
l, an
nual
ben
chm
arki
ng,
post
grad
uate
edu
catio
n, c
ase-
coac
hing
for
GPs
, and
pat
ient
edu
cati
on
(con
trol
gro
up)
Bas
elin
e 18
mon
ths
7.2
6.
8
7.1
6.7
N/S
N
/S
Not
e: C
, con
trol
gro
up; G
P, g
ener
al p
ract
itio
ner;
I, i
nter
vent
ion
grou
p; R
CT
, ran
dom
ized
con
trol
led
tria
l; P
HC
Cs,
pri
mar
y he
alth
-car
e ce
ntre
s; R
N, r
egis
tere
d nu
rse.

25
Rationale
The gap between ideal and actual care is not surprising, given the complex nature of T2DM. Continuous evaluation of the care of people with T2DM is essential. Very little is currently known about the hallmarks of successful di-abetes care in the Swedish PHC, particularly because no recent studies have been published in this field. Most people with T2DM are treated within the PHC system, and given the increasing prevalence of T2DM, the PHC system is facing serious challenges in providing high-quality and equitable care to all people with T2DM.
In 2006, a nationwide survey was conducted in the Swedish PHC system, aiming to address personnel resources and organizational features. The survey included more than 70% of Swedish PHCCs. Further, in 2010, new national guidelines were published for Swedish diabetes care. However, no national survey has been conducted to identify whether any changes have been made in Swedish diabetes care since these guidelines were introduced. The revised version of the national guidelines was published in 2015. Therefore, we con-sidered it important to investigate changes in diabetes care before implemen-tation of these new guidelines. In addition, in 2013 approximately 90% of all people diagnosed with T2DM were registered in the NDR.
It has become clear that identifying the characteristics of successful diabe-tes care is a daunting task. There is still very little scientific understanding of Swedish primary diabetes care and its associations with improved HbA1c lev-els or all-cause mortality. Far too little attention has been paid to consideration of important confounding factors at the PHCC and individual level, including socio-economic status and comorbidities. Sweden is one of the leading coun-tries in Europe for primary diabetes care and is therefore of interest. This thesis will provide an addition to published RCTs in the form of information about real-life clinical practice, to better understand the benefits of the organization of diabetes care in the Swedish PHC setting.
26
Aims
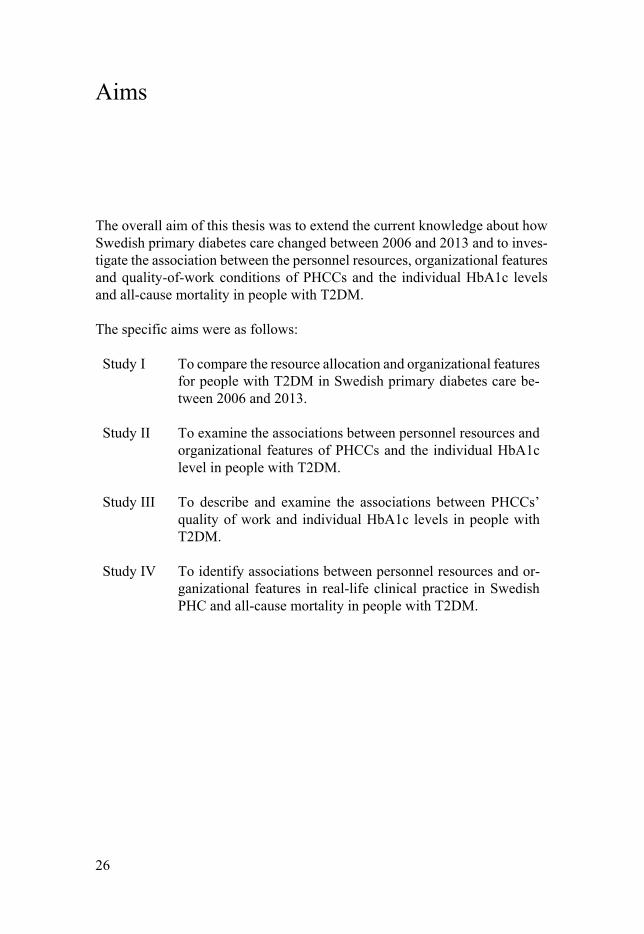
The overall aim of this thesis was to extend the current knowledge about how Swedish primary diabetes care changed between 2006 and 2013 and to inves-tigate the association between the personnel resources, organizational features and quality-of-work conditions of PHCCs and the individual HbA1c levels and all-cause mortality in people with T2DM. The specific aims were as follows:
Study I
To compare the resource allocation and organizational features for people with T2DM in Swedish primary diabetes care be-tween 2006 and 2013.
Study II
To examine the associations between personnel resources and organizational features of PHCCs and the individual HbA1c level in people with T2DM.
Study III
To describe and examine the associations between PHCCs’ quality of work and individual HbA1c levels in people with T2DM.
Study IV
To identify associations between personnel resources and or-ganizational features in real-life clinical practice in Swedish PHC and all-cause mortality in people with T2DM.
27
Methods
The present thesis is a compilation of four studies presented within a frame-work. It is based on my licentiate thesis titled “The organisation of diabetes care for persons with type 2 diabetes mellitus: A nationwide cross-sectional study in Swedish primary health care”, which was published in 2017 (98), and that included two of the studies (I and II) described in this compilation.
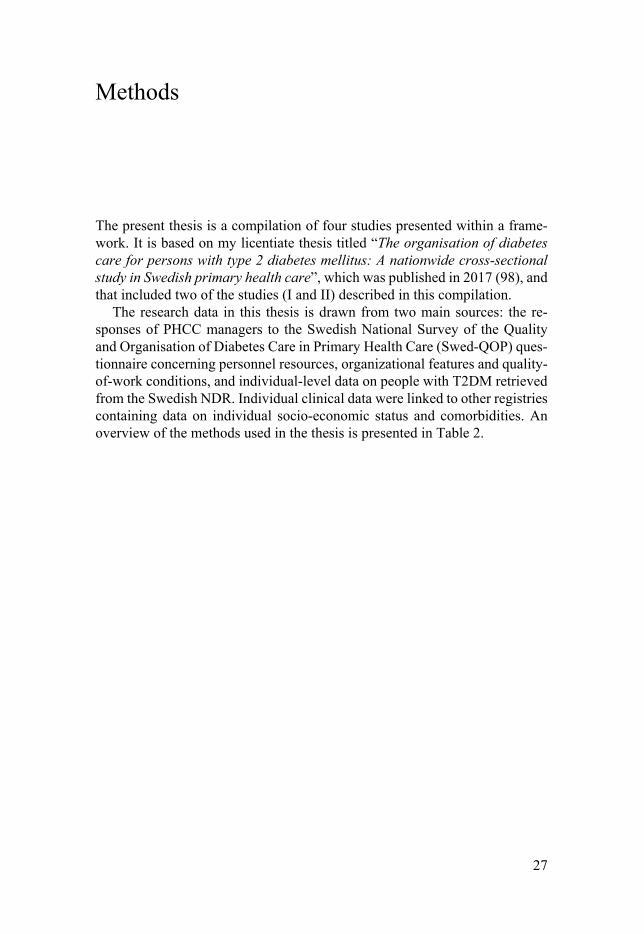
The research data in this thesis is drawn from two main sources: the re-sponses of PHCC managers to the Swedish National Survey of the Quality and Organisation of Diabetes Care in Primary Health Care (Swed-QOP) ques-tionnaire concerning personnel resources, organizational features and quality-of-work conditions, and individual-level data on people with T2DM retrieved from the Swedish NDR. Individual clinical data were linked to other registries containing data on individual socio-economic status and comorbidities. An overview of the methods used in the thesis is presented in Table 2.
28
Table 2. Overview of the methods used in this thesis.
Study I Study II Study III Study IV D
esig
n
Longitudinal Cross-sectional Registry-based cohort
Par
tici
pan
ts 684 (74.3%) PHCCs in
2006 and 880 (76.4%) in 2013.
People with T2DM (n = 230,958) attending 846 PHCCs.
People with T2DM (n = 187,570) attending 787 PHCCs.
Dat
a co
llec
tion
Managers of PHCCs re-sponding to the Swed-QOP questionnaire in 2006 and 2013.
PHCC-level data from the Swed-QOP questionnaire. Individual clini-cal data from the Swedish NDR in 2013, linked to individual-level data on socio-economic status and comorbidities.
PHCC-level data from the Swed-QOP questionnaire. Individual-level data from the Swedish NDR in 2013, linked to individual-level data on socio-economic sta-tus and comorbidities. All-cause mortality was re-trieved from the Swedish Population Register.
Sta
tist
ical
an
alys
is Bootstrap procedures for
tests of differences utiliz-
ing Pearson’s 2 test for categorical data and the Mann–Whitney test for ordinal, discrete and con-tinuous data.
GEE linear re-gression models.
Explanatory fac-tor analysis and GEE linear re-gression models.
Unadjusted and adjusted hi-erarchical Cox regression models.
Notes: GEE, generalized estimating equations; NDR, National Diabetes Register; PHCC, Primary health-care centres; Swed-QOP, Swedish National Survey of the Quality and Organisation of Diabetes Care in Primary Health Care.

29
Setting and study design All studies included in this thesis were conducted in the setting of the Swedish PHC. The longitudinal cross-sectional design of Study I involved all Swedish PHCC that responded to the Swed-QOP questionnaire in 2006 and 2013. Stud-ies II and III were cross-sectional studies using PHCC-level data for 2013 from the Swed-QOP questionnaire and individual-level clinical data from 2013 for people with T2DM reported in the Swedish NDR. The registry-based cohort design of Study IV involved PHCC-level data from 2013 and individ-ual-level clinical data reported in the NDR in 2013 for people with T2DM who were followed until death, emigration or the end of follow-up.
Participants In Study I, 684 (74.3%) of 921 eligible PHCCs responded to the Swed-QOP questionnaire in 2006. In 2013, 880 (76.4%) of 1152 eligible PHCCs re-sponded. Studies II and III included 846 (74.3%) of the 880 responding PHCCs, because PHCCs that had reported no data to the NDR (n = 11) or had reported less than 30 people with T2DM to NDR (n = 23) (i.e. deemed eligible to perform statistical analyses) were excluded. A total of 290,808 people with T2DM were eligible to participate. People with T2DM were excluded if they were registered at non-responding PHCCs (n = 59,461) or were registered at PHCCs reporting fewer than 30 people with T2DM (n = 389). The final sam-ple in Studies II and III consisted of 846 PHCCs and 230,958 people with T2DM.
Participants in Study IV included 787 PHCCs and 187,570 people with T2DM who med the criterion of having complete cases for all PHCC varia-bles. A flow chart describing the process of inclusion of PHCCs and people with T2DM in the studies comprising this thesis is presented in Figure 3.

Fig
ure
3. O
verv
iew
of
the
incl
usio
n pr
oces
s of
the
PH
CC
s an
d pe
ople
wit
h ty
pe 2
dia
bete
s m
elli
tus
from
the
Sw
edis
h N
atio
nal
Dia
bete
s R
egis
ter.

31
Data collection procedure In Study I, the data for 2006 were collected during January–August, 2007, and those for 2013 during January–June, 2014, by sending the Swed-QOP ques-tionnaire to PHCC managers. In 2006, the addresses of PHCC managers were identified through the health and medical information service address registry; in 2013, email addresses were obtained from the county councils/regions health-care choices registries. In 2006, paper-based questionnaires were sent to all PHCC managers whereas for the 2013 data collection, a combination of web- and paper-based questionnaires was used. The web-based questionnaire was accessed through the web-based survey program Artologik Software for the Web: Survey and Report (Artisan Global Media, Växjö, Sweden). In total, three reminders were sent in 2006 and four reminders in 2013. All managers were encouraged to answer the questionnaire together with personnel respon-sible for the people with T2DM. The PHCC-level data collected in 2013 for Study I were also used for Studies II, III and IV.
Demographic and clinical data for people with T2DM were retrieved from the Swedish NDR in 2013 and linked to individual data on socio-economic status and comorbidities from the Longitudinal Integration Database for Health Insurance and Labour Market Studies (LISA) and National Patient Register (NPR), respectively. People with T2DM identified from the NDR were linked to the PHCCs’ Swed-QOP data using the unique health-care ad-dress register identity number (HSA-ID) of each PHCC. These HSA-IDs were obtained from SALAR and verified by each of Sweden’s county councils/re-gions. Individual-level data were linked using Swedish personal identification numbers. For Study IV, the participants were followed up through the Swedish population register from each individual’s last registration reported in the NDR in 2013 until death, emigration or end of follow-up at 30 January 2018.
Data sources Swed-QOP questionnaire All studies in this thesis used the Swed-QOP questionnaire to address ques-tions regarding the personnel resources, organizational features and quality-of-work conditions of the PHCCs. The Swed-QOP questionnaire was created based on a survey of asthma care in Sweden (99) and previous studies con-ducted in the United Kingdom regarding the organization of diabetes care (100, 101) and, for the 2013 version, a qualitative benchmarking study con-ducted by SALAR (27). A reliability test of the Swed-QOP questionnaire was conducted in 2006 that included 10 RNs responsible for diabetes care and 10 PHCC managers at 10 PHCCs in the county of Västmanland. The results
32
showed a correlation between –0.316 and +1.0 and questions with low relia-bility were subsequently adjusted and instructions made clearer (22).
For Study I, some minor changes were made in the questionnaire between 2006 and 2013. Differences in the questionnaire between the two years in-volved changes in the questions about patient education, which were open-ended in 2006 but were changed to closed-answer questions in 2013 based on qualitative content analysis of the answers from 2006 (22). The 2006 question about medical check-ups of people with T2DM undergoing dietary/OHA treatment was constructed as one question while in 2013 medical check-ups of people with T2DM having diet/OHA treatment were split into two ques-tions. Answers to the question about medical check-ups of people with T2DM undergoing dietary and OHA treatment in 2013 were merged into single an-swer in order to make the two years comparable. Study III aimed to examine the associations between the PHCCs’ quality-of-work conditions and individ-ual HbA1c levels in people with T2DM. Thus, 21 questions about quality-of-work conditions, addressing SALAR’s seven quality-of-work features, were included in the Swed-QOP questionnaire after being face-validated. Details of the variables from the questionnaire used in all studies are listed in Table 3.

33
Table 3. Overview of questions included in each study.
Variable Study
I II III IV
List size of the PHCC X X X X Number of listed people with T2DM X X X X Number of listed patients/WTE GPs X Number of WTE RNs/500 people with T2DM assigned for diabetes care X X X X Number of WTE GPs/500 people with T2DM X X X Diabetes-responsible RN, (yes/no) X X X X Diabetes-responsible GP, (yes/no) X X X X Other professionals (chiropodists, social workers, physiotherapists, psychologists or dietitians) in-house or outside the PHCC (yes/no)
X
Lengths of visits to RNs and GPs (minutes) X X X X Number of diabetes-educated RNs (0–5) X X X RNs’ mean number of ECTS credits for diabetes-specific and or pedagogic education X RNs’ mean number of ECTS credits for diabetes-specific education X X X RNs’ mean number of ECTS credits for pedagogic education X X X Have and use regional and/or local guidelines (yes/no) X X Routines for medical check-ups for HbA1c, weight, WC, lipids, blood pressure, albuminuria and foot examinations for persons with dietary/OHAs or insulin treatments (≥ 2 times per year/once a year/every other year or less frequently/never/almost never)
X
Call–recall system for RNs and GPs (yes/no) X X X X Computerized system/manual X X Based on the persons’ needs/standardized system X X
System checking that patients participated in visits to RNs and GPs (yes/no) X X X X Diabetes team including RNs and GPs (yes/no) X X X How individual counselling is provided: checklist driven/based on persons’ needs/not specified X Group education program (yes/no) X X X X How group education in provided: pre-planned content/based on persons’ needs/not specified X Discussing treatment targets with persons with T2DM (yes/no) X RN/GP/person with T2DM participating in setting treatment targets (yes/no) X X X X Goal-oriented drug therapy based on clear treatment stages (yes/no/do not know) X Clear strategy with interventions targeted to people with poor outcomes (yes/no/do not know) X Common meetings regarding diabetes guidelines for all healthcare professionals (yes/no/do not know)
X
Frequent dialogue between PHCC management and health-care professionals about PHCCs re-sults (yes/no/do not know)
X
The health-care professionals are informed about PHCC results (yes/no/do not know) X County council/region continuously reports results from NDR to PHCC (yes/no/do not know) X County council/region uses NDR-results for quality of dialogue (yes/no/do not know) X County council/region internally reports NDR results concerning all PHCCs (yes/no/do not know)
X
Culture of following guidelines (yes/no/do not know) X Focusing on prevention of diabetes complications (yes/no/do not know) X Follow–up strategy for people with poor outcome (yes/no) X Responsibility of quality and results for people with diabetes (yes/no) X Political priority of diabetes care (yes/no) X Having conducted quality improvement work during several years (yes/no) X
Notes: ECTS, European Credit Transfer Accumulation System; GP, general practitioner; OHA, oral hypoglycaemic agent; PHCC, primary health-care centres; RN, registered nurse; Swed-QOP, Swedish National Survey of the Quality and Organisation of Diabetes Care in Primary Health Care; T2DM, type 2 diabetes mellitus; WC, waist circumference; WTE, whole-time equivalent.
34
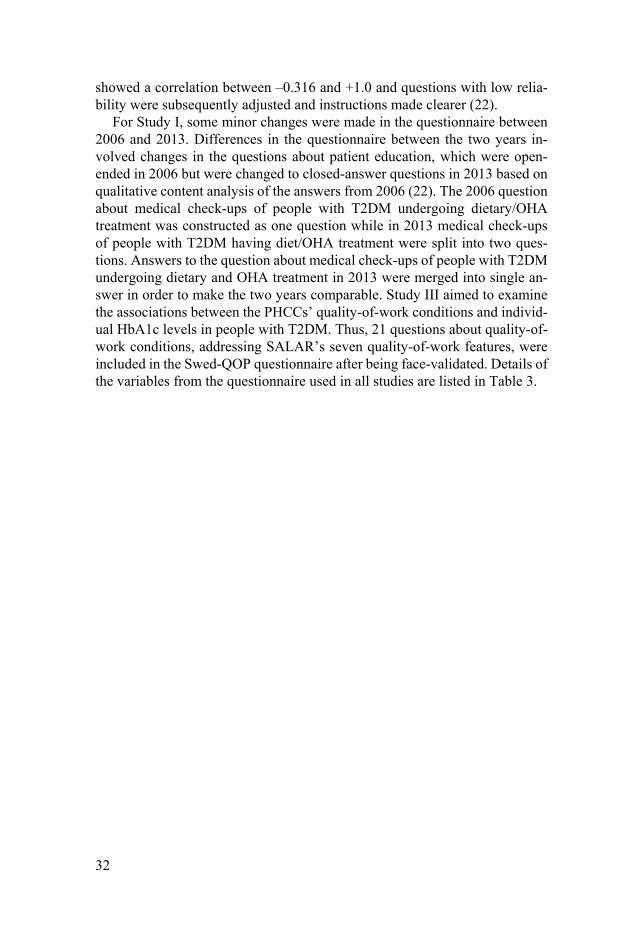
Registries Four nationwide registries were used in this thesis to obtain individual-level data. For Studies II, III and IV, the NDR provided data on demographics and clinical data, the NPR provided data on comorbidities and the LISA provided data on socio-economic status. In Study IV, data on all-cause mortality and emigration date were retrieved from the Swedish population register. An over-view of the included registries and some of the data extracted from each reg-istry is presented in Figure 4.
*Longitudinal Integration Database for Health Insurance and Labour Market Studies (LISA)
Figure 4. Overview of registers and some of the data used in this thesis.
National Diabetes Register The NDR is maintained by the Västra Götaland Centre for Registries and de-mographics, clinical and lifestyle data for people with T2DM were obtained from the NDR. The definition of T2DM used was the diagnosis based on clin-ical assessment by a physician that was reported to the NDR.
Demographic data collected were: age (years), sex (male/female) and du-ration of diabetes (years). Clinical data included HbA1c level (mmol/mol), systolic blood pressure (mmHg), diastolic blood pressure (mmHg), body mass index (BMI; kg/m2), total cholesterol (mmol/l), triglycerides (mmol/l), low-density lipoprotein (mmol/l), high-density lipoprotein (mmol/l), estimated glomerular filtration rate (eGFR) < 60 ml/min (yes/no), micro-albuminuria (yes/no), macro-albuminuria (yes/no), risk or presence of foot complications (yes/no), diabetes retinopathy (yes/no), use of antihypertensive drugs (yes/no), use of lipid-lowering drugs (yes/no), and glucose-lowering treatment (diet/OHA/insulin/OHA + insulin/other glucose-lowering treatments). Life-style data recorded were: smoker (yes/no) and physical activity (never/fewer than or once per week/1–2 times per week/3–5 times per week/daily).
Comorbidities Primary and secondary diagnoses classified according to the Inter-national Statistical Classification of Diseases and Related Health Problems, 10th revision (ICD–10).
All-cause mortality Emigration
Demographics- and clinical data e.g., Sex Age Diabetes duration HbA1c Blood pressure Micro/macro albuminuria Physical activity Smoking
Socio-economic data Country of birth Marital status Educational level Income
National Patient Register
Swedish Population
Register
LISA*
National Diabetes Register
Personal identification
number

35
The National Patient Register The NPR is maintained by the NBHW (Socialstyrelsen) and contains individ-ual-level data about comorbidities (i.e., primary and secondary medical diag-noses) from in-patient and out-patient hospital visits. The NPR uses the Inter-national Statistical Classification of Diseases and Related Health Problems, 10th revision (ICD-10) to classify primary and secondary diagnoses (102). Comorbidities were retrieved by ICD-10 code at the main diagnostic (Chap-ter) level (except for the main diagnostic group of E00–E90 for which second-ary diagnosis was retrieved) for 2012 and 2013. If an ICD-10 diagnosis was present in either of the two years it was coded as “Yes” and otherwise coded as “No”. ICD-10 codes with a prevalence of < 1.0% were excluded.
Longitudinal Integration Database for Health Insurance and Labour Market Studies LISA is maintained by Statistics Sweden (Statistiska centralbyrån) and con-tains individual-level data on socio-economic variables (103). The variables included from LISA and categorized in the thesis were: born in Sweden (yes/no), marital status (single/married/divorced/widowed), disposable in-come in Swedish Krona (quintiles; q1–q5), educational level (9 years or less/10–12 years/college or university) and occupational status (not employed aged < 65 years/not employed aged 65 years/employed).
The Swedish Population Register For Study IV, follow-up data for all-cause mortality and emigration were ob-tained for all people with T2DM registered in the NDR in 2013 from the Swe-dish population registry maintained by the Swedish National Tax Board (Skatteverket).
Ethical considerations The studies were approved by the Regional Ethical Review Board in Uppsala (approval number 2013/376) and three subsequent ethics applications were approved (approval numbers 2013/376/1, 2013/375/2 and 2013/375/3), waiv-ing informed consent. Managers at the PHCCs received a cover letter together with the Swed-QOP questionnaire indicating that their participation in the study was voluntary and that all data were to be kept confidential. We also informed them that published results would not identify PHCCs or individuals and that all data would be presented at a group level. As for the data from the NDR, all people with T2DM had given their informed consent to participate in the registry and were informed that the data could be used for research.
36
Statistical analysis For descriptive statistics: categorical variables are presented as percentages and frequencies, n (%); ordinal, discrete and continuous variables are given as median and interquartile range (IQR) in Study I and discrete and continuous variables was given as means and standard deviations (SDs) in Study II, III, IV. Mann-Whitney U-test Used for ordinal, discrete and continuous data to test for univariate differences between the two years (2006 and 2013) (Study I). Pearson’s 2- test Used for categorical data to test for univariate differences between the two years (2006 and 2013) (Study I). Bootstrap procedure To test for differences between the two years (2006 and 2013), the dependence between the two studies had to be considered. Therefore, a bootstrap proce-dure was used to calculate the P values for tests of differences between the two years (Study I). Exploratory factor analysis (EFA) A principal component analysis factor extraction, retaining all factors with ei-genvalues > 1, was used to identify the underlying structure of the questions. The quality-of-work questions with three alternative answers were dichoto-mized as 0 (“No”) and 1 (“Yes”) while “Do not know” was coded as missing. Varimax rotation with Kaiser normalization was performed and excluded questions with λ < 0.4 (i.e. “political priority of diabetes care”, λ = 0.327) and questions with λ < 0.6 that were seen as not fitting the interpretation of the other questions with λ > 0.6 for the same factor (e.g., “having diabetes-respon-sible RNs”, λ = 0.430, and “having conducted quality improvement work dur-ing several years”, λ = 0.511). Seven EFA factor analysis scores were calcu-lated for each PHCC, based on factor score coefficients estimated using the Anderson–Rubin method. The re-estimated rotations and extractions led to the retention of 18 questions forming seven quality-of-work features with 2–4 questions for each feature (Study III). Generalized estimating equations (GEE) linear regression models GEE was used for analysing associations in Studies II and III to take account of the hierarchical dependence structure of the data, in that several people with T2DM attend the same PHCC, and several PHCCs belong to the same county council/region. Utilizing an independent structure working correlation matrix.
37
In Study II, the analyses were performed in three steps. In the first step, a base model was constructed by including all PHCC-level variables except those measuring the type of call–recall system. The base model was adjusted for all other variables relating to personnel resources and organizational features, and for all background data measured at the PHCC level. In the second step, the full model included all variables in the base model as well as all demographic factors and clinical, lifestyle, socio-economic and comorbidity variables measured at the individual level. In the third step, a trimmed model was de-rived, which started by including all variables in the full model and used a backward selection procedure to exclude variables with high P values, using a removal probability of 0.2 starting with the highest P value in the full model. A subgroup analysis of PHCCs that used a call–recall system to RNs and GPs included the variables measuring the type of system used.
For Study III, two steps were applied. The first step was an unadjusted model, including only the quality-of-work features, while the second step was an adjusted model, which in addition to the quality-of-work features also in-cluded individual clinical data, socio-economic data and comorbidities, as well as background characteristics, personnel resources and organizational features of the PHCCs. The regression model was stratified into three levels of HbA1c: controlled ( 52 mmol/mol) intermediate (53–69 mmol/mol), and uncontrolled ( 70 mmol/mol). Data were presented as the linear slope coef-ficient (95% CI), using a normal approximation Z-test procedure to compare strata.
Survival analysis Survival analysis is performed to identify the time to an event of interest and to examine the nature of the survival distribution. The event of interest in Study IV was all-cause mortality. Cox regression The main focus of Study IV was to examine the associations between the per-sonnel resources and organizational features of PHCCs and all-cause mortality during the follow-up period. Survival was measured from the date of last reg-istration in the NDR in 2013 to the date of death or date of censoring because of emigration or end of follow-up (30 January 2018). A total of 160,434 peo-ple with T2DM were censored, for whom date of emigration (n = 498) and end of follow-up (n = 159,936) were used as censoring dates.
Two hierarchal Cox regression models were used to analyse the association between PHCC personnel resources and organizational features and all-cause mortality. The hierarchal approach was used because of the interdependence between people with T2DM nested in PHCCs and PHCCs nested in county council/regions. The unadjusted models included only the personnel resources
38
and organizational features whereas the adjusted model also included individ-ual-level confounding variables concerning clinical, socio-economic and comorbidity characteristics. In addition, subgroup analyses by age ( 55 years, 56–74 years, 75 years), sex (female/male) and HbA1c level category ( 52 mmol/mol, 53–69 mmol/mol, 70 mmol/mol) were constructed.
Handling of missing data The NDR is a longitudinal database that contains repeated measurements and has missing data. People with diabetes mellitus enrolled in the NDR are ex-amined repeatedly at different times and intervals. Several statistical tech-niques have been developed to handle longitudinal and complex data. The pre-sent thesis used simple imputation, which involves replacing missing values using the last observation carried forward (LOCF) method, because that is the default method used by the NDR.
Role of bias In epidemiological studies such as those included in this thesis, bias is una-voidable. Random biases can be reduced by having a large sample, however, systematic biases remain even in a large sample. There are three phenomena that may occur in observational studies: selection bias (study population), in-formation bias (data collection procedure, analysis and interpretation) and confounding. Selection bias arises from the procedure used to select partici-pants and factors that can influence study participation. The presence of se-lection bias is prevalent when, for example, the associations between exposure and disease differ between participants and non-participants. Information bias in a study can be prevalent if the information obtained is erroneous, introduc-ing systematic errors. This can manifest as misclassification and occurs when a variable is measured on categorical scale and participants are placed in an incorrect category. There is also a risk of recall bias in cross-sectional studies that require participants to provide information and to remember something after it has occurred. Confounding: every epidemiological study faces prob-lems with confounding. Confounding can be explained as confusion of effects, which implies that the effects of the exposure are influenced by effects from other variables (104). There is a risk of confounding by indication in epidemi-ological studies. This term refers to the baseline outcome being the reason for the intervention so that effects from the phenomena investigated might not be a step in a causal pathway (105).

39
Results
Study I Personnel resources The median list size for a PHCC decreased between 2006 and 2013 but the median number of people with T2DM listed at PHCCs increased (all P < 0.001). The whole-time equivalent (WTE) RNs per 500 people with T2DM increased from 0.64 in 2006 to 0.79 in 2013 (P < 0.001) with a variation in 2013 of (SD) (0.52; 1.12). From 2006 to 2013, 30 percentages points more PHCCs (from 17.0% in 2006 to 47.5% in 2013) had an RN with 16 or more European Credit Transfer Accumulation System (ECTS) credits for postgrad-uate education in diabetes (P < 0.001). Moreover, access to a psychologist in-house increased from 25.9% of PHCCs in 2006 to 47.1% in 2013 (P < 0.001). No change was found in terms of in-house access to dietitians, chiropodists, social workers or physiotherapists. Organizational features The use of a call–recall system in 2013 increased for GPs (62.3% in 2006 to 79.2% in 2013; P = 0.002) and for RNs (88.4% in 2006 to 95.2%; P = 0.020), as did their use of a system for checking that people made annual visits to GPs (68.8% in 2006 and 80.3%; P = 0.017) and to RNs (77.8% in 2006 to 88.8% in 2013; P = 0.008). No difference was found between 2006 and 2013 for the number of PHCCs providing group education, with almost one-quarter providing it in both years. The proportion of PHCCs reporting people with T2DM participating in goal setting of treatment targets remained low, and in 2013 ranged from 30.3% to 54.0% depending whether the target was HbA1c, systolic blood pressure, lipids or lifestyle changes. There was a significant change between 2006 and 2013 in the proportion of people with T2DM being included in goal setting for lifestyle changes (34.1% in 2006 to 54.0% in 2013: P < 0.001).
Medical check-ups of risk factors Descriptive statistics for screening “at least twice a year” and “once a year” between the two years for people receiving diet/OHA treatment (A) and for people receiving insulin treatment (B) are presented in Figure 5. Between 2006 and 2013 there were no significant differences in screening of HbA1c levels, weight, blood pressure, or feet, irrespective of the type of treatment.
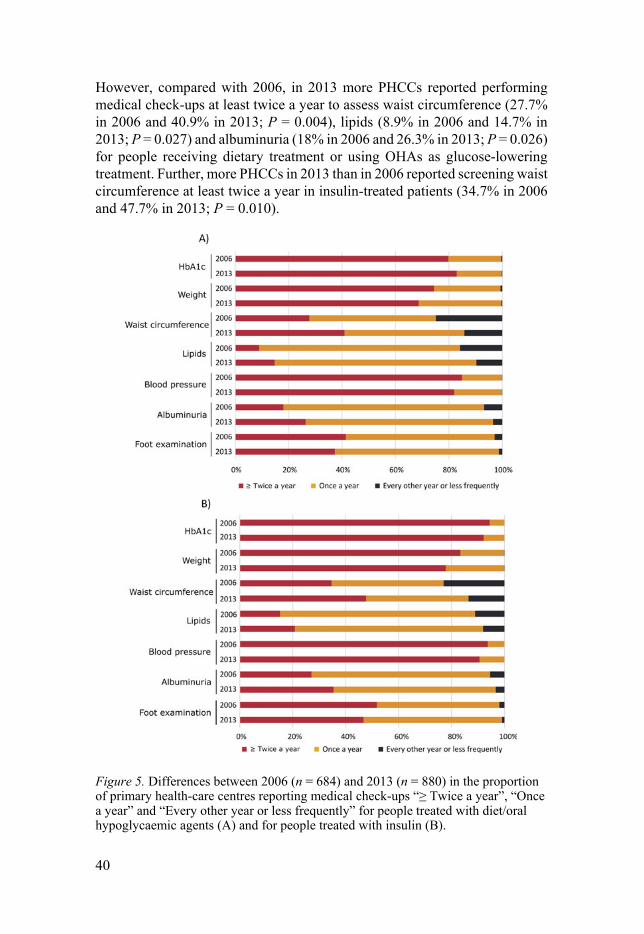
40
However, compared with 2006, in 2013 more PHCCs reported performing medical check-ups at least twice a year to assess waist circumference (27.7% in 2006 and 40.9% in 2013; P = 0.004), lipids (8.9% in 2006 and 14.7% in 2013; P = 0.027) and albuminuria (18% in 2006 and 26.3% in 2013; P = 0.026) for people receiving dietary treatment or using OHAs as glucose-lowering treatment. Further, more PHCCs in 2013 than in 2006 reported screening waist circumference at least twice a year in insulin-treated patients (34.7% in 2006 and 47.7% in 2013; P = 0.010).
Figure 5. Differences between 2006 (n = 684) and 2013 (n = 880) in the proportion of primary health-care centres reporting medical check-ups “≥ Twice a year”, “Once a year” and “Every other year or less frequently” for people treated with diet/oral hypoglycaemic agents (A) and for people treated with insulin (B).
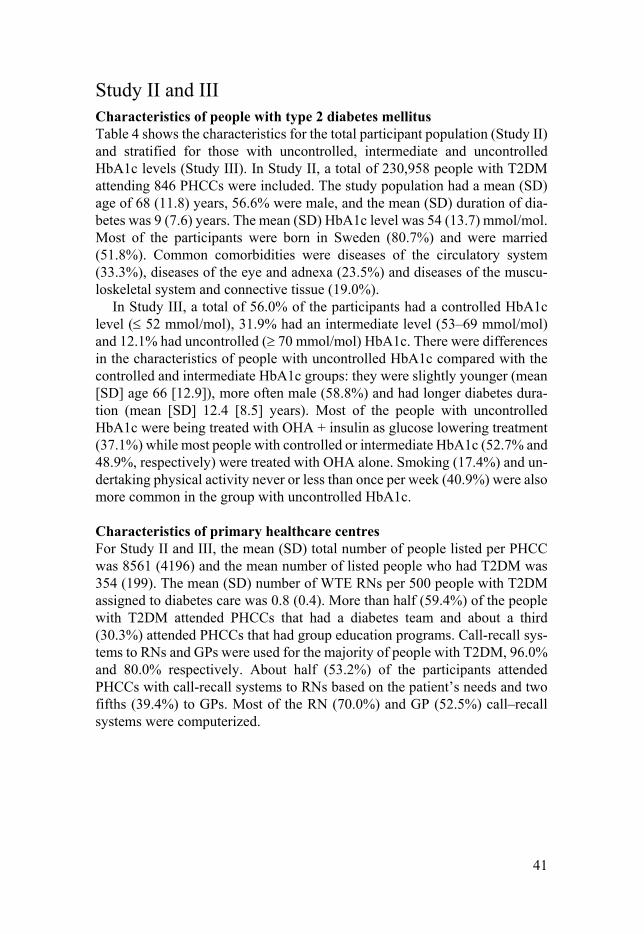
41
Study II and III Characteristics of people with type 2 diabetes mellitus Table 4 shows the characteristics for the total participant population (Study II) and stratified for those with uncontrolled, intermediate and uncontrolled HbA1c levels (Study III). In Study II, a total of 230,958 people with T2DM attending 846 PHCCs were included. The study population had a mean (SD) age of 68 (11.8) years, 56.6% were male, and the mean (SD) duration of dia-betes was 9 (7.6) years. The mean (SD) HbA1c level was 54 (13.7) mmol/mol. Most of the participants were born in Sweden (80.7%) and were married (51.8%). Common comorbidities were diseases of the circulatory system (33.3%), diseases of the eye and adnexa (23.5%) and diseases of the muscu-loskeletal system and connective tissue (19.0%).
In Study III, a total of 56.0% of the participants had a controlled HbA1c level ( 52 mmol/mol), 31.9% had an intermediate level (53–69 mmol/mol) and 12.1% had uncontrolled ( 70 mmol/mol) HbA1c. There were differences in the characteristics of people with uncontrolled HbA1c compared with the controlled and intermediate HbA1c groups: they were slightly younger (mean [SD] age 66 [12.9]), more often male (58.8%) and had longer diabetes dura-tion (mean [SD] 12.4 [8.5] years). Most of the people with uncontrolled HbA1c were being treated with OHA + insulin as glucose lowering treatment (37.1%) while most people with controlled or intermediate HbA1c (52.7% and 48.9%, respectively) were treated with OHA alone. Smoking (17.4%) and un-dertaking physical activity never or less than once per week (40.9%) were also more common in the group with uncontrolled HbA1c. Characteristics of primary healthcare centres For Study II and III, the mean (SD) total number of people listed per PHCC was 8561 (4196) and the mean number of listed people who had T2DM was 354 (199). The mean (SD) number of WTE RNs per 500 people with T2DM assigned to diabetes care was 0.8 (0.4). More than half (59.4%) of the people with T2DM attended PHCCs that had a diabetes team and about a third (30.3%) attended PHCCs that had group education programs. Call-recall sys-tems to RNs and GPs were used for the majority of people with T2DM, 96.0% and 80.0% respectively. About half (53.2%) of the participants attended PHCCs with call-recall systems to RNs based on the patient’s needs and two fifths (39.4%) to GPs. Most of the RN (70.0%) and GP (52.5%) call–recall systems were computerized.

Tab
le 4
. Des
crip
tive
stat
istic
s fo
r th
e to
tal p
opul
atio
n of
par
tici
pant
s (n
= 2
30,9
58),
str
atif
ied
acco
rdin
g to
HbA
1c le
vel:
cont
roll
ed
(n =
124
,671
), in
term
edia
te (
n =
70,
928)
and
unc
ontr
olle
d (n
= 2
6,94
7).
Var
iab
le
Tot
al p
opu
lati
on
Con
trol
led
Hb
A1c
(≤
52
mm
ol/m
ol)
Inte
rmed
iate
Hb
A1c
(5
3–69
mm
ol/m
ol)
Un
con
trol
led
Hb
A1c
(≥
70
mm
ol/m
ol)
Age
(ye
ars)
, mea
n (S
D)
68.1
(11
.8)
68.1
(11
.5)
68.8
(11
.6)
66.1
(12
.9)
Men
, n (
%)
130,
714
(56.
6)
69 4
30 (
55.7
) 40
,699
(57
.4)
15,8
44 (
58.8
) D
urat
ion
of d
iabe
tes
(yea
rs),
mea
n (S
D)
9.0
(7.6
) 7.
1 (6
.6)
10.9
(8.
0)
12.4
(8.
5)
HbA
1c (
mm
ol/m
ol),
mea
n (S
D)
54.0
(13
.9)
N/A
N
/A
N/A
S
ysto
lic
bloo
d pr
essu
re (
mm
Hg)
, mea
n (S
D)
135
(15.
7)
134.
2 (1
5.4)
13
5.5
(15.
7)
136.
0 (1
6.5)
D
iast
olic
blo
od p
ress
ure
(mm
Hg)
, mea
n (S
D)
76 (
9.7)
76
.1 (
9.6)
76
.0 (
9.7)
76
.9 (
10.3
) B
ody
mas
s in
dex
(kg/
m2)
, mea
n (S
D)
29.8
(5.
4)
29.4
(5.
2)
30.1
(5.
3)
31.2
(5.
8)
Tot
al c
hole
ster
ol (
mm
ol/l
), m
ean
(SD
) 4.
7 (1
.1)
4.7
(1.1
) 4.
6 (1
.1)
4.8
(1.2
) T
rigl
ycer
ides
(m
mol
/l),
mea
n (S
D)
1.8
(1.2
) 1.
7 (1
.0)
1.9
(1.2
) 2.
3 (1
.9)
Hig
h-de
nsit
y li
popr
otei
n (m
mol
/l),
mea
n (S
D)
1.3
(0.4
) 1.
3 (0
.4)
1.2
(0.4
) 1.
2 (0
.4)
Low
-den
sity
lipo
prot
ein
(mm
ol/l
), m
ean
(SD
)a 2.
6 (0
.9)
2.6
(0.9
) 2.
5 (0
.9)
2.6
(1.0
) E
stim
ated
glo
mer
ular
fil
trat
ion
rate
(eG
FR
) <
60 (
ml/
min
), n
(%
)b 33
,151
(17
.0)
16,2
40 (
15.0
) 11
,740
(19
.1)
4569
(19
.8)
Ris
k/pr
esen
ce o
f fo
ot c
ompl
icat
ions
, n (
%)
41
,754
(22
.9)
19,6
19 (
19.7
) 14
,303
(25
.0)
6159
(29
.8)
Dia
bete
s re
tino
path
y, n
(%
)
47,6
76 (
27.9
) 18
,772
(20
.5)
18,6
97 (
33.8
) 88
09 (
43.9
) M
icro
albu
min
uria
, n (
%)c
30,0
20 (
19.9
) 13
,660
(16
.1)
10,6
78 (
22.6
) 52
47 (
31.3
) M
acro
albu
min
uria
, n (
%)d
11,1
87 (
7.8)
45
93 (
5.6)
41
19 (
9.1)
23
05 (
14.5
) A
ntih
yper
tens
ive
drug
s, n
(%
) 17
4,34
5 (7
9.0)
94
,409
(79
.0)
54,9
51 (
80.7
) 19
,848
(76
.9)
Lip
id-l
ower
ing
drug
s, n
(%
) 13
7,41
2 (6
2.5)
72
,921
(61
.2)
44,6
97 (
65.8
) 16
,247
(63
.2)
Glu
cose
-low
erin
g tr
eatm
ent,
n (%
)
Die
t 51
,091
(22
.3)
40,4
39 (
32.6
) 64
60 (
9.2)
14
90 (
5.6)
OH
A
111,
571
(48.
6)
65,3
70 (
52.7
) 34
,531
(48
.9)
8294
(30
.9)
I
nsul
in
25,3
78 (
11.1
) 72
64 (
5.9)
10
,977
(15
.6)
6190
(23
.1)
O
HA
+ in
suli
n 37
,817
(16
.5)
9716
(7.
8)
17,0
57 (
24.2
) 99
52 (
37.1
)
Oth
er m
edic
atio
ns
3644
(1.
6)
1184
(1.
0)
1527
(2.
2)
880
(3.3
) S
mok
er, n
(%
) 28
,091
(14
.2)
14
,946
(13
.7)
8432
(13
.7)
3925
(17
.4)
Phy
sica
l act
ivit
y, n
(%
)
Nev
er o
r le
ss th
an o
nce
per
wee
k 50
,928
(28
.2)
23,9
60 (
23.9
) 17
,596
(30
.8)
8492
(40
.9)
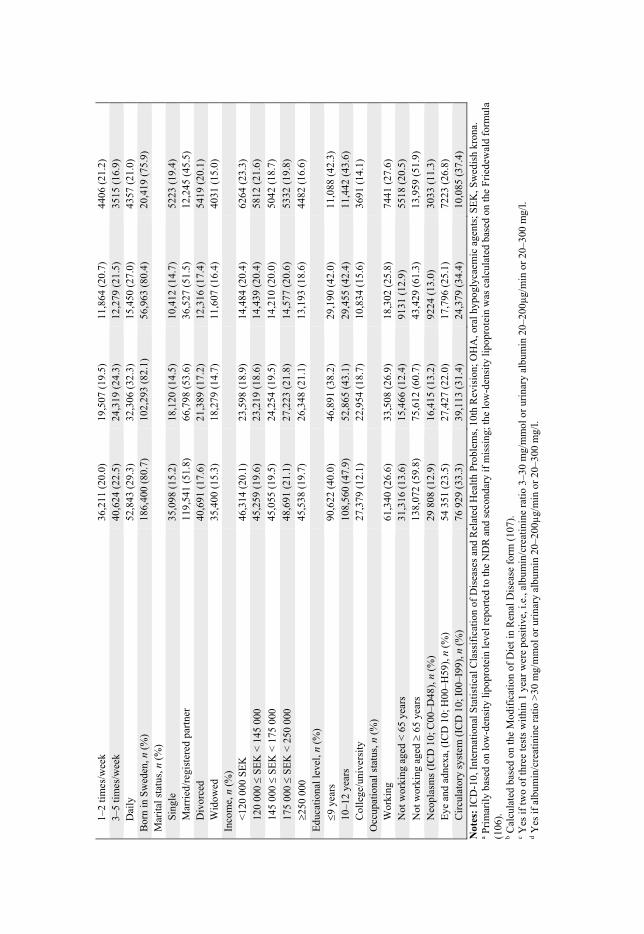
1
–2 ti
mes
/wee
k 36
,211
(20
.0)
19,5
07 (
19.5
) 11
,864
(20
.7)
4406
(21
.2)
3
–5 ti
mes
/wee
k 40
,624
(22
.5)
24,3
19 (
24.3
) 12
,279
(21
.5)
3515
(16
.9)
D
aily
52
,843
(29
.3)
32,3
06 (
32.3
) 15
,450
(27
.0)
4357
(21
.0)
Bor
n in
Sw
eden
, n (
%)
186,
400
(80.
7)
102,
293
(82.
1)
56,9
63 (
80.4
) 20
,419
(75
.9)
Mar
ital
sta
tus,
n (
%)
Sin
gle
35,0
98 (
15.2
) 18
,120
(14
.5)
10,4
12 (
14.7
) 52
23 (
19.4
) M
arri
ed/r
egis
tere
d pa
rtne
r 11
9,54
1 (5
1.8)
66
,798
(53
.6)
36,5
27 (
51.5
) 12
,245
(45
.5)
Div
orce
d 40
,691
(17
.6)
21,3
89 (
17.2
) 12
,316
(17
.4)
5419
(20
.1)
Wid
owed
35
,400
(15
.3)
18,2
79 (
14.7
) 11
,607
(16
.4)
4031
(15
.0)
Inco
me,
n (
%)
<12
0 00
0 S
EK
46
,314
(20
.1)
23,5
98 (
18.9
) 14
,484
(20
.4)
6264
(23
.3)
120
000
SE
K <
145
000
45
,259
(19
.6)
23,2
19 (
18.6
) 14
,439
(20
.4)
5812
(21
.6)
145
000
SE
K <
175
000
45
,055
(19
.5)
24,2
54 (
19.5
) 14
,210
(20
.0)
5042
(18
.7)
175
000
SE
K <
250
000
48
,691
(21
.1)
27,2
23 (
21.8
) 14
,577
(20
.6)
5332
(19
.8)
250
000
45
,538
(19
.7)
26,3
48 (
21.1
) 13
,193
(18
.6)
4482
(16
.6)
Edu
cati
onal
leve
l, n
(%)
9 y
ears
90
,622
(40
.0)
46,8
91 (
38.2
) 29
,190
(42
.0)
11,0
88 (
42.3
)
10–1
2 ye
ars
108,
560
(47.
9)
52,8
65 (
43.1
) 29
,455
(42
.4)
11,4
42 (
43.6
) C
olle
ge/u
nive
rsit
y 27
,379
(12
.1)
22,9
54 (
18.7
) 10
,834
(15
.6)
3691
(14
.1)
Occ
upat
iona
l sta
tus,
n (
%)
Wor
king
61
,340
(26
.6)
33,5
08 (
26.9
) 18
,302
(25
.8)
7441
(27
.6)
Not
wor
king
age
d <
65
year
s 31
,316
(13
.6)
15,4
66 (
12.4
) 91
31 (
12.9
) 55
18 (
20.5
)
Not
wor
king
age
d
65 y
ears
13
8,07
2 (5
9.8)
75
,612
(60
.7)
43,4
29 (
61.3
) 13
,959
(51
.9)
Neo
plas
ms
(IC
D 1
0; C
00–D
48),
n (
%)
29 8
08 (
12.9
) 16
,415
(13
.2)
9224
(13
.0)
3033
(11
.3)
Eye
and
adn
exa,
(IC
D 1
0; H
00–H
59),
n (
%)
54 3
51 (
23.5
) 27
,427
(22
.0)
17,7
96 (
25.1
) 72
23 (
26.8
) C
ircu
lato
ry s
yste
m (
ICD
10;
I00
–I99
), n
(%
) 76
929
(33
.3)
39,1
13 (
31.4
) 24
,379
(34
.4)
10,0
85 (
37.4
)
Not
es:
ICD
-10,
Int
erna
tion
al S
tati
stic
al C
lass
ific
atio
n of
Dis
ease
s an
d R
elat
ed H
ealt
h P
robl
ems,
10t
h R
evis
ion;
OH
A, o
ral h
ypog
lyca
emic
age
nts;
SE
K, S
wed
ish
kron
a.
a Pri
mar
ily
base
d on
low
-den
sity
lipo
prot
ein
leve
l rep
orte
d to
the
ND
R a
nd s
econ
dary
if m
issi
ng; t
he lo
w-d
ensi
ty li
popr
otei
n w
as c
alcu
late
d ba
sed
on th
e F
ried
ewal
d fo
rmul
a (1
06).
b C
alcu
late
d ba
sed
on th
e M
odif
icat
ion
of D
iet i
n R
enal
Dis
ease
for
m (
107)
. c Y
es if
two
of th
ree
test
s w
ithi
n 1
year
wer
e po
siti
ve, i
.e.,
albu
min
/cre
atin
ine
rati
o 3–
30 m
g/m
mol
or
urin
ary
albu
min
20–
200µ
g/m
in o
r 20
–300
mg/
l. d Y
es if
alb
umin
/cre
atin
ine
rati
o >
30 m
g/m
mol
or
urin
ary
albu
min
20–
200µ
g/m
in o
r 20
–300
mg/
l.
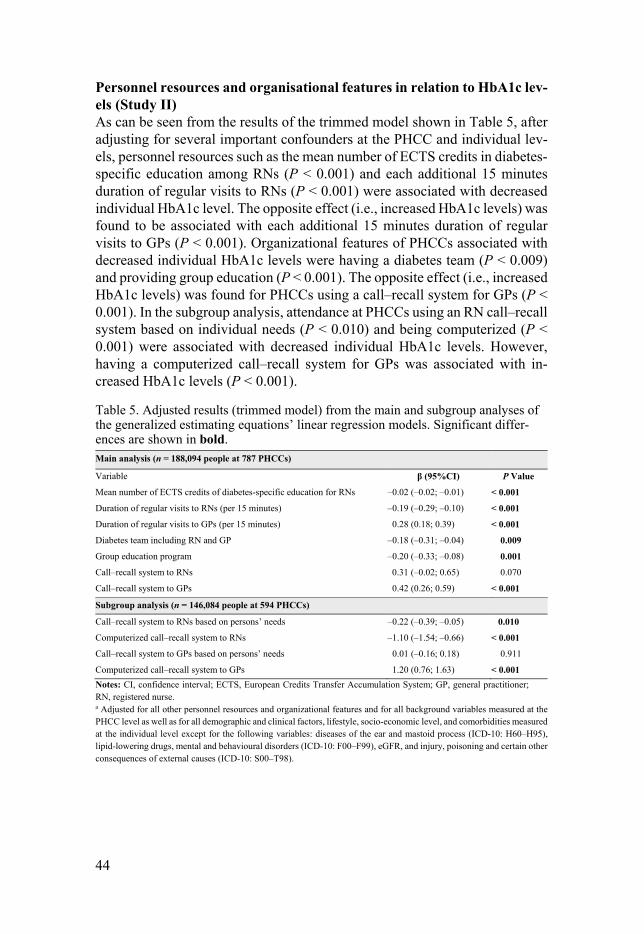
44
Personnel resources and organisational features in relation to HbA1c lev-els (Study II) As can be seen from the results of the trimmed model shown in Table 5, after adjusting for several important confounders at the PHCC and individual lev-els, personnel resources such as the mean number of ECTS credits in diabetes-specific education among RNs (P < 0.001) and each additional 15 minutes duration of regular visits to RNs (P < 0.001) were associated with decreased individual HbA1c level. The opposite effect (i.e., increased HbA1c levels) was found to be associated with each additional 15 minutes duration of regular visits to GPs (P < 0.001). Organizational features of PHCCs associated with decreased individual HbA1c levels were having a diabetes team (P < 0.009) and providing group education (P < 0.001). The opposite effect (i.e., increased HbA1c levels) was found for PHCCs using a call–recall system for GPs (P < 0.001). In the subgroup analysis, attendance at PHCCs using an RN call–recall system based on individual needs (P < 0.010) and being computerized (P < 0.001) were associated with decreased individual HbA1c levels. However, having a computerized call–recall system for GPs was associated with in-creased HbA1c levels (P < 0.001).
Table 5. Adjusted results (trimmed model) from the main and subgroup analyses of the generalized estimating equations’ linear regression models. Significant differ-ences are shown in bold. Main analysis (n = 188,094 people at 787 PHCCs)
Variable β (95%CI) P Value
Mean number of ECTS credits of diabetes-specific education for RNs –0.02 (–0.02; –0.01) < 0.001
Duration of regular visits to RNs (per 15 minutes) –0.19 (–0.29; –0.10) < 0.001
Duration of regular visits to GPs (per 15 minutes) 0.28 (0.18; 0.39) < 0.001
Diabetes team including RN and GP –0.18 (–0.31; –0.04) 0.009
Group education program –0.20 (–0.33; –0.08) 0.001
Call–recall system to RNs 0.31 (–0.02; 0.65) 0.070
Call–recall system to GPs 0.42 (0.26; 0.59) < 0.001
Subgroup analysis (n = 146,084 people at 594 PHCCs)
Call–recall system to RNs based on persons’ needs –0.22 (–0.39; –0.05) 0.010
Computerized call–recall system to RNs –1.10 (–1.54; –0.66) < 0.001
Call–recall system to GPs based on persons’ needs 0.01 (–0.16; 0.18) 0.911
Computerized call–recall system to GPs 1.20 (0.76; 1.63) < 0.001
Notes: CI, confidence interval; ECTS, European Credits Transfer Accumulation System; GP, general practitioner; RN, registered nurse. a Adjusted for all other personnel resources and organizational features and for all background variables measured at the PHCC level as well as for all demographic and clinical factors, lifestyle, socio-economic level, and comorbidities measured at the individual level except for the following variables: diseases of the ear and mastoid process (ICD-10: H60–H95), lipid-lowering drugs, mental and behavioural disorders (ICD-10: F00–F99), eGFR, and injury, poisoning and certain other consequences of external causes (ICD-10: S00–T98).

45
Quality-of-work conditions at primary health-care centres (Study III) Figure 6 presents an overview of the PHCCs’ quality-of-work conditions. Overall, 73.5% had a goal-oriented drug therapy treatment plan and 71.3% had a clear strategy for people with poor outcomes. Surprisingly, fewer of the respondents reported having common meetings about guidelines (41.0%), or accommodating a dialogue between the PHCC management and the health-care professionals (57.7%), and only 60.2% informed the health-care profes-sionals about PHCC results. In contrast, the highest reported values were found with PHCCs taking responsibility for quality and results (96.6%) and having a culture of following guidelines (98.5%).
Figure 6. Descriptive statistics of primary health-care centres’ quality-of-work con-ditions. The figure also describes which questions (Q:x) belong to which quality-of-work feature. GP, general practitioner; HCP, health-care professionals; NDR, Na-tional Diabetes Registry; PHCC, primary health-care centre; RN, registered nurse.
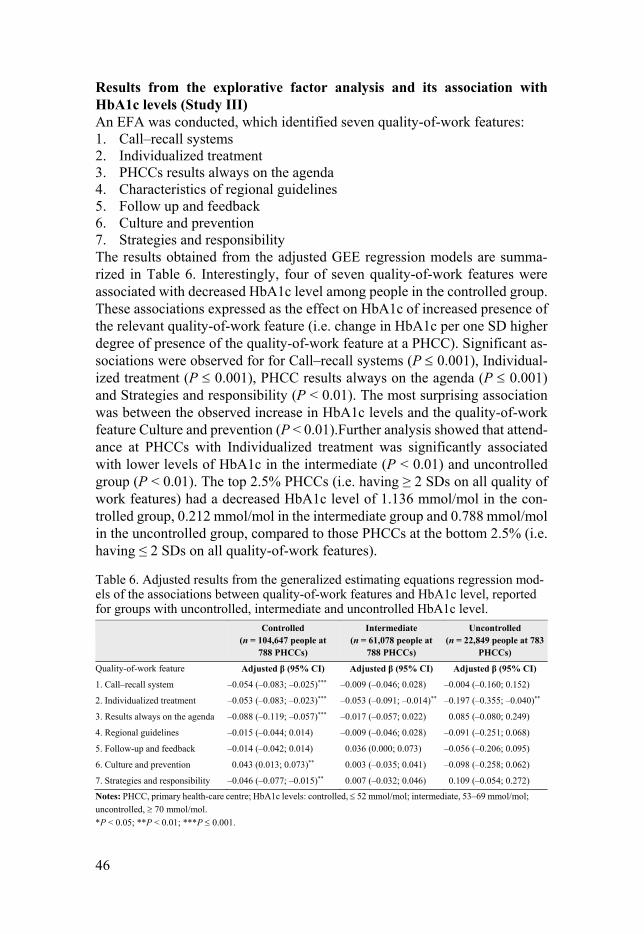
46
Results from the explorative factor analysis and its association with HbA1c levels (Study III) An EFA was conducted, which identified seven quality-of-work features: 1. Call–recall systems 2. Individualized treatment 3. PHCCs results always on the agenda 4. Characteristics of regional guidelines 5. Follow up and feedback 6. Culture and prevention 7. Strategies and responsibility The results obtained from the adjusted GEE regression models are summa-rized in Table 6. Interestingly, four of seven quality-of-work features were associated with decreased HbA1c level among people in the controlled group. These associations expressed as the effect on HbA1c of increased presence of the relevant quality-of-work feature (i.e. change in HbA1c per one SD higher degree of presence of the quality-of-work feature at a PHCC). Significant as-sociations were observed for for Call–recall systems (P 0.001), Individual-ized treatment (P 0.001), PHCC results always on the agenda (P 0.001) and Strategies and responsibility (P < 0.01). The most surprising association was between the observed increase in HbA1c levels and the quality-of-work feature Culture and prevention (P < 0.01).Further analysis showed that attend-ance at PHCCs with Individualized treatment was significantly associated with lower levels of HbA1c in the intermediate (P < 0.01) and uncontrolled group (P < 0.01). The top 2.5% PHCCs (i.e. having ≥ 2 SDs on all quality of work features) had a decreased HbA1c level of 1.136 mmol/mol in the con-trolled group, 0.212 mmol/mol in the intermediate group and 0.788 mmol/mol in the uncontrolled group, compared to those PHCCs at the bottom 2.5% (i.e. having ≤ 2 SDs on all quality-of-work features).
Table 6. Adjusted results from the generalized estimating equations regression mod-els of the associations between quality-of-work features and HbA1c level, reported for groups with uncontrolled, intermediate and uncontrolled HbA1c level. Controlled
(n = 104,647 people at 788 PHCCs)
Intermediate (n = 61,078 people at
788 PHCCs)
Uncontrolled (n = 22,849 people at 783
PHCCs)
Quality-of-work feature Adjusted β (95% CI) Adjusted β (95% CI) Adjusted β (95% CI)
1. Call–recall system –0.054 (–0.083; –0.025)*** –0.009 (–0.046; 0.028) –0.004 (–0.160; 0.152)
2. Individualized treatment –0.053 (–0.083; –0.023)*** –0.053 (–0.091; –0.014)** –0.197 (–0.355; –0.040)**
3. Results always on the agenda –0.088 (–0.119; –0.057)*** –0.017 (–0.057; 0.022) 0.085 (–0.080; 0.249)
4. Regional guidelines –0.015 (–0.044; 0.014) –0.009 (–0.046; 0.028) –0.091 (–0.251; 0.068)
5. Follow-up and feedback –0.014 (–0.042; 0.014) 0.036 (0.000; 0.073) –0.056 (–0.206; 0.095)
6. Culture and prevention 0.043 (0.013; 0.073)** 0.003 (–0.035; 0.041) –0.098 (–0.258; 0.062)
7. Strategies and responsibility –0.046 (–0.077; –0.015)** 0.007 (–0.032; 0.046) 0.109 (–0.054; 0.272)
Notes: PHCC, primary health-care centre; HbA1c levels: controlled, 52 mmol/mol; intermediate, 53–69 mmol/mol;
uncontrolled, 70 mmol/mol.
*P < 0.05; **P < 0.01; ***P 0.001.

47
Study IV A total of 27,136 people with T2DM of the 187,570 originally included in the study (14.5%) were deceased. The people who were deceased were older (mean [SD] age 77 [9.4]), and had longer diabetes duration (11.9 [8.9] years) and slightly increased mean HbA1c level (58.2 [14.9] mmol/mol). Of note, the presence of complications was more prevalent among the deceased people compared with the censored participants, with almost twice as many having foot complications (40.2%), more than one third (36.5%) having retinopathy and three times as many having microalbuminuria (18.2%).
Results from the adjusted Cox regression models including the total popu-lation (n = 187,570) showed that WTE GPs/500 people with T2DM was asso-ciated with decreased risk of early death (hazard ratio [HR] 0.989, 95% CI 0.982–0.996; P < 0.01). However, attendance at a PHCC with a call–recall system for GPs was associated with increased risk of early death (HR 1.074, 95% CI 1.022–1.129; P < 0.01). We constructed Cox regression models in-cluding subgroups stratified by age, sex and HbA1c level to assess whether differences occurred between different subgroups. Attendance at a PHCC with WTE GPs/500 people with T2DM was associated with lower risk of early death in people aged 75 years (HR 0.986, 95% CI 0.977–0.996; P < 0.01), women (HR 0.990, 95% CI 0.981–0.9996; P < 0.05), men (HR 0.989, 95% CI 0.981–0.997; P < 0.01) and with HbA1c 52 mmol/mol (HR 0.988, 95% CI 0.981–0.996; P < 0.01).
We observed significant associations between RNs mean number of ECTS credits in diabetes-specific education and a lower risk of early death for people ≤ 55 years of age (HR 0.983, 95% CI 0.972–0.995; P < 0.01) (Figure 7). Being male with T2DM and attending a PHCC having RNs with pedagogical educa-tion was also associated with a lower risk of early death (HR 0.995, 95% CI 0.992–0.999; P < 0.01) (Figure 8). Another finding of Study IV was that at-tendance at PHCCs having GP call–recall systems and providing group edu-cation increased the risk of early death. Surprisingly, the risk of early death for people with uncontrolled HbA1c ( 70 mmol/mol) were not associated with any personnel resources or organizational features.

48
Figure 7. Illustration of the cumulative effect of the mean number of ECTS credits in diabetes-specific education obtained by registered nurses in relation to all-cause mortality. ECTS, European Credits Transfer Accumulation System.

49
Figure 8. Illustration of cumulative effect of the mean number of ECTS credits in pedagogic education obtained by registered nurses in relation to all-cause mortality. ECTS, European Credits Transfer Accumulation System.
50
Discussion
The studies in this thesis examined changes in Swedish primary diabetes care between 2006 and 2013 and associations between the organization of diabetes care, HbA1c levels and all-cause mortality among people with T2DM. Differ-ent aspects of the organization of diabetes care involving personnel resources, organizational features and quality of work in the PHC setting were evaluated.
Key findings The longitudinal follow-up demonstrated that RNs mean number of diabetes-specific education credits and the time devoted by RNs to care for people with T2DM had increased. However, there is still scope for further improvement by PHCCs to provide group education programs and for health-care profes-sionals to include the patients in the goal setting of treatment targets.
The findings also indicate that personnel resources (e.g., having well-edu-cated RNs and additional time for patient visits with RNs as well as sufficient access to GPs) was associated with decreased HbA1c level and/or decreased risk of early death. Providing group education and having diabetes teams were associated with decreased HbA1c level, however, group education programs were also associated with an increased risk of early death. The opposite effect was observed for PHCCs using GP call–recall systems, which were associated with increased level of HbA1c and increased risk of early death.
An overall high level of quality-of-work conditions at Swedish PHCCs was identified, and our EFA identified seven important quality-of-work features. However, most of these quality-of-work features were associated with de-creased HbA1c level in the controlled group ( 52 mmol/mol). Only the qual-ity-of-work feature “Individualized treatment” was associated with decreased HbA1c level among people in the intermediate (53–69 mmol/mol) and uncon-trolled ( 70 mmol/mol) groups. However, all findings included in this disser-tation must be interpreted with caution because the small effect sizes may not be clinically relevant.
51
Personnel resources The present thesis reveals changes in Swedish primary diabetes care between 2006 and 2013, with increases in the education level of RNs and higher levels of RNs staffing in terms of WTE RNs/500 people with T2DM. The level of diabetes-specific education of RNs was associated with both a decreased HbA1c level in the total population and a decreased risk of early death among people aged < 55 years, while their level of pedagogical education was asso-ciated with a previously unidentified decreased risk of early death in men. It has been identified that a central cornerstone to the provision of high-quality care is the possibilities for RNs and GPs to undertake further postgraduate education and training in diabetes mellitus (108). However, evaluating the ef-fects of the RNs’ educational level on patient outcomes was viewed as prob-lematic in a Cochrane review by Loveman et al. (76) because of insufficient information about the definition of a diabetes-educated RN. Several RCTs that included multifaceted interventions (91, 96, 97) also included additional edu-cation for RNs and GPs, however, these studies reported no associated im-provement in patients’ HbA1c levels, and distinguishing an independent effect of postgraduate education was impossible.
Because the questionnaire used in the present thesis asked RNs to report the number of ECTS credits that they had obtained, the findings are unique. Further, they might be applicable to other European countries. Interestingly, sex differences between an association of RN pedagogical education with the risk of early death were found, with a decreased risk of early death observed only in men. One possible explanation for this is that men may are less willing than women to discuss issues concerning the disease, a situation that the RN’s pedagogical expertise can help resolve (109). However, a systematic and meta-analysis by Galdas et al. (110), identified no support for sex differences in the requirements for self-management support for people with chronic con-ditions, and explicitly stated the need for more evidence.
Staffing levels of RNs (WTE RNs/500 people with T2DM) increased dur-ing the seven years of follow-up, however no associations of staffing levels of RNs with HbA1c level or risk of early death were found. However, the length of regular visits to RNs was associated with a decrease in HbA1c level (–0.19 mmol/mol for each additional 15 minutes), although this effect was marginal. A qualitative study conducted in Sweden including people with T1DM and T2DM reported that support from the diabetes care team is crucial and that this care should address the patient’s individual needs regarding access, con-tent, treatment and the emotional aspects of living with the disease (111). It is possible that those PHCCs with more time for patient visits with RNs can ac-commodate these needs to a greater extent, which may facilitate improvement in glycaemic control. However, the present thesis did not consider these needs.
Access to GPs (i.e., each additional WTE GP/500 people with T2DM) were not significantly associated with decreased HbA1c levels, although they were
52
associated with a decreased risk of early death in people with T2DM. This should be interpreted in relation to the substantial variation between GPs staff-ing of the PHCCs included in this study: an SD of 4.1 for a mean of 7.1, which is a major concern. The International Health Policy Survey in 2015 of about 2,900 GPs reported that one third could not arrange for patients’ to choose their caregiver and always see the same caregiver (112), which is seen as a prerequisite for people with T2DM (111). An aggregated analysis of the re-sponses of GPs found that those who stated that the organization of their PHCC was well-prepared to handle people with chronic conditions were also more likely to have more patients reporting an overall better impression, good reputation and increased patient participation (112).
Organizational features The follow-up revealed that although the RNs diabetes-specific education level increased, the level of provision of group education programs by PHCCs remained low. Attendance at those PHCCs that provided group education pro-grams was associated with decreased HbA1c levels but increased risk of early death. The low level of provision of group education programs in Swedish primary diabetes care may be explained by the perceived high workload of the RNs (113). Comparison of the present findings with those of other studies confirms that group education is associated with reduced HbA1c levels for people with T2DM (80, 81). However, the association of group education pro-grams with an increased risk of early death is probably due to confounding by indication. Thus, in those PHCCs that provided group education programs, only a minority of people with T2DM attended these sessions. However, is-sues concerning barriers to implementation of group education programs in Swedish PHCCs need to be further investigated.
Another finding in the present thesis was that attendance at PHCCs report-ing that they had diabetes teams including a GP and RN was associated with decreased HbA1c level, although this effect was marginal. RNs and GPs are often the main care providers in the diabetes team, which can be supported by other health-care professionals; however, the most important individual in the diabetes team is the person who lives with T2DM (21). A systematic review and meta-analysis demonstrated that quality improvement strategies including the use of multidisciplinary teams or including changes in the structure of di-abetes teams were associated with 0.57% lower HbA1c levels (95% CI 0.42–0.71; 48 trials) (85). However, a cross-sectional study including 83 health-care professionals at 30 PHCCs and 752 people with T2DM showed no associations between team-work and glycaemic control (114). In view of the marginal effects we ob-served, we did not investigate other mediating factors such as team communi-cation and team climate (115) which could have helped us understand this

53
complex construct. It has been reported that a successful diabetes team is char-acterized by active participation of both the health-care professionals and the people with T2DM (116).
The follow-up also identified that the use of a review system had increased over recent years and that the use of call–recall systems remained high, with almost all PHCCs using a call–recall system for RNs and four-fifths using one for GPs. However, the present thesis produced confusing results regarding the use of call–recall systems for GPs, indicating that they were associated with increased HbA1c levels and increased risk of early death. The arguments for using call–recall systems are mainly that they can reduce the risk of worse patient outcomes and can provide structured care that ensures that people visit the GPs or RNs (82, 85). A possible explanation of our finding of the reverse effects of GP call–recall systems is that it is the result of confounding by in-dication. In this case, this implies that PHCCs that use call–recall systems bet-ter identify those people who are at increased risk (elevated HbA1c levels or risk of early death). Therefore, a call–recall system could be an organizational feature implemented to provide more structured primary diabetes care rather than as a risk factor. Another perspective is that the use of a call–recall system might, rather than being beneficial for people with T2DM, increase the work-load for health-care professionals by requiring more administration. Although we did not find an association of outcomes with having a system that checked whether patients visited the RNs or GPs, it should be considered which of these systems would be more effective to limit the amount of time spent on administration. However, the main concern that should be addressed is how organizational features can be designed to help the number of people with T2DM who have uncontrolled HbA1c levels to achieve optimal glyceamic control.
Even though the consensus from both international (38) and Swedish na-tional guidelines for diabetes care (21) promotes the inclusion of the patient in setting treatment goals, only 30%–54% (depending on treatment targets) of health-care professionals at the Swedish PHCCs reported that they did so. A possible explanation of the low level of patient participation may be related to a qualitative study (117) including 10 Swedish diabetes specialist nurses and 44 people with T2DM, which showed that nurses perceive a struggle to deal with authority, which increases the risk of diminishing people with T2DM autonomy. Also, Swedish nurses may require additional skills to support pa-tients’ self-management (118, 119). The importance of including the patient in individualized goal setting could also be interpreted in relation to an RCT study (94) that showed that structured personal care including individualized goal setting combined with patient education and surveillance support for peo-ple with T2DM was associated with a significant reduction in HbA1c to a median level of 78 mmol/mol (IQR 70–89) compared with the 83 mmol/mol (IQR 73–98) achieved with routine care (P 0.001).

54
Quality of work Although the majority of PHCCs were reported to provide an overall high quality of work, only one feature, individualized treatment, was associated with decreased HbA1c level among people in the uncontrolled group. This quality-of-work feature was assessed by two questions concerning goal-ori-ented drug therapy and intervention strategies targeted to people with poor outcomes. A major concern that should be addressed is that the people with uncontrolled glycaemic control seem not to be influenced by either personnel resources, organizational features, or quality of work. These findings are con-sistent with those of a systematic review (120) including data from 42 studies across four continents, which showed that people with uncontrolled HbA1c level (i.e., defined in the review as 59 mmol/mol) had modest to no improve-ment from interventions conducted in a PHC setting. The meta-regression analysis also showed that people with an HbA1c level of 9.5% (89 mmol/mol) benefited most from the interventions. In our study, we did not explore the multifactorial treatment approach for each patient, which might have shed more light on the mechanisms underlying our findings. We can only speculate that perhaps for people with uncontrolled HbA1c level the organization of di-abetes care is much less important than multifactorial treatment (37).
General discussion The rationale of the work described in the present thesis was to add to knowledge about the aspects of real-life clinical practice in the Swedish PHC, particularly the personnel resources, organizational features and quality of work of PHCCs, which influence the ability of people with T2DM to achieve their treatment goals for HbA1c and decrease their risk of early death. The findings reported in the present thesis suggest that the organization of diabetes care is associated with only marginal effects on HbA1c levels and the risk of early death.
During recent years there has been substantial focus on the organization of diabetes care, especially because the prevalence of T2DM is increasing dra-matically (1). It is well-known that the nature of primary diabetes care differs between and within countries (4); however, disparities in care might lead to poorer health outcomes (121). Even though primary diabetes care is struggling to provide care for all people with T2DM, there is an endeavour to provide good and equal first-line care to all. Key barriers to the provision of a high quality of care may include the demands of waiting time, availability, state cooperation and financial incentives. At the same time, the PHCCs may need to adjust the care they offer based on national guidelines, the national perspec-tive on knowledge management and results from the NDR, as well as reports published by SALAR. Thus, the gap between the ideal world and real life is

55
not new (122, 123). Although, the Swedish national guidelines (21) and other guidelines for management of T2DM (124-126) should be used as guidance and the foundation of scientific priorities in primary diabetes care, only a lim-ited proportion of patients are aware of this at their actual visit (127). It has been reported that the recommendations of the National guidelines do not ad-equately reach health-care professionals or patients. Therefore, to eliminate this problem, SALAR implemented a new organizational model in 2017 that is based on three levels: micro (health-care professional teams), meso (county councils/regions) and macro (national), with the aim of reducing the gap be-tween the ideal and actual world.
Although a new organizational model has been implemented that aims to reduce this gap, more research is required on how an optimal diabetes care organization should be designed to allow full understanding of its relationship with patient outcomes (85). The generalizability of much published research on this issue is problematic, because all previous reviews (84-88) report the existence of heterogeneous studies based on different multifaceted interven-tions, in mixed settings, and including both T1DM and T2DM patients in the same study. In addition, these reviews include studies from diverse continents. The complexity of multifaceted interventions is described in Table 1, which indicates that only two studies, that of Janssen et al. (91) and Griffin et al. (90), found decreases in the HbA1c levels after one year and after 5 years of follow-up, respectively. However, these findings must be interpreted in terms of their aims to examine the effects of early multifactorial treatment, rather than the effects of changes in the organization of diabetes care, on patients’ achievement of reduced HbA1c levels. In addition, the results of Janssen et al. (91) were derived from the same research project as those of Griffin et al. (90). Multifaceted interventions targeting aspects of both personnel resources and organization may make it difficult to distinguish separate effects that the work described in the present thesis might be able to detect. In addition, an obser-vational study conducted in the United Kingdom showed that organizational factors (i.e., clinical recording, education and training of nursing personnel) rather than staffing levels were the strongest predictors of quality of care (75).
The main insight from this thesis is that the organization of diabetes care in the Swedish PHC setting is variable, although it must be noted that each county council/region is free to decide the organization of their diabetes care, and priorities are affected by difficulties in implementation, cost-effectiveness and their effect. A possible way forward in providing more tailored diabetes care could be to establish certified diabetes clinics. An argument for this is the combination of the complexity of heterogeneous diabetes disease and the rapid development of technological and medical treatments, which places great de-mands on GPs and other personnel. In 2016, certified clinics were established in the Skåne region based on specific criteria; e.g., having RNs with a mini-mum of 15 ECTS credits in diabetes-specific education who work in diabetes teams (128). However, the results indicate that this initiative resulted in no
56
improvement in HbA1c after one year and that PHCCs including more people with controlled T2DM were more likely to be certified than PHCCs including more people with uncontrolled T2DM (129). Thus, the “one size fits all” con-cept might not be right pathway to caring for people with T2DM (130).
Time to go beyond glycaemic control Two of the four studies included in this thesis (Studies II and III) addressed only glycaemic control as the main outcome. However, it is time to go beyond glycaemic control. Although HbA1c level is the gold-standard patient out-come, it is time to change the focus to include other factors of major interest. The pathways to high quality of diabetes care are complex and multidimen-sional (131) and, to understand fully how optimal diabetes care could be achieved, measures such as the quality of life of people with T2DM and their experiences of the organization of diabetes care should be taken into consid-eration. According to the Donabedian model (72), the structure of health care influences the actual care provided (process indicators) and resulting in con-sequences of care (surrogate and hard outcomes). However, what is not men-tioned in this explanatory model is inter-personal care; e.g., interactions be-tween health-care professionals and people with T2DM. Socio-demographic characteristics (121), health need (119) and health beliefs (132) are other fac-tors that influence the possibility of achieving the desired patient outcomes. The present thesis used a research design in which these factors were not con-sidered. Performing such a study requires a different research design and it is questionable whether it is even possible to carry out such a study on a total population. However, the lack of consideration of these attributes is a possible cause of the weakness of the effects found in the present thesis. A previous population-based cohort study showed that people with self-rated poor health were at higher risk of mortality (133). Therefore, it is important to highlight other aspects to allow people to achieve their treatment targets or decrease their risk of early death.
Because people with T2DM visit the GP and RN only once a year each, and it is the people with T2DM who have the daily responsibility of managing their disease, it may be insufficient to address only the impact of diabetes care and not consider the perspective of self-management by the person with T2DM. In addition, even if there is a well-organized primary diabetes care system with diabetes-educated health-care professionals who promote healthy behaviour for people with T2DM, there is a need for both engagement and motivation by the people with T2DM to achieve change. However, the overall goal of the health system is to provide a high quality of diabetes care that is accessible and distributed equitably to everyone who needs it. Thus, the an-swer to the question about whether key features of successful Swedish primary diabetes care are a reality or fiction is that yes, although fiction might occur,
57
from now on the person with T2DM should be the main decision maker about whether successful key features are a reality.
Methodological considerations Strengths The major strength of all the studies included in this thesis is the large sample size of included PHCCs and people with T2DM. This increases the possibili-ties of identifying associations that are clinically relevant for people with T2DM. There is a minimal risk of selection bias with such a large sample size, and about 90% of all people with T2DM in Sweden are included in the NDR, which minimizes both selection and sampling bias. The present thesis adds important knowledge about associations between the organization of diabetes care in a real-life clinical practice and HbA1c levels in people with T2DM. The use of the Swed-QOP questionnaire made it possible to compile an overall picture of the management of primary diabetes care. Utilization of the web-based survey program facilitated both monitoring the response rate and send-ing out reminders. In addition, the web-based survey program allowed us to define the proportion of non-responding PHCCs based on whether the PHCC managers opened the questionnaire.
Study I was the first longitudinal cross-sectional study to be conducted in Swedish primary diabetes care. A major strength with this follow-up was the inclusion of more than 70% of all PHCCs in both years, which increased the generalizability of the results for Swedish primary diabetes care. For Studies II, III and IV, we only included PHCCs with at least 30 people registered in the NDR to provide a representative sample and to diminish the risk of selec-tion bias. Study II provided information about both the independent and sim-ultaneous effects of the variables included. In Study III, the utilization of EFA made it possible to identify seven quality-of-work features, which should be seen as complimentary information about success factors in primary diabetes care and not a replication. In Study IV, we stratified the findings by age, sex and HbA1c level, because these have been reported to be risk factors for the outcome of all-cause mortality. This stratification allowed us to identify more interesting findings. Results from the GEE (Study II and III) and Cox regres-sion (Study IV) analyses provided information on both P values and 95% CIs to allow a more detailed description. It must be mentioned that even though there is a significant difference between exposure and outcome, caution must be used in interpreting both estimated and 95% CIs.

58
Limitations The major limitation of the present studies is the validity of the Swed-QOP questionnaire, which increases the risk of a discrepancy between the theoreti-cal and operational definitions. The quality of a questionnaire should be based on its validity and reliability. However, the questions in the Swed-QOP ques-tionnaire regarding quality of work were face-validity tested, during which we obtained expert opinions about their usefulness and relevance. Reliability con-cerns the precision of measurement and if high reliability occurs there is low risk of random errors. In 2006, the Swed-QOP questionnaire was reliability tested and corrections were made. Another limitation with the questionnaire is the lack of questions concerning RNs further training other than their edu-cational level and GPs postgraduate education or experience. In addition, the questionnaire only assessed whether personnel resources, organizational fea-tures and quality of work were prevalent but not how these resources or fea-tures were used in actual clinical practice. This might contribute to reducing understanding and misclassification with participants placed in an incorrect category. The Swed-QOP questionnaire is based on self-reported data from PHCC managers. A possible limitation in these studies is the risk of selection bias because of the risk of including only those PHCCs having the greatest interest in providing an overall high-quality primary diabetes care. Therefore, there is a risk of a skewed picture of reality. However, 19 of 21 county coun-cils/regions had a response rate of 70%. Being limited to self-reported data increases the risk for information bias, which can be described as reporting false or inaccurate answers and the misinterpretation of questions, and is a major concern. The Swed-QOP questionnaire did not include definitions of terms for e.g., call–recall system, individual counselling or group education, which increased the risk of misinterpretation. To reduce the risk of misinter-pretation, we encouraged PHCC managers to answer the questionnaire to-gether with other personnel who had the most contact with people with T2DM.
In Study III, an EFA was used to identify underlying clusters of variables. One source of weakness in the applied EFA was the retention of those factors that were represented by two questions. It can be argued that a factor with fewer than three items is weak. However, by using a large sample size, the item number can be reduced and the item be retained as a strong factor. In Study IV, a limitation is that we only had baseline data on baseline and could not account for any changes at follow-up. We also assumed that the patient attended the same PHCC during the follow-up period. This may have intro-duced confounding; however, given our short follow-up time these effects should have a low impact on the outcome.
A limitation is the use of simple imputation method such as LOCF to im-pute individual clinical level data for missing values. The limitation of LOCF is that simple imputation does not take into consideration the uncertainty of imputations, which may result in inaccurate results. However, because the

59
NDR used LOCF as a standard method and because of practical constraints, multiple imputation was not applied. All studies included in this thesis are observational studies and conclusions about causal relationships cannot be drawn. It became evident that confounding by indication is probably prevalent, especially in the two cross-sectional Studies, II and III. Confounding by indi-cation most likely the explanation of the observed associations between per-sonnel resources, organizational features and quality-of-work features and in-creased HbA1c levels and increased risk of early death.
Moreover, some of the studies involve the testing of many separate null hypotheses, which may entail problems with inflated Type I error rates. This should be taken into consideration when interpreting the results, and the reader may wish to apply a more stringent criterion for statistical significance level than the conventional P < 0.05 (e.g., apply a Bonferroni correction). However, it should be noted that Bonferroni correction concerns the universal null hy-pothesis that all the tested null hypotheses are simultaneously true, which was not of interest in any of the studies. Thus, the P values are always valid, con-ditional on the restriction that each hypothesis test is considered separately.

60
Conclusions
This thesis describes the extent of changes in Swedish primary diabetes care between 2006 and 2013, and identifies associations of personnel resources, organizational features and quality-of-work features with HbA1c levels and all-cause mortality. To summarize the results of the studies reported in this thesis, personnel resources that could be valuable in caring for people with T2DM include the RNs’ educational level, longer patient visits to RNs and the access to sufficient GPs. Organizational features such as PHCCs offering group education programs and having diabetes teams were associated with decreased HbA1c levels. Although there have been some changes in the or-ganization of Swedish primary diabetes care, there is still scope for further improvement, including the provision of group education programs and in-volving the people with T2DM in the goal setting of their treatment targets. PHCCs reported an overall high level of quality-of-work conditions, although the only quality-of-work feature found to be associated with decreased HbA1c levels in all groups was individualized treatment. However, most of the qual-ity-of-work features were associated with decreased HbA1c level in the group with controlled HbA1c. Thus, more strategies are needed to support people with uncontrolled HbA1c.
Overall, this thesis adds to previous work on significant but less pro-nounced key features for successful organization of primary diabetes care. The results reported in this dissertation indicate that the care of people with T2DM is complex, which makes it difficult to identify specific success factors for all people living with T2DM. The results of the studies included in this disserta-tion do not support a need for certified diabetes clinics for people with T2DM to achieve patient outcomes. This suggests that there is still scope for further evidence to fully understand the real-life clinical associations between the or-ganization of primary diabetes care and glycaemic control and risk of early death in people with T2DM.

61
Future studies
Results reported in the current thesis suggest new aspects for future studies. The concept of providing optimal primary diabetes care is mainly addressed from the perspective of the health-care professionals and not from that of the people with T2DM. A government proposition in (2017/18:83) concluded that the future requires new tools within the PHC systems to support the growing population of people with chronic diseases (134). Thus, increased investment in strengthening information about the patients’ perspectives is a necessary investment. A report by the Swedish Agency for Health and Care Services shows that there are challenges in involving people’s experiences and to make them participate in their own care (135). Therefore, in the future new tools will be needed to accommodate the needs of people with T2DM. Conse-quently, the NDR has developed PROM and PREM that include topics con-cerning how to live a good life with diabetes and feelings about the diabetes disease (PROM) and support from the diabetes care team (PREM) (19). These tools of PROM and PREM provide additional support for GPs or RNs at pa-tient visits to allow them to address peoples’ needs to increase the possibility that more people achieve national treatment targets.
62
Svensk sammanfattning (Summary in Swedish)
Sverige erbjuder den främsta diabetesvården i Europa vilket till stor del beror på ett omfattande användande av det svenska Nationella diabetesregistret (NDR), Socialstyrelsens Nationella riktlinjer för diabetesvård och mycket subventionerade priser på läkemedel och sjukvårdsbesök. Detta till trots visar resultaten från NDR att endast hälften av personer med typ 2-diabetes i pri-märvården uppnådde en tillfredställande måluppfyllelse för HbA1c (52,9 %) år 2013. Idag finns bristande evidens om vilka faktorer inom svensk diabetes-vård i primärvården som kan få personer med typ 2-diabetes att uppnå en god glykemisk kontroll. Majoriteten av personer med typ 2-diabetes får sin vård i primärvården och givet en ökad prevalens av typ 2-diabetes blir behovet av primärvården ännu större. Organiseringen av vården är en komplex process och det finns inte någon motsvarande totalundersökning genomförd i Sverige. Resultaten från avhandlingen kan därför komma att kunna utgöra ett underlag för bättre prioriteringar i diabetesvården. Det är av betydelse att utvärdera hur vården ser ut i förhållande till den evidens som finns angående dess optimala organisation och arbetssätt, för att patienterna skall få en vård som hjälper dem att nå optimala behandlingsmål samt undvika komplikationer och en för tidig död. Det övergripande syftet med detta forskningsprojekt är att bidra med evidens angående förändringar av Sveriges diabetesvård i primärvården mellan 2006 och 2013, samt att undersöka om det finns samband mellan arbetssätt och per-sonella resurser inom primärvården och nivå av HbA1c och totalmortalitet, samt undersöka sambandet mellan kvalitetsarbete och nivå av HbA1c för per-soner med typ 2-diabetes.
Syftet med Studie I var att beskriva hur diabetesvårdens organisation 2013 avseende personella resurser och arbetssätt skiljer sig från förhållandena 2006. Studien genomfördes som en kartläggning av diabetesvårdens organisation för personer med typ 2-diabetes. Denna longitudinella tvärsnittsstudie inklude-rade alla landets vårdcentraler vid den aktuella tidpunkten för datainsamling d.v.s. 2006 och 2013. År 2006 besvarade totalt 684 (74,3 %) av landets 921 vårdcentraler år 2006 ett formulär om diabetesvårdens organisation och år 2013 besvarade 880 (76,4 %) av 1152 vårdcentraler i landet formuläret. Stu-dien visade att vårdcentralerna i Sverige har blivit fler medan antalet personer
63
listade på vårdcentralen har minskat. Antalet heltidssjukskötersketjänster per 500 personer med typ 2-diabetes varierade stort i landet (från 0.52 till 1.12). Samtidigt visar studien att ingen förändring skett vad gäller hur vanligt det är att bedriva grupputbildningsprogram (en fjärdedel vid båda tidpunkterna) eller att inkludera personer med typ 2-diabetes när behandlingsmål ska sättas.
Syftet med Studie II var att undersöka sambandet mellan vårdcentralers organisering av diabetesvården avseende personella resurser, arbetssätt och HbA1c nivån för personer med typ 2-diabetes. Studien inkluderade 846 (73 %) vårdcentraler som besvarat formuläret 2013 och 230 958 personer med typ 2-diabetes som hade kliniska data registrerade på dessa vårdcentraler i NDR. Individdata kompletterades med socioekonomisk status och samsjuklighet. Studien visade att det fanns ett samband mellan ett högre medelantal högsko-lepoäng i diabetesspecifik utbildning för sjuksköterskor på en vårdcentral samt mer avsatt tid för återbesök till sjuksköterska och minskat långtidsblod-socker (HbA1c). Ett oväntat resultat var att mer tid avsatt för återbesök till läkare kopplat till ökat långtidsblodsocker. De organisatoriska variabler som visade sig ha samband med minskat långtidsblodsocker var om vårdcentraler bedrev grupputbildningsprogram eller hade diabetesteam.
Syftet med Studie III var att undersöka sambandet mellan vårdcentralers kvalitetsarbete och HbA1c nivån för personer med typ 2-diabetes. Totalt in-kluderades 846 (73 %) vårdcentraler och 230 958 personer med typ 2-diabe-tes. En explorativ faktoranalys identifierade totalt sju faktorer för kvalitetsar-bete. Dessa faktorer var: 1. Kallelsesystem baserat på patientens behov, 2. Individualiserad behandlingsplan, 3. Vårdcentralens resultat alltid på agendan, 4. Regionala riktlinjer, 5. Uppföljning och återkoppling, 6. Kultur och prevention, 7. Strategier och ansvar. Mer än hälften (56 %) av de inkluderade personerna med typ 2-diabetes till-hörde gruppen med kontrollerat låntidsblodsocker (≤ 52 mmol/mol), en mino-ritet (12 %) hade dåligt kontrollerat långtidsblodsocker (≥ 70 mmol/mol) och resterande (32 %) av gruppen hade acceptabel långtidsblodsockernivå (53-69 mmol/mol). Fler faktorer (Kallelsesystem baserat på patientens behov, Indivi-dualiserad behandlingsplan, Vårdcentralens resultat alltid på agendan samt Strategier och ansvar) var kopplat till ett lägre långtidsblodsocker för personer med kontrollerat långtidsblodsocker jämfört med de med som låg på 53-69 mmol/mol och för de med okontrollerat långtidsblodsocker var det endast In-dividualiserad behandlingsplan som var kopplat till ett lägre långtidsblod-socker.
Syftet med Studie IV var att identifiera samband mellan vårdcentralers organisering av diabetesvård avseende personella resurser, arbetssätt och ris-
64
ken för en för tidig död för personer med typ 2-diabetes. I denna studie inklu-derades 787 vårdcentraler med 187 570 personer med typ 2-diabetes. Från det svenska folkbokföringsregistret hämtades information angående datum för död och emigration. Personerna följdes från det senaste besöket på vårdcen-traler under 2013 till uppföljningens slutdatum den 30 januari 2018. Totalt hade 27 136 personer med typ 2-diabetes avlidit under denna tid. Resultaten visade att personer med typ 2-diabetes som besökte vårdcentraler med god tillgång till heltidsallmänläkare hade en lägre risk för en för tidig död. Samti-digt visade subgruppsanalyser att ett högre medelantal högskolepoäng i dia-betesspecifik utbildning bland sjuksköterskor på en vårdcentral var kopplat till en minskad risk för en för tidig död bland personer som var 55 år och yngre. Även hittades ett samband mellan vårdcentraler som hade sjuksköterskor med ett högre medelantal högskolepoäng i pedagogisk utbildning och minskad risk för en för tidig död. Motsatta samband, d.v.s. en ökad risk för en för tidig död hittades för vårdcentraler som erbjöd grupputbildningsprogram och de vård-centraler som hade kallelsesystem till läkare.
Sammanfattningsvis är organiseringen av diabetesvården i primärvården i för-hållande till möjligheten för personer med typ 2-diabetes att uppnå uppsatta behandlingsmål för långtidsblodsocker och risken för en förtidig död ett feno-men som är svårt att studera. Även om studierna i denna avhandling belyser faktorer inom diabetesvården i primärvården som kan vara av betydelse för HbA1c nivån bland personer med typ 2-diabetes behövs mer kunskap om på vilket sätt dessa faktorer kan användas för att skapa en optimal diabetesvård för de som behandlas i primärvården.

65
Acknowledgements
The completion of my PhD has been highly inspiring and challenging for me. I am so grateful to all the people who supported me and provided me with guidance through this journey. First and foremost, I would like to express my deepest gratitude to my main supervisor Andreas Rosenblad, who has given me valuable advice, and guid-ance throughout this process. I cannot repay you for your indefatigable efforts to teach me about epidemiology and all statistical methods. You have always been there to support me when I struggle to understand. Thank you for all the support and encouragement! Eva Thors Adolfsson, my supervisor. Because of You I had the opportunity to explore this amazing world of science. I am extremely fortunate to enjoy your endless support and patience. You are my role model in many aspects, and your style of supervision is something I will bring to my future doctoral students. Janeth Leksell, my supervisor. I admire your fire and passion to always have the best intentions for people with diabetes. I cannot recall a single day you have not supported me through my journey. You are an amazing woman! Ann-Marie Svensson, Björn Eliasson, Jan Stålhammar, Lars Jerdén, Lars Steen, Stefan Jansson, Thorne Wallman, my research group. All of you accompanied me on this journey, for which I am incredibly thankful. Your advice, wise comments and clarity has been of considerable value to me. Lisa Söderström, my former room-mate and friend. You are an extraordinary person. Everyone should have someone like you as their room-mate and friend. Despite my endless questions concerning anything you always took your time to answer, despite how much work you have. Katina Pettersson, my PhD colleague and friend. You always light up our workplace with laughter and energy. You are truly a “yellow person” (not with liver disease) but as personality ha ha. Thank you for making me laugh when I needed it the most.

66
Megha Bendre, my current room-mate. Thank you for always taking the time to answer my questions. I really liked our conversations from those about var-ied topics concerning statistics to the Indian vs Swedish culture, which many times ended in a rush with you almost missing the bus. Birgitta Kerstis, my mentor. Thank you for the guidance and support, you have been so valuable to me when I have struggled the most as a PhD student. You are fantastic! Kent Nilsson, the head of the CKF. I appreciated the support and your always thoughtful questions and feedback. Mats Enlund, former head of CKF. Thank you for giving me the opportunity to be a PhD student at CKF and for the encouragement and support. Jerzy Leppert, Leif Bergkvist, and Abbas Chabok, professors and associ-ated professor at CKF. Warm thanks for the support, encouragement and dis-cussions we had during these years, I appreciated it! Maria Dell’Uva Karlsson, Maria Pettersson and Mariana Ehn, our amaz-ing secretaries at CKF. I would like to refer to you as the three musketeers. Thanks for endless support on practical matters as well as the constant encour-agement through my journey. I am glad that I have shared my journey with all former and present PhD students at the CKF and, thanks for letting me be a part of yours. Many glad memories from all of you! Frida, Mikael, Julia, Tobias, Johanna, and Karin, my amazing friends who supported me through this journey. Thanks for the much-needed non-scien-tific talks with lots of laughter. Anne and Tommy, my mother and diamond dad. No words can express my gratitude towards your endless support during this period of time reflecting the PhD student’s frustration and happiness. You have, no matter the circum-stances always been there to support me when I needed to talk or just needed a hug. Helge and Monica, my father and diamond mum. Since I was a little child you encouraged me to always to do my best and to be curious, which is prob-ably the reason why I today love science. I am so grateful that you are in my family contributing with endless support and lots of love.

67
Alexander, Alice, Elisabeth, Linda and Sofia, my siblings. Thank you for the support and love during this period of time. Elisabeth, my little sister, thank you for being one of the most important people in my life and for being my best friend through life. Giacomo, my love, you are a rock! Thank you for listening to my ramblings about my work and deadlines. You have always been there with patience, en-couragement, endless love and support. The future is ours. I love you! Finally, I would like to thank all of the participating managers of PHCCs and people with T2DM for their contribution to this thesis!
68
References
1. Cho NH, Shaw JE, Karuranga S, Huang Y, da Rocha Fernandes JD, Ohlrogge AW, et al. IDF Diabetes Atlas: Global estimates of diabetes prevalence for 2017 and projections for 2045. Diabetes Res Clin Pract. 2018;138:271–81.
2. Khunti K, Seidu S. Diabetes research in primary care: fiction, reality or es-sential? Diabet Med. 2018;35(7):832–4.
3. World Health Organization [WHO]. Global report on diabetes. Geneva: World Health Organization; 2016. p. 1–88.
4. European Coalition for Diabetes. Diabetes in Europe: Policy Puzzle, The State We Are In. European Coalition for Diabetes; 2014. p. 1–164.
5. Government Offices of Sweden [Socialdepartementet]. General practitioners – a simpler and safer healthcare [Husläkare – en enklare och tryggare sjukvård SOU 1978/74] (in Swedish). Stockholm: Government Offices of Sweden; 1978.
6. The Swedish Parliament [Sveriges Riksdag]. Swedish Health Care Law [Hälso- och sjukvårdslag SFS 1982:763]. 1982.
7. Swartling P. The history of Swedish general medicine [Den svenska allmän-medicinens historia] (in Swedish). Läkartidningen. 2006;109(24–25).
8. The Swedish Parliament [Sveriges Riksdag]. Swedish law of freedom of choice system [Lag om valfrihetssystem SFS 2008:962]. 2008.
9. The National Board of Health and Welfare [Socialstyrelsen]. Introduction of healthcare choices [Införandet av vårdval i primärvården] (in Swedish). Stockholm: The National Board of Health and Welfare; 2010. p. 1–29.
10. Swedish Diabetes Association [Diabetesförbundet]. Our history [Vår histo-ria] (in Swedish) [Available from: https://www.diabetes.se/om-oss/or-ganisation/historia/]
11. Östman J. Diabetes treatment in a 100-year perspective [Diabetesbehand-lingen i ett 100-årigt perspektiv] (in Swedish). Läkartidningen. 2004;101(51–52).
12. Diabetes care and research in Europe: The Saint Vincent declaration. Diabet Med. 1990;7(4):360.
13 Reiber GE, King, Hilary & World Health Organization. Division of Non-communicable Diseases and Health Technology. Guidelines for the de-velopment of a national programme for diabetes mellitus. Prepared by Gayle E. Reiber and Hilary King. Geneva; 1991.
14. Eliasson B, Gudbjornsdottir S. Diabetes care-improvement through measure-ment. Diabetes Res Clin Pract. 2014;106 Suppl 2:S291–4.
15. The National Board of Health and Welfare [Socialstyrelsen]. Nationella Dia-betes Registret med SWEDIABKIDS [Available from:https://www.so-cialstyrelsen.se/register/registerservice/nationellakvalitetsregis-ter/ndrnationelladiabetesregistret] (Last accessed 3 January 2019).

69
16. Adolfsson ET, Rosenblad A. Reporting systems, reporting rates and com-pleteness of data reported from primary healthcare to a Swedish quality register–the National Diabetes Register. Int J Med Inform. 2011;80(9):663–8.
17. Centre of Registers Region Västra Götaland [Registercentrum Västra Götal-and]. The National Diabetes Register: Annual report 2007 [Nationella Diabetesregistret: Årsrapport 2007] (in Swedish). Göteborg: Centre of Registers; 2007. p. 1–97.
18. Centre of Registers Region Västra Götaland [Registercentrum Västra Götal-and]. National Diabetes Register: Annual report 2017 [Nationella Diabe-tes Registret: Årsrapport 2017] (in Swedish). Göteborg: Centre of Regis-ters Region Västra Götaland; 2017. p. 1–59.
19. Svedbo Engstrom M, Leksell J, Johansson UB, Eeg-Olofsson K, Borg S, Pa-laszewski B, et al. A disease-specific questionnaire for measuring pa-tient-reported outcomes and experiences in the Swedish National Diabe-tes Register: Development and evaluation of content validity, face valid-ity, and test-retest reliability. Patient Educ Couns. 2018;101(1):139–46.
20. The National Board of Health and Welfare [Socialstyrelsen]. National guide-lines for care and treatments of patients with diabetes mellitus [Nationella riktlinjer för vård och behandling vid diabetes mellitus] (in Swedish). Stockholm: The National Board of Health and Welfare; 1996.
21. The National Board of Health and Welfare [Socialstyrelsen]. National guide-lines for diabetes care – Support for governance and management [Na-tionella riktlinjer för diabetesvård – Stöd för styrning och ledning] (in Swedish). Stockholm: The National Board of Health and Welfare; 2018. p. 1–135.
22. Adolfsson ET, Rosenblad A, Wikblad K. The Swedish National Survey of the Quality and Organization of Diabetes Care in Primary Healthcare-Swed-QOP. Prim Care Diabetes. 2010;4(2):91–7.
23. Swedish Medical Products Agency [Läkemedelsverket]. Drug treatment for glucose control in type 2 diabetes: treatment recommendations [Läkeme-delsbehandling för glukoskontroll vid typ 2-diabetes: behandlingsrekom-mendationer] (in Swedish). Swedish Medical Products Agency; 2017. p. 29–48.
24. Swedish Medical Products Agency [Läkemedelsverket]. To prevent athe-rosclerosis heart disease with medicines–reatment recommendations [Att förebygga aterosklerotisk hjärt-kärlsjukdom med läkemedel-behand-lingsrekommendation] (in Swedish). Swedish Medical Products Agency; 2014. p. 20–33.
25. Swedish Association of Local Authorities and Regions [Sveriges Kommuner och Landsting]. Swedish Association of Local Authorities and Regions: Members and employers’ organisation 2018 [Available from: https://skl.se/tjanster/englishpages.411.html] (Last accessed in 3 decem-ber 2018).
26. Swedish Association of Local Authorities and Regions [Sveriges Kommuner och Landsting]. County councils/regions system for knowledge manage-ment [Landsting och regioners system för kunskapsstyrning] (in Swe-dish): Swedish Association of Local Authorities and Regions: [Available from: https://skl.se/halsasjukvard/kunskapsstodvardochbehandling/sys-temforkunskapsstyrning.14031.html] (Last accessed 3 January 2019).
70
27. Swedish Association of Local Authorities and Regions [Sveriges Kommuner och Landsting]. Success factors in Swedish diabetes care [Framgångs-faktorer i diabetesvården] (in Swedish). Stockholm: Swedish Association of Local Authorities and Regions; 2013. p. 1–68.
28. Felton A-M, Hall M. Diabetes in Europe policy puzzle: The state we are in. Int Diabet Nurs. 2015;12(1):3–7.
29. Jansson SP, Fall K, Brus O, Magnuson A, Wandell P, Ostgren CJ, et al. Prev-alence and incidence of diabetes mellitus: A nationwide population-based pharmaco-epidemiological study in Sweden. Diabet Med. 2015;32(10):1319–28.
30. Grill V, Persson G, Carlsson S, Norman A, Alvarsson M, Ostensson CG, et al. Family history of diabetes in middle-aged Swedish men is a gender unrelated factor which associates with insulinopenia in newly diagnosed diabetic subjects. Diabetologia.1999;42(1):15–23.
31. Tuomilehto J, Lindström J, Eriksson JG, Valle TT, Hämäläinen H, Ilanne-Parikka P, et al. Prevention of type 2 diabetes mellitus by changes in lifestyle among subjects with impaired glucose tolerance. N Engl J Med. 2001;344(18):1343–50.
32. Carlsson S, Midthjell K, Tesfamarian MY, Grill V. Age, overweight and physical inactivity increase the risk of latent autoimmune diabetes in adults: Results from the Nord-Trøndelag health study. Diabetologia. 2007;50(1):55–8.
33. American Diabetes Association [ADA]. Diagnosis and classification of dia-betes mellitus. Diabetes Care. 2014;37(Supplement 1):S81–S90.
34. Turner RC, Cull CA, Frighi V, Holman RR. Glycemic control with diet, sul-fonylurea, metformin, or insulin in patients with type 2 diabetes mellitus: Progressive requirement for multiple therapies (UKPDS 49). UK Pro-spective Diabetes Study (UKPDS) Group. JAMA. 1999;281(21):2005–12.
35. Ahlqvist E, Storm P, Käräjämäki A, Martinell M, Dorkhan M, Carlsson A, et al. Novel subgroups of adult-onset diabetes and their association with outcomes: A data-driven cluster analysis of six variables. Lancet Diabet Endocrinol. 2018;6(5):361–9.
36. Stratton IM, Adler AI, Neil HAW, Matthews DR, Manley SE, Cull CA, et al. Association of glycaemia with macrovascular and microvascular compli-cations of type 2 diabetes (UKPDS 35): prospective observational study. BMJ. 2000;321(7258):405–12.
37. Rawshani A, Rawshani A, Franzen S, Sattar N, Eliasson B, Svensson AM, et al. Risk factors, mortality, and cardiovascular outcomes in patients with type 2 diabetes. N Engl J Med. 2018;379(7):633–44.
38. American Diabetes Association [ADA]. Standards of medical care in diabe-tes–2018 Abridged for primary care providers. Clin Diabetes. 2018;36(1):14–37.
39. The National Board of Health and Welfare [Socialstyrelsen]. Treatment tar-gets in diabetes care [Målnivåer för diabetesvård] (in Swedish). Stock-holm: The National Board of Health and Welfare; 2017. p. 1–44.
40. Shah AD, Langenberg C, Rapsomaniki E, Denaxas S, Pujades-Rodriguez M, Gale CP, et al. Type 2 diabetes and incidence of cardiovascular diseases: a cohort study in 1.9 million people. Lancet Diabet Endocrinol. 2015;3(2):105–13.

71
41. Tancredi M, Rosengren A, Svensson AM, Kosiborod M, Pivodic A, Gud-bjornsdottir S, et al. Excess mortality among persons with type 2 diabe-tes. N Engl J Med. 2015;373(18):1720–32.
42. Dawson SI, Willis J, Florkowski CM, Scott RS. All-cause mortality in insu-lin-treated diabetic patients: A 20-year follow-up. Diabet Res Clin Pract. 2008;80(1):6–9.
43. Ismail-Beigi F, Craven T, Banerji MA, Basile J, Calles J, Cohen RM, et al. Effect of intensive treatment of hyperglycaemia on microvascular out-comes in type 2 diabetes: An analysis of the ACCORD randomised trial. Lancet. 2010;376(9739):419–30.
44. Gerstein HC, Riddle MC, Kendall DM, Cohen RM, Goland R, Feinglos MN, et al. Glycemia treatment strategies in the Action to Control Cardiovas-cular Risk in Diabetes (ACCORD) trial. Am J Cardiol. 2007;99(12):34–43.
45. Patel A, MacMahon S, Chalmers J, Neal B, Billot L, Woodward M, et al. Intensive blood glucose control and vascular outcomes in patients with type 2 diabetes. N Engl J Med. 2008;358(24):2560–72.
46. Duckworth W, Abraira C, Moritz T, Reda D, Emanuele N, Reaven PD, et al. Glucose control and vascular complications in veterans with type 2 dia-betes. N Engl J Med. 2009;360(2):129–39.
47. Ray KK, Seshasai SRK, Wijesuriya S, Sivakumaran R, Nethercott S, Preiss D, et al. Effect of intensive control of glucose on cardiovascular out-comes and death in patients with diabetes mellitus: A meta-analysis of randomised controlled trials. Lancet. 2009;373(9677):1765–72.
48. Turnbull FM, Abraira C, Anderson RJ, Byington RP, Chalmers JP, Duck-worth WC, et al. Intensive glucose control and macrovascular outcomes in type 2 diabetes. Diabetologia. 2009;52(11):2288–98.
49. Oellgaard J, Gæde P, Rossing P, Rørth R, Køber L, Parving H-H, et al. Re-duced risk of heart failure with intensified multifactorial intervention in individuals with type 2 diabetes and microalbuminuria: 21 years of fol-low-up in the randomised Steno-2 study. Diabetologia. 2018;61(8):1724–33.
50. Gæde P, Vedel P, Larsen N, Jensen GV, Parving H-H, Pedersen O. Multifac-torial intervention and cardiovascular disease in patients with type 2 dia-betes. N Engl J of Med. 2003;348(5):383–93.
51. Gæde P, Lund-Andersen H, Parving H-H, Pedersen O. Effect of a multifac-torial intervention on mortality in type 2 diabetes. N Engl J of Med. 2008;358(6):580–91.
52. Jansson SP, Andersson DK, Svardsudd K. Mortality trends in subjects with and without diabetes during 33 years of follow-up. Diabetes Care. 2010;33(3):551–6.
53. Rawshani A, Rawshani A, Franzen S, Eliasson B, Svensson AM, Miftaraj M, et al. Mortality and cardiovascular disease in Type 1 and type 2 diabetes. N Engl J Med. 2017;376(15):1407–18.
54. Gregg EW, Li Y, Wang J, Rios Burrows N, Ali MK, Rolka D, et al. Changes in Diabetes-Related Complications in the United States, 1990–2010. New England Journal of Medicine. 2014;370(16):1514–23.
55. Lind M, Garcia-Rodriguez LA, Booth GL, Cea-Soriano L, Shah BR, Ekeroth G, et al. Mortality trends in patients with and without diabetes in Ontario, Canada and the UK from 1996 to 2009: A population-based study. Dia-betologia. 2013;56(12):2601–8.
72
56. Booth GL, Kapral MK, Fung K, Tu JV. Recent trends in cardiovascular com-plications among men and women with and without diabetes. Diabetes Care. 2006;29(1):32–7.
57. Ogurtsova K, da Rocha Fernandes JD, Huang Y, Linnenkamp U, Guariguata L, Cho NH, et al. IDF Diabetes Atlas: Global estimates for the prevalence of diabetes for 2015 and 2040. Diabetes Res Clin Pract. 2017;128:40–50.
58. Seuring T, Archangelidi O, Suhrcke M. The economic costs of type 2 diabe-tes: A global systematic review. PharmacoEconomics. 2015;33(8):811–31.
59. Nathanson D, Sabale U, Eriksson JW, Nyström T, Norhammar A, Olsson U, et al. Healthcare cost development in a type 2 diabetes patient population on glucose-lowering drug treatment: A nationwide observational study 2006–2014. PharmacoEconomics - Open. 2018;2(4):393–402.
60. Glied S, Smith P. The Oxford Handbook of Health Economics. Oxford: Ox-ford University Press; 2011.
61. Herd P, Goesling B, House JS. Socioeconomic position and health: The dif-ferential effects of education versus income on the onset versus progres-sion of health problems. J Health Soc Behav. 2007;48(3):223–38.
62. Galobardes B, Lynch J, Smith GD. Measuring socioeconomic position in health research. Brit Med Bull. 2007;81(1):21–37.
63. Rawshani A, Svensson AM, Zethelius B, Eliasson B, Rosengren A, Gud-bjornsdottir S. Association between socioeconomic status and mortality, cardiovascular disease, and cancer in patients with type 2 diabetes. JAMA Int Med. 2016;176(8):1146–54.
64. Czaika M, Haas H. The globalization of migration: Has the world become more migratory? Int Migr Rev. 2014;48(2):283–323.
65. Rawshani A, Svensson AM, Rosengren A, Zethelius B, Eliasson B, Gud-bjornsdottir S. Impact of ethnicity on progress of glycaemic control in 131,935 newly diagnosed patients with type 2 diabetes: A nationwide observational study from the Swedish National Diabetes Register. BMJ Open. 2015;5(6):e007599.
66. Holt RI, Nicolucci A, Kovacs Burns K, Escalante M, Forbes A, Hermanns N, et al. Diabetes Attitudes, Wishes and Needs second study (DAWN2): Cross-national comparisons on barriers and resources for optimal care-healthcare professional perspective. Diabet Med. 2013;30(7):789–98.
67. Mc Hugh S, O’Keeffe J, Fitzpatrick A, de Siun A, O’Mullane M, Perry I, et al. Diabetes care in Ireland: A survey of general practitioners. Prim Care Diabetes. 2009;3(4):225–31.
68. Willis TA, West R, Rushforth B, Stokes T, Glidewell L, Carder P, et al. Var-iations in achievement of evidence-based, high-impact quality indicators in general practice: An observational study. PloS One. 2017;12(7):e0177949-e.
69. Laurant M, van der Biezen M, Wijers N, Watananirun K, Kontopantelis E, van Vught AJ. Nurses as substitutes for doctors in primary care. Cochrane Database Syst Rev. 2018;7:Cd001271.
70. Campbell SM, Braspenning J, Hutchinson A, Marshall MN. Research meth-ods used in developing and applying quality indicators in primary care. BMJ. 2003;326(7393):816–9.
71. Donabedian A. The quality of care: How can it be assessed? JAMA. 1988;260(12):1743–8.

73
72. Sidorenkov G, Haaijer-Ruskamp FM, de Zeeuw D, Bilo H, Denig P. Review: relation between quality-of-care indicators for diabetes and patient out-comes: A systematic literature review. Med Care Res and Rev. 2011;68(3):263–89.
73. Health Consumer Powerhouse. Euro Diabetes Index 2014. Stockholm: Health Consumer Powerhouse; 2014. p. 1–72. [Available from https://old.healthpowerhouse.com/publications/euro-diabetes-index-2014/] (Last accessed 20 December 2018).
74. Carey N, Courtenay M. A review of the activity and effects of nurse-led care in diabetes. J Clin Nurs. 2007;16(11C):296–304.
75. Griffiths P, Maben J, Murrells T. Organisational quality, nurse staffing and the quality of chronic disease management in primary care: Observa-tional study using routinely collected data. Int J Nurs Stud. 2011;48(10):1199–210.
76. Loveman E, Royle P, Waugh N. Specialist nurses in diabetes mellitus. Cochrane Database Syst Rev. 2003(2):CD003286.
77. Ovhed I, Johansson E, Odeberg H, Rastam L. A comparison of two different team models for treatment of diabetes mellitus in primary care. Scand J Caring Sci. 2000;14(4):253–8.
78. Coulter A, Entwistle VA, Eccles A, Ryan S, Shepperd S, Perera R. Personal-ised care planning for adults with chronic or long-term health conditions. Cochrane Database Syst Rev. 2015(3):Cd010523.
79. Norris SL, Lau J, Smith SJ, Schmid CH, Engelgau MM. Self-management education for adults with type 2 diabetes: a meta-analysis of the effect on glycemic control. Diabetes Care. 2002;25(7):1159–71.
80. Odgers-Jewell K, Ball LE, Kelly JT, Isenring EA, Reidlinger DP, Thomas R. Effectiveness of group-based self-management education for individuals with Type 2 diabetes: A systematic review with meta-analyses and meta-regression. Diabet Med. 2017;34(8):1027–39.
81. Hornsten A, Stenlund H, Lundman B, Sandstrom H. Improvements in HbA1c remain after 5 years–A follow up of an educational intervention focusing on patients’ personal understandings of type 2 diabetes. Diabetes Res Clin Pract. 2008;81(1):50–5.
82. Griffin S. Diabetes care in general practice: meta-analysis of randomised con-trol trials. BMJ. 1998;317(7155):390–6.
83. Hallgren Elfgren IM, Grodzinsky E, Tornvall E. Swedish Diabetes Register, a tool for quality development in primary health care. Prim Health Care Res Dev. 2013;14(3):250–7.
84. Renders CM, Valk GD, Griffin SJ, Wagner EH, Eijk Van JT, Assendelft WJ. Interventions to improve the management of diabetes in primary care, outpatient, and community settings: A systematic review. Diabetes Care. 2001;24(10):1821–33.
85. Tricco AC, Ivers NM, Grimshaw JM, Moher D, Turner L, Galipeau J, et al. Effectiveness of quality improvement strategies on the management of diabetes: A systematic review and meta-analysis. Lancet. 2012;379(9833):2252–61.
86. Seidu S, Walker NS, Bodicoat DH, Davies MJ, Khunti K. A systematic re-view of interventions targeting primary care or community based profes-sionals on cardio-metabolic risk factor control in people with diabetes. Diabetes Res Clin Pract. 2016;113:1–13.

74
87. Seitz P, Rosemann T, Gensichen J, Huber CA. Interventions in primary care to improve cardiovascular risk factors and glycated haemoglobin (HbA1c) levels in patients with diabetes: A systematic review. Diabet Obes & Metabol. 2011;13(6):479–89.
88. Worswick J, Wayne SC, Bennett R, Fiander M, Mayhew A, Weir MC, et al. Improving quality of care for persons with diabetes: an overview of sys-tematic reviews –What does the evidence tell us? Syst Rev. 2013;2:26.
89. Goderis G, Borgermans L, Grol R, Van Den Broeke C, Boland B, Verbeke G, et al. Start improving the quality of care for people with type 2 diabe-tes through a general practice support program: A cluster randomized trial. Diabetes Res Clin Pract. 2010;88(1):56–64.
90. Griffin SJ, Borch-Johnsen K, Davies MJ, Khunti K, Rutten GE, Sandbaek A, et al. Effect of early intensive multifactorial therapy on 5-year cardi-ovascular outcomes in individuals with type 2 diabetes detected by screening (ADDITION-Europe): A cluster-randomised trial. Lancet. 2011;378(9786):156–67.
91. Janssen PG, Gorter KJ, Stolk RP, Rutten GE. Randomised controlled trial of intensive multifactorial treatment for cardiovascular risk in patients with screen-detected type 2 diabetes: 1-year data from the ADDITION Neth-erlands study. Br J Gen Pract. 2009;59(558):43–8.
92. He X, Li J, Wang B, Yao Q, Li L, Song R, et al. Diabetes self-management education reduces risk of all-cause mortality in type 2 diabetes patients: a systematic review and meta-analysis. Endocrine. 2017;55(3):712–31.
93. Krag MO, Hasselbalch L, Siersma V, Nielsen AB, Reventlow S, Malterud K, et al. The impact of gender on the long-term morbidity and mortality of patients with type 2 diabetes receiving structured personal care: A 13 year follow-up study. Diabetologia. 2016;59(2):275–85.
94 Olivarius NF, Beck-Nielsen H, Andreasen AH, Horder M, Pedersen PA. Ran-domised controlled trial of structured personal care of type 2 diabetes mellitus. BMJ. 2001;323(7319):970–5.
95. Cleveringa FG, Gorter KJ, van den Donk M, Rutten GE. Combined task del-egation, computerized decision support, and feedback improve cardio-vascular risk for type 2 diabetic patients: A cluster randomized trial in primary care. Diabetes Care. 2008;31(12):2273–5.
96. Sonnichsen AC, Winkler H, Flamm M, Panisch S, Kowatsch P, Klima G, et al. The effectiveness of the Austrian disease management programme for type 2 diabetes: a cluster-randomised controlled trial. BMC Fam Pract. 2010;11:86.
97. Frei A, Senn O, Chmiel C, Reissner J, Held U, Rosemann T. Implementation of the chronic care model in small medical practices improves cardiovas-cular risk but not glycemic control. Diabetes Care. 2014;37(4):1039–47.
98. Husdal R. The organisation of diabetes care for persons with type 2 diabetes mellitus : A nationwide cross-sectional study in Swedish primary health care [Licentiate thesis, comprehensive summary]. Uppsala: Uppsala Uni-versity; 2017.
99. Lisspers K, Stallberg B, Hasselgren M, Johansson G, Svardsudd K. Organi-sation of asthma care in primary health care in Mid-Sweden. Prim Care Respir J. 2005;14(3):147–53.
100. Stewart J, Kendrick D. Setting and negotiating targets in people with type 2 diabetes in primary care: A cross sectional survey. Diabet Med. 2005;22(6):683–7.

75
101. Pierce M, Agarwal G, Ridout D. A survey of diabetes care in general practice in England and Wales. Br J Gen Pract. 2000;50(456):542–5.
102 Ludvigsson JF, Andersson E, Ekbom A, Feychting M, Kim JL, Reuterwall C, et al. External review and validation of the Swedish national inpatient register. BMC Public Health. 2011;11:450.
103. Statistics Sweden [Statistiska centralbyrån]. Background Facts: Integrated database for labour market research [Bakgrundsfakta: Longitudinell in-tegrationsdatabas för Sjukförsäkrings- och Arbetsmarknadsstudier (LISA)] (in Swedish). Örebro: Statistics Sweden; 2016. p. 1–386.
104 Rothman K. Epidemiology: An Introduction. 2nd ed. New York: Oxford Uni-versity Press; 2012.
105. Salas M, Hotman A, Stricker BH. Confounding by indication: An example of variation in the use of epidemiologic terminology. Am J Epidemiol. 1999;149(11):981–3.
106. Friedewald WT, Levy RI, Fredrickson DS. Estimation of the concentration of low-density lipoprotein cholesterol in plasma, without use of the pre-parative ultracentrifuge. Clin Chem. 1972;18(6):499–502.
107. Levey AS, Coresh J, Greene T, Stevens LA, Zhang YL, Hendriksen S, et al. Using standardized serum creatinine values in the modification of diet in renal disease study equation for estimating glomerular filtration rate. Ann Intern Med. 2006;145(4):247–54.
108. Seidu S, Davies MJ, Farooqi A, Khunti K. Integrated primary care: is this the solution to the diabetes epidemic? Diabet Med. 2017;34(6):748–50.
109. Mathew R, Gucciardi E, De Melo M, Barata P. Self-management experiences among men and women with type 2 diabetes mellitus: a qualitative anal-ysis. BMC Fam Pract. 2012;13(1):122.
110. Galdas P, Fell J, Bower P, Kidd L, Blickem C, McPherson K, et al. The ef-fectiveness of self-management support interventions for men with long-term conditions: a systematic review and meta-analysis. BMJ Open. 2015;5(3):e006620.
111. Svedbo Engstrom M, Leksell J, Johansson UB, Gudbjornsdottir S. What is important for you? A qualitative interview study of living with diabetes and experiences of diabetes care to establish a basis for a tailored Patient-Reported Outcome Measure for the Swedish National Diabetes Register. BMJ Open. 2016;6(3):e010249.
112. Swedish Agency for Health and Care Services Analysis [Vårdanalys]. The care from primary care practitioners’ perspective [Vården ur primärvårdsläkarnas perspektiv] (in Swedish). Stockholm: Swedish Agency for Health and Care Services Analysis; 2015:9. p. 1–150.
113. Boström E, Hörnsten Å, Lundman B, Stenlund H, Isaksson U. Role clarity and role conflict among Swedish diabetes specialist nurses. Prim Care Diabet. 2013;7(3):207–12.
114. Bosch M, Dijkstra R, Wensing M, van der Weijden T, Grol R. Organizational culture, team climate and diabetes care in small office-based practices. BMC Health Serv Res. 2008;8:180.
115. Mundt MP, Agneessens F, Tuan WJ, Zakletskaia LI, Kamnetz SA, Gilchrist VJ. Primary care team communication networks, team climate, quality of care, and medical costs for patients with diabetes: A cross-sectional study. Int J Nurs Stud. 2016;58:1–11.
116. Clement M, Filteau P, Harvey B, Jin S, Laubscher T, Mukerji G, et al. Or-ganization of Diabetes Care. Can J Diabet. 2018;42:27–35.
76
117. Bostrom E, Isaksson U, Lundman B, Graneheim UH, Hornsten A. Interaction between diabetes specialist nurses and patients during group sessions about self-management in type 2 diabetes. Patient Educ Couns. 2014;94(2):187–92.
118. Bostrom E, Isaksson U, Lundman B, Lehuluante A, Hornsten A. Patient-cen-tred care in type 2 diabetes – an altered professional role for diabetes specialist nurses. Scand J Caring Sci. 2014;28(4):675–82.
119. Johansson K, Osterberg SA, Leksell J, Berglund M. Supporting patients learning to live with diabetes: a phenomenological study. BJN. 2018;27(12):697–704.
120. Murphy ME, Byrne M, Galvin R, Boland F, Fahey T, Smith SM. Improving risk factor management for patients with poorly controlled type 2 diabe-tes: a systematic review of healthcare interventions in primary care and community settings. BMJ Open. 2017;7(8):e015135.
121. Julin B, Willers C, Leksell J, Lindgren P, Loostrom Muth K, Svensson AM, et al. Association between sociodemographic determinants and health outcomes in individuals with type 2 diabetes in Sweden. Diabetes Metab Res Rev. 2018;34(4):e2984.
122. Timmermans S, Mauck A. The promises and pitfalls of evidence-based med-icine. Health Aff. 2005;24(1):18–28.
123. Cochrane LJ, Olson CA, Murray S, Dupuis M, Tooman T, Hayes S. Gaps between knowing and doing: understanding and assessing the barriers to optimal health care. J Con Ed Health Prof. 2007;27(2):94–102.
124. Robertson C. Translating ADA/EASD guidelines and the ACE/AACE road maps into primary care of patients with type 2 diabetes. J Nurse Practit. 2008;4(9):661–71.
125. Davies MJ, D’Alessio DA, Fradkin J, Kernan WN, Mathieu C, Mingrone G, et al. Management of hyperglycaemia in type 2 diabetes, 2018. A con-sensus report by the American Diabetes Association (ADA) and the Eu-ropean Association for the Study of Diabetes (EASD). Diabetologia. 2018;61(12):2461–98.
126. Sinclair AJ, Abdelhafiz AH, Forbes A, Munshi M. Evidence-based diabetes care for older people with Type 2 diabetes: a critical review. Diabet Med. 2018.
127. Swedish Agency for Health and Care Services Analysis [Vårdanalys]. Long way to patient benefit [Lång väg till patientnytta] (in Swedish). Stock-holm: Swedish Agency for Health and Care Services Analysis; 2015:7. p. 1–119.
128. Region Skåne. Certification of diabetes clinic 2016-01-01: Healthcare units in Region Skåne [Certifiering av diabetesmottagning 2016-01-01 Hälsovalsenheter inom Region Skåne (in Swedish). 2016 [Available from:http://vardgivare.skane.se/conten-tassets/e06b5ee2adce4590b7dab08bb5338585/certifiering-av-diabe-tesmottagning-2016.pdf?highlight=diabetesmottagning] (Last accessed 3 January 2019).
129. Swedish Association for Nurses in Diabetes Care and Swedish Nurse As-socation [Svensk förening för sjuksköterskor i diabetesvård & svensk sjuksköterskeförening] (in Swedish). Diabetes care. Swedish association for nurses in diabetes care and Swedish nurse assocation; 2017; (2–3). p. 1–60. [Available from: https://www.swenurse.se/globalassets/sektioner--natverk/diabetesnurse-sfsd/diabetesvard-nr-2-3-2017_sidvis_ny-1.pdf] (Last accessed 3 January 2019).
77
130. Rushforth B, McCrorie C, Glidewell L, Midgley E, Foy R. Barriers to effec-tive management of type 2 diabetes in primary care: Qualitative system-atic review. Brit J Gen Prac. 2016;66(643):114–27.
131. Campbell SM, Roland MO, Buetow SA. Defining quality of care. Soc Sci Med. 2000;51(11):1611–25.
132. Nam S, Chesla C, Stotts NA, Kroon L, Janson SL. Barriers to diabetes man-agement: Patient and provider factors. Diabetes Res Clin Pract. 2011;93(1):1–9.
133. Wennberg P, Rolandsson O, Jerden L, Boeing H, Sluik D, Kaaks R, et al. Self-rated health and mortality in individuals with diabetes mellitus: Pro-spective cohort study. BMJ Open. 2012;2(1):e000760.
134. Government Offices of Sweden [Socialdepartementet]. Guiding principles in health care and an enhanced healthcare guarantee, proposition 2017/18:83 [Styrande principer inom hälso- och sjukvården och en för-stärkt vårdgaranti, proposition 2017/18:83] (in Swedish). Stockholm: Government Offices of Sweden; 2018. p.1–58.
135. Swedish Agency for Health and Care Services Analysis [Vårdanalys]. Pati-ents’ perspective of care: comparisons between Sweden and 10 other countries [Vården ur patienternas perspektiv: jämförelser mellan Sverige och 10 andra länder] (in Swedish). Stockholm: Swedish Agency for Health and Care Services Analysis; 2014:11. p. 1–39.

78
Appendix 1: The 2006 questionnaire in Swedish Uppgiftslämnare
Profession
Telefonnummer
Nedanstående frågor berör förhållandet för omhändertagande av era patienter med typ 2 diabetes på er vårdcentral/mottagning år 2006.
Besvara gärna enkäten tillsammans med den/de medarbetare som har den direkta patientkontakten. Det är viktigt att svara på samtliga frågor i enkäten. Sätt ett kryss på varje fråga som är avsedd för detta och besvara öppna frågor i löpande text. För vissa av frågorna kan flera alternativ stämma över-ens, ange då samtliga alternativ som överensstämmer med de förhållanden som råder på vårdcen-tralen/mottagningen.
Allmänna frågor – Patienter
1.
Hur många patienter totalt är listade/tillhör er vårdcentral/mottagnings geografiska upptag-ningsområde?
Antal patienter:
2. Hur många personer med diabetes ansvarar er vårdcentral/mottagning för?
< 50
50-100
101-150
151-200
201-250
251-300
301-350
351-400
401-500
501-600
601-700
>700
Allmänna frågor- Personal
3. Ange totala antalet personer som var i tjänst under november månad 2006 omräknat till hel-tidstjänster för följande professioner:
Allmänläkarspecialist
Vikarierande läkare
ST-läkare
AT-läkare
Sjuksköterska/distriktssköterska
Antal heltidstjänster
4. Har ni diabetesansvarig läkare (DAL)?
Ja Nej
5. Har ni diabetesutbildad sjuksköterska/sjuksköterskor som ansvarar för patienter med typ 2 dia-
betes?
Ja, antal: Nej
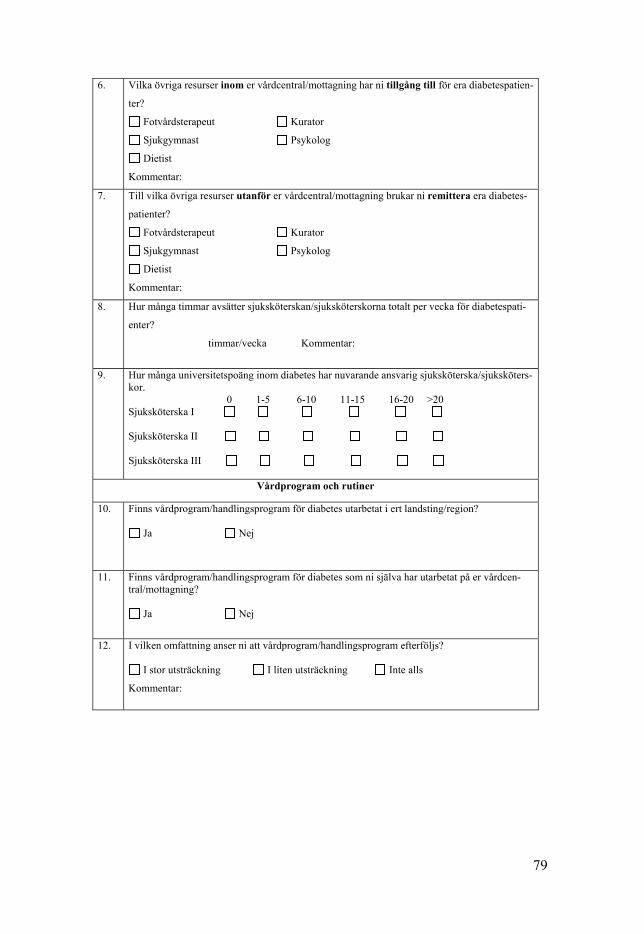
79
6. Vilka övriga resurser inom er vårdcentral/mottagning har ni tillgång till för era diabetespatien-
ter?
Fotvårdsterapeut Kurator
Sjukgymnast Psykolog
Dietist
Kommentar:
7. Till vilka övriga resurser utanför er vårdcentral/mottagning brukar ni remittera era diabetes-
patienter?
Fotvårdsterapeut Kurator
Sjukgymnast Psykolog
Dietist
Kommentar:
8. Hur många timmar avsätter sjuksköterskan/sjuksköterskorna totalt per vecka för diabetespati-
enter?
timmar/vecka Kommentar:
9. Hur många universitetspoäng inom diabetes har nuvarande ansvarig sjuksköterska/sjuksköters-kor. 0 1-5 6-10 11-15 16-20 >20 Sjuksköterska I Sjuksköterska II Sjuksköterska III
Vårdprogram och rutiner
10. Finns vårdprogram/handlingsprogram för diabetes utarbetat i ert landsting/region?
Ja Nej
11. Finns vårdprogram/handlingsprogram för diabetes som ni själva har utarbetat på er vårdcen-tral/mottagning?
Ja Nej
12. I vilken omfattning anser ni att vårdprogram/handlingsprogram efterföljs?
I stor utsträckning I liten utsträckning Inte alls
Kommentar:
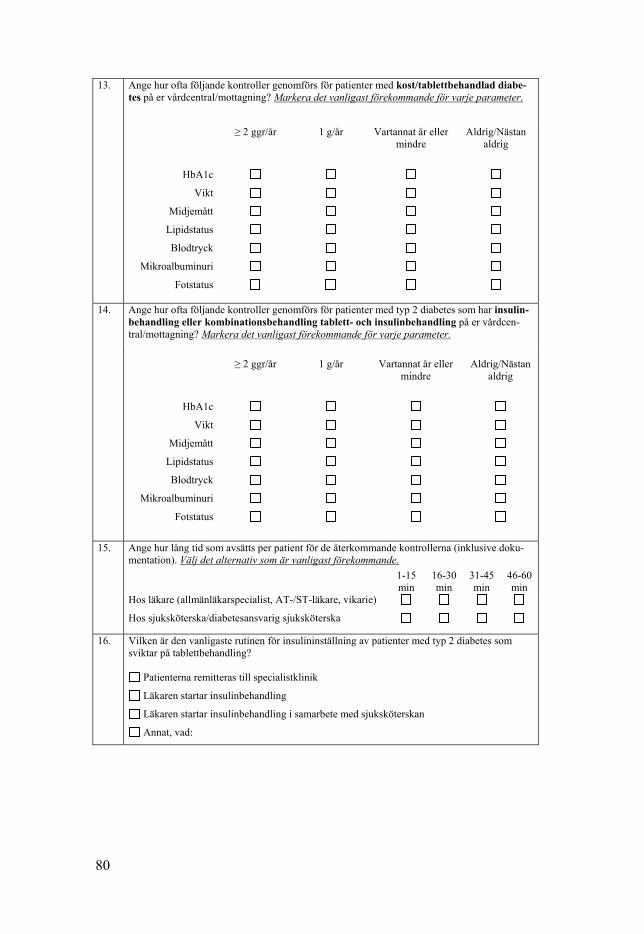
80
13. Ange hur ofta följande kontroller genomförs för patienter med kost/tablettbehandlad diabe-tes på er vårdcentral/mottagning? Markera det vanligast förekommande för varje parameter.
≥ 2 ggr/år 1 g/år Vartannat år eller mindre
Aldrig/Nästan aldrig
HbA1c
Vikt
Midjemått
Lipidstatus
Blodtryck
Mikroalbuminuri
Fotstatus
14. Ange hur ofta följande kontroller genomförs för patienter med typ 2 diabetes som har insulin-behandling eller kombinationsbehandling tablett- och insulinbehandling på er vårdcen-tral/mottagning? Markera det vanligast förekommande för varje parameter.
≥ 2 ggr/år
1 g/år
Vartannat år eller
mindre
Aldrig/Nästan
aldrig
HbA1c
Vikt
Midjemått
Lipidstatus
Blodtryck
Mikroalbuminuri
Fotstatus
15. Ange hur lång tid som avsätts per patient för de återkommande kontrollerna (inklusive doku-mentation). Välj det alternativ som är vanligast förekommande.
1-15 min
16-30 min
31-45 min
46-60 min
Hos läkare (allmänläkarspecialist, AT-/ST-läkare, vikarie)
Hos sjuksköterska/diabetesansvarig sjuksköterska
16. Vilken är den vanligaste rutinen för insulininställning av patienter med typ 2 diabetes som sviktar på tablettbehandling?
Patienterna remitteras till specialistklinik
Läkaren startar insulinbehandling
Läkaren startar insulinbehandling i samarbete med sjuksköterskan
Annat, vad:
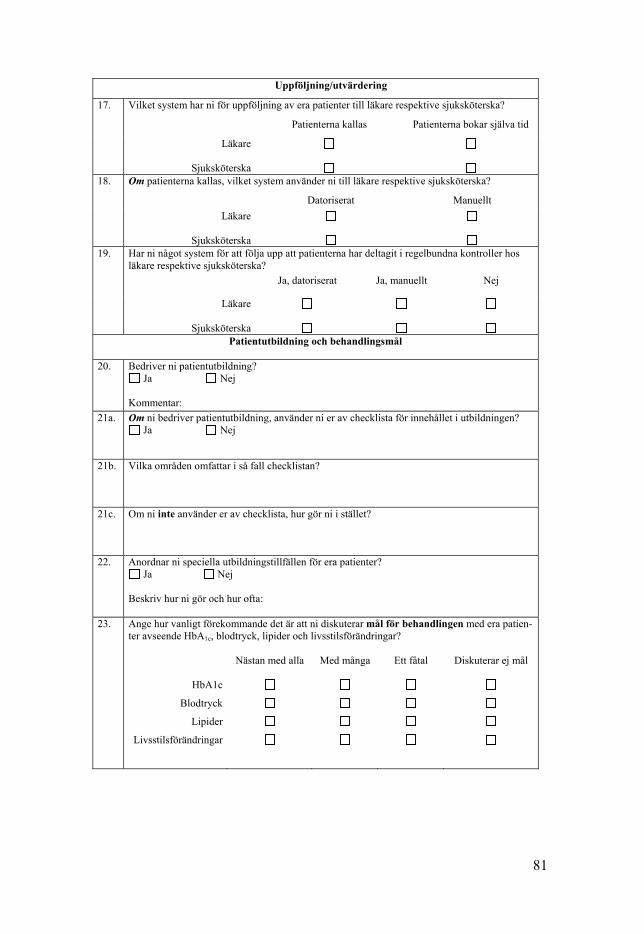
81
Uppföljning/utvärdering
17. Vilket system har ni för uppföljning av era patienter till läkare respektive sjuksköterska?
Patienterna kallas Patienterna bokar själva tid
Läkare
Sjuksköterska
18. Om patienterna kallas, vilket system använder ni till läkare respektive sjuksköterska?
Datoriserat Manuellt
Läkare
Sjuksköterska
19. Har ni något system för att följa upp att patienterna har deltagit i regelbundna kontroller hos
läkare respektive sjuksköterska?
Ja, datoriserat Ja, manuellt Nej
Läkare
Sjuksköterska
Patientutbildning och behandlingsmål
20. Bedriver ni patientutbildning?
Ja Nej Kommentar:
21a. Om ni bedriver patientutbildning, använder ni er av checklista för innehållet i utbildningen? Ja Nej
21b. Vilka områden omfattar i så fall checklistan?
21c. Om ni inte använder er av checklista, hur gör ni i stället?
22. Anordnar ni speciella utbildningstillfällen för era patienter? Ja Nej
Beskriv hur ni gör och hur ofta:
23. Ange hur vanligt förekommande det är att ni diskuterar mål för behandlingen med era patien-ter avseende HbA1c, blodtryck, lipider och livsstilsförändringar?
HbA1c
Blodtryck
Lipider
Livsstilsförändringar
Nästan med alla
Med många
Ett fåtal
Diskuterar ej mål

82
24. Vem/vilka fattar i regel beslut om mål för behandlingen avseende HbA1c, blodtryck, lipider och livsstilsförändringar? HbA1c
Blodtryck
Lipider
Livsstilsförändringar
Nationella Diabetesregistret
25. Registrerar ni era patienter i Nationella Diabetesregistret (NDR)? Ja
Nej
Planerar att starta registrering
26. Hur använder ni er av resultaten i NDR?
För egen del Sätta mål för vårdcentralen/mottagningen
För patientens del Vi använder inte resultaten
Verksamhetsutveckling Annat, vad
27. Om ni inte registrerar i NDR. Vad är den viktigaste anledningen till att ni inte gör det?
Tar för mycket tid Tror inte på kvalitetsregister
Har inte kommit igång Annat, vad
28. 29.
Ge exempel på kvalitetssäkringsarbete som ni bedriver på er vårdcentral: Övriga synpunkter som ni vill förmedla:
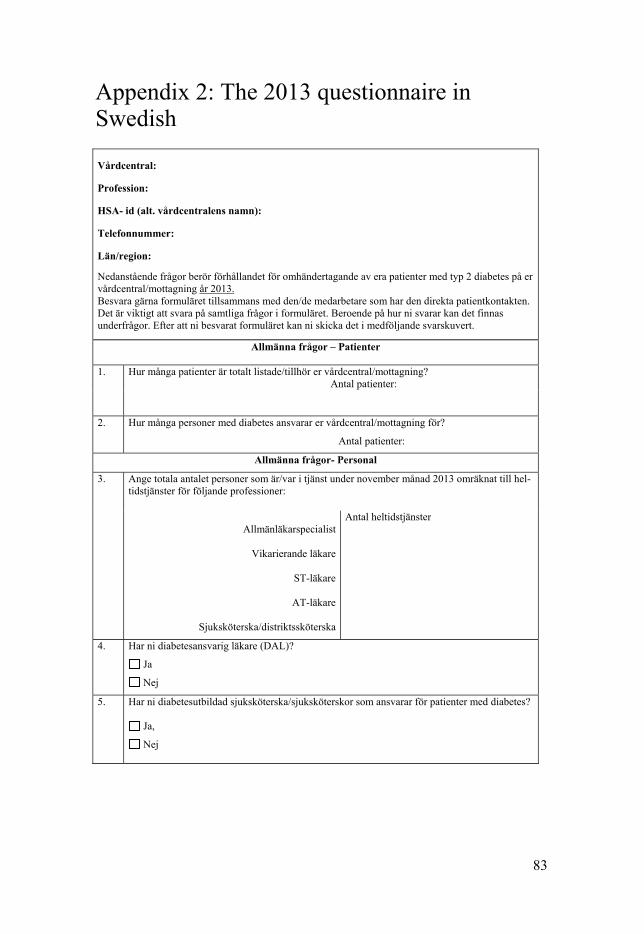
83
Appendix 2: The 2013 questionnaire in Swedish
Vårdcentral:
Profession:
HSA- id (alt. vårdcentralens namn):
Telefonnummer:
Län/region:
Nedanstående frågor berör förhållandet för omhändertagande av era patienter med typ 2 diabetes på er vårdcentral/mottagning år 2013. Besvara gärna formuläret tillsammans med den/de medarbetare som har den direkta patientkontakten. Det är viktigt att svara på samtliga frågor i formuläret. Beroende på hur ni svarar kan det finnas underfrågor. Efter att ni besvarat formuläret kan ni skicka det i medföljande svarskuvert.
Allmänna frågor – Patienter
1.
Hur många patienter är totalt listade/tillhör er vårdcentral/mottagning? Antal patienter:
2. Hur många personer med diabetes ansvarar er vårdcentral/mottagning för?
Antal patienter:
Allmänna frågor- Personal
3. Ange totala antalet personer som är/var i tjänst under november månad 2013 omräknat till hel-tidstjänster för följande professioner:
Allmänläkarspecialist
Vikarierande läkare
ST-läkare
AT-läkare
Sjuksköterska/distriktssköterska
Antal heltidstjänster
4. Har ni diabetesansvarig läkare (DAL)?
Ja
Nej
5. Har ni diabetesutbildad sjuksköterska/sjuksköterskor som ansvarar för patienter med diabetes?
Ja,
Nej

84
5a. Om ja, hur många diabetesutbildade sjuksköterskor har ni?
1
2
3
4
5
5b. Utifrån antal diabetesutbildade sjuksköterskor, hur många högskolepoäng (hp) (exempel-vis 10 gamla poäng= 15 nya hp) i ämneskompetens och pedagogisk kompetens inom diabetes har nuvarande ansvarig sjuksköterska/sjuksköterskor? Ämneskompetens Pedagogisk kompetens Antal nya högskolepoäng (hp) Antal nya högskolepoäng (hp) Sjuksköterska 1 Sjuksköterska 2 Sjuksköterska 3 Sjuksköterska 4 Sjuksköterska 5
6. Hur många timmar avsätter sjuksköterskan/sjuksköterskorna totalt per vecka för diabetespati-enter? Ange under kommentar om ni har uppehåll för exempelvis sommar och jul. Antal timmar/vecka
Kommentar:
7. Vilka övriga resurser inom er vårdcentral/mottagning har ni tillgång till för era diabetespatien-ter? Kryssa för alla alternativ som stämmer.
Fotvårdsterapeut
Sjukgymnast
Dietist
Kurator
Psykolog Annan, vem/vilka?
8. Till vilka övriga resurser utanför er vårdcentral/mottagning brukar ni remittera era diabetes-patienter? Kryssa för alla alternativ som stämmer.
Fotvårdsterapeut
Sjukgymnast
Dietist
Kurator
Psykolog Annan, vem/vilka
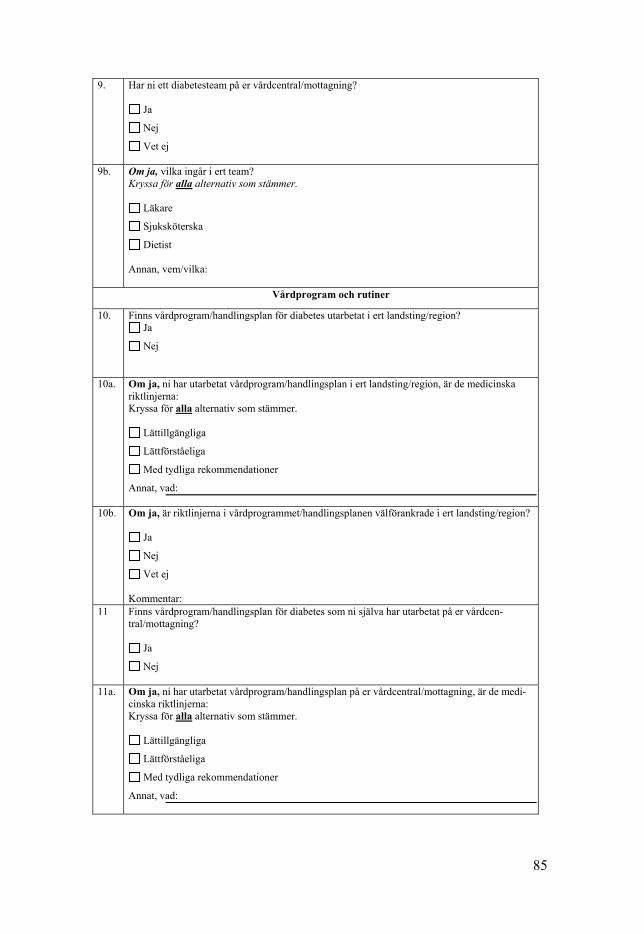
85
9. Har ni ett diabetesteam på er vårdcentral/mottagning?
Ja
Nej
Vet ej
9b. Om ja, vilka ingår i ert team? Kryssa för alla alternativ som stämmer.
Läkare
Sjuksköterska
Dietist Annan, vem/vilka:
Vårdprogram och rutiner
10. Finns vårdprogram/handlingsplan för diabetes utarbetat i ert landsting/region? Ja
Nej
10a. Om ja, ni har utarbetat vårdprogram/handlingsplan i ert landsting/region, är de medicinska riktlinjerna: Kryssa för alla alternativ som stämmer.
Lättillgängliga
Lättförståeliga
Med tydliga rekommendationer
Annat, vad:
10b. Om ja, är riktlinjerna i vårdprogrammet/handlingsplanen välförankrade i ert landsting/region?
Ja
Nej
Vet ej Kommentar:
11 Finns vårdprogram/handlingsplan för diabetes som ni själva har utarbetat på er vårdcen-tral/mottagning?
Ja
Nej
11a. Om ja, ni har utarbetat vårdprogram/handlingsplan på er vårdcentral/mottagning, är de medi-cinska riktlinjerna: Kryssa för alla alternativ som stämmer.
Lättillgängliga
Lättförståeliga
Med tydliga rekommendationer
Annat, vad:

86
11b. I vilken omfattning anser ni att vårdprogram/handlingsplan efterföljs? Sätt ett kryss för det som stämmer in på er vårdcentral/mottagning.
I stor utsträckning
I liten utsträckning
Inte alls Kommentar:
12. Ange hur ofta följande kontroller genomförs för patienter med kostbehandling på er vårdcen-tral/mottagning? Markera det vanligast förekommande för varje parameter.
≥ 2 ggr/år 1 g/år Vartannat år eller mindre
Aldrig/Nästan aldrig
HbA1c
Vikt
Midjemått
Lipidstatus
Blodtryck
Mikroalbuminuri
Fotstatus
13. Ange hur ofta följande kontroller genomförs för patienter med tablettbehandlad diabetes på er vårdcentral/mottagning? Markera det vanligast förekommande för varje parameter.
≥ 2 ggr/år 1 g/år Vartannat år eller mindre
Aldrig/nästan al-drig
HbA1c
Vikt
Midjemått
Lipidstatus
Blodtryck
Mikroalbuminuri
Fotstatus

87
14. Ange hur ofta följande kontroller genomförs för patienter med typ 2 diabetes som har insulin-behandling eller kombinationsbehandling tablett- och insulinbehandling på er vårdcen-tral/mottagning? Markera det vanligast förekommande för varje parameter.
≥ 2 ggr/år
1 g/år
Vartannat år eller
mindre
Aldrig/nästan
aldrig
HbA1c
Vikt
Midjemått
Lipidstatus
Blodtryck
Mikroalbuminuri
Fotstatus
15. Erbjuder er vårdcentral/mottagning systematiskt egenmätning av blodglukos till insulinbe-handlade personer med typ 2 diabetes? Mätning av blodglukos före och efter måltid under en dag (6-7 stickor), två dagar per vecka.
Ja
Nej
16. Erbjuder er vårdcentral/mottagning riktad egenmätning av blodglukos till personer med typ 2 diabetes, som inte behandlas med insulin? Riktad egenmätning av blodglukos vid speciella situationer som vid byte av läkemedel eller akut svängande blodglukos vid exempelvis infektioner och kortisonbehandling eller i pedago-giskt syfte.
Ja
Nej 17. Ange hur lång tid som avsätts per patient för de återkommande kontrollerna (inklusive doku-
mentation). Välj det alternativ som är vanligast förekommande hos respektive profession.
1-15 min 16-30 min 31-45 min 46-60 min
Hos läkare (allmänläkarspecialist, AT-/ST-läkare, vikarie
Hos sjuksköterska/diabetesansvarig sjuksköterska
18. Vilken är den vanligaste rutinen för insulininsättning av patienter med typ 2 diabetes som svik-tar på tablettbehandling? OBS! Sätt ett kryss som berör majoriteten av era diabetespatienter.
Patienterna remitteras till specialistklinik
Läkaren startar insulinbehandling
Sjuksköterskan startar insulinbehandling efter läkarordination
Läkaren startar insulinbehandling i samarbete med sjuksköterskan
Annat, vad:
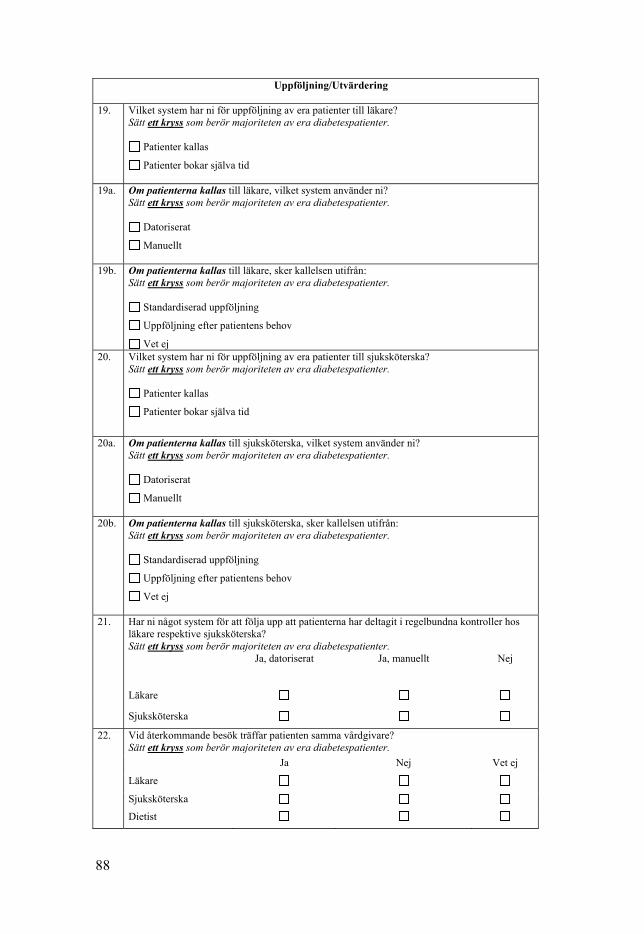
88
Uppföljning/Utvärdering
19. Vilket system har ni för uppföljning av era patienter till läkare? Sätt ett kryss som berör majoriteten av era diabetespatienter.
Patienter kallas
Patienter bokar själva tid
19a. Om patienterna kallas till läkare, vilket system använder ni? Sätt ett kryss som berör majoriteten av era diabetespatienter.
Datoriserat
Manuellt
19b. Om patienterna kallas till läkare, sker kallelsen utifrån: Sätt ett kryss som berör majoriteten av era diabetespatienter.
Standardiserad uppföljning
Uppföljning efter patientens behov
Vet ej 20. Vilket system har ni för uppföljning av era patienter till sjuksköterska?
Sätt ett kryss som berör majoriteten av era diabetespatienter.
Patienter kallas
Patienter bokar själva tid
20a. Om patienterna kallas till sjuksköterska, vilket system använder ni?
Sätt ett kryss som berör majoriteten av era diabetespatienter.
Datoriserat
Manuellt
20b. Om patienterna kallas till sjuksköterska, sker kallelsen utifrån: Sätt ett kryss som berör majoriteten av era diabetespatienter.
Standardiserad uppföljning
Uppföljning efter patientens behov
Vet ej
21. Har ni något system för att följa upp att patienterna har deltagit i regelbundna kontroller hos läkare respektive sjuksköterska? Sätt ett kryss som berör majoriteten av era diabetespatienter.
Ja, datoriserat Ja, manuellt Nej
Läkare
Sjuksköterska
22. Vid återkommande besök träffar patienten samma vårdgivare? Sätt ett kryss som berör majoriteten av era diabetespatienter.
Ja Nej Vet ej
Läkare
Sjuksköterska
Dietist
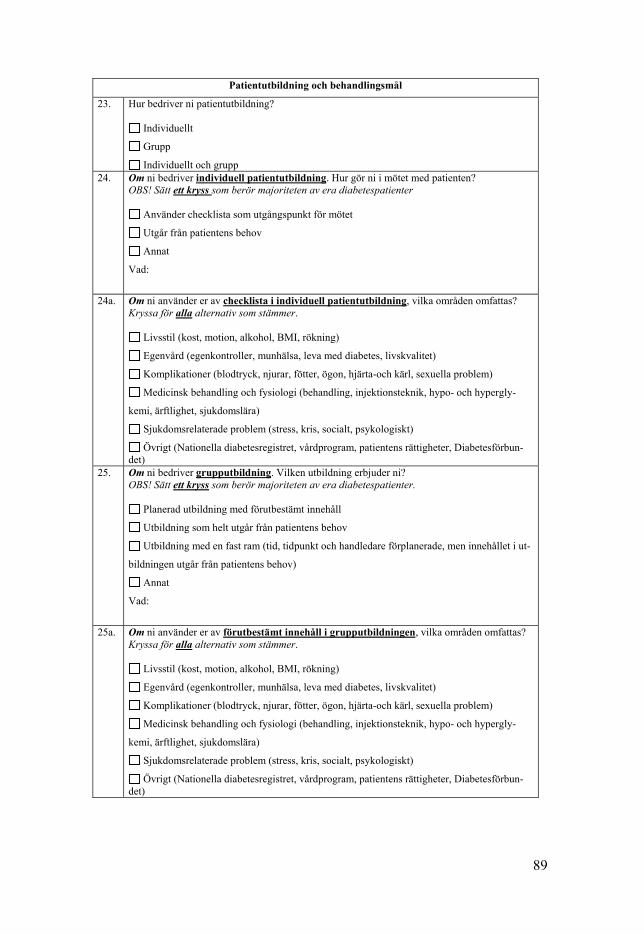
89
Patientutbildning och behandlingsmål
23. Hur bedriver ni patientutbildning?
Individuellt
Grupp
Individuellt och grupp 24. Om ni bedriver individuell patientutbildning. Hur gör ni i mötet med patienten?
OBS! Sätt ett kryss som berör majoriteten av era diabetespatienter
Använder checklista som utgångspunkt för mötet
Utgår från patientens behov
Annat
Vad:
24a. Om ni använder er av checklista i individuell patientutbildning, vilka områden omfattas?
Kryssa för alla alternativ som stämmer.
Livsstil (kost, motion, alkohol, BMI, rökning)
Egenvård (egenkontroller, munhälsa, leva med diabetes, livskvalitet)
Komplikationer (blodtryck, njurar, fötter, ögon, hjärta-och kärl, sexuella problem)
Medicinsk behandling och fysiologi (behandling, injektionsteknik, hypo- och hypergly-
kemi, ärftlighet, sjukdomslära)
Sjukdomsrelaterade problem (stress, kris, socialt, psykologiskt)
Övrigt (Nationella diabetesregistret, vårdprogram, patientens rättigheter, Diabetesförbun-det)
25. Om ni bedriver grupputbildning. Vilken utbildning erbjuder ni? OBS! Sätt ett kryss som berör majoriteten av era diabetespatienter.
Planerad utbildning med förutbestämt innehåll
Utbildning som helt utgår från patientens behov
Utbildning med en fast ram (tid, tidpunkt och handledare förplanerade, men innehållet i ut-
bildningen utgår från patientens behov)
Annat
Vad:
25a. Om ni använder er av förutbestämt innehåll i grupputbildningen, vilka områden omfattas?
Kryssa för alla alternativ som stämmer.
Livsstil (kost, motion, alkohol, BMI, rökning)
Egenvård (egenkontroller, munhälsa, leva med diabetes, livskvalitet)
Komplikationer (blodtryck, njurar, fötter, ögon, hjärta-och kärl, sexuella problem)
Medicinsk behandling och fysiologi (behandling, injektionsteknik, hypo- och hypergly-
kemi, ärftlighet, sjukdomslära)
Sjukdomsrelaterade problem (stress, kris, socialt, psykologiskt)
Övrigt (Nationella diabetesregistret, vårdprogram, patientens rättigheter, Diabetesförbun-det)

90
25b. Om ni bedriver grupputbildning, erbjuder er vårdcentral/mottagning gruppbaserad utbildning till personer med diabetes typ 2, som leds av vårdpersonal med ämneskompetens och pedago-gisk kompetens? Med ämneskompetens i diabetesvård menas minst 15 högskolepoäng (hp) och med pedagogisk kompetens menas minst 7,5 (hp).
Ja
Nej
Vet ej 25c. Om ni bedriver grupputbildning, erbjuder er vårdcentral/mottagning kulturanpassad grupput-
bildning? Med kulturanpassning menas anpassad utbildning till personer med olika kulturell bakgrund. Anpassningen gäller språk och utbildning om kost- och andra livsstilsfaktorer.
Ja
Nej
Vet ej 26. Ange hur vanligt förekommande det är att ni diskuterar mål för behandlingen med era patienter
avseende HbA1c, blodtryck, lipider och livsstilsförändringar? Välj det alternativ som är vanligast förekommande för respektive parameter.
Nästan med alla Med många Ett fåtal Diskuterar ej mål
HbA1c
Blodtryck
Lipider
Livsstilsföränd-ringar
27. Vem/vilka fattar i regel beslut om mål för behandlingen avseende HbA1c, blodtryck, lipider och livsstilsförändringar? Kryssa för alla alternativ som stämmer.
Läkare Sjuksköterska Dietist Patient
HbA1c
Blodtryck
Lipider
Livsstilsföränd-ringar
Kvalitetsarbete
28. Ja Nej Vet ej
Har ni målinriktad läkemedelsbehandling baserad i tydliga behand-lings-trappor (riktlinjer för när man ska byta läkemedelsbehandling)?
Har ni en tydlig strategi med riktade insatser för personer med diabe-tes med sämre värden?
Följer ni upp utfall/resultat för personer med diabetes?
Har ni gemensamma möten om diabetesriktlinjer för alla inom er vårdcentral/mottagning?
Vårdcentralen/mottagningens ledning för ofta dialog med medarbe-tarna kring enhetens resultat?
Känner medarbetarna väl till vårdcentralen/mottagningens resultat?
Har ni bedrivit ett förbättringsarbete under många år?
91
Har er vårdcentral/mottagning ansvar för kvalitet och resultat för per-soner med diabetes?
Finns det en kultur på er vårdcentral/mottagning att följa riktlinjer?
Finns det på er vårdcentral/mottagning ett fokus på prevention av följdsjukdomar vid diabetes?
Kvalitetsuppföljning och återkoppling i organisationen 29. Ja Nej Huvudmannen återkopplar regelbundet resultat från NDR till vårdcen-
tralerna/mottagningarna?
Huvudmannen använder återkoppling av resultat från NDR som en möjlighet till kvalitetsdialog?
Huvudmannen redovisar internt alla vårdcentraler/mottagningars NDR-resul-tat?
En satsning sker och/eller har skett på diabetes med en politiskprioritering i ert landsting/region?
Acta Universitatis UpsaliensisDigital Comprehensive Summaries of Uppsala Dissertationsfrom the Faculty of Medicine 1529
Editor: The Dean of the Faculty of Medicine
A doctoral dissertation from the Faculty of Medicine, UppsalaUniversity, is usually a summary of a number of papers. A fewcopies of the complete dissertation are kept at major Swedishresearch libraries, while the summary alone is distributedinternationally through the series Digital ComprehensiveSummaries of Uppsala Dissertations from the Faculty ofMedicine. (Prior to January, 2005, the series was publishedunder the title “Comprehensive Summaries of UppsalaDissertations from the Faculty of Medicine”.)
Distribution: publications.uu.seurn:nbn:se:uu:diva-371496
ACTAUNIVERSITATIS
UPSALIENSISUPPSALA
2019