nationaltrackingpoll#2110009 october02-04,2021
TRANSCRIPT

National Tracking Poll #2110009October 02-04, 2021
Crosstabulation Results
Methodology:This poll was conducted between October 2-October 4, 2021 among a sample of 1998 RegisteredVoters. The interviews were conducted online and the data were weighted to approximate a targetsample of Registered Voters based on gender by age, educational attainment, race, marital status,home ownership, race by educational attainment, 2020 presidential vote, and region. Results fromthe full survey have a margin of error of plus or minus 2 percentage points.

Table Index
1 Table P1: Now, generally speaking, would you say that things in the country are going in theright direction, or have they pretty seriously gotten off on the wrong track? . . . . . . . . . . 6
2 Table nr2b: Do you approve or disapprove of the job Joe Biden is doing as President? . . . . 10
3 Table nr2bNET: Do you approve or disapprove of the job Joe Biden is doing as President? . . 14
4 Table P3: Now, thinking about your vote, what would you say is the top set of issues on yourmind when you cast your vote for federal offices such as U.S. Senate or Congress? . . . . . . . 18
5 Table POL1: Thinking about the November 2022 midterm elections for U.S. Congress, howenthusiastic would you say you are about voting in the midterm elections? . . . . . . . . . . 23
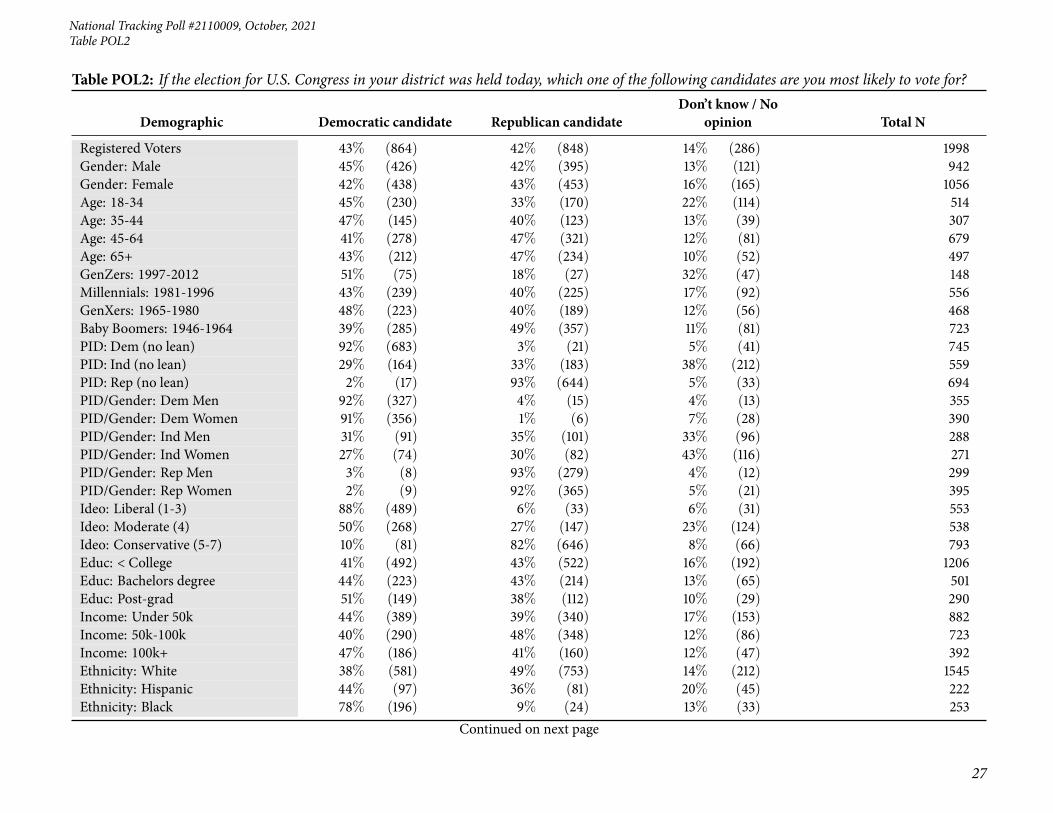
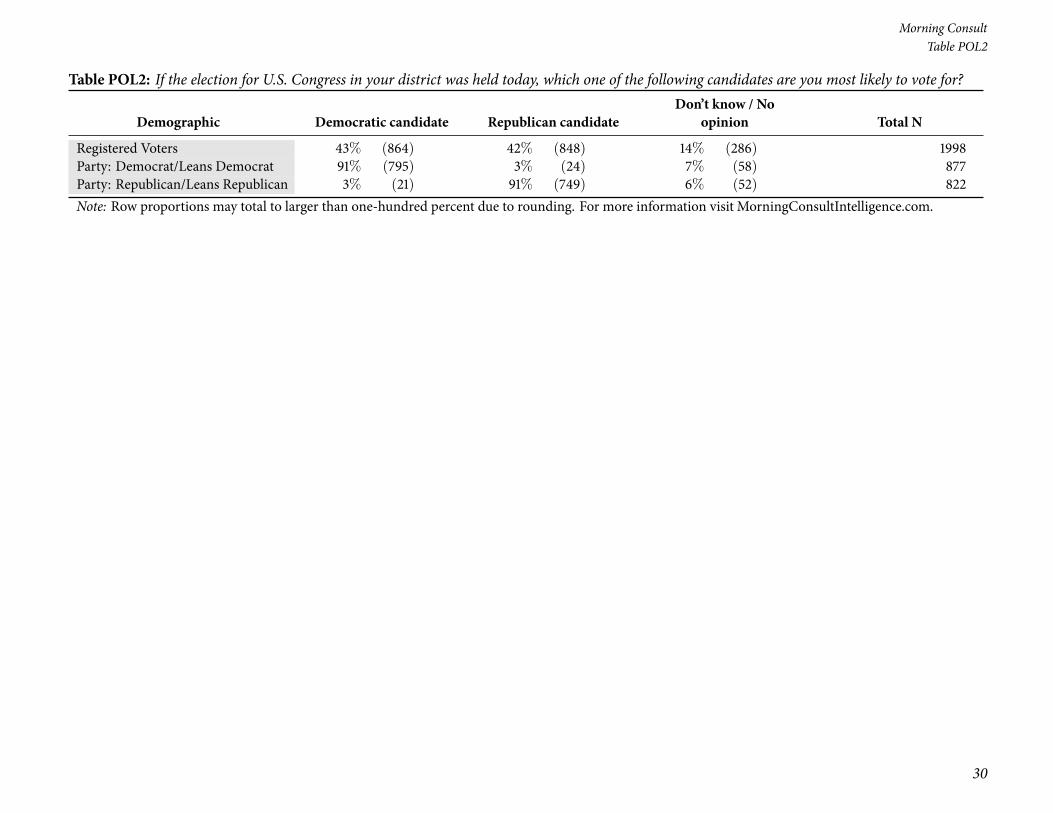
6 Table POL2: If the election for U.S. Congress in your district was held today, which one of thefollowing candidates are you most likely to vote for? . . . . . . . . . . . . . . . . . . . . . . 27
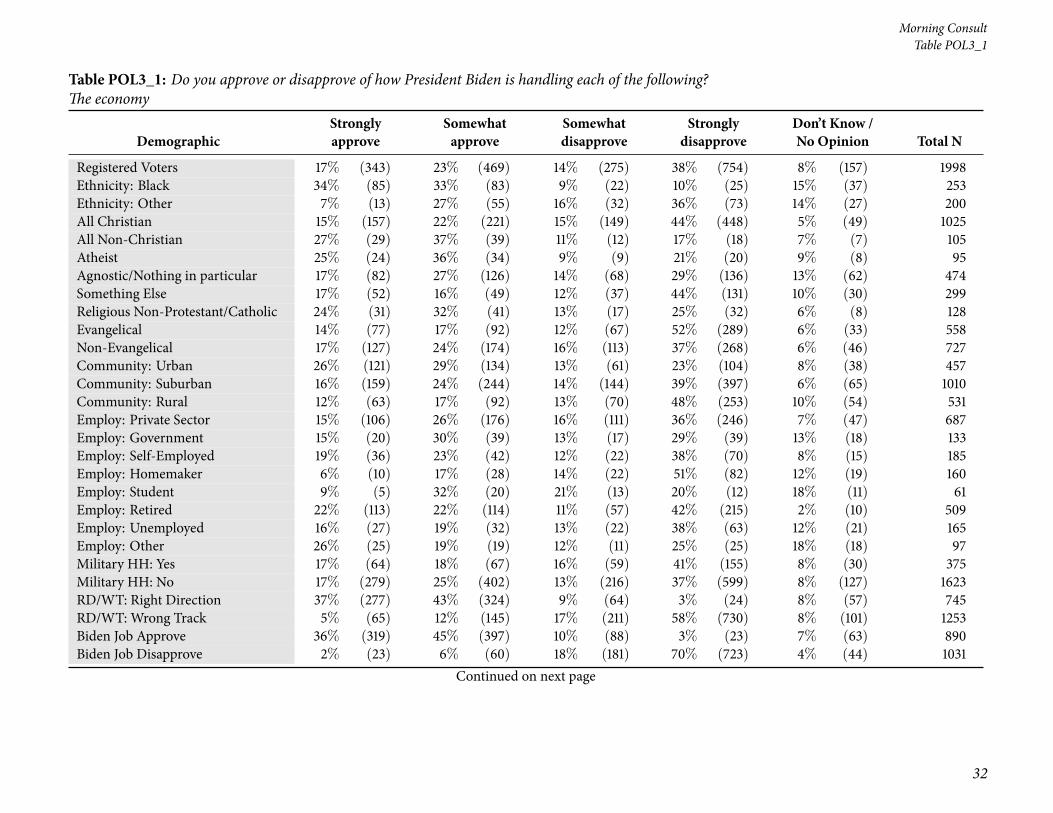
7 Table POL3_1: Do you approve or disapprove of how President Biden is handling each of thefollowing? The economy . . . . . . . . . . . . . . . . . . . . . . . . . . . . . . . . . . . . . 31
8 Table POL3_2: Do you approve or disapprove of how President Biden is handling each of thefollowing? Jobs . . . . . . . . . . . . . . . . . . . . . . . . . . . . . . . . . . . . . . . . . 35
9 Table POL3_3: Do you approve or disapprove of how President Biden is handling each of thefollowing? Health care . . . . . . . . . . . . . . . . . . . . . . . . . . . . . . . . . . . . . 39
10 Table POL3_4: Do you approve or disapprove of how President Biden is handling each of thefollowing? Immigration . . . . . . . . . . . . . . . . . . . . . . . . . . . . . . . . . . . . . 43
11 Table POL3_5: Do you approve or disapprove of how President Biden is handling each of thefollowing? Climate change . . . . . . . . . . . . . . . . . . . . . . . . . . . . . . . . . . . 47
12 Table POL3_6: Do you approve or disapprove of how President Biden is handling each of thefollowing? The environment . . . . . . . . . . . . . . . . . . . . . . . . . . . . . . . . . . 51
13 Table POL3_7: Do you approve or disapprove of how President Biden is handling each of thefollowing? Energy . . . . . . . . . . . . . . . . . . . . . . . . . . . . . . . . . . . . . . . . 55
14 Table POL3_8: Do you approve or disapprove of how President Biden is handling each of thefollowing? Education . . . . . . . . . . . . . . . . . . . . . . . . . . . . . . . . . . . . . . 59
15 Table POL3_9: Do you approve or disapprove of how President Biden is handling each of thefollowing? National security . . . . . . . . . . . . . . . . . . . . . . . . . . . . . . . . . . 63
16 Table POL3_10: Do you approve or disapprove of how President Biden is handling each ofthe following? Gun policy . . . . . . . . . . . . . . . . . . . . . . . . . . . . . . . . . . . . 67
17 Table POL3_11: Do you approve or disapprove of how President Biden is handling each ofthe following? Protecting Medicare and Social Security . . . . . . . . . . . . . . . . . . . . 71
2
National Tracking Poll #2110009, October, 2021
18 Table POL3_12: Do you approve or disapprove of how President Biden is handling each ofthe following? Coronavirus . . . . . . . . . . . . . . . . . . . . . . . . . . . . . . . . . . . 75
19 Table POL3_13: Do you approve or disapprove of how President Biden is handling each ofthe following? Voting rights . . . . . . . . . . . . . . . . . . . . . . . . . . . . . . . . . . . 79
20 Table POL3_14: Do you approve or disapprove of how President Biden is handling each ofthe following? Foreign policy . . . . . . . . . . . . . . . . . . . . . . . . . . . . . . . . . . 83
21 Table POL4_1: How would you rate each of the following on their handling of the coron-avirus? President Joe Biden . . . . . . . . . . . . . . . . . . . . . . . . . . . . . . . . . . . 87
22 Table POL4_2: How would you rate each of the following on their handling of the coron-avirus? Congress . . . . . . . . . . . . . . . . . . . . . . . . . . . . . . . . . . . . . . . . 91
23 Table POL4_3: How would you rate each of the following on their handling of the coron-avirus? Congressional Democrats . . . . . . . . . . . . . . . . . . . . . . . . . . . . . . . 95
24 Table POL4_4: How would you rate each of the following on their handling of the coron-avirus? Congressional Republicans . . . . . . . . . . . . . . . . . . . . . . . . . . . . . . . 99
25 Table POL4_5: How would you rate each of the following on their handling of the coron-avirus? The World Health Organization (WHO) . . . . . . . . . . . . . . . . . . . . . . . . 103
26 Table POL4_6: How would you rate each of the following on their handling of the coron-avirus? The Centers for Disease Control and Prevention (CDC) . . . . . . . . . . . . . . . . 107
27 Table POL4_7: How would you rate each of the following on their handling of the coron-avirus? Your state’s governor . . . . . . . . . . . . . . . . . . . . . . . . . . . . . . . . . . 111
28 Table POL4_8: How would you rate each of the following on their handling of the coron-avirus? Dr. Anthony Fauci, Director of the National Institute of Allergy and Infectious Diseases 115
29 Table POL5: Generally speaking, would you say you are more concerned about... . . . . . . 119
30 Table POL6: Currently, do you believe it’s more important for the government to address the: 123
31 Table POL7: Even if neither is exactly correct, which of the following comes closest to youropinion? . . . . . . . . . . . . . . . . . . . . . . . . . . . . . . . . . . . . . . . . . . . . . 127
32 Table POL8: As you may know, on July 15, 2021 the Treasury Department began makingpayments of up to $300 a month per child to most families with children, also known as ex-panded child tax credit payments.Do you support or oppose these expanded child tax creditpayments? . . . . . . . . . . . . . . . . . . . . . . . . . . . . . . . . . . . . . . . . . . . . 131
33 Table POL9: Have you received the expanded child tax credit payment? . . . . . . . . . . . 135
34 Table POL10: Has the expanded child tax credit payment you received had a major or minorimpact on your financial security, or has it had no impact? . . . . . . . . . . . . . . . . . . 138
35 Table POL11_1NET: Who do you feel is responsible for the expanded child tax credit pay-ments being made possible? Please select all that apply. Democrats in Congress . . . . . . . . 141
3
Morning Consult
36 Table POL11_2NET: Who do you feel is responsible for the expanded child tax credit pay-ments being made possible? Please select all that apply. Republicans in Congress . . . . . . . 145
37 Table POL11_3NET: Who do you feel is responsible for the expanded child tax credit pay-ments being made possible? Please select all that apply. President Joe Biden . . . . . . . . . . 149
38 Table POL11_4NET: Who do you feel is responsible for the expanded child tax credit pay-ments being made possible? Please select all that apply. Other (please specify) . . . . . . . . 153
39 Table POL11_5NET: Who do you feel is responsible for the expanded child tax credit pay-ments being made possible? Please select all that apply. Don’t Know / No Opinion . . . . . . 157
40 Table POL12: As you may know, the expanded child tax credit payments are set to expirenext year. Do you think the payments should be made permanent? . . . . . . . . . . . . . . 161
41 Table POL13: As youmay know, the U.S. Senate passed a $1 trillion bipartisan bill to improveAmerica’s infrastructure. Do you support or oppose this infrastructure bill? . . . . . . . . . . 165
42 Table POL14: How well, if at all, would you say you understand the ongoing conversationsin Washington D.C. about the debt ceiling? . . . . . . . . . . . . . . . . . . . . . . . . . . . 169
43 Table POL15: How concerned are you, if at all, about the U.S. defaulting on its debts? . . . . 172
44 Table POL16: If the U.S. defaulted on its debts, do you think this would have...? . . . . . . . 176
45 Table POL17: If the United States were to default on the national debt, would you tend toblame the Democratic Party more, the Republican Party more, or both parties equally? . . . 180
46 Table POL18a: Thinking about congressional Democrats’ agenda and what they have beenable to do since taking full control of the U.S. Congress in January 2021, which of the followingis closest to your opinion, even if none is exactly right? . . . . . . . . . . . . . . . . . . . . . 184
47 Table POL18b: Thinking about President Biden’s agenda and what he has been able to dosince being sworn into office in January 2021, which of the following is closest to your opinion,even if none is exactly right? . . . . . . . . . . . . . . . . . . . . . . . . . . . . . . . . . . 188
48 Table POL19_1: Howmuch have you seen, read, or heard about the following? The upcominginternational climate change conference, COP26, in Glasgow, Scotland . . . . . . . . . . . . 192
49 Table POL19_2: How much have you seen, read, or heard about the following? EvergrandeGroup, a Chinese property company, missing a payment to its investors . . . . . . . . . . . . 196
50 Table POL19_3: How much have you seen, read, or heard about the following? Congressvoting to fund the government through December 3, 2021, avoiding a government shutdown 200
51 Table POL19_4: How much have you seen, read, or heard about the following? Senate Re-publicans blocking attempts by congressional Democrats to avoid a default on the nationaldebt by raising or suspending the debt limit . . . . . . . . . . . . . . . . . . . . . . . . . . 204
52 TablePOL19_5: Howmuchhave you seen, read, or heard about the following? House SpeakerNancy Pelosi (D-Calif.) delaying a vote on the Senate’s infrastructure bill due to a lack of sup-port from liberal House Democrats . . . . . . . . . . . . . . . . . . . . . . . . . . . . . . . 208
4

National Tracking Poll #2110009, October, 2021
53 Table POL19_6: How much have you seen, read, or heard about the following? Sens. JoeManchin (D-W.Va.) and Kyrsten Sinema (D-Ariz.) negotiating with the White House overthe Democrats’ social spending bill . . . . . . . . . . . . . . . . . . . . . . . . . . . . . . . 212
54 Table POLx_1: Next we will look at a list of names that are active in politics. It is a longlist, please take the time to go through the list carefully and give an individual answer foreach name below. For each person, please indicate if you have a Very Favorable, SomewhatFavorable, Somewhat Unfavorable, or Very Unfavorable opinion of each If you have heard ofthe person, but do not have an opinion, please mark ’Heard Of, No Opinion.’ If you have notheard of the person, please mark ’Never Heard Of.’Mitch McConnell . . . . . . . . . . . . . 216
55 Table POLx_2: Favorability for Nancy Pelosi . . . . . . . . . . . . . . . . . . . . . . . . . 220
56 Table POLx_3: Favorability for Charles Schumer . . . . . . . . . . . . . . . . . . . . . . . 224
57 Table POLx_4: Favorability for Mike Pence . . . . . . . . . . . . . . . . . . . . . . . . . . 228
58 Table POLx_5: Favorability for Donald Trump . . . . . . . . . . . . . . . . . . . . . . . . 232
59 Table POLx_6: Favorability for Republicans in Congress . . . . . . . . . . . . . . . . . . . 236
60 Table POLx_7: Favorability for Democrats in Congress . . . . . . . . . . . . . . . . . . . . 240
61 Table POLx_9: Favorability for Kevin McCarthy . . . . . . . . . . . . . . . . . . . . . . . 244
62 Table POLx_10: Favorability for Joe Biden . . . . . . . . . . . . . . . . . . . . . . . . . . 248
63 Table POLx_11: Favorability for Kamala Harris . . . . . . . . . . . . . . . . . . . . . . . 252
64 Table POLx_12: Favorability for Joe Manchin . . . . . . . . . . . . . . . . . . . . . . . . . 256
65 Table POLx_13: Favorability for Kyrsten Sinema . . . . . . . . . . . . . . . . . . . . . . . 260
66 Table demKidsnew: Are you the parent or guardian of any children under 18 now living inyour household? . . . . . . . . . . . . . . . . . . . . . . . . . . . . . . . . . . . . . . . . . 264
67 Summary Statistics of Survey Respondent Demographics . . . . . . . . . . . . . . . . . 267
5

6
Morning ConsultTable P1
Crosstabulation Results by Respondent Demographics
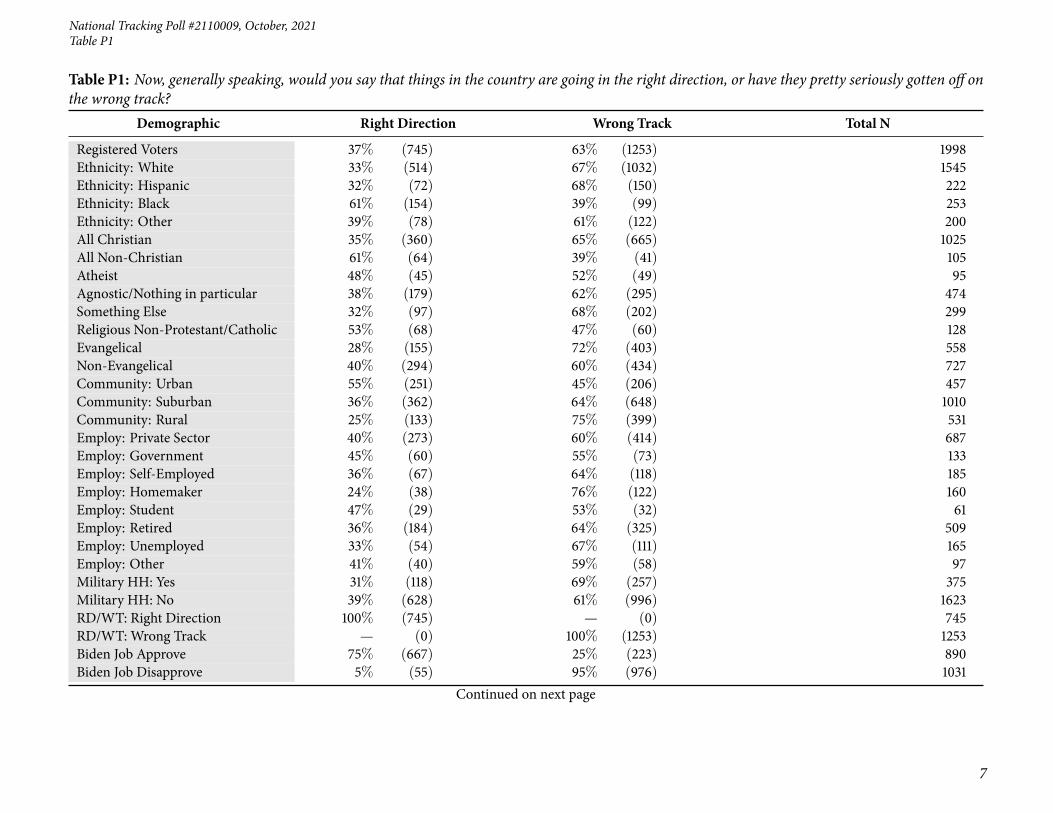
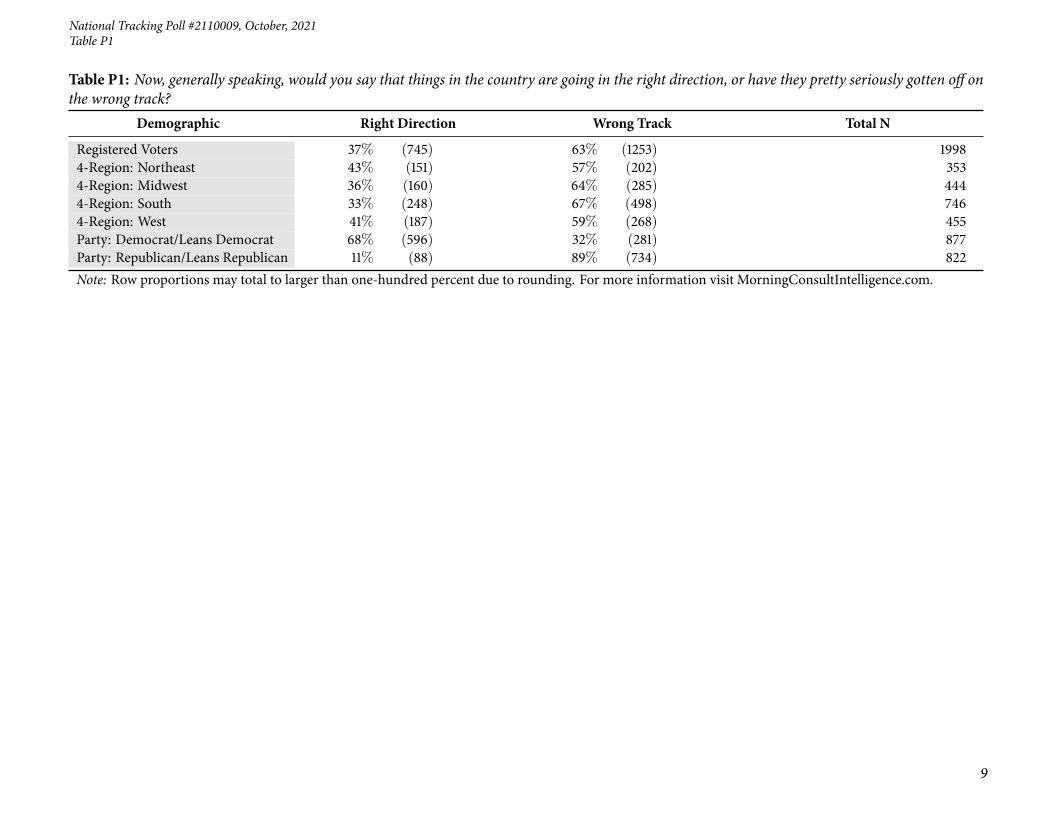
Table P1: Now, generally speaking, would you say that things in the country are going in the right direction, or have they pretty seriously gotten off onthe wrong track?
Demographic Right Direction Wrong Track Total N
Registered Voters 37% (745) 63% (1253) 1998Gender: Male 39% (370) 61% (572) 942Gender: Female 36% (375) 64% (681) 1056Age: 18-34 35% (179) 65% (335) 514Age: 35-44 40% (122) 60% (185) 307Age: 45-64 39% (264) 61% (415) 679Age: 65+ 36% (180) 64% (317) 497GenZers: 1997-2012 32% (47) 68% (101) 148Millennials: 1981-1996 38% (209) 62% (346) 556GenXers: 1965-1980 43% (201) 57% (267) 468Baby Boomers: 1946-1964 35% (254) 65% (469) 723PID: Dem (no lean) 70% (524) 30% (221) 745PID: Ind (no lean) 26% (146) 74% (413) 559PID: Rep (no lean) 11% (76) 89% (618) 694PID/Gender: DemMen 71% (253) 29% (102) 355PID/Gender: DemWomen 69% (270) 31% (119) 390PID/Gender: Ind Men 26% (75) 74% (213) 288PID/Gender: Ind Women 26% (71) 74% (200) 271PID/Gender: Rep Men 14% (42) 86% (257) 299PID/Gender: Rep Women 9% (34) 91% (361) 395Ideo: Liberal (1-3) 70% (390) 30% (163) 553Ideo: Moderate (4) 46% (245) 54% (293) 538Ideo: Conservative (5-7) 12% (92) 88% (700) 793Educ: < College 33% (393) 67% (813) 1206Educ: Bachelors degree 40% (198) 60% (303) 501Educ: Post-grad 53% (154) 47% (137) 290Income: Under 50k 36% (316) 64% (566) 882Income: 50k-100k 36% (257) 64% (466) 723Income: 100k+ 44% (172) 56% (220) 392
Continued on next page
National Tracking Poll #2110009, October, 2021
7
Table P1
Table P1: Now, generally speaking, would you say that things in the country are going in the right direction, or have they pretty seriously gotten off onthe wrong track?
Demographic Right Direction Wrong Track Total N
Registered Voters 37% (745) 63% (1253) 1998Ethnicity: White 33% (514) 67% (1032) 1545Ethnicity: Hispanic 32% (72) 68% (150) 222Ethnicity: Black 61% (154) 39% (99) 253Ethnicity: Other 39% (78) 61% (122) 200All Christian 35% (360) 65% (665) 1025All Non-Christian 61% (64) 39% (41) 105Atheist 48% (45) 52% (49) 95Agnostic/Nothing in particular 38% (179) 62% (295) 474Something Else 32% (97) 68% (202) 299Religious Non-Protestant/Catholic 53% (68) 47% (60) 128Evangelical 28% (155) 72% (403) 558Non-Evangelical 40% (294) 60% (434) 727Community: Urban 55% (251) 45% (206) 457Community: Suburban 36% (362) 64% (648) 1010Community: Rural 25% (133) 75% (399) 531Employ: Private Sector 40% (273) 60% (414) 687Employ: Government 45% (60) 55% (73) 133Employ: Self-Employed 36% (67) 64% (118) 185Employ: Homemaker 24% (38) 76% (122) 160Employ: Student 47% (29) 53% (32) 61Employ: Retired 36% (184) 64% (325) 509Employ: Unemployed 33% (54) 67% (111) 165Employ: Other 41% (40) 59% (58) 97Military HH: Yes 31% (118) 69% (257) 375Military HH: No 39% (628) 61% (996) 1623RD/WT: Right Direction 100% (745) — (0) 745RD/WT: Wrong Track — (0) 100% (1253) 1253Biden Job Approve 75% (667) 25% (223) 890Biden Job Disapprove 5% (55) 95% (976) 1031
Continued on next page

8
Morning ConsultTable P1
Table P1: Now, generally speaking, would you say that things in the country are going in the right direction, or have they pretty seriously gotten off onthe wrong track?
Demographic Right Direction Wrong Track Total N
Registered Voters 37% (745) 63% (1253) 1998Biden Job Strongly Approve 85% (379) 15% (67) 446Biden Job Somewhat Approve 65% (288) 35% (155) 444Biden Job Somewhat Disapprove 14% (35) 86% (215) 250Biden Job Strongly Disapprove 3% (20) 97% (761) 781Favorable of Biden 73% (657) 27% (243) 899Unfavorable of Biden 6% (66) 94% (967) 1032Very Favorable of Biden 84% (396) 16% (74) 470Somewhat Favorable of Biden 61% (261) 39% (168) 429Somewhat Unfavorable of Biden 19% (47) 81% (199) 246Very Unfavorable of Biden 2% (19) 98% (767) 786#1 Issue: Economy 33% (245) 67% (498) 742#1 Issue: Security 16% (64) 84% (345) 409#1 Issue: Health Care 63% (156) 37% (92) 248#1 Issue: Medicare / Social Security 51% (107) 49% (101) 209#1 Issue: Women’s Issues 56% (62) 44% (49) 111#1 Issue: Education 42% (30) 58% (42) 72#1 Issue: Energy 52% (47) 48% (43) 90#1 Issue: Other 29% (34) 71% (83) 1172020 Vote: Joe Biden 66% (628) 34% (317) 9462020 Vote: Donald Trump 8% (69) 92% (795) 8642020 Vote: Didn’t Vote 27% (42) 73% (111) 1532018 House Vote: Democrat 66% (485) 34% (249) 7342018 House Vote: Republican 10% (72) 90% (647) 7192018 House Vote: Someone else 10% (6) 90% (48) 532016 Vote: Hillary Clinton 68% (480) 32% (226) 7062016 Vote: Donald Trump 11% (92) 89% (713) 8052016 Vote: Other 36% (31) 64% (56) 872016 Vote: Didn’t Vote 36% (142) 64% (256) 399Voted in 2014: Yes 38% (503) 62% (821) 1324Voted in 2014: No 36% (243) 64% (432) 674
Continued on next page
National Tracking Poll #2110009, October, 2021
9
Table P1
Table P1: Now, generally speaking, would you say that things in the country are going in the right direction, or have they pretty seriously gotten off onthe wrong track?
Demographic Right Direction Wrong Track Total N
Registered Voters 37% (745) 63% (1253) 19984-Region: Northeast 43% (151) 57% (202) 3534-Region: Midwest 36% (160) 64% (285) 4444-Region: South 33% (248) 67% (498) 7464-Region: West 41% (187) 59% (268) 455Party: Democrat/Leans Democrat 68% (596) 32% (281) 877Party: Republican/Leans Republican 11% (88) 89% (734) 822Note: Row proportions may total to larger than one-hundred percent due to rounding. For more information visit MorningConsultIntelligence.com.

10
Morning ConsultTable nr2b
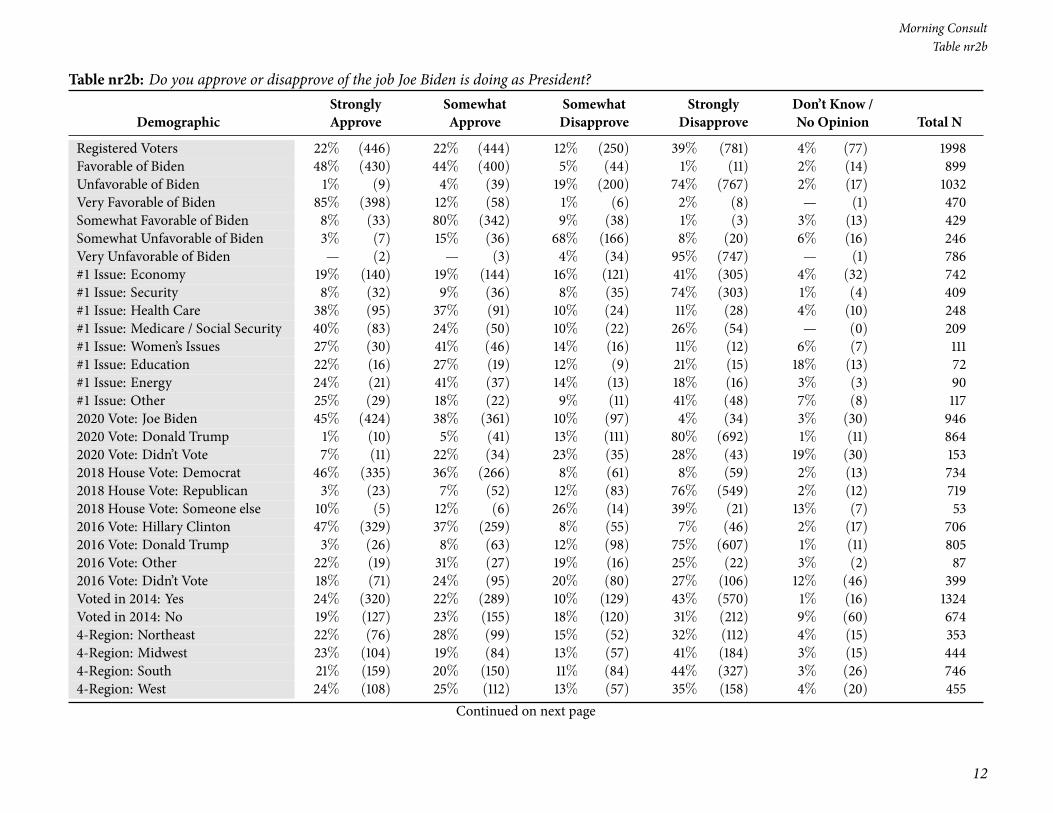
Table nr2b: Do you approve or disapprove of the job Joe Biden is doing as President?
DemographicStronglyApprove
SomewhatApprove
SomewhatDisapprove
StronglyDisapprove
Don’t Know /No Opinion Total N
Registered Voters 22% (446) 22% (444) 12% (250) 39% (781) 4% (77) 1998Gender: Male 24% (226) 21% (202) 11% (102) 41% (384) 3% (28) 942Gender: Female 21% (221) 23% (242) 14% (147) 38% (398) 5% (49) 1056Age: 18-34 17% (89) 25% (131) 17% (89) 30% (153) 10% (53) 514Age: 35-44 23% (70) 23% (69) 16% (49) 36% (109) 3% (9) 307Age: 45-64 23% (153) 22% (151) 9% (64) 44% (300) 2% (12) 679Age: 65+ 27% (134) 19% (93) 10% (47) 44% (220) 1% (3) 497GenZers: 1997-2012 12% (18) 28% (42) 17% (25) 21% (31) 22% (32) 148Millennials: 1981-1996 19% (108) 24% (135) 18% (98) 34% (186) 5% (28) 556GenXers: 1965-1980 26% (120) 23% (109) 11% (50) 38% (177) 3% (12) 468Baby Boomers: 1946-1964 24% (171) 19% (139) 10% (70) 47% (339) 1% (4) 723PID: Dem (no lean) 49% (366) 35% (259) 8% (63) 6% (42) 2% (14) 745PID: Ind (no lean) 11% (60) 24% (136) 20% (109) 36% (203) 9% (51) 559PID: Rep (no lean) 3% (20) 7% (49) 11% (78) 77% (536) 2% (11) 694PID/Gender: DemMen 53% (186) 31% (109) 9% (33) 7% (24) 1% (3) 355PID/Gender: DemWomen 46% (180) 38% (150) 8% (30) 5% (18) 3% (12) 390PID/Gender: Ind Men 11% (33) 22% (62) 17% (50) 42% (122) 7% (21) 288PID/Gender: Ind Women 10% (27) 27% (73) 22% (59) 30% (81) 11% (30) 271PID/Gender: Rep Men 2% (7) 10% (31) 6% (19) 79% (238) 2% (5) 299PID/Gender: Rep Women 3% (13) 5% (18) 15% (59) 76% (298) 2% (7) 395Ideo: Liberal (1-3) 48% (266) 35% (195) 9% (48) 6% (32) 2% (12) 553Ideo: Moderate (4) 24% (129) 33% (178) 15% (80) 24% (128) 4% (24) 538Ideo: Conservative (5-7) 6% (44) 7% (53) 13% (101) 74% (588) 1% (7) 793Educ: < College 21% (256) 20% (242) 13% (163) 41% (492) 5% (54) 1206Educ: Bachelors degree 22% (110) 23% (116) 12% (60) 40% (198) 3% (17) 501Educ: Post-grad 28% (81) 30% (86) 9% (27) 31% (91) 2% (6) 290Income: Under 50k 23% (204) 22% (194) 14% (126) 35% (311) 5% (46) 882Income: 50k-100k 19% (141) 21% (149) 11% (80) 46% (332) 3% (21) 723Income: 100k+ 26% (101) 26% (101) 11% (43) 35% (138) 2% (9) 392Ethnicity: White 19% (297) 21% (322) 12% (183) 45% (697) 3% (47) 1545Ethnicity: Hispanic 21% (47) 22% (49) 18% (40) 33% (73) 6% (14) 222Ethnicity: Black 48% (122) 25% (63) 11% (29) 8% (20) 7% (18) 253
Continued on next page

National Tracking Poll #2110009, October, 2021
11
Table nr2b
Table nr2b: Do you approve or disapprove of the job Joe Biden is doing as President?
DemographicStronglyApprove
SomewhatApprove
SomewhatDisapprove
StronglyDisapprove
Don’t Know /No Opinion Total N
Registered Voters 22% (446) 22% (444) 12% (250) 39% (781) 4% (77) 1998Ethnicity: Other 14% (28) 29% (59) 19% (38) 32% (65) 6% (12) 200All Christian 21% (211) 20% (203) 12% (126) 46% (468) 2% (18) 1025All Non-Christian 42% (44) 34% (36) 3% (3) 19% (19) 2% (2) 105Atheist 25% (24) 35% (33) 10% (10) 27% (26) 3% (3) 95Agnostic/Nothing in particular 23% (107) 27% (126) 14% (68) 30% (141) 7% (32) 474Something Else 20% (59) 16% (47) 14% (43) 43% (128) 7% (22) 299Religious Non-Protestant/Catholic 36% (46) 29% (37) 6% (7) 27% (34) 2% (3) 128Evangelical 18% (102) 13% (74) 11% (64) 54% (299) 4% (20) 558Non-Evangelical 23% (164) 24% (172) 14% (101) 37% (271) 3% (19) 727Community: Urban 35% (158) 27% (126) 11% (50) 24% (108) 4% (16) 457Community: Suburban 20% (207) 23% (230) 14% (141) 39% (396) 4% (36) 1010Community: Rural 15% (82) 17% (89) 11% (58) 52% (278) 5% (24) 531Employ: Private Sector 21% (142) 24% (167) 13% (87) 38% (260) 4% (30) 687Employ: Government 20% (26) 25% (34) 15% (20) 37% (49) 3% (4) 133Employ: Self-Employed 28% (52) 21% (38) 9% (16) 40% (74) 3% (5) 185Employ: Homemaker 9% (15) 27% (43) 14% (23) 49% (78) 1% (2) 160Employ: Student 19% (12) 26% (16) 23% (14) 17% (10) 15% (9) 61Employ: Retired 27% (138) 18% (92) 10% (50) 45% (227) 1% (3) 509Employ: Unemployed 22% (36) 19% (31) 17% (28) 34% (55) 9% (15) 165Employ: Other 27% (26) 24% (23) 11% (11) 29% (28) 10% (9) 97Military HH: Yes 22% (81) 18% (66) 12% (44) 46% (171) 3% (12) 375Military HH: No 23% (365) 23% (378) 13% (205) 38% (610) 4% (65) 1623RD/WT: Right Direction 51% (379) 39% (288) 5% (35) 3% (20) 3% (23) 745RD/WT: Wrong Track 5% (67) 12% (155) 17% (215) 61% (761) 4% (54) 1253Biden Job Approve 50% (446) 50% (444) — (0) — (0) — (0) 890Biden Job Disapprove — (0) — (0) 24% (250) 76% (781) — (0) 1031Biden Job Strongly Approve 100% (446) — (0) — (0) — (0) — (0) 446Biden Job Somewhat Approve — (0) 100% (444) — (0) — (0) — (0) 444Biden Job Somewhat Disapprove — (0) — (0) 100% (250) — (0) — (0) 250Biden Job Strongly Disapprove — (0) — (0) — (0) 100% (781) — (0) 781
Continued on next page
12
Morning ConsultTable nr2b
Table nr2b: Do you approve or disapprove of the job Joe Biden is doing as President?
DemographicStronglyApprove
SomewhatApprove
SomewhatDisapprove
StronglyDisapprove
Don’t Know /No Opinion Total N
Registered Voters 22% (446) 22% (444) 12% (250) 39% (781) 4% (77) 1998Favorable of Biden 48% (430) 44% (400) 5% (44) 1% (11) 2% (14) 899Unfavorable of Biden 1% (9) 4% (39) 19% (200) 74% (767) 2% (17) 1032Very Favorable of Biden 85% (398) 12% (58) 1% (6) 2% (8) — (1) 470Somewhat Favorable of Biden 8% (33) 80% (342) 9% (38) 1% (3) 3% (13) 429Somewhat Unfavorable of Biden 3% (7) 15% (36) 68% (166) 8% (20) 6% (16) 246Very Unfavorable of Biden — (2) — (3) 4% (34) 95% (747) — (1) 786#1 Issue: Economy 19% (140) 19% (144) 16% (121) 41% (305) 4% (32) 742#1 Issue: Security 8% (32) 9% (36) 8% (35) 74% (303) 1% (4) 409#1 Issue: Health Care 38% (95) 37% (91) 10% (24) 11% (28) 4% (10) 248#1 Issue: Medicare / Social Security 40% (83) 24% (50) 10% (22) 26% (54) — (0) 209#1 Issue: Women’s Issues 27% (30) 41% (46) 14% (16) 11% (12) 6% (7) 111#1 Issue: Education 22% (16) 27% (19) 12% (9) 21% (15) 18% (13) 72#1 Issue: Energy 24% (21) 41% (37) 14% (13) 18% (16) 3% (3) 90#1 Issue: Other 25% (29) 18% (22) 9% (11) 41% (48) 7% (8) 1172020 Vote: Joe Biden 45% (424) 38% (361) 10% (97) 4% (34) 3% (30) 9462020 Vote: Donald Trump 1% (10) 5% (41) 13% (111) 80% (692) 1% (11) 8642020 Vote: Didn’t Vote 7% (11) 22% (34) 23% (35) 28% (43) 19% (30) 1532018 House Vote: Democrat 46% (335) 36% (266) 8% (61) 8% (59) 2% (13) 7342018 House Vote: Republican 3% (23) 7% (52) 12% (83) 76% (549) 2% (12) 7192018 House Vote: Someone else 10% (5) 12% (6) 26% (14) 39% (21) 13% (7) 532016 Vote: Hillary Clinton 47% (329) 37% (259) 8% (55) 7% (46) 2% (17) 7062016 Vote: Donald Trump 3% (26) 8% (63) 12% (98) 75% (607) 1% (11) 8052016 Vote: Other 22% (19) 31% (27) 19% (16) 25% (22) 3% (2) 872016 Vote: Didn’t Vote 18% (71) 24% (95) 20% (80) 27% (106) 12% (46) 399Voted in 2014: Yes 24% (320) 22% (289) 10% (129) 43% (570) 1% (16) 1324Voted in 2014: No 19% (127) 23% (155) 18% (120) 31% (212) 9% (60) 6744-Region: Northeast 22% (76) 28% (99) 15% (52) 32% (112) 4% (15) 3534-Region: Midwest 23% (104) 19% (84) 13% (57) 41% (184) 3% (15) 4444-Region: South 21% (159) 20% (150) 11% (84) 44% (327) 3% (26) 7464-Region: West 24% (108) 25% (112) 13% (57) 35% (158) 4% (20) 455
Continued on next page

National Tracking Poll #2110009, October, 2021
13
Table nr2b
Table nr2b: Do you approve or disapprove of the job Joe Biden is doing as President?
DemographicStronglyApprove
SomewhatApprove
SomewhatDisapprove
StronglyDisapprove
Don’t Know /No Opinion Total N
Registered Voters 22% (446) 22% (444) 12% (250) 39% (781) 4% (77) 1998Party: Democrat/Leans Democrat 46% (399) 37% (329) 10% (89) 5% (45) 2% (16) 877Party: Republican/Leans Republican 3% (25) 7% (61) 13% (104) 76% (621) 1% (11) 822Note: Row proportions may total to larger than one-hundred percent due to rounding. For more information visit MorningConsultIntelligence.com.

14
Morning ConsultTable nr2bNET
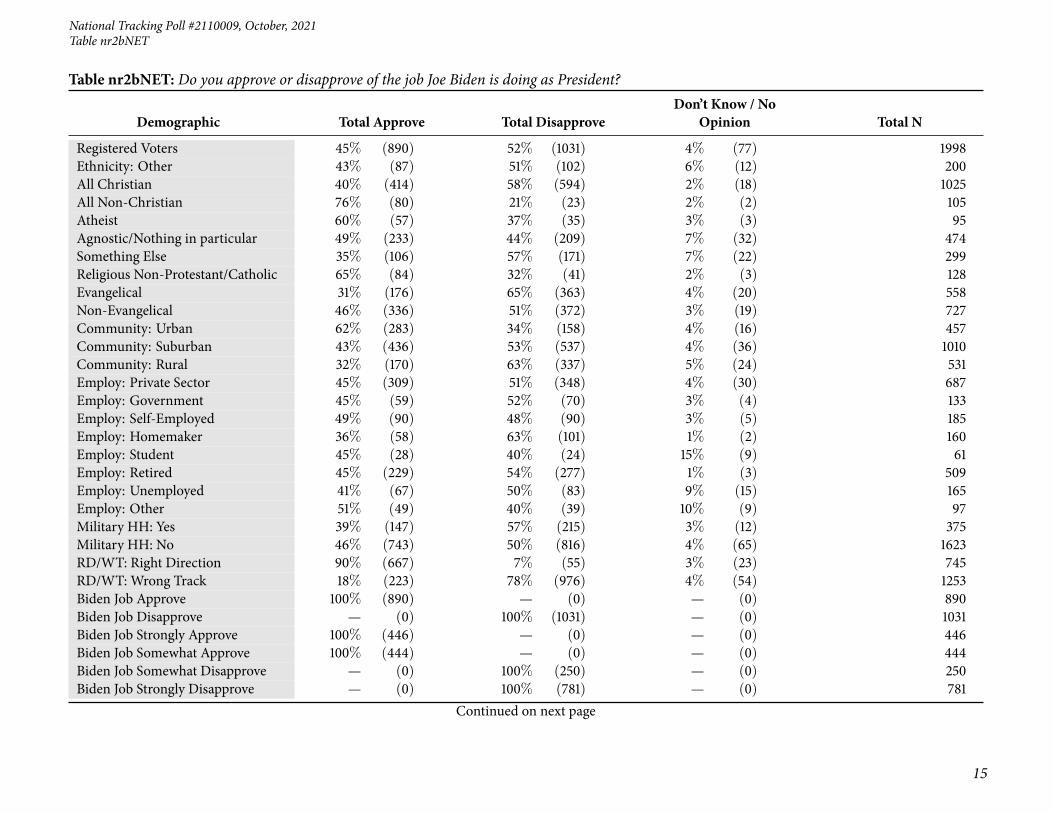
Table nr2bNET: Do you approve or disapprove of the job Joe Biden is doing as President?
Demographic Total Approve Total DisapproveDon’t Know / No
Opinion Total N
Registered Voters 45% (890) 52% (1031) 4% (77) 1998Gender: Male 45% (428) 52% (486) 3% (28) 942Gender: Female 44% (462) 52% (545) 5% (49) 1056Age: 18-34 43% (220) 47% (241) 10% (53) 514Age: 35-44 46% (140) 52% (158) 3% (9) 307Age: 45-64 45% (304) 54% (364) 2% (12) 679Age: 65+ 46% (227) 54% (267) 1% (3) 497GenZers: 1997-2012 40% (60) 38% (56) 22% (32) 148Millennials: 1981-1996 44% (243) 51% (284) 5% (28) 556GenXers: 1965-1980 49% (229) 48% (227) 3% (12) 468Baby Boomers: 1946-1964 43% (310) 56% (408) 1% (4) 723PID: Dem (no lean) 84% (625) 14% (105) 2% (14) 745PID: Ind (no lean) 35% (196) 56% (312) 9% (51) 559PID: Rep (no lean) 10% (69) 88% (614) 2% (11) 694PID/Gender: DemMen 83% (295) 16% (57) 1% (3) 355PID/Gender: DemWomen 85% (330) 12% (48) 3% (12) 390PID/Gender: Ind Men 33% (95) 60% (172) 7% (21) 288PID/Gender: Ind Women 37% (101) 52% (140) 11% (30) 271PID/Gender: Rep Men 12% (37) 86% (257) 2% (5) 299PID/Gender: Rep Women 8% (31) 90% (357) 2% (7) 395Ideo: Liberal (1-3) 83% (460) 14% (80) 2% (12) 553Ideo: Moderate (4) 57% (307) 39% (208) 4% (24) 538Ideo: Conservative (5-7) 12% (97) 87% (689) 1% (7) 793Educ: < College 41% (497) 54% (655) 5% (54) 1206Educ: Bachelors degree 45% (226) 52% (258) 3% (17) 501Educ: Post-grad 57% (167) 41% (118) 2% (6) 290Income: Under 50k 45% (399) 50% (438) 5% (46) 882Income: 50k-100k 40% (290) 57% (412) 3% (21) 723Income: 100k+ 51% (202) 46% (181) 2% (9) 392Ethnicity: White 40% (618) 57% (880) 3% (47) 1545Ethnicity: Hispanic 43% (95) 51% (113) 6% (14) 222Ethnicity: Black 73% (185) 19% (49) 7% (18) 253
Continued on next page
National Tracking Poll #2110009, October, 2021
15
Table nr2bNET
Table nr2bNET: Do you approve or disapprove of the job Joe Biden is doing as President?
Demographic Total Approve Total DisapproveDon’t Know / No
Opinion Total N
Registered Voters 45% (890) 52% (1031) 4% (77) 1998Ethnicity: Other 43% (87) 51% (102) 6% (12) 200All Christian 40% (414) 58% (594) 2% (18) 1025All Non-Christian 76% (80) 21% (23) 2% (2) 105Atheist 60% (57) 37% (35) 3% (3) 95Agnostic/Nothing in particular 49% (233) 44% (209) 7% (32) 474Something Else 35% (106) 57% (171) 7% (22) 299Religious Non-Protestant/Catholic 65% (84) 32% (41) 2% (3) 128Evangelical 31% (176) 65% (363) 4% (20) 558Non-Evangelical 46% (336) 51% (372) 3% (19) 727Community: Urban 62% (283) 34% (158) 4% (16) 457Community: Suburban 43% (436) 53% (537) 4% (36) 1010Community: Rural 32% (170) 63% (337) 5% (24) 531Employ: Private Sector 45% (309) 51% (348) 4% (30) 687Employ: Government 45% (59) 52% (70) 3% (4) 133Employ: Self-Employed 49% (90) 48% (90) 3% (5) 185Employ: Homemaker 36% (58) 63% (101) 1% (2) 160Employ: Student 45% (28) 40% (24) 15% (9) 61Employ: Retired 45% (229) 54% (277) 1% (3) 509Employ: Unemployed 41% (67) 50% (83) 9% (15) 165Employ: Other 51% (49) 40% (39) 10% (9) 97Military HH: Yes 39% (147) 57% (215) 3% (12) 375Military HH: No 46% (743) 50% (816) 4% (65) 1623RD/WT: Right Direction 90% (667) 7% (55) 3% (23) 745RD/WT: Wrong Track 18% (223) 78% (976) 4% (54) 1253Biden Job Approve 100% (890) — (0) — (0) 890Biden Job Disapprove — (0) 100% (1031) — (0) 1031Biden Job Strongly Approve 100% (446) — (0) — (0) 446Biden Job Somewhat Approve 100% (444) — (0) — (0) 444Biden Job Somewhat Disapprove — (0) 100% (250) — (0) 250Biden Job Strongly Disapprove — (0) 100% (781) — (0) 781
Continued on next page

16
Morning ConsultTable nr2bNET
Table nr2bNET: Do you approve or disapprove of the job Joe Biden is doing as President?
Demographic Total Approve Total DisapproveDon’t Know / No
Opinion Total N
Registered Voters 45% (890) 52% (1031) 4% (77) 1998Favorable of Biden 92% (831) 6% (55) 2% (14) 899Unfavorable of Biden 5% (48) 94% (967) 2% (17) 1032Very Favorable of Biden 97% (455) 3% (14) — (1) 470Somewhat Favorable of Biden 87% (375) 10% (41) 3% (13) 429Somewhat Unfavorable of Biden 18% (43) 76% (187) 6% (16) 246Very Unfavorable of Biden 1% (5) 99% (781) — (1) 786#1 Issue: Economy 38% (284) 57% (426) 4% (32) 742#1 Issue: Security 17% (68) 82% (337) 1% (4) 409#1 Issue: Health Care 75% (186) 21% (52) 4% (10) 248#1 Issue: Medicare / Social Security 63% (132) 36% (76) — (0) 209#1 Issue: Women’s Issues 69% (76) 25% (28) 6% (7) 111#1 Issue: Education 48% (35) 34% (24) 18% (13) 72#1 Issue: Energy 65% (58) 32% (29) 3% (3) 90#1 Issue: Other 43% (51) 50% (58) 7% (8) 1172020 Vote: Joe Biden 83% (785) 14% (131) 3% (30) 9462020 Vote: Donald Trump 6% (50) 93% (802) 1% (11) 8642020 Vote: Didn’t Vote 30% (45) 51% (78) 19% (30) 1532018 House Vote: Democrat 82% (601) 16% (120) 2% (13) 7342018 House Vote: Republican 10% (75) 88% (632) 2% (12) 7192018 House Vote: Someone else 21% (11) 65% (35) 13% (7) 532016 Vote: Hillary Clinton 83% (588) 14% (101) 2% (17) 7062016 Vote: Donald Trump 11% (90) 88% (704) 1% (11) 8052016 Vote: Other 53% (47) 44% (38) 3% (2) 872016 Vote: Didn’t Vote 42% (166) 47% (186) 12% (46) 399Voted in 2014: Yes 46% (609) 53% (699) 1% (16) 1324Voted in 2014: No 42% (282) 49% (332) 9% (60) 6744-Region: Northeast 49% (175) 46% (163) 4% (15) 3534-Region: Midwest 42% (188) 54% (241) 3% (15) 4444-Region: South 41% (308) 55% (411) 3% (26) 7464-Region: West 48% (220) 47% (215) 4% (20) 455
Continued on next page

National Tracking Poll #2110009, October, 2021
17
Table nr2bNET
Table nr2bNET: Do you approve or disapprove of the job Joe Biden is doing as President?
Demographic Total Approve Total DisapproveDon’t Know / No
Opinion Total N
Registered Voters 45% (890) 52% (1031) 4% (77) 1998Party: Democrat/Leans Democrat 83% (728) 15% (133) 2% (16) 877Party: Republican/Leans Republican 10% (85) 88% (725) 1% (11) 822Note: Row proportions may total to larger than one-hundred percent due to rounding. For more information visit MorningConsultIntelligence.com.

18
Morning ConsultTable P3
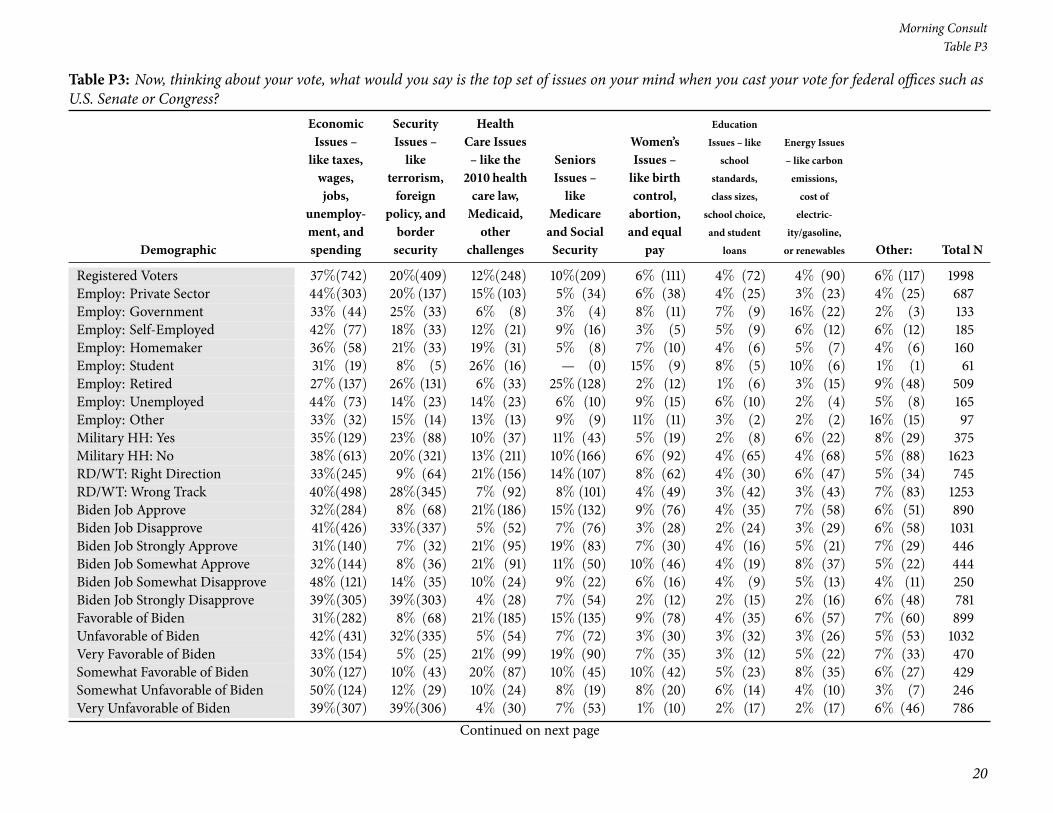
Table P3: Now, thinking about your vote, what would you say is the top set of issues on your mind when you cast your vote for federal offices such asU.S. Senate or Congress?
Demographic
EconomicIssues –like taxes,wages,jobs,
unemploy-ment, andspending
SecurityIssues –like
terrorism,foreign
policy, andbordersecurity
HealthCare Issues– like the2010 healthcare law,Medicaid,other
challenges
SeniorsIssues –like
Medicareand SocialSecurity
Women’sIssues –like birthcontrol,abortion,and equal
pay
EducationIssues – like
schoolstandards,class sizes,
school choice,and student
loans
Energy Issues– like carbonemissions,cost ofelectric-
ity/gasoline,or renewables Other: Total N
Registered Voters 37%(742) 20%(409) 12%(248) 10%(209) 6% (111) 4% (72) 4% (90) 6% (117) 1998Gender: Male 40%(372) 21%(196) 11%(108) 11%(100) 2% (22) 4% (39) 5% (51) 6% (54) 942Gender: Female 35%(370) 20%(213) 13%(140) 10%(109) 8% (89) 3% (33) 4% (39) 6% (63) 1056Age: 18-34 41%(209) 13% (68) 15% (80) 2% (11) 10% (50) 7% (39) 7% (37) 4% (20) 514Age: 35-44 48%(146) 15% (45) 15% (45) 2% (7) 7% (21) 5% (14) 6% (17) 4% (12) 307Age: 45-64 39%(268) 24%(160) 14% (92) 8% (57) 4% (26) 2% (17) 3% (22) 6% (37) 679Age: 65+ 24% (119) 27%(135) 6% (31) 27%(135) 3% (14) 1% (3) 3% (13) 10% (47) 497GenZers: 1997-2012 30% (44) 14% (20) 18% (26) 1% (2) 14% (21) 11% (17) 6% (9) 6% (9) 148Millennials: 1981-1996 46%(256) 14% (77) 15% (81) 2% (13) 8% (43) 6% (35) 6% (33) 3% (16) 556GenXers: 1965-1980 42%(199) 21% (98) 14% (66) 4% (19) 5% (21) 3% (14) 6% (28) 5% (23) 468Baby Boomers: 1946-1964 31%(224) 25%(182) 10% (70) 20%(142) 3% (22) 1% (6) 2% (17) 8% (61) 723PID: Dem (no lean) 33%(247) 9% (63) 19%(144) 13% (98) 9% (70) 4% (30) 7% (54) 5% (37) 745PID: Ind (no lean) 41%(228) 17% (94) 12% (65) 9% (48) 5% (30) 4% (24) 3% (19) 9% (52) 559PID: Rep (no lean) 39%(267) 36%(251) 6% (38) 9% (62) 2% (12) 3% (19) 2% (16) 4% (28) 694PID/Gender: DemMen 39%(137) 10% (37) 20% (71) 13% (48) 3% (12) 4% (13) 7% (25) 4% (13) 355PID/Gender: DemWomen 28% (110) 7% (26) 19% (74) 13% (51) 15% (58) 4% (17) 8% (30) 6% (25) 390PID/Gender: Ind Men 43%(123) 17% (50) 8% (24) 9% (26) 2% (7) 5% (14) 5% (14) 11% (31) 288PID/Gender: Ind Women 39%(105) 16% (44) 15% (42) 8% (23) 8% (23) 3% (9) 2% (5) 8% (21) 271PID/Gender: Rep Men 38% (112) 36%(109) 5% (14) 9% (26) 1% (3) 4% (12) 4% (12) 4% (11) 299PID/Gender: Rep Women 39%(155) 36%(143) 6% (25) 9% (36) 2% (9) 2% (7) 1% (4) 4% (17) 395Ideo: Liberal (1-3) 31%(169) 6% (32) 20% (113) 13% (74) 11% (59) 5% (27) 8% (44) 6% (35) 553Ideo: Moderate (4) 43%(233) 13% (70) 14% (74) 11% (61) 4% (23) 2% (11) 6% (31) 6% (35) 538Ideo: Conservative (5-7) 38%(301) 37%(295) 5% (43) 8% (67) 2% (16) 2% (19) 1% (11) 5% (39) 793
Continued on next page

National Tracking Poll #2110009, October, 2021
19
Table P3
Table P3: Now, thinking about your vote, what would you say is the top set of issues on your mind when you cast your vote for federal offices such asU.S. Senate or Congress?
Demographic
EconomicIssues –like taxes,wages,jobs,
unemploy-ment, andspending
SecurityIssues –like
terrorism,foreign
policy, andbordersecurity
HealthCare Issues– like the2010 healthcare law,Medicaid,other
challenges
SeniorsIssues –like
Medicareand SocialSecurity
Women’sIssues –like birthcontrol,abortion,and equal
pay
EducationIssues – like
schoolstandards,class sizes,
school choice,and student
loans
Energy Issues– like carbonemissions,cost ofelectric-
ity/gasoline,or renewables Other: Total N
Registered Voters 37%(742) 20%(409) 12%(248) 10%(209) 6% (111) 4% (72) 4% (90) 6% (117) 1998Educ: < College 36%(431) 22%(261) 12%(146) 11%(136) 5% (65) 4% (49) 4% (53) 5% (66) 1206Educ: Bachelors degree 39%(194) 21%(108) 14% (69) 10% (48) 4% (22) 3% (13) 5% (23) 5% (23) 501Educ: Post-grad 40% (117) 14% (41) 11% (33) 8% (24) 8% (24) 4% (10) 5% (13) 10% (28) 290Income: Under 50k 34%(298) 19%(170) 15%(135) 13% (114) 5% (41) 3% (30) 4% (31) 7% (62) 882Income: 50k-100k 38%(277) 24%(176) 10% (69) 9% (62) 7% (48) 3% (23) 5% (35) 5% (34) 723Income: 100k+ 43%(167) 16% (63) 11% (44) 8% (33) 6% (22) 5% (20) 6% (24) 5% (21) 392Ethnicity: White 35%(536) 23%(354) 12%(178) 11%(172) 5% (81) 3% (46) 5% (80) 6% (97) 1545Ethnicity: Hispanic 32% (70) 22% (50) 14% (31) 6% (12) 7% (16) 5% (12) 8% (17) 6% (13) 222Ethnicity: Black 47% (119) 6% (16) 18% (47) 9% (23) 9% (22) 8% (20) 1% (3) 1% (3) 253Ethnicity: Other 43% (87) 19% (39) 12% (24) 7% (13) 4% (8) 3% (7) 3% (7) 8% (17) 200All Christian 35%(364) 25%(257) 11% (116) 14%(143) 5% (47) 2% (21) 3% (33) 4% (44) 1025All Non-Christian 29% (31) 13% (13) 20% (21) 14% (14) 8% (8) 4% (4) 3% (3) 10% (10) 105Atheist 34% (33) 19% (18) 13% (12) 1% (1) 11% (10) — (0) 14% (13) 7% (7) 95Agnostic/Nothing in particular 39%(184) 13% (63) 14% (68) 6% (28) 6% (29) 8% (36) 7% (34) 7% (33) 474Something Else 44%(132) 20% (58) 10% (30) 7% (22) 5% (16) 4% (11) 2% (6) 8% (23) 299Religious Non-Protestant/Catholic 27% (35) 17% (21) 18% (22) 13% (17) 7% (9) 4% (5) 5% (6) 10% (12) 128Evangelical 41%(231) 25%(138) 10% (54) 10% (54) 5% (26) 3% (16) 2% (12) 5% (27) 558Non-Evangelical 35%(256) 22%(163) 12% (88) 15%(106) 5% (36) 2% (15) 3% (25) 5% (38) 727Community: Urban 39%(179) 17% (77) 14% (64) 10% (44) 6% (28) 6% (26) 5% (23) 3% (16) 457Community: Suburban 39%(389) 20%(202) 13%(134) 9% (94) 6% (60) 3% (26) 5% (46) 6% (58) 1010Community: Rural 33%(174) 24%(130) 10% (51) 13% (70) 4% (23) 4% (20) 4% (20) 8% (43) 531
Continued on next page
20
Morning ConsultTable P3
Table P3: Now, thinking about your vote, what would you say is the top set of issues on your mind when you cast your vote for federal offices such asU.S. Senate or Congress?
Demographic
EconomicIssues –like taxes,wages,jobs,
unemploy-ment, andspending
SecurityIssues –like
terrorism,foreign
policy, andbordersecurity
HealthCare Issues– like the2010 healthcare law,Medicaid,other
challenges
SeniorsIssues –like
Medicareand SocialSecurity
Women’sIssues –like birthcontrol,abortion,and equal
pay
EducationIssues – like
schoolstandards,class sizes,
school choice,and student
loans
Energy Issues– like carbonemissions,cost ofelectric-
ity/gasoline,or renewables Other: Total N
Registered Voters 37%(742) 20%(409) 12%(248) 10%(209) 6% (111) 4% (72) 4% (90) 6% (117) 1998Employ: Private Sector 44%(303) 20%(137) 15%(103) 5% (34) 6% (38) 4% (25) 3% (23) 4% (25) 687Employ: Government 33% (44) 25% (33) 6% (8) 3% (4) 8% (11) 7% (9) 16% (22) 2% (3) 133Employ: Self-Employed 42% (77) 18% (33) 12% (21) 9% (16) 3% (5) 5% (9) 6% (12) 6% (12) 185Employ: Homemaker 36% (58) 21% (33) 19% (31) 5% (8) 7% (10) 4% (6) 5% (7) 4% (6) 160Employ: Student 31% (19) 8% (5) 26% (16) — (0) 15% (9) 8% (5) 10% (6) 1% (1) 61Employ: Retired 27%(137) 26% (131) 6% (33) 25%(128) 2% (12) 1% (6) 3% (15) 9% (48) 509Employ: Unemployed 44% (73) 14% (23) 14% (23) 6% (10) 9% (15) 6% (10) 2% (4) 5% (8) 165Employ: Other 33% (32) 15% (14) 13% (13) 9% (9) 11% (11) 3% (2) 2% (2) 16% (15) 97Military HH: Yes 35%(129) 23% (88) 10% (37) 11% (43) 5% (19) 2% (8) 6% (22) 8% (29) 375Military HH: No 38%(613) 20%(321) 13% (211) 10%(166) 6% (92) 4% (65) 4% (68) 5% (88) 1623RD/WT: Right Direction 33%(245) 9% (64) 21%(156) 14%(107) 8% (62) 4% (30) 6% (47) 5% (34) 745RD/WT: Wrong Track 40%(498) 28%(345) 7% (92) 8% (101) 4% (49) 3% (42) 3% (43) 7% (83) 1253Biden Job Approve 32%(284) 8% (68) 21%(186) 15%(132) 9% (76) 4% (35) 7% (58) 6% (51) 890Biden Job Disapprove 41%(426) 33%(337) 5% (52) 7% (76) 3% (28) 2% (24) 3% (29) 6% (58) 1031Biden Job Strongly Approve 31%(140) 7% (32) 21% (95) 19% (83) 7% (30) 4% (16) 5% (21) 7% (29) 446Biden Job Somewhat Approve 32%(144) 8% (36) 21% (91) 11% (50) 10% (46) 4% (19) 8% (37) 5% (22) 444Biden Job Somewhat Disapprove 48% (121) 14% (35) 10% (24) 9% (22) 6% (16) 4% (9) 5% (13) 4% (11) 250Biden Job Strongly Disapprove 39%(305) 39%(303) 4% (28) 7% (54) 2% (12) 2% (15) 2% (16) 6% (48) 781Favorable of Biden 31%(282) 8% (68) 21%(185) 15%(135) 9% (78) 4% (35) 6% (57) 7% (60) 899Unfavorable of Biden 42%(431) 32%(335) 5% (54) 7% (72) 3% (30) 3% (32) 3% (26) 5% (53) 1032Very Favorable of Biden 33%(154) 5% (25) 21% (99) 19% (90) 7% (35) 3% (12) 5% (22) 7% (33) 470Somewhat Favorable of Biden 30%(127) 10% (43) 20% (87) 10% (45) 10% (42) 5% (23) 8% (35) 6% (27) 429Somewhat Unfavorable of Biden 50%(124) 12% (29) 10% (24) 8% (19) 8% (20) 6% (14) 4% (10) 3% (7) 246Very Unfavorable of Biden 39%(307) 39%(306) 4% (30) 7% (53) 1% (10) 2% (17) 2% (17) 6% (46) 786
Continued on next page

National Tracking Poll #2110009, October, 2021
21
Table P3
Table P3: Now, thinking about your vote, what would you say is the top set of issues on your mind when you cast your vote for federal offices such asU.S. Senate or Congress?
Demographic
EconomicIssues –like taxes,wages,jobs,
unemploy-ment, andspending
SecurityIssues –like
terrorism,foreign
policy, andbordersecurity
HealthCare Issues– like the2010 healthcare law,Medicaid,other
challenges
SeniorsIssues –like
Medicareand SocialSecurity
Women’sIssues –like birthcontrol,abortion,and equal
pay
EducationIssues – like
schoolstandards,class sizes,
school choice,and student
loans
Energy Issues– like carbonemissions,cost ofelectric-
ity/gasoline,or renewables Other: Total N
Registered Voters 37%(742) 20%(409) 12%(248) 10%(209) 6% (111) 4% (72) 4% (90) 6% (117) 1998#1 Issue: Economy 100%(742) — (0) — (0) — (0) — (0) — (0) — (0) — (0) 742#1 Issue: Security — (0) 100%(409) — (0) — (0) — (0) — (0) — (0) — (0) 409#1 Issue: Health Care — (0) — (0) 100%(248) — (0) — (0) — (0) — (0) — (0) 248#1 Issue: Medicare / Social Security — (0) — (0) — (0) 100%(209) — (0) — (0) — (0) — (0) 209#1 Issue: Women’s Issues — (0) — (0) — (0) — (0) 100% (111) — (0) — (0) — (0) 111#1 Issue: Education — (0) — (0) — (0) — (0) — (0) 100% (72) — (0) — (0) 72#1 Issue: Energy — (0) — (0) — (0) — (0) — (0) — (0) 100% (90) — (0) 90#1 Issue: Other — (0) — (0) — (0) — (0) — (0) — (0) — (0) 100% (117) 1172020 Vote: Joe Biden 34%(318) 7% (69) 19%(180) 13%(125) 9% (89) 4% (37) 7% (64) 7% (64) 9462020 Vote: Donald Trump 40%(342) 36%(308) 5% (46) 8% (72) 1% (11) 2% (21) 2% (18) 5% (45) 8642020 Vote: Didn’t Vote 44% (67) 17% (26) 11% (17) 8% (12) 6% (9) 8% (12) 4% (6) 2% (4) 1532018 House Vote: Democrat 35%(254) 9% (63) 19%(138) 14%(102) 9% (64) 3% (23) 6% (47) 6% (43) 7342018 House Vote: Republican 38%(276) 36%(256) 5% (39) 9% (65) 1% (8) 3% (19) 2% (14) 6% (41) 7192018 House Vote: Someone else 35% (19) 12% (6) 7% (4) 5% (3) 10% (5) 5% (3) 3% (2) 23% (12) 532016 Vote: Hillary Clinton 35%(247) 7% (52) 19%(132) 14%(100) 9% (63) 3% (23) 7% (46) 6% (43) 7062016 Vote: Donald Trump 39% (311) 35%(283) 6% (46) 9% (72) 1% (10) 2% (20) 3% (21) 5% (43) 8052016 Vote: Other 47% (41) 10% (9) 15% (13) 9% (8) 2% (2) 2% (2) 4% (4) 11% (9) 872016 Vote: Didn’t Vote 36%(143) 16% (65) 15% (58) 7% (28) 9% (36) 7% (28) 5% (18) 6% (22) 399Voted in 2014: Yes 37%(485) 22%(292) 12%(153) 12%(164) 4% (59) 3% (35) 4% (53) 6% (83) 1324Voted in 2014: No 38%(258) 17% (117) 14% (95) 7% (45) 8% (52) 6% (37) 5% (37) 5% (34) 6744-Region: Northeast 38%(134) 21% (73) 12% (41) 11% (38) 6% (20) 1% (5) 6% (20) 6% (23) 3534-Region: Midwest 33%(149) 21% (95) 15% (65) 12% (54) 5% (23) 5% (21) 4% (20) 4% (19) 4444-Region: South 40%(295) 22% (161) 11% (80) 9% (69) 5% (40) 5% (34) 3% (23) 6% (42) 7464-Region: West 36%(164) 18% (81) 14% (63) 10% (47) 6% (28) 3% (12) 6% (27) 7% (32) 455
Continued on next page
22
Morning ConsultTable P3
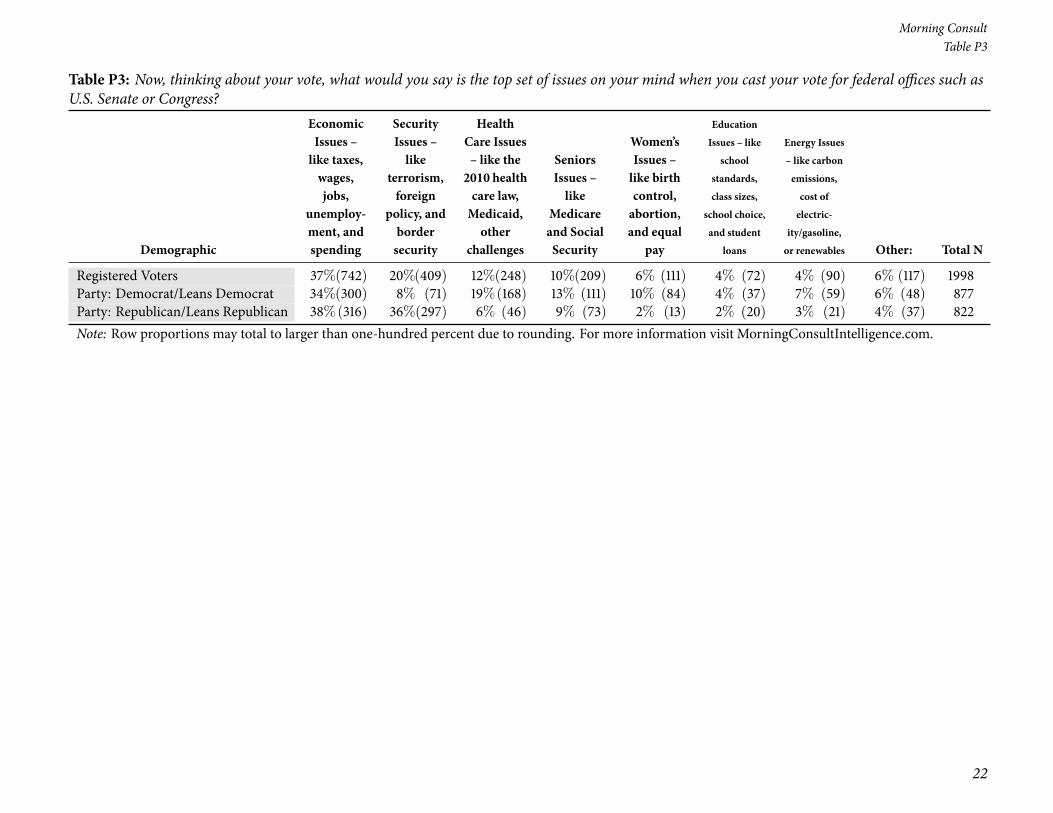
Table P3: Now, thinking about your vote, what would you say is the top set of issues on your mind when you cast your vote for federal offices such asU.S. Senate or Congress?
Demographic
EconomicIssues –like taxes,wages,jobs,
unemploy-ment, andspending
SecurityIssues –like
terrorism,foreign
policy, andbordersecurity
HealthCare Issues– like the2010 healthcare law,Medicaid,other
challenges
SeniorsIssues –like
Medicareand SocialSecurity
Women’sIssues –like birthcontrol,abortion,and equal
pay
EducationIssues – like
schoolstandards,class sizes,
school choice,and student
loans
Energy Issues– like carbonemissions,cost ofelectric-
ity/gasoline,or renewables Other: Total N
Registered Voters 37%(742) 20%(409) 12%(248) 10%(209) 6% (111) 4% (72) 4% (90) 6% (117) 1998Party: Democrat/Leans Democrat 34%(300) 8% (71) 19%(168) 13% (111) 10% (84) 4% (37) 7% (59) 6% (48) 877Party: Republican/Leans Republican 38%(316) 36%(297) 6% (46) 9% (73) 2% (13) 2% (20) 3% (21) 4% (37) 822Note: Row proportions may total to larger than one-hundred percent due to rounding. For more information visit MorningConsultIntelligence.com.

National Tracking Poll #2110009, October, 2021
23
Table POL1
Table POL1: Thinking about the November 2022 midterm elections for U.S. Congress, how enthusiastic would you say you are about voting in themidterm elections?
DemographicExtremelyenthusiastic
Veryenthusiastic
Somewhatenthusiastic
Not tooenthusiastic
Not at allenthusiastic Total N
Registered Voters 26% (511) 20% (399) 27% (543) 19% (375) 9% (171) 1998Gender: Male 31% (288) 23% (212) 25% (231) 16% (148) 7% (62) 942Gender: Female 21% (223) 18% (187) 29% (311) 21% (227) 10% (109) 1056Age: 18-34 17% (87) 16% (80) 32% (165) 25% (127) 11% (56) 514Age: 35-44 23% (72) 22% (67) 26% (80) 21% (64) 8% (25) 307Age: 45-64 25% (172) 20% (135) 28% (188) 18% (124) 9% (60) 679Age: 65+ 36% (179) 24% (118) 22% (110) 12% (60) 6% (30) 497GenZers: 1997-2012 4% (7) 12% (18) 38% (56) 33% (49) 12% (18) 148Millennials: 1981-1996 22% (124) 19% (104) 29% (160) 21% (115) 10% (53) 556GenXers: 1965-1980 24% (114) 20% (92) 30% (139) 18% (84) 8% (39) 468Baby Boomers: 1946-1964 32% (230) 23% (164) 22% (162) 15% (110) 8% (56) 723PID: Dem (no lean) 29% (217) 24% (177) 26% (195) 16% (116) 5% (39) 745PID: Ind (no lean) 16% (87) 17% (95) 28% (157) 25% (142) 14% (78) 559PID: Rep (no lean) 30% (206) 18% (128) 27% (190) 17% (116) 8% (53) 694PID/Gender: DemMen 33% (116) 27% (97) 24% (84) 12% (44) 4% (14) 355PID/Gender: DemWomen 26% (101) 20% (80) 29% (111) 19% (72) 6% (25) 390PID/Gender: Ind Men 21% (61) 20% (57) 24% (68) 24% (69) 11% (33) 288PID/Gender: Ind Women 10% (26) 14% (38) 33% (89) 27% (73) 17% (46) 271PID/Gender: Rep Men 37% (111) 19% (58) 26% (79) 12% (35) 5% (16) 299PID/Gender: Rep Women 24% (95) 18% (69) 28% (111) 21% (81) 10% (38) 395Ideo: Liberal (1-3) 33% (185) 22% (123) 26% (145) 13% (71) 5% (29) 553Ideo: Moderate (4) 16% (87) 19% (104) 30% (160) 25% (134) 10% (54) 538Ideo: Conservative (5-7) 29% (233) 21% (163) 26% (209) 16% (128) 8% (60) 793Educ: < College 23% (274) 19% (228) 28% (340) 21% (249) 10% (116) 1206Educ: Bachelors degree 29% (144) 20% (101) 28% (141) 16% (79) 7% (37) 501Educ: Post-grad 32% (93) 24% (70) 21% (61) 16% (47) 6% (18) 290Income: Under 50k 19% (171) 19% (164) 30% (267) 21% (183) 11% (97) 882Income: 50k-100k 30% (216) 21% (152) 26% (186) 17% (122) 6% (46) 723Income: 100k+ 31% (123) 21% (83) 23% (90) 18% (69) 7% (28) 392Ethnicity: White 27% (410) 20% (316) 25% (392) 19% (288) 9% (139) 1545Ethnicity: Hispanic 23% (52) 23% (50) 30% (66) 17% (39) 7% (15) 222
Continued on next page

24
Morning ConsultTable POL1
Table POL1: Thinking about the November 2022 midterm elections for U.S. Congress, how enthusiastic would you say you are about voting in themidterm elections?
DemographicExtremelyenthusiastic
Veryenthusiastic
Somewhatenthusiastic
Not tooenthusiastic
Not at allenthusiastic Total N
Registered Voters 26% (511) 20% (399) 27% (543) 19% (375) 9% (171) 1998Ethnicity: Black 29% (72) 20% (51) 26% (67) 19% (48) 5% (14) 253Ethnicity: Other 14% (28) 16% (32) 42% (84) 19% (38) 9% (17) 200All Christian 29% (300) 23% (239) 25% (252) 15% (158) 7% (77) 1025All Non-Christian 40% (42) 16% (17) 30% (32) 9% (9) 5% (5) 105Atheist 22% (20) 14% (13) 31% (30) 24% (23) 9% (9) 95Agnostic/Nothing in particular 20% (93) 14% (64) 32% (151) 24% (115) 11% (51) 474Something Else 18% (55) 22% (67) 26% (79) 23% (69) 10% (30) 299Religious Non-Protestant/Catholic 38% (49) 16% (21) 31% (39) 11% (14) 4% (5) 128Evangelical 29% (162) 20% (114) 26% (145) 16% (91) 8% (46) 558Non-Evangelical 24% (177) 25% (184) 24% (175) 18% (131) 8% (60) 727Community: Urban 30% (137) 23% (105) 24% (111) 17% (79) 6% (25) 457Community: Suburban 25% (251) 18% (183) 29% (288) 20% (200) 9% (86) 1010Community: Rural 23% (122) 21% (111) 27% (144) 18% (95) 11% (59) 531Employ: Private Sector 24% (166) 21% (147) 29% (197) 18% (124) 8% (53) 687Employ: Government 20% (27) 25% (33) 29% (39) 16% (21) 10% (13) 133Employ: Self-Employed 31% (58) 19% (35) 26% (48) 15% (29) 8% (15) 185Employ: Homemaker 19% (31) 12% (18) 27% (44) 34% (55) 8% (13) 160Employ: Student 21% (13) 7% (4) 30% (18) 26% (16) 15% (9) 61Employ: Retired 33% (169) 24% (121) 24% (120) 14% (69) 6% (29) 509Employ: Unemployed 15% (24) 17% (27) 27% (45) 25% (42) 16% (26) 165Employ: Other 22% (22) 13% (13) 32% (31) 20% (20) 12% (12) 97Military HH: Yes 28% (104) 25% (93) 20% (77) 16% (61) 11% (41) 375Military HH: No 25% (407) 19% (307) 29% (466) 19% (314) 8% (130) 1623RD/WT: Right Direction 29% (218) 23% (173) 28% (207) 16% (117) 4% (31) 745RD/WT: Wrong Track 23% (293) 18% (226) 27% (336) 21% (258) 11% (139) 1253Biden Job Approve 29% (256) 23% (202) 28% (246) 16% (144) 5% (42) 890Biden Job Disapprove 24% (252) 19% (193) 26% (273) 20% (201) 11% (112) 1031
Continued on next page

National Tracking Poll #2110009, October, 2021
25
Table POL1
Table POL1: Thinking about the November 2022 midterm elections for U.S. Congress, how enthusiastic would you say you are about voting in themidterm elections?
DemographicExtremelyenthusiastic
Veryenthusiastic
Somewhatenthusiastic
Not tooenthusiastic
Not at allenthusiastic Total N
Registered Voters 26% (511) 20% (399) 27% (543) 19% (375) 9% (171) 1998Biden Job Strongly Approve 42% (188) 27% (122) 19% (85) 9% (41) 2% (10) 446Biden Job Somewhat Approve 15% (68) 18% (80) 36% (161) 23% (104) 7% (32) 444Biden Job Somewhat Disapprove 8% (20) 17% (41) 27% (68) 32% (80) 16% (40) 250Biden Job Strongly Disapprove 30% (232) 19% (152) 26% (205) 15% (121) 9% (72) 781Favorable of Biden 28% (253) 23% (208) 28% (249) 16% (145) 5% (44) 899Unfavorable of Biden 25% (254) 18% (187) 27% (280) 19% (200) 11% (112) 1032Very Favorable of Biden 40% (190) 27% (129) 20% (96) 10% (46) 2% (10) 470Somewhat Favorable of Biden 15% (63) 19% (80) 36% (154) 23% (99) 8% (34) 429Somewhat Unfavorable of Biden 9% (22) 17% (41) 28% (69) 32% (78) 15% (37) 246Very Unfavorable of Biden 30% (232) 19% (146) 27% (211) 15% (122) 9% (75) 786#1 Issue: Economy 22% (165) 19% (139) 29% (218) 21% (157) 8% (63) 742#1 Issue: Security 32% (132) 20% (81) 25% (104) 13% (54) 9% (38) 409#1 Issue: Health Care 26% (65) 20% (51) 24% (58) 25% (63) 5% (11) 248#1 Issue: Medicare / Social Security 30% (62) 24% (51) 26% (54) 14% (28) 6% (13) 209#1 Issue: Women’s Issues 15% (17) 15% (17) 37% (41) 25% (27) 8% (9) 111#1 Issue: Education 24% (17) 17% (13) 22% (16) 24% (18) 13% (9) 72#1 Issue: Energy 19% (17) 23% (21) 25% (22) 20% (18) 13% (11) 90#1 Issue: Other 30% (35) 24% (28) 24% (28) 8% (10) 14% (16) 1172020 Vote: Joe Biden 27% (259) 23% (218) 26% (243) 18% (169) 6% (57) 9462020 Vote: Donald Trump 27% (237) 19% (165) 27% (238) 18% (154) 8% (71) 8642020 Vote: Didn’t Vote 7% (10) 7% (11) 33% (51) 27% (41) 26% (40) 1532018 House Vote: Democrat 33% (244) 22% (163) 26% (188) 15% (107) 4% (32) 7342018 House Vote: Republican 31% (221) 21% (148) 26% (189) 15% (105) 8% (55) 7192018 House Vote: Someone else 10% (5) 9% (5) 42% (22) 25% (14) 14% (7) 532016 Vote: Hillary Clinton 30% (215) 22% (152) 27% (190) 16% (111) 5% (38) 7062016 Vote: Donald Trump 30% (240) 21% (165) 26% (210) 16% (125) 8% (64) 8052016 Vote: Other 28% (24) 20% (18) 19% (16) 26% (22) 8% (7) 872016 Vote: Didn’t Vote 8% (32) 16% (65) 31% (125) 29% (116) 16% (62) 399Voted in 2014: Yes 33% (438) 21% (283) 25% (326) 15% (194) 6% (82) 1324Voted in 2014: No 11% (73) 17% (117) 32% (216) 27% (180) 13% (88) 674
Continued on next page

26
Morning ConsultTable POL1
Table POL1: Thinking about the November 2022 midterm elections for U.S. Congress, how enthusiastic would you say you are about voting in themidterm elections?
DemographicExtremelyenthusiastic
Veryenthusiastic
Somewhatenthusiastic
Not tooenthusiastic
Not at allenthusiastic Total N
Registered Voters 26% (511) 20% (399) 27% (543) 19% (375) 9% (171) 19984-Region: Northeast 23% (80) 19% (66) 30% (106) 19% (68) 9% (33) 3534-Region: Midwest 24% (108) 21% (92) 25% (112) 21% (93) 9% (40) 4444-Region: South 27% (203) 19% (139) 27% (198) 19% (141) 9% (65) 7464-Region: West 26% (120) 23% (103) 28% (127) 16% (73) 7% (33) 455Party: Democrat/Leans Democrat 28% (248) 23% (200) 27% (236) 16% (145) 6% (48) 877Party: Republican/Leans Republican 29% (238) 19% (156) 27% (223) 17% (138) 8% (68) 822Note: Row proportions may total to larger than one-hundred percent due to rounding. For more information visit MorningConsultIntelligence.com.
National Tracking Poll #2110009, October, 2021
27
Table POL2
Table POL2: If the election for U.S. Congress in your district was held today, which one of the following candidates are you most likely to vote for?
Demographic Democratic candidate Republican candidateDon’t know / No
opinion Total N
Registered Voters 43% (864) 42% (848) 14% (286) 1998Gender: Male 45% (426) 42% (395) 13% (121) 942Gender: Female 42% (438) 43% (453) 16% (165) 1056Age: 18-34 45% (230) 33% (170) 22% (114) 514Age: 35-44 47% (145) 40% (123) 13% (39) 307Age: 45-64 41% (278) 47% (321) 12% (81) 679Age: 65+ 43% (212) 47% (234) 10% (52) 497GenZers: 1997-2012 51% (75) 18% (27) 32% (47) 148Millennials: 1981-1996 43% (239) 40% (225) 17% (92) 556GenXers: 1965-1980 48% (223) 40% (189) 12% (56) 468Baby Boomers: 1946-1964 39% (285) 49% (357) 11% (81) 723PID: Dem (no lean) 92% (683) 3% (21) 5% (41) 745PID: Ind (no lean) 29% (164) 33% (183) 38% (212) 559PID: Rep (no lean) 2% (17) 93% (644) 5% (33) 694PID/Gender: DemMen 92% (327) 4% (15) 4% (13) 355PID/Gender: DemWomen 91% (356) 1% (6) 7% (28) 390PID/Gender: Ind Men 31% (91) 35% (101) 33% (96) 288PID/Gender: Ind Women 27% (74) 30% (82) 43% (116) 271PID/Gender: Rep Men 3% (8) 93% (279) 4% (12) 299PID/Gender: Rep Women 2% (9) 92% (365) 5% (21) 395Ideo: Liberal (1-3) 88% (489) 6% (33) 6% (31) 553Ideo: Moderate (4) 50% (268) 27% (147) 23% (124) 538Ideo: Conservative (5-7) 10% (81) 82% (646) 8% (66) 793Educ: < College 41% (492) 43% (522) 16% (192) 1206Educ: Bachelors degree 44% (223) 43% (214) 13% (65) 501Educ: Post-grad 51% (149) 38% (112) 10% (29) 290Income: Under 50k 44% (389) 39% (340) 17% (153) 882Income: 50k-100k 40% (290) 48% (348) 12% (86) 723Income: 100k+ 47% (186) 41% (160) 12% (47) 392Ethnicity: White 38% (581) 49% (753) 14% (212) 1545Ethnicity: Hispanic 44% (97) 36% (81) 20% (45) 222Ethnicity: Black 78% (196) 9% (24) 13% (33) 253
Continued on next page

28
Morning ConsultTable POL2
Table POL2: If the election for U.S. Congress in your district was held today, which one of the following candidates are you most likely to vote for?
Demographic Democratic candidate Republican candidateDon’t know / No
opinion Total N
Registered Voters 43% (864) 42% (848) 14% (286) 1998Ethnicity: Other 44% (88) 36% (71) 21% (41) 200All Christian 36% (371) 53% (545) 11% (110) 1025All Non-Christian 75% (78) 16% (16) 10% (10) 105Atheist 62% (59) 26% (25) 11% (11) 95Agnostic/Nothing in particular 49% (235) 30% (141) 21% (99) 474Something Else 41% (122) 41% (121) 19% (56) 299Religious Non-Protestant/Catholic 64% (82) 25% (32) 11% (14) 128Evangelical 30% (166) 59% (328) 11% (64) 558Non-Evangelical 44% (318) 43% (311) 13% (97) 727Community: Urban 59% (268) 28% (128) 13% (61) 457Community: Suburban 43% (436) 44% (441) 13% (133) 1010Community: Rural 30% (160) 52% (279) 17% (92) 531Employ: Private Sector 43% (296) 42% (291) 15% (100) 687Employ: Government 43% (57) 44% (58) 13% (17) 133Employ: Self-Employed 46% (85) 44% (81) 11% (20) 185Employ: Homemaker 30% (48) 54% (87) 16% (25) 160Employ: Student 57% (35) 17% (10) 26% (16) 61Employ: Retired 43% (219) 48% (245) 9% (45) 509Employ: Unemployed 46% (75) 30% (50) 24% (40) 165Employ: Other 50% (48) 27% (26) 23% (23) 97Military HH: Yes 35% (133) 50% (188) 15% (54) 375Military HH: No 45% (732) 41% (660) 14% (232) 1623RD/WT: Right Direction 82% (613) 10% (71) 8% (62) 745RD/WT: Wrong Track 20% (252) 62% (777) 18% (224) 1253Biden Job Approve 84% (747) 7% (66) 9% (77) 890Biden Job Disapprove 10% (105) 75% (775) 15% (150) 1031Biden Job Strongly Approve 92% (409) 4% (18) 4% (20) 446Biden Job Somewhat Approve 76% (338) 11% (48) 13% (58) 444Biden Job Somewhat Disapprove 32% (81) 38% (96) 29% (73) 250Biden Job Strongly Disapprove 3% (25) 87% (679) 10% (78) 781
Continued on next page

National Tracking Poll #2110009, October, 2021
29
Table POL2
Table POL2: If the election for U.S. Congress in your district was held today, which one of the following candidates are you most likely to vote for?
Demographic Democratic candidate Republican candidateDon’t know / No
opinion Total N
Registered Voters 43% (864) 42% (848) 14% (286) 1998Favorable of Biden 84% (754) 7% (60) 9% (85) 899Unfavorable of Biden 9% (96) 75% (778) 15% (158) 1032Very Favorable of Biden 92% (434) 4% (21) 3% (16) 470Somewhat Favorable of Biden 75% (320) 9% (40) 16% (69) 429Somewhat Unfavorable of Biden 30% (75) 39% (95) 31% (76) 246Very Unfavorable of Biden 3% (21) 87% (683) 10% (82) 786#1 Issue: Economy 40% (294) 44% (325) 17% (124) 742#1 Issue: Security 13% (53) 78% (318) 9% (38) 409#1 Issue: Health Care 70% (174) 20% (49) 10% (25) 248#1 Issue: Medicare / Social Security 58% (120) 35% (73) 7% (15) 209#1 Issue: Women’s Issues 72% (80) 11% (12) 17% (19) 111#1 Issue: Education 46% (34) 28% (20) 25% (18) 72#1 Issue: Energy 66% (59) 12% (11) 22% (19) 90#1 Issue: Other 43% (50) 34% (39) 23% (27) 1172020 Vote: Joe Biden 84% (794) 5% (45) 11% (107) 9462020 Vote: Donald Trump 2% (16) 87% (751) 11% (97) 8642020 Vote: Didn’t Vote 31% (47) 27% (41) 42% (65) 1532018 House Vote: Democrat 87% (639) 6% (42) 7% (53) 7342018 House Vote: Republican 4% (29) 88% (636) 8% (54) 7192018 House Vote: Someone else 7% (4) 19% (10) 74% (40) 532016 Vote: Hillary Clinton 85% (602) 5% (37) 9% (66) 7062016 Vote: Donald Trump 7% (56) 84% (676) 9% (73) 8052016 Vote: Other 49% (42) 25% (22) 26% (23) 872016 Vote: Didn’t Vote 41% (163) 28% (112) 31% (124) 399Voted in 2014: Yes 44% (585) 47% (622) 9% (117) 1324Voted in 2014: No 41% (280) 33% (226) 25% (169) 6744-Region: Northeast 49% (174) 34% (120) 17% (59) 3534-Region: Midwest 40% (180) 46% (204) 14% (60) 4444-Region: South 40% (301) 47% (351) 13% (94) 7464-Region: West 46% (210) 38% (172) 16% (73) 455
Continued on next page
30
Morning ConsultTable POL2
Table POL2: If the election for U.S. Congress in your district was held today, which one of the following candidates are you most likely to vote for?
Demographic Democratic candidate Republican candidateDon’t know / No
opinion Total N
Registered Voters 43% (864) 42% (848) 14% (286) 1998Party: Democrat/Leans Democrat 91% (795) 3% (24) 7% (58) 877Party: Republican/Leans Republican 3% (21) 91% (749) 6% (52) 822Note: Row proportions may total to larger than one-hundred percent due to rounding. For more information visit MorningConsultIntelligence.com.

National Tracking Poll #2110009, October, 2021
31
Table POL3_1
Table POL3_1: Do you approve or disapprove of how President Biden is handling each of the following?The economy
DemographicStronglyapprove
Somewhatapprove
Somewhatdisapprove
Stronglydisapprove
Don’t Know /No Opinion Total N
Registered Voters 17% (343) 23% (469) 14% (275) 38% (754) 8% (157) 1998Gender: Male 20% (191) 25% (232) 11% (106) 39% (364) 5% (50) 942Gender: Female 14% (152) 23% (238) 16% (169) 37% (390) 10% (107) 1056Age: 18-34 14% (70) 23% (120) 16% (84) 31% (158) 16% (82) 514Age: 35-44 17% (53) 27% (84) 14% (44) 32% (100) 8% (26) 307Age: 45-64 18% (119) 22% (148) 13% (88) 43% (292) 5% (32) 679Age: 65+ 20% (100) 24% (117) 12% (58) 41% (204) 4% (18) 497GenZers: 1997-2012 13% (19) 18% (27) 21% (32) 23% (34) 25% (37) 148Millennials: 1981-1996 14% (78) 25% (140) 15% (82) 34% (191) 12% (64) 556GenXers: 1965-1980 19% (89) 26% (122) 13% (59) 36% (168) 6% (30) 468Baby Boomers: 1946-1964 19% (137) 21% (153) 13% (93) 44% (317) 3% (24) 723PID: Dem (no lean) 36% (266) 40% (296) 12% (89) 5% (37) 8% (57) 745PID: Ind (no lean) 9% (49) 21% (116) 18% (99) 40% (222) 13% (75) 559PID: Rep (no lean) 4% (28) 8% (58) 13% (88) 71% (495) 4% (26) 694PID/Gender: DemMen 42% (150) 36% (129) 11% (38) 7% (27) 3% (11) 355PID/Gender: DemWomen 30% (116) 43% (166) 13% (50) 3% (11) 12% (46) 390PID/Gender: Ind Men 9% (25) 23% (67) 14% (40) 43% (123) 12% (33) 288PID/Gender: Ind Women 9% (23) 18% (49) 22% (59) 36% (99) 15% (41) 271PID/Gender: Rep Men 5% (16) 12% (36) 9% (28) 72% (214) 2% (6) 299PID/Gender: Rep Women 3% (12) 6% (22) 15% (60) 71% (280) 5% (20) 395Ideo: Liberal (1-3) 36% (202) 40% (222) 11% (59) 5% (29) 7% (41) 553Ideo: Moderate (4) 17% (92) 33% (180) 17% (90) 25% (135) 8% (42) 538Ideo: Conservative (5-7) 6% (47) 7% (59) 13% (102) 71% (561) 3% (23) 793Educ: < College 16% (197) 21% (258) 14% (163) 40% (480) 9% (108) 1206Educ: Bachelors degree 16% (80) 26% (129) 15% (73) 37% (185) 7% (34) 501Educ: Post-grad 22% (65) 28% (82) 13% (39) 31% (89) 5% (16) 290Income: Under 50k 16% (141) 24% (208) 14% (123) 35% (313) 11% (97) 882Income: 50k-100k 17% (123) 22% (157) 13% (95) 42% (303) 6% (45) 723Income: 100k+ 20% (79) 27% (105) 14% (57) 35% (137) 4% (14) 392Ethnicity: White 16% (244) 21% (331) 14% (220) 42% (656) 6% (93) 1545Ethnicity: Hispanic 16% (35) 26% (58) 12% (27) 37% (81) 9% (21) 222
Continued on next page
32
Morning ConsultTable POL3_1
Table POL3_1: Do you approve or disapprove of how President Biden is handling each of the following?The economy
DemographicStronglyapprove
Somewhatapprove
Somewhatdisapprove
Stronglydisapprove
Don’t Know /No Opinion Total N
Registered Voters 17% (343) 23% (469) 14% (275) 38% (754) 8% (157) 1998Ethnicity: Black 34% (85) 33% (83) 9% (22) 10% (25) 15% (37) 253Ethnicity: Other 7% (13) 27% (55) 16% (32) 36% (73) 14% (27) 200All Christian 15% (157) 22% (221) 15% (149) 44% (448) 5% (49) 1025All Non-Christian 27% (29) 37% (39) 11% (12) 17% (18) 7% (7) 105Atheist 25% (24) 36% (34) 9% (9) 21% (20) 9% (8) 95Agnostic/Nothing in particular 17% (82) 27% (126) 14% (68) 29% (136) 13% (62) 474Something Else 17% (52) 16% (49) 12% (37) 44% (131) 10% (30) 299Religious Non-Protestant/Catholic 24% (31) 32% (41) 13% (17) 25% (32) 6% (8) 128Evangelical 14% (77) 17% (92) 12% (67) 52% (289) 6% (33) 558Non-Evangelical 17% (127) 24% (174) 16% (113) 37% (268) 6% (46) 727Community: Urban 26% (121) 29% (134) 13% (61) 23% (104) 8% (38) 457Community: Suburban 16% (159) 24% (244) 14% (144) 39% (397) 6% (65) 1010Community: Rural 12% (63) 17% (92) 13% (70) 48% (253) 10% (54) 531Employ: Private Sector 15% (106) 26% (176) 16% (111) 36% (246) 7% (47) 687Employ: Government 15% (20) 30% (39) 13% (17) 29% (39) 13% (18) 133Employ: Self-Employed 19% (36) 23% (42) 12% (22) 38% (70) 8% (15) 185Employ: Homemaker 6% (10) 17% (28) 14% (22) 51% (82) 12% (19) 160Employ: Student 9% (5) 32% (20) 21% (13) 20% (12) 18% (11) 61Employ: Retired 22% (113) 22% (114) 11% (57) 42% (215) 2% (10) 509Employ: Unemployed 16% (27) 19% (32) 13% (22) 38% (63) 12% (21) 165Employ: Other 26% (25) 19% (19) 12% (11) 25% (25) 18% (18) 97Military HH: Yes 17% (64) 18% (67) 16% (59) 41% (155) 8% (30) 375Military HH: No 17% (279) 25% (402) 13% (216) 37% (599) 8% (127) 1623RD/WT: Right Direction 37% (277) 43% (324) 9% (64) 3% (24) 8% (57) 745RD/WT: Wrong Track 5% (65) 12% (145) 17% (211) 58% (730) 8% (101) 1253Biden Job Approve 36% (319) 45% (397) 10% (88) 3% (23) 7% (63) 890Biden Job Disapprove 2% (23) 6% (60) 18% (181) 70% (723) 4% (44) 1031
Continued on next page

National Tracking Poll #2110009, October, 2021
33
Table POL3_1
Table POL3_1: Do you approve or disapprove of how President Biden is handling each of the following?The economy
DemographicStronglyapprove
Somewhatapprove
Somewhatdisapprove
Stronglydisapprove
Don’t Know /No Opinion Total N
Registered Voters 17% (343) 23% (469) 14% (275) 38% (754) 8% (157) 1998Biden Job Strongly Approve 58% (259) 32% (143) 6% (26) 1% (4) 3% (14) 446Biden Job Somewhat Approve 13% (60) 57% (255) 14% (62) 4% (19) 11% (48) 444Biden Job Somewhat Disapprove 2% (6) 16% (41) 47% (118) 23% (58) 11% (27) 250Biden Job Strongly Disapprove 2% (17) 2% (18) 8% (63) 85% (666) 2% (17) 781Favorable of Biden 35% (319) 46% (410) 10% (87) 2% (19) 7% (64) 899Unfavorable of Biden 2% (17) 5% (54) 18% (184) 70% (726) 5% (52) 1032Very Favorable of Biden 58% (272) 33% (156) 6% (27) 1% (3) 3% (12) 470Somewhat Favorable of Biden 11% (47) 59% (254) 14% (60) 4% (16) 12% (52) 429Somewhat Unfavorable of Biden 3% (7) 12% (29) 47% (116) 24% (59) 14% (35) 246Very Unfavorable of Biden 1% (10) 3% (25) 9% (67) 85% (667) 2% (17) 786#1 Issue: Economy 16% (118) 19% (145) 16% (115) 43% (318) 6% (47) 742#1 Issue: Security 6% (25) 11% (43) 11% (46) 68% (279) 4% (16) 409#1 Issue: Health Care 26% (65) 37% (92) 15% (36) 12% (30) 10% (25) 248#1 Issue: Medicare / Social Security 28% (58) 29% (60) 12% (26) 26% (54) 5% (10) 209#1 Issue: Women’s Issues 25% (27) 37% (41) 16% (17) 9% (10) 14% (15) 111#1 Issue: Education 9% (6) 30% (22) 18% (13) 17% (12) 26% (19) 72#1 Issue: Energy 21% (19) 47% (43) 8% (7) 12% (11) 12% (11) 90#1 Issue: Other 21% (25) 21% (24) 13% (15) 34% (39) 12% (14) 1172020 Vote: Joe Biden 33% (308) 41% (384) 13% (124) 5% (47) 9% (83) 9462020 Vote: Donald Trump 3% (22) 6% (55) 14% (121) 74% (640) 3% (26) 8642020 Vote: Didn’t Vote 8% (12) 16% (25) 14% (22) 33% (50) 29% (44) 1532018 House Vote: Democrat 36% (261) 40% (294) 10% (73) 8% (59) 6% (47) 7342018 House Vote: Republican 3% (24) 8% (55) 14% (104) 72% (515) 3% (21) 7192018 House Vote: Someone else 2% (1) 11% (6) 17% (9) 54% (29) 16% (8) 532016 Vote: Hillary Clinton 36% (251) 40% (283) 9% (64) 7% (48) 8% (59) 7062016 Vote: Donald Trump 4% (28) 9% (74) 13% (104) 72% (576) 3% (23) 8052016 Vote: Other 13% (11) 27% (24) 25% (22) 26% (23) 9% (8) 872016 Vote: Didn’t Vote 13% (52) 22% (88) 21% (85) 27% (106) 17% (68) 399Voted in 2014: Yes 19% (251) 24% (314) 12% (158) 41% (544) 4% (57) 1324Voted in 2014: No 14% (91) 23% (156) 17% (117) 31% (210) 15% (100) 674
Continued on next page

34
Morning ConsultTable POL3_1
Table POL3_1: Do you approve or disapprove of how President Biden is handling each of the following?The economy
DemographicStronglyapprove
Somewhatapprove
Somewhatdisapprove
Stronglydisapprove
Don’t Know /No Opinion Total N
Registered Voters 17% (343) 23% (469) 14% (275) 38% (754) 8% (157) 19984-Region: Northeast 18% (63) 27% (94) 16% (58) 32% (111) 7% (26) 3534-Region: Midwest 16% (72) 23% (101) 16% (72) 38% (169) 7% (30) 4444-Region: South 18% (133) 22% (160) 10% (78) 42% (311) 8% (63) 7464-Region: West 16% (75) 25% (114) 15% (67) 36% (162) 8% (38) 455Party: Democrat/Leans Democrat 33% (291) 41% (356) 12% (102) 7% (58) 8% (71) 877Party: Republican/Leans Republican 4% (30) 9% (72) 15% (120) 69% (570) 4% (30) 822Note: Row proportions may total to larger than one-hundred percent due to rounding. For more information visit MorningConsultIntelligence.com.

National Tracking Poll #2110009, October, 2021
35
Table POL3_2
Table POL3_2: Do you approve or disapprove of how President Biden is handling each of the following?Jobs
DemographicStronglyapprove
Somewhatapprove
Somewhatdisapprove
Stronglydisapprove
Don’t Know /No Opinion Total N
Registered Voters 18% (359) 25% (500) 13% (258) 35% (694) 9% (186) 1998Gender: Male 20% (186) 25% (236) 13% (118) 36% (337) 7% (65) 942Gender: Female 16% (174) 25% (264) 13% (140) 34% (357) 12% (122) 1056Age: 18-34 16% (82) 25% (127) 16% (80) 27% (140) 17% (86) 514Age: 35-44 19% (58) 27% (84) 14% (44) 31% (95) 9% (27) 307Age: 45-64 17% (115) 25% (171) 12% (81) 38% (261) 7% (51) 679Age: 65+ 21% (105) 24% (118) 11% (53) 40% (198) 5% (23) 497GenZers: 1997-2012 16% (23) 22% (32) 16% (23) 21% (31) 26% (38) 148Millennials: 1981-1996 17% (92) 26% (142) 15% (86) 31% (170) 12% (66) 556GenXers: 1965-1980 19% (87) 28% (132) 12% (55) 33% (154) 9% (41) 468Baby Boomers: 1946-1964 19% (141) 22% (161) 11% (82) 42% (301) 5% (39) 723PID: Dem (no lean) 37% (276) 40% (299) 10% (74) 4% (33) 8% (62) 745PID: Ind (no lean) 10% (53) 24% (133) 16% (88) 34% (191) 17% (94) 559PID: Rep (no lean) 4% (30) 10% (68) 14% (96) 68% (469) 4% (31) 694PID/Gender: DemMen 41% (145) 37% (130) 12% (42) 7% (25) 3% (12) 355PID/Gender: DemWomen 34% (131) 43% (169) 8% (32) 2% (8) 13% (49) 390PID/Gender: Ind Men 10% (28) 25% (72) 13% (38) 39% (112) 13% (38) 288PID/Gender: Ind Women 9% (25) 23% (61) 18% (50) 29% (79) 21% (56) 271PID/Gender: Rep Men 4% (13) 11% (34) 13% (38) 67% (200) 5% (15) 299PID/Gender: Rep Women 4% (17) 9% (34) 15% (58) 68% (269) 4% (16) 395Ideo: Liberal (1-3) 39% (218) 40% (220) 8% (42) 4% (24) 9% (49) 553Ideo: Moderate (4) 17% (91) 35% (191) 16% (85) 22% (116) 10% (56) 538Ideo: Conservative (5-7) 5% (42) 9% (75) 14% (113) 67% (528) 4% (35) 793Educ: < College 17% (201) 23% (278) 13% (163) 37% (443) 10% (121) 1206Educ: Bachelors degree 18% (92) 26% (132) 13% (67) 33% (164) 9% (47) 501Educ: Post-grad 23% (67) 31% (90) 10% (29) 30% (86) 6% (18) 290Income: Under 50k 18% (157) 23% (206) 15% (129) 33% (287) 12% (103) 882Income: 50k-100k 17% (126) 24% (177) 11% (82) 39% (282) 8% (57) 723Income: 100k+ 20% (77) 30% (118) 12% (47) 32% (125) 7% (26) 392Ethnicity: White 16% (241) 24% (363) 13% (203) 39% (605) 9% (133) 1545Ethnicity: Hispanic 18% (41) 26% (57) 16% (36) 30% (66) 10% (22) 222
Continued on next page

36
Morning ConsultTable POL3_2
Table POL3_2: Do you approve or disapprove of how President Biden is handling each of the following?Jobs
DemographicStronglyapprove
Somewhatapprove
Somewhatdisapprove
Stronglydisapprove
Don’t Know /No Opinion Total N
Registered Voters 18% (359) 25% (500) 13% (258) 35% (694) 9% (186) 1998Ethnicity: Black 40% (100) 32% (82) 7% (18) 8% (20) 13% (32) 253Ethnicity: Other 9% (18) 27% (55) 19% (37) 34% (69) 11% (21) 200All Christian 17% (175) 22% (226) 14% (139) 41% (422) 6% (64) 1025All Non-Christian 22% (23) 47% (49) 13% (14) 10% (10) 8% (8) 105Atheist 21% (20) 35% (33) 6% (6) 25% (23) 13% (12) 95Agnostic/Nothing in particular 19% (89) 29% (136) 12% (55) 27% (127) 14% (67) 474Something Else 17% (52) 19% (56) 15% (44) 37% (112) 11% (34) 299Religious Non-Protestant/Catholic 19% (25) 40% (51) 15% (20) 17% (22) 8% (10) 128Evangelical 15% (82) 18% (98) 13% (71) 47% (264) 8% (42) 558Non-Evangelical 20% (142) 25% (180) 14% (103) 34% (248) 8% (55) 727Community: Urban 25% (115) 33% (152) 11% (50) 20% (94) 10% (46) 457Community: Suburban 17% (168) 25% (251) 14% (142) 36% (368) 8% (81) 1010Community: Rural 14% (76) 18% (98) 12% (66) 44% (232) 11% (59) 531Employ: Private Sector 18% (122) 28% (194) 12% (83) 33% (228) 9% (60) 687Employ: Government 15% (20) 27% (36) 13% (17) 27% (35) 18% (24) 133Employ: Self-Employed 20% (37) 22% (41) 12% (22) 38% (70) 8% (14) 185Employ: Homemaker 7% (12) 19% (30) 15% (25) 48% (77) 11% (17) 160Employ: Student 23% (14) 26% (16) 20% (13) 16% (10) 15% (9) 61Employ: Retired 22% (111) 24% (121) 11% (57) 40% (202) 3% (18) 509Employ: Unemployed 14% (23) 21% (35) 17% (28) 33% (54) 15% (24) 165Employ: Other 20% (20) 27% (26) 14% (14) 18% (18) 20% (20) 97Military HH: Yes 18% (67) 22% (81) 13% (47) 39% (144) 9% (35) 375Military HH: No 18% (292) 26% (419) 13% (211) 34% (549) 9% (152) 1623RD/WT: Right Direction 38% (286) 44% (324) 7% (55) 3% (19) 8% (60) 745RD/WT: Wrong Track 6% (73) 14% (176) 16% (203) 54% (675) 10% (126) 1253Biden Job Approve 38% (334) 46% (408) 7% (60) 2% (17) 8% (71) 890Biden Job Disapprove 2% (25) 8% (82) 18% (184) 65% (674) 6% (66) 1031
Continued on next page

National Tracking Poll #2110009, October, 2021
37
Table POL3_2
Table POL3_2: Do you approve or disapprove of how President Biden is handling each of the following?Jobs
DemographicStronglyapprove
Somewhatapprove
Somewhatdisapprove
Stronglydisapprove
Don’t Know /No Opinion Total N
Registered Voters 18% (359) 25% (500) 13% (258) 35% (694) 9% (186) 1998Biden Job Strongly Approve 61% (271) 32% (142) 3% (12) 1% (3) 4% (19) 446Biden Job Somewhat Approve 14% (63) 60% (267) 11% (48) 3% (14) 12% (52) 444Biden Job Somewhat Disapprove 6% (14) 20% (51) 38% (96) 21% (53) 14% (35) 250Biden Job Strongly Disapprove 1% (11) 4% (31) 11% (89) 79% (621) 4% (30) 781Favorable of Biden 37% (331) 46% (410) 8% (68) 2% (17) 8% (73) 899Unfavorable of Biden 2% (19) 8% (84) 17% (180) 65% (673) 7% (76) 1032Very Favorable of Biden 59% (276) 35% (163) 3% (15) — (2) 3% (15) 470Somewhat Favorable of Biden 13% (55) 58% (247) 13% (54) 4% (15) 13% (58) 429Somewhat Unfavorable of Biden 4% (11) 22% (53) 38% (93) 18% (45) 18% (44) 246Very Unfavorable of Biden 1% (8) 4% (31) 11% (87) 80% (628) 4% (32) 786#1 Issue: Economy 15% (114) 21% (160) 15% (113) 40% (295) 8% (61) 742#1 Issue: Security 4% (17) 15% (60) 12% (48) 61% (250) 8% (33) 409#1 Issue: Health Care 33% (83) 37% (91) 11% (27) 9% (21) 10% (26) 248#1 Issue: Medicare / Social Security 30% (63) 29% (60) 11% (24) 24% (51) 5% (11) 209#1 Issue: Women’s Issues 24% (27) 44% (49) 13% (14) 8% (9) 11% (12) 111#1 Issue: Education 18% (13) 23% (16) 11% (8) 20% (15) 28% (20) 72#1 Issue: Energy 16% (14) 46% (41) 12% (11) 13% (12) 13% (12) 90#1 Issue: Other 24% (28) 20% (23) 11% (13) 35% (41) 10% (12) 1172020 Vote: Joe Biden 34% (321) 42% (395) 10% (93) 4% (41) 10% (96) 9462020 Vote: Donald Trump 3% (26) 8% (67) 15% (128) 69% (600) 5% (42) 8642020 Vote: Didn’t Vote 7% (10) 20% (31) 18% (28) 26% (40) 29% (44) 1532018 House Vote: Democrat 36% (263) 40% (296) 9% (65) 7% (53) 8% (58) 7342018 House Vote: Republican 3% (24) 9% (66) 16% (116) 67% (485) 4% (28) 7192018 House Vote: Someone else 9% (5) 8% (4) 21% (11) 44% (24) 19% (10) 532016 Vote: Hillary Clinton 36% (252) 41% (291) 8% (56) 6% (46) 9% (61) 7062016 Vote: Donald Trump 4% (36) 10% (78) 15% (120) 67% (539) 4% (32) 8052016 Vote: Other 11% (10) 32% (28) 19% (17) 21% (18) 16% (14) 872016 Vote: Didn’t Vote 15% (62) 26% (103) 16% (65) 22% (89) 20% (79) 399Voted in 2014: Yes 19% (248) 25% (329) 12% (161) 38% (504) 6% (81) 1324Voted in 2014: No 16% (111) 25% (171) 14% (97) 28% (190) 16% (105) 674
Continued on next page

38
Morning ConsultTable POL3_2
Table POL3_2: Do you approve or disapprove of how President Biden is handling each of the following?Jobs
DemographicStronglyapprove
Somewhatapprove
Somewhatdisapprove
Stronglydisapprove
Don’t Know /No Opinion Total N
Registered Voters 18% (359) 25% (500) 13% (258) 35% (694) 9% (186) 19984-Region: Northeast 16% (57) 31% (109) 14% (50) 30% (105) 9% (32) 3534-Region: Midwest 18% (79) 24% (105) 14% (64) 37% (164) 7% (33) 4444-Region: South 18% (133) 23% (171) 10% (75) 40% (295) 10% (72) 7464-Region: West 20% (91) 25% (114) 15% (69) 29% (130) 11% (51) 455Party: Democrat/Leans Democrat 34% (301) 42% (365) 10% (87) 5% (47) 9% (77) 877Party: Republican/Leans Republican 4% (34) 11% (88) 14% (117) 65% (538) 5% (44) 822Note: Row proportions may total to larger than one-hundred percent due to rounding. For more information visit MorningConsultIntelligence.com.

National Tracking Poll #2110009, October, 2021
39
Table POL3_3
Table POL3_3: Do you approve or disapprove of how President Biden is handling each of the following?Health care
DemographicStronglyapprove
Somewhatapprove
Somewhatdisapprove
Stronglydisapprove
Don’t Know /No Opinion Total N
Registered Voters 20% (401) 24% (479) 12% (239) 33% (653) 11% (227) 1998Gender: Male 22% (210) 23% (221) 13% (120) 32% (305) 9% (85) 942Gender: Female 18% (190) 24% (258) 11% (119) 33% (347) 13% (142) 1056Age: 18-34 17% (88) 25% (130) 14% (74) 26% (135) 17% (88) 514Age: 35-44 22% (66) 26% (80) 13% (41) 30% (91) 10% (29) 307Age: 45-64 20% (134) 23% (157) 10% (71) 36% (244) 11% (72) 679Age: 65+ 23% (112) 22% (112) 11% (53) 37% (183) 7% (37) 497GenZers: 1997-2012 13% (19) 18% (27) 18% (27) 22% (33) 29% (43) 148Millennials: 1981-1996 19% (108) 28% (153) 12% (69) 29% (159) 12% (66) 556GenXers: 1965-1980 23% (105) 24% (113) 10% (48) 32% (149) 11% (53) 468Baby Boomers: 1946-1964 20% (145) 22% (159) 12% (85) 38% (272) 9% (62) 723PID: Dem (no lean) 41% (309) 37% (273) 7% (54) 5% (38) 9% (70) 745PID: Ind (no lean) 11% (59) 24% (137) 16% (88) 30% (168) 19% (108) 559PID: Rep (no lean) 5% (33) 10% (69) 14% (96) 64% (447) 7% (49) 694PID/Gender: DemMen 47% (167) 33% (119) 8% (30) 7% (25) 4% (15) 355PID/Gender: DemWomen 36% (142) 40% (155) 6% (25) 3% (14) 14% (55) 390PID/Gender: Ind Men 10% (30) 24% (68) 16% (47) 33% (96) 17% (48) 288PID/Gender: Ind Women 11% (29) 25% (69) 15% (41) 27% (72) 22% (60) 271PID/Gender: Rep Men 5% (14) 12% (35) 14% (43) 62% (185) 8% (23) 299PID/Gender: Rep Women 5% (19) 9% (34) 14% (54) 66% (262) 7% (26) 395Ideo: Liberal (1-3) 44% (244) 36% (197) 6% (32) 5% (29) 9% (50) 553Ideo: Moderate (4) 19% (105) 35% (188) 15% (79) 19% (101) 12% (66) 538Ideo: Conservative (5-7) 6% (44) 10% (78) 14% (110) 62% (494) 8% (67) 793Educ: < College 19% (235) 22% (264) 12% (140) 34% (414) 13% (155) 1206Educ: Bachelors degree 19% (94) 25% (123) 13% (64) 33% (163) 11% (57) 501Educ: Post-grad 25% (72) 32% (92) 12% (35) 26% (76) 5% (16) 290Income: Under 50k 21% (185) 22% (192) 13% (117) 30% (268) 14% (121) 882Income: 50k-100k 18% (133) 24% (172) 11% (78) 37% (270) 10% (69) 723Income: 100k+ 21% (82) 29% (115) 11% (43) 29% (115) 9% (37) 392Ethnicity: White 18% (273) 23% (355) 12% (191) 36% (563) 11% (163) 1545Ethnicity: Hispanic 19% (41) 27% (59) 12% (26) 31% (70) 12% (26) 222
Continued on next page

40
Morning ConsultTable POL3_3
Table POL3_3: Do you approve or disapprove of how President Biden is handling each of the following?Health care
DemographicStronglyapprove
Somewhatapprove
Somewhatdisapprove
Stronglydisapprove
Don’t Know /No Opinion Total N
Registered Voters 20% (401) 24% (479) 12% (239) 33% (653) 11% (227) 1998Ethnicity: Black 42% (107) 28% (70) 8% (20) 8% (19) 15% (37) 253Ethnicity: Other 11% (22) 27% (54) 14% (28) 35% (71) 13% (26) 200All Christian 19% (196) 21% (217) 12% (119) 39% (404) 9% (89) 1025All Non-Christian 32% (33) 39% (41) 10% (11) 10% (11) 9% (9) 105Atheist 26% (25) 33% (32) 11% (10) 21% (20) 8% (8) 95Agnostic/Nothing in particular 20% (94) 27% (129) 13% (61) 23% (111) 17% (79) 474Something Else 17% (52) 20% (61) 12% (37) 36% (106) 14% (42) 299Religious Non-Protestant/Catholic 28% (35) 34% (43) 12% (16) 19% (24) 8% (10) 128Evangelical 15% (86) 18% (101) 10% (58) 45% (254) 10% (58) 558Non-Evangelical 21% (156) 24% (173) 13% (93) 33% (237) 9% (69) 727Community: Urban 30% (137) 30% (135) 10% (45) 20% (91) 11% (49) 457Community: Suburban 19% (190) 25% (249) 13% (131) 33% (334) 10% (106) 1010Community: Rural 14% (74) 18% (95) 12% (63) 43% (227) 13% (72) 531Employ: Private Sector 19% (127) 28% (190) 12% (81) 31% (214) 11% (76) 687Employ: Government 19% (25) 25% (33) 16% (21) 26% (34) 15% (20) 133Employ: Self-Employed 24% (44) 23% (42) 10% (19) 35% (65) 9% (16) 185Employ: Homemaker 9% (14) 19% (31) 14% (23) 45% (72) 12% (20) 160Employ: Student 17% (10) 23% (14) 14% (8) 14% (9) 32% (19) 61Employ: Retired 23% (119) 22% (111) 11% (58) 36% (185) 7% (36) 509Employ: Unemployed 21% (35) 20% (33) 14% (23) 32% (53) 12% (20) 165Employ: Other 27% (26) 27% (27) 5% (5) 21% (21) 19% (19) 97Military HH: Yes 17% (64) 23% (84) 12% (46) 36% (136) 12% (44) 375Military HH: No 21% (336) 24% (395) 12% (192) 32% (517) 11% (183) 1623RD/WT: Right Direction 42% (313) 40% (299) 6% (43) 4% (28) 8% (62) 745RD/WT: Wrong Track 7% (88) 14% (180) 16% (195) 50% (625) 13% (165) 1253Biden Job Approve 42% (370) 42% (374) 5% (42) 3% (24) 9% (81) 890Biden Job Disapprove 3% (30) 9% (94) 18% (188) 61% (625) 9% (94) 1031
Continued on next page

National Tracking Poll #2110009, October, 2021
41
Table POL3_3
Table POL3_3: Do you approve or disapprove of how President Biden is handling each of the following?Health care
DemographicStronglyapprove
Somewhatapprove
Somewhatdisapprove
Stronglydisapprove
Don’t Know /No Opinion Total N
Registered Voters 20% (401) 24% (479) 12% (239) 33% (653) 11% (227) 1998Biden Job Strongly Approve 65% (292) 28% (125) 1% (5) 1% (4) 5% (21) 446Biden Job Somewhat Approve 18% (78) 56% (248) 8% (37) 4% (20) 14% (61) 444Biden Job Somewhat Disapprove 6% (14) 25% (62) 39% (97) 15% (36) 16% (40) 250Biden Job Strongly Disapprove 2% (15) 4% (32) 12% (91) 75% (589) 7% (54) 781Favorable of Biden 42% (375) 42% (376) 5% (45) 3% (23) 9% (80) 899Unfavorable of Biden 2% (19) 9% (97) 18% (187) 61% (626) 10% (104) 1032Very Favorable of Biden 65% (307) 28% (130) 2% (9) 1% (6) 4% (18) 470Somewhat Favorable of Biden 16% (68) 57% (246) 8% (36) 4% (17) 14% (62) 429Somewhat Unfavorable of Biden 4% (10) 26% (63) 36% (89) 14% (35) 19% (48) 246Very Unfavorable of Biden 1% (8) 4% (34) 12% (98) 75% (591) 7% (56) 786#1 Issue: Economy 18% (132) 23% (167) 14% (104) 34% (256) 11% (83) 742#1 Issue: Security 6% (23) 14% (57) 12% (47) 61% (248) 8% (34) 409#1 Issue: Health Care 33% (82) 36% (88) 8% (21) 12% (29) 11% (28) 248#1 Issue: Medicare / Social Security 35% (73) 24% (50) 11% (22) 23% (48) 8% (16) 209#1 Issue: Women’s Issues 29% (33) 39% (43) 12% (13) 7% (8) 13% (14) 111#1 Issue: Education 16% (11) 24% (18) 7% (5) 26% (18) 27% (20) 72#1 Issue: Energy 19% (17) 39% (35) 18% (16) 11% (10) 14% (12) 90#1 Issue: Other 26% (30) 18% (21) 8% (10) 31% (36) 17% (20) 1172020 Vote: Joe Biden 38% (359) 40% (375) 7% (65) 5% (46) 11% (101) 9462020 Vote: Donald Trump 3% (28) 7% (61) 17% (146) 65% (565) 7% (64) 8642020 Vote: Didn’t Vote 8% (12) 24% (36) 12% (19) 22% (34) 34% (52) 1532018 House Vote: Democrat 41% (303) 38% (275) 7% (51) 7% (50) 8% (55) 7342018 House Vote: Republican 4% (25) 10% (70) 16% (118) 63% (455) 7% (50) 7192018 House Vote: Someone else 8% (5) 14% (7) 20% (11) 31% (17) 26% (14) 532016 Vote: Hillary Clinton 40% (285) 39% (274) 6% (41) 6% (45) 9% (60) 7062016 Vote: Donald Trump 5% (38) 10% (78) 15% (124) 63% (505) 7% (60) 8052016 Vote: Other 15% (13) 31% (27) 17% (15) 23% (20) 14% (12) 872016 Vote: Didn’t Vote 16% (64) 25% (99) 15% (60) 20% (81) 24% (95) 399Voted in 2014: Yes 22% (288) 24% (317) 11% (143) 36% (476) 8% (100) 1324Voted in 2014: No 17% (113) 24% (162) 14% (96) 26% (176) 19% (127) 674
Continued on next page

42
Morning ConsultTable POL3_3
Table POL3_3: Do you approve or disapprove of how President Biden is handling each of the following?Health care
DemographicStronglyapprove
Somewhatapprove
Somewhatdisapprove
Stronglydisapprove
Don’t Know /No Opinion Total N
Registered Voters 20% (401) 24% (479) 12% (239) 33% (653) 11% (227) 19984-Region: Northeast 21% (73) 30% (107) 12% (43) 27% (97) 10% (34) 3534-Region: Midwest 21% (93) 20% (90) 12% (52) 36% (159) 11% (51) 4444-Region: South 18% (137) 23% (171) 11% (83) 36% (266) 12% (88) 7464-Region: West 22% (98) 24% (111) 13% (61) 29% (131) 12% (54) 455Party: Democrat/Leans Democrat 39% (343) 39% (340) 7% (62) 6% (52) 9% (80) 877Party: Republican/Leans Republican 4% (37) 10% (82) 16% (130) 61% (505) 8% (68) 822Note: Row proportions may total to larger than one-hundred percent due to rounding. For more information visit MorningConsultIntelligence.com.
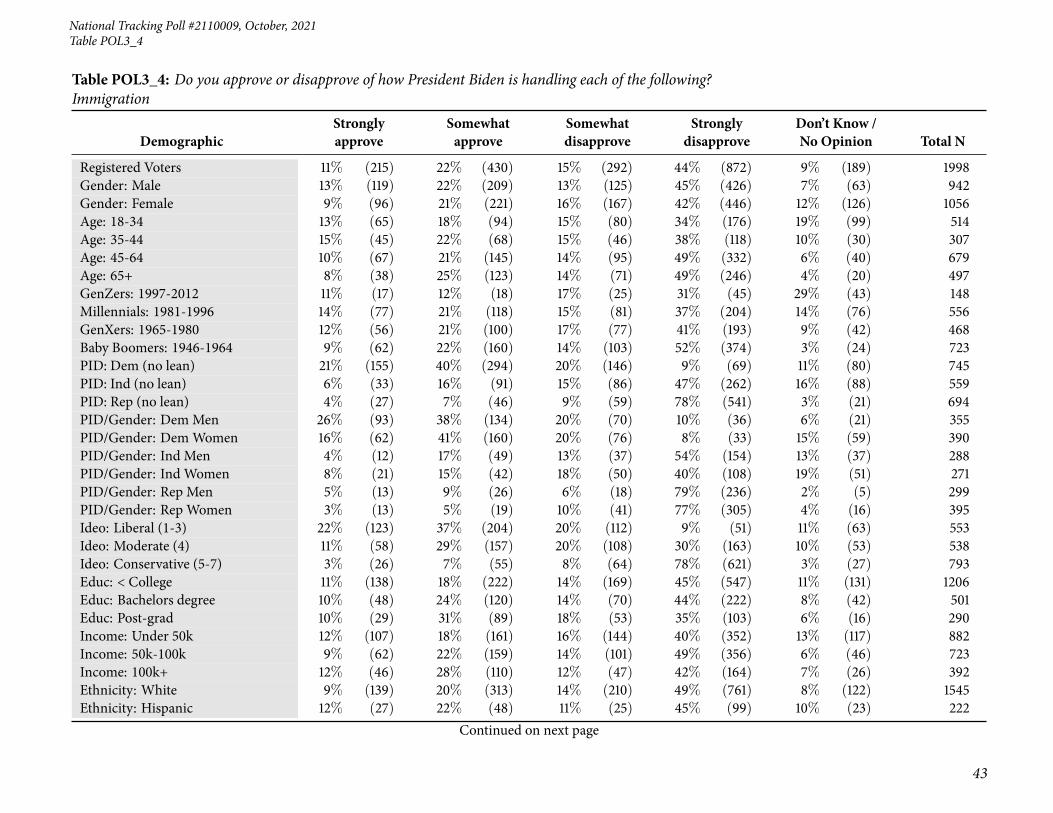
National Tracking Poll #2110009, October, 2021
43
Table POL3_4
Table POL3_4: Do you approve or disapprove of how President Biden is handling each of the following?Immigration
DemographicStronglyapprove
Somewhatapprove
Somewhatdisapprove
Stronglydisapprove
Don’t Know /No Opinion Total N
Registered Voters 11% (215) 22% (430) 15% (292) 44% (872) 9% (189) 1998Gender: Male 13% (119) 22% (209) 13% (125) 45% (426) 7% (63) 942Gender: Female 9% (96) 21% (221) 16% (167) 42% (446) 12% (126) 1056Age: 18-34 13% (65) 18% (94) 15% (80) 34% (176) 19% (99) 514Age: 35-44 15% (45) 22% (68) 15% (46) 38% (118) 10% (30) 307Age: 45-64 10% (67) 21% (145) 14% (95) 49% (332) 6% (40) 679Age: 65+ 8% (38) 25% (123) 14% (71) 49% (246) 4% (20) 497GenZers: 1997-2012 11% (17) 12% (18) 17% (25) 31% (45) 29% (43) 148Millennials: 1981-1996 14% (77) 21% (118) 15% (81) 37% (204) 14% (76) 556GenXers: 1965-1980 12% (56) 21% (100) 17% (77) 41% (193) 9% (42) 468Baby Boomers: 1946-1964 9% (62) 22% (160) 14% (103) 52% (374) 3% (24) 723PID: Dem (no lean) 21% (155) 40% (294) 20% (146) 9% (69) 11% (80) 745PID: Ind (no lean) 6% (33) 16% (91) 15% (86) 47% (262) 16% (88) 559PID: Rep (no lean) 4% (27) 7% (46) 9% (59) 78% (541) 3% (21) 694PID/Gender: DemMen 26% (93) 38% (134) 20% (70) 10% (36) 6% (21) 355PID/Gender: DemWomen 16% (62) 41% (160) 20% (76) 8% (33) 15% (59) 390PID/Gender: Ind Men 4% (12) 17% (49) 13% (37) 54% (154) 13% (37) 288PID/Gender: Ind Women 8% (21) 15% (42) 18% (50) 40% (108) 19% (51) 271PID/Gender: Rep Men 5% (13) 9% (26) 6% (18) 79% (236) 2% (5) 299PID/Gender: Rep Women 3% (13) 5% (19) 10% (41) 77% (305) 4% (16) 395Ideo: Liberal (1-3) 22% (123) 37% (204) 20% (112) 9% (51) 11% (63) 553Ideo: Moderate (4) 11% (58) 29% (157) 20% (108) 30% (163) 10% (53) 538Ideo: Conservative (5-7) 3% (26) 7% (55) 8% (64) 78% (621) 3% (27) 793Educ: < College 11% (138) 18% (222) 14% (169) 45% (547) 11% (131) 1206Educ: Bachelors degree 10% (48) 24% (120) 14% (70) 44% (222) 8% (42) 501Educ: Post-grad 10% (29) 31% (89) 18% (53) 35% (103) 6% (16) 290Income: Under 50k 12% (107) 18% (161) 16% (144) 40% (352) 13% (117) 882Income: 50k-100k 9% (62) 22% (159) 14% (101) 49% (356) 6% (46) 723Income: 100k+ 12% (46) 28% (110) 12% (47) 42% (164) 7% (26) 392Ethnicity: White 9% (139) 20% (313) 14% (210) 49% (761) 8% (122) 1545Ethnicity: Hispanic 12% (27) 22% (48) 11% (25) 45% (99) 10% (23) 222
Continued on next page
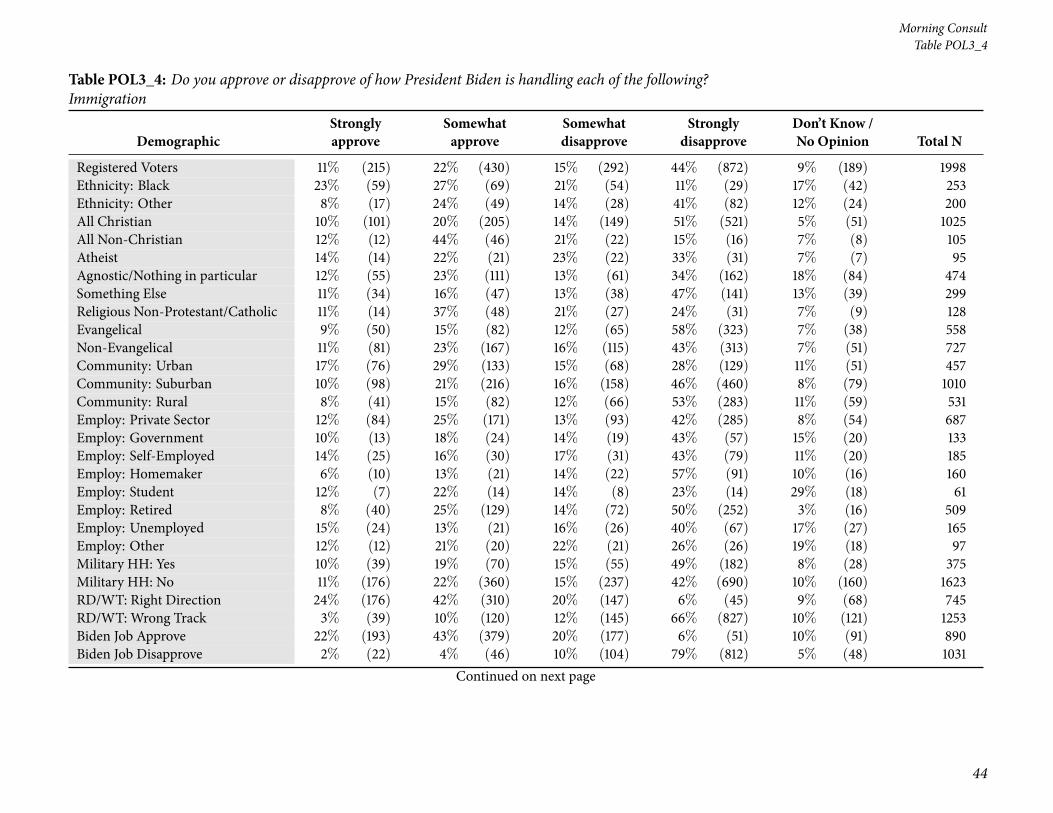
44
Morning ConsultTable POL3_4
Table POL3_4: Do you approve or disapprove of how President Biden is handling each of the following?Immigration
DemographicStronglyapprove
Somewhatapprove
Somewhatdisapprove
Stronglydisapprove
Don’t Know /No Opinion Total N
Registered Voters 11% (215) 22% (430) 15% (292) 44% (872) 9% (189) 1998Ethnicity: Black 23% (59) 27% (69) 21% (54) 11% (29) 17% (42) 253Ethnicity: Other 8% (17) 24% (49) 14% (28) 41% (82) 12% (24) 200All Christian 10% (101) 20% (205) 14% (149) 51% (521) 5% (51) 1025All Non-Christian 12% (12) 44% (46) 21% (22) 15% (16) 7% (8) 105Atheist 14% (14) 22% (21) 23% (22) 33% (31) 7% (7) 95Agnostic/Nothing in particular 12% (55) 23% (111) 13% (61) 34% (162) 18% (84) 474Something Else 11% (34) 16% (47) 13% (38) 47% (141) 13% (39) 299Religious Non-Protestant/Catholic 11% (14) 37% (48) 21% (27) 24% (31) 7% (9) 128Evangelical 9% (50) 15% (82) 12% (65) 58% (323) 7% (38) 558Non-Evangelical 11% (81) 23% (167) 16% (115) 43% (313) 7% (51) 727Community: Urban 17% (76) 29% (133) 15% (68) 28% (129) 11% (51) 457Community: Suburban 10% (98) 21% (216) 16% (158) 46% (460) 8% (79) 1010Community: Rural 8% (41) 15% (82) 12% (66) 53% (283) 11% (59) 531Employ: Private Sector 12% (84) 25% (171) 13% (93) 42% (285) 8% (54) 687Employ: Government 10% (13) 18% (24) 14% (19) 43% (57) 15% (20) 133Employ: Self-Employed 14% (25) 16% (30) 17% (31) 43% (79) 11% (20) 185Employ: Homemaker 6% (10) 13% (21) 14% (22) 57% (91) 10% (16) 160Employ: Student 12% (7) 22% (14) 14% (8) 23% (14) 29% (18) 61Employ: Retired 8% (40) 25% (129) 14% (72) 50% (252) 3% (16) 509Employ: Unemployed 15% (24) 13% (21) 16% (26) 40% (67) 17% (27) 165Employ: Other 12% (12) 21% (20) 22% (21) 26% (26) 19% (18) 97Military HH: Yes 10% (39) 19% (70) 15% (55) 49% (182) 8% (28) 375Military HH: No 11% (176) 22% (360) 15% (237) 42% (690) 10% (160) 1623RD/WT: Right Direction 24% (176) 42% (310) 20% (147) 6% (45) 9% (68) 745RD/WT: Wrong Track 3% (39) 10% (120) 12% (145) 66% (827) 10% (121) 1253Biden Job Approve 22% (193) 43% (379) 20% (177) 6% (51) 10% (91) 890Biden Job Disapprove 2% (22) 4% (46) 10% (104) 79% (812) 5% (48) 1031
Continued on next page

National Tracking Poll #2110009, October, 2021
45
Table POL3_4
Table POL3_4: Do you approve or disapprove of how President Biden is handling each of the following?Immigration
DemographicStronglyapprove
Somewhatapprove
Somewhatdisapprove
Stronglydisapprove
Don’t Know /No Opinion Total N
Registered Voters 11% (215) 22% (430) 15% (292) 44% (872) 9% (189) 1998Biden Job Strongly Approve 38% (169) 44% (194) 10% (45) 3% (12) 6% (27) 446Biden Job Somewhat Approve 6% (25) 41% (184) 30% (131) 9% (40) 14% (64) 444Biden Job Somewhat Disapprove 6% (16) 10% (25) 28% (70) 45% (111) 11% (28) 250Biden Job Strongly Disapprove 1% (6) 3% (21) 4% (34) 90% (701) 3% (20) 781Favorable of Biden 22% (196) 43% (388) 19% (172) 6% (50) 10% (93) 899Unfavorable of Biden 1% (13) 4% (41) 11% (109) 79% (813) 5% (56) 1032Very Favorable of Biden 37% (175) 45% (212) 9% (42) 3% (13) 6% (28) 470Somewhat Favorable of Biden 5% (21) 41% (176) 30% (130) 9% (37) 15% (64) 429Somewhat Unfavorable of Biden 3% (8) 11% (27) 29% (72) 42% (104) 14% (35) 246Very Unfavorable of Biden 1% (5) 2% (14) 5% (37) 90% (709) 3% (21) 786#1 Issue: Economy 11% (78) 18% (135) 15% (111) 48% (355) 9% (63) 742#1 Issue: Security 3% (11) 9% (36) 9% (36) 76% (311) 4% (15) 409#1 Issue: Health Care 20% (49) 33% (81) 21% (51) 14% (34) 13% (33) 248#1 Issue: Medicare / Social Security 16% (33) 30% (63) 15% (32) 32% (66) 7% (14) 209#1 Issue: Women’s Issues 15% (16) 35% (39) 20% (22) 22% (24) 9% (9) 111#1 Issue: Education 13% (9) 29% (21) 9% (6) 24% (17) 26% (19) 72#1 Issue: Energy 9% (8) 27% (24) 22% (19) 23% (21) 19% (17) 90#1 Issue: Other 9% (10) 27% (32) 12% (14) 37% (44) 15% (17) 1172020 Vote: Joe Biden 20% (188) 39% (367) 19% (184) 10% (97) 11% (109) 9462020 Vote: Donald Trump 2% (16) 4% (37) 9% (75) 82% (706) 4% (30) 8642020 Vote: Didn’t Vote 7% (10) 14% (22) 17% (26) 34% (51) 28% (44) 1532018 House Vote: Democrat 20% (150) 38% (281) 21% (157) 12% (90) 8% (56) 7342018 House Vote: Republican 2% (14) 7% (49) 9% (67) 79% (569) 3% (20) 7192018 House Vote: Someone else 1% (1) 11% (6) 10% (5) 60% (32) 18% (10) 532016 Vote: Hillary Clinton 21% (145) 40% (281) 19% (135) 11% (78) 9% (67) 7062016 Vote: Donald Trump 2% (18) 6% (51) 9% (72) 79% (635) 4% (29) 8052016 Vote: Other 4% (4) 25% (22) 24% (21) 38% (33) 9% (8) 872016 Vote: Didn’t Vote 12% (49) 19% (76) 16% (65) 31% (125) 21% (85) 399Voted in 2014: Yes 10% (137) 22% (294) 15% (201) 47% (626) 5% (67) 1324Voted in 2014: No 12% (78) 20% (136) 14% (91) 37% (246) 18% (122) 674
Continued on next page

46
Morning ConsultTable POL3_4
Table POL3_4: Do you approve or disapprove of how President Biden is handling each of the following?Immigration
DemographicStronglyapprove
Somewhatapprove
Somewhatdisapprove
Stronglydisapprove
Don’t Know /No Opinion Total N
Registered Voters 11% (215) 22% (430) 15% (292) 44% (872) 9% (189) 19984-Region: Northeast 10% (36) 23% (81) 19% (67) 39% (139) 9% (30) 3534-Region: Midwest 10% (45) 22% (99) 14% (64) 45% (198) 9% (38) 4444-Region: South 11% (80) 19% (141) 13% (97) 48% (356) 10% (72) 7464-Region: West 12% (55) 24% (109) 14% (65) 39% (178) 11% (48) 455Party: Democrat/Leans Democrat 20% (171) 38% (333) 21% (182) 11% (94) 11% (97) 877Party: Republican/Leans Republican 3% (28) 7% (55) 8% (69) 78% (637) 4% (31) 822Note: Row proportions may total to larger than one-hundred percent due to rounding. For more information visit MorningConsultIntelligence.com.

National Tracking Poll #2110009, October, 2021
47
Table POL3_5
Table POL3_5: Do you approve or disapprove of how President Biden is handling each of the following?Climate change
DemographicStronglyapprove
Somewhatapprove
Somewhatdisapprove
Stronglydisapprove
Don’t Know /No Opinion Total N
Registered Voters 18% (368) 24% (480) 12% (235) 32% (640) 14% (275) 1998Gender: Male 21% (199) 22% (209) 12% (110) 34% (324) 11% (100) 942Gender: Female 16% (169) 26% (271) 12% (125) 30% (316) 17% (175) 1056Age: 18-34 14% (70) 26% (132) 13% (69) 24% (126) 23% (118) 514Age: 35-44 16% (50) 29% (90) 12% (36) 30% (91) 13% (40) 307Age: 45-64 20% (136) 22% (146) 12% (78) 35% (239) 12% (79) 679Age: 65+ 23% (113) 23% (112) 10% (51) 37% (183) 8% (38) 497GenZers: 1997-2012 12% (18) 22% (33) 14% (20) 21% (31) 31% (46) 148Millennials: 1981-1996 15% (81) 28% (156) 13% (73) 26% (147) 18% (99) 556GenXers: 1965-1980 20% (92) 23% (110) 11% (52) 33% (155) 13% (60) 468Baby Boomers: 1946-1964 22% (156) 21% (153) 12% (85) 37% (266) 9% (63) 723PID: Dem (no lean) 38% (284) 37% (272) 8% (63) 6% (47) 11% (79) 745PID: Ind (no lean) 10% (55) 24% (132) 12% (70) 32% (177) 23% (126) 559PID: Rep (no lean) 4% (29) 11% (76) 15% (102) 60% (416) 10% (70) 694PID/Gender: DemMen 44% (155) 32% (112) 10% (35) 9% (31) 6% (22) 355PID/Gender: DemWomen 33% (129) 41% (160) 7% (28) 4% (16) 15% (57) 390PID/Gender: Ind Men 11% (31) 22% (62) 11% (32) 37% (106) 20% (56) 288PID/Gender: Ind Women 9% (25) 26% (69) 14% (37) 26% (70) 26% (70) 271PID/Gender: Rep Men 5% (14) 11% (34) 14% (42) 63% (187) 7% (21) 299PID/Gender: Rep Women 4% (16) 11% (42) 15% (60) 58% (229) 12% (48) 395Ideo: Liberal (1-3) 40% (220) 38% (212) 8% (42) 5% (28) 9% (51) 553Ideo: Moderate (4) 19% (104) 32% (171) 13% (71) 18% (97) 18% (95) 538Ideo: Conservative (5-7) 4% (35) 10% (82) 14% (108) 62% (489) 10% (79) 793Educ: < College 17% (204) 21% (258) 11% (136) 34% (411) 16% (197) 1206Educ: Bachelors degree 19% (96) 26% (132) 12% (58) 31% (156) 12% (60) 501Educ: Post-grad 23% (68) 31% (91) 14% (41) 25% (73) 6% (19) 290Income: Under 50k 18% (157) 22% (197) 13% (116) 29% (256) 18% (156) 882Income: 50k-100k 18% (128) 22% (162) 10% (72) 37% (270) 13% (91) 723Income: 100k+ 21% (83) 31% (121) 12% (47) 29% (114) 7% (28) 392Ethnicity: White 17% (257) 23% (353) 13% (193) 36% (554) 12% (188) 1545Ethnicity: Hispanic 17% (39) 27% (60) 13% (28) 27% (59) 16% (36) 222
Continued on next page

48
Morning ConsultTable POL3_5
Table POL3_5: Do you approve or disapprove of how President Biden is handling each of the following?Climate change
DemographicStronglyapprove
Somewhatapprove
Somewhatdisapprove
Stronglydisapprove
Don’t Know /No Opinion Total N
Registered Voters 18% (368) 24% (480) 12% (235) 32% (640) 14% (275) 1998Ethnicity: Black 34% (85) 27% (69) 8% (19) 10% (26) 21% (54) 253Ethnicity: Other 13% (26) 29% (57) 11% (23) 30% (60) 17% (34) 200All Christian 18% (185) 22% (225) 13% (135) 37% (382) 10% (99) 1025All Non-Christian 27% (29) 43% (45) 8% (9) 11% (12) 11% (11) 105Atheist 24% (22) 31% (29) 14% (13) 19% (18) 13% (12) 95Agnostic/Nothing in particular 17% (82) 28% (131) 11% (54) 24% (115) 20% (93) 474Something Else 17% (50) 17% (50) 8% (25) 38% (113) 20% (60) 299Religious Non-Protestant/Catholic 24% (31) 36% (46) 12% (15) 17% (21) 11% (14) 128Evangelical 14% (79) 17% (97) 11% (61) 45% (250) 13% (72) 558Non-Evangelical 21% (152) 24% (175) 12% (89) 31% (226) 12% (84) 727Community: Urban 27% (125) 28% (128) 10% (44) 22% (99) 13% (61) 457Community: Suburban 18% (181) 25% (248) 13% (130) 32% (321) 13% (131) 1010Community: Rural 12% (62) 20% (104) 12% (62) 41% (220) 16% (83) 531Employ: Private Sector 17% (115) 29% (198) 11% (75) 30% (206) 13% (92) 687Employ: Government 16% (21) 19% (26) 18% (24) 27% (36) 20% (27) 133Employ: Self-Employed 21% (39) 23% (42) 9% (16) 33% (61) 14% (27) 185Employ: Homemaker 11% (18) 18% (29) 14% (22) 40% (64) 17% (28) 160Employ: Student 4% (2) 40% (24) 12% (7) 17% (10) 27% (17) 61Employ: Retired 23% (118) 22% (111) 11% (54) 37% (189) 7% (37) 509Employ: Unemployed 18% (30) 16% (27) 15% (25) 33% (54) 17% (28) 165Employ: Other 27% (26) 24% (24) 11% (11) 18% (18) 20% (19) 97Military HH: Yes 20% (76) 19% (71) 11% (41) 36% (134) 14% (52) 375Military HH: No 18% (292) 25% (409) 12% (193) 31% (506) 14% (223) 1623RD/WT: Right Direction 39% (288) 40% (301) 7% (52) 3% (22) 11% (82) 745RD/WT: Wrong Track 6% (80) 14% (179) 15% (183) 49% (618) 15% (193) 1253Biden Job Approve 38% (340) 42% (375) 6% (54) 2% (19) 11% (102) 890Biden Job Disapprove 3% (28) 9% (91) 17% (178) 60% (618) 11% (116) 1031
Continued on next page

National Tracking Poll #2110009, October, 2021
49
Table POL3_5
Table POL3_5: Do you approve or disapprove of how President Biden is handling each of the following?Climate change
DemographicStronglyapprove
Somewhatapprove
Somewhatdisapprove
Stronglydisapprove
Don’t Know /No Opinion Total N
Registered Voters 18% (368) 24% (480) 12% (235) 32% (640) 14% (275) 1998Biden Job Strongly Approve 57% (255) 33% (147) 3% (15) 1% (4) 6% (26) 446Biden Job Somewhat Approve 19% (85) 51% (228) 9% (39) 3% (15) 17% (76) 444Biden Job Somewhat Disapprove 6% (15) 22% (54) 34% (85) 19% (47) 19% (48) 250Biden Job Strongly Disapprove 2% (13) 5% (36) 12% (93) 73% (571) 9% (68) 781Favorable of Biden 37% (337) 42% (374) 7% (63) 2% (20) 12% (106) 899Unfavorable of Biden 2% (25) 10% (100) 16% (166) 60% (615) 12% (127) 1032Very Favorable of Biden 57% (268) 33% (155) 3% (13) — (1) 7% (32) 470Somewhat Favorable of Biden 16% (69) 51% (219) 12% (49) 4% (18) 17% (74) 429Somewhat Unfavorable of Biden 7% (17) 26% (63) 28% (69) 16% (38) 24% (58) 246Very Unfavorable of Biden 1% (8) 5% (37) 12% (96) 73% (576) 9% (68) 786#1 Issue: Economy 17% (125) 22% (161) 14% (107) 32% (240) 15% (109) 742#1 Issue: Security 7% (29) 11% (46) 12% (47) 60% (245) 10% (42) 409#1 Issue: Health Care 27% (67) 40% (100) 8% (21) 10% (26) 14% (34) 248#1 Issue: Medicare / Social Security 29% (61) 30% (63) 9% (20) 19% (39) 12% (26) 209#1 Issue: Women’s Issues 21% (23) 37% (41) 14% (16) 13% (14) 16% (17) 111#1 Issue: Education 19% (14) 20% (14) 6% (5) 27% (19) 27% (20) 72#1 Issue: Energy 23% (20) 38% (34) 12% (11) 14% (13) 13% (12) 90#1 Issue: Other 26% (30) 17% (20) 8% (10) 36% (42) 13% (15) 1172020 Vote: Joe Biden 35% (332) 39% (366) 8% (79) 5% (50) 13% (119) 9462020 Vote: Donald Trump 3% (23) 9% (75) 14% (124) 64% (552) 10% (90) 8642020 Vote: Didn’t Vote 8% (12) 19% (29) 16% (24) 20% (30) 38% (58) 1532018 House Vote: Democrat 37% (274) 38% (282) 9% (63) 7% (51) 9% (63) 7342018 House Vote: Republican 3% (24) 10% (72) 14% (103) 63% (454) 9% (66) 7192018 House Vote: Someone else 8% (5) 15% (8) 12% (6) 39% (21) 26% (14) 532016 Vote: Hillary Clinton 37% (261) 39% (277) 8% (54) 6% (41) 10% (73) 7062016 Vote: Donald Trump 4% (36) 11% (89) 12% (98) 63% (509) 9% (72) 8052016 Vote: Other 15% (13) 29% (25) 23% (20) 18% (16) 15% (13) 872016 Vote: Didn’t Vote 15% (58) 22% (88) 16% (63) 18% (72) 29% (117) 399Voted in 2014: Yes 20% (267) 24% (316) 11% (143) 36% (480) 9% (118) 1324Voted in 2014: No 15% (102) 24% (164) 14% (92) 24% (160) 23% (157) 674
Continued on next page

50
Morning ConsultTable POL3_5
Table POL3_5: Do you approve or disapprove of how President Biden is handling each of the following?Climate change
DemographicStronglyapprove
Somewhatapprove
Somewhatdisapprove
Stronglydisapprove
Don’t Know /No Opinion Total N
Registered Voters 18% (368) 24% (480) 12% (235) 32% (640) 14% (275) 19984-Region: Northeast 21% (75) 31% (109) 13% (45) 25% (87) 10% (37) 3534-Region: Midwest 18% (79) 23% (101) 13% (57) 34% (152) 13% (56) 4444-Region: South 17% (130) 20% (153) 10% (75) 36% (268) 16% (120) 7464-Region: West 19% (85) 26% (118) 13% (58) 29% (133) 14% (62) 455Party: Democrat/Leans Democrat 36% (313) 38% (332) 8% (75) 7% (60) 11% (98) 877Party: Republican/Leans Republican 4% (34) 12% (96) 15% (122) 59% (481) 11% (90) 822Note: Row proportions may total to larger than one-hundred percent due to rounding. For more information visit MorningConsultIntelligence.com.

National Tracking Poll #2110009, October, 2021
51
Table POL3_6
Table POL3_6: Do you approve or disapprove of how President Biden is handling each of the following?The environment
DemographicStronglyapprove
Somewhatapprove
Somewhatdisapprove
Stronglydisapprove
Don’t Know /No Opinion Total N
Registered Voters 19% (384) 26% (516) 12% (238) 31% (620) 12% (239) 1998Gender: Male 21% (197) 27% (253) 11% (107) 32% (300) 9% (85) 942Gender: Female 18% (187) 25% (263) 12% (131) 30% (320) 15% (155) 1056Age: 18-34 16% (81) 23% (116) 15% (77) 26% (131) 21% (109) 514Age: 35-44 18% (57) 33% (102) 9% (29) 27% (83) 12% (37) 307Age: 45-64 20% (132) 26% (177) 12% (80) 33% (226) 9% (63) 679Age: 65+ 23% (114) 24% (121) 11% (53) 36% (180) 6% (30) 497GenZers: 1997-2012 15% (22) 20% (29) 13% (19) 22% (33) 30% (45) 148Millennials: 1981-1996 16% (89) 27% (150) 14% (75) 27% (149) 17% (92) 556GenXers: 1965-1980 21% (98) 29% (138) 10% (47) 30% (142) 9% (43) 468Baby Boomers: 1946-1964 22% (156) 23% (166) 13% (93) 35% (255) 7% (53) 723PID: Dem (no lean) 39% (294) 39% (291) 8% (59) 4% (31) 10% (71) 745PID: Ind (no lean) 11% (63) 25% (142) 13% (73) 31% (171) 20% (111) 559PID: Rep (no lean) 4% (27) 12% (84) 15% (107) 60% (419) 8% (58) 694PID/Gender: DemMen 42% (149) 38% (134) 9% (33) 6% (22) 5% (17) 355PID/Gender: DemWomen 37% (145) 40% (156) 7% (26) 2% (9) 14% (53) 390PID/Gender: Ind Men 12% (34) 26% (74) 13% (36) 33% (95) 17% (48) 288PID/Gender: Ind Women 11% (29) 25% (68) 14% (37) 28% (76) 23% (62) 271PID/Gender: Rep Men 5% (14) 15% (45) 13% (38) 61% (183) 6% (19) 299PID/Gender: Rep Women 3% (13) 10% (39) 17% (68) 60% (236) 10% (39) 395Ideo: Liberal (1-3) 40% (224) 39% (215) 8% (42) 5% (26) 9% (47) 553Ideo: Moderate (4) 22% (116) 33% (175) 15% (83) 18% (99) 12% (65) 538Ideo: Conservative (5-7) 5% (38) 13% (102) 13% (106) 59% (470) 10% (77) 793Educ: < College 18% (220) 24% (284) 11% (138) 33% (400) 14% (165) 1206Educ: Bachelors degree 20% (98) 27% (136) 13% (64) 30% (149) 11% (54) 501Educ: Post-grad 23% (66) 33% (95) 13% (37) 25% (72) 7% (21) 290Income: Under 50k 18% (161) 26% (226) 14% (123) 28% (243) 15% (130) 882Income: 50k-100k 19% (136) 24% (174) 10% (71) 37% (269) 10% (74) 723Income: 100k+ 22% (87) 30% (117) 11% (44) 28% (109) 9% (35) 392Ethnicity: White 17% (268) 24% (378) 12% (186) 35% (546) 11% (168) 1545Ethnicity: Hispanic 17% (39) 28% (62) 11% (24) 28% (63) 16% (35) 222
Continued on next page
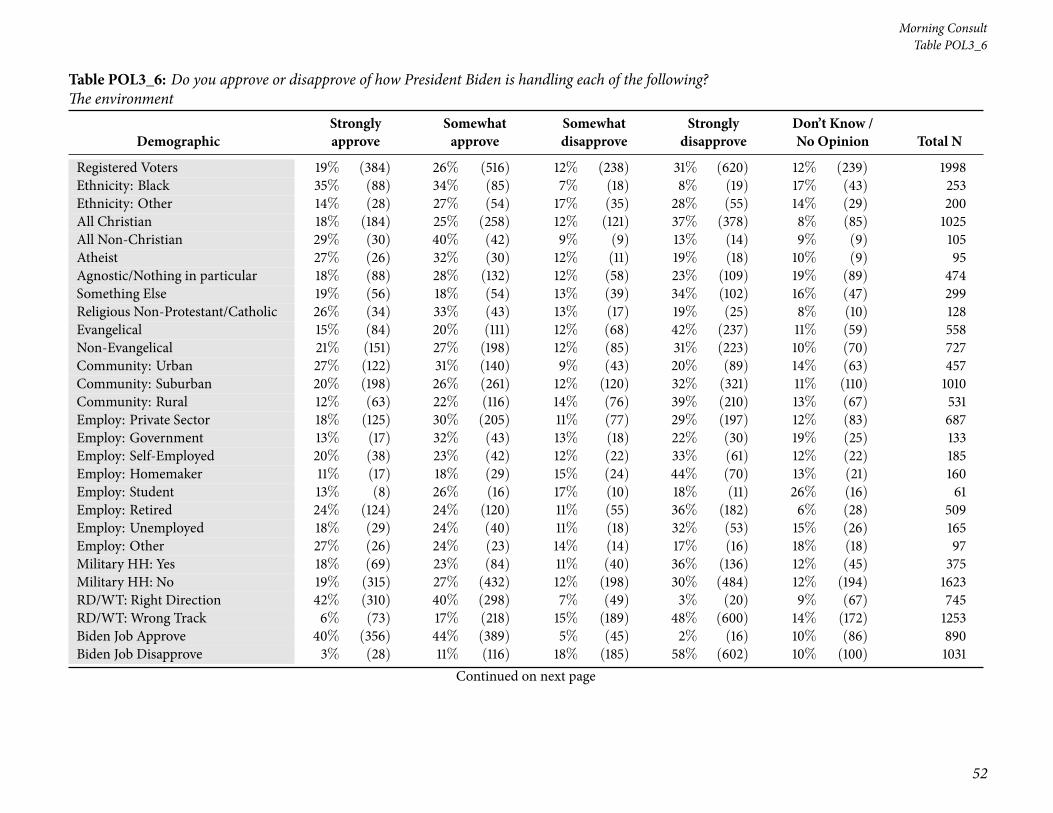
52
Morning ConsultTable POL3_6
Table POL3_6: Do you approve or disapprove of how President Biden is handling each of the following?The environment
DemographicStronglyapprove
Somewhatapprove
Somewhatdisapprove
Stronglydisapprove
Don’t Know /No Opinion Total N
Registered Voters 19% (384) 26% (516) 12% (238) 31% (620) 12% (239) 1998Ethnicity: Black 35% (88) 34% (85) 7% (18) 8% (19) 17% (43) 253Ethnicity: Other 14% (28) 27% (54) 17% (35) 28% (55) 14% (29) 200All Christian 18% (184) 25% (258) 12% (121) 37% (378) 8% (85) 1025All Non-Christian 29% (30) 40% (42) 9% (9) 13% (14) 9% (9) 105Atheist 27% (26) 32% (30) 12% (11) 19% (18) 10% (9) 95Agnostic/Nothing in particular 18% (88) 28% (132) 12% (58) 23% (109) 19% (89) 474Something Else 19% (56) 18% (54) 13% (39) 34% (102) 16% (47) 299Religious Non-Protestant/Catholic 26% (34) 33% (43) 13% (17) 19% (25) 8% (10) 128Evangelical 15% (84) 20% (111) 12% (68) 42% (237) 11% (59) 558Non-Evangelical 21% (151) 27% (198) 12% (85) 31% (223) 10% (70) 727Community: Urban 27% (122) 31% (140) 9% (43) 20% (89) 14% (63) 457Community: Suburban 20% (198) 26% (261) 12% (120) 32% (321) 11% (110) 1010Community: Rural 12% (63) 22% (116) 14% (76) 39% (210) 13% (67) 531Employ: Private Sector 18% (125) 30% (205) 11% (77) 29% (197) 12% (83) 687Employ: Government 13% (17) 32% (43) 13% (18) 22% (30) 19% (25) 133Employ: Self-Employed 20% (38) 23% (42) 12% (22) 33% (61) 12% (22) 185Employ: Homemaker 11% (17) 18% (29) 15% (24) 44% (70) 13% (21) 160Employ: Student 13% (8) 26% (16) 17% (10) 18% (11) 26% (16) 61Employ: Retired 24% (124) 24% (120) 11% (55) 36% (182) 6% (28) 509Employ: Unemployed 18% (29) 24% (40) 11% (18) 32% (53) 15% (26) 165Employ: Other 27% (26) 24% (23) 14% (14) 17% (16) 18% (18) 97Military HH: Yes 18% (69) 23% (84) 11% (40) 36% (136) 12% (45) 375Military HH: No 19% (315) 27% (432) 12% (198) 30% (484) 12% (194) 1623RD/WT: Right Direction 42% (310) 40% (298) 7% (49) 3% (20) 9% (67) 745RD/WT: Wrong Track 6% (73) 17% (218) 15% (189) 48% (600) 14% (172) 1253Biden Job Approve 40% (356) 44% (389) 5% (45) 2% (16) 10% (86) 890Biden Job Disapprove 3% (28) 11% (116) 18% (185) 58% (602) 10% (100) 1031
Continued on next page

National Tracking Poll #2110009, October, 2021
53
Table POL3_6
Table POL3_6: Do you approve or disapprove of how President Biden is handling each of the following?The environment
DemographicStronglyapprove
Somewhatapprove
Somewhatdisapprove
Stronglydisapprove
Don’t Know /No Opinion Total N
Registered Voters 19% (384) 26% (516) 12% (238) 31% (620) 12% (239) 1998Biden Job Strongly Approve 60% (270) 31% (137) 3% (12) 1% (3) 6% (25) 446Biden Job Somewhat Approve 19% (86) 57% (252) 7% (32) 3% (13) 14% (61) 444Biden Job Somewhat Disapprove 6% (14) 26% (65) 35% (88) 16% (40) 17% (43) 250Biden Job Strongly Disapprove 2% (14) 7% (51) 12% (97) 72% (562) 7% (57) 781Favorable of Biden 39% (351) 45% (401) 5% (46) 2% (17) 9% (85) 899Unfavorable of Biden 3% (27) 11% (109) 18% (184) 58% (601) 11% (110) 1032Very Favorable of Biden 62% (290) 30% (142) 2% (10) 1% (4) 5% (24) 470Somewhat Favorable of Biden 14% (61) 60% (259) 8% (36) 3% (13) 14% (61) 429Somewhat Unfavorable of Biden 7% (18) 25% (62) 33% (81) 14% (35) 20% (49) 246Very Unfavorable of Biden 1% (9) 6% (47) 13% (103) 72% (566) 8% (61) 786#1 Issue: Economy 18% (131) 22% (165) 16% (116) 31% (233) 13% (98) 742#1 Issue: Security 8% (31) 13% (54) 11% (45) 59% (240) 9% (39) 409#1 Issue: Health Care 28% (70) 40% (100) 8% (21) 11% (26) 13% (32) 248#1 Issue: Medicare / Social Security 29% (61) 34% (72) 11% (23) 20% (43) 5% (10) 209#1 Issue: Women’s Issues 24% (27) 45% (50) 8% (9) 12% (13) 11% (12) 111#1 Issue: Education 17% (12) 23% (17) 10% (7) 18% (13) 32% (23) 72#1 Issue: Energy 22% (20) 45% (40) 9% (8) 13% (11) 11% (10) 90#1 Issue: Other 27% (31) 16% (19) 8% (9) 36% (42) 13% (15) 1172020 Vote: Joe Biden 37% (351) 41% (391) 7% (65) 4% (37) 11% (103) 9462020 Vote: Donald Trump 2% (19) 9% (82) 17% (146) 63% (541) 9% (76) 8642020 Vote: Didn’t Vote 8% (12) 24% (37) 12% (18) 23% (36) 33% (50) 1532018 House Vote: Democrat 39% (284) 40% (292) 8% (60) 6% (40) 8% (58) 7342018 House Vote: Republican 4% (27) 11% (83) 15% (110) 62% (444) 8% (55) 7192018 House Vote: Someone else 11% (6) 18% (10) 14% (8) 35% (19) 22% (12) 532016 Vote: Hillary Clinton 40% (285) 39% (273) 6% (45) 5% (38) 9% (66) 7062016 Vote: Donald Trump 4% (31) 12% (97) 15% (124) 60% (485) 8% (68) 8052016 Vote: Other 14% (12) 35% (30) 20% (18) 20% (17) 11% (10) 872016 Vote: Didn’t Vote 14% (55) 29% (116) 13% (52) 20% (79) 24% (96) 399Voted in 2014: Yes 21% (276) 26% (341) 11% (149) 35% (458) 8% (100) 1324Voted in 2014: No 16% (108) 26% (175) 13% (89) 24% (162) 21% (140) 674
Continued on next page

54
Morning ConsultTable POL3_6
Table POL3_6: Do you approve or disapprove of how President Biden is handling each of the following?The environment
DemographicStronglyapprove
Somewhatapprove
Somewhatdisapprove
Stronglydisapprove
Don’t Know /No Opinion Total N
Registered Voters 19% (384) 26% (516) 12% (238) 31% (620) 12% (239) 19984-Region: Northeast 23% (83) 30% (105) 12% (42) 26% (91) 9% (33) 3534-Region: Midwest 19% (85) 24% (106) 13% (57) 33% (145) 12% (52) 4444-Region: South 18% (131) 23% (173) 10% (76) 36% (269) 13% (96) 7464-Region: West 19% (85) 29% (132) 14% (64) 25% (115) 13% (58) 455Party: Democrat/Leans Democrat 38% (331) 39% (346) 8% (73) 5% (44) 10% (84) 877Party: Republican/Leans Republican 4% (30) 13% (104) 16% (129) 58% (478) 10% (80) 822Note: Row proportions may total to larger than one-hundred percent due to rounding. For more information visit MorningConsultIntelligence.com.

National Tracking Poll #2110009, October, 2021
55
Table POL3_7
Table POL3_7: Do you approve or disapprove of how President Biden is handling each of the following?Energy
DemographicStronglyapprove
Somewhatapprove
Somewhatdisapprove
Stronglydisapprove
Don’t Know /No Opinion Total N
Registered Voters 19% (372) 23% (461) 11% (223) 34% (680) 13% (262) 1998Gender: Male 21% (194) 23% (216) 11% (104) 36% (341) 9% (86) 942Gender: Female 17% (178) 23% (245) 11% (119) 32% (339) 17% (175) 1056Age: 18-34 16% (81) 21% (108) 15% (80) 26% (132) 22% (113) 514Age: 35-44 20% (62) 24% (75) 12% (38) 28% (85) 15% (47) 307Age: 45-64 19% (126) 23% (158) 9% (59) 39% (266) 10% (71) 679Age: 65+ 21% (104) 24% (120) 9% (46) 40% (197) 6% (31) 497GenZers: 1997-2012 10% (15) 22% (33) 14% (20) 20% (29) 35% (51) 148Millennials: 1981-1996 18% (99) 22% (121) 16% (87) 28% (156) 17% (93) 556GenXers: 1965-1980 21% (100) 24% (113) 9% (42) 33% (152) 13% (61) 468Baby Boomers: 1946-1964 19% (139) 23% (165) 9% (66) 42% (301) 7% (53) 723PID: Dem (no lean) 38% (283) 37% (278) 8% (59) 5% (37) 12% (87) 745PID: Ind (no lean) 9% (50) 24% (134) 14% (76) 33% (183) 21% (116) 559PID: Rep (no lean) 6% (40) 7% (48) 13% (88) 66% (459) 8% (59) 694PID/Gender: DemMen 42% (148) 35% (123) 10% (34) 8% (27) 6% (23) 355PID/Gender: DemWomen 35% (135) 40% (156) 6% (25) 3% (10) 16% (64) 390PID/Gender: Ind Men 9% (27) 23% (67) 13% (37) 38% (108) 17% (50) 288PID/Gender: Ind Women 9% (23) 25% (68) 15% (39) 28% (75) 24% (66) 271PID/Gender: Rep Men 7% (20) 9% (27) 11% (33) 69% (205) 5% (14) 299PID/Gender: Rep Women 5% (20) 5% (21) 14% (55) 64% (254) 11% (45) 395Ideo: Liberal (1-3) 38% (212) 38% (207) 7% (40) 6% (33) 11% (60) 553Ideo: Moderate (4) 20% (106) 31% (166) 13% (73) 20% (107) 16% (86) 538Ideo: Conservative (5-7) 6% (46) 9% (69) 12% (94) 65% (518) 8% (66) 793Educ: < College 18% (219) 21% (250) 10% (127) 36% (434) 15% (177) 1206Educ: Bachelors degree 19% (97) 23% (113) 12% (61) 33% (167) 13% (63) 501Educ: Post-grad 20% (57) 34% (97) 12% (36) 27% (79) 7% (22) 290Income: Under 50k 18% (162) 23% (199) 11% (98) 31% (277) 17% (147) 882Income: 50k-100k 18% (127) 21% (155) 12% (83) 39% (284) 10% (74) 723Income: 100k+ 21% (84) 27% (106) 11% (42) 30% (119) 11% (41) 392Ethnicity: White 17% (259) 22% (338) 11% (173) 39% (597) 11% (178) 1545Ethnicity: Hispanic 19% (42) 25% (55) 11% (25) 33% (73) 12% (27) 222
Continued on next page
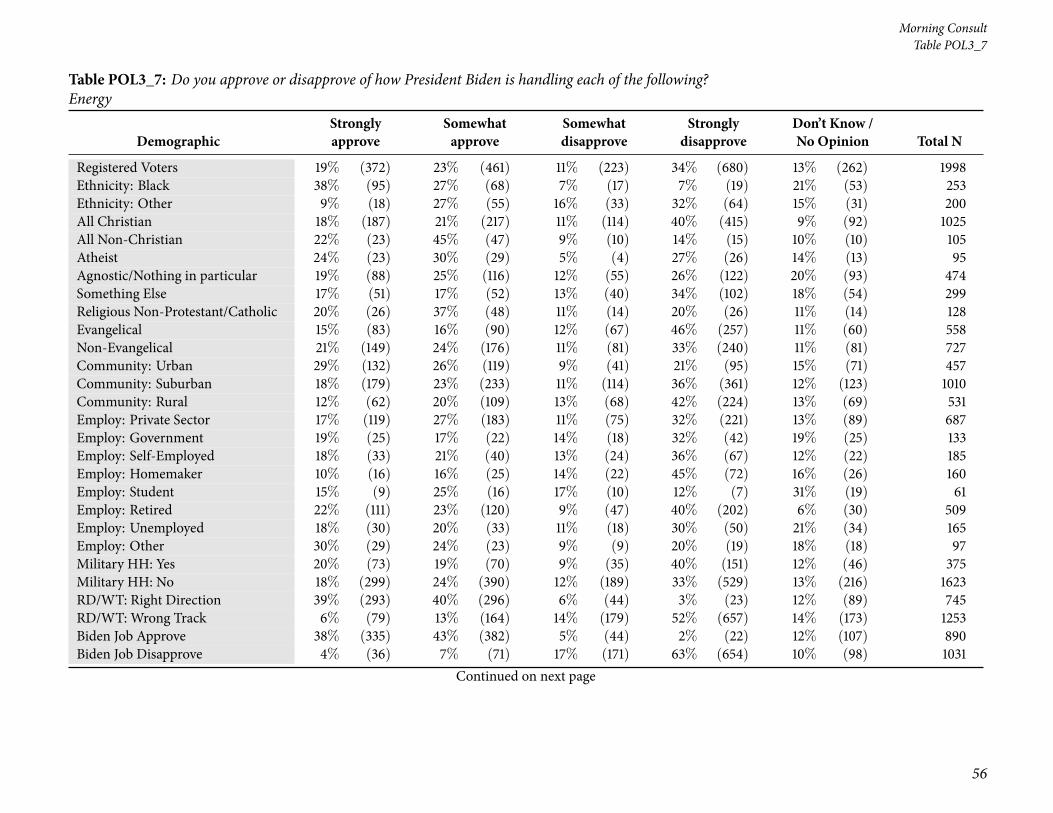
56
Morning ConsultTable POL3_7
Table POL3_7: Do you approve or disapprove of how President Biden is handling each of the following?Energy
DemographicStronglyapprove
Somewhatapprove
Somewhatdisapprove
Stronglydisapprove
Don’t Know /No Opinion Total N
Registered Voters 19% (372) 23% (461) 11% (223) 34% (680) 13% (262) 1998Ethnicity: Black 38% (95) 27% (68) 7% (17) 7% (19) 21% (53) 253Ethnicity: Other 9% (18) 27% (55) 16% (33) 32% (64) 15% (31) 200All Christian 18% (187) 21% (217) 11% (114) 40% (415) 9% (92) 1025All Non-Christian 22% (23) 45% (47) 9% (10) 14% (15) 10% (10) 105Atheist 24% (23) 30% (29) 5% (4) 27% (26) 14% (13) 95Agnostic/Nothing in particular 19% (88) 25% (116) 12% (55) 26% (122) 20% (93) 474Something Else 17% (51) 17% (52) 13% (40) 34% (102) 18% (54) 299Religious Non-Protestant/Catholic 20% (26) 37% (48) 11% (14) 20% (26) 11% (14) 128Evangelical 15% (83) 16% (90) 12% (67) 46% (257) 11% (60) 558Non-Evangelical 21% (149) 24% (176) 11% (81) 33% (240) 11% (81) 727Community: Urban 29% (132) 26% (119) 9% (41) 21% (95) 15% (71) 457Community: Suburban 18% (179) 23% (233) 11% (114) 36% (361) 12% (123) 1010Community: Rural 12% (62) 20% (109) 13% (68) 42% (224) 13% (69) 531Employ: Private Sector 17% (119) 27% (183) 11% (75) 32% (221) 13% (89) 687Employ: Government 19% (25) 17% (22) 14% (18) 32% (42) 19% (25) 133Employ: Self-Employed 18% (33) 21% (40) 13% (24) 36% (67) 12% (22) 185Employ: Homemaker 10% (16) 16% (25) 14% (22) 45% (72) 16% (26) 160Employ: Student 15% (9) 25% (16) 17% (10) 12% (7) 31% (19) 61Employ: Retired 22% (111) 23% (120) 9% (47) 40% (202) 6% (30) 509Employ: Unemployed 18% (30) 20% (33) 11% (18) 30% (50) 21% (34) 165Employ: Other 30% (29) 24% (23) 9% (9) 20% (19) 18% (18) 97Military HH: Yes 20% (73) 19% (70) 9% (35) 40% (151) 12% (46) 375Military HH: No 18% (299) 24% (390) 12% (189) 33% (529) 13% (216) 1623RD/WT: Right Direction 39% (293) 40% (296) 6% (44) 3% (23) 12% (89) 745RD/WT: Wrong Track 6% (79) 13% (164) 14% (179) 52% (657) 14% (173) 1253Biden Job Approve 38% (335) 43% (382) 5% (44) 2% (22) 12% (107) 890Biden Job Disapprove 4% (36) 7% (71) 17% (171) 63% (654) 10% (98) 1031
Continued on next page

National Tracking Poll #2110009, October, 2021
57
Table POL3_7
Table POL3_7: Do you approve or disapprove of how President Biden is handling each of the following?Energy
DemographicStronglyapprove
Somewhatapprove
Somewhatdisapprove
Stronglydisapprove
Don’t Know /No Opinion Total N
Registered Voters 19% (372) 23% (461) 11% (223) 34% (680) 13% (262) 1998Biden Job Strongly Approve 58% (258) 33% (145) 2% (11) 1% (4) 6% (28) 446Biden Job Somewhat Approve 17% (76) 53% (237) 7% (33) 4% (18) 18% (79) 444Biden Job Somewhat Disapprove 6% (16) 19% (47) 34% (86) 18% (45) 22% (56) 250Biden Job Strongly Disapprove 3% (21) 3% (23) 11% (86) 78% (609) 5% (42) 781Favorable of Biden 37% (337) 43% (385) 5% (47) 2% (21) 12% (110) 899Unfavorable of Biden 3% (29) 7% (69) 17% (172) 63% (653) 11% (110) 1032Very Favorable of Biden 59% (277) 31% (145) 3% (13) 1% (3) 7% (31) 470Somewhat Favorable of Biden 14% (60) 56% (239) 8% (33) 4% (17) 19% (79) 429Somewhat Unfavorable of Biden 6% (14) 18% (45) 32% (79) 16% (39) 28% (69) 246Very Unfavorable of Biden 2% (16) 3% (24) 12% (92) 78% (614) 5% (41) 786#1 Issue: Economy 17% (124) 21% (154) 12% (86) 37% (274) 14% (103) 742#1 Issue: Security 5% (21) 12% (51) 11% (47) 63% (260) 8% (31) 409#1 Issue: Health Care 31% (76) 36% (89) 8% (21) 10% (24) 15% (38) 248#1 Issue: Medicare / Social Security 26% (54) 33% (68) 11% (22) 24% (49) 7% (15) 209#1 Issue: Women’s Issues 26% (29) 39% (43) 10% (11) 8% (9) 17% (19) 111#1 Issue: Education 14% (10) 15% (11) 17% (12) 22% (16) 32% (23) 72#1 Issue: Energy 29% (26) 33% (30) 13% (12) 11% (10) 14% (13) 90#1 Issue: Other 27% (32) 13% (15) 11% (12) 33% (39) 17% (19) 1172020 Vote: Joe Biden 35% (327) 39% (372) 8% (74) 5% (44) 14% (129) 9462020 Vote: Donald Trump 4% (31) 6% (51) 14% (125) 68% (587) 8% (70) 8642020 Vote: Didn’t Vote 8% (12) 20% (31) 11% (17) 27% (41) 34% (52) 1532018 House Vote: Democrat 38% (281) 38% (279) 7% (49) 8% (57) 9% (68) 7342018 House Vote: Republican 4% (26) 8% (61) 14% (101) 67% (480) 7% (50) 7192018 House Vote: Someone else 4% (2) 16% (9) 18% (10) 35% (19) 27% (14) 532016 Vote: Hillary Clinton 36% (257) 39% (275) 6% (44) 7% (50) 11% (79) 7062016 Vote: Donald Trump 5% (40) 8% (68) 13% (107) 66% (533) 7% (58) 8052016 Vote: Other 14% (12) 38% (33) 13% (11) 20% (18) 16% (14) 872016 Vote: Didn’t Vote 16% (63) 21% (85) 15% (61) 20% (79) 28% (111) 399Voted in 2014: Yes 20% (270) 24% (316) 9% (123) 39% (513) 8% (103) 1324Voted in 2014: No 15% (102) 22% (145) 15% (101) 25% (167) 24% (159) 674
Continued on next page

58
Morning ConsultTable POL3_7
Table POL3_7: Do you approve or disapprove of how President Biden is handling each of the following?Energy
DemographicStronglyapprove
Somewhatapprove
Somewhatdisapprove
Stronglydisapprove
Don’t Know /No Opinion Total N
Registered Voters 19% (372) 23% (461) 11% (223) 34% (680) 13% (262) 19984-Region: Northeast 17% (61) 32% (114) 10% (36) 28% (97) 13% (45) 3534-Region: Midwest 18% (78) 22% (97) 13% (57) 37% (162) 11% (50) 4444-Region: South 18% (135) 19% (143) 10% (73) 38% (281) 15% (114) 7464-Region: West 22% (98) 23% (107) 13% (58) 31% (139) 12% (53) 455Party: Democrat/Leans Democrat 35% (309) 38% (336) 8% (73) 6% (53) 12% (107) 877Party: Republican/Leans Republican 5% (41) 8% (70) 13% (111) 64% (526) 9% (74) 822Note: Row proportions may total to larger than one-hundred percent due to rounding. For more information visit MorningConsultIntelligence.com.

National Tracking Poll #2110009, October, 2021
59
Table POL3_8
Table POL3_8: Do you approve or disapprove of how President Biden is handling each of the following?Education
DemographicStronglyapprove
Somewhatapprove
Somewhatdisapprove
Stronglydisapprove
Don’t Know /No Opinion Total N
Registered Voters 17% (347) 25% (499) 12% (236) 32% (647) 13% (269) 1998Gender: Male 19% (177) 25% (237) 12% (109) 35% (326) 10% (93) 942Gender: Female 16% (171) 25% (262) 12% (127) 30% (321) 17% (176) 1056Age: 18-34 16% (80) 23% (119) 16% (83) 25% (131) 20% (102) 514Age: 35-44 18% (56) 29% (90) 12% (36) 26% (81) 14% (44) 307Age: 45-64 18% (121) 24% (160) 10% (69) 36% (245) 12% (84) 679Age: 65+ 18% (90) 26% (130) 10% (48) 38% (190) 8% (39) 497GenZers: 1997-2012 13% (19) 18% (27) 20% (29) 19% (28) 30% (45) 148Millennials: 1981-1996 17% (94) 26% (145) 14% (76) 28% (155) 15% (86) 556GenXers: 1965-1980 21% (96) 25% (115) 10% (46) 31% (144) 14% (66) 468Baby Boomers: 1946-1964 16% (119) 25% (183) 11% (77) 38% (277) 9% (67) 723PID: Dem (no lean) 35% (262) 39% (292) 8% (58) 6% (44) 12% (88) 745PID: Ind (no lean) 9% (52) 24% (133) 15% (84) 30% (169) 22% (122) 559PID: Rep (no lean) 5% (33) 11% (75) 13% (93) 63% (434) 9% (59) 694PID/Gender: DemMen 39% (138) 38% (135) 10% (36) 8% (29) 5% (18) 355PID/Gender: DemWomen 32% (125) 40% (157) 6% (23) 4% (15) 18% (70) 390PID/Gender: Ind Men 9% (27) 23% (65) 13% (37) 35% (101) 20% (58) 288PID/Gender: Ind Women 9% (25) 25% (68) 17% (47) 25% (68) 23% (64) 271PID/Gender: Rep Men 4% (12) 13% (38) 12% (36) 65% (196) 6% (17) 299PID/Gender: Rep Women 5% (21) 9% (37) 15% (57) 60% (238) 11% (42) 395Ideo: Liberal (1-3) 36% (200) 39% (218) 8% (47) 5% (26) 11% (62) 553Ideo: Moderate (4) 18% (99) 33% (178) 14% (78) 19% (104) 15% (80) 538Ideo: Conservative (5-7) 5% (38) 11% (89) 13% (101) 62% (489) 10% (77) 793Educ: < College 17% (211) 21% (253) 12% (150) 34% (414) 15% (179) 1206Educ: Bachelors degree 15% (78) 29% (147) 12% (62) 31% (155) 12% (60) 501Educ: Post-grad 20% (59) 34% (99) 8% (24) 27% (78) 10% (30) 290Income: Under 50k 19% (165) 22% (193) 13% (111) 30% (268) 16% (145) 882Income: 50k-100k 14% (105) 26% (186) 12% (87) 36% (262) 12% (84) 723Income: 100k+ 20% (78) 30% (120) 10% (38) 30% (117) 10% (41) 392Ethnicity: White 15% (234) 25% (383) 12% (180) 36% (557) 12% (191) 1545Ethnicity: Hispanic 18% (40) 27% (60) 12% (28) 29% (65) 13% (30) 222
Continued on next page

60
Morning ConsultTable POL3_8
Table POL3_8: Do you approve or disapprove of how President Biden is handling each of the following?Education
DemographicStronglyapprove
Somewhatapprove
Somewhatdisapprove
Stronglydisapprove
Don’t Know /No Opinion Total N
Registered Voters 17% (347) 25% (499) 12% (236) 32% (647) 13% (269) 1998Ethnicity: Black 38% (97) 24% (60) 9% (22) 12% (30) 17% (44) 253Ethnicity: Other 8% (17) 28% (56) 17% (34) 30% (60) 17% (34) 200All Christian 16% (164) 25% (256) 11% (113) 39% (397) 9% (95) 1025All Non-Christian 26% (27) 42% (44) 10% (10) 13% (13) 10% (10) 105Atheist 21% (20) 36% (34) 9% (9) 19% (18) 15% (14) 95Agnostic/Nothing in particular 18% (83) 23% (111) 16% (74) 24% (115) 19% (92) 474Something Else 18% (53) 18% (55) 10% (30) 35% (104) 19% (57) 299Religious Non-Protestant/Catholic 23% (29) 36% (46) 12% (16) 20% (26) 9% (11) 128Evangelical 14% (79) 20% (112) 9% (52) 45% (250) 12% (65) 558Non-Evangelical 19% (136) 27% (193) 12% (86) 31% (229) 12% (84) 727Community: Urban 24% (111) 31% (141) 12% (54) 18% (84) 15% (67) 457Community: Suburban 16% (165) 26% (264) 12% (124) 33% (332) 12% (125) 1010Community: Rural 14% (72) 18% (94) 11% (58) 43% (230) 15% (77) 531Employ: Private Sector 16% (110) 29% (202) 12% (82) 30% (208) 12% (85) 687Employ: Government 13% (17) 22% (30) 20% (26) 24% (32) 22% (29) 133Employ: Self-Employed 21% (38) 22% (40) 10% (18) 37% (69) 10% (19) 185Employ: Homemaker 9% (15) 19% (31) 11% (17) 41% (66) 20% (31) 160Employ: Student 14% (9) 20% (12) 18% (11) 17% (10) 31% (19) 61Employ: Retired 20% (101) 25% (126) 10% (50) 38% (193) 8% (39) 509Employ: Unemployed 18% (29) 23% (39) 10% (17) 32% (53) 17% (28) 165Employ: Other 29% (28) 21% (20) 14% (13) 16% (16) 20% (20) 97Military HH: Yes 16% (61) 21% (80) 10% (37) 38% (143) 14% (53) 375Military HH: No 18% (286) 26% (419) 12% (199) 31% (503) 13% (216) 1623RD/WT: Right Direction 38% (284) 42% (316) 6% (46) 2% (17) 11% (82) 745RD/WT: Wrong Track 5% (64) 15% (183) 15% (189) 50% (630) 15% (187) 1253Biden Job Approve 36% (318) 45% (402) 6% (51) 2% (22) 11% (98) 890Biden Job Disapprove 3% (28) 9% (91) 17% (173) 60% (622) 11% (117) 1031
Continued on next page

National Tracking Poll #2110009, October, 2021
61
Table POL3_8
Table POL3_8: Do you approve or disapprove of how President Biden is handling each of the following?Education
DemographicStronglyapprove
Somewhatapprove
Somewhatdisapprove
Stronglydisapprove
Don’t Know /No Opinion Total N
Registered Voters 17% (347) 25% (499) 12% (236) 32% (647) 13% (269) 1998Biden Job Strongly Approve 57% (255) 34% (152) 2% (9) 1% (3) 6% (27) 446Biden Job Somewhat Approve 14% (63) 56% (250) 9% (41) 4% (19) 16% (71) 444Biden Job Somewhat Disapprove 6% (16) 23% (58) 32% (81) 15% (37) 23% (58) 250Biden Job Strongly Disapprove 2% (12) 4% (33) 12% (92) 75% (585) 8% (59) 781Favorable of Biden 35% (318) 46% (411) 5% (49) 2% (22) 11% (99) 899Unfavorable of Biden 2% (21) 8% (86) 17% (178) 60% (621) 12% (126) 1032Very Favorable of Biden 58% (271) 34% (160) 2% (9) 1% (5) 5% (25) 470Somewhat Favorable of Biden 11% (47) 59% (252) 9% (40) 4% (17) 17% (74) 429Somewhat Unfavorable of Biden 5% (13) 20% (49) 34% (82) 15% (37) 26% (65) 246Very Unfavorable of Biden 1% (7) 5% (37) 12% (96) 74% (585) 8% (62) 786#1 Issue: Economy 16% (115) 23% (167) 14% (104) 33% (247) 15% (109) 742#1 Issue: Security 7% (31) 11% (45) 12% (48) 60% (247) 9% (38) 409#1 Issue: Health Care 30% (75) 36% (88) 11% (27) 9% (23) 14% (35) 248#1 Issue: Medicare / Social Security 24% (51) 35% (73) 8% (17) 23% (48) 10% (20) 209#1 Issue: Women’s Issues 27% (30) 40% (44) 8% (9) 11% (13) 14% (15) 111#1 Issue: Education 11% (8) 27% (20) 17% (13) 22% (16) 22% (16) 72#1 Issue: Energy 16% (14) 42% (38) 11% (10) 13% (11) 18% (16) 90#1 Issue: Other 21% (24) 21% (24) 6% (7) 36% (42) 17% (20) 1172020 Vote: Joe Biden 33% (309) 42% (400) 7% (71) 4% (42) 13% (124) 9462020 Vote: Donald Trump 3% (26) 7% (62) 16% (135) 65% (559) 9% (82) 8642020 Vote: Didn’t Vote 7% (11) 20% (31) 15% (23) 23% (35) 35% (53) 1532018 House Vote: Democrat 35% (254) 41% (299) 8% (59) 7% (52) 10% (71) 7342018 House Vote: Republican 4% (27) 11% (76) 14% (99) 64% (458) 8% (59) 7192018 House Vote: Someone else 5% (3) 19% (10) 11% (6) 31% (17) 34% (18) 532016 Vote: Hillary Clinton 35% (249) 41% (289) 7% (48) 5% (39) 12% (82) 7062016 Vote: Donald Trump 4% (32) 11% (85) 13% (105) 63% (511) 9% (72) 8052016 Vote: Other 10% (9) 35% (31) 15% (13) 19% (16) 21% (18) 872016 Vote: Didn’t Vote 14% (58) 23% (93) 18% (70) 20% (80) 24% (98) 399Voted in 2014: Yes 18% (239) 26% (350) 10% (131) 36% (478) 9% (125) 1324Voted in 2014: No 16% (108) 22% (149) 15% (104) 25% (169) 21% (144) 674
Continued on next page

62
Morning ConsultTable POL3_8
Table POL3_8: Do you approve or disapprove of how President Biden is handling each of the following?Education
DemographicStronglyapprove
Somewhatapprove
Somewhatdisapprove
Stronglydisapprove
Don’t Know /No Opinion Total N
Registered Voters 17% (347) 25% (499) 12% (236) 32% (647) 13% (269) 19984-Region: Northeast 18% (65) 31% (108) 11% (37) 28% (99) 12% (44) 3534-Region: Midwest 14% (63) 29% (127) 12% (52) 32% (140) 14% (62) 4444-Region: South 17% (130) 20% (147) 12% (87) 36% (271) 15% (110) 7464-Region: West 20% (89) 26% (117) 13% (60) 30% (136) 12% (53) 455Party: Democrat/Leans Democrat 33% (289) 40% (349) 9% (77) 6% (56) 12% (105) 877Party: Republican/Leans Republican 5% (38) 11% (91) 14% (117) 60% (496) 10% (80) 822Note: Row proportions may total to larger than one-hundred percent due to rounding. For more information visit MorningConsultIntelligence.com.
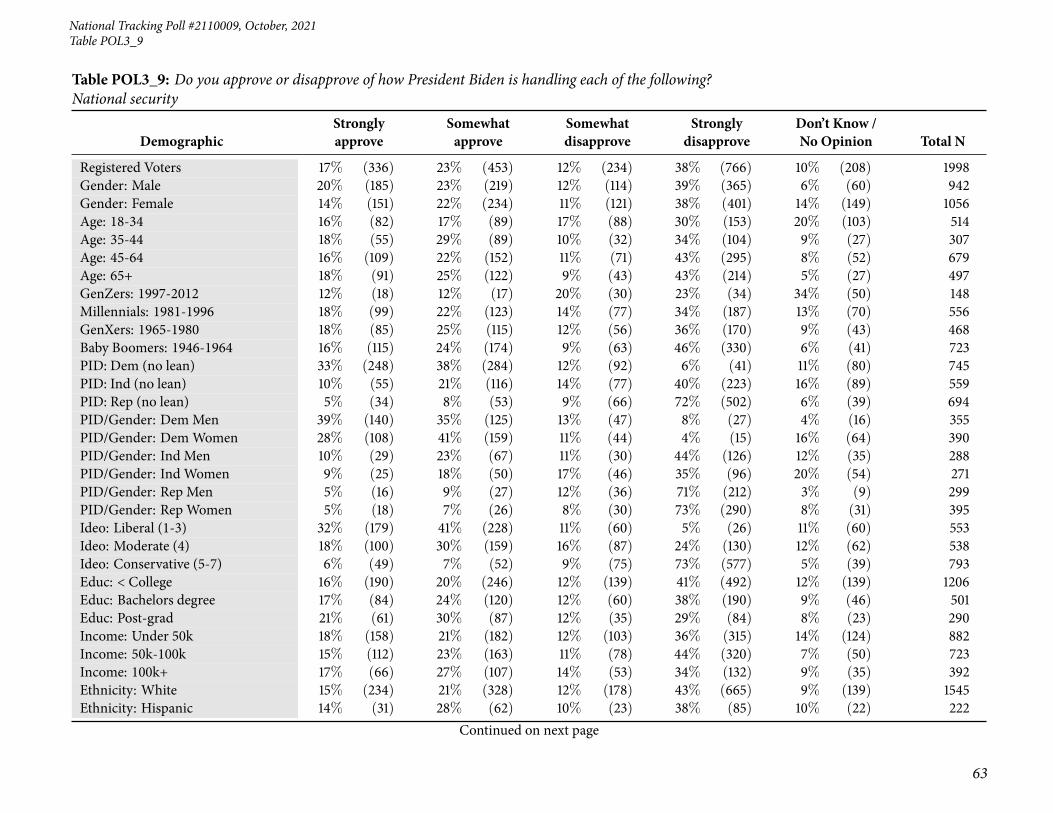
National Tracking Poll #2110009, October, 2021
63
Table POL3_9
Table POL3_9: Do you approve or disapprove of how President Biden is handling each of the following?National security
DemographicStronglyapprove
Somewhatapprove
Somewhatdisapprove
Stronglydisapprove
Don’t Know /No Opinion Total N
Registered Voters 17% (336) 23% (453) 12% (234) 38% (766) 10% (208) 1998Gender: Male 20% (185) 23% (219) 12% (114) 39% (365) 6% (60) 942Gender: Female 14% (151) 22% (234) 11% (121) 38% (401) 14% (149) 1056Age: 18-34 16% (82) 17% (89) 17% (88) 30% (153) 20% (103) 514Age: 35-44 18% (55) 29% (89) 10% (32) 34% (104) 9% (27) 307Age: 45-64 16% (109) 22% (152) 11% (71) 43% (295) 8% (52) 679Age: 65+ 18% (91) 25% (122) 9% (43) 43% (214) 5% (27) 497GenZers: 1997-2012 12% (18) 12% (17) 20% (30) 23% (34) 34% (50) 148Millennials: 1981-1996 18% (99) 22% (123) 14% (77) 34% (187) 13% (70) 556GenXers: 1965-1980 18% (85) 25% (115) 12% (56) 36% (170) 9% (43) 468Baby Boomers: 1946-1964 16% (115) 24% (174) 9% (63) 46% (330) 6% (41) 723PID: Dem (no lean) 33% (248) 38% (284) 12% (92) 6% (41) 11% (80) 745PID: Ind (no lean) 10% (55) 21% (116) 14% (77) 40% (223) 16% (89) 559PID: Rep (no lean) 5% (34) 8% (53) 9% (66) 72% (502) 6% (39) 694PID/Gender: DemMen 39% (140) 35% (125) 13% (47) 8% (27) 4% (16) 355PID/Gender: DemWomen 28% (108) 41% (159) 11% (44) 4% (15) 16% (64) 390PID/Gender: Ind Men 10% (29) 23% (67) 11% (30) 44% (126) 12% (35) 288PID/Gender: Ind Women 9% (25) 18% (50) 17% (46) 35% (96) 20% (54) 271PID/Gender: Rep Men 5% (16) 9% (27) 12% (36) 71% (212) 3% (9) 299PID/Gender: Rep Women 5% (18) 7% (26) 8% (30) 73% (290) 8% (31) 395Ideo: Liberal (1-3) 32% (179) 41% (228) 11% (60) 5% (26) 11% (60) 553Ideo: Moderate (4) 18% (100) 30% (159) 16% (87) 24% (130) 12% (62) 538Ideo: Conservative (5-7) 6% (49) 7% (52) 9% (75) 73% (577) 5% (39) 793Educ: < College 16% (190) 20% (246) 12% (139) 41% (492) 12% (139) 1206Educ: Bachelors degree 17% (84) 24% (120) 12% (60) 38% (190) 9% (46) 501Educ: Post-grad 21% (61) 30% (87) 12% (35) 29% (84) 8% (23) 290Income: Under 50k 18% (158) 21% (182) 12% (103) 36% (315) 14% (124) 882Income: 50k-100k 15% (112) 23% (163) 11% (78) 44% (320) 7% (50) 723Income: 100k+ 17% (66) 27% (107) 14% (53) 34% (132) 9% (35) 392Ethnicity: White 15% (234) 21% (328) 12% (178) 43% (665) 9% (139) 1545Ethnicity: Hispanic 14% (31) 28% (62) 10% (23) 38% (85) 10% (22) 222
Continued on next page

64
Morning ConsultTable POL3_9
Table POL3_9: Do you approve or disapprove of how President Biden is handling each of the following?National security
DemographicStronglyapprove
Somewhatapprove
Somewhatdisapprove
Stronglydisapprove
Don’t Know /No Opinion Total N
Registered Voters 17% (336) 23% (453) 12% (234) 38% (766) 10% (208) 1998Ethnicity: Black 36% (90) 29% (73) 12% (31) 8% (20) 15% (39) 253Ethnicity: Other 6% (12) 26% (52) 13% (25) 40% (81) 15% (30) 200All Christian 15% (156) 22% (224) 10% (106) 46% (468) 7% (70) 1025All Non-Christian 24% (25) 42% (44) 13% (14) 13% (14) 7% (7) 105Atheist 23% (21) 27% (25) 16% (15) 26% (25) 9% (8) 95Agnostic/Nothing in particular 17% (78) 25% (118) 13% (61) 28% (135) 17% (82) 474Something Else 18% (55) 14% (42) 13% (38) 41% (124) 13% (40) 299Religious Non-Protestant/Catholic 21% (27) 36% (46) 13% (17) 22% (29) 7% (10) 128Evangelical 15% (84) 14% (78) 10% (58) 53% (295) 8% (42) 558Non-Evangelical 17% (121) 25% (185) 11% (82) 37% (272) 9% (66) 727Community: Urban 26% (118) 28% (128) 13% (58) 22% (102) 11% (51) 457Community: Suburban 15% (149) 23% (235) 12% (122) 40% (407) 10% (96) 1010Community: Rural 13% (68) 17% (90) 10% (55) 48% (257) 12% (62) 531Employ: Private Sector 16% (112) 25% (173) 13% (87) 37% (255) 9% (60) 687Employ: Government 13% (17) 27% (35) 13% (17) 31% (41) 17% (22) 133Employ: Self-Employed 23% (42) 16% (30) 15% (28) 36% (68) 10% (18) 185Employ: Homemaker 7% (12) 15% (23) 14% (23) 52% (83) 12% (20) 160Employ: Student 9% (5) 30% (18) 16% (10) 16% (10) 30% (18) 61Employ: Retired 19% (99) 23% (117) 9% (44) 44% (225) 5% (24) 509Employ: Unemployed 17% (27) 20% (33) 11% (18) 35% (58) 18% (29) 165Employ: Other 23% (22) 24% (24) 8% (8) 27% (26) 17% (17) 97Military HH: Yes 15% (56) 22% (83) 10% (38) 44% (164) 9% (34) 375Military HH: No 17% (280) 23% (370) 12% (196) 37% (603) 11% (175) 1623RD/WT: Right Direction 36% (271) 41% (304) 9% (68) 4% (27) 10% (74) 745RD/WT: Wrong Track 5% (65) 12% (149) 13% (166) 59% (739) 11% (134) 1253Biden Job Approve 34% (304) 43% (382) 10% (89) 2% (21) 11% (94) 890Biden Job Disapprove 3% (30) 7% (67) 13% (136) 72% (739) 6% (59) 1031
Continued on next page

National Tracking Poll #2110009, October, 2021
65
Table POL3_9
Table POL3_9: Do you approve or disapprove of how President Biden is handling each of the following?National security
DemographicStronglyapprove
Somewhatapprove
Somewhatdisapprove
Stronglydisapprove
Don’t Know /No Opinion Total N
Registered Voters 17% (336) 23% (453) 12% (234) 38% (766) 10% (208) 1998Biden Job Strongly Approve 56% (252) 35% (155) 4% (17) — (2) 5% (21) 446Biden Job Somewhat Approve 12% (52) 51% (227) 16% (72) 4% (20) 16% (72) 444Biden Job Somewhat Disapprove 5% (14) 17% (41) 37% (93) 26% (64) 15% (38) 250Biden Job Strongly Disapprove 2% (16) 3% (26) 6% (43) 86% (675) 3% (21) 781Favorable of Biden 34% (305) 44% (395) 9% (84) 2% (22) 11% (94) 899Unfavorable of Biden 2% (19) 6% (57) 14% (145) 72% (739) 7% (72) 1032Very Favorable of Biden 55% (259) 35% (166) 5% (22) 1% (3) 4% (20) 470Somewhat Favorable of Biden 11% (45) 53% (229) 14% (61) 4% (19) 17% (75) 429Somewhat Unfavorable of Biden 3% (7) 15% (37) 36% (89) 27% (66) 19% (47) 246Very Unfavorable of Biden 2% (12) 3% (20) 7% (57) 86% (673) 3% (24) 786#1 Issue: Economy 15% (115) 20% (145) 14% (106) 41% (306) 9% (70) 742#1 Issue: Security 6% (25) 9% (37) 7% (30) 73% (298) 5% (19) 409#1 Issue: Health Care 27% (66) 39% (97) 10% (24) 10% (25) 14% (36) 248#1 Issue: Medicare / Social Security 27% (57) 29% (60) 9% (19) 27% (57) 8% (16) 209#1 Issue: Women’s Issues 23% (26) 38% (42) 13% (14) 11% (12) 15% (17) 111#1 Issue: Education 13% (9) 22% (16) 19% (13) 20% (14) 27% (20) 72#1 Issue: Energy 16% (14) 36% (32) 21% (19) 12% (10) 16% (14) 90#1 Issue: Other 20% (23) 20% (23) 8% (9) 38% (44) 15% (18) 1172020 Vote: Joe Biden 31% (291) 40% (382) 13% (119) 5% (49) 11% (104) 9462020 Vote: Donald Trump 3% (29) 5% (45) 10% (89) 76% (654) 5% (46) 8642020 Vote: Didn’t Vote 8% (13) 15% (23) 10% (16) 33% (51) 33% (50) 1532018 House Vote: Democrat 33% (239) 40% (293) 12% (86) 8% (56) 8% (60) 7342018 House Vote: Republican 4% (26) 8% (58) 11% (78) 73% (528) 4% (28) 7192018 House Vote: Someone else 9% (5) 11% (6) 20% (11) 35% (19) 25% (13) 532016 Vote: Hillary Clinton 32% (229) 41% (286) 11% (78) 7% (48) 9% (64) 7062016 Vote: Donald Trump 4% (35) 7% (59) 11% (90) 73% (585) 5% (37) 8052016 Vote: Other 11% (10) 30% (26) 16% (14) 30% (26) 12% (11) 872016 Vote: Didn’t Vote 16% (63) 20% (81) 13% (52) 27% (106) 24% (97) 399Voted in 2014: Yes 17% (229) 24% (323) 11% (142) 42% (553) 6% (77) 1324Voted in 2014: No 16% (107) 19% (130) 14% (92) 32% (214) 20% (132) 674
Continued on next page

66
Morning ConsultTable POL3_9
Table POL3_9: Do you approve or disapprove of how President Biden is handling each of the following?National security
DemographicStronglyapprove
Somewhatapprove
Somewhatdisapprove
Stronglydisapprove
Don’t Know /No Opinion Total N
Registered Voters 17% (336) 23% (453) 12% (234) 38% (766) 10% (208) 19984-Region: Northeast 19% (67) 25% (90) 13% (47) 32% (112) 10% (36) 3534-Region: Midwest 16% (70) 22% (98) 14% (63) 39% (172) 9% (40) 4444-Region: South 16% (122) 20% (148) 10% (74) 44% (325) 10% (77) 7464-Region: West 17% (76) 26% (117) 11% (51) 34% (156) 12% (55) 455Party: Democrat/Leans Democrat 31% (271) 39% (344) 12% (107) 6% (56) 11% (99) 877Party: Republican/Leans Republican 5% (39) 8% (65) 11% (89) 71% (582) 6% (47) 822Note: Row proportions may total to larger than one-hundred percent due to rounding. For more information visit MorningConsultIntelligence.com.

National Tracking Poll #2110009, October, 2021
67
Table POL3_10
Table POL3_10: Do you approve or disapprove of how President Biden is handling each of the following?Gun policy
DemographicStronglyapprove
Somewhatapprove
Somewhatdisapprove
Stronglydisapprove
Don’t Know /No Opinion Total N
Registered Voters 14% (280) 20% (392) 13% (264) 38% (750) 16% (312) 1998Gender: Male 16% (152) 19% (179) 14% (129) 40% (378) 11% (105) 942Gender: Female 12% (129) 20% (213) 13% (135) 35% (372) 20% (208) 1056Age: 18-34 13% (65) 18% (94) 13% (67) 34% (172) 22% (116) 514Age: 35-44 16% (50) 20% (62) 16% (50) 31% (94) 17% (51) 307Age: 45-64 14% (93) 19% (132) 11% (75) 42% (288) 13% (91) 679Age: 65+ 15% (72) 21% (104) 14% (71) 39% (195) 11% (55) 497GenZers: 1997-2012 13% (20) 11% (17) 13% (20) 31% (46) 31% (46) 148Millennials: 1981-1996 13% (73) 20% (113) 15% (85) 33% (182) 18% (103) 556GenXers: 1965-1980 16% (74) 22% (101) 11% (52) 37% (171) 15% (70) 468Baby Boomers: 1946-1964 14% (101) 19% (137) 14% (98) 42% (307) 11% (80) 723PID: Dem (no lean) 27% (204) 36% (265) 12% (90) 8% (63) 16% (123) 745PID: Ind (no lean) 8% (47) 16% (88) 16% (91) 36% (204) 23% (130) 559PID: Rep (no lean) 4% (30) 6% (39) 12% (83) 70% (482) 9% (59) 694PID/Gender: DemMen 32% (114) 34% (119) 14% (50) 11% (38) 9% (33) 355PID/Gender: DemWomen 23% (90) 37% (145) 10% (40) 6% (25) 23% (90) 390PID/Gender: Ind Men 7% (20) 13% (38) 17% (48) 44% (125) 20% (57) 288PID/Gender: Ind Women 10% (27) 19% (50) 16% (43) 29% (79) 27% (73) 271PID/Gender: Rep Men 6% (18) 7% (22) 10% (31) 72% (214) 5% (15) 299PID/Gender: Rep Women 3% (12) 4% (17) 13% (53) 68% (268) 11% (45) 395Ideo: Liberal (1-3) 29% (162) 35% (195) 11% (62) 7% (40) 17% (93) 553Ideo: Moderate (4) 14% (76) 24% (129) 17% (90) 25% (137) 20% (106) 538Ideo: Conservative (5-7) 5% (40) 6% (50) 12% (96) 69% (543) 8% (63) 793Educ: < College 13% (155) 18% (214) 12% (147) 40% (485) 17% (205) 1206Educ: Bachelors degree 14% (72) 21% (106) 15% (76) 36% (181) 13% (65) 501Educ: Post-grad 18% (53) 25% (71) 14% (41) 29% (83) 14% (42) 290Income: Under 50k 14% (122) 18% (159) 14% (126) 35% (307) 19% (169) 882Income: 50k-100k 13% (92) 20% (144) 13% (93) 43% (309) 12% (86) 723Income: 100k+ 17% (67) 23% (89) 11% (45) 34% (134) 15% (58) 392Ethnicity: White 13% (196) 18% (281) 13% (198) 42% (653) 14% (217) 1545Ethnicity: Hispanic 13% (29) 21% (47) 15% (34) 37% (81) 14% (31) 222
Continued on next page

68
Morning ConsultTable POL3_10
Table POL3_10: Do you approve or disapprove of how President Biden is handling each of the following?Gun policy
DemographicStronglyapprove
Somewhatapprove
Somewhatdisapprove
Stronglydisapprove
Don’t Know /No Opinion Total N
Registered Voters 14% (280) 20% (392) 13% (264) 38% (750) 16% (312) 1998Ethnicity: Black 28% (71) 27% (69) 12% (30) 11% (27) 22% (56) 253Ethnicity: Other 7% (14) 21% (42) 18% (36) 35% (69) 20% (39) 200All Christian 13% (133) 19% (194) 14% (142) 42% (434) 12% (122) 1025All Non-Christian 23% (24) 31% (33) 15% (16) 15% (16) 16% (16) 105Atheist 22% (21) 23% (22) 15% (14) 23% (22) 17% (16) 95Agnostic/Nothing in particular 13% (60) 21% (102) 12% (58) 30% (142) 24% (112) 474Something Else 14% (42) 14% (41) 12% (35) 45% (135) 15% (46) 299Religious Non-Protestant/Catholic 21% (27) 26% (34) 16% (20) 23% (29) 14% (18) 128Evangelical 11% (62) 14% (79) 10% (57) 51% (287) 13% (73) 558Non-Evangelical 15% (108) 21% (153) 16% (113) 36% (261) 13% (92) 727Community: Urban 22% (100) 25% (113) 12% (57) 25% (114) 16% (73) 457Community: Suburban 13% (126) 20% (204) 13% (136) 38% (389) 15% (155) 1010Community: Rural 10% (54) 14% (75) 13% (71) 46% (246) 16% (84) 531Employ: Private Sector 13% (87) 24% (164) 16% (111) 34% (237) 13% (87) 687Employ: Government 14% (19) 16% (21) 12% (17) 38% (50) 20% (26) 133Employ: Self-Employed 19% (35) 14% (26) 10% (18) 41% (75) 17% (31) 185Employ: Homemaker 7% (12) 14% (23) 11% (17) 47% (75) 21% (33) 160Employ: Student 2% (1) 21% (13) 17% (11) 24% (14) 37% (22) 61Employ: Retired 15% (76) 20% (104) 14% (70) 41% (208) 10% (51) 509Employ: Unemployed 17% (28) 13% (21) 8% (14) 39% (64) 23% (38) 165Employ: Other 23% (23) 20% (20) 7% (7) 26% (25) 23% (23) 97Military HH: Yes 11% (43) 15% (56) 16% (61) 42% (156) 16% (59) 375Military HH: No 15% (238) 21% (335) 13% (203) 37% (594) 16% (253) 1623RD/WT: Right Direction 31% (229) 38% (283) 12% (86) 6% (42) 14% (106) 745RD/WT: Wrong Track 4% (51) 9% (109) 14% (178) 57% (708) 16% (206) 1253Biden Job Approve 29% (260) 38% (334) 13% (115) 4% (40) 16% (141) 890Biden Job Disapprove 2% (18) 5% (52) 14% (143) 68% (703) 11% (114) 1031
Continued on next page
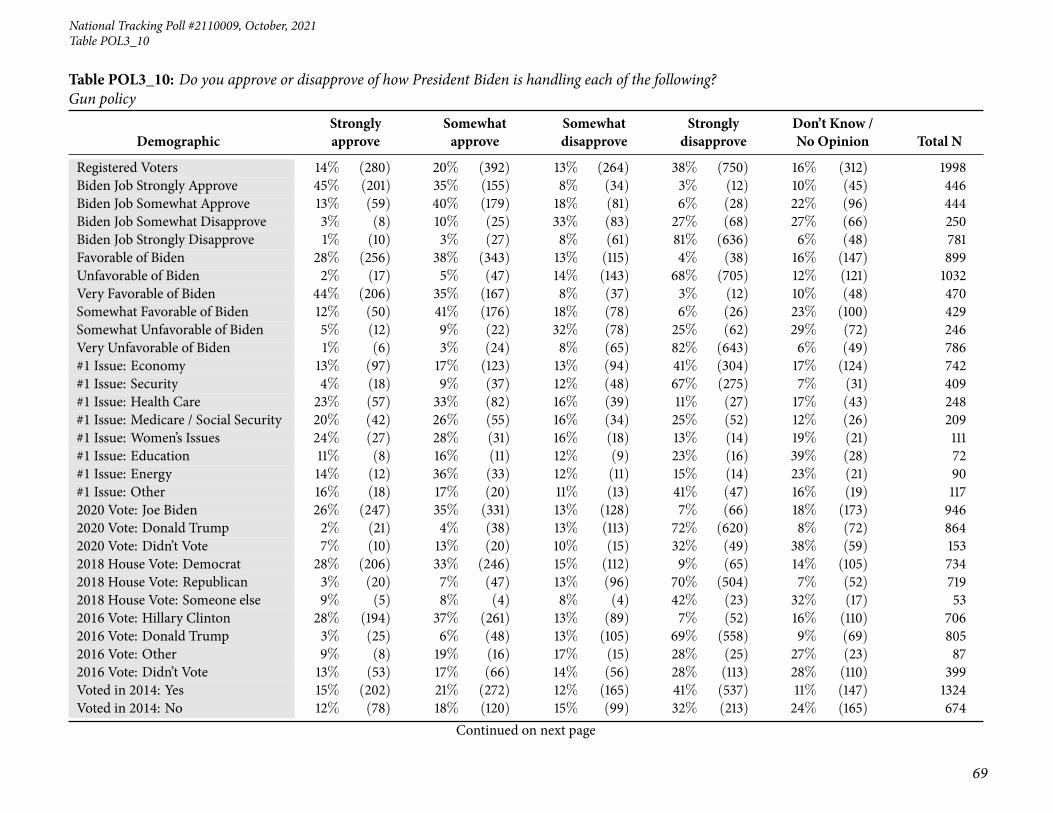
National Tracking Poll #2110009, October, 2021
69
Table POL3_10
Table POL3_10: Do you approve or disapprove of how President Biden is handling each of the following?Gun policy
DemographicStronglyapprove
Somewhatapprove
Somewhatdisapprove
Stronglydisapprove
Don’t Know /No Opinion Total N
Registered Voters 14% (280) 20% (392) 13% (264) 38% (750) 16% (312) 1998Biden Job Strongly Approve 45% (201) 35% (155) 8% (34) 3% (12) 10% (45) 446Biden Job Somewhat Approve 13% (59) 40% (179) 18% (81) 6% (28) 22% (96) 444Biden Job Somewhat Disapprove 3% (8) 10% (25) 33% (83) 27% (68) 27% (66) 250Biden Job Strongly Disapprove 1% (10) 3% (27) 8% (61) 81% (636) 6% (48) 781Favorable of Biden 28% (256) 38% (343) 13% (115) 4% (38) 16% (147) 899Unfavorable of Biden 2% (17) 5% (47) 14% (143) 68% (705) 12% (121) 1032Very Favorable of Biden 44% (206) 35% (167) 8% (37) 3% (12) 10% (48) 470Somewhat Favorable of Biden 12% (50) 41% (176) 18% (78) 6% (26) 23% (100) 429Somewhat Unfavorable of Biden 5% (12) 9% (22) 32% (78) 25% (62) 29% (72) 246Very Unfavorable of Biden 1% (6) 3% (24) 8% (65) 82% (643) 6% (49) 786#1 Issue: Economy 13% (97) 17% (123) 13% (94) 41% (304) 17% (124) 742#1 Issue: Security 4% (18) 9% (37) 12% (48) 67% (275) 7% (31) 409#1 Issue: Health Care 23% (57) 33% (82) 16% (39) 11% (27) 17% (43) 248#1 Issue: Medicare / Social Security 20% (42) 26% (55) 16% (34) 25% (52) 12% (26) 209#1 Issue: Women’s Issues 24% (27) 28% (31) 16% (18) 13% (14) 19% (21) 111#1 Issue: Education 11% (8) 16% (11) 12% (9) 23% (16) 39% (28) 72#1 Issue: Energy 14% (12) 36% (33) 12% (11) 15% (14) 23% (21) 90#1 Issue: Other 16% (18) 17% (20) 11% (13) 41% (47) 16% (19) 1172020 Vote: Joe Biden 26% (247) 35% (331) 13% (128) 7% (66) 18% (173) 9462020 Vote: Donald Trump 2% (21) 4% (38) 13% (113) 72% (620) 8% (72) 8642020 Vote: Didn’t Vote 7% (10) 13% (20) 10% (15) 32% (49) 38% (59) 1532018 House Vote: Democrat 28% (206) 33% (246) 15% (112) 9% (65) 14% (105) 7342018 House Vote: Republican 3% (20) 7% (47) 13% (96) 70% (504) 7% (52) 7192018 House Vote: Someone else 9% (5) 8% (4) 8% (4) 42% (23) 32% (17) 532016 Vote: Hillary Clinton 28% (194) 37% (261) 13% (89) 7% (52) 16% (110) 7062016 Vote: Donald Trump 3% (25) 6% (48) 13% (105) 69% (558) 9% (69) 8052016 Vote: Other 9% (8) 19% (16) 17% (15) 28% (25) 27% (23) 872016 Vote: Didn’t Vote 13% (53) 17% (66) 14% (56) 28% (113) 28% (110) 399Voted in 2014: Yes 15% (202) 21% (272) 12% (165) 41% (537) 11% (147) 1324Voted in 2014: No 12% (78) 18% (120) 15% (99) 32% (213) 24% (165) 674
Continued on next page
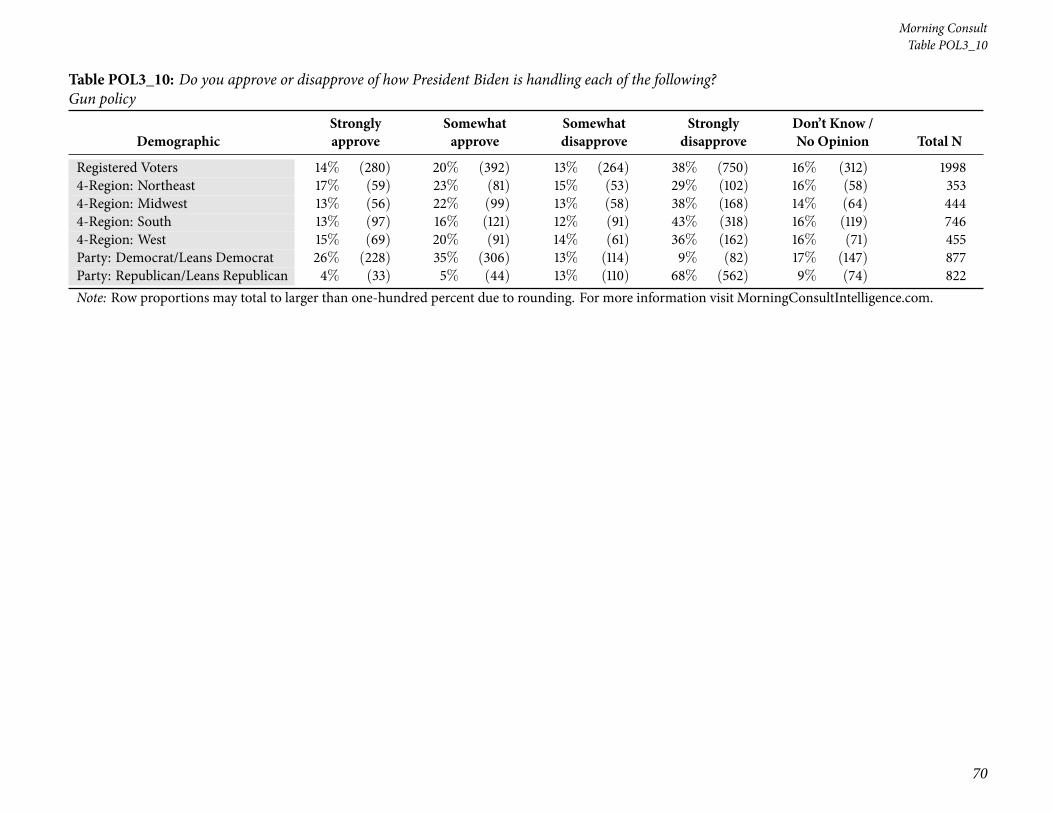
70
Morning ConsultTable POL3_10
Table POL3_10: Do you approve or disapprove of how President Biden is handling each of the following?Gun policy
DemographicStronglyapprove
Somewhatapprove
Somewhatdisapprove
Stronglydisapprove
Don’t Know /No Opinion Total N
Registered Voters 14% (280) 20% (392) 13% (264) 38% (750) 16% (312) 19984-Region: Northeast 17% (59) 23% (81) 15% (53) 29% (102) 16% (58) 3534-Region: Midwest 13% (56) 22% (99) 13% (58) 38% (168) 14% (64) 4444-Region: South 13% (97) 16% (121) 12% (91) 43% (318) 16% (119) 7464-Region: West 15% (69) 20% (91) 14% (61) 36% (162) 16% (71) 455Party: Democrat/Leans Democrat 26% (228) 35% (306) 13% (114) 9% (82) 17% (147) 877Party: Republican/Leans Republican 4% (33) 5% (44) 13% (110) 68% (562) 9% (74) 822Note: Row proportions may total to larger than one-hundred percent due to rounding. For more information visit MorningConsultIntelligence.com.

National Tracking Poll #2110009, October, 2021
71
Table POL3_11
Table POL3_11: Do you approve or disapprove of how President Biden is handling each of the following?Protecting Medicare and Social Security
DemographicStronglyapprove
Somewhatapprove
Somewhatdisapprove
Stronglydisapprove
Don’t Know /No Opinion Total N
Registered Voters 19% (384) 23% (464) 10% (210) 32% (630) 16% (310) 1998Gender: Male 22% (208) 24% (225) 10% (91) 32% (306) 12% (113) 942Gender: Female 17% (177) 23% (239) 11% (119) 31% (325) 19% (197) 1056Age: 18-34 16% (85) 26% (134) 10% (50) 25% (127) 23% (119) 514Age: 35-44 20% (62) 26% (79) 11% (33) 28% (85) 15% (47) 307Age: 45-64 19% (127) 23% (153) 10% (70) 36% (247) 12% (83) 679Age: 65+ 22% (111) 20% (98) 11% (56) 35% (172) 12% (61) 497GenZers: 1997-2012 13% (20) 20% (30) 15% (22) 18% (26) 34% (50) 148Millennials: 1981-1996 19% (104) 27% (150) 9% (48) 28% (154) 18% (100) 556GenXers: 1965-1980 20% (94) 24% (113) 8% (38) 34% (159) 14% (63) 468Baby Boomers: 1946-1964 20% (144) 20% (147) 13% (92) 35% (253) 12% (87) 723PID: Dem (no lean) 40% (294) 35% (259) 7% (49) 5% (37) 14% (106) 745PID: Ind (no lean) 10% (54) 25% (140) 11% (63) 31% (171) 23% (131) 559PID: Rep (no lean) 5% (36) 9% (65) 14% (97) 61% (423) 11% (73) 694PID/Gender: DemMen 46% (162) 31% (111) 7% (23) 8% (28) 9% (30) 355PID/Gender: DemWomen 34% (132) 38% (147) 7% (26) 2% (9) 19% (75) 390PID/Gender: Ind Men 10% (29) 28% (81) 9% (25) 35% (99) 19% (54) 288PID/Gender: Ind Women 9% (26) 22% (59) 14% (38) 26% (71) 29% (77) 271PID/Gender: Rep Men 6% (17) 11% (32) 14% (42) 60% (178) 10% (28) 299PID/Gender: Rep Women 5% (19) 8% (33) 14% (55) 62% (245) 11% (45) 395Ideo: Liberal (1-3) 40% (223) 36% (197) 6% (34) 4% (23) 14% (76) 553Ideo: Moderate (4) 21% (111) 32% (171) 11% (58) 21% (115) 15% (83) 538Ideo: Conservative (5-7) 5% (41) 11% (83) 13% (107) 59% (470) 12% (92) 793Educ: < College 18% (220) 21% (254) 11% (131) 33% (401) 17% (200) 1206Educ: Bachelors degree 19% (95) 25% (125) 11% (53) 31% (155) 15% (73) 501Educ: Post-grad 24% (69) 29% (85) 9% (26) 25% (74) 13% (37) 290Income: Under 50k 19% (168) 21% (187) 12% (104) 30% (263) 18% (161) 882Income: 50k-100k 18% (127) 25% (181) 8% (61) 36% (259) 13% (95) 723Income: 100k+ 23% (89) 25% (97) 11% (44) 28% (109) 14% (54) 392Ethnicity: White 18% (271) 21% (327) 11% (172) 36% (549) 15% (227) 1545Ethnicity: Hispanic 21% (47) 22% (48) 10% (22) 28% (63) 19% (42) 222
Continued on next page

72
Morning ConsultTable POL3_11
Table POL3_11: Do you approve or disapprove of how President Biden is handling each of the following?Protecting Medicare and Social Security
DemographicStronglyapprove
Somewhatapprove
Somewhatdisapprove
Stronglydisapprove
Don’t Know /No Opinion Total N
Registered Voters 19% (384) 23% (464) 10% (210) 32% (630) 16% (310) 1998Ethnicity: Black 37% (93) 31% (79) 4% (10) 9% (24) 19% (47) 253Ethnicity: Other 10% (20) 29% (58) 14% (28) 29% (58) 18% (36) 200All Christian 17% (176) 21% (220) 11% (116) 37% (383) 13% (130) 1025All Non-Christian 30% (31) 39% (41) 8% (8) 13% (13) 10% (11) 105Atheist 29% (27) 32% (30) 6% (6) 18% (17) 15% (14) 95Agnostic/Nothing in particular 19% (89) 26% (122) 10% (49) 23% (110) 22% (105) 474Something Else 20% (61) 17% (51) 10% (30) 36% (107) 17% (50) 299Religious Non-Protestant/Catholic 26% (34) 34% (44) 12% (15) 19% (24) 9% (11) 128Evangelical 15% (85) 18% (98) 9% (51) 43% (240) 15% (84) 558Non-Evangelical 20% (146) 23% (168) 12% (88) 32% (232) 13% (93) 727Community: Urban 30% (137) 26% (119) 10% (48) 19% (87) 14% (65) 457Community: Suburban 17% (169) 25% (257) 11% (112) 31% (318) 15% (154) 1010Community: Rural 15% (78) 17% (88) 9% (49) 42% (225) 17% (91) 531Employ: Private Sector 19% (128) 30% (203) 9% (60) 29% (197) 14% (99) 687Employ: Government 12% (15) 21% (28) 19% (25) 27% (36) 22% (29) 133Employ: Self-Employed 24% (45) 16% (30) 9% (16) 37% (69) 14% (26) 185Employ: Homemaker 8% (13) 21% (34) 12% (19) 44% (71) 15% (24) 160Employ: Student 7% (5) 33% (20) 13% (8) 13% (8) 34% (21) 61Employ: Retired 24% (122) 19% (96) 11% (55) 35% (179) 11% (58) 509Employ: Unemployed 18% (30) 19% (31) 11% (18) 32% (52) 20% (33) 165Employ: Other 27% (27) 23% (23) 8% (8) 20% (19) 21% (21) 97Military HH: Yes 19% (70) 19% (70) 13% (47) 36% (135) 14% (53) 375Military HH: No 19% (315) 24% (394) 10% (163) 30% (495) 16% (257) 1623RD/WT: Right Direction 41% (302) 39% (287) 6% (44) 3% (23) 12% (89) 745RD/WT: Wrong Track 7% (82) 14% (177) 13% (165) 49% (608) 18% (221) 1253Biden Job Approve 39% (346) 41% (366) 5% (44) 2% (17) 13% (117) 890Biden Job Disapprove 3% (32) 9% (88) 16% (162) 59% (613) 13% (136) 1031
Continued on next page

National Tracking Poll #2110009, October, 2021
73
Table POL3_11
Table POL3_11: Do you approve or disapprove of how President Biden is handling each of the following?Protecting Medicare and Social Security
DemographicStronglyapprove
Somewhatapprove
Somewhatdisapprove
Stronglydisapprove
Don’t Know /No Opinion Total N
Registered Voters 19% (384) 23% (464) 10% (210) 32% (630) 16% (310) 1998Biden Job Strongly Approve 62% (278) 28% (124) 2% (8) 1% (5) 7% (32) 446Biden Job Somewhat Approve 15% (68) 55% (242) 8% (36) 3% (12) 19% (85) 444Biden Job Somewhat Disapprove 5% (13) 22% (55) 30% (75) 21% (52) 22% (54) 250Biden Job Strongly Disapprove 2% (18) 4% (33) 11% (87) 72% (561) 11% (82) 781Favorable of Biden 39% (349) 42% (375) 5% (46) 1% (13) 13% (116) 899Unfavorable of Biden 2% (24) 9% (88) 15% (159) 59% (612) 14% (149) 1032Very Favorable of Biden 63% (294) 27% (129) 3% (12) 1% (3) 7% (33) 470Somewhat Favorable of Biden 13% (55) 57% (246) 8% (34) 2% (10) 20% (84) 429Somewhat Unfavorable of Biden 5% (13) 22% (54) 29% (70) 17% (43) 27% (66) 246Very Unfavorable of Biden 1% (12) 4% (35) 11% (89) 72% (569) 10% (82) 786#1 Issue: Economy 18% (132) 21% (154) 12% (91) 34% (251) 16% (115) 742#1 Issue: Security 5% (20) 14% (56) 11% (47) 58% (238) 12% (48) 409#1 Issue: Health Care 30% (74) 38% (94) 6% (16) 10% (24) 16% (39) 248#1 Issue: Medicare / Social Security 32% (67) 26% (54) 9% (20) 23% (48) 10% (20) 209#1 Issue: Women’s Issues 27% (30) 43% (47) 6% (7) 5% (6) 18% (21) 111#1 Issue: Education 17% (12) 18% (13) 10% (7) 24% (17) 32% (23) 72#1 Issue: Energy 22% (20) 34% (30) 15% (14) 12% (11) 17% (15) 90#1 Issue: Other 25% (29) 14% (17) 8% (9) 30% (35) 23% (27) 1172020 Vote: Joe Biden 36% (341) 38% (364) 6% (58) 4% (34) 16% (149) 9462020 Vote: Donald Trump 3% (27) 8% (66) 15% (127) 64% (550) 11% (93) 8642020 Vote: Didn’t Vote 8% (13) 18% (27) 12% (18) 24% (37) 38% (58) 1532018 House Vote: Democrat 38% (281) 37% (270) 6% (44) 6% (40) 14% (99) 7342018 House Vote: Republican 3% (25) 11% (77) 14% (101) 63% (451) 9% (65) 7192018 House Vote: Someone else 5% (2) 22% (12) 18% (10) 34% (18) 22% (12) 532016 Vote: Hillary Clinton 37% (262) 39% (272) 5% (38) 5% (36) 14% (98) 7062016 Vote: Donald Trump 5% (37) 10% (78) 13% (108) 62% (498) 10% (83) 8052016 Vote: Other 17% (15) 30% (26) 17% (15) 22% (19) 14% (12) 872016 Vote: Didn’t Vote 17% (70) 22% (88) 12% (48) 19% (77) 29% (117) 399Voted in 2014: Yes 20% (265) 23% (310) 11% (146) 35% (458) 11% (144) 1324Voted in 2014: No 18% (119) 23% (154) 9% (64) 25% (172) 25% (165) 674
Continued on next page

74
Morning ConsultTable POL3_11
Table POL3_11: Do you approve or disapprove of how President Biden is handling each of the following?Protecting Medicare and Social Security
DemographicStronglyapprove
Somewhatapprove
Somewhatdisapprove
Stronglydisapprove
Don’t Know /No Opinion Total N
Registered Voters 19% (384) 23% (464) 10% (210) 32% (630) 16% (310) 19984-Region: Northeast 19% (68) 27% (96) 12% (43) 25% (88) 16% (58) 3534-Region: Midwest 20% (90) 22% (96) 11% (47) 34% (150) 14% (61) 4444-Region: South 18% (137) 20% (150) 9% (70) 36% (268) 16% (121) 7464-Region: West 19% (89) 27% (122) 11% (50) 27% (125) 15% (70) 455Party: Democrat/Leans Democrat 37% (323) 36% (318) 7% (61) 5% (45) 15% (131) 877Party: Republican/Leans Republican 5% (37) 10% (84) 14% (115) 60% (489) 12% (96) 822Note: Row proportions may total to larger than one-hundred percent due to rounding. For more information visit MorningConsultIntelligence.com.

National Tracking Poll #2110009, October, 2021
75
Table POL3_12
Table POL3_12: Do you approve or disapprove of how President Biden is handling each of the following?Coronavirus
DemographicStronglyapprove
Somewhatapprove
Somewhatdisapprove
Stronglydisapprove
Don’t Know /No Opinion Total N
Registered Voters 27% (547) 22% (435) 12% (231) 34% (675) 6% (110) 1998Gender: Male 30% (284) 20% (187) 11% (99) 35% (331) 4% (40) 942Gender: Female 25% (263) 23% (248) 12% (132) 33% (344) 7% (70) 1056Age: 18-34 18% (91) 27% (140) 16% (81) 29% (147) 11% (56) 514Age: 35-44 25% (77) 26% (81) 9% (28) 33% (100) 7% (21) 307Age: 45-64 29% (200) 18% (124) 11% (74) 38% (257) 4% (25) 679Age: 65+ 36% (179) 18% (91) 10% (49) 34% (171) 2% (8) 497GenZers: 1997-2012 17% (25) 32% (48) 19% (28) 16% (24) 16% (24) 148Millennials: 1981-1996 19% (107) 25% (141) 13% (75) 33% (185) 9% (48) 556GenXers: 1965-1980 31% (147) 20% (94) 9% (44) 34% (157) 5% (25) 468Baby Boomers: 1946-1964 32% (231) 18% (131) 11% (78) 38% (272) 2% (12) 723PID: Dem (no lean) 54% (403) 28% (207) 8% (61) 5% (38) 5% (36) 745PID: Ind (no lean) 19% (106) 25% (140) 13% (75) 34% (188) 9% (51) 559PID: Rep (no lean) 6% (39) 13% (87) 14% (95) 65% (449) 3% (23) 694PID/Gender: DemMen 58% (207) 23% (82) 10% (35) 6% (21) 3% (9) 355PID/Gender: DemWomen 50% (196) 32% (125) 7% (26) 4% (17) 7% (26) 390PID/Gender: Ind Men 20% (58) 23% (65) 10% (29) 38% (110) 9% (26) 288PID/Gender: Ind Women 17% (47) 28% (75) 17% (46) 29% (78) 9% (26) 271PID/Gender: Rep Men 6% (19) 13% (40) 12% (35) 67% (200) 2% (5) 299PID/Gender: Rep Women 5% (20) 12% (48) 15% (60) 63% (250) 4% (18) 395Ideo: Liberal (1-3) 57% (314) 29% (160) 6% (34) 5% (29) 3% (15) 553Ideo: Moderate (4) 30% (161) 30% (162) 13% (71) 23% (123) 4% (22) 538Ideo: Conservative (5-7) 8% (62) 13% (101) 14% (109) 62% (491) 4% (29) 793Educ: < College 25% (304) 20% (240) 12% (146) 36% (437) 7% (80) 1206Educ: Bachelors degree 26% (130) 26% (130) 12% (62) 32% (161) 4% (18) 501Educ: Post-grad 39% (113) 22% (65) 8% (23) 27% (77) 4% (12) 290Income: Under 50k 27% (242) 20% (178) 13% (111) 32% (282) 8% (69) 882Income: 50k-100k 27% (192) 21% (152) 10% (71) 39% (284) 3% (25) 723Income: 100k+ 29% (113) 27% (105) 13% (49) 28% (109) 4% (17) 392Ethnicity: White 25% (386) 21% (323) 12% (183) 38% (585) 4% (68) 1545Ethnicity: Hispanic 23% (50) 26% (58) 11% (25) 32% (72) 8% (17) 222
Continued on next page

76
Morning ConsultTable POL3_12
Table POL3_12: Do you approve or disapprove of how President Biden is handling each of the following?Coronavirus
DemographicStronglyapprove
Somewhatapprove
Somewhatdisapprove
Stronglydisapprove
Don’t Know /No Opinion Total N
Registered Voters 27% (547) 22% (435) 12% (231) 34% (675) 6% (110) 1998Ethnicity: Black 50% (125) 22% (56) 7% (18) 11% (27) 10% (26) 253Ethnicity: Other 18% (36) 28% (55) 15% (30) 32% (64) 8% (15) 200All Christian 26% (270) 21% (213) 11% (115) 38% (388) 4% (40) 1025All Non-Christian 45% (47) 23% (24) 12% (12) 17% (18) 4% (4) 105Atheist 33% (31) 34% (32) 10% (10) 21% (20) 2% (2) 95Agnostic/Nothing in particular 27% (126) 25% (118) 12% (58) 27% (129) 9% (44) 474Something Else 25% (74) 16% (48) 12% (36) 40% (120) 7% (21) 299Religious Non-Protestant/Catholic 38% (49) 21% (27) 13% (17) 24% (31) 3% (4) 128Evangelical 20% (114) 17% (95) 11% (64) 45% (253) 6% (32) 558Non-Evangelical 31% (226) 22% (160) 11% (82) 32% (231) 4% (28) 727Community: Urban 37% (171) 26% (119) 9% (40) 21% (94) 7% (33) 457Community: Suburban 26% (267) 22% (226) 14% (139) 34% (339) 4% (38) 1010Community: Rural 20% (109) 17% (90) 10% (52) 46% (242) 7% (39) 531Employ: Private Sector 26% (179) 28% (192) 8% (55) 33% (227) 5% (34) 687Employ: Government 18% (23) 24% (31) 21% (28) 28% (38) 10% (13) 133Employ: Self-Employed 28% (53) 14% (25) 11% (21) 40% (74) 7% (13) 185Employ: Homemaker 16% (26) 16% (26) 17% (27) 44% (71) 7% (11) 160Employ: Student 14% (9) 45% (28) 12% (7) 15% (9) 13% (8) 61Employ: Retired 35% (177) 18% (89) 11% (56) 35% (179) 2% (8) 509Employ: Unemployed 27% (45) 16% (26) 17% (27) 32% (53) 8% (14) 165Employ: Other 36% (35) 17% (17) 10% (10) 26% (25) 11% (10) 97Military HH: Yes 27% (101) 17% (64) 12% (45) 39% (148) 5% (17) 375Military HH: No 28% (447) 23% (371) 11% (186) 32% (527) 6% (93) 1623RD/WT: Right Direction 58% (429) 30% (226) 5% (37) 2% (19) 5% (34) 745RD/WT: Wrong Track 9% (118) 17% (209) 15% (194) 52% (656) 6% (76) 1253Biden Job Approve 56% (503) 32% (287) 5% (47) 2% (17) 4% (37) 890Biden Job Disapprove 4% (40) 12% (127) 17% (179) 63% (650) 3% (35) 1031
Continued on next page
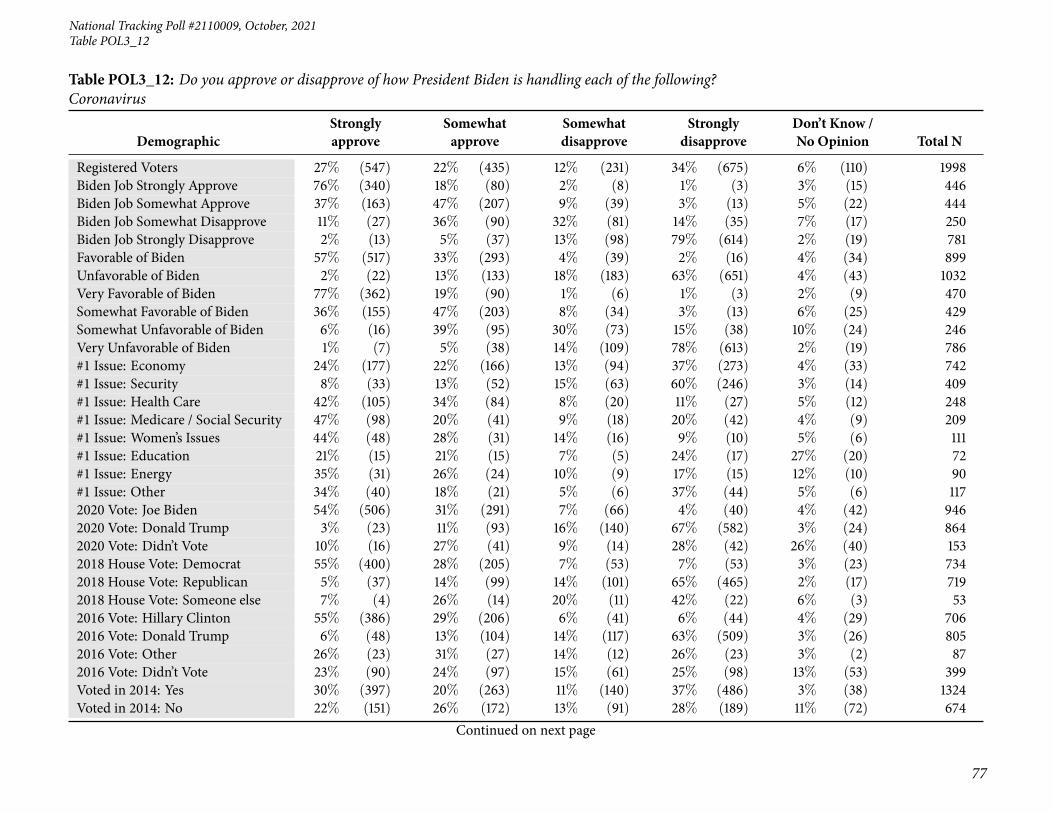
National Tracking Poll #2110009, October, 2021
77
Table POL3_12
Table POL3_12: Do you approve or disapprove of how President Biden is handling each of the following?Coronavirus
DemographicStronglyapprove
Somewhatapprove
Somewhatdisapprove
Stronglydisapprove
Don’t Know /No Opinion Total N
Registered Voters 27% (547) 22% (435) 12% (231) 34% (675) 6% (110) 1998Biden Job Strongly Approve 76% (340) 18% (80) 2% (8) 1% (3) 3% (15) 446Biden Job Somewhat Approve 37% (163) 47% (207) 9% (39) 3% (13) 5% (22) 444Biden Job Somewhat Disapprove 11% (27) 36% (90) 32% (81) 14% (35) 7% (17) 250Biden Job Strongly Disapprove 2% (13) 5% (37) 13% (98) 79% (614) 2% (19) 781Favorable of Biden 57% (517) 33% (293) 4% (39) 2% (16) 4% (34) 899Unfavorable of Biden 2% (22) 13% (133) 18% (183) 63% (651) 4% (43) 1032Very Favorable of Biden 77% (362) 19% (90) 1% (6) 1% (3) 2% (9) 470Somewhat Favorable of Biden 36% (155) 47% (203) 8% (34) 3% (13) 6% (25) 429Somewhat Unfavorable of Biden 6% (16) 39% (95) 30% (73) 15% (38) 10% (24) 246Very Unfavorable of Biden 1% (7) 5% (38) 14% (109) 78% (613) 2% (19) 786#1 Issue: Economy 24% (177) 22% (166) 13% (94) 37% (273) 4% (33) 742#1 Issue: Security 8% (33) 13% (52) 15% (63) 60% (246) 3% (14) 409#1 Issue: Health Care 42% (105) 34% (84) 8% (20) 11% (27) 5% (12) 248#1 Issue: Medicare / Social Security 47% (98) 20% (41) 9% (18) 20% (42) 4% (9) 209#1 Issue: Women’s Issues 44% (48) 28% (31) 14% (16) 9% (10) 5% (6) 111#1 Issue: Education 21% (15) 21% (15) 7% (5) 24% (17) 27% (20) 72#1 Issue: Energy 35% (31) 26% (24) 10% (9) 17% (15) 12% (10) 90#1 Issue: Other 34% (40) 18% (21) 5% (6) 37% (44) 5% (6) 1172020 Vote: Joe Biden 54% (506) 31% (291) 7% (66) 4% (40) 4% (42) 9462020 Vote: Donald Trump 3% (23) 11% (93) 16% (140) 67% (582) 3% (24) 8642020 Vote: Didn’t Vote 10% (16) 27% (41) 9% (14) 28% (42) 26% (40) 1532018 House Vote: Democrat 55% (400) 28% (205) 7% (53) 7% (53) 3% (23) 7342018 House Vote: Republican 5% (37) 14% (99) 14% (101) 65% (465) 2% (17) 7192018 House Vote: Someone else 7% (4) 26% (14) 20% (11) 42% (22) 6% (3) 532016 Vote: Hillary Clinton 55% (386) 29% (206) 6% (41) 6% (44) 4% (29) 7062016 Vote: Donald Trump 6% (48) 13% (104) 14% (117) 63% (509) 3% (26) 8052016 Vote: Other 26% (23) 31% (27) 14% (12) 26% (23) 3% (2) 872016 Vote: Didn’t Vote 23% (90) 24% (97) 15% (61) 25% (98) 13% (53) 399Voted in 2014: Yes 30% (397) 20% (263) 11% (140) 37% (486) 3% (38) 1324Voted in 2014: No 22% (151) 26% (172) 13% (91) 28% (189) 11% (72) 674
Continued on next page

78
Morning ConsultTable POL3_12
Table POL3_12: Do you approve or disapprove of how President Biden is handling each of the following?Coronavirus
DemographicStronglyapprove
Somewhatapprove
Somewhatdisapprove
Stronglydisapprove
Don’t Know /No Opinion Total N
Registered Voters 27% (547) 22% (435) 12% (231) 34% (675) 6% (110) 19984-Region: Northeast 31% (111) 24% (85) 13% (46) 27% (95) 5% (17) 3534-Region: Midwest 26% (117) 20% (88) 13% (58) 35% (155) 6% (28) 4444-Region: South 25% (185) 20% (151) 11% (83) 38% (283) 6% (44) 7464-Region: West 30% (135) 24% (111) 10% (45) 31% (142) 5% (22) 455Party: Democrat/Leans Democrat 53% (461) 30% (260) 8% (71) 5% (45) 5% (41) 877Party: Republican/Leans Republican 5% (44) 14% (114) 14% (117) 63% (517) 4% (30) 822Note: Row proportions may total to larger than one-hundred percent due to rounding. For more information visit MorningConsultIntelligence.com.

National Tracking Poll #2110009, October, 2021
79
Table POL3_13
Table POL3_13: Do you approve or disapprove of how President Biden is handling each of the following?Voting rights
DemographicStronglyapprove
Somewhatapprove
Somewhatdisapprove
Stronglydisapprove
Don’t Know /No Opinion Total N
Registered Voters 20% (396) 23% (462) 11% (220) 33% (659) 13% (261) 1998Gender: Male 22% (212) 23% (220) 11% (106) 34% (319) 9% (85) 942Gender: Female 17% (184) 23% (241) 11% (114) 32% (340) 17% (176) 1056Age: 18-34 17% (88) 25% (129) 12% (60) 25% (127) 21% (110) 514Age: 35-44 22% (67) 26% (78) 12% (38) 26% (80) 14% (44) 307Age: 45-64 21% (140) 20% (135) 9% (64) 38% (260) 12% (80) 679Age: 65+ 20% (100) 24% (120) 12% (59) 39% (192) 5% (26) 497GenZers: 1997-2012 15% (22) 21% (31) 13% (19) 18% (27) 34% (51) 148Millennials: 1981-1996 20% (109) 26% (143) 12% (64) 27% (150) 16% (90) 556GenXers: 1965-1980 23% (110) 22% (101) 10% (48) 32% (152) 12% (58) 468Baby Boomers: 1946-1964 19% (135) 22% (160) 11% (80) 40% (288) 8% (60) 723PID: Dem (no lean) 40% (294) 37% (273) 8% (63) 5% (35) 11% (80) 745PID: Ind (no lean) 12% (67) 22% (123) 14% (78) 31% (175) 21% (117) 559PID: Rep (no lean) 5% (35) 10% (66) 11% (79) 65% (449) 9% (65) 694PID/Gender: DemMen 45% (158) 35% (124) 10% (35) 6% (20) 5% (17) 355PID/Gender: DemWomen 35% (136) 38% (148) 7% (28) 4% (15) 16% (62) 390PID/Gender: Ind Men 12% (35) 21% (61) 13% (36) 36% (103) 19% (53) 288PID/Gender: Ind Women 12% (32) 23% (62) 15% (41) 27% (73) 23% (63) 271PID/Gender: Rep Men 6% (19) 12% (35) 11% (34) 66% (196) 5% (15) 299PID/Gender: Rep Women 4% (16) 8% (31) 11% (45) 64% (253) 13% (50) 395Ideo: Liberal (1-3) 39% (216) 37% (207) 8% (46) 5% (25) 11% (59) 553Ideo: Moderate (4) 23% (124) 29% (156) 14% (75) 20% (106) 14% (78) 538Ideo: Conservative (5-7) 5% (43) 10% (81) 11% (90) 63% (503) 10% (77) 793Educ: < College 20% (241) 21% (254) 10% (120) 35% (420) 14% (172) 1206Educ: Bachelors degree 19% (95) 23% (114) 12% (62) 33% (164) 13% (67) 501Educ: Post-grad 21% (61) 33% (94) 13% (37) 26% (75) 8% (23) 290Income: Under 50k 21% (182) 23% (203) 10% (91) 31% (273) 15% (133) 882Income: 50k-100k 18% (127) 22% (162) 11% (82) 37% (270) 11% (82) 723Income: 100k+ 22% (87) 25% (97) 12% (47) 29% (115) 12% (46) 392Ethnicity: White 18% (274) 21% (328) 12% (179) 37% (579) 12% (186) 1545Ethnicity: Hispanic 22% (50) 26% (57) 10% (21) 29% (64) 14% (31) 222
Continued on next page
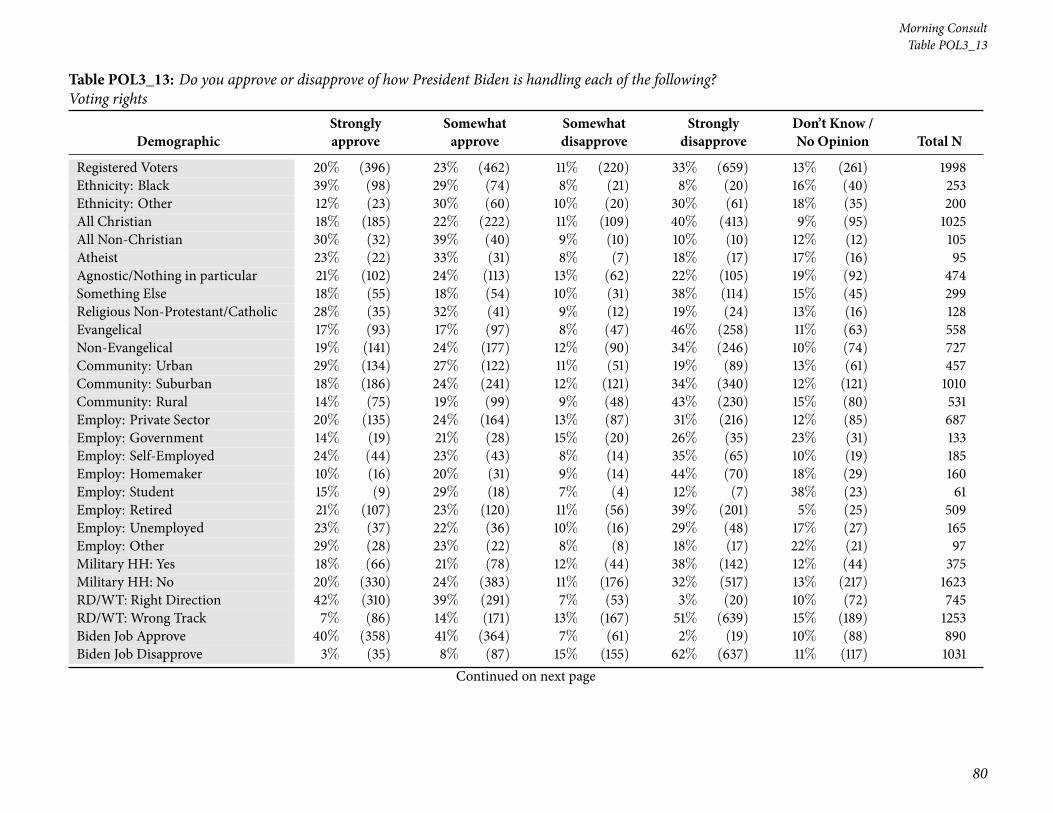
80
Morning ConsultTable POL3_13
Table POL3_13: Do you approve or disapprove of how President Biden is handling each of the following?Voting rights
DemographicStronglyapprove
Somewhatapprove
Somewhatdisapprove
Stronglydisapprove
Don’t Know /No Opinion Total N
Registered Voters 20% (396) 23% (462) 11% (220) 33% (659) 13% (261) 1998Ethnicity: Black 39% (98) 29% (74) 8% (21) 8% (20) 16% (40) 253Ethnicity: Other 12% (23) 30% (60) 10% (20) 30% (61) 18% (35) 200All Christian 18% (185) 22% (222) 11% (109) 40% (413) 9% (95) 1025All Non-Christian 30% (32) 39% (40) 9% (10) 10% (10) 12% (12) 105Atheist 23% (22) 33% (31) 8% (7) 18% (17) 17% (16) 95Agnostic/Nothing in particular 21% (102) 24% (113) 13% (62) 22% (105) 19% (92) 474Something Else 18% (55) 18% (54) 10% (31) 38% (114) 15% (45) 299Religious Non-Protestant/Catholic 28% (35) 32% (41) 9% (12) 19% (24) 13% (16) 128Evangelical 17% (93) 17% (97) 8% (47) 46% (258) 11% (63) 558Non-Evangelical 19% (141) 24% (177) 12% (90) 34% (246) 10% (74) 727Community: Urban 29% (134) 27% (122) 11% (51) 19% (89) 13% (61) 457Community: Suburban 18% (186) 24% (241) 12% (121) 34% (340) 12% (121) 1010Community: Rural 14% (75) 19% (99) 9% (48) 43% (230) 15% (80) 531Employ: Private Sector 20% (135) 24% (164) 13% (87) 31% (216) 12% (85) 687Employ: Government 14% (19) 21% (28) 15% (20) 26% (35) 23% (31) 133Employ: Self-Employed 24% (44) 23% (43) 8% (14) 35% (65) 10% (19) 185Employ: Homemaker 10% (16) 20% (31) 9% (14) 44% (70) 18% (29) 160Employ: Student 15% (9) 29% (18) 7% (4) 12% (7) 38% (23) 61Employ: Retired 21% (107) 23% (120) 11% (56) 39% (201) 5% (25) 509Employ: Unemployed 23% (37) 22% (36) 10% (16) 29% (48) 17% (27) 165Employ: Other 29% (28) 23% (22) 8% (8) 18% (17) 22% (21) 97Military HH: Yes 18% (66) 21% (78) 12% (44) 38% (142) 12% (44) 375Military HH: No 20% (330) 24% (383) 11% (176) 32% (517) 13% (217) 1623RD/WT: Right Direction 42% (310) 39% (291) 7% (53) 3% (20) 10% (72) 745RD/WT: Wrong Track 7% (86) 14% (171) 13% (167) 51% (639) 15% (189) 1253Biden Job Approve 40% (358) 41% (364) 7% (61) 2% (19) 10% (88) 890Biden Job Disapprove 3% (35) 8% (87) 15% (155) 62% (637) 11% (117) 1031
Continued on next page
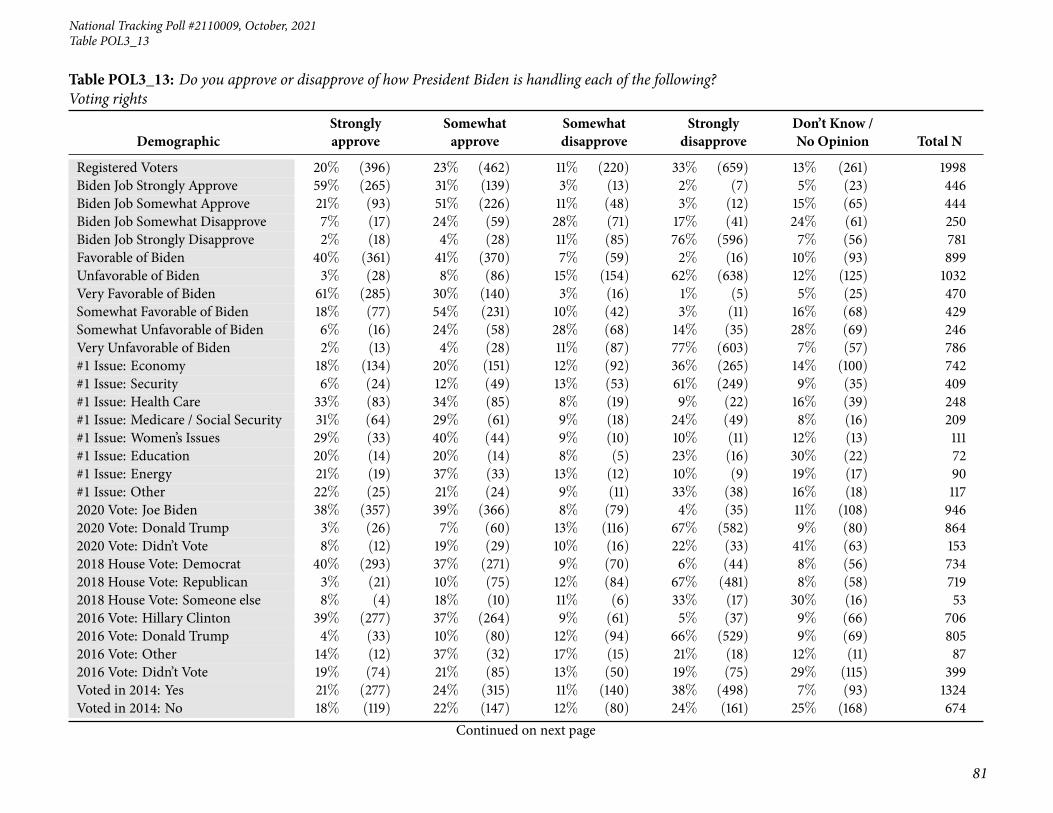
National Tracking Poll #2110009, October, 2021
81
Table POL3_13
Table POL3_13: Do you approve or disapprove of how President Biden is handling each of the following?Voting rights
DemographicStronglyapprove
Somewhatapprove
Somewhatdisapprove
Stronglydisapprove
Don’t Know /No Opinion Total N
Registered Voters 20% (396) 23% (462) 11% (220) 33% (659) 13% (261) 1998Biden Job Strongly Approve 59% (265) 31% (139) 3% (13) 2% (7) 5% (23) 446Biden Job Somewhat Approve 21% (93) 51% (226) 11% (48) 3% (12) 15% (65) 444Biden Job Somewhat Disapprove 7% (17) 24% (59) 28% (71) 17% (41) 24% (61) 250Biden Job Strongly Disapprove 2% (18) 4% (28) 11% (85) 76% (596) 7% (56) 781Favorable of Biden 40% (361) 41% (370) 7% (59) 2% (16) 10% (93) 899Unfavorable of Biden 3% (28) 8% (86) 15% (154) 62% (638) 12% (125) 1032Very Favorable of Biden 61% (285) 30% (140) 3% (16) 1% (5) 5% (25) 470Somewhat Favorable of Biden 18% (77) 54% (231) 10% (42) 3% (11) 16% (68) 429Somewhat Unfavorable of Biden 6% (16) 24% (58) 28% (68) 14% (35) 28% (69) 246Very Unfavorable of Biden 2% (13) 4% (28) 11% (87) 77% (603) 7% (57) 786#1 Issue: Economy 18% (134) 20% (151) 12% (92) 36% (265) 14% (100) 742#1 Issue: Security 6% (24) 12% (49) 13% (53) 61% (249) 9% (35) 409#1 Issue: Health Care 33% (83) 34% (85) 8% (19) 9% (22) 16% (39) 248#1 Issue: Medicare / Social Security 31% (64) 29% (61) 9% (18) 24% (49) 8% (16) 209#1 Issue: Women’s Issues 29% (33) 40% (44) 9% (10) 10% (11) 12% (13) 111#1 Issue: Education 20% (14) 20% (14) 8% (5) 23% (16) 30% (22) 72#1 Issue: Energy 21% (19) 37% (33) 13% (12) 10% (9) 19% (17) 90#1 Issue: Other 22% (25) 21% (24) 9% (11) 33% (38) 16% (18) 1172020 Vote: Joe Biden 38% (357) 39% (366) 8% (79) 4% (35) 11% (108) 9462020 Vote: Donald Trump 3% (26) 7% (60) 13% (116) 67% (582) 9% (80) 8642020 Vote: Didn’t Vote 8% (12) 19% (29) 10% (16) 22% (33) 41% (63) 1532018 House Vote: Democrat 40% (293) 37% (271) 9% (70) 6% (44) 8% (56) 7342018 House Vote: Republican 3% (21) 10% (75) 12% (84) 67% (481) 8% (58) 7192018 House Vote: Someone else 8% (4) 18% (10) 11% (6) 33% (17) 30% (16) 532016 Vote: Hillary Clinton 39% (277) 37% (264) 9% (61) 5% (37) 9% (66) 7062016 Vote: Donald Trump 4% (33) 10% (80) 12% (94) 66% (529) 9% (69) 8052016 Vote: Other 14% (12) 37% (32) 17% (15) 21% (18) 12% (11) 872016 Vote: Didn’t Vote 19% (74) 21% (85) 13% (50) 19% (75) 29% (115) 399Voted in 2014: Yes 21% (277) 24% (315) 11% (140) 38% (498) 7% (93) 1324Voted in 2014: No 18% (119) 22% (147) 12% (80) 24% (161) 25% (168) 674
Continued on next page

82
Morning ConsultTable POL3_13
Table POL3_13: Do you approve or disapprove of how President Biden is handling each of the following?Voting rights
DemographicStronglyapprove
Somewhatapprove
Somewhatdisapprove
Stronglydisapprove
Don’t Know /No Opinion Total N
Registered Voters 20% (396) 23% (462) 11% (220) 33% (659) 13% (261) 19984-Region: Northeast 21% (76) 27% (96) 13% (44) 25% (89) 14% (48) 3534-Region: Midwest 17% (74) 25% (112) 11% (47) 35% (154) 13% (57) 4444-Region: South 19% (145) 19% (145) 11% (79) 38% (284) 12% (93) 7464-Region: West 22% (101) 24% (108) 11% (50) 29% (132) 14% (63) 455Party: Democrat/Leans Democrat 37% (329) 37% (323) 10% (84) 5% (44) 11% (98) 877Party: Republican/Leans Republican 4% (36) 10% (85) 12% (100) 63% (515) 11% (86) 822Note: Row proportions may total to larger than one-hundred percent due to rounding. For more information visit MorningConsultIntelligence.com.

National Tracking Poll #2110009, October, 2021
83
Table POL3_14
Table POL3_14: Do you approve or disapprove of how President Biden is handling each of the following?Foreign policy
DemographicStronglyapprove
Somewhatapprove
Somewhatdisapprove
Stronglydisapprove
Don’t Know /No Opinion Total N
Registered Voters 13% (263) 23% (455) 12% (246) 40% (801) 12% (233) 1998Gender: Male 14% (135) 24% (224) 13% (125) 41% (388) 8% (71) 942Gender: Female 12% (128) 22% (231) 11% (121) 39% (414) 15% (162) 1056Age: 18-34 10% (52) 20% (101) 19% (97) 31% (157) 21% (108) 514Age: 35-44 16% (51) 23% (70) 17% (51) 34% (106) 10% (30) 307Age: 45-64 14% (94) 22% (152) 8% (54) 47% (316) 9% (63) 679Age: 65+ 13% (67) 26% (132) 9% (45) 45% (223) 6% (31) 497GenZers: 1997-2012 12% (18) 13% (19) 18% (26) 26% (38) 32% (47) 148Millennials: 1981-1996 11% (63) 22% (125) 19% (104) 34% (188) 14% (77) 556GenXers: 1965-1980 17% (77) 23% (106) 9% (42) 39% (183) 13% (60) 468Baby Boomers: 1946-1964 14% (101) 24% (170) 9% (65) 48% (344) 6% (42) 723PID: Dem (no lean) 27% (204) 41% (305) 12% (90) 7% (53) 12% (93) 745PID: Ind (no lean) 7% (40) 18% (100) 17% (96) 41% (227) 17% (97) 559PID: Rep (no lean) 3% (20) 7% (50) 9% (60) 75% (522) 6% (43) 694PID/Gender: DemMen 32% (114) 37% (132) 16% (56) 8% (30) 7% (24) 355PID/Gender: DemWomen 23% (90) 44% (173) 9% (35) 6% (23) 18% (69) 390PID/Gender: Ind Men 6% (17) 20% (57) 15% (44) 47% (136) 12% (35) 288PID/Gender: Ind Women 8% (23) 16% (44) 19% (52) 33% (91) 23% (62) 271PID/Gender: Rep Men 1% (4) 12% (36) 8% (25) 74% (222) 4% (12) 299PID/Gender: Rep Women 4% (16) 4% (14) 9% (35) 76% (300) 8% (31) 395Ideo: Liberal (1-3) 28% (157) 43% (235) 11% (60) 7% (40) 11% (61) 553Ideo: Moderate (4) 12% (65) 30% (160) 18% (95) 25% (137) 15% (81) 538Ideo: Conservative (5-7) 4% (32) 6% (50) 9% (75) 75% (593) 6% (44) 793Educ: < College 13% (161) 20% (239) 12% (147) 41% (496) 13% (163) 1206Educ: Bachelors degree 11% (56) 24% (121) 13% (65) 41% (207) 10% (52) 501Educ: Post-grad 16% (45) 33% (95) 11% (33) 34% (99) 6% (18) 290Income: Under 50k 14% (124) 20% (178) 12% (109) 37% (327) 16% (144) 882Income: 50k-100k 12% (86) 22% (162) 13% (91) 44% (320) 9% (65) 723Income: 100k+ 14% (53) 29% (114) 12% (47) 39% (154) 6% (24) 392Ethnicity: White 12% (191) 21% (318) 12% (180) 45% (702) 10% (155) 1545Ethnicity: Hispanic 14% (30) 25% (55) 15% (34) 36% (79) 10% (23) 222
Continued on next page

84
Morning ConsultTable POL3_14
Table POL3_14: Do you approve or disapprove of how President Biden is handling each of the following?Foreign policy
DemographicStronglyapprove
Somewhatapprove
Somewhatdisapprove
Stronglydisapprove
Don’t Know /No Opinion Total N
Registered Voters 13% (263) 23% (455) 12% (246) 40% (801) 12% (233) 1998Ethnicity: Black 24% (60) 35% (89) 11% (28) 10% (26) 20% (50) 253Ethnicity: Other 6% (13) 24% (48) 19% (39) 37% (73) 14% (28) 200All Christian 13% (132) 21% (212) 11% (114) 48% (496) 7% (72) 1025All Non-Christian 13% (14) 51% (53) 11% (12) 14% (15) 11% (11) 105Atheist 20% (19) 26% (25) 20% (19) 24% (23) 9% (8) 95Agnostic/Nothing in particular 12% (56) 25% (119) 14% (69) 30% (145) 18% (86) 474Something Else 14% (43) 15% (46) 11% (33) 41% (123) 18% (55) 299Religious Non-Protestant/Catholic 13% (17) 42% (54) 12% (16) 23% (29) 10% (12) 128Evangelical 12% (66) 15% (83) 10% (53) 55% (305) 9% (51) 558Non-Evangelical 14% (103) 24% (173) 12% (87) 40% (290) 10% (75) 727Community: Urban 21% (96) 29% (134) 11% (51) 25% (113) 14% (62) 457Community: Suburban 11% (111) 24% (245) 13% (129) 42% (423) 10% (102) 1010Community: Rural 11% (56) 14% (75) 13% (67) 50% (265) 13% (68) 531Employ: Private Sector 12% (80) 26% (176) 13% (86) 40% (272) 10% (71) 687Employ: Government 8% (11) 27% (36) 13% (17) 36% (48) 15% (20) 133Employ: Self-Employed 18% (34) 18% (33) 14% (25) 38% (71) 12% (22) 185Employ: Homemaker 8% (12) 12% (20) 16% (26) 48% (77) 16% (25) 160Employ: Student 4% (2) 29% (18) 22% (14) 15% (9) 30% (18) 61Employ: Retired 16% (79) 25% (127) 7% (36) 47% (238) 6% (28) 509Employ: Unemployed 15% (25) 13% (22) 17% (29) 37% (61) 17% (28) 165Employ: Other 20% (19) 23% (22) 13% (13) 25% (24) 20% (20) 97Military HH: Yes 12% (45) 21% (78) 11% (42) 45% (169) 11% (42) 375Military HH: No 13% (219) 23% (377) 13% (205) 39% (632) 12% (191) 1623RD/WT: Right Direction 29% (216) 44% (325) 11% (81) 5% (39) 11% (85) 745RD/WT: Wrong Track 4% (47) 10% (130) 13% (165) 61% (762) 12% (148) 1253Biden Job Approve 28% (245) 46% (408) 11% (100) 4% (35) 12% (103) 890Biden Job Disapprove 2% (18) 4% (42) 13% (137) 74% (763) 7% (70) 1031
Continued on next page
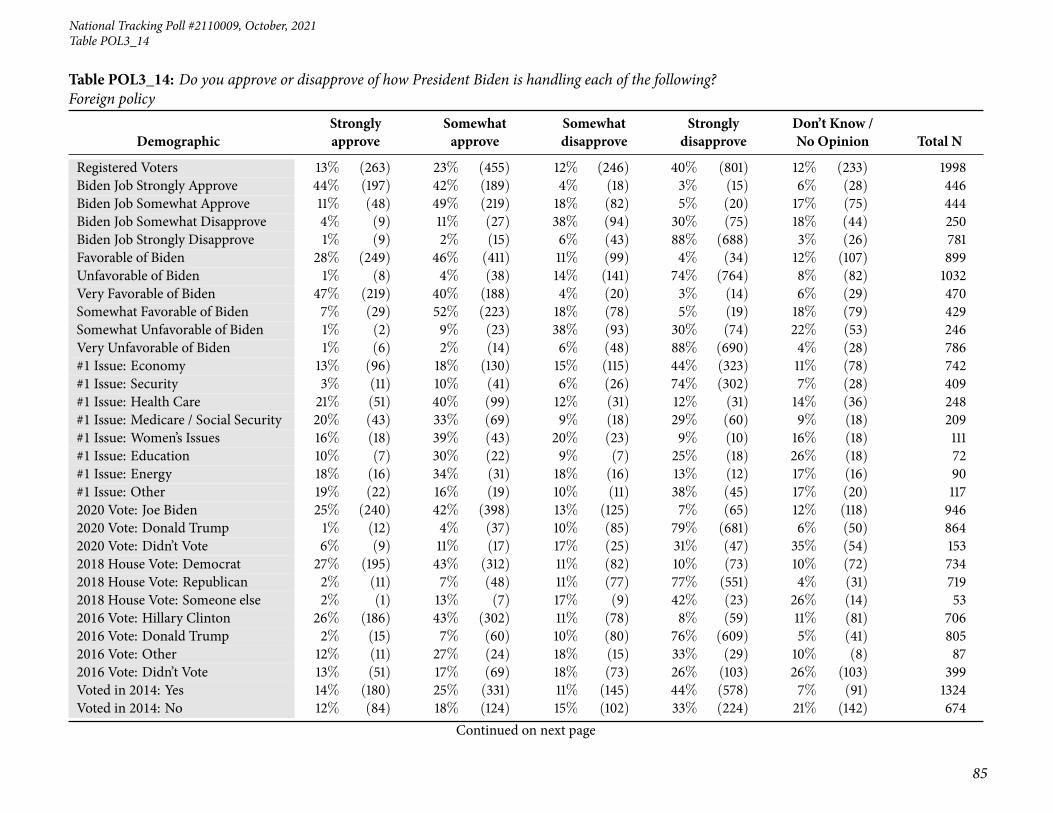
National Tracking Poll #2110009, October, 2021
85
Table POL3_14
Table POL3_14: Do you approve or disapprove of how President Biden is handling each of the following?Foreign policy
DemographicStronglyapprove
Somewhatapprove
Somewhatdisapprove
Stronglydisapprove
Don’t Know /No Opinion Total N
Registered Voters 13% (263) 23% (455) 12% (246) 40% (801) 12% (233) 1998Biden Job Strongly Approve 44% (197) 42% (189) 4% (18) 3% (15) 6% (28) 446Biden Job Somewhat Approve 11% (48) 49% (219) 18% (82) 5% (20) 17% (75) 444Biden Job Somewhat Disapprove 4% (9) 11% (27) 38% (94) 30% (75) 18% (44) 250Biden Job Strongly Disapprove 1% (9) 2% (15) 6% (43) 88% (688) 3% (26) 781Favorable of Biden 28% (249) 46% (411) 11% (99) 4% (34) 12% (107) 899Unfavorable of Biden 1% (8) 4% (38) 14% (141) 74% (764) 8% (82) 1032Very Favorable of Biden 47% (219) 40% (188) 4% (20) 3% (14) 6% (29) 470Somewhat Favorable of Biden 7% (29) 52% (223) 18% (78) 5% (19) 18% (79) 429Somewhat Unfavorable of Biden 1% (2) 9% (23) 38% (93) 30% (74) 22% (53) 246Very Unfavorable of Biden 1% (6) 2% (14) 6% (48) 88% (690) 4% (28) 786#1 Issue: Economy 13% (96) 18% (130) 15% (115) 44% (323) 11% (78) 742#1 Issue: Security 3% (11) 10% (41) 6% (26) 74% (302) 7% (28) 409#1 Issue: Health Care 21% (51) 40% (99) 12% (31) 12% (31) 14% (36) 248#1 Issue: Medicare / Social Security 20% (43) 33% (69) 9% (18) 29% (60) 9% (18) 209#1 Issue: Women’s Issues 16% (18) 39% (43) 20% (23) 9% (10) 16% (18) 111#1 Issue: Education 10% (7) 30% (22) 9% (7) 25% (18) 26% (18) 72#1 Issue: Energy 18% (16) 34% (31) 18% (16) 13% (12) 17% (16) 90#1 Issue: Other 19% (22) 16% (19) 10% (11) 38% (45) 17% (20) 1172020 Vote: Joe Biden 25% (240) 42% (398) 13% (125) 7% (65) 12% (118) 9462020 Vote: Donald Trump 1% (12) 4% (37) 10% (85) 79% (681) 6% (50) 8642020 Vote: Didn’t Vote 6% (9) 11% (17) 17% (25) 31% (47) 35% (54) 1532018 House Vote: Democrat 27% (195) 43% (312) 11% (82) 10% (73) 10% (72) 7342018 House Vote: Republican 2% (11) 7% (48) 11% (77) 77% (551) 4% (31) 7192018 House Vote: Someone else 2% (1) 13% (7) 17% (9) 42% (23) 26% (14) 532016 Vote: Hillary Clinton 26% (186) 43% (302) 11% (78) 8% (59) 11% (81) 7062016 Vote: Donald Trump 2% (15) 7% (60) 10% (80) 76% (609) 5% (41) 8052016 Vote: Other 12% (11) 27% (24) 18% (15) 33% (29) 10% (8) 872016 Vote: Didn’t Vote 13% (51) 17% (69) 18% (73) 26% (103) 26% (103) 399Voted in 2014: Yes 14% (180) 25% (331) 11% (145) 44% (578) 7% (91) 1324Voted in 2014: No 12% (84) 18% (124) 15% (102) 33% (224) 21% (142) 674
Continued on next page

86
Morning ConsultTable POL3_14
Table POL3_14: Do you approve or disapprove of how President Biden is handling each of the following?Foreign policy
DemographicStronglyapprove
Somewhatapprove
Somewhatdisapprove
Stronglydisapprove
Don’t Know /No Opinion Total N
Registered Voters 13% (263) 23% (455) 12% (246) 40% (801) 12% (233) 19984-Region: Northeast 15% (52) 25% (87) 14% (51) 34% (122) 12% (41) 3534-Region: Midwest 12% (51) 23% (104) 14% (63) 40% (179) 11% (47) 4444-Region: South 13% (95) 19% (145) 10% (77) 44% (331) 13% (98) 7464-Region: West 14% (64) 26% (119) 12% (56) 37% (169) 10% (46) 455Party: Democrat/Leans Democrat 25% (223) 40% (355) 13% (115) 8% (71) 13% (113) 877Party: Republican/Leans Republican 2% (20) 7% (59) 10% (79) 74% (611) 6% (52) 822Note: Row proportions may total to larger than one-hundred percent due to rounding. For more information visit MorningConsultIntelligence.com.
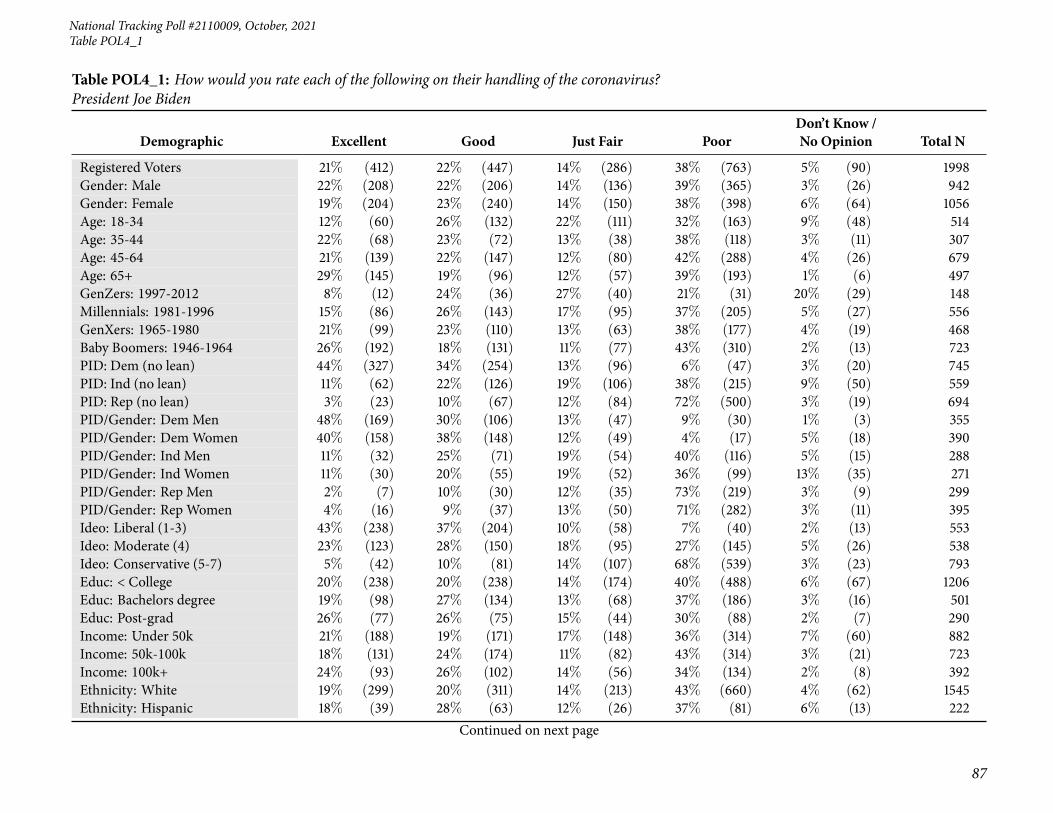
National Tracking Poll #2110009, October, 2021
87
Table POL4_1
Table POL4_1: How would you rate each of the following on their handling of the coronavirus?President Joe Biden
Demographic Excellent Good Just Fair PoorDon’t Know /No Opinion Total N
Registered Voters 21% (412) 22% (447) 14% (286) 38% (763) 5% (90) 1998Gender: Male 22% (208) 22% (206) 14% (136) 39% (365) 3% (26) 942Gender: Female 19% (204) 23% (240) 14% (150) 38% (398) 6% (64) 1056Age: 18-34 12% (60) 26% (132) 22% (111) 32% (163) 9% (48) 514Age: 35-44 22% (68) 23% (72) 13% (38) 38% (118) 3% (11) 307Age: 45-64 21% (139) 22% (147) 12% (80) 42% (288) 4% (26) 679Age: 65+ 29% (145) 19% (96) 12% (57) 39% (193) 1% (6) 497GenZers: 1997-2012 8% (12) 24% (36) 27% (40) 21% (31) 20% (29) 148Millennials: 1981-1996 15% (86) 26% (143) 17% (95) 37% (205) 5% (27) 556GenXers: 1965-1980 21% (99) 23% (110) 13% (63) 38% (177) 4% (19) 468Baby Boomers: 1946-1964 26% (192) 18% (131) 11% (77) 43% (310) 2% (13) 723PID: Dem (no lean) 44% (327) 34% (254) 13% (96) 6% (47) 3% (20) 745PID: Ind (no lean) 11% (62) 22% (126) 19% (106) 38% (215) 9% (50) 559PID: Rep (no lean) 3% (23) 10% (67) 12% (84) 72% (500) 3% (19) 694PID/Gender: DemMen 48% (169) 30% (106) 13% (47) 9% (30) 1% (3) 355PID/Gender: DemWomen 40% (158) 38% (148) 12% (49) 4% (17) 5% (18) 390PID/Gender: Ind Men 11% (32) 25% (71) 19% (54) 40% (116) 5% (15) 288PID/Gender: Ind Women 11% (30) 20% (55) 19% (52) 36% (99) 13% (35) 271PID/Gender: Rep Men 2% (7) 10% (30) 12% (35) 73% (219) 3% (9) 299PID/Gender: Rep Women 4% (16) 9% (37) 13% (50) 71% (282) 3% (11) 395Ideo: Liberal (1-3) 43% (238) 37% (204) 10% (58) 7% (40) 2% (13) 553Ideo: Moderate (4) 23% (123) 28% (150) 18% (95) 27% (145) 5% (26) 538Ideo: Conservative (5-7) 5% (42) 10% (81) 14% (107) 68% (539) 3% (23) 793Educ: < College 20% (238) 20% (238) 14% (174) 40% (488) 6% (67) 1206Educ: Bachelors degree 19% (98) 27% (134) 13% (68) 37% (186) 3% (16) 501Educ: Post-grad 26% (77) 26% (75) 15% (44) 30% (88) 2% (7) 290Income: Under 50k 21% (188) 19% (171) 17% (148) 36% (314) 7% (60) 882Income: 50k-100k 18% (131) 24% (174) 11% (82) 43% (314) 3% (21) 723Income: 100k+ 24% (93) 26% (102) 14% (56) 34% (134) 2% (8) 392Ethnicity: White 19% (299) 20% (311) 14% (213) 43% (660) 4% (62) 1545Ethnicity: Hispanic 18% (39) 28% (63) 12% (26) 37% (81) 6% (13) 222
Continued on next page

88
Morning ConsultTable POL4_1
Table POL4_1: How would you rate each of the following on their handling of the coronavirus?President Joe Biden
Demographic Excellent Good Just Fair PoorDon’t Know /No Opinion Total N
Registered Voters 21% (412) 22% (447) 14% (286) 38% (763) 5% (90) 1998Ethnicity: Black 35% (89) 32% (80) 17% (44) 11% (28) 5% (12) 253Ethnicity: Other 12% (25) 28% (56) 15% (29) 37% (75) 8% (16) 200All Christian 21% (215) 21% (212) 12% (126) 43% (440) 3% (33) 1025All Non-Christian 35% (37) 31% (33) 12% (12) 18% (19) 4% (4) 105Atheist 28% (26) 27% (26) 14% (13) 28% (27) 2% (2) 95Agnostic/Nothing in particular 18% (83) 25% (117) 19% (90) 32% (153) 7% (31) 474Something Else 17% (51) 20% (59) 15% (45) 42% (124) 7% (20) 299Religious Non-Protestant/Catholic 31% (39) 27% (35) 13% (17) 25% (32) 3% (4) 128Evangelical 17% (93) 17% (94) 13% (73) 49% (273) 4% (24) 558Non-Evangelical 23% (168) 24% (172) 12% (91) 37% (268) 4% (28) 727Community: Urban 29% (132) 29% (135) 13% (58) 26% (117) 3% (14) 457Community: Suburban 20% (204) 21% (213) 15% (154) 40% (404) 4% (36) 1010Community: Rural 14% (76) 19% (99) 14% (75) 46% (242) 8% (40) 531Employ: Private Sector 19% (128) 27% (186) 13% (92) 38% (258) 3% (23) 687Employ: Government 13% (17) 22% (29) 24% (31) 36% (48) 6% (8) 133Employ: Self-Employed 25% (45) 15% (28) 19% (35) 41% (75) 1% (1) 185Employ: Homemaker 9% (15) 23% (37) 11% (17) 51% (81) 7% (11) 160Employ: Student 7% (5) 37% (23) 12% (7) 30% (18) 14% (9) 61Employ: Retired 29% (145) 18% (92) 12% (61) 40% (205) 1% (6) 509Employ: Unemployed 21% (34) 17% (29) 18% (30) 32% (54) 11% (19) 165Employ: Other 24% (23) 25% (24) 13% (12) 25% (24) 14% (14) 97Military HH: Yes 21% (77) 17% (64) 15% (57) 44% (164) 3% (12) 375Military HH: No 21% (335) 24% (383) 14% (229) 37% (599) 5% (78) 1623RD/WT: Right Direction 44% (326) 39% (293) 10% (71) 4% (28) 4% (27) 745RD/WT: Wrong Track 7% (86) 12% (154) 17% (215) 59% (735) 5% (63) 1253Biden Job Approve 44% (392) 40% (354) 11% (98) 3% (24) 3% (23) 890Biden Job Disapprove 2% (18) 8% (84) 17% (171) 71% (730) 3% (28) 1031
Continued on next page

National Tracking Poll #2110009, October, 2021
89
Table POL4_1
Table POL4_1: How would you rate each of the following on their handling of the coronavirus?President Joe Biden
Demographic Excellent Good Just Fair PoorDon’t Know /No Opinion Total N
Registered Voters 21% (412) 22% (447) 14% (286) 38% (763) 5% (90) 1998Biden Job Strongly Approve 68% (305) 26% (116) 3% (12) 1% (5) 2% (8) 446Biden Job Somewhat Approve 19% (86) 54% (238) 19% (86) 4% (18) 3% (15) 444Biden Job Somewhat Disapprove 4% (10) 23% (58) 43% (106) 26% (65) 4% (11) 250Biden Job Strongly Disapprove 1% (8) 3% (26) 8% (64) 85% (665) 2% (18) 781Favorable of Biden 44% (396) 41% (366) 10% (91) 2% (18) 3% (28) 899Unfavorable of Biden 1% (10) 7% (76) 18% (182) 71% (732) 3% (34) 1032Very Favorable of Biden 70% (331) 26% (123) 2% (9) — (2) 1% (5) 470Somewhat Favorable of Biden 15% (64) 57% (243) 19% (82) 4% (16) 6% (24) 429Somewhat Unfavorable of Biden 3% (9) 20% (50) 45% (111) 25% (61) 6% (15) 246Very Unfavorable of Biden — (1) 3% (25) 9% (70) 85% (671) 2% (19) 786#1 Issue: Economy 17% (128) 21% (158) 15% (113) 41% (307) 5% (36) 742#1 Issue: Security 5% (21) 11% (47) 13% (51) 68% (278) 3% (12) 409#1 Issue: Health Care 34% (84) 35% (88) 13% (32) 14% (34) 4% (10) 248#1 Issue: Medicare / Social Security 40% (83) 21% (43) 13% (26) 24% (50) 3% (7) 209#1 Issue: Women’s Issues 26% (29) 41% (46) 15% (17) 14% (16) 3% (4) 111#1 Issue: Education 15% (11) 26% (19) 19% (14) 25% (18) 15% (11) 72#1 Issue: Energy 22% (20) 32% (29) 26% (24) 16% (14) 4% (3) 90#1 Issue: Other 32% (37) 15% (17) 8% (9) 39% (45) 7% (8) 1172020 Vote: Joe Biden 41% (392) 37% (348) 13% (123) 5% (47) 4% (36) 9462020 Vote: Donald Trump 1% (9) 6% (54) 15% (130) 75% (644) 3% (26) 8642020 Vote: Didn’t Vote 7% (11) 26% (40) 13% (19) 39% (60) 16% (24) 1532018 House Vote: Democrat 44% (322) 34% (248) 12% (89) 8% (59) 2% (16) 7342018 House Vote: Republican 3% (22) 8% (60) 14% (102) 72% (518) 2% (17) 7192018 House Vote: Someone else 5% (2) 16% (8) 24% (13) 44% (23) 12% (6) 532016 Vote: Hillary Clinton 46% (322) 34% (241) 10% (70) 7% (52) 3% (21) 7062016 Vote: Donald Trump 3% (26) 9% (73) 15% (117) 72% (576) 2% (14) 8052016 Vote: Other 17% (15) 29% (26) 22% (19) 28% (25) 4% (3) 872016 Vote: Didn’t Vote 12% (49) 27% (107) 20% (81) 27% (109) 13% (53) 399Voted in 2014: Yes 24% (315) 21% (279) 12% (162) 41% (542) 2% (26) 1324Voted in 2014: No 14% (97) 25% (168) 18% (124) 33% (221) 9% (64) 674
Continued on next page
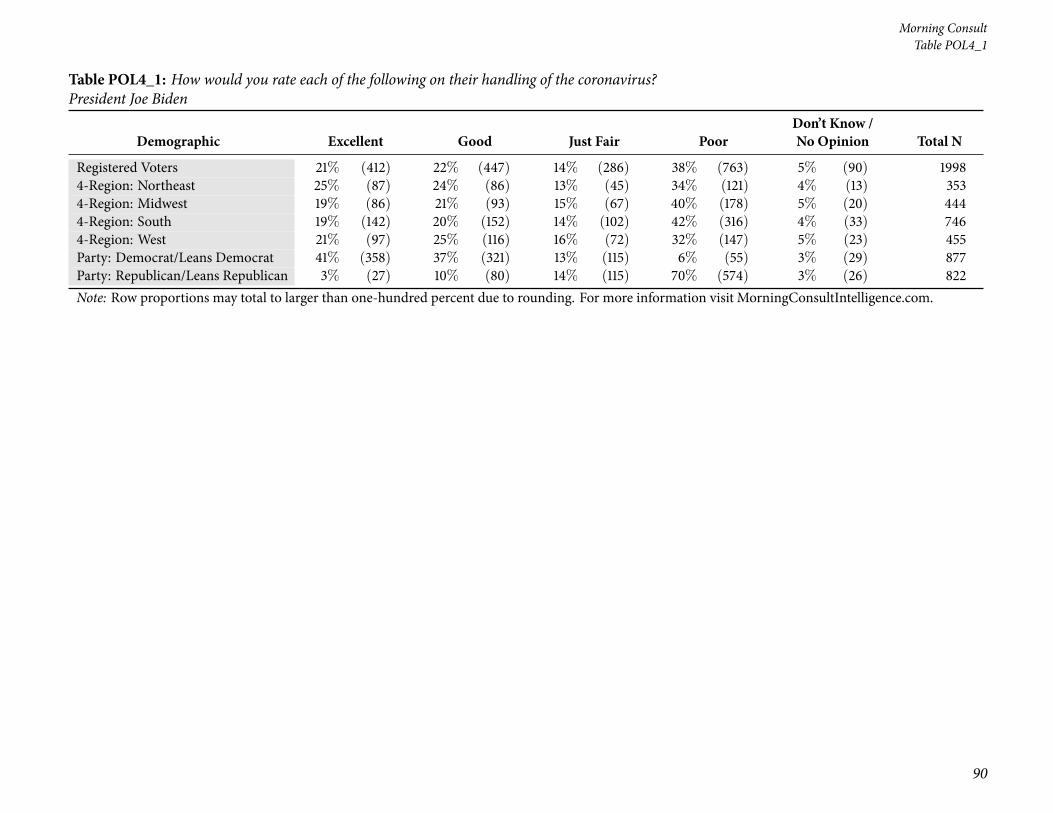
90
Morning ConsultTable POL4_1
Table POL4_1: How would you rate each of the following on their handling of the coronavirus?President Joe Biden
Demographic Excellent Good Just Fair PoorDon’t Know /No Opinion Total N
Registered Voters 21% (412) 22% (447) 14% (286) 38% (763) 5% (90) 19984-Region: Northeast 25% (87) 24% (86) 13% (45) 34% (121) 4% (13) 3534-Region: Midwest 19% (86) 21% (93) 15% (67) 40% (178) 5% (20) 4444-Region: South 19% (142) 20% (152) 14% (102) 42% (316) 4% (33) 7464-Region: West 21% (97) 25% (116) 16% (72) 32% (147) 5% (23) 455Party: Democrat/Leans Democrat 41% (358) 37% (321) 13% (115) 6% (55) 3% (29) 877Party: Republican/Leans Republican 3% (27) 10% (80) 14% (115) 70% (574) 3% (26) 822Note: Row proportions may total to larger than one-hundred percent due to rounding. For more information visit MorningConsultIntelligence.com.

National Tracking Poll #2110009, October, 2021
91
Table POL4_2
Table POL4_2: How would you rate each of the following on their handling of the coronavirus?Congress
Demographic Excellent Good Just Fair PoorDon’t Know /No Opinion Total N
Registered Voters 6% (116) 18% (351) 34% (680) 34% (672) 9% (179) 1998Gender: Male 6% (60) 18% (171) 33% (310) 37% (350) 6% (52) 942Gender: Female 5% (56) 17% (180) 35% (370) 31% (322) 12% (127) 1056Age: 18-34 9% (45) 16% (83) 29% (151) 27% (140) 19% (96) 514Age: 35-44 7% (21) 19% (59) 37% (114) 30% (93) 6% (20) 307Age: 45-64 6% (40) 16% (110) 37% (252) 34% (233) 7% (45) 679Age: 65+ 2% (10) 20% (98) 33% (163) 41% (206) 4% (19) 497GenZers: 1997-2012 7% (10) 12% (17) 37% (54) 15% (23) 30% (44) 148Millennials: 1981-1996 9% (48) 18% (101) 30% (168) 31% (174) 12% (65) 556GenXers: 1965-1980 7% (33) 16% (74) 37% (172) 33% (156) 7% (33) 468Baby Boomers: 1946-1964 3% (24) 19% (137) 35% (256) 38% (273) 5% (33) 723PID: Dem (no lean) 10% (76) 29% (215) 39% (292) 15% (115) 6% (46) 745PID: Ind (no lean) 2% (14) 12% (65) 32% (177) 40% (222) 15% (82) 559PID: Rep (no lean) 4% (26) 10% (71) 30% (211) 48% (335) 7% (51) 694PID/Gender: DemMen 13% (46) 29% (102) 38% (133) 19% (66) 2% (8) 355PID/Gender: DemWomen 8% (31) 29% (113) 41% (158) 13% (49) 10% (38) 390PID/Gender: Ind Men 1% (4) 11% (33) 32% (93) 44% (127) 11% (30) 288PID/Gender: Ind Women 4% (10) 12% (32) 31% (84) 35% (95) 19% (51) 271PID/Gender: Rep Men 3% (10) 12% (36) 28% (83) 52% (157) 4% (13) 299PID/Gender: Rep Women 4% (16) 9% (35) 32% (128) 45% (178) 10% (38) 395Ideo: Liberal (1-3) 8% (44) 28% (156) 40% (219) 18% (102) 6% (32) 553Ideo: Moderate (4) 6% (33) 22% (120) 35% (186) 28% (149) 9% (50) 538Ideo: Conservative (5-7) 4% (32) 9% (69) 31% (246) 50% (394) 6% (51) 793Educ: < College 6% (73) 18% (215) 33% (394) 32% (390) 11% (134) 1206Educ: Bachelors degree 6% (28) 17% (85) 35% (176) 37% (184) 6% (29) 501Educ: Post-grad 5% (16) 18% (51) 38% (110) 34% (98) 6% (16) 290Income: Under 50k 6% (51) 19% (168) 32% (280) 31% (278) 12% (105) 882Income: 50k-100k 5% (33) 16% (114) 35% (254) 38% (272) 7% (49) 723Income: 100k+ 8% (32) 18% (69) 37% (145) 31% (122) 6% (24) 392Ethnicity: White 5% (84) 16% (244) 34% (529) 36% (557) 8% (131) 1545Ethnicity: Hispanic 12% (27) 19% (42) 29% (65) 30% (66) 10% (23) 222
Continued on next page

92
Morning ConsultTable POL4_2
Table POL4_2: How would you rate each of the following on their handling of the coronavirus?Congress
Demographic Excellent Good Just Fair PoorDon’t Know /No Opinion Total N
Registered Voters 6% (116) 18% (351) 34% (680) 34% (672) 9% (179) 1998Ethnicity: Black 10% (26) 25% (63) 37% (94) 18% (45) 10% (25) 253Ethnicity: Other 3% (6) 22% (44) 28% (56) 35% (70) 12% (24) 200All Christian 6% (63) 19% (191) 32% (323) 37% (379) 7% (70) 1025All Non-Christian 12% (13) 22% (23) 38% (40) 22% (23) 7% (7) 105Atheist 6% (6) 16% (15) 42% (40) 31% (29) 5% (5) 95Agnostic/Nothing in particular 4% (19) 15% (73) 39% (187) 28% (132) 13% (62) 474Something Else 5% (15) 16% (49) 30% (90) 36% (108) 12% (36) 299Religious Non-Protestant/Catholic 12% (15) 20% (26) 35% (45) 27% (34) 6% (8) 128Evangelical 8% (42) 15% (83) 29% (162) 41% (228) 8% (43) 558Non-Evangelical 5% (33) 21% (150) 33% (241) 33% (240) 9% (62) 727Community: Urban 10% (46) 25% (115) 33% (152) 24% (109) 8% (36) 457Community: Suburban 5% (47) 16% (165) 36% (362) 35% (355) 8% (81) 1010Community: Rural 4% (23) 13% (72) 31% (166) 39% (208) 12% (63) 531Employ: Private Sector 7% (46) 19% (131) 35% (241) 32% (217) 7% (51) 687Employ: Government 3% (4) 19% (25) 30% (40) 34% (46) 13% (17) 133Employ: Self-Employed 13% (24) 17% (31) 32% (60) 33% (60) 5% (9) 185Employ: Homemaker 2% (3) 7% (12) 33% (53) 45% (73) 13% (21) 160Employ: Student 3% (2) 9% (5) 49% (30) 19% (12) 20% (12) 61Employ: Retired 4% (19) 20% (100) 34% (174) 39% (197) 4% (19) 509Employ: Unemployed 7% (12) 13% (22) 29% (47) 30% (49) 21% (35) 165Employ: Other 7% (7) 25% (24) 35% (34) 19% (18) 14% (14) 97Military HH: Yes 5% (20) 12% (45) 33% (124) 41% (154) 8% (31) 375Military HH: No 6% (96) 19% (306) 34% (556) 32% (517) 9% (148) 1623RD/WT: Right Direction 11% (82) 30% (224) 38% (284) 14% (101) 7% (54) 745RD/WT: Wrong Track 3% (34) 10% (127) 32% (395) 46% (571) 10% (125) 1253Biden Job Approve 10% (93) 29% (262) 38% (343) 15% (136) 6% (57) 890Biden Job Disapprove 2% (23) 8% (85) 31% (320) 51% (528) 7% (76) 1031
Continued on next page
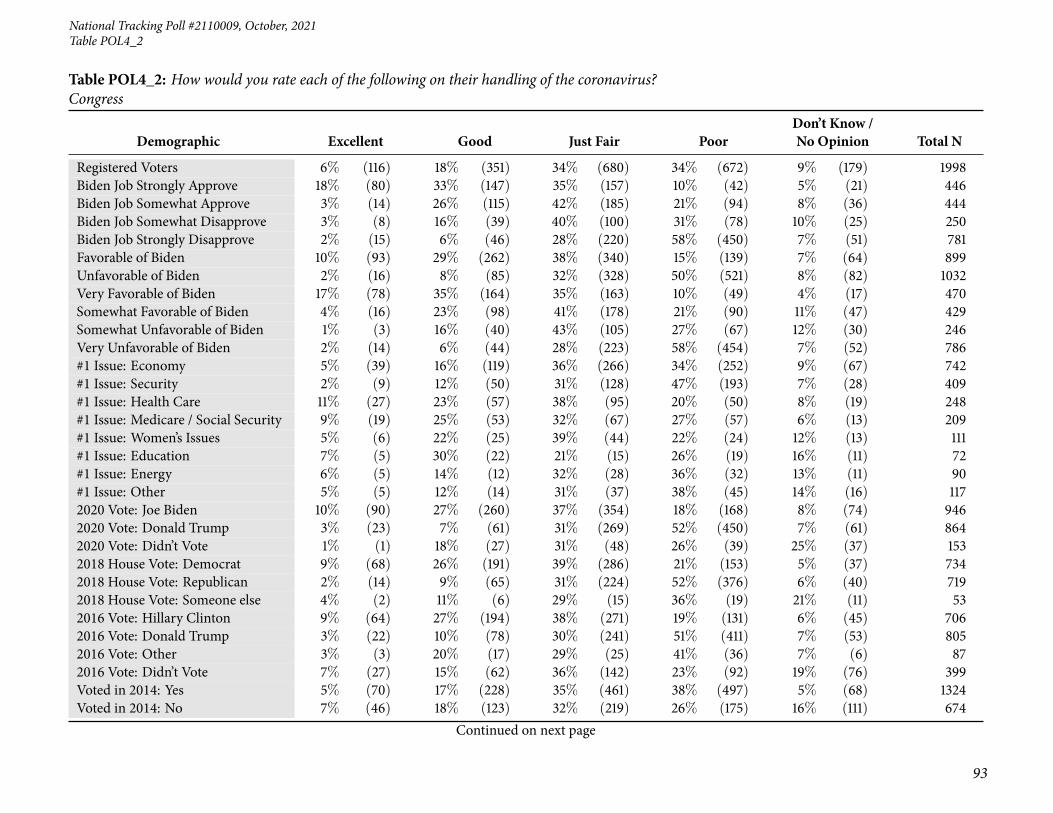
National Tracking Poll #2110009, October, 2021
93
Table POL4_2
Table POL4_2: How would you rate each of the following on their handling of the coronavirus?Congress
Demographic Excellent Good Just Fair PoorDon’t Know /No Opinion Total N
Registered Voters 6% (116) 18% (351) 34% (680) 34% (672) 9% (179) 1998Biden Job Strongly Approve 18% (80) 33% (147) 35% (157) 10% (42) 5% (21) 446Biden Job Somewhat Approve 3% (14) 26% (115) 42% (185) 21% (94) 8% (36) 444Biden Job Somewhat Disapprove 3% (8) 16% (39) 40% (100) 31% (78) 10% (25) 250Biden Job Strongly Disapprove 2% (15) 6% (46) 28% (220) 58% (450) 7% (51) 781Favorable of Biden 10% (93) 29% (262) 38% (340) 15% (139) 7% (64) 899Unfavorable of Biden 2% (16) 8% (85) 32% (328) 50% (521) 8% (82) 1032Very Favorable of Biden 17% (78) 35% (164) 35% (163) 10% (49) 4% (17) 470Somewhat Favorable of Biden 4% (16) 23% (98) 41% (178) 21% (90) 11% (47) 429Somewhat Unfavorable of Biden 1% (3) 16% (40) 43% (105) 27% (67) 12% (30) 246Very Unfavorable of Biden 2% (14) 6% (44) 28% (223) 58% (454) 7% (52) 786#1 Issue: Economy 5% (39) 16% (119) 36% (266) 34% (252) 9% (67) 742#1 Issue: Security 2% (9) 12% (50) 31% (128) 47% (193) 7% (28) 409#1 Issue: Health Care 11% (27) 23% (57) 38% (95) 20% (50) 8% (19) 248#1 Issue: Medicare / Social Security 9% (19) 25% (53) 32% (67) 27% (57) 6% (13) 209#1 Issue: Women’s Issues 5% (6) 22% (25) 39% (44) 22% (24) 12% (13) 111#1 Issue: Education 7% (5) 30% (22) 21% (15) 26% (19) 16% (11) 72#1 Issue: Energy 6% (5) 14% (12) 32% (28) 36% (32) 13% (11) 90#1 Issue: Other 5% (5) 12% (14) 31% (37) 38% (45) 14% (16) 1172020 Vote: Joe Biden 10% (90) 27% (260) 37% (354) 18% (168) 8% (74) 9462020 Vote: Donald Trump 3% (23) 7% (61) 31% (269) 52% (450) 7% (61) 8642020 Vote: Didn’t Vote 1% (1) 18% (27) 31% (48) 26% (39) 25% (37) 1532018 House Vote: Democrat 9% (68) 26% (191) 39% (286) 21% (153) 5% (37) 7342018 House Vote: Republican 2% (14) 9% (65) 31% (224) 52% (376) 6% (40) 7192018 House Vote: Someone else 4% (2) 11% (6) 29% (15) 36% (19) 21% (11) 532016 Vote: Hillary Clinton 9% (64) 27% (194) 38% (271) 19% (131) 6% (45) 7062016 Vote: Donald Trump 3% (22) 10% (78) 30% (241) 51% (411) 7% (53) 8052016 Vote: Other 3% (3) 20% (17) 29% (25) 41% (36) 7% (6) 872016 Vote: Didn’t Vote 7% (27) 15% (62) 36% (142) 23% (92) 19% (76) 399Voted in 2014: Yes 5% (70) 17% (228) 35% (461) 38% (497) 5% (68) 1324Voted in 2014: No 7% (46) 18% (123) 32% (219) 26% (175) 16% (111) 674
Continued on next page

94
Morning ConsultTable POL4_2
Table POL4_2: How would you rate each of the following on their handling of the coronavirus?Congress
Demographic Excellent Good Just Fair PoorDon’t Know /No Opinion Total N
Registered Voters 6% (116) 18% (351) 34% (680) 34% (672) 9% (179) 19984-Region: Northeast 5% (18) 18% (64) 36% (128) 31% (111) 9% (32) 3534-Region: Midwest 4% (18) 19% (85) 36% (162) 32% (140) 9% (39) 4444-Region: South 6% (45) 16% (123) 32% (239) 36% (268) 9% (70) 7464-Region: West 8% (34) 17% (79) 33% (151) 34% (153) 8% (38) 455Party: Democrat/Leans Democrat 9% (78) 27% (241) 40% (353) 17% (145) 7% (59) 877Party: Republican/Leans Republican 3% (26) 10% (78) 31% (252) 49% (402) 8% (64) 822Note: Row proportions may total to larger than one-hundred percent due to rounding. For more information visit MorningConsultIntelligence.com.

National Tracking Poll #2110009, October, 2021
95
Table POL4_3
Table POL4_3: How would you rate each of the following on their handling of the coronavirus?Congressional Democrats
Demographic Excellent Good Just Fair PoorDon’t Know /No Opinion Total N
Registered Voters 12% (239) 24% (487) 19% (371) 37% (744) 8% (157) 1998Gender: Male 14% (127) 25% (240) 17% (155) 40% (374) 5% (46) 942Gender: Female 11% (112) 23% (247) 20% (216) 35% (370) 11% (111) 1056Age: 18-34 11% (56) 22% (115) 23% (116) 28% (143) 16% (85) 514Age: 35-44 14% (43) 25% (76) 20% (63) 34% (105) 6% (19) 307Age: 45-64 12% (78) 25% (167) 16% (110) 42% (287) 5% (37) 679Age: 65+ 12% (61) 26% (129) 17% (83) 42% (208) 3% (16) 497GenZers: 1997-2012 5% (8) 22% (33) 27% (41) 17% (25) 29% (43) 148Millennials: 1981-1996 13% (72) 23% (130) 21% (117) 33% (184) 10% (54) 556GenXers: 1965-1980 14% (63) 26% (123) 18% (82) 37% (171) 6% (27) 468Baby Boomers: 1946-1964 12% (86) 24% (172) 16% (115) 44% (320) 4% (30) 723PID: Dem (no lean) 24% (178) 45% (338) 19% (142) 6% (48) 5% (38) 745PID: Ind (no lean) 6% (35) 18% (100) 21% (120) 39% (219) 15% (85) 559PID: Rep (no lean) 4% (25) 7% (48) 16% (109) 69% (477) 5% (35) 694PID/Gender: DemMen 27% (95) 45% (161) 18% (63) 8% (28) 2% (8) 355PID/Gender: DemWomen 22% (84) 46% (177) 20% (79) 5% (19) 8% (30) 390PID/Gender: Ind Men 8% (23) 18% (50) 20% (57) 44% (127) 10% (30) 288PID/Gender: Ind Women 4% (12) 18% (50) 23% (63) 34% (92) 20% (55) 271PID/Gender: Rep Men 3% (10) 9% (28) 12% (35) 73% (218) 3% (8) 299PID/Gender: Rep Women 4% (16) 5% (20) 19% (74) 65% (259) 7% (27) 395Ideo: Liberal (1-3) 26% (145) 45% (248) 18% (99) 6% (30) 6% (30) 553Ideo: Moderate (4) 12% (65) 31% (165) 25% (132) 24% (127) 9% (49) 538Ideo: Conservative (5-7) 3% (23) 8% (62) 15% (121) 69% (551) 5% (37) 793Educ: < College 12% (140) 23% (274) 18% (219) 37% (452) 10% (122) 1206Educ: Bachelors degree 12% (60) 25% (124) 20% (98) 39% (197) 5% (23) 501Educ: Post-grad 14% (39) 31% (89) 19% (54) 33% (95) 4% (13) 290Income: Under 50k 12% (105) 23% (207) 19% (166) 35% (310) 11% (94) 882Income: 50k-100k 11% (81) 24% (173) 18% (130) 41% (295) 6% (44) 723Income: 100k+ 14% (53) 27% (107) 19% (75) 35% (138) 5% (19) 392Ethnicity: White 11% (174) 22% (345) 18% (282) 41% (630) 7% (114) 1545Ethnicity: Hispanic 13% (30) 22% (50) 20% (43) 36% (81) 8% (18) 222
Continued on next page
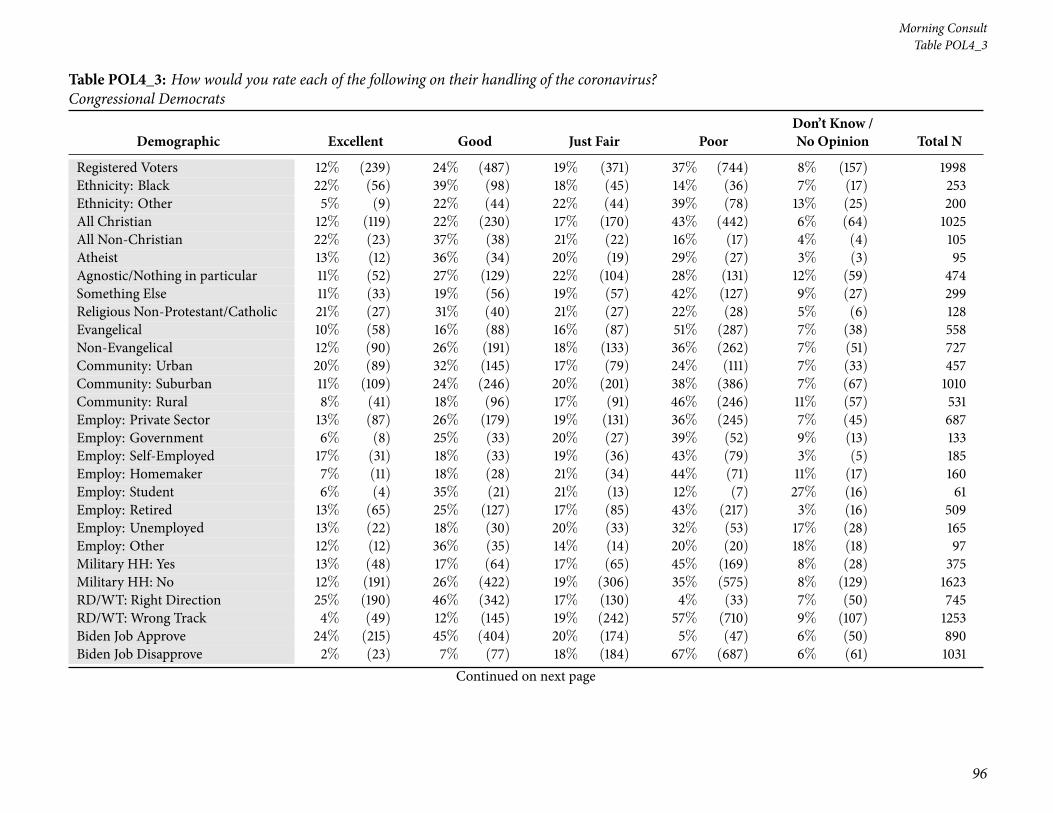
96
Morning ConsultTable POL4_3
Table POL4_3: How would you rate each of the following on their handling of the coronavirus?Congressional Democrats
Demographic Excellent Good Just Fair PoorDon’t Know /No Opinion Total N
Registered Voters 12% (239) 24% (487) 19% (371) 37% (744) 8% (157) 1998Ethnicity: Black 22% (56) 39% (98) 18% (45) 14% (36) 7% (17) 253Ethnicity: Other 5% (9) 22% (44) 22% (44) 39% (78) 13% (25) 200All Christian 12% (119) 22% (230) 17% (170) 43% (442) 6% (64) 1025All Non-Christian 22% (23) 37% (38) 21% (22) 16% (17) 4% (4) 105Atheist 13% (12) 36% (34) 20% (19) 29% (27) 3% (3) 95Agnostic/Nothing in particular 11% (52) 27% (129) 22% (104) 28% (131) 12% (59) 474Something Else 11% (33) 19% (56) 19% (57) 42% (127) 9% (27) 299Religious Non-Protestant/Catholic 21% (27) 31% (40) 21% (27) 22% (28) 5% (6) 128Evangelical 10% (58) 16% (88) 16% (87) 51% (287) 7% (38) 558Non-Evangelical 12% (90) 26% (191) 18% (133) 36% (262) 7% (51) 727Community: Urban 20% (89) 32% (145) 17% (79) 24% (111) 7% (33) 457Community: Suburban 11% (109) 24% (246) 20% (201) 38% (386) 7% (67) 1010Community: Rural 8% (41) 18% (96) 17% (91) 46% (246) 11% (57) 531Employ: Private Sector 13% (87) 26% (179) 19% (131) 36% (245) 7% (45) 687Employ: Government 6% (8) 25% (33) 20% (27) 39% (52) 9% (13) 133Employ: Self-Employed 17% (31) 18% (33) 19% (36) 43% (79) 3% (5) 185Employ: Homemaker 7% (11) 18% (28) 21% (34) 44% (71) 11% (17) 160Employ: Student 6% (4) 35% (21) 21% (13) 12% (7) 27% (16) 61Employ: Retired 13% (65) 25% (127) 17% (85) 43% (217) 3% (16) 509Employ: Unemployed 13% (22) 18% (30) 20% (33) 32% (53) 17% (28) 165Employ: Other 12% (12) 36% (35) 14% (14) 20% (20) 18% (18) 97Military HH: Yes 13% (48) 17% (64) 17% (65) 45% (169) 8% (28) 375Military HH: No 12% (191) 26% (422) 19% (306) 35% (575) 8% (129) 1623RD/WT: Right Direction 25% (190) 46% (342) 17% (130) 4% (33) 7% (50) 745RD/WT: Wrong Track 4% (49) 12% (145) 19% (242) 57% (710) 9% (107) 1253Biden Job Approve 24% (215) 45% (404) 20% (174) 5% (47) 6% (50) 890Biden Job Disapprove 2% (23) 7% (77) 18% (184) 67% (687) 6% (61) 1031
Continued on next page
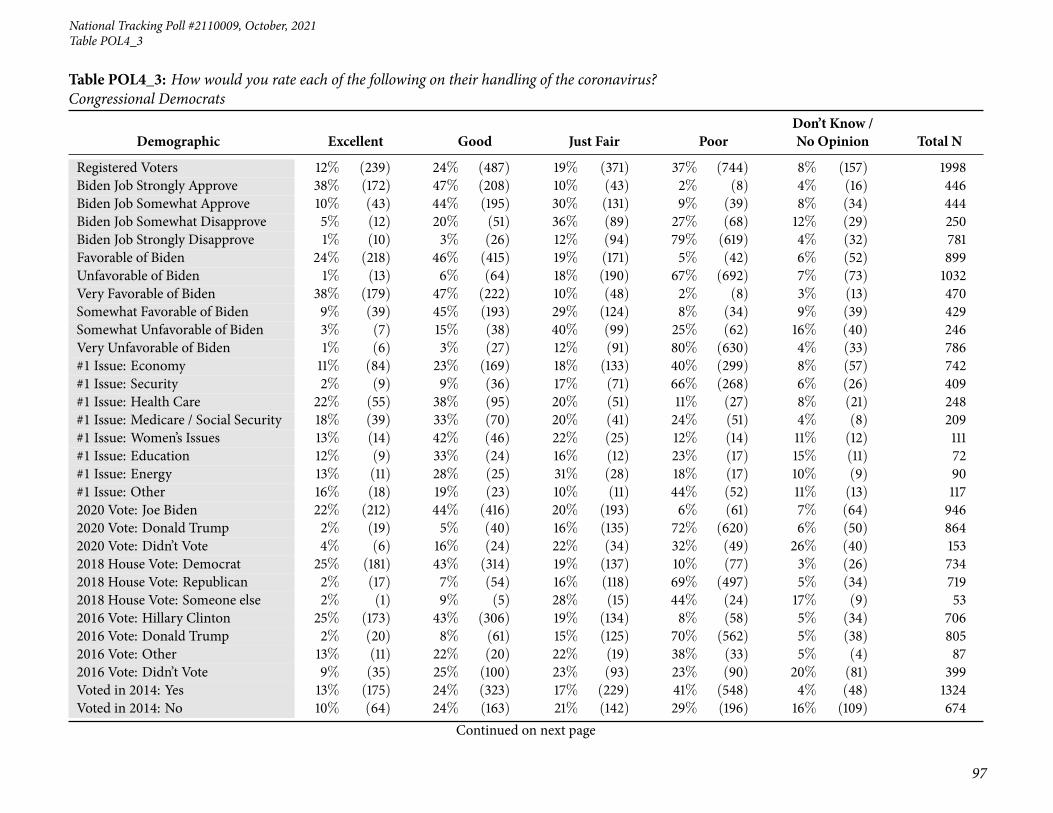
National Tracking Poll #2110009, October, 2021
97
Table POL4_3
Table POL4_3: How would you rate each of the following on their handling of the coronavirus?Congressional Democrats
Demographic Excellent Good Just Fair PoorDon’t Know /No Opinion Total N
Registered Voters 12% (239) 24% (487) 19% (371) 37% (744) 8% (157) 1998Biden Job Strongly Approve 38% (172) 47% (208) 10% (43) 2% (8) 4% (16) 446Biden Job Somewhat Approve 10% (43) 44% (195) 30% (131) 9% (39) 8% (34) 444Biden Job Somewhat Disapprove 5% (12) 20% (51) 36% (89) 27% (68) 12% (29) 250Biden Job Strongly Disapprove 1% (10) 3% (26) 12% (94) 79% (619) 4% (32) 781Favorable of Biden 24% (218) 46% (415) 19% (171) 5% (42) 6% (52) 899Unfavorable of Biden 1% (13) 6% (64) 18% (190) 67% (692) 7% (73) 1032Very Favorable of Biden 38% (179) 47% (222) 10% (48) 2% (8) 3% (13) 470Somewhat Favorable of Biden 9% (39) 45% (193) 29% (124) 8% (34) 9% (39) 429Somewhat Unfavorable of Biden 3% (7) 15% (38) 40% (99) 25% (62) 16% (40) 246Very Unfavorable of Biden 1% (6) 3% (27) 12% (91) 80% (630) 4% (33) 786#1 Issue: Economy 11% (84) 23% (169) 18% (133) 40% (299) 8% (57) 742#1 Issue: Security 2% (9) 9% (36) 17% (71) 66% (268) 6% (26) 409#1 Issue: Health Care 22% (55) 38% (95) 20% (51) 11% (27) 8% (21) 248#1 Issue: Medicare / Social Security 18% (39) 33% (70) 20% (41) 24% (51) 4% (8) 209#1 Issue: Women’s Issues 13% (14) 42% (46) 22% (25) 12% (14) 11% (12) 111#1 Issue: Education 12% (9) 33% (24) 16% (12) 23% (17) 15% (11) 72#1 Issue: Energy 13% (11) 28% (25) 31% (28) 18% (17) 10% (9) 90#1 Issue: Other 16% (18) 19% (23) 10% (11) 44% (52) 11% (13) 1172020 Vote: Joe Biden 22% (212) 44% (416) 20% (193) 6% (61) 7% (64) 9462020 Vote: Donald Trump 2% (19) 5% (40) 16% (135) 72% (620) 6% (50) 8642020 Vote: Didn’t Vote 4% (6) 16% (24) 22% (34) 32% (49) 26% (40) 1532018 House Vote: Democrat 25% (181) 43% (314) 19% (137) 10% (77) 3% (26) 7342018 House Vote: Republican 2% (17) 7% (54) 16% (118) 69% (497) 5% (34) 7192018 House Vote: Someone else 2% (1) 9% (5) 28% (15) 44% (24) 17% (9) 532016 Vote: Hillary Clinton 25% (173) 43% (306) 19% (134) 8% (58) 5% (34) 7062016 Vote: Donald Trump 2% (20) 8% (61) 15% (125) 70% (562) 5% (38) 8052016 Vote: Other 13% (11) 22% (20) 22% (19) 38% (33) 5% (4) 872016 Vote: Didn’t Vote 9% (35) 25% (100) 23% (93) 23% (90) 20% (81) 399Voted in 2014: Yes 13% (175) 24% (323) 17% (229) 41% (548) 4% (48) 1324Voted in 2014: No 10% (64) 24% (163) 21% (142) 29% (196) 16% (109) 674
Continued on next page

98
Morning ConsultTable POL4_3
Table POL4_3: How would you rate each of the following on their handling of the coronavirus?Congressional Democrats
Demographic Excellent Good Just Fair PoorDon’t Know /No Opinion Total N
Registered Voters 12% (239) 24% (487) 19% (371) 37% (744) 8% (157) 19984-Region: Northeast 11% (39) 31% (109) 19% (66) 31% (110) 8% (29) 3534-Region: Midwest 12% (52) 22% (99) 20% (89) 39% (172) 7% (33) 4444-Region: South 12% (86) 23% (168) 19% (141) 40% (296) 7% (55) 7464-Region: West 14% (63) 24% (111) 17% (76) 36% (165) 9% (41) 455Party: Democrat/Leans Democrat 22% (196) 44% (389) 21% (183) 7% (58) 6% (50) 877Party: Republican/Leans Republican 3% (27) 7% (57) 16% (130) 67% (555) 6% (53) 822Note: Row proportions may total to larger than one-hundred percent due to rounding. For more information visit MorningConsultIntelligence.com.

National Tracking Poll #2110009, October, 2021
99
Table POL4_4
Table POL4_4: How would you rate each of the following on their handling of the coronavirus?Congressional Republicans
Demographic Excellent Good Just Fair PoorDon’t Know /No Opinion Total N
Registered Voters 6% (125) 17% (334) 28% (553) 40% (806) 9% (180) 1998Gender: Male 6% (59) 17% (159) 27% (250) 45% (427) 5% (47) 942Gender: Female 6% (67) 17% (175) 29% (302) 36% (379) 13% (134) 1056Age: 18-34 10% (51) 16% (84) 23% (119) 34% (176) 16% (85) 514Age: 35-44 10% (32) 21% (65) 25% (76) 35% (109) 8% (25) 307Age: 45-64 4% (26) 17% (113) 31% (211) 41% (280) 7% (51) 679Age: 65+ 4% (18) 14% (72) 30% (147) 48% (241) 4% (20) 497GenZers: 1997-2012 7% (10) 11% (17) 24% (36) 30% (45) 27% (41) 148Millennials: 1981-1996 12% (64) 21% (115) 22% (123) 35% (192) 11% (62) 556GenXers: 1965-1980 5% (26) 15% (69) 30% (142) 42% (197) 7% (34) 468Baby Boomers: 1946-1964 3% (22) 15% (109) 31% (225) 45% (328) 5% (39) 723PID: Dem (no lean) 5% (34) 8% (58) 19% (144) 62% (463) 6% (46) 745PID: Ind (no lean) 4% (23) 11% (64) 27% (149) 43% (242) 15% (82) 559PID: Rep (no lean) 10% (69) 31% (212) 37% (259) 15% (101) 8% (53) 694PID/Gender: DemMen 6% (21) 8% (27) 18% (65) 66% (233) 3% (9) 355PID/Gender: DemWomen 3% (13) 8% (31) 20% (80) 59% (230) 9% (37) 390PID/Gender: Ind Men 4% (12) 12% (36) 24% (69) 50% (144) 9% (27) 288PID/Gender: Ind Women 4% (11) 10% (28) 29% (80) 36% (97) 20% (55) 271PID/Gender: Rep Men 9% (26) 32% (96) 39% (117) 17% (49) 4% (11) 299PID/Gender: Rep Women 11% (43) 29% (116) 36% (143) 13% (52) 11% (42) 395Ideo: Liberal (1-3) 4% (25) 7% (41) 12% (67) 71% (390) 5% (29) 553Ideo: Moderate (4) 5% (26) 14% (77) 28% (148) 44% (236) 10% (52) 538Ideo: Conservative (5-7) 9% (68) 26% (206) 40% (315) 19% (148) 7% (56) 793Educ: < College 7% (88) 16% (194) 28% (342) 37% (443) 11% (138) 1206Educ: Bachelors degree 4% (22) 20% (99) 27% (134) 44% (222) 5% (25) 501Educ: Post-grad 5% (15) 14% (41) 26% (76) 48% (140) 6% (17) 290Income: Under 50k 6% (54) 16% (141) 26% (229) 40% (356) 12% (102) 882Income: 50k-100k 6% (47) 17% (123) 29% (208) 41% (298) 7% (48) 723Income: 100k+ 6% (24) 18% (70) 29% (115) 39% (152) 8% (31) 392Ethnicity: White 6% (97) 18% (281) 28% (433) 39% (599) 9% (135) 1545Ethnicity: Hispanic 10% (22) 15% (33) 29% (65) 35% (78) 11% (25) 222
Continued on next page

100
Morning ConsultTable POL4_4
Table POL4_4: How would you rate each of the following on their handling of the coronavirus?Congressional Republicans
Demographic Excellent Good Just Fair PoorDon’t Know /No Opinion Total N
Registered Voters 6% (125) 17% (334) 28% (553) 40% (806) 9% (180) 1998Ethnicity: Black 9% (22) 9% (23) 16% (40) 59% (148) 8% (20) 253Ethnicity: Other 3% (7) 15% (30) 40% (79) 29% (58) 13% (26) 200All Christian 7% (68) 19% (199) 30% (312) 36% (371) 7% (76) 1025All Non-Christian 8% (8) 11% (12) 23% (24) 53% (55) 5% (5) 105Atheist 8% (8) 12% (12) 14% (13) 61% (58) 5% (4) 95Agnostic/Nothing in particular 6% (31) 12% (57) 24% (115) 45% (212) 13% (59) 474Something Else 4% (11) 18% (54) 30% (89) 37% (110) 12% (35) 299Religious Non-Protestant/Catholic 10% (13) 16% (20) 22% (28) 48% (61) 5% (6) 128Evangelical 9% (48) 21% (119) 34% (189) 28% (158) 8% (44) 558Non-Evangelical 3% (25) 17% (124) 28% (203) 43% (310) 9% (67) 727Community: Urban 8% (35) 19% (87) 21% (97) 45% (206) 7% (31) 457Community: Suburban 5% (49) 17% (170) 27% (277) 43% (432) 8% (81) 1010Community: Rural 8% (41) 14% (77) 34% (178) 31% (167) 13% (68) 531Employ: Private Sector 6% (42) 19% (133) 29% (196) 39% (265) 7% (50) 687Employ: Government 7% (10) 18% (24) 29% (38) 31% (42) 15% (20) 133Employ: Self-Employed 11% (20) 16% (30) 24% (44) 46% (85) 3% (5) 185Employ: Homemaker 6% (9) 14% (23) 34% (54) 32% (52) 14% (22) 160Employ: Student 3% (2) 16% (10) 18% (11) 36% (22) 26% (16) 61Employ: Retired 3% (15) 17% (85) 29% (147) 47% (241) 4% (22) 509Employ: Unemployed 13% (21) 10% (16) 17% (28) 43% (71) 18% (30) 165Employ: Other 7% (7) 14% (14) 34% (34) 29% (28) 16% (16) 97Military HH: Yes 6% (24) 12% (47) 32% (118) 41% (153) 9% (33) 375Military HH: No 6% (101) 18% (287) 27% (434) 40% (653) 9% (147) 1623RD/WT: Right Direction 6% (45) 13% (99) 17% (124) 57% (423) 7% (54) 745RD/WT: Wrong Track 6% (80) 19% (235) 34% (429) 31% (382) 10% (127) 1253Biden Job Approve 6% (51) 11% (96) 18% (156) 60% (533) 6% (54) 890Biden Job Disapprove 7% (75) 22% (230) 37% (383) 25% (258) 8% (84) 1031
Continued on next page

National Tracking Poll #2110009, October, 2021
101
Table POL4_4
Table POL4_4: How would you rate each of the following on their handling of the coronavirus?Congressional Republicans
Demographic Excellent Good Just Fair PoorDon’t Know /No Opinion Total N
Registered Voters 6% (125) 17% (334) 28% (553) 40% (806) 9% (180) 1998Biden Job Strongly Approve 9% (39) 10% (46) 14% (62) 63% (280) 4% (20) 446Biden Job Somewhat Approve 3% (12) 11% (51) 21% (94) 57% (253) 8% (34) 444Biden Job Somewhat Disapprove 3% (8) 16% (39) 31% (78) 36% (90) 14% (35) 250Biden Job Strongly Disapprove 9% (67) 24% (191) 39% (305) 22% (169) 6% (50) 781Favorable of Biden 6% (50) 10% (93) 17% (157) 60% (541) 6% (58) 899Unfavorable of Biden 7% (69) 23% (237) 37% (382) 24% (252) 9% (92) 1032Very Favorable of Biden 8% (39) 10% (47) 13% (62) 65% (304) 4% (18) 470Somewhat Favorable of Biden 2% (11) 11% (46) 22% (95) 55% (237) 9% (40) 429Somewhat Unfavorable of Biden 2% (5) 15% (37) 32% (78) 35% (85) 16% (41) 246Very Unfavorable of Biden 8% (64) 25% (200) 39% (304) 21% (167) 7% (51) 786#1 Issue: Economy 6% (47) 18% (133) 28% (204) 39% (288) 9% (69) 742#1 Issue: Security 8% (33) 24% (99) 38% (154) 22% (88) 8% (34) 409#1 Issue: Health Care 6% (15) 12% (31) 23% (57) 50% (125) 8% (21) 248#1 Issue: Medicare / Social Security 6% (12) 15% (32) 24% (49) 50% (105) 5% (10) 209#1 Issue: Women’s Issues 6% (7) 8% (9) 18% (21) 56% (62) 12% (13) 111#1 Issue: Education 7% (5) 23% (16) 26% (19) 27% (19) 17% (12) 72#1 Issue: Energy 2% (2) 6% (6) 24% (22) 56% (51) 11% (9) 90#1 Issue: Other 3% (3) 7% (8) 22% (26) 58% (68) 10% (12) 1172020 Vote: Joe Biden 5% (48) 9% (81) 18% (172) 61% (575) 7% (70) 9462020 Vote: Donald Trump 9% (74) 27% (230) 39% (336) 19% (163) 7% (61) 8642020 Vote: Didn’t Vote 2% (4) 13% (19) 25% (38) 31% (47) 29% (45) 1532018 House Vote: Democrat 4% (31) 9% (64) 17% (127) 65% (480) 4% (33) 7342018 House Vote: Republican 9% (62) 26% (189) 40% (288) 21% (148) 4% (32) 7192018 House Vote: Someone else — (0) 18% (10) 16% (8) 43% (23) 24% (13) 532016 Vote: Hillary Clinton 4% (28) 8% (54) 18% (126) 64% (451) 7% (46) 7062016 Vote: Donald Trump 8% (62) 28% (224) 38% (303) 21% (168) 6% (47) 8052016 Vote: Other 3% (3) 5% (4) 28% (24) 56% (49) 8% (7) 872016 Vote: Didn’t Vote 8% (32) 13% (51) 25% (98) 34% (137) 20% (80) 399Voted in 2014: Yes 6% (78) 17% (221) 29% (380) 44% (582) 5% (63) 1324Voted in 2014: No 7% (48) 17% (113) 26% (173) 33% (223) 17% (118) 674
Continued on next page

102
Morning ConsultTable POL4_4
Table POL4_4: How would you rate each of the following on their handling of the coronavirus?Congressional Republicans
Demographic Excellent Good Just Fair PoorDon’t Know /No Opinion Total N
Registered Voters 6% (125) 17% (334) 28% (553) 40% (806) 9% (180) 19984-Region: Northeast 4% (14) 15% (51) 26% (92) 46% (162) 10% (34) 3534-Region: Midwest 6% (25) 17% (76) 30% (133) 37% (167) 10% (44) 4444-Region: South 8% (60) 17% (123) 27% (205) 39% (293) 9% (65) 7464-Region: West 6% (26) 18% (84) 27% (123) 41% (185) 8% (38) 455Party: Democrat/Leans Democrat 4% (35) 8% (72) 19% (163) 63% (549) 7% (58) 877Party: Republican/Leans Republican 10% (80) 28% (232) 38% (309) 16% (134) 8% (67) 822Note: Row proportions may total to larger than one-hundred percent due to rounding. For more information visit MorningConsultIntelligence.com.

National Tracking Poll #2110009, October, 2021
103
Table POL4_5
Table POL4_5: How would you rate each of the following on their handling of the coronavirus?The World Health Organization (WHO)
Demographic Excellent Good Just Fair PoorDon’t Know /No Opinion Total N
Registered Voters 15% (298) 28% (559) 20% (403) 29% (570) 8% (168) 1998Gender: Male 16% (152) 25% (236) 20% (188) 33% (312) 6% (55) 942Gender: Female 14% (146) 31% (323) 20% (216) 24% (259) 11% (113) 1056Age: 18-34 17% (89) 24% (121) 20% (103) 22% (114) 17% (88) 514Age: 35-44 17% (51) 30% (94) 21% (63) 24% (74) 8% (25) 307Age: 45-64 14% (98) 27% (186) 19% (132) 33% (225) 6% (39) 679Age: 65+ 12% (60) 32% (159) 21% (105) 32% (157) 3% (16) 497GenZers: 1997-2012 9% (13) 25% (37) 26% (39) 10% (15) 30% (44) 148Millennials: 1981-1996 18% (103) 26% (146) 19% (105) 26% (143) 11% (60) 556GenXers: 1965-1980 17% (78) 26% (123) 20% (95) 29% (136) 7% (34) 468Baby Boomers: 1946-1964 12% (88) 30% (219) 20% (143) 34% (247) 3% (25) 723PID: Dem (no lean) 26% (196) 43% (317) 17% (129) 8% (56) 6% (47) 745PID: Ind (no lean) 12% (65) 23% (126) 22% (121) 29% (164) 15% (83) 559PID: Rep (no lean) 5% (36) 17% (116) 22% (154) 51% (351) 5% (38) 694PID/Gender: DemMen 27% (96) 41% (145) 18% (63) 12% (41) 3% (10) 355PID/Gender: DemWomen 26% (100) 44% (172) 17% (66) 4% (15) 9% (37) 390PID/Gender: Ind Men 12% (36) 20% (58) 22% (63) 34% (98) 11% (33) 288PID/Gender: Ind Women 11% (29) 25% (68) 22% (58) 24% (65) 19% (51) 271PID/Gender: Rep Men 7% (20) 11% (33) 21% (62) 57% (172) 4% (12) 299PID/Gender: Rep Women 4% (16) 21% (83) 23% (92) 45% (179) 6% (26) 395Ideo: Liberal (1-3) 28% (155) 44% (242) 17% (93) 6% (33) 5% (30) 553Ideo: Moderate (4) 18% (97) 32% (171) 22% (120) 19% (103) 9% (47) 538Ideo: Conservative (5-7) 5% (42) 15% (120) 22% (172) 51% (407) 7% (52) 793Educ: < College 15% (184) 26% (311) 20% (243) 29% (346) 10% (123) 1206Educ: Bachelors degree 16% (80) 29% (148) 19% (95) 30% (151) 6% (28) 501Educ: Post-grad 12% (34) 35% (100) 23% (66) 25% (73) 6% (17) 290Income: Under 50k 15% (131) 28% (249) 21% (183) 25% (223) 11% (96) 882Income: 50k-100k 14% (99) 26% (188) 21% (151) 33% (237) 7% (47) 723Income: 100k+ 17% (68) 31% (121) 18% (69) 28% (110) 6% (24) 392Ethnicity: White 14% (211) 27% (418) 21% (320) 31% (481) 7% (114) 1545Ethnicity: Hispanic 18% (40) 27% (60) 18% (40) 25% (56) 12% (26) 222
Continued on next page

104
Morning ConsultTable POL4_5
Table POL4_5: How would you rate each of the following on their handling of the coronavirus?The World Health Organization (WHO)
Demographic Excellent Good Just Fair PoorDon’t Know /No Opinion Total N
Registered Voters 15% (298) 28% (559) 20% (403) 29% (570) 8% (168) 1998Ethnicity: Black 27% (68) 34% (87) 17% (42) 12% (30) 10% (26) 253Ethnicity: Other 9% (18) 27% (54) 21% (41) 30% (59) 14% (27) 200All Christian 14% (142) 27% (280) 20% (205) 33% (338) 6% (61) 1025All Non-Christian 30% (31) 31% (32) 19% (20) 14% (15) 7% (7) 105Atheist 16% (15) 45% (42) 13% (13) 24% (22) 2% (2) 95Agnostic/Nothing in particular 14% (65) 30% (144) 24% (112) 20% (97) 12% (56) 474Something Else 15% (45) 20% (61) 18% (54) 33% (98) 14% (41) 299Religious Non-Protestant/Catholic 27% (35) 30% (38) 20% (26) 17% (22) 6% (7) 128Evangelical 15% (81) 21% (119) 17% (95) 38% (213) 9% (50) 558Non-Evangelical 14% (102) 29% (212) 22% (157) 28% (205) 7% (52) 727Community: Urban 21% (95) 33% (151) 19% (89) 15% (71) 11% (51) 457Community: Suburban 15% (152) 28% (280) 20% (206) 30% (306) 7% (66) 1010Community: Rural 9% (50) 24% (129) 20% (109) 36% (193) 10% (50) 531Employ: Private Sector 16% (109) 28% (195) 20% (139) 29% (197) 7% (46) 687Employ: Government 7% (9) 25% (34) 24% (32) 29% (38) 15% (20) 133Employ: Self-Employed 22% (40) 25% (45) 16% (30) 29% (53) 9% (16) 185Employ: Homemaker 9% (14) 19% (31) 25% (40) 37% (60) 10% (16) 160Employ: Student 21% (13) 15% (9) 27% (17) 11% (7) 25% (15) 61Employ: Retired 13% (64) 34% (171) 19% (95) 32% (162) 3% (18) 509Employ: Unemployed 19% (31) 24% (39) 20% (34) 22% (36) 15% (25) 165Employ: Other 18% (17) 35% (35) 18% (18) 17% (17) 12% (11) 97Military HH: Yes 11% (42) 26% (99) 23% (87) 33% (123) 7% (24) 375Military HH: No 16% (256) 28% (460) 19% (316) 28% (447) 9% (143) 1623RD/WT: Right Direction 29% (213) 43% (322) 17% (128) 4% (31) 7% (52) 745RD/WT: Wrong Track 7% (85) 19% (237) 22% (276) 43% (539) 9% (116) 1253Biden Job Approve 29% (255) 44% (389) 17% (152) 5% (41) 6% (53) 890Biden Job Disapprove 4% (40) 15% (156) 23% (237) 50% (520) 8% (78) 1031
Continued on next page

National Tracking Poll #2110009, October, 2021
105
Table POL4_5
Table POL4_5: How would you rate each of the following on their handling of the coronavirus?The World Health Organization (WHO)
Demographic Excellent Good Just Fair PoorDon’t Know /No Opinion Total N
Registered Voters 15% (298) 28% (559) 20% (403) 29% (570) 8% (168) 1998Biden Job Strongly Approve 38% (172) 42% (186) 13% (59) 2% (8) 5% (21) 446Biden Job Somewhat Approve 19% (83) 46% (203) 21% (93) 7% (33) 7% (32) 444Biden Job Somewhat Disapprove 6% (14) 32% (80) 33% (83) 16% (39) 13% (33) 250Biden Job Strongly Disapprove 3% (26) 10% (76) 20% (154) 62% (481) 6% (45) 781Favorable of Biden 28% (249) 46% (412) 16% (146) 4% (35) 6% (57) 899Unfavorable of Biden 4% (41) 13% (137) 24% (245) 51% (526) 8% (83) 1032Very Favorable of Biden 38% (177) 45% (210) 13% (60) 1% (5) 4% (19) 470Somewhat Favorable of Biden 17% (73) 47% (202) 20% (86) 7% (30) 9% (39) 429Somewhat Unfavorable of Biden 5% (13) 25% (62) 37% (90) 18% (44) 15% (36) 246Very Unfavorable of Biden 3% (28) 9% (75) 20% (155) 61% (482) 6% (47) 786#1 Issue: Economy 14% (102) 27% (199) 20% (150) 30% (223) 9% (68) 742#1 Issue: Security 5% (22) 15% (61) 19% (77) 54% (220) 7% (29) 409#1 Issue: Health Care 28% (71) 40% (99) 17% (42) 8% (20) 7% (16) 248#1 Issue: Medicare / Social Security 18% (38) 35% (74) 25% (53) 16% (33) 6% (12) 209#1 Issue: Women’s Issues 21% (23) 34% (38) 20% (22) 15% (17) 10% (11) 111#1 Issue: Education 13% (9) 25% (18) 18% (13) 22% (16) 21% (16) 72#1 Issue: Energy 19% (17) 38% (34) 26% (24) 6% (6) 11% (10) 90#1 Issue: Other 14% (16) 31% (37) 19% (22) 31% (36) 5% (6) 1172020 Vote: Joe Biden 26% (242) 43% (407) 18% (169) 7% (62) 7% (65) 9462020 Vote: Donald Trump 4% (36) 13% (112) 23% (195) 54% (463) 7% (58) 8642020 Vote: Didn’t Vote 9% (13) 22% (34) 18% (28) 24% (37) 27% (41) 1532018 House Vote: Democrat 27% (198) 41% (300) 17% (123) 10% (73) 6% (41) 7342018 House Vote: Republican 4% (26) 15% (107) 25% (177) 52% (374) 5% (35) 7192018 House Vote: Someone else 6% (3) 30% (16) 19% (10) 31% (17) 13% (7) 532016 Vote: Hillary Clinton 27% (190) 42% (296) 17% (122) 7% (52) 6% (45) 7062016 Vote: Donald Trump 5% (37) 15% (120) 21% (172) 52% (422) 7% (54) 8052016 Vote: Other 19% (16) 28% (25) 23% (20) 25% (22) 4% (4) 872016 Vote: Didn’t Vote 14% (54) 30% (118) 22% (89) 18% (73) 16% (65) 399Voted in 2014: Yes 15% (195) 29% (378) 20% (268) 31% (413) 5% (69) 1324Voted in 2014: No 15% (102) 27% (181) 20% (136) 23% (157) 15% (99) 674
Continued on next page
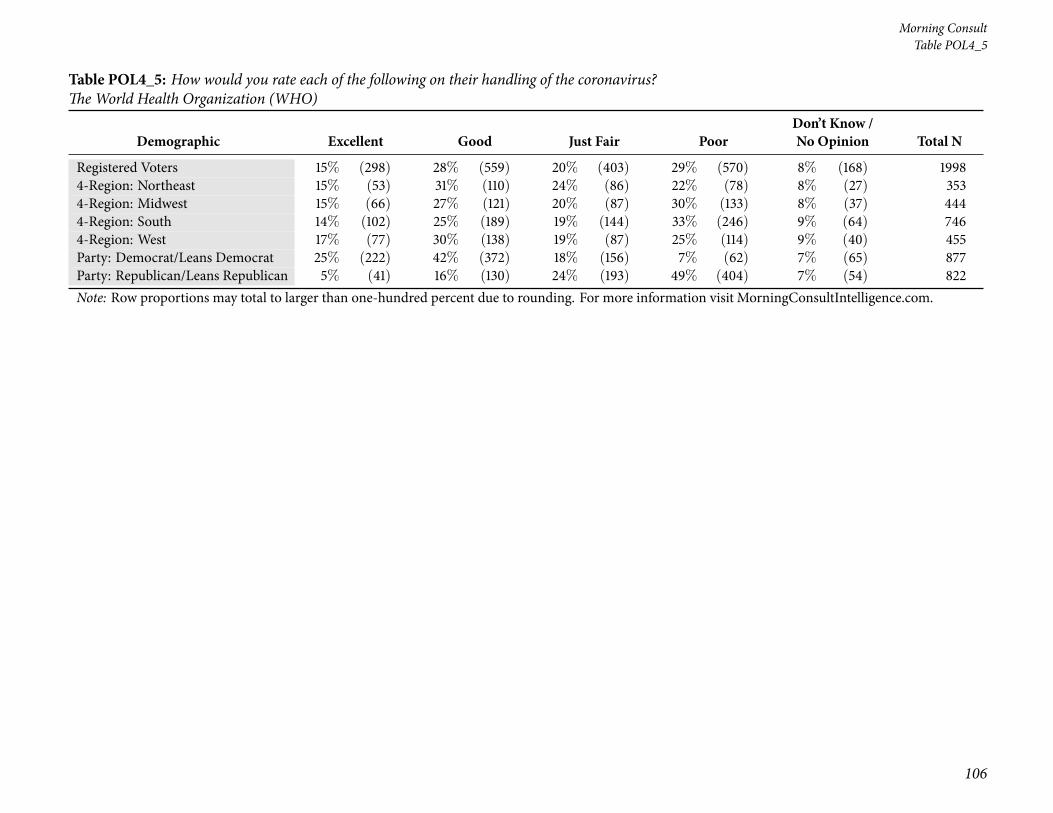
106
Morning ConsultTable POL4_5
Table POL4_5: How would you rate each of the following on their handling of the coronavirus?The World Health Organization (WHO)
Demographic Excellent Good Just Fair PoorDon’t Know /No Opinion Total N
Registered Voters 15% (298) 28% (559) 20% (403) 29% (570) 8% (168) 19984-Region: Northeast 15% (53) 31% (110) 24% (86) 22% (78) 8% (27) 3534-Region: Midwest 15% (66) 27% (121) 20% (87) 30% (133) 8% (37) 4444-Region: South 14% (102) 25% (189) 19% (144) 33% (246) 9% (64) 7464-Region: West 17% (77) 30% (138) 19% (87) 25% (114) 9% (40) 455Party: Democrat/Leans Democrat 25% (222) 42% (372) 18% (156) 7% (62) 7% (65) 877Party: Republican/Leans Republican 5% (41) 16% (130) 24% (193) 49% (404) 7% (54) 822Note: Row proportions may total to larger than one-hundred percent due to rounding. For more information visit MorningConsultIntelligence.com.

National Tracking Poll #2110009, October, 2021
107
Table POL4_6
Table POL4_6: How would you rate each of the following on their handling of the coronavirus?The Centers for Disease Control and Prevention (CDC)
Demographic Excellent Good Just Fair PoorDon’t Know /No Opinion Total N
Registered Voters 21% (428) 29% (588) 20% (401) 23% (463) 6% (118) 1998Gender: Male 23% (216) 28% (262) 19% (181) 26% (249) 4% (34) 942Gender: Female 20% (212) 31% (327) 21% (220) 20% (214) 8% (84) 1056Age: 18-34 23% (120) 23% (118) 23% (118) 19% (97) 12% (61) 514Age: 35-44 20% (62) 33% (101) 20% (62) 20% (63) 6% (19) 307Age: 45-64 20% (139) 29% (200) 19% (128) 27% (184) 4% (28) 679Age: 65+ 22% (107) 34% (170) 19% (92) 24% (119) 2% (9) 497GenZers: 1997-2012 20% (30) 26% (38) 27% (41) 9% (13) 18% (27) 148Millennials: 1981-1996 22% (120) 27% (149) 21% (116) 22% (122) 9% (49) 556GenXers: 1965-1980 22% (103) 29% (137) 21% (97) 23% (107) 5% (24) 468Baby Boomers: 1946-1964 20% (146) 33% (236) 18% (127) 27% (198) 2% (16) 723PID: Dem (no lean) 35% (261) 40% (299) 16% (120) 5% (38) 4% (27) 745PID: Ind (no lean) 19% (106) 23% (130) 22% (123) 26% (143) 10% (57) 559PID: Rep (no lean) 9% (62) 23% (159) 23% (157) 41% (282) 5% (34) 694PID/Gender: DemMen 36% (128) 40% (143) 16% (56) 7% (26) — (2) 355PID/Gender: DemWomen 34% (132) 40% (156) 16% (64) 3% (13) 6% (25) 390PID/Gender: Ind Men 21% (60) 20% (58) 21% (61) 30% (86) 8% (24) 288PID/Gender: Ind Women 17% (46) 27% (73) 23% (62) 21% (57) 12% (33) 271PID/Gender: Rep Men 9% (28) 21% (61) 21% (63) 46% (138) 3% (8) 299PID/Gender: Rep Women 8% (34) 25% (98) 24% (94) 36% (144) 7% (26) 395Ideo: Liberal (1-3) 38% (213) 39% (216) 15% (84) 4% (25) 3% (15) 553Ideo: Moderate (4) 23% (124) 37% (199) 20% (107) 15% (80) 5% (28) 538Ideo: Conservative (5-7) 10% (82) 19% (152) 23% (184) 42% (335) 5% (39) 793Educ: < College 23% (280) 25% (304) 19% (234) 24% (295) 8% (93) 1206Educ: Bachelors degree 18% (89) 35% (178) 21% (106) 22% (112) 3% (17) 501Educ: Post-grad 20% (59) 37% (107) 21% (61) 19% (56) 3% (8) 290Income: Under 50k 24% (211) 25% (221) 21% (181) 22% (195) 8% (74) 882Income: 50k-100k 19% (141) 29% (213) 19% (138) 28% (203) 4% (29) 723Income: 100k+ 20% (77) 39% (154) 21% (82) 16% (64) 4% (15) 392Ethnicity: White 21% (318) 29% (451) 20% (308) 25% (387) 5% (81) 1545Ethnicity: Hispanic 23% (52) 31% (69) 16% (37) 23% (50) 7% (15) 222
Continued on next page
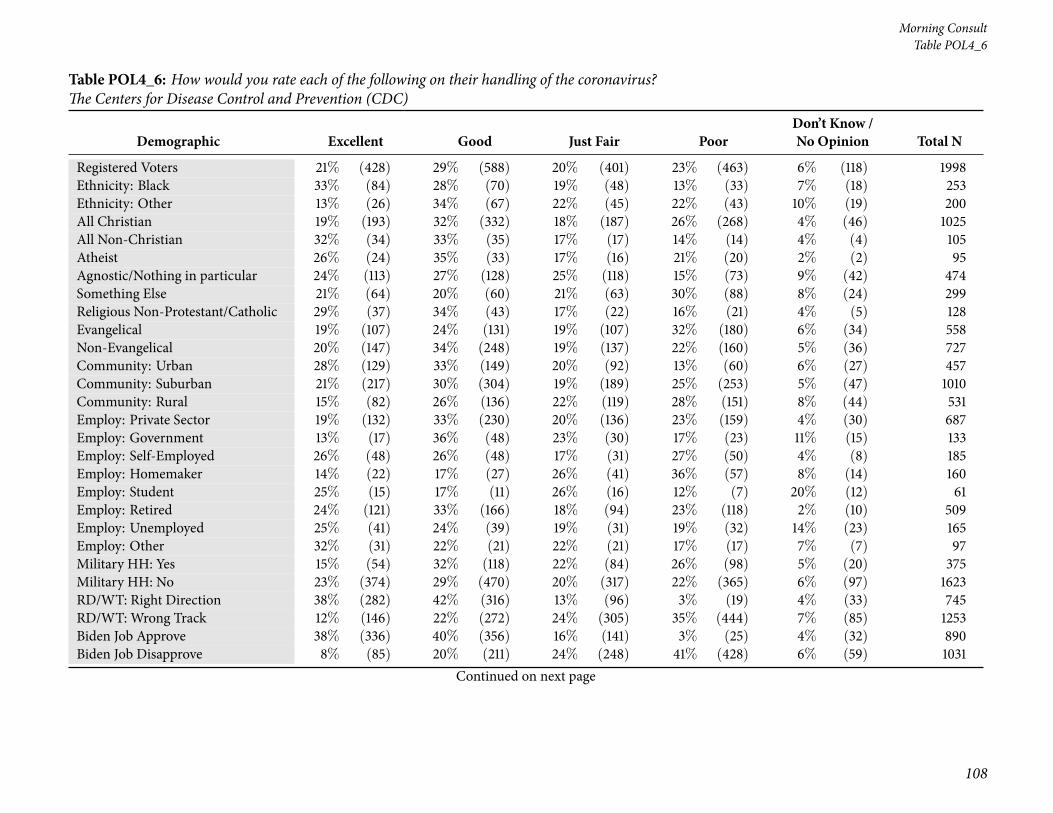
108
Morning ConsultTable POL4_6
Table POL4_6: How would you rate each of the following on their handling of the coronavirus?The Centers for Disease Control and Prevention (CDC)
Demographic Excellent Good Just Fair PoorDon’t Know /No Opinion Total N
Registered Voters 21% (428) 29% (588) 20% (401) 23% (463) 6% (118) 1998Ethnicity: Black 33% (84) 28% (70) 19% (48) 13% (33) 7% (18) 253Ethnicity: Other 13% (26) 34% (67) 22% (45) 22% (43) 10% (19) 200All Christian 19% (193) 32% (332) 18% (187) 26% (268) 4% (46) 1025All Non-Christian 32% (34) 33% (35) 17% (17) 14% (14) 4% (4) 105Atheist 26% (24) 35% (33) 17% (16) 21% (20) 2% (2) 95Agnostic/Nothing in particular 24% (113) 27% (128) 25% (118) 15% (73) 9% (42) 474Something Else 21% (64) 20% (60) 21% (63) 30% (88) 8% (24) 299Religious Non-Protestant/Catholic 29% (37) 34% (43) 17% (22) 16% (21) 4% (5) 128Evangelical 19% (107) 24% (131) 19% (107) 32% (180) 6% (34) 558Non-Evangelical 20% (147) 34% (248) 19% (137) 22% (160) 5% (36) 727Community: Urban 28% (129) 33% (149) 20% (92) 13% (60) 6% (27) 457Community: Suburban 21% (217) 30% (304) 19% (189) 25% (253) 5% (47) 1010Community: Rural 15% (82) 26% (136) 22% (119) 28% (151) 8% (44) 531Employ: Private Sector 19% (132) 33% (230) 20% (136) 23% (159) 4% (30) 687Employ: Government 13% (17) 36% (48) 23% (30) 17% (23) 11% (15) 133Employ: Self-Employed 26% (48) 26% (48) 17% (31) 27% (50) 4% (8) 185Employ: Homemaker 14% (22) 17% (27) 26% (41) 36% (57) 8% (14) 160Employ: Student 25% (15) 17% (11) 26% (16) 12% (7) 20% (12) 61Employ: Retired 24% (121) 33% (166) 18% (94) 23% (118) 2% (10) 509Employ: Unemployed 25% (41) 24% (39) 19% (31) 19% (32) 14% (23) 165Employ: Other 32% (31) 22% (21) 22% (21) 17% (17) 7% (7) 97Military HH: Yes 15% (54) 32% (118) 22% (84) 26% (98) 5% (20) 375Military HH: No 23% (374) 29% (470) 20% (317) 22% (365) 6% (97) 1623RD/WT: Right Direction 38% (282) 42% (316) 13% (96) 3% (19) 4% (33) 745RD/WT: Wrong Track 12% (146) 22% (272) 24% (305) 35% (444) 7% (85) 1253Biden Job Approve 38% (336) 40% (356) 16% (141) 3% (25) 4% (32) 890Biden Job Disapprove 8% (85) 20% (211) 24% (248) 41% (428) 6% (59) 1031
Continued on next page

National Tracking Poll #2110009, October, 2021
109
Table POL4_6
Table POL4_6: How would you rate each of the following on their handling of the coronavirus?The Centers for Disease Control and Prevention (CDC)
Demographic Excellent Good Just Fair PoorDon’t Know /No Opinion Total N
Registered Voters 21% (428) 29% (588) 20% (401) 23% (463) 6% (118) 1998Biden Job Strongly Approve 49% (218) 37% (163) 12% (52) 1% (3) 2% (10) 446Biden Job Somewhat Approve 26% (117) 43% (193) 20% (89) 5% (22) 5% (23) 444Biden Job Somewhat Disapprove 17% (43) 35% (88) 27% (68) 11% (28) 9% (22) 250Biden Job Strongly Disapprove 5% (43) 16% (123) 23% (180) 51% (400) 5% (36) 781Favorable of Biden 39% (346) 41% (368) 15% (134) 2% (22) 3% (29) 899Unfavorable of Biden 7% (72) 20% (208) 25% (258) 42% (430) 6% (64) 1032Very Favorable of Biden 49% (230) 39% (183) 10% (47) 1% (3) 1% (6) 470Somewhat Favorable of Biden 27% (116) 43% (184) 20% (87) 4% (19) 5% (23) 429Somewhat Unfavorable of Biden 13% (32) 35% (85) 29% (72) 11% (28) 11% (28) 246Very Unfavorable of Biden 5% (40) 16% (123) 24% (186) 51% (402) 5% (36) 786#1 Issue: Economy 18% (136) 30% (226) 20% (147) 25% (187) 6% (46) 742#1 Issue: Security 12% (51) 19% (77) 23% (96) 40% (164) 5% (21) 409#1 Issue: Health Care 32% (79) 37% (92) 19% (46) 7% (19) 5% (12) 248#1 Issue: Medicare / Social Security 29% (60) 37% (77) 17% (36) 13% (28) 4% (8) 209#1 Issue: Women’s Issues 29% (33) 32% (35) 19% (21) 13% (15) 7% (8) 111#1 Issue: Education 23% (16) 27% (19) 19% (14) 15% (11) 16% (12) 72#1 Issue: Energy 26% (23) 40% (36) 21% (19) 4% (3) 9% (8) 90#1 Issue: Other 26% (30) 22% (25) 19% (22) 31% (37) 3% (3) 1172020 Vote: Joe Biden 35% (333) 40% (381) 16% (148) 5% (44) 4% (40) 9462020 Vote: Donald Trump 7% (60) 19% (168) 24% (210) 44% (379) 5% (47) 8642020 Vote: Didn’t Vote 19% (30) 21% (31) 21% (31) 21% (32) 19% (29) 1532018 House Vote: Democrat 35% (254) 39% (287) 17% (122) 7% (53) 3% (19) 7342018 House Vote: Republican 7% (47) 23% (163) 25% (180) 42% (302) 4% (27) 7192018 House Vote: Someone else 22% (12) 14% (8) 19% (10) 31% (17) 13% (7) 532016 Vote: Hillary Clinton 36% (251) 39% (278) 16% (113) 5% (38) 4% (27) 7062016 Vote: Donald Trump 9% (73) 21% (167) 23% (186) 43% (344) 4% (35) 8052016 Vote: Other 21% (18) 31% (27) 22% (19) 22% (19) 4% (3) 872016 Vote: Didn’t Vote 22% (86) 29% (116) 21% (83) 15% (61) 13% (53) 399Voted in 2014: Yes 20% (270) 30% (402) 21% (279) 25% (330) 3% (43) 1324Voted in 2014: No 23% (158) 28% (187) 18% (122) 20% (133) 11% (75) 674
Continued on next page

110
Morning ConsultTable POL4_6
Table POL4_6: How would you rate each of the following on their handling of the coronavirus?The Centers for Disease Control and Prevention (CDC)
Demographic Excellent Good Just Fair PoorDon’t Know /No Opinion Total N
Registered Voters 21% (428) 29% (588) 20% (401) 23% (463) 6% (118) 19984-Region: Northeast 22% (78) 34% (120) 20% (71) 18% (63) 6% (20) 3534-Region: Midwest 20% (90) 30% (133) 19% (86) 24% (107) 6% (28) 4444-Region: South 21% (156) 27% (198) 19% (144) 27% (201) 6% (47) 7464-Region: West 23% (104) 30% (137) 22% (98) 20% (92) 5% (23) 455Party: Democrat/Leans Democrat 35% (303) 40% (350) 17% (147) 5% (44) 4% (33) 877Party: Republican/Leans Republican 8% (70) 22% (184) 24% (198) 39% (324) 6% (47) 822Note: Row proportions may total to larger than one-hundred percent due to rounding. For more information visit MorningConsultIntelligence.com.

National Tracking Poll #2110009, October, 2021
111
Table POL4_7
Table POL4_7: How would you rate each of the following on their handling of the coronavirus?Your state’s governor
Demographic Excellent Good Just Fair PoorDon’t Know /No Opinion Total N
Registered Voters 19% (378) 26% (524) 20% (394) 29% (587) 6% (116) 1998Gender: Male 20% (185) 27% (259) 20% (191) 29% (271) 4% (36) 942Gender: Female 18% (193) 25% (265) 19% (203) 30% (316) 8% (80) 1056Age: 18-34 15% (78) 21% (111) 21% (107) 29% (147) 14% (71) 514Age: 35-44 23% (71) 30% (93) 15% (45) 27% (84) 5% (14) 307Age: 45-64 17% (115) 29% (196) 20% (138) 31% (208) 3% (23) 679Age: 65+ 23% (114) 25% (125) 21% (104) 30% (148) 1% (7) 497GenZers: 1997-2012 7% (10) 18% (27) 24% (35) 27% (39) 25% (37) 148Millennials: 1981-1996 20% (113) 25% (137) 18% (99) 29% (161) 8% (46) 556GenXers: 1965-1980 16% (74) 32% (150) 19% (88) 29% (136) 4% (20) 468Baby Boomers: 1946-1964 21% (155) 26% (190) 20% (147) 30% (219) 2% (12) 723PID: Dem (no lean) 27% (201) 31% (228) 16% (118) 21% (160) 5% (38) 745PID: Ind (no lean) 11% (61) 25% (142) 21% (117) 33% (183) 10% (56) 559PID: Rep (no lean) 17% (115) 22% (153) 23% (159) 35% (244) 3% (22) 694PID/Gender: DemMen 27% (95) 33% (118) 18% (63) 21% (76) 1% (3) 355PID/Gender: DemWomen 27% (106) 28% (110) 14% (55) 21% (84) 9% (35) 390PID/Gender: Ind Men 9% (27) 26% (75) 23% (65) 33% (95) 9% (26) 288PID/Gender: Ind Women 13% (35) 25% (67) 19% (52) 32% (87) 11% (30) 271PID/Gender: Rep Men 21% (64) 22% (66) 21% (63) 33% (100) 2% (7) 299PID/Gender: Rep Women 13% (52) 22% (88) 24% (95) 37% (145) 4% (16) 395Ideo: Liberal (1-3) 29% (159) 30% (165) 14% (76) 24% (131) 4% (22) 553Ideo: Moderate (4) 15% (82) 29% (154) 23% (126) 28% (148) 5% (28) 538Ideo: Conservative (5-7) 16% (126) 24% (192) 22% (174) 35% (277) 3% (24) 793Educ: < College 18% (216) 25% (299) 21% (254) 29% (347) 7% (90) 1206Educ: Bachelors degree 19% (97) 29% (147) 17% (83) 32% (159) 3% (16) 501Educ: Post-grad 22% (65) 27% (78) 20% (57) 28% (81) 3% (10) 290Income: Under 50k 18% (155) 23% (206) 22% (190) 30% (260) 8% (71) 882Income: 50k-100k 18% (133) 28% (202) 18% (132) 31% (227) 4% (29) 723Income: 100k+ 23% (90) 29% (116) 18% (72) 25% (100) 4% (16) 392Ethnicity: White 20% (304) 26% (404) 20% (306) 30% (460) 5% (72) 1545Ethnicity: Hispanic 20% (44) 22% (48) 16% (36) 36% (79) 7% (15) 222
Continued on next page

112
Morning ConsultTable POL4_7
Table POL4_7: How would you rate each of the following on their handling of the coronavirus?Your state’s governor
Demographic Excellent Good Just Fair PoorDon’t Know /No Opinion Total N
Registered Voters 19% (378) 26% (524) 20% (394) 29% (587) 6% (116) 1998Ethnicity: Black 19% (48) 28% (70) 22% (56) 22% (55) 9% (23) 253Ethnicity: Other 13% (26) 25% (50) 16% (32) 36% (72) 10% (21) 200All Christian 20% (210) 27% (280) 20% (205) 28% (288) 4% (42) 1025All Non-Christian 26% (28) 22% (23) 21% (22) 27% (29) 4% (4) 105Atheist 23% (22) 21% (20) 21% (20) 31% (29) 5% (4) 95Agnostic/Nothing in particular 15% (73) 27% (130) 20% (96) 28% (131) 9% (44) 474Something Else 15% (46) 24% (71) 17% (52) 37% (110) 7% (21) 299Religious Non-Protestant/Catholic 24% (31) 23% (29) 20% (26) 29% (37) 4% (5) 128Evangelical 18% (99) 27% (148) 21% (116) 30% (168) 5% (28) 558Non-Evangelical 21% (151) 26% (189) 18% (134) 30% (220) 5% (34) 727Community: Urban 23% (105) 32% (146) 17% (76) 22% (101) 6% (29) 457Community: Suburban 19% (193) 26% (266) 20% (202) 30% (300) 5% (49) 1010Community: Rural 15% (79) 21% (112) 22% (116) 35% (186) 7% (38) 531Employ: Private Sector 19% (128) 31% (213) 17% (117) 30% (203) 4% (26) 687Employ: Government 18% (24) 27% (36) 21% (27) 25% (33) 10% (13) 133Employ: Self-Employed 25% (45) 20% (36) 23% (42) 27% (50) 6% (11) 185Employ: Homemaker 12% (19) 20% (32) 24% (38) 37% (60) 7% (11) 160Employ: Student 12% (7) 26% (16) 14% (8) 19% (11) 29% (18) 61Employ: Retired 21% (107) 28% (142) 21% (107) 29% (145) 2% (8) 509Employ: Unemployed 15% (24) 20% (33) 22% (37) 28% (47) 15% (24) 165Employ: Other 22% (22) 16% (15) 18% (17) 39% (38) 6% (6) 97Military HH: Yes 17% (65) 24% (92) 21% (77) 34% (126) 4% (15) 375Military HH: No 19% (313) 27% (432) 20% (317) 28% (461) 6% (101) 1623RD/WT: Right Direction 27% (205) 32% (242) 16% (117) 19% (141) 5% (40) 745RD/WT: Wrong Track 14% (173) 22% (281) 22% (277) 36% (445) 6% (76) 1253Biden Job Approve 26% (234) 32% (284) 18% (156) 20% (178) 4% (39) 890Biden Job Disapprove 14% (141) 22% (228) 22% (228) 38% (391) 4% (44) 1031
Continued on next page
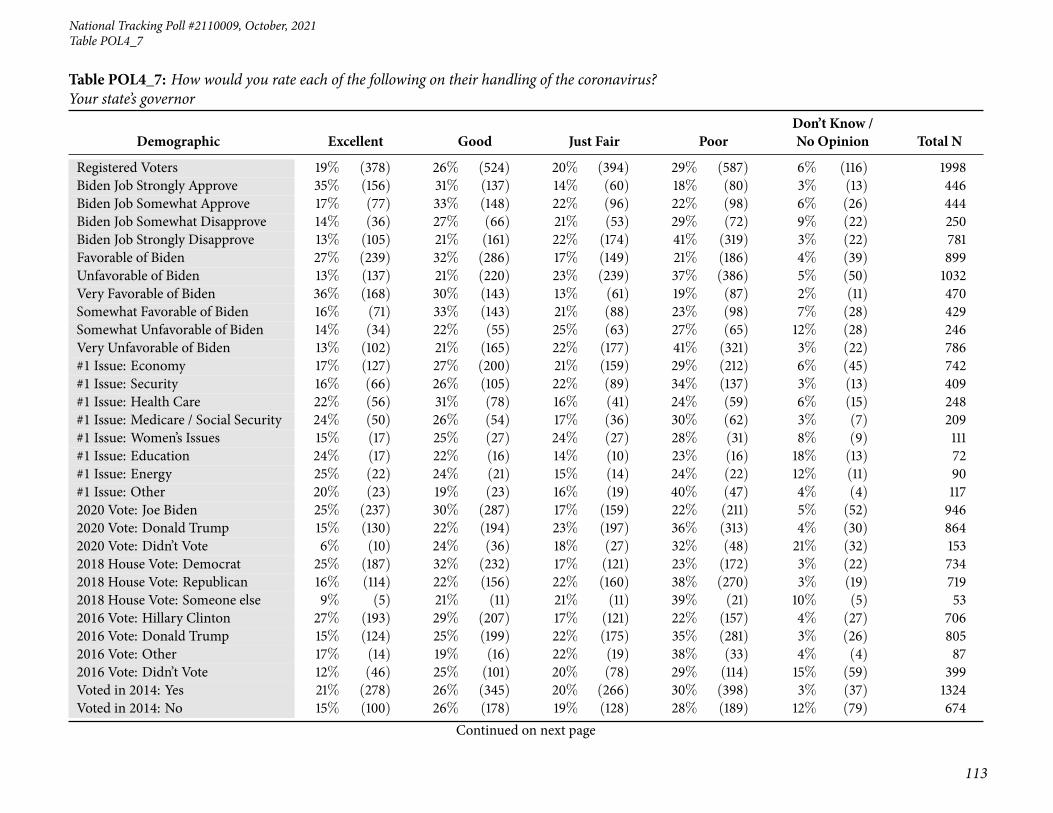
National Tracking Poll #2110009, October, 2021
113
Table POL4_7
Table POL4_7: How would you rate each of the following on their handling of the coronavirus?Your state’s governor
Demographic Excellent Good Just Fair PoorDon’t Know /No Opinion Total N
Registered Voters 19% (378) 26% (524) 20% (394) 29% (587) 6% (116) 1998Biden Job Strongly Approve 35% (156) 31% (137) 14% (60) 18% (80) 3% (13) 446Biden Job Somewhat Approve 17% (77) 33% (148) 22% (96) 22% (98) 6% (26) 444Biden Job Somewhat Disapprove 14% (36) 27% (66) 21% (53) 29% (72) 9% (22) 250Biden Job Strongly Disapprove 13% (105) 21% (161) 22% (174) 41% (319) 3% (22) 781Favorable of Biden 27% (239) 32% (286) 17% (149) 21% (186) 4% (39) 899Unfavorable of Biden 13% (137) 21% (220) 23% (239) 37% (386) 5% (50) 1032Very Favorable of Biden 36% (168) 30% (143) 13% (61) 19% (87) 2% (11) 470Somewhat Favorable of Biden 16% (71) 33% (143) 21% (88) 23% (98) 7% (28) 429Somewhat Unfavorable of Biden 14% (34) 22% (55) 25% (63) 27% (65) 12% (28) 246Very Unfavorable of Biden 13% (102) 21% (165) 22% (177) 41% (321) 3% (22) 786#1 Issue: Economy 17% (127) 27% (200) 21% (159) 29% (212) 6% (45) 742#1 Issue: Security 16% (66) 26% (105) 22% (89) 34% (137) 3% (13) 409#1 Issue: Health Care 22% (56) 31% (78) 16% (41) 24% (59) 6% (15) 248#1 Issue: Medicare / Social Security 24% (50) 26% (54) 17% (36) 30% (62) 3% (7) 209#1 Issue: Women’s Issues 15% (17) 25% (27) 24% (27) 28% (31) 8% (9) 111#1 Issue: Education 24% (17) 22% (16) 14% (10) 23% (16) 18% (13) 72#1 Issue: Energy 25% (22) 24% (21) 15% (14) 24% (22) 12% (11) 90#1 Issue: Other 20% (23) 19% (23) 16% (19) 40% (47) 4% (4) 1172020 Vote: Joe Biden 25% (237) 30% (287) 17% (159) 22% (211) 5% (52) 9462020 Vote: Donald Trump 15% (130) 22% (194) 23% (197) 36% (313) 4% (30) 8642020 Vote: Didn’t Vote 6% (10) 24% (36) 18% (27) 32% (48) 21% (32) 1532018 House Vote: Democrat 25% (187) 32% (232) 17% (121) 23% (172) 3% (22) 7342018 House Vote: Republican 16% (114) 22% (156) 22% (160) 38% (270) 3% (19) 7192018 House Vote: Someone else 9% (5) 21% (11) 21% (11) 39% (21) 10% (5) 532016 Vote: Hillary Clinton 27% (193) 29% (207) 17% (121) 22% (157) 4% (27) 7062016 Vote: Donald Trump 15% (124) 25% (199) 22% (175) 35% (281) 3% (26) 8052016 Vote: Other 17% (14) 19% (16) 22% (19) 38% (33) 4% (4) 872016 Vote: Didn’t Vote 12% (46) 25% (101) 20% (78) 29% (114) 15% (59) 399Voted in 2014: Yes 21% (278) 26% (345) 20% (266) 30% (398) 3% (37) 1324Voted in 2014: No 15% (100) 26% (178) 19% (128) 28% (189) 12% (79) 674
Continued on next page

114
Morning ConsultTable POL4_7
Table POL4_7: How would you rate each of the following on their handling of the coronavirus?Your state’s governor
Demographic Excellent Good Just Fair PoorDon’t Know /No Opinion Total N
Registered Voters 19% (378) 26% (524) 20% (394) 29% (587) 6% (116) 19984-Region: Northeast 21% (73) 34% (120) 17% (60) 22% (77) 6% (22) 3534-Region: Midwest 19% (84) 25% (110) 24% (104) 26% (117) 6% (28) 4444-Region: South 18% (137) 23% (174) 21% (155) 32% (241) 5% (38) 7464-Region: West 18% (83) 26% (119) 16% (75) 33% (151) 6% (27) 455Party: Democrat/Leans Democrat 25% (218) 31% (275) 16% (142) 22% (194) 5% (47) 877Party: Republican/Leans Republican 16% (130) 22% (184) 22% (184) 36% (293) 4% (32) 822Note: Row proportions may total to larger than one-hundred percent due to rounding. For more information visit MorningConsultIntelligence.com.

National Tracking Poll #2110009, October, 2021
115
Table POL4_8
Table POL4_8: How would you rate each of the following on their handling of the coronavirus?Dr. Anthony Fauci, Director of the National Institute of Allergy and Infectious Diseases
Demographic Excellent Good Just Fair PoorDon’t Know /No Opinion Total N
Registered Voters 26% (520) 22% (445) 13% (257) 31% (625) 8% (150) 1998Gender: Male 26% (243) 22% (209) 13% (122) 33% (314) 6% (54) 942Gender: Female 26% (277) 22% (237) 13% (135) 29% (311) 9% (96) 1056Age: 18-34 20% (105) 19% (100) 16% (83) 26% (135) 18% (90) 514Age: 35-44 23% (70) 28% (85) 18% (56) 25% (77) 6% (19) 307Age: 45-64 26% (178) 22% (150) 11% (73) 36% (246) 5% (33) 679Age: 65+ 33% (167) 22% (111) 9% (45) 34% (167) 2% (8) 497GenZers: 1997-2012 13% (20) 20% (29) 22% (33) 15% (22) 30% (44) 148Millennials: 1981-1996 22% (122) 23% (129) 15% (85) 29% (163) 10% (57) 556GenXers: 1965-1980 26% (120) 25% (116) 14% (65) 30% (140) 6% (28) 468Baby Boomers: 1946-1964 30% (219) 21% (153) 8% (60) 38% (272) 3% (20) 723PID: Dem (no lean) 48% (354) 31% (230) 10% (76) 5% (39) 6% (46) 745PID: Ind (no lean) 20% (109) 20% (113) 14% (76) 34% (192) 12% (69) 559PID: Rep (no lean) 8% (57) 15% (103) 15% (106) 57% (394) 5% (35) 694PID/Gender: DemMen 45% (160) 32% (114) 11% (40) 8% (27) 4% (14) 355PID/Gender: DemWomen 50% (194) 30% (116) 9% (36) 3% (12) 8% (32) 390PID/Gender: Ind Men 20% (58) 18% (53) 13% (38) 38% (110) 11% (30) 288PID/Gender: Ind Women 19% (51) 22% (60) 14% (38) 30% (83) 14% (39) 271PID/Gender: Rep Men 8% (25) 14% (42) 15% (44) 59% (177) 3% (10) 299PID/Gender: Rep Women 8% (32) 15% (61) 16% (62) 55% (216) 6% (25) 395Ideo: Liberal (1-3) 54% (301) 30% (165) 6% (34) 5% (28) 4% (24) 553Ideo: Moderate (4) 27% (144) 30% (159) 16% (84) 20% (108) 8% (44) 538Ideo: Conservative (5-7) 8% (66) 13% (103) 15% (122) 58% (463) 5% (39) 793Educ: < College 25% (297) 19% (234) 14% (170) 32% (387) 10% (117) 1206Educ: Bachelors degree 25% (126) 26% (131) 12% (61) 32% (162) 4% (21) 501Educ: Post-grad 33% (96) 28% (80) 9% (26) 26% (76) 4% (12) 290Income: Under 50k 26% (228) 20% (174) 14% (122) 30% (261) 11% (97) 882Income: 50k-100k 26% (186) 21% (151) 12% (84) 37% (267) 5% (35) 723Income: 100k+ 27% (105) 30% (120) 13% (52) 25% (98) 5% (18) 392Ethnicity: White 25% (386) 22% (342) 12% (183) 35% (538) 6% (97) 1545Ethnicity: Hispanic 24% (54) 23% (51) 17% (37) 28% (62) 8% (18) 222
Continued on next page
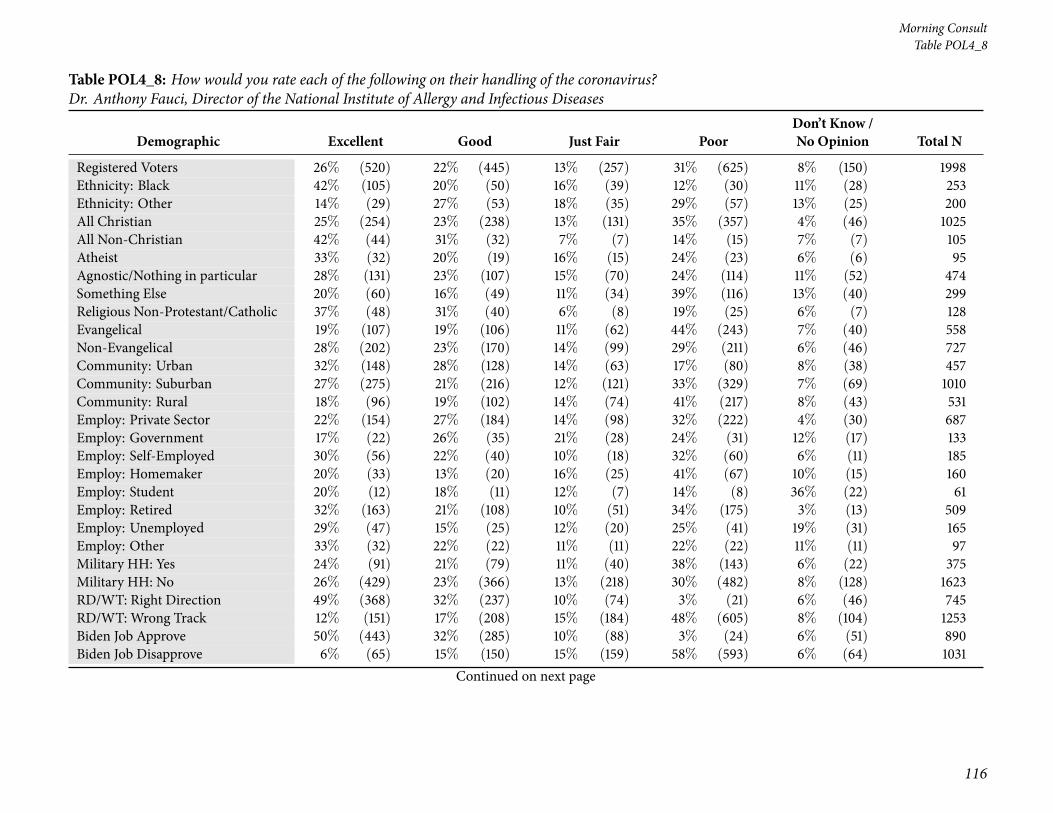
116
Morning ConsultTable POL4_8
Table POL4_8: How would you rate each of the following on their handling of the coronavirus?Dr. Anthony Fauci, Director of the National Institute of Allergy and Infectious Diseases
Demographic Excellent Good Just Fair PoorDon’t Know /No Opinion Total N
Registered Voters 26% (520) 22% (445) 13% (257) 31% (625) 8% (150) 1998Ethnicity: Black 42% (105) 20% (50) 16% (39) 12% (30) 11% (28) 253Ethnicity: Other 14% (29) 27% (53) 18% (35) 29% (57) 13% (25) 200All Christian 25% (254) 23% (238) 13% (131) 35% (357) 4% (46) 1025All Non-Christian 42% (44) 31% (32) 7% (7) 14% (15) 7% (7) 105Atheist 33% (32) 20% (19) 16% (15) 24% (23) 6% (6) 95Agnostic/Nothing in particular 28% (131) 23% (107) 15% (70) 24% (114) 11% (52) 474Something Else 20% (60) 16% (49) 11% (34) 39% (116) 13% (40) 299Religious Non-Protestant/Catholic 37% (48) 31% (40) 6% (8) 19% (25) 6% (7) 128Evangelical 19% (107) 19% (106) 11% (62) 44% (243) 7% (40) 558Non-Evangelical 28% (202) 23% (170) 14% (99) 29% (211) 6% (46) 727Community: Urban 32% (148) 28% (128) 14% (63) 17% (80) 8% (38) 457Community: Suburban 27% (275) 21% (216) 12% (121) 33% (329) 7% (69) 1010Community: Rural 18% (96) 19% (102) 14% (74) 41% (217) 8% (43) 531Employ: Private Sector 22% (154) 27% (184) 14% (98) 32% (222) 4% (30) 687Employ: Government 17% (22) 26% (35) 21% (28) 24% (31) 12% (17) 133Employ: Self-Employed 30% (56) 22% (40) 10% (18) 32% (60) 6% (11) 185Employ: Homemaker 20% (33) 13% (20) 16% (25) 41% (67) 10% (15) 160Employ: Student 20% (12) 18% (11) 12% (7) 14% (8) 36% (22) 61Employ: Retired 32% (163) 21% (108) 10% (51) 34% (175) 3% (13) 509Employ: Unemployed 29% (47) 15% (25) 12% (20) 25% (41) 19% (31) 165Employ: Other 33% (32) 22% (22) 11% (11) 22% (22) 11% (11) 97Military HH: Yes 24% (91) 21% (79) 11% (40) 38% (143) 6% (22) 375Military HH: No 26% (429) 23% (366) 13% (218) 30% (482) 8% (128) 1623RD/WT: Right Direction 49% (368) 32% (237) 10% (74) 3% (21) 6% (46) 745RD/WT: Wrong Track 12% (151) 17% (208) 15% (184) 48% (605) 8% (104) 1253Biden Job Approve 50% (443) 32% (285) 10% (88) 3% (24) 6% (51) 890Biden Job Disapprove 6% (65) 15% (150) 15% (159) 58% (593) 6% (64) 1031
Continued on next page

National Tracking Poll #2110009, October, 2021
117
Table POL4_8
Table POL4_8: How would you rate each of the following on their handling of the coronavirus?Dr. Anthony Fauci, Director of the National Institute of Allergy and Infectious Diseases
Demographic Excellent Good Just Fair PoorDon’t Know /No Opinion Total N
Registered Voters 26% (520) 22% (445) 13% (257) 31% (625) 8% (150) 1998Biden Job Strongly Approve 62% (276) 28% (124) 5% (21) 2% (8) 4% (18) 446Biden Job Somewhat Approve 38% (167) 36% (162) 15% (67) 4% (16) 7% (32) 444Biden Job Somewhat Disapprove 13% (33) 33% (82) 25% (62) 17% (42) 13% (31) 250Biden Job Strongly Disapprove 4% (32) 9% (68) 12% (97) 71% (551) 4% (33) 781Favorable of Biden 51% (457) 31% (283) 10% (87) 2% (21) 6% (52) 899Unfavorable of Biden 5% (54) 14% (149) 16% (165) 58% (594) 7% (69) 1032Very Favorable of Biden 63% (295) 27% (125) 6% (30) 1% (5) 3% (15) 470Somewhat Favorable of Biden 38% (162) 37% (158) 13% (57) 4% (16) 9% (37) 429Somewhat Unfavorable of Biden 13% (31) 30% (73) 27% (67) 17% (42) 14% (33) 246Very Unfavorable of Biden 3% (23) 10% (77) 13% (99) 70% (552) 5% (36) 786#1 Issue: Economy 20% (151) 22% (164) 16% (115) 34% (249) 9% (63) 742#1 Issue: Security 10% (41) 17% (68) 11% (45) 59% (239) 4% (15) 409#1 Issue: Health Care 44% (109) 26% (66) 14% (35) 8% (20) 7% (18) 248#1 Issue: Medicare / Social Security 42% (89) 28% (57) 8% (16) 17% (36) 5% (11) 209#1 Issue: Women’s Issues 36% (40) 24% (26) 13% (14) 12% (14) 15% (17) 111#1 Issue: Education 20% (15) 33% (24) 9% (6) 23% (17) 15% (11) 72#1 Issue: Energy 36% (33) 25% (22) 18% (16) 10% (9) 11% (10) 90#1 Issue: Other 37% (43) 15% (18) 8% (9) 36% (42) 4% (5) 1172020 Vote: Joe Biden 48% (454) 31% (292) 10% (97) 4% (40) 7% (62) 9462020 Vote: Donald Trump 5% (42) 14% (120) 14% (123) 62% (532) 5% (47) 8642020 Vote: Didn’t Vote 13% (19) 18% (27) 19% (30) 27% (41) 23% (36) 1532018 House Vote: Democrat 51% (371) 28% (202) 10% (74) 7% (54) 4% (32) 7342018 House Vote: Republican 6% (45) 16% (116) 15% (108) 58% (419) 4% (31) 7192018 House Vote: Someone else 16% (8) 23% (13) 15% (8) 34% (18) 12% (6) 532016 Vote: Hillary Clinton 51% (361) 29% (205) 8% (57) 6% (42) 6% (40) 7062016 Vote: Donald Trump 7% (57) 14% (117) 15% (125) 58% (468) 5% (38) 8052016 Vote: Other 28% (24) 28% (24) 14% (12) 25% (22) 6% (5) 872016 Vote: Didn’t Vote 19% (77) 25% (99) 16% (64) 23% (92) 17% (67) 399Voted in 2014: Yes 28% (377) 22% (294) 12% (164) 33% (437) 4% (52) 1324Voted in 2014: No 21% (143) 22% (152) 14% (93) 28% (188) 15% (98) 674
Continued on next page

118
Morning ConsultTable POL4_8
Table POL4_8: How would you rate each of the following on their handling of the coronavirus?Dr. Anthony Fauci, Director of the National Institute of Allergy and Infectious Diseases
Demographic Excellent Good Just Fair PoorDon’t Know /No Opinion Total N
Registered Voters 26% (520) 22% (445) 13% (257) 31% (625) 8% (150) 19984-Region: Northeast 29% (104) 24% (85) 14% (48) 26% (91) 7% (25) 3534-Region: Midwest 25% (113) 22% (100) 9% (39) 36% (160) 7% (32) 4444-Region: South 24% (179) 20% (147) 15% (108) 34% (253) 8% (58) 7464-Region: West 27% (124) 25% (115) 13% (61) 27% (122) 7% (34) 455Party: Democrat/Leans Democrat 46% (408) 31% (269) 11% (96) 5% (47) 7% (58) 877Party: Republican/Leans Republican 7% (61) 15% (127) 15% (121) 57% (467) 6% (46) 822Note: Row proportions may total to larger than one-hundred percent due to rounding. For more information visit MorningConsultIntelligence.com.
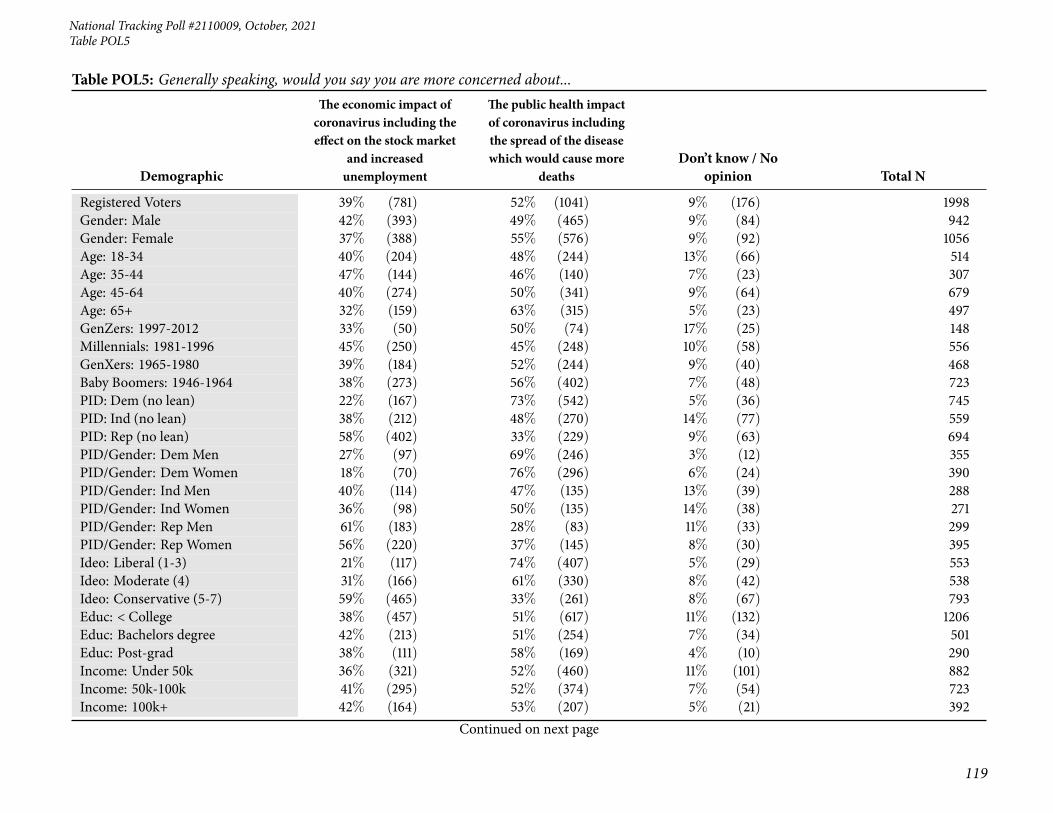
National Tracking Poll #2110009, October, 2021
119
Table POL5
Table POL5: Generally speaking, would you say you are more concerned about...
Demographic
The economic impact ofcoronavirus including theeffect on the stock market
and increasedunemployment
The public health impactof coronavirus includingthe spread of the diseasewhich would cause more
deathsDon’t know / No
opinion Total N
Registered Voters 39% (781) 52% (1041) 9% (176) 1998Gender: Male 42% (393) 49% (465) 9% (84) 942Gender: Female 37% (388) 55% (576) 9% (92) 1056Age: 18-34 40% (204) 48% (244) 13% (66) 514Age: 35-44 47% (144) 46% (140) 7% (23) 307Age: 45-64 40% (274) 50% (341) 9% (64) 679Age: 65+ 32% (159) 63% (315) 5% (23) 497GenZers: 1997-2012 33% (50) 50% (74) 17% (25) 148Millennials: 1981-1996 45% (250) 45% (248) 10% (58) 556GenXers: 1965-1980 39% (184) 52% (244) 9% (40) 468Baby Boomers: 1946-1964 38% (273) 56% (402) 7% (48) 723PID: Dem (no lean) 22% (167) 73% (542) 5% (36) 745PID: Ind (no lean) 38% (212) 48% (270) 14% (77) 559PID: Rep (no lean) 58% (402) 33% (229) 9% (63) 694PID/Gender: DemMen 27% (97) 69% (246) 3% (12) 355PID/Gender: DemWomen 18% (70) 76% (296) 6% (24) 390PID/Gender: Ind Men 40% (114) 47% (135) 13% (39) 288PID/Gender: Ind Women 36% (98) 50% (135) 14% (38) 271PID/Gender: Rep Men 61% (183) 28% (83) 11% (33) 299PID/Gender: Rep Women 56% (220) 37% (145) 8% (30) 395Ideo: Liberal (1-3) 21% (117) 74% (407) 5% (29) 553Ideo: Moderate (4) 31% (166) 61% (330) 8% (42) 538Ideo: Conservative (5-7) 59% (465) 33% (261) 8% (67) 793Educ: < College 38% (457) 51% (617) 11% (132) 1206Educ: Bachelors degree 42% (213) 51% (254) 7% (34) 501Educ: Post-grad 38% (111) 58% (169) 4% (10) 290Income: Under 50k 36% (321) 52% (460) 11% (101) 882Income: 50k-100k 41% (295) 52% (374) 7% (54) 723Income: 100k+ 42% (164) 53% (207) 5% (21) 392
Continued on next page
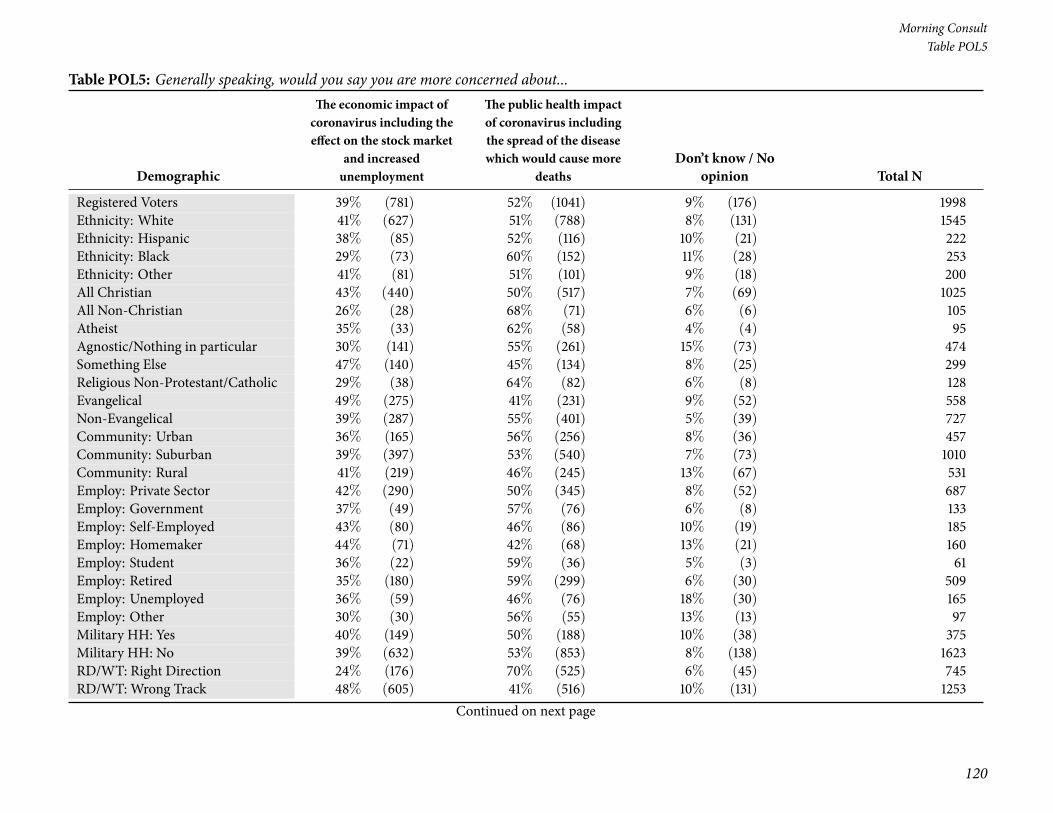
120
Morning ConsultTable POL5
Table POL5: Generally speaking, would you say you are more concerned about...
Demographic
The economic impact ofcoronavirus including theeffect on the stock market
and increasedunemployment
The public health impactof coronavirus includingthe spread of the diseasewhich would cause more
deathsDon’t know / No
opinion Total N
Registered Voters 39% (781) 52% (1041) 9% (176) 1998Ethnicity: White 41% (627) 51% (788) 8% (131) 1545Ethnicity: Hispanic 38% (85) 52% (116) 10% (21) 222Ethnicity: Black 29% (73) 60% (152) 11% (28) 253Ethnicity: Other 41% (81) 51% (101) 9% (18) 200All Christian 43% (440) 50% (517) 7% (69) 1025All Non-Christian 26% (28) 68% (71) 6% (6) 105Atheist 35% (33) 62% (58) 4% (4) 95Agnostic/Nothing in particular 30% (141) 55% (261) 15% (73) 474Something Else 47% (140) 45% (134) 8% (25) 299Religious Non-Protestant/Catholic 29% (38) 64% (82) 6% (8) 128Evangelical 49% (275) 41% (231) 9% (52) 558Non-Evangelical 39% (287) 55% (401) 5% (39) 727Community: Urban 36% (165) 56% (256) 8% (36) 457Community: Suburban 39% (397) 53% (540) 7% (73) 1010Community: Rural 41% (219) 46% (245) 13% (67) 531Employ: Private Sector 42% (290) 50% (345) 8% (52) 687Employ: Government 37% (49) 57% (76) 6% (8) 133Employ: Self-Employed 43% (80) 46% (86) 10% (19) 185Employ: Homemaker 44% (71) 42% (68) 13% (21) 160Employ: Student 36% (22) 59% (36) 5% (3) 61Employ: Retired 35% (180) 59% (299) 6% (30) 509Employ: Unemployed 36% (59) 46% (76) 18% (30) 165Employ: Other 30% (30) 56% (55) 13% (13) 97Military HH: Yes 40% (149) 50% (188) 10% (38) 375Military HH: No 39% (632) 53% (853) 8% (138) 1623RD/WT: Right Direction 24% (176) 70% (525) 6% (45) 745RD/WT: Wrong Track 48% (605) 41% (516) 10% (131) 1253
Continued on next page

National Tracking Poll #2110009, October, 2021
121
Table POL5
Table POL5: Generally speaking, would you say you are more concerned about...
Demographic
The economic impact ofcoronavirus including theeffect on the stock market
and increasedunemployment
The public health impactof coronavirus includingthe spread of the diseasewhich would cause more
deathsDon’t know / No
opinion Total N
Registered Voters 39% (781) 52% (1041) 9% (176) 1998Biden Job Approve 20% (181) 75% (670) 4% (39) 890Biden Job Disapprove 57% (586) 32% (335) 11% (110) 1031Biden Job Strongly Approve 17% (76) 78% (348) 5% (22) 446Biden Job Somewhat Approve 24% (105) 73% (322) 4% (17) 444Biden Job Somewhat Disapprove 42% (105) 47% (117) 11% (28) 250Biden Job Strongly Disapprove 62% (481) 28% (218) 10% (82) 781Favorable of Biden 21% (185) 75% (673) 5% (41) 899Unfavorable of Biden 56% (578) 33% (336) 11% (119) 1032Very Favorable of Biden 17% (80) 77% (364) 5% (26) 470Somewhat Favorable of Biden 24% (105) 72% (309) 4% (15) 429Somewhat Unfavorable of Biden 40% (100) 46% (113) 14% (34) 246Very Unfavorable of Biden 61% (479) 28% (223) 11% (85) 786#1 Issue: Economy 49% (366) 43% (318) 8% (58) 742#1 Issue: Security 54% (219) 36% (149) 10% (41) 409#1 Issue: Health Care 22% (54) 74% (184) 4% (10) 248#1 Issue: Medicare / Social Security 25% (52) 70% (145) 5% (11) 209#1 Issue: Women’s Issues 23% (25) 69% (77) 8% (9) 111#1 Issue: Education 27% (20) 48% (35) 25% (18) 72#1 Issue: Energy 16% (15) 72% (64) 12% (11) 90#1 Issue: Other 25% (30) 59% (69) 16% (18) 1172020 Vote: Joe Biden 22% (208) 73% (691) 5% (46) 9462020 Vote: Donald Trump 59% (514) 30% (260) 10% (90) 8642020 Vote: Didn’t Vote 27% (41) 50% (77) 23% (35) 1532018 House Vote: Democrat 22% (158) 74% (545) 4% (31) 7342018 House Vote: Republican 58% (415) 33% (236) 9% (68) 7192018 House Vote: Someone else 40% (21) 43% (23) 18% (9) 53
Continued on next page

122
Morning ConsultTable POL5
Table POL5: Generally speaking, would you say you are more concerned about...
Demographic
The economic impact ofcoronavirus including theeffect on the stock market
and increasedunemployment
The public health impactof coronavirus includingthe spread of the diseasewhich would cause more
deathsDon’t know / No
opinion Total N
Registered Voters 39% (781) 52% (1041) 9% (176) 19982016 Vote: Hillary Clinton 22% (155) 74% (521) 4% (30) 7062016 Vote: Donald Trump 57% (463) 34% (273) 9% (69) 8052016 Vote: Other 33% (29) 61% (53) 6% (5) 872016 Vote: Didn’t Vote 33% (134) 49% (194) 18% (71) 399Voted in 2014: Yes 40% (534) 53% (707) 6% (83) 1324Voted in 2014: No 37% (247) 49% (334) 14% (93) 6744-Region: Northeast 41% (145) 53% (188) 6% (21) 3534-Region: Midwest 41% (180) 52% (232) 7% (32) 4444-Region: South 38% (284) 51% (381) 11% (80) 7464-Region: West 38% (172) 53% (240) 9% (43) 455Party: Democrat/Leans Democrat 22% (193) 73% (642) 5% (42) 877Party: Republican/Leans Republican 57% (468) 33% (274) 10% (80) 822Note: Row proportions may total to larger than one-hundred percent due to rounding. For more information visit MorningConsultIntelligence.com.

National Tracking Poll #2110009, October, 2021
123
Table POL6
Table POL6: Currently, do you believe it’s more important for the government to address the:
DemographicThe spread ofcoronavirus The economy
Don’t know / Noopinion Total N
Registered Voters 46% (922) 45% (905) 9% (171) 1998Gender: Male 45% (425) 47% (446) 8% (72) 942Gender: Female 47% (498) 43% (459) 9% (99) 1056Age: 18-34 44% (227) 46% (239) 9% (49) 514Age: 35-44 40% (123) 48% (148) 11% (35) 307Age: 45-64 43% (290) 48% (327) 9% (63) 679Age: 65+ 57% (282) 38% (191) 5% (24) 497GenZers: 1997-2012 52% (77) 33% (49) 15% (22) 148Millennials: 1981-1996 40% (221) 51% (285) 9% (50) 556GenXers: 1965-1980 44% (208) 44% (208) 11% (52) 468Baby Boomers: 1946-1964 49% (357) 46% (330) 5% (36) 723PID: Dem (no lean) 69% (514) 25% (184) 6% (47) 745PID: Ind (no lean) 44% (245) 45% (252) 11% (62) 559PID: Rep (no lean) 24% (164) 68% (469) 9% (61) 694PID/Gender: DemMen 66% (235) 29% (103) 5% (17) 355PID/Gender: DemWomen 72% (279) 21% (80) 8% (30) 390PID/Gender: Ind Men 46% (133) 45% (130) 9% (25) 288PID/Gender: Ind Women 41% (112) 45% (122) 14% (37) 271PID/Gender: Rep Men 19% (57) 71% (212) 10% (29) 299PID/Gender: Rep Women 27% (106) 65% (257) 8% (32) 395Ideo: Liberal (1-3) 74% (406) 22% (121) 5% (25) 553Ideo: Moderate (4) 53% (285) 38% (206) 9% (48) 538Ideo: Conservative (5-7) 25% (201) 66% (526) 8% (65) 793Educ: < College 44% (533) 45% (547) 10% (126) 1206Educ: Bachelors degree 47% (234) 47% (233) 7% (34) 501Educ: Post-grad 53% (155) 43% (124) 4% (11) 290Income: Under 50k 45% (401) 43% (377) 12% (105) 882Income: 50k-100k 46% (329) 48% (351) 6% (43) 723Income: 100k+ 49% (193) 45% (177) 6% (23) 392Ethnicity: White 44% (680) 48% (740) 8% (125) 1545Ethnicity: Hispanic 46% (101) 46% (101) 9% (20) 222Ethnicity: Black 59% (150) 30% (75) 11% (28) 253
Continued on next page

124
Morning ConsultTable POL6
Table POL6: Currently, do you believe it’s more important for the government to address the:
DemographicThe spread ofcoronavirus The economy
Don’t know / Noopinion Total N
Registered Voters 46% (922) 45% (905) 9% (171) 1998Ethnicity: Other 46% (93) 45% (89) 9% (18) 200All Christian 44% (452) 49% (503) 7% (71) 1025All Non-Christian 62% (65) 31% (33) 6% (7) 105Atheist 63% (59) 35% (33) 2% (2) 95Agnostic/Nothing in particular 47% (221) 41% (194) 12% (59) 474Something Else 42% (125) 47% (142) 11% (33) 299Religious Non-Protestant/Catholic 59% (75) 35% (44) 6% (8) 128Evangelical 37% (206) 55% (307) 8% (45) 558Non-Evangelical 49% (354) 44% (318) 8% (56) 727Community: Urban 53% (241) 39% (180) 8% (36) 457Community: Suburban 48% (483) 44% (447) 8% (80) 1010Community: Rural 37% (198) 52% (277) 10% (56) 531Employ: Private Sector 44% (300) 48% (331) 8% (56) 687Employ: Government 40% (53) 50% (67) 10% (13) 133Employ: Self-Employed 45% (84) 50% (92) 5% (10) 185Employ: Homemaker 34% (54) 54% (87) 12% (19) 160Employ: Student 68% (42) 23% (14) 9% (5) 61Employ: Retired 53% (270) 42% (213) 5% (26) 509Employ: Unemployed 43% (72) 37% (62) 19% (32) 165Employ: Other 50% (49) 40% (39) 10% (10) 97Military HH: Yes 43% (162) 49% (185) 7% (28) 375Military HH: No 47% (760) 44% (720) 9% (143) 1623RD/WT: Right Direction 68% (509) 25% (185) 7% (52) 745RD/WT: Wrong Track 33% (413) 57% (720) 10% (119) 1253Biden Job Approve 71% (630) 23% (205) 6% (55) 890Biden Job Disapprove 25% (259) 66% (679) 9% (92) 1031Biden Job Strongly Approve 74% (331) 20% (90) 6% (25) 446Biden Job Somewhat Approve 68% (300) 26% (115) 7% (30) 444Biden Job Somewhat Disapprove 45% (112) 46% (114) 9% (23) 250Biden Job Strongly Disapprove 19% (147) 72% (565) 9% (69) 781
Continued on next page

National Tracking Poll #2110009, October, 2021
125
Table POL6
Table POL6: Currently, do you believe it’s more important for the government to address the:
DemographicThe spread ofcoronavirus The economy
Don’t know / Noopinion Total N
Registered Voters 46% (922) 45% (905) 9% (171) 1998Favorable of Biden 71% (634) 23% (203) 7% (62) 899Unfavorable of Biden 25% (257) 66% (684) 9% (92) 1032Very Favorable of Biden 73% (343) 22% (103) 5% (24) 470Somewhat Favorable of Biden 68% (291) 23% (100) 9% (38) 429Somewhat Unfavorable of Biden 42% (104) 49% (121) 9% (21) 246Very Unfavorable of Biden 19% (153) 72% (563) 9% (71) 786#1 Issue: Economy 37% (274) 56% (413) 7% (55) 742#1 Issue: Security 29% (119) 62% (255) 9% (35) 409#1 Issue: Health Care 71% (176) 23% (57) 6% (15) 248#1 Issue: Medicare / Social Security 61% (126) 32% (68) 7% (15) 209#1 Issue: Women’s Issues 72% (79) 20% (22) 8% (9) 111#1 Issue: Education 37% (27) 42% (30) 20% (15) 72#1 Issue: Energy 61% (55) 26% (23) 13% (12) 90#1 Issue: Other 57% (66) 31% (36) 12% (15) 1172020 Vote: Joe Biden 68% (644) 25% (240) 6% (61) 9462020 Vote: Donald Trump 23% (195) 69% (593) 9% (76) 8642020 Vote: Didn’t Vote 45% (68) 35% (54) 20% (31) 1532018 House Vote: Democrat 71% (520) 24% (174) 5% (40) 7342018 House Vote: Republican 25% (181) 66% (475) 9% (63) 7192018 House Vote: Someone else 39% (21) 50% (26) 11% (6) 532016 Vote: Hillary Clinton 70% (491) 25% (173) 6% (42) 7062016 Vote: Donald Trump 26% (207) 66% (533) 8% (65) 8052016 Vote: Other 55% (48) 41% (35) 5% (4) 872016 Vote: Didn’t Vote 44% (176) 41% (163) 15% (60) 399Voted in 2014: Yes 47% (621) 46% (607) 7% (96) 1324Voted in 2014: No 45% (302) 44% (298) 11% (75) 6744-Region: Northeast 48% (170) 44% (156) 8% (28) 3534-Region: Midwest 44% (194) 50% (221) 7% (30) 4444-Region: South 45% (332) 46% (344) 9% (70) 7464-Region: West 50% (227) 41% (184) 10% (44) 455
Continued on next page
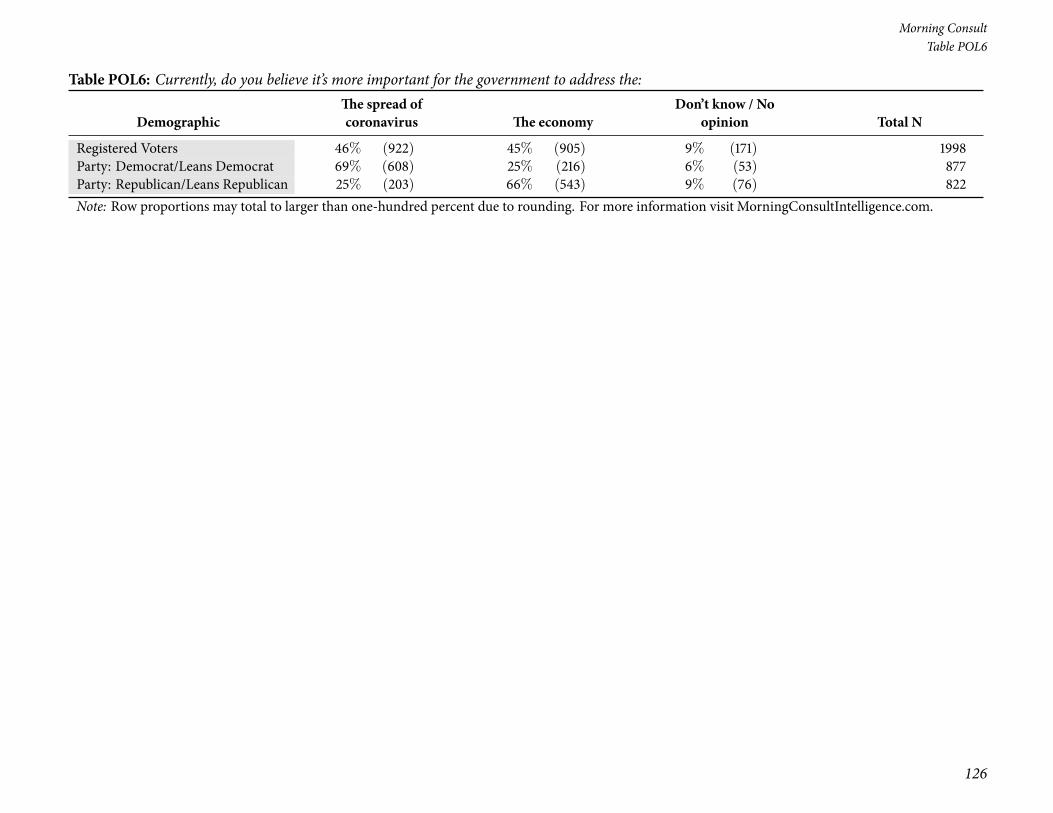
126
Morning ConsultTable POL6
Table POL6: Currently, do you believe it’s more important for the government to address the:
DemographicThe spread ofcoronavirus The economy
Don’t know / Noopinion Total N
Registered Voters 46% (922) 45% (905) 9% (171) 1998Party: Democrat/Leans Democrat 69% (608) 25% (216) 6% (53) 877Party: Republican/Leans Republican 25% (203) 66% (543) 9% (76) 822Note: Row proportions may total to larger than one-hundred percent due to rounding. For more information visit MorningConsultIntelligence.com.

National Tracking Poll #2110009, October, 2021
127
Table POL7
Table POL7: Even if neither is exactly correct, which of the following comes closest to your opinion?
Demographic
Americans shouldcontinue to social
distance for as long as isneeded to curb the spreadof coronavirus even if itmeans continued damage
to the economy
Americans should stopsocial distancing to
stimulate the economyeven if it means
increasing the spread ofcoronavirus
Don’t know / Noopinion Total N
Registered Voters 62% (1235) 26% (518) 12% (245) 1998Gender: Male 60% (567) 29% (276) 10% (99) 942Gender: Female 63% (668) 23% (242) 14% (146) 1056Age: 18-34 57% (295) 28% (144) 15% (76) 514Age: 35-44 62% (190) 25% (77) 13% (40) 307Age: 45-64 61% (414) 27% (186) 12% (80) 679Age: 65+ 68% (336) 23% (112) 10% (49) 497GenZers: 1997-2012 56% (83) 24% (35) 21% (31) 148Millennials: 1981-1996 58% (321) 30% (166) 12% (69) 556GenXers: 1965-1980 65% (303) 23% (108) 12% (57) 468Baby Boomers: 1946-1964 63% (456) 26% (187) 11% (80) 723PID: Dem (no lean) 84% (622) 10% (77) 6% (46) 745PID: Ind (no lean) 58% (327) 25% (138) 17% (95) 559PID: Rep (no lean) 41% (286) 44% (303) 15% (105) 694PID/Gender: DemMen 81% (287) 14% (50) 5% (18) 355PID/Gender: DemWomen 86% (334) 7% (27) 7% (28) 390PID/Gender: Ind Men 56% (162) 26% (76) 18% (51) 288PID/Gender: Ind Women 61% (165) 23% (62) 16% (44) 271PID/Gender: Rep Men 39% (118) 50% (151) 10% (30) 299PID/Gender: Rep Women 43% (168) 39% (152) 19% (74) 395Ideo: Liberal (1-3) 87% (481) 8% (47) 4% (25) 553Ideo: Moderate (4) 71% (380) 18% (99) 11% (59) 538Ideo: Conservative (5-7) 40% (320) 45% (356) 15% (116) 793Educ: < College 59% (713) 27% (321) 14% (172) 1206Educ: Bachelors degree 63% (314) 26% (131) 11% (56) 501Educ: Post-grad 72% (208) 23% (65) 6% (17) 290
Continued on next page

128
Morning ConsultTable POL7
Table POL7: Even if neither is exactly correct, which of the following comes closest to your opinion?
Demographic
Americans shouldcontinue to social
distance for as long as isneeded to curb the spreadof coronavirus even if itmeans continued damage
to the economy
Americans should stopsocial distancing to
stimulate the economyeven if it means
increasing the spread ofcoronavirus
Don’t know / Noopinion Total N
Registered Voters 62% (1235) 26% (518) 12% (245) 1998Income: Under 50k 60% (531) 25% (220) 15% (131) 882Income: 50k-100k 61% (443) 27% (198) 11% (82) 723Income: 100k+ 66% (260) 25% (100) 8% (32) 392Ethnicity: White 60% (922) 28% (437) 12% (186) 1545Ethnicity: Hispanic 60% (133) 25% (55) 15% (34) 222Ethnicity: Black 76% (193) 12% (30) 12% (30) 253Ethnicity: Other 60% (121) 26% (51) 14% (28) 200All Christian 59% (603) 30% (310) 11% (112) 1025All Non-Christian 80% (84) 15% (15) 5% (6) 105Atheist 69% (66) 24% (22) 7% (7) 95Agnostic/Nothing in particular 64% (304) 20% (93) 16% (78) 474Something Else 60% (179) 26% (78) 14% (43) 299Religious Non-Protestant/Catholic 75% (96) 19% (24) 6% (7) 128Evangelical 53% (295) 35% (193) 13% (70) 558Non-Evangelical 64% (465) 25% (181) 11% (82) 727Community: Urban 70% (319) 21% (98) 9% (40) 457Community: Suburban 62% (626) 26% (261) 12% (123) 1010Community: Rural 55% (290) 30% (160) 15% (82) 531Employ: Private Sector 61% (422) 27% (184) 12% (81) 687Employ: Government 65% (87) 28% (37) 7% (9) 133Employ: Self-Employed 58% (107) 30% (56) 12% (22) 185Employ: Homemaker 46% (74) 37% (60) 16% (26) 160Employ: Student 64% (39) 24% (15) 12% (7) 61Employ: Retired 68% (344) 23% (117) 9% (48) 509Employ: Unemployed 59% (98) 20% (34) 20% (34) 165Employ: Other 66% (64) 16% (16) 18% (17) 97
Continued on next page

National Tracking Poll #2110009, October, 2021
129
Table POL7
Table POL7: Even if neither is exactly correct, which of the following comes closest to your opinion?
Demographic
Americans shouldcontinue to social
distance for as long as isneeded to curb the spreadof coronavirus even if itmeans continued damage
to the economy
Americans should stopsocial distancing to
stimulate the economyeven if it means
increasing the spread ofcoronavirus
Don’t know / Noopinion Total N
Registered Voters 62% (1235) 26% (518) 12% (245) 1998Military HH: Yes 60% (223) 30% (111) 11% (40) 375Military HH: No 62% (1012) 25% (407) 13% (204) 1623RD/WT: Right Direction 84% (630) 10% (74) 6% (41) 745RD/WT: Wrong Track 48% (605) 35% (444) 16% (203) 1253Biden Job Approve 86% (767) 9% (81) 5% (42) 890Biden Job Disapprove 42% (430) 42% (431) 16% (170) 1031Biden Job Strongly Approve 86% (383) 9% (42) 5% (21) 446Biden Job Somewhat Approve 87% (384) 9% (39) 5% (21) 444Biden Job Somewhat Disapprove 66% (164) 20% (50) 14% (36) 250Biden Job Strongly Disapprove 34% (266) 49% (381) 17% (134) 781Favorable of Biden 88% (788) 8% (69) 5% (42) 899Unfavorable of Biden 41% (420) 42% (436) 17% (176) 1032Very Favorable of Biden 88% (413) 8% (39) 4% (18) 470Somewhat Favorable of Biden 87% (375) 7% (30) 6% (24) 429Somewhat Unfavorable of Biden 64% (157) 20% (49) 16% (40) 246Very Unfavorable of Biden 33% (263) 49% (387) 17% (136) 786#1 Issue: Economy 57% (423) 30% (222) 13% (98) 742#1 Issue: Security 39% (161) 44% (179) 17% (69) 409#1 Issue: Health Care 84% (209) 10% (26) 5% (14) 248#1 Issue: Medicare / Social Security 80% (166) 14% (29) 6% (13) 209#1 Issue: Women’s Issues 78% (87) 12% (13) 10% (11) 111#1 Issue: Education 50% (36) 23% (17) 28% (20) 72#1 Issue: Energy 82% (74) 14% (13) 4% (3) 90#1 Issue: Other 68% (80) 17% (20) 14% (17) 117
Continued on next page

130
Morning ConsultTable POL7
Table POL7: Even if neither is exactly correct, which of the following comes closest to your opinion?
Demographic
Americans shouldcontinue to social
distance for as long as isneeded to curb the spreadof coronavirus even if itmeans continued damage
to the economy
Americans should stopsocial distancing to
stimulate the economyeven if it means
increasing the spread ofcoronavirus
Don’t know / Noopinion Total N
Registered Voters 62% (1235) 26% (518) 12% (245) 19982020 Vote: Joe Biden 84% (796) 10% (95) 6% (55) 9462020 Vote: Donald Trump 38% (329) 46% (394) 16% (141) 8642020 Vote: Didn’t Vote 63% (97) 14% (21) 23% (35) 1532018 House Vote: Democrat 85% (623) 10% (74) 5% (38) 7342018 House Vote: Republican 41% (298) 43% (308) 16% (113) 7192018 House Vote: Someone else 45% (24) 31% (16) 25% (13) 532016 Vote: Hillary Clinton 85% (599) 10% (68) 5% (38) 7062016 Vote: Donald Trump 42% (339) 44% (355) 14% (111) 8052016 Vote: Other 65% (57) 18% (16) 16% (14) 872016 Vote: Didn’t Vote 60% (239) 20% (78) 20% (82) 399Voted in 2014: Yes 62% (821) 28% (367) 10% (136) 1324Voted in 2014: No 61% (414) 22% (151) 16% (109) 6744-Region: Northeast 67% (235) 21% (74) 12% (44) 3534-Region: Midwest 57% (252) 33% (145) 11% (48) 4444-Region: South 60% (446) 25% (188) 15% (111) 7464-Region: West 66% (302) 25% (112) 9% (42) 455Party: Democrat/Leans Democrat 84% (737) 10% (84) 6% (56) 877Party: Republican/Leans Republican 43% (351) 42% (349) 15% (122) 822Note: Row proportions may total to larger than one-hundred percent due to rounding. For more information visit MorningConsultIntelligence.com.

National Tracking Poll #2110009, October, 2021
131
Table POL8
Table POL8: As you may know, on July 15, 2021 the Treasury Department began making payments of up to $300 a month per child to most familieswith children, also known as expanded child tax credit payments.Do you support or oppose these expanded child tax credit payments?
DemographicStronglysupport
Somewhatsupport
Somewhatoppose
Stronglyoppose
Don’t know /No opinion Total N
Registered Voters 24% (475) 26% (526) 17% (343) 21% (426) 11% (227) 1998Gender: Male 26% (242) 27% (253) 16% (150) 22% (210) 9% (87) 942Gender: Female 22% (234) 26% (273) 18% (193) 20% (215) 13% (140) 1056Age: 18-34 31% (157) 27% (141) 13% (67) 11% (55) 18% (95) 514Age: 35-44 32% (97) 28% (85) 12% (38) 17% (53) 11% (33) 307Age: 45-64 21% (140) 25% (172) 19% (132) 25% (171) 10% (65) 679Age: 65+ 16% (81) 26% (129) 21% (106) 30% (147) 7% (34) 497GenZers: 1997-2012 23% (34) 25% (38) 18% (26) 10% (16) 24% (35) 148Millennials: 1981-1996 33% (186) 27% (151) 11% (63) 13% (75) 14% (80) 556GenXers: 1965-1980 26% (120) 29% (137) 16% (76) 19% (91) 10% (45) 468Baby Boomers: 1946-1964 17% (123) 24% (175) 21% (150) 29% (212) 9% (62) 723PID: Dem (no lean) 41% (302) 33% (244) 12% (92) 6% (48) 8% (58) 745PID: Ind (no lean) 18% (102) 26% (146) 18% (101) 21% (115) 17% (96) 559PID: Rep (no lean) 10% (72) 20% (136) 22% (150) 38% (263) 11% (73) 694PID/Gender: DemMen 43% (152) 32% (114) 11% (40) 9% (30) 5% (18) 355PID/Gender: DemWomen 38% (150) 33% (130) 13% (52) 4% (17) 10% (40) 390PID/Gender: Ind Men 20% (57) 24% (70) 15% (44) 24% (69) 17% (48) 288PID/Gender: Ind Women 17% (45) 28% (76) 21% (57) 17% (46) 17% (47) 271PID/Gender: Rep Men 11% (32) 23% (69) 22% (66) 37% (111) 7% (20) 299PID/Gender: Rep Women 10% (39) 17% (67) 21% (84) 39% (152) 13% (53) 395Ideo: Liberal (1-3) 46% (256) 33% (185) 9% (50) 5% (28) 6% (34) 553Ideo: Moderate (4) 22% (118) 31% (166) 20% (108) 13% (73) 14% (74) 538Ideo: Conservative (5-7) 10% (77) 19% (151) 22% (175) 40% (314) 10% (76) 793Educ: < College 24% (284) 26% (312) 17% (207) 21% (249) 13% (153) 1206Educ: Bachelors degree 24% (120) 24% (120) 16% (82) 24% (122) 11% (57) 501Educ: Post-grad 24% (71) 32% (94) 19% (54) 19% (55) 6% (17) 290Income: Under 50k 25% (217) 25% (220) 17% (148) 19% (172) 14% (126) 882Income: 50k-100k 23% (168) 27% (193) 16% (118) 24% (176) 9% (68) 723Income: 100k+ 23% (91) 29% (114) 20% (77) 20% (78) 8% (32) 392Ethnicity: White 21% (327) 26% (397) 19% (287) 24% (368) 11% (165) 1545Ethnicity: Hispanic 27% (59) 28% (63) 14% (31) 23% (51) 8% (19) 222
Continued on next page
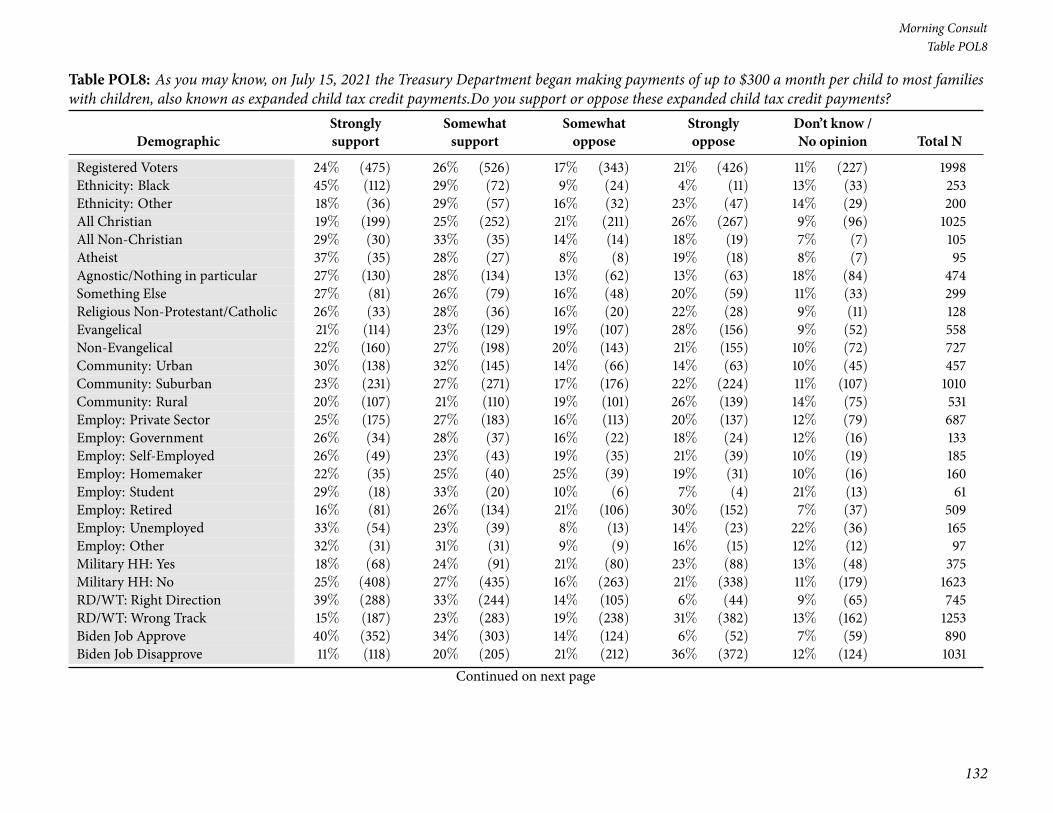
132
Morning ConsultTable POL8
Table POL8: As you may know, on July 15, 2021 the Treasury Department began making payments of up to $300 a month per child to most familieswith children, also known as expanded child tax credit payments.Do you support or oppose these expanded child tax credit payments?
DemographicStronglysupport
Somewhatsupport
Somewhatoppose
Stronglyoppose
Don’t know /No opinion Total N
Registered Voters 24% (475) 26% (526) 17% (343) 21% (426) 11% (227) 1998Ethnicity: Black 45% (112) 29% (72) 9% (24) 4% (11) 13% (33) 253Ethnicity: Other 18% (36) 29% (57) 16% (32) 23% (47) 14% (29) 200All Christian 19% (199) 25% (252) 21% (211) 26% (267) 9% (96) 1025All Non-Christian 29% (30) 33% (35) 14% (14) 18% (19) 7% (7) 105Atheist 37% (35) 28% (27) 8% (8) 19% (18) 8% (7) 95Agnostic/Nothing in particular 27% (130) 28% (134) 13% (62) 13% (63) 18% (84) 474Something Else 27% (81) 26% (79) 16% (48) 20% (59) 11% (33) 299Religious Non-Protestant/Catholic 26% (33) 28% (36) 16% (20) 22% (28) 9% (11) 128Evangelical 21% (114) 23% (129) 19% (107) 28% (156) 9% (52) 558Non-Evangelical 22% (160) 27% (198) 20% (143) 21% (155) 10% (72) 727Community: Urban 30% (138) 32% (145) 14% (66) 14% (63) 10% (45) 457Community: Suburban 23% (231) 27% (271) 17% (176) 22% (224) 11% (107) 1010Community: Rural 20% (107) 21% (110) 19% (101) 26% (139) 14% (75) 531Employ: Private Sector 25% (175) 27% (183) 16% (113) 20% (137) 12% (79) 687Employ: Government 26% (34) 28% (37) 16% (22) 18% (24) 12% (16) 133Employ: Self-Employed 26% (49) 23% (43) 19% (35) 21% (39) 10% (19) 185Employ: Homemaker 22% (35) 25% (40) 25% (39) 19% (31) 10% (16) 160Employ: Student 29% (18) 33% (20) 10% (6) 7% (4) 21% (13) 61Employ: Retired 16% (81) 26% (134) 21% (106) 30% (152) 7% (37) 509Employ: Unemployed 33% (54) 23% (39) 8% (13) 14% (23) 22% (36) 165Employ: Other 32% (31) 31% (31) 9% (9) 16% (15) 12% (12) 97Military HH: Yes 18% (68) 24% (91) 21% (80) 23% (88) 13% (48) 375Military HH: No 25% (408) 27% (435) 16% (263) 21% (338) 11% (179) 1623RD/WT: Right Direction 39% (288) 33% (244) 14% (105) 6% (44) 9% (65) 745RD/WT: Wrong Track 15% (187) 23% (283) 19% (238) 31% (382) 13% (162) 1253Biden Job Approve 40% (352) 34% (303) 14% (124) 6% (52) 7% (59) 890Biden Job Disapprove 11% (118) 20% (205) 21% (212) 36% (372) 12% (124) 1031
Continued on next page

National Tracking Poll #2110009, October, 2021
133
Table POL8
Table POL8: As you may know, on July 15, 2021 the Treasury Department began making payments of up to $300 a month per child to most familieswith children, also known as expanded child tax credit payments.Do you support or oppose these expanded child tax credit payments?
DemographicStronglysupport
Somewhatsupport
Somewhatoppose
Stronglyoppose
Don’t know /No opinion Total N
Registered Voters 24% (475) 26% (526) 17% (343) 21% (426) 11% (227) 1998Biden Job Strongly Approve 49% (217) 31% (136) 10% (43) 5% (22) 6% (28) 446Biden Job Somewhat Approve 30% (135) 37% (166) 18% (81) 7% (30) 7% (31) 444Biden Job Somewhat Disapprove 20% (49) 26% (64) 19% (48) 18% (46) 17% (43) 250Biden Job Strongly Disapprove 9% (69) 18% (141) 21% (164) 42% (326) 10% (81) 781Favorable of Biden 39% (352) 34% (305) 14% (123) 7% (60) 7% (59) 899Unfavorable of Biden 11% (110) 21% (213) 21% (213) 35% (362) 13% (134) 1032Very Favorable of Biden 48% (227) 31% (145) 10% (45) 6% (29) 5% (24) 470Somewhat Favorable of Biden 29% (125) 37% (160) 18% (78) 7% (31) 8% (35) 429Somewhat Unfavorable of Biden 20% (49) 28% (69) 19% (47) 12% (30) 21% (51) 246Very Unfavorable of Biden 8% (61) 18% (144) 21% (166) 42% (333) 10% (83) 786#1 Issue: Economy 22% (165) 27% (197) 18% (135) 19% (143) 14% (103) 742#1 Issue: Security 8% (33) 19% (78) 20% (82) 45% (182) 8% (33) 409#1 Issue: Health Care 40% (99) 25% (62) 16% (39) 9% (23) 10% (25) 248#1 Issue: Medicare / Social Security 24% (51) 33% (69) 19% (39) 17% (35) 7% (14) 209#1 Issue: Women’s Issues 41% (46) 33% (37) 11% (12) 5% (5) 10% (11) 111#1 Issue: Education 35% (26) 26% (19) 9% (7) 10% (7) 20% (14) 72#1 Issue: Energy 35% (32) 32% (29) 14% (12) 6% (6) 13% (11) 90#1 Issue: Other 21% (25) 30% (36) 14% (17) 21% (25) 13% (15) 1172020 Vote: Joe Biden 37% (353) 33% (311) 14% (135) 7% (67) 8% (80) 9462020 Vote: Donald Trump 9% (80) 20% (169) 22% (188) 38% (325) 12% (101) 8642020 Vote: Didn’t Vote 24% (37) 24% (36) 9% (13) 20% (30) 24% (37) 1532018 House Vote: Democrat 38% (282) 33% (240) 12% (92) 8% (62) 8% (59) 7342018 House Vote: Republican 9% (66) 20% (147) 22% (156) 39% (277) 10% (73) 7192018 House Vote: Someone else 17% (9) 40% (21) 7% (4) 19% (10) 17% (9) 532016 Vote: Hillary Clinton 40% (281) 33% (233) 12% (84) 7% (48) 8% (58) 7062016 Vote: Donald Trump 9% (74) 20% (164) 22% (176) 38% (308) 10% (84) 8052016 Vote: Other 25% (22) 19% (17) 27% (24) 18% (15) 12% (10) 872016 Vote: Didn’t Vote 24% (97) 28% (113) 15% (59) 14% (55) 19% (75) 399Voted in 2014: Yes 23% (309) 26% (350) 18% (234) 24% (317) 9% (114) 1324Voted in 2014: No 25% (166) 26% (177) 16% (109) 16% (109) 17% (113) 674
Continued on next page
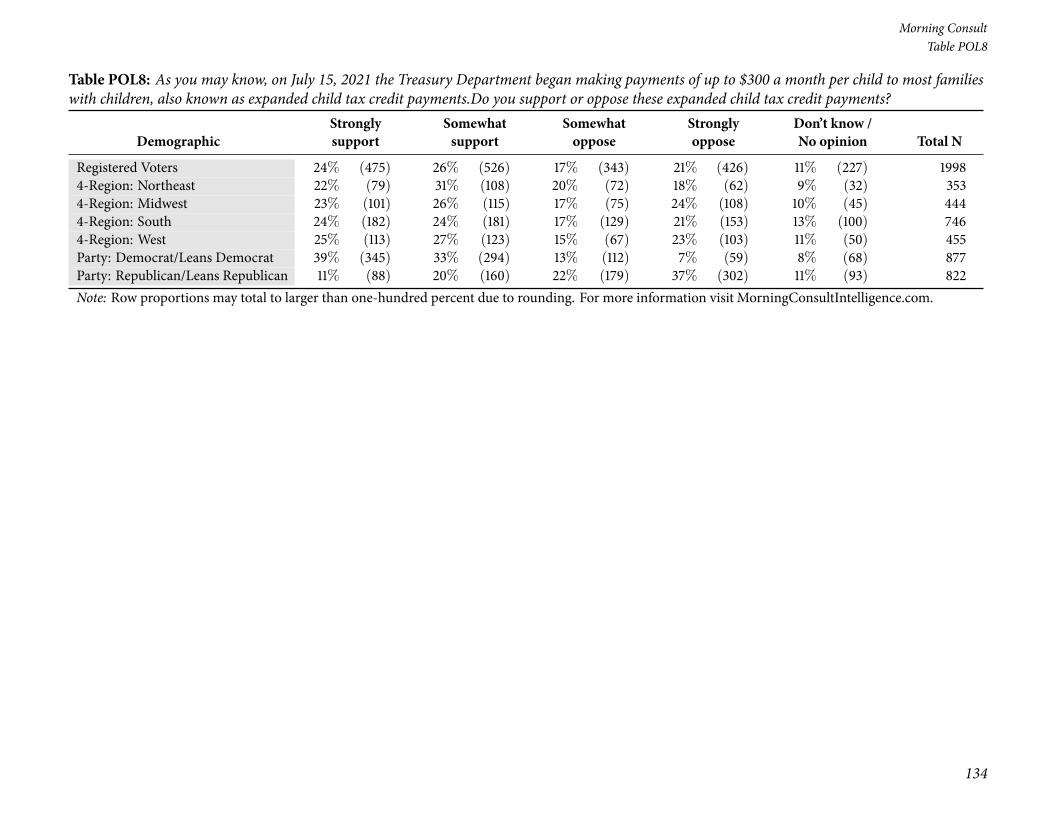
134
Morning ConsultTable POL8
Table POL8: As you may know, on July 15, 2021 the Treasury Department began making payments of up to $300 a month per child to most familieswith children, also known as expanded child tax credit payments.Do you support or oppose these expanded child tax credit payments?
DemographicStronglysupport
Somewhatsupport
Somewhatoppose
Stronglyoppose
Don’t know /No opinion Total N
Registered Voters 24% (475) 26% (526) 17% (343) 21% (426) 11% (227) 19984-Region: Northeast 22% (79) 31% (108) 20% (72) 18% (62) 9% (32) 3534-Region: Midwest 23% (101) 26% (115) 17% (75) 24% (108) 10% (45) 4444-Region: South 24% (182) 24% (181) 17% (129) 21% (153) 13% (100) 7464-Region: West 25% (113) 27% (123) 15% (67) 23% (103) 11% (50) 455Party: Democrat/Leans Democrat 39% (345) 33% (294) 13% (112) 7% (59) 8% (68) 877Party: Republican/Leans Republican 11% (88) 20% (160) 22% (179) 37% (302) 11% (93) 822Note: Row proportions may total to larger than one-hundred percent due to rounding. For more information visit MorningConsultIntelligence.com.

National Tracking Poll #2110009, October, 2021
135
Table POL9
Table POL9: Have you received the expanded child tax credit payment?Demographic Yes No Don’t know Total N
Registered Voters 61% (332) 36% (195) 3% (17) 544Gender: Male 53% (148) 45% (125) 2% (6) 278Gender: Female 69% (184) 27% (71) 4% (11) 266Age: 18-34 67% (129) 30% (58) 3% (6) 192Age: 35-44 62% (114) 34% (62) 4% (7) 182Age: 45-64 54% (89) 44% (72) 3% (4) 166Millennials: 1981-1996 65% (190) 31% (92) 4% (11) 293GenXers: 1965-1980 57% (111) 40% (79) 3% (5) 194PID: Dem (no lean) 62% (123) 35% (69) 4% (7) 199PID: Ind (no lean) 65% (96) 31% (46) 4% (6) 148PID: Rep (no lean) 58% (113) 41% (80) 2% (3) 196PID/Gender: DemMen 56% (65) 42% (49) 2% (2) 116PID/Gender: DemWomen 69% (58) 24% (20) 6% (5) 83PID/Gender: Ind Men 59% (47) 36% (29) 5% (4) 80PID/Gender: Ind Women 71% (48) 25% (17) 4% (3) 68PID/Gender: Rep Men 44% (36) 56% (46) — (0) 82PID/Gender: Rep Women 68% (77) 29% (34) 3% (3) 114Ideo: Liberal (1-3) 74% (101) 25% (34) 1% (2) 137Ideo: Moderate (4) 52% (85) 44% (71) 4% (7) 163Ideo: Conservative (5-7) 59% (119) 39% (78) 2% (3) 201Educ: < College 64% (190) 32% (96) 3% (10) 295Educ: Bachelors degree 51% (79) 46% (70) 3% (5) 154Educ: Post-grad 67% (63) 31% (29) 2% (2) 94Income: Under 50k 67% (118) 30% (53) 3% (6) 177Income: 50k-100k 59% (120) 37% (76) 3% (6) 202Income: 100k+ 57% (94) 41% (67) 3% (4) 165Ethnicity: White 65% (253) 33% (129) 2% (7) 389Ethnicity: Hispanic 66% (61) 33% (30) 1% (1) 91Ethnicity: Black 52% (50) 43% (41) 5% (5) 96Ethnicity: Other 49% (29) 43% (25) 8% (5) 59All Christian 62% (149) 36% (88) 2% (5) 242Agnostic/Nothing in particular 59% (77) 35% (45) 7% (9) 131Something Else 57% (63) 40% (44) 3% (3) 110
Continued on next page

136
Morning ConsultTable POL9
Table POL9: Have you received the expanded child tax credit payment?Demographic Yes No Don’t know Total N
Registered Voters 61% (332) 36% (195) 3% (17) 544Evangelical 59% (107) 38% (69) 3% (6) 182Non-Evangelical 65% (104) 34% (55) 1% (2) 160Community: Urban 62% (100) 35% (57) 3% (5) 161Community: Suburban 62% (163) 35% (92) 2% (6) 261Community: Rural 57% (69) 39% (47) 5% (6) 122Employ: Private Sector 57% (167) 41% (119) 2% (5) 291Employ: Government 70% (37) 22% (11) 8% (4) 52Employ: Self-Employed 61% (34) 37% (21) 1% (1) 55Employ: Homemaker 69% (49) 27% (19) 4% (3) 70Military HH: Yes 59% (36) 37% (23) 4% (2) 61Military HH: No 61% (296) 36% (173) 3% (14) 483RD/WT: Right Direction 60% (127) 37% (79) 3% (7) 213RD/WT: Wrong Track 62% (205) 35% (117) 3% (9) 331Biden Job Approve 63% (150) 35% (84) 2% (5) 240Biden Job Disapprove 60% (166) 38% (105) 3% (8) 280Biden Job Strongly Approve 59% (72) 39% (48) 2% (2) 122Biden Job Somewhat Approve 66% (78) 31% (36) 3% (3) 118Biden Job Somewhat Disapprove 71% (66) 24% (22) 6% (5) 93Biden Job Strongly Disapprove 54% (101) 45% (83) 1% (3) 186Favorable of Biden 67% (159) 32% (75) 2% (4) 237Unfavorable of Biden 56% (160) 41% (115) 3% (8) 283Very Favorable of Biden 63% (81) 35% (44) 3% (4) 129Somewhat Favorable of Biden 72% (78) 28% (30) — (0) 108Somewhat Unfavorable of Biden 57% (51) 39% (35) 3% (3) 89Very Unfavorable of Biden 56% (109) 41% (80) 3% (5) 194#1 Issue: Economy 62% (153) 35% (85) 4% (9) 247#1 Issue: Security 50% (48) 49% (48) 1% (1) 96#1 Issue: Health Care 63% (41) 35% (23) 2% (2) 662020 Vote: Joe Biden 64% (161) 33% (82) 3% (8) 2502020 Vote: Donald Trump 57% (131) 41% (95) 2% (4) 2302020 Vote: Didn’t Vote 66% (33) 31% (16) 4% (2) 50
Continued on next page

National Tracking Poll #2110009, October, 2021
137
Table POL9
Table POL9: Have you received the expanded child tax credit payment?Demographic Yes No Don’t know Total N
Registered Voters 61% (332) 36% (195) 3% (17) 5442018 House Vote: Democrat 62% (113) 35% (64) 3% (6) 1842018 House Vote: Republican 58% (113) 40% (77) 2% (4) 1952016 Vote: Hillary Clinton 60% (114) 37% (71) 3% (6) 1902016 Vote: Donald Trump 58% (127) 41% (90) 1% (2) 2192016 Vote: Didn’t Vote 68% (76) 27% (30) 6% (6) 112Voted in 2014: Yes 56% (192) 41% (138) 3% (10) 340Voted in 2014: No 69% (140) 28% (57) 3% (7) 2044-Region: Northeast 67% (56) 33% (28) — (0) 844-Region: Midwest 60% (72) 35% (42) 5% (6) 1204-Region: South 57% (126) 40% (88) 3% (6) 2204-Region: West 65% (79) 31% (37) 4% (5) 120Party: Democrat/Leans Democrat 62% (150) 35% (83) 3% (8) 241Party: Republican/Leans Republican 61% (140) 37% (84) 1% (3) 227Note: Row proportions may total to larger than one-hundred percent due to rounding. For more information visit MorningConsultIntelligence.com.
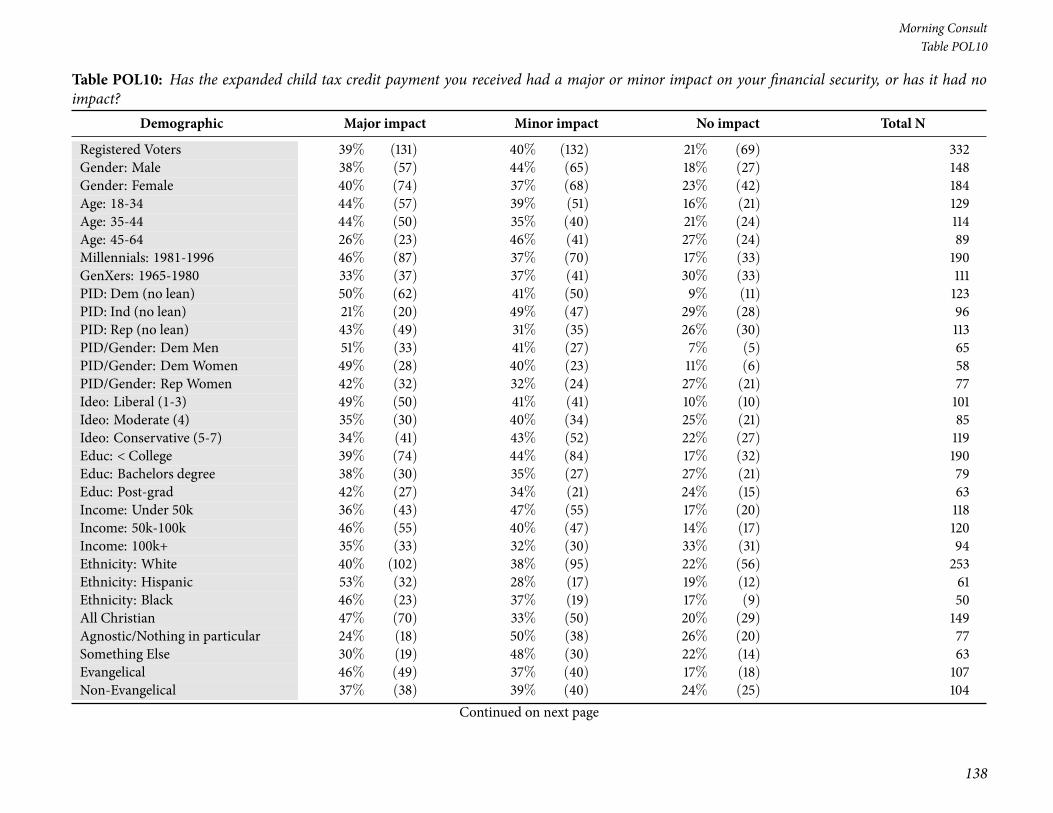
138
Morning ConsultTable POL10
Table POL10: Has the expanded child tax credit payment you received had a major or minor impact on your financial security, or has it had noimpact?
Demographic Major impact Minor impact No impact Total N
Registered Voters 39% (131) 40% (132) 21% (69) 332Gender: Male 38% (57) 44% (65) 18% (27) 148Gender: Female 40% (74) 37% (68) 23% (42) 184Age: 18-34 44% (57) 39% (51) 16% (21) 129Age: 35-44 44% (50) 35% (40) 21% (24) 114Age: 45-64 26% (23) 46% (41) 27% (24) 89Millennials: 1981-1996 46% (87) 37% (70) 17% (33) 190GenXers: 1965-1980 33% (37) 37% (41) 30% (33) 111PID: Dem (no lean) 50% (62) 41% (50) 9% (11) 123PID: Ind (no lean) 21% (20) 49% (47) 29% (28) 96PID: Rep (no lean) 43% (49) 31% (35) 26% (30) 113PID/Gender: DemMen 51% (33) 41% (27) 7% (5) 65PID/Gender: DemWomen 49% (28) 40% (23) 11% (6) 58PID/Gender: Rep Women 42% (32) 32% (24) 27% (21) 77Ideo: Liberal (1-3) 49% (50) 41% (41) 10% (10) 101Ideo: Moderate (4) 35% (30) 40% (34) 25% (21) 85Ideo: Conservative (5-7) 34% (41) 43% (52) 22% (27) 119Educ: < College 39% (74) 44% (84) 17% (32) 190Educ: Bachelors degree 38% (30) 35% (27) 27% (21) 79Educ: Post-grad 42% (27) 34% (21) 24% (15) 63Income: Under 50k 36% (43) 47% (55) 17% (20) 118Income: 50k-100k 46% (55) 40% (47) 14% (17) 120Income: 100k+ 35% (33) 32% (30) 33% (31) 94Ethnicity: White 40% (102) 38% (95) 22% (56) 253Ethnicity: Hispanic 53% (32) 28% (17) 19% (12) 61Ethnicity: Black 46% (23) 37% (19) 17% (9) 50All Christian 47% (70) 33% (50) 20% (29) 149Agnostic/Nothing in particular 24% (18) 50% (38) 26% (20) 77Something Else 30% (19) 48% (30) 22% (14) 63Evangelical 46% (49) 37% (40) 17% (18) 107Non-Evangelical 37% (38) 39% (40) 24% (25) 104
Continued on next page

National Tracking Poll #2110009, October, 2021
139
Table POL10
Table POL10: Has the expanded child tax credit payment you received had a major or minor impact on your financial security, or has it had noimpact?
Demographic Major impact Minor impact No impact Total N
Registered Voters 39% (131) 40% (132) 21% (69) 332Community: Urban 52% (52) 39% (39) 9% (9) 100Community: Suburban 31% (50) 42% (68) 27% (44) 163Community: Rural 42% (29) 36% (25) 22% (15) 69Employ: Private Sector 38% (63) 39% (65) 24% (39) 167Military HH: No 39% (116) 40% (118) 21% (62) 296RD/WT: Right Direction 55% (69) 36% (46) 9% (12) 127RD/WT: Wrong Track 30% (62) 42% (86) 28% (57) 205Biden Job Approve 54% (81) 35% (53) 11% (17) 150Biden Job Disapprove 30% (49) 44% (73) 27% (44) 166Biden Job Strongly Approve 69% (50) 23% (17) 8% (5) 72Biden Job Somewhat Approve 40% (31) 46% (36) 14% (11) 78Biden Job Somewhat Disapprove 34% (22) 49% (33) 16% (11) 66Biden Job Strongly Disapprove 27% (27) 40% (40) 33% (34) 101Favorable of Biden 56% (89) 32% (51) 12% (19) 159Unfavorable of Biden 25% (40) 48% (77) 27% (43) 160Very Favorable of Biden 63% (51) 32% (26) 5% (4) 81Somewhat Favorable of Biden 49% (38) 32% (25) 19% (15) 78Somewhat Unfavorable of Biden 29% (15) 53% (27) 18% (9) 51Very Unfavorable of Biden 23% (25) 46% (50) 32% (34) 109#1 Issue: Economy 31% (47) 47% (72) 22% (34) 1532020 Vote: Joe Biden 51% (82) 36% (58) 13% (21) 1612020 Vote: Donald Trump 32% (42) 42% (54) 27% (35) 1312018 House Vote: Democrat 51% (58) 35% (40) 13% (15) 1132018 House Vote: Republican 36% (41) 36% (41) 28% (32) 1132016 Vote: Hillary Clinton 49% (56) 38% (43) 13% (15) 1142016 Vote: Donald Trump 34% (44) 43% (55) 23% (29) 1272016 Vote: Didn’t Vote 34% (26) 40% (30) 25% (19) 76Voted in 2014: Yes 48% (92) 33% (64) 19% (36) 192Voted in 2014: No 28% (39) 49% (69) 23% (32) 140
Continued on next page

140
Morning ConsultTable POL10
Table POL10: Has the expanded child tax credit payment you received had a major or minor impact on your financial security, or has it had noimpact?
Demographic Major impact Minor impact No impact Total N
Registered Voters 39% (131) 40% (132) 21% (69) 3324-Region: Northeast 44% (25) 34% (19) 22% (12) 564-Region: Midwest 31% (22) 49% (35) 20% (14) 724-Region: South 37% (47) 38% (48) 25% (31) 1264-Region: West 48% (37) 38% (30) 14% (11) 79Party: Democrat/Leans Democrat 43% (65) 45% (68) 11% (17) 150Party: Republican/Leans Republican 41% (57) 35% (49) 24% (34) 140Note: Row proportions may total to larger than one-hundred percent due to rounding. For more information visit MorningConsultIntelligence.com.
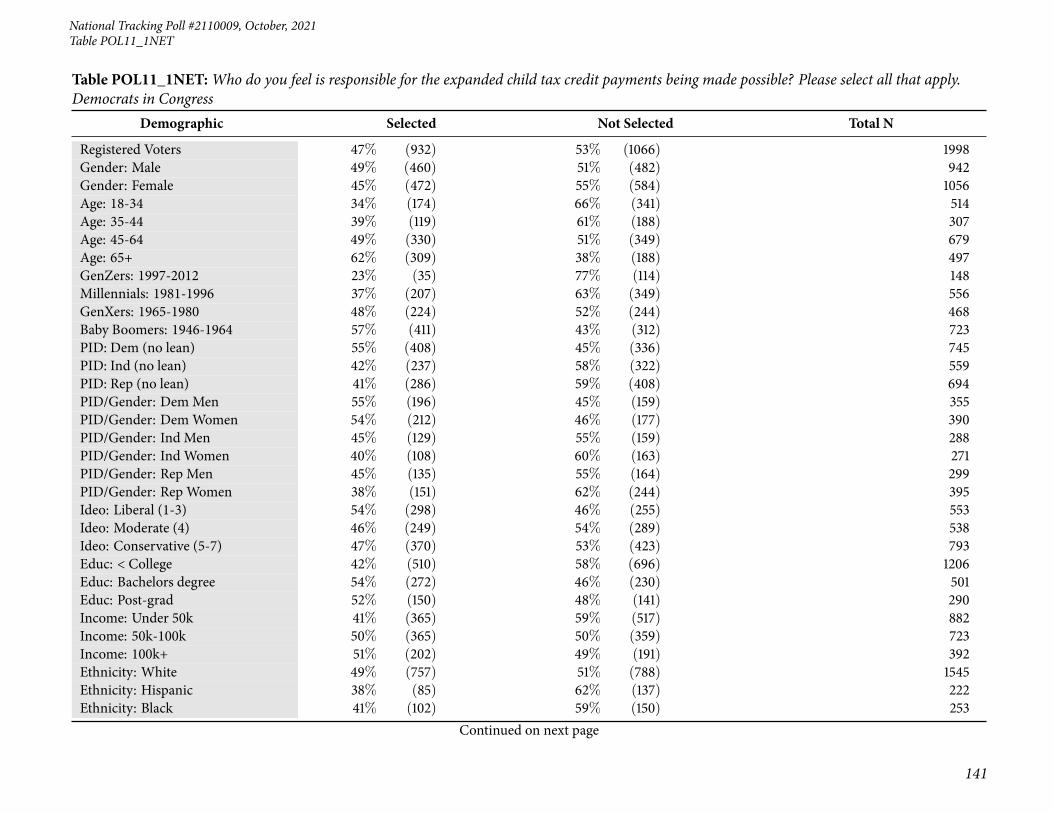
National Tracking Poll #2110009, October, 2021
141
Table POL11_1NET
Table POL11_1NET:Who do you feel is responsible for the expanded child tax credit payments being made possible? Please select all that apply.Democrats in Congress
Demographic Selected Not Selected Total N
Registered Voters 47% (932) 53% (1066) 1998Gender: Male 49% (460) 51% (482) 942Gender: Female 45% (472) 55% (584) 1056Age: 18-34 34% (174) 66% (341) 514Age: 35-44 39% (119) 61% (188) 307Age: 45-64 49% (330) 51% (349) 679Age: 65+ 62% (309) 38% (188) 497GenZers: 1997-2012 23% (35) 77% (114) 148Millennials: 1981-1996 37% (207) 63% (349) 556GenXers: 1965-1980 48% (224) 52% (244) 468Baby Boomers: 1946-1964 57% (411) 43% (312) 723PID: Dem (no lean) 55% (408) 45% (336) 745PID: Ind (no lean) 42% (237) 58% (322) 559PID: Rep (no lean) 41% (286) 59% (408) 694PID/Gender: DemMen 55% (196) 45% (159) 355PID/Gender: DemWomen 54% (212) 46% (177) 390PID/Gender: Ind Men 45% (129) 55% (159) 288PID/Gender: Ind Women 40% (108) 60% (163) 271PID/Gender: Rep Men 45% (135) 55% (164) 299PID/Gender: Rep Women 38% (151) 62% (244) 395Ideo: Liberal (1-3) 54% (298) 46% (255) 553Ideo: Moderate (4) 46% (249) 54% (289) 538Ideo: Conservative (5-7) 47% (370) 53% (423) 793Educ: < College 42% (510) 58% (696) 1206Educ: Bachelors degree 54% (272) 46% (230) 501Educ: Post-grad 52% (150) 48% (141) 290Income: Under 50k 41% (365) 59% (517) 882Income: 50k-100k 50% (365) 50% (359) 723Income: 100k+ 51% (202) 49% (191) 392Ethnicity: White 49% (757) 51% (788) 1545Ethnicity: Hispanic 38% (85) 62% (137) 222Ethnicity: Black 41% (102) 59% (150) 253
Continued on next page

142
Morning ConsultTable POL11_1NET
Table POL11_1NET:Who do you feel is responsible for the expanded child tax credit payments being made possible? Please select all that apply.Democrats in Congress
Demographic Selected Not Selected Total N
Registered Voters 47% (932) 53% (1066) 1998Ethnicity: Other 36% (72) 64% (128) 200All Christian 52% (532) 48% (493) 1025All Non-Christian 50% (53) 50% (52) 105Atheist 46% (43) 54% (51) 95Agnostic/Nothing in particular 38% (181) 62% (293) 474Something Else 41% (123) 59% (176) 299Religious Non-Protestant/Catholic 51% (65) 49% (63) 128Evangelical 49% (276) 51% (282) 558Non-Evangelical 49% (356) 51% (371) 727Community: Urban 42% (191) 58% (266) 457Community: Suburban 50% (500) 50% (509) 1010Community: Rural 45% (240) 55% (291) 531Employ: Private Sector 46% (313) 54% (374) 687Employ: Government 39% (52) 61% (81) 133Employ: Self-Employed 38% (71) 62% (114) 185Employ: Homemaker 42% (67) 58% (93) 160Employ: Student 27% (17) 73% (44) 61Employ: Retired 60% (307) 40% (202) 509Employ: Unemployed 39% (64) 61% (101) 165Employ: Other 42% (41) 58% (56) 97Military HH: Yes 50% (189) 50% (186) 375Military HH: No 46% (742) 54% (881) 1623RD/WT: Right Direction 50% (375) 50% (370) 745RD/WT: Wrong Track 44% (556) 56% (697) 1253Biden Job Approve 53% (468) 47% (422) 890Biden Job Disapprove 44% (452) 56% (579) 1031Biden Job Strongly Approve 53% (235) 47% (211) 446Biden Job Somewhat Approve 52% (232) 48% (211) 444Biden Job Somewhat Disapprove 38% (94) 62% (155) 250Biden Job Strongly Disapprove 46% (358) 54% (424) 781
Continued on next page
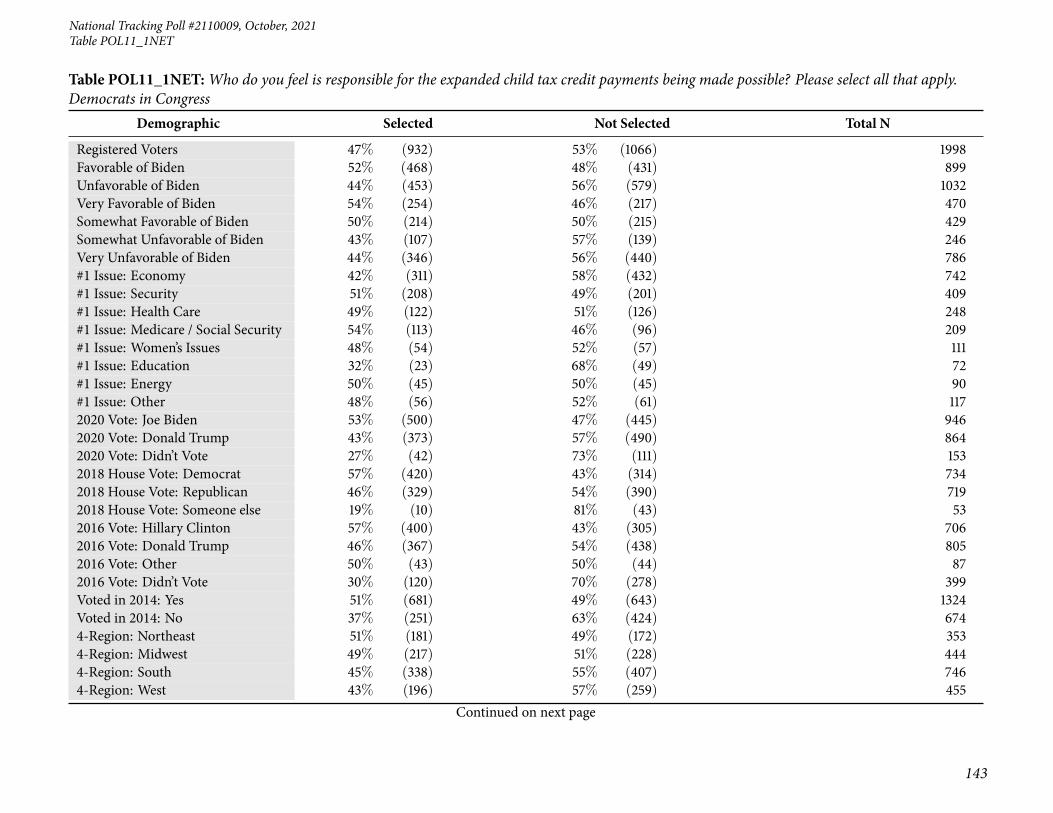
National Tracking Poll #2110009, October, 2021
143
Table POL11_1NET
Table POL11_1NET:Who do you feel is responsible for the expanded child tax credit payments being made possible? Please select all that apply.Democrats in Congress
Demographic Selected Not Selected Total N
Registered Voters 47% (932) 53% (1066) 1998Favorable of Biden 52% (468) 48% (431) 899Unfavorable of Biden 44% (453) 56% (579) 1032Very Favorable of Biden 54% (254) 46% (217) 470Somewhat Favorable of Biden 50% (214) 50% (215) 429Somewhat Unfavorable of Biden 43% (107) 57% (139) 246Very Unfavorable of Biden 44% (346) 56% (440) 786#1 Issue: Economy 42% (311) 58% (432) 742#1 Issue: Security 51% (208) 49% (201) 409#1 Issue: Health Care 49% (122) 51% (126) 248#1 Issue: Medicare / Social Security 54% (113) 46% (96) 209#1 Issue: Women’s Issues 48% (54) 52% (57) 111#1 Issue: Education 32% (23) 68% (49) 72#1 Issue: Energy 50% (45) 50% (45) 90#1 Issue: Other 48% (56) 52% (61) 1172020 Vote: Joe Biden 53% (500) 47% (445) 9462020 Vote: Donald Trump 43% (373) 57% (490) 8642020 Vote: Didn’t Vote 27% (42) 73% (111) 1532018 House Vote: Democrat 57% (420) 43% (314) 7342018 House Vote: Republican 46% (329) 54% (390) 7192018 House Vote: Someone else 19% (10) 81% (43) 532016 Vote: Hillary Clinton 57% (400) 43% (305) 7062016 Vote: Donald Trump 46% (367) 54% (438) 8052016 Vote: Other 50% (43) 50% (44) 872016 Vote: Didn’t Vote 30% (120) 70% (278) 399Voted in 2014: Yes 51% (681) 49% (643) 1324Voted in 2014: No 37% (251) 63% (424) 6744-Region: Northeast 51% (181) 49% (172) 3534-Region: Midwest 49% (217) 51% (228) 4444-Region: South 45% (338) 55% (407) 7464-Region: West 43% (196) 57% (259) 455
Continued on next page

144
Morning ConsultTable POL11_1NET
Table POL11_1NET:Who do you feel is responsible for the expanded child tax credit payments being made possible? Please select all that apply.Democrats in Congress
Demographic Selected Not Selected Total N
Registered Voters 47% (932) 53% (1066) 1998Party: Democrat/Leans Democrat 55% (479) 45% (398) 877Party: Republican/Leans Republican 42% (348) 58% (474) 822Note: Row proportions may total to larger than one-hundred percent due to rounding. For more information visit MorningConsultIntelligence.com.

National Tracking Poll #2110009, October, 2021
145
Table POL11_2NET
Table POL11_2NET:Who do you feel is responsible for the expanded child tax credit payments being made possible? Please select all that apply.Republicans in Congress
Demographic Selected Not Selected Total N
Registered Voters 10% (207) 90% (1791) 1998Gender: Male 11% (108) 89% (834) 942Gender: Female 9% (99) 91% (957) 1056Age: 18-34 13% (66) 87% (449) 514Age: 35-44 15% (45) 85% (262) 307Age: 45-64 9% (63) 91% (616) 679Age: 65+ 7% (34) 93% (464) 497GenZers: 1997-2012 14% (21) 86% (127) 148Millennials: 1981-1996 13% (73) 87% (483) 556GenXers: 1965-1980 10% (49) 90% (419) 468Baby Boomers: 1946-1964 8% (57) 92% (666) 723PID: Dem (no lean) 7% (53) 93% (691) 745PID: Ind (no lean) 7% (38) 93% (521) 559PID: Rep (no lean) 17% (116) 83% (578) 694PID/Gender: DemMen 6% (22) 94% (333) 355PID/Gender: DemWomen 8% (31) 92% (358) 390PID/Gender: Ind Men 9% (25) 91% (263) 288PID/Gender: Ind Women 5% (14) 95% (258) 271PID/Gender: Rep Men 20% (61) 80% (238) 299PID/Gender: Rep Women 14% (55) 86% (341) 395Ideo: Liberal (1-3) 9% (50) 91% (503) 553Ideo: Moderate (4) 10% (53) 90% (485) 538Ideo: Conservative (5-7) 12% (97) 88% (696) 793Educ: < College 11% (136) 89% (1070) 1206Educ: Bachelors degree 8% (39) 92% (462) 501Educ: Post-grad 11% (32) 89% (258) 290Income: Under 50k 10% (89) 90% (793) 882Income: 50k-100k 12% (88) 88% (635) 723Income: 100k+ 8% (30) 92% (362) 392Ethnicity: White 10% (161) 90% (1384) 1545Ethnicity: Hispanic 5% (11) 95% (212) 222Ethnicity: Black 10% (26) 90% (227) 253
Continued on next page

146
Morning ConsultTable POL11_2NET
Table POL11_2NET:Who do you feel is responsible for the expanded child tax credit payments being made possible? Please select all that apply.Republicans in Congress
Demographic Selected Not Selected Total N
Registered Voters 10% (207) 90% (1791) 1998Ethnicity: Other 10% (20) 90% (180) 200All Christian 9% (95) 91% (930) 1025All Non-Christian 8% (9) 92% (96) 105Atheist 7% (6) 93% (88) 95Agnostic/Nothing in particular 12% (58) 88% (416) 474Something Else 13% (39) 87% (260) 299Religious Non-Protestant/Catholic 9% (11) 91% (117) 128Evangelical 10% (57) 90% (501) 558Non-Evangelical 10% (73) 90% (655) 727Community: Urban 11% (52) 89% (405) 457Community: Suburban 9% (92) 91% (918) 1010Community: Rural 12% (64) 88% (467) 531Employ: Private Sector 12% (82) 88% (605) 687Employ: Government 16% (21) 84% (112) 133Employ: Self-Employed 13% (24) 87% (161) 185Employ: Homemaker 10% (15) 90% (145) 160Employ: Student 14% (9) 86% (53) 61Employ: Retired 7% (36) 93% (473) 509Employ: Unemployed 10% (16) 90% (149) 165Employ: Other 5% (5) 95% (93) 97Military HH: Yes 10% (38) 90% (337) 375Military HH: No 10% (170) 90% (1454) 1623RD/WT: Right Direction 10% (73) 90% (672) 745RD/WT: Wrong Track 11% (134) 89% (1119) 1253Biden Job Approve 8% (71) 92% (820) 890Biden Job Disapprove 13% (136) 87% (895) 1031Biden Job Strongly Approve 8% (35) 92% (412) 446Biden Job Somewhat Approve 8% (36) 92% (408) 444Biden Job Somewhat Disapprove 13% (33) 87% (217) 250Biden Job Strongly Disapprove 13% (103) 87% (678) 781
Continued on next page

National Tracking Poll #2110009, October, 2021
147
Table POL11_2NET
Table POL11_2NET:Who do you feel is responsible for the expanded child tax credit payments being made possible? Please select all that apply.Republicans in Congress
Demographic Selected Not Selected Total N
Registered Voters 10% (207) 90% (1791) 1998Favorable of Biden 7% (64) 93% (835) 899Unfavorable of Biden 13% (138) 87% (895) 1032Very Favorable of Biden 6% (30) 94% (440) 470Somewhat Favorable of Biden 8% (34) 92% (395) 429Somewhat Unfavorable of Biden 11% (26) 89% (220) 246Very Unfavorable of Biden 14% (112) 86% (675) 786#1 Issue: Economy 11% (83) 89% (660) 742#1 Issue: Security 14% (59) 86% (350) 409#1 Issue: Health Care 7% (18) 93% (230) 248#1 Issue: Medicare / Social Security 9% (19) 91% (189) 209#1 Issue: Women’s Issues 4% (5) 96% (106) 111#1 Issue: Education 14% (10) 86% (62) 72#1 Issue: Energy 5% (5) 95% (85) 90#1 Issue: Other 7% (8) 93% (109) 1172020 Vote: Joe Biden 6% (54) 94% (891) 9462020 Vote: Donald Trump 16% (138) 84% (726) 8642020 Vote: Didn’t Vote 8% (12) 92% (141) 1532018 House Vote: Democrat 6% (43) 94% (691) 7342018 House Vote: Republican 16% (115) 84% (604) 7192018 House Vote: Someone else 6% (3) 94% (50) 532016 Vote: Hillary Clinton 5% (36) 95% (669) 7062016 Vote: Donald Trump 15% (124) 85% (681) 8052016 Vote: Other 9% (8) 91% (79) 872016 Vote: Didn’t Vote 9% (38) 91% (361) 399Voted in 2014: Yes 10% (138) 90% (1185) 1324Voted in 2014: No 10% (69) 90% (606) 6744-Region: Northeast 8% (28) 92% (325) 3534-Region: Midwest 11% (47) 89% (397) 4444-Region: South 12% (90) 88% (656) 7464-Region: West 9% (42) 91% (413) 455
Continued on next page

148
Morning ConsultTable POL11_2NET
Table POL11_2NET:Who do you feel is responsible for the expanded child tax credit payments being made possible? Please select all that apply.Republicans in Congress
Demographic Selected Not Selected Total N
Registered Voters 10% (207) 90% (1791) 1998Party: Democrat/Leans Democrat 6% (57) 94% (821) 877Party: Republican/Leans Republican 16% (129) 84% (693) 822Note: Row proportions may total to larger than one-hundred percent due to rounding. For more information visit MorningConsultIntelligence.com.

National Tracking Poll #2110009, October, 2021
149
Table POL11_3NET
Table POL11_3NET:Who do you feel is responsible for the expanded child tax credit payments being made possible? Please select all that apply.President Joe Biden
Demographic Selected Not Selected Total N
Registered Voters 38% (753) 62% (1245) 1998Gender: Male 38% (358) 62% (584) 942Gender: Female 37% (395) 63% (661) 1056Age: 18-34 35% (182) 65% (333) 514Age: 35-44 40% (122) 60% (185) 307Age: 45-64 34% (233) 66% (446) 679Age: 65+ 44% (217) 56% (281) 497GenZers: 1997-2012 34% (51) 66% (98) 148Millennials: 1981-1996 38% (211) 62% (345) 556GenXers: 1965-1980 36% (167) 64% (301) 468Baby Boomers: 1946-1964 39% (279) 61% (444) 723PID: Dem (no lean) 48% (356) 52% (388) 745PID: Ind (no lean) 31% (175) 69% (385) 559PID: Rep (no lean) 32% (222) 68% (472) 694PID/Gender: DemMen 50% (177) 50% (178) 355PID/Gender: DemWomen 46% (179) 54% (210) 390PID/Gender: Ind Men 32% (93) 68% (195) 288PID/Gender: Ind Women 30% (82) 70% (190) 271PID/Gender: Rep Men 30% (88) 70% (210) 299PID/Gender: Rep Women 34% (134) 66% (261) 395Ideo: Liberal (1-3) 47% (261) 53% (291) 553Ideo: Moderate (4) 35% (186) 65% (352) 538Ideo: Conservative (5-7) 35% (276) 65% (516) 793Educ: < College 38% (464) 62% (742) 1206Educ: Bachelors degree 35% (174) 65% (327) 501Educ: Post-grad 40% (115) 60% (175) 290Income: Under 50k 38% (333) 62% (550) 882Income: 50k-100k 37% (266) 63% (458) 723Income: 100k+ 39% (155) 61% (237) 392Ethnicity: White 37% (566) 63% (979) 1545Ethnicity: Hispanic 46% (102) 54% (120) 222Ethnicity: Black 43% (108) 57% (145) 253
Continued on next page
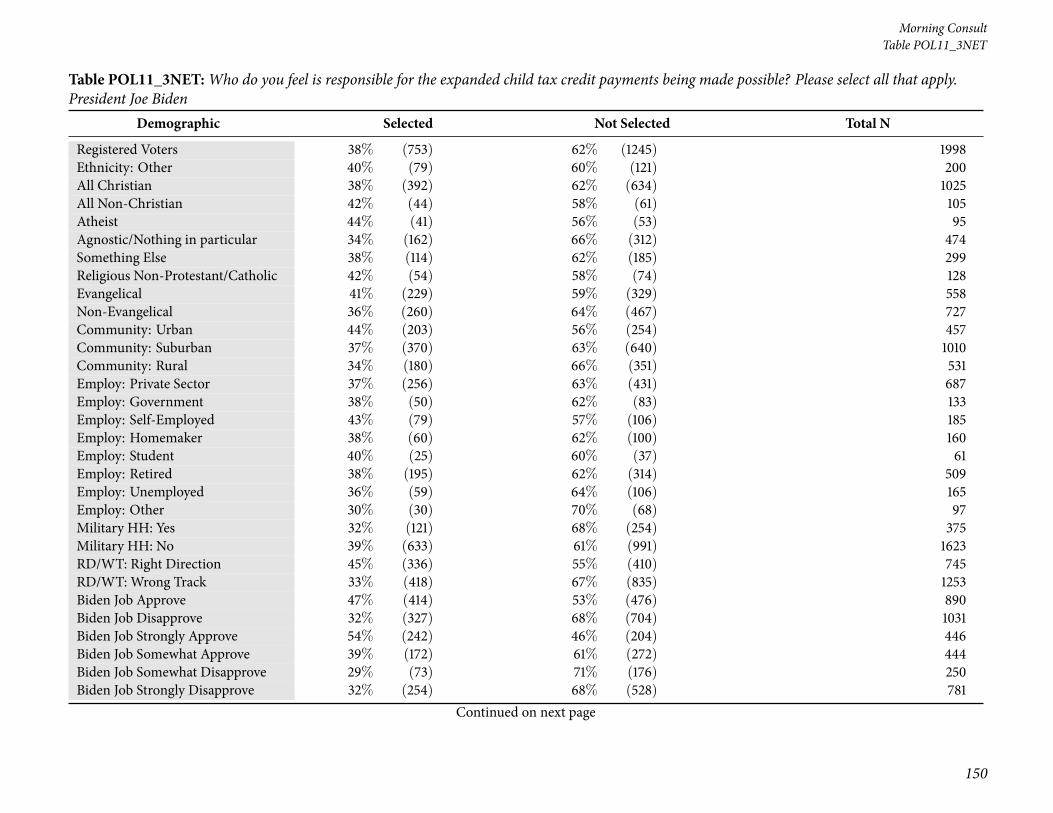
150
Morning ConsultTable POL11_3NET
Table POL11_3NET:Who do you feel is responsible for the expanded child tax credit payments being made possible? Please select all that apply.President Joe Biden
Demographic Selected Not Selected Total N
Registered Voters 38% (753) 62% (1245) 1998Ethnicity: Other 40% (79) 60% (121) 200All Christian 38% (392) 62% (634) 1025All Non-Christian 42% (44) 58% (61) 105Atheist 44% (41) 56% (53) 95Agnostic/Nothing in particular 34% (162) 66% (312) 474Something Else 38% (114) 62% (185) 299Religious Non-Protestant/Catholic 42% (54) 58% (74) 128Evangelical 41% (229) 59% (329) 558Non-Evangelical 36% (260) 64% (467) 727Community: Urban 44% (203) 56% (254) 457Community: Suburban 37% (370) 63% (640) 1010Community: Rural 34% (180) 66% (351) 531Employ: Private Sector 37% (256) 63% (431) 687Employ: Government 38% (50) 62% (83) 133Employ: Self-Employed 43% (79) 57% (106) 185Employ: Homemaker 38% (60) 62% (100) 160Employ: Student 40% (25) 60% (37) 61Employ: Retired 38% (195) 62% (314) 509Employ: Unemployed 36% (59) 64% (106) 165Employ: Other 30% (30) 70% (68) 97Military HH: Yes 32% (121) 68% (254) 375Military HH: No 39% (633) 61% (991) 1623RD/WT: Right Direction 45% (336) 55% (410) 745RD/WT: Wrong Track 33% (418) 67% (835) 1253Biden Job Approve 47% (414) 53% (476) 890Biden Job Disapprove 32% (327) 68% (704) 1031Biden Job Strongly Approve 54% (242) 46% (204) 446Biden Job Somewhat Approve 39% (172) 61% (272) 444Biden Job Somewhat Disapprove 29% (73) 71% (176) 250Biden Job Strongly Disapprove 32% (254) 68% (528) 781
Continued on next page

National Tracking Poll #2110009, October, 2021
151
Table POL11_3NET
Table POL11_3NET:Who do you feel is responsible for the expanded child tax credit payments being made possible? Please select all that apply.President Joe Biden
Demographic Selected Not Selected Total N
Registered Voters 38% (753) 62% (1245) 1998Favorable of Biden 47% (426) 53% (473) 899Unfavorable of Biden 31% (319) 69% (713) 1032Very Favorable of Biden 54% (256) 46% (214) 470Somewhat Favorable of Biden 40% (170) 60% (259) 429Somewhat Unfavorable of Biden 30% (73) 70% (173) 246Very Unfavorable of Biden 31% (246) 69% (540) 786#1 Issue: Economy 33% (246) 67% (496) 742#1 Issue: Security 39% (161) 61% (248) 409#1 Issue: Health Care 45% (111) 55% (137) 248#1 Issue: Medicare / Social Security 40% (84) 60% (125) 209#1 Issue: Women’s Issues 44% (48) 56% (63) 111#1 Issue: Education 33% (24) 67% (48) 72#1 Issue: Energy 39% (35) 61% (55) 90#1 Issue: Other 38% (44) 62% (73) 1172020 Vote: Joe Biden 45% (428) 55% (518) 9462020 Vote: Donald Trump 30% (255) 70% (608) 8642020 Vote: Didn’t Vote 38% (57) 62% (95) 1532018 House Vote: Democrat 46% (338) 54% (396) 7342018 House Vote: Republican 34% (241) 66% (478) 7192018 House Vote: Someone else 28% (15) 72% (38) 532016 Vote: Hillary Clinton 46% (328) 54% (378) 7062016 Vote: Donald Trump 32% (260) 68% (545) 8052016 Vote: Other 32% (28) 68% (59) 872016 Vote: Didn’t Vote 35% (138) 65% (261) 399Voted in 2014: Yes 40% (529) 60% (795) 1324Voted in 2014: No 33% (225) 67% (450) 6744-Region: Northeast 45% (158) 55% (195) 3534-Region: Midwest 35% (155) 65% (290) 4444-Region: South 38% (280) 62% (466) 7464-Region: West 35% (161) 65% (294) 455
Continued on next page
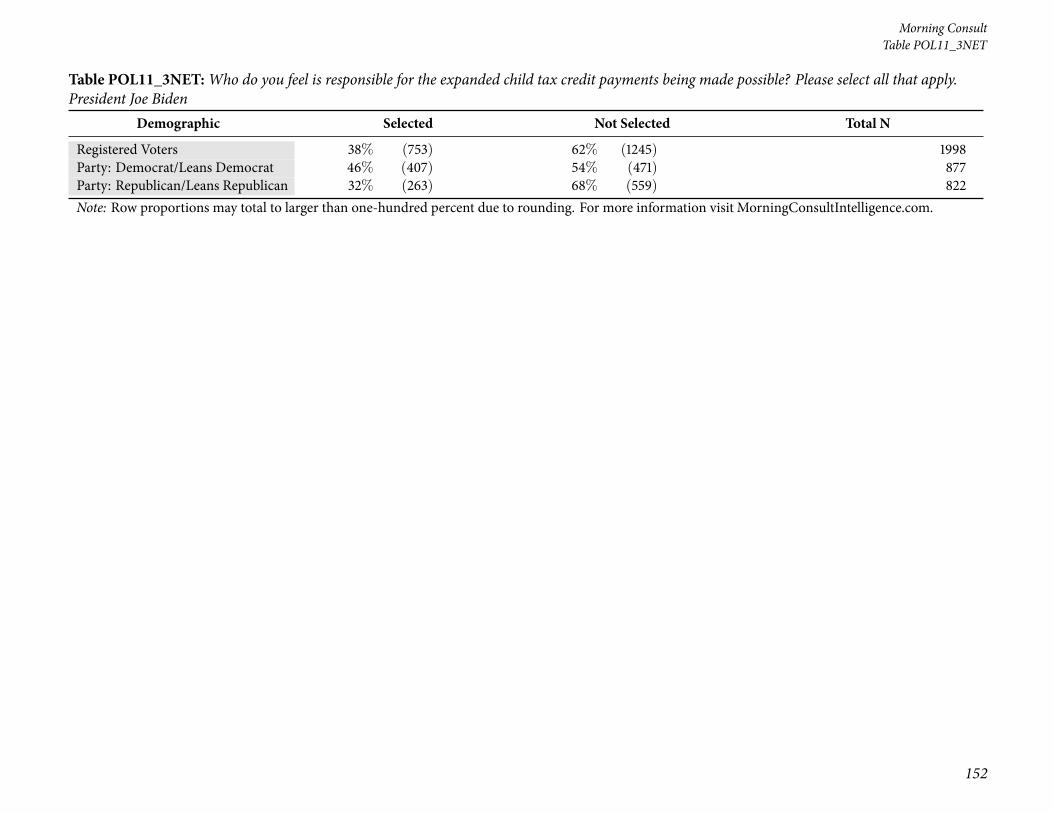
152
Morning ConsultTable POL11_3NET
Table POL11_3NET:Who do you feel is responsible for the expanded child tax credit payments being made possible? Please select all that apply.President Joe Biden
Demographic Selected Not Selected Total N
Registered Voters 38% (753) 62% (1245) 1998Party: Democrat/Leans Democrat 46% (407) 54% (471) 877Party: Republican/Leans Republican 32% (263) 68% (559) 822Note: Row proportions may total to larger than one-hundred percent due to rounding. For more information visit MorningConsultIntelligence.com.

National Tracking Poll #2110009, October, 2021
153
Table POL11_4NET
Table POL11_4NET:Who do you feel is responsible for the expanded child tax credit payments being made possible? Please select all that apply.Other (please specify)
Demographic Selected Not Selected Total N
Registered Voters 2% (30) 98% (1968) 1998Gender: Male 2% (22) 98% (920) 942Gender: Female 1% (9) 99% (1048) 1056Age: 18-34 1% (7) 99% (508) 514Age: 35-44 2% (5) 98% (301) 307Age: 45-64 2% (14) 98% (665) 679Age: 65+ 1% (4) 99% (493) 497GenZers: 1997-2012 1% (2) 99% (147) 148Millennials: 1981-1996 2% (8) 98% (547) 556GenXers: 1965-1980 1% (5) 99% (463) 468Baby Boomers: 1946-1964 2% (13) 98% (710) 723PID: Dem (no lean) 1% (6) 99% (739) 745PID: Ind (no lean) 2% (12) 98% (547) 559PID: Rep (no lean) 2% (13) 98% (681) 694PID/Gender: DemMen 1% (3) 99% (352) 355PID/Gender: DemWomen 1% (2) 99% (387) 390PID/Gender: Ind Men 4% (12) 96% (276) 288PID/Gender: Ind Women — (1) 100% (271) 271PID/Gender: Rep Men 2% (7) 98% (292) 299PID/Gender: Rep Women 1% (6) 99% (390) 395Ideo: Liberal (1-3) 1% (4) 99% (549) 553Ideo: Moderate (4) 2% (9) 98% (529) 538Ideo: Conservative (5-7) 2% (16) 98% (776) 793Educ: < College 1% (17) 99% (1190) 1206Educ: Bachelors degree 1% (6) 99% (495) 501Educ: Post-grad 3% (8) 97% (283) 290Income: Under 50k 2% (15) 98% (867) 882Income: 50k-100k 1% (8) 99% (715) 723Income: 100k+ 2% (7) 98% (385) 392Ethnicity: White 2% (26) 98% (1519) 1545Ethnicity: Hispanic 2% (5) 98% (217) 222Ethnicity: Black 1% (2) 99% (251) 253
Continued on next page
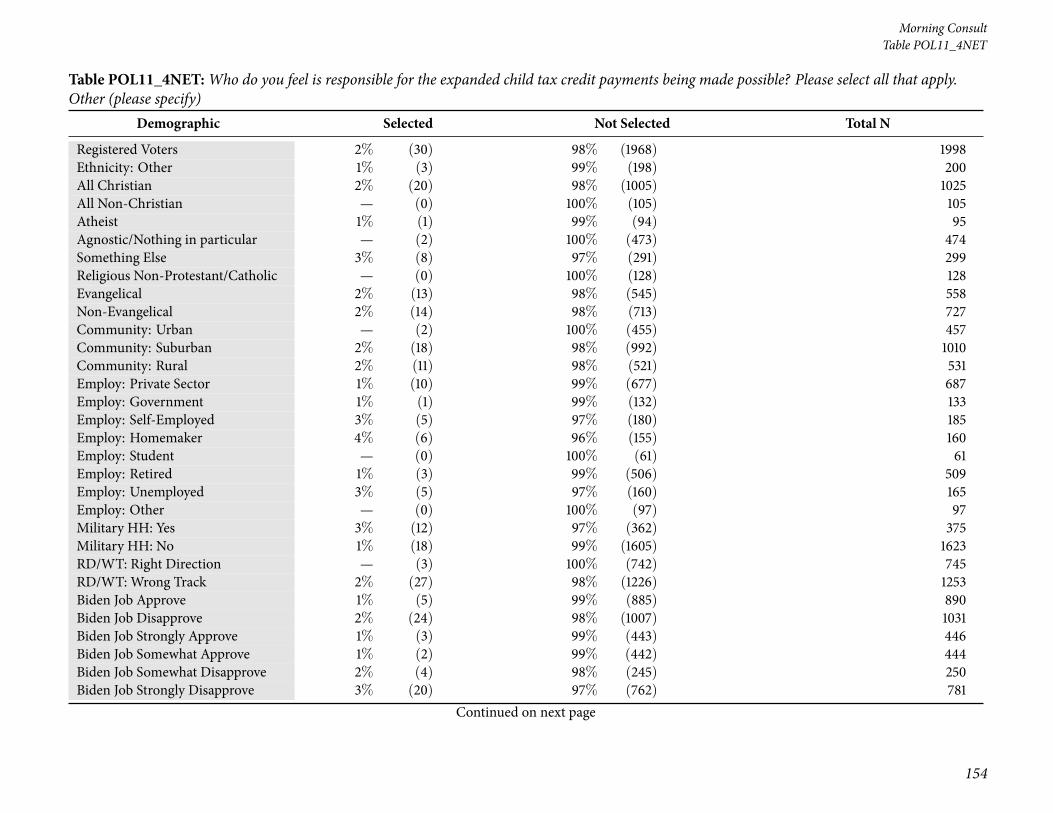
154
Morning ConsultTable POL11_4NET
Table POL11_4NET:Who do you feel is responsible for the expanded child tax credit payments being made possible? Please select all that apply.Other (please specify)
Demographic Selected Not Selected Total N
Registered Voters 2% (30) 98% (1968) 1998Ethnicity: Other 1% (3) 99% (198) 200All Christian 2% (20) 98% (1005) 1025All Non-Christian — (0) 100% (105) 105Atheist 1% (1) 99% (94) 95Agnostic/Nothing in particular — (2) 100% (473) 474Something Else 3% (8) 97% (291) 299Religious Non-Protestant/Catholic — (0) 100% (128) 128Evangelical 2% (13) 98% (545) 558Non-Evangelical 2% (14) 98% (713) 727Community: Urban — (2) 100% (455) 457Community: Suburban 2% (18) 98% (992) 1010Community: Rural 2% (11) 98% (521) 531Employ: Private Sector 1% (10) 99% (677) 687Employ: Government 1% (1) 99% (132) 133Employ: Self-Employed 3% (5) 97% (180) 185Employ: Homemaker 4% (6) 96% (155) 160Employ: Student — (0) 100% (61) 61Employ: Retired 1% (3) 99% (506) 509Employ: Unemployed 3% (5) 97% (160) 165Employ: Other — (0) 100% (97) 97Military HH: Yes 3% (12) 97% (362) 375Military HH: No 1% (18) 99% (1605) 1623RD/WT: Right Direction — (3) 100% (742) 745RD/WT: Wrong Track 2% (27) 98% (1226) 1253Biden Job Approve 1% (5) 99% (885) 890Biden Job Disapprove 2% (24) 98% (1007) 1031Biden Job Strongly Approve 1% (3) 99% (443) 446Biden Job Somewhat Approve 1% (2) 99% (442) 444Biden Job Somewhat Disapprove 2% (4) 98% (245) 250Biden Job Strongly Disapprove 3% (20) 97% (762) 781
Continued on next page

National Tracking Poll #2110009, October, 2021
155
Table POL11_4NET
Table POL11_4NET:Who do you feel is responsible for the expanded child tax credit payments being made possible? Please select all that apply.Other (please specify)
Demographic Selected Not Selected Total N
Registered Voters 2% (30) 98% (1968) 1998Favorable of Biden 1% (5) 99% (894) 899Unfavorable of Biden 2% (25) 98% (1007) 1032Very Favorable of Biden 1% (3) 99% (467) 470Somewhat Favorable of Biden 1% (2) 99% (427) 429Somewhat Unfavorable of Biden 2% (5) 98% (241) 246Very Unfavorable of Biden 3% (20) 97% (767) 786#1 Issue: Economy 2% (17) 98% (725) 742#1 Issue: Security 1% (5) 99% (404) 409#1 Issue: Health Care — (0) 100% (248) 248#1 Issue: Medicare / Social Security — (1) 100% (208) 209#1 Issue: Women’s Issues 2% (2) 98% (109) 111#1 Issue: Education — (0) 100% (72) 72#1 Issue: Energy — (0) 100% (89) 90#1 Issue: Other 4% (4) 96% (113) 1172020 Vote: Joe Biden 1% (8) 99% (938) 9462020 Vote: Donald Trump 2% (19) 98% (845) 8642020 Vote: Didn’t Vote 1% (2) 99% (151) 1532018 House Vote: Democrat 1% (8) 99% (726) 7342018 House Vote: Republican 2% (14) 98% (705) 7192018 House Vote: Someone else 5% (3) 95% (51) 532016 Vote: Hillary Clinton 1% (8) 99% (698) 7062016 Vote: Donald Trump 2% (15) 98% (790) 8052016 Vote: Other 3% (2) 97% (85) 872016 Vote: Didn’t Vote 1% (5) 99% (394) 399Voted in 2014: Yes 2% (21) 98% (1302) 1324Voted in 2014: No 1% (9) 99% (665) 6744-Region: Northeast 2% (5) 98% (347) 3534-Region: Midwest 2% (10) 98% (434) 4444-Region: South 2% (12) 98% (734) 7464-Region: West 1% (3) 99% (452) 455
Continued on next page

156
Morning ConsultTable POL11_4NET
Table POL11_4NET:Who do you feel is responsible for the expanded child tax credit payments being made possible? Please select all that apply.Other (please specify)
Demographic Selected Not Selected Total N
Registered Voters 2% (30) 98% (1968) 1998Party: Democrat/Leans Democrat 1% (7) 99% (871) 877Party: Republican/Leans Republican 2% (15) 98% (807) 822Note: Row proportions may total to larger than one-hundred percent due to rounding. For more information visit MorningConsultIntelligence.com.

National Tracking Poll #2110009, October, 2021
157
Table POL11_5NET
Table POL11_5NET:Who do you feel is responsible for the expanded child tax credit payments being made possible? Please select all that apply.Don’t Know / No Opinion
Demographic Selected Not Selected Total N
Registered Voters 24% (471) 76% (1527) 1998Gender: Male 19% (177) 81% (764) 942Gender: Female 28% (294) 72% (762) 1056Age: 18-34 33% (169) 67% (345) 514Age: 35-44 23% (72) 77% (235) 307Age: 45-64 22% (149) 78% (531) 679Age: 65+ 16% (81) 84% (416) 497GenZers: 1997-2012 39% (58) 61% (91) 148Millennials: 1981-1996 28% (156) 72% (400) 556GenXers: 1965-1980 22% (103) 78% (365) 468Baby Boomers: 1946-1964 19% (134) 81% (589) 723PID: Dem (no lean) 14% (103) 86% (642) 745PID: Ind (no lean) 35% (194) 65% (366) 559PID: Rep (no lean) 25% (175) 75% (519) 694PID/Gender: DemMen 10% (36) 90% (319) 355PID/Gender: DemWomen 17% (67) 83% (323) 390PID/Gender: Ind Men 30% (87) 70% (201) 288PID/Gender: Ind Women 39% (106) 61% (165) 271PID/Gender: Rep Men 18% (54) 82% (245) 299PID/Gender: Rep Women 31% (121) 69% (274) 395Ideo: Liberal (1-3) 13% (73) 87% (480) 553Ideo: Moderate (4) 26% (140) 74% (399) 538Ideo: Conservative (5-7) 24% (189) 76% (604) 793Educ: < College 25% (302) 75% (904) 1206Educ: Bachelors degree 22% (109) 78% (393) 501Educ: Post-grad 21% (60) 79% (230) 290Income: Under 50k 28% (244) 72% (638) 882Income: 50k-100k 22% (158) 78% (565) 723Income: 100k+ 17% (69) 83% (324) 392Ethnicity: White 23% (359) 77% (1186) 1545Ethnicity: Hispanic 27% (60) 73% (162) 222Ethnicity: Black 19% (49) 81% (204) 253
Continued on next page

158
Morning ConsultTable POL11_5NET
Table POL11_5NET:Who do you feel is responsible for the expanded child tax credit payments being made possible? Please select all that apply.Don’t Know / No Opinion
Demographic Selected Not Selected Total N
Registered Voters 24% (471) 76% (1527) 1998Ethnicity: Other 32% (64) 68% (137) 200All Christian 20% (202) 80% (824) 1025All Non-Christian 23% (24) 77% (80) 105Atheist 21% (20) 79% (75) 95Agnostic/Nothing in particular 31% (146) 69% (328) 474Something Else 27% (79) 73% (219) 299Religious Non-Protestant/Catholic 21% (27) 79% (101) 128Evangelical 20% (113) 80% (445) 558Non-Evangelical 22% (162) 78% (565) 727Community: Urban 21% (95) 79% (362) 457Community: Suburban 23% (235) 77% (774) 1010Community: Rural 27% (141) 73% (390) 531Employ: Private Sector 21% (141) 79% (546) 687Employ: Government 25% (33) 75% (100) 133Employ: Self-Employed 27% (50) 73% (135) 185Employ: Homemaker 28% (45) 72% (116) 160Employ: Student 33% (20) 67% (41) 61Employ: Retired 19% (98) 81% (411) 509Employ: Unemployed 29% (48) 71% (116) 165Employ: Other 36% (35) 64% (62) 97Military HH: Yes 22% (83) 78% (292) 375Military HH: No 24% (389) 76% (1234) 1623RD/WT: Right Direction 16% (122) 84% (623) 745RD/WT: Wrong Track 28% (349) 72% (903) 1253Biden Job Approve 15% (134) 85% (757) 890Biden Job Disapprove 27% (281) 73% (750) 1031Biden Job Strongly Approve 8% (37) 92% (409) 446Biden Job Somewhat Approve 22% (96) 78% (348) 444Biden Job Somewhat Disapprove 32% (81) 68% (169) 250Biden Job Strongly Disapprove 26% (200) 74% (582) 781
Continued on next page

National Tracking Poll #2110009, October, 2021
159
Table POL11_5NET
Table POL11_5NET:Who do you feel is responsible for the expanded child tax credit payments being made possible? Please select all that apply.Don’t Know / No Opinion
Demographic Selected Not Selected Total N
Registered Voters 24% (471) 76% (1527) 1998Favorable of Biden 16% (142) 84% (757) 899Unfavorable of Biden 28% (284) 72% (748) 1032Very Favorable of Biden 9% (44) 91% (426) 470Somewhat Favorable of Biden 23% (98) 77% (331) 429Somewhat Unfavorable of Biden 31% (77) 69% (169) 246Very Unfavorable of Biden 26% (207) 74% (580) 786#1 Issue: Economy 27% (202) 73% (540) 742#1 Issue: Security 19% (78) 81% (331) 409#1 Issue: Health Care 19% (47) 81% (202) 248#1 Issue: Medicare / Social Security 17% (36) 83% (173) 209#1 Issue: Women’s Issues 21% (24) 79% (87) 111#1 Issue: Education 25% (18) 75% (54) 72#1 Issue: Energy 32% (29) 68% (61) 90#1 Issue: Other 32% (38) 68% (79) 1172020 Vote: Joe Biden 18% (167) 82% (779) 9462020 Vote: Donald Trump 27% (232) 73% (632) 8642020 Vote: Didn’t Vote 40% (61) 60% (92) 1532018 House Vote: Democrat 14% (103) 86% (631) 7342018 House Vote: Republican 22% (157) 78% (562) 7192018 House Vote: Someone else 54% (29) 46% (25) 532016 Vote: Hillary Clinton 15% (104) 85% (601) 7062016 Vote: Donald Trump 24% (196) 76% (609) 8052016 Vote: Other 29% (25) 71% (62) 872016 Vote: Didn’t Vote 36% (145) 64% (254) 399Voted in 2014: Yes 18% (243) 82% (1080) 1324Voted in 2014: No 34% (228) 66% (446) 6744-Region: Northeast 18% (64) 82% (289) 3534-Region: Midwest 23% (102) 77% (343) 4444-Region: South 25% (183) 75% (562) 7464-Region: West 27% (122) 73% (333) 455
Continued on next page

160
Morning ConsultTable POL11_5NET
Table POL11_5NET:Who do you feel is responsible for the expanded child tax credit payments being made possible? Please select all that apply.Don’t Know / No Opinion
Demographic Selected Not Selected Total N
Registered Voters 24% (471) 76% (1527) 1998Party: Democrat/Leans Democrat 15% (134) 85% (743) 877Party: Republican/Leans Republican 25% (209) 75% (613) 822Note: Row proportions may total to larger than one-hundred percent due to rounding. For more information visit MorningConsultIntelligence.com.

National Tracking Poll #2110009, October, 2021
161
Table POL12
Table POL12: As you may know, the expanded child tax credit payments are set to expire next year. Do you think the payments should be madepermanent?
Demographic Yes, definitely Yes, probablyNo, probably
notNo, definitely
notDon’t know /No opinion Total N
Registered Voters 18% (358) 17% (334) 18% (368) 34% (679) 13% (258) 1998Gender: Male 20% (185) 18% (168) 17% (164) 34% (319) 11% (105) 942Gender: Female 16% (173) 16% (166) 19% (205) 34% (360) 14% (153) 1056Age: 18-34 24% (124) 23% (116) 17% (88) 20% (103) 16% (84) 514Age: 35-44 28% (85) 18% (55) 20% (62) 26% (78) 9% (27) 307Age: 45-64 15% (101) 15% (99) 19% (129) 39% (264) 13% (86) 679Age: 65+ 10% (49) 13% (64) 18% (90) 47% (235) 12% (61) 497GenZers: 1997-2012 15% (22) 17% (25) 24% (36) 19% (29) 25% (36) 148Millennials: 1981-1996 29% (158) 23% (127) 16% (90) 21% (115) 12% (65) 556GenXers: 1965-1980 18% (86) 17% (81) 19% (88) 33% (156) 12% (57) 468Baby Boomers: 1946-1964 12% (84) 13% (92) 18% (131) 46% (330) 12% (85) 723PID: Dem (no lean) 28% (210) 24% (180) 20% (150) 15% (114) 12% (91) 745PID: Ind (no lean) 14% (79) 14% (78) 20% (111) 33% (183) 19% (109) 559PID: Rep (no lean) 10% (69) 11% (77) 15% (107) 55% (383) 8% (59) 694PID/Gender: DemMen 31% (111) 25% (90) 19% (66) 15% (52) 10% (35) 355PID/Gender: DemWomen 25% (99) 23% (89) 22% (84) 16% (62) 14% (55) 390PID/Gender: Ind Men 17% (48) 15% (42) 17% (49) 34% (98) 18% (51) 288PID/Gender: Ind Women 11% (31) 13% (36) 23% (62) 31% (85) 21% (58) 271PID/Gender: Rep Men 9% (26) 12% (36) 16% (49) 57% (170) 6% (18) 299PID/Gender: Rep Women 11% (42) 10% (41) 15% (58) 54% (213) 10% (40) 395Ideo: Liberal (1-3) 33% (184) 24% (133) 18% (99) 11% (61) 14% (76) 553Ideo: Moderate (4) 16% (87) 17% (92) 23% (122) 30% (161) 14% (76) 538Ideo: Conservative (5-7) 8% (64) 12% (92) 16% (130) 56% (441) 8% (66) 793Educ: < College 17% (205) 15% (182) 19% (225) 34% (416) 15% (179) 1206Educ: Bachelors degree 20% (99) 18% (90) 17% (85) 36% (180) 10% (48) 501Educ: Post-grad 19% (54) 22% (63) 20% (58) 29% (84) 11% (31) 290Income: Under 50k 18% (157) 15% (131) 18% (162) 31% (274) 18% (158) 882Income: 50k-100k 18% (132) 18% (131) 17% (121) 37% (265) 10% (74) 723Income: 100k+ 17% (68) 18% (72) 22% (86) 36% (140) 7% (26) 392Ethnicity: White 16% (243) 16% (246) 18% (284) 37% (577) 13% (196) 1545Ethnicity: Hispanic 26% (57) 21% (48) 16% (36) 28% (62) 9% (20) 222
Continued on next page
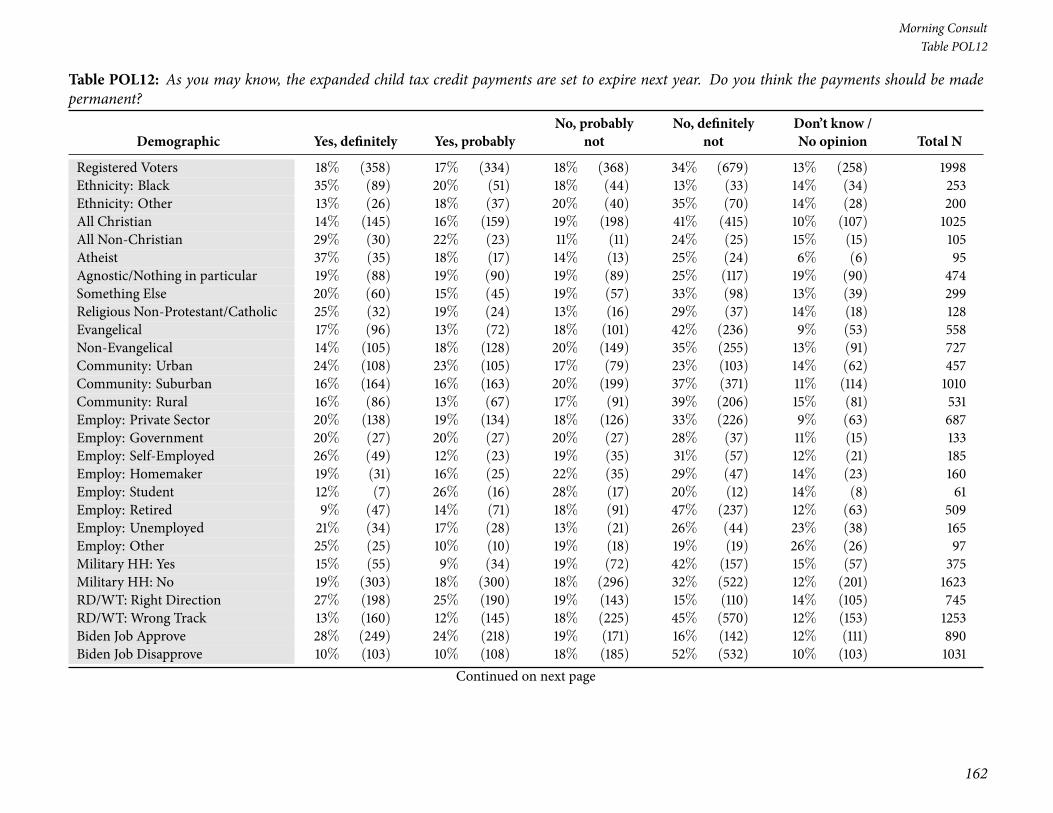
162
Morning ConsultTable POL12
Table POL12: As you may know, the expanded child tax credit payments are set to expire next year. Do you think the payments should be madepermanent?
Demographic Yes, definitely Yes, probablyNo, probably
notNo, definitely
notDon’t know /No opinion Total N
Registered Voters 18% (358) 17% (334) 18% (368) 34% (679) 13% (258) 1998Ethnicity: Black 35% (89) 20% (51) 18% (44) 13% (33) 14% (34) 253Ethnicity: Other 13% (26) 18% (37) 20% (40) 35% (70) 14% (28) 200All Christian 14% (145) 16% (159) 19% (198) 41% (415) 10% (107) 1025All Non-Christian 29% (30) 22% (23) 11% (11) 24% (25) 15% (15) 105Atheist 37% (35) 18% (17) 14% (13) 25% (24) 6% (6) 95Agnostic/Nothing in particular 19% (88) 19% (90) 19% (89) 25% (117) 19% (90) 474Something Else 20% (60) 15% (45) 19% (57) 33% (98) 13% (39) 299Religious Non-Protestant/Catholic 25% (32) 19% (24) 13% (16) 29% (37) 14% (18) 128Evangelical 17% (96) 13% (72) 18% (101) 42% (236) 9% (53) 558Non-Evangelical 14% (105) 18% (128) 20% (149) 35% (255) 13% (91) 727Community: Urban 24% (108) 23% (105) 17% (79) 23% (103) 14% (62) 457Community: Suburban 16% (164) 16% (163) 20% (199) 37% (371) 11% (114) 1010Community: Rural 16% (86) 13% (67) 17% (91) 39% (206) 15% (81) 531Employ: Private Sector 20% (138) 19% (134) 18% (126) 33% (226) 9% (63) 687Employ: Government 20% (27) 20% (27) 20% (27) 28% (37) 11% (15) 133Employ: Self-Employed 26% (49) 12% (23) 19% (35) 31% (57) 12% (21) 185Employ: Homemaker 19% (31) 16% (25) 22% (35) 29% (47) 14% (23) 160Employ: Student 12% (7) 26% (16) 28% (17) 20% (12) 14% (8) 61Employ: Retired 9% (47) 14% (71) 18% (91) 47% (237) 12% (63) 509Employ: Unemployed 21% (34) 17% (28) 13% (21) 26% (44) 23% (38) 165Employ: Other 25% (25) 10% (10) 19% (18) 19% (19) 26% (26) 97Military HH: Yes 15% (55) 9% (34) 19% (72) 42% (157) 15% (57) 375Military HH: No 19% (303) 18% (300) 18% (296) 32% (522) 12% (201) 1623RD/WT: Right Direction 27% (198) 25% (190) 19% (143) 15% (110) 14% (105) 745RD/WT: Wrong Track 13% (160) 12% (145) 18% (225) 45% (570) 12% (153) 1253Biden Job Approve 28% (249) 24% (218) 19% (171) 16% (142) 12% (111) 890Biden Job Disapprove 10% (103) 10% (108) 18% (185) 52% (532) 10% (103) 1031
Continued on next page
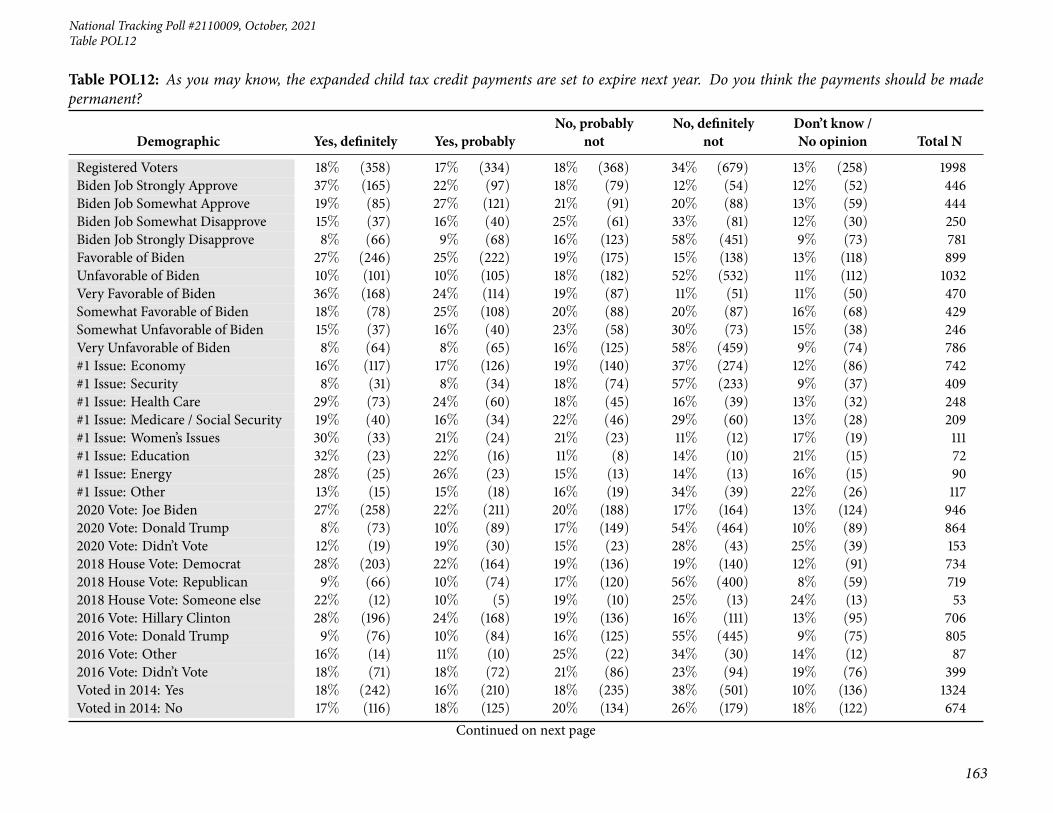
National Tracking Poll #2110009, October, 2021
163
Table POL12
Table POL12: As you may know, the expanded child tax credit payments are set to expire next year. Do you think the payments should be madepermanent?
Demographic Yes, definitely Yes, probablyNo, probably
notNo, definitely
notDon’t know /No opinion Total N
Registered Voters 18% (358) 17% (334) 18% (368) 34% (679) 13% (258) 1998Biden Job Strongly Approve 37% (165) 22% (97) 18% (79) 12% (54) 12% (52) 446Biden Job Somewhat Approve 19% (85) 27% (121) 21% (91) 20% (88) 13% (59) 444Biden Job Somewhat Disapprove 15% (37) 16% (40) 25% (61) 33% (81) 12% (30) 250Biden Job Strongly Disapprove 8% (66) 9% (68) 16% (123) 58% (451) 9% (73) 781Favorable of Biden 27% (246) 25% (222) 19% (175) 15% (138) 13% (118) 899Unfavorable of Biden 10% (101) 10% (105) 18% (182) 52% (532) 11% (112) 1032Very Favorable of Biden 36% (168) 24% (114) 19% (87) 11% (51) 11% (50) 470Somewhat Favorable of Biden 18% (78) 25% (108) 20% (88) 20% (87) 16% (68) 429Somewhat Unfavorable of Biden 15% (37) 16% (40) 23% (58) 30% (73) 15% (38) 246Very Unfavorable of Biden 8% (64) 8% (65) 16% (125) 58% (459) 9% (74) 786#1 Issue: Economy 16% (117) 17% (126) 19% (140) 37% (274) 12% (86) 742#1 Issue: Security 8% (31) 8% (34) 18% (74) 57% (233) 9% (37) 409#1 Issue: Health Care 29% (73) 24% (60) 18% (45) 16% (39) 13% (32) 248#1 Issue: Medicare / Social Security 19% (40) 16% (34) 22% (46) 29% (60) 13% (28) 209#1 Issue: Women’s Issues 30% (33) 21% (24) 21% (23) 11% (12) 17% (19) 111#1 Issue: Education 32% (23) 22% (16) 11% (8) 14% (10) 21% (15) 72#1 Issue: Energy 28% (25) 26% (23) 15% (13) 14% (13) 16% (15) 90#1 Issue: Other 13% (15) 15% (18) 16% (19) 34% (39) 22% (26) 1172020 Vote: Joe Biden 27% (258) 22% (211) 20% (188) 17% (164) 13% (124) 9462020 Vote: Donald Trump 8% (73) 10% (89) 17% (149) 54% (464) 10% (89) 8642020 Vote: Didn’t Vote 12% (19) 19% (30) 15% (23) 28% (43) 25% (39) 1532018 House Vote: Democrat 28% (203) 22% (164) 19% (136) 19% (140) 12% (91) 7342018 House Vote: Republican 9% (66) 10% (74) 17% (120) 56% (400) 8% (59) 7192018 House Vote: Someone else 22% (12) 10% (5) 19% (10) 25% (13) 24% (13) 532016 Vote: Hillary Clinton 28% (196) 24% (168) 19% (136) 16% (111) 13% (95) 7062016 Vote: Donald Trump 9% (76) 10% (84) 16% (125) 55% (445) 9% (75) 8052016 Vote: Other 16% (14) 11% (10) 25% (22) 34% (30) 14% (12) 872016 Vote: Didn’t Vote 18% (71) 18% (72) 21% (86) 23% (94) 19% (76) 399Voted in 2014: Yes 18% (242) 16% (210) 18% (235) 38% (501) 10% (136) 1324Voted in 2014: No 17% (116) 18% (125) 20% (134) 26% (179) 18% (122) 674
Continued on next page
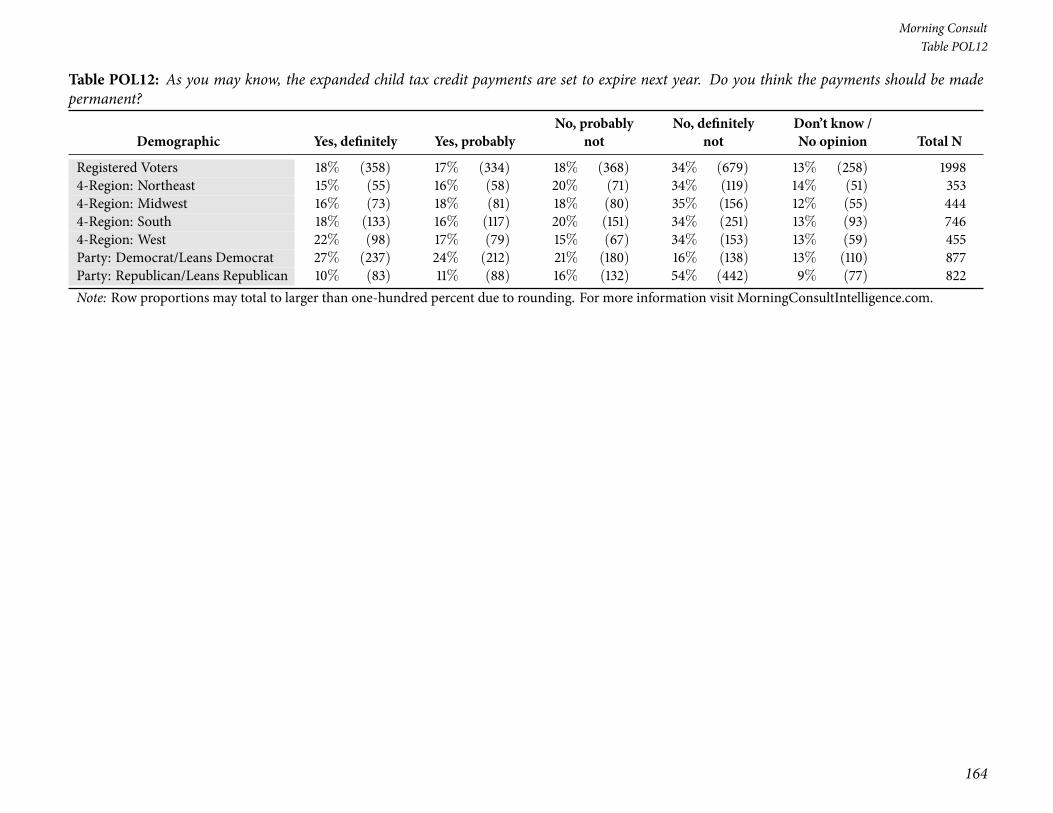
164
Morning ConsultTable POL12
Table POL12: As you may know, the expanded child tax credit payments are set to expire next year. Do you think the payments should be madepermanent?
Demographic Yes, definitely Yes, probablyNo, probably
notNo, definitely
notDon’t know /No opinion Total N
Registered Voters 18% (358) 17% (334) 18% (368) 34% (679) 13% (258) 19984-Region: Northeast 15% (55) 16% (58) 20% (71) 34% (119) 14% (51) 3534-Region: Midwest 16% (73) 18% (81) 18% (80) 35% (156) 12% (55) 4444-Region: South 18% (133) 16% (117) 20% (151) 34% (251) 13% (93) 7464-Region: West 22% (98) 17% (79) 15% (67) 34% (153) 13% (59) 455Party: Democrat/Leans Democrat 27% (237) 24% (212) 21% (180) 16% (138) 13% (110) 877Party: Republican/Leans Republican 10% (83) 11% (88) 16% (132) 54% (442) 9% (77) 822Note: Row proportions may total to larger than one-hundred percent due to rounding. For more information visit MorningConsultIntelligence.com.
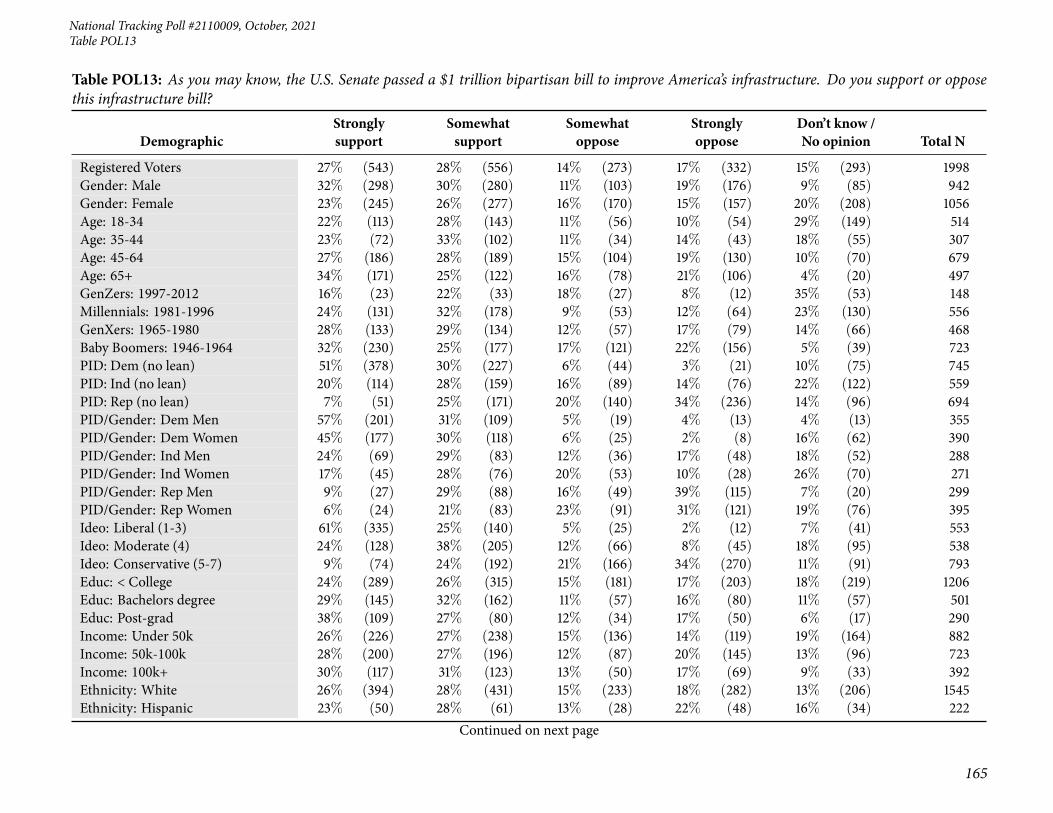
National Tracking Poll #2110009, October, 2021
165
Table POL13
Table POL13: As you may know, the U.S. Senate passed a $1 trillion bipartisan bill to improve America’s infrastructure. Do you support or opposethis infrastructure bill?
DemographicStronglysupport
Somewhatsupport
Somewhatoppose
Stronglyoppose
Don’t know /No opinion Total N
Registered Voters 27% (543) 28% (556) 14% (273) 17% (332) 15% (293) 1998Gender: Male 32% (298) 30% (280) 11% (103) 19% (176) 9% (85) 942Gender: Female 23% (245) 26% (277) 16% (170) 15% (157) 20% (208) 1056Age: 18-34 22% (113) 28% (143) 11% (56) 10% (54) 29% (149) 514Age: 35-44 23% (72) 33% (102) 11% (34) 14% (43) 18% (55) 307Age: 45-64 27% (186) 28% (189) 15% (104) 19% (130) 10% (70) 679Age: 65+ 34% (171) 25% (122) 16% (78) 21% (106) 4% (20) 497GenZers: 1997-2012 16% (23) 22% (33) 18% (27) 8% (12) 35% (53) 148Millennials: 1981-1996 24% (131) 32% (178) 9% (53) 12% (64) 23% (130) 556GenXers: 1965-1980 28% (133) 29% (134) 12% (57) 17% (79) 14% (66) 468Baby Boomers: 1946-1964 32% (230) 25% (177) 17% (121) 22% (156) 5% (39) 723PID: Dem (no lean) 51% (378) 30% (227) 6% (44) 3% (21) 10% (75) 745PID: Ind (no lean) 20% (114) 28% (159) 16% (89) 14% (76) 22% (122) 559PID: Rep (no lean) 7% (51) 25% (171) 20% (140) 34% (236) 14% (96) 694PID/Gender: DemMen 57% (201) 31% (109) 5% (19) 4% (13) 4% (13) 355PID/Gender: DemWomen 45% (177) 30% (118) 6% (25) 2% (8) 16% (62) 390PID/Gender: Ind Men 24% (69) 29% (83) 12% (36) 17% (48) 18% (52) 288PID/Gender: Ind Women 17% (45) 28% (76) 20% (53) 10% (28) 26% (70) 271PID/Gender: Rep Men 9% (27) 29% (88) 16% (49) 39% (115) 7% (20) 299PID/Gender: Rep Women 6% (24) 21% (83) 23% (91) 31% (121) 19% (76) 395Ideo: Liberal (1-3) 61% (335) 25% (140) 5% (25) 2% (12) 7% (41) 553Ideo: Moderate (4) 24% (128) 38% (205) 12% (66) 8% (45) 18% (95) 538Ideo: Conservative (5-7) 9% (74) 24% (192) 21% (166) 34% (270) 11% (91) 793Educ: < College 24% (289) 26% (315) 15% (181) 17% (203) 18% (219) 1206Educ: Bachelors degree 29% (145) 32% (162) 11% (57) 16% (80) 11% (57) 501Educ: Post-grad 38% (109) 27% (80) 12% (34) 17% (50) 6% (17) 290Income: Under 50k 26% (226) 27% (238) 15% (136) 14% (119) 19% (164) 882Income: 50k-100k 28% (200) 27% (196) 12% (87) 20% (145) 13% (96) 723Income: 100k+ 30% (117) 31% (123) 13% (50) 17% (69) 9% (33) 392Ethnicity: White 26% (394) 28% (431) 15% (233) 18% (282) 13% (206) 1545Ethnicity: Hispanic 23% (50) 28% (61) 13% (28) 22% (48) 16% (34) 222
Continued on next page

166
Morning ConsultTable POL13
Table POL13: As you may know, the U.S. Senate passed a $1 trillion bipartisan bill to improve America’s infrastructure. Do you support or opposethis infrastructure bill?
DemographicStronglysupport
Somewhatsupport
Somewhatoppose
Stronglyoppose
Don’t know /No opinion Total N
Registered Voters 27% (543) 28% (556) 14% (273) 17% (332) 15% (293) 1998Ethnicity: Black 43% (110) 27% (68) 7% (17) 6% (14) 17% (44) 253Ethnicity: Other 19% (39) 29% (57) 12% (23) 18% (37) 22% (44) 200All Christian 25% (261) 26% (270) 17% (179) 21% (212) 10% (103) 1025All Non-Christian 45% (48) 28% (30) 7% (8) 9% (9) 10% (11) 105Atheist 47% (44) 28% (26) 6% (6) 8% (8) 11% (10) 95Agnostic/Nothing in particular 28% (134) 30% (144) 10% (46) 11% (52) 21% (99) 474Something Else 19% (57) 29% (87) 12% (35) 17% (51) 23% (69) 299Religious Non-Protestant/Catholic 39% (50) 25% (33) 13% (17) 12% (15) 10% (13) 128Evangelical 20% (113) 26% (144) 14% (76) 26% (144) 15% (82) 558Non-Evangelical 27% (198) 28% (207) 17% (125) 15% (110) 12% (88) 727Community: Urban 36% (163) 32% (145) 10% (47) 11% (50) 11% (52) 457Community: Suburban 28% (282) 27% (277) 15% (151) 16% (157) 14% (143) 1010Community: Rural 18% (98) 25% (135) 14% (75) 23% (125) 19% (99) 531Employ: Private Sector 26% (178) 32% (219) 13% (88) 16% (110) 13% (92) 687Employ: Government 23% (31) 28% (37) 13% (18) 15% (19) 21% (27) 133Employ: Self-Employed 33% (61) 24% (44) 10% (18) 17% (31) 17% (32) 185Employ: Homemaker 14% (22) 23% (37) 20% (32) 19% (31) 24% (38) 160Employ: Student 23% (14) 22% (14) 15% (9) 15% (9) 26% (16) 61Employ: Retired 33% (170) 27% (138) 15% (75) 21% (108) 4% (19) 509Employ: Unemployed 24% (40) 27% (45) 11% (17) 8% (14) 30% (49) 165Employ: Other 27% (27) 25% (24) 16% (15) 11% (11) 21% (20) 97Military HH: Yes 26% (99) 22% (81) 21% (78) 19% (72) 12% (45) 375Military HH: No 27% (444) 29% (475) 12% (195) 16% (260) 15% (248) 1623RD/WT: Right Direction 50% (370) 32% (240) 6% (48) 2% (18) 9% (70) 745RD/WT: Wrong Track 14% (173) 25% (316) 18% (225) 25% (315) 18% (223) 1253Biden Job Approve 50% (447) 33% (293) 7% (59) 1% (13) 9% (78) 890Biden Job Disapprove 9% (88) 24% (249) 20% (211) 31% (318) 16% (165) 1031
Continued on next page
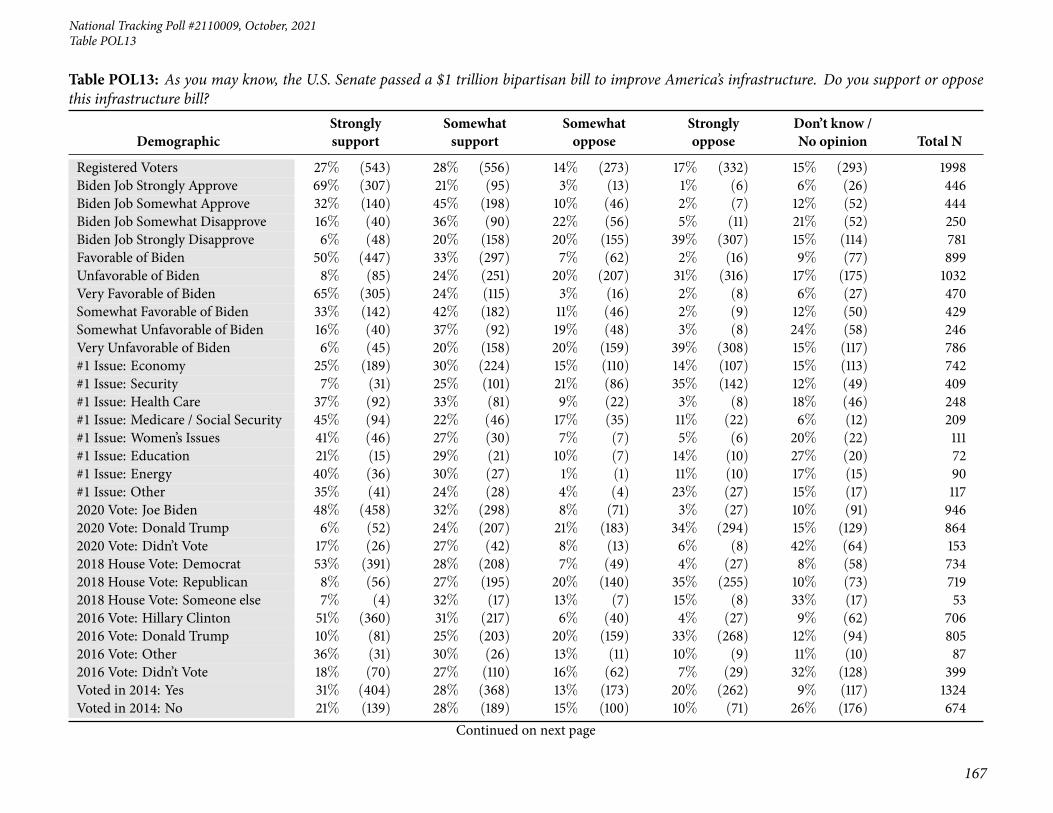
National Tracking Poll #2110009, October, 2021
167
Table POL13
Table POL13: As you may know, the U.S. Senate passed a $1 trillion bipartisan bill to improve America’s infrastructure. Do you support or opposethis infrastructure bill?
DemographicStronglysupport
Somewhatsupport
Somewhatoppose
Stronglyoppose
Don’t know /No opinion Total N
Registered Voters 27% (543) 28% (556) 14% (273) 17% (332) 15% (293) 1998Biden Job Strongly Approve 69% (307) 21% (95) 3% (13) 1% (6) 6% (26) 446Biden Job Somewhat Approve 32% (140) 45% (198) 10% (46) 2% (7) 12% (52) 444Biden Job Somewhat Disapprove 16% (40) 36% (90) 22% (56) 5% (11) 21% (52) 250Biden Job Strongly Disapprove 6% (48) 20% (158) 20% (155) 39% (307) 15% (114) 781Favorable of Biden 50% (447) 33% (297) 7% (62) 2% (16) 9% (77) 899Unfavorable of Biden 8% (85) 24% (251) 20% (207) 31% (316) 17% (175) 1032Very Favorable of Biden 65% (305) 24% (115) 3% (16) 2% (8) 6% (27) 470Somewhat Favorable of Biden 33% (142) 42% (182) 11% (46) 2% (9) 12% (50) 429Somewhat Unfavorable of Biden 16% (40) 37% (92) 19% (48) 3% (8) 24% (58) 246Very Unfavorable of Biden 6% (45) 20% (158) 20% (159) 39% (308) 15% (117) 786#1 Issue: Economy 25% (189) 30% (224) 15% (110) 14% (107) 15% (113) 742#1 Issue: Security 7% (31) 25% (101) 21% (86) 35% (142) 12% (49) 409#1 Issue: Health Care 37% (92) 33% (81) 9% (22) 3% (8) 18% (46) 248#1 Issue: Medicare / Social Security 45% (94) 22% (46) 17% (35) 11% (22) 6% (12) 209#1 Issue: Women’s Issues 41% (46) 27% (30) 7% (7) 5% (6) 20% (22) 111#1 Issue: Education 21% (15) 29% (21) 10% (7) 14% (10) 27% (20) 72#1 Issue: Energy 40% (36) 30% (27) 1% (1) 11% (10) 17% (15) 90#1 Issue: Other 35% (41) 24% (28) 4% (4) 23% (27) 15% (17) 1172020 Vote: Joe Biden 48% (458) 32% (298) 8% (71) 3% (27) 10% (91) 9462020 Vote: Donald Trump 6% (52) 24% (207) 21% (183) 34% (294) 15% (129) 8642020 Vote: Didn’t Vote 17% (26) 27% (42) 8% (13) 6% (8) 42% (64) 1532018 House Vote: Democrat 53% (391) 28% (208) 7% (49) 4% (27) 8% (58) 7342018 House Vote: Republican 8% (56) 27% (195) 20% (140) 35% (255) 10% (73) 7192018 House Vote: Someone else 7% (4) 32% (17) 13% (7) 15% (8) 33% (17) 532016 Vote: Hillary Clinton 51% (360) 31% (217) 6% (40) 4% (27) 9% (62) 7062016 Vote: Donald Trump 10% (81) 25% (203) 20% (159) 33% (268) 12% (94) 8052016 Vote: Other 36% (31) 30% (26) 13% (11) 10% (9) 11% (10) 872016 Vote: Didn’t Vote 18% (70) 27% (110) 16% (62) 7% (29) 32% (128) 399Voted in 2014: Yes 31% (404) 28% (368) 13% (173) 20% (262) 9% (117) 1324Voted in 2014: No 21% (139) 28% (189) 15% (100) 10% (71) 26% (176) 674
Continued on next page

168
Morning ConsultTable POL13
Table POL13: As you may know, the U.S. Senate passed a $1 trillion bipartisan bill to improve America’s infrastructure. Do you support or opposethis infrastructure bill?
DemographicStronglysupport
Somewhatsupport
Somewhatoppose
Stronglyoppose
Don’t know /No opinion Total N
Registered Voters 27% (543) 28% (556) 14% (273) 17% (332) 15% (293) 19984-Region: Northeast 33% (117) 30% (105) 14% (49) 13% (45) 10% (37) 3534-Region: Midwest 25% (112) 30% (133) 14% (64) 15% (65) 16% (71) 4444-Region: South 24% (182) 28% (206) 12% (90) 19% (144) 17% (123) 7464-Region: West 29% (132) 25% (113) 15% (69) 17% (79) 14% (62) 455Party: Democrat/Leans Democrat 50% (443) 30% (265) 6% (56) 3% (23) 10% (91) 877Party: Republican/Leans Republican 8% (62) 25% (204) 21% (172) 32% (266) 14% (118) 822Note: Row proportions may total to larger than one-hundred percent due to rounding. For more information visit MorningConsultIntelligence.com.

National Tracking Poll #2110009, October, 2021
169
Table POL14
Table POL14: How well, if at all, would you say you understand the ongoing conversations in Washington D.C. about the debt ceiling?Demographic Very well Somewhat well Not too well Not well at all Total N
Registered Voters 15% (298) 38% (761) 31% (622) 16% (317) 1998Gender: Male 21% (198) 43% (409) 23% (217) 13% (118) 942Gender: Female 10% (100) 33% (351) 38% (406) 19% (199) 1056Age: 18-34 12% (61) 35% (179) 32% (165) 21% (109) 514Age: 35-44 19% (57) 35% (106) 33% (100) 14% (43) 307Age: 45-64 15% (104) 40% (269) 30% (206) 15% (101) 679Age: 65+ 15% (76) 41% (206) 30% (151) 13% (64) 497GenZers: 1997-2012 5% (8) 31% (46) 36% (54) 28% (41) 148Millennials: 1981-1996 16% (90) 34% (191) 33% (181) 17% (94) 556GenXers: 1965-1980 14% (67) 44% (205) 27% (126) 15% (70) 468Baby Boomers: 1946-1964 16% (115) 39% (285) 32% (231) 13% (92) 723PID: Dem (no lean) 16% (118) 41% (307) 32% (237) 11% (84) 745PID: Ind (no lean) 13% (75) 36% (199) 31% (174) 20% (112) 559PID: Rep (no lean) 15% (105) 37% (255) 31% (212) 18% (122) 694PID/Gender: DemMen 22% (77) 44% (157) 24% (87) 10% (34) 355PID/Gender: DemWomen 10% (41) 38% (149) 39% (150) 13% (50) 390PID/Gender: Ind Men 19% (56) 39% (112) 23% (67) 18% (53) 288PID/Gender: Ind Women 7% (19) 32% (87) 39% (107) 22% (59) 271PID/Gender: Rep Men 22% (65) 47% (140) 21% (63) 10% (31) 299PID/Gender: Rep Women 10% (40) 29% (115) 38% (149) 23% (90) 395Ideo: Liberal (1-3) 19% (103) 41% (227) 29% (160) 11% (62) 553Ideo: Moderate (4) 12% (63) 41% (219) 31% (168) 16% (88) 538Ideo: Conservative (5-7) 16% (127) 38% (298) 33% (258) 14% (110) 793Educ: < College 11% (135) 34% (412) 34% (414) 20% (245) 1206Educ: Bachelors degree 20% (101) 40% (200) 28% (140) 12% (59) 501Educ: Post-grad 21% (61) 51% (149) 23% (68) 4% (13) 290Income: Under 50k 11% (100) 32% (280) 36% (321) 21% (183) 882Income: 50k-100k 17% (121) 42% (301) 26% (192) 15% (110) 723Income: 100k+ 20% (77) 46% (180) 28% (110) 6% (25) 392Ethnicity: White 15% (225) 39% (595) 31% (474) 16% (251) 1545Ethnicity: Hispanic 17% (37) 42% (92) 21% (47) 20% (45) 222Ethnicity: Black 20% (51) 33% (84) 32% (82) 14% (35) 253Ethnicity: Other 11% (22) 40% (81) 33% (66) 16% (31) 200
Continued on next page

170
Morning ConsultTable POL14
Table POL14: How well, if at all, would you say you understand the ongoing conversations in Washington D.C. about the debt ceiling?Demographic Very well Somewhat well Not too well Not well at all Total N
Registered Voters 15% (298) 38% (761) 31% (622) 16% (317) 1998All Christian 16% (163) 40% (413) 31% (316) 13% (133) 1025All Non-Christian 29% (31) 45% (47) 17% (17) 9% (10) 105Atheist 20% (19) 33% (31) 24% (23) 23% (22) 95Agnostic/Nothing in particular 9% (43) 38% (178) 31% (149) 22% (104) 474Something Else 14% (42) 30% (91) 39% (117) 16% (49) 299Religious Non-Protestant/Catholic 30% (38) 38% (49) 23% (30) 9% (11) 128Evangelical 18% (99) 37% (204) 31% (171) 15% (84) 558Non-Evangelical 13% (94) 40% (291) 34% (247) 13% (96) 727Community: Urban 19% (88) 40% (183) 27% (123) 14% (63) 457Community: Suburban 14% (145) 39% (394) 32% (321) 15% (150) 1010Community: Rural 12% (65) 35% (184) 34% (178) 20% (104) 531Employ: Private Sector 17% (118) 40% (278) 30% (208) 12% (83) 687Employ: Government 14% (19) 42% (56) 28% (38) 15% (20) 133Employ: Self-Employed 24% (44) 29% (53) 31% (57) 17% (31) 185Employ: Homemaker 6% (9) 34% (55) 40% (64) 21% (33) 160Employ: Student 9% (5) 40% (25) 24% (15) 27% (16) 61Employ: Retired 16% (80) 43% (216) 30% (154) 11% (58) 509Employ: Unemployed 7% (12) 28% (46) 34% (57) 30% (50) 165Employ: Other 11% (10) 33% (32) 31% (30) 26% (25) 97Military HH: Yes 15% (58) 39% (145) 27% (102) 19% (70) 375Military HH: No 15% (241) 38% (616) 32% (520) 15% (247) 1623RD/WT: Right Direction 17% (129) 44% (327) 28% (211) 11% (79) 745RD/WT: Wrong Track 14% (169) 35% (433) 33% (412) 19% (238) 1253Biden Job Approve 17% (152) 41% (367) 31% (274) 11% (97) 890Biden Job Disapprove 14% (140) 37% (379) 32% (328) 18% (184) 1031Biden Job Strongly Approve 24% (107) 42% (186) 25% (111) 9% (41) 446Biden Job Somewhat Approve 10% (44) 41% (181) 37% (163) 13% (56) 444Biden Job Somewhat Disapprove 5% (14) 33% (84) 43% (106) 19% (46) 250Biden Job Strongly Disapprove 16% (126) 38% (295) 28% (222) 18% (138) 781Favorable of Biden 16% (140) 41% (371) 31% (282) 12% (105) 899Unfavorable of Biden 14% (147) 37% (379) 31% (321) 18% (185) 1032
Continued on next page
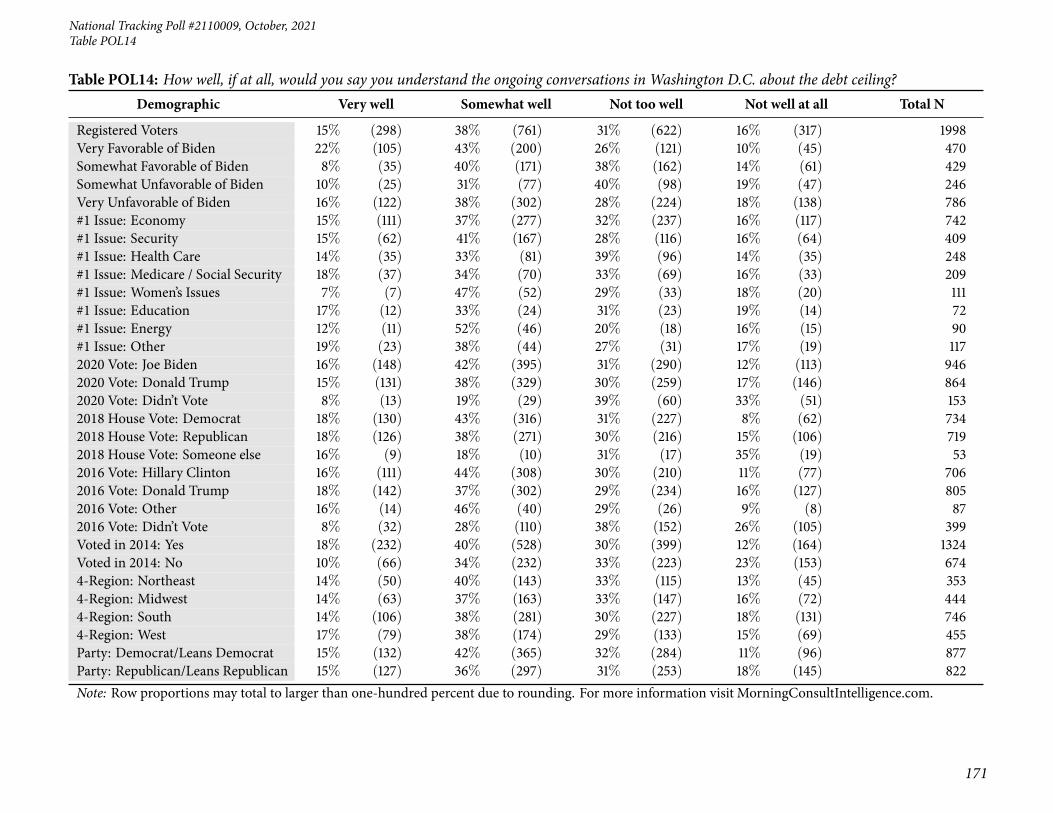
National Tracking Poll #2110009, October, 2021
171
Table POL14
Table POL14: How well, if at all, would you say you understand the ongoing conversations in Washington D.C. about the debt ceiling?Demographic Very well Somewhat well Not too well Not well at all Total N
Registered Voters 15% (298) 38% (761) 31% (622) 16% (317) 1998Very Favorable of Biden 22% (105) 43% (200) 26% (121) 10% (45) 470Somewhat Favorable of Biden 8% (35) 40% (171) 38% (162) 14% (61) 429Somewhat Unfavorable of Biden 10% (25) 31% (77) 40% (98) 19% (47) 246Very Unfavorable of Biden 16% (122) 38% (302) 28% (224) 18% (138) 786#1 Issue: Economy 15% (111) 37% (277) 32% (237) 16% (117) 742#1 Issue: Security 15% (62) 41% (167) 28% (116) 16% (64) 409#1 Issue: Health Care 14% (35) 33% (81) 39% (96) 14% (35) 248#1 Issue: Medicare / Social Security 18% (37) 34% (70) 33% (69) 16% (33) 209#1 Issue: Women’s Issues 7% (7) 47% (52) 29% (33) 18% (20) 111#1 Issue: Education 17% (12) 33% (24) 31% (23) 19% (14) 72#1 Issue: Energy 12% (11) 52% (46) 20% (18) 16% (15) 90#1 Issue: Other 19% (23) 38% (44) 27% (31) 17% (19) 1172020 Vote: Joe Biden 16% (148) 42% (395) 31% (290) 12% (113) 9462020 Vote: Donald Trump 15% (131) 38% (329) 30% (259) 17% (146) 8642020 Vote: Didn’t Vote 8% (13) 19% (29) 39% (60) 33% (51) 1532018 House Vote: Democrat 18% (130) 43% (316) 31% (227) 8% (62) 7342018 House Vote: Republican 18% (126) 38% (271) 30% (216) 15% (106) 7192018 House Vote: Someone else 16% (9) 18% (10) 31% (17) 35% (19) 532016 Vote: Hillary Clinton 16% (111) 44% (308) 30% (210) 11% (77) 7062016 Vote: Donald Trump 18% (142) 37% (302) 29% (234) 16% (127) 8052016 Vote: Other 16% (14) 46% (40) 29% (26) 9% (8) 872016 Vote: Didn’t Vote 8% (32) 28% (110) 38% (152) 26% (105) 399Voted in 2014: Yes 18% (232) 40% (528) 30% (399) 12% (164) 1324Voted in 2014: No 10% (66) 34% (232) 33% (223) 23% (153) 6744-Region: Northeast 14% (50) 40% (143) 33% (115) 13% (45) 3534-Region: Midwest 14% (63) 37% (163) 33% (147) 16% (72) 4444-Region: South 14% (106) 38% (281) 30% (227) 18% (131) 7464-Region: West 17% (79) 38% (174) 29% (133) 15% (69) 455Party: Democrat/Leans Democrat 15% (132) 42% (365) 32% (284) 11% (96) 877Party: Republican/Leans Republican 15% (127) 36% (297) 31% (253) 18% (145) 822Note: Row proportions may total to larger than one-hundred percent due to rounding. For more information visit MorningConsultIntelligence.com.
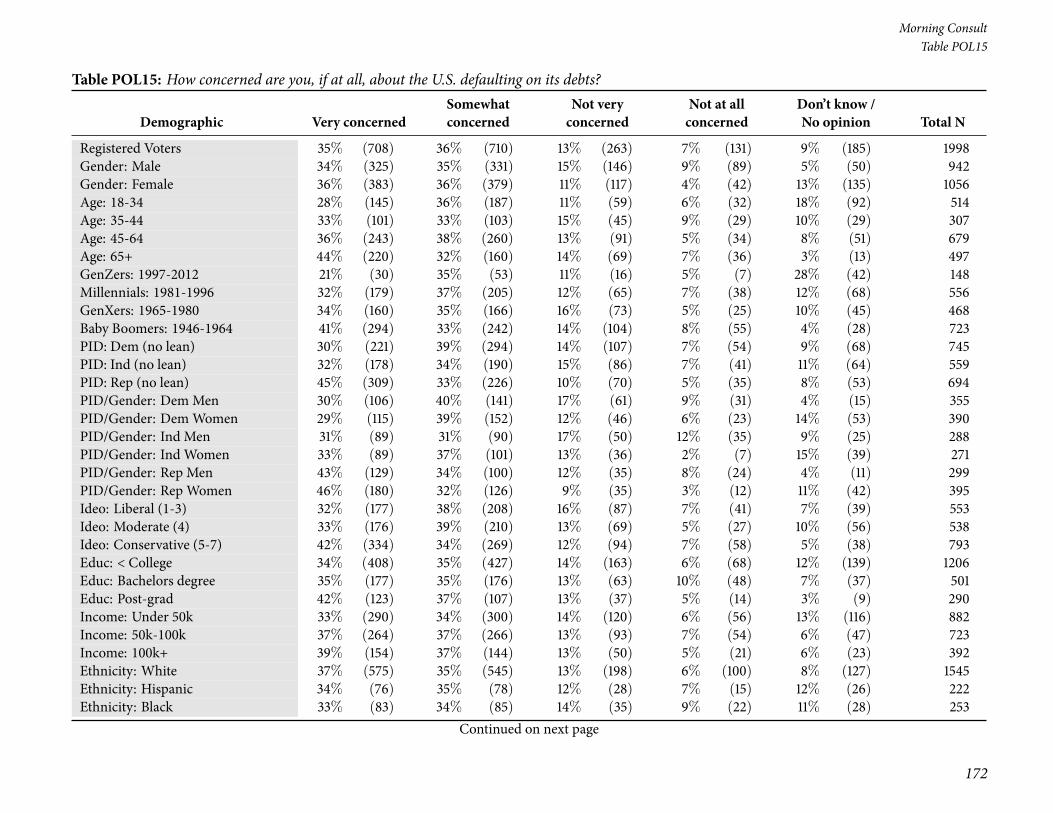
172
Morning ConsultTable POL15
Table POL15: How concerned are you, if at all, about the U.S. defaulting on its debts?
Demographic Very concernedSomewhatconcerned
Not veryconcerned
Not at allconcerned
Don’t know /No opinion Total N
Registered Voters 35% (708) 36% (710) 13% (263) 7% (131) 9% (185) 1998Gender: Male 34% (325) 35% (331) 15% (146) 9% (89) 5% (50) 942Gender: Female 36% (383) 36% (379) 11% (117) 4% (42) 13% (135) 1056Age: 18-34 28% (145) 36% (187) 11% (59) 6% (32) 18% (92) 514Age: 35-44 33% (101) 33% (103) 15% (45) 9% (29) 10% (29) 307Age: 45-64 36% (243) 38% (260) 13% (91) 5% (34) 8% (51) 679Age: 65+ 44% (220) 32% (160) 14% (69) 7% (36) 3% (13) 497GenZers: 1997-2012 21% (30) 35% (53) 11% (16) 5% (7) 28% (42) 148Millennials: 1981-1996 32% (179) 37% (205) 12% (65) 7% (38) 12% (68) 556GenXers: 1965-1980 34% (160) 35% (166) 16% (73) 5% (25) 10% (45) 468Baby Boomers: 1946-1964 41% (294) 33% (242) 14% (104) 8% (55) 4% (28) 723PID: Dem (no lean) 30% (221) 39% (294) 14% (107) 7% (54) 9% (68) 745PID: Ind (no lean) 32% (178) 34% (190) 15% (86) 7% (41) 11% (64) 559PID: Rep (no lean) 45% (309) 33% (226) 10% (70) 5% (35) 8% (53) 694PID/Gender: DemMen 30% (106) 40% (141) 17% (61) 9% (31) 4% (15) 355PID/Gender: DemWomen 29% (115) 39% (152) 12% (46) 6% (23) 14% (53) 390PID/Gender: Ind Men 31% (89) 31% (90) 17% (50) 12% (35) 9% (25) 288PID/Gender: Ind Women 33% (89) 37% (101) 13% (36) 2% (7) 15% (39) 271PID/Gender: Rep Men 43% (129) 34% (100) 12% (35) 8% (24) 4% (11) 299PID/Gender: Rep Women 46% (180) 32% (126) 9% (35) 3% (12) 11% (42) 395Ideo: Liberal (1-3) 32% (177) 38% (208) 16% (87) 7% (41) 7% (39) 553Ideo: Moderate (4) 33% (176) 39% (210) 13% (69) 5% (27) 10% (56) 538Ideo: Conservative (5-7) 42% (334) 34% (269) 12% (94) 7% (58) 5% (38) 793Educ: < College 34% (408) 35% (427) 14% (163) 6% (68) 12% (139) 1206Educ: Bachelors degree 35% (177) 35% (176) 13% (63) 10% (48) 7% (37) 501Educ: Post-grad 42% (123) 37% (107) 13% (37) 5% (14) 3% (9) 290Income: Under 50k 33% (290) 34% (300) 14% (120) 6% (56) 13% (116) 882Income: 50k-100k 37% (264) 37% (266) 13% (93) 7% (54) 6% (47) 723Income: 100k+ 39% (154) 37% (144) 13% (50) 5% (21) 6% (23) 392Ethnicity: White 37% (575) 35% (545) 13% (198) 6% (100) 8% (127) 1545Ethnicity: Hispanic 34% (76) 35% (78) 12% (28) 7% (15) 12% (26) 222Ethnicity: Black 33% (83) 34% (85) 14% (35) 9% (22) 11% (28) 253
Continued on next page

National Tracking Poll #2110009, October, 2021
173
Table POL15
Table POL15: How concerned are you, if at all, about the U.S. defaulting on its debts?
Demographic Very concernedSomewhatconcerned
Not veryconcerned
Not at allconcerned
Don’t know /No opinion Total N
Registered Voters 35% (708) 36% (710) 13% (263) 7% (131) 9% (185) 1998Ethnicity: Other 25% (50) 40% (80) 15% (31) 5% (10) 15% (29) 200All Christian 40% (407) 35% (363) 14% (146) 6% (57) 5% (52) 1025All Non-Christian 37% (39) 37% (39) 11% (11) 8% (8) 7% (7) 105Atheist 30% (28) 33% (31) 18% (17) 14% (13) 5% (5) 95Agnostic/Nothing in particular 25% (118) 37% (173) 13% (63) 8% (37) 17% (82) 474Something Else 39% (115) 35% (104) 9% (26) 6% (17) 13% (38) 299Religious Non-Protestant/Catholic 39% (50) 33% (42) 14% (18) 7% (9) 6% (8) 128Evangelical 46% (256) 32% (180) 10% (57) 4% (24) 7% (40) 558Non-Evangelical 34% (248) 39% (282) 14% (104) 6% (44) 7% (49) 727Community: Urban 38% (173) 33% (151) 14% (63) 7% (31) 9% (40) 457Community: Suburban 34% (340) 37% (378) 13% (131) 7% (71) 9% (89) 1010Community: Rural 37% (195) 34% (182) 13% (69) 5% (29) 11% (56) 531Employ: Private Sector 31% (213) 39% (266) 15% (105) 7% (50) 8% (52) 687Employ: Government 37% (49) 34% (45) 12% (16) 6% (9) 10% (14) 133Employ: Self-Employed 40% (73) 28% (51) 17% (31) 9% (16) 7% (13) 185Employ: Homemaker 35% (56) 36% (57) 12% (19) 4% (7) 14% (22) 160Employ: Student 26% (16) 42% (26) 12% (7) 5% (3) 15% (9) 61Employ: Retired 41% (208) 35% (180) 14% (69) 7% (37) 3% (16) 509Employ: Unemployed 32% (53) 32% (52) 8% (13) 4% (7) 24% (40) 165Employ: Other 41% (40) 34% (33) 3% (3) 3% (3) 20% (19) 97Military HH: Yes 42% (156) 36% (135) 12% (47) 5% (20) 5% (17) 375Military HH: No 34% (553) 35% (575) 13% (216) 7% (111) 10% (168) 1623RD/WT: Right Direction 31% (227) 39% (288) 16% (118) 6% (46) 9% (67) 745RD/WT: Wrong Track 38% (481) 34% (423) 12% (146) 7% (85) 9% (118) 1253Biden Job Approve 30% (266) 40% (356) 16% (139) 6% (57) 8% (73) 890Biden Job Disapprove 42% (432) 33% (342) 11% (115) 7% (71) 7% (71) 1031Biden Job Strongly Approve 35% (157) 33% (148) 16% (71) 8% (37) 7% (32) 446Biden Job Somewhat Approve 24% (108) 47% (207) 15% (68) 4% (20) 9% (41) 444Biden Job Somewhat Disapprove 29% (73) 43% (108) 15% (36) 5% (12) 8% (20) 250Biden Job Strongly Disapprove 46% (359) 30% (234) 10% (79) 7% (58) 7% (51) 781
Continued on next page

174
Morning ConsultTable POL15
Table POL15: How concerned are you, if at all, about the U.S. defaulting on its debts?
Demographic Very concernedSomewhatconcerned
Not veryconcerned
Not at allconcerned
Don’t know /No opinion Total N
Registered Voters 35% (708) 36% (710) 13% (263) 7% (131) 9% (185) 1998Favorable of Biden 30% (267) 40% (358) 15% (139) 6% (55) 9% (81) 899Unfavorable of Biden 41% (425) 33% (344) 12% (120) 7% (70) 7% (74) 1032Very Favorable of Biden 36% (170) 32% (149) 16% (75) 9% (40) 8% (36) 470Somewhat Favorable of Biden 23% (97) 49% (209) 15% (64) 3% (15) 10% (44) 429Somewhat Unfavorable of Biden 28% (70) 43% (105) 18% (44) 5% (11) 7% (16) 246Very Unfavorable of Biden 45% (356) 30% (239) 10% (76) 7% (59) 7% (57) 786#1 Issue: Economy 34% (250) 33% (245) 14% (107) 7% (53) 12% (88) 742#1 Issue: Security 45% (183) 33% (133) 12% (47) 7% (27) 4% (18) 409#1 Issue: Health Care 31% (76) 43% (107) 11% (26) 6% (16) 9% (23) 248#1 Issue: Medicare / Social Security 39% (82) 42% (87) 10% (22) 5% (11) 4% (7) 209#1 Issue: Women’s Issues 27% (30) 42% (47) 15% (17) 9% (9) 7% (8) 111#1 Issue: Education 28% (20) 37% (26) 12% (9) 6% (5) 17% (12) 72#1 Issue: Energy 25% (23) 36% (33) 19% (17) 7% (6) 13% (12) 90#1 Issue: Other 38% (44) 27% (31) 17% (20) 4% (5) 15% (17) 1172020 Vote: Joe Biden 31% (294) 38% (363) 16% (148) 6% (60) 9% (81) 9462020 Vote: Donald Trump 43% (368) 33% (288) 11% (96) 6% (54) 7% (59) 8642020 Vote: Didn’t Vote 22% (34) 32% (50) 11% (17) 9% (14) 25% (39) 1532018 House Vote: Democrat 34% (249) 38% (276) 16% (115) 7% (49) 6% (44) 7342018 House Vote: Republican 44% (319) 32% (227) 12% (86) 7% (49) 5% (38) 7192018 House Vote: Someone else 25% (13) 38% (20) 14% (7) 3% (1) 21% (11) 532016 Vote: Hillary Clinton 32% (224) 39% (275) 15% (102) 7% (50) 8% (55) 7062016 Vote: Donald Trump 43% (348) 33% (263) 13% (102) 6% (48) 5% (44) 8052016 Vote: Other 38% (33) 30% (27) 16% (14) 6% (5) 10% (8) 872016 Vote: Didn’t Vote 26% (103) 36% (146) 11% (46) 7% (27) 19% (78) 399Voted in 2014: Yes 40% (529) 34% (453) 14% (183) 7% (86) 6% (73) 1324Voted in 2014: No 27% (179) 38% (258) 12% (81) 7% (45) 17% (112) 6744-Region: Northeast 33% (115) 38% (133) 15% (53) 5% (19) 9% (33) 3534-Region: Midwest 34% (149) 38% (167) 12% (54) 7% (31) 10% (43) 4444-Region: South 39% (287) 34% (252) 12% (91) 6% (48) 9% (67) 7464-Region: West 34% (157) 35% (159) 14% (65) 7% (33) 9% (42) 455
Continued on next page

National Tracking Poll #2110009, October, 2021
175
Table POL15
Table POL15: How concerned are you, if at all, about the U.S. defaulting on its debts?
Demographic Very concernedSomewhatconcerned
Not veryconcerned
Not at allconcerned
Don’t know /No opinion Total N
Registered Voters 35% (708) 36% (710) 13% (263) 7% (131) 9% (185) 1998Party: Democrat/Leans Democrat 30% (267) 39% (345) 15% (131) 7% (61) 8% (73) 877Party: Republican/Leans Republican 42% (346) 34% (279) 10% (84) 6% (52) 7% (60) 822Note: Row proportions may total to larger than one-hundred percent due to rounding. For more information visit MorningConsultIntelligence.com.

176
Morning ConsultTable POL16
Table POL16: If the U.S. defaulted on its debts, do you think this would have...?
Demographic
a verypositiveimpact onthe U.S.economy
a somewhatpositiveimpact onthe U.S.economy
no impact onthe U.S.economy
a somewhatnegativeimpact onthe U.S.economy
a verynegativeimpact onthe U.S.economy
Don’t know /No opinion Total N
Registered Voters 4% (89) 3% (69) 7% (143) 24% (474) 49% (980) 12% (242) 1998Gender: Male 6% (54) 4% (41) 9% (84) 24% (228) 49% (459) 8% (76) 942Gender: Female 3% (35) 3% (28) 6% (59) 23% (246) 49% (521) 16% (166) 1056Age: 18-34 8% (43) 6% (32) 10% (52) 22% (111) 33% (172) 20% (104) 514Age: 35-44 9% (27) 5% (15) 13% (40) 24% (72) 38% (118) 12% (35) 307Age: 45-64 2% (14) 2% (15) 4% (30) 28% (189) 54% (366) 10% (65) 679Age: 65+ 1% (5) 2% (8) 4% (21) 20% (102) 65% (325) 7% (37) 497GenZers: 1997-2012 5% (7) 7% (11) 12% (18) 23% (34) 23% (34) 31% (45) 148Millennials: 1981-1996 11% (60) 6% (33) 10% (57) 22% (122) 36% (202) 15% (82) 556GenXers: 1965-1980 4% (17) 3% (15) 8% (35) 28% (130) 48% (224) 10% (47) 468Baby Boomers: 1946-1964 1% (5) 1% (8) 4% (28) 23% (164) 63% (458) 8% (59) 723PID: Dem (no lean) 5% (40) 5% (37) 10% (76) 26% (191) 41% (304) 13% (96) 745PID: Ind (no lean) 4% (21) 3% (19) 7% (39) 25% (140) 48% (267) 13% (74) 559PID: Rep (no lean) 4% (29) 2% (13) 4% (28) 21% (143) 59% (410) 10% (72) 694PID/Gender: DemMen 9% (32) 5% (17) 12% (42) 27% (97) 39% (138) 8% (29) 355PID/Gender: DemWomen 2% (8) 5% (20) 9% (34) 24% (94) 43% (166) 17% (67) 390PID/Gender: Ind Men 4% (10) 6% (16) 9% (26) 23% (66) 50% (144) 9% (26) 288PID/Gender: Ind Women 4% (11) 1% (3) 5% (13) 27% (74) 45% (123) 18% (48) 271PID/Gender: Rep Men 4% (12) 3% (8) 5% (16) 22% (65) 59% (177) 7% (21) 299PID/Gender: Rep Women 4% (17) 1% (5) 3% (12) 20% (78) 59% (232) 13% (51) 395Ideo: Liberal (1-3) 6% (35) 3% (18) 10% (53) 24% (132) 47% (259) 10% (55) 553Ideo: Moderate (4) 4% (23) 5% (27) 8% (42) 26% (141) 43% (229) 14% (76) 538Ideo: Conservative (5-7) 3% (25) 2% (16) 5% (43) 24% (186) 58% (458) 8% (65) 793Educ: < College 4% (47) 3% (39) 8% (96) 23% (283) 46% (558) 15% (184) 1206Educ: Bachelors degree 3% (15) 3% (16) 6% (32) 26% (133) 51% (257) 10% (48) 501Educ: Post-grad 9% (27) 5% (15) 5% (15) 20% (58) 57% (165) 4% (10) 290Income: Under 50k 4% (34) 3% (28) 9% (83) 22% (191) 44% (392) 18% (155) 882Income: 50k-100k 4% (28) 4% (28) 6% (43) 24% (177) 53% (385) 9% (63) 723Income: 100k+ 7% (28) 3% (13) 4% (17) 27% (107) 52% (203) 6% (25) 392
Continued on next page
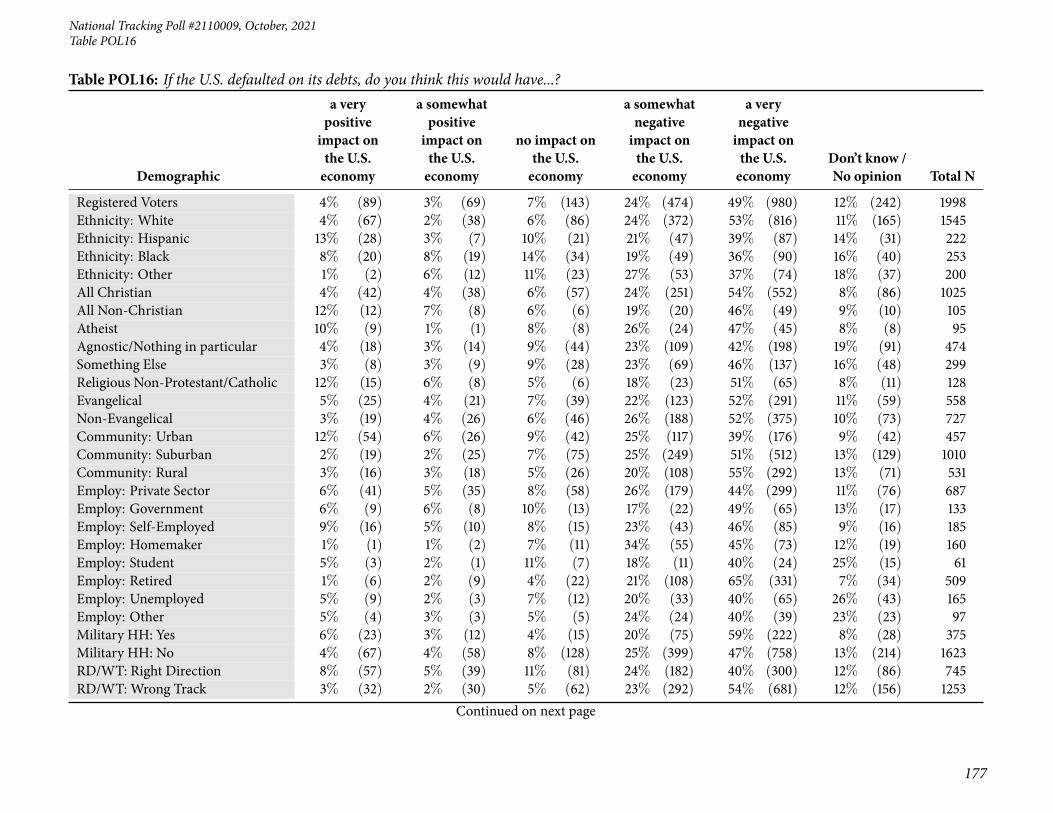
National Tracking Poll #2110009, October, 2021
177
Table POL16
Table POL16: If the U.S. defaulted on its debts, do you think this would have...?
Demographic
a verypositiveimpact onthe U.S.economy
a somewhatpositiveimpact onthe U.S.economy
no impact onthe U.S.economy
a somewhatnegativeimpact onthe U.S.economy
a verynegativeimpact onthe U.S.economy
Don’t know /No opinion Total N
Registered Voters 4% (89) 3% (69) 7% (143) 24% (474) 49% (980) 12% (242) 1998Ethnicity: White 4% (67) 2% (38) 6% (86) 24% (372) 53% (816) 11% (165) 1545Ethnicity: Hispanic 13% (28) 3% (7) 10% (21) 21% (47) 39% (87) 14% (31) 222Ethnicity: Black 8% (20) 8% (19) 14% (34) 19% (49) 36% (90) 16% (40) 253Ethnicity: Other 1% (2) 6% (12) 11% (23) 27% (53) 37% (74) 18% (37) 200All Christian 4% (42) 4% (38) 6% (57) 24% (251) 54% (552) 8% (86) 1025All Non-Christian 12% (12) 7% (8) 6% (6) 19% (20) 46% (49) 9% (10) 105Atheist 10% (9) 1% (1) 8% (8) 26% (24) 47% (45) 8% (8) 95Agnostic/Nothing in particular 4% (18) 3% (14) 9% (44) 23% (109) 42% (198) 19% (91) 474Something Else 3% (8) 3% (9) 9% (28) 23% (69) 46% (137) 16% (48) 299Religious Non-Protestant/Catholic 12% (15) 6% (8) 5% (6) 18% (23) 51% (65) 8% (11) 128Evangelical 5% (25) 4% (21) 7% (39) 22% (123) 52% (291) 11% (59) 558Non-Evangelical 3% (19) 4% (26) 6% (46) 26% (188) 52% (375) 10% (73) 727Community: Urban 12% (54) 6% (26) 9% (42) 25% (117) 39% (176) 9% (42) 457Community: Suburban 2% (19) 2% (25) 7% (75) 25% (249) 51% (512) 13% (129) 1010Community: Rural 3% (16) 3% (18) 5% (26) 20% (108) 55% (292) 13% (71) 531Employ: Private Sector 6% (41) 5% (35) 8% (58) 26% (179) 44% (299) 11% (76) 687Employ: Government 6% (9) 6% (8) 10% (13) 17% (22) 49% (65) 13% (17) 133Employ: Self-Employed 9% (16) 5% (10) 8% (15) 23% (43) 46% (85) 9% (16) 185Employ: Homemaker 1% (1) 1% (2) 7% (11) 34% (55) 45% (73) 12% (19) 160Employ: Student 5% (3) 2% (1) 11% (7) 18% (11) 40% (24) 25% (15) 61Employ: Retired 1% (6) 2% (9) 4% (22) 21% (108) 65% (331) 7% (34) 509Employ: Unemployed 5% (9) 2% (3) 7% (12) 20% (33) 40% (65) 26% (43) 165Employ: Other 5% (4) 3% (3) 5% (5) 24% (24) 40% (39) 23% (23) 97Military HH: Yes 6% (23) 3% (12) 4% (15) 20% (75) 59% (222) 8% (28) 375Military HH: No 4% (67) 4% (58) 8% (128) 25% (399) 47% (758) 13% (214) 1623RD/WT: Right Direction 8% (57) 5% (39) 11% (81) 24% (182) 40% (300) 12% (86) 745RD/WT: Wrong Track 3% (32) 2% (30) 5% (62) 23% (292) 54% (681) 12% (156) 1253
Continued on next page
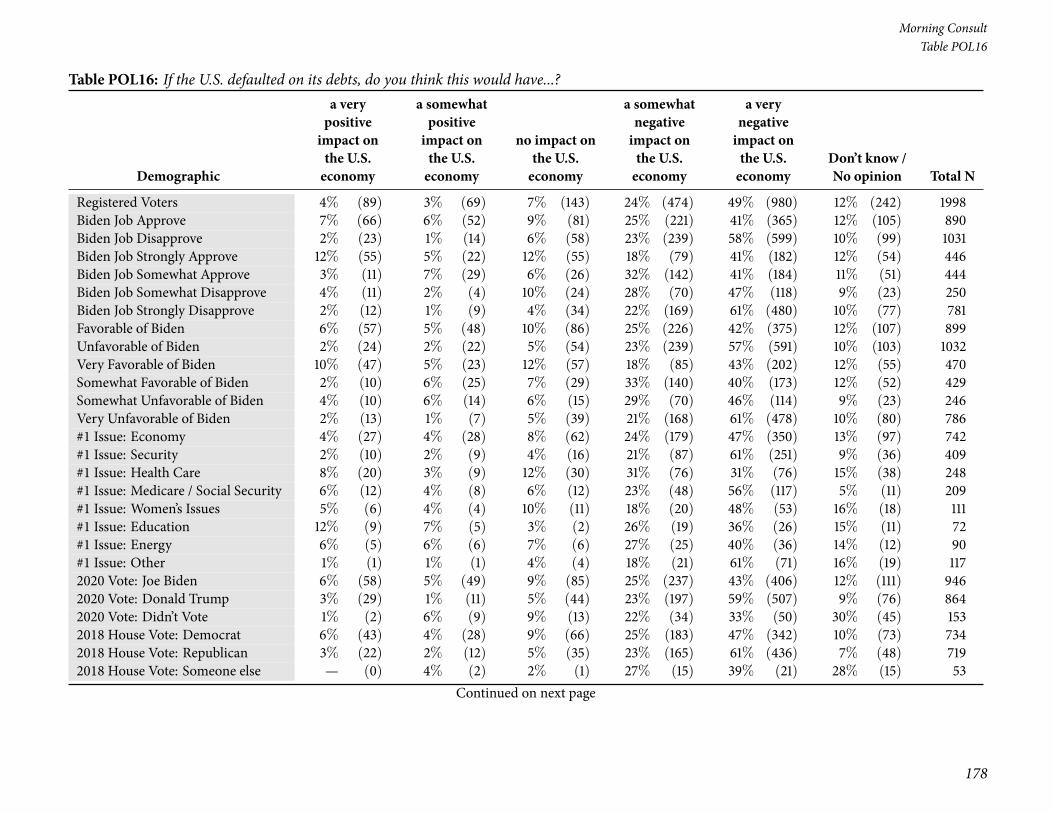
178
Morning ConsultTable POL16
Table POL16: If the U.S. defaulted on its debts, do you think this would have...?
Demographic
a verypositiveimpact onthe U.S.economy
a somewhatpositiveimpact onthe U.S.economy
no impact onthe U.S.economy
a somewhatnegativeimpact onthe U.S.economy
a verynegativeimpact onthe U.S.economy
Don’t know /No opinion Total N
Registered Voters 4% (89) 3% (69) 7% (143) 24% (474) 49% (980) 12% (242) 1998Biden Job Approve 7% (66) 6% (52) 9% (81) 25% (221) 41% (365) 12% (105) 890Biden Job Disapprove 2% (23) 1% (14) 6% (58) 23% (239) 58% (599) 10% (99) 1031Biden Job Strongly Approve 12% (55) 5% (22) 12% (55) 18% (79) 41% (182) 12% (54) 446Biden Job Somewhat Approve 3% (11) 7% (29) 6% (26) 32% (142) 41% (184) 11% (51) 444Biden Job Somewhat Disapprove 4% (11) 2% (4) 10% (24) 28% (70) 47% (118) 9% (23) 250Biden Job Strongly Disapprove 2% (12) 1% (9) 4% (34) 22% (169) 61% (480) 10% (77) 781Favorable of Biden 6% (57) 5% (48) 10% (86) 25% (226) 42% (375) 12% (107) 899Unfavorable of Biden 2% (24) 2% (22) 5% (54) 23% (239) 57% (591) 10% (103) 1032Very Favorable of Biden 10% (47) 5% (23) 12% (57) 18% (85) 43% (202) 12% (55) 470Somewhat Favorable of Biden 2% (10) 6% (25) 7% (29) 33% (140) 40% (173) 12% (52) 429Somewhat Unfavorable of Biden 4% (10) 6% (14) 6% (15) 29% (70) 46% (114) 9% (23) 246Very Unfavorable of Biden 2% (13) 1% (7) 5% (39) 21% (168) 61% (478) 10% (80) 786#1 Issue: Economy 4% (27) 4% (28) 8% (62) 24% (179) 47% (350) 13% (97) 742#1 Issue: Security 2% (10) 2% (9) 4% (16) 21% (87) 61% (251) 9% (36) 409#1 Issue: Health Care 8% (20) 3% (9) 12% (30) 31% (76) 31% (76) 15% (38) 248#1 Issue: Medicare / Social Security 6% (12) 4% (8) 6% (12) 23% (48) 56% (117) 5% (11) 209#1 Issue: Women’s Issues 5% (6) 4% (4) 10% (11) 18% (20) 48% (53) 16% (18) 111#1 Issue: Education 12% (9) 7% (5) 3% (2) 26% (19) 36% (26) 15% (11) 72#1 Issue: Energy 6% (5) 6% (6) 7% (6) 27% (25) 40% (36) 14% (12) 90#1 Issue: Other 1% (1) 1% (1) 4% (4) 18% (21) 61% (71) 16% (19) 1172020 Vote: Joe Biden 6% (58) 5% (49) 9% (85) 25% (237) 43% (406) 12% (111) 9462020 Vote: Donald Trump 3% (29) 1% (11) 5% (44) 23% (197) 59% (507) 9% (76) 8642020 Vote: Didn’t Vote 1% (2) 6% (9) 9% (13) 22% (34) 33% (50) 30% (45) 1532018 House Vote: Democrat 6% (43) 4% (28) 9% (66) 25% (183) 47% (342) 10% (73) 7342018 House Vote: Republican 3% (22) 2% (12) 5% (35) 23% (165) 61% (436) 7% (48) 7192018 House Vote: Someone else — (0) 4% (2) 2% (1) 27% (15) 39% (21) 28% (15) 53
Continued on next page

National Tracking Poll #2110009, October, 2021
179
Table POL16
Table POL16: If the U.S. defaulted on its debts, do you think this would have...?
Demographic
a verypositiveimpact onthe U.S.economy
a somewhatpositiveimpact onthe U.S.economy
no impact onthe U.S.economy
a somewhatnegativeimpact onthe U.S.economy
a verynegativeimpact onthe U.S.economy
Don’t know /No opinion Total N
Registered Voters 4% (89) 3% (69) 7% (143) 24% (474) 49% (980) 12% (242) 19982016 Vote: Hillary Clinton 4% (28) 5% (32) 9% (66) 26% (181) 44% (314) 12% (85) 7062016 Vote: Donald Trump 5% (37) 2% (16) 5% (43) 22% (180) 59% (473) 7% (55) 8052016 Vote: Other 1% (1) 2% (2) 4% (4) 20% (17) 59% (51) 13% (11) 872016 Vote: Didn’t Vote 6% (23) 5% (19) 7% (29) 24% (95) 36% (142) 23% (90) 399Voted in 2014: Yes 4% (58) 3% (36) 6% (81) 23% (310) 55% (728) 8% (111) 1324Voted in 2014: No 5% (31) 5% (33) 9% (62) 24% (164) 37% (253) 19% (131) 6744-Region: Northeast 4% (14) 4% (15) 6% (22) 26% (92) 48% (169) 11% (40) 3534-Region: Midwest 2% (11) 2% (11) 7% (30) 25% (110) 52% (233) 11% (49) 4444-Region: South 4% (31) 3% (26) 6% (46) 22% (164) 51% (380) 13% (100) 7464-Region: West 7% (33) 4% (18) 10% (45) 24% (108) 44% (199) 12% (52) 455Party: Democrat/Leans Democrat 5% (43) 5% (43) 10% (88) 26% (224) 43% (375) 12% (105) 877Party: Republican/Leans Republican 4% (36) 2% (15) 4% (37) 22% (178) 57% (471) 10% (85) 822Note: Row proportions may total to larger than one-hundred percent due to rounding. For more information visit MorningConsultIntelligence.com.

180
Morning ConsultTable POL17
Table POL17: If the United States were to default on the national debt, would you tend to blame the Democratic Party more, the Republican Partymore, or both parties equally?
DemographicThe Democratic
PartyBoth partiesequally
The RepublicanParty
Don’t know / Noopinion Total N
Registered Voters 30% (600) 39% (779) 21% (414) 10% (206) 1998Gender: Male 30% (285) 40% (378) 24% (222) 6% (58) 942Gender: Female 30% (315) 38% (401) 18% (192) 14% (148) 1056Age: 18-34 23% (116) 44% (228) 15% (75) 18% (95) 514Age: 35-44 29% (90) 34% (104) 24% (72) 13% (41) 307Age: 45-64 33% (224) 40% (270) 20% (136) 7% (49) 679Age: 65+ 34% (169) 36% (178) 26% (130) 4% (20) 497GenZers: 1997-2012 22% (32) 41% (61) 9% (14) 28% (41) 148Millennials: 1981-1996 26% (145) 43% (238) 17% (97) 14% (76) 556GenXers: 1965-1980 29% (136) 37% (172) 24% (112) 10% (48) 468Baby Boomers: 1946-1964 34% (249) 38% (273) 23% (166) 5% (34) 723PID: Dem (no lean) 13% (99) 38% (284) 39% (292) 9% (70) 745PID: Ind (no lean) 20% (111) 51% (288) 13% (72) 16% (88) 559PID: Rep (no lean) 56% (390) 30% (207) 7% (49) 7% (48) 694PID/Gender: DemMen 17% (60) 37% (132) 42% (148) 4% (15) 355PID/Gender: DemWomen 10% (39) 39% (153) 37% (144) 14% (55) 390PID/Gender: Ind Men 20% (58) 53% (152) 15% (44) 12% (33) 288PID/Gender: Ind Women 19% (53) 50% (136) 10% (28) 20% (55) 271PID/Gender: Rep Men 56% (166) 32% (94) 10% (29) 3% (9) 299PID/Gender: Rep Women 57% (224) 29% (113) 5% (20) 10% (39) 395Ideo: Liberal (1-3) 9% (52) 35% (191) 48% (264) 8% (45) 553Ideo: Moderate (4) 19% (101) 52% (281) 19% (101) 10% (55) 538Ideo: Conservative (5-7) 55% (432) 34% (273) 5% (43) 6% (44) 793Educ: < College 30% (357) 41% (490) 18% (217) 12% (142) 1206Educ: Bachelors degree 33% (168) 38% (188) 20% (99) 9% (46) 501Educ: Post-grad 26% (75) 35% (100) 34% (97) 6% (18) 290Income: Under 50k 25% (219) 41% (363) 19% (166) 15% (134) 882Income: 50k-100k 36% (258) 37% (264) 21% (152) 7% (49) 723Income: 100k+ 31% (122) 39% (152) 24% (95) 6% (23) 392Ethnicity: White 33% (505) 38% (592) 20% (315) 9% (134) 1545Ethnicity: Hispanic 28% (61) 39% (86) 18% (40) 15% (34) 222
Continued on next page

National Tracking Poll #2110009, October, 2021
181
Table POL17
Table POL17: If the United States were to default on the national debt, would you tend to blame the Democratic Party more, the Republican Partymore, or both parties equally?
DemographicThe Democratic
PartyBoth partiesequally
The RepublicanParty
Don’t know / Noopinion Total N
Registered Voters 30% (600) 39% (779) 21% (414) 10% (206) 1998Ethnicity: Black 15% (39) 39% (99) 30% (75) 16% (40) 253Ethnicity: Other 28% (56) 44% (88) 12% (24) 16% (32) 200All Christian 36% (370) 39% (404) 17% (176) 7% (75) 1025All Non-Christian 21% (22) 39% (41) 30% (31) 10% (11) 105Atheist 16% (15) 45% (42) 33% (32) 6% (5) 95Agnostic/Nothing in particular 20% (96) 37% (174) 26% (123) 17% (81) 474Something Else 32% (97) 39% (117) 17% (51) 11% (34) 299Religious Non-Protestant/Catholic 29% (37) 37% (47) 25% (31) 10% (13) 128Evangelical 41% (228) 40% (223) 11% (63) 8% (43) 558Non-Evangelical 29% (213) 40% (290) 22% (163) 8% (62) 727Community: Urban 24% (109) 42% (193) 24% (112) 10% (44) 457Community: Suburban 30% (306) 40% (400) 21% (208) 9% (95) 1010Community: Rural 35% (185) 35% (185) 18% (94) 13% (68) 531Employ: Private Sector 30% (208) 41% (285) 18% (127) 10% (68) 687Employ: Government 36% (48) 31% (41) 22% (29) 11% (15) 133Employ: Self-Employed 33% (60) 39% (72) 19% (36) 9% (17) 185Employ: Homemaker 34% (55) 35% (57) 17% (27) 14% (22) 160Employ: Student 15% (9) 43% (26) 22% (13) 20% (12) 61Employ: Retired 32% (164) 39% (197) 25% (129) 4% (19) 509Employ: Unemployed 25% (40) 36% (60) 21% (35) 18% (30) 165Employ: Other 15% (15) 43% (42) 19% (19) 23% (23) 97Military HH: Yes 35% (132) 38% (144) 18% (67) 8% (31) 375Military HH: No 29% (467) 39% (635) 21% (346) 11% (175) 1623RD/WT: Right Direction 11% (82) 40% (301) 40% (295) 9% (67) 745RD/WT: Wrong Track 41% (517) 38% (478) 9% (119) 11% (139) 1253Biden Job Approve 11% (96) 40% (358) 40% (357) 9% (79) 890Biden Job Disapprove 49% (501) 39% (400) 5% (55) 7% (75) 1031
Continued on next page

182
Morning ConsultTable POL17
Table POL17: If the United States were to default on the national debt, would you tend to blame the Democratic Party more, the Republican Partymore, or both parties equally?
DemographicThe Democratic
PartyBoth partiesequally
The RepublicanParty
Don’t know / Noopinion Total N
Registered Voters 30% (600) 39% (779) 21% (414) 10% (206) 1998Biden Job Strongly Approve 13% (59) 29% (131) 51% (226) 7% (31) 446Biden Job Somewhat Approve 8% (38) 51% (227) 29% (130) 11% (49) 444Biden Job Somewhat Disapprove 18% (46) 55% (138) 10% (25) 17% (41) 250Biden Job Strongly Disapprove 58% (455) 34% (263) 4% (29) 4% (34) 781Favorable of Biden 10% (91) 40% (364) 39% (350) 10% (94) 899Unfavorable of Biden 49% (504) 38% (395) 6% (57) 7% (76) 1032Very Favorable of Biden 13% (60) 30% (140) 50% (234) 8% (36) 470Somewhat Favorable of Biden 7% (30) 52% (224) 27% (116) 14% (58) 429Somewhat Unfavorable of Biden 19% (46) 55% (135) 11% (28) 15% (38) 246Very Unfavorable of Biden 58% (458) 33% (261) 4% (30) 5% (38) 786#1 Issue: Economy 30% (222) 43% (320) 17% (127) 10% (74) 742#1 Issue: Security 53% (216) 33% (136) 8% (31) 6% (26) 409#1 Issue: Health Care 15% (38) 42% (104) 30% (75) 12% (30) 248#1 Issue: Medicare / Social Security 25% (53) 36% (74) 32% (67) 6% (13) 209#1 Issue: Women’s Issues 13% (15) 41% (45) 31% (34) 15% (17) 111#1 Issue: Education 25% (18) 28% (20) 17% (13) 30% (22) 72#1 Issue: Energy 13% (12) 43% (38) 36% (32) 8% (7) 90#1 Issue: Other 22% (25) 34% (40) 29% (34) 15% (18) 1172020 Vote: Joe Biden 11% (107) 41% (387) 38% (356) 10% (96) 9462020 Vote: Donald Trump 54% (466) 35% (302) 6% (48) 6% (48) 8642020 Vote: Didn’t Vote 16% (25) 43% (66) 5% (8) 36% (54) 1532018 House Vote: Democrat 12% (89) 40% (292) 41% (303) 7% (49) 7342018 House Vote: Republican 54% (388) 33% (238) 7% (52) 6% (41) 7192018 House Vote: Someone else 9% (5) 57% (30) 2% (1) 33% (18) 532016 Vote: Hillary Clinton 11% (78) 39% (276) 41% (290) 9% (61) 7062016 Vote: Donald Trump 53% (430) 36% (289) 6% (48) 5% (38) 8052016 Vote: Other 12% (10) 54% (47) 25% (22) 8% (7) 872016 Vote: Didn’t Vote 20% (81) 41% (165) 13% (53) 25% (100) 399Voted in 2014: Yes 33% (440) 38% (505) 23% (305) 6% (75) 1324Voted in 2014: No 24% (160) 41% (274) 16% (109) 19% (131) 674
Continued on next page

National Tracking Poll #2110009, October, 2021
183
Table POL17
Table POL17: If the United States were to default on the national debt, would you tend to blame the Democratic Party more, the Republican Partymore, or both parties equally?
DemographicThe Democratic
PartyBoth partiesequally
The RepublicanParty
Don’t know / Noopinion Total N
Registered Voters 30% (600) 39% (779) 21% (414) 10% (206) 19984-Region: Northeast 28% (99) 39% (138) 22% (77) 11% (40) 3534-Region: Midwest 29% (130) 41% (184) 19% (82) 11% (48) 4444-Region: South 32% (237) 39% (293) 20% (146) 10% (71) 7464-Region: West 30% (134) 36% (165) 24% (109) 10% (47) 455Party: Democrat/Leans Democrat 12% (105) 40% (352) 39% (342) 9% (79) 877Party: Republican/Leans Republican 55% (452) 32% (261) 7% (55) 7% (55) 822Note: Row proportions may total to larger than one-hundred percent due to rounding. For more information visit MorningConsultIntelligence.com.

184
Morning ConsultTable POL18a
Table POL18a: Thinking about congressional Democrats’ agenda and what they have been able to do since taking full control of the U.S. Congress inJanuary 2021, which of the following is closest to your opinion, even if none is exactly right?
Demographic
Democrats inCongress haveaccomplishedmore than Iexpected
Democrats inCongress have
accomplished lessthan I expected
Democrats inCongress haveaccomplishedabout what Iexpected
Don’t know / Noopinion Total N
Registered Voters 10% (96) 40% (406) 29% (291) 21% (210) 1002Gender: Male 9% (42) 45% (207) 32% (145) 14% (63) 457Gender: Female 10% (54) 36% (199) 27% (146) 27% (147) 545Age: 18-34 8% (22) 37% (98) 24% (63) 31% (82) 266Age: 35-44 12% (20) 39% (63) 22% (35) 26% (42) 161Age: 45-64 9% (31) 41% (136) 32% (106) 18% (58) 332Age: 65+ 9% (22) 45% (109) 35% (87) 11% (27) 244GenZers: 1997-2012 6% (4) 32% (24) 18% (13) 44% (33) 74Millennials: 1981-1996 10% (31) 38% (113) 25% (75) 27% (79) 298GenXers: 1965-1980 11% (25) 40% (94) 31% (72) 18% (42) 234Baby Boomers: 1946-1964 9% (30) 44% (149) 34% (116) 14% (47) 342PID: Dem (no lean) 18% (67) 37% (135) 30% (111) 14% (52) 365PID: Ind (no lean) 6% (17) 40% (119) 26% (77) 29% (87) 299PID: Rep (no lean) 4% (12) 45% (152) 30% (103) 21% (71) 338PID/Gender: DemMen 17% (28) 41% (66) 34% (55) 8% (13) 161PID/Gender: DemWomen 19% (39) 34% (69) 27% (56) 19% (39) 204PID/Gender: Ind Men 5% (7) 41% (61) 33% (49) 22% (32) 150PID/Gender: Ind Women 6% (10) 39% (58) 19% (28) 36% (54) 150PID/Gender: Rep Men 5% (7) 55% (81) 28% (41) 12% (18) 146PID/Gender: Rep Women 3% (5) 37% (71) 33% (62) 28% (53) 191Ideo: Liberal (1-3) 16% (42) 43% (115) 28% (74) 13% (35) 266Ideo: Moderate (4) 12% (33) 39% (109) 27% (77) 22% (63) 281Ideo: Conservative (5-7) 5% (18) 45% (173) 35% (132) 15% (59) 382Educ: < College 10% (59) 36% (218) 30% (182) 24% (143) 601Educ: Bachelors degree 9% (24) 47% (122) 25% (64) 20% (52) 262Educ: Post-grad 10% (13) 47% (66) 32% (45) 11% (15) 139
Continued on next page
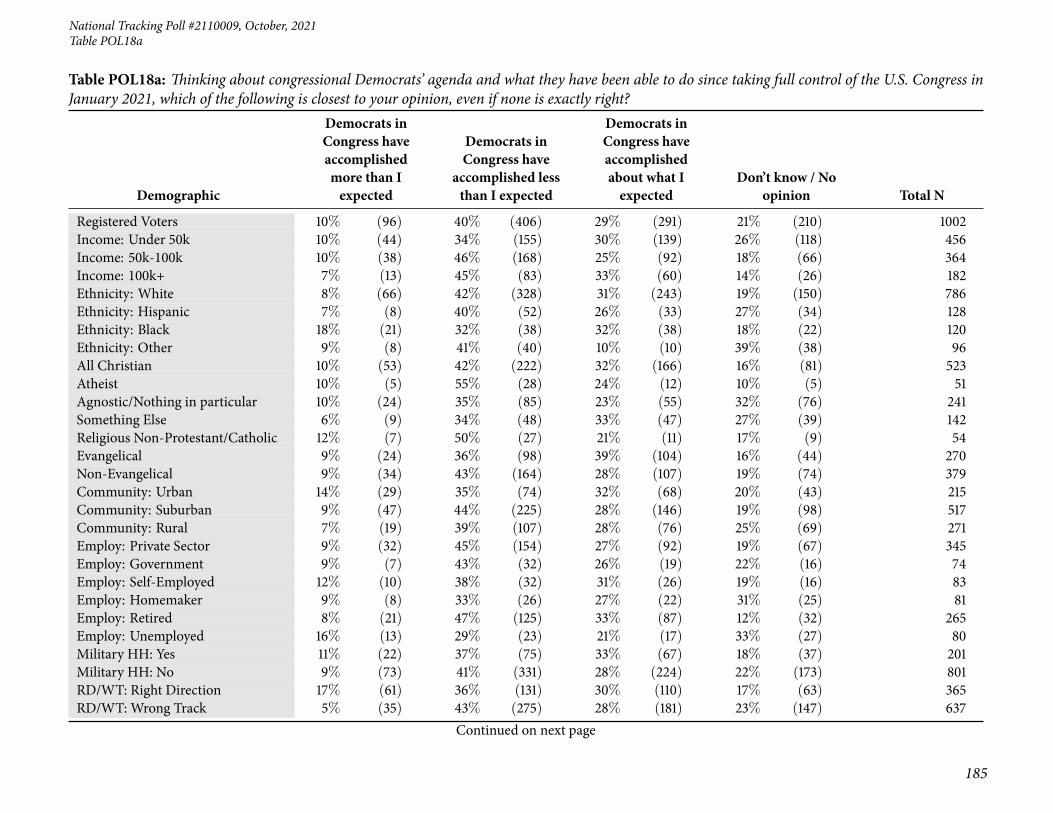
National Tracking Poll #2110009, October, 2021
185
Table POL18a
Table POL18a: Thinking about congressional Democrats’ agenda and what they have been able to do since taking full control of the U.S. Congress inJanuary 2021, which of the following is closest to your opinion, even if none is exactly right?
Demographic
Democrats inCongress haveaccomplishedmore than Iexpected
Democrats inCongress have
accomplished lessthan I expected
Democrats inCongress haveaccomplishedabout what Iexpected
Don’t know / Noopinion Total N
Registered Voters 10% (96) 40% (406) 29% (291) 21% (210) 1002Income: Under 50k 10% (44) 34% (155) 30% (139) 26% (118) 456Income: 50k-100k 10% (38) 46% (168) 25% (92) 18% (66) 364Income: 100k+ 7% (13) 45% (83) 33% (60) 14% (26) 182Ethnicity: White 8% (66) 42% (328) 31% (243) 19% (150) 786Ethnicity: Hispanic 7% (8) 40% (52) 26% (33) 27% (34) 128Ethnicity: Black 18% (21) 32% (38) 32% (38) 18% (22) 120Ethnicity: Other 9% (8) 41% (40) 10% (10) 39% (38) 96All Christian 10% (53) 42% (222) 32% (166) 16% (81) 523Atheist 10% (5) 55% (28) 24% (12) 10% (5) 51Agnostic/Nothing in particular 10% (24) 35% (85) 23% (55) 32% (76) 241Something Else 6% (9) 34% (48) 33% (47) 27% (39) 142Religious Non-Protestant/Catholic 12% (7) 50% (27) 21% (11) 17% (9) 54Evangelical 9% (24) 36% (98) 39% (104) 16% (44) 270Non-Evangelical 9% (34) 43% (164) 28% (107) 19% (74) 379Community: Urban 14% (29) 35% (74) 32% (68) 20% (43) 215Community: Suburban 9% (47) 44% (225) 28% (146) 19% (98) 517Community: Rural 7% (19) 39% (107) 28% (76) 25% (69) 271Employ: Private Sector 9% (32) 45% (154) 27% (92) 19% (67) 345Employ: Government 9% (7) 43% (32) 26% (19) 22% (16) 74Employ: Self-Employed 12% (10) 38% (32) 31% (26) 19% (16) 83Employ: Homemaker 9% (8) 33% (26) 27% (22) 31% (25) 81Employ: Retired 8% (21) 47% (125) 33% (87) 12% (32) 265Employ: Unemployed 16% (13) 29% (23) 21% (17) 33% (27) 80Military HH: Yes 11% (22) 37% (75) 33% (67) 18% (37) 201Military HH: No 9% (73) 41% (331) 28% (224) 22% (173) 801RD/WT: Right Direction 17% (61) 36% (131) 30% (110) 17% (63) 365RD/WT: Wrong Track 5% (35) 43% (275) 28% (181) 23% (147) 637
Continued on next page

186
Morning ConsultTable POL18a
Table POL18a: Thinking about congressional Democrats’ agenda and what they have been able to do since taking full control of the U.S. Congress inJanuary 2021, which of the following is closest to your opinion, even if none is exactly right?
Demographic
Democrats inCongress haveaccomplishedmore than Iexpected
Democrats inCongress have
accomplished lessthan I expected
Democrats inCongress haveaccomplishedabout what Iexpected
Don’t know / Noopinion Total N
Registered Voters 10% (96) 40% (406) 29% (291) 21% (210) 1002Biden Job Approve 17% (75) 38% (172) 32% (143) 14% (62) 452Biden Job Disapprove 4% (20) 46% (233) 28% (144) 22% (111) 509Biden Job Strongly Approve 25% (52) 31% (64) 35% (72) 10% (20) 209Biden Job Somewhat Approve 9% (23) 44% (107) 29% (70) 17% (42) 243Biden Job Somewhat Disapprove 2% (2) 38% (49) 25% (31) 35% (44) 126Biden Job Strongly Disapprove 5% (18) 48% (184) 30% (113) 18% (67) 383Favorable of Biden 15% (70) 37% (170) 32% (146) 17% (77) 463Unfavorable of Biden 4% (20) 46% (230) 28% (142) 22% (109) 500Very Favorable of Biden 23% (50) 33% (73) 33% (72) 11% (25) 221Somewhat Favorable of Biden 8% (20) 40% (97) 31% (74) 21% (52) 242Somewhat Unfavorable of Biden 2% (2) 38% (43) 29% (32) 31% (35) 112Very Unfavorable of Biden 5% (18) 48% (187) 28% (109) 19% (74) 388#1 Issue: Economy 10% (39) 38% (146) 29% (111) 23% (88) 383#1 Issue: Security 5% (9) 51% (103) 30% (60) 15% (31) 204#1 Issue: Health Care 13% (14) 37% (42) 27% (30) 23% (26) 112#1 Issue: Medicare / Social Security 14% (15) 45% (50) 30% (33) 11% (12) 110#1 Issue: Women’s Issues 12% (7) 33% (20) 38% (23) 17% (10) 60#1 Issue: Other 10% (5) 28% (15) 29% (15) 33% (17) 522020 Vote: Joe Biden 16% (77) 37% (184) 30% (146) 17% (84) 4902020 Vote: Donald Trump 4% (17) 47% (199) 29% (122) 19% (81) 4202020 Vote: Didn’t Vote 2% (1) 27% (20) 24% (18) 47% (34) 732018 House Vote: Democrat 15% (59) 41% (155) 31% (120) 13% (48) 3822018 House Vote: Republican 4% (15) 45% (157) 31% (108) 19% (66) 3462016 Vote: Hillary Clinton 16% (58) 40% (149) 29% (107) 15% (56) 3702016 Vote: Donald Trump 4% (18) 47% (188) 33% (131) 16% (62) 3992016 Vote: Didn’t Vote 8% (16) 29% (56) 20% (39) 44% (86) 196
Continued on next page
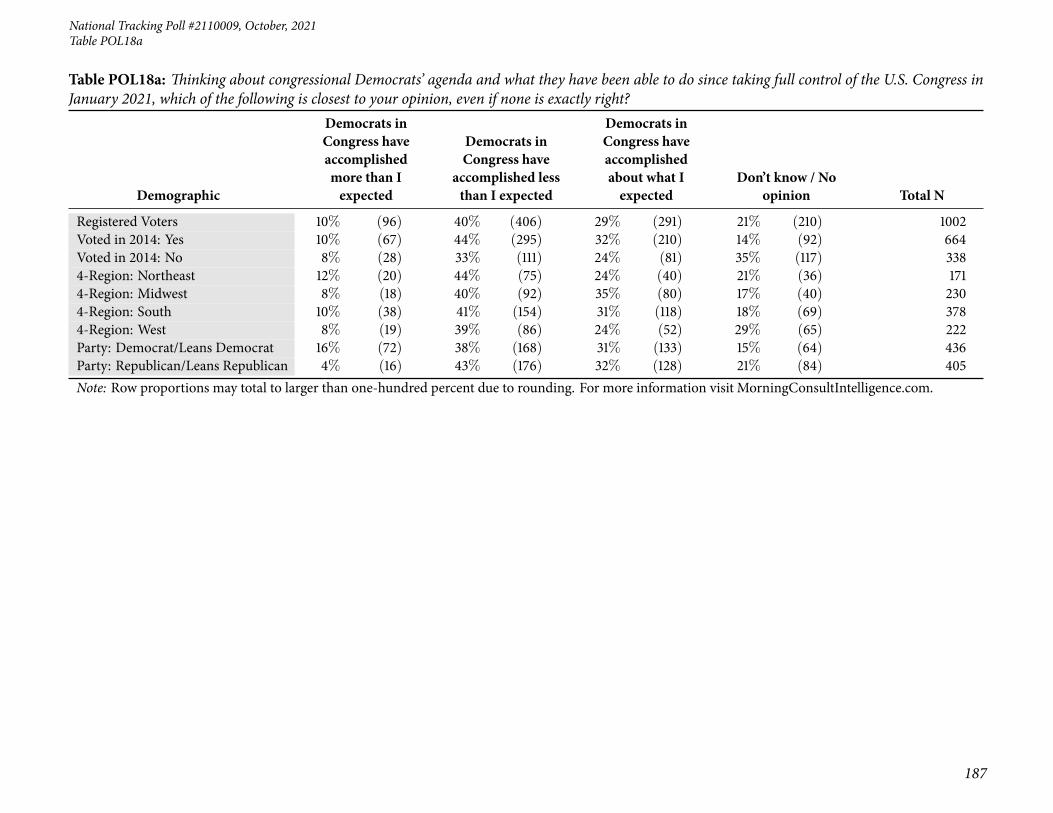
National Tracking Poll #2110009, October, 2021
187
Table POL18a
Table POL18a: Thinking about congressional Democrats’ agenda and what they have been able to do since taking full control of the U.S. Congress inJanuary 2021, which of the following is closest to your opinion, even if none is exactly right?
Demographic
Democrats inCongress haveaccomplishedmore than Iexpected
Democrats inCongress have
accomplished lessthan I expected
Democrats inCongress haveaccomplishedabout what Iexpected
Don’t know / Noopinion Total N
Registered Voters 10% (96) 40% (406) 29% (291) 21% (210) 1002Voted in 2014: Yes 10% (67) 44% (295) 32% (210) 14% (92) 664Voted in 2014: No 8% (28) 33% (111) 24% (81) 35% (117) 3384-Region: Northeast 12% (20) 44% (75) 24% (40) 21% (36) 1714-Region: Midwest 8% (18) 40% (92) 35% (80) 17% (40) 2304-Region: South 10% (38) 41% (154) 31% (118) 18% (69) 3784-Region: West 8% (19) 39% (86) 24% (52) 29% (65) 222Party: Democrat/Leans Democrat 16% (72) 38% (168) 31% (133) 15% (64) 436Party: Republican/Leans Republican 4% (16) 43% (176) 32% (128) 21% (84) 405Note: Row proportions may total to larger than one-hundred percent due to rounding. For more information visit MorningConsultIntelligence.com.

188
Morning ConsultTable POL18b
Table POL18b: Thinking about President Biden’s agenda and what he has been able to do since being sworn into office in January 2021, which of thefollowing is closest to your opinion, even if none is exactly right?
Demographic
President Bidenhas accomplished
more than Iexpected
President Bidenhas accomplished
less than Iexpected
President Bidenhas accomplishedabout what Iexpected
Don’t know / Noopinion Total N
Registered Voters 15% (145) 40% (400) 36% (357) 9% (94) 996Gender: Male 17% (80) 40% (192) 36% (176) 8% (37) 485Gender: Female 13% (65) 41% (208) 35% (181) 11% (57) 511Age: 18-34 20% (51) 35% (87) 25% (62) 20% (49) 249Age: 35-44 22% (33) 35% (51) 35% (51) 8% (11) 146Age: 45-64 9% (32) 41% (141) 42% (145) 8% (29) 348Age: 65+ 12% (30) 47% (120) 39% (99) 2% (5) 253GenZers: 1997-2012 11% (8) 35% (26) 27% (20) 26% (20) 74Millennials: 1981-1996 22% (57) 37% (96) 27% (70) 13% (34) 258GenXers: 1965-1980 17% (40) 38% (89) 36% (85) 9% (21) 234Baby Boomers: 1946-1964 9% (33) 44% (167) 43% (162) 5% (19) 380PID: Dem (no lean) 25% (96) 28% (108) 40% (154) 6% (22) 380PID: Ind (no lean) 10% (27) 41% (105) 31% (80) 18% (48) 260PID: Rep (no lean) 6% (22) 52% (187) 35% (123) 7% (24) 356PID/Gender: DemMen 27% (52) 28% (55) 41% (79) 4% (8) 193PID/Gender: DemWomen 24% (45) 29% (53) 40% (75) 7% (14) 186PID/Gender: Ind Men 14% (19) 42% (58) 29% (40) 16% (22) 138PID/Gender: Ind Women 6% (8) 39% (48) 33% (40) 21% (26) 122PID/Gender: Rep Men 6% (9) 52% (80) 37% (57) 4% (7) 153PID/Gender: Rep Women 6% (13) 53% (107) 32% (66) 9% (18) 204Ideo: Liberal (1-3) 27% (77) 26% (75) 43% (122) 4% (12) 286Ideo: Moderate (4) 14% (35) 40% (102) 35% (91) 11% (29) 257Ideo: Conservative (5-7) 8% (33) 51% (211) 34% (138) 7% (28) 410Educ: < College 16% (97) 40% (241) 33% (202) 11% (65) 605Educ: Bachelors degree 11% (26) 42% (100) 38% (92) 9% (21) 239Educ: Post-grad 15% (22) 38% (58) 42% (63) 5% (7) 151Income: Under 50k 17% (72) 39% (167) 30% (126) 14% (61) 426Income: 50k-100k 13% (46) 39% (142) 42% (151) 6% (21) 360Income: 100k+ 13% (28) 43% (91) 38% (80) 6% (12) 210
Continued on next page
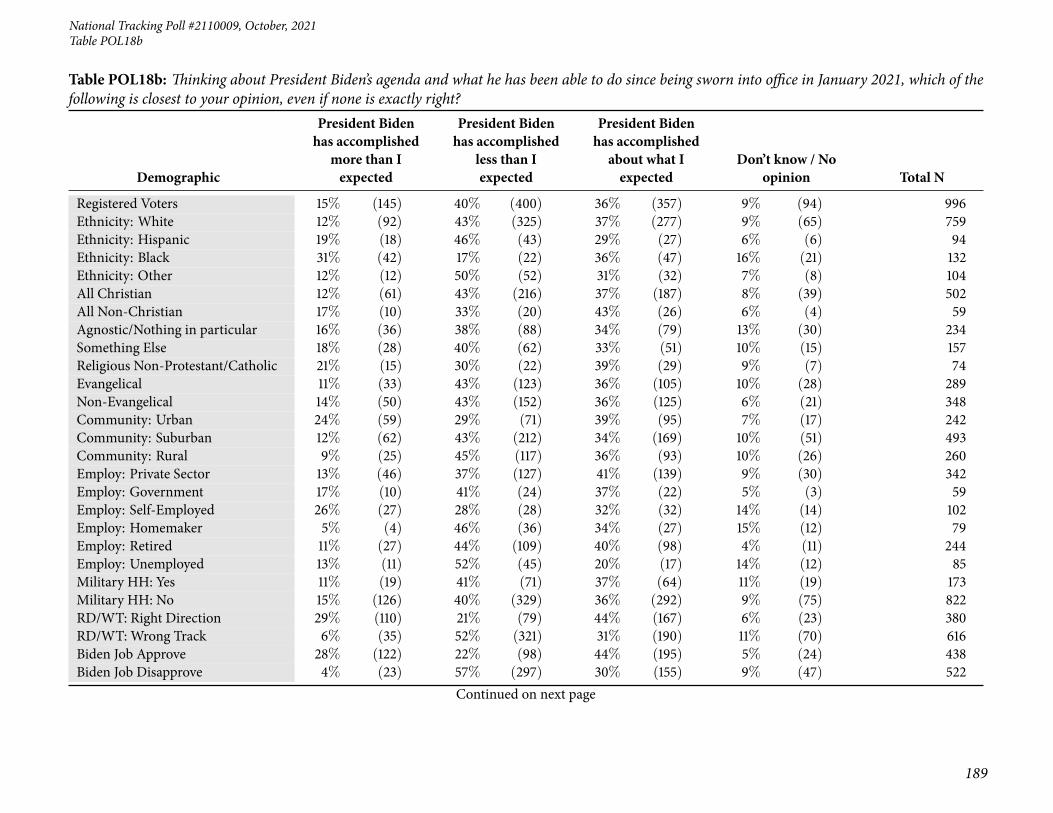
National Tracking Poll #2110009, October, 2021
189
Table POL18b
Table POL18b: Thinking about President Biden’s agenda and what he has been able to do since being sworn into office in January 2021, which of thefollowing is closest to your opinion, even if none is exactly right?
Demographic
President Bidenhas accomplished
more than Iexpected
President Bidenhas accomplished
less than Iexpected
President Bidenhas accomplishedabout what Iexpected
Don’t know / Noopinion Total N
Registered Voters 15% (145) 40% (400) 36% (357) 9% (94) 996Ethnicity: White 12% (92) 43% (325) 37% (277) 9% (65) 759Ethnicity: Hispanic 19% (18) 46% (43) 29% (27) 6% (6) 94Ethnicity: Black 31% (42) 17% (22) 36% (47) 16% (21) 132Ethnicity: Other 12% (12) 50% (52) 31% (32) 7% (8) 104All Christian 12% (61) 43% (216) 37% (187) 8% (39) 502All Non-Christian 17% (10) 33% (20) 43% (26) 6% (4) 59Agnostic/Nothing in particular 16% (36) 38% (88) 34% (79) 13% (30) 234Something Else 18% (28) 40% (62) 33% (51) 10% (15) 157Religious Non-Protestant/Catholic 21% (15) 30% (22) 39% (29) 9% (7) 74Evangelical 11% (33) 43% (123) 36% (105) 10% (28) 289Non-Evangelical 14% (50) 43% (152) 36% (125) 6% (21) 348Community: Urban 24% (59) 29% (71) 39% (95) 7% (17) 242Community: Suburban 12% (62) 43% (212) 34% (169) 10% (51) 493Community: Rural 9% (25) 45% (117) 36% (93) 10% (26) 260Employ: Private Sector 13% (46) 37% (127) 41% (139) 9% (30) 342Employ: Government 17% (10) 41% (24) 37% (22) 5% (3) 59Employ: Self-Employed 26% (27) 28% (28) 32% (32) 14% (14) 102Employ: Homemaker 5% (4) 46% (36) 34% (27) 15% (12) 79Employ: Retired 11% (27) 44% (109) 40% (98) 4% (11) 244Employ: Unemployed 13% (11) 52% (45) 20% (17) 14% (12) 85Military HH: Yes 11% (19) 41% (71) 37% (64) 11% (19) 173Military HH: No 15% (126) 40% (329) 36% (292) 9% (75) 822RD/WT: Right Direction 29% (110) 21% (79) 44% (167) 6% (23) 380RD/WT: Wrong Track 6% (35) 52% (321) 31% (190) 11% (70) 616Biden Job Approve 28% (122) 22% (98) 44% (195) 5% (24) 438Biden Job Disapprove 4% (23) 57% (297) 30% (155) 9% (47) 522
Continued on next page

190
Morning ConsultTable POL18b
Table POL18b: Thinking about President Biden’s agenda and what he has been able to do since being sworn into office in January 2021, which of thefollowing is closest to your opinion, even if none is exactly right?
Demographic
President Bidenhas accomplished
more than Iexpected
President Bidenhas accomplished
less than Iexpected
President Bidenhas accomplishedabout what Iexpected
Don’t know / Noopinion Total N
Registered Voters 15% (145) 40% (400) 36% (357) 9% (94) 996Biden Job Strongly Approve 39% (93) 12% (29) 44% (105) 4% (10) 237Biden Job Somewhat Approve 14% (28) 34% (69) 45% (90) 7% (14) 201Biden Job Somewhat Disapprove 10% (12) 57% (70) 22% (27) 12% (14) 123Biden Job Strongly Disapprove 3% (11) 57% (228) 32% (128) 8% (32) 399Favorable of Biden 27% (116) 22% (98) 45% (198) 6% (25) 437Unfavorable of Biden 5% (28) 56% (299) 29% (154) 10% (52) 533Very Favorable of Biden 38% (95) 14% (34) 44% (110) 4% (10) 250Somewhat Favorable of Biden 11% (21) 34% (63) 47% (88) 8% (14) 187Somewhat Unfavorable of Biden 12% (17) 52% (70) 23% (31) 13% (17) 134Very Unfavorable of Biden 3% (11) 58% (229) 31% (123) 9% (34) 398#1 Issue: Economy 12% (44) 42% (150) 35% (125) 11% (39) 359#1 Issue: Security 8% (17) 55% (113) 30% (61) 7% (14) 204#1 Issue: Health Care 24% (33) 32% (44) 34% (47) 9% (12) 136#1 Issue: Medicare / Social Security 14% (14) 41% (41) 40% (40) 4% (4) 99#1 Issue: Women’s Issues 24% (12) 21% (11) 43% (22) 12% (6) 51#1 Issue: Other 12% (8) 37% (24) 44% (28) 8% (5) 652020 Vote: Joe Biden 24% (110) 26% (121) 44% (200) 6% (25) 4552020 Vote: Donald Trump 7% (29) 54% (241) 31% (136) 8% (37) 4442020 Vote: Didn’t Vote 7% (5) 40% (32) 17% (14) 36% (28) 792018 House Vote: Democrat 25% (86) 32% (112) 40% (139) 4% (14) 3522018 House Vote: Republican 6% (23) 53% (196) 35% (129) 7% (24) 3732016 Vote: Hillary Clinton 26% (87) 26% (89) 43% (143) 5% (17) 3352016 Vote: Donald Trump 7% (28) 54% (218) 33% (133) 7% (27) 4072016 Vote: Other 11% (5) 44% (22) 37% (19) 8% (4) 502016 Vote: Didn’t Vote 12% (25) 34% (70) 31% (63) 22% (45) 203Voted in 2014: Yes 13% (88) 43% (282) 39% (257) 5% (32) 659Voted in 2014: No 17% (58) 35% (117) 30% (100) 18% (61) 336
Continued on next page

National Tracking Poll #2110009, October, 2021
191
Table POL18b
Table POL18b: Thinking about President Biden’s agenda and what he has been able to do since being sworn into office in January 2021, which of thefollowing is closest to your opinion, even if none is exactly right?
Demographic
President Bidenhas accomplished
more than Iexpected
President Bidenhas accomplished
less than Iexpected
President Bidenhas accomplishedabout what Iexpected
Don’t know / Noopinion Total N
Registered Voters 15% (145) 40% (400) 36% (357) 9% (94) 9964-Region: Northeast 14% (25) 44% (79) 37% (68) 5% (9) 1814-Region: Midwest 11% (23) 38% (82) 37% (79) 14% (31) 2144-Region: South 14% (51) 39% (144) 37% (135) 10% (38) 3674-Region: West 20% (47) 41% (94) 32% (75) 7% (16) 233Party: Democrat/Leans Democrat 25% (111) 28% (125) 41% (179) 6% (26) 441Party: Republican/Leans Republican 7% (28) 52% (215) 35% (145) 7% (29) 417Note: Row proportions may total to larger than one-hundred percent due to rounding. For more information visit MorningConsultIntelligence.com.

192
Morning ConsultTable POL19_1
Table POL19_1: How much have you seen, read, or heard about the following?The upcoming international climate change conference, COP26, in Glasgow, Scotland
Demographic A lot Some Not much Nothing at all Total N
Registered Voters 7% (139) 20% (406) 30% (593) 43% (860) 1998Gender: Male 9% (87) 25% (234) 31% (290) 35% (331) 942Gender: Female 5% (53) 16% (172) 29% (303) 50% (529) 1056Age: 18-34 9% (49) 19% (100) 25% (126) 47% (240) 514Age: 35-44 12% (37) 19% (59) 27% (84) 41% (127) 307Age: 45-64 4% (28) 20% (138) 30% (202) 46% (311) 679Age: 65+ 5% (26) 22% (109) 36% (181) 37% (183) 497GenZers: 1997-2012 7% (10) 20% (30) 21% (32) 51% (76) 148Millennials: 1981-1996 11% (60) 19% (106) 27% (151) 43% (240) 556GenXers: 1965-1980 7% (33) 19% (88) 32% (148) 42% (198) 468Baby Boomers: 1946-1964 4% (31) 22% (156) 31% (225) 43% (311) 723PID: Dem (no lean) 10% (73) 25% (183) 29% (217) 36% (271) 745PID: Ind (no lean) 4% (21) 18% (101) 29% (162) 49% (276) 559PID: Rep (no lean) 7% (46) 18% (122) 31% (213) 45% (313) 694PID/Gender: DemMen 12% (42) 30% (108) 28% (100) 30% (105) 355PID/Gender: DemWomen 8% (31) 19% (76) 30% (117) 43% (166) 390PID/Gender: Ind Men 4% (12) 22% (63) 27% (78) 47% (136) 288PID/Gender: Ind Women 3% (9) 14% (38) 31% (85) 51% (139) 271PID/Gender: Rep Men 11% (33) 21% (64) 38% (112) 30% (90) 299PID/Gender: Rep Women 3% (12) 15% (58) 26% (101) 57% (224) 395Ideo: Liberal (1-3) 11% (62) 24% (131) 28% (155) 37% (205) 553Ideo: Moderate (4) 5% (27) 23% (122) 30% (163) 42% (227) 538Ideo: Conservative (5-7) 6% (51) 18% (141) 31% (249) 44% (352) 793Educ: < College 6% (74) 18% (221) 28% (337) 48% (575) 1206Educ: Bachelors degree 6% (31) 23% (115) 33% (165) 38% (190) 501Educ: Post-grad 12% (35) 24% (70) 31% (90) 33% (96) 290Income: Under 50k 6% (51) 17% (150) 29% (257) 48% (425) 882Income: 50k-100k 9% (65) 22% (161) 28% (206) 40% (292) 723Income: 100k+ 6% (23) 24% (95) 33% (131) 37% (144) 392Ethnicity: White 6% (95) 19% (299) 30% (468) 44% (683) 1545Ethnicity: Hispanic 11% (24) 21% (46) 35% (78) 33% (74) 222Ethnicity: Black 16% (40) 24% (61) 25% (64) 35% (87) 253
Continued on next page

National Tracking Poll #2110009, October, 2021
193
Table POL19_1
Table POL19_1: How much have you seen, read, or heard about the following?The upcoming international climate change conference, COP26, in Glasgow, Scotland
Demographic A lot Some Not much Nothing at all Total N
Registered Voters 7% (139) 20% (406) 30% (593) 43% (860) 1998Ethnicity: Other 2% (3) 23% (45) 31% (61) 45% (90) 200All Christian 7% (74) 21% (216) 32% (328) 40% (407) 1025All Non-Christian 17% (18) 25% (26) 35% (37) 23% (25) 105Atheist 10% (9) 18% (17) 24% (23) 47% (45) 95Agnostic/Nothing in particular 4% (20) 19% (91) 26% (124) 51% (240) 474Something Else 6% (18) 19% (56) 27% (82) 48% (144) 299Religious Non-Protestant/Catholic 15% (19) 23% (30) 33% (43) 29% (37) 128Evangelical 9% (49) 20% (109) 29% (160) 43% (241) 558Non-Evangelical 5% (38) 21% (155) 33% (239) 41% (295) 727Community: Urban 12% (57) 23% (106) 28% (129) 36% (165) 457Community: Suburban 6% (60) 20% (200) 31% (315) 43% (435) 1010Community: Rural 4% (22) 19% (100) 28% (149) 49% (260) 531Employ: Private Sector 8% (52) 23% (156) 31% (214) 39% (265) 687Employ: Government 9% (12) 16% (21) 31% (42) 44% (59) 133Employ: Self-Employed 17% (32) 23% (43) 21% (38) 39% (72) 185Employ: Homemaker 2% (3) 13% (21) 32% (52) 53% (85) 160Employ: Student 7% (4) 13% (8) 19% (12) 61% (37) 61Employ: Retired 4% (19) 22% (113) 35% (177) 39% (200) 509Employ: Unemployed 9% (15) 12% (20) 23% (38) 56% (92) 165Employ: Other 3% (3) 25% (25) 21% (21) 51% (49) 97Military HH: Yes 6% (24) 17% (65) 36% (134) 41% (152) 375Military HH: No 7% (115) 21% (341) 28% (459) 44% (708) 1623RD/WT: Right Direction 10% (74) 26% (197) 30% (221) 34% (254) 745RD/WT: Wrong Track 5% (65) 17% (209) 30% (372) 48% (606) 1253Biden Job Approve 9% (84) 26% (230) 28% (253) 36% (324) 890Biden Job Disapprove 5% (55) 17% (172) 31% (320) 47% (484) 1031Biden Job Strongly Approve 14% (63) 25% (113) 27% (121) 34% (150) 446Biden Job Somewhat Approve 5% (21) 26% (116) 30% (132) 39% (174) 444Biden Job Somewhat Disapprove 5% (13) 18% (44) 30% (75) 47% (117) 250Biden Job Strongly Disapprove 5% (42) 16% (128) 31% (245) 47% (366) 781
Continued on next page

194
Morning ConsultTable POL19_1
Table POL19_1: How much have you seen, read, or heard about the following?The upcoming international climate change conference, COP26, in Glasgow, Scotland
Demographic A lot Some Not much Nothing at all Total N
Registered Voters 7% (139) 20% (406) 30% (593) 43% (860) 1998Favorable of Biden 9% (77) 26% (234) 29% (260) 36% (328) 899Unfavorable of Biden 5% (55) 16% (168) 31% (325) 47% (485) 1032Very Favorable of Biden 13% (60) 26% (124) 29% (135) 32% (151) 470Somewhat Favorable of Biden 4% (17) 26% (110) 29% (125) 41% (177) 429Somewhat Unfavorable of Biden 7% (16) 18% (43) 28% (69) 48% (118) 246Very Unfavorable of Biden 5% (39) 16% (124) 33% (256) 47% (367) 786#1 Issue: Economy 7% (55) 18% (133) 30% (219) 45% (335) 742#1 Issue: Security 6% (25) 20% (83) 32% (132) 41% (169) 409#1 Issue: Health Care 8% (19) 23% (57) 25% (63) 44% (109) 248#1 Issue: Medicare / Social Security 6% (13) 27% (55) 30% (63) 37% (78) 209#1 Issue: Women’s Issues 11% (12) 15% (17) 27% (30) 47% (53) 111#1 Issue: Education 7% (5) 26% (19) 27% (20) 40% (29) 72#1 Issue: Energy 7% (6) 24% (21) 35% (31) 35% (31) 90#1 Issue: Other 4% (5) 18% (21) 30% (35) 48% (56) 1172020 Vote: Joe Biden 9% (83) 24% (229) 29% (278) 38% (356) 9462020 Vote: Donald Trump 6% (52) 17% (146) 31% (269) 46% (398) 8642020 Vote: Didn’t Vote 2% (4) 17% (27) 24% (37) 56% (86) 1532018 House Vote: Democrat 9% (64) 25% (187) 30% (218) 36% (265) 7342018 House Vote: Republican 7% (50) 17% (125) 33% (235) 43% (309) 7192018 House Vote: Someone else 4% (2) 13% (7) 29% (15) 54% (29) 532016 Vote: Hillary Clinton 8% (58) 25% (179) 29% (205) 37% (263) 7062016 Vote: Donald Trump 6% (51) 18% (149) 31% (248) 44% (357) 8052016 Vote: Other 2% (1) 21% (19) 37% (32) 40% (35) 872016 Vote: Didn’t Vote 7% (28) 15% (59) 27% (107) 51% (204) 399Voted in 2014: Yes 7% (93) 22% (287) 31% (416) 40% (528) 1324Voted in 2014: No 7% (46) 18% (119) 26% (176) 49% (332) 6744-Region: Northeast 7% (25) 21% (74) 30% (107) 42% (146) 3534-Region: Midwest 7% (30) 21% (92) 26% (114) 47% (208) 4444-Region: South 6% (48) 21% (157) 30% (222) 43% (319) 7464-Region: West 8% (36) 18% (83) 33% (150) 41% (186) 455
Continued on next page
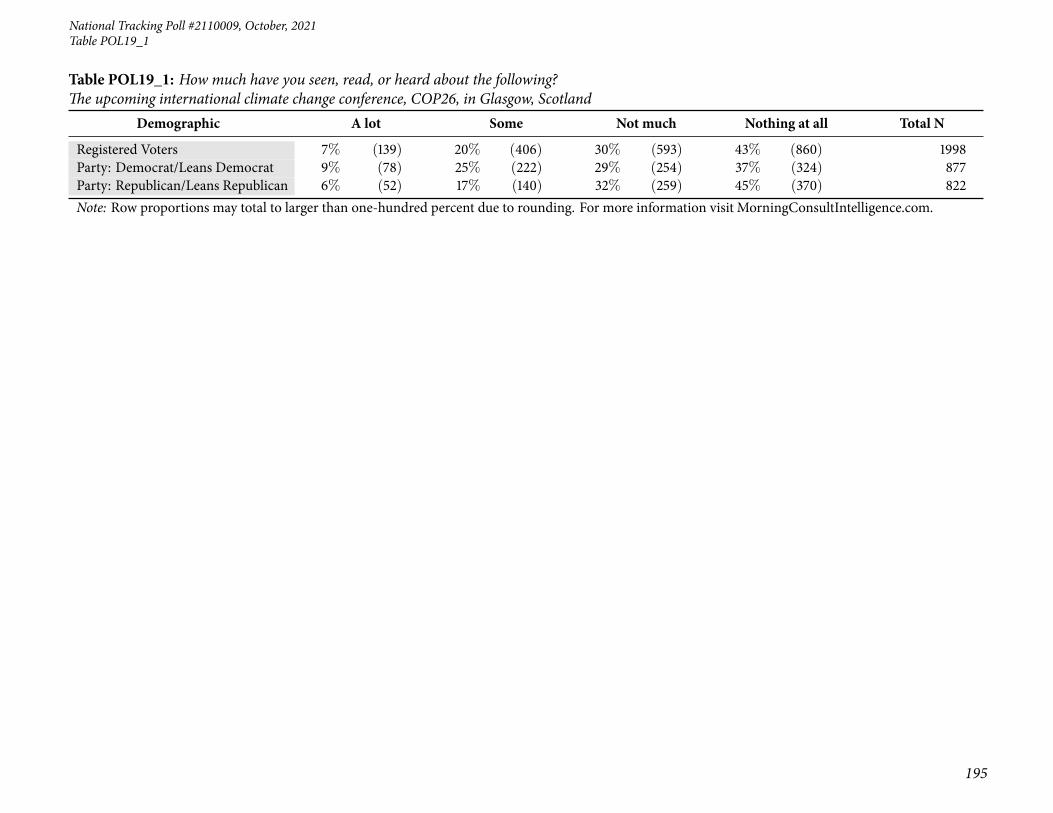
National Tracking Poll #2110009, October, 2021
195
Table POL19_1
Table POL19_1: How much have you seen, read, or heard about the following?The upcoming international climate change conference, COP26, in Glasgow, Scotland
Demographic A lot Some Not much Nothing at all Total N
Registered Voters 7% (139) 20% (406) 30% (593) 43% (860) 1998Party: Democrat/Leans Democrat 9% (78) 25% (222) 29% (254) 37% (324) 877Party: Republican/Leans Republican 6% (52) 17% (140) 32% (259) 45% (370) 822Note: Row proportions may total to larger than one-hundred percent due to rounding. For more information visit MorningConsultIntelligence.com.
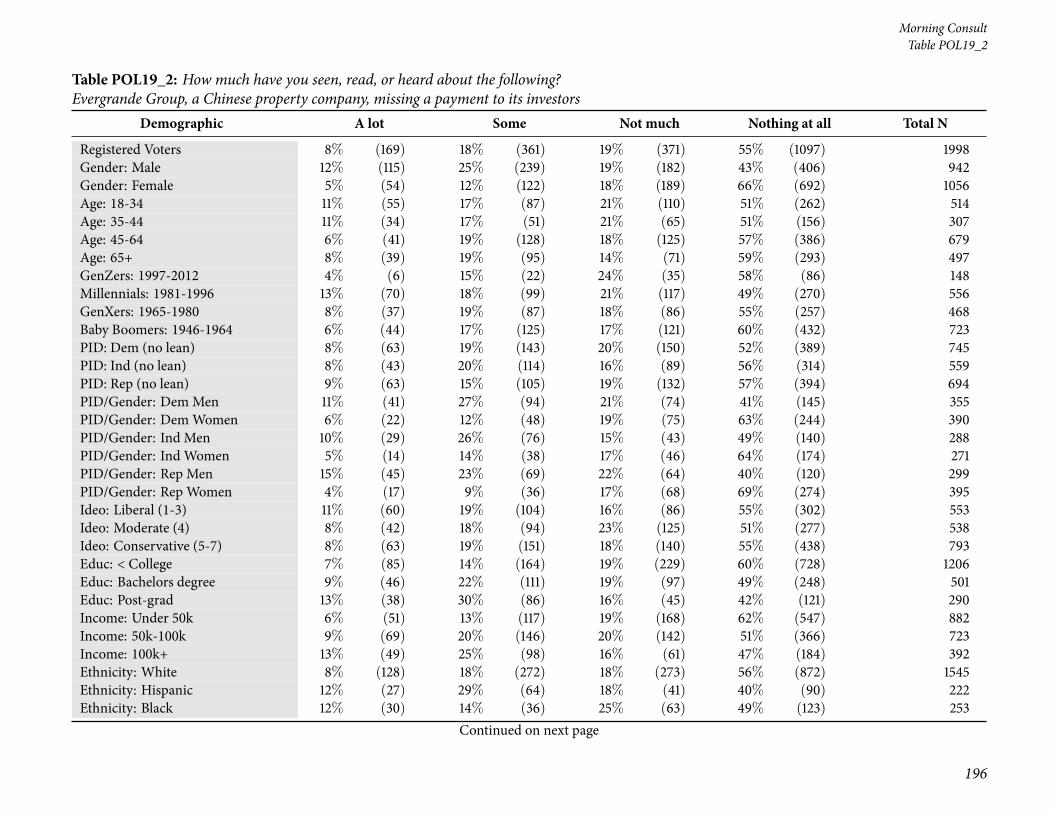
196
Morning ConsultTable POL19_2
Table POL19_2: How much have you seen, read, or heard about the following?Evergrande Group, a Chinese property company, missing a payment to its investors
Demographic A lot Some Not much Nothing at all Total N
Registered Voters 8% (169) 18% (361) 19% (371) 55% (1097) 1998Gender: Male 12% (115) 25% (239) 19% (182) 43% (406) 942Gender: Female 5% (54) 12% (122) 18% (189) 66% (692) 1056Age: 18-34 11% (55) 17% (87) 21% (110) 51% (262) 514Age: 35-44 11% (34) 17% (51) 21% (65) 51% (156) 307Age: 45-64 6% (41) 19% (128) 18% (125) 57% (386) 679Age: 65+ 8% (39) 19% (95) 14% (71) 59% (293) 497GenZers: 1997-2012 4% (6) 15% (22) 24% (35) 58% (86) 148Millennials: 1981-1996 13% (70) 18% (99) 21% (117) 49% (270) 556GenXers: 1965-1980 8% (37) 19% (87) 18% (86) 55% (257) 468Baby Boomers: 1946-1964 6% (44) 17% (125) 17% (121) 60% (432) 723PID: Dem (no lean) 8% (63) 19% (143) 20% (150) 52% (389) 745PID: Ind (no lean) 8% (43) 20% (114) 16% (89) 56% (314) 559PID: Rep (no lean) 9% (63) 15% (105) 19% (132) 57% (394) 694PID/Gender: DemMen 11% (41) 27% (94) 21% (74) 41% (145) 355PID/Gender: DemWomen 6% (22) 12% (48) 19% (75) 63% (244) 390PID/Gender: Ind Men 10% (29) 26% (76) 15% (43) 49% (140) 288PID/Gender: Ind Women 5% (14) 14% (38) 17% (46) 64% (174) 271PID/Gender: Rep Men 15% (45) 23% (69) 22% (64) 40% (120) 299PID/Gender: Rep Women 4% (17) 9% (36) 17% (68) 69% (274) 395Ideo: Liberal (1-3) 11% (60) 19% (104) 16% (86) 55% (302) 553Ideo: Moderate (4) 8% (42) 18% (94) 23% (125) 51% (277) 538Ideo: Conservative (5-7) 8% (63) 19% (151) 18% (140) 55% (438) 793Educ: < College 7% (85) 14% (164) 19% (229) 60% (728) 1206Educ: Bachelors degree 9% (46) 22% (111) 19% (97) 49% (248) 501Educ: Post-grad 13% (38) 30% (86) 16% (45) 42% (121) 290Income: Under 50k 6% (51) 13% (117) 19% (168) 62% (547) 882Income: 50k-100k 9% (69) 20% (146) 20% (142) 51% (366) 723Income: 100k+ 13% (49) 25% (98) 16% (61) 47% (184) 392Ethnicity: White 8% (128) 18% (272) 18% (273) 56% (872) 1545Ethnicity: Hispanic 12% (27) 29% (64) 18% (41) 40% (90) 222Ethnicity: Black 12% (30) 14% (36) 25% (63) 49% (123) 253
Continued on next page

National Tracking Poll #2110009, October, 2021
197
Table POL19_2
Table POL19_2: How much have you seen, read, or heard about the following?Evergrande Group, a Chinese property company, missing a payment to its investors
Demographic A lot Some Not much Nothing at all Total N
Registered Voters 8% (169) 18% (361) 19% (371) 55% (1097) 1998Ethnicity: Other 5% (11) 26% (52) 17% (35) 51% (102) 200All Christian 9% (93) 21% (211) 17% (175) 53% (546) 1025All Non-Christian 15% (16) 24% (25) 16% (16) 46% (48) 105Atheist 10% (10) 16% (15) 19% (18) 54% (51) 95Agnostic/Nothing in particular 7% (34) 14% (67) 20% (97) 58% (277) 474Something Else 5% (16) 14% (43) 21% (64) 59% (176) 299Religious Non-Protestant/Catholic 15% (19) 23% (30) 14% (18) 48% (61) 128Evangelical 8% (47) 19% (108) 19% (104) 54% (299) 558Non-Evangelical 7% (54) 19% (138) 18% (131) 56% (404) 727Community: Urban 12% (55) 23% (105) 16% (72) 49% (224) 457Community: Suburban 8% (85) 17% (175) 20% (202) 54% (549) 1010Community: Rural 5% (29) 15% (81) 18% (97) 61% (325) 531Employ: Private Sector 11% (74) 20% (136) 20% (140) 49% (336) 687Employ: Government 9% (12) 18% (23) 24% (32) 49% (66) 133Employ: Self-Employed 18% (34) 16% (30) 23% (43) 42% (78) 185Employ: Homemaker 3% (5) 13% (20) 15% (24) 70% (112) 160Employ: Student 6% (3) 15% (9) 29% (18) 51% (31) 61Employ: Retired 6% (30) 21% (106) 14% (73) 59% (301) 509Employ: Unemployed 4% (7) 12% (20) 18% (30) 65% (108) 165Employ: Other 4% (3) 16% (16) 12% (12) 68% (66) 97Military HH: Yes 6% (24) 18% (69) 18% (67) 58% (216) 375Military HH: No 9% (145) 18% (292) 19% (304) 54% (882) 1623RD/WT: Right Direction 11% (82) 20% (151) 18% (136) 50% (376) 745RD/WT: Wrong Track 7% (87) 17% (210) 19% (235) 58% (721) 1253Biden Job Approve 11% (96) 19% (173) 18% (160) 52% (462) 890Biden Job Disapprove 7% (72) 18% (182) 19% (194) 57% (583) 1031Biden Job Strongly Approve 13% (60) 19% (86) 15% (67) 52% (234) 446Biden Job Somewhat Approve 8% (36) 19% (86) 21% (93) 51% (228) 444Biden Job Somewhat Disapprove 3% (7) 21% (53) 17% (43) 59% (146) 250Biden Job Strongly Disapprove 8% (65) 16% (129) 19% (151) 56% (437) 781
Continued on next page
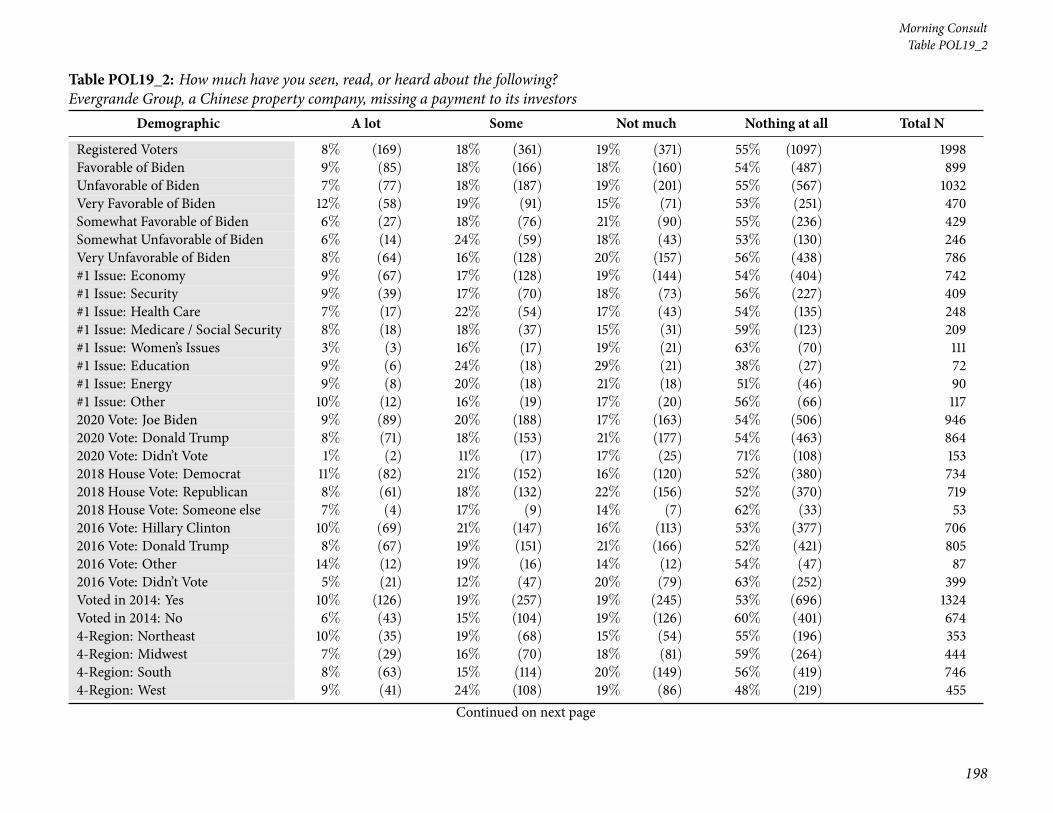
198
Morning ConsultTable POL19_2
Table POL19_2: How much have you seen, read, or heard about the following?Evergrande Group, a Chinese property company, missing a payment to its investors
Demographic A lot Some Not much Nothing at all Total N
Registered Voters 8% (169) 18% (361) 19% (371) 55% (1097) 1998Favorable of Biden 9% (85) 18% (166) 18% (160) 54% (487) 899Unfavorable of Biden 7% (77) 18% (187) 19% (201) 55% (567) 1032Very Favorable of Biden 12% (58) 19% (91) 15% (71) 53% (251) 470Somewhat Favorable of Biden 6% (27) 18% (76) 21% (90) 55% (236) 429Somewhat Unfavorable of Biden 6% (14) 24% (59) 18% (43) 53% (130) 246Very Unfavorable of Biden 8% (64) 16% (128) 20% (157) 56% (438) 786#1 Issue: Economy 9% (67) 17% (128) 19% (144) 54% (404) 742#1 Issue: Security 9% (39) 17% (70) 18% (73) 56% (227) 409#1 Issue: Health Care 7% (17) 22% (54) 17% (43) 54% (135) 248#1 Issue: Medicare / Social Security 8% (18) 18% (37) 15% (31) 59% (123) 209#1 Issue: Women’s Issues 3% (3) 16% (17) 19% (21) 63% (70) 111#1 Issue: Education 9% (6) 24% (18) 29% (21) 38% (27) 72#1 Issue: Energy 9% (8) 20% (18) 21% (18) 51% (46) 90#1 Issue: Other 10% (12) 16% (19) 17% (20) 56% (66) 1172020 Vote: Joe Biden 9% (89) 20% (188) 17% (163) 54% (506) 9462020 Vote: Donald Trump 8% (71) 18% (153) 21% (177) 54% (463) 8642020 Vote: Didn’t Vote 1% (2) 11% (17) 17% (25) 71% (108) 1532018 House Vote: Democrat 11% (82) 21% (152) 16% (120) 52% (380) 7342018 House Vote: Republican 8% (61) 18% (132) 22% (156) 52% (370) 7192018 House Vote: Someone else 7% (4) 17% (9) 14% (7) 62% (33) 532016 Vote: Hillary Clinton 10% (69) 21% (147) 16% (113) 53% (377) 7062016 Vote: Donald Trump 8% (67) 19% (151) 21% (166) 52% (421) 8052016 Vote: Other 14% (12) 19% (16) 14% (12) 54% (47) 872016 Vote: Didn’t Vote 5% (21) 12% (47) 20% (79) 63% (252) 399Voted in 2014: Yes 10% (126) 19% (257) 19% (245) 53% (696) 1324Voted in 2014: No 6% (43) 15% (104) 19% (126) 60% (401) 6744-Region: Northeast 10% (35) 19% (68) 15% (54) 55% (196) 3534-Region: Midwest 7% (29) 16% (70) 18% (81) 59% (264) 4444-Region: South 8% (63) 15% (114) 20% (149) 56% (419) 7464-Region: West 9% (41) 24% (108) 19% (86) 48% (219) 455
Continued on next page

National Tracking Poll #2110009, October, 2021
199
Table POL19_2
Table POL19_2: How much have you seen, read, or heard about the following?Evergrande Group, a Chinese property company, missing a payment to its investors
Demographic A lot Some Not much Nothing at all Total N
Registered Voters 8% (169) 18% (361) 19% (371) 55% (1097) 1998Party: Democrat/Leans Democrat 9% (77) 20% (177) 19% (166) 52% (457) 877Party: Republican/Leans Republican 9% (72) 16% (130) 19% (153) 57% (467) 822Note: Row proportions may total to larger than one-hundred percent due to rounding. For more information visit MorningConsultIntelligence.com.

200
Morning ConsultTable POL19_3
Table POL19_3: How much have you seen, read, or heard about the following?Congress voting to fund the government through December 3, 2021, avoiding a government shutdown
Demographic A lot Some Not much Nothing at all Total N
Registered Voters 24% (481) 39% (781) 17% (345) 20% (391) 1998Gender: Male 29% (269) 42% (395) 14% (132) 16% (147) 942Gender: Female 20% (213) 37% (386) 20% (213) 23% (244) 1056Age: 18-34 19% (99) 31% (158) 18% (94) 32% (163) 514Age: 35-44 23% (70) 35% (108) 17% (53) 24% (75) 307Age: 45-64 22% (148) 43% (295) 17% (114) 18% (122) 679Age: 65+ 33% (164) 44% (220) 17% (84) 6% (30) 497GenZers: 1997-2012 15% (23) 29% (42) 17% (25) 40% (59) 148Millennials: 1981-1996 22% (121) 32% (177) 18% (100) 28% (158) 556GenXers: 1965-1980 21% (99) 39% (185) 20% (92) 20% (93) 468Baby Boomers: 1946-1964 28% (202) 44% (322) 17% (122) 11% (77) 723PID: Dem (no lean) 31% (228) 38% (281) 14% (107) 17% (128) 745PID: Ind (no lean) 19% (106) 36% (204) 20% (111) 25% (138) 559PID: Rep (no lean) 21% (146) 43% (297) 18% (126) 18% (124) 694PID/Gender: DemMen 33% (115) 42% (150) 12% (43) 13% (47) 355PID/Gender: DemWomen 29% (113) 34% (131) 17% (65) 21% (81) 390PID/Gender: Ind Men 25% (71) 37% (105) 16% (47) 23% (65) 288PID/Gender: Ind Women 13% (36) 36% (98) 24% (64) 27% (73) 271PID/Gender: Rep Men 28% (82) 47% (139) 14% (42) 12% (35) 299PID/Gender: Rep Women 16% (64) 40% (158) 21% (84) 23% (89) 395Ideo: Liberal (1-3) 35% (195) 36% (201) 13% (74) 15% (82) 553Ideo: Moderate (4) 20% (107) 37% (197) 23% (126) 20% (108) 538Ideo: Conservative (5-7) 21% (170) 46% (361) 16% (125) 17% (137) 793Educ: < College 20% (244) 37% (449) 19% (227) 24% (287) 1206Educ: Bachelors degree 26% (130) 41% (205) 16% (81) 17% (85) 501Educ: Post-grad 37% (106) 44% (128) 13% (38) 7% (19) 290Income: Under 50k 19% (167) 36% (314) 21% (183) 25% (218) 882Income: 50k-100k 28% (201) 41% (295) 16% (112) 16% (114) 723Income: 100k+ 29% (113) 44% (172) 13% (49) 15% (58) 392Ethnicity: White 24% (369) 40% (615) 17% (268) 19% (293) 1545Ethnicity: Hispanic 27% (61) 38% (84) 12% (28) 22% (49) 222Ethnicity: Black 34% (87) 34% (85) 16% (41) 16% (40) 253
Continued on next page
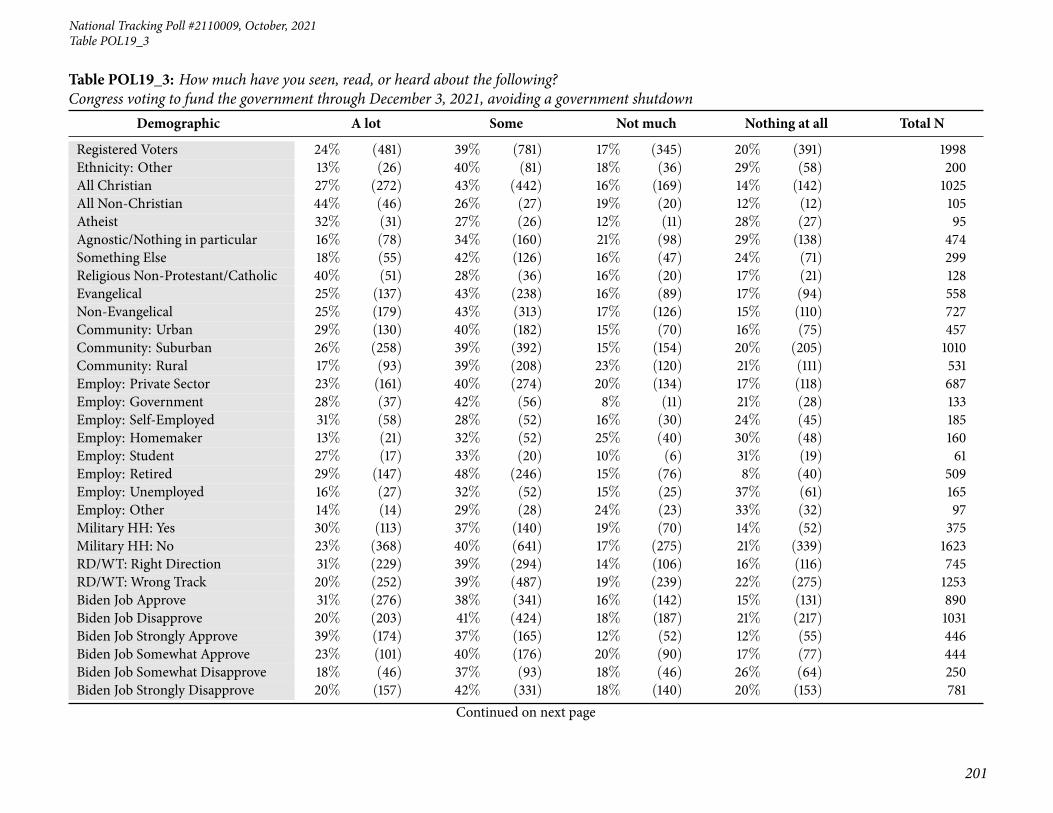
National Tracking Poll #2110009, October, 2021
201
Table POL19_3
Table POL19_3: How much have you seen, read, or heard about the following?Congress voting to fund the government through December 3, 2021, avoiding a government shutdown
Demographic A lot Some Not much Nothing at all Total N
Registered Voters 24% (481) 39% (781) 17% (345) 20% (391) 1998Ethnicity: Other 13% (26) 40% (81) 18% (36) 29% (58) 200All Christian 27% (272) 43% (442) 16% (169) 14% (142) 1025All Non-Christian 44% (46) 26% (27) 19% (20) 12% (12) 105Atheist 32% (31) 27% (26) 12% (11) 28% (27) 95Agnostic/Nothing in particular 16% (78) 34% (160) 21% (98) 29% (138) 474Something Else 18% (55) 42% (126) 16% (47) 24% (71) 299Religious Non-Protestant/Catholic 40% (51) 28% (36) 16% (20) 17% (21) 128Evangelical 25% (137) 43% (238) 16% (89) 17% (94) 558Non-Evangelical 25% (179) 43% (313) 17% (126) 15% (110) 727Community: Urban 29% (130) 40% (182) 15% (70) 16% (75) 457Community: Suburban 26% (258) 39% (392) 15% (154) 20% (205) 1010Community: Rural 17% (93) 39% (208) 23% (120) 21% (111) 531Employ: Private Sector 23% (161) 40% (274) 20% (134) 17% (118) 687Employ: Government 28% (37) 42% (56) 8% (11) 21% (28) 133Employ: Self-Employed 31% (58) 28% (52) 16% (30) 24% (45) 185Employ: Homemaker 13% (21) 32% (52) 25% (40) 30% (48) 160Employ: Student 27% (17) 33% (20) 10% (6) 31% (19) 61Employ: Retired 29% (147) 48% (246) 15% (76) 8% (40) 509Employ: Unemployed 16% (27) 32% (52) 15% (25) 37% (61) 165Employ: Other 14% (14) 29% (28) 24% (23) 33% (32) 97Military HH: Yes 30% (113) 37% (140) 19% (70) 14% (52) 375Military HH: No 23% (368) 40% (641) 17% (275) 21% (339) 1623RD/WT: Right Direction 31% (229) 39% (294) 14% (106) 16% (116) 745RD/WT: Wrong Track 20% (252) 39% (487) 19% (239) 22% (275) 1253Biden Job Approve 31% (276) 38% (341) 16% (142) 15% (131) 890Biden Job Disapprove 20% (203) 41% (424) 18% (187) 21% (217) 1031Biden Job Strongly Approve 39% (174) 37% (165) 12% (52) 12% (55) 446Biden Job Somewhat Approve 23% (101) 40% (176) 20% (90) 17% (77) 444Biden Job Somewhat Disapprove 18% (46) 37% (93) 18% (46) 26% (64) 250Biden Job Strongly Disapprove 20% (157) 42% (331) 18% (140) 20% (153) 781
Continued on next page

202
Morning ConsultTable POL19_3
Table POL19_3: How much have you seen, read, or heard about the following?Congress voting to fund the government through December 3, 2021, avoiding a government shutdown
Demographic A lot Some Not much Nothing at all Total N
Registered Voters 24% (481) 39% (781) 17% (345) 20% (391) 1998Favorable of Biden 31% (282) 38% (342) 15% (133) 16% (142) 899Unfavorable of Biden 18% (191) 41% (425) 20% (202) 21% (214) 1032Very Favorable of Biden 39% (186) 37% (175) 11% (53) 12% (57) 470Somewhat Favorable of Biden 23% (97) 39% (167) 19% (80) 20% (85) 429Somewhat Unfavorable of Biden 14% (36) 39% (97) 23% (56) 23% (58) 246Very Unfavorable of Biden 20% (155) 42% (328) 19% (146) 20% (156) 786#1 Issue: Economy 22% (162) 38% (282) 18% (132) 22% (166) 742#1 Issue: Security 23% (93) 43% (177) 16% (65) 18% (74) 409#1 Issue: Health Care 30% (74) 35% (86) 19% (48) 16% (40) 248#1 Issue: Medicare / Social Security 27% (57) 46% (96) 18% (37) 9% (19) 209#1 Issue: Women’s Issues 23% (25) 30% (34) 24% (27) 23% (26) 111#1 Issue: Education 14% (10) 33% (24) 22% (16) 31% (22) 72#1 Issue: Energy 33% (29) 38% (34) 7% (6) 22% (20) 90#1 Issue: Other 26% (30) 41% (48) 12% (14) 21% (25) 1172020 Vote: Joe Biden 32% (299) 38% (358) 15% (141) 16% (148) 9462020 Vote: Donald Trump 18% (159) 44% (379) 19% (168) 18% (157) 8642020 Vote: Didn’t Vote 11% (16) 21% (32) 18% (27) 50% (77) 1532018 House Vote: Democrat 35% (257) 38% (282) 15% (108) 12% (87) 7342018 House Vote: Republican 20% (145) 46% (328) 19% (135) 15% (111) 7192018 House Vote: Someone else 10% (5) 27% (14) 15% (8) 48% (26) 532016 Vote: Hillary Clinton 32% (228) 40% (282) 14% (98) 14% (97) 7062016 Vote: Donald Trump 20% (164) 46% (368) 18% (147) 16% (126) 8052016 Vote: Other 34% (30) 39% (34) 14% (12) 13% (11) 872016 Vote: Didn’t Vote 15% (60) 24% (97) 22% (86) 39% (156) 399Voted in 2014: Yes 28% (366) 42% (560) 16% (213) 14% (184) 1324Voted in 2014: No 17% (115) 33% (221) 20% (132) 31% (206) 6744-Region: Northeast 29% (101) 39% (137) 14% (51) 18% (65) 3534-Region: Midwest 20% (90) 42% (188) 19% (84) 19% (83) 4444-Region: South 22% (165) 40% (301) 17% (126) 21% (154) 7464-Region: West 28% (125) 34% (156) 19% (85) 20% (89) 455
Continued on next page
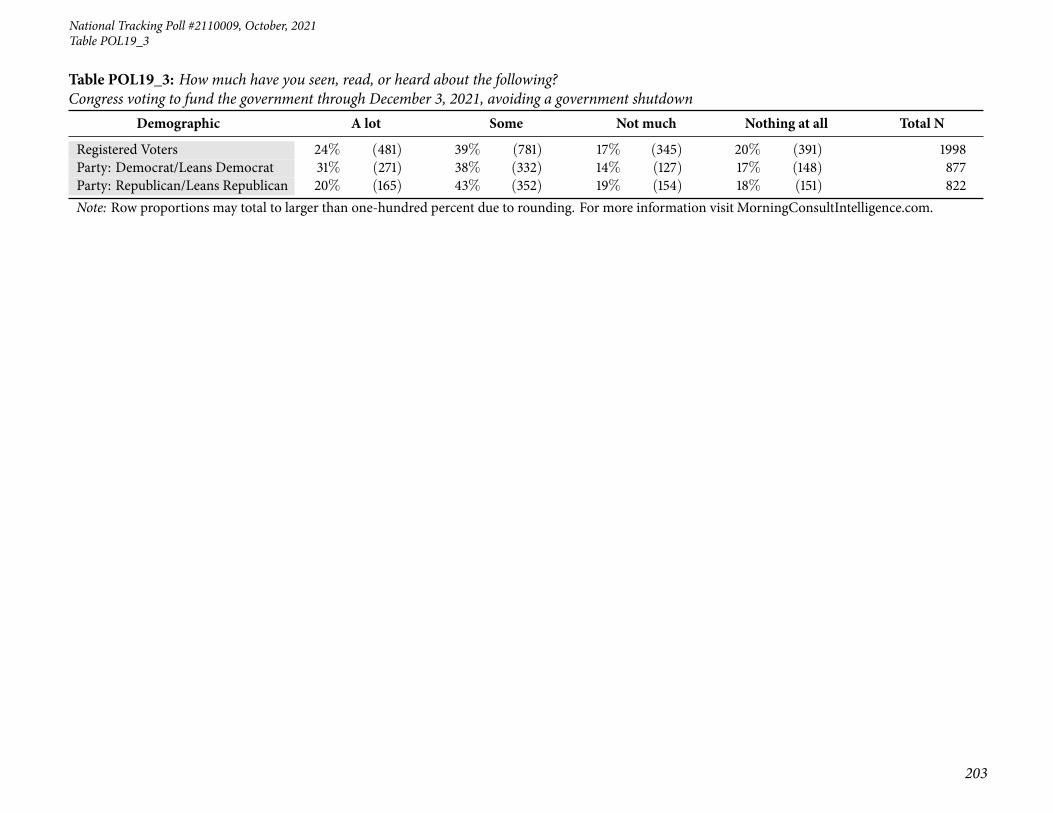
National Tracking Poll #2110009, October, 2021
203
Table POL19_3
Table POL19_3: How much have you seen, read, or heard about the following?Congress voting to fund the government through December 3, 2021, avoiding a government shutdown
Demographic A lot Some Not much Nothing at all Total N
Registered Voters 24% (481) 39% (781) 17% (345) 20% (391) 1998Party: Democrat/Leans Democrat 31% (271) 38% (332) 14% (127) 17% (148) 877Party: Republican/Leans Republican 20% (165) 43% (352) 19% (154) 18% (151) 822Note: Row proportions may total to larger than one-hundred percent due to rounding. For more information visit MorningConsultIntelligence.com.
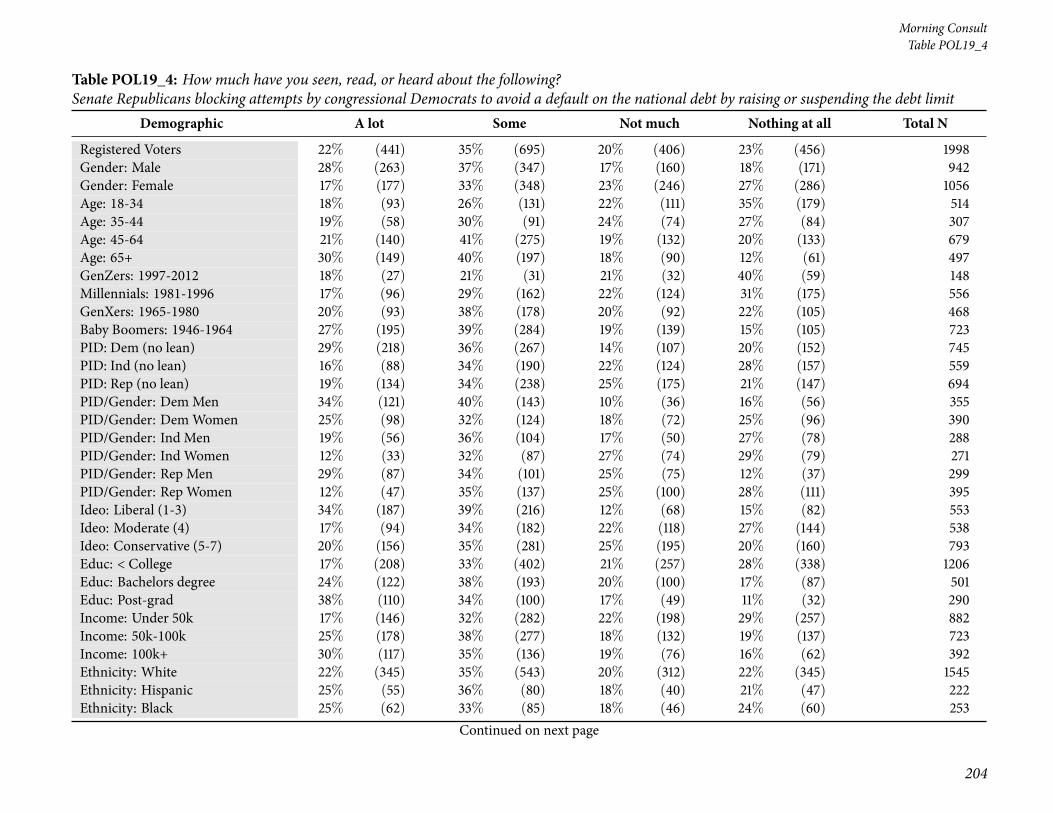
204
Morning ConsultTable POL19_4
Table POL19_4: How much have you seen, read, or heard about the following?Senate Republicans blocking attempts by congressional Democrats to avoid a default on the national debt by raising or suspending the debt limit
Demographic A lot Some Not much Nothing at all Total N
Registered Voters 22% (441) 35% (695) 20% (406) 23% (456) 1998Gender: Male 28% (263) 37% (347) 17% (160) 18% (171) 942Gender: Female 17% (177) 33% (348) 23% (246) 27% (286) 1056Age: 18-34 18% (93) 26% (131) 22% (111) 35% (179) 514Age: 35-44 19% (58) 30% (91) 24% (74) 27% (84) 307Age: 45-64 21% (140) 41% (275) 19% (132) 20% (133) 679Age: 65+ 30% (149) 40% (197) 18% (90) 12% (61) 497GenZers: 1997-2012 18% (27) 21% (31) 21% (32) 40% (59) 148Millennials: 1981-1996 17% (96) 29% (162) 22% (124) 31% (175) 556GenXers: 1965-1980 20% (93) 38% (178) 20% (92) 22% (105) 468Baby Boomers: 1946-1964 27% (195) 39% (284) 19% (139) 15% (105) 723PID: Dem (no lean) 29% (218) 36% (267) 14% (107) 20% (152) 745PID: Ind (no lean) 16% (88) 34% (190) 22% (124) 28% (157) 559PID: Rep (no lean) 19% (134) 34% (238) 25% (175) 21% (147) 694PID/Gender: DemMen 34% (121) 40% (143) 10% (36) 16% (56) 355PID/Gender: DemWomen 25% (98) 32% (124) 18% (72) 25% (96) 390PID/Gender: Ind Men 19% (56) 36% (104) 17% (50) 27% (78) 288PID/Gender: Ind Women 12% (33) 32% (87) 27% (74) 29% (79) 271PID/Gender: Rep Men 29% (87) 34% (101) 25% (75) 12% (37) 299PID/Gender: Rep Women 12% (47) 35% (137) 25% (100) 28% (111) 395Ideo: Liberal (1-3) 34% (187) 39% (216) 12% (68) 15% (82) 553Ideo: Moderate (4) 17% (94) 34% (182) 22% (118) 27% (144) 538Ideo: Conservative (5-7) 20% (156) 35% (281) 25% (195) 20% (160) 793Educ: < College 17% (208) 33% (402) 21% (257) 28% (338) 1206Educ: Bachelors degree 24% (122) 38% (193) 20% (100) 17% (87) 501Educ: Post-grad 38% (110) 34% (100) 17% (49) 11% (32) 290Income: Under 50k 17% (146) 32% (282) 22% (198) 29% (257) 882Income: 50k-100k 25% (178) 38% (277) 18% (132) 19% (137) 723Income: 100k+ 30% (117) 35% (136) 19% (76) 16% (62) 392Ethnicity: White 22% (345) 35% (543) 20% (312) 22% (345) 1545Ethnicity: Hispanic 25% (55) 36% (80) 18% (40) 21% (47) 222Ethnicity: Black 25% (62) 33% (85) 18% (46) 24% (60) 253
Continued on next page

National Tracking Poll #2110009, October, 2021
205
Table POL19_4
Table POL19_4: How much have you seen, read, or heard about the following?Senate Republicans blocking attempts by congressional Democrats to avoid a default on the national debt by raising or suspending the debt limit
Demographic A lot Some Not much Nothing at all Total N
Registered Voters 22% (441) 35% (695) 20% (406) 23% (456) 1998Ethnicity: Other 17% (33) 34% (67) 24% (48) 26% (51) 200All Christian 25% (254) 38% (392) 20% (208) 17% (171) 1025All Non-Christian 41% (43) 27% (29) 16% (17) 15% (16) 105Atheist 22% (21) 37% (35) 13% (13) 28% (27) 95Agnostic/Nothing in particular 18% (84) 29% (137) 22% (103) 32% (150) 474Something Else 13% (38) 34% (103) 22% (65) 31% (92) 299Religious Non-Protestant/Catholic 37% (47) 27% (35) 18% (23) 18% (23) 128Evangelical 23% (126) 37% (204) 19% (105) 22% (124) 558Non-Evangelical 22% (159) 38% (275) 22% (161) 18% (133) 727Community: Urban 28% (129) 33% (152) 19% (85) 20% (91) 457Community: Suburban 23% (229) 36% (366) 19% (190) 22% (224) 1010Community: Rural 15% (82) 33% (177) 25% (131) 27% (142) 531Employ: Private Sector 22% (148) 36% (246) 21% (144) 22% (149) 687Employ: Government 22% (30) 38% (50) 19% (25) 21% (28) 133Employ: Self-Employed 26% (47) 28% (53) 21% (39) 25% (46) 185Employ: Homemaker 11% (17) 36% (58) 24% (38) 30% (48) 160Employ: Student 27% (17) 26% (16) 15% (9) 33% (20) 61Employ: Retired 27% (135) 41% (209) 20% (103) 12% (62) 509Employ: Unemployed 16% (27) 26% (43) 17% (29) 40% (66) 165Employ: Other 20% (20) 21% (20) 20% (20) 39% (38) 97Military HH: Yes 25% (94) 36% (134) 21% (80) 18% (66) 375Military HH: No 21% (346) 35% (561) 20% (326) 24% (390) 1623RD/WT: Right Direction 30% (221) 38% (281) 14% (107) 18% (136) 745RD/WT: Wrong Track 18% (220) 33% (414) 24% (299) 26% (320) 1253Biden Job Approve 30% (269) 37% (332) 15% (134) 17% (155) 890Biden Job Disapprove 17% (171) 34% (354) 25% (254) 24% (252) 1031Biden Job Strongly Approve 38% (168) 34% (154) 14% (61) 14% (64) 446Biden Job Somewhat Approve 23% (102) 40% (178) 17% (73) 21% (91) 444Biden Job Somewhat Disapprove 12% (30) 33% (83) 26% (64) 29% (73) 250Biden Job Strongly Disapprove 18% (141) 35% (271) 24% (190) 23% (179) 781
Continued on next page

206
Morning ConsultTable POL19_4
Table POL19_4: How much have you seen, read, or heard about the following?Senate Republicans blocking attempts by congressional Democrats to avoid a default on the national debt by raising or suspending the debt limit
Demographic A lot Some Not much Nothing at all Total N
Registered Voters 22% (441) 35% (695) 20% (406) 23% (456) 1998Favorable of Biden 29% (261) 37% (331) 15% (138) 19% (168) 899Unfavorable of Biden 17% (173) 35% (357) 25% (254) 24% (248) 1032Very Favorable of Biden 35% (166) 36% (171) 13% (63) 15% (70) 470Somewhat Favorable of Biden 22% (95) 37% (160) 18% (75) 23% (98) 429Somewhat Unfavorable of Biden 14% (36) 33% (82) 25% (62) 27% (67) 246Very Unfavorable of Biden 17% (137) 35% (275) 24% (192) 23% (181) 786#1 Issue: Economy 18% (137) 34% (254) 21% (156) 26% (195) 742#1 Issue: Security 16% (66) 41% (166) 22% (89) 22% (88) 409#1 Issue: Health Care 29% (73) 34% (85) 16% (40) 20% (50) 248#1 Issue: Medicare / Social Security 30% (63) 39% (81) 21% (44) 10% (21) 209#1 Issue: Women’s Issues 23% (25) 28% (31) 22% (25) 26% (29) 111#1 Issue: Education 13% (9) 28% (20) 26% (19) 33% (24) 72#1 Issue: Energy 35% (31) 24% (21) 16% (15) 25% (23) 90#1 Issue: Other 30% (35) 31% (37) 16% (19) 23% (26) 1172020 Vote: Joe Biden 29% (273) 37% (351) 15% (144) 19% (179) 9462020 Vote: Donald Trump 17% (145) 35% (301) 26% (228) 22% (190) 8642020 Vote: Didn’t Vote 13% (19) 20% (31) 18% (28) 49% (75) 1532018 House Vote: Democrat 33% (240) 37% (270) 14% (105) 16% (119) 7342018 House Vote: Republican 18% (131) 38% (274) 25% (182) 18% (132) 7192018 House Vote: Someone else 7% (4) 20% (11) 21% (11) 52% (28) 532016 Vote: Hillary Clinton 31% (217) 39% (276) 12% (85) 18% (127) 7062016 Vote: Donald Trump 19% (150) 37% (295) 25% (203) 19% (157) 8052016 Vote: Other 29% (25) 31% (27) 20% (17) 20% (18) 872016 Vote: Didn’t Vote 12% (48) 24% (96) 25% (100) 39% (155) 399Voted in 2014: Yes 26% (347) 38% (499) 18% (238) 18% (239) 1324Voted in 2014: No 14% (93) 29% (196) 25% (168) 32% (217) 6744-Region: Northeast 24% (83) 37% (131) 16% (55) 23% (83) 3534-Region: Midwest 20% (89) 38% (167) 21% (94) 21% (94) 4444-Region: South 20% (152) 35% (263) 20% (147) 25% (183) 7464-Region: West 25% (116) 29% (133) 24% (110) 21% (96) 455
Continued on next page

National Tracking Poll #2110009, October, 2021
207
Table POL19_4
Table POL19_4: How much have you seen, read, or heard about the following?Senate Republicans blocking attempts by congressional Democrats to avoid a default on the national debt by raising or suspending the debt limit
Demographic A lot Some Not much Nothing at all Total N
Registered Voters 22% (441) 35% (695) 20% (406) 23% (456) 1998Party: Democrat/Leans Democrat 30% (260) 37% (321) 14% (125) 20% (171) 877Party: Republican/Leans Republican 18% (147) 35% (288) 26% (211) 21% (176) 822Note: Row proportions may total to larger than one-hundred percent due to rounding. For more information visit MorningConsultIntelligence.com.

208
Morning ConsultTable POL19_5
Table POL19_5: How much have you seen, read, or heard about the following?House Speaker Nancy Pelosi (D-Calif.) delaying a vote on the Senate’s infrastructure bill due to a lack of support from liberal House Democrats
Demographic A lot Some Not much Nothing at all Total N
Registered Voters 24% (470) 36% (711) 20% (390) 21% (427) 1998Gender: Male 30% (280) 36% (344) 18% (170) 16% (148) 942Gender: Female 18% (189) 35% (367) 21% (221) 26% (279) 1056Age: 18-34 16% (81) 22% (114) 26% (131) 37% (188) 514Age: 35-44 18% (55) 33% (100) 25% (77) 24% (75) 307Age: 45-64 24% (163) 42% (286) 16% (110) 18% (120) 679Age: 65+ 34% (170) 42% (211) 15% (72) 9% (44) 497GenZers: 1997-2012 12% (18) 17% (25) 26% (39) 45% (67) 148Millennials: 1981-1996 17% (93) 28% (154) 25% (139) 31% (170) 556GenXers: 1965-1980 19% (90) 41% (193) 21% (100) 18% (86) 468Baby Boomers: 1946-1964 32% (230) 41% (299) 14% (98) 13% (96) 723PID: Dem (no lean) 24% (182) 39% (289) 18% (135) 19% (139) 745PID: Ind (no lean) 21% (116) 33% (183) 18% (102) 28% (158) 559PID: Rep (no lean) 25% (172) 34% (239) 22% (152) 19% (131) 694PID/Gender: DemMen 30% (107) 40% (141) 17% (61) 13% (45) 355PID/Gender: DemWomen 19% (75) 38% (148) 19% (74) 24% (93) 390PID/Gender: Ind Men 26% (75) 34% (97) 16% (46) 24% (70) 288PID/Gender: Ind Women 15% (41) 32% (86) 21% (56) 33% (88) 271PID/Gender: Rep Men 33% (98) 35% (106) 21% (62) 11% (33) 299PID/Gender: Rep Women 19% (74) 34% (133) 23% (91) 25% (97) 395Ideo: Liberal (1-3) 30% (168) 37% (205) 15% (82) 18% (98) 553Ideo: Moderate (4) 18% (95) 35% (189) 24% (127) 23% (126) 538Ideo: Conservative (5-7) 26% (203) 38% (301) 20% (156) 17% (132) 793Educ: < College 19% (227) 33% (394) 23% (279) 25% (307) 1206Educ: Bachelors degree 30% (148) 39% (194) 14% (70) 18% (90) 501Educ: Post-grad 33% (95) 42% (123) 14% (41) 11% (31) 290Income: Under 50k 17% (149) 32% (279) 25% (219) 27% (234) 882Income: 50k-100k 28% (200) 38% (271) 17% (124) 18% (128) 723Income: 100k+ 31% (120) 41% (160) 12% (47) 17% (65) 392Ethnicity: White 24% (373) 37% (564) 19% (286) 21% (322) 1545Ethnicity: Hispanic 23% (52) 30% (67) 26% (58) 20% (45) 222Ethnicity: Black 24% (60) 35% (89) 22% (55) 19% (49) 253
Continued on next page
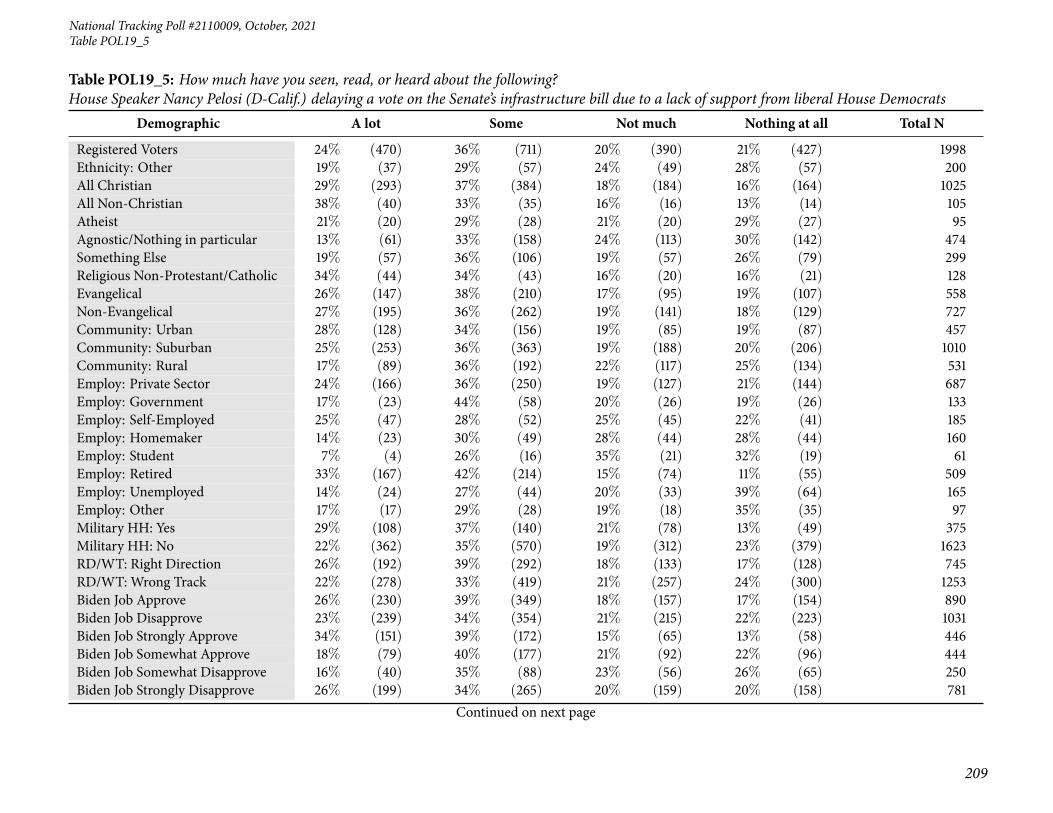
National Tracking Poll #2110009, October, 2021
209
Table POL19_5
Table POL19_5: How much have you seen, read, or heard about the following?House Speaker Nancy Pelosi (D-Calif.) delaying a vote on the Senate’s infrastructure bill due to a lack of support from liberal House Democrats
Demographic A lot Some Not much Nothing at all Total N
Registered Voters 24% (470) 36% (711) 20% (390) 21% (427) 1998Ethnicity: Other 19% (37) 29% (57) 24% (49) 28% (57) 200All Christian 29% (293) 37% (384) 18% (184) 16% (164) 1025All Non-Christian 38% (40) 33% (35) 16% (16) 13% (14) 105Atheist 21% (20) 29% (28) 21% (20) 29% (27) 95Agnostic/Nothing in particular 13% (61) 33% (158) 24% (113) 30% (142) 474Something Else 19% (57) 36% (106) 19% (57) 26% (79) 299Religious Non-Protestant/Catholic 34% (44) 34% (43) 16% (20) 16% (21) 128Evangelical 26% (147) 38% (210) 17% (95) 19% (107) 558Non-Evangelical 27% (195) 36% (262) 19% (141) 18% (129) 727Community: Urban 28% (128) 34% (156) 19% (85) 19% (87) 457Community: Suburban 25% (253) 36% (363) 19% (188) 20% (206) 1010Community: Rural 17% (89) 36% (192) 22% (117) 25% (134) 531Employ: Private Sector 24% (166) 36% (250) 19% (127) 21% (144) 687Employ: Government 17% (23) 44% (58) 20% (26) 19% (26) 133Employ: Self-Employed 25% (47) 28% (52) 25% (45) 22% (41) 185Employ: Homemaker 14% (23) 30% (49) 28% (44) 28% (44) 160Employ: Student 7% (4) 26% (16) 35% (21) 32% (19) 61Employ: Retired 33% (167) 42% (214) 15% (74) 11% (55) 509Employ: Unemployed 14% (24) 27% (44) 20% (33) 39% (64) 165Employ: Other 17% (17) 29% (28) 19% (18) 35% (35) 97Military HH: Yes 29% (108) 37% (140) 21% (78) 13% (49) 375Military HH: No 22% (362) 35% (570) 19% (312) 23% (379) 1623RD/WT: Right Direction 26% (192) 39% (292) 18% (133) 17% (128) 745RD/WT: Wrong Track 22% (278) 33% (419) 21% (257) 24% (300) 1253Biden Job Approve 26% (230) 39% (349) 18% (157) 17% (154) 890Biden Job Disapprove 23% (239) 34% (354) 21% (215) 22% (223) 1031Biden Job Strongly Approve 34% (151) 39% (172) 15% (65) 13% (58) 446Biden Job Somewhat Approve 18% (79) 40% (177) 21% (92) 22% (96) 444Biden Job Somewhat Disapprove 16% (40) 35% (88) 23% (56) 26% (65) 250Biden Job Strongly Disapprove 26% (199) 34% (265) 20% (159) 20% (158) 781
Continued on next page

210
Morning ConsultTable POL19_5
Table POL19_5: How much have you seen, read, or heard about the following?House Speaker Nancy Pelosi (D-Calif.) delaying a vote on the Senate’s infrastructure bill due to a lack of support from liberal House Democrats
Demographic A lot Some Not much Nothing at all Total N
Registered Voters 24% (470) 36% (711) 20% (390) 21% (427) 1998Favorable of Biden 25% (229) 39% (348) 18% (160) 18% (162) 899Unfavorable of Biden 23% (235) 34% (356) 21% (217) 22% (225) 1032Very Favorable of Biden 33% (155) 38% (179) 16% (74) 13% (63) 470Somewhat Favorable of Biden 17% (74) 39% (169) 20% (86) 23% (100) 429Somewhat Unfavorable of Biden 16% (40) 37% (92) 19% (46) 28% (69) 246Very Unfavorable of Biden 25% (195) 34% (264) 22% (170) 20% (156) 786#1 Issue: Economy 23% (172) 35% (259) 19% (138) 23% (173) 742#1 Issue: Security 26% (107) 38% (157) 19% (77) 17% (69) 409#1 Issue: Health Care 17% (42) 35% (86) 25% (63) 23% (58) 248#1 Issue: Medicare / Social Security 32% (67) 43% (90) 13% (26) 12% (25) 209#1 Issue: Women’s Issues 20% (22) 26% (28) 25% (27) 30% (33) 111#1 Issue: Education 17% (12) 31% (22) 25% (18) 28% (20) 72#1 Issue: Energy 15% (14) 36% (32) 22% (20) 27% (24) 90#1 Issue: Other 28% (33) 31% (36) 19% (22) 22% (26) 1172020 Vote: Joe Biden 25% (240) 39% (371) 17% (157) 19% (178) 9462020 Vote: Donald Trump 24% (205) 36% (309) 22% (190) 19% (160) 8642020 Vote: Didn’t Vote 14% (21) 14% (22) 22% (33) 50% (77) 1532018 House Vote: Democrat 28% (208) 41% (303) 16% (116) 15% (107) 7342018 House Vote: Republican 26% (186) 39% (277) 20% (146) 15% (110) 7192018 House Vote: Someone else 13% (7) 24% (13) 10% (5) 53% (28) 532016 Vote: Hillary Clinton 27% (192) 41% (287) 15% (104) 17% (123) 7062016 Vote: Donald Trump 27% (214) 36% (293) 21% (168) 16% (129) 8052016 Vote: Other 29% (25) 33% (29) 20% (18) 17% (15) 872016 Vote: Didn’t Vote 9% (37) 25% (101) 25% (100) 40% (160) 399Voted in 2014: Yes 28% (369) 40% (535) 16% (216) 15% (204) 1324Voted in 2014: No 15% (101) 26% (175) 26% (175) 33% (224) 6744-Region: Northeast 26% (91) 39% (139) 14% (51) 20% (72) 3534-Region: Midwest 23% (103) 35% (156) 19% (84) 23% (102) 4444-Region: South 22% (166) 34% (256) 23% (168) 21% (156) 7464-Region: West 24% (110) 35% (160) 19% (87) 22% (98) 455
Continued on next page

National Tracking Poll #2110009, October, 2021
211
Table POL19_5
Table POL19_5: How much have you seen, read, or heard about the following?House Speaker Nancy Pelosi (D-Calif.) delaying a vote on the Senate’s infrastructure bill due to a lack of support from liberal House Democrats
Demographic A lot Some Not much Nothing at all Total N
Registered Voters 24% (470) 36% (711) 20% (390) 21% (427) 1998Party: Democrat/Leans Democrat 25% (220) 39% (339) 18% (157) 18% (161) 877Party: Republican/Leans Republican 24% (197) 35% (288) 22% (184) 19% (154) 822Note: Row proportions may total to larger than one-hundred percent due to rounding. For more information visit MorningConsultIntelligence.com.

212
Morning ConsultTable POL19_6
Table POL19_6: How much have you seen, read, or heard about the following?Sens. Joe Manchin (D-W.Va.) and Kyrsten Sinema (D-Ariz.) negotiating with the White House over the Democrats’ social spending bill
Demographic A lot Some Not much Nothing at all Total N
Registered Voters 21% (420) 27% (549) 19% (376) 33% (653) 1998Gender: Male 26% (249) 33% (309) 17% (158) 24% (226) 942Gender: Female 16% (171) 23% (240) 21% (218) 40% (427) 1056Age: 18-34 13% (66) 20% (101) 23% (120) 44% (227) 514Age: 35-44 19% (59) 26% (81) 20% (62) 34% (105) 307Age: 45-64 20% (133) 32% (218) 17% (116) 31% (212) 679Age: 65+ 33% (162) 30% (148) 16% (77) 22% (109) 497GenZers: 1997-2012 6% (9) 17% (25) 22% (33) 55% (82) 148Millennials: 1981-1996 17% (92) 23% (125) 22% (123) 39% (216) 556GenXers: 1965-1980 18% (83) 31% (144) 20% (93) 32% (148) 468Baby Boomers: 1946-1964 27% (198) 31% (223) 16% (113) 26% (188) 723PID: Dem (no lean) 25% (189) 33% (243) 15% (109) 27% (203) 745PID: Ind (no lean) 17% (95) 24% (132) 22% (123) 37% (209) 559PID: Rep (no lean) 20% (136) 25% (174) 21% (143) 35% (240) 694PID/Gender: DemMen 31% (109) 36% (127) 12% (43) 21% (76) 355PID/Gender: DemWomen 20% (80) 30% (116) 17% (66) 33% (127) 390PID/Gender: Ind Men 19% (55) 29% (83) 20% (58) 32% (92) 288PID/Gender: Ind Women 15% (40) 18% (48) 24% (65) 43% (117) 271PID/Gender: Rep Men 28% (85) 33% (99) 19% (57) 19% (58) 299PID/Gender: Rep Women 13% (51) 19% (76) 22% (86) 46% (182) 395Ideo: Liberal (1-3) 30% (168) 32% (175) 16% (87) 22% (123) 553Ideo: Moderate (4) 16% (86) 27% (146) 22% (118) 35% (188) 538Ideo: Conservative (5-7) 21% (164) 27% (214) 18% (146) 34% (269) 793Educ: < College 15% (177) 25% (298) 21% (259) 39% (472) 1206Educ: Bachelors degree 28% (141) 31% (157) 15% (76) 25% (126) 501Educ: Post-grad 35% (102) 32% (94) 14% (41) 19% (54) 290Income: Under 50k 14% (128) 25% (216) 22% (193) 39% (346) 882Income: 50k-100k 26% (192) 28% (205) 16% (118) 29% (209) 723Income: 100k+ 26% (101) 32% (127) 17% (66) 25% (98) 392Ethnicity: White 22% (340) 28% (430) 18% (283) 32% (491) 1545Ethnicity: Hispanic 24% (53) 27% (59) 18% (40) 31% (69) 222Ethnicity: Black 24% (62) 23% (59) 21% (53) 31% (78) 253
Continued on next page

National Tracking Poll #2110009, October, 2021
213
Table POL19_6
Table POL19_6: How much have you seen, read, or heard about the following?Sens. Joe Manchin (D-W.Va.) and Kyrsten Sinema (D-Ariz.) negotiating with the White House over the Democrats’ social spending bill
Demographic A lot Some Not much Nothing at all Total N
Registered Voters 21% (420) 27% (549) 19% (376) 33% (653) 1998Ethnicity: Other 9% (18) 30% (59) 20% (40) 42% (83) 200All Christian 25% (259) 30% (303) 16% (169) 29% (295) 1025All Non-Christian 38% (40) 27% (29) 17% (18) 18% (19) 105Atheist 24% (23) 25% (24) 19% (18) 32% (30) 95Agnostic/Nothing in particular 14% (68) 24% (114) 23% (110) 39% (184) 474Something Else 11% (32) 27% (80) 21% (62) 42% (125) 299Religious Non-Protestant/Catholic 34% (43) 28% (35) 15% (19) 24% (30) 128Evangelical 21% (117) 27% (153) 17% (97) 34% (191) 558Non-Evangelical 23% (166) 29% (213) 18% (132) 30% (216) 727Community: Urban 24% (111) 30% (136) 17% (79) 29% (131) 457Community: Suburban 22% (225) 27% (273) 19% (188) 32% (323) 1010Community: Rural 16% (84) 26% (140) 20% (108) 37% (199) 531Employ: Private Sector 21% (142) 30% (207) 19% (130) 30% (208) 687Employ: Government 18% (24) 31% (42) 20% (27) 30% (40) 133Employ: Self-Employed 26% (48) 21% (38) 18% (34) 35% (65) 185Employ: Homemaker 9% (14) 21% (34) 23% (37) 47% (75) 160Employ: Student 7% (4) 13% (8) 34% (21) 46% (28) 61Employ: Retired 29% (148) 34% (172) 15% (78) 22% (111) 509Employ: Unemployed 16% (26) 16% (27) 19% (32) 49% (81) 165Employ: Other 14% (14) 22% (22) 18% (17) 46% (45) 97Military HH: Yes 23% (87) 31% (115) 20% (75) 26% (98) 375Military HH: No 21% (334) 27% (434) 19% (301) 34% (555) 1623RD/WT: Right Direction 26% (194) 32% (240) 18% (135) 24% (176) 745RD/WT: Wrong Track 18% (227) 25% (309) 19% (240) 38% (477) 1253Biden Job Approve 27% (243) 30% (271) 17% (153) 25% (223) 890Biden Job Disapprove 17% (177) 26% (271) 20% (202) 37% (381) 1031Biden Job Strongly Approve 35% (154) 31% (140) 15% (68) 19% (84) 446Biden Job Somewhat Approve 20% (88) 29% (131) 19% (86) 31% (139) 444Biden Job Somewhat Disapprove 9% (23) 18% (46) 22% (56) 50% (125) 250Biden Job Strongly Disapprove 20% (154) 29% (225) 19% (147) 33% (256) 781
Continued on next page
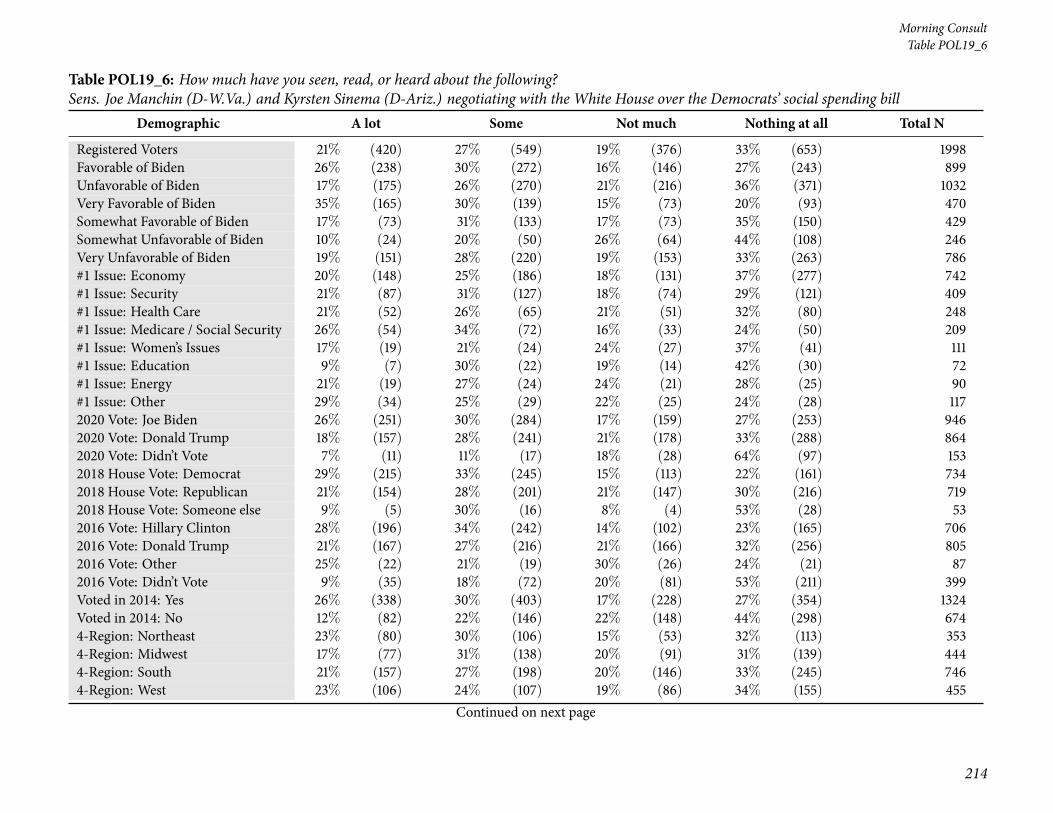
214
Morning ConsultTable POL19_6
Table POL19_6: How much have you seen, read, or heard about the following?Sens. Joe Manchin (D-W.Va.) and Kyrsten Sinema (D-Ariz.) negotiating with the White House over the Democrats’ social spending bill
Demographic A lot Some Not much Nothing at all Total N
Registered Voters 21% (420) 27% (549) 19% (376) 33% (653) 1998Favorable of Biden 26% (238) 30% (272) 16% (146) 27% (243) 899Unfavorable of Biden 17% (175) 26% (270) 21% (216) 36% (371) 1032Very Favorable of Biden 35% (165) 30% (139) 15% (73) 20% (93) 470Somewhat Favorable of Biden 17% (73) 31% (133) 17% (73) 35% (150) 429Somewhat Unfavorable of Biden 10% (24) 20% (50) 26% (64) 44% (108) 246Very Unfavorable of Biden 19% (151) 28% (220) 19% (153) 33% (263) 786#1 Issue: Economy 20% (148) 25% (186) 18% (131) 37% (277) 742#1 Issue: Security 21% (87) 31% (127) 18% (74) 29% (121) 409#1 Issue: Health Care 21% (52) 26% (65) 21% (51) 32% (80) 248#1 Issue: Medicare / Social Security 26% (54) 34% (72) 16% (33) 24% (50) 209#1 Issue: Women’s Issues 17% (19) 21% (24) 24% (27) 37% (41) 111#1 Issue: Education 9% (7) 30% (22) 19% (14) 42% (30) 72#1 Issue: Energy 21% (19) 27% (24) 24% (21) 28% (25) 90#1 Issue: Other 29% (34) 25% (29) 22% (25) 24% (28) 1172020 Vote: Joe Biden 26% (251) 30% (284) 17% (159) 27% (253) 9462020 Vote: Donald Trump 18% (157) 28% (241) 21% (178) 33% (288) 8642020 Vote: Didn’t Vote 7% (11) 11% (17) 18% (28) 64% (97) 1532018 House Vote: Democrat 29% (215) 33% (245) 15% (113) 22% (161) 7342018 House Vote: Republican 21% (154) 28% (201) 21% (147) 30% (216) 7192018 House Vote: Someone else 9% (5) 30% (16) 8% (4) 53% (28) 532016 Vote: Hillary Clinton 28% (196) 34% (242) 14% (102) 23% (165) 7062016 Vote: Donald Trump 21% (167) 27% (216) 21% (166) 32% (256) 8052016 Vote: Other 25% (22) 21% (19) 30% (26) 24% (21) 872016 Vote: Didn’t Vote 9% (35) 18% (72) 20% (81) 53% (211) 399Voted in 2014: Yes 26% (338) 30% (403) 17% (228) 27% (354) 1324Voted in 2014: No 12% (82) 22% (146) 22% (148) 44% (298) 6744-Region: Northeast 23% (80) 30% (106) 15% (53) 32% (113) 3534-Region: Midwest 17% (77) 31% (138) 20% (91) 31% (139) 4444-Region: South 21% (157) 27% (198) 20% (146) 33% (245) 7464-Region: West 23% (106) 24% (107) 19% (86) 34% (155) 455
Continued on next page

National Tracking Poll #2110009, October, 2021
215
Table POL19_6
Table POL19_6: How much have you seen, read, or heard about the following?Sens. Joe Manchin (D-W.Va.) and Kyrsten Sinema (D-Ariz.) negotiating with the White House over the Democrats’ social spending bill
Demographic A lot Some Not much Nothing at all Total N
Registered Voters 21% (420) 27% (549) 19% (376) 33% (653) 1998Party: Democrat/Leans Democrat 25% (217) 32% (284) 16% (138) 27% (237) 877Party: Republican/Leans Republican 20% (164) 24% (194) 21% (176) 35% (288) 822Note: Row proportions may total to larger than one-hundred percent due to rounding. For more information visit MorningConsultIntelligence.com.

216
Morning ConsultTable POLx_1
Table POLx_1: Next we will look at a list of names that are active in politics. It is a long list, please take the time to go through the list carefullyand give an individual answer for each name below. For each person, please indicate if you have a Very Favorable, Somewhat Favorable, SomewhatUnfavorable, or Very Unfavorable opinion of each If you have heard of the person, but do not have an opinion, please mark ’Heard Of, No Opinion.’ Ifyou have not heard of the person, please mark ’Never Heard Of.’Mitch McConnell
Demographic Total Favorable Total UnfavorableHeard Of, NoOpinion Never Heard Of Total N
Registered Voters 21% (415) 57% (1137) 17% (337) 5% (110) 1998Gender: Male 22% (208) 62% (584) 11% (105) 5% (45) 942Gender: Female 20% (206) 52% (553) 22% (232) 6% (65) 1056Age: 18-34 15% (78) 44% (224) 28% (146) 13% (66) 514Age: 35-44 21% (63) 56% (172) 16% (50) 7% (22) 307Age: 45-64 21% (140) 63% (431) 14% (94) 2% (14) 679Age: 65+ 27% (134) 62% (310) 9% (46) 2% (8) 497GenZers: 1997-2012 9% (13) 33% (49) 34% (51) 24% (35) 148Millennials: 1981-1996 20% (109) 50% (277) 22% (120) 9% (50) 556GenXers: 1965-1980 18% (84) 62% (291) 17% (81) 3% (12) 468Baby Boomers: 1946-1964 25% (178) 63% (455) 11% (77) 2% (13) 723PID: Dem (no lean) 9% (69) 75% (557) 10% (77) 6% (42) 745PID: Ind (no lean) 13% (74) 57% (318) 24% (134) 6% (34) 559PID: Rep (no lean) 39% (272) 38% (262) 18% (125) 5% (34) 694PID/Gender: DemMen 11% (41) 77% (272) 6% (23) 6% (20) 355PID/Gender: DemWomen 7% (28) 73% (286) 14% (54) 6% (22) 390PID/Gender: Ind Men 13% (38) 66% (189) 16% (47) 5% (13) 288PID/Gender: Ind Women 13% (36) 47% (129) 32% (87) 7% (20) 271PID/Gender: Rep Men 43% (129) 41% (123) 12% (35) 4% (12) 299PID/Gender: Rep Women 36% (143) 35% (139) 23% (91) 6% (23) 395Ideo: Liberal (1-3) 7% (39) 80% (444) 9% (49) 4% (20) 553Ideo: Moderate (4) 15% (81) 61% (326) 19% (102) 6% (30) 538Ideo: Conservative (5-7) 35% (281) 44% (347) 17% (138) 3% (26) 793Educ: < College 19% (233) 53% (642) 21% (252) 7% (79) 1206Educ: Bachelors degree 23% (115) 62% (313) 11% (57) 3% (16) 501Educ: Post-grad 23% (67) 63% (182) 9% (28) 5% (14) 290Income: Under 50k 16% (142) 57% (505) 20% (179) 6% (56) 882Income: 50k-100k 23% (169) 57% (413) 14% (103) 5% (39) 723Income: 100k+ 26% (103) 56% (219) 14% (55) 4% (15) 392
Continued on next page

National Tracking Poll #2110009, October, 2021
217
Table POLx_1
Table POLx_1: Next we will look at a list of names that are active in politics. It is a long list, please take the time to go through the list carefullyand give an individual answer for each name below. For each person, please indicate if you have a Very Favorable, Somewhat Favorable, SomewhatUnfavorable, or Very Unfavorable opinion of each If you have heard of the person, but do not have an opinion, please mark ’Heard Of, No Opinion.’ Ifyou have not heard of the person, please mark ’Never Heard Of.’Mitch McConnell
Demographic Total Favorable Total UnfavorableHeard Of, NoOpinion Never Heard Of Total N
Registered Voters 21% (415) 57% (1137) 17% (337) 5% (110) 1998Ethnicity: White 24% (373) 55% (848) 17% (265) 4% (59) 1545Ethnicity: Hispanic 17% (37) 51% (113) 23% (51) 10% (22) 222Ethnicity: Black 9% (22) 65% (164) 16% (40) 10% (26) 253Ethnicity: Other 10% (19) 62% (125) 16% (32) 12% (25) 200All Christian 27% (278) 54% (552) 16% (162) 3% (32) 1025All Non-Christian 18% (19) 66% (70) 7% (7) 8% (9) 105Atheist 15% (14) 66% (62) 14% (13) 5% (5) 95Agnostic/Nothing in particular 12% (55) 60% (287) 20% (97) 8% (36) 474Something Else 16% (48) 56% (166) 19% (57) 9% (28) 299Religious Non-Protestant/Catholic 21% (27) 58% (75) 12% (16) 8% (10) 128Evangelical 29% (164) 48% (269) 17% (96) 5% (29) 558Non-Evangelical 21% (150) 60% (433) 16% (114) 4% (30) 727Community: Urban 20% (92) 57% (260) 17% (80) 6% (25) 457Community: Suburban 20% (202) 58% (587) 17% (167) 5% (55) 1010Community: Rural 23% (121) 55% (290) 17% (90) 6% (30) 531Employ: Private Sector 22% (151) 57% (392) 15% (104) 6% (39) 687Employ: Government 19% (26) 49% (65) 23% (30) 9% (12) 133Employ: Self-Employed 19% (34) 51% (94) 23% (42) 8% (15) 185Employ: Homemaker 19% (30) 55% (88) 20% (32) 6% (10) 160Employ: Student 9% (6) 50% (31) 23% (14) 18% (11) 61Employ: Retired 26% (132) 65% (330) 8% (43) 1% (4) 509Employ: Unemployed 14% (23) 50% (83) 27% (45) 9% (14) 165Employ: Other 13% (12) 56% (55) 26% (26) 5% (5) 97Military HH: Yes 24% (91) 55% (204) 15% (57) 6% (23) 375Military HH: No 20% (324) 57% (933) 17% (280) 5% (87) 1623RD/WT: Right Direction 13% (100) 69% (516) 12% (90) 5% (40) 745RD/WT: Wrong Track 25% (315) 50% (621) 20% (247) 6% (70) 1253
Continued on next page

218
Morning ConsultTable POLx_1
Table POLx_1: Next we will look at a list of names that are active in politics. It is a long list, please take the time to go through the list carefullyand give an individual answer for each name below. For each person, please indicate if you have a Very Favorable, Somewhat Favorable, SomewhatUnfavorable, or Very Unfavorable opinion of each If you have heard of the person, but do not have an opinion, please mark ’Heard Of, No Opinion.’ Ifyou have not heard of the person, please mark ’Never Heard Of.’Mitch McConnell
Demographic Total Favorable Total UnfavorableHeard Of, NoOpinion Never Heard Of Total N
Registered Voters 21% (415) 57% (1137) 17% (337) 5% (110) 1998Biden Job Approve 12% (108) 72% (641) 11% (97) 5% (44) 890Biden Job Disapprove 29% (303) 47% (483) 19% (201) 4% (44) 1031Biden Job Strongly Approve 12% (55) 73% (325) 10% (45) 5% (23) 446Biden Job Somewhat Approve 12% (54) 71% (316) 12% (52) 5% (22) 444Biden Job Somewhat Disapprove 15% (37) 52% (131) 27% (66) 6% (16) 250Biden Job Strongly Disapprove 34% (266) 45% (352) 17% (134) 4% (28) 781Favorable of Biden 12% (107) 72% (649) 11% (97) 5% (46) 899Unfavorable of Biden 30% (305) 46% (479) 19% (200) 5% (48) 1032Very Favorable of Biden 12% (57) 75% (350) 9% (41) 5% (22) 470Somewhat Favorable of Biden 12% (50) 70% (299) 13% (57) 6% (24) 429Somewhat Unfavorable of Biden 17% (41) 50% (123) 25% (62) 8% (20) 246Very Unfavorable of Biden 34% (264) 45% (356) 18% (139) 4% (28) 786#1 Issue: Economy 22% (165) 54% (398) 20% (147) 4% (33) 742#1 Issue: Security 32% (133) 49% (199) 14% (56) 5% (21) 409#1 Issue: Health Care 13% (32) 62% (154) 19% (46) 6% (15) 248#1 Issue: Medicare / Social Security 20% (42) 65% (136) 12% (25) 2% (5) 209#1 Issue: Women’s Issues 11% (13) 66% (73) 14% (16) 8% (9) 111#1 Issue: Education 13% (9) 47% (34) 20% (14) 20% (15) 72#1 Issue: Energy 14% (12) 63% (56) 18% (16) 6% (5) 90#1 Issue: Other 7% (8) 73% (85) 14% (16) 6% (7) 1172020 Vote: Joe Biden 10% (91) 74% (701) 12% (110) 5% (44) 9462020 Vote: Donald Trump 35% (301) 42% (363) 20% (169) 4% (31) 8642020 Vote: Didn’t Vote 13% (19) 34% (52) 32% (49) 21% (32) 1532018 House Vote: Democrat 9% (66) 78% (574) 10% (71) 3% (23) 7342018 House Vote: Republican 38% (270) 45% (323) 15% (109) 2% (17) 7192018 House Vote: Someone else 5% (3) 56% (30) 33% (18) 6% (3) 53
Continued on next page

National Tracking Poll #2110009, October, 2021
219
Table POLx_1
Table POLx_1: Next we will look at a list of names that are active in politics. It is a long list, please take the time to go through the list carefullyand give an individual answer for each name below. For each person, please indicate if you have a Very Favorable, Somewhat Favorable, SomewhatUnfavorable, or Very Unfavorable opinion of each If you have heard of the person, but do not have an opinion, please mark ’Heard Of, No Opinion.’ Ifyou have not heard of the person, please mark ’Never Heard Of.’Mitch McConnell
Demographic Total Favorable Total UnfavorableHeard Of, NoOpinion Never Heard Of Total N
Registered Voters 21% (415) 57% (1137) 17% (337) 5% (110) 19982016 Vote: Hillary Clinton 8% (54) 79% (555) 11% (75) 3% (22) 7062016 Vote: Donald Trump 37% (296) 43% (345) 18% (143) 3% (21) 8052016 Vote: Other 11% (9) 72% (63) 12% (11) 5% (4) 872016 Vote: Didn’t Vote 14% (55) 43% (173) 27% (108) 16% (63) 399Voted in 2014: Yes 24% (316) 62% (817) 12% (153) 3% (39) 1324Voted in 2014: No 15% (99) 48% (321) 27% (184) 11% (71) 6744-Region: Northeast 21% (75) 57% (200) 16% (57) 6% (21) 3534-Region: Midwest 21% (93) 56% (250) 17% (78) 6% (25) 4444-Region: South 23% (168) 56% (416) 17% (127) 5% (34) 7464-Region: West 17% (79) 60% (272) 16% (75) 6% (29) 455Party: Democrat/Leans Democrat 9% (76) 75% (660) 11% (95) 5% (46) 877Party: Republican/Leans Republican 38% (309) 40% (325) 19% (153) 4% (35) 822Note: Row proportions may total to larger than one-hundred percent due to rounding. For more information visit MorningConsultIntelligence.com.
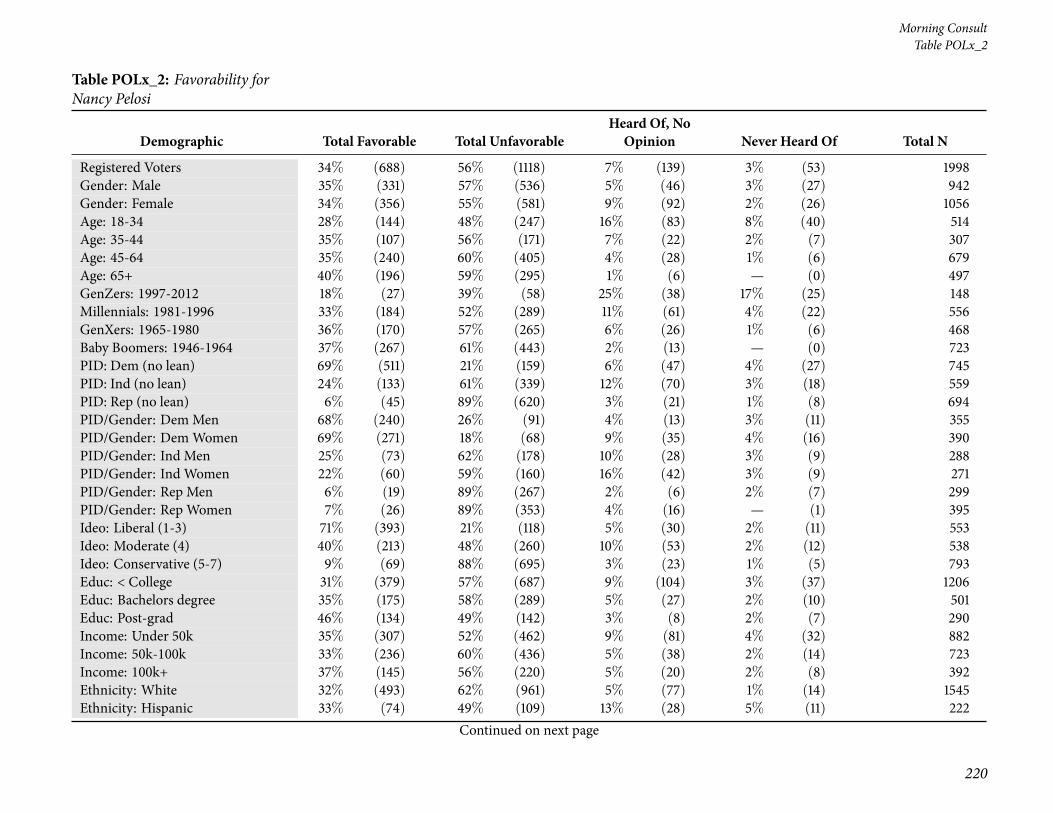
220
Morning ConsultTable POLx_2
Table POLx_2: Favorability forNancy Pelosi
Demographic Total Favorable Total UnfavorableHeard Of, NoOpinion Never Heard Of Total N
Registered Voters 34% (688) 56% (1118) 7% (139) 3% (53) 1998Gender: Male 35% (331) 57% (536) 5% (46) 3% (27) 942Gender: Female 34% (356) 55% (581) 9% (92) 2% (26) 1056Age: 18-34 28% (144) 48% (247) 16% (83) 8% (40) 514Age: 35-44 35% (107) 56% (171) 7% (22) 2% (7) 307Age: 45-64 35% (240) 60% (405) 4% (28) 1% (6) 679Age: 65+ 40% (196) 59% (295) 1% (6) — (0) 497GenZers: 1997-2012 18% (27) 39% (58) 25% (38) 17% (25) 148Millennials: 1981-1996 33% (184) 52% (289) 11% (61) 4% (22) 556GenXers: 1965-1980 36% (170) 57% (265) 6% (26) 1% (6) 468Baby Boomers: 1946-1964 37% (267) 61% (443) 2% (13) — (0) 723PID: Dem (no lean) 69% (511) 21% (159) 6% (47) 4% (27) 745PID: Ind (no lean) 24% (133) 61% (339) 12% (70) 3% (18) 559PID: Rep (no lean) 6% (45) 89% (620) 3% (21) 1% (8) 694PID/Gender: DemMen 68% (240) 26% (91) 4% (13) 3% (11) 355PID/Gender: DemWomen 69% (271) 18% (68) 9% (35) 4% (16) 390PID/Gender: Ind Men 25% (73) 62% (178) 10% (28) 3% (9) 288PID/Gender: Ind Women 22% (60) 59% (160) 16% (42) 3% (9) 271PID/Gender: Rep Men 6% (19) 89% (267) 2% (6) 2% (7) 299PID/Gender: Rep Women 7% (26) 89% (353) 4% (16) — (1) 395Ideo: Liberal (1-3) 71% (393) 21% (118) 5% (30) 2% (11) 553Ideo: Moderate (4) 40% (213) 48% (260) 10% (53) 2% (12) 538Ideo: Conservative (5-7) 9% (69) 88% (695) 3% (23) 1% (5) 793Educ: < College 31% (379) 57% (687) 9% (104) 3% (37) 1206Educ: Bachelors degree 35% (175) 58% (289) 5% (27) 2% (10) 501Educ: Post-grad 46% (134) 49% (142) 3% (8) 2% (7) 290Income: Under 50k 35% (307) 52% (462) 9% (81) 4% (32) 882Income: 50k-100k 33% (236) 60% (436) 5% (38) 2% (14) 723Income: 100k+ 37% (145) 56% (220) 5% (20) 2% (8) 392Ethnicity: White 32% (493) 62% (961) 5% (77) 1% (14) 1545Ethnicity: Hispanic 33% (74) 49% (109) 13% (28) 5% (11) 222
Continued on next page
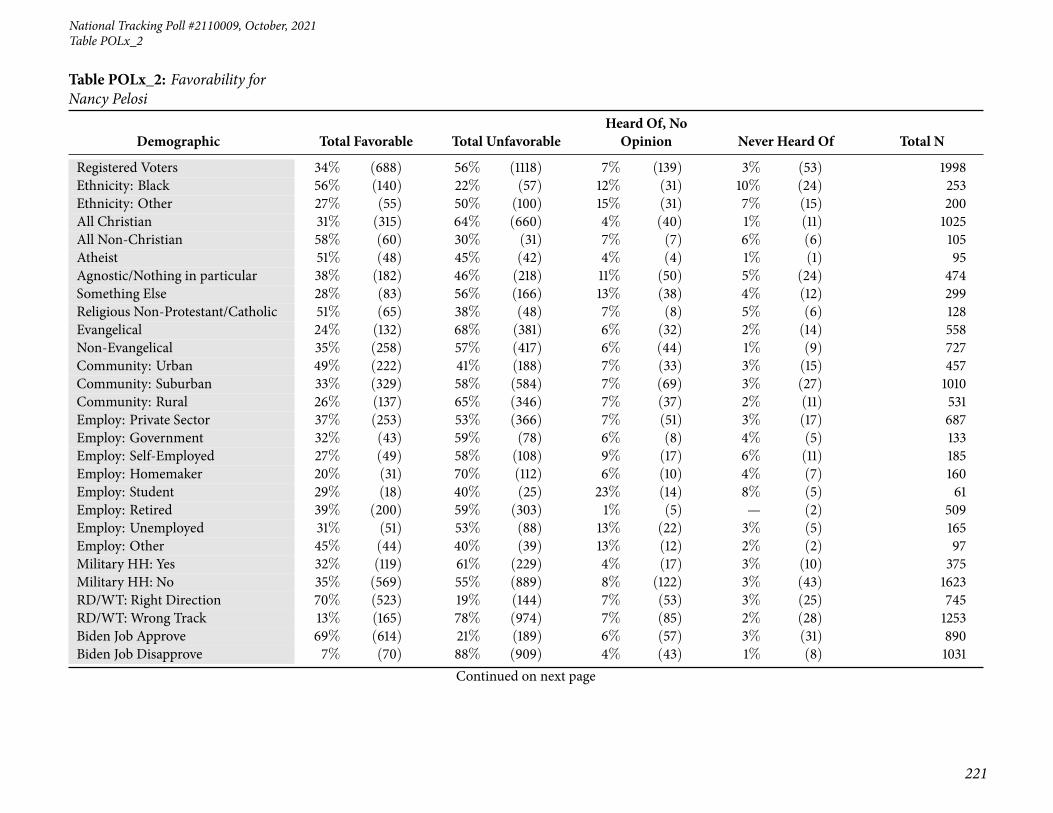
National Tracking Poll #2110009, October, 2021
221
Table POLx_2
Table POLx_2: Favorability forNancy Pelosi
Demographic Total Favorable Total UnfavorableHeard Of, NoOpinion Never Heard Of Total N
Registered Voters 34% (688) 56% (1118) 7% (139) 3% (53) 1998Ethnicity: Black 56% (140) 22% (57) 12% (31) 10% (24) 253Ethnicity: Other 27% (55) 50% (100) 15% (31) 7% (15) 200All Christian 31% (315) 64% (660) 4% (40) 1% (11) 1025All Non-Christian 58% (60) 30% (31) 7% (7) 6% (6) 105Atheist 51% (48) 45% (42) 4% (4) 1% (1) 95Agnostic/Nothing in particular 38% (182) 46% (218) 11% (50) 5% (24) 474Something Else 28% (83) 56% (166) 13% (38) 4% (12) 299Religious Non-Protestant/Catholic 51% (65) 38% (48) 7% (8) 5% (6) 128Evangelical 24% (132) 68% (381) 6% (32) 2% (14) 558Non-Evangelical 35% (258) 57% (417) 6% (44) 1% (9) 727Community: Urban 49% (222) 41% (188) 7% (33) 3% (15) 457Community: Suburban 33% (329) 58% (584) 7% (69) 3% (27) 1010Community: Rural 26% (137) 65% (346) 7% (37) 2% (11) 531Employ: Private Sector 37% (253) 53% (366) 7% (51) 3% (17) 687Employ: Government 32% (43) 59% (78) 6% (8) 4% (5) 133Employ: Self-Employed 27% (49) 58% (108) 9% (17) 6% (11) 185Employ: Homemaker 20% (31) 70% (112) 6% (10) 4% (7) 160Employ: Student 29% (18) 40% (25) 23% (14) 8% (5) 61Employ: Retired 39% (200) 59% (303) 1% (5) — (2) 509Employ: Unemployed 31% (51) 53% (88) 13% (22) 3% (5) 165Employ: Other 45% (44) 40% (39) 13% (12) 2% (2) 97Military HH: Yes 32% (119) 61% (229) 4% (17) 3% (10) 375Military HH: No 35% (569) 55% (889) 8% (122) 3% (43) 1623RD/WT: Right Direction 70% (523) 19% (144) 7% (53) 3% (25) 745RD/WT: Wrong Track 13% (165) 78% (974) 7% (85) 2% (28) 1253Biden Job Approve 69% (614) 21% (189) 6% (57) 3% (31) 890Biden Job Disapprove 7% (70) 88% (909) 4% (43) 1% (8) 1031
Continued on next page

222
Morning ConsultTable POLx_2
Table POLx_2: Favorability forNancy Pelosi
Demographic Total Favorable Total UnfavorableHeard Of, NoOpinion Never Heard Of Total N
Registered Voters 34% (688) 56% (1118) 7% (139) 3% (53) 1998Biden Job Strongly Approve 82% (365) 9% (39) 6% (27) 3% (15) 446Biden Job Somewhat Approve 56% (248) 34% (150) 7% (30) 4% (16) 444Biden Job Somewhat Disapprove 21% (53) 65% (163) 12% (29) 2% (5) 250Biden Job Strongly Disapprove 2% (17) 95% (746) 2% (14) — (4) 781Favorable of Biden 71% (640) 19% (174) 6% (57) 3% (28) 899Unfavorable of Biden 4% (45) 90% (929) 4% (43) 2% (17) 1032Very Favorable of Biden 83% (392) 8% (37) 5% (25) 3% (16) 470Somewhat Favorable of Biden 58% (248) 32% (137) 7% (32) 3% (12) 429Somewhat Unfavorable of Biden 15% (36) 70% (172) 10% (25) 5% (13) 246Very Unfavorable of Biden 1% (9) 96% (756) 2% (18) — (4) 786#1 Issue: Economy 29% (216) 60% (445) 9% (66) 2% (16) 742#1 Issue: Security 11% (45) 87% (354) 2% (8) — (2) 409#1 Issue: Health Care 57% (143) 31% (76) 6% (16) 6% (14) 248#1 Issue: Medicare / Social Security 53% (111) 43% (90) 3% (7) — (0) 209#1 Issue: Women’s Issues 59% (66) 28% (31) 7% (8) 5% (6) 111#1 Issue: Education 27% (19) 37% (27) 17% (12) 19% (14) 72#1 Issue: Energy 46% (41) 40% (36) 13% (12) 1% (0) 90#1 Issue: Other 40% (47) 50% (58) 9% (10) 1% (1) 1172020 Vote: Joe Biden 66% (624) 24% (223) 7% (69) 3% (30) 9462020 Vote: Donald Trump 4% (32) 93% (802) 3% (24) 1% (6) 8642020 Vote: Didn’t Vote 20% (30) 45% (69) 24% (37) 11% (17) 1532018 House Vote: Democrat 67% (494) 26% (193) 4% (33) 2% (14) 7342018 House Vote: Republican 6% (45) 90% (650) 2% (16) 1% (8) 7192018 House Vote: Someone else 16% (8) 66% (35) 18% (9) 1% (0) 532016 Vote: Hillary Clinton 70% (491) 23% (164) 5% (37) 2% (14) 7062016 Vote: Donald Trump 6% (49) 90% (722) 3% (26) 1% (9) 8052016 Vote: Other 36% (31) 56% (49) 7% (6) 1% (1) 872016 Vote: Didn’t Vote 29% (116) 46% (182) 18% (71) 7% (30) 399Voted in 2014: Yes 38% (502) 58% (767) 3% (40) 1% (14) 1324Voted in 2014: No 28% (185) 52% (351) 15% (99) 6% (39) 674
Continued on next page

National Tracking Poll #2110009, October, 2021
223
Table POLx_2
Table POLx_2: Favorability forNancy Pelosi
Demographic Total Favorable Total UnfavorableHeard Of, NoOpinion Never Heard Of Total N
Registered Voters 34% (688) 56% (1118) 7% (139) 3% (53) 19984-Region: Northeast 39% (137) 54% (190) 6% (21) 2% (6) 3534-Region: Midwest 31% (136) 61% (272) 6% (28) 2% (9) 4444-Region: South 32% (240) 57% (428) 7% (53) 3% (26) 7464-Region: West 39% (175) 50% (229) 8% (38) 3% (13) 455Party: Democrat/Leans Democrat 67% (584) 23% (200) 7% (63) 3% (30) 877Party: Republican/Leans Republican 7% (58) 89% (732) 3% (24) 1% (8) 822Note: Row proportions may total to larger than one-hundred percent due to rounding. For more information visit MorningConsultIntelligence.com.

224
Morning ConsultTable POLx_3
Table POLx_3: Favorability forCharles Schumer
Demographic Total Favorable Total UnfavorableHeard Of, NoOpinion Never Heard Of Total N
Registered Voters 29% (574) 43% (856) 19% (371) 10% (198) 1998Gender: Male 31% (293) 49% (458) 12% (116) 8% (76) 942Gender: Female 27% (281) 38% (398) 24% (255) 12% (122) 1056Age: 18-34 19% (98) 32% (164) 27% (140) 22% (113) 514Age: 35-44 30% (93) 33% (100) 20% (61) 17% (53) 307Age: 45-64 30% (202) 51% (345) 16% (107) 4% (24) 679Age: 65+ 36% (180) 50% (247) 13% (63) 1% (7) 497GenZers: 1997-2012 7% (10) 20% (30) 38% (56) 35% (52) 148Millennials: 1981-1996 26% (147) 35% (195) 20% (113) 18% (101) 556GenXers: 1965-1980 29% (135) 43% (201) 22% (105) 6% (28) 468Baby Boomers: 1946-1964 33% (241) 53% (381) 12% (84) 2% (17) 723PID: Dem (no lean) 55% (406) 22% (160) 14% (103) 10% (75) 745PID: Ind (no lean) 20% (110) 43% (241) 26% (144) 12% (65) 559PID: Rep (no lean) 8% (57) 66% (455) 18% (124) 8% (58) 694PID/Gender: DemMen 55% (195) 26% (94) 10% (35) 9% (31) 355PID/Gender: DemWomen 54% (211) 17% (66) 18% (68) 11% (44) 390PID/Gender: Ind Men 23% (67) 50% (144) 17% (48) 10% (29) 288PID/Gender: Ind Women 16% (43) 36% (96) 35% (96) 13% (36) 271PID/Gender: Rep Men 10% (31) 73% (219) 11% (33) 5% (16) 299PID/Gender: Rep Women 7% (26) 60% (236) 23% (91) 11% (42) 395Ideo: Liberal (1-3) 62% (343) 20% (110) 11% (60) 7% (40) 553Ideo: Moderate (4) 29% (155) 34% (184) 24% (130) 13% (69) 538Ideo: Conservative (5-7) 9% (69) 69% (544) 17% (137) 5% (43) 793Educ: < College 23% (283) 43% (517) 22% (268) 11% (138) 1206Educ: Bachelors degree 33% (165) 45% (226) 14% (70) 8% (40) 501Educ: Post-grad 43% (126) 39% (112) 11% (32) 7% (20) 290Income: Under 50k 26% (225) 40% (353) 23% (201) 12% (102) 882Income: 50k-100k 29% (210) 47% (337) 15% (112) 9% (65) 723Income: 100k+ 35% (139) 42% (166) 15% (58) 8% (30) 392Ethnicity: White 27% (415) 47% (726) 18% (277) 8% (128) 1545Ethnicity: Hispanic 24% (54) 38% (83) 21% (47) 17% (38) 222
Continued on next page
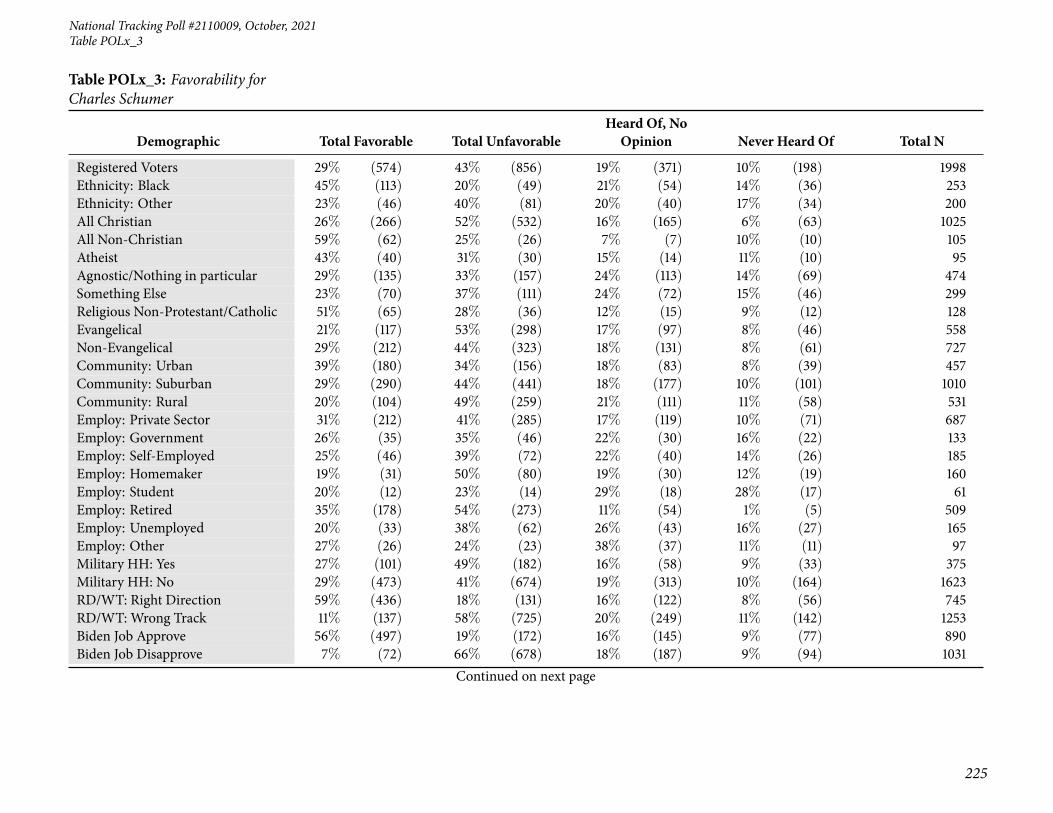
National Tracking Poll #2110009, October, 2021
225
Table POLx_3
Table POLx_3: Favorability forCharles Schumer
Demographic Total Favorable Total UnfavorableHeard Of, NoOpinion Never Heard Of Total N
Registered Voters 29% (574) 43% (856) 19% (371) 10% (198) 1998Ethnicity: Black 45% (113) 20% (49) 21% (54) 14% (36) 253Ethnicity: Other 23% (46) 40% (81) 20% (40) 17% (34) 200All Christian 26% (266) 52% (532) 16% (165) 6% (63) 1025All Non-Christian 59% (62) 25% (26) 7% (7) 10% (10) 105Atheist 43% (40) 31% (30) 15% (14) 11% (10) 95Agnostic/Nothing in particular 29% (135) 33% (157) 24% (113) 14% (69) 474Something Else 23% (70) 37% (111) 24% (72) 15% (46) 299Religious Non-Protestant/Catholic 51% (65) 28% (36) 12% (15) 9% (12) 128Evangelical 21% (117) 53% (298) 17% (97) 8% (46) 558Non-Evangelical 29% (212) 44% (323) 18% (131) 8% (61) 727Community: Urban 39% (180) 34% (156) 18% (83) 8% (39) 457Community: Suburban 29% (290) 44% (441) 18% (177) 10% (101) 1010Community: Rural 20% (104) 49% (259) 21% (111) 11% (58) 531Employ: Private Sector 31% (212) 41% (285) 17% (119) 10% (71) 687Employ: Government 26% (35) 35% (46) 22% (30) 16% (22) 133Employ: Self-Employed 25% (46) 39% (72) 22% (40) 14% (26) 185Employ: Homemaker 19% (31) 50% (80) 19% (30) 12% (19) 160Employ: Student 20% (12) 23% (14) 29% (18) 28% (17) 61Employ: Retired 35% (178) 54% (273) 11% (54) 1% (5) 509Employ: Unemployed 20% (33) 38% (62) 26% (43) 16% (27) 165Employ: Other 27% (26) 24% (23) 38% (37) 11% (11) 97Military HH: Yes 27% (101) 49% (182) 16% (58) 9% (33) 375Military HH: No 29% (473) 41% (674) 19% (313) 10% (164) 1623RD/WT: Right Direction 59% (436) 18% (131) 16% (122) 8% (56) 745RD/WT: Wrong Track 11% (137) 58% (725) 20% (249) 11% (142) 1253Biden Job Approve 56% (497) 19% (172) 16% (145) 9% (77) 890Biden Job Disapprove 7% (72) 66% (678) 18% (187) 9% (94) 1031
Continued on next page

226
Morning ConsultTable POLx_3
Table POLx_3: Favorability forCharles Schumer
Demographic Total Favorable Total UnfavorableHeard Of, NoOpinion Never Heard Of Total N
Registered Voters 29% (574) 43% (856) 19% (371) 10% (198) 1998Biden Job Strongly Approve 66% (295) 12% (55) 14% (64) 7% (33) 446Biden Job Somewhat Approve 46% (202) 26% (116) 18% (81) 10% (44) 444Biden Job Somewhat Disapprove 15% (37) 42% (105) 28% (70) 15% (37) 250Biden Job Strongly Disapprove 4% (35) 73% (573) 15% (117) 7% (56) 781Favorable of Biden 57% (512) 18% (160) 16% (147) 9% (80) 899Unfavorable of Biden 6% (59) 67% (690) 18% (187) 9% (96) 1032Very Favorable of Biden 67% (315) 13% (59) 12% (57) 8% (39) 470Somewhat Favorable of Biden 46% (196) 24% (101) 21% (90) 10% (41) 429Somewhat Unfavorable of Biden 14% (35) 42% (104) 28% (70) 15% (38) 246Very Unfavorable of Biden 3% (24) 75% (586) 15% (117) 7% (58) 786#1 Issue: Economy 25% (188) 44% (324) 21% (157) 10% (74) 742#1 Issue: Security 11% (46) 69% (281) 15% (61) 5% (21) 409#1 Issue: Health Care 43% (106) 22% (55) 23% (57) 12% (30) 248#1 Issue: Medicare / Social Security 46% (96) 37% (77) 15% (31) 2% (5) 209#1 Issue: Women’s Issues 45% (49) 22% (24) 12% (13) 21% (24) 111#1 Issue: Education 21% (15) 27% (19) 22% (16) 30% (22) 72#1 Issue: Energy 40% (36) 29% (26) 19% (17) 12% (11) 90#1 Issue: Other 32% (37) 41% (49) 17% (19) 10% (12) 1172020 Vote: Joe Biden 53% (503) 21% (199) 16% (154) 10% (90) 9462020 Vote: Donald Trump 6% (51) 70% (602) 18% (151) 7% (60) 8642020 Vote: Didn’t Vote 11% (16) 26% (40) 37% (57) 26% (40) 1532018 House Vote: Democrat 57% (415) 23% (170) 13% (99) 7% (50) 7342018 House Vote: Republican 8% (59) 71% (513) 15% (107) 5% (39) 7192018 House Vote: Someone else 3% (2) 51% (27) 30% (16) 15% (8) 532016 Vote: Hillary Clinton 59% (413) 20% (144) 15% (103) 6% (45) 7062016 Vote: Donald Trump 8% (66) 70% (560) 17% (138) 5% (41) 8052016 Vote: Other 30% (26) 48% (42) 11% (10) 11% (9) 872016 Vote: Didn’t Vote 17% (67) 27% (109) 30% (120) 26% (102) 399Voted in 2014: Yes 33% (433) 48% (641) 13% (177) 6% (73) 1324Voted in 2014: No 21% (141) 32% (214) 29% (194) 19% (125) 674
Continued on next page

National Tracking Poll #2110009, October, 2021
227
Table POLx_3
Table POLx_3: Favorability forCharles Schumer
Demographic Total Favorable Total UnfavorableHeard Of, NoOpinion Never Heard Of Total N
Registered Voters 29% (574) 43% (856) 19% (371) 10% (198) 19984-Region: Northeast 38% (135) 38% (135) 16% (56) 7% (26) 3534-Region: Midwest 25% (110) 48% (214) 18% (80) 9% (40) 4444-Region: South 25% (185) 44% (331) 21% (153) 10% (77) 7464-Region: West 32% (144) 38% (175) 18% (82) 12% (54) 455Party: Democrat/Leans Democrat 54% (470) 21% (181) 16% (138) 10% (88) 877Party: Republican/Leans Republican 8% (69) 66% (539) 18% (144) 9% (70) 822Note: Row proportions may total to larger than one-hundred percent due to rounding. For more information visit MorningConsultIntelligence.com.

228
Morning ConsultTable POLx_4
Table POLx_4: Favorability forMike Pence
Demographic Total Favorable Total UnfavorableHeard Of, NoOpinion Never Heard Of Total N
Registered Voters 39% (787) 48% (961) 10% (190) 3% (60) 1998Gender: Male 39% (370) 49% (464) 8% (79) 3% (29) 942Gender: Female 39% (417) 47% (497) 11% (112) 3% (30) 1056Age: 18-34 27% (140) 49% (253) 17% (89) 6% (32) 514Age: 35-44 35% (107) 49% (149) 11% (34) 5% (17) 307Age: 45-64 44% (297) 46% (314) 9% (58) 1% (10) 679Age: 65+ 49% (243) 49% (245) 2% (9) — (1) 497GenZers: 1997-2012 18% (27) 45% (66) 25% (37) 13% (19) 148Millennials: 1981-1996 34% (187) 48% (269) 13% (72) 5% (28) 556GenXers: 1965-1980 36% (170) 51% (237) 11% (50) 2% (12) 468Baby Boomers: 1946-1964 48% (347) 48% (345) 4% (29) — (2) 723PID: Dem (no lean) 15% (111) 74% (554) 7% (54) 4% (26) 745PID: Ind (no lean) 33% (187) 47% (263) 17% (93) 3% (16) 559PID: Rep (no lean) 71% (489) 21% (144) 6% (44) 2% (17) 694PID/Gender: DemMen 18% (65) 69% (245) 8% (30) 4% (15) 355PID/Gender: DemWomen 12% (46) 79% (308) 6% (24) 3% (12) 390PID/Gender: Ind Men 33% (94) 51% (148) 13% (37) 3% (8) 288PID/Gender: Ind Women 34% (92) 43% (115) 20% (55) 3% (8) 271PID/Gender: Rep Men 71% (211) 24% (71) 4% (11) 2% (6) 299PID/Gender: Rep Women 71% (279) 19% (73) 8% (33) 3% (11) 395Ideo: Liberal (1-3) 11% (59) 83% (457) 4% (25) 2% (11) 553Ideo: Moderate (4) 32% (171) 53% (285) 12% (65) 3% (18) 538Ideo: Conservative (5-7) 68% (541) 23% (185) 8% (61) 1% (6) 793Educ: < College 37% (446) 47% (569) 12% (147) 4% (44) 1206Educ: Bachelors degree 44% (222) 47% (238) 6% (30) 2% (12) 501Educ: Post-grad 41% (119) 53% (154) 5% (14) 1% (3) 290Income: Under 50k 34% (304) 48% (420) 13% (116) 5% (42) 882Income: 50k-100k 41% (299) 50% (360) 7% (49) 2% (15) 723Income: 100k+ 47% (184) 46% (181) 6% (25) 1% (3) 392Ethnicity: White 45% (691) 45% (697) 9% (132) 2% (25) 1545Ethnicity: Hispanic 32% (72) 44% (97) 17% (37) 7% (16) 222
Continued on next page

National Tracking Poll #2110009, October, 2021
229
Table POLx_4
Table POLx_4: Favorability forMike Pence
Demographic Total Favorable Total UnfavorableHeard Of, NoOpinion Never Heard Of Total N
Registered Voters 39% (787) 48% (961) 10% (190) 3% (60) 1998Ethnicity: Black 17% (43) 62% (157) 13% (33) 8% (19) 253Ethnicity: Other 26% (53) 53% (107) 13% (26) 8% (15) 200All Christian 52% (533) 40% (406) 7% (70) 2% (16) 1025All Non-Christian 21% (22) 69% (73) 3% (3) 6% (7) 105Atheist 15% (15) 72% (68) 9% (8) 4% (4) 95Agnostic/Nothing in particular 24% (113) 60% (282) 13% (60) 4% (19) 474Something Else 35% (104) 44% (132) 17% (49) 5% (14) 299Religious Non-Protestant/Catholic 29% (38) 61% (77) 4% (6) 6% (7) 128Evangelical 54% (304) 32% (181) 11% (60) 2% (13) 558Non-Evangelical 43% (310) 47% (344) 8% (56) 2% (17) 727Community: Urban 32% (148) 57% (260) 8% (38) 3% (12) 457Community: Suburban 40% (404) 48% (483) 9% (96) 3% (27) 1010Community: Rural 44% (235) 41% (218) 11% (57) 4% (21) 531Employ: Private Sector 39% (270) 47% (326) 9% (63) 4% (27) 687Employ: Government 46% (61) 44% (58) 8% (11) 2% (3) 133Employ: Self-Employed 36% (67) 45% (83) 15% (27) 4% (8) 185Employ: Homemaker 41% (66) 47% (76) 8% (12) 4% (7) 160Employ: Student 10% (6) 63% (38) 21% (13) 7% (4) 61Employ: Retired 46% (236) 51% (259) 3% (13) — (1) 509Employ: Unemployed 28% (45) 48% (79) 22% (36) 3% (5) 165Employ: Other 37% (36) 43% (42) 16% (15) 4% (4) 97Military HH: Yes 47% (177) 42% (157) 6% (23) 5% (18) 375Military HH: No 38% (610) 50% (804) 10% (167) 3% (41) 1623RD/WT: Right Direction 22% (163) 67% (498) 8% (57) 4% (27) 745RD/WT: Wrong Track 50% (624) 37% (463) 11% (134) 3% (32) 1253Biden Job Approve 20% (175) 71% (629) 7% (59) 3% (27) 890Biden Job Disapprove 58% (602) 30% (314) 9% (96) 2% (19) 1031
Continued on next page

230
Morning ConsultTable POLx_4
Table POLx_4: Favorability forMike Pence
Demographic Total Favorable Total UnfavorableHeard Of, NoOpinion Never Heard Of Total N
Registered Voters 39% (787) 48% (961) 10% (190) 3% (60) 1998Biden Job Strongly Approve 18% (82) 71% (318) 8% (34) 3% (13) 446Biden Job Somewhat Approve 21% (93) 70% (311) 6% (25) 3% (14) 444Biden Job Somewhat Disapprove 34% (84) 47% (118) 15% (38) 4% (10) 250Biden Job Strongly Disapprove 66% (518) 25% (197) 7% (58) 1% (9) 781Favorable of Biden 18% (165) 71% (640) 7% (63) 3% (31) 899Unfavorable of Biden 59% (611) 30% (309) 9% (93) 2% (19) 1032Very Favorable of Biden 17% (79) 73% (345) 5% (26) 4% (20) 470Somewhat Favorable of Biden 20% (86) 69% (295) 9% (38) 2% (11) 429Somewhat Unfavorable of Biden 38% (95) 43% (105) 14% (36) 4% (10) 246Very Unfavorable of Biden 66% (517) 26% (204) 7% (58) 1% (8) 786#1 Issue: Economy 41% (302) 45% (335) 12% (88) 2% (17) 742#1 Issue: Security 65% (267) 25% (104) 8% (33) 1% (6) 409#1 Issue: Health Care 20% (49) 64% (158) 10% (25) 6% (15) 248#1 Issue: Medicare / Social Security 39% (81) 55% (115) 5% (10) 1% (2) 209#1 Issue: Women’s Issues 14% (16) 71% (79) 9% (10) 5% (5) 111#1 Issue: Education 30% (22) 47% (34) 11% (8) 11% (8) 72#1 Issue: Energy 26% (23) 67% (60) 5% (4) 3% (3) 90#1 Issue: Other 23% (27) 64% (75) 10% (11) 3% (4) 1172020 Vote: Joe Biden 16% (149) 73% (689) 8% (76) 3% (32) 9462020 Vote: Donald Trump 69% (593) 23% (200) 7% (63) 1% (7) 8642020 Vote: Didn’t Vote 22% (34) 33% (50) 32% (49) 13% (20) 1532018 House Vote: Democrat 17% (124) 75% (548) 7% (50) 2% (12) 7342018 House Vote: Republican 69% (497) 24% (173) 6% (40) 1% (10) 7192018 House Vote: Someone else 20% (10) 58% (31) 22% (12) — (0) 532016 Vote: Hillary Clinton 14% (100) 77% (541) 7% (48) 2% (17) 7062016 Vote: Donald Trump 69% (556) 23% (182) 7% (58) 1% (9) 8052016 Vote: Other 29% (25) 62% (54) 6% (6) 3% (2) 872016 Vote: Didn’t Vote 27% (107) 46% (182) 20% (79) 8% (31) 399Voted in 2014: Yes 43% (572) 49% (652) 6% (82) 1% (18) 1324Voted in 2014: No 32% (215) 46% (309) 16% (109) 6% (41) 674
Continued on next page

National Tracking Poll #2110009, October, 2021
231
Table POLx_4
Table POLx_4: Favorability forMike Pence
Demographic Total Favorable Total UnfavorableHeard Of, NoOpinion Never Heard Of Total N
Registered Voters 39% (787) 48% (961) 10% (190) 3% (60) 19984-Region: Northeast 41% (144) 47% (167) 8% (30) 3% (12) 3534-Region: Midwest 43% (190) 47% (210) 9% (38) 1% (6) 4444-Region: South 40% (295) 47% (347) 11% (81) 3% (23) 7464-Region: West 35% (158) 52% (236) 9% (42) 4% (19) 455Party: Democrat/Leans Democrat 14% (124) 75% (654) 8% (72) 3% (27) 877Party: Republican/Leans Republican 70% (575) 22% (180) 6% (49) 2% (17) 822Note: Row proportions may total to larger than one-hundred percent due to rounding. For more information visit MorningConsultIntelligence.com.

232
Morning ConsultTable POLx_5
Table POLx_5: Favorability forDonald Trump
Demographic Total Favorable Total UnfavorableHeard Of, NoOpinion Never Heard Of Total N
Registered Voters 43% (853) 54% (1075) 3% (63) — (8) 1998Gender: Male 45% (427) 52% (488) 3% (24) — (3) 942Gender: Female 40% (426) 56% (587) 4% (38) 1% (5) 1056Age: 18-34 41% (213) 52% (267) 5% (28) 1% (6) 514Age: 35-44 42% (129) 52% (158) 6% (18) 1% (2) 307Age: 45-64 46% (311) 52% (356) 2% (13) — (0) 679Age: 65+ 40% (199) 59% (294) 1% (4) — (0) 497GenZers: 1997-2012 33% (50) 57% (84) 8% (11) 2% (3) 148Millennials: 1981-1996 44% (247) 49% (271) 6% (33) 1% (5) 556GenXers: 1965-1980 42% (196) 56% (260) 2% (11) — (0) 468Baby Boomers: 1946-1964 44% (321) 55% (395) 1% (7) — (0) 723PID: Dem (no lean) 8% (58) 89% (660) 3% (20) 1% (7) 745PID: Ind (no lean) 42% (235) 51% (287) 6% (36) — (1) 559PID: Rep (no lean) 81% (560) 18% (127) 1% (7) — (0) 694PID/Gender: DemMen 14% (48) 83% (294) 3% (11) — (1) 355PID/Gender: DemWomen 2% (9) 94% (366) 2% (9) 1% (5) 390PID/Gender: Ind Men 45% (130) 50% (144) 5% (13) — (1) 288PID/Gender: Ind Women 39% (105) 53% (144) 8% (22) — (0) 271PID/Gender: Rep Men 83% (249) 17% (49) — (0) — (0) 299PID/Gender: Rep Women 79% (311) 20% (78) 2% (7) — (0) 395Ideo: Liberal (1-3) 9% (50) 89% (491) 1% (8) 1% (3) 553Ideo: Moderate (4) 30% (161) 66% (354) 4% (24) — (0) 538Ideo: Conservative (5-7) 76% (600) 23% (181) 1% (11) — (0) 793Educ: < College 46% (552) 50% (600) 4% (49) — (5) 1206Educ: Bachelors degree 40% (201) 57% (288) 2% (10) 1% (3) 501Educ: Post-grad 34% (99) 64% (186) 2% (5) — (0) 290Income: Under 50k 39% (343) 56% (492) 5% (43) 1% (5) 882Income: 50k-100k 50% (358) 49% (355) 1% (9) — (2) 723Income: 100k+ 39% (151) 58% (228) 3% (11) — (1) 392Ethnicity: White 47% (729) 50% (777) 2% (36) — (3) 1545Ethnicity: Hispanic 40% (88) 51% (113) 8% (18) 1% (3) 222
Continued on next page

National Tracking Poll #2110009, October, 2021
233
Table POLx_5
Table POLx_5: Favorability forDonald Trump
Demographic Total Favorable Total UnfavorableHeard Of, NoOpinion Never Heard Of Total N
Registered Voters 43% (853) 54% (1075) 3% (63) — (8) 1998Ethnicity: Black 16% (40) 77% (196) 6% (16) 1% (2) 253Ethnicity: Other 42% (84) 51% (102) 6% (11) 2% (3) 200All Christian 48% (488) 50% (513) 2% (22) — (2) 1025All Non-Christian 20% (21) 75% (79) 2% (2) 3% (3) 105Atheist 25% (24) 71% (67) 4% (4) — (0) 95Agnostic/Nothing in particular 37% (177) 58% (275) 4% (20) 1% (3) 474Something Else 48% (143) 47% (140) 5% (15) — (1) 299Religious Non-Protestant/Catholic 29% (37) 67% (85) 2% (2) 2% (3) 128Evangelical 57% (317) 40% (225) 3% (15) — (1) 558Non-Evangelical 39% (286) 57% (418) 3% (22) — (2) 727Community: Urban 37% (167) 60% (275) 3% (12) 1% (3) 457Community: Suburban 40% (404) 56% (566) 4% (36) — (4) 1010Community: Rural 53% (281) 44% (234) 3% (15) — (2) 531Employ: Private Sector 43% (295) 54% (370) 3% (18) 1% (4) 687Employ: Government 50% (66) 48% (64) 2% (3) — (0) 133Employ: Self-Employed 50% (92) 43% (80) 6% (11) 1% (1) 185Employ: Homemaker 50% (80) 48% (76) 3% (4) — (0) 160Employ: Student 27% (17) 65% (40) 7% (4) 1% (1) 61Employ: Retired 40% (202) 59% (301) 1% (6) — (0) 509Employ: Unemployed 39% (65) 51% (84) 10% (16) — (0) 165Employ: Other 37% (36) 61% (59) 1% (1) 2% (2) 97Military HH: Yes 47% (178) 48% (179) 5% (18) — (0) 375Military HH: No 42% (675) 55% (895) 3% (45) 1% (8) 1623RD/WT: Right Direction 13% (93) 84% (624) 3% (23) 1% (5) 745RD/WT: Wrong Track 61% (759) 36% (450) 3% (40) — (3) 1253Biden Job Approve 10% (85) 88% (779) 2% (21) 1% (5) 890Biden Job Disapprove 73% (751) 25% (261) 2% (19) — (0) 1031
Continued on next page

234
Morning ConsultTable POLx_5
Table POLx_5: Favorability forDonald Trump
Demographic Total Favorable Total UnfavorableHeard Of, NoOpinion Never Heard Of Total N
Registered Voters 43% (853) 54% (1075) 3% (63) — (8) 1998Biden Job Strongly Approve 8% (36) 88% (391) 3% (15) 1% (5) 446Biden Job Somewhat Approve 11% (50) 88% (388) 1% (5) — (0) 444Biden Job Somewhat Disapprove 40% (101) 54% (135) 6% (14) — (0) 250Biden Job Strongly Disapprove 83% (650) 16% (126) 1% (5) — (0) 781Favorable of Biden 8% (76) 89% (796) 2% (22) 1% (5) 899Unfavorable of Biden 74% (765) 25% (257) 1% (11) — (0) 1032Very Favorable of Biden 6% (29) 90% (424) 3% (12) 1% (5) 470Somewhat Favorable of Biden 11% (47) 87% (372) 2% (10) — (0) 429Somewhat Unfavorable of Biden 43% (107) 55% (135) 2% (4) — (0) 246Very Unfavorable of Biden 84% (658) 15% (121) 1% (7) — (0) 786#1 Issue: Economy 44% (327) 52% (387) 3% (26) — (3) 742#1 Issue: Security 77% (314) 22% (89) 1% (6) — (0) 409#1 Issue: Health Care 16% (41) 77% (192) 6% (14) 1% (1) 248#1 Issue: Medicare / Social Security 31% (64) 67% (139) 2% (3) 1% (2) 209#1 Issue: Women’s Issues 13% (15) 85% (95) 1% (1) — (0) 111#1 Issue: Education 44% (32) 47% (34) 9% (6) 1% (1) 72#1 Issue: Energy 25% (23) 70% (63) 5% (4) — (0) 90#1 Issue: Other 32% (37) 65% (76) 2% (2) 1% (1) 1172020 Vote: Joe Biden 6% (60) 90% (849) 3% (30) 1% (7) 9462020 Vote: Donald Trump 84% (727) 15% (126) 1% (11) — (0) 8642020 Vote: Didn’t Vote 39% (59) 49% (75) 11% (17) 1% (1) 1532018 House Vote: Democrat 9% (67) 88% (647) 2% (18) — (2) 7342018 House Vote: Republican 77% (555) 22% (159) 1% (5) — (0) 7192018 House Vote: Someone else 38% (20) 52% (28) 10% (6) — (0) 532016 Vote: Hillary Clinton 7% (48) 90% (634) 3% (20) — (3) 7062016 Vote: Donald Trump 79% (637) 20% (159) 1% (9) — (0) 8052016 Vote: Other 16% (14) 82% (71) 2% (2) — (0) 872016 Vote: Didn’t Vote 38% (152) 53% (210) 8% (32) 1% (5) 399Voted in 2014: Yes 43% (563) 56% (735) 2% (23) — (2) 1324Voted in 2014: No 43% (289) 50% (339) 6% (39) 1% (6) 674
Continued on next page
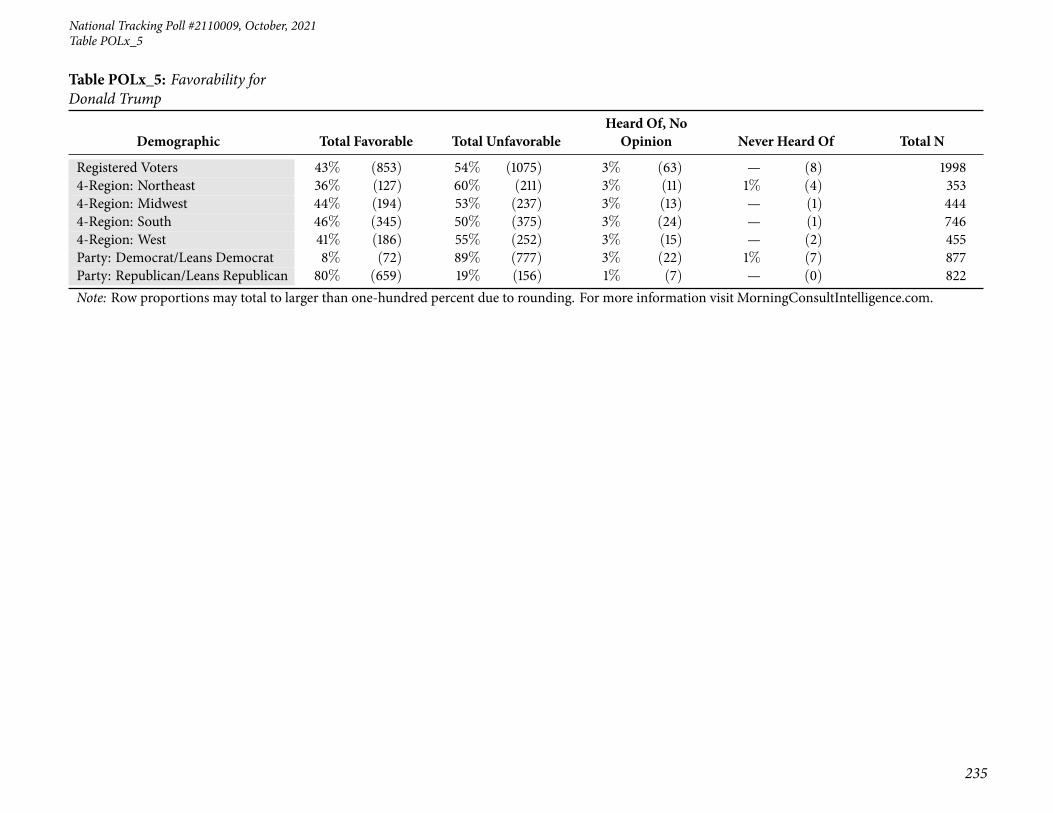
National Tracking Poll #2110009, October, 2021
235
Table POLx_5
Table POLx_5: Favorability forDonald Trump
Demographic Total Favorable Total UnfavorableHeard Of, NoOpinion Never Heard Of Total N
Registered Voters 43% (853) 54% (1075) 3% (63) — (8) 19984-Region: Northeast 36% (127) 60% (211) 3% (11) 1% (4) 3534-Region: Midwest 44% (194) 53% (237) 3% (13) — (1) 4444-Region: South 46% (345) 50% (375) 3% (24) — (1) 7464-Region: West 41% (186) 55% (252) 3% (15) — (2) 455Party: Democrat/Leans Democrat 8% (72) 89% (777) 3% (22) 1% (7) 877Party: Republican/Leans Republican 80% (659) 19% (156) 1% (7) — (0) 822Note: Row proportions may total to larger than one-hundred percent due to rounding. For more information visit MorningConsultIntelligence.com.

236
Morning ConsultTable POLx_6
Table POLx_6: Favorability forRepublicans in Congress
Demographic Total Favorable Total UnfavorableHeard Of, NoOpinion Never Heard Of Total N
Registered Voters 37% (729) 55% (1105) 7% (131) 2% (32) 1998Gender: Male 36% (344) 57% (540) 5% (46) 1% (12) 942Gender: Female 37% (386) 54% (566) 8% (85) 2% (20) 1056Age: 18-34 32% (167) 50% (260) 13% (65) 4% (23) 514Age: 35-44 39% (121) 51% (156) 8% (23) 2% (7) 307Age: 45-64 38% (256) 56% (384) 6% (38) — (2) 679Age: 65+ 37% (186) 62% (306) 1% (5) — (0) 497GenZers: 1997-2012 25% (37) 49% (73) 17% (25) 9% (13) 148Millennials: 1981-1996 38% (211) 50% (276) 10% (55) 2% (13) 556GenXers: 1965-1980 36% (168) 56% (260) 7% (34) 1% (5) 468Baby Boomers: 1946-1964 38% (273) 60% (436) 2% (14) — (0) 723PID: Dem (no lean) 10% (76) 82% (612) 6% (41) 2% (15) 745PID: Ind (no lean) 24% (134) 60% (334) 14% (76) 3% (15) 559PID: Rep (no lean) 75% (519) 23% (159) 2% (14) — (1) 694PID/Gender: DemMen 13% (47) 81% (286) 5% (17) 1% (5) 355PID/Gender: DemWomen 8% (29) 84% (326) 6% (24) 3% (11) 390PID/Gender: Ind Men 23% (66) 66% (190) 9% (25) 3% (8) 288PID/Gender: Ind Women 25% (68) 53% (144) 19% (51) 3% (7) 271PID/Gender: Rep Men 77% (231) 21% (64) 1% (4) — (0) 299PID/Gender: Rep Women 73% (288) 24% (96) 3% (10) — (1) 395Ideo: Liberal (1-3) 9% (49) 86% (477) 4% (20) 1% (6) 553Ideo: Moderate (4) 25% (135) 64% (346) 9% (48) 2% (8) 538Ideo: Conservative (5-7) 66% (526) 30% (238) 3% (27) — (2) 793Educ: < College 39% (467) 51% (621) 8% (92) 2% (26) 1206Educ: Bachelors degree 34% (172) 60% (300) 5% (24) 1% (5) 501Educ: Post-grad 31% (90) 64% (185) 5% (15) — (1) 290Income: Under 50k 34% (300) 56% (491) 8% (70) 2% (21) 882Income: 50k-100k 41% (293) 54% (391) 4% (32) 1% (7) 723Income: 100k+ 35% (136) 57% (224) 7% (29) 1% (4) 392Ethnicity: White 41% (635) 53% (822) 5% (78) 1% (11) 1545Ethnicity: Hispanic 33% (74) 50% (110) 12% (28) 5% (11) 222
Continued on next page

National Tracking Poll #2110009, October, 2021
237
Table POLx_6
Table POLx_6: Favorability forRepublicans in Congress
Demographic Total Favorable Total UnfavorableHeard Of, NoOpinion Never Heard Of Total N
Registered Voters 37% (729) 55% (1105) 7% (131) 2% (32) 1998Ethnicity: Black 13% (33) 71% (179) 12% (31) 4% (9) 253Ethnicity: Other 31% (62) 52% (104) 11% (23) 6% (12) 200All Christian 44% (448) 51% (527) 4% (46) — (4) 1025All Non-Christian 16% (17) 76% (80) 5% (5) 3% (3) 105Atheist 25% (23) 72% (68) 2% (2) 1% (1) 95Agnostic/Nothing in particular 29% (135) 61% (290) 8% (37) 3% (12) 474Something Else 35% (105) 47% (140) 14% (42) 4% (12) 299Religious Non-Protestant/Catholic 25% (32) 67% (86) 6% (8) 2% (3) 128Evangelical 50% (279) 40% (225) 8% (45) 2% (8) 558Non-Evangelical 34% (248) 59% (431) 6% (40) 1% (7) 727Community: Urban 31% (143) 62% (284) 5% (21) 2% (9) 457Community: Suburban 36% (359) 55% (556) 8% (78) 2% (17) 1010Community: Rural 43% (227) 50% (265) 6% (33) 1% (6) 531Employ: Private Sector 37% (253) 56% (382) 6% (39) 2% (13) 687Employ: Government 42% (56) 48% (64) 8% (11) 2% (2) 133Employ: Self-Employed 39% (72) 49% (91) 11% (20) 1% (2) 185Employ: Homemaker 40% (64) 52% (83) 6% (10) 2% (4) 160Employ: Student 21% (13) 61% (38) 11% (7) 7% (4) 61Employ: Retired 37% (191) 61% (312) 1% (6) — (0) 509Employ: Unemployed 27% (45) 55% (91) 15% (25) 3% (5) 165Employ: Other 38% (37) 46% (45) 14% (14) 2% (2) 97Military HH: Yes 40% (148) 53% (199) 6% (23) 1% (4) 375Military HH: No 36% (581) 56% (906) 7% (108) 2% (27) 1623RD/WT: Right Direction 16% (119) 76% (569) 6% (41) 2% (16) 745RD/WT: Wrong Track 49% (611) 43% (536) 7% (90) 1% (16) 1253Biden Job Approve 14% (121) 79% (703) 6% (50) 2% (16) 890Biden Job Disapprove 58% (602) 37% (378) 4% (42) 1% (9) 1031
Continued on next page
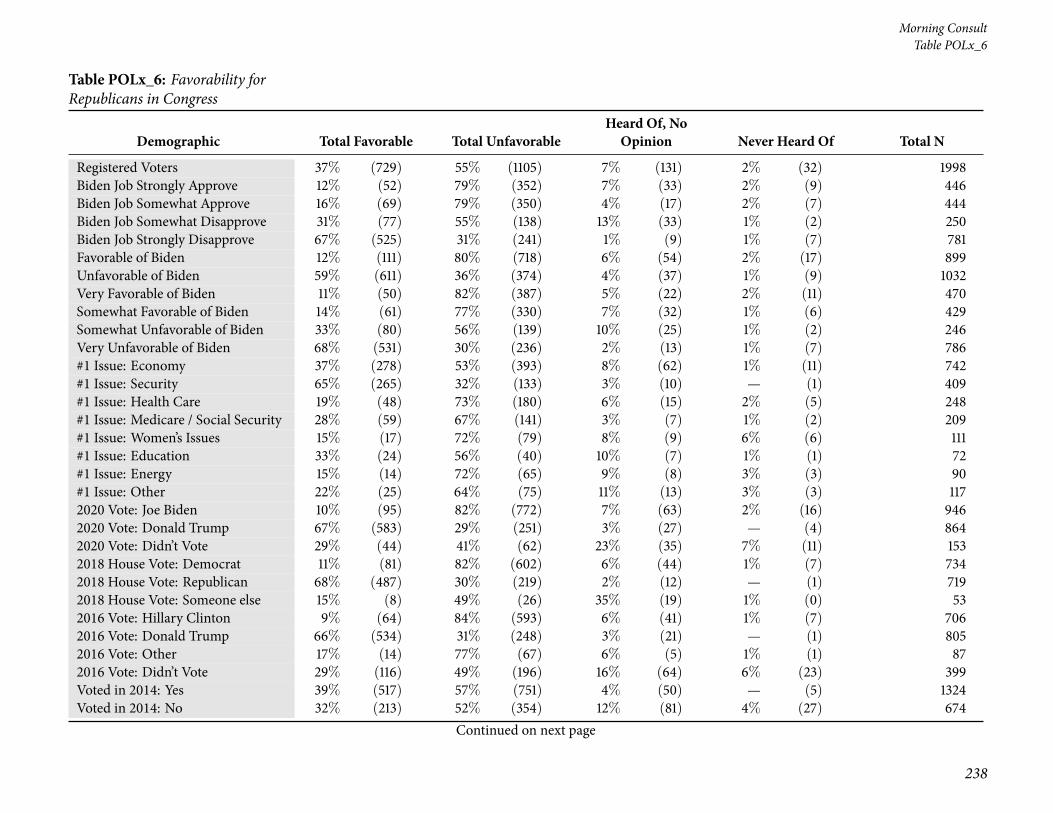
238
Morning ConsultTable POLx_6
Table POLx_6: Favorability forRepublicans in Congress
Demographic Total Favorable Total UnfavorableHeard Of, NoOpinion Never Heard Of Total N
Registered Voters 37% (729) 55% (1105) 7% (131) 2% (32) 1998Biden Job Strongly Approve 12% (52) 79% (352) 7% (33) 2% (9) 446Biden Job Somewhat Approve 16% (69) 79% (350) 4% (17) 2% (7) 444Biden Job Somewhat Disapprove 31% (77) 55% (138) 13% (33) 1% (2) 250Biden Job Strongly Disapprove 67% (525) 31% (241) 1% (9) 1% (7) 781Favorable of Biden 12% (111) 80% (718) 6% (54) 2% (17) 899Unfavorable of Biden 59% (611) 36% (374) 4% (37) 1% (9) 1032Very Favorable of Biden 11% (50) 82% (387) 5% (22) 2% (11) 470Somewhat Favorable of Biden 14% (61) 77% (330) 7% (32) 1% (6) 429Somewhat Unfavorable of Biden 33% (80) 56% (139) 10% (25) 1% (2) 246Very Unfavorable of Biden 68% (531) 30% (236) 2% (13) 1% (7) 786#1 Issue: Economy 37% (278) 53% (393) 8% (62) 1% (11) 742#1 Issue: Security 65% (265) 32% (133) 3% (10) — (1) 409#1 Issue: Health Care 19% (48) 73% (180) 6% (15) 2% (5) 248#1 Issue: Medicare / Social Security 28% (59) 67% (141) 3% (7) 1% (2) 209#1 Issue: Women’s Issues 15% (17) 72% (79) 8% (9) 6% (6) 111#1 Issue: Education 33% (24) 56% (40) 10% (7) 1% (1) 72#1 Issue: Energy 15% (14) 72% (65) 9% (8) 3% (3) 90#1 Issue: Other 22% (25) 64% (75) 11% (13) 3% (3) 1172020 Vote: Joe Biden 10% (95) 82% (772) 7% (63) 2% (16) 9462020 Vote: Donald Trump 67% (583) 29% (251) 3% (27) — (4) 8642020 Vote: Didn’t Vote 29% (44) 41% (62) 23% (35) 7% (11) 1532018 House Vote: Democrat 11% (81) 82% (602) 6% (44) 1% (7) 7342018 House Vote: Republican 68% (487) 30% (219) 2% (12) — (1) 7192018 House Vote: Someone else 15% (8) 49% (26) 35% (19) 1% (0) 532016 Vote: Hillary Clinton 9% (64) 84% (593) 6% (41) 1% (7) 7062016 Vote: Donald Trump 66% (534) 31% (248) 3% (21) — (1) 8052016 Vote: Other 17% (14) 77% (67) 6% (5) 1% (1) 872016 Vote: Didn’t Vote 29% (116) 49% (196) 16% (64) 6% (23) 399Voted in 2014: Yes 39% (517) 57% (751) 4% (50) — (5) 1324Voted in 2014: No 32% (213) 52% (354) 12% (81) 4% (27) 674
Continued on next page

National Tracking Poll #2110009, October, 2021
239
Table POLx_6
Table POLx_6: Favorability forRepublicans in Congress
Demographic Total Favorable Total UnfavorableHeard Of, NoOpinion Never Heard Of Total N
Registered Voters 37% (729) 55% (1105) 7% (131) 2% (32) 19984-Region: Northeast 31% (110) 60% (212) 7% (23) 2% (7) 3534-Region: Midwest 40% (176) 54% (241) 5% (21) 1% (6) 4444-Region: South 40% (299) 52% (386) 7% (50) 2% (12) 7464-Region: West 32% (145) 58% (266) 8% (37) 2% (8) 455Party: Democrat/Leans Democrat 10% (86) 83% (727) 6% (48) 2% (16) 877Party: Republican/Leans Republican 72% (589) 26% (217) 2% (15) — (1) 822Note: Row proportions may total to larger than one-hundred percent due to rounding. For more information visit MorningConsultIntelligence.com.

240
Morning ConsultTable POLx_7
Table POLx_7: Favorability forDemocrats in Congress
Demographic Total Favorable Total UnfavorableHeard Of, NoOpinion Never Heard Of Total N
Registered Voters 42% (845) 50% (1004) 6% (122) 1% (27) 1998Gender: Male 43% (404) 52% (490) 4% (38) 1% (11) 942Gender: Female 42% (441) 49% (514) 8% (84) 2% (16) 1056Age: 18-34 43% (221) 39% (200) 14% (75) 4% (19) 514Age: 35-44 45% (139) 47% (145) 6% (17) 2% (5) 307Age: 45-64 41% (278) 55% (377) 3% (22) — (2) 679Age: 65+ 41% (206) 57% (282) 2% (9) — (0) 497GenZers: 1997-2012 44% (66) 27% (41) 21% (32) 7% (10) 148Millennials: 1981-1996 43% (238) 45% (250) 10% (55) 2% (13) 556GenXers: 1965-1980 47% (219) 48% (226) 4% (19) 1% (4) 468Baby Boomers: 1946-1964 39% (281) 59% (428) 2% (14) — (0) 723PID: Dem (no lean) 85% (633) 11% (79) 3% (24) 1% (9) 745PID: Ind (no lean) 27% (154) 57% (317) 13% (74) 3% (15) 559PID: Rep (no lean) 8% (59) 88% (608) 4% (25) — (2) 694PID/Gender: DemMen 83% (296) 14% (49) 3% (10) — (0) 355PID/Gender: DemWomen 86% (337) 8% (31) 3% (13) 2% (9) 390PID/Gender: Ind Men 30% (85) 60% (173) 7% (21) 3% (9) 288PID/Gender: Ind Women 25% (68) 53% (143) 20% (53) 2% (6) 271PID/Gender: Rep Men 8% (23) 90% (268) 2% (7) 1% (2) 299PID/Gender: Rep Women 9% (36) 86% (340) 5% (18) — (1) 395Ideo: Liberal (1-3) 84% (464) 12% (68) 3% (17) 1% (3) 553Ideo: Moderate (4) 48% (256) 43% (232) 8% (46) 1% (5) 538Ideo: Conservative (5-7) 12% (95) 85% (677) 3% (21) — (0) 793Educ: < College 41% (493) 50% (603) 7% (87) 2% (23) 1206Educ: Bachelors degree 43% (216) 52% (260) 5% (25) — (1) 501Educ: Post-grad 47% (136) 49% (141) 3% (10) 1% (3) 290Income: Under 50k 45% (395) 45% (396) 8% (73) 2% (18) 882Income: 50k-100k 38% (275) 57% (410) 4% (30) 1% (8) 723Income: 100k+ 45% (175) 50% (198) 5% (19) — (0) 392Ethnicity: White 38% (591) 56% (870) 5% (77) 1% (8) 1545Ethnicity: Hispanic 44% (97) 41% (92) 11% (25) 4% (8) 222
Continued on next page

National Tracking Poll #2110009, October, 2021
241
Table POLx_7
Table POLx_7: Favorability forDemocrats in Congress
Demographic Total Favorable Total UnfavorableHeard Of, NoOpinion Never Heard Of Total N
Registered Voters 42% (845) 50% (1004) 6% (122) 1% (27) 1998Ethnicity: Black 71% (179) 18% (45) 8% (20) 4% (9) 253Ethnicity: Other 38% (76) 45% (90) 13% (25) 5% (9) 200All Christian 36% (374) 59% (605) 4% (44) — (2) 1025All Non-Christian 70% (73) 24% (25) 3% (4) 3% (3) 105Atheist 56% (53) 40% (38) 4% (4) — (0) 95Agnostic/Nothing in particular 47% (222) 41% (195) 10% (47) 2% (11) 474Something Else 41% (122) 47% (142) 8% (24) 4% (11) 299Religious Non-Protestant/Catholic 62% (79) 31% (40) 5% (6) 2% (3) 128Evangelical 31% (173) 62% (348) 5% (29) 1% (8) 558Non-Evangelical 43% (314) 51% (372) 5% (37) 1% (5) 727Community: Urban 57% (260) 37% (171) 4% (19) 2% (7) 457Community: Suburban 41% (411) 51% (518) 7% (67) 1% (14) 1010Community: Rural 33% (174) 59% (315) 7% (36) 1% (6) 531Employ: Private Sector 44% (303) 49% (337) 5% (37) 1% (10) 687Employ: Government 40% (53) 53% (71) 5% (6) 3% (3) 133Employ: Self-Employed 41% (77) 50% (93) 7% (13) 1% (2) 185Employ: Homemaker 28% (44) 64% (103) 6% (10) 2% (4) 160Employ: Student 53% (32) 24% (15) 19% (12) 5% (3) 61Employ: Retired 42% (216) 56% (286) 1% (7) — (0) 509Employ: Unemployed 43% (71) 40% (66) 15% (24) 2% (3) 165Employ: Other 51% (49) 34% (34) 13% (13) 2% (2) 97Military HH: Yes 33% (124) 59% (222) 6% (24) 1% (5) 375Military HH: No 44% (721) 48% (782) 6% (98) 1% (22) 1623RD/WT: Right Direction 80% (599) 14% (104) 4% (33) 1% (9) 745RD/WT: Wrong Track 20% (246) 72% (900) 7% (89) 1% (17) 1253Biden Job Approve 80% (717) 15% (132) 4% (33) 1% (9) 890Biden Job Disapprove 12% (121) 83% (860) 4% (42) 1% (9) 1031
Continued on next page

242
Morning ConsultTable POLx_7
Table POLx_7: Favorability forDemocrats in Congress
Demographic Total Favorable Total UnfavorableHeard Of, NoOpinion Never Heard Of Total N
Registered Voters 42% (845) 50% (1004) 6% (122) 1% (27) 1998Biden Job Strongly Approve 89% (399) 7% (30) 3% (12) 1% (5) 446Biden Job Somewhat Approve 71% (317) 23% (102) 5% (21) 1% (4) 444Biden Job Somewhat Disapprove 34% (84) 56% (140) 10% (24) 1% (2) 250Biden Job Strongly Disapprove 5% (37) 92% (720) 2% (18) 1% (7) 781Favorable of Biden 83% (751) 12% (109) 3% (30) 1% (9) 899Unfavorable of Biden 8% (87) 86% (888) 5% (50) 1% (8) 1032Very Favorable of Biden 92% (433) 5% (22) 2% (10) 1% (6) 470Somewhat Favorable of Biden 74% (318) 20% (87) 5% (21) 1% (3) 429Somewhat Unfavorable of Biden 23% (56) 64% (157) 13% (31) 1% (1) 246Very Unfavorable of Biden 4% (30) 93% (731) 2% (18) 1% (7) 786#1 Issue: Economy 39% (293) 53% (391) 7% (52) 1% (7) 742#1 Issue: Security 14% (57) 82% (335) 4% (16) — (1) 409#1 Issue: Health Care 68% (168) 24% (59) 6% (16) 2% (5) 248#1 Issue: Medicare / Social Security 58% (121) 40% (84) 2% (3) — (0) 209#1 Issue: Women’s Issues 68% (75) 19% (22) 7% (8) 5% (6) 111#1 Issue: Education 48% (35) 35% (26) 11% (8) 5% (4) 72#1 Issue: Energy 54% (49) 36% (32) 9% (8) — (0) 90#1 Issue: Other 40% (46) 48% (56) 10% (11) 3% (3) 1172020 Vote: Joe Biden 78% (741) 15% (145) 5% (48) 1% (11) 9462020 Vote: Donald Trump 6% (51) 89% (773) 4% (35) 1% (6) 8642020 Vote: Didn’t Vote 31% (47) 44% (67) 21% (32) 5% (7) 1532018 House Vote: Democrat 78% (576) 17% (126) 4% (29) — (3) 7342018 House Vote: Republican 7% (52) 89% (639) 3% (24) 1% (4) 7192018 House Vote: Someone else 13% (7) 61% (32) 26% (14) — (0) 532016 Vote: Hillary Clinton 80% (562) 16% (110) 4% (28) 1% (5) 7062016 Vote: Donald Trump 10% (79) 86% (696) 3% (26) 1% (4) 8052016 Vote: Other 36% (31) 58% (50) 6% (5) 1% (1) 872016 Vote: Didn’t Vote 43% (172) 37% (147) 16% (63) 4% (17) 399Voted in 2014: Yes 42% (556) 55% (725) 3% (36) 1% (7) 1324Voted in 2014: No 43% (290) 41% (279) 13% (86) 3% (20) 674
Continued on next page

National Tracking Poll #2110009, October, 2021
243
Table POLx_7
Table POLx_7: Favorability forDemocrats in Congress
Demographic Total Favorable Total UnfavorableHeard Of, NoOpinion Never Heard Of Total N
Registered Voters 42% (845) 50% (1004) 6% (122) 1% (27) 19984-Region: Northeast 48% (171) 44% (156) 7% (23) 1% (3) 3534-Region: Midwest 39% (173) 55% (243) 5% (23) 1% (6) 4444-Region: South 39% (291) 54% (404) 5% (40) 1% (10) 7464-Region: West 46% (210) 44% (202) 8% (36) 2% (7) 455Party: Democrat/Leans Democrat 83% (731) 12% (107) 3% (30) 1% (10) 877Party: Republican/Leans Republican 9% (72) 88% (722) 3% (25) — (2) 822Note: Row proportions may total to larger than one-hundred percent due to rounding. For more information visit MorningConsultIntelligence.com.
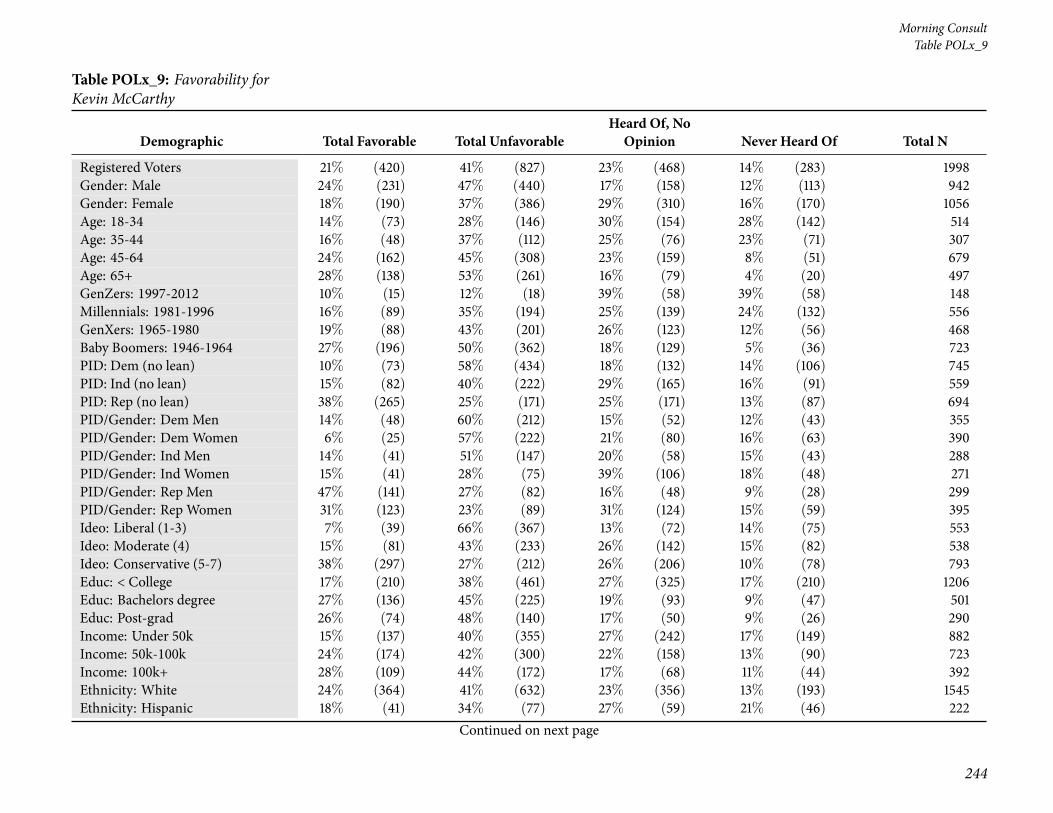
244
Morning ConsultTable POLx_9
Table POLx_9: Favorability forKevin McCarthy
Demographic Total Favorable Total UnfavorableHeard Of, NoOpinion Never Heard Of Total N
Registered Voters 21% (420) 41% (827) 23% (468) 14% (283) 1998Gender: Male 24% (231) 47% (440) 17% (158) 12% (113) 942Gender: Female 18% (190) 37% (386) 29% (310) 16% (170) 1056Age: 18-34 14% (73) 28% (146) 30% (154) 28% (142) 514Age: 35-44 16% (48) 37% (112) 25% (76) 23% (71) 307Age: 45-64 24% (162) 45% (308) 23% (159) 8% (51) 679Age: 65+ 28% (138) 53% (261) 16% (79) 4% (20) 497GenZers: 1997-2012 10% (15) 12% (18) 39% (58) 39% (58) 148Millennials: 1981-1996 16% (89) 35% (194) 25% (139) 24% (132) 556GenXers: 1965-1980 19% (88) 43% (201) 26% (123) 12% (56) 468Baby Boomers: 1946-1964 27% (196) 50% (362) 18% (129) 5% (36) 723PID: Dem (no lean) 10% (73) 58% (434) 18% (132) 14% (106) 745PID: Ind (no lean) 15% (82) 40% (222) 29% (165) 16% (91) 559PID: Rep (no lean) 38% (265) 25% (171) 25% (171) 13% (87) 694PID/Gender: DemMen 14% (48) 60% (212) 15% (52) 12% (43) 355PID/Gender: DemWomen 6% (25) 57% (222) 21% (80) 16% (63) 390PID/Gender: Ind Men 14% (41) 51% (147) 20% (58) 15% (43) 288PID/Gender: Ind Women 15% (41) 28% (75) 39% (106) 18% (48) 271PID/Gender: Rep Men 47% (141) 27% (82) 16% (48) 9% (28) 299PID/Gender: Rep Women 31% (123) 23% (89) 31% (124) 15% (59) 395Ideo: Liberal (1-3) 7% (39) 66% (367) 13% (72) 14% (75) 553Ideo: Moderate (4) 15% (81) 43% (233) 26% (142) 15% (82) 538Ideo: Conservative (5-7) 38% (297) 27% (212) 26% (206) 10% (78) 793Educ: < College 17% (210) 38% (461) 27% (325) 17% (210) 1206Educ: Bachelors degree 27% (136) 45% (225) 19% (93) 9% (47) 501Educ: Post-grad 26% (74) 48% (140) 17% (50) 9% (26) 290Income: Under 50k 15% (137) 40% (355) 27% (242) 17% (149) 882Income: 50k-100k 24% (174) 42% (300) 22% (158) 13% (90) 723Income: 100k+ 28% (109) 44% (172) 17% (68) 11% (44) 392Ethnicity: White 24% (364) 41% (632) 23% (356) 13% (193) 1545Ethnicity: Hispanic 18% (41) 34% (77) 27% (59) 21% (46) 222
Continued on next page

National Tracking Poll #2110009, October, 2021
245
Table POLx_9
Table POLx_9: Favorability forKevin McCarthy
Demographic Total Favorable Total UnfavorableHeard Of, NoOpinion Never Heard Of Total N
Registered Voters 21% (420) 41% (827) 23% (468) 14% (283) 1998Ethnicity: Black 12% (31) 46% (115) 27% (69) 15% (38) 253Ethnicity: Other 13% (26) 40% (79) 21% (43) 26% (52) 200All Christian 28% (290) 41% (421) 21% (214) 10% (100) 1025All Non-Christian 19% (20) 55% (58) 16% (17) 10% (11) 105Atheist 12% (12) 54% (51) 19% (18) 14% (14) 95Agnostic/Nothing in particular 13% (59) 42% (198) 27% (126) 19% (90) 474Something Else 13% (40) 33% (99) 31% (92) 23% (69) 299Religious Non-Protestant/Catholic 20% (26) 49% (63) 21% (26) 10% (13) 128Evangelical 30% (170) 31% (173) 25% (139) 14% (76) 558Non-Evangelical 20% (144) 46% (336) 22% (157) 12% (91) 727Community: Urban 23% (104) 43% (196) 19% (88) 15% (69) 457Community: Suburban 20% (200) 44% (445) 23% (235) 13% (129) 1010Community: Rural 22% (116) 35% (186) 27% (144) 16% (86) 531Employ: Private Sector 23% (158) 41% (280) 20% (138) 16% (110) 687Employ: Government 19% (26) 37% (49) 24% (32) 19% (26) 133Employ: Self-Employed 22% (40) 35% (65) 28% (52) 15% (28) 185Employ: Homemaker 16% (25) 37% (59) 31% (50) 16% (26) 160Employ: Student 5% (3) 30% (19) 31% (19) 34% (21) 61Employ: Retired 27% (140) 52% (266) 16% (81) 4% (22) 509Employ: Unemployed 10% (17) 33% (54) 35% (57) 22% (37) 165Employ: Other 11% (11) 35% (34) 40% (39) 14% (14) 97Military HH: Yes 22% (81) 40% (152) 24% (89) 14% (52) 375Military HH: No 21% (339) 42% (675) 23% (379) 14% (231) 1623RD/WT: Right Direction 16% (117) 56% (416) 18% (133) 11% (79) 745RD/WT: Wrong Track 24% (304) 33% (411) 27% (335) 16% (204) 1253Biden Job Approve 13% (112) 57% (507) 18% (164) 12% (106) 890Biden Job Disapprove 30% (306) 30% (311) 25% (262) 15% (152) 1031
Continued on next page

246
Morning ConsultTable POLx_9
Table POLx_9: Favorability forKevin McCarthy
Demographic Total Favorable Total UnfavorableHeard Of, NoOpinion Never Heard Of Total N
Registered Voters 21% (420) 41% (827) 23% (468) 14% (283) 1998Biden Job Strongly Approve 14% (62) 61% (272) 16% (73) 9% (40) 446Biden Job Somewhat Approve 11% (50) 53% (236) 21% (92) 15% (66) 444Biden Job Somewhat Disapprove 10% (24) 35% (87) 32% (80) 23% (59) 250Biden Job Strongly Disapprove 36% (281) 29% (224) 23% (183) 12% (93) 781Favorable of Biden 12% (107) 57% (512) 18% (166) 13% (115) 899Unfavorable of Biden 30% (311) 30% (307) 26% (267) 14% (147) 1032Very Favorable of Biden 14% (66) 60% (284) 15% (71) 10% (49) 470Somewhat Favorable of Biden 10% (41) 53% (228) 22% (94) 15% (66) 429Somewhat Unfavorable of Biden 13% (32) 33% (82) 32% (78) 22% (55) 246Very Unfavorable of Biden 36% (279) 29% (226) 24% (189) 12% (92) 786#1 Issue: Economy 21% (156) 38% (281) 26% (191) 15% (114) 742#1 Issue: Security 39% (159) 31% (126) 21% (86) 9% (37) 409#1 Issue: Health Care 11% (28) 49% (121) 24% (60) 15% (38) 248#1 Issue: Medicare / Social Security 17% (36) 58% (122) 18% (37) 6% (13) 209#1 Issue: Women’s Issues 8% (9) 47% (52) 19% (21) 25% (28) 111#1 Issue: Education 11% (8) 32% (23) 36% (26) 22% (16) 72#1 Issue: Energy 9% (8) 47% (42) 18% (16) 26% (23) 90#1 Issue: Other 13% (15) 50% (59) 26% (30) 11% (13) 1172020 Vote: Joe Biden 10% (94) 57% (543) 20% (190) 13% (118) 9462020 Vote: Donald Trump 36% (310) 27% (234) 25% (219) 12% (101) 8642020 Vote: Didn’t Vote 8% (12) 24% (37) 32% (49) 36% (55) 1532018 House Vote: Democrat 9% (65) 63% (464) 17% (126) 11% (79) 7342018 House Vote: Republican 39% (283) 29% (212) 22% (157) 9% (67) 7192018 House Vote: Someone else 4% (2) 51% (27) 30% (16) 14% (8) 532016 Vote: Hillary Clinton 9% (64) 63% (445) 17% (121) 11% (76) 7062016 Vote: Donald Trump 38% (304) 27% (220) 25% (198) 10% (84) 8052016 Vote: Other 9% (8) 60% (52) 15% (13) 16% (14) 872016 Vote: Didn’t Vote 11% (45) 27% (109) 34% (135) 28% (110) 399Voted in 2014: Yes 25% (334) 47% (624) 18% (238) 10% (128) 1324Voted in 2014: No 13% (87) 30% (203) 34% (230) 23% (155) 674
Continued on next page

National Tracking Poll #2110009, October, 2021
247
Table POLx_9
Table POLx_9: Favorability forKevin McCarthy
Demographic Total Favorable Total UnfavorableHeard Of, NoOpinion Never Heard Of Total N
Registered Voters 21% (420) 41% (827) 23% (468) 14% (283) 19984-Region: Northeast 22% (77) 43% (151) 23% (80) 13% (45) 3534-Region: Midwest 20% (89) 42% (185) 25% (112) 13% (58) 4444-Region: South 23% (168) 38% (284) 25% (184) 15% (110) 7464-Region: West 19% (86) 45% (206) 20% (92) 16% (71) 455Party: Democrat/Leans Democrat 9% (80) 58% (510) 18% (160) 14% (127) 877Party: Republican/Leans Republican 37% (305) 25% (206) 26% (210) 12% (101) 822Note: Row proportions may total to larger than one-hundred percent due to rounding. For more information visit MorningConsultIntelligence.com.

248
Morning ConsultTable POLx_10
Table POLx_10: Favorability forJoe Biden
Demographic Total Favorable Total UnfavorableHeard Of, NoOpinion Never Heard Of Total N
Registered Voters 45% (899) 52% (1032) 3% (59) — (7) 1998Gender: Male 44% (416) 53% (499) 2% (21) 1% (6) 942Gender: Female 46% (484) 50% (533) 4% (38) — (1) 1056Age: 18-34 42% (214) 51% (260) 7% (35) 1% (5) 514Age: 35-44 49% (151) 48% (148) 2% (7) — (1) 307Age: 45-64 44% (301) 54% (367) 2% (12) — (0) 679Age: 65+ 47% (233) 52% (258) 1% (5) — (1) 497GenZers: 1997-2012 42% (63) 45% (67) 12% (18) — (1) 148Millennials: 1981-1996 44% (245) 51% (282) 4% (23) 1% (5) 556GenXers: 1965-1980 48% (225) 49% (231) 3% (12) — (0) 468Baby Boomers: 1946-1964 43% (314) 56% (402) 1% (6) — (0) 723PID: Dem (no lean) 86% (639) 12% (90) 2% (15) — (1) 745PID: Ind (no lean) 34% (192) 59% (328) 6% (35) 1% (5) 559PID: Rep (no lean) 10% (69) 89% (614) 1% (9) — (2) 694PID/Gender: DemMen 83% (295) 15% (53) 2% (7) — (0) 355PID/Gender: DemWomen 88% (344) 10% (37) 2% (8) — (1) 390PID/Gender: Ind Men 31% (90) 63% (182) 4% (11) 2% (5) 288PID/Gender: Ind Women 37% (102) 54% (145) 9% (24) — (0) 271PID/Gender: Rep Men 10% (30) 88% (264) 1% (4) — (1) 299PID/Gender: Rep Women 10% (38) 89% (351) 1% (5) — (1) 395Ideo: Liberal (1-3) 85% (470) 14% (76) 1% (6) — (0) 553Ideo: Moderate (4) 55% (293) 40% (217) 5% (24) 1% (4) 538Ideo: Conservative (5-7) 13% (100) 87% (686) 1% (5) — (1) 793Educ: < College 43% (517) 53% (642) 3% (42) — (6) 1206Educ: Bachelors degree 45% (225) 53% (264) 2% (11) — (1) 501Educ: Post-grad 54% (158) 44% (126) 2% (6) — (0) 290Income: Under 50k 47% (414) 49% (430) 4% (33) 1% (6) 882Income: 50k-100k 41% (295) 56% (408) 3% (19) — (1) 723Income: 100k+ 49% (191) 50% (194) 2% (7) — (0) 392Ethnicity: White 41% (632) 56% (872) 3% (39) — (3) 1545Ethnicity: Hispanic 48% (106) 49% (109) 3% (7) — (0) 222
Continued on next page

National Tracking Poll #2110009, October, 2021
249
Table POLx_10
Table POLx_10: Favorability forJoe Biden
Demographic Total Favorable Total UnfavorableHeard Of, NoOpinion Never Heard Of Total N
Registered Voters 45% (899) 52% (1032) 3% (59) — (7) 1998Ethnicity: Black 74% (188) 19% (48) 6% (14) 1% (3) 253Ethnicity: Other 40% (80) 56% (113) 3% (6) 1% (1) 200All Christian 41% (417) 58% (592) 2% (16) — (1) 1025All Non-Christian 72% (75) 25% (26) 2% (2) 1% (1) 105Atheist 59% (56) 38% (36) 3% (3) — (0) 95Agnostic/Nothing in particular 50% (236) 45% (213) 5% (25) — (1) 474Something Else 39% (115) 55% (166) 5% (14) 1% (4) 299Religious Non-Protestant/Catholic 62% (79) 35% (45) 2% (3) 1% (1) 128Evangelical 32% (176) 66% (367) 2% (11) 1% (5) 558Non-Evangelical 48% (348) 50% (360) 3% (19) — (0) 727Community: Urban 60% (275) 36% (166) 4% (16) — (0) 457Community: Suburban 43% (434) 53% (538) 3% (31) 1% (6) 1010Community: Rural 36% (191) 62% (329) 2% (12) — (1) 531Employ: Private Sector 45% (309) 52% (358) 3% (18) — (2) 687Employ: Government 45% (60) 50% (66) 5% (6) — (0) 133Employ: Self-Employed 45% (83) 52% (97) 1% (3) 2% (3) 185Employ: Homemaker 35% (56) 65% (104) 1% (1) — (0) 160Employ: Student 45% (27) 42% (26) 13% (8) 1% (1) 61Employ: Retired 47% (237) 52% (266) 1% (5) — (1) 509Employ: Unemployed 42% (69) 48% (80) 9% (16) — (0) 165Employ: Other 59% (58) 37% (36) 4% (4) — (0) 97Military HH: Yes 39% (146) 57% (214) 4% (15) — (0) 375Military HH: No 46% (753) 50% (818) 3% (44) — (7) 1623RD/WT: Right Direction 88% (657) 9% (66) 3% (21) — (2) 745RD/WT: Wrong Track 19% (243) 77% (967) 3% (38) — (5) 1253Biden Job Approve 93% (831) 5% (48) 1% (10) — (2) 890Biden Job Disapprove 5% (55) 94% (967) 1% (7) — (1) 1031
Continued on next page

250
Morning ConsultTable POLx_10
Table POLx_10: Favorability forJoe Biden
Demographic Total Favorable Total UnfavorableHeard Of, NoOpinion Never Heard Of Total N
Registered Voters 45% (899) 52% (1032) 3% (59) — (7) 1998Biden Job Strongly Approve 96% (430) 2% (9) 1% (6) — (0) 446Biden Job Somewhat Approve 90% (400) 9% (39) 1% (3) — (2) 444Biden Job Somewhat Disapprove 18% (44) 80% (200) 2% (5) — (0) 250Biden Job Strongly Disapprove 1% (11) 98% (767) — (2) — (1) 781Favorable of Biden 100% (899) — (0) — (0) — (0) 899Unfavorable of Biden — (0) 100% (1032) — (0) — (0) 1032Very Favorable of Biden 100% (470) — (0) — (0) — (0) 470Somewhat Favorable of Biden 100% (429) — (0) — (0) — (0) 429Somewhat Unfavorable of Biden — (0) 100% (246) — (0) — (0) 246Very Unfavorable of Biden — (0) 100% (786) — (0) — (0) 786#1 Issue: Economy 38% (282) 58% (431) 4% (27) — (3) 742#1 Issue: Security 17% (68) 82% (335) 2% (6) — (0) 409#1 Issue: Health Care 75% (185) 22% (54) 4% (9) — (0) 248#1 Issue: Medicare / Social Security 65% (135) 34% (72) — (0) 1% (1) 209#1 Issue: Women’s Issues 70% (78) 27% (30) 3% (3) 1% (1) 111#1 Issue: Education 48% (35) 44% (32) 7% (5) 1% (1) 72#1 Issue: Energy 64% (57) 29% (26) 6% (6) — (0) 90#1 Issue: Other 51% (60) 45% (53) 2% (3) 1% (1) 1172020 Vote: Joe Biden 85% (807) 12% (117) 2% (22) — (1) 9462020 Vote: Donald Trump 4% (37) 94% (812) 2% (13) — (1) 8642020 Vote: Didn’t Vote 32% (49) 53% (80) 14% (21) 1% (2) 1532018 House Vote: Democrat 83% (607) 15% (112) 2% (14) — (1) 7342018 House Vote: Republican 9% (64) 90% (645) 1% (6) 1% (4) 7192018 House Vote: Someone else 32% (17) 65% (35) 4% (2) — (0) 532016 Vote: Hillary Clinton 85% (596) 14% (97) 2% (13) — (0) 7062016 Vote: Donald Trump 9% (75) 89% (714) 1% (12) 1% (5) 8052016 Vote: Other 51% (45) 48% (42) 1% (1) — (0) 872016 Vote: Didn’t Vote 46% (183) 45% (179) 9% (34) 1% (3) 399Voted in 2014: Yes 46% (610) 53% (699) 1% (13) — (2) 1324Voted in 2014: No 43% (289) 49% (333) 7% (47) 1% (5) 674
Continued on next page

National Tracking Poll #2110009, October, 2021
251
Table POLx_10
Table POLx_10: Favorability forJoe Biden
Demographic Total Favorable Total UnfavorableHeard Of, NoOpinion Never Heard Of Total N
Registered Voters 45% (899) 52% (1032) 3% (59) — (7) 19984-Region: Northeast 52% (183) 44% (157) 3% (12) 1% (2) 3534-Region: Midwest 42% (188) 55% (243) 2% (11) 1% (2) 4444-Region: South 41% (304) 56% (418) 3% (21) — (3) 7464-Region: West 49% (225) 47% (215) 3% (16) — (0) 455Party: Democrat/Leans Democrat 84% (738) 14% (122) 2% (17) — (1) 877Party: Republican/Leans Republican 10% (82) 89% (728) 1% (10) — (2) 822Note: Row proportions may total to larger than one-hundred percent due to rounding. For more information visit MorningConsultIntelligence.com.
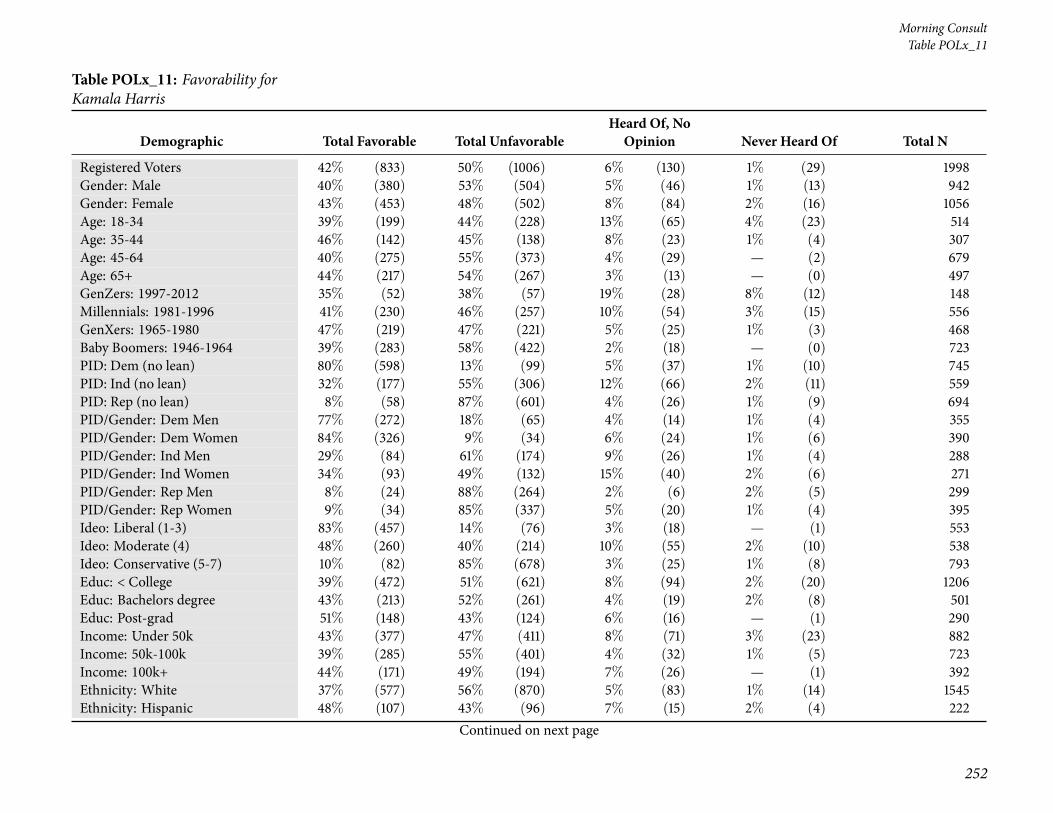
252
Morning ConsultTable POLx_11
Table POLx_11: Favorability forKamala Harris
Demographic Total Favorable Total UnfavorableHeard Of, NoOpinion Never Heard Of Total N
Registered Voters 42% (833) 50% (1006) 6% (130) 1% (29) 1998Gender: Male 40% (380) 53% (504) 5% (46) 1% (13) 942Gender: Female 43% (453) 48% (502) 8% (84) 2% (16) 1056Age: 18-34 39% (199) 44% (228) 13% (65) 4% (23) 514Age: 35-44 46% (142) 45% (138) 8% (23) 1% (4) 307Age: 45-64 40% (275) 55% (373) 4% (29) — (2) 679Age: 65+ 44% (217) 54% (267) 3% (13) — (0) 497GenZers: 1997-2012 35% (52) 38% (57) 19% (28) 8% (12) 148Millennials: 1981-1996 41% (230) 46% (257) 10% (54) 3% (15) 556GenXers: 1965-1980 47% (219) 47% (221) 5% (25) 1% (3) 468Baby Boomers: 1946-1964 39% (283) 58% (422) 2% (18) — (0) 723PID: Dem (no lean) 80% (598) 13% (99) 5% (37) 1% (10) 745PID: Ind (no lean) 32% (177) 55% (306) 12% (66) 2% (11) 559PID: Rep (no lean) 8% (58) 87% (601) 4% (26) 1% (9) 694PID/Gender: DemMen 77% (272) 18% (65) 4% (14) 1% (4) 355PID/Gender: DemWomen 84% (326) 9% (34) 6% (24) 1% (6) 390PID/Gender: Ind Men 29% (84) 61% (174) 9% (26) 1% (4) 288PID/Gender: Ind Women 34% (93) 49% (132) 15% (40) 2% (6) 271PID/Gender: Rep Men 8% (24) 88% (264) 2% (6) 2% (5) 299PID/Gender: Rep Women 9% (34) 85% (337) 5% (20) 1% (4) 395Ideo: Liberal (1-3) 83% (457) 14% (76) 3% (18) — (1) 553Ideo: Moderate (4) 48% (260) 40% (214) 10% (55) 2% (10) 538Ideo: Conservative (5-7) 10% (82) 85% (678) 3% (25) 1% (8) 793Educ: < College 39% (472) 51% (621) 8% (94) 2% (20) 1206Educ: Bachelors degree 43% (213) 52% (261) 4% (19) 2% (8) 501Educ: Post-grad 51% (148) 43% (124) 6% (16) — (1) 290Income: Under 50k 43% (377) 47% (411) 8% (71) 3% (23) 882Income: 50k-100k 39% (285) 55% (401) 4% (32) 1% (5) 723Income: 100k+ 44% (171) 49% (194) 7% (26) — (1) 392Ethnicity: White 37% (577) 56% (870) 5% (83) 1% (14) 1545Ethnicity: Hispanic 48% (107) 43% (96) 7% (15) 2% (4) 222
Continued on next page

National Tracking Poll #2110009, October, 2021
253
Table POLx_11
Table POLx_11: Favorability forKamala Harris
Demographic Total Favorable Total UnfavorableHeard Of, NoOpinion Never Heard Of Total N
Registered Voters 42% (833) 50% (1006) 6% (130) 1% (29) 1998Ethnicity: Black 71% (179) 17% (44) 9% (22) 3% (7) 253Ethnicity: Other 38% (77) 46% (92) 12% (24) 4% (7) 200All Christian 38% (386) 58% (593) 4% (45) — (2) 1025All Non-Christian 65% (68) 28% (29) 4% (5) 3% (3) 105Atheist 61% (57) 34% (32) 3% (3) 2% (2) 95Agnostic/Nothing in particular 45% (216) 43% (204) 9% (43) 2% (11) 474Something Else 36% (106) 49% (148) 11% (34) 4% (11) 299Religious Non-Protestant/Catholic 58% (74) 36% (46) 4% (5) 2% (3) 128Evangelical 31% (171) 63% (353) 5% (26) 2% (9) 558Non-Evangelical 43% (313) 49% (358) 7% (52) 1% (5) 727Community: Urban 56% (257) 35% (160) 8% (35) 1% (5) 457Community: Suburban 39% (398) 51% (519) 7% (75) 2% (18) 1010Community: Rural 34% (179) 62% (328) 4% (19) 1% (5) 531Employ: Private Sector 43% (293) 50% (342) 6% (44) 1% (8) 687Employ: Government 31% (41) 56% (74) 10% (14) 3% (4) 133Employ: Self-Employed 43% (79) 49% (91) 5% (10) 3% (5) 185Employ: Homemaker 26% (42) 60% (96) 12% (19) 3% (4) 160Employ: Student 48% (29) 31% (19) 20% (12) 2% (1) 61Employ: Retired 44% (223) 54% (275) 2% (10) — (1) 509Employ: Unemployed 42% (69) 44% (73) 12% (19) 2% (4) 165Employ: Other 59% (57) 37% (36) 1% (1) 3% (2) 97Military HH: Yes 35% (131) 59% (221) 5% (19) 1% (3) 375Military HH: No 43% (702) 48% (785) 7% (110) 2% (26) 1623RD/WT: Right Direction 78% (585) 13% (94) 7% (54) 2% (13) 745RD/WT: Wrong Track 20% (249) 73% (912) 6% (76) 1% (17) 1253Biden Job Approve 82% (727) 11% (99) 6% (52) 1% (13) 890Biden Job Disapprove 8% (83) 87% (899) 4% (41) 1% (8) 1031
Continued on next page

254
Morning ConsultTable POLx_11
Table POLx_11: Favorability forKamala Harris
Demographic Total Favorable Total UnfavorableHeard Of, NoOpinion Never Heard Of Total N
Registered Voters 42% (833) 50% (1006) 6% (130) 1% (29) 1998Biden Job Strongly Approve 91% (408) 4% (16) 4% (17) 1% (6) 446Biden Job Somewhat Approve 72% (319) 19% (83) 8% (35) 1% (7) 444Biden Job Somewhat Disapprove 25% (64) 62% (154) 11% (27) 2% (5) 250Biden Job Strongly Disapprove 2% (19) 95% (745) 2% (13) — (3) 781Favorable of Biden 85% (760) 9% (81) 5% (45) 1% (13) 899Unfavorable of Biden 6% (61) 89% (921) 4% (40) 1% (11) 1032Very Favorable of Biden 93% (438) 3% (15) 2% (11) 1% (6) 470Somewhat Favorable of Biden 75% (322) 16% (67) 8% (34) 2% (6) 429Somewhat Unfavorable of Biden 22% (54) 67% (165) 9% (21) 2% (6) 246Very Unfavorable of Biden 1% (7) 96% (756) 2% (19) 1% (5) 786#1 Issue: Economy 38% (284) 53% (393) 7% (55) 1% (11) 742#1 Issue: Security 12% (49) 84% (345) 3% (12) 1% (3) 409#1 Issue: Health Care 63% (157) 24% (61) 9% (21) 4% (9) 248#1 Issue: Medicare / Social Security 62% (129) 35% (73) 3% (7) — (0) 209#1 Issue: Women’s Issues 74% (82) 16% (18) 8% (9) 2% (2) 111#1 Issue: Education 41% (29) 41% (30) 17% (12) 1% (1) 72#1 Issue: Energy 52% (47) 36% (33) 11% (10) 1% (0) 90#1 Issue: Other 48% (56) 47% (54) 2% (3) 3% (3) 1172020 Vote: Joe Biden 80% (754) 13% (125) 6% (56) 1% (10) 9462020 Vote: Donald Trump 4% (30) 92% (795) 4% (31) 1% (8) 8642020 Vote: Didn’t Vote 26% (40) 42% (64) 26% (39) 7% (10) 1532018 House Vote: Democrat 78% (575) 17% (126) 4% (31) — (2) 7342018 House Vote: Republican 8% (57) 87% (627) 4% (26) 1% (9) 7192018 House Vote: Someone else 26% (14) 59% (32) 10% (5) 5% (3) 532016 Vote: Hillary Clinton 80% (563) 15% (103) 5% (36) — (3) 7062016 Vote: Donald Trump 8% (62) 88% (707) 4% (30) 1% (7) 8052016 Vote: Other 45% (39) 48% (42) 6% (5) 1% (1) 872016 Vote: Didn’t Vote 42% (169) 39% (154) 15% (58) 5% (18) 399Voted in 2014: Yes 43% (567) 53% (705) 3% (45) 1% (7) 1324Voted in 2014: No 39% (266) 45% (301) 13% (85) 3% (22) 674
Continued on next page

National Tracking Poll #2110009, October, 2021
255
Table POLx_11
Table POLx_11: Favorability forKamala Harris
Demographic Total Favorable Total UnfavorableHeard Of, NoOpinion Never Heard Of Total N
Registered Voters 42% (833) 50% (1006) 6% (130) 1% (29) 19984-Region: Northeast 45% (160) 48% (169) 6% (21) 1% (3) 3534-Region: Midwest 39% (173) 53% (238) 6% (28) 1% (5) 4444-Region: South 38% (286) 53% (396) 7% (50) 2% (12) 7464-Region: West 47% (213) 45% (203) 7% (30) 2% (9) 455Party: Democrat/Leans Democrat 78% (687) 15% (128) 6% (53) 1% (10) 877Party: Republican/Leans Republican 8% (68) 87% (715) 4% (29) 1% (10) 822Note: Row proportions may total to larger than one-hundred percent due to rounding. For more information visit MorningConsultIntelligence.com.

256
Morning ConsultTable POLx_12
Table POLx_12: Favorability forJoe Manchin
Demographic Total Favorable Total UnfavorableHeard Of, NoOpinion Never Heard Of Total N
Registered Voters 21% (414) 33% (657) 21% (420) 25% (508) 1998Gender: Male 26% (250) 39% (364) 17% (161) 18% (168) 942Gender: Female 16% (164) 28% (293) 25% (259) 32% (340) 1056Age: 18-34 13% (64) 29% (149) 24% (124) 34% (177) 514Age: 35-44 21% (64) 27% (84) 23% (72) 28% (87) 307Age: 45-64 20% (139) 37% (251) 19% (126) 24% (164) 679Age: 65+ 29% (146) 35% (174) 20% (98) 16% (79) 497GenZers: 1997-2012 7% (11) 17% (25) 26% (39) 50% (74) 148Millennials: 1981-1996 17% (94) 31% (174) 23% (128) 29% (160) 556GenXers: 1965-1980 17% (80) 35% (163) 23% (105) 25% (119) 468Baby Boomers: 1946-1964 27% (192) 36% (259) 18% (128) 20% (143) 723PID: Dem (no lean) 19% (141) 41% (307) 17% (123) 23% (174) 745PID: Ind (no lean) 17% (94) 29% (161) 26% (146) 28% (159) 559PID: Rep (no lean) 26% (179) 27% (190) 22% (150) 25% (175) 694PID/Gender: DemMen 25% (88) 43% (154) 15% (52) 17% (61) 355PID/Gender: DemWomen 14% (53) 39% (153) 18% (71) 29% (114) 390PID/Gender: Ind Men 21% (61) 37% (108) 21% (60) 20% (59) 288PID/Gender: Ind Women 12% (32) 19% (53) 32% (86) 37% (100) 271PID/Gender: Rep Men 34% (100) 34% (102) 16% (48) 16% (48) 299PID/Gender: Rep Women 20% (79) 22% (88) 26% (102) 32% (126) 395Ideo: Liberal (1-3) 18% (98) 48% (268) 14% (80) 19% (107) 553Ideo: Moderate (4) 15% (80) 30% (164) 25% (135) 30% (159) 538Ideo: Conservative (5-7) 29% (228) 26% (207) 21% (166) 24% (192) 793Educ: < College 17% (201) 30% (365) 23% (283) 30% (357) 1206Educ: Bachelors degree 26% (128) 36% (179) 18% (89) 21% (105) 501Educ: Post-grad 29% (84) 39% (113) 16% (47) 16% (47) 290Income: Under 50k 17% (151) 30% (265) 24% (215) 28% (251) 882Income: 50k-100k 22% (163) 35% (253) 20% (142) 23% (166) 723Income: 100k+ 25% (100) 36% (139) 16% (62) 23% (91) 392Ethnicity: White 22% (332) 34% (521) 20% (312) 25% (380) 1545Ethnicity: Hispanic 22% (48) 31% (68) 24% (54) 23% (51) 222
Continued on next page
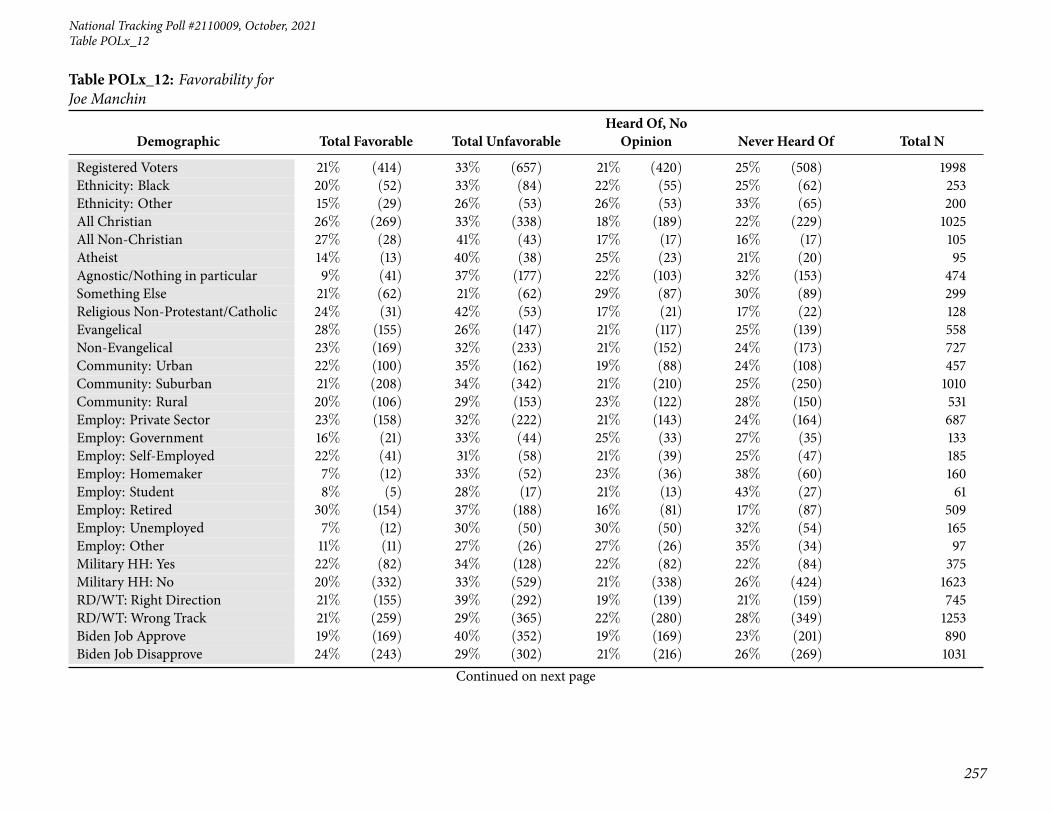
National Tracking Poll #2110009, October, 2021
257
Table POLx_12
Table POLx_12: Favorability forJoe Manchin
Demographic Total Favorable Total UnfavorableHeard Of, NoOpinion Never Heard Of Total N
Registered Voters 21% (414) 33% (657) 21% (420) 25% (508) 1998Ethnicity: Black 20% (52) 33% (84) 22% (55) 25% (62) 253Ethnicity: Other 15% (29) 26% (53) 26% (53) 33% (65) 200All Christian 26% (269) 33% (338) 18% (189) 22% (229) 1025All Non-Christian 27% (28) 41% (43) 17% (17) 16% (17) 105Atheist 14% (13) 40% (38) 25% (23) 21% (20) 95Agnostic/Nothing in particular 9% (41) 37% (177) 22% (103) 32% (153) 474Something Else 21% (62) 21% (62) 29% (87) 30% (89) 299Religious Non-Protestant/Catholic 24% (31) 42% (53) 17% (21) 17% (22) 128Evangelical 28% (155) 26% (147) 21% (117) 25% (139) 558Non-Evangelical 23% (169) 32% (233) 21% (152) 24% (173) 727Community: Urban 22% (100) 35% (162) 19% (88) 24% (108) 457Community: Suburban 21% (208) 34% (342) 21% (210) 25% (250) 1010Community: Rural 20% (106) 29% (153) 23% (122) 28% (150) 531Employ: Private Sector 23% (158) 32% (222) 21% (143) 24% (164) 687Employ: Government 16% (21) 33% (44) 25% (33) 27% (35) 133Employ: Self-Employed 22% (41) 31% (58) 21% (39) 25% (47) 185Employ: Homemaker 7% (12) 33% (52) 23% (36) 38% (60) 160Employ: Student 8% (5) 28% (17) 21% (13) 43% (27) 61Employ: Retired 30% (154) 37% (188) 16% (81) 17% (87) 509Employ: Unemployed 7% (12) 30% (50) 30% (50) 32% (54) 165Employ: Other 11% (11) 27% (26) 27% (26) 35% (34) 97Military HH: Yes 22% (82) 34% (128) 22% (82) 22% (84) 375Military HH: No 20% (332) 33% (529) 21% (338) 26% (424) 1623RD/WT: Right Direction 21% (155) 39% (292) 19% (139) 21% (159) 745RD/WT: Wrong Track 21% (259) 29% (365) 22% (280) 28% (349) 1253Biden Job Approve 19% (169) 40% (352) 19% (169) 23% (201) 890Biden Job Disapprove 24% (243) 29% (302) 21% (216) 26% (269) 1031
Continued on next page
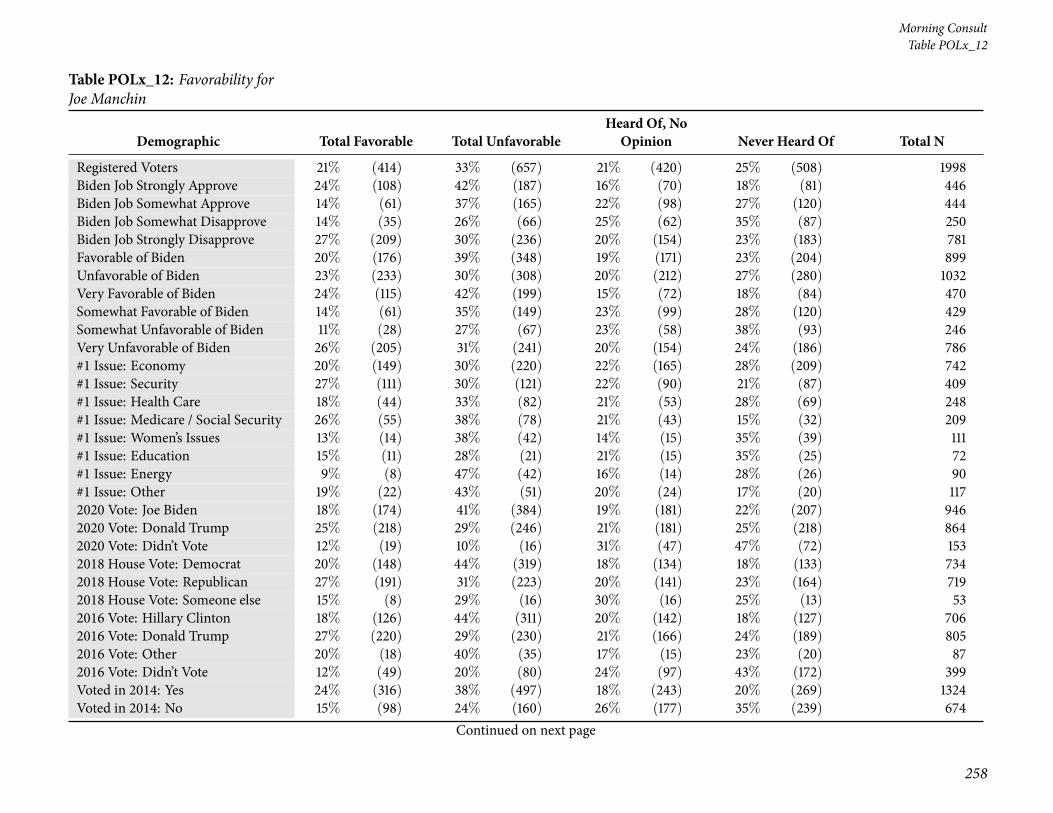
258
Morning ConsultTable POLx_12
Table POLx_12: Favorability forJoe Manchin
Demographic Total Favorable Total UnfavorableHeard Of, NoOpinion Never Heard Of Total N
Registered Voters 21% (414) 33% (657) 21% (420) 25% (508) 1998Biden Job Strongly Approve 24% (108) 42% (187) 16% (70) 18% (81) 446Biden Job Somewhat Approve 14% (61) 37% (165) 22% (98) 27% (120) 444Biden Job Somewhat Disapprove 14% (35) 26% (66) 25% (62) 35% (87) 250Biden Job Strongly Disapprove 27% (209) 30% (236) 20% (154) 23% (183) 781Favorable of Biden 20% (176) 39% (348) 19% (171) 23% (204) 899Unfavorable of Biden 23% (233) 30% (308) 20% (212) 27% (280) 1032Very Favorable of Biden 24% (115) 42% (199) 15% (72) 18% (84) 470Somewhat Favorable of Biden 14% (61) 35% (149) 23% (99) 28% (120) 429Somewhat Unfavorable of Biden 11% (28) 27% (67) 23% (58) 38% (93) 246Very Unfavorable of Biden 26% (205) 31% (241) 20% (154) 24% (186) 786#1 Issue: Economy 20% (149) 30% (220) 22% (165) 28% (209) 742#1 Issue: Security 27% (111) 30% (121) 22% (90) 21% (87) 409#1 Issue: Health Care 18% (44) 33% (82) 21% (53) 28% (69) 248#1 Issue: Medicare / Social Security 26% (55) 38% (78) 21% (43) 15% (32) 209#1 Issue: Women’s Issues 13% (14) 38% (42) 14% (15) 35% (39) 111#1 Issue: Education 15% (11) 28% (21) 21% (15) 35% (25) 72#1 Issue: Energy 9% (8) 47% (42) 16% (14) 28% (26) 90#1 Issue: Other 19% (22) 43% (51) 20% (24) 17% (20) 1172020 Vote: Joe Biden 18% (174) 41% (384) 19% (181) 22% (207) 9462020 Vote: Donald Trump 25% (218) 29% (246) 21% (181) 25% (218) 8642020 Vote: Didn’t Vote 12% (19) 10% (16) 31% (47) 47% (72) 1532018 House Vote: Democrat 20% (148) 44% (319) 18% (134) 18% (133) 7342018 House Vote: Republican 27% (191) 31% (223) 20% (141) 23% (164) 7192018 House Vote: Someone else 15% (8) 29% (16) 30% (16) 25% (13) 532016 Vote: Hillary Clinton 18% (126) 44% (311) 20% (142) 18% (127) 7062016 Vote: Donald Trump 27% (220) 29% (230) 21% (166) 24% (189) 8052016 Vote: Other 20% (18) 40% (35) 17% (15) 23% (20) 872016 Vote: Didn’t Vote 12% (49) 20% (80) 24% (97) 43% (172) 399Voted in 2014: Yes 24% (316) 38% (497) 18% (243) 20% (269) 1324Voted in 2014: No 15% (98) 24% (160) 26% (177) 35% (239) 674
Continued on next page

National Tracking Poll #2110009, October, 2021
259
Table POLx_12
Table POLx_12: Favorability forJoe Manchin
Demographic Total Favorable Total UnfavorableHeard Of, NoOpinion Never Heard Of Total N
Registered Voters 21% (414) 33% (657) 21% (420) 25% (508) 19984-Region: Northeast 20% (69) 33% (115) 23% (81) 25% (88) 3534-Region: Midwest 19% (84) 34% (152) 20% (90) 27% (118) 4444-Region: South 22% (161) 30% (223) 23% (172) 25% (189) 7464-Region: West 22% (99) 37% (168) 17% (76) 25% (112) 455Party: Democrat/Leans Democrat 18% (160) 41% (358) 17% (153) 23% (205) 877Party: Republican/Leans Republican 26% (217) 26% (212) 22% (181) 26% (212) 822Note: Row proportions may total to larger than one-hundred percent due to rounding. For more information visit MorningConsultIntelligence.com.

260
Morning ConsultTable POLx_13
Table POLx_13: Favorability forKyrsten Sinema
Demographic Total Favorable Total UnfavorableHeard Of, NoOpinion Never Heard Of Total N
Registered Voters 16% (326) 25% (505) 16% (315) 43% (853) 1998Gender: Male 21% (193) 32% (305) 15% (142) 32% (301) 942Gender: Female 13% (133) 19% (199) 16% (172) 52% (552) 1056Age: 18-34 15% (80) 19% (100) 18% (95) 47% (241) 514Age: 35-44 15% (47) 24% (73) 19% (59) 42% (128) 307Age: 45-64 16% (109) 28% (193) 13% (90) 42% (287) 679Age: 65+ 18% (90) 28% (139) 14% (71) 40% (198) 497GenZers: 1997-2012 12% (18) 8% (12) 20% (29) 60% (89) 148Millennials: 1981-1996 16% (91) 23% (130) 18% (99) 43% (237) 556GenXers: 1965-1980 13% (62) 27% (127) 19% (87) 41% (192) 468Baby Boomers: 1946-1964 18% (131) 29% (206) 12% (88) 41% (298) 723PID: Dem (no lean) 16% (122) 33% (249) 14% (104) 36% (269) 745PID: Ind (no lean) 14% (78) 23% (126) 20% (112) 44% (244) 559PID: Rep (no lean) 18% (126) 19% (130) 14% (98) 49% (340) 694PID/Gender: DemMen 20% (71) 38% (135) 14% (50) 28% (98) 355PID/Gender: DemWomen 13% (51) 29% (114) 14% (54) 44% (171) 390PID/Gender: Ind Men 16% (46) 30% (86) 18% (51) 36% (104) 288PID/Gender: Ind Women 12% (31) 15% (40) 22% (61) 51% (139) 271PID/Gender: Rep Men 25% (76) 28% (84) 14% (41) 33% (98) 299PID/Gender: Rep Women 13% (50) 12% (46) 14% (57) 61% (242) 395Ideo: Liberal (1-3) 16% (87) 39% (217) 14% (77) 31% (172) 553Ideo: Moderate (4) 13% (71) 24% (127) 18% (99) 45% (241) 538Ideo: Conservative (5-7) 20% (162) 19% (151) 14% (110) 47% (370) 793Educ: < College 13% (160) 22% (264) 18% (220) 47% (563) 1206Educ: Bachelors degree 22% (110) 27% (135) 11% (53) 40% (203) 501Educ: Post-grad 19% (56) 36% (106) 14% (42) 30% (87) 290Income: Under 50k 12% (104) 23% (199) 19% (167) 47% (412) 882Income: 50k-100k 18% (133) 27% (198) 14% (102) 40% (290) 723Income: 100k+ 23% (89) 27% (107) 12% (46) 38% (151) 392Ethnicity: White 16% (254) 25% (389) 15% (236) 43% (665) 1545Ethnicity: Hispanic 22% (49) 23% (51) 21% (46) 34% (76) 222
Continued on next page

National Tracking Poll #2110009, October, 2021
261
Table POLx_13
Table POLx_13: Favorability forKyrsten Sinema
Demographic Total Favorable Total UnfavorableHeard Of, NoOpinion Never Heard Of Total N
Registered Voters 16% (326) 25% (505) 16% (315) 43% (853) 1998Ethnicity: Black 16% (40) 27% (67) 18% (46) 39% (99) 253Ethnicity: Other 16% (31) 24% (48) 16% (32) 44% (89) 200All Christian 19% (193) 25% (261) 14% (147) 41% (424) 1025All Non-Christian 24% (25) 34% (35) 13% (14) 30% (31) 105Atheist 15% (14) 35% (33) 21% (20) 30% (28) 95Agnostic/Nothing in particular 10% (46) 27% (127) 15% (73) 48% (228) 474Something Else 16% (48) 16% (49) 20% (61) 47% (141) 299Religious Non-Protestant/Catholic 22% (28) 35% (45) 14% (17) 29% (37) 128Evangelical 20% (114) 18% (99) 15% (86) 47% (260) 558Non-Evangelical 16% (119) 27% (196) 16% (116) 41% (297) 727Community: Urban 21% (97) 26% (121) 16% (75) 36% (164) 457Community: Suburban 16% (158) 27% (268) 16% (157) 42% (427) 1010Community: Rural 13% (71) 22% (116) 15% (82) 49% (262) 531Employ: Private Sector 19% (134) 26% (179) 15% (105) 39% (269) 687Employ: Government 15% (20) 27% (36) 17% (23) 40% (53) 133Employ: Self-Employed 19% (35) 20% (37) 21% (39) 40% (74) 185Employ: Homemaker 3% (5) 22% (35) 12% (19) 63% (101) 160Employ: Student 9% (6) 18% (11) 11% (7) 61% (38) 61Employ: Retired 19% (97) 30% (152) 13% (67) 38% (193) 509Employ: Unemployed 11% (18) 22% (36) 22% (36) 46% (76) 165Employ: Other 12% (11) 19% (18) 20% (19) 50% (48) 97Military HH: Yes 14% (51) 26% (98) 14% (53) 46% (173) 375Military HH: No 17% (275) 25% (407) 16% (262) 42% (680) 1623RD/WT: Right Direction 19% (139) 31% (229) 17% (128) 33% (249) 745RD/WT: Wrong Track 15% (187) 22% (275) 15% (187) 48% (604) 1253Biden Job Approve 17% (150) 32% (283) 15% (135) 36% (322) 890Biden Job Disapprove 17% (174) 21% (221) 15% (151) 47% (486) 1031
Continued on next page

262
Morning ConsultTable POLx_13
Table POLx_13: Favorability forKyrsten Sinema
Demographic Total Favorable Total UnfavorableHeard Of, NoOpinion Never Heard Of Total N
Registered Voters 16% (326) 25% (505) 16% (315) 43% (853) 1998Biden Job Strongly Approve 22% (97) 35% (158) 14% (61) 29% (130) 446Biden Job Somewhat Approve 12% (53) 28% (125) 17% (74) 43% (192) 444Biden Job Somewhat Disapprove 7% (16) 20% (51) 16% (40) 57% (142) 250Biden Job Strongly Disapprove 20% (158) 22% (170) 14% (110) 44% (343) 781Favorable of Biden 16% (147) 31% (282) 15% (135) 37% (335) 899Unfavorable of Biden 17% (177) 21% (220) 14% (147) 47% (488) 1032Very Favorable of Biden 20% (93) 37% (174) 13% (63) 30% (140) 470Somewhat Favorable of Biden 13% (54) 25% (108) 17% (72) 45% (195) 429Somewhat Unfavorable of Biden 10% (25) 20% (49) 15% (37) 55% (135) 246Very Unfavorable of Biden 19% (152) 22% (171) 14% (110) 45% (353) 786#1 Issue: Economy 14% (107) 25% (187) 15% (113) 45% (335) 742#1 Issue: Security 23% (93) 20% (83) 16% (64) 41% (169) 409#1 Issue: Health Care 11% (27) 26% (66) 15% (38) 47% (118) 248#1 Issue: Medicare / Social Security 22% (45) 27% (56) 18% (37) 34% (70) 209#1 Issue: Women’s Issues 16% (18) 25% (28) 15% (16) 44% (49) 111#1 Issue: Education 16% (12) 19% (14) 15% (11) 50% (36) 72#1 Issue: Energy 12% (11) 30% (27) 18% (16) 40% (36) 90#1 Issue: Other 11% (13) 39% (45) 16% (19) 34% (40) 1172020 Vote: Joe Biden 16% (150) 32% (301) 16% (148) 37% (347) 9462020 Vote: Donald Trump 18% (154) 21% (181) 14% (120) 47% (409) 8642020 Vote: Didn’t Vote 11% (17) 10% (15) 27% (41) 52% (79) 1532018 House Vote: Democrat 15% (111) 37% (272) 15% (110) 33% (241) 7342018 House Vote: Republican 20% (142) 21% (153) 14% (99) 45% (324) 7192018 House Vote: Someone else 17% (9) 21% (11) 24% (13) 38% (20) 532016 Vote: Hillary Clinton 16% (114) 36% (256) 16% (110) 32% (225) 7062016 Vote: Donald Trump 19% (153) 21% (172) 14% (112) 46% (367) 8052016 Vote: Other 15% (13) 22% (19) 13% (11) 50% (43) 872016 Vote: Didn’t Vote 11% (44) 14% (56) 20% (81) 55% (217) 399Voted in 2014: Yes 18% (238) 30% (393) 14% (187) 38% (506) 1324Voted in 2014: No 13% (88) 17% (112) 19% (128) 51% (347) 674
Continued on next page
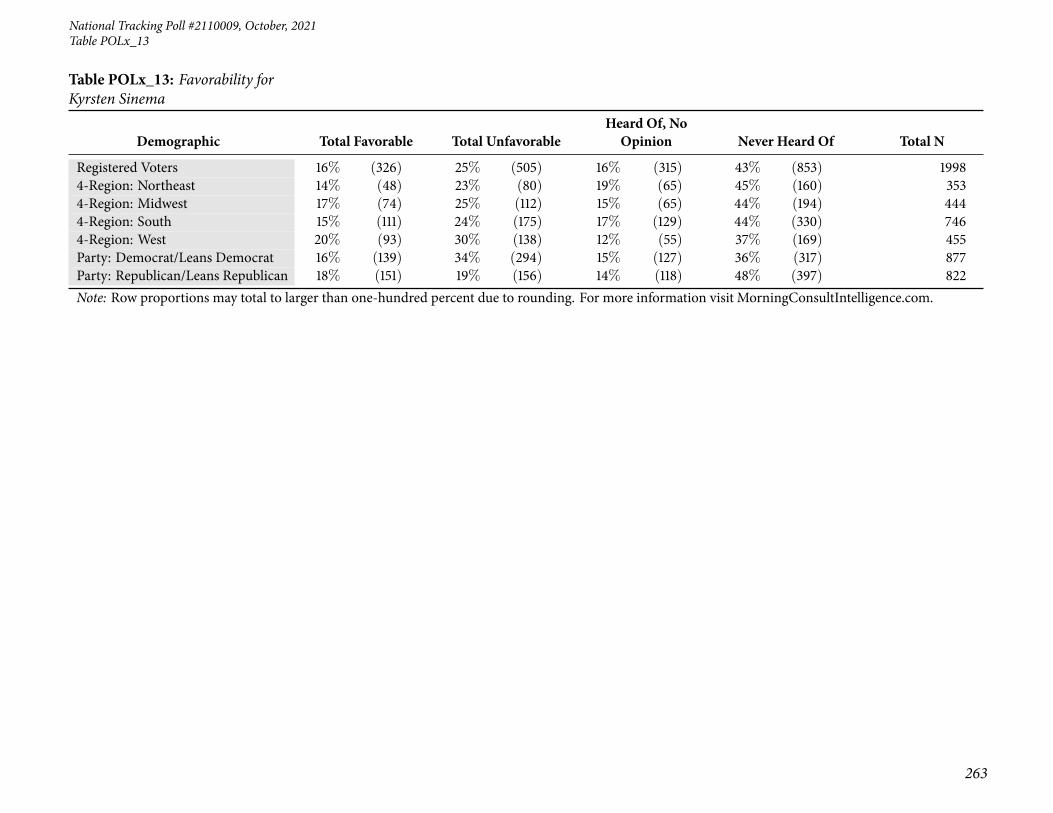
National Tracking Poll #2110009, October, 2021
263
Table POLx_13
Table POLx_13: Favorability forKyrsten Sinema
Demographic Total Favorable Total UnfavorableHeard Of, NoOpinion Never Heard Of Total N
Registered Voters 16% (326) 25% (505) 16% (315) 43% (853) 19984-Region: Northeast 14% (48) 23% (80) 19% (65) 45% (160) 3534-Region: Midwest 17% (74) 25% (112) 15% (65) 44% (194) 4444-Region: South 15% (111) 24% (175) 17% (129) 44% (330) 7464-Region: West 20% (93) 30% (138) 12% (55) 37% (169) 455Party: Democrat/Leans Democrat 16% (139) 34% (294) 15% (127) 36% (317) 877Party: Republican/Leans Republican 18% (151) 19% (156) 14% (118) 48% (397) 822Note: Row proportions may total to larger than one-hundred percent due to rounding. For more information visit MorningConsultIntelligence.com.
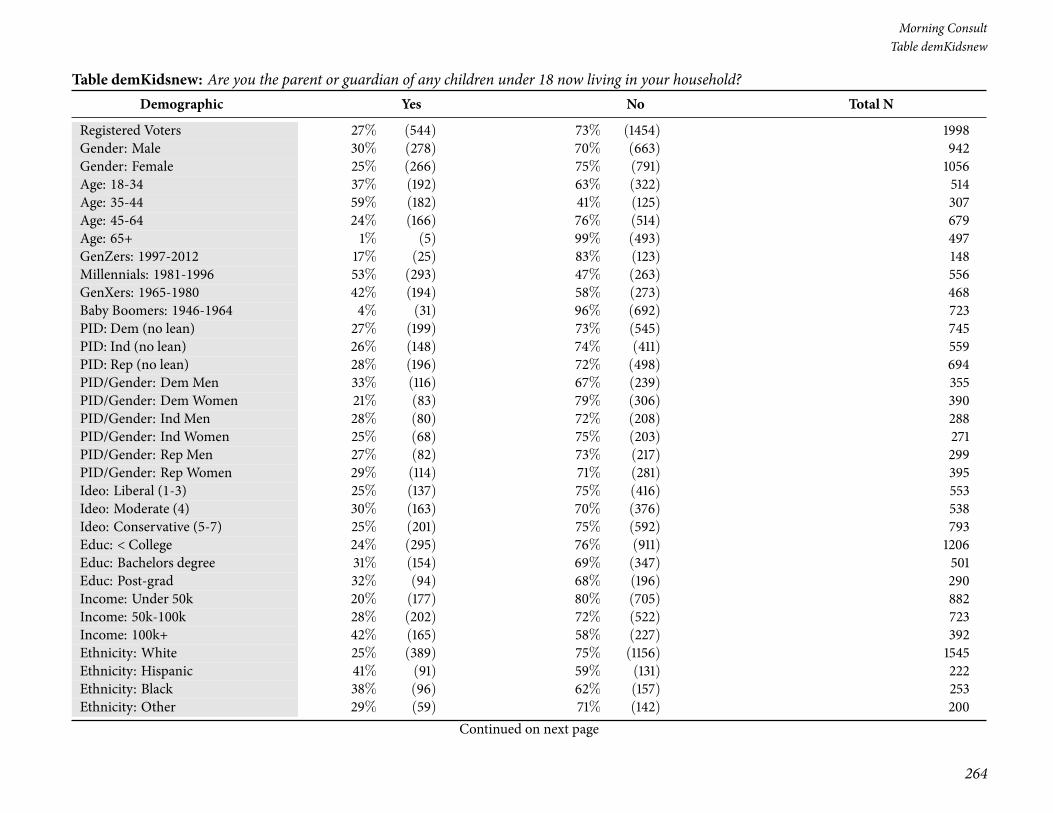
264
Morning ConsultTable demKidsnew
Table demKidsnew: Are you the parent or guardian of any children under 18 now living in your household?Demographic Yes No Total N
Registered Voters 27% (544) 73% (1454) 1998Gender: Male 30% (278) 70% (663) 942Gender: Female 25% (266) 75% (791) 1056Age: 18-34 37% (192) 63% (322) 514Age: 35-44 59% (182) 41% (125) 307Age: 45-64 24% (166) 76% (514) 679Age: 65+ 1% (5) 99% (493) 497GenZers: 1997-2012 17% (25) 83% (123) 148Millennials: 1981-1996 53% (293) 47% (263) 556GenXers: 1965-1980 42% (194) 58% (273) 468Baby Boomers: 1946-1964 4% (31) 96% (692) 723PID: Dem (no lean) 27% (199) 73% (545) 745PID: Ind (no lean) 26% (148) 74% (411) 559PID: Rep (no lean) 28% (196) 72% (498) 694PID/Gender: DemMen 33% (116) 67% (239) 355PID/Gender: DemWomen 21% (83) 79% (306) 390PID/Gender: Ind Men 28% (80) 72% (208) 288PID/Gender: Ind Women 25% (68) 75% (203) 271PID/Gender: Rep Men 27% (82) 73% (217) 299PID/Gender: Rep Women 29% (114) 71% (281) 395Ideo: Liberal (1-3) 25% (137) 75% (416) 553Ideo: Moderate (4) 30% (163) 70% (376) 538Ideo: Conservative (5-7) 25% (201) 75% (592) 793Educ: < College 24% (295) 76% (911) 1206Educ: Bachelors degree 31% (154) 69% (347) 501Educ: Post-grad 32% (94) 68% (196) 290Income: Under 50k 20% (177) 80% (705) 882Income: 50k-100k 28% (202) 72% (522) 723Income: 100k+ 42% (165) 58% (227) 392Ethnicity: White 25% (389) 75% (1156) 1545Ethnicity: Hispanic 41% (91) 59% (131) 222Ethnicity: Black 38% (96) 62% (157) 253Ethnicity: Other 29% (59) 71% (142) 200
Continued on next page

National Tracking Poll #2110009, October, 2021
265
Table demKidsnew
Table demKidsnew: Are you the parent or guardian of any children under 18 now living in your household?Demographic Yes No Total N
Registered Voters 27% (544) 73% (1454) 1998All Christian 24% (242) 76% (784) 1025All Non-Christian 29% (30) 71% (74) 105Atheist 33% (31) 67% (64) 95Agnostic/Nothing in particular 28% (131) 72% (344) 474Something Else 37% (110) 63% (188) 299Religious Non-Protestant/Catholic 30% (38) 70% (90) 128Evangelical 33% (182) 67% (377) 558Non-Evangelical 22% (160) 78% (567) 727Community: Urban 35% (161) 65% (296) 457Community: Suburban 26% (261) 74% (749) 1010Community: Rural 23% (122) 77% (409) 531Employ: Private Sector 42% (291) 58% (396) 687Employ: Government 39% (52) 61% (81) 133Employ: Self-Employed 30% (55) 70% (130) 185Employ: Homemaker 44% (70) 56% (90) 160Employ: Student 13% (8) 87% (53) 61Employ: Retired 3% (13) 97% (496) 509Employ: Unemployed 19% (31) 81% (134) 165Employ: Other 24% (23) 76% (74) 97Military HH: Yes 16% (61) 84% (313) 375Military HH: No 30% (483) 70% (1141) 1623RD/WT: Right Direction 29% (213) 71% (533) 745RD/WT: Wrong Track 26% (331) 74% (921) 1253Biden Job Approve 27% (240) 73% (651) 890Biden Job Disapprove 27% (280) 73% (751) 1031Biden Job Strongly Approve 27% (122) 73% (325) 446Biden Job Somewhat Approve 27% (118) 73% (326) 444Biden Job Somewhat Disapprove 37% (93) 63% (156) 250Biden Job Strongly Disapprove 24% (186) 76% (595) 781Favorable of Biden 26% (237) 74% (662) 899Unfavorable of Biden 27% (283) 73% (749) 1032
Continued on next page
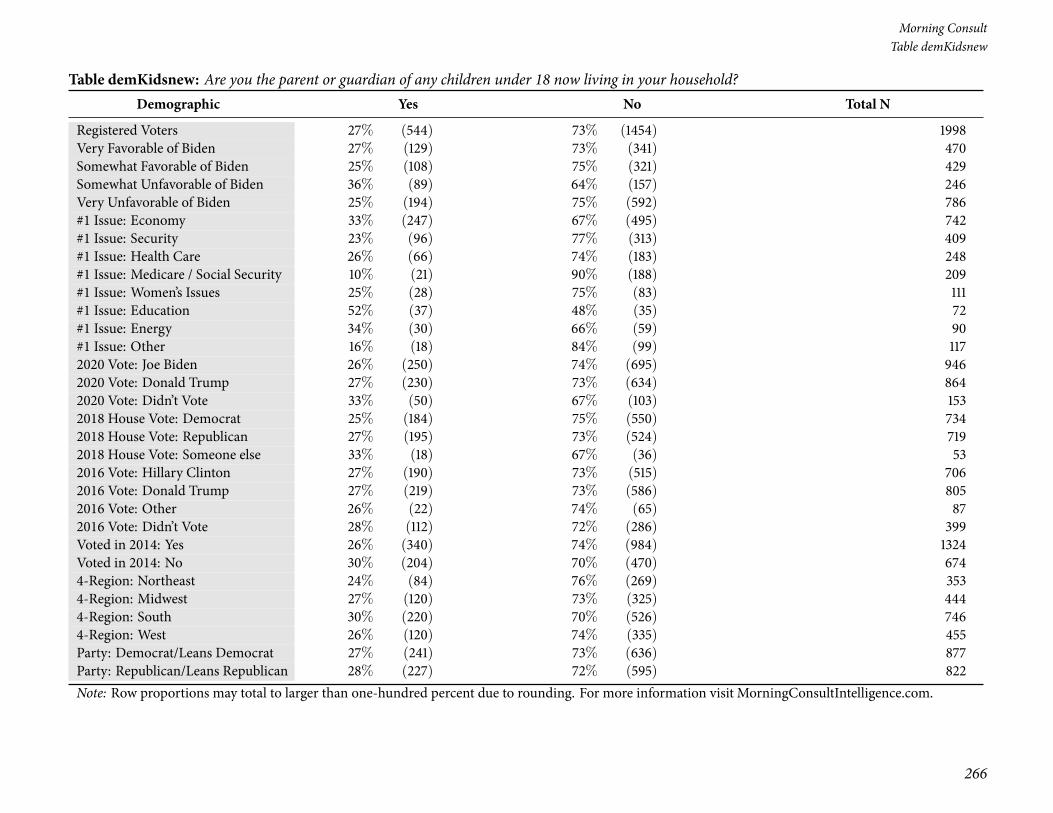
266
Morning ConsultTable demKidsnew
Table demKidsnew: Are you the parent or guardian of any children under 18 now living in your household?Demographic Yes No Total N
Registered Voters 27% (544) 73% (1454) 1998Very Favorable of Biden 27% (129) 73% (341) 470Somewhat Favorable of Biden 25% (108) 75% (321) 429Somewhat Unfavorable of Biden 36% (89) 64% (157) 246Very Unfavorable of Biden 25% (194) 75% (592) 786#1 Issue: Economy 33% (247) 67% (495) 742#1 Issue: Security 23% (96) 77% (313) 409#1 Issue: Health Care 26% (66) 74% (183) 248#1 Issue: Medicare / Social Security 10% (21) 90% (188) 209#1 Issue: Women’s Issues 25% (28) 75% (83) 111#1 Issue: Education 52% (37) 48% (35) 72#1 Issue: Energy 34% (30) 66% (59) 90#1 Issue: Other 16% (18) 84% (99) 1172020 Vote: Joe Biden 26% (250) 74% (695) 9462020 Vote: Donald Trump 27% (230) 73% (634) 8642020 Vote: Didn’t Vote 33% (50) 67% (103) 1532018 House Vote: Democrat 25% (184) 75% (550) 7342018 House Vote: Republican 27% (195) 73% (524) 7192018 House Vote: Someone else 33% (18) 67% (36) 532016 Vote: Hillary Clinton 27% (190) 73% (515) 7062016 Vote: Donald Trump 27% (219) 73% (586) 8052016 Vote: Other 26% (22) 74% (65) 872016 Vote: Didn’t Vote 28% (112) 72% (286) 399Voted in 2014: Yes 26% (340) 74% (984) 1324Voted in 2014: No 30% (204) 70% (470) 6744-Region: Northeast 24% (84) 76% (269) 3534-Region: Midwest 27% (120) 73% (325) 4444-Region: South 30% (220) 70% (526) 7464-Region: West 26% (120) 74% (335) 455Party: Democrat/Leans Democrat 27% (241) 73% (636) 877Party: Republican/Leans Republican 28% (227) 72% (595) 822Note: Row proportions may total to larger than one-hundred percent due to rounding. For more information visit MorningConsultIntelligence.com.
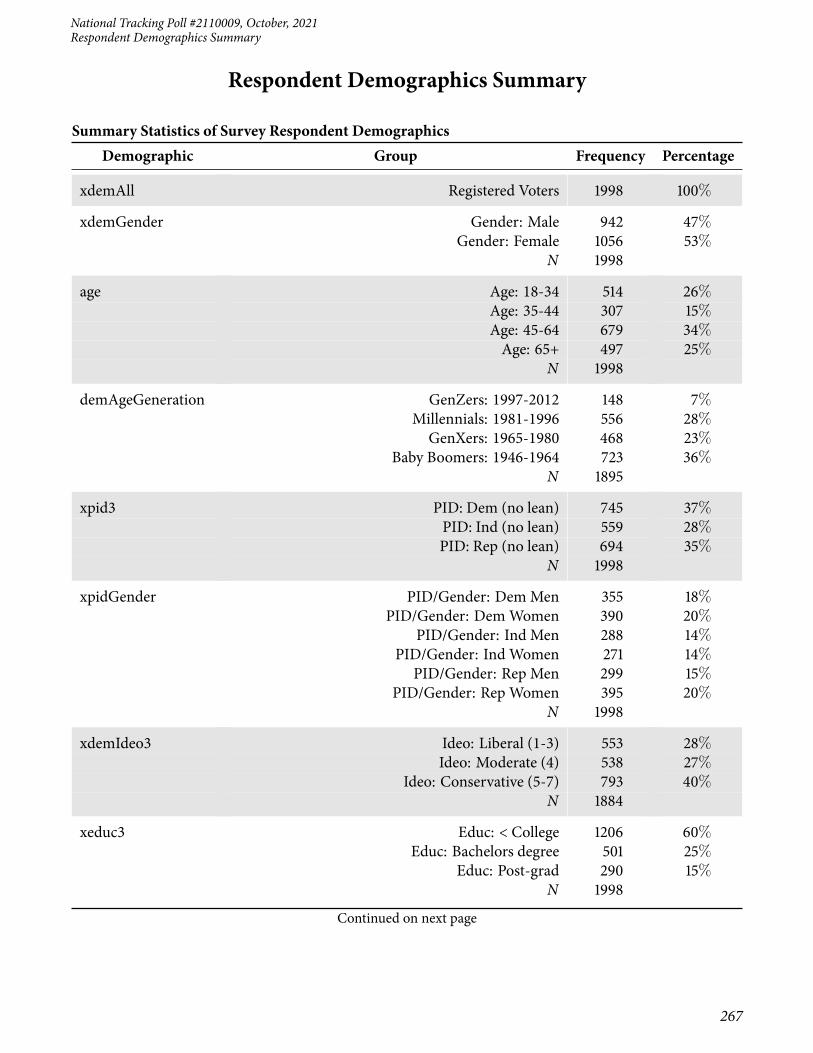
National Tracking Poll #2110009, October, 2021Respondent Demographics Summary
Respondent Demographics Summary
Summary Statistics of Survey Respondent DemographicsDemographic Group Frequency Percentage
xdemAll Registered Voters 1998 100%
xdemGender Gender: Male 942 47%Gender: Female 1056 53%
N 1998
age Age: 18-34 514 26%Age: 35-44 307 15%Age: 45-64 679 34%Age: 65+ 497 25%
N 1998
demAgeGeneration GenZers: 1997-2012 148 7%Millennials: 1981-1996 556 28%GenXers: 1965-1980 468 23%
Baby Boomers: 1946-1964 723 36%N 1895
xpid3 PID: Dem (no lean) 745 37%PID: Ind (no lean) 559 28%PID: Rep (no lean) 694 35%
N 1998
xpidGender PID/Gender: DemMen 355 18%PID/Gender: DemWomen 390 20%
PID/Gender: Ind Men 288 14%PID/Gender: Ind Women 271 14%
PID/Gender: Rep Men 299 15%PID/Gender: Rep Women 395 20%
N 1998
xdemIdeo3 Ideo: Liberal (1-3) 553 28%Ideo: Moderate (4) 538 27%
Ideo: Conservative (5-7) 793 40%N 1884
xeduc3 Educ: < College 1206 60%Educ: Bachelors degree 501 25%
Educ: Post-grad 290 15%N 1998
Continued on next page
267
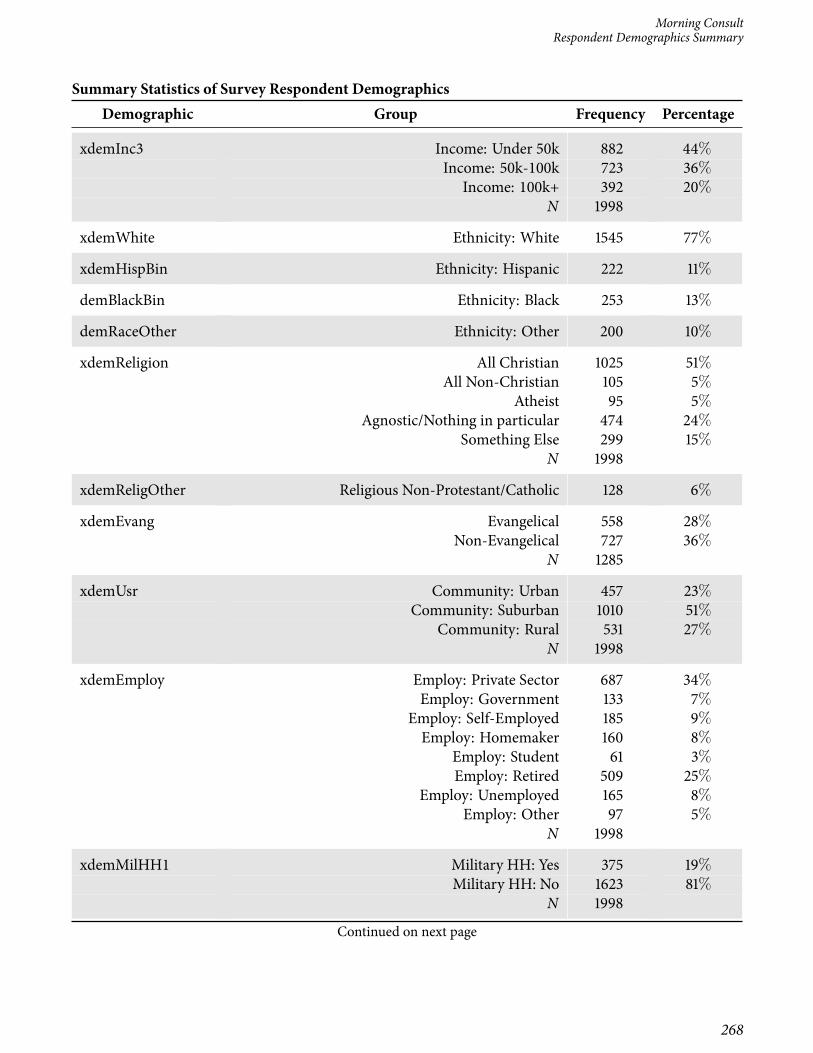
Morning ConsultRespondent Demographics Summary
Summary Statistics of Survey Respondent DemographicsDemographic Group Frequency Percentage
xdemInc3 Income: Under 50k 882 44%Income: 50k-100k 723 36%
Income: 100k+ 392 20%N 1998
xdemWhite Ethnicity: White 1545 77%
xdemHispBin Ethnicity: Hispanic 222 11%
demBlackBin Ethnicity: Black 253 13%
demRaceOther Ethnicity: Other 200 10%
xdemReligion All Christian 1025 51%All Non-Christian 105 5%
Atheist 95 5%Agnostic/Nothing in particular 474 24%
Something Else 299 15%N 1998
xdemReligOther Religious Non-Protestant/Catholic 128 6%
xdemEvang Evangelical 558 28%Non-Evangelical 727 36%
N 1285
xdemUsr Community: Urban 457 23%Community: Suburban 1010 51%
Community: Rural 531 27%N 1998
xdemEmploy Employ: Private Sector 687 34%Employ: Government 133 7%
Employ: Self-Employed 185 9%Employ: Homemaker 160 8%
Employ: Student 61 3%Employ: Retired 509 25%
Employ: Unemployed 165 8%Employ: Other 97 5%
N 1998
xdemMilHH1 Military HH: Yes 375 19%Military HH: No 1623 81%
N 1998
Continued on next page
268

National Tracking Poll #2110009, October, 2021Respondent Demographics Summary
Summary Statistics of Survey Respondent DemographicsDemographic Group Frequency Percentage
xnr1 RD/WT: Right Direction 745 37%RD/WT: Wrong Track 1253 63%
N 1998
xdemBidenApprove Biden Job Approve 890 45%Biden Job Disapprove 1031 52%
N 1921
xdemBidenApprove2 Biden Job Strongly Approve 446 22%Biden Job Somewhat Approve 444 22%
Biden Job Somewhat Disapprove 250 12%Biden Job Strongly Disapprove 781 39%
N 1921
xdemBidenFav Favorable of Biden 899 45%Unfavorable of Biden 1032 52%
N 1932
xdemBidenFavFull Very Favorable of Biden 470 24%Somewhat Favorable of Biden 429 21%
Somewhat Unfavorable of Biden 246 12%Very Unfavorable of Biden 786 39%
N 1932
xnr3 #1 Issue: Economy 742 37%#1 Issue: Security 409 20%
#1 Issue: Health Care 248 12%#1 Issue: Medicare / Social Security 209 10%
#1 Issue: Women’s Issues 111 6%#1 Issue: Education 72 4%
#1 Issue: Energy 90 4%#1 Issue: Other 117 6%
N 1998
xsubVote20O 2020 Vote: Joe Biden 946 47%2020 Vote: Donald Trump 864 43%
2020 Vote: Other 35 2%2020 Vote: Didn’t Vote 153 8%
N 1998
xsubVote18O 2018 House Vote: Democrat 734 37%2018 House Vote: Republican 719 36%
2018 House Vote: Someone else 53 3%N 1506
Continued on next page
269
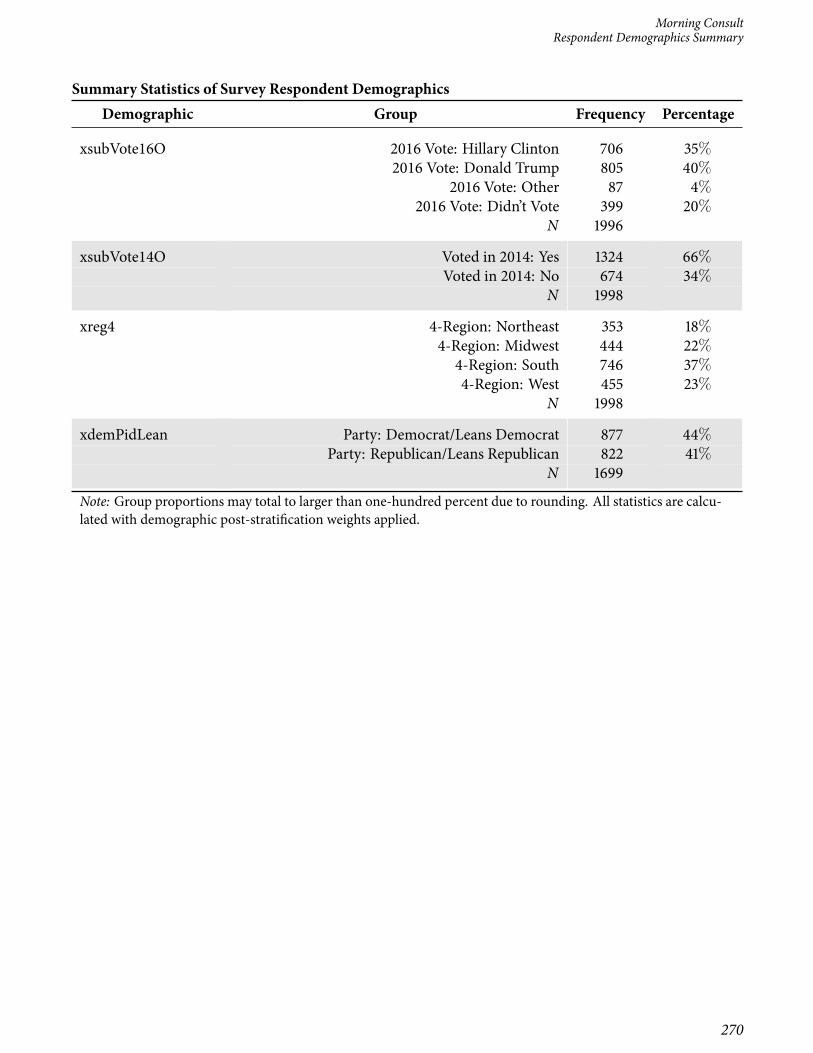
Morning ConsultRespondent Demographics Summary
Summary Statistics of Survey Respondent DemographicsDemographic Group Frequency Percentage
xsubVote16O 2016 Vote: Hillary Clinton 706 35%2016 Vote: Donald Trump 805 40%
2016 Vote: Other 87 4%2016 Vote: Didn’t Vote 399 20%
N 1996
xsubVote14O Voted in 2014: Yes 1324 66%Voted in 2014: No 674 34%
N 1998
xreg4 4-Region: Northeast 353 18%4-Region: Midwest 444 22%
4-Region: South 746 37%4-Region: West 455 23%
N 1998
xdemPidLean Party: Democrat/Leans Democrat 877 44%Party: Republican/Leans Republican 822 41%
N 1699
Note: Group proportions may total to larger than one-hundred percent due to rounding. All statistics are calcu-lated with demographic post-stratification weights applied.
270

National Tracking Poll #2110009, October, 2021 271