national transit summaries and trends peter rogoff … figure 8: unlinked passenger trips by mode...
TRANSCRIPT

National Transit Summaries and Trends National Transit Database 2010 Report Year
Peter Rogoff Administrator
Federal Transit Administration US Department of Transportation November 2011

2010 National Transit Summaries and Trends
i
Contents for the 2010 National Transit Database Report Year .............................................................................................................. i
Contents................................................................................................................................................................... i Figures .................................................................................................................................................................... ii
Introduction .................................................................................................................................................................... 1 General Information .................................................................................................................................................... 1 Transit Modes ............................................................................................................................................................. 1
Bus .......................................................................................................................................................................... 1 Commuter Rail ........................................................................................................................................................ 1 Heavy Rail............................................................................................................................................................... 2 Demand Response ................................................................................................................................................. 2 Demand Response – Taxi (DT) .............................................................................................................................. 2 Light Rail ................................................................................................................................................................. 2 Vanpool ................................................................................................................................................................... 3
Rounding and Inflation ............................................................................................................................................... 3 Web Information ......................................................................................................................................................... 3
Transit in the United States ............................................................................................................................................ 4 Total Federal Assistance (Capital and Operating) Applied to Transit and Unlinked Passenger Trips ........................ 4
Concepts ................................................................................................................................................................. 4 Comments............................................................................................................................................................... 4
Number of Transit Agencies ....................................................................................................................................... 5 Concepts ................................................................................................................................................................. 5 Comments............................................................................................................................................................... 5
Vehicle Revenue Miles ............................................................................................................................................... 7 Concepts ................................................................................................................................................................. 7 Comments............................................................................................................................................................... 7
Unlinked Passenger Trips by Mode ............................................................................................................................ 9 Comments............................................................................................................................................................... 9
Distribution of Vehicle Revenue Miles and Unlinked Passenger Trips by Mode....................................................... 10 Relative Impact on Data by UZA Size Group ........................................................................................................... 12
Concepts ............................................................................................................................................................... 12 Comments............................................................................................................................................................. 12
Rural Transit ............................................................................................................................................................. 12 Concepts ............................................................................................................................................................... 12 Comments............................................................................................................................................................. 13
Operating and Capital Funding - Rural ..................................................................................................................... 13 Concepts ............................................................................................................................................................... 13 Comments............................................................................................................................................................. 13
Service Supplied and Consumed ............................................................................................................................. 15 Operating Costs and Performance Measures .............................................................................................................. 16
Operating Expenses ................................................................................................................................................. 16 Concepts ............................................................................................................................................................... 16 Comments............................................................................................................................................................. 16
Operating Expense by Function and Object Class ................................................................................................... 17 Concepts ............................................................................................................................................................... 17 Comments............................................................................................................................................................. 17
Cost Effectiveness (Operating Expense per Unlinked Passenger Trip) ................................................................... 18 Concepts ............................................................................................................................................................... 18 Comments............................................................................................................................................................. 18
Cost Efficiency (Operating Expense per Vehicle Revenue Hour) ............................................................................. 20 Concepts ............................................................................................................................................................... 20 Comments............................................................................................................................................................. 20
Service Effectiveness ............................................................................................................................................... 21 Concepts ............................................................................................................................................................... 21 Comments............................................................................................................................................................. 21
Load Factor .............................................................................................................................................................. 24 Concepts ............................................................................................................................................................... 24 Comments............................................................................................................................................................. 24
Service Utilization ..................................................................................................................................................... 24 Concepts ............................................................................................................................................................... 24 Comments............................................................................................................................................................. 25
Quality of Transit Service ............................................................................................................................................. 27 Fatalities ................................................................................................................................................................... 27

2010 National Transit Summaries and Trends
ii
Concepts ............................................................................................................................................................... 27 Comments............................................................................................................................................................. 28
Distribution of Fatalities ............................................................................................................................................ 28 Concepts ............................................................................................................................................................... 28 Comments............................................................................................................................................................. 28
Reliability ...................................................................................................................................................................... 29 Miles between Major Mechanical System Failures — Bus ....................................................................................... 29
Concepts ............................................................................................................................................................... 29 Comments............................................................................................................................................................. 29
ADA Compliance — Bus .............................................................................................................................................. 30 ADA Lift- or Ramp-equipped .................................................................................................................................... 30
Concepts ............................................................................................................................................................... 30 Comments............................................................................................................................................................. 30
Operating Funding .................................................................................................................................................... 31 Concepts ............................................................................................................................................................... 31 Comments............................................................................................................................................................. 31
Federal Operating Assistance per Trip – Total and by Urbanized Area Size............................................................ 32 Farebox Recovery Ratio (Fare Revenues per Operating Expense) ......................................................................... 33
Concepts ............................................................................................................................................................... 33 Comments............................................................................................................................................................. 34
Subsidy per Trip ....................................................................................................................................................... 35 Concepts ............................................................................................................................................................... 35 Comments............................................................................................................................................................. 35
Operating Funding Sources by UZA ......................................................................................................................... 36 Concepts ............................................................................................................................................................... 36 Comments............................................................................................................................................................. 36
Capital Investment in Transit .................................................................................................................................... 38 Concepts ............................................................................................................................................................... 38 Comments............................................................................................................................................................. 38
Sources of Capital Funding by UZA ......................................................................................................................... 39 Comments............................................................................................................................................................. 39
Capital Expenditures ................................................................................................................................................ 41 Concepts ............................................................................................................................................................... 41
Uses of Capital by Urbanized Area Size................................................................................................................... 42 Comments............................................................................................................................................................. 42
Distribution of Capital by Mode and Category .......................................................................................................... 43 Comments............................................................................................................................................................. 43
Fleet Characteristics .................................................................................................................................................... 43 Average Fleet Age by Vehicle Type ......................................................................................................................... 43
Concepts ............................................................................................................................................................... 43 Comments............................................................................................................................................................. 44
Age Distribution of Buses by Vehicle Type ............................................................................................................... 46 Comments............................................................................................................................................................. 46
Fixed Guideway Mileage .......................................................................................................................................... 48 Concepts ............................................................................................................................................................... 48 Comments............................................................................................................................................................. 49
Alternative Fuel Usage ............................................................................................................................................. 49 Concepts ............................................................................................................................................................... 49 Comments............................................................................................................................................................. 50
National Transit Profile .................................................................................................................................................51
Data Used to Compile Graphics ................................................................................................................................... 54 Transit Data by 2000 U.S. Census Urbanized Area ....................................................................................................82
Figures Figure 1: Federal Funds Applied to Transit 1991 – 2010 ............................................................................................... 4 Figure 2: Unlinked Passenger Trips 1991 – 2010 .......................................................................................................... 5 Figure 3: Number of Agencies Reporting by Mode 2001 – 2010.................................................................................... 6 Figure 4: Number of Agencies Reporting by Mode 2009 – 2010.................................................................................... 6 Figure 5: Vehicle Revenue Miles by Mode 2009 – 2010 (Millions) ................................................................................. 8 Figure 6: Vehicle Revenue Miles by Mode 2001 – 2010 (Millions) ................................................................................. 8 Figure 7: Unlinked Passenger Trips by Mode 2009 – 2010 (Millions) ............................................................................ 9

iii
Figure 8: Unlinked Passenger Trips by Mode 2001 – 2010 (Millions) .......................................................................... 10 Figure 9: Distribution of Vehicle Revenue Miles – 2001 ............................................................................................... 11 Figure 10: Distribution of Vehicle Revenue Miles – 2010 ............................................................................................. 11 Figure 11: Distribution of Unlinked Passenger Trips – 2001 ........................................................................................ 11 Figure 13: Relative Impact of the Data by UZA Size Group – 2010 ............................................................................. 12 Figure 14: Types of Rural Service – 2010 .................................................................................................................... 13 Figure 15: Sources of Capital Funding – 2010 ............................................................................................................ 14 Figure 16: Sources of Operating Funding – 2010 ........................................................................................................ 14 Figure 17: Total Operating Expenses 2001 - 2010....................................................................................................... 14 Figure 18: Total Operating Expense by Mode — 2010 ................................................................................................ 17 Figure 19: Operating Expense by Function - 2010 ....................................................................................................... 18 Figure 20: Operating Expense by Object Class - 2010 ................................................................................................ 18 Figure 21: Operating Expense per Unlinked Passenger Trip 2001 – 2010 .................................................................. 18 Figure 22: Operating Expense per Unlinked Passenger Trip for Bus and Rail Modes 2001 - 2010 ............................. 20 Figure 23: Total Operating Expense per Vehicle Revenue Hour 2001 – 2010 ............................................................. 21 Figure 24: Unlinked Passenger Trip per Vehicle Revenue Hour 2001 – 2010 ............................................................. 22 Figure 27: Motor Bus Service Utilization 2001 - 2010 .................................................................................................. 25 Figure 28: Commuter Rail Service Utilization 2001 – 2010 .......................................................................................... 25 Figure 29: Heavy Rail Service Utilization 2001 - 2010 ................................................................................................. 26 Figure 30: Light Rail Service Utilization 2001 - 2010 .................................................................................................... 26 Figure 31: Total Fatalities (*) 2001 – 2010 ................................................................................................................... 27 Figure 32: Fatalities per 100 Million Passenger Miles — 2001-2010 ........................................................................... 28 Figure 33: Miles between Major Mechanical System Failures — Bus 2003 – 2010 ..................................................... 29 Figure 34: ADA Compliance - Bus ............................................................................................................................... 31 Figure 35: Total Operating Funds 2001– 2010 ............................................................................................................ 31 Figure 36: Federal Operating Assistance as a Percentage of Operating Funds 2001 - 2010 ...................................... 32 Figure 37: Total Federal Operating Assistance per Trip 2001 - 2010........................................................................... 32 Figure 38: Federal Operating Assistance per Trip by Urbanized Area Size 2001 - 2010 ............................................. 33 Figure 39: Farebox Recovery Ratio by Urbanized Area Size 2001 – 2010 .................................................................. 34 Figure 40: Recovery Ratio (*) 2001 - 2010 ................................................................................................................... 34 Figure 41: Total Operating Subsidy per Trip 2001 - 2010 ............................................................................................ 35 Figure 42: Total Subsidy per Trip by Urbanized Area Size 2001 - 2010 ...................................................................... 36 Figure 43: UZAs with More than 1 Million Population - 2001 ....................................................................................... 37 Figure 44: UZAs with More than 1 Million Population - 2010 ....................................................................................... 37 Figure 45: Equal to or More than 200,000 and Less than 1 Million Population - 2001 ................................................. 37 Figure 46: Equal to or More than 200,000 and Less than 1 Million Population - 2010 ................................................. 37 Figure 47: UZAs with Less than 200,000 Population - 2001 ........................................................................................ 38 Figure 48: UZAs with Less than 200,000 Population - 20010 ...................................................................................... 38 Figure 49: Total Capital Assistance — 2001 - 2010 ..................................................................................................... 39 Figure 50: Percent of Federal Share of Total Capital Assistance 2001 - 2010 ............................................................. 39 Figure 51: UZAs with more than 1 Million Population ................................................................................................... 40 Figure 52: UZAs Equal to or More than 200,000 and Less than 1 Million Population .................................................. 40 Figure 53: UZAs with Less than 200,000 Population ................................................................................................... 40 Figure 54: Capital Expenditures — 2001 - 2010 .......................................................................................................... 41 Figure 55: UZAs with more than 1 Million Population ................................................................................................... 42 Figure 56: UZAs Equal to or More than 200,000 and Less than 1 Million Population .................................................. 42 Figure 57: UZAs with Less than 200,000 Populations.................................................................................................. 42 Figure 58: Percent of Uses of Capital Net of Revenue Vehicles Capital Expenditures 2001 — 2010 .......................... 43 Figure 59: Average Fleet Age by Vehicle Type 2001 – 2010 ....................................................................................... 44 Figure 60: Average Fleet Age by Mode (Heavy Rail, Light Rail) 2001 - 2010 .............................................................. 45 Figure 61: Average Vanpool Fleet Age Vanpool 2001 – 2010 ..................................................................................... 45 Figure 63: Average Bus Fleet Age 2001 - 2010 ........................................................................................................... 46 Figure 64: Percent of Bus Fleet 5 Years Old or Less by Vehicle Type 2001– 2010 ..................................................... 47 Figure 65: Percent of Rail Fleet 5 Years Old or Less 2001 - 2010 ............................................................................... 47 Figure 66: Percent of Vanpool Fleet 5 Years Old or Less 2001 - 2010 ........................................................................ 48 Figure 67: Percent of Ferryboat Fleet 5 Years Old or Less 2001 - 2010 ...................................................................... 48 Figure 68: Fixed Guideway Mileage — Bus 2003 - 2010 ............................................................................................. 49 Figure 69: Fixed Guideway Mileage — Rail Modes 2003 - 2010 ................................................................................. 49 Figure 70: Percent of National Bus Fleet Using Alternative Fuels 2001-2010 .............................................................. 50 Figure 71: Percentage of Fuel Consumption for Non-Electric Modes 2001 ................................................................ 50 Figure 72: Percentage of Fuel Consumption for Non-Electric Modes 2010 ................................................................ 50
2010 National Transit Summaries and Trends
1
Introduction
General Information Welcome to the National Transit Summaries and Trends (NTST), a portion of the Federal Transit Administration’s (FTA) annual report. The goal of the NTST is to summarize transit data in an easy to read format. The 2010 NTST discusses data covering the period 2001 to 2010.
On an average weekday, the nation’s transit systems carry approximately 32.7 million riders (unlinked passenger trips). There were 10 billion urban trips in 2010 and 138 million rural trips.
Transit Modes The NTST presents aggregate transit operating statistics by mode. Seventeen transit modes are included in the National Transit Database; for this publication statistics are presented for the predominant modes: bus, heavy rail, light rail, commuter rail, demand response,demand response-taxi and vanpool.
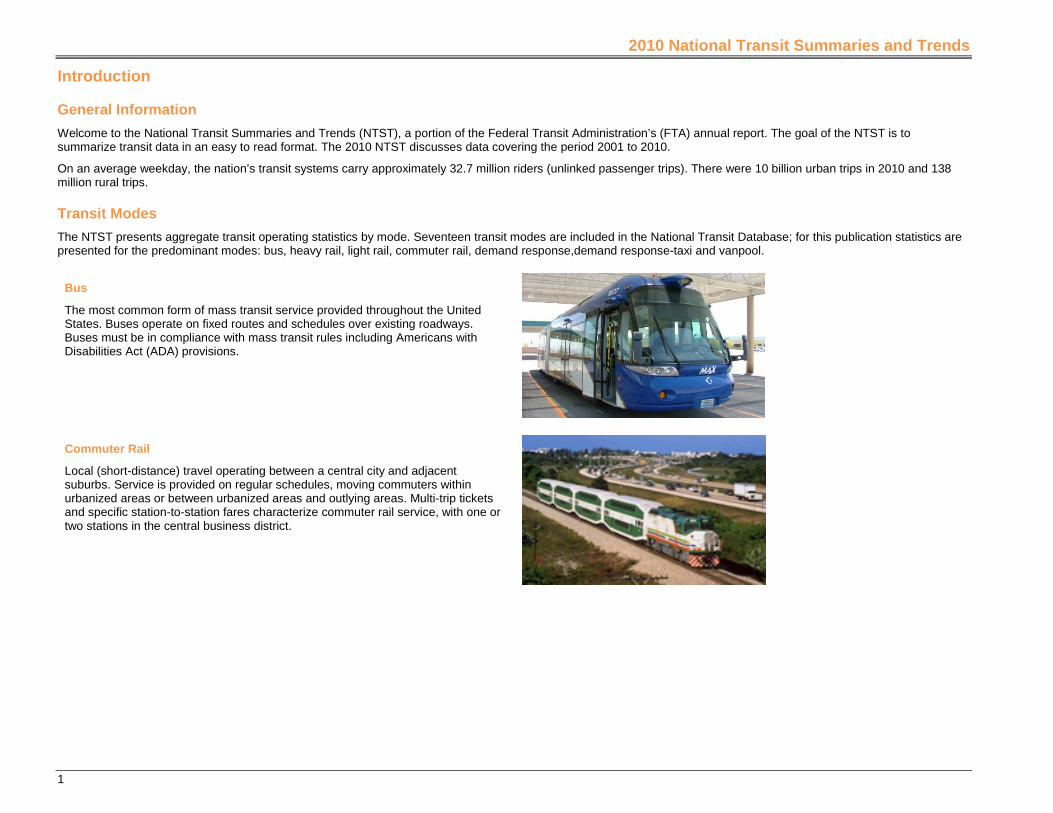
Bus
The most common form of mass transit service provided throughout the United States. Buses operate on fixed routes and schedules over existing roadways. Buses must be in compliance with mass transit rules including Americans with Disabilities Act (ADA) provisions.
Commuter Rail
Local (short-distance) travel operating between a central city and adjacent suburbs. Service is provided on regular schedules, moving commuters within urbanized areas or between urbanized areas and outlying areas. Multi-trip tickets and specific station-to-station fares characterize commuter rail service, with one or two stations in the central business district.

2010 National Transit Summaries and Trends
2
Heavy Rail
Heavy rail service is characterized by high-speed and rapid acceleration passenger rail cars operating singly or in multi-car trains on fixed electric rails; separate rights-of-way from which all other traffic is excluded; sophisticated signaling, high platform loading and a heavy passenger volume.
Demand Response
Service (passenger cars, vans or small buses) provided upon request to pick up and transport passengers to and from their destinations. Typically, a vehicle may be dispatched to pick up several passengers at different pick-up points before taking them to their respective destinations and may be interrupted en route to these destinations to pick up other passengers.
Demand Response – Taxi (DT) A special form of the demand response mode operated through taxicab providers. The mode is always purchased transportation type of service.
Light Rail
Light rail is an electric railway with a lighter passenger volume compared to heavy rail. Passenger cars operating singly (or in short, two-car trains) on fixed rails in shared or exclusive right-of-way, low or high platform loading characterize light rail service. The vehicle’s power is drawn from an overhead electric wire.
2010 National Transit Summaries and Trends
3
Vanpool
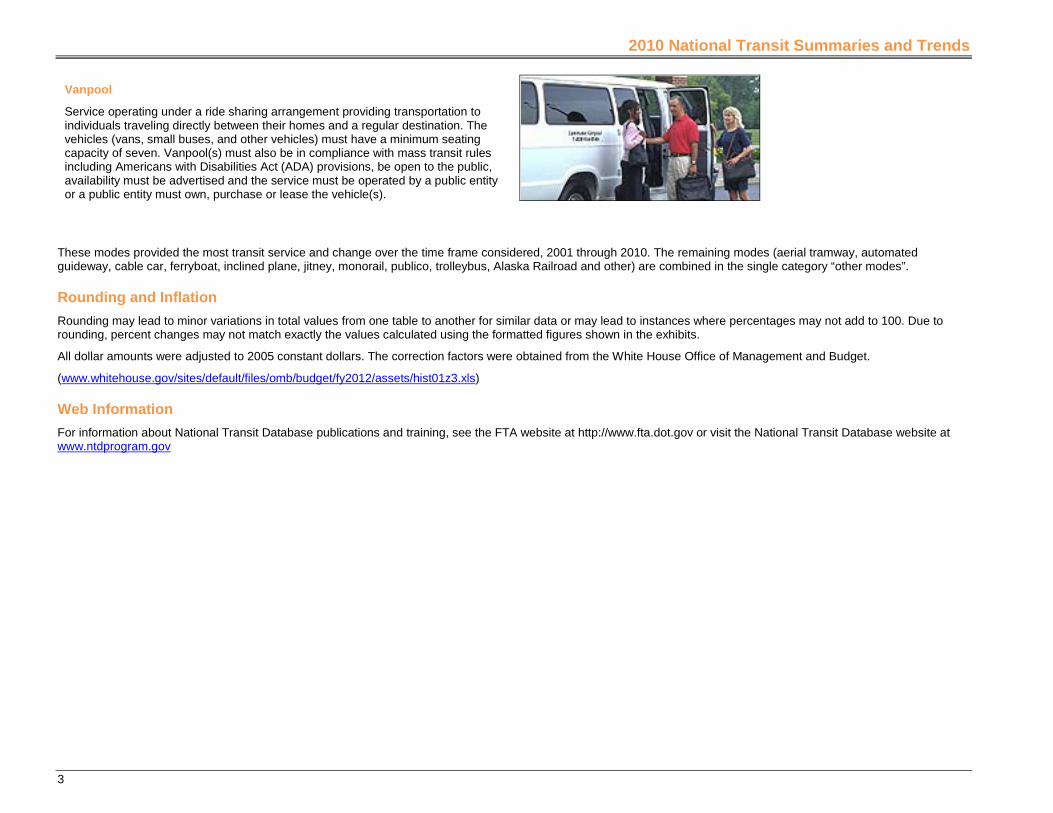
Service operating under a ride sharing arrangement providing transportation to individuals traveling directly between their homes and a regular destination. The vehicles (vans, small buses, and other vehicles) must have a minimum seating capacity of seven. Vanpool(s) must also be in compliance with mass transit rules including Americans with Disabilities Act (ADA) provisions, be open to the public, availability must be advertised and the service must be operated by a public entity or a public entity must own, purchase or lease the vehicle(s).
These modes provided the most transit service and change over the time frame considered, 2001 through 2010. The remaining modes (aerial tramway, automated guideway, cable car, ferryboat, inclined plane, jitney, monorail, publico, trolleybus, Alaska Railroad and other) are combined in the single category “other modes”.
Rounding and Inflation Rounding may lead to minor variations in total values from one table to another for similar data or may lead to instances where percentages may not add to 100. Due to rounding, percent changes may not match exactly the values calculated using the formatted figures shown in the exhibits.
All dollar amounts were adjusted to 2005 constant dollars. The correction factors were obtained from the White House Office of Management and Budget.
(www.whitehouse.gov/sites/default/files/omb/budget/fy2012/assets/hist01z3.xls)
Web Information For information about National Transit Database publications and training, see the FTA website at http://www.fta.dot.gov or visit the National Transit Database website at www.ntdprogram.gov

2010 National Transit Summaries and Trends
4
Transit in the United States
Total Federal Assistance (Capital and Operating) Applied to Transit and Unlinked Passenger Trips
Concepts
Federal funds applied to transit are Federal Transit Administration (FTA) Urbanized Area Formula Program funds (financial assistance used to offset operating costs and pay for capital projects) and other Federal funds.
Unlinked passenger trips are the number of patrons boarding public transportation vehicles.
Comments
Ridership (*) increased by 28.7 percent from 1991 to 2010. During the same period, Federal assistance applied to transit increased by nearly 74.3percent (constant 2005 dollars).
Figure 1: Federal Funds Applied to Transit 1991 – 2010
$2,000
$3,000
$4,000
$5,000
$6,000
$7,000
$8,000
$9,000
$10,000
$11,000
1991 1993 1995 1997 1999 2001 2003 2005 2007 2009
Actual Dollars Constant 2005 Dollars

2010 National Transit Summaries and Trends
5
Figure 2: Unlinked Passenger Trips 1991 – 2010
.
Number of Transit Agencies
Concepts
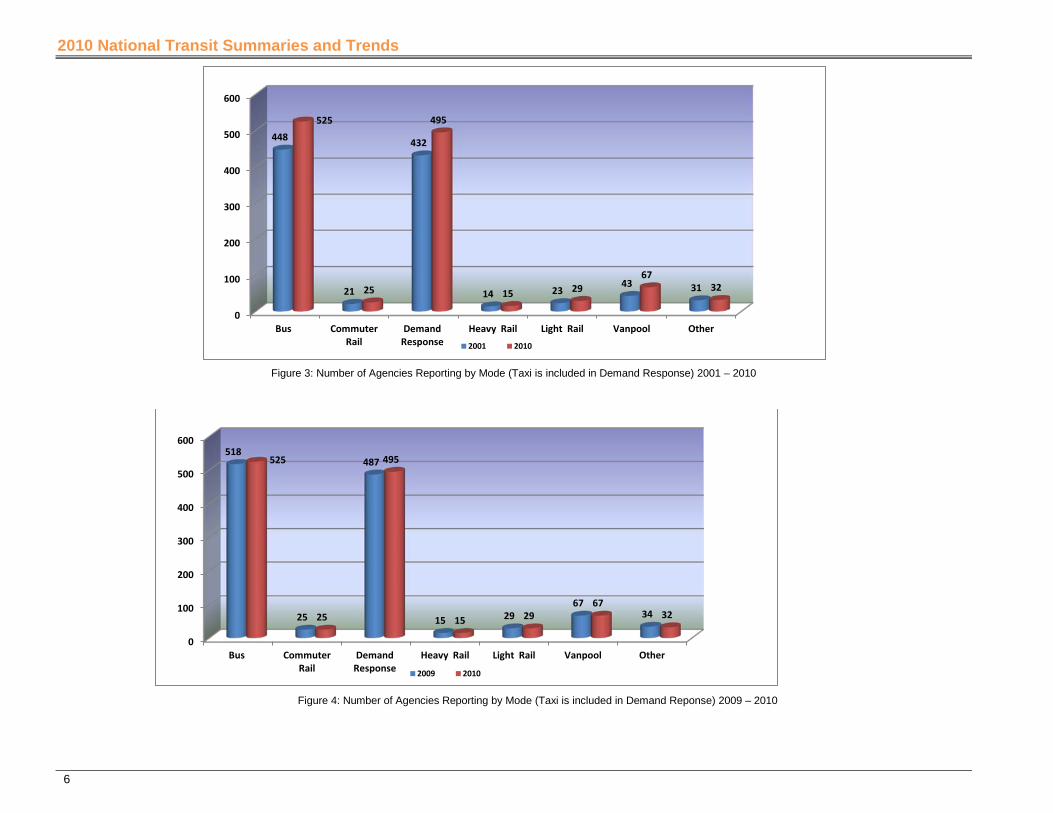
Transit agencies that receive or benefit from Federal Transit Administration (FTA) Urbanized Area Formula Program funds (capital or operating) are required to report selected transit data to the National Transit Database (NTD) program. In addition, transit agencies not receiving FTA funds are encouraged to submit data, providing a more complete picture of public transit throughout the United States. These transit agencies report financial (capital and operating) data and non-financial operating statistics by transit mode. A total of 742 transit agencies reported data in 2010.
Comments • The number of bus systems increased in the last 10 years (77 new systems). • Demand response combined with Demand Response-Taxi increased by nearly 14.5 percent (63 new systems) over the same period, reflecting the need to continue
providing special transit service for elderly individuals and individuals with disabilities. Demand Response-Taxi is combined with Demand Response in below Figure 3 and Figure 4.
• Vanpool increased by 56 percent (24 new systems) during the 10 year period.
2010 National Transit Summaries and Trends
6
Figure 3: Number of Agencies Reporting by Mode (Taxi is included in Demand Response) 2001 – 2010
Figure 4: Number of Agencies Reporting by Mode (Taxi is included in Demand Reponse) 2009 – 2010
0
100
200
300
400
500
600
Bus Commuter Rail
Demand Response
Heavy Rail Light Rail Vanpool Other
448
21
432
14 23 43 31
525
25
495
15 29 67
32
2001 2010
0
100
200
300
400
500
600
Bus Commuter Rail
Demand Response
Heavy Rail Light Rail Vanpool Other
518
25
487
15 29 67
34
525
25
495
15 29 67
32
2009 2010

2010 National Transit Summaries and Trends
7
Table 1: Number of Agencies Reporting by Year by Mode between 2001 - 2010
Year Bus * Demand
Response * Vanpool * Heavy Rail Commuter Rail Light Rail Demand
Response Taxi Other Modes * 2001 448 432 43 14 21 23 31
2002 456 423 42 14 19 23 31
2003 463 433 47 14 19 25 31
2004 471 441 43 14 19 27 31
2005 476 449 51 15 20 27 30
2006 491 464 52 15 20 27 28
2007 497 473 57 15 21 26 30
2008 504 474 62 15 22 29 34
2009 518 487 67 15 25 29 34
2010 525 488 67 15 25 29 66 32
Actual Change 77 56 24 1 4 6 66 1
(*) Data does not include agencies receiving nine or fewer vehicles waiver.
Vehicle Revenue Miles
Concepts
Vehicle revenue miles are the miles a transit vehicle travels while in revenue service. A transit vehicle is in revenue service when the vehicle is available to the public with the expectation of carrying passengers. Passengers pay full fares, reduced fares (senior citizen, student, special ride fares, etc.), or provide payment through some contractual agreement.
Deadhead travel is not included in vehicle revenue miles. Deadhead mileage consists of the miles a transit vehicle travels while not in revenue service (leaving or returning to the garage or yard or changing routes).
Comments
Vehicle revenue miles increased by 18.1 percent between 2001 and 2010 over all modes. Modes showing the most significant growth are those that had an increase in the number of systems in operation during the period.
• Light rail – 73.1 percent • Demand response ( combined with Demand Response Taxi) –46.5percent • Vanpool – 176.4 percent • Bus – 5.3 percent • Commuter Rail – 24.5 percent. • Demand Response Taxi is a new mode reported in 2010 but It is combined with Demand Response in figure 5 and Figure 6

2010 National Transit Summaries and Trends
8
Figure 5: Vehicle Revenue Miles by Mode (Taxi data is combined with Demand Response) 2009 – 2010 (Millions)
Figure 6: Vehicle Revenue Miles by Mode (Taxi data is combined with Demand Response) 2001 – 2010 (Millions)
0
200
400
600
800
1,000
1,200
1,400
1,600
1,800
2,000
Bus Commuter Rail
Demand Response
Heavy Rail Light Rail Vanpool Other
1,969
312
724 667
89 171
56
1,917
315
718 647
92 181
50
2009 2010
0
200
400
600
800
1,000
1,200
1,400
1,600
1,800
2,000
Bus Commuter Rail
Demand Response
Heavy Rail Light Rail Vanpool Other
1,821
253
490 591
53 65 45
1,917
315
718 647
92 181
50
2001 2010

2010 National Transit Summaries and Trends
9
Unlinked Passenger Trips by Mode
Comments
Rider ship increased by over 18.1 percent from 2001 to 2010
Figure 7: Unlinked Passenger Trips by Mode (Taxi data is combined with Demand Response) 2009 – 2010 (Millions)
(*) 2006 data adjusted to correct a bias reported by a large heavy rail operator.
0
1,000
2,000
3,000
4,000
5,000
6,000
Bus Commuter Rail
Demand Response
Heavy Rail Light Rail Vanpool Other
5,359
464 100
3,490
464 32 225
5,139
460 99
3,550
456 31 225
2009 2010
Table 2: Vehicle Revenue Miles (Millions) 2001 - 2010
Year Vehicle Revenue Miles (Millions) 2001 3,319 2002 3,427 2003 3,476 2004 3,548 2005 3,602 2006 3,671 2007 3,769 2008 3,894 2009 3,987 2010 3920
% Change 18.1

2010 National Transit Summaries and Trends
10
Figure 8: Unlinked Passenger Trips by Mode (Taxi data is combined with Demand Response) 2001 – 2010 (Millions)
Distribution of Vehicle Revenue Miles and Unlinked Passenger Trips by Mode The share of vehicle revenue miles for demand response has increased from slightly more than 14.7 percent in 2001 to 17.5 percent in 2010 while the share of vehicle revenue miles for bus decreased from 54.8 percent to 48.9 percent.
At the same time, the share of unlinked passenger trips for demand response increased slightly to 0.9 percent, illustrating the low capacity nature of this service, while the share of unlinked passenger trips for bus decreased from 57.8 percent in 2001 to 51.5 percent in 2010.
0
1,000
2,000
3,000
4,000
5,000
6,000
Bus Commuter Rail
Demand Response
Heavy Rail Light Rail Vanpool Other
5,215
418 77
2,728
334 12
224
5,139
460 99
3,550
456 31
225
2001 2010

2010 National Transit Summaries and Trends
11
Figure 9: Distribution of Vehicle Revenue Miles – 2001
Figure 10: Distribution of Vehicle Revenue Miles – 2010
Figure 11: Distribution of Unlinked Passenger Trips – 2001
Figure 12: Distribution of Unlinked Passenger Trips – 2010
2010 National Transit Summaries and Trends
12
Relative Impact on Data by UZA Size Group
Concepts
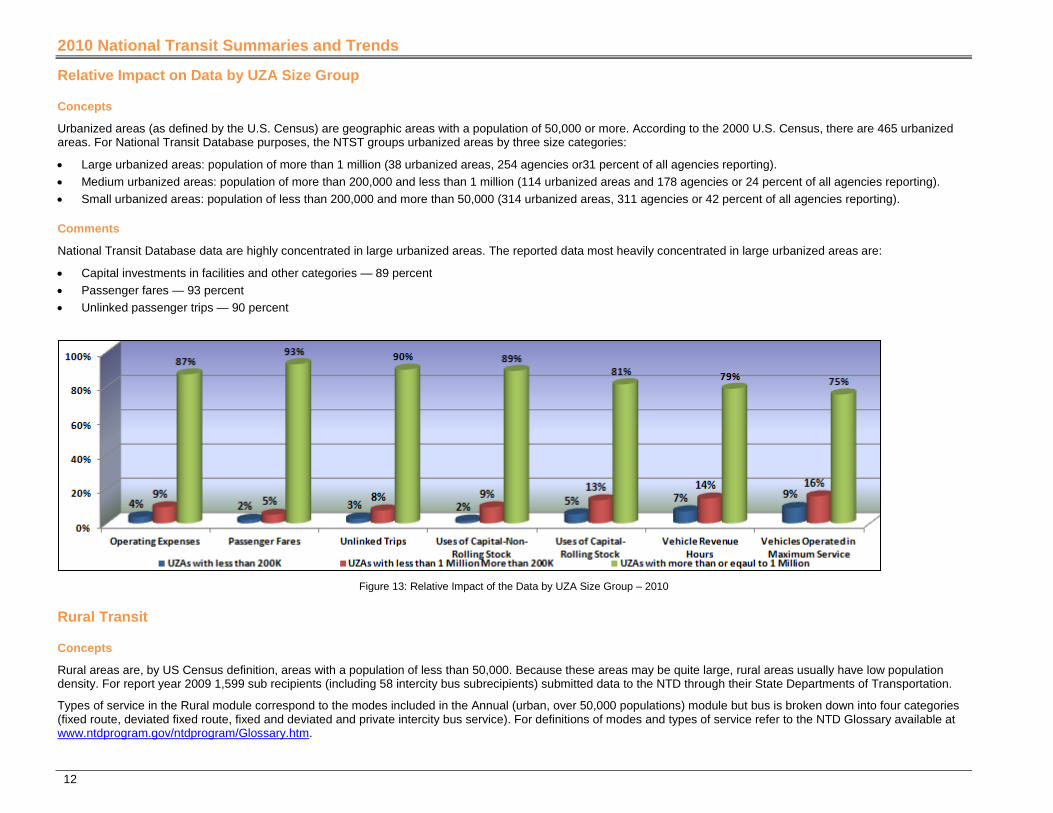
Urbanized areas (as defined by the U.S. Census) are geographic areas with a population of 50,000 or more. According to the 2000 U.S. Census, there are 465 urbanized areas. For National Transit Database purposes, the NTST groups urbanized areas by three size categories:
• Large urbanized areas: population of more than 1 million (38 urbanized areas, 254 agencies or31 percent of all agencies reporting). • Medium urbanized areas: population of more than 200,000 and less than 1 million (114 urbanized areas and 178 agencies or 24 percent of all agencies reporting). • Small urbanized areas: population of less than 200,000 and more than 50,000 (314 urbanized areas, 311 agencies or 42 percent of all agencies reporting).
Comments
National Transit Database data are highly concentrated in large urbanized areas. The reported data most heavily concentrated in large urbanized areas are:
• Capital investments in facilities and other categories — 89 percent • Passenger fares — 93 percent • Unlinked passenger trips — 90 percent
Figure 13: Relative Impact of the Data by UZA Size Group – 2010
Rural Transit
Concepts
Rural areas are, by US Census definition, areas with a population of less than 50,000. Because these areas may be quite large, rural areas usually have low population density. For report year 2009 1,599 sub recipients (including 58 intercity bus subrecipients) submitted data to the NTD through their State Departments of Transportation.
Types of service in the Rural module correspond to the modes included in the Annual (urban, over 50,000 populations) module but bus is broken down into four categories (fixed route, deviated fixed route, fixed and deviated and private intercity bus service). For definitions of modes and types of service refer to the NTD Glossary available at www.ntdprogram.gov/ntdprogram/Glossary.htm.

2010 National Transit Summaries and Trends
13
Comments • Due to the low population density of rural areas, types of service such as demand response and bus – deviated fixed route are the most common in rural transit and
accounted for 80 percent of all rural service in 2010
Figure 14: Types of Rural Service – 2010
Operating and Capital Funding - Rural
Concepts
Sources of funds (operating and capital) include assistance local, state and federal and funds generated by the service providers (fares and contract revenues).
FTA funding categories available for Rural Transit are:
• Section 5309 - FTA Capital Program • Section 5310 - FTA Special Needs of Elderly Individuals and Individuals with Disabilities Program • Section 5311 – FTA Non-Urbanized Area Program • Section 5316 - FTA Job Access and Reverse Commute Program • Section 5317 - FTA New Freedom Program • Section 5320 - FTA Alternative Transportation in Parks and Public Lands Program
Comments
Rural transit operating budgets required 30 percent from federal assistance, and 26.5 percent from directly generated funds.
Rural transit capital budgets relied mostly on Federal assistance, accounting for nearly 90 percent of all capital applied.
Demand Response 67.54%
Bus Both 4.35%
Bus Deviated Fixed
12.94%
Bus Fixed 9.73%
Bus Intercity
3.32%
Other 1.20%
VanPool 0.92%

2010 National Transit Summaries and Trends
14
In 2010, ARRA funds were used to pay for capital projects in rural areas. In general, buses and rolling stock are the main use of capital in these areas. ARRA Funds accounted for more than 60% of capital funds in 2010.
Figure 15: Sources of Capital Funding – 2010
Figure 16: Sources of Operating Funding – 2010
ARRA Other Than UAF
Formula 5311, 57.5%
FTA Other Than UAF
Program 5311, 10.7%
FTA Capital Program 5309,
10.5%
State Assistance,
5.6%
ARRA Grants for
Provisioning/Planning and Operations,
4.4%
Local Assistance,
4.4%
FTA ADA Program 5310,
2.7%
Other, 4.1%
Local Assistance,
24.9% FTA Other Than UAF Program
5311, 23.0%
Contract Revenues,
18.8%
State Assistance,
18.2%
Fare Revenues,
7.7% Grants for
Provisioning/Planning and Opera, 1.5%
Other Federal Funds, 1.5%
FTA Job Access
Program 5316, 1.0%
Other, 3.4%

2010 National Transit Summaries and Trends
15
Service Supplied and Consumed
Table 3: Rural Service Supplied and Consumed - 2010 Fare Revenues (Millions) 99.5
Operating Expenses (Millions) 1,263.7
Unlinked Passenger Trips (Millions) 138.0
Vehicle Miles (Millions) 542.6
Vehicle Hours (Millions) 31.5
Operating Expenses per Vehicle Mile 2.3
Operating Expenses per Vehicle Hour 40.1
Operating Expenses per Unlinked Passenger Trip 9.2
Recovery Ratio (Fare Revenues per Operating Expense) 7.9%
Rural performance measures are typical of service provided in low density areas such as low recovery ratios, and high cost per trip among others.
Table 4: Rural Safety
Total Number of Subrecipients
Safety Incidents
Average Safety Incidents per Subrecipient
Major Incidents 1400
340 .24
Major Injuries 1400 410 .29
Fatalities 1400 6 .0042

2010 National Transit Summaries and Trends
16
Operating Costs and Performance Measures
Operating Expenses
Concepts
Operating expenses are those expenses incurred by transit agencies that are associated with operating mass transportation services (vehicle operations, maintenance and administration). Reconciling items are expenses that vary as transit agencies have different accounting practices due to local ordinances on accounting treatments. Regarding performance measures, the NTST excludes reconciling items such as depreciation, interest expenses, leases and rentals.
Comments
Operating expenses increased nearly 29.9 percent over the last 10 years.
Figure 17: Total Operating Expenses 2001 - 2010
2010 National Transit Summaries and Trends
17
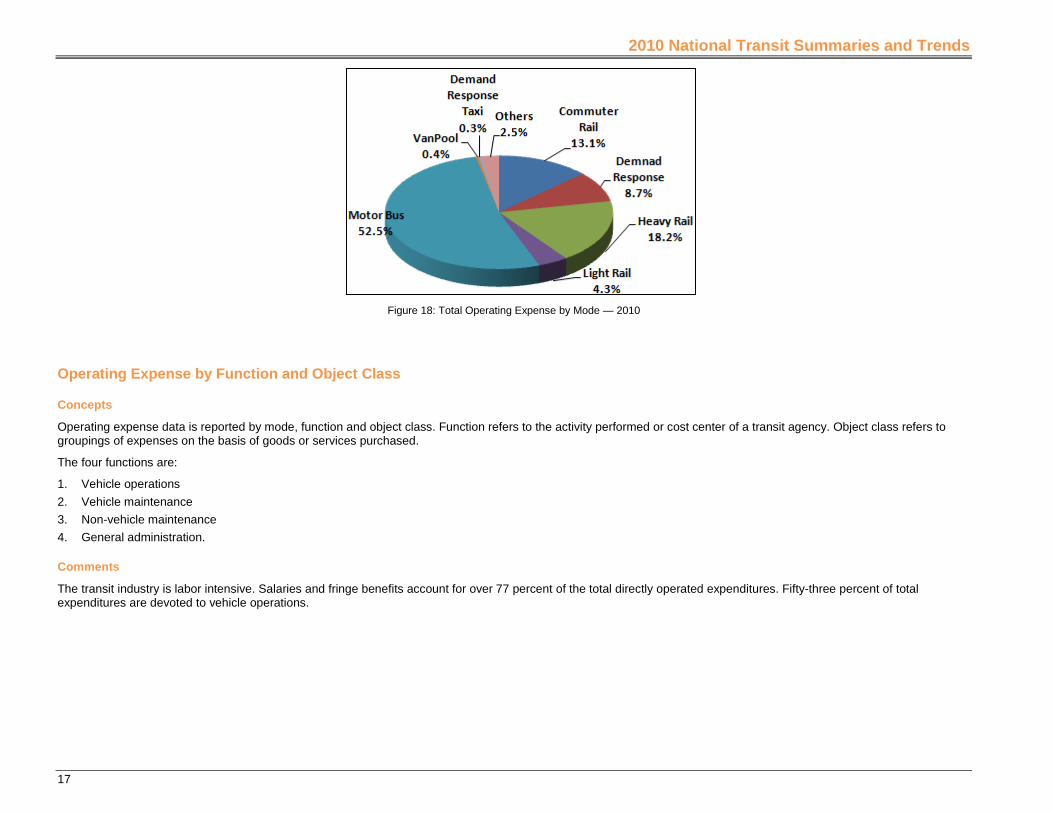
Figure 18: Total Operating Expense by Mode — 2010
Operating Expense by Function and Object Class
Concepts
Operating expense data is reported by mode, function and object class. Function refers to the activity performed or cost center of a transit agency. Object class refers to groupings of expenses on the basis of goods or services purchased.
The four functions are:
1. Vehicle operations 2. Vehicle maintenance 3. Non-vehicle maintenance 4. General administration.
Comments
The transit industry is labor intensive. Salaries and fringe benefits account for over 77 percent of the total directly operated expenditures. Fifty-three percent of total expenditures are devoted to vehicle operations.

2010 National Transit Summaries and Trends
18
Figure 19: Operating Expense by Function - 2010
Figure 20: Operating Expense by Object Class - 2010
Cost Effectiveness (Operating Expense per Unlinked Passenger Trip)
Concepts
Cost effectiveness is the relationship between service inputs and service consumption.
Service input is the quantity of resources expended to produce transit service, expressed in either monetary or non-monetary terms. Examples include operating cost (dollars expended for operations, maintenance and administration), employee hours (total operating, maintenance or administration), capital investment and energy (fuel cost or volume).
Service consumption is the amount of service used by the public expressed in either monetary or non-monetary terms. Examples include unlinked passenger trips, passenger miles and operating revenue.
Comments
Overall, operating expense per unlinked passenger trip increased 17.5 percent over the last 10 years. In addition, overall operating expense increased 29.9 percent during this same 10 year period.
Figure 21: Operating Expense per Unlinked Passenger Trip 2001 – 2010

2010 National Transit Summaries and Trends
19
Table 5: Operating Expense per Unlinked Passenger Trip 2001– 2010
(Constant 2005 Dollars)
Year Operating Expense (Millions)
Unlinked (*) Passenger Trips
(Millions)
Operating Expense per Unlinked Passenger
Trip 2001 $23,952 9,001 $2.66
2002 $25,021 9,018 $2.77
2003 $25,777 8,876 $2.90
2004 $26,350 8,937 $2.95
2005 $27,229 9,175 $2.97
2006 $28,018 9,379 $2.99
2007 $29,418 9,948 $2.96
2008 $30,348 10,257 $2.96
2009 $31,337 10,134 $3.09
2010 $31,119 9,960 $3.12
% Change 29.9% 10.7% 17.5%
(*) Adjusted for all years prior to 2007 to correct a bias reported by a large heavy rail operator.

2010 National Transit Summaries and Trends
20
Figure 22: Operating Expense per Unlinked Passenger Trip for Bus and Rail Modes 2001 - 2010
Cost Efficiency (Operating Expense per Vehicle Revenue Hour)
Concepts
Cost efficiency is the relationship between service inputs and service outputs.
Service output is the quantity of service produced by a transit operator, expressed in non-monetary terms. Examples include vehicle hours (total and revenue), vehicle miles (total and revenue), capacity miles (total vehicle capacity times revenue mileage), service reliability (miles between system failures) and safety (number of accidents).
Comments
Overall, operating expense per vehicle revenue hour increased by approximately 11 percent over the last 10 years.
$0
$5
$10
$15
$20
$25
$30
2001 2002 2003 2004 2005 2006 2007 2008 2009 2010
2.5
2.6
2.8
2.8
2.8
2.9
3.0
3.0
3.1
3.2
7.6 7.9 8.3 8.6
8.6
8.2
8.2
8.3 8.
9
8.9
$21.0 $22.7 $23.2 $23.7 $23.9
$25.0 $26.2
$27.2 $27.6 $29.3
1.5
1.5
1.6
1.6
1.6
1.5
1.6
1.6
1.6
1.6
2.3 2.
5
2.6
2.6
2.6
2.5
2.6
2.5 2.7 2.9
Bus Commuter Rail Demand response Heavy Rail Light Rail

2010 National Transit Summaries and Trends
21
Figure 23: Total Operating Expense per Vehicle Revenue Hour 2001 – 2010
Table 6: Operating Expense per Vehicle Revenue Hour 2001 - 2010
Year Operating Expense(Millions)
(Constant 2005 Dollars) Vehicle Revenue Hours
(Millions) Operating Expense per Vehicle
Revenue Hour (Constant 2005 Dollars)
2001 $23,953 223 $107.4
2002 $25,074 230 $108.9
2003 $25,798 234 $110.1
2004 $26,365 240 $109.9
2005 $27,238 241 $113.0
2006 $28,027 247 $113.7
2007 $29,426 254 $115.9
2008 $30,348 260 $116.6 2009 $31,368 267 $117.7 2010 $31,111 261 $119.4
% Change 62.9% 16.8% 11.2%
Service Effectiveness
Concepts
Service effectiveness is the relationship between service outputs and service consumption.
Comments
Unlinked passenger trips per vehicle revenue hour decreased by 8.9 percent from 2001 to 2010. .
$100.0
$105.0
$110.0
$115.0
$120.0
2001 2002 2003 2004 2005 2006 2007 2008 2009 2010
$107.4 $108.9
$110.1 $109.9
$113.0 $113.7 $115.9 $116.6
$117.7 $119.4
( Constant 2005 Dollars )

2010 National Transit Summaries and Trends
22
Figure 24: Unlinked Passenger Trip per Vehicle Revenue Hour 2001 – 2010
36.0
37.0
38.0
39.0
40.0
41.0
42.0
2001 2002 2003 2004 2005 2006 2007 2008 2009 2010
42.0
40.6
39.3 38.7
39.6 39.6 39.2 39.4
38.0 38.2

2010 National Transit Summaries and Trends
23
Table 7: Unlinked Passenger Trip per Vehicle Revenue Hour 2001 -2010 Year Unlinked
Passenger Trips (Millions) (*)
Vehicle Revenue Hours (Millions)
Unlinked Passenger Trips per Vehicle Revenue Hour
2001 9,356 223 42.0
2002 9,356 230 40.6
2003 9,216 234 39.3
2004 9,289 240 38.7
2005 9,536 241 39.6
2006 9,754 247 39.6
2007 9,948 254 39.2
2008 10,257 260 39.4
2009 10,134 267 38.0
2010 9,960 261 38.2
% Change 10.6% 16.8% -8.9%
(*) Adjusted for all years prior to 2007 to correct a bias reported by a large heavy rail operator.
Figure 25: Unlinked Passenger Trips per Vehicle Revenue Hour by Mode 2001 - 2010
0.0
20.0
40.0
60.0
80.0
100.0
120.0
2001 2002 2003 2004 2005 2006 2007 2008 2009 2010
Commuter Rail Demand Response Heavy Rail Light Rail
Bus Vanpool Others Demand Response Taxi

2010 National Transit Summaries and Trends
24
Load Factor
Concepts
Average load factor is the ratio of passenger miles traveled per vehicle revenue mile.
Comments • Commuter Rail average load factor decreased slightly in the last 10 years, and in the last 3 the decrease was1.5 percent. • Light Rail average load factor decreased slightly in the last 10 years and the last 3 the decrease was 0.4 percent. • Heavy Rail average load factor remained stable over the last 10 years and in the last 3 the decrease was 0.4 percent. • Bus average load factor remained stable in the last 10 years and the last 3.
Figure 26: Load Factor by Mode 2001- 2010
Service Utilization
Concepts
Average service utilization is defined in the NTST as the ratio vehicle revenue miles per directional route miles.
Average service utilization is inversely proportional to average headway, i.e. the higher the average service utilization, the smaller the average headway and vice-versa.
The geographical expansion of transit service may contribute to reductions in average service utilization if the average headway of expanded areas is greater than the average headway before the expansion.

2010 National Transit Summaries and Trends
25
Comments • Commuter Rail average service utilization increased 10.8 percent in the last 10 years and decreased approximately 3.1 percent in the last 3 years. 4 new systems were
added in the last 10 years and 3 since 2009. These facts indicate an expansion in commuter rail markets combined with an increase in service frequency to meet a higher demand for service.
• Light Rail average service utilization increased 5.2 percent in the last 10 years, and decreased approximately 1 percent in the last 3 years. Only 1 new system was added in the last 10 years, and no new systems were added in the last 3 years.
• Heavy Rail average service utilization increased 6.5 percent in the last 10 years but decreased 0.8 percent in the last 3. Only one system was added in the last 10 years, and no new systems were added in the last 3.
• Bus average service utilization decreased approximately 9.4 percent in the last 10 years and decreased 4.9 percent in the last 3. 77 bus systems were added as new NTD reporters in the last 10 years and 21 in the last 3 years.
Figure 27: Motor Bus Service Utilization 2001 - 2010
Figure 28: Commuter Rail Service Utilization 2001 – 2010
8,949
8,506
8,812
8,742
8,562
8,586
8,557
8,529
8,262
8,108
8,100 8,200 8,300 8,400 8,500 8,600 8,700 8,800 8,900 9,000
2001 2002 2003 2004 2005 2006 2007 2008 2009 2010

2010 National Transit Summaries and Trends
26
Figure 29: Heavy Rail Service Utilization 2001 - 2010
Figure 30: Light Rail Service Utilization 2001 - 2010
376,048
383,911
383,111
391,314
387,532 390,397 393,287
403,716
410,701
400,356
370,000 375,000 380,000 385,000 390,000 395,000 400,000 405,000 410,000 415,000
2001 2002 2003 2004 2005 2006 2007 2008 2009 2010
58,184
62,471
63,779
56,143
57,269
57,039
61,440
61,785 60,159
61,197
54,000
56,000
58,000
60,000
62,000
64,000
66,000
2001 2002 2003 2004 2005 2006 2007 2008 2009 2010

2010 National Transit Summaries and Trends
27
Quality of Transit Service
Fatalities
Concepts A fatality is defined as a death confirmed within 30 days following a transit-related incident. Deaths in or on transit property that are a result of illness or other natural causes are not reportable to NTD and are excluded from this dataset. However, these totals do include suicides.
(*) Data excludes Commuter Rail and includes suicides. Data is reported by calendar year.
Figure 31: Total Fatalities (*) 2001 – 2010
Table 8: Total Fatalities - 2010
Year Total Fatalities
2001 191 2002 179 2003 194 2004 177 2005 149 2006 162 2007 188 2008 172 2009 226 2010 221

2010 National Transit Summaries and Trends
28
Comments • Transit agencies reported 0.53 fatalities per 100 million Passenger Miles in 2009. This is the highest rate since 2003 when the industry reported a fatality rate of 0.54.
Figure 32: Fatalities per 100 Million Passenger Miles — 2001-2010
Distribution of Fatalities
Concepts
Fatalities are categorized according to nine sixteen categories of individuals:
• Passengers: A person who is on board a transit vehicle or who is boarding / alighting, including those using ramps and lifts. • Revenue facility occupants: A person who is inside the public passenger area of transit revenue facility. Employees, other workers or trespassers are not transit
facility occupants. • Employee: An individual who is compensated by the transit agency. • Other workers: A person who is not employed by the transit agency or a purchased transportation (PT) provider contracted to provide specific services to the transit
agency. • Pedestrian: A person walking in a crosswalk, out of a crosswalk, crossing tracks, or walking along tracks and bicyclists. • Other Vehicle Occupant: A driver or passenger in a privately-owned vehicle. • Individuals Committing Suicide: Individuals intentionally killing themselves. • Others: A person who is not included in the above categories – Many trespassing-related fatalities are reported under this category.
Comments
Most victims in transit-related accidents are non-passengers. Passenger fatalities account for 4.5percent of all reportable fatalities in 2010.

2010 National Transit Summaries and Trends
29
Table 9: Number of Fatalities by Person Type – 2010 Person Type Fatalities Percentages
Passengers 10 4.5% Revenue Facility Occupants 39 17.6% Employees 6 2.7% Pedestrians 59 26.7% Other Vehicle Occupant 37 16.7% Individuals Committing Suicides 52 23.5% Others 18 8.1%
Reliability
Miles between Major Mechanical System Failures — Bus
Concepts
These are failures of a mechanical element of the revenue vehicle that prevents the vehicle from completing a scheduled revenue trip or from starting the next scheduled revenue trip because actual movement is limited or because of safety concerns. Examples of major bus failures include breakdowns of air equipment, brakes, doors, engine cooling system, steering and front axle, rear axle and suspension and torque converters.
A number of factors affect the number of major mechanical system failures incurred by a transit agency including local operating conditions, types of vehicles operated, and effectiveness of the maintenance program. However, it is expected that the same types of major mechanical failures will be reported by different agencies. The differences among agencies may be in the numbers reported, not the types of major mechanical failures.
Vehicle miles are the total miles that a vehicle travels while in service (actual vehicle revenue miles and deadhead miles). See the Transit in the United States section for definitions of vehicle revenue miles and deadhead miles.
Comments
Due to changes in the definition of major and minor system failures over the years, only the years 2003 through 2010 are shown in the NTST. Major system failures have decreased 10 percent over the last 8 years. Vehicle Miles Between Major System Failures has improved 10.3 percent over the same period.
Figure 33: Miles between Major Mechanical System Failures — Bus 2003 – 2010
2010 National Transit Summaries and Trends
30
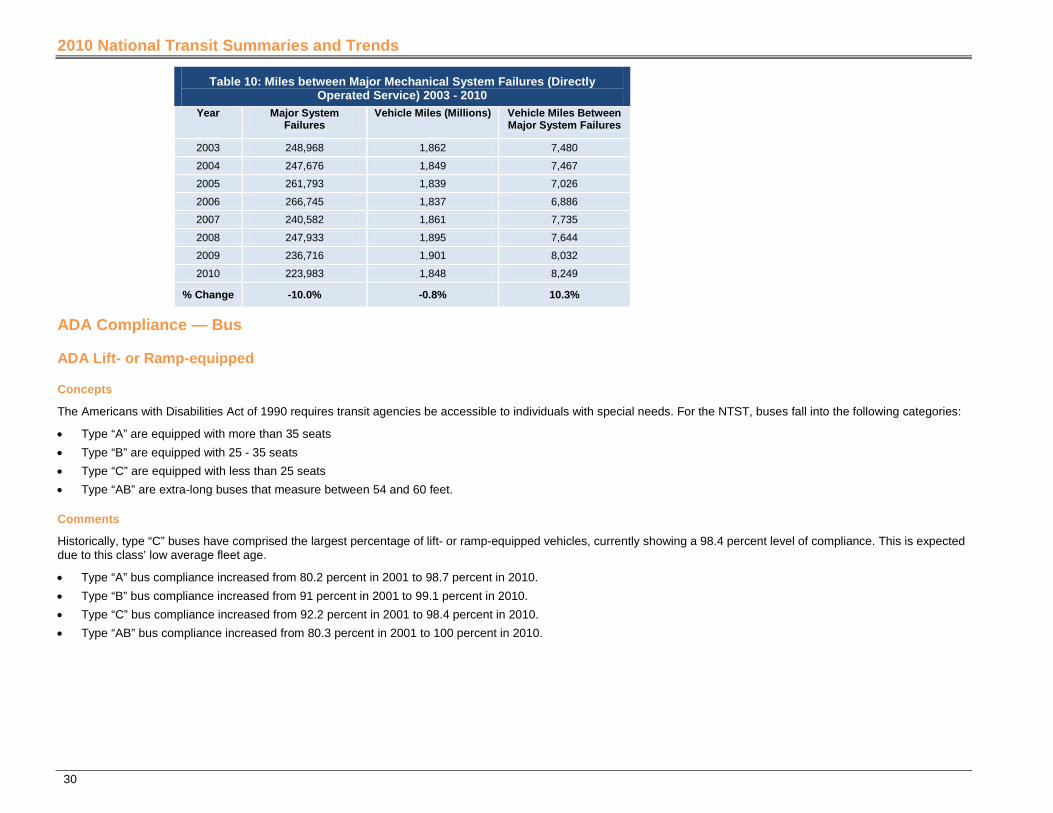
Table 10: Miles between Major Mechanical System Failures (Directly Operated Service) 2003 - 2010
Year Major System Failures
Vehicle Miles (Millions) Vehicle Miles Between Major System Failures
2003 248,968 1,862 7,480
2004 247,676 1,849 7,467
2005 261,793 1,839 7,026
2006 266,745 1,837 6,886
2007 240,582 1,861 7,735
2008 247,933 1,895 7,644
2009 236,716 1,901 8,032
2010 223,983 1,848 8,249
% Change -10.0% -0.8% 10.3%
ADA Compliance — Bus
ADA Lift- or Ramp-equipped
Concepts
The Americans with Disabilities Act of 1990 requires transit agencies be accessible to individuals with special needs. For the NTST, buses fall into the following categories:
• Type “A” are equipped with more than 35 seats • Type “B” are equipped with 25 - 35 seats • Type “C” are equipped with less than 25 seats • Type “AB” are extra-long buses that measure between 54 and 60 feet.
Comments
Historically, type “C” buses have comprised the largest percentage of lift- or ramp-equipped vehicles, currently showing a 98.4 percent level of compliance. This is expected due to this class’ low average fleet age.
• Type “A” bus compliance increased from 80.2 percent in 2001 to 98.7 percent in 2010. • Type “B” bus compliance increased from 91 percent in 2001 to 99.1 percent in 2010. • Type “C” bus compliance increased from 92.2 percent in 2001 to 98.4 percent in 2010. • Type “AB” bus compliance increased from 80.3 percent in 2001 to 100 percent in 2010.

2010 National Transit Summaries and Trends
31
Figure 34: ADA Compliance - Bus
Operating Funding
Concepts
Operating funds are the funds transit agencies receive from Federal, state, local and directly generated sources that are applied to operating expenditures. These funds are applied in the year in which they resulted in liabilities for benefits received whether or not receipt of the funds actually took place within the report year.
Federal funds are the financial assistance used to defray some of the operating costs of providing transit service.
Comments
Total Operating funds applied to transit operations increased 31 percent over the last 10 years
.
Figure 35: Total Operating Funds 2001– 2010
$23,000
$25,000
$27,000
$29,000
$31,000
$33,000
$35,000
2001 2002 2003 2004 2005 2006 2007 2008 2009 2010
$25,578 $26,482 $27,067 $27,861
$28,761 $29,556
$31,658 $33,014
$33,916 $33,519
( Constant 2005 Dollars )

2010 National Transit Summaries and Trends
32
Figure 36: Federal Operating Assistance as a Percentage of Operating Funds 2001 - 2010
Federal Operating Assistance per Trip – Total and by Urbanized Area Size
Figure 37: Total Federal Operating Assistance per Trip 2001 - 2010
$0.00
$0.05
$0.10
$0.15
$0.20
$0.25
2001 2002 2003 2004 2005 2006 2007 2008 2009 2010
$0.09 $0.11
$0.13 $0.17 $0.17 $0.19 $0.18 $0.16
$0.20 $0.23
Total Fed Operating Assistance per trip (adjusted) constant 2005 Dollars

2010 National Transit Summaries and Trends
33
Figure 38: Federal Operating Assistance per Trip by Urbanized Area Size 2001 - 2010
Farebox Recovery Ratio (Fare Revenues per Operating Expense)
Concepts
Fare revenues are funds earned through carrying passengers in regularly scheduled service. It includes the base fare, zone premiums, express service premiums, extra cost transfers and quality purchase discounts applicable to the passenger’s ride.
Farebox recovery ratio is the proportion of the amount of revenue generated through fares by its paying customers as a percentage of the cost of its total operating expenses.
$0.00
$0.30
$0.60
$0.90
$1.20
2001 2002 2003 2004 2005 2006 2007 2008 2009 2010 $0
.10
$0.1
2
$0.1
4
$0.1
8
$0.1
9
$0.2
1
$0.2
0
$0.1
8
$0.2
3
$0.2
6 $0.36 $0.42 $0.51 $0.57 $0.59 $0.55 $0.54 $0.54 $0.59 $0.68 $0.65 $0.70
$0.85 $0.90 $0.91 $0.99 $1.00 $1.00 $1.04 $1.09
( Constant 2005 Dollars )
UZAs with More Than 1 Million Population
UZAs Equal to or More Than 200,000 and Less Than 1 Million Population
UZAs with Less Than 200,000 Population

2010 National Transit Summaries and Trends
34
Figure 39: Farebox Recovery Ratio by Urbanized Area Size 2001 – 2010
Figure 40: Recovery Ratio (*) 2001 - 2010
Comments
The Recovery ratio continues to show improvement in 2010 following the 2007 implementation of GASB (Government Accounting Standards Board) by many large transit agencies. GASB requires transit agencies to accrue the cost of other post-employment benefits over the career of an employee and to disclose the amount of any unfunded liability. This new requirement significantly increased operating costs and initially affected agency recovery ratios.
10%
20%
30%
40%
50%
60%
2001 2002 2003 2004 2005 2006 2007 2008 2009 2010
37% 36% 35% 36% 36% 36% 33% 33% 34% 34%
21%
19%
18%
18%
18%
18%
18%
18%
18%
18%
23%
21%
18%
19%
19%
19%
20%
20%
20%
20%
UZAs with MoreThan 1 Million Population
UZAs with Equal to or More Than 200,000 and Less Than 1 Million Population
UZAs with Less Than 200,000 Population

2010 National Transit Summaries and Trends
35
Subsidy per Trip
Concepts
Subsidies are financial assistance received from Federal, state and local governments. Subsidies also include directly generated funds including: grants from private foundations, directly levied taxes and other funds dedicated to transit.
Comments
Subsidy per trip increased approximately 29.3 percent over the last 10 years.
Medium and small urbanized areas have a rate of increase greater than the rate of increase for large urbanized areas. This is due in part to the expansion of fixed route service in low-density areas combined with the expansion in demand response services. Demand response service accounts for a substantial portion of the service provided in medium and small urbanized areas.
Figure 41: Total Operating Subsidy per Trip 2001 – 2010
$0.25
$0.75
$1.25
$1.75
$2.25
$2.75
2001 2002 2003 2004 2005 2006 2007 2008 2009 2010
$1.65 $1.78 $1.91 $1.99 $2.08 $2.16 $2.32 $2.44
$2.17 $2.13
( Constant 2005 Dollars )

2010 National Transit Summaries and Trends
36
Figure 42: Total Subsidy per Trip by Urbanized Area Size 2001 - 2010
Operating Funding Sources by UZA
Concepts
Operating funding sources include:
• Fare revenues • Federal assistance • State assistance • Local assistance • Other funds.
Other funds include non-transportation funds, subsidies from other sectors of operations, auxiliary transportation funds, charter service, freight tariffs, school bus funds and directly levied taxes.
Comments
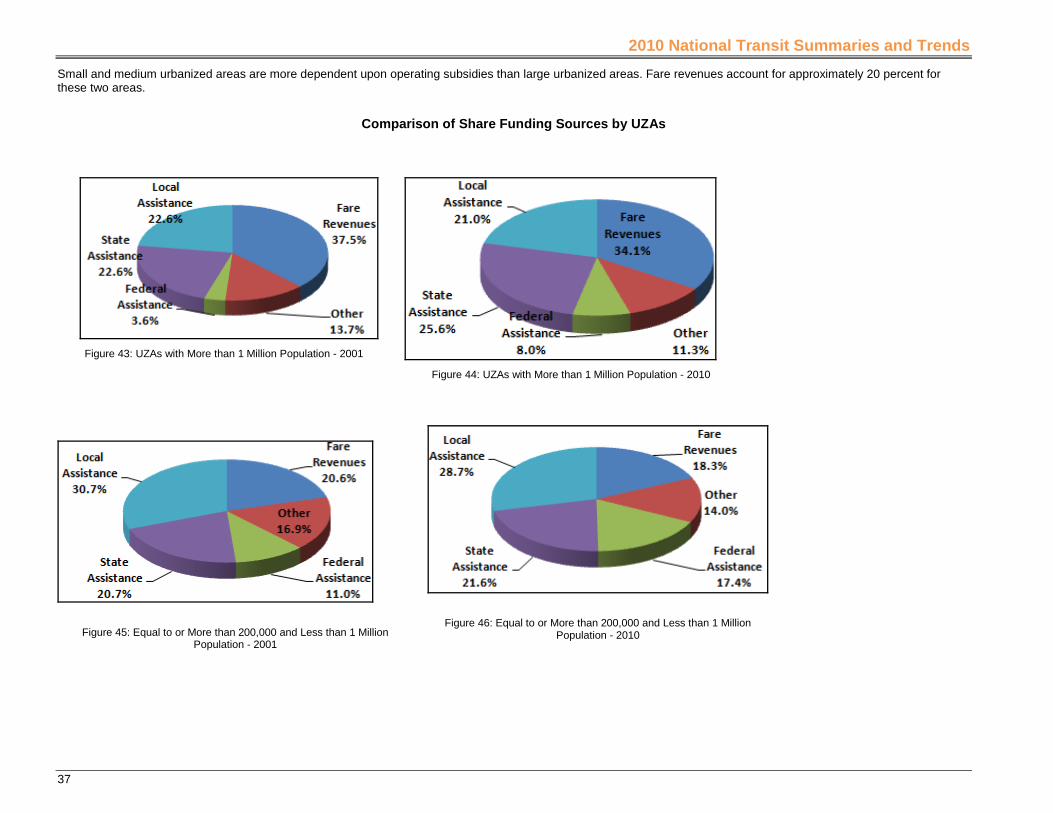
For large urbanized areas, the share of fare revenues decreased from 2001-2010. A decrease in the share of fare revenues was compensated for by increases in Federal and state assistance.
$1.00
$1.40
$1.80
$2.20
$2.60
$3.00
$3.40
$3.80
2001 2002 2003 2004 2005 2006 2007 2008 2009 2010
$1.4
9
$1.6
2
$1.7
3
$1.8
0
$1.8
9
$1.9
5 $2.2
0
$2.3
2
$2.0
5
$2.0
2
$2.3
4 $2.5
5 $2.8
5
$3.0
4
$3.1
2
$3.2
5
$3.4
0
$3.5
2
$3.1
9
$3.1
1
$2.48 $2.74
$2.92 $3.06 $3.23
$3.40 $3.52 $3.71
$3.12 $3.17
( Constant 2005 Dollars )
UZAs with More Than 1 Million Population
UZAs with More Than 200,000 and Less Than 1 Million Population
UZAs with Less Than 200,000 Population
2010 National Transit Summaries and Trends
37
Small and medium urbanized areas are more dependent upon operating subsidies than large urbanized areas. Fare revenues account for approximately 20 percent for these two areas.
Comparison of Share Funding Sources by UZAs
Figure 43: UZAs with More than 1 Million Population - 2001
Figure 44: UZAs with More than 1 Million Population - 2010
Figure 45: Equal to or More than 200,000 and Less than 1 Million Population - 2001
Figure 46: Equal to or More than 200,000 and Less than 1 Million Population - 2010

2010 National Transit Summaries and Trends
38
Figure 47: UZAs with Less than 200,000 Population - 2001
Figure 48: UZAs with Less than 200,000 Population - 20010
Capital Investment in Transit
Concepts
Capital funds are the funds that the transit agencies receive from Federal, state, local and directly generated sources and that are applied to capital projects. Directly generated sources include any funds generated or donated directly to the transit agency including passenger fares, advertising revenues, donations and grants from private entities.
Comments
Capital investment increased by approximately 50.7 percent over the last 10 years. The role of the Federal government accounted on average for 41 percent of all capital invested in transit during the same period.

2010 National Transit Summaries and Trends
39
Figure 49: Total Capital Assistance (In constant 2005 Dollars) — 2001 - 2010
Figure 50: Percent of Federal Share of Total Capital Assistance 2001 - 2010
Sources of Capital Funding by UZA
Comments
Most of capital invested in transit comes from Federal sources. Federal funds account for a significant portion of all capital invested in small and medium urbanized areas. Large urbanized areas rely primarily on local and state funds and directly levied taxes to pay for capital projects.
$8,000
$10,000
$12,000
$14,000
$16,000
2001 2002 2003 2004 2005 2006 2007 2008 2009 2010
$12,043
$13,466 $13,627 $13,095
$11,837 $12,314
$12,757
$14,547 $15,196
$14,639
Mill
ions
30%
35%
40%
45%
50%
55%
2001 2002 2003 2004 2005 2006 2007 2008 2009 2010
51%
41% 40% 39% 39%
44% 41%
40% 42% 41%

2010 National Transit Summaries and Trends
40
Figure 51: UZAs with more than 1 Million Population
Figure 52: UZAs Equal to or More than 200,000 and Less than 1 Million Population
Figure 53: UZAs with Less than 200,000 Population
Federal Capital Funds 38.1%
State Capital Funds 14.1%
Local Capital Funds 47.1%
Directly Generated
Capital Funds 0.6%
Federal Capital Funds
55.1% State Capital
Funds 16.8%
Local Capital Funds 27.4%
Directly Generated
Capital Funds 0.6%
Federal Capital Funds 80.0%
State Capital Funds 10.0%
Local Capital Funds 8.3%
Directly Generated
Capital Funds 1.7%

2010 National Transit Summaries and Trends
41
Capital Expenditures
Concepts
Uses of Capital include the following categories:
• Revenue vehicles: Vehicles used to provide transit service for passengers. Capital funds for revenue vehicles may be used for replacement, rehabilitation, remanufacture, rail overhaul and expansion of fleet.
• Guideway: Buildings and structures dedicated for the operation of transit vehicles such as: at grade, elevated and subway structures, tunnels, bridges, track and power systems for rail modes and paved highway lanes dedicated to bus.
• Communication and Information systems: Communication systems include two-way radio systems for communicating between dispatchers and vehicle operations, cab signaling and train control equipment in rail systems, automatic vehicle locator systems, automated dispatching systems, vehicle guidance systems, telephones, facsimile machines and public address systems. Information systems include computers, monitors, printers, scanners, data storage devices and associated software that support general office, accounting, scheduling, vehicle and non-vehicle maintenance and customer service functions.
• Fare revenue collection equipment: Includes capital expenses for the acquisition of fare revenue collection equipment such as turnstiles, fare boxes (drop), automated fare boxes, and related software, money changers, etc.
• Maintenance facilities: Central / overhaul maintenance facilities, light maintenance and storage facilities. • Passenger stations: Boarding/alighting facilities with a platform, including: transportation / transit / transfer centers, park and ride
facilities, and transit malls with the above components, including those only utilized by buses. Passenger stations do not include: bus, light rail, or cable car stops.
• Administration buildings: Include capital expenses for administrative buildings including the cost for design and engineering, land acquisition and relocations, demolition, and purchase or construction of administrative buildings.
• Service (non-revenue) vehicles: Service, supervisory and other vehicles other than revenue vehicles. • Other including passenger shelters, signs and amenities, furniture and equipment that are not integral parts of buildings and
structures.
Figure 54: Capital Expenditures — 2001 - 2010
$1,000
$4,000
$7,000
$10,000
$13,000
$16,000
2001 2002 2003 2004 2005 2006 2007 2008 2009 2010
$3,1
60
$4,4
51
$3,7
13
$3,4
86
$3,1
65
$2,9
92
$3,1
15
$3,9
53
$4,6
12
$3,8
57 $9,153
$13,466 $13,606 $13,095 $11,831 $12,314 $12,759
$14,588 $15,247 $14,698
( Constant 2005 Dollars )
Revenue Vehicle All Other Capital Categories

2010 National Transit Summaries and Trends
42
Uses of Capital by Urbanized Area Size
Comments
Large and medium-sized urbanized areas operate almost all rail systems in the nation, and guide way and facilities account for a significant portion of the overall capital costs.
For small urbanized areas, bus and demand response are the most common modes. Thus, most uses of capital are revenue vehicles and facilities.
Figure 55: UZAs with more than 1 Million Population
Figure 56: UZAs Equal to or More than 200,000 and Less than 1 Million Population
Figure 57: UZAs with Less than 200,000 Populations
Guidway 39%
Systems 7%
Stations 18%
Facilities 5%
Other 4%
Other Vehicle
1%
Admin Build 12%
Fare Equipment
2%
Revenue Vehicle
54% Guidway
33%
Systems 7%
Stations 8%
Facilities 9%
Other 3%
Other Vehicle
1%
Admin Build 12%
Fare Equipment
2%
Revenue Vehicle
54%
Guidway 0%
Systems 4%
Stations 10%
Facilities 13%
Other 4%
Other Vehicle
1% Admin Build
12%
Fare Equipment
2% Revenue Vehicle
54%

2010 National Transit Summaries and Trends
43
Distribution of Capital by Mode and Category
Comments
Bus systems require less capital investment than rail systems. Generally, rail systems are located in high-density corridors within the larger metropolitan areas of the United States. The high levels of service supplied in these areas require large investments in transit infrastructure (e.g. track, signals and communication systems, complex maintenance facilities, passenger stations, inter-modal terminals, real time data acquisition systems and other cost intensive items).
Bus systems do not require the same level of investment in infrastructure as rail. Therefore, revenue vehicles are the main use of capital for bus.
Figure 58: Percent of Uses of Capital Net of Revenue Vehicles Capital Expenditures 2001 — 2010
Fleet Characteristics
Average Fleet Age by Vehicle Type
Concepts
Large, medium, small and articulated buses are rubber tired passenger vehicles powered by diesel gasoline, electric battery or other alternative fuel engines.
• Type “A” buses are equipped with more than 35 seats. • Type “B” buses are equipped with 25 -35 seats. • Type “C” buses are equipped with 25 seats. • Type “AB” is extra long buses that measure between 54 and 60 feet. • Ferryboat • Heavy Rail
30%
40%
50%
60%
70%
80%
90%
100%
2001 2002 2003 2004 2005 2006 2007 2008 2009 2010
45%
49%
52%
48%
59%
53%
49%
50%
41%
42%
79%
75%
71%
72%
62%
71%
82%
75%
83%
87%
72%
69%
82%
91%
86%
89%
84%
80%
74%
84%
79%
87%
86%
84%
87%
92%
89%
86%
89%
90%
Bus Commuter Rail Heavy Rail Light Rail

2010 National Transit Summaries and Trends
44
• Light Rail • Commuter Rail (Passenger Cars) • Vans
Comments
The average fleet age of type “C” buses have been stable over the last 10 years, while the average fleet age of large buses decreased 3.7 percent and medium size buses increased 6.1 percent in the same period.
The average fleet age of articulated buses increased slightly in the last 10 years (from 5.9 years old in 2001 to 6.5 years old in 2010).
Figure 59: Average Fleet Age by Vehicle Type 2001 – 2010
2
4
6
8
10
2001 2002 2003 2004 2005 2006 2007 2008 2009 2010
8.1 7.5 7.3 7.2
7.6 7.4 7.6 7.7 7.8 7.8 6.
6
5.6 5.7
5.7 5.8 6.
2 6.5 6.
7
6.2
7
4.2
4.0
4.0 4.1
4.1 4.3
4.3
4.4
4.3
4.0
6.6
5.8
5.8
4.6 4.
9 5.4
6.2 6.
9
6.6
6.5
"A" Type Buses "B" Type Buses "C" Type" Buses "AB" Type Buses

2010 National Transit Summaries and Trends
45
Figure 60: Average Fleet Age by Mode (Heavy Rail, Light Rail) 2001 - 2010
Figure 61: Average Vanpool Fleet Age Vanpool 2001 – 2010
12
14
16
18
20
22
24
2001 2002 2003 2004 2005 2006 2007 2008 2009 2010
Light Rail Heavy Rail
4.2
3.1 3.2
3.3
3.2 3.1 3.1
2.7 2.7
3.4
2.0
2.5
3.0
3.5
4.0
4.5
2001 2002 2003 2004 2005 2006 2007 2008 2009 2010
Van

2010 National Transit Summaries and Trends
46
Age Distribution of Buses by Vehicle Type
Comments
The overall shares of the four bus types 5 years old or less decreased from 2001 to 2010.
Figure 62: Average Ferry Boat Fleet Age 2001 - 2010
Figure 623: Average Bus Fleet Age 2001 - 2010
21.5
22.7 23.3
20.7 20.0
21.7
20.3 20.1
19.2
20.4
18
19
20
21
22
23
24
2001 2002 2003 2004 2005 2006 2007 2008 2009 2010
Ferry Boat

2010 National Transit Summaries and Trends
47
Figure 634: Percent of Bus Fleet 5 Years Old or Less by Vehicle Type 2001– 2010
Figure 645: Percent of Rail Fleet 5 Years Old or Less 2001 - 2010
25%
35%
45%
55%
65%
75%
85%
2001 2002 2003 2004 2005 2006 2007 2008 2009 2010
39%
43%
45%
45%
39%
39%
35%
32%
32%
33%
59%
62%
57%
55%
55%
52%
47%
43%
39%
39%
70%
74%
74%
74%
72%
71%
69%
67%
68%
71%
61%
64%
60%
72%
64%
40%
39%
39%
38%
37%
"A"Type Buses "B" Type Buses "C" Type Buses "AB" Type Buses
13%
20%
25% 23%
23%
5% 6%
9%
16%
19% 20% 21%
21%
28%
24%
29%
22%
18%
20%
16%
0%
5%
10%
15%
20%
25%
30%
35%
2001 2002 2003 2004 2005 2006 2007 2008 2009 2010
High Rail Light Rail

2010 National Transit Summaries and Trends
48
Figure 656: Percent of Vanpool Fleet 5 Years Old or Less 2001 - 2010
Figure 67: Percent of Ferryboat Fleet 5 Years Old or Less 2001 - 2010
Fixed Guideway Mileage
Concepts
Fixed guideway directional route miles are the miles in each direction that transit vehicles travel while in revenue service on fixed guideways (high occupancy vehicle lanes, transit malls, busways, or rail track).
Fixed guideway mileage is a measure of the route path over a facility or roadway; it does not measure the service carried on the facility. This mileage is computed with regard to direction of service and is recorded without regard to the number of traffic lanes or rail tracks existing on the right-of-way.
79%
84% 84%
83%
81%
82% 82%
79%
80%
83%
75% 76% 77% 78% 79% 80% 81% 82% 83% 84% 85%
2001 2002 2003 2004 2005 2006 2007 2008 2009 2010
Van
17% 14%
11%
19%
25%
16% 17%
15%
10%
6%
0%
5%
10%
15%
20%
25%
30%
2001 2002 2003 2004 2005 2006 2007 2008 2009 2010
Ferry Boat

2010 National Transit Summaries and Trends
49
Comments
Bus fixed guideway directional route miles increased by 51 percent while rail modes increased by nearly 23 percent.
Figure 668: Fixed Guideway Mileage — Bus 2003 - 2010
Figure 69: Fixed Guideway Mileage — Rail Modes 2003 - 2010
Alternative Fuel Usage
Concepts
Alternative fuels are not diesel or gasoline. They include compressed natural gas (CNG), electric, battery, ethanol, methanol, liquefied petroleum gas, liquefied natural gas (LNG), kerosene, bio-diesel, grain substitute and other fuels.
The national bus fleet includes only buses fully dedicated to transit service.

2010 National Transit Summaries and Trends
50
Comments
The share of the national bus fleet using alternative fuels rose from 9.9 percent in 2001 to 30.9 percent in 2010.
Figure 70: Percent of National Bus Fleet Using Alternative Fuels 2001-2010
Figure 67: Percentage of Fuel Consumption for Non-Electric Modes
2001
Figure 72: Percentage of Fuel Consumption for Non-Electric Modes 2010
5%
10%
15%
20%
25%
30%
35%
2001 2002 2003 2004 2005 2006 2007 2008 2009 2010
10% 11% 12% 14%
16% 20%
22% 25%
29% 31%

2010 National Transit Profile Summary - All Agencies
General Information (Millions)
Service Consumption Annual Passenger Miles Annual Unlinked Trips Average Weekday Unlinked Trips (****)
Average Saturday Unlinked Trips (****)
Average Sunday Unlinked Trips (****)
Service Supplied Annual Vehicle Revenue Miles Annual Vehicle Revenue Hours Vehicles Operated in Maximum Service Vehicles Available for Maximum Service
52,627.29,959.7
32.717.812.3
3,919.6260.5
111,304135,674
Financial Information (Millions)
Fare Revenues EarnedSources of Operating Funds Expended Fare Revenues (32%) Local Funds (28%) State Funds (25%) Federal Assistance (9%) (***) Other Funds (5%)Total Operating Funds ExpendedSources of Capital Funds Expended Local Funds (44%) State Funds (14%) Federal Assistance (41%) (***) Other Funds (1%)Total Capital Funds Expended
$12,173.8
$12,126.3$10,636.4$9,432.4$3,550.9$2,029.9
$37,775.9
$7,280.9$2,356.0$6,813.1
$103.7$16,553.8
Summary Operating Expenses (Millions)
Salary, Wages, Benefits Materials and Supplies Purchased Transportation Other Operating ExpensesTotal Operating Expenses
Reconciling Cash Expenditures
23,314.83,728.64,509.83,518.2
35,071.4
2,875.2
Sources ofOperating Funds Expended
Sources ofCapital Funds Expended
Vehicles Operated in Maximum Service and Uses of Capital Funds Performance Measures
ModeDirectly
OperatedPurchased
TransportationRevenueVehicles
Systems andGuideways
Facilities andStations Other Total
OperatingExpense per
VehicleRevenue
Mile
OperatingExpense per
VehicleRevenue
Hour
OperatingExpense per
PassengerMile
OperatingExpense per
UnlinkedPassenger
Trip
UnlinkedPassenger
Trips perVehicle
RevenueMile
UnlinkedPassenger
Trips perVehicle
RevenueHour
Bus 43,298 8,266 $2,373.4 $460.1 $1,095.4 $190.6 $4,119.5 $9.6 $119.8 $0.9 $3.6 2.7 33.5Heavy Rail 9,158 40 $877.5 $2,637.2 $1,684.8 $446.9 $5,646.4 $9.8 $198.8 $0.4 $1.8 5.5 110.8Commuter Rail 4,862 1,190 $403.3 $1,943.0 $591.7 $88.1 $3,026.0 $14.6 $479.9 $0.4 $10.0 1.5 48.0Demand Response 6,643 17,450 $221.9 $26.2 $40.8 $8.2 $297.2 $4.4 $64.2 $3.6 $33.0 0.1 1.9Demand Response - Taxi 0 4,353 $0.0 $0.0 $0.0 $0.0 $0.0 $3.7 $61.2 $3.3 $19.3 0.2 3.2Light Rail 1,347 142 $326.8 $2,439.6 $441.1 $26.9 $3,234.4 $16.4 $244.6 $0.7 $3.3 5.0 74.5Ferryboat 64 29 $128.3 $0.4 $62.3 $11.9 $202.9 $149.3 $1,381.8 $1.3 $7.9 19.0 175.5Trolleybus 421 0 $0.6 $3.2 $1.1 $0.4 $5.3 $20.8 $147.7 $1.5 $2.5 8.4 60.1Cable Car 27 0 $0.5 $6.5 $0.0 $0.2 $7.2 $166.7 $392.7 $5.7 $7.1 23.4 55.1Vanpool 6,608 4,025 $11.8 $0.1 $0.2 $0.3 $12.3 $0.8 $32.6 $0.1 $4.6 0.2 7.1Automated Guideway 38 0 $2.6 $0.4 $1.6 $0.3 $5.0 $22.6 $246.0 $3.3 $3.7 6.0 65.7Publico 0 3,291 $0.0 $0.0 $0.0 $0.0 $0.0 $1.8 $19.7 $0.3 $1.4 1.3 14.1Monorail 0 8 $0.0 $0.5 $0.0 $0.0 $0.5 $13.4 $139.1 $1.7 $1.5 8.9 91.8Inclined Plane 6 2 $0.0 $0.1 $0.2 $0.0 $0.4 $41.9 $123.0 $4.8 $1.6 26.1 76.7Alaska Railroad 36 0 $0.2 $5.6 $1.3 $0.1 $7.3 $31.7 $584.3 $1.5 $27.7 1.1 21.1Total 72,508 38,796 $4,346.9 $7,522.8 $3,920.6 $774.1 $16,564.3
Modal Characteristics
Mode
OperatingExpenses(Millions)
FareRevenues(Millions)
Uses ofCapitalFunds
(Millions)
AnnualPassenger
Miles(Millions)
AnnualVehicle
RevenueMiles
(Millions)
AnnualUnlinked
Trips(Millions)
AnnualVehicle
RevenueHours
FixedGuidewayDirectional
RouteMiles (*)
VehiclesAvailable for
MaximumService
AverageFleet Age
in Years
VehiclesOperated in
MaximumService
Peak toBaseRatio
PercentSpares
Bus $18,399.2 $4,922.5 $4,119.5 20,569.7 1,917.1 5,139.1 153.5 4294.3 63,108 7.3 51,564 1.5 23%Heavy Rail $6,369.7 $3,965.7 $5,646.4 16,406.9 647.4 3,549.8 32.0 1617.2 11,510 18.7 9,198 1.6 25%Commuter Rail $4,595.2 $2,232.6 $3,026.0 10,773.7 314.7 460.0 9.6 7630.4 6,768 19.1 6,052 1.7 12%Demand Response $3,062.4 $239.7 $297.2 841.2 688.3 92.8 47.7 N/A 28,792 3.6 24,093 N/A 21%Demand Response - Taxi $109.0 $11.8 $0.0 32.8 29.7 5.6 1.8 N/A 4,763 N/A 4,353 N/A 9%Light Rail $1,498.8 $421.7 $3,234.4 2,172.7 91.6 456.4 6.1 1496.9 2,096 17.1 1,489 1.5 41%Ferryboat $487.3 $118.1 $202.9 389.2 3.3 61.9 0.4 689.7 134 20.5 93 0.0 44%Trolleybus $242.4 $80.1 $5.3 158.9 11.7 98.5 1.6 451.4 571 10.4 421 1.3 36%Cable Car $57.0 $25.6 $7.2 10.1 0.3 8.0 0.1 8.8 40 100.7 27 1.4 48%Vanpool $143.3 $88.8 $12.3 1,086.7 181.0 31.3 4.4 N/A 12,109 3.0 10,633 N/A 14%Automated Guideway $39.9 $1.1 $5.0 12.2 1.8 10.6 0.2 16.8 51 8.6 38 1.1 34%Publico $58.8 $58.2 $0.0 168.9 32.4 42.1 3.0 N/A 5,620 N/A 3,291 N/A 71%Monorail $2.7 $3.1 $0.5 1.6 0.2 1.8 0.0 1.8 8 48.0 8 1.0 0%Inclined Plane $2.5 $3.7 $0.4 0.5 0.1 1.6 0.0 2.8 8 80.5 8 1.0 0%Alaska Railroad $3.0 $1.3 $7.3 2.0 0.1 0.1 0.0 959.9 96 22.9 36 1.0 167%Total $35,071.4 $12,173.8 $16,564.3 52,627.2 3,919.6 9,959.7 260.5 17,170.1 135,674 111,304
(*) Includes some double-counting for bus mode. These are the fixed-guideway miles at the agency's fiscal year end for all levels of service (A through F).(**) Includes Federal capital funds used to pay for operating expenses. (***) Includes capital funds used to pay for capital projects.(****) Average UPT values not available for DT Demand Response Taxi.
10/07/2011 1:25 PM Page 1 of 1

AutomatedGuideway
AutomatedGuideway
AutomatedGuideway
Cable Car Cable Car Cable Car
DemandResponse
DemandResponse
DemandResponse
Ferryboat Ferryboat Ferryboat
InclinedPlane
InclinedPlane
InclinedPlane
Bus Bus Bus
CommuterRail
CommuterRail
CommuterRail
DemandResponse -
Taxi
DemandResponse -
Taxi
DemandResponse -
Taxi
Heavy Rail Heavy Rail Heavy Rail
Jitney Jitney Jitney
10/07/2011 1:25 PM Page 2 of 2

Light Rail Light Rail Light Rail
Publico Publico Publico
Vanpool Vanpool Vanpool
Monorail Monorail Monorail
Trolleybus Trolleybus Trolleybus
10/07/2011 1:25 PM Page 3 of 3
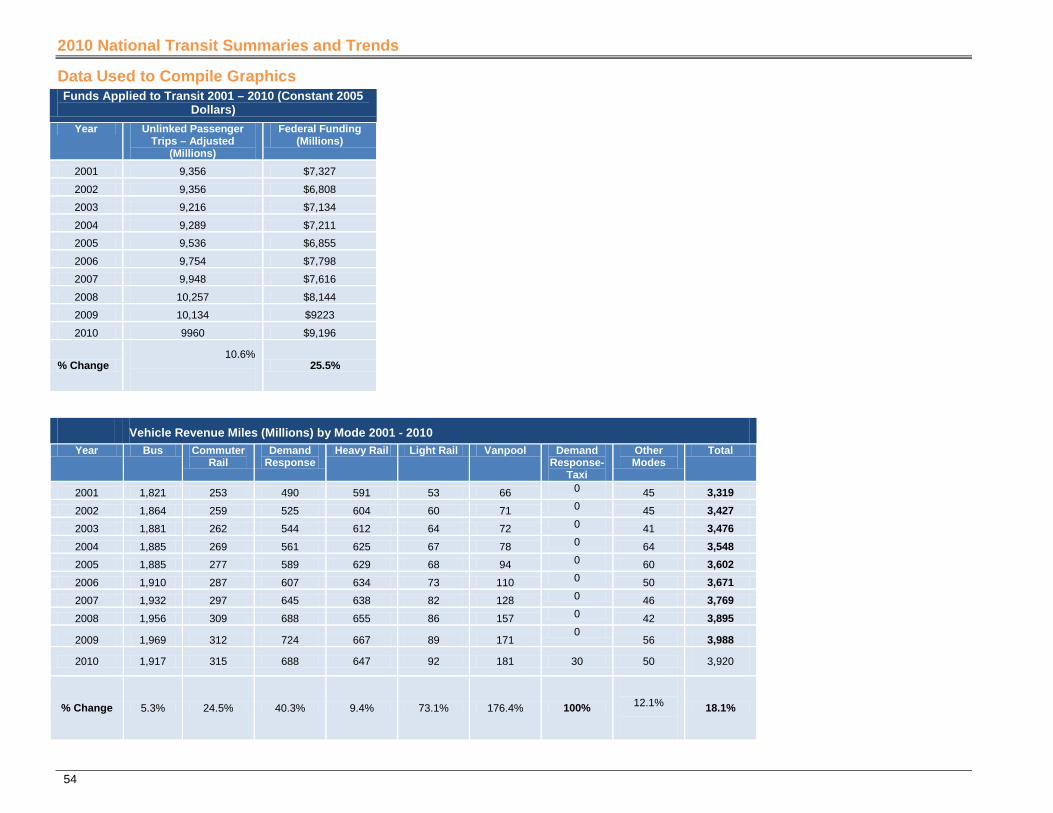
2010 National Transit Summaries and Trends
54
Data Used to Compile Graphics Funds Applied to Transit 2001 – 2010 (Constant 2005
Dollars) Year Unlinked Passenger
Trips – Adjusted (Millions)
Federal Funding (Millions)
2001 9,356 $7,327
2002 9,356 $6,808
2003 9,216 $7,134
2004 9,289 $7,211
2005 9,536 $6,855
2006 9,754 $7,798
2007 9,948 $7,616
2008 10,257 $8,144
2009 10,134 $9223
2010 9960 $9,196
% Change 10.6%
25.5%
Vehicle Revenue Miles (Millions) by Mode 2001 - 2010 Year Bus Commuter
Rail Demand
Response Heavy Rail Light Rail Vanpool Demand
Response- Taxi
Other Modes
Total
2001 1,821 253 490 591 53 66 0 45 3,319 2002 1,864 259 525 604 60 71 0 45 3,427 2003 1,881 262 544 612 64 72 0 41 3,476 2004 1,885 269 561 625 67 78 0 64 3,548 2005 1,885 277 589 629 68 94 0 60 3,602 2006 1,910 287 607 634 73 110 0 50 3,671 2007 1,932 297 645 638 82 128 0 46 3,769 2008 1,956 309 688 655 86 157 0 42 3,895
2009 1,969 312 724 667 89 171 0
56 3,988
2010 1,917 315 688 647 92 181 30 50 3,920
% Change 5.3% 24.5% 40.3% 9.4% 73.1% 176.4% 100%
12.1%
18.1%
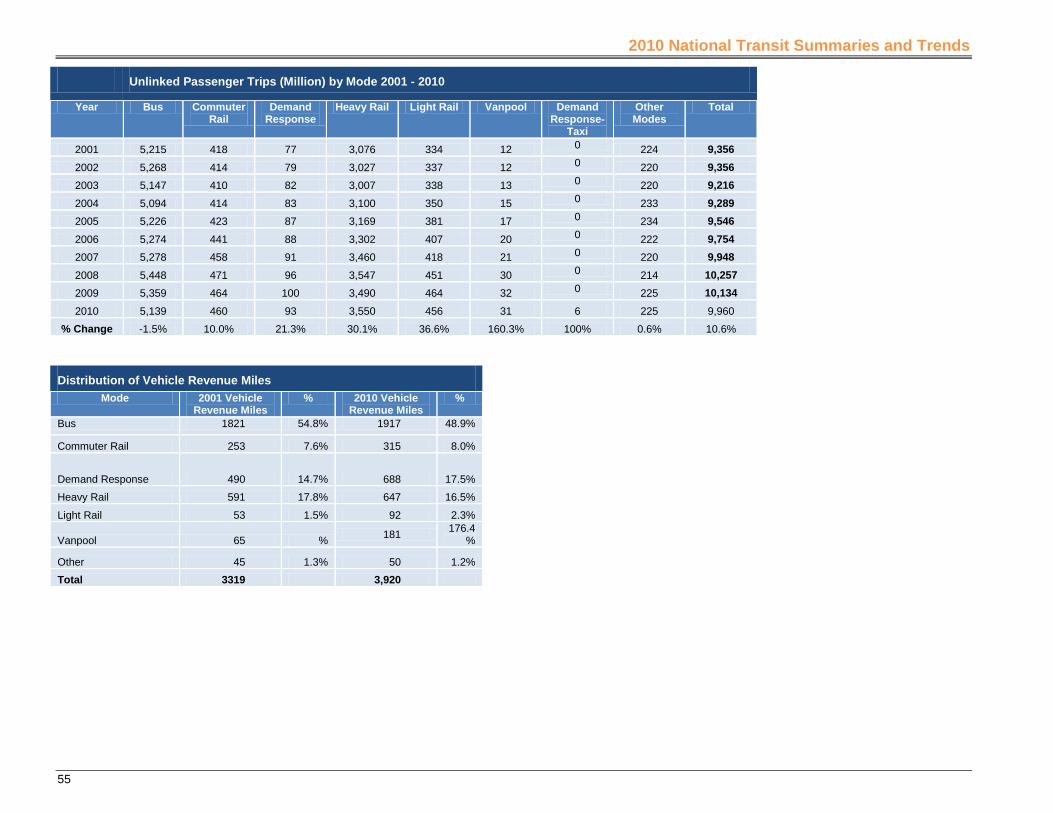
2010 National Transit Summaries and Trends
55
Unlinked Passenger Trips (Million) by Mode 2001 - 2010
Year Bus Commuter Rail
Demand Response
Heavy Rail Light Rail Vanpool Demand Response-
Taxi
Other Modes
Total
2001 5,215 418 77 3,076 334 12 0 224 9,356 2002 5,268 414 79 3,027 337 12 0 220 9,356 2003 5,147 410 82 3,007 338 13 0 220 9,216 2004 5,094 414 83 3,100 350 15 0 233 9,289 2005 5,226 423 87 3,169 381 17 0 234 9,546 2006 5,274 441 88 3,302 407 20 0 222 9,754 2007 5,278 458 91 3,460 418 21 0 220 9,948 2008 5,448 471 96 3,547 451 30 0 214 10,257 2009 5,359 464 100 3,490 464 32 0 225 10,134 2010 5,139 460 93 3,550 456 31 6 225 9,960
% Change -1.5% 10.0% 21.3% 30.1% 36.6% 160.3% 100% 0.6% 10.6%
Distribution of Vehicle Revenue Miles Mode 2001 Vehicle
Revenue Miles % 2010 Vehicle
Revenue Miles %
Bus 1821 54.8% 1917 48.9%
Commuter Rail 253 7.6% 315 8.0%
Demand Response 490 14.7% 688 17.5%
Heavy Rail 591 17.8% 647 16.5%
Light Rail 53 1.5% 92 2.3%
Vanpool 65 % 181 176.4%
Other 45 1.3% 50 1.2% Total 3319 3,920

2010 National Transit Summaries and Trends
56
Distribution of Unlinked Passenger Trips Mode 2001 Unlinked
Passenger Trips (Adjusted)
% 2010 Unlinked Passenger Trips
%
Bus 5,215 57.8% 5,139 51.5%
Commuter Rail 418 4.6% 460 4.6%
Demand Response 77 0.8% 93 0.9%
Heavy Rail 2,728 30.2%. 3,550 36.7%
Light Rail 334 3.6% 456 4.6%
Vanpool 12 0.1% 31 0.3%
Other 224 2.4% 225 2.3%
Total 9008 9960
Relative Impact of the Data by UZA Size Group 2009
Item UZAs with Less than 200,000 Population
UZAs Equal to or More than 200,000 and Less than 1 Million Population
UZAs with More than 1 Million
Population Uses of Capital — Non-Revenue Vehicle 1.6% 9.4% 89%
Passenger Fares 2% 5% 93%
Unlinked Trips 3% 8% 90%
Operating Expense 4% 9% 87%
Uses of Capital — Revenue Vehicle 5% 13% 81%
Vehicle Revenue Hours 7% 14% 79%
Vehicles Operated in Maximum Service 9% 16% 75%
Total Operating Expenses (Millions) 2001 - 2010 (Constant 2005 Dollars)
Year Total Operating Expense (Millions)
2001 $23,953 2002 $25,074 2003 $25,798 2004 $26,365 2005 $27,238 2006 $28,027 2007 $29,426 2008 $30,356 2009 $31,375 2010 31119
% Change 29.9%

2010 National Transit Summaries and Trends
57
Operating Expenses by Function and Object Class Function 2010
Operating Expense (Actual Dollars – Millions) %
Vehicle Operations $18,633.0 53.1%
Vehicle Maintenance $6,878.6 19.6%
Non-Vehicle Maintenance $3,597.4 10.3%
General Administration $5,962.4 17.0% Total $35071.4
Total Operating Expenses (Millions) by Mode 2001 – 2010 Year Bus Commuter Rail Demand Response Heavy Rail Light Rail Vanpool Demand
Response - Taxi
Other Modes
Total
2001 $11,81
3 $2,852 $1,410 $4,180 $676 $34
$562 $21,528
2002 $12,61
3 $2,995 $1,636 $4,267 $778 $39
$605 $22,933
2003 $13,31
6 $3,173 $1,779 $4,446 $815 $46
$611 $24,185
2004 $13,79
0 $3,436 $1,902 $4,734 $887 $57
$620 $25,427
2005 $14,66
6 $3,657 $2,071 $5,145 $978 $66
$655 $27,238
2006 $15,79
6 $3,765 $2,286 $5,287 $1,070 $77
$743 $29,025
2007 $16,81
2 $4,001 $2,5389 $5,888 $1,163 $101
$800 $31,304
2008 $17,96
3 $4,294 $2,861 $6,128 $1,259 $121
$853 $33,479
2009 $18,31
2 $4,538 $3,053 $6,311 $1,393 $138
$892 $34,638
2010 $18,39
9 $4,595 $3,062 $6,369 $1,498 $143 109
$893 $34,962 %
Change 55.8% 61.1% 117.2% 52.4% 121.6% 318.7% 100% 59.0% 73.1%

2010 National Transit Summaries and Trends
58
Total Operating Expense by Object Class — Directly Operated Service 2010
Operating
Expense (Actual Dollars) (Millions
of Dollars)
%
Salaries $13173.5 45.0%
Fringe Benefits $9,775 33.4%
Services $1,945 6.6%
Materials and Supplies $3,429 11.7%
Utilities $1,198 4.1%
Other -$242 -0.8% Total — Directly Operated $29280.3 Purchased Transportation (*) $5791.4 Total $35071.4
(*) Does not include purchased transportation detailed by object class.
Operating Expenses per Unlinked Passenger Trip by Mode 2001 - 2010 (Constant 2005 Dollars)
Year Bus Commuter Rail
Demand Response
Heavy Rail (Adjusted)
Light Rail
Vanpool Other Modes
2001 $2.5 $7.6 $21.0 $1.7 $1.5 $2.3 $2.8
2002 $2.6 $7.9 $22.7 $1.5 $2.5 $3.5 $3.0
2003 $2.8 $8.3 $23.2 $1.6 $2.6 $3.6 $3.0
2004 $2.80 $8.6 $23.7 $1.8 $1.6 $2.6 $3.7
2005 $2.81 $8.6 $23.9 $1.8 $1.6 $2.6 $3.8
2006 $2.89 $8.2 $25.0 $1.7 $1.5 $2.5 $3.7
2007 $2.99 $8.2 $26.2 $1.6 $1.6 $2.6 $3.9
2008 $2.99 $8.3 $27.2 $1.6 $1.6 $2.5 $3.4
2009 $3.1 $8.9 $27.6 $1.6 $1.6 $3.7 $3.6
2010 $3.18 $8.9 $29.3 $1.6 $1.6 $2.9 $3.5 %
Change 26.0% 16.8% 39.8% 5.3% 29.3% 20.8% 26.2%
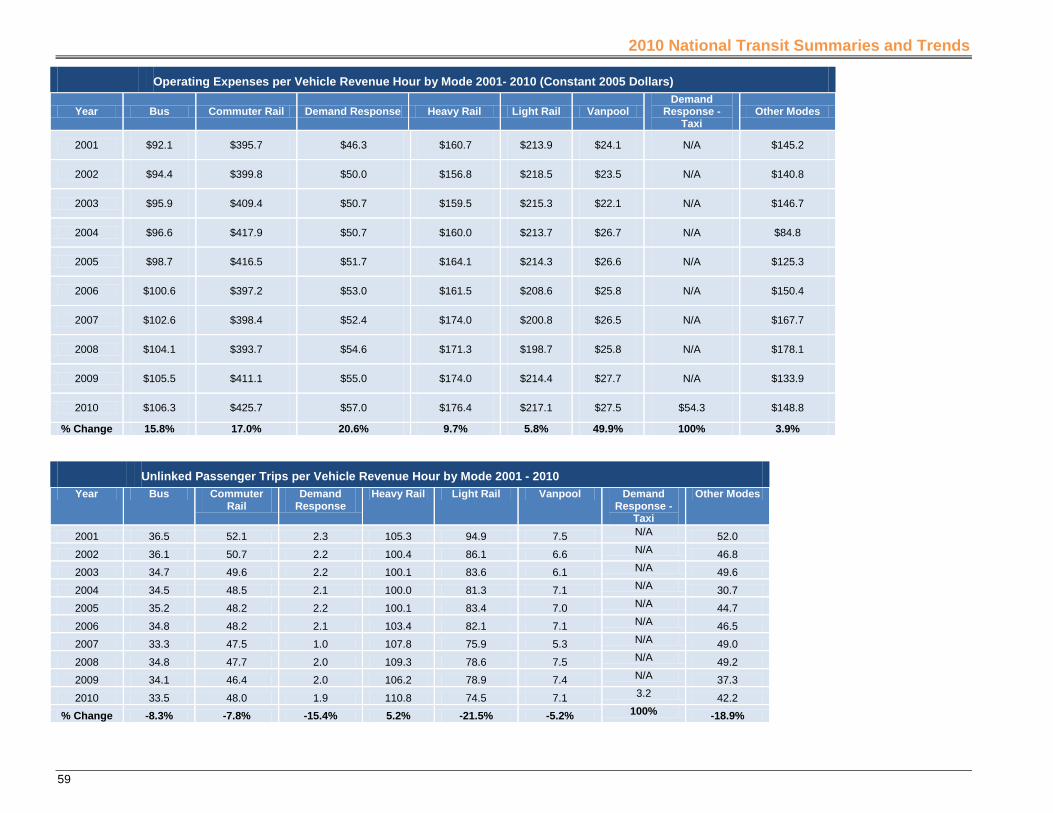
2010 National Transit Summaries and Trends
59
Operating Expenses per Vehicle Revenue Hour by Mode 2001- 2010 (Constant 2005 Dollars)
Year Bus Commuter Rail Demand Response Heavy Rail Light Rail Vanpool Demand
Response - Taxi
Other Modes
2001 $92.1 $395.7 $46.3 $160.7 $213.9 $24.1 N/A $145.2
2002 $94.4 $399.8 $50.0 $156.8 $218.5 $23.5 N/A $140.8
2003 $95.9 $409.4 $50.7 $159.5 $215.3 $22.1 N/A $146.7
2004 $96.6 $417.9 $50.7 $160.0 $213.7 $26.7 N/A $84.8
2005 $98.7 $416.5 $51.7 $164.1 $214.3 $26.6 N/A $125.3
2006 $100.6 $397.2 $53.0 $161.5 $208.6 $25.8 N/A $150.4
2007 $102.6 $398.4 $52.4 $174.0 $200.8 $26.5 N/A $167.7
2008 $104.1 $393.7 $54.6 $171.3 $198.7 $25.8 N/A $178.1
2009 $105.5 $411.1 $55.0 $174.0 $214.4 $27.7 N/A $133.9
2010 $106.3 $425.7 $57.0 $176.4 $217.1 $27.5 $54.3 $148.8
% Change 15.8% 17.0% 20.6% 9.7% 5.8% 49.9% 100% 3.9%
Unlinked Passenger Trips per Vehicle Revenue Hour by Mode 2001 - 2010 Year Bus Commuter
Rail Demand
Response Heavy Rail Light Rail Vanpool Demand
Response - Taxi
Other Modes
2001 36.5 52.1 2.3 105.3 94.9 7.5 N/A 52.0
2002 36.1 50.7 2.2 100.4 86.1 6.6 N/A 46.8
2003 34.7 49.6 2.2 100.1 83.6 6.1 N/A 49.6
2004 34.5 48.5 2.1 100.0 81.3 7.1 N/A 30.7
2005 35.2 48.2 2.2 100.1 83.4 7.0 N/A 44.7
2006 34.8 48.2 2.1 103.4 82.1 7.1 N/A 46.5
2007 33.3 47.5 1.0 107.8 75.9 5.3 N/A 49.0
2008 34.8 47.7 2.0 109.3 78.6 7.5 N/A 49.2
2009 34.1 46.4 2.0 106.2 78.9 7.4 N/A 37.3
2010 33.5 48.0 1.9 110.8 74.5 7.1 3.2 42.2 % Change -8.3% -7.8% -15.4% 5.2% -21.5% -5.2% 100% -18.9%

2010 National Transit Summaries and Trends
60
Distribution of Fatalities 2010
Number of Fatalities %
Employees 11 4.9%
Other 118 52.2%
Other workers 0 0.0%
Passengers 18 8.0%
Revenue Facility Occupants 30 13.3% Individuals attempting / committing suicide 49 21.7% Total 172
(*) Does not include Commuter Rail
ADA Lift– or Ramp– Equipped Buses Total 2001 - 2010
Year Buses ADA-Lift or Ramp-Equipped
ADA-Lift or Ramp-Equipped (%)
2001 72271 60200 83.3%
2010 75,467 74,543 98.8%

2010 National Transit Summaries and Trends
61
Federal Operating Assistance as a Percent of Operating Funds 2001 – 2010 (Constant 2005 Dollars)
Year Federal Operating Assistance
Total Operating Funding (Millions)
Federal Operating Assistance (%)
2001 $1,243.1 $25,577.9 4.9%
2002 $1,425.5 $26,481.9 5.4%
2003 $1,702.5 $27,067.3 6.3%
2004 $2,098.9 $27,861.5 7.5%
2005 $2,243.1 $28,761.0 7.8%
2006 $2,436.6 $29,556.2 8.2%
2007 $2,388.0 $31,657.7 7.5%
2008 $2,328.1 $33,014.3 7.1%
2009 $2,795.3 $33,915.8 8.2%
2010 $3150.8 $33519.0 9.4%
% Change 153.5% 31.0%
ADA Lift– or Ramp– Equipped Buses 2001 - 2010 “A” Type Buses “B” Type Buses
Year Buses ADA-Lift or Ramp-Equipped
ADA-Lift or Ramp-Equipped
(%)
Buses ADA-Lift or Ramp-Equipped
ADA-Lift or Ramp-Equipped
(%)
2001 50500 40484 80.2% 8121 7387 91.0%
2010 44,057 43481 98.7% 12,082 11,974 99.1%
% Change -12.8% 7.4%
48.8% 62.1%

2010 National Transit Summaries and Trends
62
ADA Lift– or Ramp– Equipped Buses 2000 - 2009 (Continued) “C” Type Buses Articulated Buses
Year Buses ADA-Lift or Ramp-Equipped
ADA-Lift or Ramp-
Equipped (%)
Buses ADA-Lift or Ramp-Equipped
ADA-Lift or Ramp-Equipped
(%)
2001 11517 10617 92.2% 2,133 1,712 80.3%
2010 15170 14930 98.4% 4158 4158 100.0%
% Change 31.7% 40.6%
94.9% 142.9%
Federal Operating Assistance per Unlinked Passenger Trip by UZA 2001
Year
Federal Operating Assistance (Millions)
Unlinked Passenger
Trips (Millions)
Federal Operating
Assistance per Unlinked
Passenger Trip
2001 $176 269.7 $0.65
2002 $145 206.6 $0.70
2003 $179 210.5 $0.85
2004 $189 209.6 $0.90
2005 $203 224.5 $0.91
2006 $234 236.9 $0.99
2007 $249 248.6 $1.00
2008 $260 261.0 $1.00
2009 $291 280.5 $1.04
2010 $305 279.1 $1.09
% Change 72.9% 3.5% 67.1%

2010 National Transit Summaries and Trends
63
Federal Operating Assistance per Unlinked Passenger Trip by UZA 2001 (Continued)
UZAs with More than 200,000 and Less than 1 Million Population
Year
Federal Operating Assistance (Millions)
Unlinked Passenger
Trips (Millions)
Federal Operating Assistance
per Unlinked Passenger
Trip
2001 $271 747.7 $0.36
2002 $284 671.3 $0.42
2003 $338 656.8 $0.51
2004 $367 642.7 $0.57
2005 $392 665.7 $0.59
2006 $386 696.5 $0.55
2007 $383 710.4 $0.54
2008 $404 750.6 $0.54
2009 $455 768.3 $0.59
2010 $511 749.3 $0.68
% Change 72.9% 3.5% 67.1%
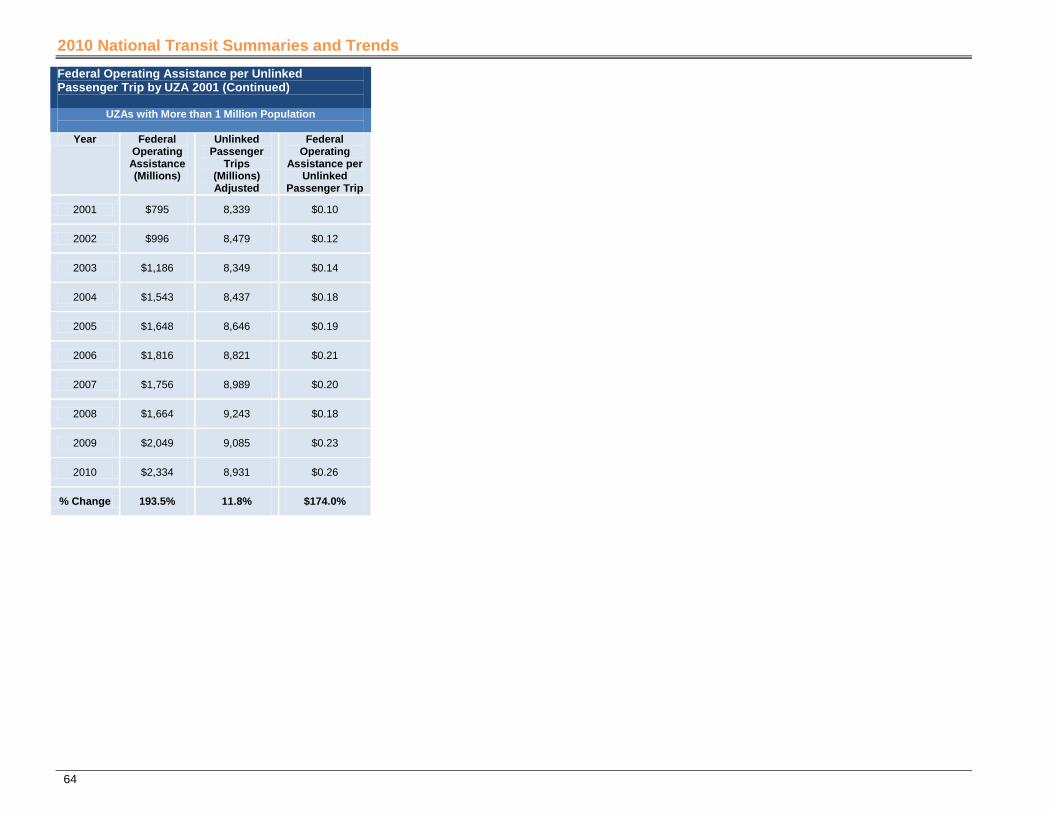
2010 National Transit Summaries and Trends
64
Federal Operating Assistance per Unlinked Passenger Trip by UZA 2001 (Continued)
UZAs with More than 1 Million Population
Year Federal Operating Assistance (Millions)
Unlinked Passenger
Trips (Millions) Adjusted
Federal Operating
Assistance per Unlinked
Passenger Trip
2001 $795 8,339 $0.10
2002 $996 8,479 $0.12
2003 $1,186 8,349 $0.14
2004 $1,543 8,437 $0.18
2005 $1,648 8,646 $0.19
2006 $1,816 8,821 $0.21
2007 $1,756 8,989 $0.20
2008 $1,664 9,243 $0.18
2009 $2,049 9,085 $0.23
2010 $2,334 8,931 $0.26
% Change 193.5% 11.8% $174.0%
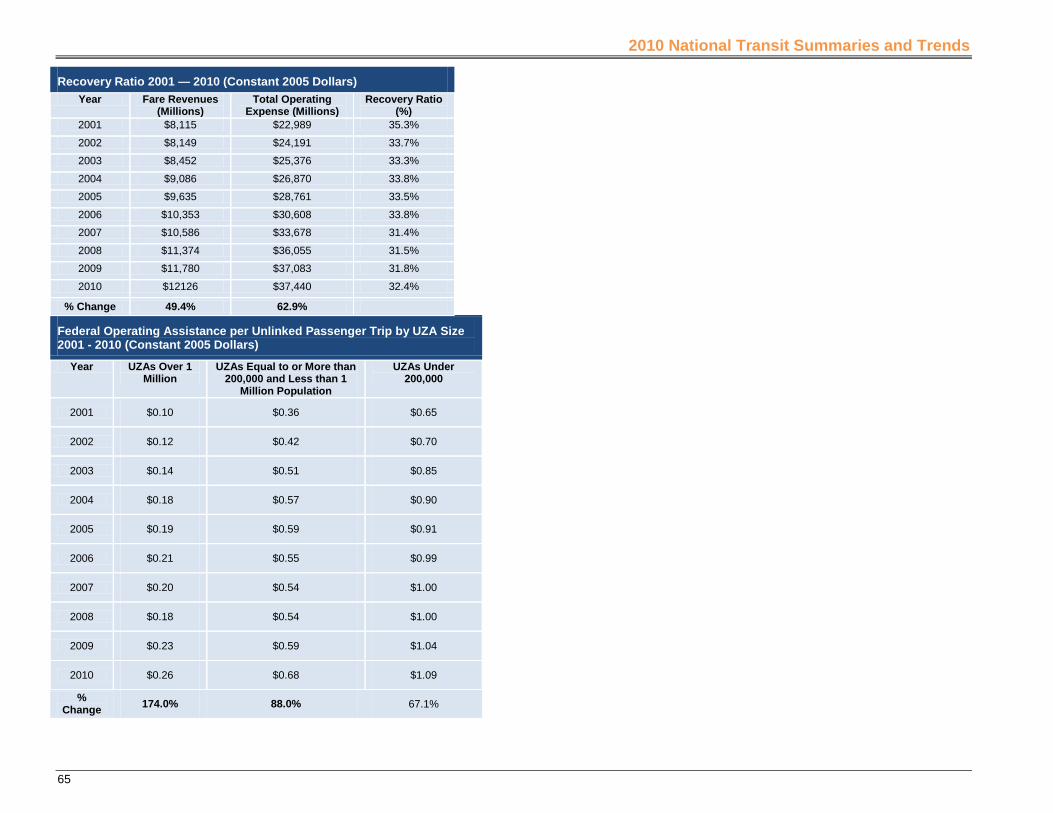
2010 National Transit Summaries and Trends
65
Recovery Ratio 2001 — 2010 (Constant 2005 Dollars) Year Fare Revenues
(Millions) Total Operating
Expense (Millions) Recovery Ratio
(%) 2001 $8,115 $22,989 35.3%
2002 $8,149 $24,191 33.7%
2003 $8,452 $25,376 33.3%
2004 $9,086 $26,870 33.8%
2005 $9,635 $28,761 33.5%
2006 $10,353 $30,608 33.8%
2007 $10,586 $33,678 31.4%
2008 $11,374 $36,055 31.5%
2009 $11,780 $37,083 31.8%
2010 $12126 $37,440 32.4%
% Change 49.4% 62.9%
Federal Operating Assistance per Unlinked Passenger Trip by UZA Size 2001 - 2010 (Constant 2005 Dollars)
Year UZAs Over 1 Million
UZAs Equal to or More than 200,000 and Less than 1
Million Population
UZAs Under 200,000
2001 $0.10 $0.36 $0.65
2002 $0.12 $0.42 $0.70
2003 $0.14 $0.51 $0.85
2004 $0.18 $0.57 $0.90
2005 $0.19 $0.59 $0.91
2006 $0.21 $0.55 $0.99
2007 $0.20 $0.54 $1.00
2008 $0.18 $0.54 $1.00
2009 $0.23 $0.59 $1.04
2010 $0.26 $0.68 $1.09
% Change 174.0% 88.0% 67.1%
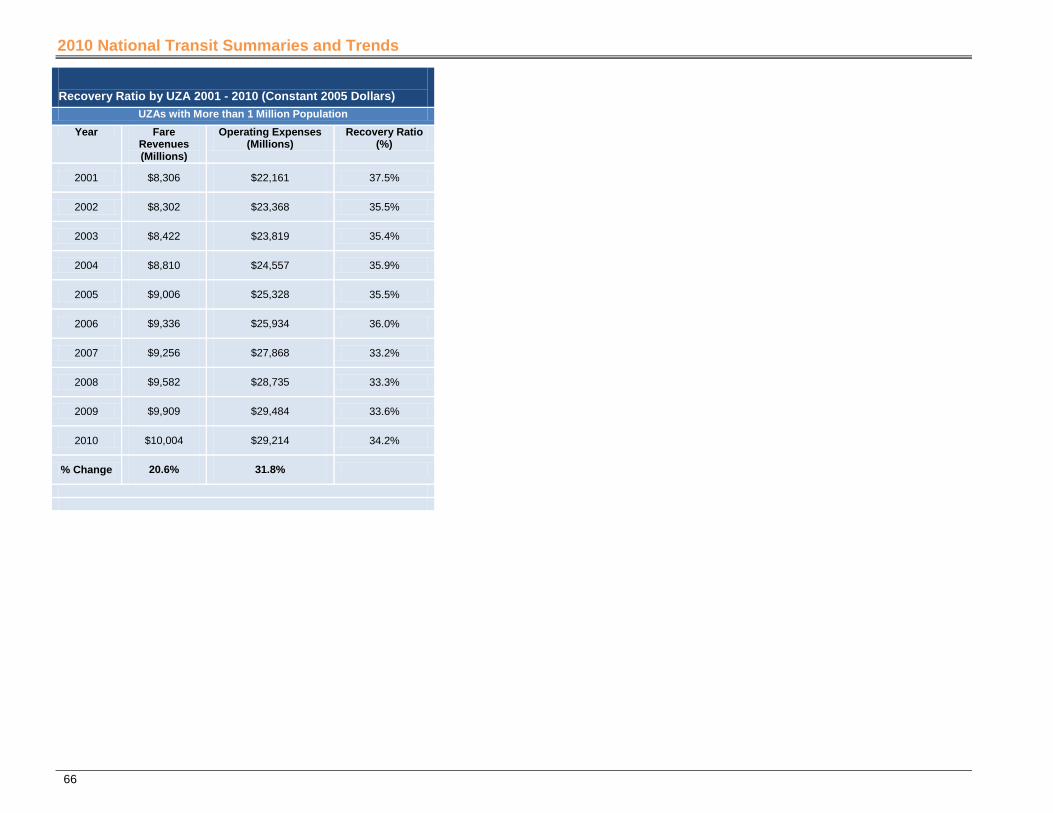
2010 National Transit Summaries and Trends
66
Recovery Ratio by UZA 2001 - 2010 (Constant 2005 Dollars)
UZAs with More than 1 Million Population Year Fare
Revenues (Millions)
Operating Expenses (Millions)
Recovery Ratio (%)
2001 $8,306 $22,161 37.5%
2002 $8,302 $23,368 35.5%
2003 $8,422 $23,819 35.4%
2004 $8,810 $24,557 35.9%
2005 $9,006 $25,328 35.5%
2006 $9,336 $25,934 36.0%
2007 $9,256 $27,868 33.2%
2008 $9,582 $28,735 33.3%
2009 $9,909 $29,484 33.6%
2010 $10,004 $29,214 34.2%
% Change 20.6% 31.8%

2010 National Transit Summaries and Trends
67
Recovery Ratio by UZA 2001 - 2010 (Constant 2005 Dollars) (Continued)
UZAs with More than 200,000 and Less than 1 Million Population
Year Fare Revenues (Millions)
Operating Expenses (Millions)
Recovery Ratio (%)
2001 $507 $2,458 20.6%
2002 $452 $2,327 19.4%
2003 $446 $2,445 18.3%
2004 $453 $2,480 18.3%
2005 $457 $2,535 18.0%
2006 $477 $2,660 17.9%
2007 $495 $2,766 17.9%
2008 $521 $2,898 18.0%
2009 $543 $3,027 17.9%
2010 $537 $2911 18.5%
% Change 5.9% 18.5%

2010 National Transit Summaries and Trends
68
Recovery Ratio by UZA 2001 - 2010 (Constant 2005 Dollars) (Continued)
UZAs with Less than 200,000 Population
Year Fare Revenues (Millions)
Operating Expenses (Millions)
Recovery Ratio (%)
2001 $216 $959 22.5%
2002 $166 $787 21.1%
2003 $147 $804 18.3%
2004 $159 $825 19.3%
2005 $172 $898 19.2%
2006 $185 $962 19.2%
2007 $200 $1,024 19.6%
2008 $210 $1,057 19.8%
2009 $219 $1,079 20.3%
2010 $219 $1096 19.9%
% Change 1.2% 14.3%

2010 National Transit Summaries and Trends
69
Subsidy per Trip by UZA 2001 - 2010 (Constant 2005 Dollars)
UZAs with More than 1 Million Population
Year Subsidy (Millions)
Passengers (Millions)
Subsidy per Passenger
2001 $13,856 9,277 $1.49
2002 $15,066 9,281 $1.62
2003 $15,396 8,906 $1.73
2004 $15,747 8,748 $1.80
2005 $16,322 8,646 $1.89
2006 $16,598 8,518 $1.95
2007 $18,612 8,450 $2.20
2008 $19,422 8,381 $2.32
2009 $16,887 8,229 $2.05
2010 $16012 7925 $2.02
% Change 15.6% -14.6% 45%

2010 National Transit Summaries and Trends
70
Subsidy per Trip by UZA 2001 - 2010 (Constant 2005 Dollars) (Continued)
UZAs Equal to or More than 200,000 and Less than 1 Million Population
Year Subsidy (Millions)
Passengers (Millions)
Subsidy per Passenger
2001 $1,950 832 $2.34
2002 $1,875 735 $2.55
2003 $1,999 701 $2.85
2004 $2,027 666 $3.04
2005 $2,078 666 $3.12
2006 $2,184 673 $3.25
2007 $2,271 668 $3.40
2008 $2,399 681 $3.52
2009 $2,217 696 $3.19
2010 $2,068 665 $3.11
% Change 6.1% -20.1% 32.7%

2010 National Transit Summaries and Trends
71
Subsidy per Trip by UZA 2001 – 2010 (Constant 2005 Dollars) (Continued)
UZAs with Less than 200,000 Population
Year Subsidy (Millions)
Passengers (Millions)
Subsidy per Passenger
2001 $743 300 $2.48
2002 $620 226 $2.74
2003 $657 225 $2.92
2004 $666 217 $3.06
2005 $726 224 $3.23
2006 $777 229 $3.40
2007 $823 234 $3.52
2008 $879 237 $3.71
2009 $792 254 $3.12
2010 $786 248 $3.17
% Change 5.7% -17.4% 28.1%
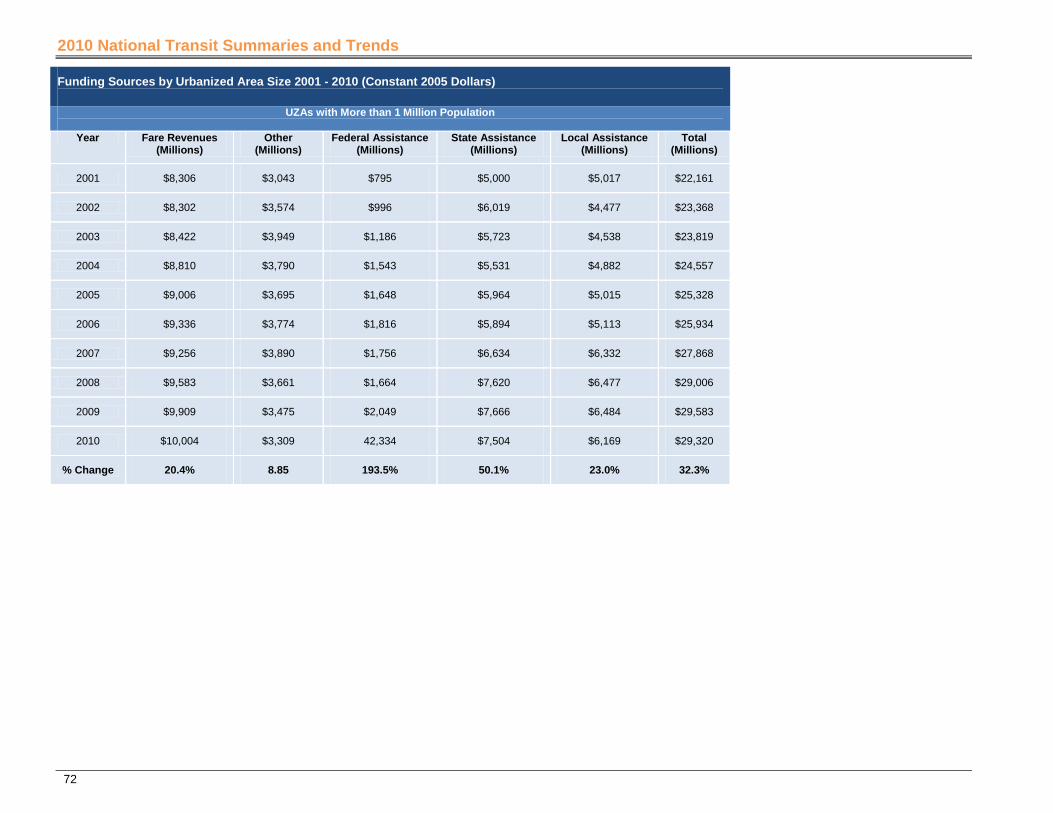
2010 National Transit Summaries and Trends
72
Funding Sources by Urbanized Area Size 2001 - 2010 (Constant 2005 Dollars)
UZAs with More than 1 Million Population
Year Fare Revenues (Millions)
Other (Millions)
Federal Assistance (Millions)
State Assistance (Millions)
Local Assistance (Millions)
Total (Millions)
2001 $8,306 $3,043 $795 $5,000 $5,017 $22,161
2002 $8,302 $3,574 $996 $6,019 $4,477 $23,368
2003 $8,422 $3,949 $1,186 $5,723 $4,538 $23,819
2004 $8,810 $3,790 $1,543 $5,531 $4,882 $24,557
2005 $9,006 $3,695 $1,648 $5,964 $5,015 $25,328
2006 $9,336 $3,774 $1,816 $5,894 $5,113 $25,934
2007 $9,256 $3,890 $1,756 $6,634 $6,332 $27,868
2008 $9,583 $3,661 $1,664 $7,620 $6,477 $29,006
2009 $9,909 $3,475 $2,049 $7,666 $6,484 $29,583
2010 $10,004 $3,309 42,334 $7,504 $6,169 $29,320
% Change 20.4% 8.85 193.5% 50.1% 23.0% 32.3%

2010 National Transit Summaries and Trends
73
Funding Sources by Urbanized Area Size 2001-2010 (Constant 2005 Dollars) (Continued)
UZAs Equal to or More than 200,000and Less than 1 Million Population
Year Fare Revenues (Millions)
Other (Millions)
Federal Assistance (Millions)
State Assistance (Millions)
Local Assistance (Millions)
Total (Millions)
2001 $507 $415 $271 $509 $754 $2,458
2002 $452 $407 $284 $515 $669 $2,327
2003 $446 $428 $338 $559 $673 $2,445
2004 $453 $423 $367 $553 $684 $2,480
2005 $457 $400 $392 $557 $729 $2,535
2006 $477 $431 $386 $549 $817 $2,660
2007 $495 $395 $383 $626 $867 $2,766
2008 $521 $412 $404 $674 $909 $2,920
2009 $543 $434 $455 $694 $920 $3,047
2010 $537 $411 $511 $634 $842 $2936
% Change 5.9% -1.0% 88.4% 24.6% 11.6% 19.5%

2010 National Transit Summaries and Trends
74
Funding Sources by Urbanized Area Size 2001 – 2010 (Constant 2005 Dollars) (Continued)
UZAs with Less than 200,000 Population Year Fare Revenues
(Millions) Other
(Millions) Federal Assistance
(Millions) State Assistance
(Millions) Local Assistance
(Millions) Total
(Millions)
2001 $216 $137 $176 $195 $235 $959
2002 $166 $137 $145 $161 $177 $787
2003 $147 $126 $179 $163 $189 $804
2004 $159 $103 $189 $174 $200 $825
2005 $172 $131 $203 $181 $210 $898
2006 $185 $136 $234 $193 $214 $962
2007 $200 $152 $249 $202 $221 $1,024
2008 $210 $150 $260 $233 $236 $1,088
2009 $219 $137 $291 $234 $235 $1,116
2010 $219 $135 $305 $231 $242 $1132
% Change 1.2% -1.3% 72.9% 18.5% 3.0% 18.0%
Operating Funding Sources by UZA (Constant 2005 Dollars) UZAs with More than 1 Million Population
2001 2010
Millions % Millions % Fare Revenues $8,305.5 37.5% $10003.9 34.1%
Other $3,042.9 13.7% $3,309.3 11.3%
Federal Assistance $795.3 3.6% $2334.2 8.0
State Assistance $500.5 22.6% $7,504.0 25.6%
Local Assistance $5,017.1 22.6% $6,186.6 21.0.% Total $22,161.3 $29,320.1

2010 National Transit Summaries and Trends
75
Operating Funding Sources by UZA (Constant 2005 Dollars) (Continued) UZAs Equal to or More than 200,000and Less than 1 Million Population
2001 2010
Millions % Millions % Fare Revenues $507.4 20.6% $537.4 18.3%
Other $415.5 16.9% $411.4 14.0%
Federal Assistance $271.4 11.0% $511.4 17.4%
State Assistance $509.1 20.7% $634.3 21.6%
Local Assistance $754.3 30.7% $842.0 28.7% Total $2,457.6 $2936.5
Operating Funding Sources by UZA (Constant 2005 Dollars) (Continued)
UZAs with Less than 200,000 Population 2001 2010
Millions % Millions %
Fare Revenues $215.9 22.5% $2189.5 19.3%
Other $136.9 14.3% $135.1 11.9%
Federal Assistance $176.5. 18.4% $305.2 27.0%
State Assistance $195.0 20.3% $231.1 20.4%
Local Assistance $234.7 24.5% $241.7 21.4%
Total $958.9 $1,131.6
Sources of Capital by Urbanized Area Size 2010
UZAs with More than 1 Million Population Capital Assistance
(Millions) %
Federal Capital Funds Applied to Capital Projects $5474 38.1%
State Capital Funds $2,026 14.1%
Local Capital Funds $6,778 47.1%
Directly Generated Capital Funds $85 0.6%
Total Capital Assistance $14,363

2010 National Transit Summaries and Trends
76
Sources of Capital by Urbanized Area Size 2010 (Continued) UZAs Equal to or More than 200,000and Less than 1 Million Population
Capital Assistance (Millions) % Federal Capital Funds Applied to Capital Projects $944.1 55.1% State Capital Funds $287.4 16.8% Local Capital Funds $467.8 27.4% Directly Generated Capital Funds $11.5 0.6% Total Capital Assistance $1,710.8 Sources of Capital by Urbanized Area Size 2010 (Continued)
UZAs with Less than 200,000 Population Capital Assistance (Millions) %
Federal Capital Funds Applied to Capital Projects $339.35 80.0%
State Capital Funds $42.38 10.0%
Local Capital Funds $35 8.3%
Directly Generated Capital Funds $7.31 1.7%
Total Capital Assistance $424.07
Capital Expenditures (Millions) 2001 – 2010 (Constant 2005 Dollars)
Year Revenue Vehicles (Millions)
Other Capital (Millions) Total (Millions)
2001 $3,160 $9,153 $12,313
2002 $4,451 $13,466 $17,917
2003 $3,713 $13,606 $17,319
2004 $3,486 $13,095 $16,581
2005 $3,165 $11,831 $14,996
2006 $2,992 $12,314 $15,305
2007 $3,115 $12,759 $15,874
2008 $3,953 $14,588 $18,540
2009 $4,612 $15,247 $19,858
2010 $3857 $14698 $18555
% Change 22.1% 60.6% 50.7%
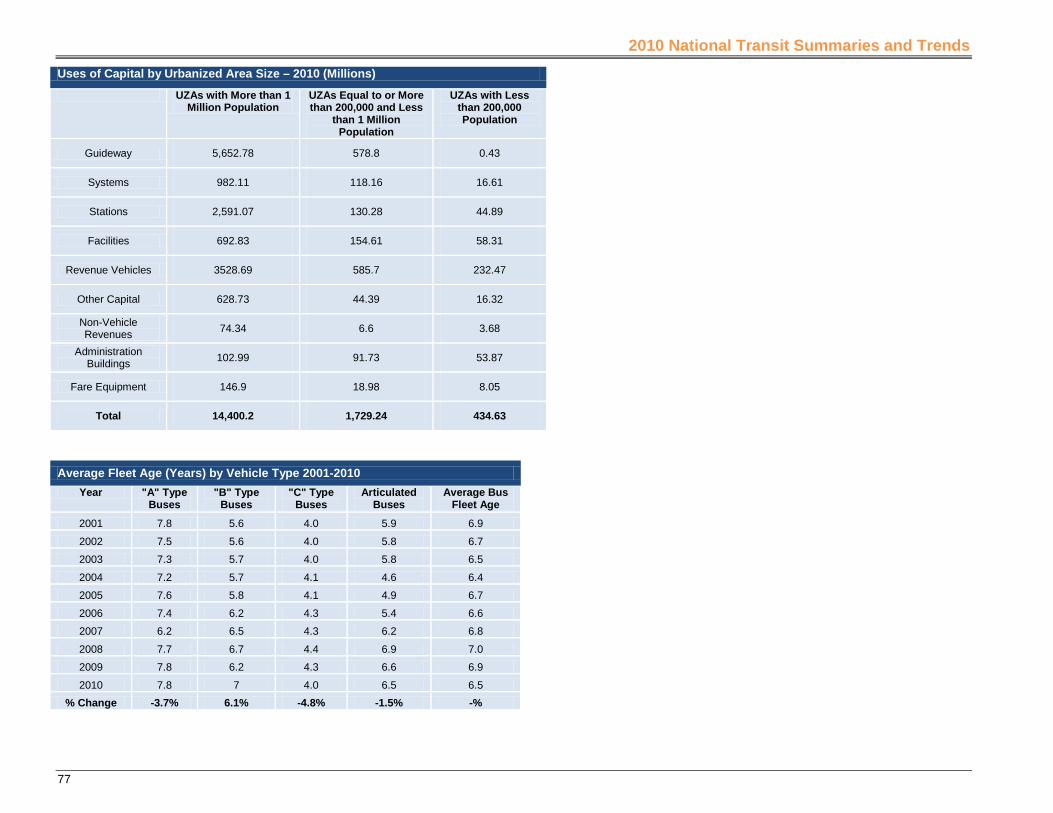
2010 National Transit Summaries and Trends
77
Uses of Capital by Urbanized Area Size – 2010 (Millions)
UZAs with More than 1 Million Population
UZAs Equal to or More than 200,000 and Less
than 1 Million Population
UZAs with Less than 200,000 Population
Guideway 5,652.78 578.8 0.43
Systems 982.11 118.16 16.61
Stations 2,591.07 130.28 44.89
Facilities 692.83 154.61 58.31
Revenue Vehicles 3528.69 585.7 232.47
Other Capital 628.73 44.39 16.32
Non-Vehicle Revenues 74.34 6.6 3.68
Administration Buildings 102.99 91.73 53.87
Fare Equipment 146.9 18.98 8.05
Total 14,400.2 1,729.24 434.63
Average Fleet Age (Years) by Vehicle Type 2001-2010 Year "A" Type
Buses "B" Type
Buses "C" Type
Buses Articulated
Buses Average Bus
Fleet Age
2001 7.8 5.6 4.0 5.9 6.9
2002 7.5 5.6 4.0 5.8 6.7
2003 7.3 5.7 4.0 5.8 6.5
2004 7.2 5.7 4.1 4.6 6.4
2005 7.6 5.8 4.1 4.9 6.7
2006 7.4 6.2 4.3 5.4 6.6
2007 6.2 6.5 4.3 6.2 6.8
2008 7.7 6.7 4.4 6.9 7.0
2009 7.8 6.2 4.3 6.6 6.9
2010 7.8 7 4.0 6.5 6.5 % Change -3.7% 6.1% -4.8% -1.5% -%

2010 National Transit Summaries and Trends
78
Average Fleet Age (Years) of Rail Modes, Ferryboat and Vanpools
Heavy Rail
Year Fleet Average Fleet Age 2001 11,013 21.4 2002 10,946 20.0 2003 10,886 19.0 2004 10,965 19.8 2005 11,083 20.6 2006 11,083 21.6 2007 11,312 21.6 2008 11,367 20.7 2009 11,418 19.0 2010 11,434 18.7
% Change 3.8% -12.6%
Light Rail
Year Fleet Average Fleet Age 2001 1,575 18.2 2002 1,457 16.1 2003 1,529 15.4 2004 1,665 15.2 2005 1,662 14.2 2006 1,802 15.3 2007 1,830 16.1 2008 1,919 16.4 2009 2,045 16.4 2010 2118 16.8
% Change 34.5% -7.7%
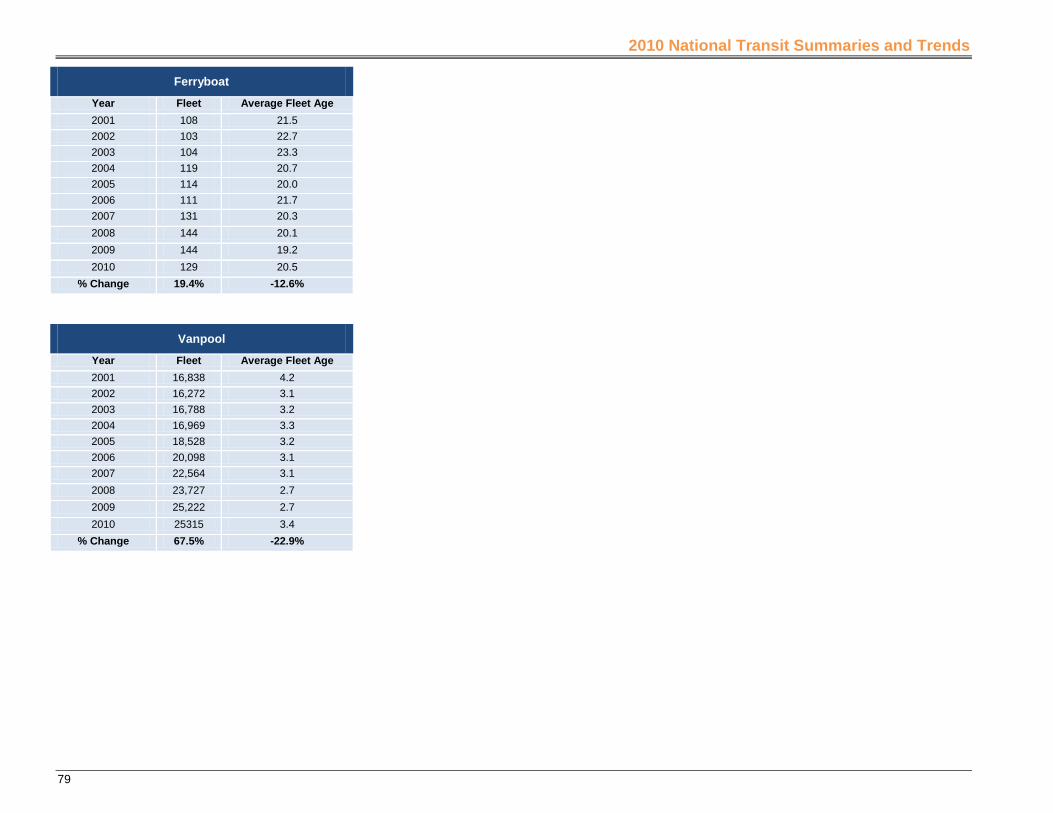
2010 National Transit Summaries and Trends
79
Ferryboat
Year Fleet Average Fleet Age 2001 108 21.5 2002 103 22.7 2003 104 23.3 2004 119 20.7 2005 114 20.0 2006 111 21.7 2007 131 20.3 2008 144 20.1 2009 144 19.2 2010 129 20.5
% Change 19.4% -12.6%
Vanpool
Year Fleet Average Fleet Age 2001 16,838 4.2 2002 16,272 3.1 2003 16,788 3.2 2004 16,969 3.3 2005 18,528 3.2 2006 20,098 3.1 2007 22,564 3.1 2008 23,727 2.7 2009 25,222 2.7 2010 25315 3.4
% Change 67.5% -22.9%

2010 National Transit Summaries and Trends
80
Distribution of Buses by Vehicle Type 2001-2010
"A" Type Buses "B" Type Buses "C" Type Buses Articulated Buses
Year Buses Percent of Total
Buses Percent of Total
Buses Percent of Total
Buses Percent of Total
Total
2001 47,925 71.1% 7,830 11.6% 9,622 14.3% 2,002 3.0% 67,379 2002 47,764 69.8% 8,693 12.7% 9,822 14.4% 2,139 3.1% 68,418 2003 46,608 67.9% 9,346 13.6% 10,084 14.7% 2,558 3.7% 68,596 2004 45,600 67.2% 9,974 14.7% 9,706 14.3% 2,591 3.8% 67,871 2005 45,524 65.5% 10,631 15.3% 11,118 16.0% 2,231 3.2% 69,504 2006 45,010 64.8% 10,958 15.8% 11,090 16.0% 2,294 5.4% 69,436 2007 45,680 64.4% 11,262 16.0% 11,695 16.5% 2,267 3.2% 70,904 2008 46,023 63.9% 11,481 16.0% 12,125 16.8% 2,340 3.3% 71,969 2009 44,355 61.5% 11,481 15.9% 12,527 17.4% 3,757 5.3% 72,120 2010 43,624 59.9% 12,007 16.5% 12,994 17.9% 4,158 5.7% 72,783
% Change -13.6% 48.0% 24.1% 94.9% 2.2%%
Age Distribution of Buses by Vehicle Type 2001-2010 “A” Type Buses “B” Type Buses
Year Active Buses 5 Years Old or Less
Year Active Buses 5 Years Old or Less
2001 47,925 40.7% 2001 7,830 60.2%
2002 47,650 42.4% 2002 8,616 61.7%
2003 46,216 44.6% 2003 9,292 57.0%
2004 45,600 45.1% 2004 9,974 55.3%
2005 45,524 39.4% 2005 10,631 54.8%
2006 45,010 39.1% 2006 10,958 51.6%
2007 45,680 35.0% 2007 11,262 47.0%
2008 46,023 32.3% 2008 11,481 43.0%
2009 44,355 32.2% 2009 11,481 39.2%
2010 43,624 37.4% 2010 12,007 33.1%
% Change -10.7% % Change 49.6%

2010 National Transit Summaries and Trends
81
Age Distribution of Buses by Vehicle Type 2001-2010 (Continued) “C” Type buses Articulated Buses
Year Active Buses 5 Years Old or Less
Year Active Buses 5 Years Old or Less
2001 9,622 72.1% 2001 2,002 64.3%
2002 9,440 74.0% 2002 2,139 64.7%
2003 9,587 73.7% 2003 2,558 59.9%
2004 9,706 73.8% 2004 2,591 71.6%
2005 11,118 71.8% 2005 2,231 63.6%
2006 11,090 70.8% 2006 2,294 40.2%
2007 11,694 69.5% 2007 2,267 39.5%
2008 12,125 67.1% 2008 2,340 38.5%
2009 12,527 67.8% 2009 3,757 38.4%
2010 12,994 71.2% 2010 4,158 37.4%
% Change 27.4% % Change 12.6%
Age Distribution of Rail Modes, Ferryboat and Vanpools
Heavy Rail
Year Fleet Less than 5
Years Old Percent of Total Total Fleet 2001 1,435 13.0% 11,013 2002 2,177 19.9% 10,946 2003 2,694 24.7% 10,886 2004 2,558 23.3% 10,965 2005 2,566 23.2% 11,083 2006 604 5.4% 11,083 2007 686 6.1% 11,312 2008 1,046 9.2% 11,367 2009 1,783 15.6% 11,418 2010 2,166 18.9% 11,434
%Change 50.9%% 3.8%

2010 National Transit Summaries and Trends
82
Light Rail
Year Fleet Less than 5
Years old Percent of Total Total Fleet 2001 310 19.7% 1,575 2002 300 20.6% 1,457 2003 315 20.6% 1,529 2004 458 27.5% 1,665 2005 403 24.2% 1,662 2006 524 29.1% 1,802 2007 399 21.8% 1,830 2008 341 17.8% 1,919 2009 404 19.8% 2,045 2010 348 16.8% 2,118
%Change 12.3% 34.5%
Ferryboat
Year Fleet Less than 5 Years Old
Percent of Total Total Fleet
2001 18 16.7% 108 2002 14 13.6% 103 2003 11 10.6% 104 2004 23 19.3% 119 2005 29 25.4% 114 2006 18 16.2% 111 2007 22 16.8% 131 2008 22 15.3% 144 2009 14 9.7% 144 2010 8 6.2% 129
%Change -55.6% 19.4%

2010 National Transit Summaries and Trends
83
Vanpool
Year Fleet Less than 5
Years Old Percent of Total Total Fleet 2001 13,251 78.7% 16,838 2002 13,685 84.1% 16,272 2003 14,157 84.3% 16,788 2004 14,022 82.6% 16,969 2005 15,052 81.2% 18,528 2006 16,530 82.2% 20,105 2007 18,543 82.2% 22,564 2008 18,746 79.0% 23,727 2009 20,188 80.2% 25,160 2010 20,931 82.7% 25,315
%Change 58.0% 50.3%
Fixed Guideway Mileage 2002-2010 Year Bus Rail Modes
2002 1,849 9,485
2003 1,920 9,525
2004 2,081 9,781
2005 2,253 10,916
2006 2,307 10,865
2007 2,419 11,089
2008 2,610 11,270
2009 2,793 11,650
2010 2,876 11,734 % Change 51.0% 23.2%
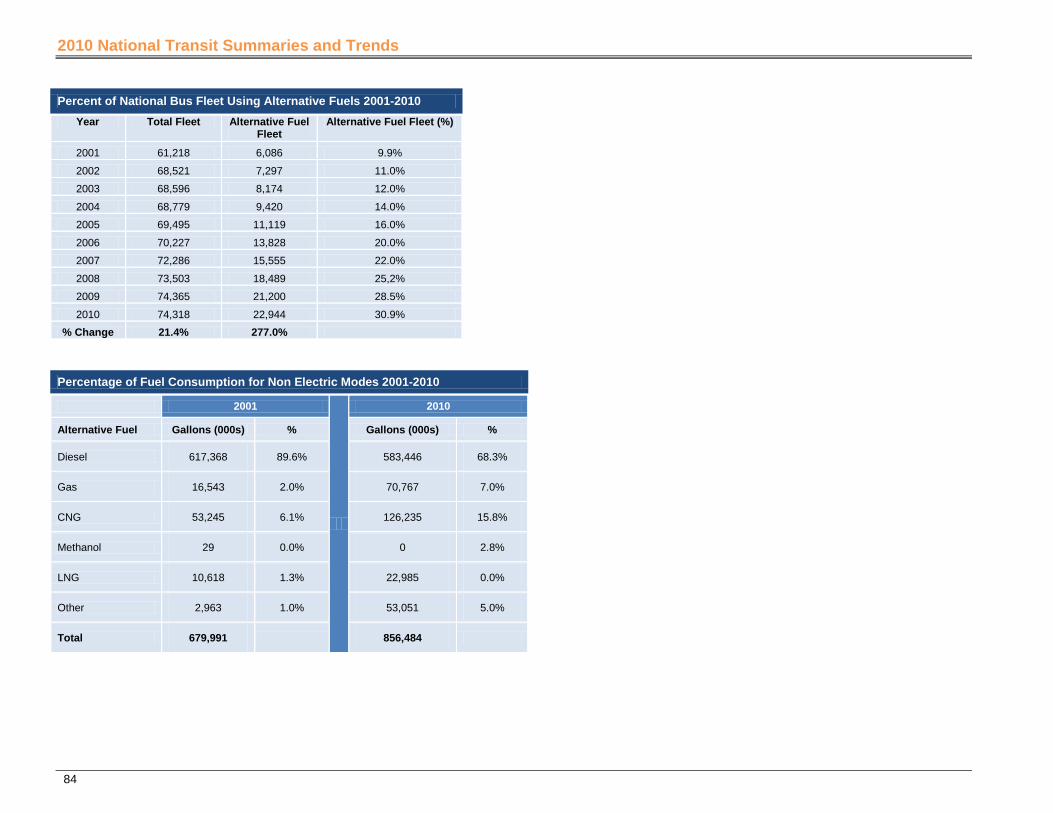
2010 National Transit Summaries and Trends
84
Percent of National Bus Fleet Using Alternative Fuels 2001-2010 Year Total Fleet Alternative Fuel
Fleet Alternative Fuel Fleet (%)
2001 61,218 6,086 9.9%
2002 68,521 7,297 11.0%
2003 68,596 8,174 12.0%
2004 68,779 9,420 14.0%
2005 69,495 11,119 16.0%
2006 70,227 13,828 20.0%
2007 72,286 15,555 22.0%
2008 73,503 18,489 25,2%
2009 74,365 21,200 28.5%
2010 74,318 22,944 30.9% % Change 21.4% 277.0%
Percentage of Fuel Consumption for Non Electric Modes 2001-2010
2001
2010
Alternative Fuel Gallons (000s) % Gallons (000s) %
Diesel 617,368 89.6% 583,446 68.3%
Gas 16,543 2.0% 70,767 7.0%
CNG 53,245 6.1% 126,235 15.8%
Methanol 29 0.0% 0 2.8%
LNG 10,618 1.3% 22,985 0.0%
Other 2,963 1.0% 53,051 5.0%
Total 679,991 856,484
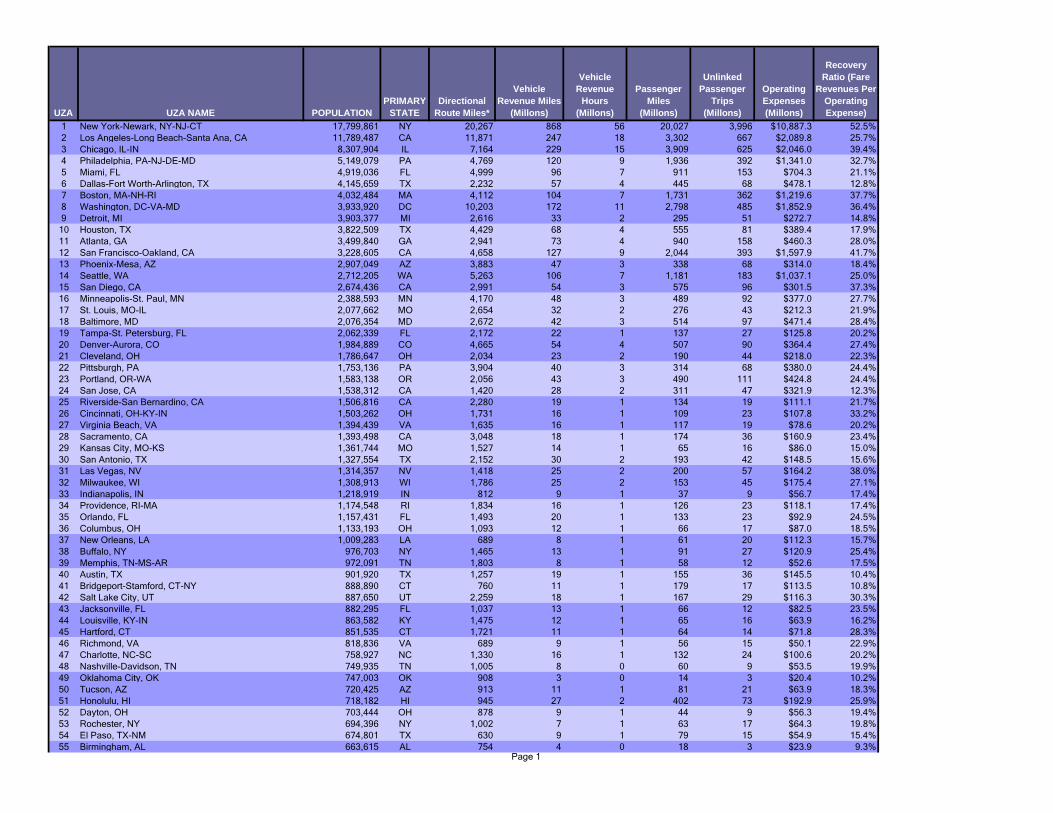
Transit Data by 2000 U.S. Census Urbanized Area
Page 1
UZA UZA NAME POPULATIONPRIMARY
STATEDirectional
Route Miles*
Vehicle Revenue Miles
(Millons)
Vehicle Revenue
Hours (Millons)
Passenger Miles
(Millons)
Unlinked Passenger
Trips (Millons)
Operating Expenses (Millons)
Recovery Ratio (Fare
Revenues Per Operating Expense)
1 New York-Newark, NY-NJ-CT 17,799,861 NY 20,267 868 56 20,027 3,996 $10,887.3 52.5%2 Los Angeles-Long Beach-Santa Ana, CA 11,789,487 CA 11,871 247 18 3,302 667 $2,089.8 25.7%3 Chicago, IL-IN 8,307,904 IL 7,164 229 15 3,909 625 $2,046.0 39.4%4 Philadelphia, PA-NJ-DE-MD 5,149,079 PA 4,769 120 9 1,936 392 $1,341.0 32.7%5 Miami, FL 4,919,036 FL 4,999 96 7 911 153 $704.3 21.1%6 Dallas-Fort Worth-Arlington, TX 4,145,659 TX 2,232 57 4 445 68 $478.1 12.8%7 Boston, MA-NH-RI 4,032,484 MA 4,112 104 7 1,731 362 $1,219.6 37.7%8 Washington, DC-VA-MD 3,933,920 DC 10,203 172 11 2,798 485 $1,852.9 36.4%9 Detroit, MI 3,903,377 MI 2,616 33 2 295 51 $272.7 14.8%
10 Houston, TX 3,822,509 TX 4,429 68 4 555 81 $389.4 17.9%11 Atlanta, GA 3,499,840 GA 2,941 73 4 940 158 $460.3 28.0%12 San Francisco-Oakland, CA 3,228,605 CA 4,658 127 9 2,044 393 $1,597.9 41.7%13 Phoenix-Mesa, AZ 2,907,049 AZ 3,883 47 3 338 68 $314.0 18.4%14 Seattle, WA 2,712,205 WA 5,263 106 7 1,181 183 $1,037.1 25.0%15 San Diego, CA 2,674,436 CA 2,991 54 3 575 96 $301.5 37.3%16 Minneapolis-St. Paul, MN 2,388,593 MN 4,170 48 3 489 92 $377.0 27.7%17 St. Louis, MO-IL 2,077,662 MO 2,654 32 2 276 43 $212.3 21.9%18 Baltimore, MD 2,076,354 MD 2,672 42 3 514 97 $471.4 28.4%19 Tampa-St. Petersburg, FL 2,062,339 FL 2,172 22 1 137 27 $125.8 20.2%20 Denver-Aurora, CO 1,984,889 CO 4,665 54 4 507 90 $364.4 27.4%21 Cleveland, OH 1,786,647 OH 2,034 23 2 190 44 $218.0 22.3%22 Pittsburgh, PA 1,753,136 PA 3,904 40 3 314 68 $380.0 24.4%23 Portland, OR-WA 1,583,138 OR 2,056 43 3 490 111 $424.8 24.4%24 San Jose, CA 1,538,312 CA 1,420 28 2 311 47 $321.9 12.3%25 Riverside-San Bernardino, CA 1,506,816 CA 2,280 19 1 134 19 $111.1 21.7%26 Cincinnati, OH-KY-IN 1,503,262 OH 1,731 16 1 109 23 $107.8 33.2%27 Virginia Beach, VA 1,394,439 VA 1,635 16 1 117 19 $78.6 20.2%28 Sacramento, CA 1,393,498 CA 3,048 18 1 174 36 $160.9 23.4%29 Kansas City, MO-KS 1,361,744 MO 1,527 14 1 65 16 $86.0 15.0%30 San Antonio, TX 1,327,554 TX 2,152 30 2 193 42 $148.5 15.6%31 Las Vegas, NV 1,314,357 NV 1,418 25 2 200 57 $164.2 38.0%32 Milwaukee, WI 1,308,913 WI 1,786 25 2 153 45 $175.4 27.1%33 Indianapolis, IN 1,218,919 IN 812 9 1 37 9 $56.7 17.4%34 Providence, RI-MA 1,174,548 RI 1,834 16 1 126 23 $118.1 17.4%35 Orlando, FL 1,157,431 FL 1,493 20 1 133 23 $92.9 24.5%36 Columbus, OH 1,133,193 OH 1,093 12 1 66 17 $87.0 18.5%37 New Orleans, LA 1,009,283 LA 689 8 1 61 20 $112.3 15.7%38 Buffalo, NY 976,703 NY 1,465 13 1 91 27 $120.9 25.4%39 Memphis, TN-MS-AR 972,091 TN 1,803 8 1 58 12 $52.6 17.5%40 Austin, TX 901,920 TX 1,257 19 1 155 36 $145.5 10.4%41 Bridgeport-Stamford, CT-NY 888,890 CT 760 11 1 179 17 $113.5 10.8%42 Salt Lake City, UT 887,650 UT 2,259 18 1 167 29 $116.3 30.3%43 Jacksonville, FL 882,295 FL 1,037 13 1 66 12 $82.5 23.5%44 Louisville, KY-IN 863,582 KY 1,475 12 1 65 16 $63.9 16.2%45 Hartford, CT 851,535 CT 1,721 11 1 64 14 $71.8 28.3%46 Richmond, VA 818,836 VA 689 9 1 56 15 $50.1 22.9%47 Charlotte, NC-SC 758,927 NC 1,330 16 1 132 24 $100.6 20.2%48 Nashville-Davidson, TN 749,935 TN 1,005 8 0 60 9 $53.5 19.9%49 Oklahoma City, OK 747,003 OK 908 3 0 14 3 $20.4 10.2%50 Tucson, AZ 720,425 AZ 913 11 1 81 21 $63.9 18.3%51 Honolulu, HI 718,182 HI 945 27 2 402 73 $192.9 25.9%52 Dayton, OH 703,444 OH 878 9 1 44 9 $56.3 19.4%53 Rochester, NY 694,396 NY 1,002 7 1 63 17 $64.3 19.8%54 El Paso, TX-NM 674,801 TX 630 9 1 79 15 $54.9 15.4%55 Birmingham, AL 663,615 AL 754 4 0 18 3 $23.9 9.3%

Transit Data by 2000 U.S. Census Urbanized Area
Page 2
UZA UZA NAME POPULATIONPRIMARY
STATEDirectional
Route Miles*
Vehicle Revenue Miles
(Millons)
Vehicle Revenue
Hours (Millons)
Passenger Miles
(Millons)
Unlinked Passenger
Trips (Millons)
Operating Expenses (Millons)
Recovery Ratio (Fare
Revenues Per Operating Expense)
56 Omaha, NE-IA 626,623 NE 639 5 0 18 4 $24.8 16.8%57 Albuquerque, NM 598,191 NM 864 8 1 92 12 $60.5 11.1%58 Allentown-Bethlehem, PA-NJ 576,408 PA 469 7 0 28 6 $28.9 15.7%59 Springfield, MA-CT 573,610 MA 753 7 1 33 11 $36.4 17.8%60 Akron, OH 570,215 OH 712 5 0 23 6 $38.5 11.2%61 Sarasota-Bradenton, FL 559,229 FL 710 6 0 24 4 $28.4 8.9%62 Albany, NY 558,947 NY 1,737 9 1 51 14 $77.9 19.8%63 Tulsa, OK 558,329 OK 859 4 0 16 3 $17.5 13.7%64 Fresno, CA 554,923 CA 422 7 1 46 18 $43.5 20.3%65 Concord, CA 552,624 CA 794 20 1 355 30 $149.6 4.7%66 Raleigh, NC 541,527 NC 403 8 1 42 9 $38.8 8.8%67 Grand Rapids, MI 539,080 MI 440 8 1 39 10 $35.7 14.9%68 Mission Viejo, CA 533,015 CA 0 5 0 44 7 $41.9 0.0%69 New Haven, CT 531,314 CT 350 11 1 185 15 $126.6 6.1%70 McAllen, TX 523,144 TX 353 0 0 1 0 $1.1 19.5%71 Toledo, OH-MI 503,008 OH 339 4 0 18 4 $25.5 22.9%72 Baton Rouge, LA 479,019 LA 313 2 0 16 4 $13.2 16.3%73 Colorado Springs, CO 466,122 CO 501 4 0 19 3 $15.9 19.7%74 Worcester, MA-CT 429,882 MA 289 3 0 34 5 $27.4 11.7%75 Charleston-North Charleston, SC 423,410 SC 449 4 0 16 4 $17.2 17.4%76 Wichita, KS 422,301 KS 275 4 0 13 3 $13.3 17.2%77 Columbia, SC 420,537 SC 442 2 0 10 2 $11.8 17.4%78 Knoxville, TN 419,830 TN 359 4 0 14 3 $18.7 6.7%79 Ogden-Layton, UT 417,933 UT 0 7 0 68 6 $39.8 0.0%80 Youngstown, OH-PA 417,437 OH 440 3 0 6 1 $11.6 9.1%81 Syracuse, NY 402,267 NY 1,354 5 0 39 12 $46.0 23.8%82 Bakersfield, CA 396,125 CA 381 4 0 26 7 $22.7 22.0%83 Palm Bay-Melbourne, FL 393,289 FL 371 3 0 14 2 $9.3 20.2%84 Scranton, PA 385,237 PA 708 2 0 15 3 $13.6 14.2%85 Des Moines, IA 370,505 IA 506 6 0 32 5 $21.2 43.5%86 Flint, MI 365,096 MI 1,443 8 0 29 6 $25.5 17.6%87 Harrisburg, PA 362,782 PA 605 4 0 26 3 $21.1 19.5%88 Little Rock, AR 360,331 AR 312 3 0 14 3 $13.8 14.3%89 Poughkeepsie-Newburgh, NY 351,982 NY 2,000 13 0 249 7 $81.4 5.1%90 Chattanooga, TN-GA 343,509 TN 227 3 0 10 3 $15.6 25.8%91 Oxnard, CA 337,591 CA 751 4 0 27 5 $22.2 17.6%92 Augusta-Richmond County, GA-SC 335,630 GA 128 1 0 3 1 $3.6 19.6%93 Spokane, WA-ID 334,858 WA 551 9 1 53 11 $56.6 16.5%94 Cape Coral, FL 329,757 FL 412 4 0 15 3 $16.0 17.0%95 Madison, WI 329,533 WI 411 7 0 49 14 $47.5 23.3%96 Pensacola, FL-AL 323,783 FL 312 2 0 6 1 $7.7 18.0%97 Lancaster, PA 323,554 PA 392 5 0 35 2 $24.9 9.5%98 Mobile, AL 317,605 AL 231 2 0 7 1 $9.0 12.0%99 Stockton, CA 313,392 CA 2,201 4 0 38 5 $34.1 25.9%
100 Modesto, CA 310,945 CA 210 2 0 12 3 $12.2 20.0%101 Reno, NV 303,689 NV 322 4 0 26 8 $31.7 21.3%102 Provo-Orem, UT 303,680 UT 0 3 0 24 4 $18.3 0.0%103 Greenville, SC 302,194 SC 158 1 0 3 1 $3.6 16.7%104 Lansing, MI 300,032 MI 388 6 0 42 11 $37.9 20.0%105 Denton-Lewisville, TX 299,823 TX 300 2 0 7 2 $9.7 30.1%106 Winston-Salem, NC 299,290 NC 174 3 0 11 3 $12.1 20.1%107 Corpus Christi, TX 293,925 TX 556 4 0 23 5 $21.7 7.1%108 Jackson, MS 292,637 MS 284 1 0 1 1 $5.9 6.1%109 Durham, NC 287,796 NC 1,023 8 1 50 13 $42.0 29.5%110 Fort Wayne, IN 287,759 IN 319 2 0 7 2 $11.0 11.2%
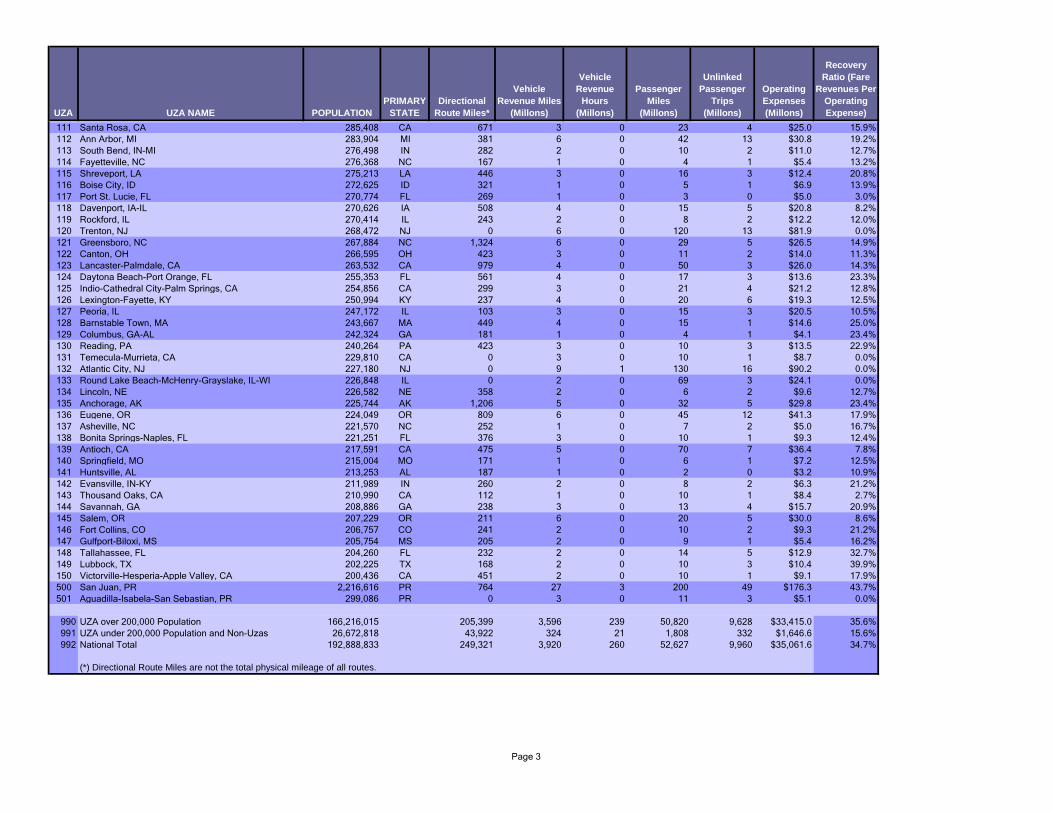
Transit Data by 2000 U.S. Census Urbanized Area
Page 3
UZA UZA NAME POPULATIONPRIMARY
STATEDirectional
Route Miles*
Vehicle Revenue Miles
(Millons)
Vehicle Revenue
Hours (Millons)
Passenger Miles
(Millons)
Unlinked Passenger
Trips (Millons)
Operating Expenses (Millons)
Recovery Ratio (Fare
Revenues Per Operating Expense)
111 Santa Rosa, CA 285,408 CA 671 3 0 23 4 $25.0 15.9%112 Ann Arbor, MI 283,904 MI 381 6 0 42 13 $30.8 19.2%113 South Bend, IN-MI 276,498 IN 282 2 0 10 2 $11.0 12.7%114 Fayetteville, NC 276,368 NC 167 1 0 4 1 $5.4 13.2%115 Shreveport, LA 275,213 LA 446 3 0 16 3 $12.4 20.8%116 Boise City, ID 272,625 ID 321 1 0 5 1 $6.9 13.9%117 Port St. Lucie, FL 270,774 FL 269 1 0 3 0 $5.0 3.0%118 Davenport, IA-IL 270,626 IA 508 4 0 15 5 $20.8 8.2%119 Rockford, IL 270,414 IL 243 2 0 8 2 $12.2 12.0%120 Trenton, NJ 268,472 NJ 0 6 0 120 13 $81.9 0.0%121 Greensboro, NC 267,884 NC 1,324 6 0 29 5 $26.5 14.9%122 Canton, OH 266,595 OH 423 3 0 11 2 $14.0 11.3%123 Lancaster-Palmdale, CA 263,532 CA 979 4 0 50 3 $26.0 14.3%124 Daytona Beach-Port Orange, FL 255,353 FL 561 4 0 17 3 $13.6 23.3%125 Indio-Cathedral City-Palm Springs, CA 254,856 CA 299 3 0 21 4 $21.2 12.8%126 Lexington-Fayette, KY 250,994 KY 237 4 0 20 6 $19.3 12.5%127 Peoria, IL 247,172 IL 103 3 0 15 3 $20.5 10.5%128 Barnstable Town, MA 243,667 MA 449 4 0 15 1 $14.6 25.0%129 Columbus, GA-AL 242,324 GA 181 1 0 4 1 $4.1 23.4%130 Reading, PA 240,264 PA 423 3 0 10 3 $13.5 22.9%131 Temecula-Murrieta, CA 229,810 CA 0 3 0 10 1 $8.7 0.0%132 Atlantic City, NJ 227,180 NJ 0 9 1 130 16 $90.2 0.0%133 Round Lake Beach-McHenry-Grayslake, IL-WI 226,848 IL 0 2 0 69 3 $24.1 0.0%134 Lincoln, NE 226,582 NE 358 2 0 6 2 $9.6 12.7%135 Anchorage, AK 225,744 AK 1,206 5 0 32 5 $29.8 23.4%136 Eugene, OR 224,049 OR 809 6 0 45 12 $41.3 17.9%137 Asheville, NC 221,570 NC 252 1 0 7 2 $5.0 16.7%138 Bonita Springs-Naples, FL 221,251 FL 376 3 0 10 1 $9.3 12.4%139 Antioch, CA 217,591 CA 475 5 0 70 7 $36.4 7.8%140 Springfield, MO 215,004 MO 171 1 0 6 1 $7.2 12.5%141 Huntsville, AL 213,253 AL 187 1 0 2 0 $3.2 10.9%142 Evansville, IN-KY 211,989 IN 260 2 0 8 2 $6.3 21.2%143 Thousand Oaks, CA 210,990 CA 112 1 0 10 1 $8.4 2.7%144 Savannah, GA 208,886 GA 238 3 0 13 4 $15.7 20.9%145 Salem, OR 207,229 OR 211 6 0 20 5 $30.0 8.6%146 Fort Collins, CO 206,757 CO 241 2 0 10 2 $9.3 21.2%147 Gulfport-Biloxi, MS 205,754 MS 205 2 0 9 1 $5.4 16.2%148 Tallahassee, FL 204,260 FL 232 2 0 14 5 $12.9 32.7%149 Lubbock, TX 202,225 TX 168 2 0 10 3 $10.4 39.9%150 Victorville-Hesperia-Apple Valley, CA 200,436 CA 451 2 0 10 1 $9.1 17.9%500 San Juan, PR 2,216,616 PR 764 27 3 200 49 $176.3 43.7%501 Aguadilla-Isabela-San Sebastian, PR 299,086 PR 0 3 0 11 3 $5.1 0.0%
990 UZA over 200,000 Population 166,216,015 205,399 3,596 239 50,820 9,628 $33,415.0 35.6%991 UZA under 200,000 Population and Non-Uzas 26,672,818 43,922 324 21 1,808 332 $1,646.6 15.6%992 National Total 192,888,833 249,321 3,920 260 52,627 9,960 $35,061.6 34.7%
(*) Directional Route Miles are not the total physical mileage of all routes.