national survey of long-haul truck driver health and injury · office of research and information...
TRANSCRIPT

Office of Research and Information Technology
National Survey of Long-Haul Truck Driver Health and Injury 2014 Transportation Research Board 93rd Annual Meeting Federal Motor Carrier Safety Administration Analysis, Research, and Technology Forum January 14, 2014

1 Office of Research and Information Technology
Outline
I. Survey Objectives and Development
II. Survey Conduct
III. Some Results
IV. Future Directions

2 Office of Research and Information Technology
NIOSH Transport Strategic Goal #3 Improve health and reduce premature mortality through workplace programs and practices that:
Enable workers to engage in healthy behaviors. Reduce work-related physiological and psychological
stressors. Improve healthcare utilization.

3 Office of Research and Information Technology
Survey Objectives Provide baseline data about long-haul truck drivers’
health and safety, including prevalence of selected health conditions and risk factors.
Describe prevalence of risk factors associated with poor health and safety outcomes within the long-haul truck driver population.
Provide information to drivers, the trucking industry, and the transportation research community that will guide health and safety promotion, interventions, and future research needs.
4 Office of Research and Information Technology
Survey Plan
Intercept study of long-haul truck drivers stopping at
truck stops. Nationally representative 3 stage probability sample. Truck driver eligibility:
─ Truck driving is the main occupation. ─ Drives a truck with three or more axles (a heavy
truck). ─ Has driven a heavy truck 12 months or longer. ─ Takes at least one mandatory 10-hour rest period
away from home during each delivery run.

5 Office of Research and Information Technology
Survey Interview
Face-to-face interview by trained interviewers.
Data collection at 32 truck stops in 20 States. Conducted October through December 2010.
1,670 drivers interviewed. ─ 1,265 completed the full survey and 405
completed only a non-respondent questionnaire.

6 Office of Research and Information Technology
Statistical Analysis of Survey Data Descriptive characteristics and prevalence estimates
for health conditions and risk factors.
Prevalence was sex- and age-adjusted to the 2010 U.S. employed population. Results were compared to those from working adults included in the 2010 National Health Interview Survey (NHIS).
The NHIS is a national household, multistage probability sample survey conducted annually by the National Center for Health Statistics (NCHS).

7 Office of Research and Information Technology
Truck Stop Locations

8 Office of Research and Information Technology
SOME PRELIMINARY RESULTS
9 Office of Research and Information Technology
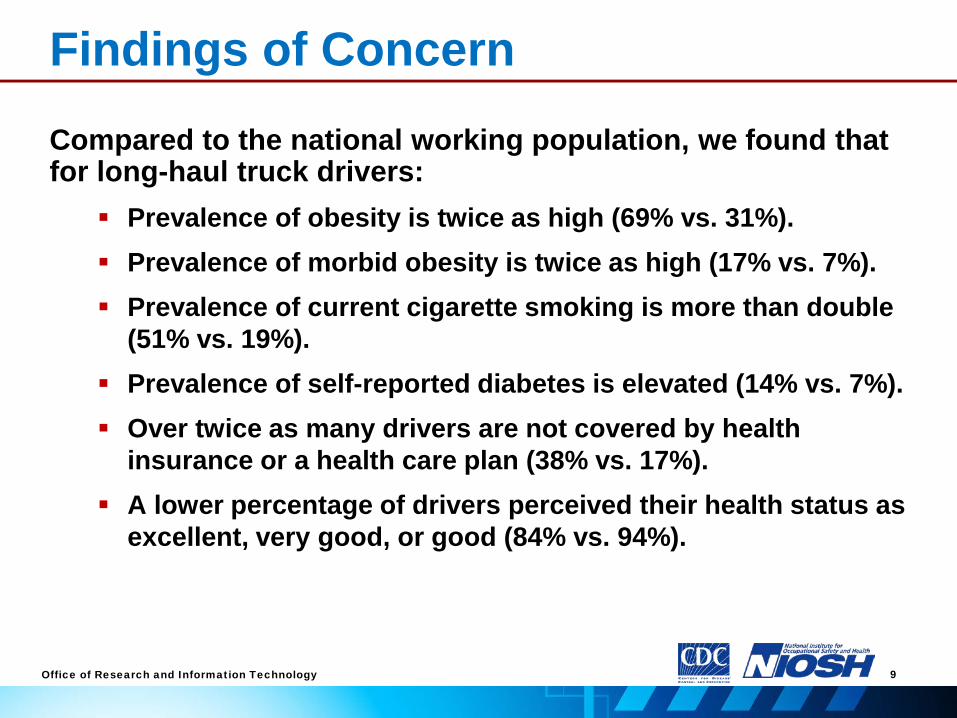
Findings of Concern
Compared to the national working population, we found that for long-haul truck drivers:
Prevalence of obesity is twice as high (69% vs. 31%). Prevalence of morbid obesity is twice as high (17% vs. 7%). Prevalence of current cigarette smoking is more than double
(51% vs. 19%). Prevalence of self-reported diabetes is elevated (14% vs. 7%). Over twice as many drivers are not covered by health
insurance or a health care plan (38% vs. 17%). A lower percentage of drivers perceived their health status as
excellent, very good, or good (84% vs. 94%).
10 Office of Research and Information Technology
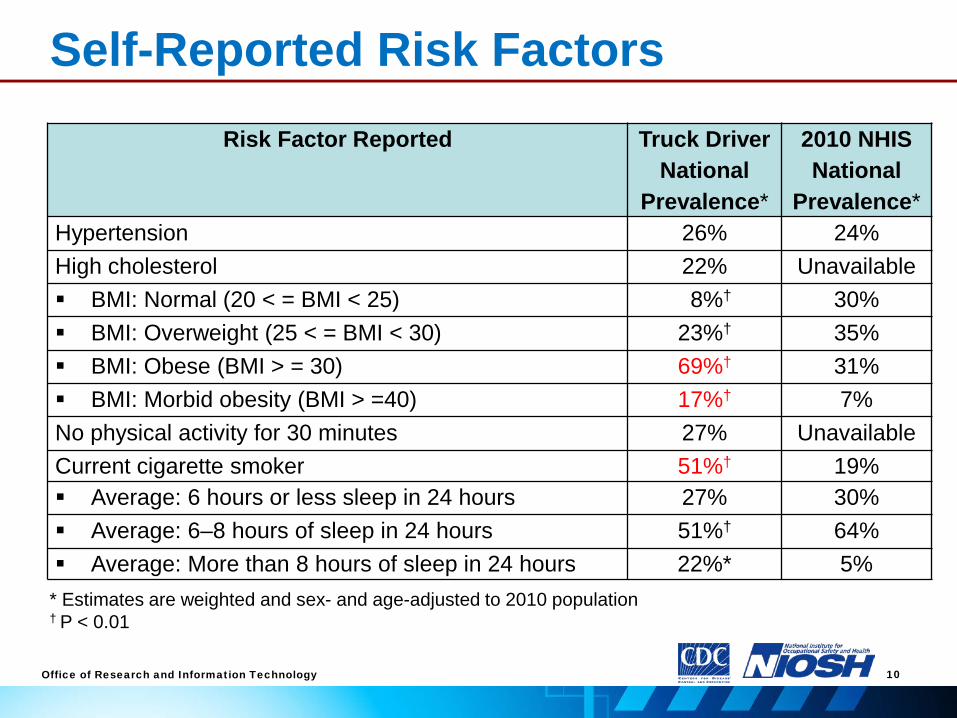
Self-Reported Risk Factors Risk Factor Reported Truck Driver
National Prevalence*
2010 NHIS National
Prevalence* Hypertension 26% 24% High cholesterol 22% Unavailable BMI: Normal (20 < = BMI < 25) 8%† 30% BMI: Overweight (25 < = BMI < 30) 23%† 35% BMI: Obese (BMI > = 30) 69%† 31% BMI: Morbid obesity (BMI > =40) 17%† 7% No physical activity for 30 minutes 27% Unavailable Current cigarette smoker 51%† 19% Average: 6 hours or less sleep in 24 hours 27% 30% Average: 6–8 hours of sleep in 24 hours 51%† 64% Average: More than 8 hours of sleep in 24 hours 22%* 5%
* Estimates are weighted and sex- and age-adjusted to 2010 population † P < 0.01

11 Office of Research and Information Technology
Hypertension, Smoking, and Obesity Number of Risk Factors Reported (Hypertension, Smoking, Obesity)
Truck Driver National
Prevalence*
2010 NHIS National
Prevalence* 1 or more risk factor 88% 54% All 3 risk factors 9% 2%
* Estimates are weighted and sex- and age-adjusted to 2010 working population

12 Office of Research and Information Technology
Self-Reported Health Conditions Self-Reported Health Condition Truck Driver
National Prevalence*
2010 NHIS National
Prevalence Heart Disease 4%† 7% Diabetes 14%† 7%
* Estimates are weighted and sex- and age-adjusted to 2010 population † P < 0.01

13 Office of Research and Information Technology
Self-Reported Health Care Coverage
Self-Report Health Care Coverage National Prevalence*
per Truck Drivers
National Prevalence*
per 2010 NHIS
Perceived Health: Excellent, Very Good, or Good 84%† 94% Perceived Health: Fair or Poor 16%† 6% Not Covered by Health Insurance or Health Care Plan 38%† 17% Delayed/did not receive needed health care in 12 months 18% 10% Did not receive flu shot in 12 months 80%† 67%
* Estimates are weighted and sex- and age-adjusted to 2010 population † P < 0.01

14 Office of Research and Information Technology
Sleepiness Disturbance (Preliminary)
Screening Index Mean Index Value Indicating Apnea
Drivers Above Mean Value
Epworth Sleepiness Scale* 9 15% Probability of Respiratory Disturbance† 0.47 59%
* ©1990-97 MW Johns. Used under license. † Maislin et al. [1995], Pack et al. [2001].

15 Office of Research and Information Technology
Highway Safety Outcomes
Occurrence Weighted National
Estimate* Near miss in the past 7 days: At least one near miss
24%
Near miss in the past 7 days: Two or more near misses
12%
Nodding off/falling asleep/drowsiness: Drivers who have nodded off or fallen asleep while driving
34%
Nodding off/falling asleep/drowsiness: Drivers feeling very drowsy almost every day driving
7%
* Weighted national estimates using 1,265 survey responses.

16 Office of Research and Information Technology
Work and Driving Practices
Description Weighted National
Estimate* Mean number of hours worked in the last 7 days 61 Driving practice on trip: Driving alone
78%
Driving practice on trip: Driving with others
22%
Driving with second job 2% Drivers with union membership 3% 0 days slept at home in the last 30 days 18% 1-6 days slept at home in the last 30 days 45% 7 or more days slept at home in the last 30 days 37%
* Weighted national estimates using 1,265 survey responses.
17 Office of Research and Information Technology
Strengths and Limitations Strengths: Nationally representative population-based sample. National prevalence estimates of illness and injury. Methodology designed for hard-to-reach, mobile workers. Standardized questions used. Non-response bias assessed.
Limitations: Cross-sectional design. Self-reported data is subject to recall and interviewer
bias.

18 Office of Research and Information Technology
Project Products Six descriptive articles in process:
─ Survey approach, conduct, and selected findings. ─ Health behaviors. ─ Crashes and injuries, safety, and training. ─ Truck stop amenities and food options. ─ Truck driver working environment/work history. ─ Sleep disorders/fatigue and risk factors.
Website. Dissemination of findings. Public use data file. Other suggestions?
19 Office of Research and Information Technology
Continuing Research
Other research suggested by survey results: Dissemination of safety and health information to
truck drivers and managers. Longitudinal studies of truck drivers. Workers compensation analyses. Owner-operators as a group. Sleep apnea, fatigue. Age and driving. Public health burden.

20 Office of Research and Information Technology
NIOSH Science Blog:
NIOSH Transportation Web Pages
www.cdc.gov/niosh/blog/nsb111907_truck.html
Transportation, Warehousing, and Utilities Sector Program Page:
www.cdc.gov/niosh/programs/twu/
Motor vehicle safety page: www.cdc.gov/niosh/topics/motorvehicle/
Twitter account: @NIOSHTransport

21 Office of Research and Information Technology
Acknowledgements
This work was supported by the National Institute for Occupational Safety and Health with partial funding from the Federal Motor Carrier Safety Administration, U.S. Department of Transportation. Albert Alvarez, Rebecca Brewster, Dale Belman, Michael Belzer, LaMont Byrd, Gerald Donaldson, Eric Garshick, Gerald Krueger, Scott Madar, Anne McCartt, Stephanie Pratt, Thomas Weakley, Martin Walker, Ann Williamson, and Eric Wood each provided helpful comments and/or guidance in development of our survey and questionnaire.

22 Office of Research and Information Technology
Contact Information
Karl Sieber
NIOSH [email protected]
(513) 841-4231 The findings and conclusions in this presentation are those of the author and do not necessarily represent the views of the National Institute for Occupational Safety and Health.

23 Office of Research and Information Technology
APPENDIX

24 Office of Research and Information Technology
Demographics (1)
Description Weighted National Estimate*
Male 94% Female 6% Age Range: 20-29 years 5% Age Range: 30-39 years 17% Age Range: 40-49 years 33% Age Range: 50-59 years 29% Age Range: 60-69 years 15% Age Range: 70-80 years 1% * Weighted national estimates using 1,265 survey responses.

25 Office of Research and Information Technology
Demographics (2)
Description Weighted National Estimate* Hispanic or Latino 9% White 74% African American 17% Other or multiple race 7% Unknown 3%
* Weighted national estimates using 1,265 survey responses.

26 Office of Research and Information Technology
Employment (1)
Description Weighted National
Estimate* Mean number of years as a long-haul truck driver 16.4 Employment: Company Employee 65%
Employment: Owner-operator 35% Type of company working or contractor for: For-hire
90%
Type of company working or contractor for: Private carriage
8%
Type of company working or contractor for: Both for-hire and private
1%
Type of company working or contractor for: Don’t know/refused/missing
0.5%
* Weighted national estimates using 1,265 survey responses.

27 Office of Research and Information Technology
Employment (2)
Description Weighted National
Estimate* Type of freight shipment on current trip: Less than truckload freight
16%
Type of freight shipment on current trip: Truckload freight
75%
Type of freight shipment on current trip: Unknown/refused/missing
9%
Methods of work compensation: By-the-mile 66% Methods of work compensation: Percentage of revenue 20% Methods of work compensation: By-the-load 10% Methods of work compensation: By-the-hour 3% Methods of work compensation: Salaried 1%
28 Office of Research and Information Technology
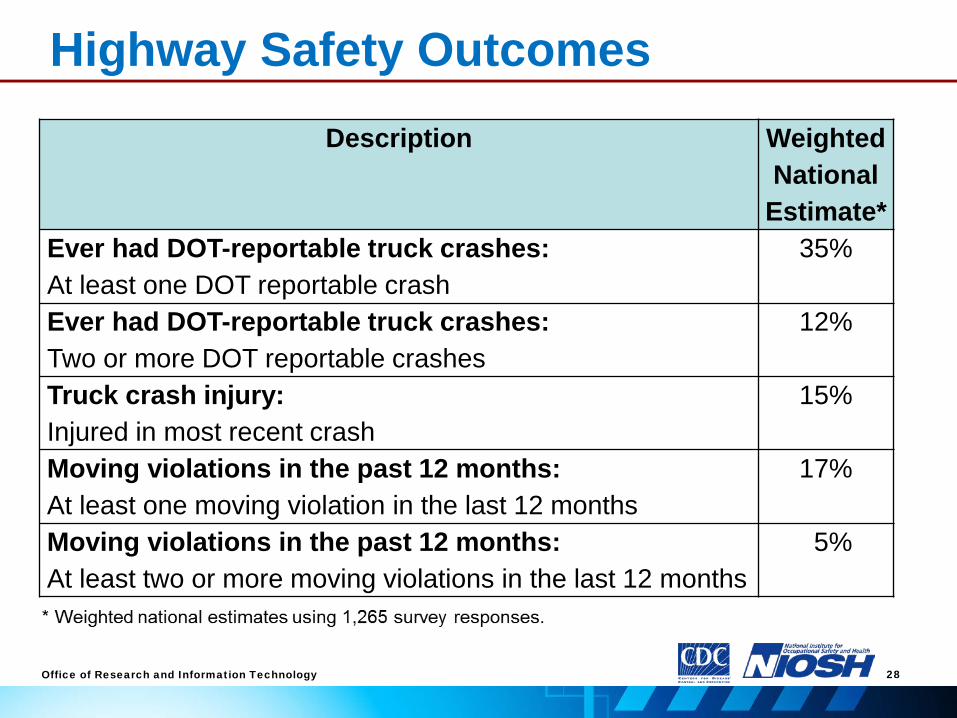
Highway Safety Outcomes Description Weighted
National Estimate*
Ever had DOT-reportable truck crashes: At least one DOT reportable crash
35%
Ever had DOT-reportable truck crashes: Two or more DOT reportable crashes
12%
Truck crash injury: Injured in most recent crash
15%
Moving violations in the past 12 months: At least one moving violation in the last 12 months
17%
Moving violations in the past 12 months: At least two or more moving violations in the last 12 months
5%