national sentinel stroke audit phase i (organisational
TRANSCRIPT

National Sentinel Stroke Audit Phase I (organisational audit) 2006
Phase II (clinical audit) 2006
Report for England, Wales and Northern Ireland
Prepared on behalf of the Intercollegiate Stroke Working Party
by
Clinical Effectiveness and Evaluation Unit Royal College of Physicians of London
April 2007

---------------------------------------------------------------------------------------------------
2
Table of Contents Report authors ...................................................................................................... 4 Glossary ................................................................................................................ 5 Definitions of models of care................................................................................. 7 Priority Findings and Recommendations for Actions ............................................ 9 Executive Summary for Phase I Organisation of Stroke Care ............................ 11 Executive Summary for Phase II Clinical Audit ................................................... 15 Section 1 Audit of organisation of stroke care Chapter 1 – Background and Presentation of Results............................... 21 Chapter 2 – Organisation of Stroke Care Nationally as at 1 April 2006............................................................................................ 22 Chapter 3 – Organisation of Stroke Care by Domains............................... 29 Domain 1 – Acute Care ........................................................... 30 Description of domain...................................................... 30 Domain 2 – Organisation of Care............................................ 32 Description of domain...................................................... 32 Domain 3 – Interdisciplinary Service (overall service)............. 34 Description of domain...................................................... 34 Domain 4 – Interdisciplinary Services (stroke units only)........ 35 Description of domain...................................................... 35 Domain 5 – TIA Neurovascular Services ................................ 36 Description of domain...................................................... 36 Domain 6 – Continuing Education and Research ................... 37 Description of domain...................................................... 37 Domain 7 Multidisciplinary Records ........................................ 38 Description of domain...................................................... 38 Domain 8 – Team Working – Team Meetings......................... 39 Description of domain...................................................... 39 Domain 9 – Agreed Assessment Measures ............................ 40 Description of domain...................................................... 40 Domain 10 – Communication with Patients and Carers.......... 41 Description of domain...................................................... 41 Chapter 4 – National Organisational Audit Results by Region................... 43
Table 30 – Summary of Key Organisational Results by Hospital for Stroke Unit provision and quality and other models of stroke care ........................................................................................... 43 Table 31 – Summary of Key Organisational Results by Hospital Including Waiting Times for Scan, Presence of Neurovascular/TIA Clinic and Involvement With Patients.................................................. 58

---------------------------------------------------------------------------------------------------
3
Section 2 Audit of process of care for stroke patients Chapter 1 – Background and Methods for Phase II Data Collection and Presentation of Results ....................................................................... 76
Chapter 2 – Key National Results 2006 & Compared With Previous
Rounds....................................................................................................... 79 2.1 Overall results for key process indicators in 2006 compared with 2004 and 2001 ................................................. 79 2.2 Site variation for key process indicators in 2006...................................................................................... 80 2.3 Site variation for change in key process indicator score in 2004 compared to 2006 .............................................. 81 2.4 Site variation for key process indicator score in 2006 compared to the organisational score in 2006.......................... 81 2.5 Site variation for process domain and total scores in 2006.......................................................................................... 82 2.6 Site variation for process total and key process indicator scores in 2006............................................................ 83 2.7 Compliance with standards for patients admitted to a stroke unit compared to those not admitted to a stroke unit ................................................................................. 84 2.8 Applicability and compliance by standard in 2006 compared to previous rounds ................................................... 85
Chapter 3 – Key national results 2006 for England, Wales and Northern Ireland and in comparison with 2004 and 2001........................... 86 3.1 Clinico-demographic results 2006 ...................................... 86 3.2 Overall results for key process indicators in 2006 .............. 87
3.3 Site variation for key process indicator score in 2006 ....... 88 3.4 Site variation for process domain and total scores in 2006.......................................................................................... 88
3.5 Comparison of results in England from 2001-6 .................. 89 3.6 Comparison of results in Wales from 2001-6 ..................... 89 3.7 Comparison of results in Northern Ireland from 2001-6 .............................................................................. 90 3.8 Site variation for key process indicator score in 2006 compared to 2004........................................................ 90 Chapter 4 – The key indicators national results 2006 for all hospitals regionally..................................................................................... 91 Table 12 Key clinical audit indicator scores for all hospitals in the 2006 Audit .................................................................................................. 92
Table 13 Total Key indicator scores for clinical audit all hospitals in each Strategic Health Authority and Region.................................................... 92
Conclusions .............................................................................................. 105 Appendix 1 – Questionnaire used for data collection phase I (organisational audit) Appendix 2 – Questionnaire used for data collection phase II (clinical audit)

---------------------------------------------------------------------------------------------------
4
Report authors REPORT PREPARED BY Mrs Alex Hoffman LCST MSc National Stroke Audit Co-ordinator, Clinical Effectiveness and Evaluation Unit, Royal College of Physicians Mr Calvin Down BA Stroke Programme Administrator, Clinical Effectiveness and Evaluation Unit, Royal College of Physicians Mr Robert Grant BSc DipStat Medical Statistician, Clinical Effectiveness and Evaluation Unit, Royal College of Physicians Ms Fatima Wurie (BSc Hons) Stroke Programme Co-ordinator, Clinical Effectiveness and Evaluation Unit, Royal College of Physicians Mr Derek Lowe MSc/C.Stat Medical Statistician, Clinical Effectiveness and Evaluation Unit, Royal College of Physicians Dr Anthony Rudd FRCP Chair of the Intercollegiate Stroke Group, Associate Director for Stroke (CEEU), Consultant Stroke Physician, Guy’s and St Thomas’ Hospital This report is a concise version of a generic format of the trust report which is available by written request to the Stroke Programme, Clinical Effectiveness and Evaluation Unit, Royal College of Physicians 11 St Andrews Place London NW1 4LE.

------------------------------------------------------------------------------------------------------------------- 5
GLOSSARY Benchmarking Measurement of performance against a standard reached by
others. For example in national audit this could be the top score or the national average
Carer Someone (commonly the patient’s spouse, a close relative or a
friend) who provides ongoing, unpaid support and personal care at home
Carotid Doppler A non invasive test which uses high frequency sounds waves
to determine extent of blood flow through the carotid arteries in the neck. Used in the evaluation of stoke and TIA symptoms
Carotid Carotid endarterectomy is a surgical procedure in which a Endarterectomy stenosis (narrowing) or ulceration of an atherosclerotic plaque
in the carotid artery is removed. CT scan A CT scan (computerised tomography) of the head.
A CT scan X-rays the body from many angles. The X-ray beams are detected by the scanner and analyzed by a computer. The computer compiles the images into a picture of the body area being scanned. These images can be viewed on a monitor or reproduced as photographs.
Domain The organisation of stroke care was divided into key areas for
summary presentation of results Inter Quartile Range The IQR is the range between 25th and 75th centile which (IQR) is equivalent to the middle half of all values IST The International Stroke Trial (IST): a randomised trial of
aspirin, subcutaneous heparin, both, or neither among 19435 patients with acute ischaemic stroke. International Stroke Trial Collaborative Group
CAST CAST: randomised placebo-controlled trial of early aspirin use
in 20,000 patients with acute ischaemic stroke. CAST (Chinese Acute Stroke Trial) Collaborative Group.
Transient Ischaemic A transient ischaemic attack is less severe than a stroke Attack (TIA) in that all the symptoms disappear within a day (and often last
for less than half an) Magnetic Resonance A non-invasive procedure that produces a picture of the Imaging (MRI) inside of the head without exposure to ionising radiation (X
rays) Median The median is the middle point of a data set; half of the values
are below this point, and half are above this point National Clinical National evidence based guidelines for stroke care Guidelines For published by the Intercollegiate Working Party

---------------------------------------------------------------------------------------------------
6
Stroke (2004) for Stroke second edition 2004 http://www.rcplondon.ac.uk/pubs
National Sentinel National audit at a specific point in time to identify levels of Audit practice and service provision across the country National Service The NSF for older people was published in March Framework for 2001. It set national standards and service models Older People of care across health and social services for all older Department of people whether they live at home, in residential care Health England or are being cared for in hospital. (NSF) http//:www.publications.doh.gov.uk/nsf/olderpeople/index.htm National Service An NSF for Older People in Wales was published in March Framework for Older 2006 http://www.wales.nhs.uk/sites3/home.cfm?orgid=439 People in Wales (NSF Wales) Neurovascular An outpatient clinic for patients with Transient Ischaemic Clinic Attacks or minor stroke for further investigation Organisational Audit of the service organisation, particularly relevant in stroke audit due to the evidence supporting organised stroke services. Organisational The data was analysed using a formula to combine Score similar questions into an overall score for domains or key areas
in the organisation of care. A score of 100 is the optimal score Secondary Measures to prevent recurrence of the same illness prevention Stroke Research A nationally funded organisation to increase participation in Network stroke research http://www.uksrn.ac.uk/ Stroke Unit Stroke Unit Trialists' Collaboration Trialists’ Organised inpatient (stroke unit) care for stroke (Cochrane Collaboration Review). In: The Cochrane Library, Issue 3, 2004. (SUTC) Chichester, UK: John Wiley & Sons, Ltd. Thrombolysis The use of drugs to break up a blood clot Trusts In the context of the UK’s National Health Service (NHS), trusts
are organisational units, eg hospital trusts, community trusts, primary care trusts or combinations thereof. In this report it usually refers to hospitals

--------------------------------------------------------------------------------------------------- Definitions
7
Definitions of models of care The NSF for Older People (which applies to England only) set out that all hospitals caring for people with stroke should have ‘a specialised stroke service” by April 2004. An NSF for Older People in Wales has also now been published which requires the development of care pathways incorporating prompt access to specialist acute stroke services in accordance with National Clinical Guidelines by March 2007, and ongoing continuous service improvements. The definition used for a stroke unit (and used in this audit) is: Stroke unit - a multidisciplinary team including specialist nursing staff based in a discrete ward which has been designated for stroke patients. This category includes the following sub-divisions: Acute stroke units that accept patients acutely but discharge early (usually within 7 days). This could include an “intensive” model of care with continuous monitoring and high nurse staffing levels. Rehabilitation stroke units which accept patients after a delay of usually 7 days or more and focus on rehabilitation Combined stroke units (ie no separation between acute and rehabilitation beds) that accept patients acutely but also provide rehabilitation for at least several weeks if necessary. Key characteristics of all stroke units Five key characteristics were chosen from the Stroke Unit Trialists' Collaboration (SUTC) http://www.update-software.com/abstracts/AB000197.htm and subsequent papers, as markers of stroke unit organisation. The audit has assessed how many of these are in place. The 5 characteristics are:
• Consultant physician with responsibility for stroke • Formal links with patient and carer organisations • Multidisciplinary meetings at least weekly to plan patient care • Provision of information to patients about stroke • Continuing education programmes for staff
The Department of Health National Performance Indicator on the percentage of patients admitted to a stroke unit uses a minimum of 4/5 of these criteria to define a stroke unit. This is included in the summary results table Chapter Four. For further information: http://ratings2005.healthcarecommission.org.uk/Trust/Indicator/indicatorDescriptionShort.asp?indicatorId=1221 Criteria for judging quality of acute stroke units To evaluate specifically the quality of acute stroke unit organisation we determined whether the following 6 criteria were met. These characteristics are not all evidence based but were developed using the consensus of an expert working group – the Intercollegiate Stroke Working Party:
• Continuous physiological monitoring (ECG, oximetry, blood pressure) • Access to scanning within 3 hours of admission • if not 3 hours, access to 24 hour brain imaging • Policy for direct admission from A&E • Specialist ward rounds at least 5 times a week • Acute stroke protocols/guidelines

--------------------------------------------------------------------------------------------------- Definitions
8
Mobile Stroke Team A multidisciplinary team providing care in a variety of settings. The Department of Health in England has suggested that provision of a mobile stroke team may be acceptable as an alternative to a geographically based stroke unit. However if this model is adopted it is accepted that there should be clear criteria by which to judge whether they reach the standard necessary for the NSF milestone for specialist stroke services. We would suggest that these criteria are that the team should consist of a minimum of a physician responsible for stroke, a specialist nurse and at least two kinds of therapist disciplines. The team should meet to plan stroke patients’ care at least once a week. Early Supported Discharge Teams The National Clinical Guidelines for Stroke (2004) state that specialist stroke services should be available in the community as part of an integrated system of care to facilitate early supported discharge. There are as yet no definitions as to the constitution of an ideal early supported discharge team, but the research evidence suggests that medical, nursing and therapy input are all desirable and that the team should be a specialist team for stroke and not a group of therapists providing care to a range of different clinical conditions Useful addresses Chest, Heart and Stroke Association Scotland www.chss.org.uk Department of Health stroke strategy http://www.dh.gov.uk/PolicyAndGuidance/HealthAndSocialCareTopics/Stroke/fs/en Different Strokes www.differentstrokes.co.uk Northern Ireland Chest, Hearth and Stroke Association www.nichsa.com Stroke Association www.stroke.org.uk Connect http://www.ukconnect.org/

--------------------------------------------------------------------------------------------------- Priority Findings and Recommendations for Action
9
PRIORITY FINDINGS AND RECOMMENDATIONS FOR ACTION Stroke clinicians, managers and politicians can feel proud of the advances that have been made over the last ten years - there are few other conditions that have progressed as rapidly. Inpatient specialist care has made enormous progress with both an increase in the proportion of hospitals with a stroke unit (79% in 2004 to 91% in 2006) and an increase in the size of the units in England. 62% of the patients in the audit sample were admitted to a stroke unit at some point during their stay and 54% spent more than 50% of their stay in a stroke unit. This is a significant and welcome improvement over the last two years from 46% and 40% respectively. Patients managed on a stroke unit had considerably better results for the key indicators than patients looked after in other settings. They were much more likely to have a swallow screen, to have started aspirin within 48 hours, been assessed by therapists within recommended time frames and had rehabilitation goals documented and have a home visit performed before discharge. Action required: All trusts managing stroke patients should increase the proportion who spend the majority of their hospital stay on a stroke unit to over 80% by the time of the next audit in 2008 The National Clinical Guidelines for Stroke (2004) recommend scanning within 24 hours of the onset of symptoms of stroke to confirm their diagnosis. 42% of all patients achieved this standard which is worse than the 59% achieved in the 2004 audit and unacceptably low, however the question in this round of audit differs from previous rounds in that a much greater proportion of patients were regarded as applicable. The standard has therefore become more stringent. Speed of access to imaging needs to be radically improved. Action required: By 2008 All patients should have brain imaging within a maximum of 24 hours of admission Stroke should be treated as a medical emergency. This means raising the profile of stroke amongst the general public and health professionals and the rapid transfer of stroke patients to hospitals able to provide the best quality of specialist acute care including thrombolysis and diagnostics. The rates of thrombolysis for acute ischaemic stroke are amongst the lowest in Western Europe. Only 40 (18%) hospitals saying they offer a service and the total number of patients being thrombolysed (218) is a tiny proportion of those that might benefit and must be an important area for development of services over the next few years. However, getting patients to hospital rapidly is important even if tissue plasminogen activator (tPA) - a medication used to dissolve clots following a stroke in appropriate patients - is not going to be given. Early diagnosis and management on an acute stroke unit are important. It is of concern that only 10% of patients are admitted directly to such a unit. 18% of hospitals provide no specialist acute stroke unit care. While stroke rehabilitation is vital there is good evidence to show that effective acute care can reduce the burden of disability and therefore the pressure on rehabilitation resources. This needs to be addressed through restructuring of acute stroke services and a greater commitment to training of stroke physicians and nurses. Action required: Every Strategic Health Authority and Region should develop systems by 2008 to ensure that all stroke patients have the opportunity to access high quality acute stroke care including thrombolysis

--------------------------------------------------------------------------------------------------- Priority Findings and Recommendations for Action
10
The late launch of a National Service Framework in Wales in 2006 appears to have handicapped the development of specialist stroke services in Wales, which need urgent attention. Given the evidence for the benefits of stroke units, the very low rate of stroke unit provision and admission is unacceptable. Patients in Wales will be dying or surviving with higher levels of disability than is necessary compared to England and Northern Ireland. Action required: Wales needs to identify systems to raise the quality of stroke across the whole patient pathway, particularly through the development of stroke units. Problems remain with stroke patients getting timely access to therapists and social workers. The standards set for the audit should not be too challenging to meet. Yet a third of patients with swallowing disorders have not been assessed by a Speech and Language Therapist within 72 hours of admission or 7 days for those with communication deficits. 29% of patients with motor problems have not seen a physiotherapist within 72 hours and access to occupational therapy and social work is even worse. Not only is this likely to lead to worse patient outcomes but it will almost certainly increase the time that patients spend in hospital. Action required: There should be a greater than 90% compliance with the standards for assessment by therapists in the National Clinical Guidelines for Stroke by the time of the next audit in 2008. Many of the problems identified in the audit stem from the problem that the NHS only operates at full strength on Monday to Friday during normal working hours. Action required: There needs to be a major shift in the attitude towards healthcare that sees the development of services that can respond appropriately at all times including night and weekends. Overall 29% of patients were catheterised following their stroke. Of these 35% (or about 10% of all stroke admissions) were catheterised because of urinary incontinence. Action required: Management of patients with incontinence should be a top priority for service developments. By the time of the 2008 audit there should be no patients being catheterised without good reason and all patients should have adequate assessment for the cause of the incontinence and a management plan implemented. 34% of patients with atrial fibrillation were discharged on an anticoagulant. While not all patients in atrial fibrillation will be appropriate for anticoagulation (because of severe stroke, risk of falling and other contraindications) this figure is lower than one would predict for ideal stroke management. Use of anticoagulation has risen since 2001 but is still an underused treatment. Action required: All patients in atrial fibrillation should be anticoagulated unless there are clearly documented contraindications.

Executive Summary and Recommendations 2006 11
Executive Summary for Phase I Organisation of Stroke Care Background The 5th round of the National Sentinel Audit of Stroke on the organisation of care was conducted in April 2006 having taken place on a two-year cycle since 1998. Aims The aims of the audit are: To enable Trusts to benchmark the quality of their stroke services compared to national standards To identify changes in stroke service organisation and quality of care for stroke patients since the 2004 national sentinel audit To evaluate the extent to which the National Clinical Guidelines for Stroke have been implemented. To monitor the progress of stroke care delivery post National Service Framework Older People (Chapter 5 stroke). No references have been quoted in the report for reasons of space. All relevant evidence is available in the second edition of the National Clinical Guidelines for Stroke (2004). http://www.rcplondon.ac.uk/pubs/brochure.aspx?e=130 Participation All applicable hospitals that admit patients for stroke in England, Wales, Northern Ireland, Isle of Man and the Channel Islands took part. Participation in this audit contributes to the core standards for Healthcare Commission indicators. The total number of participating sites was 238 with 203 in England, 20 in Wales, 12 in Northern Ireland, and 3 in the Channel Islands. The data were collected between 3rdst April 2006 and 7th May 2006 and represent the organisation of services as at 1st April 2006. Organisation of the Audit This audit was funded by the Healthcare Commission and run by the Clinical Effectiveness and Evaluation unit (CEEu) of the Royal College of Physicians London. It was co-ordinated by the CEEu and data were collected within Trusts using a standardised method. Data collection was overseen at a Trust level by a lead clinician for stroke who was responsible for the quality of data supplied. The project was guided by a multidisciplinary steering group responsible for the Stroke Programme - the Intercollegiate Working Party for Stroke (ICWP) http://www.rcplondon.ac.uk/college/ceeu/ceeu_stroke_workingparty.htm. The steering group oversaw the preparation, conduct, analysis and reporting of the audit. Key findings from Phase I organisational audit In-patient specialist care has made enormous progress with both an increase in the proportion of hospitals with a stroke unit (79% in 2004 to 91% in 2006) and an increase in the size of the units in England. However they have reduced in size in Northern Ireland and Wales. We should not be satisfied until nearly all patients are managed on high quality stroke units for both their acute care and rehabilitation. It is imperative that stroke units do not improve at the expense of other elements of patient care. The concern remains that patients who are not admitted to a stroke unit are receiving second rate care. The time has come to start addressing the problem that similar services in the community have failed to develop in parallel. There have been no targets or similar imperatives for this to happen and this should be an area that the Department of Health Stroke Strategy should address.
Executive Summary and Recommendations 2006 12
Management of Transient Ischaemic Attack (TIA) • More neurovascular clinics are operating than in 2004 with slightly shorter waiting
times, although only 35% currently achieve the target of seeing, assessing and managing patients within 7 days.
• It is encouraging to see the number of neurovascular clinics is increasing (65% in 2004 to 78% in 2006) with waiting times for appointments falling from a median of 14 days to 12 days.
• Services must continue to improve so that at the very least they achieve the recommendations of the National Clinical Guideline of being seen and a management plan established within a week of the onset of symptoms.
Managing Stroke as a Medical Emergency • The failure to develop arrangements with paramedic services to transport
patients with stroke to hospital urgently, reflects the slow progress that has been made in the development of thrombolysis services in the UK.
• Thrombolysis services for stroke are being introduced very slowly. Only 40 (18%) hospitals saying they offer a service and only 30 having thrombolysed any patients during the last year.
• The total number of patients being thrombolysed (218) is a tiny proportion of those that might benefit and must be an important area for development of services over the next few years.
• However, getting patients to hospital rapidly is important even if tissue plasminogen activator (tPA) - a medication used to dissolve clots following a stroke in appropriate patients - is not going to be given. Early diagnosis and management on an acute stroke unit are important. It is of concern that only 10% of patients are admitted directly to such a unit. 18% of hospitals provide no specialist acute stroke unit care. While stroke rehabilitation is vital there is good evidence to show that effective acute care can reduce the burden of disability and therefore the pressure on rehabilitation resources.
• There are increasing numbers of hospitals with acute stroke units (34% in 2004 to 50% in 2006). The 6 characteristics used by the audit to assess the intensity of care provided in these units are not all evidence based but these data suggest that in some units ‘acute’ is not very acute.
Investigation of Stroke • Nearly all hospitals now have the facilities to scan the brain and carotid arteries,
however access remains difficult for some, particularly out of normal working hours. This is an issue that will need to be resolved if first class stroke services are to be delivered in UK hospitals
Numbers of Stroke Units • While the desired 100% figure for stroke unit provision has not yet been reached
it does now look to be an achievable objective. 94% of stroke units (205/217) had 4 or all of the five features we have used to define quality, compared to 90% in 2004 and 72% in 2002.
• There have been small increases in the size of stroke units since the 2004 audit. • Across the country on the day of audit there were 6720 patients on site, and there
were 5552 stroke unit beds, an overall ratio of 0.83 beds per stroke patient. If this ratio is calculated for each site the site median was 0.89, up from 0.77 in 2004. In 2004 less than 50% of stroke patients spent the majority of their time on a stroke unit suggesting that bed capacity was inadequate. These figures suggest that unless length of stay has fallen significantly there is still likely to be a problem of insufficient stroke unit capacity.
Executive Summary and Recommendations 2006 13
• There is no scientific basis for excluding stroke patients from stroke units as the Stroke Unit Trialists’ Collaboration has shown that patients of all ages, stroke severity and type appear to benefit from specialist care. The fact that nearly half of units do still exclude some patients on the basis of these factors is perhaps indicative of the fact that hospitals are not providing sufficient beds to meet the needs of the population
Staffing and Stroke Care • There remain quite large variations between hospitals in the numbers of
professionals employed to deliver stroke care. • Psychology remains seriously under resourced • Provision of orthotics and foot health is important for stroke patients, however
provision appears scarce. • It is very encouraging that 97% of hospitals now have a consultant physician
responsible for stroke services. The median number of sessions has risen to 5, which is better than in previous audits, but still a long way from the recommendations of the British Association of Stroke Physicians of 2 Whole Time Equivalents (wte) or 22 sessions per district.
• Consultant nurse posts in stroke are still low in number and over a quarter of hospitals have no form of senior stroke nurse specialist
Processes of Stroke Care • The service has at last achieved 100% of stroke units holding team meetings at
least once a week. In most cases they do appear to be truly multidisciplinary although the occasional unit operating without a physician, speech and language therapist or occupational therapist leaves some cause for concern.
• The difficulties in provision of social workers for stroke units remains. There are still a quarter of stroke teams that do not have a designated social worker.
• Provision of psychology services remains diabolical. • Using standardised measurement of impairments and disability after stroke helps
maintain common standards and consistency of treatment. There have been marked improvements in the use of such standardised measures over the last four years (measures for conscious level have increased from 83% in 2002 to 96% in 2006, measures of motor impairment from 59% to 90% over the same period)
• Coordinating the care of professionals is important in the delivery of effective multidisciplinary treatment. The use of joint notes and care pathways is one way that may help the process. Development of the electronic patient pathway should provide the best solution but in the meantime this is an area that requires local initiative.
Early Supported Discharge and Community Stroke Teams • A lot of progress that still needs to be made in the development of specialist
stroke services outside hospitals. As length of stay in hospital falls this will become an increasingly important aspect of stroke care.
• There is now a good evidence base to support early supported discharge teams both in terms of clinical benefit and resource use and yet only 22% of trusts have one.
• One of the common complaints of patients is that they feel abandoned when they leave hospital. The failure to provide specialist community stroke teams may be contributing to this perception. Too few of the ‘specialist stroke teams’ appear to be truly multidisciplinary. As the number of such teams increase it is going to be important that their quality is monitored and that they are really fit for purpose.

Executive Summary and Recommendations 2006 14
Training and Education • The number of education programmes for stroke has increased on stroke units. • Maintaining and developing skills of staff working with stroke patients is essential
for the provision of high quality services. This should be a priority for all hospital and primary care trusts. Given that a significant proportion of stroke patients are being managed outside stroke units it is important that training schemes for general medical staff are maintained; this does not seem to be happening.
Patient and Carer Involvement • Educating and informing patients and carers should be seen as a key role of
health professionals managing patients with stroke. Many units do not appear to have the resources to provide this facility especially for patients managed outside stroke units.
• Over two-thirds of units now have a community user group which is a major shift since the last audit (59% in 2004 up to 68% in 2006).
• Improvements have been made in all areas of information provision for stroke patients.
• An increasing number of hospitals do now have formal links with user groups, although this remains the aspect most often missing from the criteria we have set to assess quality of stroke unit organisation.
Research
• Participation in research projects is low. 44% of hospitals are not participating in any stroke related research studies and those that are only contribute to a small number. There is fertile ground for the Stroke Research Network to develop.

Executive Summary and Recommendations 2006 15
Executive Summary for Phase II Clinical Audit Participation This 2006 audit relates to patients admitted from 1 April 2006 to 30 June 2006 and takes place exactly 2 years since the last audit of patients admitted 1 April 2004 to 30 June 2004. It follows on (as Phase II) directly from the audit of stroke organisation at 1 April 2006 as conducted in the summer of 2006 (Phase I). A total of 224 sites from 203 Trusts submitted data on a total of 13,625 patients. This represents 100% of acute Trusts admitting stroke patients in England, Wales, Northern Ireland and the Islands. The number of sites differs from the number in the organisational audit due to reconfiguration of hospitals and may span several sites where patients are transferred. Key findings from Phase II clinical audit Case Mix • The case mix of patients included in the 2006 audit was very similar to previous
years • Mortality rates have fallen slightly since 2004
Use of Hospital Beds and Institutionalisation Rates • Mean length of stay has fallen considerably over the last two cycles of audit from
34 days in 2001, to 25.4 days in 2006. Similar reductions in length of stay are shown for patients dying in hospital, falling from 21.1 days in 2001 to 18.6 days in 2006 and for those discharged alive from 39.5 days to 27.7 days. For an estimated 120,000 stroke patients in the UK annually this would translate into a reduction of about 2800 beds for their care.
• The shorter lengths of stay observed this time are not being achieved at the expense of earlier inappropriate discharge into care homes with no change in the percentage of patients (only 13%) being newly institutionalised after their stroke.
• The proportion of patients with mild stroke (Barthel 15-19) has fallen from 29% in the 2004 audit to 24% in 2006. This suggests that patients are being discharged earlier with residual impairments while in the past they would have remained in hospital to complete their rehabilitation. Given that the organisational audit in 2006 did not show a significant increase in the availability of specialist community rehabilitation teams this is concerning and highlights the need for audit data looking at the longer term outcomes of stroke patients.
Stroke Unit Provision • 62% of the sample was admitted to a stroke unit at some point during their stay
and 54% spent more than 50% of their stay in a stroke unit. . This is a significant and welcome improvement over the last two years from 46% and 40% respectively. It reflects the fact that 91% of hospitals now have a stroke unit. There is still however clearly a lack of capacity within these units to manage all appropriate stroke patients.
• 76% of patients with minor stroke, staying in hospital less than 2 days, are not being managed on specialist units. These are often patients at very high risk of stroke recurrence and it is particularly important that they receive expert care and investigation. This is more likely to occur on a stroke unit and improvement of services for these patients should become a priority in the development of stroke services in the UK.
• 78% of patients staying in hospital more than 28 days spend some of their admission on a stroke unit. The objective should be to increase this figure to nearly 100%

Executive Summary and Recommendations 2006 16
• Of the 341,343 bed-days captured in this audit, 195,629 (57%) were spent in a stroke unit.
• Speed of access to stroke unit care is better than in 2004 but needs to be further improved. Only 15% of patients are admitted to a stroke unit on the same day as their stroke and only 12% of patients are being admitted directly to a stroke unit (within 4 hours of arrival in hospital). This compares with 25% who were admitted on the same day in 2004 and 20% in 2001. The opportunities to optimise acute care at the time when ischaemic brain remains potentially salvageable is not being maximised. Direct admission to an acute stroke unit should be the standard that the NHS should be setting.
• For many patients the delay in admission to a stroke unit is totally unacceptable, stretching to days and weeks.
• 54% of the patients spent more than half of their stay on a stroke unit, 33% on a general ward.
• There are a large number of patients whose admission to hospital is delayed. It is likely that this adversely affects outcome and it highlights the need for a public and professional awareness campaign that stroke is a medical emergency and that immediate admission to hospital should be arranged for all cases.
• Of the 7502 patients where time of stroke and time of scan are recorded only about 39% are admitted within 2 hours of stroke. These are the patients who might be appropriate for thrombolysis given that they will need to be assessed clinically and scanned before the 3 hour time window. To increase this percentage professionals and public need to recognise symptoms of stroke, know how to respond and be provided with the facilities for rapid transfer to a stroke thrombolysis centre. The majority of patients with stroke are admitted between 8am and midnight. Provision of a thrombolysis service between these hours will cover 6 out of seven patients.
• Patients managed on a stroke unit had considerably better results for the key indicators than patients looked after in other settings. They were much more likely to have a swallow screen, to have started aspirin within 48 hours, been assessed by therapists within recommended time frames and had rehabilitation goals documented and have a home visit performed before discharge. Brain Imaging
• Only 42% of patients had brain imaging to confirm their diagnosis within 24 hours of the onset of symptoms. This is unacceptably low, however the question in this round of audit differs from previous rounds in that a much greater proportion of patients were regarded as applicable. The standard has therefore become more stringent. Speed of access to imaging needs to be radically improved.
• Of the patients scanned (6559 with times of stroke and scan known) only 9% were scanned within 3 hours of stroke.
• The delay from stroke to brain scan data suggests that those patients not scanned during daytime hours on the day of admission have to wait until the next working day before the scan is performed.
• The National Clinical Guidelines for Stroke (2004) recommend scanning within 24 hours of stroke. Only 42% of patients achieved this standard which is worse than the 59% achieved in the 2004 audit.

Executive Summary and Recommendations 2006 17
• The histogram below showing the times of day scans are performed suggests
that the reason for delays in scanning are not likely to be due to a lack of scanners.
242220181614121086420
24-hour clock
1,200
1,000
800
600
400
200
0
Num
ber o
f pat
ient
s re
ceiv
ing
first
bra
in s
can
afte
r str
oke
• It is clear that the scanning machines are scarcely used outside normal working hours and there is also spare capacity during the lunch hour. Improving the standards for scanning needs the issues of radiographer and radiologist staffing to be solved, not the provision of more machines.
Comparison between England, Wales and Northern Ireland • Stroke services in Wales need urgent attention. The very low rate of stroke unit
admission is unacceptable. Patients in Wales will be dying or surviving with higher levels of disability than is necessary.
Promotion of continence • Overall 29% of patients were catheterised following their stroke. Of these 35% (or
about 10% of all stroke admissions) were catheterised because of urinary incontinence. While it is clearly appropriate to catheterise patients in urinary retention, where the patient has been admitted with a catheter in situ or where there is a need for accurate fluid balance monitoring, urinary incontinence per se is not usually an acceptable indication. Catheterisation increases the risk of infection; it is an unpleasant experience for patients and prevents any attempt being made to regain continence. The 10% catheterised overall represents a small reduction in catheterisation for incontinence from 12% in 2004, but the figure remains unacceptably high.

Executive Summary and Recommendations 2006 18
• Effective management of urinary incontinence is extremely important for the patients for whom it is a distressing and disabling complication of stroke. That only just over half of patients with incontinence had any evidence of a written plan to promote continence is appalling. This aspect of stroke care should be given the highest priority for service development over the next year. Documentation of Pathology and Impairments
• Overall there have been improvements in the standards of care for screening of impairments however these are happening at a painfully slow rate. It is disgraceful that only 66% of patients are screened to see if they can swallow safely and that 26% of patients have no record in their notes about whether their visual fields have been affected by the stroke. Multi-disciplinary Assessment
• Nearly all trusts reported in the 2006 Organisational Audit that they conduct regular multidisciplinary meetings. And yet a quarter of patients with physical impairments have no rehabilitation goals documented in their notes. What purpose do the multidisciplinary meetings have for these patients? Management/Care Planning
• Problems remain with stroke patients getting timely access to therapists and social workers. The standards set for the audit should not be too challenging to meet. Yet a third of patients with swallowing disorders have not been assessed by a Speech and Language Therapist within 72 hours of admission or 7 days for those with communication deficits. 29% of patients with motor problems have not seen a physiotherapist within 72 hours and access to occupational therapy and social work is even worse. Not only is this likely to lead to worse patient outcomes but it will almost certainly increase the time that patients spend in hospital. Part of the problem is the persistence of policies within the NHS that attempt to provide all ‘routine’ care between 9 and 5 Mondays to Fridays. The service needs to acknowledge that illness does not recognise days of the week or times of day.
• There have been slow improvements in some of these standards but again the targets set should not be challenging and it is disappointing that so many patients are still not being offered adequate screening and functional assessment. Assessment of nutritional status, mood and cognition should be performed in nearly all patients.
• For the first time a question has been asked about whether and how patients are nourished in the acute phase of stroke. A high percentage – 93% were receiving some form of nutrition by 72 hours.
• The number of home visits prior to discharge home is falling with each cycle of audit. This represents a 6% decrease for patients in whom such a visit was considered to be applicable in 2004. Communication with Patients and Carers
• Assessment of carer needs is one of the areas of practice that has improved most since the last audit from 43% compliance to 68%. Smaller improvements were seen in the teaching of skills to carers to manage stroke patients at home.
• There has been a small deterioration in the standards assessing discussion with the patient about diagnosis and prognosis. A third of patients had nothing recorded in their notes to indicate that these issues had been raised with them

Executive Summary and Recommendations 2006 19
Primary and Secondary Prevention • Only 9% of admitted patients were recorded as being current smokers. The
majority of whom did have evidence of being advised to stop. • Exercise after stroke is a valuable as a way of improving physical fitness and
losing weight. Less than half of people who had regained the ability to walk (as judged by a mobility score on the Barthel Index of 3) were recorded as having been given advice about exercise.
• Nearly all stroke patients should receive dietary advice, particularly about salt intake, cholesterol and calories. However again only 42% had any documentation to show that this has been provided.
• 72% of patients were on an antihypertensive, an antithrombotic, an antiplatelet or a lipid lowering drug before admission.
• The fact that so many patients are on anti-platelet agents and antihypertensive drugs prior to admission highlights the urgent need for research to ascertain whether these drugs should be stopped, continued or changed following an acute stroke. Antihypertensive Medication
• 57% of patients were admitted already taking at least one antihypertensive drug. 82% of people with known hypertension were taking antihypertensive drugs.
• 17% of discharged patients had treatment with blood pressure lowering drugs initiated during their admission to hospital, and on discharge 70% of patients were on treatment. Clinical guidelines recommend not starting treatment until two weeks after acute ischaemic stroke so it is likely that the total percentage of stroke patients ending up on antihypertensive treatment will be even higher. Antithrombotic Treatment
• Of patients with a pre-stroke co-morbidity of atrial fibrillation, 25% were on warfarin before admission. Given the clear evidence that anticoagulation of patients in atrial fibrillation is the most effective way of preventing stroke in these patients, this is a much lower figure than one would have hoped.
• Only 79% of the patients with a previous history of ischaemic heart disease were admitted on any form of antithrombotic medication. This is an unacceptably large failure in the provision of the most basic form of secondary prevention. Correcting this would probably reduce the stroke rate considerably, saving lives and reducing long term disability.
• Only 23% of patients were discharged on the combination of aspirin and dipyridamole MR. Since the collection of this data the ESPRIT trial has been published confirming the previous ESPS 2 study that the combination of aspirin and dipyridamole is superior to aspirin alone at preventing recurrent stroke. The expectation is that the use of the combination will increase between now and the next round of audit.
• The combined use of aspirin and clopidogrel has reduced since the last audit from 4% to 2% in line with the evidence that the combination is inappropriate for stroke prevention.
• 34% of patients with atrial fibrillation were discharged on an anticoagulant. While not all patients in atrial fibrillation will be appropriate for anticoagulation (because of severe stroke, risk of falling and other contraindications) this figure is lower than one would predict for ideal stroke management. Use of anticoagulation has risen since 2001 but is still an underused treatment.
• A key audit standard is commencement of aspirin by 48 hours after stroke. This is based upon two large randomised trials, IST and CAST which showed modest, but definite benefit for early use of aspirin after ischaemic stroke. It is of grave concern that only 71% of patients achieved this standard.

Executive Summary and Recommendations 2006 20
Management of Lipids
• The increased used of statins in primary care is confirmed in the audit. In 2004 22% of patients were admitted on a lipid lowering drug and this has now increased to 33%.
• One third of patients are admitted already taking a statin and 78 % are taking one by discharge. This is a dramatic increase in the use of statins over the last 5 years.
• Surprisingly large numbers of patients with a history of diabetes or ischaemic heart disease were not taking a statin on admission (44% and 47% respectively). Research
• Only 3% of stroke patients were entered into a research trial. If care for stroke patients is to improve more patients should be entered into research studies. The Stroke Research Network has been set up to address this issue and the evidence from his audit suggests that there is enormous capacity to increase participation in research.

--------------------------------------------------------------------------------------------------- Section 1 Chapter 1 Background and Presentation of results
21
Section 1 Chapter 1 BACKGROUND AND PRESENTATION OF RESULTS Background to the national sentinel stroke audit The National Sentinel Audit of Stroke has taken place on a two-year cycle since 1998. The results for organisation of care were initially published separately from the clinical process standards. This report now combines the results of the clinical data collected from October 2006. No references have been quoted in the report for reasons of space. The audit compares the service organisation with standards derived from research evidence for organisation of stroke care delivery set out in the National Clinical Guidelines for Stroke 2004 (website www.rcplondon.ac.uk/pubs/books/stroke/index.htm) Further information on methods can be obtained from the Royal College of Physicians Presentation of results The results for each phase of the audit are presented in separate sections of this report. Chapter 1 in each section introduces the methods. The following chapters provide national results overall and comparisons over time. The final chapter in each section provides named hospital results by region for key indicators. The Islands refers to the Isle of Man, States of Jersey and States of Guernsey. Where comparisons are made between rounds this relates to standards where comparison is possible. The algorithm for calculating the domains and total scores are available on request. National results are presented as percentages, and site variation is summarised by the median and Inter-Quartile Range (IQR). Ratios of staffing numbers per 10 stroke unit beds are given rather than staffing numbers per se so as to allow an interpretation more relevant to National standards.

--------------------------------------------------------------------------------------------------- Section 1 Chapter 2 Organisation of stroke care nationally
22
Chapter 2 ORGANISATION OF STROKE CARE NATIONALLY AS AT 1 APRIL 2006 All hospitals took part – the second time that 100% participation has been achieved. The total number of participating sites in 2006 was 238: England 203, Wales 20, Northern Ireland 12 and the Islands 3. Stroke Unit Provision England, Wales and Northern Ireland have made excellent progress in the provision of stroke units. Development of acute stroke units is more extensive in England than Wales or Northern Ireland. Wales has changed little since 2004. Emphasis must now be placed on quality, not just on quantity. Median bed numbers have increased in England but reduced in Northern Ireland and Wales
Table 1 Stroke Unit Provision in UK hospitals
England (203)
Wales (20)
N. Ireland (12)
Islands (3)
% of sites with stroke unit 2006 % of sites with stoke unit 2004
97% (196) 82%
45% 45%
(9)
92% 85%
(11)
33% (1) 0%
Median (IQR) number of stroke beds in stroke units 2006
24 (18 – 31)
20 (15 – 25)
12 (10 – 22)
8 (--)
Median number of stroke beds in stroke units 2004 20 21 14 -
% of stroke units with 4-5 key characteristics* 95%
100% 82%
100%
Ratio: Median (IQR) number of stroke unit beds per stroke inpatient (on site on the day the audit form was completed)
0.9 (0.7 – 1.1)
1.0 (0.5 – 1.3)
0.8 (0.7 – 1.1)
0.7 (--)
* See definitions on page 6 for details

--------------------------------------------------------------------------------------------------- Section 1 Chapter 2 Organisation of stroke care nationally
23
Acute and combined stroke units Acute stroke units in Wales and Northern Ireland do not appear to be as ‘acute’ as those in English acute stroke units
Table 2 acute stroke unit provision in UK hospitals England
(191)* Wales (20)
N. Ireland (12)
Islands (3)
Number (%) of sites with acute stroke unit 112 (59%) 3 (15%) 3 (25%) 0%
Median (IQR) number of stroke beds in acute stroke units 10 (6-15) 8 (-) 6 (-) -
% of acute units with 5-6 acute features* 47 (42%) 0 (0%) 1 (33%) -
*12 hospitals which only treat rehabilitation patients were excluded from this analysis Table 3 combined stroke unit provision in UK hospitals England*
(191) Wales (20)
N. Ireland (12)
Islands (3)
Number (%) of sites with combined stroke unit 53 (28%) 3 (15%) 7 (58%) 0%
Median (IQR) number of stroke beds in combined stroke units 20 (15 - 24) 15 (-) 11 (-) -
% of combined stroke units with 5-6 acute features* 16 (30%) 1 (33%) 4 (57%) -
% of sites with an acute or a combined stroke unit 2006 85% 30% 83% 0%
See definitions on page 6 for details *12 hospitals which only treat rehabilitation patients were excluded from this analysis

--------------------------------------------------------------------------------------------------- Section 1 Chapter 2 Organisation of stroke care nationally
24
Whole Time Equivalents (WTE) for staff on stroke units There are large variations in the numbers of nurses, junior doctors and therapists employed on stroke units that are unlikely to be explained on the basis of case mix alone. Research is needed to identify what the ideal numbers of staff are from both the perspective of clinical and cost effectiveness.
Table 4 Whole time equivalents (WTEs)* for staff in stroke units England Wales N. Ireland Islands Median (IQR) number of qualified nurses/assistants on duty per 10 beds
3.3 (2.9 - 3.7) 3.0 (2.9 - 3.9) 5.0 (3.3 - 7.8) 10.0 (-)
Median (IQR) number of junior doctor sessions per 10 beds
5.0 (3.3 - 7.1) 3.9 (1.7 - 8.4) 4.5 (4.0 - 8.3) 0.0 (-)
Median (IQR) WTE per 10 beds for:
Clinical Psychology 0.0 (0.0 – 0.1) 0.0 (0.0 – 0.3) 0.0 (0.0 – 0.0) 1.3 (--)
Dietetics 0.1 (0.1 – 0.2) 0.1 (0.0 – 0.4) 0.3 (0.1 – 0.4) 1.3 (--)
Occupational Therapy 1.0 (0.7 – 1.3) 0.8 (0.2 – 0.9) 1.0 (0.3 – 1.4) 3.8 (--)
Physiotherapy 1.3 (0.9 – 1.6) 1.3 (0.6 – 1.8) 1.2 (0.4 – 1.5) 3.8 (--)
Speech & Language Therapy 0.3 (0.2 – 0.6) 0.6 (0.3 – 0.7) 0.3 (0.2 – 0.5) 1.3 (--)
Pharmacists 0.1 (0.0 – 0.2) 0.1 (0.1 – 0.7) 0.1 (0.0 – 0.2) 1.3 (--)
Orthotists 0.0 (0.0 – 0.0) 0.0 (0.0 – 0.0) 0.0 (0.0 – 0.0) 1.3 (--)
Foot health / podiatrists 0.0 (0.0 – 0.0) 0.0 (0.0 – 0.0) 0.0 (0.0 – 0.0) 1.3 (--)
* WTEs are presented as ratios of staff per ten stroke unit beds to allow comparison Table 5 Percentage of stroke units with social worker attached to the multidisciplinary team Sites with stroke units England Wales N. Ireland Islands % with a named social worker attached to the multi-disciplinary team
73% 56% 100% 100%
Other models of stroke care As in 2004, comprehensive information was collected on alternative types of specialist service provision for stroke patients
A lot of progress still needs to be made in the development of specialist stroke services outside hospitals. As length of stay in hospital falls this will become an increasingly important aspect of stroke care

--------------------------------------------------------------------------------------------------- Section 1 Chapter 2 Organisation of stroke care nationally
25
Table 6 Percentage of hospitals with other models of stroke unit care % with: England Wales N. Ireland Islands
A mobile stroke team 32% 25% 0% 0%
An early supported discharge team 21% 20% 42% 33%
A specialist community stroke team 34% 5% 42% 33%
See definitions on page 6 for details Specialist medical staff It is very encouraging that the majority of hospitals have a consultant physician responsible for stroke services. The median number of sessions is a long way from the recommendations of the British Association of Stroke Physicians of 2 WTE per district.
Table 7 Consultant physician provision in UK hospitals
England Wales N. Ireland Islands % of sites with a consultant physician with specialist knowledge of stroke formally recognised as having principal responsibility for stroke services
98% 95% 83% 100%
Median (IQR) of the number of formal sessions per week of consultant physician time for stroke management (including outpatient clinics)
5 (3-8) 3 (1-4) 3 (3-6) 1 (0-2)
Patients thrombolysed The number of stroke patients thrombolysed (218) in 12 months is a very small proportion (approximately 0.2%) of the national number of strokes (> 100,000). One quarter (10) of the 40 sites offering thrombolysis did not thrombolyse any patients in 12 months.
Table 8 patients thrombolysed in UK hospitals England Wales N. Ireland Islands Sites offering thrombolysis 18% 5% 17% 0% Numbers of patients thrombolysed by sites in last 12 months: 0 patients 86% 95% 92% 100% 1-3 patients 4% 5% 8% 0% 4-10 patients 5% 0% 0% 0% 11-20 patients 3% 0% 0% 0% >20 patients 1% 0% 0% 0% Overall, 218 stroke patients were thrombolysed during this period: 215 in England, 2 in Wales and 1 in Northern Ireland.

--------------------------------------------------------------------------------------------------- Section 1 Chapter 2 Organisation of stroke care nationally
26
Research studies Nearly half of sites do not participate in any research studies. Only a quarter of sites participate in 3 or more studies.
Table 9 Participation in research in UK hospitals England Wales N. Ireland Islands % of sites with ONE or more research studies 56% 60% 58% 0%
% of sites with THREE or more research studies 24% 10% 25% 0%
--------------------------------------------------------------------------------------------------- Section 1 Chapter 2 Organisation of stroke care nationally
27
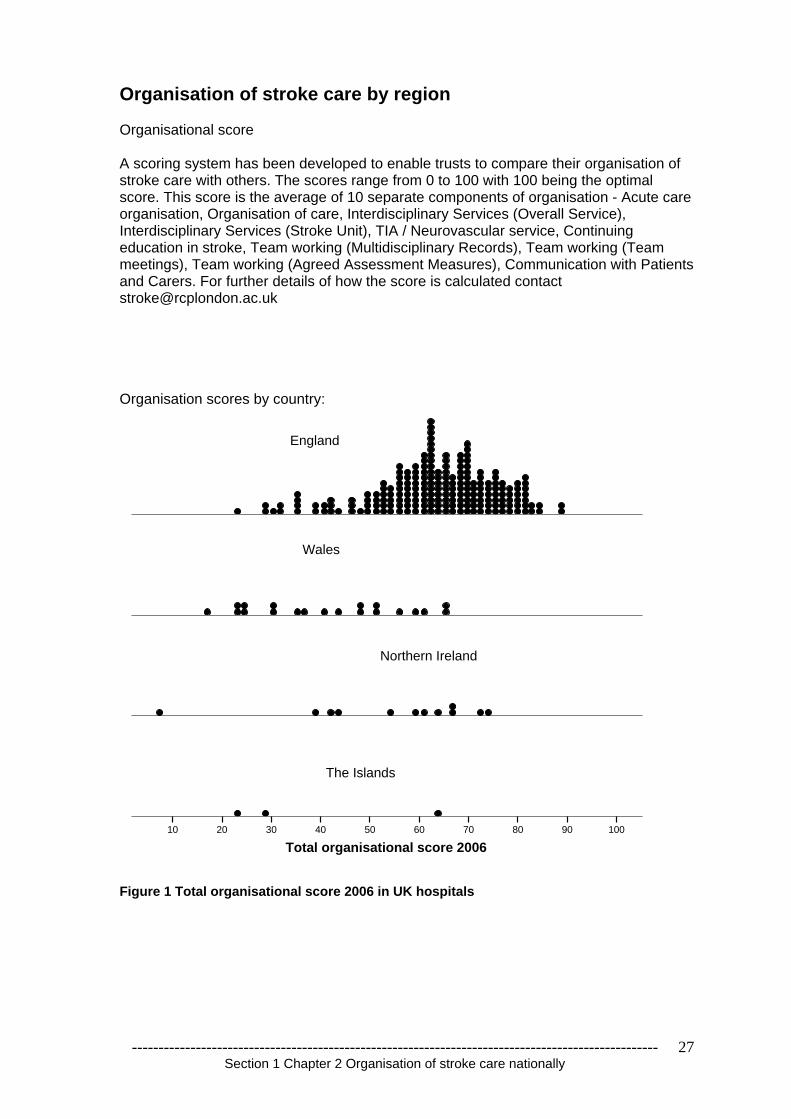
Organisation of stroke care by region Organisational score A scoring system has been developed to enable trusts to compare their organisation of stroke care with others. The scores range from 0 to 100 with 100 being the optimal score. This score is the average of 10 separate components of organisation - Acute care organisation, Organisation of care, Interdisciplinary Services (Overall Service), Interdisciplinary Services (Stroke Unit), TIA / Neurovascular service, Continuing education in stroke, Team working (Multidisciplinary Records), Team working (Team meetings), Team working (Agreed Assessment Measures), Communication with Patients and Carers. For further details of how the score is calculated contact [email protected] Organisation scores by country:
Total organisational score 2006100908070605040302010
England
Northern Ireland
Wales
The Islands
Figure 1 Total organisational score 2006 in UK hospitals

--------------------------------------------------------------------------------------------------- Section 1 Chapter 2 Organisation of stroke care nationally
28
Organisation scores by region (including the proposed new SHA s for England):
Total organisational score 2006100908070605040302010
East Midlands
East of England
Islands
London
North East
North West
Northern Ireland
South Central
South East Coast
South West
Wales Mid & West
Wales North
Wales South East
West Midlands
Yorkshire & The Humber
Figure 2 Total organisational scores 2006 by region

--------------------------------------------------------------------------------------------------- Section 1 Chapter 3 Organisation of stroke care by domains
29
Chapter 3 Organisation of Stroke Care by Domains A scoring system was developed in 2002 to enable trusts to compare their organisation with the national data. The optimal best score was 100 and results were presented according to 9 domains. The system was updated in 2006 and expanded to include Acute and TIA/neurovascular services. There are now 10 domains. 1 Acute Stroke Care 2 Organisation of Care 3 Interdisciplinary Services (Overall Service) 4 Interdisciplinary Services (Stroke Unit) 5 TIA/neurovascular Services 6 Continuing Education in stroke 7 Team working - multidisciplinary Records 8 Team working – team meetings 9 Agreed Assessment Measures 10 Communication with Patients and Carers

--------------------------------------------------------------------------------------------------- Section 1 Chapter 3 Organisation of stroke care by domains
30
Domain 1 – Acute stroke care
Description of domain This domain includes the presence of either an acute or combined stroke unit, a measure of the quality of these units (eg whether physiological monitoring is present), joint protocols with ambulance services for emergency/rapid transfer to hospitals and whether the Trust offers thrombolysis and if so, the number of patients thrombolysed in the previous six months. Evidence is strong that appropriate patients who receive thrombolysis have better outcomes than those who do not. The drug received a provisional license in Europe two years ago and following careful auditing by the SITS-MOST organisation has now been granted a full licence. Only 1 in 10 patients are likely to be admitted directly to an acute stroke unit. 8 out of 10 are more likely to be admitted to a Medical assessment unit or admission ward. Acute and Combined stroke units We are seeing progressive improvements in the organisation of stroke services with increasing numbers of acute stroke units and improvement in the quality of those units. The 6 characteristics used by the audit to assess the intensity of care provided in these units are not all evidence based but these data suggest that in some units ‘acute’ is not very acute. The organisation of care on units that classified as acute or combined are comparable apart from lower intensity of specialist ward rounds on the combined units. Table 10 Percentage of hospitals with an acute or combined stroke unit in 2004 and 2006 2004 2006 % hospitals with an acute stroke unit % hospitals with a combined stroke unit
34% 16%
50% 26%
Table 11 Quality of acute or combined stroke units measured by acute characteristics
Characteristics of Acute or combined Stroke Unit Acute stroke unit
Combined stroke unit
a) Continuous physiological monitoring (ECG, oximetry, blood pressure)
57%
54%
b) Access to scanning within 3 hours of admission 48% 41% c) Access to brain imaging within 24 hours 95% 98% d) Policy for direct admission from A&E 48% 44% e) Specialist ward rounds at least 5 times a week 74% 49% f) Acute stroke protocols/guidelines 97% 98% 5 or all 6 Acute Stroke Unit characteristics 41% 33% Table 12 Development of features on acute stroke unit between rounds 2004 2006 Number of features on acute stroke unit 0 features present 1-4 features present 5-6 features present
3% 64% 33%
0% 59% 41%

--------------------------------------------------------------------------------------------------- Section 1 Chapter 3 Organisation of stroke care by domains
31
Thrombolysis The failure to develop arrangements with paramedic services to transport patients with stroke to hospital urgently reflects the slow progress that has been made in the development of thrombolysis services in the UK. Only 18% of sites offer thrombolysis and the median number of patients treated over the last year in these sites is woefully low. However getting patients to hospital rapidly is important even if tPA is not going to be given. The country has been very slow to introduce thrombolysis services for stroke with only 40 (18%) hospitals saying they offer a service and only 30 having thrombolysed any patients during the last year, a total of 218 patients. This number of patients being thrombolysed is a tiny proportion of those that might benefit and must be an important area for development of services over the next few years. Table 13 Development of thrombolysis services 2004 to 2006 2004 2006 % hospitals that have arrangements with local ambulance service for emergency/rapid transfer to hospital for acute stroke over and above the regular system
4%
12%
% hospitals where the Trust offers thrombolysis NA 18%
0 0 0 0 0 0 0 0 0 01 1 1 1
2 2 2 23 3 3
4 4 45 5 5
78
910
11 1112 1212
14
20
2222
0
5
10
15
20
25
Sites
Num
ber o
f pat
ient
s th
rom
boly
sed
Figure 3 Stroke patients thrombolysed during the past 12 months at those sites who state they offer thrombolysis

--------------------------------------------------------------------------------------------------- Section 1 Chapter 3 Organisation of stroke care by domains
32
Domain 2 Organisation of care
Description of domain This domain incorporates the formal services for stroke care within both acute and community settings and maps specialist bed capacity for the number of patients with stroke in the trust. In-patient specialist care has made enormous progress with both an increase in the proportion of hospitals with a stroke unit and an increase in the size of the units; the time has come to start addressing the problem that similar services in the community have failed to develop in parallel. There have been no targets or similar imperatives for this to happen and this should be an area that the Department of Health Stroke Strategy should address. Table 14 Changes in provision of stroke units and specialist community stroke teams 2002 to 2004 2002 2004 2006
% with Stroke Unit 73% 79% 91%
Median (IQR) number of stroke beds 20 (14-27) 20 (15-29) 24 (16-30)
Specialist stroke community team in your area for continuing longer-term management NA 25% 32%
94% of stroke units (205/217) had four or all five features, compared to 90% in 2004 and 72% in 2002. 9 of 11 units with three features were missing formal links with patients and carers and continuing education. 47 of 59 units with four features were missing formal links with patients and carers.
Table 15 Quality of all stroke units according to 5 key characteristics
No. of characteristics
No. of stroke units
Consultant physician
Formal links with patients and carers
Team meetings
Patient information
Continuing education
1 0 0 0 0 0 0 2 <1% 0 0 <1% <1% 0 3 5% 91% 18% 100% 91% 0 4 27% 97% 20% 100% 95% 88% 5 67% 100% 100% 100% 100% 100%
Admission Criteria for Stroke Units The Stroke Unit Trialists Collaboration (SUTC) data suggest that all patients benefit from specialist stroke unit care regardless of age, sex or stroke severity. Therefore if a hospital has sufficient beds of the appropriate type then there is no justification for selecting patients. 43% of hospitals operated selection criteria compared with 67% of hospitals in 2004.

--------------------------------------------------------------------------------------------------- Section 1 Chapter 3 Organisation of stroke care by domains
33
Other models of stroke care Development of other models of stroke care needs considerably more attention paid to it. Early supported discharge teams are effective both in terms of clinical benefit and resource use and yet only 22% of trusts have one. One of the common complaints of patients is they feel abandoned when they leave hospital. The failure to provide specialist community stroke teams may be contributing to this perception. Too few of the ‘specialist stroke teams’ appear to be truly multidisciplinary. As the number of such teams increase it is going to be important that their quality is monitored and that they are really fit for purpose.
Table 16 Specialist teams for stroke
% of hospitals with such a team
Mobile Inpatient Stroke Team 29% Specialist Early Supported Discharge Stroke Team 22% Specialist Community Stroke Team 32% Table 17 Composition of specialist stroke teams
Regular members of the teams:
Mobile Stroke
Team
Early Supported Discharge Team
Specialist Community
Stroke Team Specialist doctor 74% 29% 19% Specialist nurse 80% 46% 53% Social worker 20% 42% 36% Speech & Language therapist 64% 77% 83% Physiotherapist 81% 100% 93% Occupational therapist 60% 96% 92% Dietitian 39% 44% 36% Psychologist 4% 19% 28% Other* 16% 17% 13%
Specialist doctor & nurse & two of the three therapists %YES
44% 19% 11%

--------------------------------------------------------------------------------------------------- Section 1 Chapter 3 Organisation of stroke care by domains
34
Domain 3 – Interdisciplinary Services (overall service)
Description of domain This domain describes and quantifies the specialist medical care available for participating hospitals with and without a stroke unit. It also includes the ratio of senior doctor sessions to stroke unit beds Virtually all hospitals have a lead clinician for stroke; however, the number of sessions remains inadequate for the delivery of comprehensive stroke services including prevention, acute, rehabilitation and longer term support services. The British Association of Stroke Physicians recommends 2 whole time equivalents per district. Table 18 Provision of senior medical staff between 2002 and 2006 2002 2004 2006 Consultant physician with specialist knowledge of stroke formally recognised as having principal responsibility for stroke services
80% 90% 98%
Number of formal sessions per week of senior doctor time for stroke management:
% with no consultant sessions 22% 7% 2% % with no staff grade sessions 64% 68% 61%
% with no clinical assistant sessions 90% 90% 91%
In 2006 the median number of consultant sessions is 5 per week Interquartile range 3 to 7. This has increased from 2004 when the median was 3 and interquartile range 2 to 5.
--------------------------------------------------------------------------------------------------- Section 1 Chapter 3 Organisation of stroke care by domains
35
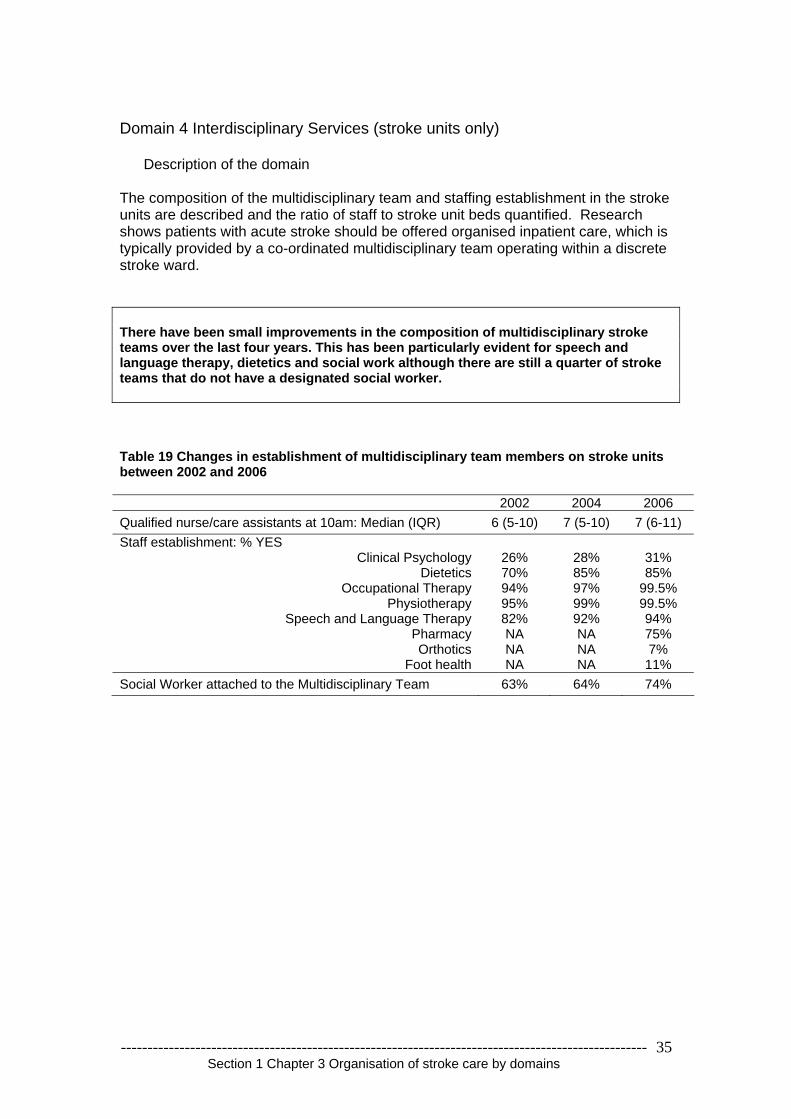
Domain 4 Interdisciplinary Services (stroke units only)
Description of the domain The composition of the multidisciplinary team and staffing establishment in the stroke units are described and the ratio of staff to stroke unit beds quantified. Research shows patients with acute stroke should be offered organised inpatient care, which is typically provided by a co-ordinated multidisciplinary team operating within a discrete stroke ward. There have been small improvements in the composition of multidisciplinary stroke teams over the last four years. This has been particularly evident for speech and language therapy, dietetics and social work although there are still a quarter of stroke teams that do not have a designated social worker. Table 19 Changes in establishment of multidisciplinary team members on stroke units between 2002 and 2006 2002 2004 2006 Qualified nurse/care assistants at 10am: Median (IQR) 6 (5-10) 7 (5-10) 7 (6-11) Staff establishment: % YES
Clinical Psychology 26% 28% 31% Dietetics 70% 85% 85%
Occupational Therapy 94% 97% 99.5% Physiotherapy 95% 99% 99.5%
Speech and Language Therapy 82% 92% 94% Pharmacy NA NA 75% Orthotics NA NA 7%
Foot health NA NA 11% Social Worker attached to the Multidisciplinary Team 63% 64% 74%

--------------------------------------------------------------------------------------------------- Section 1 Chapter 3 Organisation of stroke care by domains
36
Domain 5 TIA Neurovascular services
Description of the domain This domain includes the provision of services for patients with transient ischaemic attack. The risk of stroke within the first four weeks after TIA can be as high as 20%. It is therefore vital that patients with TIA are seen urgently, investigated and a management plan put into place. Where significant carotid stenosis is found, carotid endarterectomy should be performed as soon as possible. There is now evidence to suggest that once 12 weeks have passed from the TIA, carotid endarterectomy ceases to be of value. National Clinical Guidelines for Stroke (2004) recommend that patients with TIA are seen in a neurovascular clinic within one week of the onset of symptoms. It is encouraging to see how the number of neurovascular clinics is increasing with falling waiting times for appointments. We have to continue to improve services so that at the very least they achieve the recommendations of the National Clinical Guidelines of being seen and a management plan established within a week of the symptoms. More neurovascular clinics are operating than in 2004 with slightly shorter waiting times. Only 35% currently achieve the target of seeing, assessing and managing patients within 7 days. Table 20 Changes in the provision of neurovascular/TIA services between 2004 and 2006 2004 2006
Neurovascular clinic 65% 78%
Clinics within a 4 week period: Median (IQR) 4 (4-4) 5 (4-8)
Current average waiting time for a clinic appointment: Median (IQR) days 14 (7-28) 12 (7-17)
Service which enables patients to be seen and investigated within (stated number of) days of minor stroke
55% within 14 days
35% within 7 days

--------------------------------------------------------------------------------------------------- Section 1 Chapter 3 Organisation of stroke care by domains
37
Domain 6 Continuing Education and research
Description of the domain This indicates whether the staff expertise in stroke care is updated through education and training. Regular programmes of education and training are cited as a key feature in randomised stroke unit trials. This year participation in research studies has been included. The number of education programmes for stroke has increased on stroke units Table 21 Development of continuing education programmes on stroke units between 2002 and 2006
Stroke Unit 2002 2004 2006
In-house programme for qualified staff 74% 79% 91%
In-house training unqualified staff 64% 82% 88% Participation in research projects is low. 44% of hospitals are not participating in any stroke related research studies and those that are only contribute to a small number. There is fertile ground for the Stroke Research Network to develop.
Table 22 Participation in research studies Number of clinical stroke research studies registered with Research and Development Department (on the day you complete this form?)
Acute studies % ONE or more 38%
Rehabilitation studies % ONE or more 29%
Prevention studies % ONE or more 23%
Other studies % ONE or more 15% Total studies (SUM of acute, rehab, prevention & other studies) % ONE or more 56%
Table 23 Staff in (wte) funded for clinical stroke research studies How much time (in whole time equivalents (WTE) and however funded) is spent on clinical stroke research studies? % hospitals with ANY wte Total, all professionals 43% Doctor 31% Nurse 24% Occupational Therapy 4% Physiotherapy 9% Speech & Language Therapy 6% Psychologist 5% Dietitian 2% Other 10%

--------------------------------------------------------------------------------------------------- Section 1 Chapter 3 Organisation of stroke care by domains
38
Domain 7 Multidisciplinary Records
Description of this domain A range of staff from different disciplines delivers patient care. The use of multidisciplinary records promotes patient centred care, aids communication between members of the team and helps to avoid duplication. The extent to which multidisciplinary records are in place and the use of a care pathway for stroke is recommended in the National Service Framework for older people. Coordinating the care from professionals is important in the delivery of effective multidisciplinary treatment. The use of joint notes and care pathways is one way that may help the process. Development of the electronic patient pathway should provide the best solution but in the meantime this is an area that requires local initiative.
Table 24 Percentage of hospitals with multidisciplinary records
Single set of patient records for stroke management 71%
Trust has an interdisciplinary care pathway for stroke 66% Table 25 Progress with provision of care pathways for stroke in hospitals between 2002 and 2006
2002 2004 2006 Trust has an interdisciplinary care pathway for stroke 40% 53% 66%

--------------------------------------------------------------------------------------------------- Section 1 Chapter 3 Organisation of stroke care by domains
39
Domain 8 Team Working – Team meetings
Description of the domain This domain reviews the frequency of team meetings for the interchange of information about individual patients and the range of disciplines involved. Weekly team meetings have been identified as one of the significant factors in a co-ordinated stroke service leading to improved clinical outcomes. (SUTC) 100% of stroke units now have multidisciplinary meetings weekly with the vast majority having nurses, physiotherapists, occupational therapists and doctors attending. There remains a problem with insufficient involvement of speech therapy, social work, and dietetics. Clinical psychology provision remains grossly inadequate. Table 26 Changes in provision of team meetings on stroke units and their composition between 2002 and 2006
Stroke Unit 2002 2004 2006
Team meetings once weekly 82% 96% 100% Clinical Psychology 13% 17% 18% Dietetics 37% 47% 61% Medicine (Senior Doctor) 81% 93% 98% Nursing 84% 96% 100% Occupational Therapy 82% 95% 99% Physiotherapy 83% 96% 100% Social Work 59% 69% 77% Speech & Language Therapy 63% 74% 82% Other 33% 41% 58%
0
20
40
60
80
100
Clinica
l psy
cholo
gy
Dietetics
Medici
ne (s
enior
docto
r)
Nursing
Occup
ationa
l thera
py
Physio
thera
py
Social w
ork
Speec
h & la
nguag
e the
rapy
Other
% o
f site
s 200220042006
Figure 4 changes in composition of team meetings on stroke units between 2002 and 2006

--------------------------------------------------------------------------------------------------- Section 1 Chapter 3 Organisation of stroke care by domains
40
Domain 9 Agreed Assessment Measures
Description of domain Measures agreed and used by the whole team can facilitate a shared understanding of the severity of the illness/disability and the patient’s progress during rehabilitation. Using standardised measurement of impairments and disability after stroke helps maintain common standards and consistency of treatment.
There have been marked improvements in the use of standardised measures of impairment and disability over the last four years
Table 27 implementation of assessment protocols between 2002 to 2006 Locally agreed assessment protocol for stroke indicating the appropriate use of agreed measures for:
2002 2004 2006
Conscious level 83 % 89 % 96% Motor impairment 59 % 77 % 90% Cognitive Function 85 % 90 % 93%
Activities of Daily Living 82 % 85 % 95% Information was collected for the first time in 2006 protocols for the appropriate use of agreed measures for acute stroke impairment and mood and are found in 35% and 66% of hospitals respectively.
0
20
40
60
80
100
Conscio
us le
vel
Motor im
pairm
ent
Cognitiv
e fun
ction
Activit
ies of
Dail
y Livin
g
% o
f site
s 200220042006
Figure 5 Implementation of stroke protocols between 2002 and 2006

--------------------------------------------------------------------------------------------------- Section 1 Chapter 3 Organisation of stroke care by domains
41
Domain 10 Communication with patients and carers
Description of the domain This comprehensive domain covers the organisational arrangements for patients to access information and for the organisation to communicate with user groups. The display of patient information including literature, patient versions of guidelines and local agencies helps to promote patients’/carers’ understanding and enables shared decision making when treatment options are involved. Educating and informing patients and carers should be seen as a key role of health professionals managing patients with stroke. Over two-thirds of units now have a community user group which is a major shift since the last audit Improvements have been made in all areas of information provision for stroke patients. An increasing number of hospitals do now have formal links with user groups. Table 28 Development of patient information structures between 2002 and 2006
2002 2004 2006 Does stroke service have formal links with patients and carers organisations for communication on service provision, audit and future plans:
61% 69% 74%
Is there a community user group for stroke: 58% 59% 68%
% of hospitals with the characteristic on their Stroke Unit 2002 2004 2006
Patient access to management plan 62% 66% 73%
Patient information literature displayed in unit on: Condition specific literature on stroke 85% 98% 99% Patient versions of national or local guidelines/ standards 43% 52% 59% Social Services local Community Care arrangements 58% 71% 82% The Benefits Agency 56% 72% 76% Local Voluntary Agencies 70% 76% 94% How to complain 78% 92% 99%

--------------------------------------------------------------------------------------------------- Section 1 Chapter 3 Organisation of stroke care by domains
42
SCANNING SERVICES Various questions were asked about the availability of imaging services both in weekdays and at weekends. Inpatient services are summarised below Nearly all hospitals now have the facilities to scan brain and carotids, however access remains difficult for some, particularly out of normal working hours. This is an issue that will need to be resolved if first class stroke services are to be delivered in UK hospitals Table 29 Access to CT, MRI and Carotid Dopper imaging
Computerised Tomography
Magnetic Resonance Image
Carotid Doppler
% YES 100% 97% 97%
Weekdays
0-4 hours 5-24 hours 25-48 hours More than 48 hours
8% 58% 27% 7%
<1% 15% 33%
52%
4% 11% 25%
60%
Weekends
0-4 hours 5-24 hours 25-48 hours More than 48 hours
8% 18% 40% 35%
2% 3% 9%
85%
1%
0.4% 6%
90%

--------------------------------------------------------------------------------------------------- Section 1 Chapter 4 Regional summary of key organisational results by named hospital
43
Chapter 4 National Organisational Audit Results by Region - Summary of key organisational results by hospital in SHA/Country NB STATUS AS AT 1ST APRIL 2006 For interpretation see questionnaire and definitions Table 30 summary of key organisational results by hospital for stroke unit provision and quality and other models of care
SITE Acu
te S
troke
U
nit
Num
ber o
f A
cute
Stro
ke
Uni
t bed
s
Reh
abili
tatio
n S
troke
Uni
t
Com
bine
d S
troke
Uni
t
Num
ber o
f ke
y S
troke
U
nit f
eatu
res
Mob
ile s
troke
te
am
Spe
cial
ist
Com
mun
ity
Stro
ke T
eam
Ear
ly
Supp
orte
d D
isch
arge
Te
am
EAST MIDLANDS STRATEGIC HEALTH AUTHORITY Chesterfield Royal Hospital NHS Foundation Trust Yes 3 No None 4 Yes No No Derby Hospitals NHS Foundation Trust Yes 4 Yes None 4 Yes No No
Kettering General Hospital NHS Trust None None No None No Stroke
Unit No No No Northampton General Hospital NHS Trust Yes 3 Yes None 5 No No No Nottingham University Hospital NHS Trust Yes 6 Yes None 5 Yes Yes No Sherwood Forest Hospitals NHS Trust Yes 5 Yes None 4 No No No United Lincolnshire Hospitals NHS Trust (Grantham and District Hospital) None None No Yes 5 Yes No No United Lincolnshire Hospitals NHS Trust (Lincoln County) None None No Yes 5 No No No United Lincolnshire Hospitals NHS Trust (Louth County Hospital) None None Yes None 5 No No No United Lincolnshire Hospitals NHS Trust (Pilgrim Hospital) None None No Yes 3 No No No University Hospitals of Leicester NHS Trust None None No Yes 4 No No No EAST OF ENGLAND STRATEGIC HEALTH AUTHORITY Basildon & Thurrock University Hospitals NHS Foundation Trust None None Yes None 5 No No No

--------------------------------------------------------------------------------------------------- Section 1 Chapter 4 Regional summary of key organisational results by named hospital
44
SITE Acu
te S
troke
U
nit
Num
ber o
f A
cute
Stro
ke
Uni
t bed
s
Reh
abili
tatio
n S
troke
Uni
t
Com
bine
d S
troke
Uni
t
Num
ber o
f ke
y S
troke
U
nit f
eatu
res
Mob
ile s
troke
te
am
Spe
cial
ist
Com
mun
ity
Stro
ke T
eam
Ear
ly
Supp
orte
d D
isch
arge
Te
am
Bedford Hospital NHS Trust None None Yes None 5 No Yes No Cambridge University Hospitals NHS Foundation Trust Yes 5 Yes None 5 Yes No Yes East & North Hertfordshire NHS Trust (Lister Hospital) None None Yes None 4 No No No East and North Hertfordshire NHS Trust (Queen Elizabeth II Hospital) None None Yes None 3 No No No Essex Rivers Healthcare NHS Trust None None Yes Yes 5 Yes Yes No Hinchingbrooke Health Care NHS Trust None None No Yes 3 No No No Ipswich Hospital NHS Trust None None No Yes 5 Yes No No James Paget Healthcare NHS Trust Yes 2 Yes None 5 No Yes No Luton and Dunstable Hospital NHS Trust None None No Yes 5 No No Yes Mid Essex Hospital Services NHS Trust None None No Yes 5 No No No Norfolk & Norwich University Hospital NHS Trust Yes 3 No None 4 No No No Peterborough and Stamford Hospitals NHS Foundation Trust Yes 4 Yes None 5 Yes No Yes Princess Alexandra Hospital NHS Trust Yes 3 Yes Yes 5 No No No Southend Hospital NHS Trust None None Yes None 5 Yes No No The Queen Elizabeth Hospital King's Lynn NHS Trust None None No Yes 5 No No No West Hertfordshire Hospitals NHS Trust (Hemel Hempstead Hospital) None None No Yes 5 No No Yes West Hertfordshire Hospitals NHS Trust (Watford General Hospital) Yes 6 Yes None 4 Yes Yes No West Suffolk Hospitals NHS Trust Yes 4 Yes None 5 No No No LONDON STRATEGIC HEALTH AUTHORITY Barking Havering and Redbridge Hospitals NHS Trust (King George) Yes 5 Yes None 5 No No No
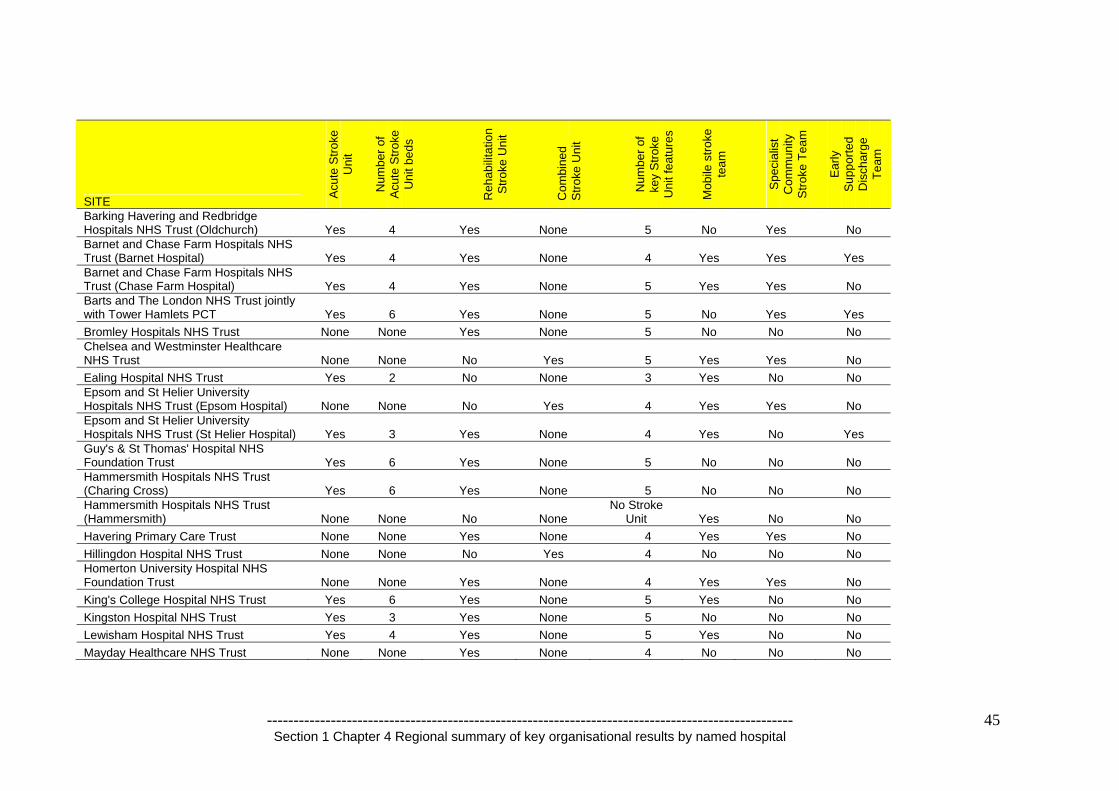
--------------------------------------------------------------------------------------------------- Section 1 Chapter 4 Regional summary of key organisational results by named hospital
45
SITE Acu
te S
troke
U
nit
Num
ber o
f A
cute
Stro
ke
Uni
t bed
s
Reh
abili
tatio
n S
troke
Uni
t
Com
bine
d S
troke
Uni
t
Num
ber o
f ke
y S
troke
U
nit f
eatu
res
Mob
ile s
troke
te
am
Spe
cial
ist
Com
mun
ity
Stro
ke T
eam
Ear
ly
Supp
orte
d D
isch
arge
Te
am
Barking Havering and Redbridge Hospitals NHS Trust (Oldchurch) Yes 4 Yes None 5 No Yes No Barnet and Chase Farm Hospitals NHS Trust (Barnet Hospital) Yes 4 Yes None 4 Yes Yes Yes Barnet and Chase Farm Hospitals NHS Trust (Chase Farm Hospital) Yes 4 Yes None 5 Yes Yes No Barts and The London NHS Trust jointly with Tower Hamlets PCT Yes 6 Yes None 5 No Yes Yes Bromley Hospitals NHS Trust None None Yes None 5 No No No Chelsea and Westminster Healthcare NHS Trust None None No Yes 5 Yes Yes No Ealing Hospital NHS Trust Yes 2 No None 3 Yes No No Epsom and St Helier University Hospitals NHS Trust (Epsom Hospital) None None No Yes 4 Yes Yes No Epsom and St Helier University Hospitals NHS Trust (St Helier Hospital) Yes 3 Yes None 4 Yes No Yes Guy's & St Thomas' Hospital NHS Foundation Trust Yes 6 Yes None 5 No No No Hammersmith Hospitals NHS Trust (Charing Cross) Yes 6 Yes None 5 No No No Hammersmith Hospitals NHS Trust (Hammersmith) None None No None
No Stroke Unit Yes No No
Havering Primary Care Trust None None Yes None 4 Yes Yes No Hillingdon Hospital NHS Trust None None No Yes 4 No No No Homerton University Hospital NHS Foundation Trust None None Yes None 4 Yes Yes No King's College Hospital NHS Trust Yes 6 Yes None 5 Yes No No Kingston Hospital NHS Trust Yes 3 Yes None 5 No No No Lewisham Hospital NHS Trust Yes 4 Yes None 5 Yes No No Mayday Healthcare NHS Trust None None Yes None 4 No No No

--------------------------------------------------------------------------------------------------- Section 1 Chapter 4 Regional summary of key organisational results by named hospital
46
SITE Acu
te S
troke
U
nit
Num
ber o
f A
cute
Stro
ke
Uni
t bed
s
Reh
abili
tatio
n S
troke
Uni
t
Com
bine
d S
troke
Uni
t
Num
ber o
f ke
y S
troke
U
nit f
eatu
res
Mob
ile s
troke
te
am
Spe
cial
ist
Com
mun
ity
Stro
ke T
eam
Ear
ly
Supp
orte
d D
isch
arge
Te
am
Newham University Hospital NHS Trust Yes 4 Yes None 5 Yes Yes No North Middlesex University Hospital NHS Trust - Jointly with Haringey PCT None None Yes Yes 4 Yes No No North West London Hospitals NHS Trust (Central Middlesex Hospital including Willesden Community hospital (Brent PCT)) Yes 4 No None 5 Yes Yes Yes North West London Hospitals NHS Trust (Northwick Park Hospital) None None No Yes 4 Yes No No Queen Elizabeth Hospital NHS Trust None None No Yes 5 No No No Queen Mary's Sidcup NHS Trust None None Yes None 5 No No No Royal Free Hampstead NHS Trust None None No Yes 4 Yes No No St George's Healthcare NHS Trust Yes 5 Yes None 5 No No No St Mary's NHS Trust None None No Yes 5 No Yes No University College London Hospitals NHS Foundation Trust None None No Yes 5 Yes Yes No West Middlesex University Hospital NHS Trust None None No Yes 4 Yes No No Whipps Cross University Hospital NHS Trust Yes 5 Yes None 4 No No No Whittington Hospital NHS Trust Yes 5 Yes None 4 No Yes No NORTH EAST STRATEGIC HEALTH AUTHORITY City Hospitals Sunderland NHS Foundation Trust Yes 6 Yes None 5 Yes No No County Durham and Darlington Acute Hospitals NHS Trust (Bishop Auckland) None None No Yes 4 No Yes No County Durham and Darlington Acute Hospitals NHS Trust (Darlington Memorial) None None Yes None 3 No Yes Yes County Durham and Darlington Acute None None No Yes 4 No No No

--------------------------------------------------------------------------------------------------- Section 1 Chapter 4 Regional summary of key organisational results by named hospital
47
SITE Acu
te S
troke
U
nit
Num
ber o
f A
cute
Stro
ke
Uni
t bed
s
Reh
abili
tatio
n S
troke
Uni
t
Com
bine
d S
troke
Uni
t
Num
ber o
f ke
y S
troke
U
nit f
eatu
res
Mob
ile s
troke
te
am
Spe
cial
ist
Com
mun
ity
Stro
ke T
eam
Ear
ly
Supp
orte
d D
isch
arge
Te
am
Hospitals NHS Trust (University Hospital North Durham) Gateshead Health NHS Foundation Trust Yes 6 Yes None 5 No No Yes Newcastle upon Tyne Hospitals NHS Trust Yes 6 Yes None 5 No Yes Yes North Tees and Hartlepool NHS Trust (North Tees Hospital) None None Yes None 3 Yes Yes Yes North Tees and Hartlepool NHS Trust (University Hospital of Hartlepool) None None Yes None 4 No No Yes Northumbria Healthcare NHS Trust (Hexham General Hospital) None None No Yes 5 No Yes No Northumbria Healthcare NHS Trust (North Tyneside District General Hospital) Yes 5 Yes None 5 No Yes Yes Northumbria Healthcare NHS Trust (Wansbeck General Hospital) Yes 5 Yes None 5 No Yes No South Tees Hospitals NHS Trust (The James Cook University Hospital) None None No Yes 5 No Yes Yes South Tees Hospitals Trust in collaboration with Hambleton and Richmond PCT Yes 5 No None 4 No No No South Tyneside NHS Foundation Trust Yes 6 Yes None 5 No Yes No NORTH WEST STRATEGIC HEALTH AUTHORITY Aintree Hospitals NHS Trust Yes 6 Yes None 5 No No No Blackpool, Fylde & Wyre Hospitals NHS Trust Yes 5 Yes None 4 No No No Bolton Hospitals NHS Trust None None Yes None 5 No No No Central Manchester and Manchester Children's University Hospital NHS Trust Yes 5 Yes None 5 Yes Yes Yes Countess of Chester Hospital NHS Yes 3 Yes None 5 Yes Yes No

--------------------------------------------------------------------------------------------------- Section 1 Chapter 4 Regional summary of key organisational results by named hospital
48
SITE Acu
te S
troke
U
nit
Num
ber o
f A
cute
Stro
ke
Uni
t bed
s
Reh
abili
tatio
n S
troke
Uni
t
Com
bine
d S
troke
Uni
t
Num
ber o
f ke
y S
troke
U
nit f
eatu
res
Mob
ile s
troke
te
am
Spe
cial
ist
Com
mun
ity
Stro
ke T
eam
Ear
ly
Supp
orte
d D
isch
arge
Te
am
Foundation Trust
East Cheshire NHS Trust Yes 4 Yes None 5 Yes No No East Lancashire Hospitals NHS Trust (Blackburn Hyndburn & Ribble Valley) Yes 3 Yes None 4 No No No East Lancashire Hospitals NHS Trust (Burnley Health Care NHS Trust) None None No Yes 5 No No Yes Lancashire Teaching Hospitals NHS Foundation Trust Yes 2 Yes None 5 Yes No No Lancashire Teaching Hospitals NHS Foundation Trust (Chorley and South Ribble) None None Yes None 5 No No No Mid Cheshire Hospitals NHS Trust Yes 6 Yes None 5 No No No Morecambe Bay Hospitals NHS Trust (Furness General Hospital) Yes 2 Yes None 4 No No No Morecambe Bay Hospitals NHS Trust (Royal Lancaster Infirmary) None None Yes None 4 No No No Morecambe Bay Hospitals NHS Trust (Westmorland General Hospital) Yes 4 No None 5 No No No North Cheshire Hospitals NHS Trust (Halton General Hospital) None None No Yes 5 No No No North Cheshire Hospitals NHS Trust (Warrington Hospital) Yes 6 Yes None 5 Yes Yes No North Cumbria Acute Hospitals NHS Trust (Cumberland Infirmary) None None Yes Yes 5 No No No North Cumbria Acute Hospitals NHS Trust (West Cumberland Hospital) Yes 6 Yes None 5 No No No Pennine Acute Hospitals NHS Trust (Fairfield General Hospital) Yes 4 Yes None 5 Yes No No Pennine Acute Hospitals NHS Trust (North Manchester General) Yes 4 Yes None 5 Yes Yes No Pennine Acute Hospitals NHS Trust (Rochdale Infirmary) Yes 3 Yes None 5 Yes Yes Yes

--------------------------------------------------------------------------------------------------- Section 1 Chapter 4 Regional summary of key organisational results by named hospital
49
SITE Acu
te S
troke
U
nit
Num
ber o
f A
cute
Stro
ke
Uni
t bed
s
Reh
abili
tatio
n S
troke
Uni
t
Com
bine
d S
troke
Uni
t
Num
ber o
f ke
y S
troke
U
nit f
eatu
res
Mob
ile s
troke
te
am
Spe
cial
ist
Com
mun
ity
Stro
ke T
eam
Ear
ly
Supp
orte
d D
isch
arge
Te
am
Pennine Acute Hospitals NHS Trust (Royal Oldham Hospital) Yes 6 Yes None 5 No Yes No Royal Liverpool & Broadgreen University Hospitals NHS Trust Yes 5 Yes None 5 Yes No Yes Salford Royal Hospitals NHS Trust Yes 6 Yes None 5 No Yes No South Manchester University Hospitals NHS Trust Yes 4 Yes None 5 No No No Southport and Ormskirk Hospital NHS Trust Yes 6 Yes None 5 Yes Yes No St Helens & Knowsley Hospitals NHS Trust Yes 4 Yes None 4 No No No Stockport NHS Foundation Trust Yes 3 Yes None 5 Yes No Yes Tameside and Glossop Acute Services None None Yes None 5 No No No
Trafford Healthcare NHS Trust None None No None No Stroke
Unit Yes Yes Yes Wirral Hospital NHS Trust Yes 6 Yes None 5 Yes No No Wrightington, Wigan and Leigh NHS Trust Yes 2 Yes None 4 Yes No No SOUTH CENTRAL STRATEGIC HEALTH AUTHORITY Buckinghamshire Hospitals NHS Trust (Amersham & Wycombe Hospitals) None None No Yes 4 No No No Buckinghamshire Hospitals NHS Trust (Stoke Mandeville Hospital) None None No Yes 5 Yes Yes No East Hampshire Primary Care Trust jointly with Portsmouth Hospitals NHS Trust Yes 4 Yes None 5 Yes No Yes Heatherwood & Wexham Park Hospitals None None No Yes 5 No No No Isle of Wight Healthcare NHS Trust Yes 2 Yes None 5 No No No Milford Stroke Unit (New Forest PCT) None None Yes None 5 No No No Milton Keynes General NHS Trust None None Yes None 4 No No Yes

--------------------------------------------------------------------------------------------------- Section 1 Chapter 4 Regional summary of key organisational results by named hospital
50
SITE Acu
te S
troke
U
nit
Num
ber o
f A
cute
Stro
ke
Uni
t bed
s
Reh
abili
tatio
n S
troke
Uni
t
Com
bine
d S
troke
Uni
t
Num
ber o
f ke
y S
troke
U
nit f
eatu
res
Mob
ile s
troke
te
am
Spe
cial
ist
Com
mun
ity
Stro
ke T
eam
Ear
ly
Supp
orte
d D
isch
arge
Te
am
North Hampshire Hospitals NHS Trust Yes 4 Yes None 5 No No No Oxford Radcliffe Hospitals NHS Trust Yes 6 Yes None 5 No No No Royal Berkshire & Battle Hospitals NHS Trust Yes 4 Yes None 5 No No No Southampton University Hospitals NHS Trust (Southampton General Hospital) Yes 2 No None 4 No No No Tannersbrook Stroke Unit (Southampton City PCT) None None Yes None 5 No No No Winchester and Eastleigh Healthcare NHS Trust None None No Yes 5 Yes No No SOUTH EAST COAST STRATEGIC HEALTH AUTHORITY Ashford and St Peter's Hospital NHS Trust Yes 3 Yes None 4 No Yes No Brighton & Sussex University Hospitals NHS Trust (Brighton) None None No Yes 4 No Yes No Brighton & Sussex University Hospitals NHS Trust (Mid-Sussex) None None No Yes 5 No No No Dartford & Gravesham NHS Trust None None No Yes 5 Yes Yes No Dartford, Gravesham & Swanley Primary Care Trust None None No None
No Stroke Unit No Yes No
East Kent Hospitals NHS Trust (Ashford, William Harvey Hospital) None None No Yes 5 No Yes Yes East Kent Hospitals NHS Trust (Kent & Canterbury Hospital) Yes 6 Yes None 4 No No No East Kent Hospitals NHS Trust (Queen Elizabeth Queen Mother (Margate) Hospital) None None No Yes 4 Yes No No East Sussex Hospitals NHS Trust (Conquest Hospital) None None No Yes 5 Yes Yes No East Sussex Hospitals NHS Trust (Eastbourne Hospital) Yes 5 Yes None 5 No Yes No

--------------------------------------------------------------------------------------------------- Section 1 Chapter 4 Regional summary of key organisational results by named hospital
51
SITE Acu
te S
troke
U
nit
Num
ber o
f A
cute
Stro
ke
Uni
t bed
s
Reh
abili
tatio
n S
troke
Uni
t
Com
bine
d S
troke
Uni
t
Num
ber o
f ke
y S
troke
U
nit f
eatu
res
Mob
ile s
troke
te
am
Spe
cial
ist
Com
mun
ity
Stro
ke T
eam
Ear
ly
Supp
orte
d D
isch
arge
Te
am
Frimley Park Hospitals NHS Foundation Trust None None No Yes 4 No No No Maidstone and Tunbridge Wells NHS Trust (Kent and Sussex) None None Yes None 3 No Yes Yes Maidstone and Tunbridge Wells NHS Trust (Maidstone Hospital) None None No None
No Stroke Unit No No No
Medway Maritime Hospital, Medway PCT & Swale PCT Yes 5 Yes None 5 Yes Yes Yes Royal Surrey County Hospital NHS Trust None None No Yes 4 Yes No Yes Royal West Sussex Trust Yes 6 Yes None 5 No No No Surrey & Sussex Healthcare NHS Trust Yes 4 Yes None 3 Yes Yes Yes Worthing & Southlands Hospitals NHS Trust Yes 4 Yes None 5 No Yes No SOUTH WEST STRATEGIC HEALTH AUTHORITY Bath & North East Somerset Primary Care Trust None None No None
No Stroke Unit Yes No No
East Devon Primary Care Trust None None Yes None 5 No No No Exeter Primary Care Trust None None Yes None 4 No No No Gloucestershire Hospitals NHS Foundation Trust (Cheltenham General Hospital) Yes 4 Yes None 5 No Yes No Gloucestershire Hospitals NHS Foundation Trust (Gloucestershire Royal Hospital) None None No Yes 5 No Yes No Kennet, North and West Wiltshire PCT Stroke Unit None None Yes None 5 No No Yes Mendip PCT (Shepton Mallet Hospital) None None Yes None 5 No Yes Yes Mid Devon Primary Care Trust None None Yes None 5 No No No North Bristol NHS Trust Yes 6 Yes None 5 Yes Yes No Northern Devon Healthcare NHS Trust None None No Yes 5 No Yes No

--------------------------------------------------------------------------------------------------- Section 1 Chapter 4 Regional summary of key organisational results by named hospital
52
SITE Acu
te S
troke
U
nit
Num
ber o
f A
cute
Stro
ke
Uni
t bed
s
Reh
abili
tatio
n S
troke
Uni
t
Com
bine
d S
troke
Uni
t
Num
ber o
f ke
y S
troke
U
nit f
eatu
res
Mob
ile s
troke
te
am
Spe
cial
ist
Com
mun
ity
Stro
ke T
eam
Ear
ly
Supp
orte
d D
isch
arge
Te
am
Plymouth Hospitals NHS Trust Yes 5 No None 4 No No No Plymouth Primary Care Trust None None Yes None 5 No No No Poole Hospital NHS Trust Yes 4 Yes None 5 No No No Royal Bournemouth & Christchurch Hospitals NHS Foundation Trust Yes 3 Yes None 4 Yes Yes No Royal Cornwall Hospitals Trust Yes 4 Yes None 4 No No Yes Royal Devon & Exeter NHS Foundation Trust Yes 6 Yes None 5 No Yes No Royal United Hospital Bath NHS Trust Yes 4 No None 5 Yes No No Salisbury Health Care NHS Trust None None Yes None 5 No Yes No South Devon (including South Devon Healthcare NHS Trust and Teignbridge, Torbay and South Hams and West Devon PCTs) Yes 3 Yes None 5 Yes Yes No Swindon & Marlborough NHS Trust (in collaboration with Swindon PCT) None None Yes None 4 No No Yes Taunton & Somerset NHS Trust None None No Yes 4 No No No United Bristol Healthcare NHS Trust Yes 3 Yes None 5 No No No West Dorset General Hospitals NHS Trust Yes 5 Yes None 5 Yes No No Weston Area Health Trust Yes 3 Yes None 3 No No No Yeovil District Hospital NHS Foundation Trust None None No Yes 4 No Yes No WEST MIDLANDS STRATEGIC HEALTH AUTHORITY
Burton Hospitals NHS Trust None None No None No Stroke
Unit Yes No No Dudley Group of Hospitals NHS Trust Yes 3 Yes None 5 No Yes No George Eliot Hospital NHS Trust None None No Yes 5 No No No Good Hope Hospital NHS Trust Yes 3 Yes None 5 No Yes No

--------------------------------------------------------------------------------------------------- Section 1 Chapter 4 Regional summary of key organisational results by named hospital
53
SITE Acu
te S
troke
U
nit
Num
ber o
f A
cute
Stro
ke
Uni
t bed
s
Reh
abili
tatio
n S
troke
Uni
t
Com
bine
d S
troke
Uni
t
Num
ber o
f ke
y S
troke
U
nit f
eatu
res
Mob
ile s
troke
te
am
Spe
cial
ist
Com
mun
ity
Stro
ke T
eam
Ear
ly
Supp
orte
d D
isch
arge
Te
am
Heart of England NHS Foundation Trust Yes 6 Yes Yes 5 Yes No Yes Hereford Hospitals NHS Trust Yes 4 No None 5 No No No Mid Staffordshire General Hospitals NHS Trust Yes 3 Yes None 5 Yes No No Royal Wolverhampton Hospitals NHS Trust jointly with Wolverhampton Health Care NHS Trust Yes 5 Yes None 5 No No No Sandwell and West Birmingham Hospitals NHS Trust (City Hospital) Yes 4 Yes None 4 No Yes No Sandwell and West Birmingham Hospitals NHS Trust (Sandwell District Hospital) Yes 3 Yes None 4 No Yes No Shrewsbury & Telford Hospital NHS Trust Yes 2 Yes Yes 5 No No No South Birmingham Primary Care Trust None None Yes None 5 No No No South Warwickshire General Hospitals NHS Trust Yes 4 Yes None 5 No Yes Yes South Worcestershire Primary Care Trust None None Yes None 5 No No No University Hospital Birmingham NHS Foundation Trust Yes 5 No None 5 No No No University Hospital of North Staffordshire NHS Trust & North Staffordshire Combined Healthcare NHS Trust Combined None None Yes Yes 5 No No No University Hospitals Coventry and Warwickshire (St Cross Hospital Rugby) Yes 3 No None 5 No No No University Hospitals Coventry and Warwickshire (Walsgrave Hospital) Yes 4 No None 5 Yes No No Walsall Hospitals NHS Trust Yes 5 Yes None 5 No Yes Yes Worcestershire Acute Hospitals NHS Yes 4 Yes None 5 No No No

--------------------------------------------------------------------------------------------------- Section 1 Chapter 4 Regional summary of key organisational results by named hospital
54
SITE Acu
te S
troke
U
nit
Num
ber o
f A
cute
Stro
ke
Uni
t bed
s
Reh
abili
tatio
n S
troke
Uni
t
Com
bine
d S
troke
Uni
t
Num
ber o
f ke
y S
troke
U
nit f
eatu
res
Mob
ile s
troke
te
am
Spe
cial
ist
Com
mun
ity
Stro
ke T
eam
Ear
ly
Supp
orte
d D
isch
arge
Te
am
Trust (Alexandra Hospital Redditch) Worcestershire Acute Hospitals NHS Trust (Worcester Royal Hospital) Yes 5 Yes None 5 No No
No
YORKSHIRE AND THE HUMBER STRATEGIC HEALTH AUTHORITY Airedale NHS Trust None None No Yes 5 No No No Barnsley Hospital NHS Foundation Trust Yes 3 Yes None 5 No No Yes Bradford Teaching Hospitals NHS Foundation Trust Yes 3 Yes None 5 No No Yes Calderdale & Huddersfield NHS Trust Yes 4 Yes None 5 Yes No No Doncaster & Bassetlaw Hospitals NHS Foundation Trust (Bassetlaw Hospital) None None No Yes 5 Yes Yes Yes Doncaster & Bassetlaw Hospitals NHS Foundation Trust (Doncaster Royal Infirmary & Montagu Hospital) Yes 2 Yes None 4 No Yes No Hambleton and Richmondshire PCT (Rutson Rehabilitation Unit) None None Yes None 5 No No Yes Harrogate and District NHS Foundation Trust None None Yes None 4 No No No Hull and East Yorkshire Hospitals NHS Trust Yes 6 Yes None 5 No Yes No Mid Yorkshire Hospitals NHS Trust Yes 1 Yes None 5 No No No Northern Lincolnshire and Goole Hospitals NHS Trust (Diana Princess of Wales Grimsby) Yes 4 Yes None 5 No No No Northern Lincolnshire and Goole Hospitals NHS Trust (Scunthorpe General) Yes 3 Yes None 4 No No No Scarborough and North East Yorks Health Care NHS Trust None None No Yes 5 No No No Sheffield Teaching Hospitals NHS Foundation Trust Yes 2 Yes None 5 No No Yes

--------------------------------------------------------------------------------------------------- Section 1 Chapter 4 Regional summary of key organisational results by named hospital
55
SITE Acu
te S
troke
U
nit
Num
ber o
f A
cute
Stro
ke
Uni
t bed
s
Reh
abili
tatio
n S
troke
Uni
t
Com
bine
d S
troke
Uni
t
Num
ber o
f ke
y S
troke
U
nit f
eatu
res
Mob
ile s
troke
te
am
Spe
cial
ist
Com
mun
ity
Stro
ke T
eam
Ear
ly
Supp
orte
d D
isch
arge
Te
am
The Leeds Teaching Hospitals NHS Trust Yes 5 Yes None 5 No No Yes The Rotherham NHS Foundation Trust None None No Yes 5 No No Yes York Health Services NHS Trust Yes 6 Yes None 4 No Yes No NORTHERN IRELAND Belfast City Hospital Health & Social Services Trust None None No Yes 4 No No Yes Down Lisburn Health and Social Services Trust None None No Yes 5 No Yes No Mater Hospital Belfast Health & Social Services Trust None None No Yes 5 No Yes Yes Royal Group of Hospitals and Dental Health & Social Services Trust Yes 4 Yes None 3 No Yes No Ulster Community & Hospitals Trust None None No Yes 5 No Yes Yes Causeway Health & Social Services Trust None None No None
No Stroke Unit No No No
United Hospitals Health & Social Services Trust Yes 3 Yes None 2 No No No Craigavon Area Hospital Group Trust Yes 6 Yes None 5 No No Yes Newry & Mourne Health & Social Services Trust None None No Yes 4 No Yes Yes Altnagelvin Hospitals Health & Social Services Trust None None No Yes 4 No No No Sperrin Lakeland Health and Social Care NHS Trust (Erne Hospital) None None No Yes 5 No No No Sperrin Lakeland Health and Social Care NHS Trust (Tyrone County Hospital) None None Yes None 5 No No No WALES Bro Morgannwg NHS Trust (Neath Port Talbot Hospital) None None No None
No Stroke Unit No No No

--------------------------------------------------------------------------------------------------- Section 1 Chapter 4 Regional summary of key organisational results by named hospital
56
SITE Acu
te S
troke
U
nit
Num
ber o
f A
cute
Stro
ke
Uni
t bed
s
Reh
abili
tatio
n S
troke
Uni
t
Com
bine
d S
troke
Uni
t
Num
ber o
f ke
y S
troke
U
nit f
eatu
res
Mob
ile s
troke
te
am
Spe
cial
ist
Com
mun
ity
Stro
ke T
eam
Ear
ly
Supp
orte
d D
isch
arge
Te
am
Bro Morgannwg NHS Trust (Princess of Wales Hospital ) None None No None
No Stroke Unit No No No
Carmarthenshire NHS Trust (Prince Philip Hospital) None None No None
No Stroke Unit No No No
Carmarthenshire NHS Trust (West Wales General) None None No None
No Stroke Unit No No No
Ceredigion & Mid-Wales NHS Trust None None No Yes 4 No No No Pembrokeshire & Derwen NHS Trust Yes 3 Yes None 5 No No No
Powys Local Health Board None None No None No Stroke
Unit No No No
Swansea NHS Trust (Morriston Hospital) None None No None No Stroke
Unit Yes No No
Swansea NHS Trust (Singleton Hospital) None None No None No Stroke
Unit No No Yes Conwy & Denbighshire NHS Trust Yes 3 Yes None 4 Yes No No North East Wales NHS Trust None None Yes None 4 No No No North West Wales NHS Trust (Bangor Hospital) None None No None
No Stroke Unit Yes No Yes
North West Wales NHS Trust (Llandudno Hospital) None None No None
No Stroke Unit No No No
Cardiff and Vale NHS Trust (Llandough Hospital) None None No Yes 4 No No No Cardiff and Vale NHS Trust (University Hospital Wales) None None Yes None 5 No No No Gwent Healthcare NHS Trust (Caerphilly District Miner's Hospital) None None No None
No Stroke Unit No No No
Gwent Healthcare NHS Trust (Nevill Hall Hospital) None None No Yes 5 Yes No No Gwent Healthcare NHS Trust (St Woolos Hospital (Royal Gwent)) Yes 1 No None 5 Yes No No

--------------------------------------------------------------------------------------------------- Section 1 Chapter 4 Regional summary of key organisational results by named hospital
57
SITE Acu
te S
troke
U
nit
Num
ber o
f A
cute
Stro
ke
Uni
t bed
s
Reh
abili
tatio
n S
troke
Uni
t
Com
bine
d S
troke
Uni
t
Num
ber o
f ke
y S
troke
U
nit f
eatu
res
Mob
ile s
troke
te
am
Spe
cial
ist
Com
mun
ity
Stro
ke T
eam
Ear
ly
Supp
orte
d D
isch
arge
Te
am
North Glamorgan NHS Trust None None No None No Stroke
Unit No No Yes Pontypridd & Rhondda NHS Trust None None Yes None 5 No Yes Yes THE ISLANDS Isle of Man Department of Health and Social Security None None Yes None 4 No No No States of Guernsey Health & Social Services None None No None
No Stroke Unit No No No
States of Jersey Health & Social Services None None No None
No Stroke Unit No Yes Yes

--------------------------------------------------------------------------------------------------- Section 1 Chapter 4 Regional summary of key organisational results by named hospital
58
Summary of key organisational results by hospital in SHA/Country This table includes average estimated waiting times for scan, whether the trust has a neurovascular/TIA clinic and involvement with patients. The total organisational score is an aggregated score across all domains. The best organised 25% of hospitals are in the upper quartile designated by the symbol , the least well organised hospitals for stroke care are in the lower quartile designated with the symbol , the
middle half lie between the two designated by the diamond . Table 31 Summary of key organisational results by hospital including waiting times for scan, presence of neurovascular/TIA clinic and involvement with patients.
SITE CT
scan
ave
rage
w
aitin
g tim
e w
eekd
ays
CT
scan
av
erag
e w
aitin
g tim
e w
eeke
nds
MR
I sca
n av
erag
e w
aitin
g tim
e w
eekd
ays
MR
I sca
n
aver
age
wai
ting
time
wee
kend
s
Neu
rova
scul
ar/
TIA
Clin
ic
TIA
pat
ient
s se
en a
nd
inve
stig
ated
w
ithin
7 d
ays
Pat
ient
/car
er
view
s so
ught
on
serv
ice
Rep
ort b
een
prod
uced
with
in
12m
ana
lysi
ng
patie
nt v
iew
s
OV
ER
ALL
P
OS
ITIO
N
EAST MIDLANDS STRATEGIC HEALTH AUTHORITY
Chesterfield Royal Hospital NHS Foundation Trust 5-24 hrs 5-24 hrs 5-24 hrs 0-4 hrs Yes No Yes No
lower
qua rtile
Derby Hospitals NHS Foundation Trust 5-24 hrs 5-24 hrs 25-48 hrs > 48 hrs Yes No Yes Yes Kettering General Hospital NHS Trust 25-48 hrs > 48 hrs 25-48 hrs > 48 hrs Yes No Yes Yes Northampton General Hospital NHS Trust 5-24 hrs 25-48 hrs > 48 hrs > 48 hrs Yes Yes Yes Yes Nottingham University Hospital NHS Trust 5-24 hrs 5-24 hrs > 48 hrs > 48 hrs Yes No Yes Yes
Sherwood Forest Hospitals NHS Trust 5-24 hrs > 48 hrs > 48 hrs > 48 hrs Yes No No No United Lincolnshire Hospitals NHS Trust (Grantham and District Hospital) 5-24 hrs 5-24 hrs > 48 hrs > 48 hrs No Yes Yes No United Lincolnshire Hospitals NHS Trust (Lincoln County) > 48 hrs > 48 hrs > 48 hrs > 48 hrs Yes No Yes No United Lincolnshire Hospitals NHS Trust (Louth County Hospital) > 48 hrs > 48 hrs > 48 hrs > 48 hrs Yes Yes Yes No United Lincolnshire Hospitals NHS Trust (Pilgrim Hospital) 5-24 hrs 25-48 hrs 25-48 hrs 25-48 hrs Yes No Yes No

--------------------------------------------------------------------------------------------------- Section 1 Chapter 4 Regional summary of key organisational results by named hospital
59
SITE CT
scan
ave
rage
w
aitin
g tim
e w
eekd
ays
CT
scan
av
erag
e w
aitin
g tim
e w
eeke
nds
MR
I sca
n av
erag
e w
aitin
g tim
e w
eekd
ays
MR
I sca
n
aver
age
wai
ting
time
wee
kend
s
Neu
rova
scul
ar/
TIA
Clin
ic
TIA
pat
ient
s se
en a
nd
inve
stig
ated
w
ithin
7 d
ays
Pat
ient
/car
er
view
s so
ught
on
serv
ice
Rep
ort b
een
prod
uced
with
in
12m
ana
lysi
ng
patie
nt v
iew
s
OV
ER
ALL
P
OS
ITIO
N
University Hospitals of Leicester NHS Trust 5-24 hrs > 48 hrs > 48 hrs > 48 hrs Yes No Yes Yes EAST OF ENGLAND STRATEGIC HEALTH AUTHORITY Basildon & Thurrock University Hospitals NHS Foundation Trust > 48 hrs > 48 hrs > 48 hrs > 48 hrs Yes No No No
Bedford Hospital NHS Trust 5-24 hrs > 48 hrs 5-24 hrs > 48 hrs Yes Yes No No Cambridge University Hospitals NHS Foundation Trust 25-48 hrs > 48 hrs 25-48 hrs > 48 hrs Yes Yes Yes Yes East & North Hertfordshire NHS Trust (Lister Hospital) 5-24 hrs 5-24 hrs > 48 hrs > 48 hrs Yes No Yes No East and North Hertfordshire NHS Trust (Queen Elizabeth II Hospital) 5-24 hrs 0-4 hrs 25-48 hrs > 48 hrs Yes Yes Yes No
Essex Rivers Healthcare NHS Trust 5-24 hrs > 48 hrs 5-24 hrs > 48 hrs Yes No Yes Yes Hinchingbrooke Health Care NHS Trust 25-48 hrs 25-48 hrs > 48 hrs > 48 hrs Yes No No No
Ipswich Hospital NHS Trust 5-24 hrs 25-48 hrs 25-48 hrs 25-48 hrs Yes Yes Yes Yes James Paget Healthcare NHS Trust 5-24 hrs 5-24 hrs 5-24 hrs > 48 hrs No Yes Yes No Luton and Dunstable Hospital NHS Trust 25-48 hrs > 48 hrs > 48 hrs > 48 hrs Yes No Yes Yes
Mid Essex Hospital Services NHS Trust 5-24 hrs 5-24 hrs > 48 hrs > 48 hrs Yes Yes Yes Yes Norfolk & Norwich University Hospital NHS Trust 5-24 hrs 25-48 hrs 25-48 hrs > 48 hrs Yes No Yes No Peterborough and Stamford Hospitals NHS Foundation Trust 25-48 hrs 25-48 hrs 25-48 hrs 25-48 hrs Yes No Yes No
Princess Alexandra Hospital NHS Trust 5-24 hrs > 48 hrs > 48 hrs > 48 hrs Yes No Yes No

--------------------------------------------------------------------------------------------------- Section 1 Chapter 4 Regional summary of key organisational results by named hospital
60
SITE CT
scan
ave
rage
w
aitin
g tim
e w
eekd
ays
CT
scan
av
erag
e w
aitin
g tim
e w
eeke
nds
MR
I sca
n av
erag
e w
aitin
g tim
e w
eekd
ays
MR
I sca
n
aver
age
wai
ting
time
wee
kend
s
Neu
rova
scul
ar/
TIA
Clin
ic
TIA
pat
ient
s se
en a
nd
inve
stig
ated
w
ithin
7 d
ays
Pat
ient
/car
er
view
s so
ught
on
serv
ice
Rep
ort b
een
prod
uced
with
in
12m
ana
lysi
ng
patie
nt v
iew
s
OV
ER
ALL
P
OS
ITIO
N
Southend Hospital NHS Trust 25-48 hrs > 48 hrs > 48 hrs > 48 hrs Yes No Yes No The Queen Elizabeth Hospital King's Lynn NHS Trust 25-48 hrs > 48 hrs > 48 hrs > 48 hrs Yes No Yes No West Hertfordshire Hospitals NHS Trust (Hemel Hempstead Hospital) 5-24 hrs 5-24 hrs > 48 hrs > 48 hrs Yes Yes Yes Yes West Hertfordshire Hospitals NHS Trust (Watford General Hospital) 5-24 hrs 25-48 hrs 25-48 hrs > 48 hrs Yes Yes Yes No
West Suffolk Hospitals NHS Trust 5-24 hrs > 48 hrs 25-48 hrs > 48 hrs No No Yes Yes LONDON STRATEGIC HEALTH AUTHORITY Barking Havering and Redbridge Hospitals NHS Trust (King George) 5-24 hrs 5-24 hrs 5-24 hrs 5-24 hrs Yes Yes Yes Yes Barking Havering and Redbridge Hospitals NHS Trust (Oldchurch) 5-24 hrs 25-48 hrs 25-48 hrs > 48 hrs No No Yes No Barnet and Chase Farm Hospitals NHS Trust (Barnet Hospital) 5-24 hrs 5-24 hrs 5-24 hrs 25-48 hrs Yes Yes Yes No Barnet and Chase Farm Hospitals NHS Trust (Chase Farm Hospital) 5-24 hrs 25-48 hrs > 48 hrs > 48 hrs Yes No Yes Yes Barts and The London NHS Trust jointly with Tower Hamlets PCT 0-4 hrs 0-4 hrs 25-48 hrs 25-48 hrs No Yes Yes Yes Bromley Hospitals NHS Trust 5-24 hrs 25-48 hrs 25-48 hrs > 48 hrs No No Yes Yes Chelsea and Westminster Healthcare NHS Trust 0-4 hrs 0-4 hrs 25-48 hrs > 48 hrs Yes Yes Yes No Ealing Hospital NHS Trust 25-48 hrs 25-48 hrs > 48 hrs > 48 hrs No No No No Epsom and St Helier University Hospitals NHS Trust (Epsom Hospital) > 48 hrs > 48 hrs > 48 hrs > 48 hrs No No Yes No Epsom and St Helier University Hospitals NHS Trust (St Helier Hospital) 25-48 hrs > 48 hrs > 48 hrs > 48 hrs Yes No Yes No Guy's & St Thomas' Hospital NHS Foundation Trust 0-4 hrs 0-4 hrs 5-24 hrs 5-24 hrs Yes Yes Yes Yes

--------------------------------------------------------------------------------------------------- Section 1 Chapter 4 Regional summary of key organisational results by named hospital
61
SITE CT
scan
ave
rage
w
aitin
g tim
e w
eekd
ays
CT
scan
av
erag
e w
aitin
g tim
e w
eeke
nds
MR
I sca
n av
erag
e w
aitin
g tim
e w
eekd
ays
MR
I sca
n
aver
age
wai
ting
time
wee
kend
s
Neu
rova
scul
ar/
TIA
Clin
ic
TIA
pat
ient
s se
en a
nd
inve
stig
ated
w
ithin
7 d
ays
Pat
ient
/car
er
view
s so
ught
on
serv
ice
Rep
ort b
een
prod
uced
with
in
12m
ana
lysi
ng
patie
nt v
iew
s
OV
ER
ALL
P
OS
ITIO
N
Hammersmith Hospitals NHS Trust (Charing Cross) 0-4 hrs 5-24 hrs 5-24 hrs 25-48 hrs Yes Yes Yes No Hammersmith Hospitals NHS Trust (Hammersmith) 0-4 hrs 0-4 hrs 5-24 hrs 5-24 hrs No Yes Yes No
Havering Primary Care Trust > 48 hrs > 48 hrs > 48 hrs > 48 hrs Yes Yes Yes No
Hillingdon Hospital NHS Trust 5-24 hrs 25-48 hrs 25-48 hrs > 48 hrs Yes Yes Yes Yes Homerton University Hospital NHS Foundation Trust 25-48 hrs > 48 hrs 25-48 hrs > 48 hrs Yes No Yes No King's College Hospital NHS Trust 0-4 hrs 0-4 hrs 5-24 hrs 25-48 hrs Yes Yes Yes Yes
Kingston Hospital NHS Trust 5-24 hrs 25-48 hrs 25-48 hrs > 48 hrs Yes No Yes No
Lewisham Hospital NHS Trust 5-24 hrs 25-48 hrs > 48 hrs > 48 hrs Yes No Yes No Mayday Healthcare NHS Trust > 48 hrs > 48 hrs > 48 hrs > 48 hrs Yes No Yes No
Newham University Hospital NHS Trust 5-24 hrs 25-48 hrs > 48 hrs > 48 hrs Yes No Yes Yes North Middlesex University Hospital NHS Trust - Jointly with Haringey PCT 5-24 hrs 25-48 hrs 25-48 hrs > 48 hrs Yes No Yes Yes North West London Hospitals NHS Trust (Central Middlesex Hospital including Willesden Community hospital (Brent PCT)) 5-24 hrs 5-24 hrs > 48 hrs > 48 hrs Yes No Yes No North West London Hospitals NHS Trust (Northwick Park Hospital) 25-48 hrs > 48 hrs > 48 hrs > 48 hrs Yes No Yes No Queen Elizabeth Hospital NHS Trust > 48 hrs > 48 hrs > 48 hrs > 48 hrs Yes No Yes Yes
Queen Mary's Sidcup NHS Trust 5-24 hrs 25-48 hrs 5-24 hrs > 48 hrs No No No No
Royal Free Hampstead NHS Trust 5-24 hrs 25-48 hrs 0-4 hrs 0-4 hrs Yes Yes Yes No

--------------------------------------------------------------------------------------------------- Section 1 Chapter 4 Regional summary of key organisational results by named hospital
62
SITE CT
scan
ave
rage
w
aitin
g tim
e w
eekd
ays
CT
scan
av
erag
e w
aitin
g tim
e w
eeke
nds
MR
I sca
n av
erag
e w
aitin
g tim
e w
eekd
ays
MR
I sca
n
aver
age
wai
ting
time
wee
kend
s
Neu
rova
scul
ar/
TIA
Clin
ic
TIA
pat
ient
s se
en a
nd
inve
stig
ated
w
ithin
7 d
ays
Pat
ient
/car
er
view
s so
ught
on
serv
ice
Rep
ort b
een
prod
uced
with
in
12m
ana
lysi
ng
patie
nt v
iew
s
OV
ER
ALL
P
OS
ITIO
N
St George's Healthcare NHS Trust 0-4 hrs 5-24 hrs 5-24 hrs 25-48 hrs Yes No No No St Mary's NHS Trust 0-4 hrs 0-4 hrs 25-48 hrs > 48 hrs Yes Yes Yes Yes University College London Hospitals NHS Foundation Trust 0-4 hrs 0-4 hrs > 48 hrs 0-4 hrs Yes No Yes Yes West Middlesex University Hospital NHS Trust 5-24 hrs 5-24 hrs 25-48 hrs > 48 hrs No No Yes Yes Whipps Cross University Hospital NHS Trust 5-24 hrs 25-48 hrs 25-48 hrs > 48 hrs No No Yes No Whittington Hospital NHS Trust 5-24 hrs 5-24 hrs 25-48 hrs 25-48 hrs Yes No Yes Yes NORTH EAST STRATEGIC HEALTH AUTHORITY City Hospitals Sunderland NHS Foundation Trust 5-24 hrs > 48 hrs > 48 hrs > 48 hrs Yes Yes Yes No County Durham and Darlington Acute Hospitals NHS Trust (Bishop Auckland) 5-24 hrs 25-48 hrs 5-24 hrs 25-48 hrs Yes Yes No No County Durham and Darlington Acute Hospitals NHS Trust (Darlington Memorial) 5-24 hrs 5-24 hrs 5-24 hrs > 48 hrs Yes No Yes No County Durham and Darlington Acute Hospitals NHS Trust (University Hospital North Durham) 25-48 hrs > 48 hrs > 48 hrs > 48 hrs Yes Yes No Yes Gateshead Health NHS Foundation Trust 5-24 hrs 25-48 hrs > 48 hrs > 48 hrs Yes No Yes No Newcastle upon Tyne Hospitals NHS Trust 0-4 hrs 5-24 hrs 25-48 hrs > 48 hrs Yes Yes Yes Yes North Tees and Hartlepool NHS Trust (North Tees Hospital) 5-24 hrs 25-48 hrs > 48 hrs > 48 hrs Yes Yes No No North Tees and Hartlepool NHS Trust (University Hospital of Hartlepool) 5-24 hrs 5-24 hrs 25-48 hrs > 48 hrs Yes No Yes No Northumbria Healthcare NHS Trust (Hexham General Hospital) 5-24 hrs > 48 hrs > 48 hrs > 48 hrs Yes No Yes Yes

--------------------------------------------------------------------------------------------------- Section 1 Chapter 4 Regional summary of key organisational results by named hospital
63
SITE CT
scan
ave
rage
w
aitin
g tim
e w
eekd
ays
CT
scan
av
erag
e w
aitin
g tim
e w
eeke
nds
MR
I sca
n av
erag
e w
aitin
g tim
e w
eekd
ays
MR
I sca
n
aver
age
wai
ting
time
wee
kend
s
Neu
rova
scul
ar/
TIA
Clin
ic
TIA
pat
ient
s se
en a
nd
inve
stig
ated
w
ithin
7 d
ays
Pat
ient
/car
er
view
s so
ught
on
serv
ice
Rep
ort b
een
prod
uced
with
in
12m
ana
lysi
ng
patie
nt v
iew
s
OV
ER
ALL
P
OS
ITIO
N
Northumbria Healthcare NHS Trust (North Tyneside District General Hospital) 25-48 hrs > 48 hrs 25-48 hrs > 48 hrs Yes No Yes Yes Northumbria Healthcare NHS Trust (Wansbeck General Hospital) 25-48 hrs > 48 hrs > 48 hrs > 48 hrs Yes No Yes Yes South Tees Hospitals NHS Trust (The James Cook University Hospital) 5-24 hrs 25-48 hrs > 48 hrs > 48 hrs Yes No Yes No South Tees Hospitals Trust in collaboration with Hambleton and Richmond PCT 5-24 hrs 25-48 hrs 25-48 hrs > 48 hrs Yes No Yes No South Tyneside NHS Foundation Trust 5-24 hrs 25-48 hrs 25-48 hrs > 48 hrs Yes No Yes Yes NORTH WEST STRATEGIC HEALTH AUTHORITY Aintree Hospitals NHS Trust 5-24 hrs 25-48 hrs 25-48 hrs > 48 hrs Yes Yes Yes No Blackpool, Fylde & Wyre Hospitals NHS Trust 25-48 hrs 25-48 hrs > 48 hrs > 48 hrs No No Yes Yes
Bolton Hospitals NHS Trust 25-48 hrs > 48 hrs 25-48 hrs > 48 hrs Yes No Yes Yes Central Manchester and Manchester Children's University Hospital NHS Trust 0-4 hrs 0-4 hrs > 48 hrs > 48 hrs Yes Yes Yes No Countess of Chester Hospital NHS Foundation Trust 5-24 hrs 25-48 hrs 25-48 hrs > 48 hrs Yes No Yes No
East Cheshire NHS Trust 5-24 hrs 25-48 hrs 5-24 hrs > 48 hrs No No Yes Yes East Lancashire Hospitals NHS Trust (Blackburn Hyndburn & Ribble Valley) 25-48 hrs > 48 hrs > 48 hrs > 48 hrs Yes Yes Yes No East Lancashire Hospitals NHS Trust (Burnley Health Care NHS Trust) > 48 hrs > 48 hrs > 48 hrs > 48 hrs Yes No Yes No Lancashire Teaching Hospitals NHS Foundation Trust 25-48 hrs > 48 hrs > 48 hrs > 48 hrs Yes No Yes No

--------------------------------------------------------------------------------------------------- Section 1 Chapter 4 Regional summary of key organisational results by named hospital
64
SITE CT
scan
ave
rage
w
aitin
g tim
e w
eekd
ays
CT
scan
av
erag
e w
aitin
g tim
e w
eeke
nds
MR
I sca
n av
erag
e w
aitin
g tim
e w
eekd
ays
MR
I sca
n
aver
age
wai
ting
time
wee
kend
s
Neu
rova
scul
ar/
TIA
Clin
ic
TIA
pat
ient
s se
en a
nd
inve
stig
ated
w
ithin
7 d
ays
Pat
ient
/car
er
view
s so
ught
on
serv
ice
Rep
ort b
een
prod
uced
with
in
12m
ana
lysi
ng
patie
nt v
iew
s
OV
ER
ALL
P
OS
ITIO
N
Lancashire Teaching Hospitals NHS Foundation Trust (Chorley and South Ribble) 25-48 hrs > 48 hrs 25-48 hrs > 48 hrs No No No Yes Mid Cheshire Hospitals NHS Trust 5-24 hrs 5-24 hrs 25-48 hrs > 48 hrs Yes No Yes No Morecambe Bay Hospitals NHS Trust (Furness General Hospital) 25-48 hrs 25-48 hrs No MRI No MRI Yes Yes No No Morecambe Bay Hospitals NHS Trust (Royal Lancaster Infirmary) 25-48 hrs 25-48 hrs 25-48 hrs > 48 hrs Yes No No No Morecambe Bay Hospitals NHS Trust (Westmorland General Hospital) 25-48 hrs > 48 hrs > 48 hrs > 48 hrs Yes No No No North Cheshire Hospitals NHS Trust (Halton General Hospital) 25-48 hrs > 48 hrs > 48 hrs > 48 hrs Yes Yes Yes Yes North Cheshire Hospitals NHS Trust (Warrington Hospital) 5-24 hrs 25-48 hrs > 48 hrs > 48 hrs Yes Yes Yes Yes North Cumbria Acute Hospitals NHS Trust (Cumberland Infirmary) 5-24 hrs 25-48 hrs 25-48 hrs > 48 hrs Yes No Yes Yes North Cumbria Acute Hospitals NHS Trust (West Cumberland Hospital) 0-4 hrs 5-24 hrs > 48 hrs > 48 hrs Yes Yes Yes Yes Pennine Acute Hospitals NHS Trust (Fairfield General Hospital) 5-24 hrs 25-48 hrs 25-48 hrs > 48 hrs Yes No Yes Yes Pennine Acute Hospitals NHS Trust (North Manchester General) 5-24 hrs 25-48 hrs > 48 hrs > 48 hrs Yes No Yes Yes Pennine Acute Hospitals NHS Trust (Rochdale Infirmary) 5-24 hrs 25-48 hrs 25-48 hrs > 48 hrs Yes Yes Yes Yes Pennine Acute Hospitals NHS Trust (Royal Oldham Hospital) 5-24 hrs > 48 hrs > 48 hrs > 48 hrs Yes No Yes Yes Royal Liverpool & Broadgreen University Hospitals NHS Trust 25-48 hrs > 48 hrs > 48 hrs > 48 hrs Yes Yes No No Salford Royal Hospitals NHS Trust 0-4 hrs 5-24 hrs 25-48 hrs > 48 hrs Yes No No No

--------------------------------------------------------------------------------------------------- Section 1 Chapter 4 Regional summary of key organisational results by named hospital
65
SITE CT
scan
ave
rage
w
aitin
g tim
e w
eekd
ays
CT
scan
av
erag
e w
aitin
g tim
e w
eeke
nds
MR
I sca
n av
erag
e w
aitin
g tim
e w
eekd
ays
MR
I sca
n
aver
age
wai
ting
time
wee
kend
s
Neu
rova
scul
ar/
TIA
Clin
ic
TIA
pat
ient
s se
en a
nd
inve
stig
ated
w
ithin
7 d
ays
Pat
ient
/car
er
view
s so
ught
on
serv
ice
Rep
ort b
een
prod
uced
with
in
12m
ana
lysi
ng
patie
nt v
iew
s
OV
ER
ALL
P
OS
ITIO
N
South Manchester University Hospitals NHS Trust 5-24 hrs 25-48 hrs > 48 hrs > 48 hrs Yes No Yes Yes Southport and Ormskirk Hospital NHS Trust 25-48 hrs 25-48 hrs > 48 hrs > 48 hrs Yes No Yes Yes St Helens & Knowsley Hospitals NHS Trust 5-24 hrs 25-48 hrs 5-24 hrs > 48 hrs Yes No No Yes
Stockport NHS Foundation Trust 25-48 hrs > 48 hrs 25-48 hrs > 48 hrs Yes No Yes No
Tameside and Glossop Acute Services 5-24 hrs > 48 hrs 5-24 hrs > 48 hrs Yes No Yes Yes Trafford Healthcare NHS Trust 5-24 hrs 5-24 hrs > 48 hrs > 48 hrs Yes No Yes No
Wirral Hospital NHS Trust 5-24 hrs 25-48 hrs 25-48 hrs > 48 hrs No No Yes No Wrightington, Wigan and Leigh NHS Trust 25-48 hrs > 48 hrs 5-24 hrs > 48 hrs Yes No No No SOUTH CENTRAL STRATEGIC HEALTH AUTHORITY Buckinghamshire Hospitals NHS Trust (Amersham & Wycombe Hospitals) 5-24 hrs > 48 hrs 5-24 hrs > 48 hrs Yes No Yes No Buckinghamshire Hospitals NHS Trust (Stoke Mandeville Hospital) 25-48 hrs 25-48 hrs 25-48 hrs 25-48 hrs Yes No Yes No East Hampshire Primary Care Trust jointly with Portsmouth Hospitals NHS Trust 5-24 hrs 25-48 hrs > 48 hrs > 48 hrs Yes No Yes Yes
Heatherwood & Wexham Park Hospitals 5-24 hrs 25-48 hrs > 48 hrs > 48 hrs Yes Yes Yes No
Isle of Wight Healthcare NHS Trust 5-24 hrs > 48 hrs 5-24 hrs > 48 hrs Yes No Yes Yes
Milford Stroke Unit (New Forest PCT) > 48 hrs > 48 hrs > 48 hrs > 48 hrs Yes No Yes Yes
Milton Keynes General NHS Trust 5-24 hrs 25-48 hrs > 48 hrs > 48 hrs Yes Yes Yes Yes

--------------------------------------------------------------------------------------------------- Section 1 Chapter 4 Regional summary of key organisational results by named hospital
66
SITE CT
scan
ave
rage
w
aitin
g tim
e w
eekd
ays
CT
scan
av
erag
e w
aitin
g tim
e w
eeke
nds
MR
I sca
n av
erag
e w
aitin
g tim
e w
eekd
ays
MR
I sca
n
aver
age
wai
ting
time
wee
kend
s
Neu
rova
scul
ar/
TIA
Clin
ic
TIA
pat
ient
s se
en a
nd
inve
stig
ated
w
ithin
7 d
ays
Pat
ient
/car
er
view
s so
ught
on
serv
ice
Rep
ort b
een
prod
uced
with
in
12m
ana
lysi
ng
patie
nt v
iew
s
OV
ER
ALL
P
OS
ITIO
N
North Hampshire Hospitals NHS Trust 5-24 hrs 25-48 hrs 25-48 hrs > 48 hrs Yes Yes Yes No Oxford Radcliffe Hospitals NHS Trust 0-4 hrs 25-48 hrs 5-24 hrs 25-48 hrs Yes Yes Yes Yes Royal Berkshire & Battle Hospitals NHS Trust 5-24 hrs 5-24 hrs 25-48 hrs > 48 hrs Yes Yes Yes Yes Southampton University Hospitals NHS Trust (Southampton General Hospital) > 48 hrs > 48 hrs > 48 hrs > 48 hrs Yes No Yes No Tannersbrook Stroke Unit (Southampton City PCT) > 48 hrs > 48 hrs > 48 hrs > 48 hrs Yes No Yes Yes Winchester and Eastleigh Healthcare NHS Trust 25-48 hrs > 48 hrs 25-48 hrs 25-48 hrs Yes No Yes Yes SOUTH EAST COAST STRATEGIC HEALTH AUTHORITY Ashford and St Peter's Hospital NHS Trust 5-24 hrs 5-24 hrs > 48 hrs > 48 hrs Yes Yes Yes No Brighton & Sussex University Hospitals NHS Trust (Brighton) 5-24 hrs 25-48 hrs 25-48 hrs > 48 hrs No No No No Brighton & Sussex University Hospitals NHS Trust (Mid-Sussex) 5-24 hrs 25-48 hrs 25-48 hrs > 48 hrs No No No No
Dartford & Gravesham NHS Trust 25-48 hrs > 48 hrs > 48 hrs > 48 hrs Yes No Yes No Dartford, Gravesham & Swanley Primary Care Trust No CT No CT No MRI No MRI No No No No East Kent Hospitals NHS Trust (Ashford, William Harvey Hospital) 5-24 hrs 25-48 hrs > 48 hrs > 48 hrs Yes No Yes Yes East Kent Hospitals NHS Trust (Kent & Canterbury Hospital) 5-24 hrs 25-48 hrs 5-24 hrs 25-48 hrs Yes Yes No Yes East Kent Hospitals NHS Trust (Queen Elizabeth Queen Mother (Margate) Hospital) 5-24 hrs 25-48 hrs 5-24 hrs > 48 hrs Yes No No No East Sussex Hospitals NHS Trust (Conquest Hospital) 25-48 hrs > 48 hrs > 48 hrs > 48 hrs Yes No Yes Yes

--------------------------------------------------------------------------------------------------- Section 1 Chapter 4 Regional summary of key organisational results by named hospital
67
SITE CT
scan
ave
rage
w
aitin
g tim
e w
eekd
ays
CT
scan
av
erag
e w
aitin
g tim
e w
eeke
nds
MR
I sca
n av
erag
e w
aitin
g tim
e w
eekd
ays
MR
I sca
n
aver
age
wai
ting
time
wee
kend
s
Neu
rova
scul
ar/
TIA
Clin
ic
TIA
pat
ient
s se
en a
nd
inve
stig
ated
w
ithin
7 d
ays
Pat
ient
/car
er
view
s so
ught
on
serv
ice
Rep
ort b
een
prod
uced
with
in
12m
ana
lysi
ng
patie
nt v
iew
s
OV
ER
ALL
P
OS
ITIO
N
East Sussex Hospitals NHS Trust (Eastbourne Hospital) 5-24 hrs > 48 hrs 25-48 hrs > 48 hrs Yes No Yes Yes Frimley Park Hospitals NHS Foundation Trust 25-48 hrs > 48 hrs > 48 hrs > 48 hrs Yes No Yes No Maidstone and Tunbridge Wells NHS Trust (Kent and Sussex) 5-24 hrs 0-4 hrs 25-48 hrs > 48 hrs No No Yes No Maidstone and Tunbridge Wells NHS Trust (Maidstone Hospital) 25-48 hrs > 48 hrs > 48 hrs > 48 hrs Yes No Yes No Medway Maritime Hospital, Medway PCT & Swale PCT 5-24 hrs 25-48 hrs 25-48 hrs > 48 hrs Yes Yes Yes Yes Royal Surrey County Hospital NHS Trust 5-24 hrs 25-48 hrs 25-48 hrs > 48 hrs Yes Yes Yes No
Royal West Sussex Trust 5-24 hrs 25-48 hrs 5-24 hrs > 48 hrs Yes Yes Yes No Surrey & Sussex Healthcare NHS Trust 25-48 hrs 0-4 hrs 25-48 hrs > 48 hrs Yes No No No Worthing & Southlands Hospitals NHS Trust 25-48 hrs > 48 hrs > 48 hrs > 48 hrs Yes Yes Yes Yes SOUTH WEST STRATEGIC HEALTH AUTHORITY Bath & North East Somerset Primary Care Trust > 48 hrs > 48 hrs > 48 hrs > 48 hrs No No Yes Yes
East Devon Primary Care Trust > 48 hrs > 48 hrs > 48 hrs > 48 hrs No Yes Yes Yes Exeter Primary Care Trust No CT No CT No MRI No MRI No No Yes No Gloucestershire Hospitals NHS Foundation Trust (Cheltenham General Hospital) 5-24 hrs 25-48 hrs > 48 hrs > 48 hrs Yes Yes Yes No Gloucestershire Hospitals NHS Foundation Trust (Gloucestershire Royal Hospital) 25-48 hrs 25-48 hrs > 48 hrs > 48 hrs Yes Yes Yes Yes

--------------------------------------------------------------------------------------------------- Section 1 Chapter 4 Regional summary of key organisational results by named hospital
68
SITE CT
scan
ave
rage
w
aitin
g tim
e w
eekd
ays
CT
scan
av
erag
e w
aitin
g tim
e w
eeke
nds
MR
I sca
n av
erag
e w
aitin
g tim
e w
eekd
ays
MR
I sca
n
aver
age
wai
ting
time
wee
kend
s
Neu
rova
scul
ar/
TIA
Clin
ic
TIA
pat
ient
s se
en a
nd
inve
stig
ated
w
ithin
7 d
ays
Pat
ient
/car
er
view
s so
ught
on
serv
ice
Rep
ort b
een
prod
uced
with
in
12m
ana
lysi
ng
patie
nt v
iew
s
OV
ER
ALL
P
OS
ITIO
N
Kennet, North and West Wiltshire PCT Stroke Unit 25-48 hrs 25-48 hrs 25-48 hrs 25-48 hrs No No Yes Yes
Mendip PCT (Shepton Mallet Hospital) 5-24 hrs 5-24 hrs > 48 hrs > 48 hrs No No Yes No
Mid Devon Primary Care Trust > 48 hrs > 48 hrs > 48 hrs > 48 hrs No Yes Yes Yes North Bristol NHS Trust 5-24 hrs 5-24 hrs 25-48 hrs > 48 hrs Yes No Yes Yes
Northern Devon Healthcare NHS Trust 5-24 hrs 25-48 hrs 25-48 hrs > 48 hrs Yes No Yes Yes
Plymouth Hospitals NHS Trust 5-24 hrs > 48 hrs 5-24 hrs > 48 hrs Yes Yes Yes No
Plymouth Primary Care Trust 5-24 hrs 5-24 hrs > 48 hrs > 48 hrs No No Yes No Poole Hospital NHS Trust 5-24 hrs > 48 hrs > 48 hrs > 48 hrs Yes Yes Yes No Royal Bournemouth & Christchurch Hospitals NHS Foundation Trust 5-24 hrs 5-24 hrs 25-48 hrs 25-48 hrs Yes Yes Yes Yes Royal Cornwall Hospitals Trust 25-48 hrs > 48 hrs > 48 hrs > 48 hrs Yes No Yes Yes Royal Devon & Exeter NHS Foundation Trust 5-24 hrs 25-48 hrs > 48 hrs > 48 hrs Yes Yes Yes No
Royal United Hospital Bath NHS Trust 5-24 hrs 5-24 hrs 5-24 hrs 5-24 hrs No No Yes Yes Salisbury Health Care NHS Trust 5-24 hrs 25-48 hrs 25-48 hrs > 48 hrs Yes Yes Yes No South Devon (including South Devon Healthcare NHS Trust and Teignbridge, Torbay and South Hams and West Devon PCTs) 5-24 hrs 25-48 hrs > 48 hrs > 48 hrs Yes Yes Yes Yes Swindon & Marlborough NHS Trust (in collaboration with Swindon PCT) 25-48 hrs > 48 hrs > 48 hrs > 48 hrs Yes No Yes No
Taunton & Somerset NHS Trust 25-48 hrs > 48 hrs > 48 hrs > 48 hrs Yes Yes Yes Yes United Bristol Healthcare NHS Trust 5-24 hrs 25-48 hrs > 48 hrs > 48 hrs Yes No Yes Yes

--------------------------------------------------------------------------------------------------- Section 1 Chapter 4 Regional summary of key organisational results by named hospital
69
SITE CT
scan
ave
rage
w
aitin
g tim
e w
eekd
ays
CT
scan
av
erag
e w
aitin
g tim
e w
eeke
nds
MR
I sca
n av
erag
e w
aitin
g tim
e w
eekd
ays
MR
I sca
n
aver
age
wai
ting
time
wee
kend
s
Neu
rova
scul
ar/
TIA
Clin
ic
TIA
pat
ient
s se
en a
nd
inve
stig
ated
w
ithin
7 d
ays
Pat
ient
/car
er
view
s so
ught
on
serv
ice
Rep
ort b
een
prod
uced
with
in
12m
ana
lysi
ng
patie
nt v
iew
s
OV
ER
ALL
P
OS
ITIO
N
West Dorset General Hospitals NHS Trust 5-24 hrs 25-48 hrs 25-48 hrs > 48 hrs Yes Yes Yes Yes Weston Area Health Trust 5-24 hrs 25-48 hrs No MRI No MRI Yes No No No Yeovil District Hospital NHS Foundation Trust 5-24 hrs 5-24 hrs 25-48 hrs > 48 hrs Yes No Yes Yes WEST MIDLANDS STRATEGIC HEALTH AUTHORITY Burton Hospitals NHS Trust > 48 hrs > 48 hrs > 48 hrs > 48 hrs No No Yes No
Dudley Group of Hospitals NHS Trust 25-48 hrs > 48 hrs > 48 hrs > 48 hrs Yes No Yes No
George Eliot Hospital NHS Trust 5-24 hrs 25-48 hrs 25-48 hrs > 48 hrs Yes No Yes No
Good Hope Hospital NHS Trust 5-24 hrs 25-48 hrs 25-48 hrs > 48 hrs Yes No Yes No Heart of England NHS Foundation Trust 5-24 hrs 25-48 hrs 5-24 hrs > 48 hrs Yes No Yes No
Hereford Hospitals NHS Trust 25-48 hrs > 48 hrs 25-48 hrs > 48 hrs Yes Yes Yes Yes Mid Staffordshire General Hospitals NHS Trust 5-24 hrs > 48 hrs > 48 hrs > 48 hrs Yes Yes Yes No Royal Wolverhampton Hospitals NHS Trust jointly with Wolverhampton Health Care NHS Trust 5-24 hrs 25-48 hrs > 48 hrs > 48 hrs Yes Yes Yes Yes Sandwell and West Birmingham Hospitals NHS Trust (City Hospital) 5-24 hrs 0-4 hrs > 48 hrs > 48 hrs Yes No No No Sandwell and West Birmingham Hospitals NHS Trust (Sandwell District Hospital) > 48 hrs > 48 hrs > 48 hrs > 48 hrs Yes No Yes Yes Shrewsbury & Telford Hospital NHS Trust 25-48 hrs 25-48 hrs 25-48 hrs > 48 hrs Yes No Yes Yes
South Birmingham Primary Care Trust 25-48 hrs 25-48 hrs 25-48 hrs 25-48 hrs No No Yes Yes

--------------------------------------------------------------------------------------------------- Section 1 Chapter 4 Regional summary of key organisational results by named hospital
70
SITE CT
scan
ave
rage
w
aitin
g tim
e w
eekd
ays
CT
scan
av
erag
e w
aitin
g tim
e w
eeke
nds
MR
I sca
n av
erag
e w
aitin
g tim
e w
eekd
ays
MR
I sca
n
aver
age
wai
ting
time
wee
kend
s
Neu
rova
scul
ar/
TIA
Clin
ic
TIA
pat
ient
s se
en a
nd
inve
stig
ated
w
ithin
7 d
ays
Pat
ient
/car
er
view
s so
ught
on
serv
ice
Rep
ort b
een
prod
uced
with
in
12m
ana
lysi
ng
patie
nt v
iew
s
OV
ER
ALL
P
OS
ITIO
N
South Warwickshire General Hospitals NHS Trust 25-48 hrs > 48 hrs > 48 hrs > 48 hrs Yes No Yes No South Worcestershire Primary Care Trust > 48 hrs > 48 hrs > 48 hrs > 48 hrs No No Yes No University Hospital Birmingham NHS Foundation Trust 5-24 hrs 25-48 hrs > 48 hrs > 48 hrs Yes Yes Yes No University Hospital of North Staffordshire NHS Trust & North Staffordshire Combined Healthcare NHS Trust Combined 25-48 hrs 25-48 hrs 25-48 hrs 25-48 hrs Yes No Yes No University Hospitals Coventry and Warwickshire (St Cross Hospital Rugby) > 48 hrs 5-24 hrs > 48 hrs 5-24 hrs Yes No Yes No University Hospitals Coventry and Warwickshire (Walsgrave Hospital) 5-24 hrs 0-4 hrs > 48 hrs 0-4 hrs Yes No Yes No Walsall Hospitals NHS Trust 5-24 hrs 5-24 hrs 5-24 hrs > 48 hrs Yes Yes Yes Yes Worcestershire Acute Hospitals NHS Trust (Alexandra Hospital Redditch) 5-24 hrs 25-48 hrs 5-24 hrs 25-48 hrs Yes No Yes No Worcestershire Acute Hospitals NHS Trust (Worcester Royal Hospital) 25-48 hrs > 48 hrs > 48 hrs > 48 hrs Yes No Yes No YORKSHIRE AND THE HUMBER STRATEGIC HEALTH AUTHORITY
Airedale NHS Trust 5-24 hrs 25-48 hrs 25-48 hrs > 48 hrs Yes No Yes Yes Barnsley Hospital NHS Foundation Trust > 48 hrs > 48 hrs > 48 hrs > 48 hrs Yes Yes Yes Yes Bradford Teaching Hospitals NHS Foundation Trust 5-24 hrs 5-24 hrs > 48 hrs > 48 hrs Yes Yes Yes Yes Calderdale & Huddersfield NHS Trust 5-24 hrs 25-48 hrs > 48 hrs > 48 hrs Yes Yes Yes Yes Doncaster & Bassetlaw Hospitals NHS Foundation Trust (Bassetlaw Hospital) 0-4 hrs 0-4 hrs 5-24 hrs 25-48 hrs Yes Yes Yes No
Doncaster & Bassetlaw Hospitals NHS 5-24 hrs 5-24 hrs > 48 hrs > 48 hrs Yes No Yes Yes

--------------------------------------------------------------------------------------------------- Section 1 Chapter 4 Regional summary of key organisational results by named hospital
71
SITE CT
scan
ave
rage
w
aitin
g tim
e w
eekd
ays
CT
scan
av
erag
e w
aitin
g tim
e w
eeke
nds
MR
I sca
n av
erag
e w
aitin
g tim
e w
eekd
ays
MR
I sca
n
aver
age
wai
ting
time
wee
kend
s
Neu
rova
scul
ar/
TIA
Clin
ic
TIA
pat
ient
s se
en a
nd
inve
stig
ated
w
ithin
7 d
ays
Pat
ient
/car
er
view
s so
ught
on
serv
ice
Rep
ort b
een
prod
uced
with
in
12m
ana
lysi
ng
patie
nt v
iew
s
OV
ER
ALL
P
OS
ITIO
N
Foundation Trust (Doncaster Royal Infirmary & Montagu Hospital) Hambleton and Richmondshire PCT (Rutson Rehabilitation Unit) 5-24 hrs 25-48 hrs > 48 hrs > 48 hrs Yes Yes Yes No Harrogate and District NHS Foundation Trust 5-24 hrs 0-4 hrs 25-48 hrs 5-24 hrs No No Yes No Hull and East Yorkshire Hospitals NHS Trust 5-24 hrs 25-48 hrs 25-48 hrs > 48 hrs Yes Yes Yes Yes Mid Yorkshire Hospitals NHS Trust (Pinderfields Hospital) 5-24 hrs > 48 hrs > 48 hrs > 48 hrs No No Yes Yes Northern Lincolnshire and Goole Hospitals NHS Trust (Diana Princess of Wales Grimsby) 5-24 hrs 5-24 hrs > 48 hrs > 48 hrs Yes Yes Yes No Northern Lincolnshire and Goole Hospitals NHS Trust (Scunthorpe General) 5-24 hrs > 48 hrs > 48 hrs > 48 hrs Yes Yes Yes No Scarborough and North East Yorks Health Care NHS Trust 25-48 hrs > 48 hrs > 48 hrs > 48 hrs Yes No Yes No Sheffield Teaching Hospitals NHS Foundation Trust 25-48 hrs 25-48 hrs > 48 hrs 0-4 hrs Yes Yes Yes Yes The Leeds Teaching Hospitals NHS Trust 25-48 hrs 25-48 hrs > 48 hrs > 48 hrs Yes No Yes Yes
The Rotherham NHS Foundation Trust 25-48 hrs > 48 hrs > 48 hrs > 48 hrs Yes Yes Yes No
York Health Services NHS Trust 5-24 hrs 25-48 hrs 25-48 hrs > 48 hrs Yes No Yes No NORTHERN IRELAND Belfast City Hospital Health & Social Services Trust 5-24 hrs 25-48 hrs 25-48 hrs > 48 hrs Yes Yes No Yes Down Lisburn Health and Social Services Trust 5-24 hrs > 48 hrs > 48 hrs > 48 hrs Yes Yes Yes No

--------------------------------------------------------------------------------------------------- Section 1 Chapter 4 Regional summary of key organisational results by named hospital
72
SITE CT
scan
ave
rage
w
aitin
g tim
e w
eekd
ays
CT
scan
av
erag
e w
aitin
g tim
e w
eeke
nds
MR
I sca
n av
erag
e w
aitin
g tim
e w
eekd
ays
MR
I sca
n
aver
age
wai
ting
time
wee
kend
s
Neu
rova
scul
ar/
TIA
Clin
ic
TIA
pat
ient
s se
en a
nd
inve
stig
ated
w
ithin
7 d
ays
Pat
ient
/car
er
view
s so
ught
on
serv
ice
Rep
ort b
een
prod
uced
with
in
12m
ana
lysi
ng
patie
nt v
iew
s
OV
ER
ALL
P
OS
ITIO
N
Mater Hospital Belfast Health & Social Services Trust 25-48 hrs > 48 hrs > 48 hrs > 48 hrs No No Yes No Royal Group of Hospitals and Dental Health & Social Services Trust 5-24 hrs 5-24 hrs > 48 hrs > 48 hrs Yes No Yes No Ulster Community & Hospitals Trust 25-48 hrs 25-48 hrs 25-48 hrs > 48 hrs Yes No Yes Yes Causeway Health & Social Services Trust 5-24 hrs 25-48 hrs > 48 hrs > 48 hrs No No Yes No United Hospitals Health & Social Services Trust 5-24 hrs 25-48 hrs > 48 hrs > 48 hrs Yes No No No
Craigavon Area Hospital Group Trust 25-48 hrs 25-48 hrs > 48 hrs > 48 hrs Yes No Yes Yes Newry & Mourne Health & Social Services Trust 5-24 hrs > 48 hrs No MRI No MRI No No Yes Yes Altnagelvin Hospitals Health & Social Services Trust 5-24 hrs 25-48 hrs 25-48 hrs > 48 hrs Yes No Yes No Sperrin Lakeland Health and Social Care NHS Trust (Erne Hospital) 5-24 hrs 5-24 hrs > 48 hrs > 48 hrs No Yes Yes No Sperrin Lakeland Health and Social Care NHS Trust (Tyrone County Hospital) 0-4 hrs 5-24 hrs No MRI No MRI No No No No Bro Morgannwg NHS Trust (Neath Port Talbot Hospital) 5-24 hrs > 48 hrs > 48 hrs > 48 hrs No No Yes No Bro Morgannwg NHS Trust (Princess of Wales Hospital ) 25-48 hrs > 48 hrs > 48 hrs > 48 hrs Yes No Yes No Carmarthenshire NHS Trust (Prince Philip Hospital) 0-4 hrs 0-4 hrs > 48 hrs > 48 hrs No No No No Carmarthenshire NHS Trust (West Wales General) 5-24 hrs 5-24 hrs > 48 hrs > 48 hrs No No No No Ceredigion & Mid-Wales NHS Trust 5-24 hrs 5-24 hrs > 48 hrs > 48 hrs No No Yes Yes
Pembrokeshire & Derwen NHS Trust 5-24 hrs 25-48 hrs 25-48 hrs > 48 hrs Yes No No No

--------------------------------------------------------------------------------------------------- Section 1 Chapter 4 Regional summary of key organisational results by named hospital
73
SITE CT
scan
ave
rage
w
aitin
g tim
e w
eekd
ays
CT
scan
av
erag
e w
aitin
g tim
e w
eeke
nds
MR
I sca
n av
erag
e w
aitin
g tim
e w
eekd
ays
MR
I sca
n
aver
age
wai
ting
time
wee
kend
s
Neu
rova
scul
ar/
TIA
Clin
ic
TIA
pat
ient
s se
en a
nd
inve
stig
ated
w
ithin
7 d
ays
Pat
ient
/car
er
view
s so
ught
on
serv
ice
Rep
ort b
een
prod
uced
with
in
12m
ana
lysi
ng
patie
nt v
iew
s
OV
ER
ALL
P
OS
ITIO
N
Powys Local Health Board > 48 hrs > 48 hrs > 48 hrs > 48 hrs Yes No Yes No Swansea NHS Trust (Morriston Hospital) 25-48 hrs > 48 hrs > 48 hrs > 48 hrs No No Yes No Swansea NHS Trust (Singleton Hospital) 5-24 hrs 25-48 hrs > 48 hrs > 48 hrs No No Yes No
Conwy & Denbighshire NHS Trust 5-24 hrs > 48 hrs > 48 hrs > 48 hrs Yes Yes Yes No North East Wales NHS Trust 25-48 hrs 25-48 hrs 25-48 hrs 25-48 hrs Yes No Yes No North West Wales NHS Trust (Bangor Hospital) 5-24 hrs 25-48 hrs 25-48 hrs > 48 hrs No Yes Yes No North West Wales NHS Trust (Llandudno Hospital) > 48 hrs > 48 hrs > 48 hrs > 48 hrs No No Yes No Cardiff and Vale NHS Trust (Llandough Hospital) 25-48 hrs > 48 hrs No MRI No MRI No No Yes No Cardiff and Vale NHS Trust (University Hospital Wales) 25-48 hrs > 48 hrs > 48 hrs > 48 hrs Yes No No No Gwent Healthcare NHS Trust (Caerphilly District Miner's Hospital) > 48 hrs > 48 hrs > 48 hrs > 48 hrs Yes No Yes No Gwent Healthcare NHS Trust (Nevill Hall Hospital) 5-24 hrs 25-48 hrs 25-48 hrs > 48 hrs Yes No Yes Yes Gwent Healthcare NHS Trust (St Woolos Hospital (Royal Gwent)) 25-48 hrs 5-24 hrs > 48 hrs > 48 hrs No No Yes No North Glamorgan NHS Trust 25-48 hrs 25-48 hrs No MRI No MRI No Yes Yes Yes
Pontypridd & Rhondda NHS Trust 25-48 hrs > 48 hrs > 48 hrs > 48 hrs Yes No Yes No

--------------------------------------------------------------------------------------------------- Section 1 Chapter 4 Regional summary of key organisational results by named hospital
74
SITE CT
scan
ave
rage
w
aitin
g tim
e w
eekd
ays
CT
scan
av
erag
e w
aitin
g tim
e w
eeke
nds
MR
I sca
n av
erag
e w
aitin
g tim
e w
eekd
ays
MR
I sca
n
aver
age
wai
ting
time
wee
kend
s
Neu
rova
scul
ar/
TIA
Clin
ic
TIA
pat
ient
s se
en a
nd
inve
stig
ated
w
ithin
7 d
ays
Pat
ient
/car
er
view
s so
ught
on
serv
ice
Rep
ort b
een
prod
uced
with
in
12m
ana
lysi
ng
patie
nt v
iew
s
OV
ER
ALL
P
OS
ITIO
N
ISLANDS States of Guernsey Health & Social Services 0-4 hrs 0-4 hrs > 48 hrs > 48 hrs No Yes No No States of Jersey Health & Social Services 5-24 hrs 5-24 hrs 5-24 hrs 5-24 hrs No No Yes No Isle of Man Department of Health and Social Security 5-24 hrs > 48 hrs 5-24 hrs > 48 hrs No No Yes No

--------------------------------------------------------------------------------------------------- Section 2 Clinical Audit
75
Section 2 Results for the process of stroke care audit

Section 2 Chapter 1 Introduction and Methods Clinical Audit 2006 76
Chapter 1- Background and Methods for Phase II Data Collection and Presentation of Results Evidence-based The results from this clinical audit are based on information obtained retrospectively from patient records. They compare delivery of care with standards derived from systematically retrieved and critically appraised research evidence and agreed by experts in all disciplines involved in the management of stroke. The strength of evidence is outlined in National Clinical Guidelines for Stroke 2004 second edition Intercollegiate Stroke Working Party Royal College of Physicians (http://www.rcplondon.ac.uk/pubs/books/stroke/index.htm) 1.1 METHODS Key indicators of Stroke care Following the third round of audit in 2002 a minimum dataset was selected to best represent the total clinical process for each hospital. The final selection of 11 key indicators involved both clinical reasoning and statistical considerations. The 11 key standards are as follows:
• More than 50% of stay on a stroke unit • Screened for swallowing disorders within first 24 hours of admission • Brain scan within 24 hours of stroke • Commenced aspirin by 48 hours after stroke • Physiotherapy assessment within first 72 hours of admission • Assessment by an Occupational Therapist within 7 days of admission • Weighed at least once during admission • Mood assessed by discharge • On antithrombotic therapy by discharge • Rehabilitation goals agreed by the multi-disciplinary team • Home visit performed before discharge
As in 2004 within this report we have added one further key item:
• Treated in a stroke unit during their stay Site compliance rates for each key standard and an average compliance across standards will be released to the Department of Health strategic health authorities and the public. Rates will also be used for comparative purposes within this report. The benefits of having a stroke unit are demonstrated by research. One indicator therefore refers to patients spending most of their stay on a stroke unit. The chosen indicators represent important facets of care and together cover a broad spectrum of care. It is argued that this set of indicators is valid in its own right in terms of face and content validity. Validity is enhanced by its broad agreement with the total process score as has been seen in successive rounds of the audit. Standards in the audit The full proforma of questions is shown in Appendix 2 and many questions are the same as in the 2004 audit. Approximately one third of questions have been removed from this audit round to balance the effort of auditors in collecting good quality data and representativeness of the sample. The working party have selected those which are judged to be particularly good indicators, based on their ability to discriminate the quality of care and their statistical reliability, as well as their perceived clinical value in

Section 2 Chapter 1 Introduction and Methods Clinical Audit 2006 77
stroke. This is not to deny the value to clinical care of the items removed. This allows an assessment of change over time, a high priority for hospitals. As standards changed and new areas were considered, the Intercollegiate Working Party agreed some additional questions for Stroke. These link to the National Clinical Guidelines for Stroke. The new questions were piloted during December 2005. NO, BUT…answers: The diversity of effects from a stroke creates difficulties for clinical management and for determining overall standards of care. For example if someone is unconscious after their stroke it would not be possible to test their walking or speech difficulties within the time frames normally required. The audit therefore designated specified circumstances where standards would not be applicable. All results in this report refer to the compliance with standards after excluding the non applicable patients for each question. The full wording of questions can be found in Appendix 2. Definition of a ‘site’ Lead clinicians were asked to collect data on the basis of a unified service within a Trust. For most Trusts the ‘site’ was the Trust. For some Trusts there were several ‘sites’ each offering a distinct service. A few other ‘sites’ were combinations of Trusts. There are some differences in configuration between the organisational audit (Phase I conducted in April 2006) and the clinical audit (Phase II). Recruitment The 224 sites that participated in the previous round of the audit were kept informed of the proposed timetable for the fifth round. Changes in Trust configuration and the details of lead clinician and audit co-ordinator were updated regularly. All the eligible Trusts that participated in 2004 were enrolled again. In all data on 13,625 cases were received from 224 sites, within 203 Trusts. Selection criteria for the cohort Patients who were admitted between 1 April 2006 and 30 June 2006 were included. Sites were instructed to obtain a minimum of 20 and a maximum of 80 consecutive admissions with a primary diagnosis of stroke (ICD10 codes I61, I63 or I64). To ensure that the indicators were based on a sufficiently large number of applicable patients hospitals were asked to obtain data on all admissions within the time period or 80 if they had admitted more than 80. Data collection tool A web-based tool was used to collect data from sites. This web tool included context specific online help including definitions and clarifications. Security and confidentiality was maintained by the use of site codes. Sites accessed the proforma using unique identifiers and passwords and data could be saved during as well as at the end of an input session. Formal data collection began on 2 October 2006 for cases admitted from 1 April 2006 and each participating Trust was provided with an appropriate login and password and help booklets. However the web tool went live on August 1st 2006 to accommodate the increased sample size. A telephone and email helpdesk was provided by the CEEu to answer any individual queries. The final record was submitted on 6th December 2006. Data reliability Sites were asked to re-audit their first 5 cases, using a different auditor. 143 sites submitted 624 cases. Because this audit again used web-based data entry data completeness was again very high. Problems in finding data (typically one auditor

Section 2 Chapter 1 Introduction and Methods Clinical Audit 2006 78
found information about a batch of patients whilst the other did not) were low. The levels of agreement for categorical data were generally very good with the majority of questions having kappa values of 0.81 and higher (kappa median 0.82, Inter-Quartile range 0.73-0.90, n=125 questions).
• For questions unchanged from the previous audit reliability: kappa median 0.82, Inter-Quartile range 0.74-0.91, n=69 questions.
• For questions amended from the previous round of audit, reliability: kappa median 0.87, Inter-Quartile range 0.76-0.92, n=28 questions.
• For questions new to this round of audit: kappa median 0.78 Inter-Quartile range 0.66-0.85, n=28 questions.
Kappa levels were generally higher for patient characteristic and medication (sections 1, 2 and 6 of the proforma had the majority of kappa scores in the range 0.81-1.0) than for standards, which require a greater degree of scrutiny of case-notes (sections 3, 4, 5, 7 of the proforma had the majority of kappa scores in the range 0.61-0.80). Further details can be found in Appendix 3. Presentation of results Wherever possible the audit question numbers have been added within tables of results to facilitate reference to the full wording of questions in the audit tool in Appendix 2. A total of 34 duplicate cases were found and excluded from the dataset.

Section 2 Chapter 2 Key national results for 2006 and compared to previous rounds 79
Chapter 2 - Key National Results 2006 and Compared with Previous Rounds This section summarises changes in stroke care between the fourth round of the audit in 2004 and this round in 2006 (and where applicable 2001). The data have been summarised according to performance on key indicators (as described in the methods) and by domains of care. The former comprise a minimum dataset and the latter enables hospitals to identify broad areas of care (domains) on which to focus improvements. 2.1 Overall results for key process indicators in 2006 compared to 2004 and 2001
Provision of stroke unit care has improved significantly over the last five years, both as measured by the proportion of hospitals with a stroke unit (94% nationally) and in terms of the proportions of patients accessing them, which has improved dramatically since 2004 rising to 62% of all admissions. The proportion of patients managed on a stroke unit for the majority of their stay has doubled since 2001.
Access to physiotherapy and occupational therapy has also improved somewhat, although not proportionally as much.
Performance in the other key indicators was less impressive, not showing as much change as expected given the rise in stroke unit care. This raises the possibility that although more stroke beds are available they are not being resourced appropriately.
Table 1 Percentage compliance with key indicators all hospitals 2001 to 2006
*The question for 2006 differs from previously in that a much greater proportion of patients were regarded as applicable. The standard has therefore become more stringent.
Table gives % compliance with each indicator for applicable patients
National
2006 National
2004 National
2001
Patients 13625 8697 8200 Q1.7 Treated in a stroke unit during their stay 62 46 36 Q1.9 More than 50% of stay on a stroke unit 54 40 27
Q3.1 Screened for swallowing disorders within first 24 hours of admission 66 63 64
Q1.2iii Brain scan within 24 hours of stroke* 42 59 58 Q3.3 Commenced aspirin by 48 hours after stroke 71 68 65
Q3.5 Physiotherapy assessment within first 72 hours of admission 71 63 59
Q4.2 Assessment by an Occupational Therapist within 7 days of admission 68 57 51
Q5.1 Weighed at least once during admission 57 52 49 Q5.3 Mood assessed by discharge 55 47 52 Q6.3 On antithrombotic therapy by discharge 100 95 91
Q5.5 Rehabilitation goals agreed by the multi-disciplinary team 76 68 61
Q7.4 Home visit performed before discharge 63 69 73 Average for 12 indicators 65 61 57

Section 2 Chapter 2 Key national results for 2006 and compared to previous rounds 80
2.2 Site variation for key process indicators in 2006 (n=224 sites) There was considerable variability between sites in compliance for all but one of these key indicators. The box-plot below shows median, inter-quartile range and outlier site scores.
KEY 12
121110987654321
100
90
80
70
60
50
40
30
20
10
0
Figure 1 Variation between hospitals for key clinical indicators
Table 2 Percentage compliance with key indicators all hospitals median and interquartile range
ALL 224 sites
Table gives % compliance with each indicator, for applicable patients 25% sites
score below
Median score
25% of sites score
above 1 Q1.7 Treated in a stroke unit during their stay 47 66 80
2 Q1.9 More than 50% of stay on a stroke unit 39 58 71
3 Q3.1 Screened for swallowing disorders within first 24 hours of admission 53 67 81
4 Q1.2iii Brain scan within 24 hours of stroke 30 40 57
5 Q3.3 Commenced aspirin by 48 hours after stroke 59 73 87
6 Q3.5 Physiotherapy assessment within first 72 hours of admission 59 73 87
7 Q4.2 Assessment by an Occupational Therapist within 7 days of admission 47 70 88
8 Q5.1 Weighed at least once during admission 34 58 75
9 Q5.3 Mood assessed by discharge 33 56 76
10 Q6.3 On antithrombotic therapy by discharge All sites scored 100%
11 Q5.5 Rehabilitation goals agreed by the multi-disciplinary team 65 82 93
12 Q7.4 Home visit performed before discharge 47 67 84
KEY12 Average for 12 indicators for 2006 57 65 74

Section 2 Chapter 2 Key national results for 2006 and compared to previous rounds 81
2.3 Site variation for change in key process indicator score in 2004 compared to 2006 There is reasonable correlation between performance 2 years ago and performance in this audit (Spearman 0.50, P<0.001). Sites with better results in 2006 tended to be the ones with better results in 2004.
1009080706050403020100
KEY 12 process indicator score 2004
100
90
80
70
60
50
40
30
20
10
0
KEY
12
proc
ess
indi
cato
r 200
6
Figure 2 Change in key clinical indicator scores 2004-2006 for each hospital
2.4 Site variation for key process indicator score in 2006 compared to organisational score in 2006 There is reasonable correlation between the 12 key indicators and the performance in the 2006 organisational audit (Spearman 0.56, P<0.001). Sites with better process results in 2006 tended to be the ones with better organisation scores.
1009080706050403020100
2006 Total Organisation score
100
90
80
70
60
50
40
30
20
10
0
KEY
12
proc
ess
indi
cato
r sco
re 2
006
Figure 3 Variation between hospitals for key clinical indicator score in 2006 and
organisational score in 2006

Section 2 Chapter 2 Key national results for 2006 and compared to previous rounds 82
2.5 Site variation for process domain and total scores in 2006 (n=224 sites) The total number of standards of care was divided up into domains as in earlier audit rounds. Process domain scores were obtained as the simple average of compliance rates to standards within domains. The total process score was a simple average of domains scores. Standards within domains and the names of domains have been changed for the 2006 because the dataset was reduced. As with the 12 key indicator score, also shown below, there is considerable site variation in the process domain and total scores. The box-plot shows median, inter-quartile range and outlier site scores.
KEY 12TOTAL D5D4D3D2D1
100
90
80
70
60
50
40
30
20
10
0
Figure 4 Variation between hospitals clinical Domain Scores & Key 12 indicator score
Table 3 Median and Interquartile range of clinical domain scores and Key 12 indicator score
ALL sites 2006
Process of care
Domains
SITE VARIATION 25% sites score below
Median score
25% of
sites score above
D1 Initial patient assessment (4 standards) 57 66 75 D2 Multidisciplinary assessment (5) 54 66 79 D3 Screening & Functional assessment (3) 48 61 73 D4 Care planning (3) 64 74 86
D5 Communication with patients and carers (5) 53 67 81
Total (D1+D2+D3+D4+D5)/5 58 67 76 KEY12 Items as described earlier 57 65 74

Section 2 Chapter 2 Key national results for 2006 and compared to previous rounds 83
2.6 Site variation for process total and key process indicator scores in 2006 The 12 key process indicators are an strong correlate of performance overall (Spearman 0.88, P<0.001, n=224), providing reassurance that the data available to the Healthcare Commission and the public are a fair representation of overall performance using all the standards measured in this audit.
1009080706050403020100
KEY 12 process indicator score 2006
100
90
80
70
60
50
40
30
20
10
0
TOTA
L Pr
oces
s sc
ore
2006
Figure 5 Correlation between key indicator score and total score 2006 for all hospitals

Section 2 Chapter 2 Key national results for 2006 and compared to previous rounds 84
2.7 Compliance with standards for patients admitted to a stroke unit compared to those not admitted to a stroke unit
ALL 224 sites
Table gives % compliance with each indicator, for applicable patients 2006
% Patients admitted to stroke
unit (8383)
% Patients not
admitted to a stroke
unit (5242)
3 Q3.1 Screened for swallowing disorders within first 24 hours of admission 73 53
4 Q1.12iii Brain scan within 24 hours of stroke 45 38 5 Q3.3 Commenced aspirin by 48 hours
after stroke 74 66
6 Q3.5 Physiotherapy assessment within first 72 hours of admission 78 56
7 Q4.2 Assessment by an Occupational Therapist within 7 days of admission 74 51
8 Q5.1 Weighed at least once during admission 66 37
9 Q5.3 Mood assessed by discharge 64 36 10 Q6.3 On antithrombotic therapy by
discharge 100 100
11 Q5.5 Rehabilitation goals agreed by the multi-disciplinary team 86 50
12 Q7.4 Home visit performed before discharge 73 36
Getting patients to stroke units quickly facilitates acute care and multidisciplinary assessment. Ten of the twelve key indicators of care (admission to a stroke unit and majority of stay in a stroke unit were omitted as they - by definition - would be different in each group) were investigated to see if there was greater compliance for patients who were admitted to a stroke unit. Patients managed on a stroke unit had considerably better results than those who were not.

Section 2 Chapter 2 Key national results for 2006 and compared to previous rounds 85
2.8 Applicability and Compliance by standard in 2006 compared to previous rounds Table 4 Summary of applicability and compliance for all standards 2001-2006 and change between round 4 and round 5 % applicable % compliance
Standards 2006 2004 2001 2006 2004 2001 Change 04-06
Aspirin within 48 hours of stroke 73 67 66 71 68 65 +3 On an antithrombotic by discharge
86 66 63 100 95 91 +5
% admitted to a stroke unit during their stay 100 100 100 62 46 36 +16 % spending >50% of stay in a stroke unit 100 100 100 54 40 27 +14 (D1) Initial assessment Screen swallowing disorders 79 79 79 66 63 64 +3 Visual Fields 70 67 67 74 65 63 +9 Sensory testing 70 68 68 81 73 69 +8 Brain scan carried out within 24 hours of stroke 99 70 60 42 59 58 N/A
(D2) Multidisciplinary assessment Swallowing assessed by Speech and Language Therapist within 72 hours of admission
47 50 53 67 65 62 +2
Patient assessed by Physiotherapist within 72 hours of admission 83 82 81 71 63 59 +8
Initial assessment of communication problems by speech and language therapist within 7 days of admission
46 47 50 69 68 64 +1
Patient assessed by Occupational therapist within 7 days of admission 65 65 64 68 57 51 +11
Social work assessment within 7 days of referral 42 47 46 56 53 45 +3
(D3) Screening and Functional Assessment Patient weighed at least once during admission 84 83 82 57 52 49 +5
Evidence patient’s mood has been assessed 81 80 80 55 47 52 +8
Cognitive status assessed 80 80 Not asked 71 65 Not
asked +6
(D4) Care planning Written evidence that rehabilitation goals agreed by multidisciplinary team 68 67 68 76 68 61 +8
Plan to promote urinary continence? 31 28 36 54 58 63 -4
Receiving nutrition within 72 hours 87 Not asked
Not asked 93 Not
asked Not
asked N/A
(D5) Communication: Patients and carers Discussion with patient about diagnosis 65 66 69 70 -1 Discussion with patient about prognosis 64 66
70 59 63
63 -4
Discussion with patient about therapy goals Not asked 64 69 Not
asked 65 60 N/A
Carer needs for support assessed separately 50 59 62 68 43 41 +25 Skills taught to care for patient at home 23 24 25 71 63 60 +8 Home visit performed 28 31 32 63 69 73 -6 *The question for 2006 differs from previously in that a much greater proportion of patients were regarded as applicable. The standard has therefore become more stringent.

Section 2 Chapter 3 Key national results 2006 England Wales and N Ireland compared 86
Chapter 3 Key national results 2006 for England, Wales and Northern Ireland and In comparison with 2004 and 2001
3.1 Clinico-demographic results 2006
The three sites (67 patients) in the Channel Islands and Isle of Man are not shown in this section. This selection of results indicates a similar mix of audit patients for England, Wales, Northern Ireland and the Islands. Table 6 Comparison of patient characteristics in England, Wales and Northern Ireland Clinical Audit 2006
Comparisons by country
National England Wales N Ireland
Sites (Patients)
230 (13625)
196 (12231)
19 (925)
12 (402)
Gender -% male 48 48 49 48
Worst level of consciousness in first week - % Fully conscious
62 62 64 64
Worst level of consciousness in first week - % Unconscious
14 15 10 13
% newly institutionalised on discharge 12 13 7 7
% discharged Barthel score of 20 39 39 45 40
% discharged Barthel scores of <10 22 22 16 30
Mean (SD) Age 75 (13) 75 (13) 75 (12) 74 (13)
Median (IQR) age 78 (68-85)
78 (68-85)
77 (69-84)
75 (66-84)
Mean (median) LOS to discharge or death 25 (14) 25 (14) 29 (13) 27 (14)
Mean (median) LOS to discharge 28 (15) 27 (15) 30 (13) 28 (15)
Mean (median) LOS to death 19 (10) 18 (9) 25 (11) 22 (14)
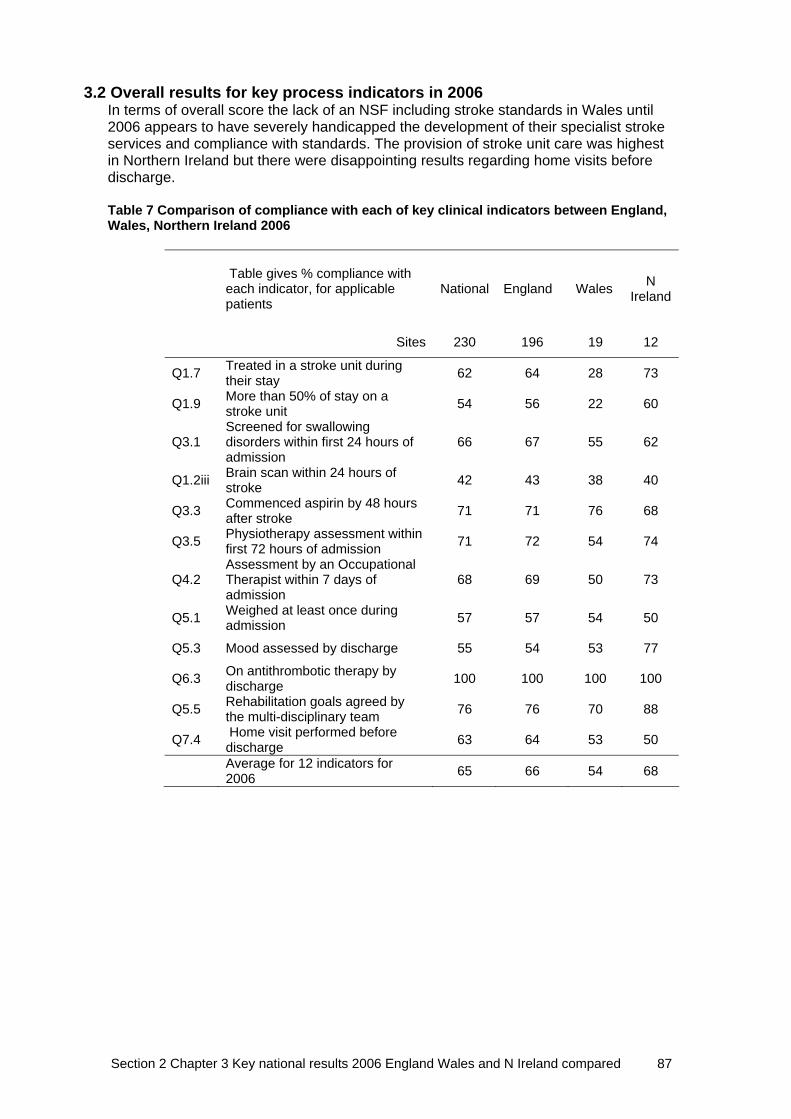
Section 2 Chapter 3 Key national results 2006 England Wales and N Ireland compared 87
3.2 Overall results for key process indicators in 2006 In terms of overall score the lack of an NSF including stroke standards in Wales until 2006 appears to have severely handicapped the development of their specialist stroke services and compliance with standards. The provision of stroke unit care was highest in Northern Ireland but there were disappointing results regarding home visits before discharge. Table 7 Comparison of compliance with each of key clinical indicators between England, Wales, Northern Ireland 2006
Table gives % compliance with each indicator, for applicable patients
National England Wales N Ireland
Sites 230 196 19 12
Q1.7 Treated in a stroke unit during their stay 62 64 28 73
Q1.9 More than 50% of stay on a stroke unit 54 56 22 60
Q3.1 Screened for swallowing disorders within first 24 hours of admission
66 67 55 62
Q1.2iii Brain scan within 24 hours of stroke 42 43 38 40
Q3.3 Commenced aspirin by 48 hours after stroke 71 71 76 68
Q3.5 Physiotherapy assessment within first 72 hours of admission 71 72 54 74
Q4.2 Assessment by an Occupational Therapist within 7 days of admission
68 69 50 73
Q5.1 Weighed at least once during admission 57 57 54 50
Q5.3 Mood assessed by discharge 55 54 53 77
Q6.3 On antithrombotic therapy by discharge 100 100 100 100
Q5.5 Rehabilitation goals agreed by the multi-disciplinary team 76 76 70 88
Q7.4 Home visit performed before discharge 63 64 53 50
Average for 12 indicators for 2006 65 66 54 68

Section 2 Chapter 3 Key national results 2006 England Wales and N Ireland compared 88
3.3 Site variation for key process indicator score in 2006 (n=224 sites)
The site variation box-plot below shows median, inter-quartile range and outlier site scores by country. This confirms the overall message of broad similarity between countries, and the slightly worse set of scores for Wales reflects its relative lack of stroke unit provision.
WalesN IrelandEngland
100
90
80
70
60
50
40
30
20
10
0
KEY
12
indi
cato
r sco
re 2
006
Figure 6 Comparison of median and IQR 12 key clinical indicator score compliance
between England, Wales and Northern Ireland 2006
3.4 Site variation for process domain and total scores in 2006 (n=224 sites) Domain scores were obtained as the simple average of compliance rates to all standards within each domain. The total process score was a simple average of domain scores. As with the 12 key indicator score, the results show similarity between country and considerable site variation within country. Table 8 Comparison of median and IQR for Domain scores in England, Wales and Northern Ireland 2006
2006 Process of care
SITE VARIATION – table gives median (IQR) scores National
(224 sites) England
(190 sites) Wales
(19 sites) N Ireland (12 sites)
D1 Initial patient assessment 66 (57-75) 67 (58-76) 59 (47-74) 66 (55-73) D2 Multidisciplinary assessment 66 (54-79) 67 (54-79) 56 (48-70) 77 (60-82)
D3 Screening & Functional assessment 61 (48-73) 60 (48-73) 59 (42-79) 68 (61-79)
D4 Care planning 74 (64-86) 74 (64-86) 76 (58-88) 84 (78-89)
D5 Communication with patients & carers 67 (53-81) 67 (54-81) 64 (51-88) 70 (53-82)
Total (D1+D2+D3+D4+D5)/5 67 (58-76) 67 (58-76) 63 (50-76) 73 (66-76) KEY12 Key 12 items as described earlier 65 (57-74) 67 (57-75) 57 (46-63) 66 (61-75)

Section 2 Chapter 3 Key national results 2006 England Wales and N Ireland compared 89
3.5 Comparison of results in England from 2001-6 England has improved over the last five years in all the 12 standards apart from access to home visits but given the improvement in speed of access to occupational therapists, deterioration in home visiting is difficult to explain. The change in the level of brain scanning must be interpreted in the light of the change in the way this question was asked. Table 9 Comparison of change in key indicator score for hospitals in England between 2001, 2004 and 2006
3.6 Comparison of results in Wales from 2001-6 The late launch of a National Service Framework including stroke standards in Wales appears to have handicapped the development of specialist stroke services in Wales. Table 10 Comparison of change in key indicator score for hospitals in Wales 2001- 2006
*The question for 2006 differs from previously in that a much greater proportion of patients were regarded as applicable. The standard has therefore become more stringent.
Table gives % compliance with each indicator, for applicable patients
England 2006
England 2004
England 2001
Patients 12231 7619 7238 Q1.7 Treated in a stroke unit during their stay 64 47 36 Q1.9 More than 50% of stay on a stroke unit 56 41 27
Q3.1 Screened for swallowing disorders within first 24 hours of admission 67 64 64
Q1.2iii Brain scan within 24 hours of stroke* 43 59 57 Q3.3 Commenced aspirin by 48 hours after stroke 71 68 64
Q3.5 Physiotherapy assessment within first 72 hours of admission 72 65 59
Q4.2 Assessment by an Occupational Therapist within 7 days of admission 69 57 49
Q5.1 Weighed at least once during admission 57 52 48 Q5.3 Mood assessed by discharge 54 46 50 Q6.3 On antithrombotic therapy by discharge 100 95 91
Q5.5 Rehabilitation goals agreed by the multi-disciplinary team 76 69 61
Q7.4 Home visit performed before discharge 64 70 73 Average for 12 indicators 66 61 57
Table gives % compliance with each indicator, for applicable patients
Wales 2006
Wales 2004
Wales 2001
Patients 925 667 530 Q1.7 Treated in a stroke unit during their stay 28 28 22 Q1.9 More than 50% of stay on a stroke unit 22 23 17
Q3.1 Screened for swallowing disorders within first 24 hours of admission 55 51 60
Q1.2iii Brain scan within 24 hours of stroke* 38 62 60 Q3.3 Commenced aspirin by 48 hours after stroke 76 73 72
Q3.5 Physiotherapy assessment within first 72 hours of admission 54 49 58
Q4.2 Assessment by an Occupational Therapist within 7 days of admission 50 55 62
Q5.1 Weighed at least once during admission 54 51 56 Q5.3 Mood assessed by discharge 53 47 52 Q6.3 On antithrombotic therapy by discharge 100 97 91
Q5.5 Rehabilitation goals agreed by the multi-disciplinary team 70 67 58
Q7.4 Home visit performed before discharge 53 69 80 Average for 12 indicators 54 56 57

Section 2 Chapter 3 Key national results 2006 England Wales and N Ireland compared 90
3.7 Comparison of results in Northern Ireland from 2001-6 Northern Ireland has consistently out-performed England and Wales in the stroke audits since the first round in 1998. However the results this time show a disappointing failure to improve on 2001 levels in some of the key measures particularly in areas of commencing aspirin within 48 hours of stroke and home visit. Table 11 Comparison of change in key indicator score for hospitals in Northern Ireland between 2001, 2004 and 2006
*The question for 2006 differs from previously in that a much greater proportion of patients were regarded as applicable. The standard has therefore become more stringent.
3.8 Site variation for key process indicator score in 2006 compared to 2004
Overall standards of care appear only to have improved since 2004 for England and Northern Ireland.
WalesN IrelandEngland
100
90
80
70
60
50
40
30
20
10
0 20062004
Figure 7 Changes in mean, median, IQR total scores for each hospital in England,
Wales and Northern Ireland between 2004 and 2006
Table gives % compliance with each indicator, for applicable patients
N Ireland 2006
N Ireland 2004
N Ireland 2001
Patients 402 350 372 Q1.7 Treated in a stroke unit during their stay 73 62 57 Q1.9 More than 50% of stay on a stroke unit 60 55 46
Q3.1 Screened for swallowing disorders within 24 hrs of admission 62 66 66
Q1.2iii Brain scan within 24 hours of stroke* 40 59 59 Q3.3 Commenced aspirin by 48 hours after stroke 68 63 74
Q3.5 Physiotherapy assessment within first 72 hours of admission 74 59 66
Q4.2 Assessment by an Occupational Therapist within 7 days of admission 73 67 67
Q5.1 Weighed at least once during admission 50 49 50 Q5.3 Mood assessed by discharge 77 53 74 Q6.3 On antithrombotic therapy by discharge 100 98 91
Q5.5 Rehabilitation goals agreed by the multi-disciplinary team 88 58 63
Q7.4 Home visit performed before discharge 50 50 68 Average for 12 indicators 68 62 65
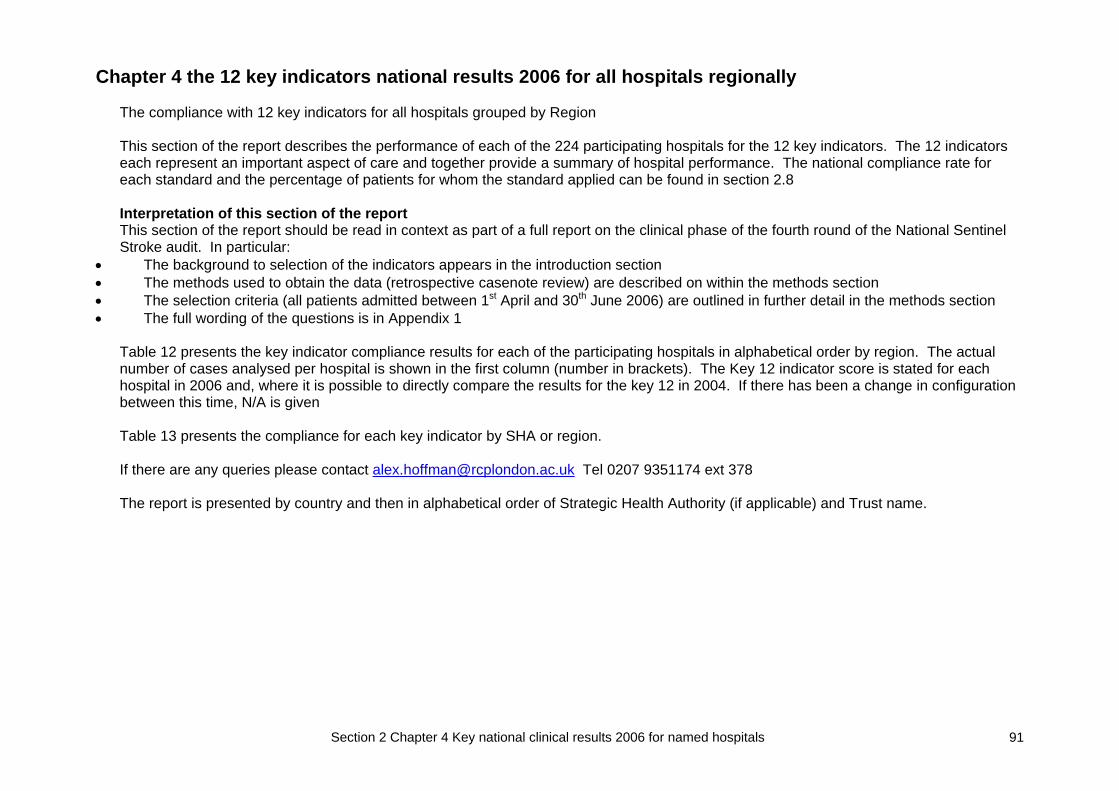
Section 2 Chapter 4 Key national clinical results 2006 for named hospitals 91
Chapter 4 the 12 key indicators national results 2006 for all hospitals regionally The compliance with 12 key indicators for all hospitals grouped by Region This section of the report describes the performance of each of the 224 participating hospitals for the 12 key indicators. The 12 indicators each represent an important aspect of care and together provide a summary of hospital performance. The national compliance rate for each standard and the percentage of patients for whom the standard applied can be found in section 2.8 Interpretation of this section of the report This section of the report should be read in context as part of a full report on the clinical phase of the fourth round of the National Sentinel Stroke audit. In particular:
• The background to selection of the indicators appears in the introduction section • The methods used to obtain the data (retrospective casenote review) are described on within the methods section • The selection criteria (all patients admitted between 1st April and 30th June 2006) are outlined in further detail in the methods section • The full wording of the questions is in Appendix 1
Table 12 presents the key indicator compliance results for each of the participating hospitals in alphabetical order by region. The actual number of cases analysed per hospital is shown in the first column (number in brackets). The Key 12 indicator score is stated for each hospital in 2006 and, where it is possible to directly compare the results for the key 12 in 2004. If there has been a change in configuration between this time, N/A is given Table 13 presents the compliance for each key indicator by SHA or region. If there are any queries please contact [email protected] Tel 0207 9351174 ext 378 The report is presented by country and then in alphabetical order of Strategic Health Authority (if applicable) and Trust name.

Section 2 Chapter 4 Key national clinical results 2006 for named hospitals 92
KEY CLINICAL AUDIT INDICATORS FOR ALL HOSPITALS REGIONALLY Table 12 Key clinical audit indicator scores for all hospitals in the 2006 audit
Trust name (site name)
Num
ber o
f cas
es in
the
audi
t
Patie
nts
trea
ted
in a
St
roke
Uni
t
Patie
nts
trea
ted
for >
50%
of
sta
y in
Str
oke
Uni
t Sc
reen
ing
for s
wal
low
ing
diso
rder
s <
24 h
ours
af
ter a
dmis
sion
B
rain
sca
n w
ithin
24
hour
s
Asp
irin
by 4
8 ho
urs
afte
r st
roke
Ph
ysio
ther
apis
t as
sess
men
t with
in 7
2 ho
urs
of a
dmis
sion
OT
asse
ssm
ent w
ithin
7
days
of a
dmis
sion
Patie
nt w
eigh
ed d
urin
g ad
mis
sion
Patie
nt's
moo
d as
sess
ed
by d
isch
arge
Pa
tient
on
antit
hrom
botic
ther
apy
by d
isch
arge
R
ehab
ilita
tion
goal
s ag
reed
by
the
mul
ti-di
scip
linar
y te
am
Hom
e vi
sit p
erfo
rmed
be
fore
dis
char
ge
2006
key
12
indi
cato
r sc
ore
2004
key
12
indi
cato
r sc
ore
All Hospitals (sites) overall 62 54 66 42 71 71 68 57 55 100 76 63 65 61 ENGLAND EAST MIDLANDS SHA Chesterfield Royal Hospital NHS Foundation Trust 62 56 55 81 44 57 67 43 34 14 100 63 30 54 58 Derby Hospitals NHS Foundation Trust 80 45 43 46 33 76 56 64 73 56 100 44 50 57 51 Kettering General Hospital NHS Trust 80 0 0 31 73 69 38 24 19 3 100 8 6 31 55 Northampton General Hospital NHS Trust 56 39 32 44 63 72 67 81 32 83 100 75 93 65 61 Nottingham University Hospital NHS Trust 146 70 68 72 28 84 69 77 74 62 100 88 38 69 N/A Sherwood Forest Hospitals NHS Trust 76 51 30 58 36 66 48 25 23 83 100 55 53 52 65 United Lincolnshire Hospitals NHS Trust (Grantham and District Hospital) 28 39 29 54 39 43 95 83 55 70 100 100 100 67 25
United Lincolnshire Hospitals NHS Trust (Lincoln County) 40 60 58 50 25 28 68 76 69 59 100 95 45 61 58 United Lincolnshire Hospitals NHS Trust (Louth County Hospital) 20 80 80 89 11 86 94 100 32 29 100 93 100 74 65
United Lincolnshire Hospitals NHS Trust (Pilgrim Hospital) 69 46 36 47 22 69 50 47 66 56 100 63 22 52 42 University Hospitals of Leicester NHS Trust 68 78 76 68 57 64 85 66 79 39 100 96 64 73 60 EAST MIDLANDS SHA overall 725 51 46 57 40 69 62 59 53 51 100 66 45 58 56 EAST OF ENGLAND SHA Basildon & Thurrock University Hospitals NHS Foundation Trust 66 35 32 42 30 42 56 39 60 78 100 51 60 52 63
Bedford Hospital NHS Trust 51 35 33 72 24 56 87 94 53 16 100 86 73 61 53 Cambridge University Hospitals NHS Foundation Trust 73 81 75 84 70 96 95 98 75 69 100 92 25 80 71

Section 2 Chapter 4 Key national clinical results 2006 for named hospitals 93
Trust name (site name)
Num
ber o
f cas
es in
the
audi
t
Patie
nts
trea
ted
in a
St
roke
Uni
t
Patie
nts
trea
ted
for >
50%
of
sta
y in
Str
oke
Uni
t Sc
reen
ing
for s
wal
low
ing
diso
rder
s <
24 h
ours
af
ter a
dmis
sion
B
rain
sca
n w
ithin
24
hour
s
Asp
irin
by 4
8 ho
urs
afte
r st
roke
Ph
ysio
ther
apis
t as
sess
men
t with
in 7
2 ho
urs
of a
dmis
sion
OT
asse
ssm
ent w
ithin
7
days
of a
dmis
sion
Patie
nt w
eigh
ed d
urin
g ad
mis
sion
Patie
nt's
moo
d as
sess
ed
by d
isch
arge
Pa
tient
on
antit
hrom
botic
ther
apy
by d
isch
arge
R
ehab
ilita
tion
goal
s ag
reed
by
the
mul
ti-di
scip
linar
y te
am
Hom
e vi
sit p
erfo
rmed
be
fore
dis
char
ge
2006
key
12
indi
cato
r sc
ore
2004
key
12
indi
cato
r sc
ore
All Hospitals (sites) overall 62 54 66 42 71 71 68 57 55 100 76 63 65 61 East & North Hertfordshire NHS Trust (Lister Hospital) 53 40 34 73 43 55 65 29 62 27 100 45 40 51 51 East and North Hertfordshire NHS Trust (Queen Elizabeth II Hospital) 50 24 14 61 42 60 43 8 53 16 100 50 60 44 44
Essex Rivers Healthcare NHS Trust 74 59 53 46 34 40 57 53 79 50 100 69 69 59 59 Hinchingbrooke Health Care NHS Trust 46 22 20 73 22 67 74 43 85 33 100 92 80 59 47 Ipswich Hospital NHS Trust 80 63 60 86 11 60 59 65 60 57 100 100 58 65 53 James Paget University Hospitals NHS Foundation Trust 80 55 48 23 15 41 63 63 71 77 100 63 72 58 48 Luton and Dunstable Hospital NHS Foundation Trust 78 59 50 69 47 56 65 52 96 15 100 69 75 63 59 Mid Essex Hospital Services NHS Trust 80 85 83 69 38 70 81 91 84 50 100 92 100 79 54 Norfolk & Norwich University Hospital NHS Trust 80 65 39 53 18 68 73 53 31 53 100 71 58 57 58 Peterborough and Stamford Hospitals NHS Foundation Trust 80 69 65 75 34 40 72 92 82 15 100 84 38 64 79
Princess Alexandra Hospital NHS Trust 66 76 71 67 53 51 76 69 86 67 100 94 63 73 75 Southend University Hospital NHS Foundation Trust 71 32 31 93 39 83 82 96 31 72 100 73 71 67 45 The Queen Elizabeth Hospital King's Lynn NHS Trust 58 74 69 57 29 59 74 86 71 64 100 73 70 69 48 West Hertfordshire Hospitals NHS Trust (Hemel Hempstead Hospital) 55 93 89 72 38 88 96 95 27 50 100 95 100 79 48
West Hertfordshire Hospitals NHS Trust (Watford General Hospital) 71 82 79 98 76 98 98 100 56 66 100 98 100 88 81
West Suffolk Hospitals NHS Trust 73 68 60 50 40 93 43 30 52 61 100 78 63 61 69 EAST OF ENGLAND SHA overall 60 54 67 37 65 71 69 65 50 100 79 62 65 59

Section 2 Chapter 4 Key national clinical results 2006 for named hospitals 94
Trust name (site name)
Num
ber o
f cas
es in
the
audi
t
Patie
nts
trea
ted
in a
St
roke
Uni
t
Patie
nts
trea
ted
for >
50%
of
sta
y in
Str
oke
Uni
t Sc
reen
ing
for s
wal
low
ing
diso
rder
s <
24 h
ours
af
ter a
dmis
sion
B
rain
sca
n w
ithin
24
hour
s
Asp
irin
by 4
8 ho
urs
afte
r st
roke
Ph
ysio
ther
apis
t as
sess
men
t with
in 7
2 ho
urs
of a
dmis
sion
OT
asse
ssm
ent w
ithin
7
days
of a
dmis
sion
Patie
nt w
eigh
ed d
urin
g ad
mis
sion
Patie
nt's
moo
d as
sess
ed
by d
isch
arge
Pa
tient
on
antit
hrom
botic
ther
apy
by d
isch
arge
R
ehab
ilita
tion
goal
s ag
reed
by
the
mul
ti-di
scip
linar
y te
am
Hom
e vi
sit p
erfo
rmed
be
fore
dis
char
ge
2006
key
12
indi
cato
r sc
ore
2004
key
12
indi
cato
r sc
ore
All Hospitals (sites) overall 62 54 66 42 71 71 68 57 55 100 76 63 65 61 LONDON SHA Barking Havering and Redbridge Hospitals NHS Trust (King George) 45 16 16 95 60 83 77 69 58 50 100 58 47 61 52
Barking, Havering & Redbridge Hospitals NHS Trust (Oldchurch & Harold Wood hospitals in collaboration with Havering PCT)
81 27 26 87 65 86 72 78 55 55 100 68 59 65 N/A
Barnet and Chase Farm Hospitals NHS Trust (Barnet Hospital), Barnet PCT and Finchley Memorial Hospital 59 81 71 68 51 94 96 98 90 78 100 91 93 84 72
Barnet and Chase Farm Hospitals NHS Trust (Chase Farm Hospital) 62 73 68 74 81 91 88 87 68 54 100 96 79 80 59
Barts and The London NHS Trust jointly with Tower Hamlets PCT 51 96 88 88 65 95 78 100 86 81 100 100 100 90 78
Bromley Hospitals NHS Trust 76 37 34 47 25 89 28 22 48 56 100 85 36 51 56 Chelsea and Westminster Hospital NHS Foundation Trust 49 86 78 79 84 95 98 97 70 76 100 95 100 88 82 Ealing Hospital NHS Trust 62 69 58 92 52 91 83 42 100 15 100 4 91 66 67 Epsom and St Helier University Hospitals NHS Trust (Epsom Hospital) 62 58 53 51 20 64 17 10 72 20 100 35 40 45 41
Epsom and St Helier University Hospitals NHS Trust (St Helier Hospital) 59 73 69 78 22 96 49 68 69 76 100 72 86 71 69
Guy's & St Thomas' Hospital NHS Foundation Trust 79 95 92 94 82 95 97 87 74 90 100 98 87 91 86 Hammersmith Hospitals NHS Trust 79 59 44 55 54 86 76 68 96 56 100 69 75 70 N/A Hillingdon Hospital NHS Trust 54 78 67 31 61 90 88 88 84 20 100 79 62 71 70 Homerton University Hospital NHS Foundation Trust 39 72 72 63 64 90 78 47 82 68 100 77 95 76 68 King's College Hospital NHS Trust 64 78 72 79 79 98 75 94 53 56 100 74 67 77 68 Kingston Hospital NHS Trust 40 58 55 55 43 81 64 87 44 35 100 75 45 62 38 Lewisham Hospital NHS Trust 79 82 82 73 63 89 91 55 60 27 100 98 81 75 56 Mayday Healthcare NHS Trust 46 46 41 40 30 82 53 68 34 64 100 86 78 60 67

Section 2 Chapter 4 Key national clinical results 2006 for named hospitals 95
Trust name (site name)
Num
ber o
f cas
es in
the
audi
t
Patie
nts
trea
ted
in a
St
roke
Uni
t
Patie
nts
trea
ted
for >
50%
of
sta
y in
Str
oke
Uni
t Sc
reen
ing
for s
wal
low
ing
diso
rder
s <
24 h
ours
af
ter a
dmis
sion
B
rain
sca
n w
ithin
24
hour
s
Asp
irin
by 4
8 ho
urs
afte
r st
roke
Ph
ysio
ther
apis
t as
sess
men
t with
in 7
2 ho
urs
of a
dmis
sion
OT
asse
ssm
ent w
ithin
7
days
of a
dmis
sion
Patie
nt w
eigh
ed d
urin
g ad
mis
sion
Patie
nt's
moo
d as
sess
ed
by d
isch
arge
Pa
tient
on
antit
hrom
botic
ther
apy
by d
isch
arge
R
ehab
ilita
tion
goal
s ag
reed
by
the
mul
ti-di
scip
linar
y te
am
Hom
e vi
sit p
erfo
rmed
be
fore
dis
char
ge
2006
key
12
indi
cato
r sc
ore
2004
key
12
indi
cato
r sc
ore
All Hospitals (sites) overall 62 54 66 42 71 71 68 57 55 100 76 63 65 61 Newham University Hospital NHS Trust 57 72 53 83 67 100 66 80 56 24 100 71 77 71 57 North Middlesex University Hospital NHS Trust - Jointly with Haringey PCT 47 53 47 69 70 94 67 84 76 31 100 81 42 68 47
North West London Hospitals NHS Trust (Central Middlesex Hospital including Willesden Community hospital (Brent PCT))
43 81 70 55 65 82 90 94 58 37 100 76 100 76 51
North West London Hospitals NHS Trust (Northwick Park Hospital) 64 50 50 82 36 91 85 91 55 20 100 63 93 68 72
Queen Elizabeth Hospital NHS Trust 38 68 61 57 45 63 70 57 17 0 100 33 85 55 64 Queen Mary's Sidcup NHS Trust 33 42 39 45 39 82 57 30 26 25 100 62 35 49 61 Royal Free Hampstead NHS Trust 45 87 80 92 58 100 91 100 83 80 100 100 100 89 93 St George's Healthcare NHS Trust 71 99 66 92 63 92 82 95 99 95 100 100 75 88 84 St Mary's NHS Trust 51 82 76 86 80 97 93 78 96 86 100 100 54 86 89 University College London Hospitals NHS Foundation Trust 30 87 87 59 83 100 85 100 69 80 100 96 50 83 83 West Middlesex University Hospital NHS Trust 52 54 40 59 77 85 49 52 44 52 100 72 100 65 68 Whipps Cross University Hospital NHS Trust 72 53 47 64 56 95 64 82 46 87 100 68 78 70 45 Whittington Hospital NHS Trust 38 79 71 86 50 81 88 88 76 57 100 94 92 80 61 LONDON SHA overall 67 60 72 58 89 74 75 68 55 100 77 73 72 66
NORTH EAST SHA City Hospitals Sunderland NHS Foundation Trust 79 87 77 49 42 62 41 49 28 23 100 87 77 60 55 County Durham and Darlington Acute Hospitals NHS Trust (Bishop Auckland) 49 80 76 77 39 93 79 85 90 83 100 94 94 82 68
County Durham and Darlington Acute Hospitals NHS Trust (Darlington Memorial) 62 15 11 67 27 49 70 45 47 24 100 25 38 43 55
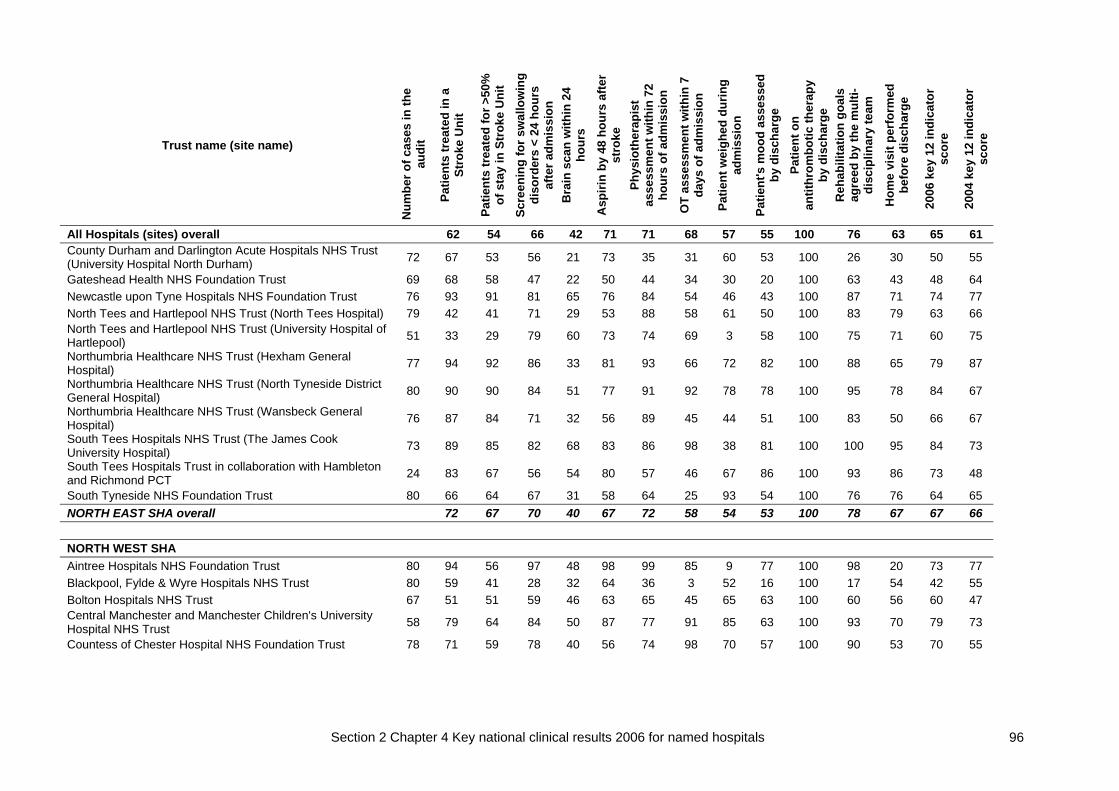
Section 2 Chapter 4 Key national clinical results 2006 for named hospitals 96
Trust name (site name)
Num
ber o
f cas
es in
the
audi
t
Patie
nts
trea
ted
in a
St
roke
Uni
t
Patie
nts
trea
ted
for >
50%
of
sta
y in
Str
oke
Uni
t Sc
reen
ing
for s
wal
low
ing
diso
rder
s <
24 h
ours
af
ter a
dmis
sion
B
rain
sca
n w
ithin
24
hour
s
Asp
irin
by 4
8 ho
urs
afte
r st
roke
Ph
ysio
ther
apis
t as
sess
men
t with
in 7
2 ho
urs
of a
dmis
sion
OT
asse
ssm
ent w
ithin
7
days
of a
dmis
sion
Patie
nt w
eigh
ed d
urin
g ad
mis
sion
Patie
nt's
moo
d as
sess
ed
by d
isch
arge
Pa
tient
on
antit
hrom
botic
ther
apy
by d
isch
arge
R
ehab
ilita
tion
goal
s ag
reed
by
the
mul
ti-di
scip
linar
y te
am
Hom
e vi
sit p
erfo
rmed
be
fore
dis
char
ge
2006
key
12
indi
cato
r sc
ore
2004
key
12
indi
cato
r sc
ore
All Hospitals (sites) overall 62 54 66 42 71 71 68 57 55 100 76 63 65 61 County Durham and Darlington Acute Hospitals NHS Trust (University Hospital North Durham) 72 67 53 56 21 73 35 31 60 53 100 26 30 50 55
Gateshead Health NHS Foundation Trust 69 68 58 47 22 50 44 34 30 20 100 63 43 48 64 Newcastle upon Tyne Hospitals NHS Foundation Trust 76 93 91 81 65 76 84 54 46 43 100 87 71 74 77 North Tees and Hartlepool NHS Trust (North Tees Hospital) 79 42 41 71 29 53 88 58 61 50 100 83 79 63 66 North Tees and Hartlepool NHS Trust (University Hospital of Hartlepool) 51 33 29 79 60 73 74 69 3 58 100 75 71 60 75
Northumbria Healthcare NHS Trust (Hexham General Hospital) 77 94 92 86 33 81 93 66 72 82 100 88 65 79 87
Northumbria Healthcare NHS Trust (North Tyneside District General Hospital) 80 90 90 84 51 77 91 92 78 78 100 95 78 84 67
Northumbria Healthcare NHS Trust (Wansbeck General Hospital) 76 87 84 71 32 56 89 45 44 51 100 83 50 66 67
South Tees Hospitals NHS Trust (The James Cook University Hospital) 73 89 85 82 68 83 86 98 38 81 100 100 95 84 73
South Tees Hospitals Trust in collaboration with Hambleton and Richmond PCT 24 83 67 56 54 80 57 46 67 86 100 93 86 73 48
South Tyneside NHS Foundation Trust 80 66 64 67 31 58 64 25 93 54 100 76 76 64 65 NORTH EAST SHA overall 72 67 70 40 67 72 58 54 53 100 78 67 67 66 NORTH WEST SHA Aintree Hospitals NHS Foundation Trust 80 94 56 97 48 98 99 85 9 77 100 98 20 73 77 Blackpool, Fylde & Wyre Hospitals NHS Trust 80 59 41 28 32 64 36 3 52 16 100 17 54 42 55 Bolton Hospitals NHS Trust 67 51 51 59 46 63 65 45 65 63 100 60 56 60 47 Central Manchester and Manchester Children's University Hospital NHS Trust 58 79 64 84 50 87 77 91 85 63 100 93 70 79 73
Countess of Chester Hospital NHS Foundation Trust 78 71 59 78 40 56 74 98 70 57 100 90 53 70 55

Section 2 Chapter 4 Key national clinical results 2006 for named hospitals 97
Trust name (site name)
Num
ber o
f cas
es in
the
audi
t
Patie
nts
trea
ted
in a
St
roke
Uni
t
Patie
nts
trea
ted
for >
50%
of
sta
y in
Str
oke
Uni
t Sc
reen
ing
for s
wal
low
ing
diso
rder
s <
24 h
ours
af
ter a
dmis
sion
B
rain
sca
n w
ithin
24
hour
s
Asp
irin
by 4
8 ho
urs
afte
r st
roke
Ph
ysio
ther
apis
t as
sess
men
t with
in 7
2 ho
urs
of a
dmis
sion
OT
asse
ssm
ent w
ithin
7
days
of a
dmis
sion
Patie
nt w
eigh
ed d
urin
g ad
mis
sion
Patie
nt's
moo
d as
sess
ed
by d
isch
arge
Pa
tient
on
antit
hrom
botic
ther
apy
by d
isch
arge
R
ehab
ilita
tion
goal
s ag
reed
by
the
mul
ti-di
scip
linar
y te
am
Hom
e vi
sit p
erfo
rmed
be
fore
dis
char
ge
2006
key
12
indi
cato
r sc
ore
2004
key
12
indi
cato
r sc
ore
All Hospitals (sites) overall 62 54 66 42 71 71 68 57 55 100 76 63 65 61 East Cheshire NHS Trust 68 74 59 89 31 38 59 34 53 56 100 76 69 61 65 East Lancashire Hospitals NHS Trust (Blackburn Hyndburn & Ribble Valley) 67 30 25 74 34 67 56 78 67 43 100 87 55 60 51
East Lancashire Hospitals NHS Trust (Burnley Health Care NHS Trust) 74 58 54 38 30 35 45 24 48 33 100 72 44 48 40
Lancashire Teaching Hospitals NHS Foundation Trust (Royal Preston Hospital) 57 30 18 58 29 57 34 23 30 46 100 65 52 45 58
Lancashire Teaching Hospitals NHS Foundation Trust (Chorley and South Ribble) 57 2 0 31 33 41 31 35 2 10 100 18 67 31 48
Mid Cheshire Hospitals NHS Trust 64 66 64 93 56 92 98 93 88 88 100 100 100 87 65 Morecambe Bay Hospitals NHS Trust (Furness General Hospital) 33 91 52 69 50 83 89 83 75 25 100 81 60 71 56
Morecambe Bay Hospitals NHS Trust (Royal Lancaster Infirmary) 50 48 44 53 18 78 54 30 11 49 100 88 58 53 54
Morecambe Bay Hospitals NHS Trust (Westmorland General Hospital) 36 86 61 90 8 90 68 84 76 76 100 78 80 75 79
North Cheshire Hospitals NHS Trust 102 87 83 61 38 59 88 70 52 78 100 94 89 75 N/A North Cumbria Acute Hospitals NHS Trust (Cumberland Infirmary) 66 53 14 87 66 70 73 85 70 68 100 100 67 71 62
North Cumbria Acute Hospitals NHS Trust (West Cumberland Hospital) 46 54 37 67 65 52 51 43 47 41 100 96 79 61 56
Pennine Acute Hospitals NHS Trust (Fairfield General Hospital) 50 96 88 88 69 100 93 97 93 98 100 100 94 93 49
Pennine Acute Hospitals NHS Trust (North Manchester General) 61 80 44 79 35 88 81 70 64 63 100 98 96 75 39
Pennine Acute Hospitals NHS Trust (Rochdale Infirmary) 32 69 66 84 81 86 18 81 70 70 100 93 65 73 38 Pennine Acute Hospitals NHS Trust (Royal Oldham Hospital) 57 74 70 59 40 35 80 16 62 41 100 73 29 57 27

Section 2 Chapter 4 Key national clinical results 2006 for named hospitals 98
Trust name (site name)
Num
ber o
f cas
es in
the
audi
t
Patie
nts
trea
ted
in a
St
roke
Uni
t
Patie
nts
trea
ted
for >
50%
of
sta
y in
Str
oke
Uni
t Sc
reen
ing
for s
wal
low
ing
diso
rder
s <
24 h
ours
af
ter a
dmis
sion
B
rain
sca
n w
ithin
24
hour
s
Asp
irin
by 4
8 ho
urs
afte
r st
roke
Ph
ysio
ther
apis
t as
sess
men
t with
in 7
2 ho
urs
of a
dmis
sion
OT
asse
ssm
ent w
ithin
7
days
of a
dmis
sion
Patie
nt w
eigh
ed d
urin
g ad
mis
sion
Patie
nt's
moo
d as
sess
ed
by d
isch
arge
Pa
tient
on
antit
hrom
botic
ther
apy
by d
isch
arge
R
ehab
ilita
tion
goal
s ag
reed
by
the
mul
ti-di
scip
linar
y te
am
Hom
e vi
sit p
erfo
rmed
be
fore
dis
char
ge
2006
key
12
indi
cato
r sc
ore
2004
key
12
indi
cato
r sc
ore
All Hospitals (sites) overall 62 54 66 42 71 71 68 57 55 100 76 63 65 61 Royal Liverpool & Broadgreen University Hospitals NHS Trust 79 76 59 60 34 56 73 85 55 42 100 82 75 66 59
Salford Royal NHS Foundation Trust 81 84 81 86 64 78 92 97 78 83 100 44 85 81 63 South Manchester University Hospitals NHS Trust 80 98 90 77 66 72 67 46 88 99 100 94 100 83 90 Southport and Ormskirk Hospital NHS Trust 80 53 48 60 28 68 90 96 31 83 100 96 90 70 75 St Helens & Knowsley Hospitals NHS Trust 80 75 73 53 33 74 64 88 24 63 100 100 69 68 65 Stockport NHS Foundation Trust 79 61 58 47 35 61 69 89 38 38 100 89 95 65 64 Tameside and Glossop Acute Services 52 40 37 32 25 22 8 22 71 55 100 62 26 42 52 Trafford Healthcare NHS Trust 32 0 0 52 38 42 21 70 59 12 100 43 77 43 48 Wirral Hospital NHS Trust 80 56 50 80 41 44 64 68 64 58 100 90 57 64 63 Wrightington, Wigan and Leigh NHS Trust 73 53 44 62 22 68 78 42 38 63 100 79 71 60 56 NORTH WEST SHA overall 64 53 67 41 65 67 66 55 59 100 80 68 66 58
SOUTH CENTRAL SHA Buckinghamshire Hospitals NHS Trust (Amersham & Wycombe Hospitals) 66 68 59 55 32 56 82 60 82 30 100 48 55 61 53
Buckinghamshire Hospitals NHS Trust (Stoke Mandeville Hospital) 36 58 47 86 39 58 41 67 58 59 100 35 56 59 41
East Hampshire Primary Care Trust jointly with Portsmouth Hospitals NHS Trust 78 64 54 60 31 47 81 42 39 57 100 84 68 61 71
Heatherwood & Wexham Park Hospitals 50 90 86 68 43 90 88 93 2 37 100 37 65 67 74 Isle of Wight Healthcare NHS Trust 77 45 44 77 55 53 94 67 71 78 100 93 88 72 56 Milton Keynes General NHS Trust 44 66 61 84 70 95 86 94 79 30 100 70 70 75 64 North Hampshire Hospitals NHS Trust 35 80 60 61 29 80 72 45 76 16 100 95 88 67 80 Oxford Radcliffe Hospitals NHS Trust 80 44 39 52 63 92 62 81 22 67 100 93 29 62 N/A

Section 2 Chapter 4 Key national clinical results 2006 for named hospitals 99
Trust name (site name)
Num
ber o
f cas
es in
the
audi
t
Patie
nts
trea
ted
in a
St
roke
Uni
t
Patie
nts
trea
ted
for >
50%
of
sta
y in
Str
oke
Uni
t Sc
reen
ing
for s
wal
low
ing
diso
rder
s <
24 h
ours
af
ter a
dmis
sion
B
rain
sca
n w
ithin
24
hour
s
Asp
irin
by 4
8 ho
urs
afte
r st
roke
Ph
ysio
ther
apis
t as
sess
men
t with
in 7
2 ho
urs
of a
dmis
sion
OT
asse
ssm
ent w
ithin
7
days
of a
dmis
sion
Patie
nt w
eigh
ed d
urin
g ad
mis
sion
Patie
nt's
moo
d as
sess
ed
by d
isch
arge
Pa
tient
on
antit
hrom
botic
ther
apy
by d
isch
arge
R
ehab
ilita
tion
goal
s ag
reed
by
the
mul
ti-di
scip
linar
y te
am
Hom
e vi
sit p
erfo
rmed
be
fore
dis
char
ge
2006
key
12
indi
cato
r sc
ore
2004
key
12
indi
cato
r sc
ore
All Hospitals (sites) overall 62 54 66 42 71 71 68 57 55 100 76 63 65 61 Royal Berkshire NHS Foundation Trust 80 74 51 95 44 67 91 95 87 32 100 89 100 77 78 Southampton University Hospitals NHS Trust (Southampton General Hospital) 80 54 50 41 39 74 62 51 73 64 100 79 61 62 45
Winchester and Eastleigh Healthcare NHS Trust 60 85 75 96 42 94 96 97 81 84 100 100 100 88 74 SOUTH CENTRAL SHA overall 64 55 71 44 73 79 74 61 51 100 78 66 68 63
SOUTH EAST COAST SHA Ashford and St Peter's Hospital NHS Trust 73 44 33 31 70 87 75 45 31 16 100 37 58 52 N/A Brighton & Sussex University Hospitals NHS Trust (Brighton) 77 100 100 96 77 98 95 98 84 90 100 85 40 89 78
Brighton & Sussex University Hospitals NHS Trust (Mid Sussex) 40 80 75 58 60 66 75 58 70 37 100 78 36 66 73
Dartford & Gravesham NHS Trust 79 67 59 51 28 33 81 46 67 32 100 72 48 57 57 East Kent Hospitals NHS Trust (William Harvey Hospital Ashford) 68 65 62 48 24 69 72 66 59 26 100 73 40 59 56
East Kent Hospitals NHS Trust (Kent & Canterbury Hospital) 62 50 47 44 48 66 75 88 25 20 100 80 29 56 43 East Kent Hospitals NHS Trust (Queen Elizabeth Queen Mother Hospital, Margate) 65 60 54 58 59 52 66 81 29 26 100 62 57 59 44
East Sussex Hospitals NHS Trust (Conquest Hospital) 79 62 53 70 20 39 78 86 91 80 100 94 70 70 48 East Sussex Hospitals NHS Trust (Eastbourne Hospital) 53 85 77 45 51 61 79 22 96 38 100 3 80 61 57 Frimley Park Hospitals NHS Foundation Trust 69 61 51 77 58 67 89 68 53 73 100 82 100 73 68 Maidstone and Tunbridge Wells NHS Trust (Kent and Sussex) 58 24 2 41 54 63 57 9 35 21 100 18 0 35 45
Maidstone and Tunbridge Wells NHS Trust (Maidstone Hospital) 35 3 3 57 31 62 54 65 28 59 100 20 43 44 62

Section 2 Chapter 4 Key national clinical results 2006 for named hospitals 100
Trust name (site name)
Num
ber o
f cas
es in
the
audi
t
Patie
nts
trea
ted
in a
St
roke
Uni
t
Patie
nts
trea
ted
for >
50%
of
sta
y in
Str
oke
Uni
t Sc
reen
ing
for s
wal
low
ing
diso
rder
s <
24 h
ours
af
ter a
dmis
sion
B
rain
sca
n w
ithin
24
hour
s
Asp
irin
by 4
8 ho
urs
afte
r st
roke
Ph
ysio
ther
apis
t as
sess
men
t with
in 7
2 ho
urs
of a
dmis
sion
OT
asse
ssm
ent w
ithin
7
days
of a
dmis
sion
Patie
nt w
eigh
ed d
urin
g ad
mis
sion
Patie
nt's
moo
d as
sess
ed
by d
isch
arge
Pa
tient
on
antit
hrom
botic
ther
apy
by d
isch
arge
R
ehab
ilita
tion
goal
s ag
reed
by
the
mul
ti-di
scip
linar
y te
am
Hom
e vi
sit p
erfo
rmed
be
fore
dis
char
ge
2006
key
12
indi
cato
r sc
ore
2004
key
12
indi
cato
r sc
ore
All Hospitals (sites) overall 62 54 66 42 71 71 68 57 55 100 76 63 65 61 Medway Maritime Hospital, Medway PCT & Swale PCT 80 50 45 51 20 21 66 36 61 35 100 91 64 53 61 Royal Surrey County Hospital NHS Trust 75 79 68 73 58 86 86 83 22 72 100 94 63 74 71 Royal West Sussex Trust 78 77 73 68 60 63 47 95 87 82 100 100 25 73 74 Surrey & Sussex Healthcare NHS Trust 79 51 49 78 19 47 63 62 27 34 100 52 69 54 51 Worthing & Southlands Hospitals NHS Trust 80 83 69 87 15 82 82 31 88 26 100 100 100 72 55 SOUTH EAST COAST SHA overall 63 56 61 43 62 74 64 57 46 100 72 46 62 58 SOUTH WEST SHA Gloucestershire Hospitals NHS Foundation Trust (Cheltenham General Hospital) 80 65 41 88 20 87 71 98 56 90 100 95 100 76 76
Gloucestershire Hospitals NHS Foundation Trust (Gloucestershire Royal Hospital) 80 44 36 82 23 89 65 86 40 97 100 80 100 70 72
North Bristol NHS Trust 38 84 84 59 81 94 80 65 59 41 100 96 78 77 N/A Northern Devon Healthcare NHS Trust 4 INSUFFICIENT CASES TO REPORT Plymouth Hospitals NHS Trust 26 77 73 48 62 95 83 62 0 17 100 32 9 55 50 Plymouth Primary Care Trust 32 81 0 71 N/A 89 94 44 97 100 100 100 100 80 84 Poole Hospital NHS Trust 68 75 71 76 31 81 87 61 54 46 100 78 79 70 58 Royal Bournemouth & Christchurch Hospitals NHS Foundation Trust 78 68 42 81 29 98 96 100 28 98 100 100 35 73 74
Royal Cornwall Hospitals Trust 80 34 21 49 16 65 38 49 28 18 100 76 55 46 60 Royal Devon & Exeter NHS Foundation Trust 80 63 56 78 30 59 54 70 65 76 100 87 47 65 N/A Royal United Hospital Bath NHS Trust 28 50 39 59 50 100 68 68 27 59 100 74 57 63 51 Salisbury Health Care NHS Trust 59 54 51 93 39 97 93 100 41 72 100 93 100 78 84 South Devon (including South Devon Healthcare NHS Trust &Teignbridge, Torbay and South Hams & W. Devon PCTs) 79 81 78 88 61 89 85 97 65 83 100 90 100 85 88

Section 2 Chapter 4 Key national clinical results 2006 for named hospitals 101
Trust name (site name)
Num
ber o
f cas
es in
the
audi
t
Patie
nts
trea
ted
in a
St
roke
Uni
t
Patie
nts
trea
ted
for >
50%
of
sta
y in
Str
oke
Uni
t Sc
reen
ing
for s
wal
low
ing
diso
rder
s <
24 h
ours
af
ter a
dmis
sion
B
rain
sca
n w
ithin
24
hour
s
Asp
irin
by 4
8 ho
urs
afte
r st
roke
Ph
ysio
ther
apis
t as
sess
men
t with
in 7
2 ho
urs
of a
dmis
sion
OT
asse
ssm
ent w
ithin
7
days
of a
dmis
sion
Patie
nt w
eigh
ed d
urin
g ad
mis
sion
Patie
nt's
moo
d as
sess
ed
by d
isch
arge
Pa
tient
on
antit
hrom
botic
ther
apy
by d
isch
arge
R
ehab
ilita
tion
goal
s ag
reed
by
the
mul
ti-di
scip
linar
y te
am
Hom
e vi
sit p
erfo
rmed
be
fore
dis
char
ge
2006
key
12
indi
cato
r sc
ore
2004
key
12
indi
cato
r sc
ore
All Hospitals (sites) overall 62 54 66 42 71 71 68 57 55 100 76 63 65 61 Swindon & Marlborough NHS Trust (with Swindon PCT) 80 19 16 61 34 66 29 35 18 42 100 25 56 42 48 Taunton & Somerset NHS Trust 80 66 59 58 49 71 71 88 65 72 100 83 29 67 48 United Bristol Healthcare NHS Trust 77 83 75 80 64 71 73 67 77 67 100 84 68 76 63 West Dorset General Hospitals NHS Trust 73 75 71 82 27 74 88 89 48 45 100 73 65 70 75 Weston Area Health Trust 80 70 59 59 40 58 68 61 75 98 100 80 50 68 53 Yeovil District Hospital NHS Foundation Trust 68 90 81 64 60 83 97 93 34 88 100 81 58 77 43 SOUTH WEST SHA overall 64 53 72 39 79 73 77 50 70 100 80 66 69 65 WEST MIDLANDS SHA Burton Hospitals NHS Trust 80 45 38 45 30 81 80 94 13 76 100 80 61 62 51 Dudley Group of Hospitals NHS Trust 77 86 66 74 24 81 77 79 57 69 100 66 39 68 53 George Eliot Hospital NHS Trust 72 64 63 93 44 77 96 88 72 74 100 82 44 75 44 Good Hope Hospital NHS Trust 76 70 58 48 51 61 80 49 4 25 100 84 29 55 63 Heart of England NHS Foundation Trust 79 65 61 83 38 65 90 76 74 63 100 87 75 73 59 Hereford Hospitals NHS Trust 60 38 33 57 38 44 85 24 22 17 100 73 15 45 46 Mid Staffordshire General Hospitals NHS Trust 70 66 34 65 37 76 54 50 25 26 100 53 80 55 39 Royal Wolverhampton Hospitals NHS Trust jointly with Wolverhampton Health Care NHS Trust 80 69 66 89 58 80 72 78 79 75 100 84 100 79 70
Sandwell and West Birmingham Hospitals NHS Trust (City Hospital) 67 70 45 46 34 48 74 55 13 55 100 88 75 59 68
Sandwell and West Birmingham Hospitals NHS Trust (Sandwell District Hospital) 71 86 83 69 26 73 90 96 76 54 100 89 74 76 59
Shrewsbury & Telford Hospital NHS Trust 80 74 63 23 33 61 41 77 37 16 100 53 75 54 N/A South Birmingham PCT with University Birmingham NHS Foundation Trust 70 77 67 52 28 71 76 79 70 16 100 15 42 58 N/A

Section 2 Chapter 4 Key national clinical results 2006 for named hospitals 102
Trust name (site name)
Num
ber o
f cas
es in
the
audi
t
Patie
nts
trea
ted
in a
St
roke
Uni
t
Patie
nts
trea
ted
for >
50%
of
sta
y in
Str
oke
Uni
t Sc
reen
ing
for s
wal
low
ing
diso
rder
s <
24 h
ours
af
ter a
dmis
sion
B
rain
sca
n w
ithin
24
hour
s
Asp
irin
by 4
8 ho
urs
afte
r st
roke
Ph
ysio
ther
apis
t as
sess
men
t with
in 7
2 ho
urs
of a
dmis
sion
OT
asse
ssm
ent w
ithin
7
days
of a
dmis
sion
Patie
nt w
eigh
ed d
urin
g ad
mis
sion
Patie
nt's
moo
d as
sess
ed
by d
isch
arge
Pa
tient
on
antit
hrom
botic
ther
apy
by d
isch
arge
R
ehab
ilita
tion
goal
s ag
reed
by
the
mul
ti-di
scip
linar
y te
am
Hom
e vi
sit p
erfo
rmed
be
fore
dis
char
ge
2006
key
12
indi
cato
r sc
ore
2004
key
12
indi
cato
r sc
ore
All Hospitals (sites) overall 62 54 66 42 71 71 68 57 55 100 76 63 65 61 South Warwickshire General Hospitals NHS Trust 51 73 67 65 47 90 91 89 29 41 100 76 46 68 62 South Worcestershire PCT 8 100 88 14 N/A 57 71 71 100 25 100 100 88 74 62 University Hospital of North Staffordshire NHS Trust & North Staffordshire Combined Healthcare NHS Trust Combined 80 91 73 81 40 32 76 90 75 68 100 90 100 76 N/A
University Hospitals Coventry and Warwickshire (St Cross Hospital Rugby) 21 67 67 86 5 38 71 67 38 44 100 62 60 59 70
University Hospitals Coventry and Warwickshire (Walsgrave Hospital) 80 58 48 52 35 67 27 36 25 43 100 75 25 49 46
Walsall Hospitals NHS Trust 79 73 67 55 33 69 65 50 61 44 100 78 69 64 35 Worcestershire Acute Hospitals NHS Trust (Alexandra Hospital Redditch) 48 31 25 67 54 65 50 85 5 17 100 91 -- 54 61
Worcestershire Acute Hospitals NHS Trust (Worcester Royal Hospital) 79 70 32 38 56 60 76 53 6 32 100 94 43 55 62
WEST MIDLANDS SHA overall 68 56 62 39 66 72 69 42 46 100 76 60 63 62 YORKSHIRE AND THE HUMBER Airedale NHS Trust 47 45 40 59 40 69 26 26 63 20 100 36 50 48 52 Barnsley Hospital NHS Foundation Trust 59 58 37 88 22 26 88 35 30 43 100 43 80 54 65 Bradford Teaching Hospitals NHS Foundation Trust 60 90 77 91 51 87 94 19 31 54 100 87 86 72 76 Calderdale & Huddersfield NHS Foundation Trust 80 89 79 82 41 73 74 90 55 77 100 93 92 79 N/A Doncaster & Bassetlaw Hospitals NHS Foundation Trust (Bassetlaw Hospital) 48 65 65 54 38 82 85 100 97 34 100 100 54 73 68
Doncaster & Bassetlaw Hospitals NHS Foundation Trust (Doncaster Royal Infirmary & Montagu Hospital) 80 73 71 82 19 97 93 91 95 68 100 75 81 79 N/A
Hambleton & Richmondshire PCT (Rutson Rehabilitation Unit) 20 100 95 100 N/A 94 90 100 90 80 100 100 100 95 71
Harrogate and District NHS Foundation Trust 52 46 40 67 56 89 93 97 57 45 100 100 19 67 54

Section 2 Chapter 4 Key national clinical results 2006 for named hospitals 103
Trust name (site name)
Num
ber o
f cas
es in
the
audi
t
Patie
nts
trea
ted
in a
St
roke
Uni
t
Patie
nts
trea
ted
for >
50%
of
sta
y in
Str
oke
Uni
t Sc
reen
ing
for s
wal
low
ing
diso
rder
s <
24 h
ours
af
ter a
dmis
sion
B
rain
sca
n w
ithin
24
hour
s
Asp
irin
by 4
8 ho
urs
afte
r st
roke
Ph
ysio
ther
apis
t as
sess
men
t with
in 7
2 ho
urs
of a
dmis
sion
OT
asse
ssm
ent w
ithin
7
days
of a
dmis
sion
Patie
nt w
eigh
ed d
urin
g ad
mis
sion
Patie
nt's
moo
d as
sess
ed
by d
isch
arge
Pa
tient
on
antit
hrom
botic
ther
apy
by d
isch
arge
R
ehab
ilita
tion
goal
s ag
reed
by
the
mul
ti-di
scip
linar
y te
am
Hom
e vi
sit p
erfo
rmed
be
fore
dis
char
ge
2006
key
12
indi
cato
r sc
ore
2004
key
12
indi
cato
r sc
ore
All Hospitals (sites) overall 62 54 66 42 71 71 68 57 55 100 76 63 65 61 Hull and East Yorkshire Hospitals NHS Trust 80 76 71 82 53 69 72 89 73 82 100 97 64 77 78 Mid Yorkshire Hospitals NHS Trust 178 25 23 67 25 65 70 74 52 55 100 56 58 56 N/A Northern Lincolnshire and Goole Hospitals NHS Trust (Diana Princess of Wales Grimsby) 60 60 58 61 47 48 27 29 27 58 100 65 50 52 40
Northern Lincolnshire and Goole Hospitals NHS Trust (Scunthorpe General) 43 51 40 48 53 81 68 47 43 38 100 65 26 55 41
Scarborough and North East Yorks Health Care NHS Trust 77 44 29 52 32 56 65 43 27 58 100 71 42 52 65 Sheffield Teaching Hospitals NHS Foundation Trust 80 76 71 70 63 80 72 75 67 59 100 73 79 74 52 The Leeds Teaching Hospitals NHS Trust 71 73 72 80 68 77 70 54 73 46 100 70 85 72 73 The Rotherham NHS Foundation Trust 80 85 76 77 44 65 89 94 96 82 100 87 85 82 78 York Health Services NHS Trust 75 72 65 77 43 40 88 72 37 18 100 0 94 59 53
YORKSHIRE & THE HUMBER SHA overall 63 56 72 42 69 75 68 59 56 100 71 67 67 62
NORTHERN IRELAND Altnagelvin Hospitals Health & Social Services Trust 20 60 55 64 40 64 100 0 27 33 100 0 33 48 58 Belfast City Hospital Health & Social Services Trust 57 81 65 66 44 83 85 87 47 93 100 92 26 72 59 Causeway Health & Social Services Trust 23 0 0 62 41 88 86 85 53 60 100 90 63 61 62 Craigavon Area Hospital Group Trust 68 90 51 63 41 58 74 59 68 89 100 100 32 69 67 Down Lisburn Health and Social Services Trust 15 73 60 100 29 50 80 75 90 100 100 100 100 80 46 Mater Hospital Belfast Health & Social Services Trust 38 71 66 52 18 35 56 88 26 84 100 92 67 63 32 Newry & Mourne Health & Social Services Trust 40 95 85 57 58 83 82 85 32 94 100 92 46 76 60 Royal Group of Hospitals and Dental Health & Social Services Trust 23 65 61 60 13 69 88 60 53 50 100 71 29 60 81
Sperrin Lakeland Health and Social Care NHS Trust (Erne 18 100 100 100 88 100 94 100 88 94 100 100 75 95 90

Section 2 Chapter 4 Key national clinical results 2006 for named hospitals 104
Trust name (site name)
Num
ber o
f cas
es in
the
audi
t
Patie
nts
trea
ted
in a
St
roke
Uni
t
Patie
nts
trea
ted
for >
50%
of
sta
y in
Str
oke
Uni
t Sc
reen
ing
for s
wal
low
ing
diso
rder
s <
24 h
ours
af
ter a
dmis
sion
B
rain
sca
n w
ithin
24
hour
s
Asp
irin
by 4
8 ho
urs
afte
r st
roke
Ph
ysio
ther
apis
t as
sess
men
t with
in 7
2 ho
urs
of a
dmis
sion
OT
asse
ssm
ent w
ithin
7
days
of a
dmis
sion
Patie
nt w
eigh
ed d
urin
g ad
mis
sion
Patie
nt's
moo
d as
sess
ed
by d
isch
arge
Pa
tient
on
antit
hrom
botic
ther
apy
by d
isch
arge
R
ehab
ilita
tion
goal
s ag
reed
by
the
mul
ti-di
scip
linar
y te
am
Hom
e vi
sit p
erfo
rmed
be
fore
dis
char
ge
2006
key
12
indi
cato
r sc
ore
2004
key
12
indi
cato
r sc
ore
All Hospitals (sites) overall 62 54 66 42 71 71 68 57 55 100 76 63 65 61 Hospital) Sperrin Lakeland Health and Social Care NHS Trust (Tyrone County Hospital) 13 69 62 82 46 78 8 50 58 50 100 50 83 61 69
Ulster Community & Hospitals Trust 50 70 68 34 34 70 70 88 60 53 100 97 67 68 66 United Hospitals Health & Social Services Trust 37 54 49 64 35 41 63 85 23 69 100 80 100 64 50 NORTHERN IRELAND overall 73 60 62 40 68 74 73 50 77 100 88 50 68 62
WALES Bro Morgannwg NHS Trust (Neath Port Talbot Hospital) 43 2 2 35 65 69 37 59 30 15 100 13 40 39 42 Bro Morgannwg NHS Trust (Princess of Wales Hospital ) 45 0 0 63 47 50 42 73 49 35 100 84 24 47 47 Cardiff and Vale NHS Trust (Llandough Hospital) 64 50 42 35 23 76 39 30 52 37 100 43 60 49 54 Cardiff and Vale NHS Trust (University Hospital Wales) 76 29 25 38 37 75 39 17 52 33 100 46 55 46 53 Carmarthenshire NHS Trust (Prince Philip Hospital) 50 0 0 43 58 63 21 58 27 76 100 95 60 50 60 Carmarthenshire NHS Trust (West Wales General) 40 0 0 17 63 83 15 13 19 4 100 65 60 36 35 Ceredigion & Mid-Wales NHS Trust 20 0 0 88 30 83 63 57 41 29 100 29 0 43 47 Conwy & Denbighshire NHS Trust 54 63 43 60 33 82 53 89 45 22 100 57 33 57 71 Gwent Healthcare NHS Trust (Nevill Hall Hospital) 53 75 74 76 28 78 68 81 62 57 100 67 100 72 81 Gwent Healthcare NHS Trust (St Woolos, Royal Gwent and Caerphilly & District Miner's Hospitals) 69 87 61 26 33 72 44 70 44 77 100 83 71 64 N/A
North East Wales NHS Trust 48 50 48 72 54 86 77 67 82 77 100 89 32 69 72 North Glamorgan NHS Trust 49 0 0 24 27 39 20 13 13 0 100 3 8 20 37 North West Wales NHS Trust (Bangor Hospital) 76 0 0 81 24 97 100 71 52 93 100 100 60 65 59 North West Wales NHS Trust (Llandudno Hospital) 11 0 0 60 0 100 100 100 10 70 100 100 -- 58 59 Pembrokeshire & Derwen NHS Trust 45 67 40 62 56 94 51 15 54 43 100 91 77 62 68

Section 2 Chapter 4 Key national clinical results 2006 for named hospitals 105
Trust name (site name)
Num
ber o
f cas
es in
the
audi
t
Patie
nts
trea
ted
in a
St
roke
Uni
t
Patie
nts
trea
ted
for >
50%
of
sta
y in
Str
oke
Uni
t Sc
reen
ing
for s
wal
low
ing
diso
rder
s <
24 h
ours
af
ter a
dmis
sion
B
rain
sca
n w
ithin
24
hour
s
Asp
irin
by 4
8 ho
urs
afte
r st
roke
Ph
ysio
ther
apis
t as
sess
men
t with
in 7
2 ho
urs
of a
dmis
sion
OT
asse
ssm
ent w
ithin
7
days
of a
dmis
sion
Patie
nt w
eigh
ed d
urin
g ad
mis
sion
Patie
nt's
moo
d as
sess
ed
by d
isch
arge
Pa
tient
on
antit
hrom
botic
ther
apy
by d
isch
arge
R
ehab
ilita
tion
goal
s ag
reed
by
the
mul
ti-di
scip
linar
y te
am
Hom
e vi
sit p
erfo
rmed
be
fore
dis
char
ge
2006
key
12
indi
cato
r sc
ore
2004
key
12
indi
cato
r sc
ore
All Hospitals (sites) overall 62 54 66 42 71 71 68 57 55 100 76 63 65 61 Pontypridd & Rhondda NHS Trust 78 15 13 80 27 88 50 42 93 65 100 88 93 63 43 Powys Local Health Board 29 17 0 70 0 88 67 70 79 92 100 84 79 62 73 Swansea NHS Trust (Morriston Hospital) 51 0 0 71 35 56 94 18 98 83 100 100 57 59 55 Swansea NHS Trust (Singleton Hospital) 24 0 0 47 42 86 59 78 32 38 100 42 67 49 57 WALES overall 28 22 55 38 76 54 50 54 53 100 70 53 54 56
ISLANDS Isle of Man Department of Health and Social Security 19 21 16 17 58 56 25 70 90 11 100 0 29 41 82 States of Guernsey Health & Social Services 20 0 0 67 55 82 83 69 88 50 100 36 67 58 74 States of Jersey Health & Social Services 28 0 0 88 64 75 59 47 48 74 100 72 58 57 58 ISLANDS overall 6 4 65 60 73 63 61 69 54 100 46 52 54 72

Section 2 Chapter 4 Key national clinical results 2006 for named hospitals 106
TABLE 13 TOTAL KEY INDICATOR SCORE FOR CLINICAL AUDIT - ALL HOSPITALS IN EACH STRATEGIC HEALTH AUTHORITY AND REGION
Trust name (site name)
Patie
nts
trea
ted
in a
St
roke
Uni
t
Patie
nts
trea
ted
for >
50%
of
sta
y in
Str
oke
Uni
t
Scre
enin
g fo
r sw
allo
win
g di
sord
ers
< 24
hou
rs
afte
r adm
issi
on
Bra
in s
can
with
in 2
4 ho
urs
Asp
irin
by 4
8 ho
urs
afte
r st
roke
Phys
ioth
erap
ist
asse
ssm
ent w
ithin
72
hour
s of
adm
issi
on
OT
asse
ssm
ent w
ithin
7
days
of a
dmis
sion
Patie
nt w
eigh
ed d
urin
g ad
mis
sion
Patie
nt's
moo
d as
sess
ed
by d
isch
arge
Patie
nt o
n an
tithr
ombo
tic th
erap
y by
dis
char
ge
Reh
abili
tatio
n go
als
agre
ed b
y th
e m
ulti-
disc
iplin
ary
team
Hom
e vi
sit p
erfo
rmed
be
fore
dis
char
ge
2006
key
12
indi
cato
r sc
ore
2004
key
12
indi
cato
r sc
ore
All Hospitals (sites) 62 54 66 42 71 71 68 57 55 100 76 63 65 61 EAST MIDLANDS SHA 51 46 57 40 69 62 59 53 51 100 66 45 58 56 EAST OF ENGLAND SHA 60 54 67 37 65 71 69 65 50 100 79 62 65 59 LONDON SHA 67 60 72 58 89 74 75 68 55 100 77 73 72 66 NORTH EAST SHA 72 67 70 40 67 72 58 54 53 100 78 67 67 66 NORTH WEST SHA 64 53 67 41 65 67 66 55 59 100 80 68 66 58 SOUTH CENTRAL SHA 64 55 71 44 73 79 74 61 51 100 78 66 68 63 SOUTH EAST COAST SHA 63 56 61 43 62 74 64 57 46 100 72 46 62 58 SOUTH WEST SHA 64 53 72 39 79 73 77 50 70 100 80 66 69 65 WEST MIDLANDS SHA 68 56 62 39 66 72 69 42 46 100 76 60 63 62 YORKSHIRE & THE HUMBER SHA 63 56 72 42 69 75 68 59 56 100 71 67 67 62 NORTHERN IRELAND 73 60 62 40 68 74 73 50 77 100 88 50 68 62 WALES 28 22 55 38 76 54 50 54 53 100 70 53 54 56 ISLANDS 6 4 65 60 73 63 61 69 54 100 46 52 54 72

Section 2 Chapter 4 Conclusions 107
Conclusions Conclusions Stroke clinicians, managers and politicians can feel proud of the advances that have been made over the last ten years - there are few other conditions that have progressed as rapidly. However there are still many areas of care that need to be improved and some hospitals that have failed to recognise that their stroke patients need 21st century management.

Stroke Organisational Audit Proforma 2006
National Sentinel Stroke Organisational Audit 2006 Copyright to the Royal College of Physicians 2006 1
Appendix 1 Questionnaire used for data collection phase I (organisational audit)
ROYAL COLLEGE OF PHYSICIANS NATIONAL SENTINEL STROKE AUDIT 2006
ORGANISATIONAL AUDIT PROFORMA
This proforma should describe your stroke services as at 1st April 2006. Please complete all questions. Clarification is available online against each question and also in the Help Booklet provided. In some cases you will either be directed to a later question or a response will not be apply based on answers to key questions. Data should be submitted to the Royal College of Physicians via the website.
Final Deadline 2nd May 2006. Helpline: telephone 0207 9351174 ext 335 email [email protected]
SECTION 1 ACUTE PRESENTATION SITE CODE: 1.1 Auditor Discipline: (tick all that apply) Doctor Manager Nurse Therapist Other (please specify)………
TRUST CASELOAD
1.2 How many patients with stroke are there in the Trust/hospital site? [ ] (please estimate the number of patients with stroke in the Trust/hospital on the day this form is completed) PRESENTATION AT HOSPITAL 1.3 Are there arrangements with the local ambulance service for emergency/rapid transfer to hospital for stroke patients with acute stroke over and above the regular system? Yes No
1.4 Which ward is a patient with acute stroke most likely to be admitted to first? (select one option) Medical Assessment Unit/Admission ward General medical ward/Care of the Elderly Acute stroke unit Stroke unit (other) Other
If other please specify ………… 1.5 Do you offer thrombolysis for appropriate stroke patients at your site? Yes No If yes, how many patients have you thrombolysed in your site during the past 12 months? _____

Stroke Organisational Audit Proforma 2006
National Sentinel Stroke Organisational Audit 2006 Copyright to the Royal College of Physicians 2006 2
SECTION 2 STROKE UNIT MODELS ORGANISATION OF CARE Stroke Unit Yes No 2.1 Does the trust have a specialist stroke unit or units? Definition: a specialist multidisciplinary team including staff based in a discrete ward which has been designated for stroke patients. If Yes 2.2 What is the total number of specialist stroke unit beds? [ ] (Total should equal the sum of the number of beds for Questions 2.3, 2.6 & 2.9) If No go straight to question 4.1 TYPE OF STROKE UNIT Answer the following questions according to the type(s) of unit(s). Before answering these questions see the definitions for each type of model in the help booklet. ACUTE STROKE BEDS Definition: Patients are accepted acutely but discharged or transferred early (usually within 7 days)
2.3 Number of beds designated for acute stroke care [ ] (If you do not have a unit of this type answer 0) 2.4 Which of the following features does this unit provide? (Tick all that apply)
a. continuous physiological monitoring (ECG, oximetry, blood pressure) b. access to scanning within 3 hours of admission c if no access to scanning within 3 hours
is there access to 24 hour brain imaging? d. a policy for direct admission from A&E/front door e. specialist ward rounds at least 5 times a week f. acute stroke protocols/guidelines

Stroke Organisational Audit Proforma 2006
National Sentinel Stroke Organisational Audit 2006 Copyright to the Royal College of Physicians 2006 3
2.5 How many of the following nursing staff are there usually on duty at 10.00 in the morning (on a normal week-day) on the acute stroke unit? (Enter 0 if no staff of that grade)
a. Qualified nurses [ ] b. Care assistants [ ]
REHABILITATION STROKE BEDS Definition: accepts patients after a delay of usually 7 days or more and has a focus on rehabilitation
2.6 Number of beds designated for stroke rehabilitation [ ] (If you do not have a unit of this type answer 0)
2.7 How many of the following nursing staff are there usually on duty at 10.00 in the morning (on a normal week-day) on the rehabilitation stroke unit? (Enter 0 if no staff of that grade)
a. Qualified nurses [ ] b. Care assistants [ ]
2.8 If you have both acute and rehabilitation stroke units are they on the same ward? Yes No COMBINED STROKE BEDS
Definition: No separation between acute and rehabilitation beds. Accepts patients acutely but also provides rehabilitation for at least several weeks if necessary. 2.9 Number of beds if combined stroke unit [ ] (If you do not have a unit of this type answer 0) 2.10 Which of the following features does this unit provide? (Tick all that apply)
a. continuous physiological monitoring (ECG, oximetry, blood pressure) b. access to scanning within 3 hours of admission c if no access to scanning within 3 hours
is there access to 24 hour brain imaging? d. a policy for direct admission from A&E/front door e. specialist ward rounds at least 5 times a week f. acute stroke protocols/guidelines

Stroke Organisational Audit Proforma 2006
National Sentinel Stroke Organisational Audit 2006 Copyright to the Royal College of Physicians 2006 4
2.11 How many of the following nursing staff are there usually on duty at 10.00 in the morning (on a normal week-day) on the combined stroke unit? (Enter 0 if no staff of that grade)
a. Qualified nurses [ ] b. Care assistants [ ]
SECTION 3 ALL STROKE UNITS ALL STROKE UNITS
3.1 If you have a stroke unit/stroke units, are there named Yes No Social Workers attached to the multi-disciplinary team?
3.2 Do(es) your stroke unit(s) operate admission criteria? Yes No
If Yes, 3.2i Which of the following criteria apply? (tick all that apply)
Acute SU Rehab SU Combined SU a) None
b) Age related c) Stroke severity
d) Pre existing dementia e) Other If other please specify [ ] [ ] [ ] 3.3 What is the total establishment of whole time equivalents (WTEs) of the following professionals for all your stroke unit beds? (Enter 0 if no establishment) i. Clinical Psychology [ ] WTE ii. Dietetics [ ] WTE iii. Occupational Therapy [ ] WTE iv. Physiotherapy [ ] WTE v. Speech & Language Therapy [ ] WTE vi. Pharmacy [ ] WTE vii. Orthotics [ ] WTE viii. Foot health/Podiatry [ ] WTE
3.4 How many sessions of junior doctor time are there per week in total for all stroke unit beds? [ ] Sessions

Stroke Organisational Audit Proforma 2006
National Sentinel Stroke Organisational Audit 2006 Copyright to the Royal College of Physicians 2006 5
SECTION 4 OTHER STROKE CARE MODELS MOBILE IN-PATIENT STROKE TEAM Definition – a multidisciplinary team providing inpatient specialist stroke care outside a stroke unit setting 4.1i Do you have a mobile in-patient stroke team? Yes No IF NO, go to question 4.2 IF YES, 4.1 ii Which of the following are regular members of the team? (Tick all that apply)
Specialist doctor Occupational therapist Specialist nurse Dietitian Social worker Psychologist Speech and language therapist Other (please specify)………… Physiotherapist
4.1 iii How many “ward rounds” are conducted per week? [ ] 4.1 iv How many patients has the team seen in the last week? [ ]
4.2 Do you have access to a stroke specialist early supported discharge team? Yes No IF NO go to 4.3 IF YES, 4.2i Which of the following are regular members of the team? (Tick all that apply)
Specialist doctor Occupational therapist Specialist nurse Dietitian Social worker Psychologist Speech and language therapist Other (please specify)………… Physiotherapist
4.2ii How many patients has the team seen in the last week? [ ] 4.3. Is there a specialist community stroke team in your area Yes No
for continuing longer term management? IF No go to 5.1 IF YES, 4.3i Which of the following are regular members of the team? (Tick all that apply)
Specialist doctor Occupational therapist Specialist nurse Dietitian Social worker Psychologist Speech and language therapist Other (please specify)………… Physiotherapist
4.3ii How many patients has the team seen in the last week? [ ]

Stroke Organisational Audit Proforma 2006
National Sentinel Stroke Organisational Audit 2006 Copyright to the Royal College of Physicians 2006 6
SECTION 5 IMAGING, TIA/NEUROVASCULAR SERVICE IMAGING
Are you able to obtain the following for your stroke inpatients? [*If yes for any of 5.2 – 5.4 you must tick one of a) – d) for both Weekdays and Weekends 5.1 CT scanning Yes No If yes, what is the current average waiting time for both weekdays and weekends?
Weekdays Weekends a) 0-4 hours b) 5-24 hours c) 25-48 hours d) More than 48 hours
5.2 MRI scanning Yes No If yes, what is the current average waiting time for both weekdays and weekends? Weekdays Weekends a) 0-4 hours b) 5-24 hours c) 25-48 hours d) More than 48 hours 5.3 Carotid Doppler Yes No If yes, what is the current average waiting time for both weekdays and weekends? Weekdays Weekends a) 0-4 hours b) 5-24 hours c) 25-48 hours d) More than 48 hours TIA/NEUROVASCULAR SERVICE 5.4 Do you have a neurovascular clinic? Yes No If YES, 5.5 How many clinics within a 4 week period? [ ] 5.6 How many new patients were seen during the past 4 weeks? [ ] 5.7 What is the current average waiting time for an appointment? [ ] days

Stroke Organisational Audit Proforma 2006
National Sentinel Stroke Organisational Audit 2006 Copyright to the Royal College of Physicians 2006 7
5.8 Do you have a service which enables the majority of patients referred Yes No with TIA to be seen and investigated within 7 days of minor stroke or TIA? SECTION 6 SPECIALIST ROLES MEDICAL STAFF 6.1 Is there a consultant physician with specialist knowledge of stroke who is formally Yes No recognised as having principal responsibility for stroke services? 6.2 How many formal sessions are there per week of senior doctor time for the management of stroke (including Outpatient Clinics): a) Consultant [ ] sessions per week b) Non consultant career grade [ ] sessions per week c) Staff grade [ ] sessions per week d) Clinical Assistant [ ] sessions per week OTHER STROKE SPECIALIST ROLES 6.3 How many whole time equivalents of the following stroke specialists? (enter 0 if you do not have one)
No. of whole time equivalents
6.3i Stroke Co-ordinator
6.3ii Stroke Specialist Nurse
6.3iii Stroke Clinical Specialist Therapist
6.3iv Stroke Consultant Nurse
6.3v Stroke Consultant Therapist
VOCATIONAL TRAINING AND SUPPORT
Yes No 6.4. Is there access to vocational training/employment support for working age stroke patients?

Stroke Organisational Audit Proforma 2006
National Sentinel Stroke Organisational Audit 2006 Copyright to the Royal College of Physicians 2006 8
SECTION 7 CONTINUING EDUCATION & RESEARCH For the following questions answers for Stroke Unit apply to any type of stroke unit (acute, rehabilitation or combined). Other wards refers to all other wards in the hospital which treat stroke patients.
CONTINUING EDUCATION & RESEARCH CAPACITY
Stroke Unit Other Wards in the Trust
7.1 Is there an in-house programme for the continuing education Yes No Yes No of qualified staff in management of stroke?
Stroke Unit Other Wards in
the Trust 7.2 Is there an in-house training programme, which includes Yes No Yes No issues relevant to the management of stroke for non-qualified clinical staff?
7.3 How many clinical stroke research studies are registered with your Research & Development Department (on the day you complete this form)? Please give as a total and then estimate by type of study. Total [ ] Acute [ ] Rehabilitation [ ] Prevention [ ] Other [ ] 7.4 How much time (in whole time equivalents, WTE, and however funded) is spent on clinical stroke research studies where patient consent (or relative assent) is required? Please give as a total and then estimate by type of profession.
Total [ ] WTE Doctor [ ] WTE Nurse [ ] WTE Occupational Therapy [ ] WTE Physiotherapy [ ] WTE Speech & Language Therapy [ ] WTE Psychologist [ ] WTE Dietitian [ ] WTE Other [ ] WTE

Stroke Organisational Audit Proforma 2006
National Sentinel Stroke Organisational Audit 2006 Copyright to the Royal College of Physicians 2006 9
SECTION 8 TEAM MEETINGS & ASSESSMENT MEASURES TEAM WORKING Records 8.1 Do all professions contribute to a single set of Yes No patient records for the management of stroke? 8.2 Does the Trust have an interdisciplinary care pathway for stroke? Yes No TEAM MEETINGS For the following questions answers for Stroke Unit apply to any type of stroke unit (acute, rehabilitation or combined). Other wards refers to all other wards in the hospital which treat stroke patients. Stroke Unit Other Wards in
the Trust 8.3 Are there team meetings at least once a week for the Yes No Yes No interchange of information about individual patients? 8.4 Which of the following disciplines regularly attend the team meetings?(please mark all that apply)
Stroke Unit Other Wards in the Trust
Clinical Psychology Dietetics Medicine (senior doctor) Nursing Occupational Therapy Physiotherapy Social Work Speech and Language Therapy Other (state which)

Stroke Organisational Audit Proforma 2006
National Sentinel Stroke Organisational Audit 2006 Copyright to the Royal College of Physicians 2006 10
AGREED ASSESSMENT MEASURES
8.5 Is there a locally agreed assessment protocol for stroke, which indicates the appropriate use of standardised measures for the following?
Yes No 8.5i Conscious level 8.5ii Motor impairment 8.5iii Cognitive function 8.5iv Activities of Daily Living 8.5v Acute stroke impairment Scale (eg NIH, Scandinavian Stroke Scale) 8.5vi Mood AVAILABILITY OF INFORMATION TO INFORM PRACTICE Stroke Unit Other Wards in
the Trust 8.6 Do staff have ready access to up-to-date information Yes No Yes No on local and national patients/carers support organisations?
SECTION 9 PATIENT/CARER COMMUNICATION For the following questions answers for Stroke Unit apply to any type of stroke unit (acute, rehabilitation or combined). Other wards refers to all other wards in the hospital which treat stroke patients. Stroke Unit Other Wards in
the Trust 9.1 Does the organisation of the ward/unit enable patients Yes No Yes No to have access to their management plan?
Stroke Unit Other Wards in the Trust
9.2 Is there patient information literature displayed in unit/ward on the following? Yes No Yes No 9.2i Condition specific literature on stroke 9.2ii Patient versions of national or local guidelines/standards 9.2iii Social Services local Community Care arrangements 9.2iv The Benefits Agency 9.2v Local voluntary agencies 9.2vi How to complain

Stroke Organisational Audit Proforma 2006
National Sentinel Stroke Organisational Audit 2006 Copyright to the Royal College of Physicians 2006 11
9.3 Are patients given copies of their discharge summary/letters? Yes No
9.4 Does the Stroke service have formal links with patients and Yes No carers organisations for communication on service provision, audit and future plans?
9.5 Is there a community user group for stroke? Yes No
9.6 Is there a policy to give patients a named contact Yes No on transfer from hospital to community?
9.7 Are Patient/Carer groups involved in formulating policy to Yes No deliver care?
9.8 Are Patient/Carer views sought on stroke services? Yes No
9.9 Has a report been produced within the past 12 months which Yes No analysed the views of patients?
Notes:
This section is for you to clarify your answers to any questions. Identify the question number (s) which apply to each comment. (Online version allows you to enter comments next to each individual question)

Appendix 2 Questionnaire used for data collection phase II (clinical audit) ROYAL COLLEGE OF PHYSICIANS
NATIONAL SENTINEL STROKE AUDIT 2006 CLINICAL AUDIT PROFORMA
The patient should be selected from the first 80 consecutive cases with a primary diagnosis of stroke (ICD 10 codes: I61, I63 and I64) admitted to the Trust between 1st April – 30th June 2006 SITE CODE: [ ] Auditor Discipline (tick all that apply) Clinical Audit Medicine Nursing Therapy Other Specify _____________
DEMOGRAPHIC INFORMATION Patient audit number: [ ] Date of Birth: [ ] /[ ]/[ ] (dd/mm/yyyy) Gender: Male Female If acute care for this patient is not being audited because they were initially admitted elsewhere tick this box Site code of collaborating hospital: [ ] (Contact RCP Administrator to obtain site code) Date of transfer to your unit: [ / / ] (dd/mm/yyyy) SECTION 1 STROKE ONSET AND HOSPITAL STAY 1.1 Date of stroke: [ / / ] Don’t know dd /mm/yyyy
*Please make every effort to find the date and time of stroke Time of stroke: [ ] HH (24 hr clock)
1.2 Date of admission: [ / / ] Don’t know dd /mm/yyyy
n.b. should have been admitted between 1st April 2006 and 30 June 2006 Time of admission [ ] HH (24 hr clock)
Age at admission: [ ] (will be calculated automatically when you enter dates online) n.b must be >16 years 1.3 Did the patient die whilst still an inpatient? Yes No
IF NO, 1.3i At the time of audit is the patient?
still in hospital for initial episode been discharged

Stroke Clinical Audit Proforma 2006
ICWP National Sentinel Stroke Clinical Audit 2006. Copyright Royal College of Physicians 2006 2
1.4 Date of discharge (If discharged alive): [ / / ] (dd/mm/yyyy) Length of stay to discharge alive: [ ] days (will be calculated automatically when you enter dates online) 1.5 Date of death: [ / / ] (dd/mm/yyyy) Or date of death not applicable Time from stroke (or date of admission if not available) to death: [ ] days (will be calculated automatically when you enter dates online) 1.6 Was the patient alive at 30 days after stroke? Yes No Don’t know ADMISSION/DISCHARGE 1.7 Was the patient treated in a Stroke Unit at any time Yes No during their stay?
1.8 Was the patient admitted to a Stroke Unit Yes No
within 4 hours of arrival at hospital? 1.9 Where did the patient spend over 50% of their stay? General/geriatric Ward Stroke Unit Rehabilitation Unit Other Specify______________
1.10 Date of admission to stroke unit [ / / ] (dd/mm/yyyy) 1.11 Date of discharge from stroke unit [ / / ] (dd/mm/yyyy) SCAN 1.12 Did the patient have a brain scan after the stroke? Yes No Not known If yes, 1.12i Date of first brain scan after the stroke [ / / ] (dd/mm/yyyy) *Please make every effort to find the date and time of scan
1.12ii Time of first brain scan after the stroke [ ] HH (24 hr Clock)
1.12iii Has a brain scan been carried out within 24 hours of stroke? Yes No Not known
1.12iv What did the scan show?
Infarct Haemorrhage Haemorrhagic Infarct No relevant abnormality
Stroke Clinical Audit Proforma 2006
ICWP National Sentinel Stroke Clinical Audit 2006. Copyright Royal College of Physicians 2006 3
1.12v If no,
Reason the patient did not have a scan:
Patient refused/unable to co-operate Palliative care Scan not routinely available Other
If other specify ________________________ SECTION 2 CASEMIX CO-MORBIDITIES 2.1 Any history of known co-morbidities prior to admission? (please select all that apply) Atrial Fibrillation Previous stroke or TIA Diabetes mellitus Hyperlipidaemia (total cholesterol >5 or LDL >3.0 mmol/L) Hypertension (systolic >140 or diastolic >85) Myocardial infarction or angina Valvular heart disease (aortic or mitral valves) Other serious illness that influences prognosis or management of stroke
Please specify __________________
None of the above apply 2.2 Was the patient newly institutionalised at discharge? Yes No Not Known PRE-ADMISSION MEDICATION 2.3 Was the patient on any of the following treatments Yes No
before admission? 2.3i If YES which classes of drugs were prescribed? (tick all that were prescribed): Antihypertensives Antiplatelet/thrombotic Lipid lowering treatment ACE inhibitor or Angiotensin-II receptor antagonists
Aspirin
Statin
Alpha Blocker Clopidogrel Other Beta Blocker Dipyridamole MR None Calcium Channel blocker
Warfarin/other anticoagulant
Thiazide diuretic Other Other None None 2.4 Was the patient independent in everyday Yes No Don’t know
activities before the stroke? (e.g. Barthel 19-20 or Rankin <3
Stroke Clinical Audit Proforma 2006
ICWP National Sentinel Stroke Clinical Audit 2006. Copyright Royal College of Physicians 2006 4
Error!DEPENDENCY AT DISCHARGE 2.5 Dependency at discharge (using the Barthel ADL Functional Assessment Scale) Bowels 0 = Incontinent (or needs to be given enemata)
1 = Occasional accident (once/week) 2 = Continent
0 1 2
Bladder 0 = Incontinent, or catheterised 1 = Occasional accident (max once per 24 hrs) 2 = Continent (over 7 days)
0 1 2
Grooming 0 = Needs help with personal care 1 = Independent face / hair / teeth / shaving (implements provided)
0 1
Toilet Use 0 = Dependent 1 = Needs some help, can do something alone 2 = Independent (on and off, dressing / wiping)
0 1 2
Feeding 0 = Unable 1 = Needs help cutting, etc 2 = Independent (food in reach)
0 1 2
Mobility 0 = Immobile 1 =Wheelchair independent including corners etc. 2 =Walks with help of one person (verbal or physical) 3 = Independent (may use stick etc.)
0 1 2 3
Transfer 0 = Unable - no sitting balance 1 = Major help (one / two people) can sit 2 = Minor help (verbal or physical) 3 = Independent
0 1 2 3
Dressing 0 = Dependent 1 = Needs help, can do half unaided 2 = Independent (including buttons, zips, laces etc)
0 1 2
Stairs 0 = Unable 1 = Needs help (verbal/physical) 2 = Independent
0 1 2
Bathing 0 = Dependent 1 = Independent
0 1
Total [ ] (will only be calculated on website if all sections completed) MAXIMUM SEVERITY WITHIN FIRST WEEK 2.6 What was the worst level of consciousness at the time of maximum severity within the
first week after stroke? Fully conscious Drowsy Semi-conscious (not fully rousable) Unconscious (responds to pain only/no response)

Stroke Clinical Audit Proforma 2006
ICWP National Sentinel Stroke Clinical Audit 2006. Copyright Royal College of Physicians 2006 5
SECTION 3 STANDARDS WITHIN 72 HOURS Where the patient has been transferred from another hospital and data for the questions below is not available use the “No but..” option. PATIENT ASSESSMENT FIRST 24 HOURS 3.1 Has screening for swallowing disorders (not gag reflex) been specifically recorded in the first 24 hours?
Yes No No but
Answer No, but if: impaired level of consciousness is documented. 3.2 If the patient is alert and able to communicate, is there a formal assessment of?
Yes No No but
i) Visual fields ii) Sensory testing
Answer No, but… if: impaired level of consciousness/communication is documented. PATIENT ASSESSMENT FIRST 48 HOURS 3.3 Had the patient commenced aspirin by 48 hours after stroke? Yes No No
but
Answer No, but... if: patient died; patient has intra-cerebral haemorrhage; it is documented that aspirin was contra-indicated.
PATIENT ASSESSMENT FIRST 72 HOURS Yes No No but 3.4 Has swallowing been assessed within 72 hours of admission by a speech and language therapist (or of stroke if the stroke occurred in hospital)? Answer No, but... if: patient's swallowing is documented as normal: patient is still unconscious; patient died within 72 hours; patient is receiving palliative care. 3.5 Has the patient been assessed by a physiotherapist Yes No No but within 72 hours of admission (or of stroke if the stroke occurred in hospital)? Answer No, but... if: patient died within 72 hours; patient is receiving palliative care.
Yes No No but 3.6 Was the patient receiving nutrition by 72 hours of admission? Answer No, but... if: patient refused or patient receiving palliative care If yes, 3.6i Which of the following methods was in use? Oral Nasogastric/PEG Intravenous

Stroke Clinical Audit Proforma 2006
ICWP National Sentinel Stroke Clinical Audit 2006. Copyright Royal College of Physicians 2006 6
SECTION 4 STANDARDS WITHIN 7 DAYS WITHIN SEVEN DAYS Yes No No but 4.1 Has there been an initial assessment of communication problems by the speech and language therapist within 7 days of admission (or of stroke if the stroke occurred in hospital)? Answer No, but... if: patient died within 7 days; the patient was still unconscious; it is documented that the patient had no communication problems; patient is receiving palliative care. Yes No No but 4.2 Was the patient assessed by an occupational therapist
within 4 working days of admission (or of stroke if the stroke occurred in hospital)?
Answer No, but... if: patient died within 4 days; the patient was still unconscious; it is documented that the patient had no difficulties performing everyday activities; patient is receiving palliative care. If no, 4.2i Was the patient assessed by an occupational therapist Yes No No but
within 7 days of admission (or of stroke if the stroke occurred in hospital)?
Answer No, but... if: patient died within 7 days; the patient was still unconscious; it is documented that the patient had no difficulties performing everyday activities; patient is receiving palliative care. 4.3 Did the patient have an indwelling urinary catheter in Yes No
the first week after admission? If yes which of the following have been documented as the reason for urinary catheterisation? Please select all that apply
a. urinary retention b. pre-existing catheter c. urinary incontinence d. need for accurate fluid balance monitoring e. critical skin care f. not documented g. other
please specify Yes No No but 4.4 Is there a plan to promote urinary continence? Answer No, but... if: patient is continent; patient died within 7 days; patient is unconscious; patient is receiving palliative care.

Stroke Clinical Audit Proforma 2006
ICWP National Sentinel Stroke Clinical Audit 2006. Copyright Royal College of Physicians 2006 7
SECTION 5 BY DISCHARGE 5.1 Is there evidence that the patient was weighed Yes No No but
at least once during admission? Answer No, but... if patient died within 7 days; patient unconscious throughout. 5.2 Is there evidence in the multi-disciplinary notes of Yes No No but a social work assessment within 7 days of referral? Answer No, but... if: patient not referred to Social Worker; patient died within 7 days; or patient refused.
Yes No No but 5.3 Is there evidence that the patient's mood has
been assessed? Answer No, but... if: patient unconscious throughout; or patient died within 7 days.
Yes No No but 5.4. Is there evidence that the patient's cognitive status has been assessed? Answer No, but... if: patient unconscious throughout; or patient died within 7 days, or receiving palliative care. CARE PLANNING Yes No No but 5.5 Is there written evidence of rehabilitation goals agreed by the multi-disciplinary team? Answer No, but... if: patient died / discharged within 7 days; patient is receiving palliative care.

Stroke Clinical Audit Proforma 2006
ICWP National Sentinel Stroke Clinical Audit 2006. Copyright Royal College of Physicians 2006 8
SECTION 6 RISK FACTORS AND SECONDARY PREVENTION STROKE RISK FACTORS DEFINED AT DISCHARGE 6.1 Has(ve) the probable underlying cause(s) for the Yes No Not documented stroke been identified?
If yes, 6.1i which of the following?
Carotid stenosis Current smoker Alcohol abuse no. of units per week (21 female 28 men) Atrial Fibrillation Myocardial Infarction within the past month Hypertension Other
If other specify__________________________________________ 6.2 Have the following risk factors been discussed Yes No No but
with the patient and/or carer? Smoking cessation Alcohol reduction Exercise Diet Answer No, but… if patient died; remained profoundly impaired 6.3 Which treatment was the patient on at discharge? (Tick all that apply. If “none” select the reason) Antihypertensives Antiplatelet/thrombotic Lipid lowering treatment ACE inhibitor or Angiotensin-II receptor antagonists
Aspirin
Statin
Alpha Blocker Clopidogrel Other Beta Blocker Dipyridamole MR None Calcium Channel blocker
Warfarin/other anticoagulant
Thiazide diuretic Other Other None None If None, reasons for not prescribing Antihypertensives Antiplatelet/thrombotic Lipid lowering treatment Not indicated Not indicated Not indicated Patient refused Patient refused Patient refused Under review Under review Under review
Haemorrhagic stroke Patient life expectancy <2 years Contra-indications Other Contra-indications Other Contra-indications

Stroke Clinical Audit Proforma 2006
ICWP National Sentinel Stroke Clinical Audit 2006. Copyright Royal College of Physicians 2006 9
SECTION 7 PATIENT COMUNICATION AND RESEARCH COMMUNICATION 7.1 Is there documented evidence that there has been discussion with the patient about:
Yes No No but i. Diagnosis ii. Prognosis
Answer No, but... if patient unconscious throughout or died or has severe receptive or cognitive difficulties.
Yes No No but.. 7.2 Were the carer's needs for support assessed separately? Answer No, but... if it was documented that there was no carer. 7.3 Is there evidence that the skills required to care Yes No No but
for the patient at home were taught? Answer No, but... if: patient died; patient discharged to institutional care; it is documented that the carer is not participating in the patient's care; patient was self-caring by discharge.
Yes No No but 7.4 Was a home visit performed?
If yes,
7.4i was this:
by a professional with the patient? by a professional without the patient?
Answer No, but... if: the patient was sent to another hospital/institution; or was functionally competent; or there was no change in functional ability from before stroke; patient died; or patient or carer refused. RESEARCH 7.5 Is this patient in a research study where they (or a relative) have given Yes No
written consent/assent? Notes:
This section is for you to clarify your answers to any questions. Identify the question number (s) which apply to each comment. (Online version allows you to enter comments next to each individual question)