national school lunch state categorical funding and ... attachments/810/i14052...national school...
TRANSCRIPT

BUREAU OF LEGISLATIVE RESEARCH
One Capitol Mall, 5TH
Floor | Little Rock, Ark., 72201 | (501) 682-1937
National School Lunch State Categorical Funding and Expenditures
September 15, 2015
Prepared for
THE HOUSE INTERIM COMMITTEE ON EDUCATION
AND THE SENATE INTERIM COMMITTEE ON EDUCATION
2015-16
Adequacy
Study


Bureau of Legislative Research
Project Number 16-001-25
Contents Background ...................................................................................................................................... 1
Student Count .................................................................................................................................. 1
NSL Funding Background ................................................................................................................ 2
NSL Funding Trends ........................................................................................................................ 3
Other Types of NSL Funding and Funding Adjustments ................................................................... 5
NSL Transitional Adjustments................................................................................................. 5
NSL Growth Funding .............................................................................................................. 5
Allowable Uses and 2014 Expenditures ........................................................................................... 8
NSL Fund Balances ....................................................................................................................... 12
Poverty Funding In Other States .................................................................................................... 13
Federal Funding for Low-income Student Populations ................................................................... 14
Student Achievement ..................................................................................................................... 14
State Assessments ................................................................................................................15
NAEP Assessment ................................................................................................................15
Other Reports on NSL Funding Use and Closing the Achievement Gap ........................................ 19
Summary Conclusion ..................................................................................................................... 20
Appendix ........................................................................................................................................ 21


Page 1
Background Arkansas statute §10-3-2102 requires the House and Senate Committees on Education to evaluate the cost of providing an adequate education. As one part of that responsibility, the law requires the Committees to review the expenditures from National School Lunch (NSL) state categorical funding. NSL funding is state money distributed to school districts based on the concentrations of poverty in their student populations. This document provides information on the NSL funding provided to districts, districts’ use of this funding, the number of low-income students in Arkansas, and the performance of these students on state and national tests. The NSL state poverty funding program should not be confused with the federal school lunch program. The state funding is called NSL funding because eligibility for the federal National School Lunch Act program is used as the measure of poverty. According to the federal program rules, children from families with incomes below 130 percent of the poverty level are eligible for free meals, and those with incomes between 130 percent and 185 percent of the poverty level are eligible for reduced-price meals.
Student Count Nearly 290,000 of the roughly 475,000 students enrolled in the state’s school districts and open-enrollment charter schools, or about 61%, are eligible for free or reduced price lunch. The following chart indicates that both the number and the percentage of NSL students, has been increasing annually over the last six years.
Source: Arkansas Department of Education, Annual Oct. Enrollment Data. Data does not include Arkansas School for the Blind, Arkansas School for the Deaf or Arkansas Division of Youth Services.
In 2014-15, about 51.5% of all students were eligible for free lunches, while 9.3% were eligible for reduced-price lunches. About 39% of students were ineligible for free or reduced-price lunches. Over the last six years, the number of free lunch students has been increasing, while the number of students who are not eligible for either free or reduced-price lunches (shown on the following chart as “Full Price”) is decreasing.
55.8% 58.1% 58.8% 59.7% 60.2% 60.6% 60.8%
259,648
271,258 275,329
279,718 283,885
287,651 289,313
50.0%
55.0%
60.0%
65.0%
240,000
250,000
260,000
270,000
280,000
290,000
300,000
2008-09 2009-10 2010-11 2011-12 2012-13 2013-14 2014-15 %
of
To
tal E
nro
llm
en
t
Stu
den
ts
Free & Reduced-Price Lunch Eligible Students (K-12)
% of All Students Students

Page 2
Source: Arkansas Department of Education, Annual Oct. Enrollment Data. Data does not include Arkansas School for the Blind, Arkansas School for the Deaf or Arkansas Division of Youth Services.
NSL Funding Background
The Arkansas General Assembly introduced NSL state categorical funding during the Second Extraordinary Session of 2003, with the first appropriation for the 2004-05 school year. The new funding was based on recommendations made by Lawrence O. Picus and Associates, the education finance consulting firm the General Assembly hired in 2003 to help devise a new funding formula for the state’s education system. The consultants made recommendations in 20031 and again in 2006,2 when the state rehired them to recalibrate the funding formula. Picus and Associates argued that districts with high concentrations of poverty need additional resources and, in both 2003 and 2006, they recommended the state provide additional funding for two purposes: teacher tutors and pupil support personnel. In 2003, Picus and Associates noted that, for struggling students, “the most powerful and effective strategy is individual one-to-one tutoring provided by licensed teachers” (p. 25). The consultants recommended that Arkansas fund one fully licensed teacher tutor for every 100 NSL students, with a minimum of one for every school. They also suggested the state fund extended-day and summer-school programs as secondary measures if the state found its tutoring strategy was not fully sufficient. Picus and Associates also noted that schools need a strategy for student support and family outreach, and that strategy should be based on each district’s level of poverty. The general standard, they said, is one licensed professional for every 20-25% of the student body that is low income. In total, the consultants recommended two full-time employee (FTE) positions for every 100 NSL students—one teacher tutor and one pupil support services FTE. The Legislature then enacted Act 59 of the Second Extraordinary Session of 2003, which turned the staffing level into a dollar amount for each NSL student that essentially funded 1 FTE position for districts with NSL concentrations below 70%, two for districts with NSL concentrations between 70% and less than 90% and three positions for districts with NSL concentrations at 90% and above. Since then, the General Assembly has increased the three per-student rates five times.
1 Lawrence O. Picus and Associates, An Evidenced-Based Approach to School Finance Adequacy in
Arkansas, Final Report, September 1, 2003. 2 Lawrence O. Picus and Associates, Recalibrating the Arkansas School Funding Structure, Final Report,
August 30, 2006.
-
50,000
100,000
150,000
200,000
250,000
300,000
2008-09 2009-10 2010-11 2011-12 2012-13 2013-14 2014-15
Students by Free, Reduced-Price or Full-Price Lunch Status
Free Reduced Price Full Price

Page 3
NSL Funding Trends
Under the state NSL categorical funding program, districts receive one of three funding rates for each student eligible for a free or reduced-price lunch. The funding rates for 2014 through 2017 are provided in the table below. Each district’s funding rate is based on the district’s percentage of students eligible for the free or reduced-price lunch program in the previous year. For example, if a 1,000-student district had 800 students eligible for free or reduced-price lunches (80%) in 2014, the district would receive $1,033 for each of those 800 students in 2015, or $826,400.
% NSL Students FY14 FY15 FY16 FY17
< 70% $517 $517 $522 $526 70% - 90% $1,033 $1,033 $1,042 $1,051
90% > $1,549 $1,549 $1,562 $1,576 In 2014-15, about 57% of the districts fell into the lowest NSL funding rate (<70%), while 39% were in the middle rate (70%-<90%) and just nine districts (4%) were in the highest funding rate (90%+). The number of districts in the lowest funding rate has decreased in recent years, while those in the middle rate has increased.
Source: Arkansas Department of Education, State Aid Notice. The data represent the funding rates that districts received each year based on prior year enrollment counts. For example, 2015 represents the enrollment data collected in Oct. 2013 of the 2013-14 school year and used to calculate NSL funding distribution for the 2014-15 school year.
180 173 162 156 150 143
135
60 65 71 75 81 87 92
5 6 6 8 8 8 9
0
20
40
60
80
100
120
140
160
180
200
2009 2010 2011 2012 2013 2014 2015
Nu
mb
er
of
Dis
tric
ts
Districts, by NSL Category
<70% 70%-90% 90%+

Page 4
The districts with the highest concentrations of NSL students are primarily located along the eastern edge of the state, as indicated by the following map. Districts with mid-level concentrations of poverty are scattered across the state.
NSL Funding Rates by District, 2014-15

Page 5
Other Types of NSL Funding and Funding Adjustments In addition to the regular NSL funding, there are two other related state funding programs: NSL growth funding and NSL transitional adjustments.
NSL Transitional Adjustments
Districts with NSL percentages that are close to the funding rate break points (for example, 69%-70% and 89%-90%) can easily shift between rates from one year to the next, resulting in significant gains or losses. To ease the transition from one rate to another, Act 811 of 2007 created a provision that allows districts moving from a higher or lower funding rate to receive adjustments over a three-year period. This ensures that districts shift to a higher or lower rate gradually, rather than all at once.
Shifting to a Higher Rate
From To Year One Year Two Year Three 69% 71% $1,033-(2 X $172)=
$689 $1,033-(1 X $172)=
$861 $1,033-(0 X $172)=
$1,033 $517 $1,033
Shifting to a Lower Rate
From To Year One Year Two Year Three 71% 69% $517+(2 X $172)=
$861 $517+(1 X $172)=
$689 $517+(0 X $172)=
$517 $1,033 $517
In 2014-15, 22 districts received a transitional adjustment. Of those, only one shifted to a lower rate, while 21 shifted to a higher rate. Transitional adjustments for school districts collectively reduced their total NSL funding by $5.4 million. Two open enrollment charter schools also received transitional adjustments totaling $65,852.
NSL Growth Funding
Because NSL funding is based on the prior year’s enrollment data, growing districts receive NSL funding for a smaller number of students than they are responsible for educating. To adjust for this issue, Act 2283 of 2005 created a provision that provides additional NSL funding for growing districts. (This funding is separate from and in addition to the regular student growth funding, which is another appropriation in the Public School Fund.) Districts that have grown at least one percent in enrollment each of the last three years qualify for NSL growth funding.
For those districts that qualify for funding, the amount provided is calculated by multiplying the three-year average growth in enrollment by the district’s previous year’s NSL percentage. That amount is then multiplied by the district’s per-student NSL funding rate. An example of the NSL growth calculation is provided below.
Year Enrollment % Increase Enrollment
Increase 3-Year Average
Enrollment Increase NSL %
2011-12 1,000
12
2012-13 1,010 1% 10 2013-14 1,025 1.49% 15 2014-15 1,036 1.07% 11 75%
3-Year Average Increase in Enrollment
NSL %
NSL
Funding Rate
2014-15 Total
Growth Funding
12 X 75% X $1,033 = $9,297
Page 6
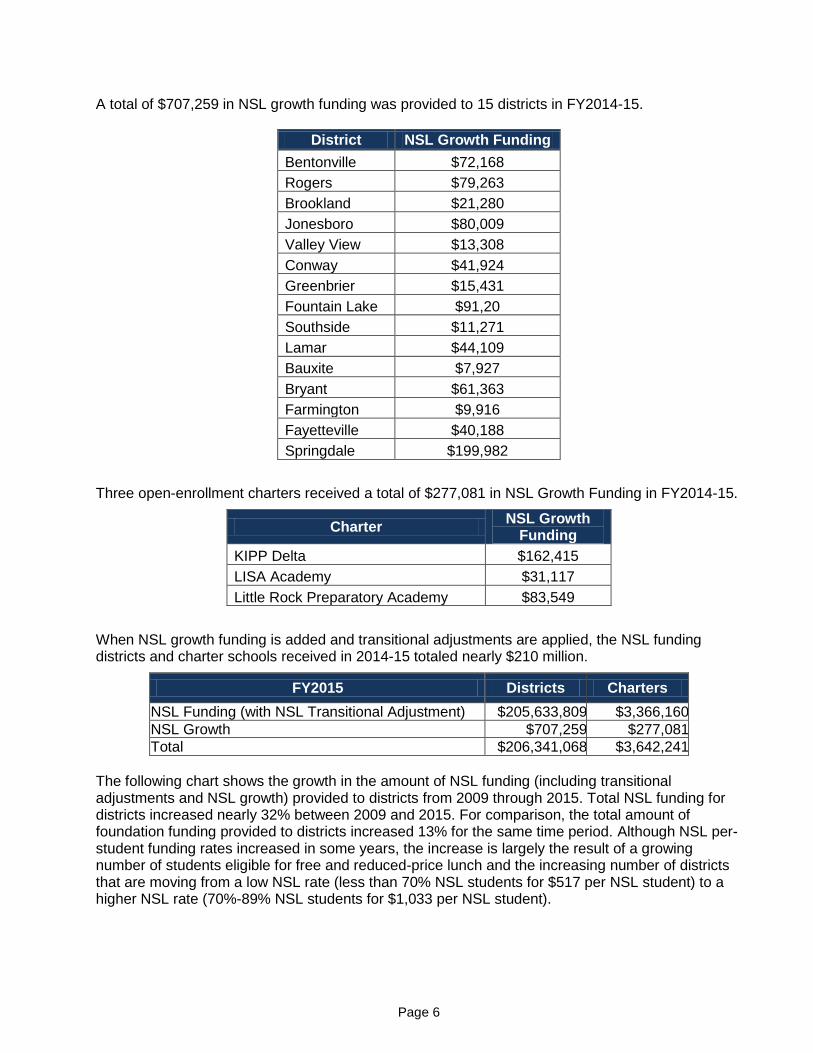
A total of $707,259 in NSL growth funding was provided to 15 districts in FY2014-15.
District NSL Growth Funding
Bentonville $72,168
Rogers $79,263
Brookland $21,280
Jonesboro $80,009
Valley View $13,308
Conway $41,924
Greenbrier $15,431
Fountain Lake $91,20
Southside $11,271
Lamar $44,109
Bauxite $7,927
Bryant $61,363
Farmington $9,916
Fayetteville $40,188
Springdale $199,982
Three open-enrollment charters received a total of $277,081 in NSL Growth Funding in FY2014-15.
Charter NSL Growth
Funding
KIPP Delta $162,415
LISA Academy $31,117
Little Rock Preparatory Academy $83,549
When NSL growth funding is added and transitional adjustments are applied, the NSL funding districts and charter schools received in 2014-15 totaled nearly $210 million.
FY2015 Districts Charters
NSL Funding (with NSL Transitional Adjustment) $205,633,809 $3,366,160 NSL Growth $707,259 $277,081 Total $206,341,068 $3,642,241
The following chart shows the growth in the amount of NSL funding (including transitional adjustments and NSL growth) provided to districts from 2009 through 2015. Total NSL funding for districts increased nearly 32% between 2009 and 2015. For comparison, the total amount of foundation funding provided to districts increased 13% for the same time period. Although NSL per-student funding rates increased in some years, the increase is largely the result of a growing number of students eligible for free and reduced-price lunch and the increasing number of districts that are moving from a low NSL rate (less than 70% NSL students for $517 per NSL student) to a higher NSL rate (70%-89% NSL students for $1,033 per NSL student).

Page 7
Source: Arkansas Department of Education, State Aid Notices. Note: The amounts in the chart above do not include reductions resulting from excessive fund balances under Act 1220 of 2011.
Total NSL funding has increased substantially for open enrollment charter schools as well. In 2008-09, only 12 of the 17 charter schools operating at the time received NSL funding. The 12 schools received a total of a little over $1 million. In 2014-15, 16 of the 18 open-enrollment charter schools in operation received NSL funding. These schools received a total of $3.6 million, more than triple the funding provided in 2009.
Source: Arkansas Department of Education: Annual Statistical Reports Note: The amounts in the chart above do not include reductions resulting from excessive fund balances under Act 1220 of 2011.
$150,000,000
$160,000,000
$170,000,000
$180,000,000
$190,000,000
$200,000,000
$210,000,000
2008-09 2009-10 2010-11 2011-12 2012-13 2013-14 2014-15
Total NSL Funding for Districts
NSL (with transitional adjustment) NSL Growth
$0
$500,000
$1,000,000
$1,500,000
$2,000,000
$2,500,000
$3,000,000
$3,500,000
$4,000,000
2008-09 2009-10 2010-11 2011-12 2012-13 2013-14 2014-15
Total NSL Funding for Charters
Total NSL Funding (including transitional adjustment and NSL Growth)

Page 8
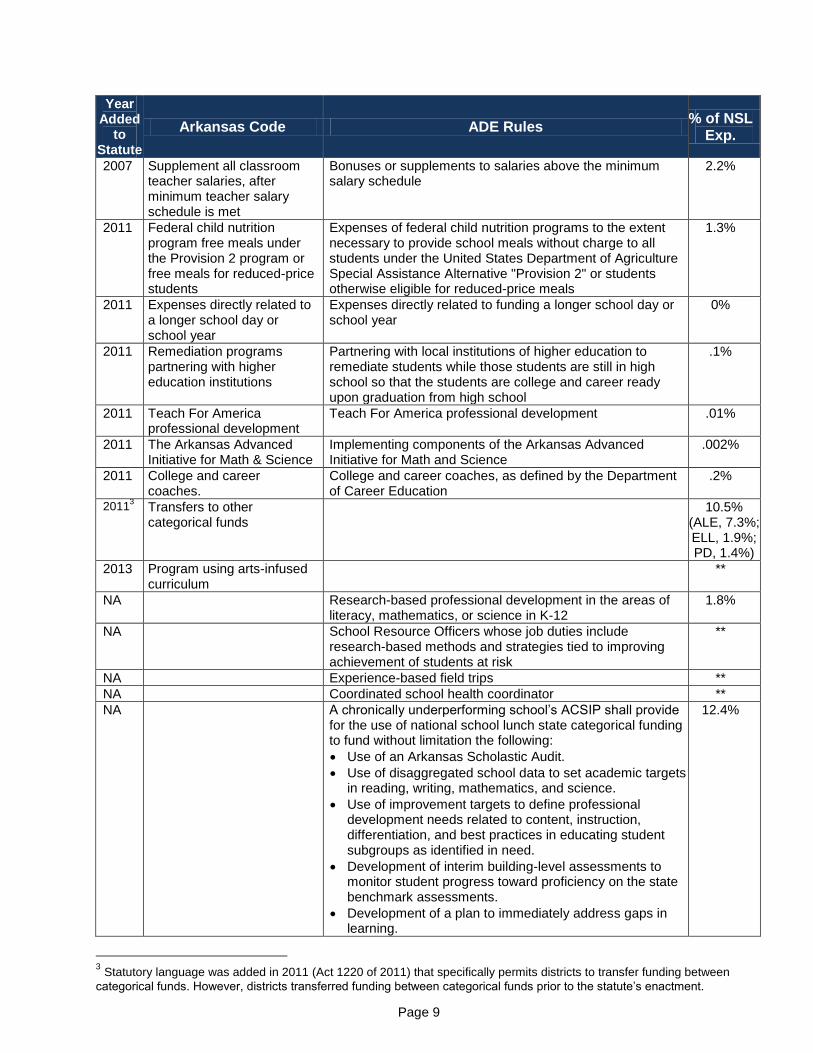
Allowable Uses and 2014 Expenditures
Unlike the per-pupil foundation funds, NSL funding is considered restricted, meaning districts can spend NSL dollars only for certain activities. A.C.A. § 6-20-2305(b)(4)(C) requires the State Board of Education to establish by rule a list of approved uses of NSL funds. The statute also provides a list of eligible uses for which districts may expend funding, but it notes that approved uses are not limited to those included in statute. The following chart lists the allowable uses specified in statute and the year in which the allowable use was adopted by the Legislature. It also lists the allowable uses spelled out in ADE’s Rules Governing the Distribution of Student Special Needs Funding. Each allowable use that does not have a year in the first column (“Year Added to Statute”) was added by rule only, not statute. The far right column, “% of NSL Exp.”, shows the percentage of all NSL expenditures statewide spent on each allowable use during the 2013-14 school year. (All expenditures described in this report are from the 2013-14 school year because 2014-15 expenditures have not been finalized.) The uses recommended by the state’s education consultants—tutors and pupil support services—are shaded in light blue. (The consultants also recommended before- and after-school programs and summer school if tutoring was insufficient. See page 4 for more information about the consultants’ recommendations.)
Year Added
to Statute
Arkansas Code ADE Rules % of NSL
Exp.
2003 Classroom teachers, provided the district meets the minimum salary schedule without using NSL funds
Highly qualified classroom teachers in K-12 7.6%
2003 Curriculum specialists Curriculum specialists and instructional facilitators or literacy, mathematics, or science specialists/coaches that meet specified requirements
21.0%
2003 Before- and after-school academic programs, including transportation
Research-based before- and after-school academic programs, including transportation
1.6%
2003 Pre-kindergarten programs coordinated by the Department of Human Services
Research-based pre-kindergarten programs that meet the program standards as outlined in the Rules Governing the Arkansas Better Chance program.
4.3%
2003 Tutors Tutors 1.9%
2003 Teachers' aides Teacher's aides 9.4%
2003 Counselors, social workers, and nurses
Licensed counselors and nurses above the mandates of the Standards for Accreditation; human service workers, licensed mental health counselors, licensed certified social workers or licensed social workers
8.4%
2003 Parent education Parent education that addresses the whole child .4%
2003 Summer programs Summer programs that implement research-based methods and strategies targeted at closing the achievement gap
1.1%
2003 Early intervention programs Early intervention programs 1.3%
2003 Materials, supplies, and equipment, including technology, used in approved programs or for approved purposes
Materials, supplies, and equipment, including technology, used in approved instructional programs or for approved purposes in support of the local educational agency’s ACSIP
**
Page 9
Year Added
to Statute
Arkansas Code ADE Rules % of NSL
Exp.
2007 Supplement all classroom teacher salaries, after minimum teacher salary schedule is met
Bonuses or supplements to salaries above the minimum salary schedule
2.2%
2011 Federal child nutrition program free meals under the Provision 2 program or free meals for reduced-price students
Expenses of federal child nutrition programs to the extent necessary to provide school meals without charge to all students under the United States Department of Agriculture Special Assistance Alternative "Provision 2" or students otherwise eligible for reduced-price meals
1.3%
2011 Expenses directly related to a longer school day or school year
Expenses directly related to funding a longer school day or school year
0%
2011 Remediation programs partnering with higher education institutions
Partnering with local institutions of higher education to remediate students while those students are still in high school so that the students are college and career ready upon graduation from high school
.1%
2011 Teach For America professional development
Teach For America professional development .01%
2011 The Arkansas Advanced Initiative for Math & Science
Implementing components of the Arkansas Advanced Initiative for Math and Science
.002%
2011 College and career coaches.
College and career coaches, as defined by the Department of Career Education
.2%
20113 Transfers to other
categorical funds 10.5%
(ALE, 7.3%; ELL, 1.9%; PD, 1.4%)
2013 Program using arts-infused curriculum
**
NA Research-based professional development in the areas of literacy, mathematics, or science in K-12
1.8%
NA School Resource Officers whose job duties include research-based methods and strategies tied to improving achievement of students at risk
**
NA Experience-based field trips **
NA Coordinated school health coordinator **
NA A chronically underperforming school’s ACSIP shall provide for the use of national school lunch state categorical funding to fund without limitation the following:
Use of an Arkansas Scholastic Audit.
Use of disaggregated school data to set academic targets in reading, writing, mathematics, and science.
Use of improvement targets to define professional development needs related to content, instruction, differentiation, and best practices in educating student subgroups as identified in need.
Development of interim building-level assessments to monitor student progress toward proficiency on the state benchmark assessments.
Development of a plan to immediately address gaps in learning.
12.4%
3 Statutory language was added in 2011 (Act 1220 of 2011) that specifically permits districts to transfer funding between
categorical funds. However, districts transferred funding between categorical funds prior to the statute’s enactment.

Page 10
Year Added
to Statute
Arkansas Code ADE Rules % of NSL
Exp.
Examination and realignment, as needed, of school scheduling, academic support systems, and assignment of personnel to improve student achievement.
Design of a plan for increasing parental knowledge and skill to support academic objectives.
Evaluation of the impact of the before-mentioned educational strategies on student achievement.
NA Paying for students in grade eleven (11) to take the ACT Assessment, pursuant to the Voluntary Universal ACT Assessment Program or operating a postsecondary preparatory program.
.02%
NA Other activities approved by the ADE. Such activities include, but are not limited to, research-based activities and activities directed at chronically underperforming schools
14.4%
** These uses do not appear to have a specific expenditure code (program code) for districts to use to record these types of expenditures.
Policymakers have frequently asked what types of programs are most helpful in raising student achievement among targeted students. The following table shows the spending patterns of districts based on the percentage of NSL students testing proficient or advanced on state assessments. Districts were divided into quartiles based on the percentage of each district’s low-income students who scored proficient or advanced on state assessments. A proficiency percentage was calculated for low-income students taking any literacy test (Literacy Benchmark for Grades 3-8 and Grade 11 Literacy Assessment) and another proficiency percentage was calculated for low-income students taking any math assessment (Math Benchmark for Grades 3-8 and Algebra and Geometry End of Course Exams). An average of the two was then calculated. Districts were ranked based on this average and placed in quartiles. The following table shows each quartile’s average percentage expenditure for each allowable use. The data show no discernible pattern in terms of NSL spending among the district with different levels of student achievement among low-income students.
Proficiency Among NSL Students
Allowable Use 43.2%-65.5%
65.6%-70.6%
70.6%-74.9%
74.9%-84.5%
Classroom teachers, provided the district meets the minimum salary schedule without using NSL funds
11.3% 7.6% 13.1% 10.2%
Curriculum specialists, coaches & instructional facilitators 20.4 20.4 19.1 21.8
Before- and after-school academic programs, including transportation to and from the programs
1.8% 1.2% 0.8% 2.0%
Pre-kindergarten programs 2.7% 2.9% 2.5% 2.5%
Tutors 1.7% 3.4% 3.3% 2.4%
Teachers' aides 7.4% 9.8% 12.4% 9.8%
Counselors, social workers, and nurses 7.5% 8.5% 8.2% 10.9%
Parent education 0.4% 0.7% 0.5% 0.1%
Summer programs 1.3% 0.6% 0.9% 0.6%
Early intervention programs 0.8% 1.7% 1.3% 1.2%
Materials, supplies, and equipment, including technology used in approved programs or for approved purposes
Supplement all classroom teacher salaries, after minimum teacher salary schedule is met
1.8% 3.1% 1.8% 0.6%
Federal child nutrition program free meals under the Provision 2 program or free meals for reduced-price students
1.7% 1.8% 0.8% 0.2%

Page 11
Proficiency Among NSL Students
Allowable Use 43.2%-65.5%
65.6%-70.6%
70.6%-74.9%
74.9%-84.5%
Expenses directly related to a longer school day or school year
0.0% 0.0% 0.0% 0.0%
Remediation programs, partnering with higher education institutions
0.04% 0.08% 0.00% 0.03%
Teach For America professional development 0.01% 0.01% 0.00% 0.00%
The Arkansas Advanced Initiative for Math and Science 0.00% 0.00% 0.00% 0.00%
College and career coaches. 0.2% 0.1% 0.2% 0.5%
Transfers to ALE 6.0% 6.7% 4.9% 6.2%
Transfers to ELL 0.3% 0.5% 0.8% 1.2%
Transfers to PD 0.7% 1.7% 1.5% 1.5%
Program using arts-infused curriculum
Research-based professional development 2.1% 2.0% .8% 1.2%
Activities related to an underperforming school’s ACSIP 18.1% 8.2% 8.7% 9.3%
Paying for students in grade eleven (11) to take the ACT 0.1% 0.2% 0.1% 0.1%
Other activities approved by the ADE. 13.9% 18.8% 18.3% 17.9%
The funding can also be examined by the number of districts that spent NSL funds—of any amount—on each funding use. The most popular NSL use, as shown in the following chart was curriculum specialists and instructional facilitators, followed by other ADE-approved activities and pupil support services.
NSL expenditures can also be viewed by more general categories, such as whether it was used to pay for employees, contracted services or supplies. The majority of NSL expenditures—about 64% for school districts and about 75% for charter schools—went toward employee salaries and
190 168 167 166
116 116
103 94
79 75
65 61 61
51 37 35 34
30 23
17 6
2 1 0 0
48 70 71 72
122 122
135 144
159 163
173 177 177
187 201 203 204
208 215
221 232
236 237 238 238
0 50 100 150 200 250
Curriculum specialists/instructional facilitators Other activities approved by ADE
Counselors, social workers, nurses Teachers' aides
Classroom teachers Transfers to ALE
ACSIP, scholastic audit, etc. Before-/after-school programs
Tutors Summer programs
PD in lit., math, science Parent education
Pre-K Transfers to PD
Free and reduced price meals ACT fees
Early intervention programs Transfers to ELL
Teacher bonuses College and career coaches
Remediation programs Teach For America PD
AAIMS Scholastic Audit
Longer School Day
NSL Uses, by # of Districts Spending on Each, 2013-14
# of Districts Spending on Use # of Districts Not Spending on Use

Page 12
benefits. Both districts and charter schools spent about 12% on supplies and materials and about 10% on contracted services (e.g., school improvement consultants).
Expenditure Category % of Total NSL Expenditures
Districts Charter Schools
Salaries and Benefits 63.52% 74.68%
Purchased Services 10.39% 10.85%
Supplies and Materials 12.05% 11.83%
Property 1.91% 2.01%
Other Uses 12.13% 0.63%
In 2013-14, districts received nearly $199 million in NSL funding (including NSL transitional adjustments and NSL growth funding), and collectively they spent about $199 million, including $21 million that districts transferred from NSL funds to other categorical funding programs. NSL funding can be carried over from one year to the next, allowing districts to spend more than they received if they have balances from previous years.
FY2014
NSL Funding Received NSL Expenditures
Districts $198,972,119 $199,454,122 Charters $3,331,118 $3,142,887
NSL Fund Balances
Because districts are allowed to carry over unspent NSL funds from one year to the next, they frequently end the year with NSL fund balances. Collectively districts had $17.30 million in NSL fund balances, or about $61 per NSL student at the end of 2013-14. Open enrollment charter schools had $259,917 in NSL fund balances. At the end of 2013-14, 225 districts had NSL fund balances (though 44 of those districts had fund balances under $10,000). Over time, more districts are carrying NSL fund balances, but they are carrying smaller individual balances.
Total NSL Fund Balance Districts
2010-11 $26.65 million 213
2011-12 $21.68 million 212
2012-13 $18.36 million 222
2013-14 $17.30 million 225
2013-14 Ending Fund Balance
Number of Districts
Number of Charter Schools
$0 13 8
1-$50,000 129 8
$50,001-$100,000 45 0
$100,001-$500,000 47 1
$500,001-$1,000,000 4 0
Total 238 17
Act 1220 of the 2011 Regular Session (A.C.A. §6-20-2305) requires districts to spend at least 85% of the total NSL allocation they receive each year. At the end of the year, districts with NSL fund balances above 15% of their current year allocation are required to reduce their balance by at least 10% each year until their balance is within 15% of the year’s allocation. If a district fails to comply, the Education Department may withhold a portion of the district’s NSL funding in the following year. The law also allows ADE to redistribute to other districts any funding it withholds.

Page 13
The law was applied for the first time to NSL fund balances at the end of 2011-12, requiring 53 districts (and two charter schools) to reduce their NSL fund balances in the 2012-13 school year. At the end of 2012-13, any of those 53 school districts that did not spend down the required 10% of their 2011-12 fund balance had NSL funding withheld in 2013-14. Eleven districts were unable to adequately spend down their NSL fund balances, and ADE withheld the following amounts from their NSL funding in 2013-14.
District Amount Withheld
Helena West-Helena $926,998
South Mississippi County $106,527
Hughes $21,395
Cleveland County $16,018
Stephens $11,611
Des Arc $7,448
Marvell $5,968
Booneville $4,304
Cutter-Morning Star $3,511
Kirby $1,744
Riverside $151
Charter Schools
Benton County School of Arts $28,869
LISA Academy $6,789
SIA Tech $1,623
(Act 1220 of 2011 also limits districts’ allowable fund balance for all four state categorical funds collectively. Districts that were unable to spend down their total categorical fund balance, were also penalized. ADE imposed this penalty by withholding NSL funds. Six districts and two charter schools had NSL funding withheld for having a total categorical fund balance above the allowable limit.) State statute allows ADE to redistribute to other districts any NSL funding the department withholds. According to ADE, withheld funds remained in the Public School Fund and were used to offset the general revenue needed to provide other funding for school districts.
Poverty Funding In Other States Like Arkansas, many states provide additional funding to school districts based on low-income student populations. However, the way the funding is distributed and the restrictions on its use varies by state. The Southern Regional Education Board (SREB) polled its 16 member states in 2013 about the way they provide this funding and published a compilation report in 2013.4 According to the report, five SREB states (Alabama, Delaware, Florida, Georgia, and West Virginia) do not provide additional funding to districts based on students’ family income. However, some of those five states may provide additional funding based on “at-risk students.” Alabama, for example provides additional funding based on the number of students who do not score at proficient levels on state assessments. Of the eleven states that do provide additional funding based on the number of low-income students, five have a complicated system that is unique to the state. The other six apply a weight to the regular per-student foundation funding for low-income students. For example, according to the
4 Southern Regional Education Board, Notes on School Finance: Selected Information on Funding for Low-
Income Students in SREB States, August 2013. Retrieved at http://www.sreb.org/cgi-bin/MySQLdb?VIEW=/public/docs/view_one.txt&docid=2186
Page 14
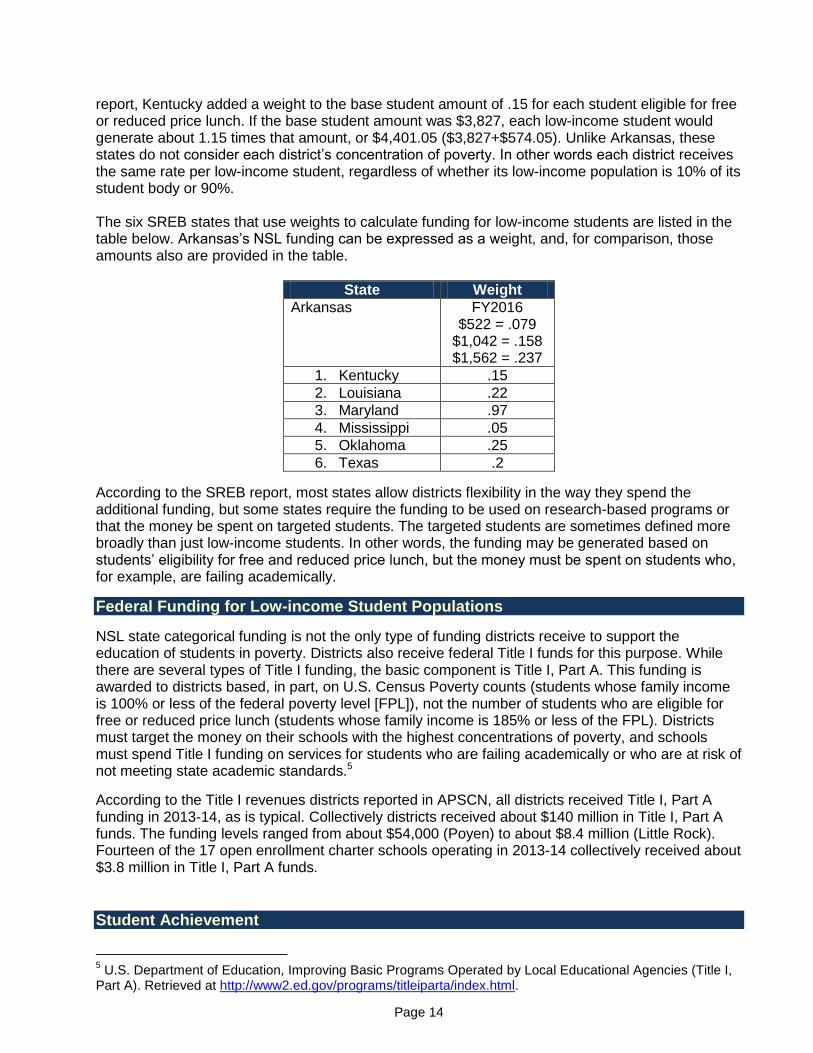
report, Kentucky added a weight to the base student amount of .15 for each student eligible for free or reduced price lunch. If the base student amount was $3,827, each low-income student would generate about 1.15 times that amount, or $4,401.05 ($3,827+$574.05). Unlike Arkansas, these states do not consider each district’s concentration of poverty. In other words each district receives the same rate per low-income student, regardless of whether its low-income population is 10% of its student body or 90%. The six SREB states that use weights to calculate funding for low-income students are listed in the table below. Arkansas’s NSL funding can be expressed as a weight, and, for comparison, those amounts also are provided in the table.
State Weight
Arkansas FY2016 $522 = .079
$1,042 = .158 $1,562 = .237
1. Kentucky .15
2. Louisiana .22
3. Maryland .97
4. Mississippi .05
5. Oklahoma .25
6. Texas .2
According to the SREB report, most states allow districts flexibility in the way they spend the additional funding, but some states require the funding to be used on research-based programs or that the money be spent on targeted students. The targeted students are sometimes defined more broadly than just low-income students. In other words, the funding may be generated based on students’ eligibility for free and reduced price lunch, but the money must be spent on students who, for example, are failing academically.
Federal Funding for Low-income Student Populations
NSL state categorical funding is not the only type of funding districts receive to support the education of students in poverty. Districts also receive federal Title I funds for this purpose. While there are several types of Title I funding, the basic component is Title I, Part A. This funding is awarded to districts based, in part, on U.S. Census Poverty counts (students whose family income is 100% or less of the federal poverty level [FPL]), not the number of students who are eligible for free or reduced price lunch (students whose family income is 185% or less of the FPL). Districts must target the money on their schools with the highest concentrations of poverty, and schools must spend Title I funding on services for students who are failing academically or who are at risk of not meeting state academic standards.5
According to the Title I revenues districts reported in APSCN, all districts received Title I, Part A funding in 2013-14, as is typical. Collectively districts received about $140 million in Title I, Part A funds. The funding levels ranged from about $54,000 (Poyen) to about $8.4 million (Little Rock). Fourteen of the 17 open enrollment charter schools operating in 2013-14 collectively received about $3.8 million in Title I, Part A funds.
Student Achievement
5 U.S. Department of Education, Improving Basic Programs Operated by Local Educational Agencies (Title I,
Part A). Retrieved at http://www2.ed.gov/programs/titleiparta/index.html.

Page 15
State Assessments The following charts show the percentage of students who took a state Benchmark or End of Course exam and scored proficient (i.e., on grade level) or advanced. (Students in some grades, such as second grade, do not take benchmark or end of course exams.) The charts compare the percentage of NSL students (low-income) who tested proficient or advanced with the percentage of non low-income (all non NSL students) who were proficient or advanced. Student achievement among NSL students has increased since the funding began, but it continues to lag behind that of students who are not eligible for free or reduced-price lunch. The achievement gap between the low-income student population and the non low-income student population narrowed some between 2008 and 2012, but has begun to widen in the last two years. (It should be noted that the Common Core State Standards were phased in between 2012 and 2014. At the same time, students were being tested with assessments that were based on the previous academic standards. This misalignment may help explain the decrease in student test scores.)
Source: National Office of Research, Measurement and Evaluation Systems, Arkansas Research Center, University of
Arkansas, Office of Innovation for Education
Source: National Office of Research, Measurement and Evaluation Systems; Arkansas Research Center; University of
Arkansas, Office of Innovation for Education
NAEP Assessment
0%
20%
40%
60%
80%
100%
2005 2006 2007 2008 2009 2010 2011 2012 2013 2014
% P
rofi
cie
nt
or
Ad
van
ced
% Proficient/Advanced: Literacy
Low Income Non Low Income
0%
20%
40%
60%
80%
100%
2005 2006 2007 2008 2009 2010 2011 2012 2013 2014 % P
rofi
cie
nt
or
Ad
van
ced
% Proficient/Advanced: Math
Low Income Non Low Income

Page 16
Because each state assesses students using its own test, it is difficult to accurately compare student proficiency from one state to another in the same way that the state compares one school’s or one district’s student performance with another. The best way to compare the student achievement of low-income students in Arkansas with those in other states is with the National Assessment of Educational Progress (NAEP) scale scores.
However, caution must be used in making state-to-state NAEP comparisons. The NAEP scores are based on a random sample of students in each state — not the entire state population of students. Therefore, these scores are estimates with sampling errors. If the entire population had been tested, the score may have differed somewhat.
Considering those cautionary notes, the following charts show how the average scale score for Arkansas’s low-income students (those eligible for free or reduced-price lunch) and non low-income (not eligible for free or reduced-price lunch) compares with the average scale scores in surrounding states and nationally. Arkansas’s low-income 4th grade students typically outperform the national average for low-income students, while the state’s non low-income students tend to score below the national average for their counterparts. Arkansas’s 8th grade students typically perform below the national average, but the state’s low-income students perform closer to the low-income national average than the state’s more affluent students compared with their counterparts nationally. Additionally, both Arkansas and the U.S. have a pronounced achievement gap between low-income and non low-income students that does not appear to be narrowing. However, the Arkansas gap is narrower than the U.S. gap in all four assessments listed in the charts below.
200
205
210
215
220
225
230
235
240
2002 2003 2005 2007 2009 2011 2013
NAEP: 4th Grade Reading
AR Low Income AR Non Low Income US Low Income US Non Low Income

Page 17
200
210
220
230
240
250
260
2000 2003 2005 2007 2009 2011 2013
NAEP: 4th Grade Math
AR Low Income AR Non Low Income US Low Income US Non Low Income
200
210
220
230
240
250
260
270
280
290
2002 2003 2005 2007 2009 2011 2013
NAEP: 8th Grade Reading
AR Low Income AR Non Low Income US Low Income US Non Low Income
200
220
240
260
280
300
320
2000 2003 2005 2007 2009 2011 2013
NAEP: 8th Grade Math
AR Low Income AR Non Low Income US Low Income US Non Low Income

Page 18
The following tables show how Arkansas’s low-income students compared with low-income students in surrounding states on the 2013 NAEP assessment. Arkansas’s low-income 4th graders scored higher than low-income students in most other surrounding states as did Arkansas’s low-income 8th graders who took the math assessment. However, the state’s low-income students ranked closer to the bottom of the selected states on the 8th grade reading assessment.
2013 4th Grade Reading 8th Grade Reading
Low-income
Non-Low-income
Low-income
Non-Low-income
Missouri 211 Tennessee 237 Missouri 256 U.S. 278
Arkansas 209 Missouri 236 Tennessee 256 Missouri 277
Oklahoma 208 U.S. 236 Texas 254 Tennessee 276
U.S. 207 Texas 234 U.S. 254 Texas 276
Texas 206 Arkansas 233 Oklahoma 254 Arkansas 275
Tennessee 205 Mississippi 231 Arkansas 253 Oklahoma 271
Louisiana 203 Oklahoma 230 Louisiana 250 Louisiana 271
Mississippi 201 Louisiana 230 Mississippi 246 Mississippi 269
2013 4th Grade Math 8th Grade Math
Low-income
Non-Low-income
Low-income
Non-Low-
income
Texas 233 Texas 256 Texas 279 Texas 300
Oklahoma 232 U.S. 254 Missouri 271 U.S. 297
Arkansas 232 Tennessee 254 U.S. 270 Missouri 294
Missouri 230 Arkansas 251 Arkansas 267 Arkansas 292
U.S. 230 Missouri 250 Oklahoma 266 Tennessee 292
Tennessee 228 Oklahoma 249 Louisiana 265 Mississippi 288
Mississippi 226 Mississippi 248 Tennessee 265 Louisiana 287
Louisiana 226 Louisiana 244 Mississippi 263 Oklahoma 286

Page 19
Other Reports on NSL Funding Use and Closing the Achievement Gap
The Arkansas Department of Education (ADE) is required to produce two reports regarding the use of NSL funding and its impact on closing the achievement gap. One of the two reports must be included in the adequacy study process. That report is due May 31, 2016, and will be provided to the Education Committees at that time. Additionally, the Arkansas Commission on Closing the Achievement Gap is statutorily required to produce an annual report that addresses NSL expenditures.
Statute Due Date Entity
Responsible Report must address Links to Reports
6-15-2701 August 1, annually
ADE The use of NSL funding by chronically underperforming schools in the state and the status of the achievement gaps at chronically underperforming schools in the state.
Link to the 2015 Report: http://www.arkleg.state.ar.us/education/K12/InitiativesDevelopmentsDocs/2015%20Achievement%20Gap%20Report%20Arkansas%20Department%20of%20Education.pdf
6-20-2305 (b)(4)(C)(xii)(E)(ii)
May 31 of even numbered years
ADE The impact of NSL funding on closing the achievement gap, including:
How school districts spend NSL funds, including specific programs used by school districts;
The amount of NSL funds transferred to other categorical funds, including a reason for the transfers;
The analysis of student achievement data evaluated in growth models, including the evaluation of the best estimates of classroom, school, and school district effects on narrowing the achievement gap.
Report must be included in adequacy study.
Link to the 2014 Report http://www.arkleg.state.ar.us/education/K12/AdequacyReports/2014/2014-06-09/2014%20ADE%20Biannual%20Report%20-%20NSL%20Impact%20on%20Closing%20the%20Achievement%20Gap%20per%20ACA%206-20-2305%28b%29%284%29%28E%29.pdf
6-15-1601 Nov. 1, annually
Commission on Closing the Achievement Gap
Profiles of underachieving students and chronically under-performing schools and districts
Review of policies and programs approved by ADE for NSL expenditures on closing the achievement gap
Child poverty statistics in the state and the impact poverty has on education
Successful strategies with students of poverty
Best practices for teacher preparation for student and language diversity
Review of leadership challenges in closing the achievement gap
Suggested policy changes to improve the achievement gap at the legislative, ADE, and school district level
Link to the 2014 Report http://www.arkansased.gov/public/userfiles/Policy_and_Special_Projects/GAP_2014/2014_AnnualReport_ClosingTheGap.pdf
Page 20
Summary Conclusion
National School Lunch (NSL) state categorical funding is state money distributed to school districts based on the levels of poverty among their students. The state funding is called NSL funding because eligibility for the federal National School Lunch Act program is used as the measure of poverty. Nearly 290,000 of the roughly 475,000 students enrolled in the state’s school districts and open-enrollment charter schools, or about 61%, are eligible for free or reduced price lunch. Both the number and the percentage of NSL students, has been increasing annually over the last six years. The amount of NSL funding districts and charter schooIs receive is based on the percentage of their students who are eligible for free or reduced-price lunch (NSL students). In 2014-15, districts with less than 70% NSL students received $517 per NSL student. Districts with between 70% and 90% NSL students received $1,033 per NSL student, and districts with 90% or more NSL students received $1,549 per NSL student. In 2014-15, about 57% of the districts fell into the lowest NSL funding rate (<70%), while 39% were in the middle rate (70%-<90%) and just nine districts (4%) were in the highest funding rate (90%+). The number of districts in the lowest funding rate has decreased in recent years, while those in the middle rate has increased. Total NSL funding for districts increased nearly 32% between 2009 and 2015 largely due to an increasing number of students who are eligible for free or reduced price lunch and an increasing number of districts receiving funding at the higher rates. Additionally, a growing number of charter schools are qualifying for NSL funding, causing NSL funding for charters to triple between 2008 and 2015. NSL funding is considered restricted, meaning districts can spend NSL dollars only for activities specified in statute or rule. Collectively, districts spent the highest amount of NSL dollars on curriculum specialists/instructional facilitators, activities called for in their school improvement plan, and activities not specified in law or rule but individually approved by the Arkansas Department of Education. Districts also transferred about 10% of their NSL funds to other categorical programs. When districts were grouped by the student achievement levels of their NSL students, there was very little difference among the groups’ spending patterns. Districts with the highest achieving NSL students did not spend their NSL dollars much differently from the districts with the lowest achieving NSL students. This report also examined the patterns in student achievement among NSL students statewide on state assessments. While the test scores of low-income and non-low-income students has increased over the last decade, low-income students continue to score below more affluent students. This achievement gap narrowed some between 2008 and 2012, but has begun to widen slightly in the last two years. The NAEP exam is used to compare Arkansas students’ test scores with others’ across the country. Arkansas’s low-income 4th grade students typically outperform the national average for low-income students, while the state’s non low-income students tend to score below the national average for non-low income students. Arkansas’s 8th grade students of all income rages generally perform below the national average. However, the achievement gap between the state’s low income 8th grade students and the national average for low-income students is smaller than the gap between the state’s non-low-income students and the national average for non-low-income students.

Page 21
Appendix
National School Lunch State Categorical Funding Amounts, 2014-15
County District Prior
Year NSL Students
NSL Funding NSL
Transitional Adjustment
Act 1220 or 2011 With-
holding
NSL Growth Funding
Total NSL Funding
ARKANSAS DEWITT 822 $424,974 $424,974
ARKANSAS STUTTGART 1,106 $571,802 $571,802
ASHLEY CROSSETT 1,058 $546,986 $546,986
ASHLEY HAMBURG 1,090 $563,530 $563,530
BAXTER COTTER 471 $486,543 -$162,024 $324,519
BAXTER MOUNTAIN HOME 2,104 $1,087,768 $1,087,768
BAXTER NORFORK 366 $378,078 $378,078
BENTON BENTONVILLE 4,098 $2,118,666 $72,168 $2,190,834
BENTON DECATUR 450 $464,850 $464,850
BENTON GENTRY 921 $476,157 $476,157
BENTON GRAVETTE 914 $472,538 $472,538
BENTON ROGERS 9,031 $4,669,027 $79,263 $4,748,290
BENTON SILOAM SPRINGS 2,334 $1,206,678 $1,206,678
BENTON PEA RIDGE 813 $420,321 $420,321
BOONE ALPENA 324 $167,508 $167,508
BOONE BERGMAN 580 $299,860 $299,860
BOONE HARRISON 1,447 $748,099 $748,099
BOONE OMAHA 321 $331,593 $331,593
BOONE VALLEY SPRINGS 428 $221,276 $221,276
BOONE LEAD HILL 292 $301,636 -$14,724 $286,912
BRADLEY HERMITAGE 340 $351,220 $351,220
BRADLEY WARREN 1,210 $1,249,930 $1,249,930
CALHOUN HAMPTON 373 $385,309 -$64,156 $321,153
CARROLL BERRYVILLE 1,211 $626,087 $626,087
CARROLL EUREKA SPRINGS 425 $219,725 $219,725
CARROLL GREEN FOREST 1,023 $1,056,759 $1,056,759
CHICOT DERMOTT 402 $622,698 $622,698
CHICOT LAKESIDE 917 $947,261 $947,261
CLARK ARKADELPHIA 1,111 $574,387 $574,387
CLARK GURDON 565 $583,645 $583,645
CLAY CORNING 686 $708,638 $708,638
CLAY PIGGOTT 511 $264,187 -$34,331 $229,856
CLAY RECTOR 343 $177,331 $177,331
CLEBURNE CONCORD 315 $162,855 $162,855
CLEBURNE HEBER SPRINGS 884 $457,028 $457,028
CLEBURNE QUITMAN 365 $188,705 $188,705
CLEBURNE WEST SIDE 243 $125,631 $125,631
CLEVELAND WOODLAWN 224 $115,808 -$11,526 $104,282
CLEVELAND CLEVELAND COUNTY 536 $277,112 -$40,122 $236,990
COLUMBIA MAGNOLIA 1,975 $1,021,330 $1,021,330
COLUMBIA EMERSON-TAYLOR-BRADLEY
528 $272,976 $272,976
CONWAY NEMO VISTA 255 $131,835 $131,835
CONWAY WONDERVIEW 226 $116,842 -$16,268 $100,574
CONWAY SO CONWAY COUNTY 1,478 $764,126 $764,126
CRAIGHEAD BAY 368 $190,256 $190,256

Page 22
County District Prior
Year NSL Students
NSL Funding NSL
Transitional Adjustment
Act 1220 or 2011 With-
holding
NSL Growth Funding
Total NSL Funding
CRAIGHEAD WESTSIDE CONSOLIDATED 979 $506,143 $506,143
CRAIGHEAD BROOKLAND 703 $363,451 $21,280 $384,731
CRAIGHEAD BUFFALO ISLAND CENTRAL 457 $236,269 $236,269
CRAIGHEAD JONESBORO 4,188 $4,326,204 $80,009 $4,406,213
CRAIGHEAD NETTLETON 2,075 $1,072,775 $1,072,775
CRAIGHEAD VALLEY VIEW 697 $360,349 $13,308 $373,657
CRAIGHEAD RIVERSIDE 525 $271,425 -$8,192 $263,233
CRAWFORD ALMA 1,745 $902,165 $902,165
CRAWFORD CEDARVILLE 624 $644,592 $644,592
CRAWFORD MOUNTAINBURG 507 $523,731 $523,731
CRAWFORD MULBERRY/PLEASANT VIEW BI-COUNTY
278 $287,174 $287,174
CRAWFORD VAN BUREN 3,694 $1,909,798 $1,909,798
CRITTENDEN EARLE 579 $896,871 $896,871
CRITTENDEN WEST MEMPHIS 4,052 $4,185,716 $4,185,716
CRITTENDEN MARION 2,651 $1,370,567 $1,370,567
CROSS CROSS COUNTY 505 $521,665 $521,665
CROSS WYNNE 1,650 $853,050 $853,050
DALLAS FORDYCE 622 $642,526 -$106,984 $535,542
DESHA DUMAS 1,141 $1,178,653 $1,178,653
DESHA MCGEHEE 897 $926,601 $926,601
DREW DREW CENTRAL 662 $683,846 $683,846
DREW MONTICELLO 1,132 $585,244 $585,244
FAULKNER CONWAY 4,913 $2,540,021 $41,924 $2,581,945
FAULKNER GREENBRIER 1,220 $630,740 $15,431 $646,171
FAULKNER GUY-PERKINS 229 $118,393 $118,393
FAULKNER MAYFLOWER 664 $343,288 $343,288
FAULKNER MOUNT VERNON/ENOLA 297 $153,549 $153,549
FAULKNER VILONIA 1,308 $676,236 $676,236
FRANKLIN CHARLESTON 390 $201,630 $201,630
FRANKLIN COUNTY LINE 287 $148,379 $148,379
FRANKLIN OZARK 1,017 $525,789 $525,789
FULTON MAMMOTH SPRING 285 $147,345 $147,345
FULTON SALEM 523 $270,391 $270,391
FULTON VIOLA 238 $123,046 $123,046
GARLAND CUTTER-MORNING STAR 437 $451,421 -$75,164 -$37,630 $338,627
GARLAND FOUNTAIN LAKE 815 $421,355 -$1,377 $9,120 $429,098
GARLAND HOT SPRINGS 2,857 $2,951,281 $2,951,281
GARLAND JESSIEVILLE 639 $660,087 -$219,816 $440,271
GARLAND LAKE HAMILTON 2,343 $1,211,331 $1,211,331
GARLAND LAKESIDE 1,376 $711,392 $711,392
GARLAND MOUNTAIN PINE 446 $460,718 $460,718
GRANT POYEN 314 $162,338 $162,338
GRANT SHERIDAN 2,114 $1,092,938 $1,092,938
GREENE MARMADUKE 474 $245,058 $245,058
GREENE GREENE COUNTY TECH 1,826 $944,042 $944,042
GREENE PARAGOULD 1,858 $960,586 $960,586
HEMPSTEAD BLEVINS 416 $429,728 $429,728
HEMPSTEAD HOPE 2,023 $2,089,759 $2,089,759
HEMPSTEAD SPRING HILL 289 $149,413 $149,413

Page 23
County District Prior
Year NSL Students
NSL Funding NSL
Transitional Adjustment
Act 1220 or 2011 With-
holding
NSL Growth Funding
Total NSL Funding
HOT SPRING BISMARCK 622 $321,574 $321,574
HOT SPRING GLEN ROSE 553 $285,901 $285,901
HOT SPRING MAGNET COVE 292 $150,964 $150,964
HOT SPRING MALVERN 1,551 $1,602,183 $1,602,183
HOT SPRING OUACHITA 248 $128,216 $128,216
HOWARD DIERKS 363 $187,671 $187,671
HOWARD MINERAL SPRINGS 367 $568,483 -$63,124 -$169,758 $335,601
HOWARD NASHVILLE 1,271 $657,107 $657,107
INDEPENDENCE BATESVILLE 1,581 $817,377 $817,377
INDEPENDENCE SOUTHSIDE 975 $504,075 $11,271 $515,346
INDEPENDENCE MIDLAND 354 $365,682 -$60,888 -$3,509 $301,285
INDEPENDENCE CEDAR RIDGE 557 $287,969 $287,969
IZARD CALICO ROCK 274 $141,658 $141,658
IZARD MELBOURNE 512 $264,704 $264,704
IZARD IZARD CO CONSOLIDATED 339 $350,187 $350,187
JACKSON NEWPORT 1,009 $1,042,297 $1,042,297
JACKSON JACKSON COUNTY 535 $276,595 $276,595
JEFFERSON DOLLARWAY 1,209 $1,872,741 $1,872,741
JEFFERSON PINE BLUFF 3,734 $3,857,222 $3,857,222
JEFFERSON WATSON CHAPEL 2,142 $2,212,686 $2,212,686
JEFFERSON WHITE HALL 1,306 $675,202 $675,202
JOHNSON CLARKSVILLE 1,889 $1,951,337 -$649,816 $1,301,521
JOHNSON LAMAR 873 $901,809 -$150,156 $44,109 $795,762
JOHNSON WESTSIDE 480 $495,840 $495,840
LAFAYETTE LAFAYETTE COUNTY 571 $589,843 $589,843
LAWRENCE HOXIE 635 $655,955 $655,955
LAWRENCE SLOAN-HENDRIX 438 $226,446 $226,446
LAWRENCE HILLCREST 245 $126,665 $126,665
LAWRENCE LAWRENCE COUNTY 692 $357,764 $357,764
LEE LEE COUNTY 799 $1,237,651 $1,237,651
LINCOLN STAR CITY 996 $514,932 $514,932
LITTLE RIVER ASHDOWN 910 $470,470 $470,470
LITTLE RIVER FOREMAN 379 $391,507 $391,507
LOGAN BOONEVILLE 917 $947,261 -$157,724 $789,537
LOGAN MAGAZINE 412 $425,596 $425,596
LOGAN PARIS 758 $391,886 $391,886
LOGAN SCRANTON 234 $120,978 $120,978
LONOKE LONOKE 1,101 $569,217 $569,217
LONOKE ENGLAND 576 $595,008 $595,008
LONOKE CARLISLE 417 $215,589 $215,589
LONOKE CABOT 4,122 $2,131,074 $2,131,074
MADISON HUNTSVILLE 1,362 $704,154 $704,154
MARION FLIPPIN 572 $590,876 -$98,384 $492,492
MARION YELLVILLE-SUMMIT 526 $271,942 $271,942
MILLER GENOA CENTRAL 532 $275,044 $275,044
MILLER FOUKE 617 $318,989 $318,989
MILLER TEXARKANA 2,995 $3,093,835 -$1,030,280 $2,063,555
MISSISSIPPI ARMOREL 156 $80,652 $80,652
MISSISSIPPI BLYTHEVILLE 2,011 $2,077,363 $2,077,363
MISSISSIPPI RIVERCREST 983 $1,015,439 -$8,668 $1,006,771

Page 24
County District Prior
Year NSL Students
NSL Funding NSL
Transitional Adjustment
Act 1220 or 2011 With-
holding
NSL Growth Funding
Total NSL Funding
MISSISSIPPI GOSNELL 887 $458,579 $458,579
MISSISSIPPI MANILA 646 $333,982 $333,982
MISSISSIPPI OSCEOLA 1,165 $1,804,585 -$400,760 $1,403,825
MONROE BRINKLEY 413 $426,629 $426,629
MONROE CLARENDON 544 $842,656 -$187,136 $655,520
MONTGOMERY CADDO HILLS 450 $464,850 $464,850
MONTGOMERY MOUNT IDA 355 $183,535 $183,535
NEVADA PRESCOTT 756 $780,948 $780,948
NEVADA NEVADA 319 $329,265 $329,265
NEWTON JASPER 640 $661,120 $661,120
NEWTON DEER/MT. JUDEA 274 $283,042 $283,042
OUACHITA BEARDEN 411 $424,563 -$57,598 $366,965
OUACHITA CAMDEN-FAIRVIEW 1,976 $2,040,961 $2,040,961
OUACHITA HARMONY GROVE 525 $271,425 $271,425
PERRY EAST END 347 $179,399 $179,399
PERRY PERRYVILLE 541 $279,697 $279,697
PHILLIPS BARTON-LEXA 629 $649,757 $649,757
PHILLIPS HELENA-W HELENA 1,592 $2,466,008 $2,466,008
PHILLIPS MARVELL 383 $593,267 -$45,165 $548,102
PIKE CENTERPOINT 658 $340,186 $340,186
PIKE KIRBY 243 $251,019 -$83,592 $167,427
PIKE SOUTH PIKE COUNTY 499 $515,467 -$171,656 $343,811
POINSETT HARRISBURG 938 $968,954 $968,954
POINSETT MARKED TREE 441 $455,553 -$1,338 $454,215
POINSETT TRUMANN 1,289 $1,331,537 $1,331,537
POINSETT EAST POINSETT COUNTY 553 $571,249 $571,249
POLK MENA 1,166 $602,822 $602,822
POLK OUACHITA RIVER 471 $486,543 $486,543
POLK COSSATOT RIVER 863 $891,479 $891,479
POPE ATKINS 643 $332,431 $332,431
POPE DOVER 872 $450,824 $450,824
POPE HECTOR 436 $450,388 $450,388
POPE POTTSVILLE 702 $362,934 $362,934
POPE RUSSELLVILLE 2,968 $1,534,456 $1,534,456
PRAIRIE DES ARC 386 $398,738 $398,738
PRAIRIE HAZEN 432 $223,344 $148,608 $371,952
PULASKI LITTLE ROCK 17,035 $17,597,155 $17,597,155
PULASKI N LITTLE ROCK 6,012 $6,210,396 -$1,034,064 $5,176,332
PULASKI PULASKI COUNTY 8,841 $4,570,797 $4,570,797
RANDOLPH MAYNARD 336 $347,088 $347,088
RANDOLPH POCAHONTAS 1,104 $570,768 $570,768
ST FRANCIS FORREST CITY 2,415 $2,494,695 $2,494,695
ST FRANCIS HUGHES 296 $305,768 $305,768
ST FRANCIS PALESTINE-WHEATLEY 559 $577,447 $577,447
SALINE BAUXITE 731 $377,927 $7,927 $385,854
SALINE BENTON 1,964 $1,015,388 $1,015,388
SALINE BRYANT 3,438 $1,777,446 $61,363 $1,838,809
SALINE HARMONY GROVE 485 $250,745 $250,745
SCOTT WALDRON 1,090 $1,125,970 $1,125,970
SEARCY SEARCY COUNTY 623 $643,559 $643,559

Page 25
County District Prior
Year NSL Students
NSL Funding NSL
Transitional Adjustment
Act 1220 or 2011 With-
holding
NSL Growth Funding
Total NSL Funding
SEARCY OZARK MOUNTAIN 497 $513,401 $513,401
SEBASTIAN FORT SMITH 10,265 $10,603,745 $10,603,745
SEBASTIAN GREENWOOD 1,209 $625,053 $625,053
SEBASTIAN HACKETT 363 $187,671 $187,671
SEBASTIAN HARTFORD 233 $240,689 -$40,076 $200,613
SEBASTIAN LAVACA 435 $224,895 $224,895
SEBASTIAN MANSFIELD 531 $274,527 $274,527
SEVIER DEQUEEN 1,848 $1,908,984 $1,908,984
SEVIER HORATIO 623 $643,559 -$107,156 $536,403
SHARP CAVE CITY 928 $958,624 $958,624
SHARP HIGHLAND 1,030 $532,510 $532,510
STONE MOUNTAIN VIEW 1,103 $570,251 $570,251
UNION EL DORADO 2,830 $1,463,110 $1,463,110
UNION JUNCTION CITY 333 $172,161 $172,161
UNION PARKERS CHAPEL 283 $146,311 $146,311
UNION SMACKOVER-NORPHLET 645 $333,465 $333,465
UNION STRONG-HUTTIG 345 $356,385 $356,385
VAN BUREN CLINTON 931 $961,723 $961,723
VAN BUREN SHIRLEY 316 $326,428 $326,428
VAN BUREN SOUTH SIDE 268 $138,556 $138,556
WASHINGTON ELKINS 510 $263,670 $263,670
WASHINGTON FARMINGTON 963 $497,871 $9,916 $507,787
WASHINGTON FAYETTEVILLE 3,800 $1,964,600 $40,188 $2,004,788
WASHINGTON GREENLAND 516 $266,772 $266,772
WASHINGTON LINCOLN CONSOLIDATED 853 $881,149 $881,149
WASHINGTON PRAIRIE GROVE 849 $438,933 $438,933
WASHINGTON SPRINGDALE 13,832 $7,151,144 $199,982 $7,351,126
WASHINGTON WEST FORK 697 $360,349 $360,349
WHITE BALD KNOB 838 $433,246 $433,246
WHITE BEEBE 1,645 $850,465 -$10,511 $839,954
WHITE BRADFORD 360 $371,880 $371,880
WHITE WHITE COUNTY CENTRAL 464 $479,312 -$159,616 $319,696
WHITE RIVERVIEW 1,019 $1,052,627 $1,052,627
WHITE PANGBURN 439 $226,963 $226,963
WHITE ROSE BUD 503 $260,051 $260,051
WHITE SEARCY 2,092 $1,081,564 $1,081,564
WOODRUFF AUGUSTA 380 $392,540 $392,540
WOODRUFF MCCRORY 388 $200,596 $200,596
YELL DANVILLE 672 $694,176 $694,176
YELL DARDANELLE 1,478 $1,526,774 -$508,432 $1,018,342
YELL WESTERN YELL COUNTY 328 $338,824 $338,824
YELL TWO RIVERS 638.00 $659,054 $659,054