national school lunch program: background, trends, and issues
TRANSCRIPT

Economic ResearchReportNumber 61
July 2008
United States Department of Agriculture
Economic Research Service
Katherine RalstonConstance Newman Annette ClausonJoanne GuthrieJean Buzby
The National School Lunch Program:Background, Trends, and Issues

ww
w.er
s.usda.gov
You can find additional information about ERS publications, databases, and other products at our website.
Visit Our Website To Learn More!
National Agricultural LibraryCataloging Record:
The U.S. Department of Agriculture (USDA) prohibits discrimination in all its programs and activities on the basis of race, color, national origin, age, disability, and, where applicable, sex, marital status, familial status, parental status, religion, sexual orientation, genetic information, political beliefs, reprisal, or because all or a part of an individual's income is derived from any public assistance program. (Not all prohibited bases apply to all programs.) Persons with disabilities who require alternative means for communication of program information (Braille, large print, audiotape, etc.) should contact USDA's TARGET Center at (202) 720-2600 (voice and TDD).
To file a complaint of discrimination write to USDA, Director, Office of Civil Rights, 1400 Independence Avenue, S.W., Washington, D.C. 20250-9410 or call (800) 795-3272 (voice) or (202) 720-6382 (TDD). USDA is an equal opportunity provider and employer.
The national school lunch program : backgrounds, trends, and issues.
(Economic research report (United States. Dept. of Agriculture. Economic Research Service) ; no. 61)
1. National school lunch program. 2. School children—Nutrition—United States.
3. Obesity in children—United States. 4. Food relief—United States.
I. Ralston, Katherine. II. United States. Dept. of Agriculture. Economic Research Service.
III. Title.
HV696.F6
www.ers.usda.gov
Photo credit: GettyImages
United StatesDepartmentof Agriculture
www.ers.usda.gov
A Report from the Economic Research Service
Abstract
The National School Lunch Program (NSLP) is the Nation’s second largest food and nutrition assistance program. In 2006, it operated in over 101,000 public and nonprofi t private schools and provided over 28 million low-cost or free lunches to children on a typical school day at a Federal cost of $8 billion for the year. This report provides background information on the NSLP, including historical trends and participant charac-teristics. It also addresses steps being taken to meet challenges facing administrators of the program, including tradeoffs between nutritional quality of foods served, costs, and participation, as well as between program access and program integrity.
Keywords: National School Lunch Program, child nutrition, obesity, food assistance
Acknowledgments
The authors wish to thank Elise Golan, Mark Prell, and Ram Chandran of USDA’s Economic Research Service, Ken Clayton of USDA’s Agricultural Marketing Service, and several anonymous reviewers for many helpful suggestions. We also thank John Weber for patient editing, and Cynthia A. Ray for expert design and layout.
Katherine Ralston, Constance Newman, Annette Clauson, Joanne Guthrie, and Jean Buzby
The National School Lunch Program
Background, Trends, and Issues
EconomicResearchReportNumber 61
July 2008

iiThe National School Lunch Program: Background, Trends, and Issues / ERR-61
Economic Research Service/USDA
Contents
Summary. . . . . . . . . . . . . . . . . . . . . . . . . . . . . . . . . . . . . . . . . . . . . . . . . . . iii
Abbreviations . . . . . . . . . . . . . . . . . . . . . . . . . . . . . . . . . . . . . . . . . . . . . . . vi
Overview of the National School Lunch Program . . . . . . . . . . . . . . . . . . 1
NSLP History and Trends. . . . . . . . . . . . . . . . . . . . . . . . . . . . . . . . . . . . . . 6 Legislative and Regulatory History . . . . . . . . . . . . . . . . . . . . . . . . . . . . . 6 Participation and Costs Increase Overall . . . . . . . . . . . . . . . . . . . . . . . . . 6
Characteristics of NSLP Participants . . . . . . . . . . . . . . . . . . . . . . . . . . . 10 Participant Characteristics by Meal Type . . . . . . . . . . . . . . . . . . . . . . . . 12 Preteens in All Categories Participate More Than Other Age Groups . . . . . . . . . . . . . . . . . . . . . . . . . . . . . . . . . . . . . . . . 12 Ethnic Composition Infl uenced by Income. . . . . . . . . . . . . . . . . . . . . . . 13 Income as a Ratio of Poverty by Meal Type. . . . . . . . . . . . . . . . . . . . . . 14
Issues of NSLP Outcomes: Is NSLP Making Children Overweight To Support Agriculture? . . . . . . . . . . . . . . . . . . . . . . . . . . . . . . . . . . . . . . 16 How NSLP Can Infl uence Children’s Diets . . . . . . . . . . . . . . . . . . . . . . 16 Donated Commodities. . . . . . . . . . . . . . . . . . . . . . . . . . . . . . . . . . . . . . . 16 Meal Requirements . . . . . . . . . . . . . . . . . . . . . . . . . . . . . . . . . . . . . . . . . 18 Limited Effect on Agriculture Observed . . . . . . . . . . . . . . . . . . . . . . . . 21 Effects on Diets: Some Good News... . . . . . . . . . . . . . . . . . . . . . . . . . . 21 . . .And Some Challenges . . . . . . . . . . . . . . . . . . . . . . . . . . . . . . . . . . . . 23 Effects on Childhood Overweight Uncertain . . . . . . . . . . . . . . . . . . . . . 23 The Bottom Line: Stay Tuned. . . . . . . . . . . . . . . . . . . . . . . . . . . . . . . . . 25
Issues of NSLP Outcomes: Juggling Nutrition, Participation, and the Budget . . . . . . . . . . . . . . . . . . . . . . . . . . . . . . . . . . 26 Efforts To Increase Acceptance of More Healthful Lunches . . . . . . . . . 27 Other Factors That Affect Participation and Plate Waste . . . . . . . . . . . . 28 Meal Production Costs Increasing Faster Than Revenues . . . . . . . . . . . 29 Revenue-Generating Competitive Foods Under Scrutiny . . . . . . . . . . . 30
Administrative Issues: Access and Integrity Tradeoffs . . . . . . . . . . . . . 34 Erroneous Payments Closely Studied . . . . . . . . . . . . . . . . . . . . . . . . . . . 35 Longer Eligibility Period Reduces Overcertifi cation . . . . . . . . . . . . . . . 36 Documentation Requirements May Deter Applicants . . . . . . . . . . . . . . 37 Direct Certifi cation Removes a Barrier for Applicants. . . . . . . . . . . . . . 37
Conclusions . . . . . . . . . . . . . . . . . . . . . . . . . . . . . . . . . . . . . . . . . . . . . . . . . 39
References . . . . . . . . . . . . . . . . . . . . . . . . . . . . . . . . . . . . . . . . . . . . . . . . . . 40
Recommended citation format for this publication:
Ralston, Katherine, Constance Newman, Annette Clauson, Joanne Guthrie, and Jean Buzby. The National School Lunch Program: Background, Trends, and Issues. ERR-61, U.S. Dept. of Agri., Econ. Res. Serv. July 2008.
iiiThe National School Lunch Program: Background, Trends, and Issues / ERR-61
Economic Research Service/USDA
Summary
The National School Lunch Program (NSLP) is one of the largest food and nutrition assistance programs in the United States, feeding millions of chil-dren every day. During the 2006 school year, the program served 28 million lunches daily, on average, at a cost of $8 billion for the year. School meal providers face the task of serving nutritious and appealing school lunches, including free and reduced-price lunches for low-income students, and doing so under budget constraints. This report is intended as a briefi ng for policymakers and other stakeholders on the history and basic features of the program. It also addresses steps being taken by school food authorities and USDA’s Food and Nutrition Service (FNS) in response to challenges faced by program administrators.
What Is the Issue?
One of the main goals of NSLP as identifi ed by Congress is to promote the health and well-being of the Nation’s children. In recent years, questions have been raised about the program’s ability to meet this goal, especially as the main nutrition problem has shifted from undernutrition to overweight and obesity. Public concern for the program has focused on whether it is contributing to the growing problem of childhood obesity and on the quality of foods available to schoolchildren. In response, many States and locali-ties have imposed stricter nutritional requirements on both NSLP meals and “competitive foods” (other foods and beverages available in the school). School meal providers have wrestled with meeting these restrictions and other program requirements while covering rising costs and encouraging student participation. Meanwhile, issues at the Federal level include how to help school meal providers improve the nutritional quality of foods served as well as how to balance program access and integrity, particularly in regard to ensuring that ineligible students do not receive free or reduced-price lunches.
What Did the Study Find?
Most issues related to the NSLP touch upon, in one way or another, two, if not all three, components of a school meal “trilemma” involving the meal’s nutrition, program cost, and student participation in the program. This trilemma applies to competitive foods as well because revenues from these foods can be important to the budgets of both the cafeteria and the school as a whole. A change to one component of the trilemma can have unintentional effects on either or both of the other components.
Nutritional quality of foods. Results are inconclusive from the best designed studies comparing the weight gain of NSLP participants with that of nonpar-ticipants. One study shows no effect of program participation on children’s obesity, and another study shows a small effect. The most rigorous study of nutrient intake shows similar calorie intakes for participants and nonpartici-pants but higher fat and sodium intakes for participants. While some studies fi nd that participants derive important nutritional benefi ts from participating in the program, including higher intake of key nutrients and underconsumed foods and lower intake of sweets, other fi ndings suggest that participants have high intakes of fat and sodium, and that a substantial share of school

ivThe National School Lunch Program: Background, Trends, and Issues / ERR-61
Economic Research Service/USDA
meal providers are not ensuring that foods meet the recommended levels of fat and sodium.
Program costs and revenues. To defray costs, many schools, and, sometimes, the school food service itself, depend on revenues from competitive foods, even though such foods have been found to contribute to overconsumption of calories, increased plate waste of nutritionally balanced NSLP lunches, and decreased intakes of nutrients by students. Rising costs also have increased pressure on school boards to use private foodservice management companies. The size of these operations provides them with greater purchasing power to procure foods. Many also reduce costs by providing lower benefi t levels to their employees than those provided to employees of inhouse school meal providers.
Several studies show that schools could reduce the fat content of foods offered and increase consumption of underconsumed foods, such as milk and vegetables, while still maintaining revenue levels and NSLP participation levels. This can be done by exposing students to new foods, updating menus, changing the way food is presented, and providing nutrition education. USDA has assisted schools in this effort by providing grants for educational resources through its Team Nutrition initiative and by including lower fat foods as part of the commodities it donates to the program.
Access and integrity. In the late 1990s, concerns arose that certifi cation errors were enabling ineligible students to receive free or reduced-price meals from NSLP. Studies to uncover the sources of the errors found that household incomes of students often changed during the year, causing some students to move in and out of monthly eligibility. The 2004 Child Nutrition Reauthorization Act established eligibility for certifi ed students for a full year, and this change has eliminated errors related to income vola-tility. Direct certifi cation—automatic certifi cation for children in households participating in the Food Stamp Program, Temporary Assistance for Needy Families, or the Food Distribution Program on Indian Reservations—has also reduced error rates and has been shown to increase participation by students eligible for a free school lunch. The Act required all schools to phase in direct certifi cation and to use new methods to verify eligibility of students. The new policies are expected to reduce, but not totally eliminate, certifi ca-tion errors; some errors, such as those stemming from household reporting, are not directly affected by the policies.
Improving the nutritional quality of school meals and competitive foods may, in principle, be a goal of many NSLP stakeholders, including schools, parents, the nutrition community, FNS, and Congress. But meeting this goal may raise program costs for parents, localities, or the Federal Government. Moreover, even if more nutritious foods are provided, that does not guar-antee that students will eat them. Both participation and program costs can be affected by administrative policies and procedures, such as those used to determine program eligibility, to enroll children through application or direct certifi cation, and to conduct eligibility verifi cations.

vThe National School Lunch Program: Background, Trends, and Issues / ERR-61
Economic Research Service/USDA
How Was the Study Conducted?
Researchers from USDA’s Economic Research Service (ERS) reviewed recent economic-based and nutrition-based literature on NSLP, focusing on issues of health and administration. In summarizing fi ndings from different studies, researchers gave more weight to the studies that were nationally representative and rigorously conducted. Several new studies have greatly aided these efforts. A large and comprehensive study sponsored by ERS assessed the last 35 years of research on health and nutritional outcomes of all food and nutrition assistance programs. The 2005 School Nutrition and Dietary Assessment Survey (SNDA), sponsored by FNS, provided the most recent data on the program’s impact on children’s diets. The 2005 School Lunch and Breakfast Cost Study, sponsored by FNS, provided nationally representative data on school meal costs. Several other studies sponsored by FNS provided fi ndings on the effi ciency of NSLP administration.

viThe National School Lunch Program: Background, Trends, and Issues / ERR-61
Economic Research Service/USDA
Abbreviations
AMS Agricultural Marketing Service (of U.S. Department of Agriculture)
APEC Access, Participation, Eligibility, and Certifi cationCATCH Child and Adolescent Trial for Cardiovascular Health CFR Code of Federal RegulationsCNA Child Nutrition ActCPS Current Population SurveyDHHS Department of Health and Human ServicesDSCP Defense Supply Center, PhiladelphiaECLS-K Early Childhood Longitudinal Survey –
Kindergarten cohortERS Economic Research Service (of U.S. Department of
Agriculture)FCS Food and Consumer Services (of U.S. Department of
Agriculture) FDA Food and Drug Administration (of U.S. Department of
Health and Human Services)FDPIR Food Distribution Program on Indian ReservationsFNS Food and Nutrition Service (of U.S. Department of
Agriculture)FSA Farm Service Agency (of U.S. Department of Agriculture)FSP Food Stamp ProgramFVPP Fruit and Vegetable Pilot ProgramGAO Government Accountability Offi ce (formerly General
Accounting Offi ce)HACCP Hazard Analysis and Critical Control PointsIOM Institute of Medicine (of National Academy of Sciences)LEAF Linking Education Activity and FitnessNFSMI National Food Service Management InstituteNHANES National Health and Nutrition Examination SurveyNSLA National School Lunch ActNSLP National School Lunch ProgramOIG Offi ce of the Inspector General (of U.S. Department of
Agriculture)RCCI Residential Child Care InstitutionsSBP School Breakfast ProgramSFA School Food AuthoritySIPP Study of Income and Program ParticipationsSLBCS School Lunch and Breakfast Cost StudySMI School Meals InitiativeSNDA School Nutrition and Dietary AssessmentTANF Temporary Aid to Needy FamiliesUSDA U.S. Department of AgricultureWPA Works Progress Administration
1The National School Lunch Program: Background, Trends, and Issues / ERR-61
Economic Research Service/USDA
Overview of the National School Lunch Program
The National School Lunch Program (NSLP) was established under the National School Lunch Act (NSLA), signed by President Harry Truman in 1946, to “safeguard the health and well-being of the Nation’s children and to encourage the domestic consumption of nutritious agricultural commodi-ties and other foods.” The NSLP has grown to become the second largest U.S. food and nutrition assistance program in both numbers of children served—30 million in 2006—and Federal dollars spent—8 billion in 2006. Almost 60 percent of American children age 5-18 participate in the program at least once per week. Almost half of all lunches served are provided free to students, with an additional 10 percent provided at reduced prices. Although schools are not required to offer NSLP meals, 94 percent of schools, both public and private, choose to participate in the program. NSLP accounts for 17 percent of the total Federal expenditures for all food and nutrition assis-tance programs.
This report presents comprehensive background information on the NSLP—how it works, its history and recent changes, program trends, partici-pant characteristics, and current issues. Many of the broader issues faced by NSLP are similar to those facing food and nutrition assistance programs in general. The program was begun at a time when malnutrition due to poverty was a major concern. While poverty still exists in America, under-weight children are now rare. Obesity among children, however, is rising, especially among the poor (Ogden et al., 2006). Policies designed to ensure adequate food consumption could contribute to rising rates of obesity if they inadvertently encourage some recipients who already are eating enough to eat more. This may be even truer of the NSLP because school meals are required to meet a calorie target; while a provision called “offer versus serve” allows children to decline certain parts of the meal, children who take the whole meal may take in more calories than they need. Critics of the program argue that recipients might be better off receiving income instead of food (Besharov, 2003). Policymakers face hard choices because the chil-dren served by NSLP have diverse nutritional needs, making a single policy for all diffi cult to craft. While all children benefi t from a healthful meal and healthful food choices, requirements for calorie intake differ among children, depending on many factors.
Like other food and nutrition assistance programs, NSLP also was intended to increase demand for agricultural commodities. It supports commodity demand by providing free and reduced-price lunches for low-income students, subsidizing full-price lunches to a small extent, and directly donating commodities to the program. Critics of the program argue that these donations—over and above whatever increase in food consumption a free or subsidized lunch generates—could infl uence the content of the meal.
Other NSLP concerns accept the basic premise and structure of the program and focus on potential improvements at the margins. These include serving lower fat menu items and more fruits, vegetables, and whole grains without decreasing student participation or increasing plate waste, and without over-stepping program cost boundaries.

2The National School Lunch Program: Background, Trends, and Issues / ERR-61
Economic Research Service/USDA
Budgetary pressures on schools increased in the early 1980s following cuts in subsidies for full-price meals. The budget squeeze has continued as school meal reimbursement rates have gone up more slowly than the growth in costs, particularly the health benefi t component of labor costs. These pres-sures have led many school nutrition authorities to offer a la carte items in school meals that do not meet nutritional standards but contribute to the food service program’s bottom line. Concerns raised by parent groups have resulted in restrictions on “competitive foods” through individual State laws and wellness policies implemented by local school districts.
This cost pressure is such that some school nutrition authorities may be taken over by private foodservice management companies. These organiza-tions may operate at lower costs due to greater purchasing power stemming from their size, as well as lower benefi t levels provided for their employees. While managers in local school districts have an understandable desire to protect workers from a takeover, higher labor costs make it more diffi cult for schools to serve students more healthful meals that are both appetizing and affordable.
Like other food and nutrition assistance programs, the NSLP faces the constant challenge of encouraging eligible households to apply for participa-tion while preventing loss of program benefi ts through errors in certifi cation of eligible recipients. Increasing participation—both through encouraging application for free and reduced-price meals, and by using electronic payment to reduce the potential for stigma associated with participation—does more than just expand the benefi ts of the program. Higher numbers of participants increase reimbursements for free and reduced-price meals, which are often critical to covering fi xed costs of meal service in a school district.
School districts vary by size, income level, student food preferences, labor costs, population density, and level of concern for nutrition, and they differ in approaches taken to balance program goals and costs. Thus, national gener-alizations about the NSLP can obscure issues affecting a sizable fraction of school food authorities (SFA).
Under NSLP requirements, schools must operate their lunch programs on a nonprofi t basis, provide free or reduced-price meals to eligible children, and serve lunches at regular meal hours (see box, “Summary of Program Elements”). School lunches must meet the applicable recommendations of the Dietary Guidelines for Americans, while refl ecting the differing nutrient and calorie needs of children. Schools that choose to take part in the lunch program receive cash reimbursements for each meal served. In addition to receiving cash reimbursements, schools are entitled by law to receive commodity foods, known as “entitlement” foods, for each meal served. Schools can also receive “bonus” commodities as they become available from surplus agricultural stocks.
At the Federal level, USDA’s Food and Nutrition Service (FNS), Child Nutrition Division, reimburses States for NSLP meals served in schools, coordinates NSLP policy, provides technical assistance, and oversees the work of the State agencies. The State agencies, in most cases within a State department of education, in turn, administer the program through agreements with local school food authorities. The State agencies are responsible for

3The National School Lunch Program: Background, Trends, and Issues / ERR-61
Economic Research Service/USDA
managing fi scal elements of the program, monitoring SFA performance and adherence to USDA nutrient standards, and providing SFAs with technical assistance.
SFAs operate the NSLP at the local level. Their jurisdiction usually corre-sponds to school district areas but can be confi ned to single schools or groups of school districts. In addition to serving meals that meet nutritional require-ments, the SFAs process applications and certify students as being eligible for free or reduced-price lunches; they verify the eligibility status for a sample of free and reduced-price meal recipients; and they maintain program data for reporting and reimbursement claims.
NSLP does not require applicants to submit income documentation, and participant income requirements do not include an asset limit. The relatively low burden for certifi cation may contribute to the program’s role in meeting food assistance needs, as nearly two-thirds of children receiving free lunches come from households whose incomes appear to be low enough to qualify for the Food Stamp Program and Temporary Aid to Needy Families (TANF) but who either do not meet other requirements or choose not to participate (Newman and Ralston, 2006).

4The National School Lunch Program: Background, Trends, and Issues / ERR-61
Economic Research Service/USDA
Summary of Program Elements1
Eligibility and benefi ts Free lunch: Household income is less than or equal to 130 percent of poverty level, OR household participates in Temporary Aid to Needy Families (TANF), Food Stamp Program (FSP), or Food Dis-tribution Program on Indian Reservations (FDPIR), OR child is homeless, runaway, or migrant.
Reduced-price lunch: (students paid 40 cents in 2006): Household income is between 130 and 185 percent of poverty level.
Certifi cation process Application: Parent or guardian must submit an application to the school food authority (SFA), any time during the school year, self-reporting households’ total income for the most recent full month, the size of the household, and whether the student receives benefi ts from any of the three other Federal food and nutrition assistance programs.
Direct certifi cation: Participants in FSP, TANF, or FDPIR are automatically certifi ed for free lunch through administrative records. Requirement is phased in for all SFAs by 2008 under the 2004 Child Nutrition and WIC Reauthorization Act.
See “Administrative Issues: Access and Integrity Tradeoffs” on page 34 for further details.
Verifi cationrequirements
Required sample: SFAs must verify a sample of applications and have several options. The most common is a 3-percent sample of “error-prone” applications, up to a total sample of 3,000. If there are not enough applications to fi ll a sample of 3,000, the SFA adds households selected at random.
Deadline: November 15.
USDA reimbursements (as of 2006)
NSLP reimburses the following amounts to school food authorities for lunches served:
Free lunch: $2.40 Reduced-price lunch: $2.00 Paid lunch: $0.23
Rates are 2 cents higher in school districts with more than 60 percent free and reduced-price meals and are also higher in Alaska and Hawaii.
Commodity donations (as of 2006)
Entitlement commodities: USDA donates commodities at a rate of 16.75 cents (2006) per meal served the previous year.
Bonus commodities: USDA purchases additional commodities to remove surplus from the marketplace. Amounts vary annually.
See box, “USDA’s Commodity Donation Program,” on page 19 for further details.
Universal free meal provisions
Provision 1: School may certify students as eligible for free lunches for 2 years if 80 percent of the student body is eligible for free or reduced-price lunches.
Provision 2: Schools may provide free lunches to all students for 4 years as long as the school pays the difference between the Federal subsidies and the cost of providing the lunch. The school receives Federal reimbursement payment rates according to the percentage of paid, free, and reduced-price lunch shares consumed in a base year at the school. The base year for provision 2 is the fi rst of the 4 years of operation of the agreement.
Provision 3: Schools provide free lunches to all students for 4 years, and receive the same level of Federal cash and commodity assistance as they received in the last year for which the school made eligibility determinations and meal counts for each type, with annual adjustments for enrollment and infl ation.
Meal requirements for reimbursement
Nutrients: Meal must provide one-third of the daily requirement for energy, protein, calcium, iron, and vitamins A and C, and no more than 30 percent of calories from fat, 10 percent from saturated fat, and moderate amounts of sodium and cholesterol.
Changes in the 2005 Dietary Guidelines may lead to revision of meal requirements, especially for energy (see “Meal Requirements” on page 18).
Required foods—food-based meal plan: Food must include 1.5 - 2 oz of meat or meat alternate, two servings of fruits or vegetables, one serving of grain product, and 8 oz of fl uid milk. (Increased quantities of fruits, vegetables, grains, and breads are served with the “enhanced food-based meal plan.”)
Nutrient-based meal plan: Food must include any combination of entrée, side dish, and milk meeting nutrient requirements.
Offer vs. serve: Student may refuse up to two items, and meal will still be counted as reimbursable.
Food safety requirements
Commodities purchased by USDA for donation to NSLP meet strict food safety standards. As of 2004, meals produced by school cafeterias must have documentation on standard operating procedures to monitor heating, cooling, and refrigeration to ensure food safety. Cafeterias must be inspected twice annually, up from once annually.
5The National School Lunch Program: Background, Trends, and Issues / ERR-61
Economic Research Service/USDA
Summary of Program Elements1—continued
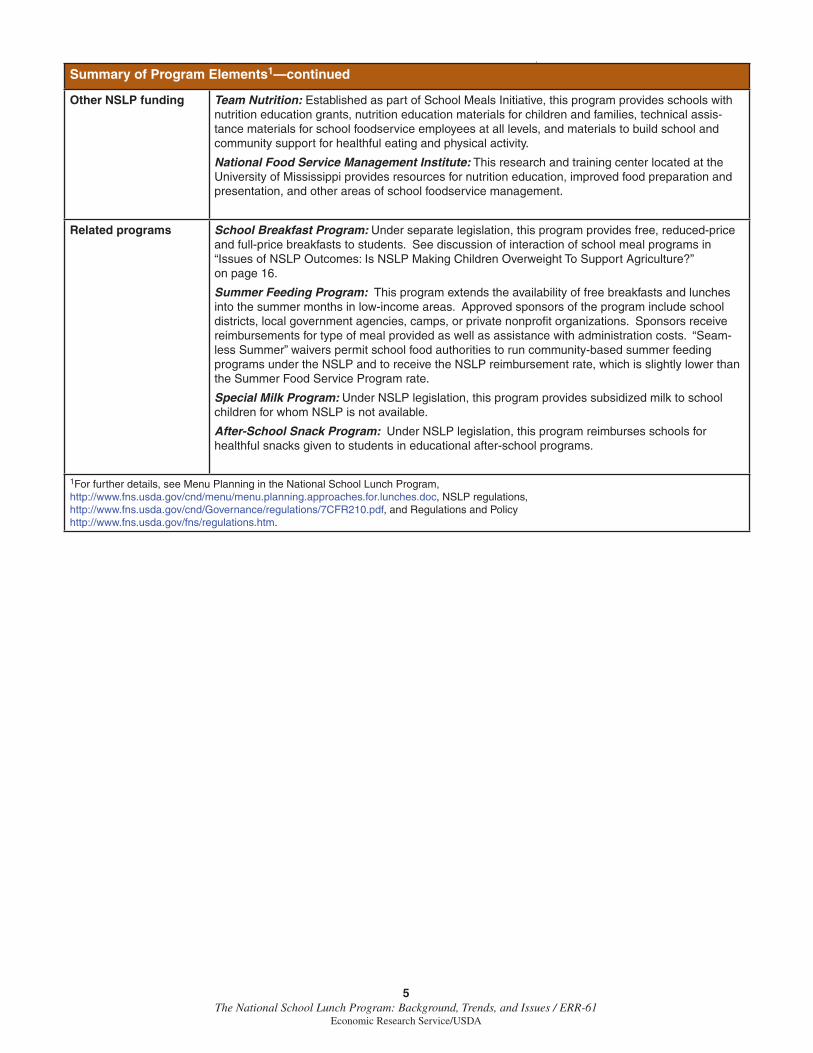
Other NSLP funding Team Nutrition: Established as part of School Meals Initiative, this program provides schools with nutrition education grants, nutrition education materials for children and families, technical assis-tance materials for school foodservice employees at all levels, and materials to build school and community support for healthful eating and physical activity.
National Food Service Management Institute: This research and training center located at the University of Mississippi provides resources for nutrition education, improved food preparation and presentation, and other areas of school foodservice management.
Related programs School Breakfast Program: Under separate legislation, this program provides free, reduced-price and full-price breakfasts to students. See discussion of interaction of school meal programs in “Issues of NSLP Outcomes: Is NSLP Making Children Overweight To Support Agriculture?” on page 16.
Summer Feeding Program: This program extends the availability of free breakfasts and lunches into the summer months in low-income areas. Approved sponsors of the program include school districts, local government agencies, camps, or private nonprofi t organizations. Sponsors receive reimbursements for type of meal provided as well as assistance with administration costs. “Seam-less Summer” waivers permit school food authorities to run community-based summer feeding programs under the NSLP and to receive the NSLP reimbursement rate, which is slightly lower than the Summer Food Service Program rate.
Special Milk Program: Under NSLP legislation, this program provides subsidized milk to school children for whom NSLP is not available.
After-School Snack Program: Under NSLP legislation, this program reimburses schools for healthful snacks given to students in educational after-school programs.
1For further details, see Menu Planning in the National School Lunch Program, http://www.fns.usda.gov/cnd/menu/menu.planning.approaches.for.lunches.doc, NSLP regulations, http://www.fns.usda.gov/cnd/Governance/regulations/7CFR210.pdf, and Regulations and Policy http://www.fns.usda.gov/fns/regulations.htm.

6The National School Lunch Program: Background, Trends, and Issues / ERR-61
Economic Research Service/USDA
NSLP History and Trends
The National School Lunch Program was founded by the National School Lunch Act in 1946 as a way to provide permanent Federal support to long-standing efforts in some States and localities to provide meals to school-children. The program has grown over the decades to become practically universal in its coverage: almost all schools participate in the program.
Legislative and Regulatory History
The Child Nutrition Act (CNA) of 1966 and later amendments to the NSLA and CNA consolidated the program’s administration and expanded meal assistance with the addition of the School Breakfast Program, the Summer Food Service Program, and the Child and Adult Care Food Program (see box, “NSLP Timeline”). Concern over costs and targeting emerged with the Omnibus Budget Reconciliation Acts 1980-81, which reduced subsidies for paid meals but increased the income range for free-meal eligibility.
More recent changes in the 1990s through 2004 have refl ected rising concerns for children’s health. The School Meals Initiative, developed in response to the Healthy Meals for Americans Act of 1994, required schools to provide meals that meet the Dietary Guidelines for Americans, including limiting fat to 30 percent of calories. To help schools meet these goals, the initiative instituted a new menu-planning system created by Team Nutrition to help schools develop healthful menus that appeal to children, and created the Commodity Improvement Council to modify specifi cations for processed commodities to lower the fat and sodium content of commodities donated to schools for NSLP.
The 2004 Child Nutrition and WIC Reauthorization Act included a require-ment that schools develop wellness policies that specify nutrition guide-lines for all foods in the school, including competitive foods. The act also increased the certifi cation period for participant eligibility to 1 year, mandated direct certifi cation of children participating in the Food Stamp Program, TANF, or the Food Distribution Program on Indian Reservations, increased food safety requirements, and expanded the Fruit and Vegetable Pilot into a permanent program.
Participation and Costs Increase Overall
Student participation in the NSLP increased over most years of the program, despite a drop in total school enrollment of 12 percent from 1971 to 1984. Participation declined by 14 percent during 1980-82 when reduced-price lunch reimbursements fell (Lutz et al., 1999), but the number of total lunches served per year grew at an average annual rate of 1.3 percent, surpassing 5 billion in 2005-06 (fi g. 1). This growth matches growth in the school enroll-ment from 1985 to 2000: both the number of total lunches served and enroll-ment in elementary and high schools increased around 18 percent from 1985 to 2000. Participation by students eligible for free and reduced-price meals has increased even more rapidly. During 1983-2005, free and reduced-price meals served increased by an average annual rate of 1.9 percent per year.
7The National School Lunch Program: Background, Trends, and Issues / ERR-61
Economic Research Service/USDA
NSLP Timeline1
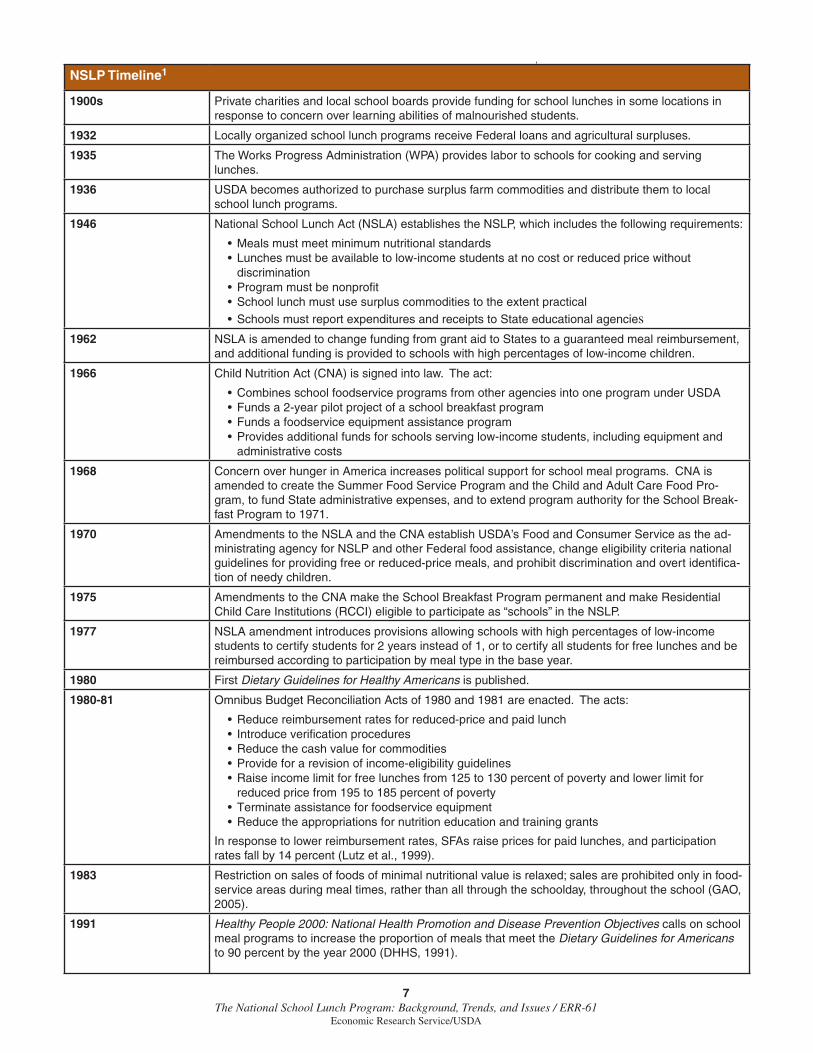
1900s Private charities and local school boards provide funding for school lunches in some locations in response to concern over learning abilities of malnourished students.
1932 Locally organized school lunch programs receive Federal loans and agricultural surpluses.
1935 The Works Progress Administration (WPA) provides labor to schools for cooking and serving lunches.
1936 USDA becomes authorized to purchase surplus farm commodities and distribute them to local school lunch programs.
1946 National School Lunch Act (NSLA) establishes the NSLP, which includes the following requirements:
• Meals must meet minimum nutritional standards• Lunches must be available to low-income students at no cost or reduced price without
discrimination• Program must be nonprofi t• School lunch must use surplus commodities to the extent practical• Schools must report expenditures and receipts to State educational agencies
1962 NSLA is amended to change funding from grant aid to States to a guaranteed meal reimbursement, and additional funding is provided to schools with high percentages of low-income children.
1966 Child Nutrition Act (CNA) is signed into law. The act:
• Combines school foodservice programs from other agencies into one program under USDA• Funds a 2-year pilot project of a school breakfast program• Funds a foodservice equipment assistance program• Provides additional funds for schools serving low-income students, including equipment and
administrative costs
1968 Concern over hunger in America increases political support for school meal programs. CNA is amended to create the Summer Food Service Program and the Child and Adult Care Food Pro-gram, to fund State administrative expenses, and to extend program authority for the School Break-fast Program to 1971.
1970 Amendments to the NSLA and the CNA establish USDA’s Food and Consumer Service as the ad-ministrating agency for NSLP and other Federal food assistance, change eligibility criteria national guidelines for providing free or reduced-price meals, and prohibit discrimination and overt identifi ca-tion of needy children.
1975 Amendments to the CNA make the School Breakfast Program permanent and make Residential Child Care Institutions (RCCI) eligible to participate as “schools” in the NSLP.
1977 NSLA amendment introduces provisions allowing schools with high percentages of low-income students to certify students for 2 years instead of 1, or to certify all students for free lunches and be reimbursed according to participation by meal type in the base year.
1980 First Dietary Guidelines for Healthy Americans is published.
1980-81 Omnibus Budget Reconciliation Acts of 1980 and 1981 are enacted. The acts:
• Reduce reimbursement rates for reduced-price and paid lunch• Introduce verifi cation procedures• Reduce the cash value for commodities• Provide for a revision of income-eligibility guidelines • Raise income limit for free lunches from 125 to 130 percent of poverty and lower limit for
reduced price from 195 to 185 percent of poverty • Terminate assistance for foodservice equipment• Reduce the appropriations for nutrition education and training grants
In response to lower reimbursement rates, SFAs raise prices for paid lunches, and participation rates fall by 14 percent (Lutz et al., 1999).
1983 Restriction on sales of foods of minimal nutritional value is relaxed; sales are prohibited only in food-service areas during meal times, rather than all through the schoolday, throughout the school (GAO, 2005).
1991 Healthy People 2000: National Health Promotion and Disease Prevention Objectives calls on school meal programs to increase the proportion of meals that meet the Dietary Guidelines for Americans to 90 percent by the year 2000 (DHHS, 1991).

8The National School Lunch Program: Background, Trends, and Issues / ERR-61
Economic Research Service/USDA
The rate of program participation has stayed fairly stable since 1989, the earliest year for which data are available. In Federal fi scal year 1989, NSLP-participating students (who received a full price, reduced-price, or free lunch) accounted for 60 percent of all students in NSLP-participating schools. The rate declined slightly through the 1990s to nearly 58 percent in fi scal year 2000 and then increased steadily from 2003 to about 62 percent in fi scal year 2008, the last year for which data are available (fi g. 2).
Federal expenditures adjusted for infl ation have increased more slowly than total NSLP participation, and substantially more slowly than the number of free and reduced-price meals served, which make up the bulk of reimburse-ments. While Federal expenditures in nominal (unadjusted for infl ation) dollars increased at 4.8 percent per year during 1983-2005 (fi g. 3), Federal expenditures in 2005 dollars increased only 1.1 percent per year during this period. (See “Administrative Issues: Access and Integrity Tradeoffs” on page 34 for a discussion of program fi nances at the local level.)
NSLP Timeline —continued1
1993 Results from the 1991-92 School Nutrition Dietary Assessment (SNDA) conducted by USDA’s FNS fi nd that school meals generally meet the nutritional needs of children but that school lunches do not meet the dietary guidelines for fat and saturated fat as a percent of calories (Burghardt et al., 1993).
1994 Healthy Meals for Healthy Americans Act requires school lunches to conform to the Dietary Guide-lines by 1996 and requires that commodities account for at least 12 percent of total assistance.
USDA launches the School Meals Initiative for Healthy Children to implement changes in meal requirement regulations and support improvements in the nutritional content of school lunches through technical assistance, nutritional improvement in commodity donations, and an alternative nutrient-based meal planning system.
1996 The Healthy Meals for Children Act adds a menu-planning option that allows for more fruits, veg-etables, and grains and provides schools with more fl exibility in meeting nutrition standards with regard to the use of commodity provisions.
2001 Results from the 1998-99 SNDA II fi nd that the average fat content of school lunches fell from 39 to 35 percent of calories but still did not meet the 1995 Dietary Guidelines
2002 Nutrition Title of 2002 Farm Act provides $6 million for the Fruit and Vegetable Pilot Program to provide free fresh and dried fruits and fresh vegetables to designated schools in four States and one Indian Tribal Organization.
Fifty million dollars is allocated for fresh produce for school meals through the Department of Defense.
2004 The Child Nutrition and WIC Reauthorization Act of 2004 is enacted. The act:
• Expands certifi cation period to 1 year, aligning law with common practice• Requires direct certifi cation to be phased in as a required part of certifi cation process, requires
schools to develop Hazard Analysis and Critical Control Point plans for food safety in meal production, and increases food safety inspections from once to twice annually
• Authorizes Fresh Fruit and Vegetable Pilot as a permanent program and expands to new States and Indian Tribal Organizations
• Requires school food authorities to develop wellness plans specifying nutritional standards for all foods in schools and goals for physical fi tness of students
2005 Release of 2005 Dietary Guidelines for Americans has implications for school meal requirements. New guidelines recommend different calorie limits for different levels of activity and recommend fat intake between 25 and 35 percent of calories, rather than below 30 percent.
Agriculture, Rural Development, Food and Drug Administration and Related Agencies Appropria-tions Act of 2006 further expands the Fresh Fruit and Vegetable Program to a total of 375 schools in 14 States and 3 Indian Tribal Organizations.
2007 Results from the 2004-05 SNDA III fi nd that less than one-third of schools served lunches contain-ing at most 30 percent of calories from fat and less than 10 percent of calories from saturated fat.
1For a comprehensive history of school meals through 1970, see Gunderson (1971).

9The National School Lunch Program: Background, Trends, and Issues / ERR-61
Economic Research Service/USDA
Figure 1
Participation: Total lunches and free and reduced-price lunches served
Source: USDA, FNS, 2007a.
Billions of lunches
Fiscal year
Total lunches served
Free or reduced-price lunches
1969 74 79 84 89 94 990
1
2
3
4
5
6
072004
Figure 2
NSLP student participation rate
Source: USDA, ERS using data from USDA, FNS, 1990-2008.
Percent of students
Federal fiscal year
1989 92 95 98 2001 04 0754
56
58
60
62
64
Figure 3
NSLP costs, 1969-2006
Note: Costs are in nominal dollars.Source: USDA, FNS, 2007b.
Billion dollars
1969 73 77 81 85 89 93 97 2001 050
1
2
3
4
5
6
7
8
9
Fiscal year
Cash reimbursements
Entitlement commodities
Bonus commodities

10The National School Lunch Program: Background, Trends, and Issues / ERR-61
Economic Research Service/USDA
Characteristics of NSLP Participants
What are the characteristics of students who receive school meal benefi ts? Do they differ greatly from those of other students? Every year, FNS releases national and State-level statistics on NSLP participants who received free, reduced-price, and full-price lunches. The most recent data, for 2006, based on over 5 billion lunches served, indicate that 49 percent of meals served were free, 10 percent were reduced price, and 41 percent were full price (USDA, FNS, 2007a).
Participant characteristics, such as age group, household composition, ethnicity, income, and other information, are not available in the annual statistics from FNS, which are collected as administrative data from the schools. FNS publishes such data when available from its nationally repre-sentative School Nutrition Dietary Assessments (SNDA), the most recent of which (SNDA III) was conducted in 2004-05 (see Gordon et al., 2007a, for results). Participant characteristics are included in a few more frequent national surveys, such as the Survey of Income and Program Participation (SIPP) and the National Health and Nutrition Examination Survey (NHANES).
Using data from SNDA III, Gordon et al. found that 7 of 10 students reported usually participating in NSLP, defi ned as three or more times per week (table 1). This proportion is comparable to that reported in fi ndings from other national surveys (Newman and Ralston, 2006). Almost all (89 percent) students who are certifi ed to receive a free or reduced-price meal participate, whereas those who are not certifi ed for a subsidized meal still participate at a fairly high level (60 percent). Minority students participate at slightly higher levels than do non-Hispanic White students, and students from households with lower income-to-poverty ratios also participate at higher rates than those with higher income-to-poverty ratios.
Table 1Share of all students in a given category who reported usually participating in NSLP, school year 2004-05
Percent
All students 71.9
Certifi cation statusFree or reduced-price meals 88.7Not certifi ed 60.4
EthnicityNon-Hispanic White 68.0Non-Hispanic Black 78.2Hispanic 76.3Other 73.6
Income/Poverty ratio0 to 130 84.1131 to 185 82.5186+ 64.4
Note: Usual participation is defi ned as participation on 3 or more days per week, per child report.
Source: USDA, ERS using data from School Nutrition Dietary Assessment Study-III, school year 2004-05, Child Interview, Dietary Recalls, Parent Interview. Weighted tabulations prepared by Gordon et al. (2007a).

11The National School Lunch Program: Background, Trends, and Issues / ERR-61
Economic Research Service/USDA
According to data from SNDA III, in 2004-05, students age 8-10, the largest single age group, made up nearly a third of all NSLP participants; students age 11-13 made up about a quarter (table 2). Younger students, age 5-7, made up 16 percent of participants, and older students, age 14-18, made up 26 percent. Children age 8-13 were more likely to participate than children in other age groups, while children age 16-18 were less likely to participate.
Seven of 10 NSLP participants lived in dual-adult households, somewhat less than the percentage of all students who did so. And while White students are less likely to participate than Blacks and Hispanics, half of NSLP participants were White. Students in families receiving food stamps and/or TANF had higher representation among NSLP participants than they did among all students.
Table 2Sharacteristics of students and NSLP participants on a typical day, school year 2004-05
All students All NSLP age 5 - 18 participants
Percent
Ethnicity:Non-Hispanic White 54.2 50.4Non-Hispanic Black 16.8 19.1Hispanic 21.9 24.0Other 7.0 6.5Total: 100.0 100.0
Age group (years):6 to 7 13.3 15.68 to 10 28.3 32.811 to 13 23.7 25.514 to 15 16.1 12.516 to 18 18.8 13.5Total: 100.0 100.0
Income/Poverty ratio0 to 130 35.0 28.7131 to 185 15.3 12.6186+ 49.8 45.2Total: 100.0 100.0
Household composition:Adult respondent lives with spouse or partner 74.2 70.4Adult respondent does not live with spouse or partner 25.8 29.6Total: 100.0 100.0
Other programs (not mutually exclusive):Family receives food stamps 21.0 24.1Family receives TANF or othercash assistance 8.0 9.5
Food security statusFood secure 82.5 77.6Low food security 12.6 16.6Very low food security 4.9 5.7
Note: Participation on a typical day is defi ned as participation on the day students were inter-viewed. TANF = Temporary Aid to Needy Families.
Source: USDA, ERS using data from School Nutrition Dietary Assessment Study-III, school year 2004-05, Child Interview, Dietary Recalls, Parent Interview. Weighted tabulations prepared by Gordon et al. (2007a).
12The National School Lunch Program: Background, Trends, and Issues / ERR-61
Economic Research Service/USDA
Participant Characteristics by Meal Type
An examination of participant characteristics by meal type (full price, reduced price, or free) offers further insights into the population served by the NSLP. While cross-tabulations by meal type are not yet available from SNDA III, they were reported by Newman and Ralston (2006) from the Survey of Income and Program Participation (SIPP) for fi scal year 2001.
The defi nition of NSLP participation in SIPP differs from the FNS defi ni-tion: FNS reports participation in daily averages over 9 school months of the Federal fi scal year (October 1 to September 30), whereas SIPP reports participation by month. Nevertheless, the survey-based estimates of shares of participants in each payment category in SIPP match well with FNS shares of lunch receipt in each category, thus providing a basis for the estimates of participant characteristics. Further, data from SIPP indicate that the shares of participants and all students represented by population subgroups were roughly similar to those shown in table 2, suggesting that the more detailed cross-tabulations discussed in this section are relevant.
Preteens in All Categories Participate More Than Other Age Groups
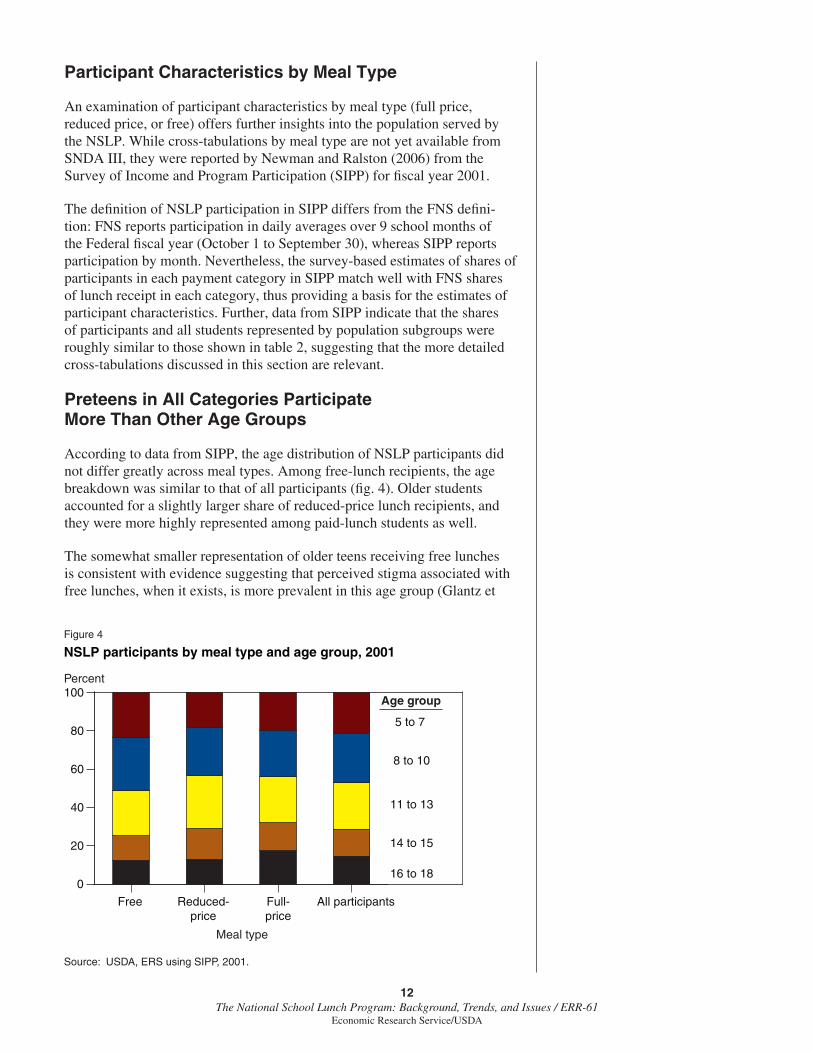
According to data from SIPP, the age distribution of NSLP participants did not differ greatly across meal types. Among free-lunch recipients, the age breakdown was similar to that of all participants (fi g. 4). Older students accounted for a slightly larger share of reduced-price lunch recipients, and they were more highly represented among paid-lunch students as well.
The somewhat smaller representation of older teens receiving free lunches is consistent with evidence suggesting that perceived stigma associated with free lunches, when it exists, is more prevalent in this age group (Glantz et
Figure 4
NSLP participants by meal type and age group, 2001
Source: USDA, ERS using SIPP, 2001.
Percent
Free Reduced-price
Full-price
All participants
0
20
40
60
80
100
16 to 18
14 to 15
11 to 13
8 to 10
5 to 7
Age group
Meal type

13The National School Lunch Program: Background, Trends, and Issues / ERR-61
Economic Research Service/USDA
al., 1994). The average household incomes of older students were higher (as shown later in this chapter), which also would lead to lower free-lunch participation rates among this group (Newman and Ralston, 2006).
In contrast, the difference in distribution of participating household compo-sition types was more notable across the three payment types (fi g. 5). SIPP data show that free-lunch recipients were about as likely to be from a single female-headed household as from a married-couple household, while reduced-price lunch recipients were more likely to be from a married couple household than from a single female-headed household (33 percent). And, paid lunch recipients were even more likely to be from a married-couple household than from a single female-headed household (14 percent). The percentage of students from single male-headed households was similarly low across the three payment types.
Ethnic Composition Infl uenced by Incomes
Racial and ethnic distribution also differed notably across the three payment types (fi g. 6). Shares of free-lunch recipients were divided nearly equally among the three major ethnic groups, with Blacks, Whites, and Hispanics ranging from 28 to 35 percent of the total. Native Americans and Asians accounted for signifi cantly smaller shares. Among reduced-price lunch recip-ients, the highest shares were attributed to Whites, Blacks, and Hispanics, respectively. And, among paid-lunch recipients, Whites had a signifi cantly higher share than the other groups. The predominance of Whites in the last category of recipients refl ects the greater proportion of White children in the population as well as the higher average incomes of Whites relative to the U.S. population as a whole.
Figure 5
NSLP participants by meal type and household composition
Source: USDA, ERS using SIPP, 2001.
Percent
Femalehouseholder
Meal type
Free Reduced-price
Full-price Allparticipants
0
10
20
30
40
50
60
70
80
90
100
Malehouseholder
Marriedcouple

14The National School Lunch Program: Background, Trends, and Issues / ERR-61
Economic Research Service/USDA
Income as a Ratio of Poverty by Meal Type
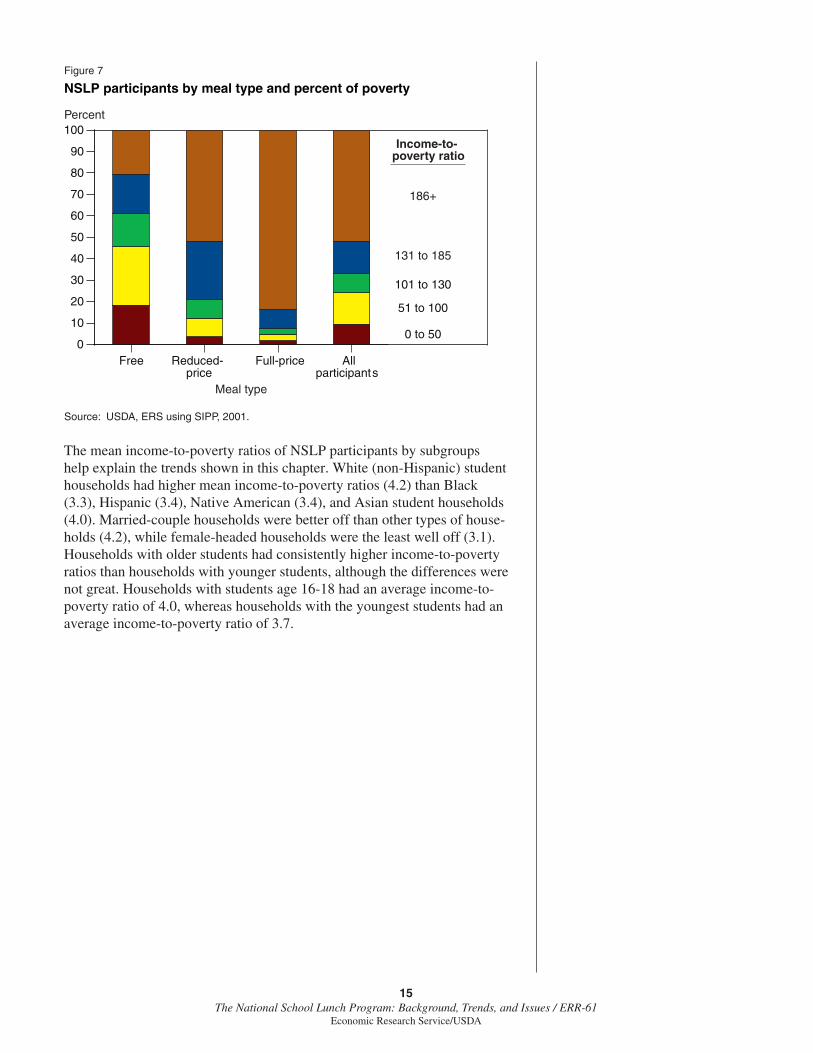
The distribution of the income-to-poverty ratio differed across the three payment types as expected, with the proportion of low-income recipients increasing as the subsidy level increases (fi g. 7). Sixty percent of free-lunch recipients live in households with an annual income below 130 percent of the poverty line, where the provision of free lunch is likely to have a signifi cant impact. The remainder had income-to-poverty ratios above the 130-percent limit. Over half of reduced-price lunch recipients had income-to-poverty ratios above the 185-percent limit. Some of these recipients may have lived in districts providing universal free lunch under provisions 2 or 3 of NSLP regulations, or some may have benefi ted from State or local subsidies. Others may have had lower 1-month incomes at the time of application than the annual average income used here. The data may also refl ect income reporting errors. On the other hand, almost 8 percent of NSLP participants who paid for a lunch would have been eligible for a free lunch, and 9 percent who paid would have been eligible for a reduced-price lunch. Again, however, using annual survey data to estimate a household’s monthly income at the time of application provides only a rough estimate of program eligibility. See “Administrative Issues: Access and Integrity Tradeoffs” on page 34 for further discussion of the implications of eligibility and benefi t receipt.
Figure 6
NSLP participants by meal type group and ethnicity
Source: USDA, ERS using SIPP, 2001.
Percent
Meal type
0
10
20
30
40
50
60
70
80
90
100
Native American, Aleut,or Eskimo
Hispanic
Non-Hispanic Black
Non-Hispanic White
Asian or Pacific Islander
Free Reduced-price
Full-price All participants
15The National School Lunch Program: Background, Trends, and Issues / ERR-61
Economic Research Service/USDA
The mean income-to-poverty ratios of NSLP participants by subgroups help explain the trends shown in this chapter. White (non-Hispanic) student households had higher mean income-to-poverty ratios (4.2) than Black (3.3), Hispanic (3.4), Native American (3.4), and Asian student households (4.0). Married-couple households were better off than other types of house-holds (4.2), while female-headed households were the least well off (3.1). Households with older students had consistently higher income-to-poverty ratios than households with younger students, although the differences were not great. Households with students age 16-18 had an average income-to-poverty ratio of 4.0, whereas households with the youngest students had an average income-to-poverty ratio of 3.7.
Figure 7
NSLP participants by meal type and percent of poverty
Source: USDA, ERS using SIPP, 2001.
Percent
Meal type
Free Reduced-price
Full-price Allparticipants
0
10
20
30
40
50
60
70
80
90
100
0 to 50
51 to 100
101 to 130
131 to 185
186+
Income-to- poverty ratio
16The National School Lunch Program: Background, Trends, and Issues / ERR-61
Economic Research Service/USDA
Issues of NSLP Outcomes: Is NSLP Making Children Overweight To Support Agriculture?
Many of the broader issues faced by NSLP are similar to those of food and nutrition assistance programs in general. When the program began in 1946, it was seen as a way to reduce undernutrition among low-income chil-dren while supporting the demand for U.S. agriculture. Now, critics of the program charge, the poor are no longer undernourished and providing assis-tance in the form of food instead of income contributes to obesity, either by encouraging overconsumption of some foods that are high in fat and calories or by increasing overall food consumption beyond what is necessary for growth and health (Besharov, 2003; Yeoman, 2003).
How NSLP Can Infl uence Children’s Diets
NSLP has the potential to infl uence children’s food consumption in several ways. First, the program subsidizes lunch for low-income families by giving cash reimbursements to schools for meals provided free or at a reduced price, thus lowering the cost and potentially increasing food consumption for low-income children—either in total or for some categories of foods. By subsi-dizing the cost of providing lunches to children, the program also provides participating families, especially low-income families, with additional income. This could affect children’s diets further if this additional income changes food purchases. Economists refer to these two effects as a “price effect” and an “income effect.” The overall effect of this subsidy depends on the income level of recipients and the cost (including time) of providing a lunch from home. Subsidized meals have a greater impact on diets of recipi-ents who have diffi culty meeting basic food needs.
Second, USDA directly donates commodities to States for use in school lunches. Commodity donations could infl uence meals if the donated foods were different from what children would otherwise eat, and if they were donated in suffi cient quantities. Note that the program requires that commodity donations for school lunches be produced domestically. The program could increase demand for U.S. agricultural products even without increasing amounts of food consumed because domestically produced food could substitute for imported food.
Third, the program originally required specifi c quantities of individual food groups as part of a food-based meal pattern in order to meet nutritional objec-tives. While the program now allows a nutrient-based meal pattern with no specifi c food requirements, nearly four of fi ve school food authorities still follow a food-based plan (either “traditional” or “enhanced”) (Logan and Kling, 2005), and the program still requires schools to offer milk with every meal. Under the food-based and nutrient-based patterns, requirements for calories and nutrients infl uence the content and size of meals offered.
Donated Commodities
Critics of NSLP charge specifi cally that the program forces schools to accept higher fat foods, such as high-fat meats and cheeses, in order to support these

17The National School Lunch Program: Background, Trends, and Issues / ERR-61
Economic Research Service/USDA
products as demand in the open market declines. It is important to recognize that commodities purchased must be used for meals that meet the Dietary Guidelines for fat and saturated fat. In fact, as part of the 1995 School Meals Initiative for Healthy Children (SMI), USDA began offering more low-fat meat and cheese products as part of commodity donations as well as greatly expanding fresh produce donations. Further, schools consider distribution, storage costs, and other logistical factors in accepting donated commodities.
Are the commodity donations big enough to make a difference in the foods that schools offer and children eat? While the USDA commodity purchases represent 17 percent or less of the total food budgets of school food authori-ties on average, USDA is often able to purchase the commodities at lower prices than those available on the open market (MacDonald et al., 1998), so those dollars purchase a larger volume of commodities than the schools would be able to purchase with the same amount of money. This amount could be enough to at least have a small effect on meals offered if the range of commodities offered were suffi ciently different from that otherwise offered, or the prices were suffi ciently different from prices on the open market.
Program regulations specifi cally require participating school food authori-ties to “accept and use, in as large quantities as may be effi ciently utilized in their nonprofi t school food service,” commodities that USDA purchases for distribution (CFR 7 chapter II, 210.9b). USDA develops dollar guides within commodity groups for each State—divided into fruits and vegetables, poultry and eggs, meat and fi sh, cheese, and grain products.
The initial plan is based on an estimate of the dollars available for the upcoming school year, based on forecasting and market analysis, and tradi-tional levels of support. The plan is adjusted throughout the year as supply and demand changes. The total target dollars are estimated entitlement dollars (meals served times the commodity rate). The dollars by commodity group are based on the national average percentages of prior purchases and current budget, with each State offered its fair share of dollars available.
Program documents stress that States and school districts “are not precisely restricted to the dollar amounts in the guide” and that ordering is fl exible (USDA, FNS, 2006). This fl exibility is apparent from changes in commodi-ties purchased by school foodservice programs from 1996 to 2005. Over that period, poultry as a fraction of meat and poultry together increased from 41 to 46 percent, perhaps refl ecting efforts to lower fat content of meals. Meat and poultry together as a share of total commodity donations fell from 47 to 39 percent, while cheese increased from 14 percent of total dollars to 16 percent (USDA, OBPA, 1998-2007), perhaps refl ecting changes in preferences.
USDA has made efforts to support goals for improved nutrition within the context of supporting agriculture. During the 1990s, as part of the School Meals Initiative, USDA began offering lower fat meat, poultry, and cheese products and worked with food manufacturers to develop and market test low-fat cheese with acceptable melting properties. USDA had already increased the volume of fruits and vegetables purchased through the program in the 1980s but increased them further in the 1990s. USDA began working

18The National School Lunch Program: Background, Trends, and Issues / ERR-61
Economic Research Service/USDA
with the Department of Defense procurement system to offer more fresh fruits and vegetables through the commodity donation program.
The 2002 farm bill allocated $50 million in commodity entitlement funds (section 32) to be used annually for direct purchases of fresh fruits and vege-tables from the Defense Supply Center, Philadelphia (DSCP) for school years 2003-06. School lunch programs were also given the authority in school year 2005 to make additional purchases of fresh fruits and vegetables directly from DSCP out of cash reimbursement funds (section 4 and 11 funds).
For further details, see box, “USDA’s Commodity Donation Program.”
Meal Requirements
NSLP meal requirements are another aspect of the program that affects chil-dren’s lunchtime choices. These requirements have become more fl exible, thus reducing somewhat the infl uence of the meals on consumption of some individual food groups, as well as total calories.
School meals are required to meet nutritional targets for calories, protein, calcium, iron, and vitamin A and, since the 1995 SMI, must meet the Dietary Guidelines for Americans for the percent of calories from fat and saturated fat. They also have some requirements for amounts of particular food groups, at least if they follow food-based menu planning.
The original food-based meal pattern requirement, still followed by the majority of schools, specifi es amounts of meat or meat alternates, breads or grains, fruits, and vegetables required for a reimbursable meal. This require-ment encourages consumption from all of these food groups, potentially more of any individual group than would be consumed otherwise.
As part of the SMI, USDA introduced new options for meal planning, including the nutrient-based meal plan. This plan requires only that the meal meet nutrient targets and contain an entrée, a side dish, and milk. This meal plan would allow, for example, protein-enriched pasta to count toward the protein target, without requiring a separate meat alternate (defi ned to include cheese, yogurt, eggs, beans, or nuts/nut butter) to be included.
This plan offers more fl exibility and less potential impact on any commodity group, since meals may end up looking more like what students would other-wise be eating. Several State agencies have begun encouraging this approach, but more than two-thirds of school foodservice programs still follow the food-based method (Gordon et al., 2007b).
The calorie requirement for NSLP meals could lead to overconsumption for students whose calorie needs are less than the lunch provides. The “offer versus serve” provision, required for high schools and adopted by most middle and elementary schools, allows a lunch chosen by students to be counted as reimbursable if it contains three of fi ve required meal components under the food-based plan (or two of three under the nutrient-based meal plan), and includes fl uid milk. This added fl exibility may reduce the problem of mismatch between calorie needs and calories provided by the meal.

19The National School Lunch Program: Background, Trends, and Issues / ERR-61
Economic Research Service/USDA
School districts and independent schools choosing to participate in the NSLP receive two forms of Federal support from USDA: cash subsidies and donated agricultural “entitlement” commodities. USDA procures and distributes commodi-ties to schools that participate in the NSLP and also provides cash reimburse-ments for each free, reduced-price, and paid meal served. Schools receive approximately 17 percent of the total dollar value of the food served in the NSLP from USDA-donated commodities. USDA’s goal of commodity assistance is to provide students with nutritious food while removing surplus production from the marketplace to improve and maintain farm income.
In fi scal year (FY) 2005, USDA spent $975.1 million on commodity purchases for the NSLP program. USDA’s Food and Nutrition Service (FNS) administers the domestic food distribution program, with direct procurement assistance from USDA’s Agricultural Marketing Service (AMS) and USDA’s Farm Service Agency (FSA).
Generally, purchases are made bi-weekly or monthly in support of both the export and domestic food and nutrition assistance programs. The purchasing program is a coordinated effort in USDA. The AMS and FSA specialists knowledgeable in food processing work with potential vendors, FNS, and food safety specialists to develop product specifi cations. Each specifi cation provides details on product formulations (i.e., manufacturing, packaging, sampling, and testing requirements) and quality assurance provisions. USDA then assesses market conditions and determines the availability and anticipated prices of commodities.
During this time, AMS and FSA work closely with FNS to determine recipient preferences. Then, after notifying specifi c industries through press releases, AMS and FSA gather competitive bids or negotiate contracts with vendors and award contracts. FNS matches the quantity, quality, and variety of purchased commodi-ties to specifi c needs of food recipients. AMS, FSA, and FNS work together to monitor vendors’ compliance with contract requirements and applicable Federal food safety laws and regulations. And fi nally, FSA issues delivery orders and makes payments to vendors to whom contracts have been awarded.
The bulk of commodity donations to schools are called “entitlement” commodities. School food authorities receive a per meal allotment toward entitlement commodi-ties (16.75 cents in FY 2006), which is funded from annual customs receipts. The list of commodity products and foods offered to schools are based on requests and include minimally processed meats, cheeses, grains, and produce, as well as a wide range of items, such as frozen hamburger patties, chicken fajita strips and nuggets, turkey sausage and taco meat, canned and frozen fruits and vegetables, salsa, macaroni and cheese, and other pasta.
In addition to the entitlement amounts, USDA offers bonus commodity donations when they are available from surplus agricultural stocks. Bonus commodities are purchased by USDA specifi cally to help producers when there is an oversupply in the retail market. Bonus commodities offered to schools in 2006 included frozen cherries, sweet potatoes, canned crushed pineapple, and dry beans.
USDA’s Commodity Donation Program

20The National School Lunch Program: Background, Trends, and Issues / ERR-61
Economic Research Service/USDA
Milk is the only individual commodity that the program specifi cally requires schools to include in all reimbursable lunches, directly under school lunch legislation.1 Schools are permitted to provide calcium-fortifi ed soymilk as an alternative for students who are allergic to milk. As part of the SMI, USDA made efforts to support reduction in fat consumption by encouraging schools to offer reduced-fat, low-fat, and skim milk. In 2004, USDA removed the requirement to offer whole milk as an option if it was consumed by at least 1 percent of students in the previous year.
The targets for individual nutrients also infl uence the composition of the meal in different ways under the nutrient-based and food-based meal plans. The limits on fat and saturated fat as a percent of calories encourages schools to use lower fat meats and cheeses and discourages use of butter in cooking. But the need to meet the calorie requirement under the fat limit encourages the use of breaded items. Further, the calorie limit requires schools to offer enough food to meet the target, even if it is more than the student would otherwise eat. This can increase the amount of commodities consumed.
While the restrictions on fat and saturated fat are designed to improve chil-dren’s diets, the effect of these requirements is limited. First, under the “offer versus serve” provision, schools are required to allow students to choose a subset of the full reimbursable meal, so actual fat content of meals consumed by students could be higher than the average for the full meal. Second, if schools offer higher fat choices on the menu for reimbursable meals, the average meal chosen by students may have a higher fat content than the average meal offered by the cafeteria. Finally, school food authorities are checked for compliance only once every 5 years, and even then, some school food authorities are found to be out of compliance.
The gradual implementation of fat-content restrictions is apparent from results of the 2005 SNDA III, (Gordon et al., 2007b), which surveyed school meal providers outside of the periodic review cycle. While the study showed some improvement in saturated fat content over that shown in the 1998-99 SNDA II, it found that only one in four elementary schools served lunches that met the standard for fat and one in three met the standard for saturated fat. For high schools, the numbers were even lower: 1 in 10 for fat and 1 in 5 for saturated fat.
The 2005 Dietary Guidelines for Americans allow a new range for fat as a percent of calories—25-35 percent for children, which is a more relaxed standard than the previous limit of 30 percent of calories from fat. This relax-ation may result in menu fl exibility that leads to greater program participa-tion, since participation was found to be negatively associated with lower fat content of school lunches (Gleason, 1996).
The new Guidelines also provide calorie recommendations based on activity level, but as of early 2008, it has not yet been determined which activity level should be used to establish calorie standards for the NSLP (USDA, FNS, 2005a). That decision could infl uence the size and composition of meals.
Other changes that could infl uence meals are the new list of nutrients of concern for children (calcium, potassium, fi ber, magnesium, and vitamin E), and the recommendation that nutrients should come primarily from foods as
1United States Code, Title 42, Chapter 13, Section 1758 a 2, http://frwebgate.access.gpo.gov/cgi-bin/getdoc.cgi?dbname=browse_usc&docid=Cite:+42USC1758, accessed January 19, 2007.
21The National School Lunch Program: Background, Trends, and Issues / ERR-61
Economic Research Service/USDA
opposed to fortifi cation, which may infl uence how fortifi ed foods are counted toward nutrient standards (USDA, FNS, 2005a). For example, milk served with NSLP lunches is required to be fortifi ed with vitamin A and vitamin D, and this contributes to the meal requirement for Vitamin A. If meal planners decide to count only Vitamin A from food sources such as vegetables toward the Vitamin A requirement, meals may have to include more of these foods to meet the standard.
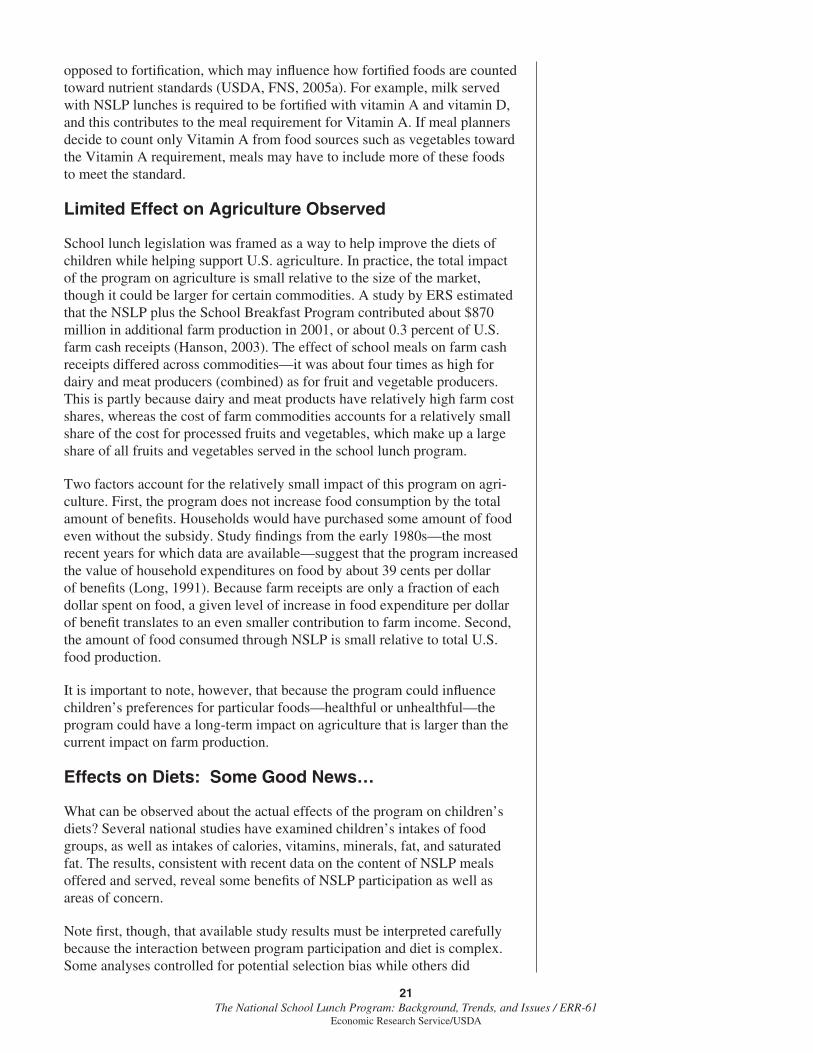
Limited Effect on Agriculture Observed
School lunch legislation was framed as a way to help improve the diets of children while helping support U.S. agriculture. In practice, the total impact of the program on agriculture is small relative to the size of the market, though it could be larger for certain commodities. A study by ERS estimated that the NSLP plus the School Breakfast Program contributed about $870 million in additional farm production in 2001, or about 0.3 percent of U.S. farm cash receipts (Hanson, 2003). The effect of school meals on farm cash receipts differed across commodities—it was about four times as high for dairy and meat producers (combined) as for fruit and vegetable producers. This is partly because dairy and meat products have relatively high farm cost shares, whereas the cost of farm commodities accounts for a relatively small share of the cost for processed fruits and vegetables, which make up a large share of all fruits and vegetables served in the school lunch program.
Two factors account for the relatively small impact of this program on agri-culture. First, the program does not increase food consumption by the total amount of benefi ts. Households would have purchased some amount of food even without the subsidy. Study fi ndings from the early 1980s—the most recent years for which data are available—suggest that the program increased the value of household expenditures on food by about 39 cents per dollar of benefi ts (Long, 1991). Because farm receipts are only a fraction of each dollar spent on food, a given level of increase in food expenditure per dollar of benefi t translates to an even smaller contribution to farm income. Second, the amount of food consumed through NSLP is small relative to total U.S. food production.
It is important to note, however, that because the program could infl uence children’s preferences for particular foods—healthful or unhealthful—the program could have a long-term impact on agriculture that is larger than the current impact on farm production.
Effects on Diets: Some Good News…
What can be observed about the actual effects of the program on children’s diets? Several national studies have examined children’s intakes of food groups, as well as intakes of calories, vitamins, minerals, fat, and saturated fat. The results, consistent with recent data on the content of NSLP meals offered and served, reveal some benefi ts of NSLP participation as well as areas of concern.
Note fi rst, though, that available study results must be interpreted carefully because the interaction between program participation and diet is complex. Some analyses controlled for potential selection bias while others did

22The National School Lunch Program: Background, Trends, and Issues / ERR-61
Economic Research Service/USDA
not. Selection bias arises from survey studies because participants are not randomly assigned to each category; they choose whether or not to partici-pate in a program based on factors (some of which are unobservable) that may also infl uence dietary choices independent of the program’s effects. For example, children with large appetites may be more likely to participate and more likely to eat more even if they brought lunch from home.
While available studies of participants’ consumption by food group did not adjust for selection bias, the fi ndings consistently suggest that NSLP partici-pants consume more milk and vegetables at lunch and fewer sweets, sweet-ened beverages, and snack foods than nonparticipants (Gordon et al., 2007a; Gleason and Suitor, 2001). Results from SNDA III suggest that much of the difference in vegetable consumption may be due to higher consumption of french fries and other potato-based items (Gordon et al., 2007b).
The analysis of SNDA III also found a higher share of participants consuming fruit and 100-percent fruit juice at lunch than nonparticipants, but these results do not correct for selection bias or other factors infl uencing consumption. Earlier results from more detailed analysis of data from 1994 to 1998 found no statistically signifi cant difference in fruit consumption between NSLP participants and nonparticipants (Gleason and Suitor, 2001).
Gleason and Suitor (2001) found that, on average, NSLP participants consumed fewer servings of grains at lunch than nonparticipants, possibly due to a high prevalence of sandwiches in lunches from home. More recent results from SNDA III were consistent with this fi nding. Further research correcting for selection bias would be required to strengthen fi ndings on differences in foods consumed.
Results from national studies of vitamin and mineral intake also point to some positive effects of participation, and these are more rigorous, with at least some adjustment for selection bias. Analysis of the 2005 SNDA III found that among middle schoolers, NSLP participants were more likely to have adequate usual daily intakes of vitamin A and magnesium than nonpar-ticipants (Gordon et al., 2007a). Differences were even more pronounced among high school students, who are generally at higher risk for poor diets. High school NSLP participants were more likely than nonparticipants to have adequate usual daily intakes of vitamin A, vitamin C, vitamin B6, folate, thiamin, iron, and phosphorus. These results are adjusted for observable factors that could lead to selection bias but not unobservable factors.
The SNDA III report also found that mean usual intakes of calcium and fi ber, which are underconsumed by middle and high schoolers, were higher for NSLP participants than for nonparticipants (Gordon et al., 2007a). While these results did not account for selection bias, they are consistent with an earlier national study that did correct for selection bias. That study showed that participants had higher intakes of calcium, magnesium, zinc, and fi ber (Gleason and Suitor, 2003). The difference in intake between participants and nonparticipants was largest for calcium—an amount equal to 16 percent of the Recommended Daily Allowance—and was probably due to higher milk consumption for participants (Fox et al., 2004a)—about half a serving on average. These differences were maintained over 24 hours, indicating
23The National School Lunch Program: Background, Trends, and Issues / ERR-61
Economic Research Service/USDA
improvement in the overall daily diet, as opposed to impacts only at the lunch meal and counteracted at other meals.
…And Some Challenges
Reducing sodium intake continues to be a challenge for all children and, in particular, for NSLP participants. In 2005, 88 percent of nonparticipants exceeded the upper limit of recommended intake level for sodium, whereas 95 percent of NSLP participants exceeded the limit (Gordon et al., 2007a).
Reducing intake of fat and saturated fat also continues to be a challenge, although the apparent magnitude of the problem will decrease if regula-tions are changed to follow the 2005 Dietary Guidelines for Americans, rather than the current requirement to follow the 2000 Guidelines. The new Guidelines recommended fat intake between 25 and 35 percent of calo-ries, a more relaxed standard than the recommendation to keep fat intake below 30 percent of calories. SNDA III found that only one-third of schools offered and served lunches that met the current regulations based on the 2000 Dietary Guidelines for fat (<= 30 percent of calories ) and saturated fat (< 10 percent of calories).
When Gordon and her colleagues looked at usual daily fat intakes of partici-pating and nonparticipating students, however, they applied the more relaxed 2005 Guidelines and found no difference in the proportion of students that met the standard—about 70 percent of both groups. Further, they found that mean intake of fat, saturated fat, or calories at lunch was not signifi cantly different among participants and nonparticipants, although lunch-time intake of calories was higher for high school participants as a subgroup, compared with nonparticipants.
Intake of calories over 24 hours was not signifi cantly different between participants and nonparticipants. The SNDA III results for fat, saturated fat, and calories are consistent with results in Gleason and Suitor (2003), which controlled more completely for selection bias.
Higher intake of underconsumed nutrients by NSLP participants suggests that the program does contribute positively to some aspects of diet quality for low-income children, as it does for higher income children paying full price. Further research looking at effects separately for low-income children may examine this issue more closely. However, the continued higher-than-recom-mended intakes of sodium, fat, and saturated fat by participants will continue to challenge NSLP meal planners.
Effects on Childhood Overweight Uncertain
While the most rigorous available calorie study of NSLP participants and nonparticipants showed no difference in energy intake during lunch or over 24 hours, the evidence for weight gain is more complicated. Several studies that did not correct for selection bias found NSLP participants more likely than nonparticipants to be overweight (Fox et al., 2004b). These analyses did not account for the role of unobserved factors related to poverty that could be the cause of observed higher obesity among participants, particularly since low-income children are more likely to participate in the program. These

24The National School Lunch Program: Background, Trends, and Issues / ERR-61
Economic Research Service/USDA
studies also used data collected before full implementation of the 1995 SMI, which required lunches to meet the Dietary Guidelines.
Two studies corrected for selection bias and used data after SMI but produced confl icting results.2 One study used 1997 data for children age 5-18 and found no effect of NSLP participation on obesity (Hofferth and Curtin, 2005). The other used 2001 data from a longitudinal survey of young children and found that participation was linked to increases in weight and the probability of overweight. Schanzenbach (2005) found that nonpoor fi rst graders participating in NSLP since kindergarten were 2 percentage points more likely to be overweight than nonparticipants of the same category, on a base prevalence of 9 percent for the group. The estimated average differ-ence in BMI between participants and nonparticipants, about 0.5 pounds, was too small to be consistent with the difference in obesity, or masked a larger change in the upper tail of the distribution. The increase in BMI occurring among participants from the beginning of kindergarten to the end of fi rst grade, a timespan of about 21 months, is large enough to raise concern.
Schanzenbach’s results appear to contradict the fi nding by Gleason and Suitor that energy intakes were similar between participants and nonpar-ticipants, after correcting for selection bias. One reason for this difference between the study results may be that Schanzenbach used more recent data; updated results for energy intakes could reveal a link to NSLP participation not seen in earlier data. A second reason is that Gleason and Suitor studied all school-age children, whereas Schanzenbach studied only nonpoor fi rst graders.
More important, differences in energy intake that are too small to detect statistically may add up over time to differences in weight gain that are large enough to detect statistically. For example, Schanzenbach estimates that the observed increase in BMI could be accounted for by a calorie imbalance of roughly 40 extra kilocalories per day, a level that is diffi cult to separate from the variation in measured food intakes.
While Schanzenbach’s study is limited to nonpoor fi rst graders, it suggests that a contribution to overweight from participation in NSLP should not be ruled out. Further analysis will be required to determine why the available study results differ. For example, the program could have different results for different age and income groups that are masked by the result for all school-age children as reported from Hofferth and Curtin’s study.
Further, the two surveys used different questions to determine whether students participate regularly in NSLP, and these questions may have differed in how well they captured participation. If students who buy items from the a la carte line are counted as if they ate an NSLP lunch, differences in their weight status may be attributed to the NSLP lunch rather than the a la carte items.
Schanzenbach used a much larger data set than Hofferth and Curtin (5,473 vs. 1,268), which makes it easier to detect a difference if one exists. Finally, the statistical techniques used by the two studies differed, and further anal-ysis of diagnostic statistics from the two studies (not included in the publi-
2A third study did not correct for selection bias but controlled for food insecurity, which has been found to increase the risk of overweight in children (Casey et al., 2006; Rose and Broder, 2006). Jones et al. (2003) found that girls from food-insecure households actually were less likely to be obese if they participated in the NSLP. In that study, boys from both participation and food security groups had the same probability of obesity.
25The National School Lunch Program: Background, Trends, and Issues / ERR-61
Economic Research Service/USDA
cations) would be required to determine whether one should be given more credibility in this case than the other.
The Bottom Line: Stay Tuned
Is NSLP making children overweight as a result of its support of U.S. agri-culture? Study results differ, but the worst-case verdict would appear to be that the program is making children a little overweight while contributing a little support for agriculture. If Schanzenbach’s results were extrapolated to all children from the study sample of nonpoor fi rst graders, the 2-percentage-point difference in the probability of obesity for participants represents 25 percent of the base.
Further, the program does appear to contribute to demand for some commodity groups, both through the small overall increase in total food expenditure related to the program and, possibly, through higher consump-tion of meat, dairy, and vegetables that research suggests may be consumed more by NSLP participants.
At the same time, some nutritional benefi ts appear to be associated with these effects on food demand, as higher milk and vegetable consumption are linked with increased intake of underconsumed nutrients and fi ber. Higher milk consumption likely accounts for much of the lower sugar consumption by participants because it substitutes for juice drinks and soda. Increased food demand, however, may also have nutritional drawbacks if some of these foods are major sources of the excessive fat and saturated fat consumed by NSLP participants. Policy changes to support moves to lower fat forms of these commodities have been initiated, but according to SNDA III, imple-mentation of these changes in lowering fat and saturated fat appear to be slow. Future research will provide some insight into what factors infl uence the effectiveness of efforts to reduce fat content of school meals, and the program’s ability to infl uence intake and weight gain.
It should be noted that results from even the most rigorous studies refl ect a national average, while individual school districts may serve meals that meet nutritional objectives to a greater or lesser extent than the average. These variations are infl uenced by fi nancial pressures as well as by student preferences for particular foods. In school districts where meals do not meet nutritional ideals, the problem may have more to do with what children will accept than with meeting the program’s objective of supporting U.S. agri-culture. Further, much of the concern over children’s diets is focused on competitive foods, which in some cases are sold by the school foodservice itself to ease budgetary pressures.
26The National School Lunch Program: Background, Trends, and Issues / ERR-61
Economic Research Service/USDA
Issues of NSLP Outcomes: Juggling Nutrition, Participation, and the Budget
The success of NSLP in providing nutritious meals to children depends on how well school foodservice directors manage a diffi cult balancing act among three objectives: serving a nutritious meal, getting children to purchase and eat the meal, and doing it all on a limited budget. Meals that meet the standards for fat and saturated fat may require salesmanship on the part of SFAs in some schools. Getting children to actually consume the nutri-tious food being served may require some creativity as well, since part of the school lunch often becomes “plate waste,” especially foods that were already underconsumed, such as milk and vegetables. Stretching revenues to cover foodservice costs often requires schools to offer a la carte items that are not held to the same nutritional standards as the reimbursable meal, which affects the school meal environment as a whole. Because Federal and State policies can make this balancing act easier or more diffi cult, it is important to under-stand the constraints schools face.
While research has shown that combinations of menu changes and marketing can increase the likelihood of student acceptance of healthful meals, increasing cost pressures on operators of school cafeterias have made it more diffi cult to implement these changes. In some cafeterias, a la carte sales are expected to provide extra funds to support either the school meals program or nonmeal items and activities, such as school band uniforms. These food sales, however, have come under scrutiny because they are not a component of NSLP and are thus not required to meet nutritional standards. School districts are now required to develop local wellness policies, and while the policies are meant to be fl exible to refl ect local priorities, they may create more pressure to raise nutritional standards in the cafeteria and the school as a whole in at least some localities.
Schools that have successfully improved meals and imposed higher stan-dards on a la carte items and vending machines found that other changes in the overall foodservice program were also important. Increasing breakfast purchases and changing staff positions to part-time to save on benefi ts have helped some schools increase revenues and decrease labor costs to cover decreased revenues from lower a la carte sales and increased costs of some more healthful menu items. Increasing certifi cation for free and reduced-price meals and increased marketing efforts have helped maintain or increase revenues from reimbursable meals, even when popular items like french fries are eliminated or cut back from menu offerings. In some cases, successful changes have depended on political support to help fi ll revenue gaps from other sources.
Researchers have studied the factors affecting student acceptance of more healthful menu items and levels of plate waste. Some strategies designed to address these issues are becoming more diffi cult to implement as cost pres-sures on school districts increase. Concern over the role of competitive foods in children’s diets has led to new restrictions on sales of such foods in some districts, sometimes cutting into revenue for school foodservice authorities or the school as a whole.
27The National School Lunch Program: Background, Trends, and Issues / ERR-61
Economic Research Service/USDA
Efforts To Increase Acceptance of More Healthful Lunches
Several studies have found that schools could maintain sales of lower fat meals and increase consumption of underconsumed foods, such as milk and vegetables, through marketing changes, food presentation changes, nutrition education, and combinations of all of these elements.
The Lunchpower program, tested in 34 schools in Minnesota in 1991, and the Child and Adolescent Trial for Cardiovascular Health (CATCH) program, tested in 96 schools in 4 States in 1992, both demonstrated that students would accept menus modifi ed to reduce fat and sodium content if they were combined with nutrition education and improvements in presentation. Both studies found that total daily fat intake fell among student participants (Luepker et al., 1996; Snyder et al., 1992).
Smaller studies illustrate the effectiveness of some individual interven-tion components. Some students in Washington State selected lower fat menu selections when they were offered in school meals, even when higher fat selections were still available. As a result, the average fat content of meals served in the schools decreased. More students chose low-fat options when schools sent educational materials home to increase awareness of the health benefi ts of the new options (Whitaker et al., 1993; 1994). Students in Texas were more likely to choose low- and moderate-fat selections of meal items when the number of competing higher fat selections was reduced (Bartholomew and Jowers, 2006).
Research by the Dairy Board found that improved milk marketing—improved packaging, additional fl avor options, use of chilled cases and vending machines—increased milk sales by 18 percent across 146 pilot schools (Prentice, 2002). The study also found lower waste of milk after it was purchased.
In a review of intervention studies that combined classroom activities, involvement by parents, and modifi cation of school menus, children were found to consume up to 1.8 more servings of fruits and vegetables (from 2.3 servings, a 74-percent increase) (Reynolds et al., 2001). Pilot tests of salad bar programs in schools in Los Angeles and Florida found increases in fruit and vegetable consumption of 37 percent and 10 percent, respectively (Slusser et al., 2007; Produce for Better Health Foundation, 2003).
Other studies of policy interventions found that education activities that emphasize student participation and exposure to new foods were effective (Liquori et al., 1998, Demas, 1998). Cultural sensitivity in nutrition is also important in many settings, as found by the Pathways intervention study aimed at reducing obesity among Native American children (Gittlesohn et al., 2000)
The Lunchpower, CATCH, and fruit and vegetable interventions relied on multiple channels for reaching children. The pilot study for FNS’s Team Nutrition program, which assists schools using many of the lessons of Lunchpower and CATCH, explicitly examined whether multiple channels were effective. The study found that use of multiple approaches was helpful,

28The National School Lunch Program: Background, Trends, and Issues / ERR-61
Economic Research Service/USDA
and that students reporting participation in greater numbers of pilot-related activities reported better scores (USDA, FNS, 1999). A detailed analysis comparing efforts would be helpful, but rigorous research to determine the cost effectiveness of the components requires careful controls to isolate each component and adequate sample size for each combination of components (Reynolds et al., 2001).
Many of the insights gained from these studies have been incorporated into technical assistance and training provided by USDA through Team Nutrition and the National Food Service Management Institute at the University of Mississippi. In addition to providing materials for nutrition education, Team Nutrition provides school nutrition and foodservice personnel with training and technical assistance for improved food preparation and presentation, through training standards and materials, grants to States to develop self-sustaining training projects, and an e-mail listserv group to foster commu-nication among interested professionals (USDA, FNS, 1999). The School Nutrition Association, a private trade organization of foodservice employees, also provides training and certifi cation.
Because fruits and vegetables are among the foods most likely to be wasted by students, efforts to decrease plate waste have included combinations of nutrition education as well as improved food presentation, such as those described earlier in this chapter. In addition, USDA has worked to increase the availability of fresh fruits and vegetables it donates, to allow schools to purchase produce through the Department of Defense procurement system, and to encourage schools to obtain fresh produce locally (Buzby and Guthrie, 2002). The USDA Fruit and Vegetable Pilot (now the Fruit and Vegetable Program) was also intended to increase fruit and vegetable consumption in schools by making free fruits and vegetables available for snacks.
Other Factors That Affect Participation and Plate Waste
In addition to changes in menu and presentation, other factors affect levels of school meal participation and plate waste. First, because over half of school lunch participants are receiving free or reduced-price meals, efforts to certify eligible children to receive these meals are key to increasing participation. This link was confi rmed in a study of participation using the 1992 School Nutrition and Dietary Assessment (Gleason, 1996).
Additional efforts by schools to make sure parents receive necessary announcements and forms can often increase certifi cation. But stigma may be a barrier in some communities, both for certifi cation and participation (Glantz et al., 1994a). California’s Linking Education, Activity, and Fitness pilot found that investment in expanding electronic payment technology helped increase participation overall, especially among free and reduced-price meal recipients (Woodward-Lopez et al., 2005), perhaps by removing the distinc-tion between students paying full price and those receiving free and reduced-price meals and, thus, reducing stigma. Automatic certifi cation of children eligible through their participation in the Food Stamp Program (referred to as “direct certifi cation”) also increases certifi cation rates (Gleason et al., 2003). The 2004 Child Nutrition and WIC Reauthorization Act phased in a require-ment for all school districts to use direct certifi cation.

29The National School Lunch Program: Background, Trends, and Issues / ERR-61
Economic Research Service/USDA
Plate waste has been estimated at 12 percent of total calories served in the reimbursable meal. Girls waste more food than boys, younger children waste more than older children, and salad, vegetables, and fruit account for more waste than other foods (Buzby and Guthrie, 2002). Plate waste appears to be infl uenced not only by the food’s lack of appeal but also by the timing of the lunch period. Lunch periods that are relatively short result in higher plate waste, as do lunch periods scheduled too early or too late (Buzby and Guthrie, 2002). Younger children are found to waste less food when lunches are scheduled after recess, perhaps because children are hungrier after activity or because they are not rushing through the meal to get outside sooner (Bergman et al., 2003). Remedies to these situations may be diffi cult for schools to implement, however. Crowded schools may be forced to give shorter, earlier, and later lunch periods to accommodate all the students in the available cafeteria space. Many elementary schools cite the diffi culties of getting students to put away winter coats and wash their hands quickly after recess when lunch is scheduled to follow. Further, some teachers and administrators are concerned that recess before lunch would take away more morning classroom time, which teachers fi nd more productive for students than classes during the afternoon (Rainville et al., 2005).
USDA school meal regulations allowing fl exibility may also be helpful in reducing the amount of food that ends up in the trash. The “offer vs. serve” provision for meal service allows schools to be reimbursed for a meal that includes some but not all the required components (three of fi ve required meal components under food-based planning—milk, meat or alternate, two servings of fruits or vegetables, dairy, and bread or alternate). Under nutrient-based planning, students may take the entrée and one other item plus milk for a reimbursable meal. USDA also allows children to serve themselves and schools to tailor portion sizes to appetites and needs more closely, which may help reduce plate waste. A downside to this fl exibility is that it is unlikely to increase intake of underconsumed foods.
Meal Production Costs Increasing Faster Than Revenues
Cost pressures may be a barrier to improving school menus in some cases. The nationally representative School Lunch and Breakfast Cost Study (SLBCS) II found that while the mean reported cost of producing lunch during 2005-06 was below the reimbursement rate, about one in four school districts reported costs above the reimbursement rate (Bartlett et al., 2008). Further, the mean full cost of producing a lunch was higher than the reim-bursement rate. Reported costs refer to costs actually paid by SFAs, whereas full costs include support from the school district general fund that is not charged to the school food service budget.
The study also found that reported costs increased over 1992-2005 while full costs decreased, probably refl ecting an increasing number of school food authorities being charged by school districts for indirect costs in response to their own budget pressures (School Nutrition Association, 2006). Other sources of increasing cost pressure include increases in health care costs for employees (GAO, 2003; Woodward-Lopez et al., 2005) and, more recently, rising food costs (FRAC, 2008).
30The National School Lunch Program: Background, Trends, and Issues / ERR-61
Economic Research Service/USDA
SFAs are responding in a variety of ways to reduce expenses and increase revenue, including switching to part-time labor to save on health care costs, buying more food in bulk, buying more ready-to-eat foods to reduce labor use, reducing purchases of fresh produce, and expanding revenues through a la carte food sales and catering services (GAO, 2003). Increasing indi-rect costs may make it especially diffi cult for schools to save up for larger purchases that could improve nutritional quality, such as salad bar stations (Wagner et al., 2007).
These adjustments are not always suffi cient to prevent a small but growing defi cit, which rose from an average of 3 percent of expenses to an average of 4.5 percent of expenses in a six-State study by GAO (2003). In the SFAs studied, the gap between revenues and costs was covered by the school districts, but SFA directors expressed concern that education budget pres-sures may constrain districts from absorbing the shortfall in the future.
In some cases, cost pressure is such that school nutrition authorities may be taken over by private foodservice management companies. These operations typically have lower costs due to purchasing power enabled by their size, as well as lower benefi t levels provided for their employees. While local school foodservice managers have an understandable desire to protect workers from a takeover, higher labor costs make it more diffi cult to serve students more healthful meals that are both appetizing and affordable.
Reimbursement rates are determined under the National School Lunch Act, which specifi es adjustments to be made based on the Consumer Price Index for Food Away from Home for Urban Consumers. This price index may not refl ect increases in costs for SFAs if the costs of benefi ts for school foodser-vice workers, often under county employee contracts, are rising faster than those for workers in urban food-away-from-home outlets, who are less likely to receive benefi ts. Further, costs may vary by region, but the reimbursement rate is applied nationally, except for adjustments for Hawaii, Alaska, and districts with a high percentage of free and reduced-price meal recipients. Addressing the issue of whether reimbursements should be raised or region-alized will require further analysis of data on the costs of meal production.
Proposals have been introduced to phase out the reduced-price lunch category, so that free lunches would be offered to students in households with incomes under 185 percent of the poverty level (School Nutrition Association, 2007). This change would extend the benefi ts of NSLP lunches to students who may not be participating because they cannot afford to pay 40 cents for lunch. The increase in participation also could help some school food authorities increase revenues. The proposals, however, have been considered cost prohibitive.
Revenue-Generating Competitive Foods Under Scrutiny
Foods sold in schools that are not part of the NSLP meal are commonly referred to as “competitive foods” because they are seen as competing with the NSLP meals as food choices for students. Competitive foods available to schoolchildren can include food purchased off campus; a la carte items; food purchased through vending machines, school stores, canteens and snack
31The National School Lunch Program: Background, Trends, and Issues / ERR-61
Economic Research Service/USDA
bars, and fundraising sales; food served at school parties; and treats given by teachers to students. Revenues from a la carte sales and, in some cases, vending machines, usually go to the school food authority itself and supple-ment revenues from sales and reimbursements of lunches. Vending machine revenues more often belong to the overall school or school district budget and generate discretionary revenue used for fi eld trips, assemblies, athletic and music equipment, and other needs (GAO, 2005).
Because competitive foods are not part of the reimbursable meal, they are not required to meet USDA nutrient standards, except that “foods of minimal nutritional value”3 cannot be sold in foodservice areas during mealtimes. Competitive foods are generally lower in key nutrients and recommended food groups and higher in fat than the NSLP reimbursable meal (Cullen et al., 2000; Story et al., 1996; Harnack et al., 2000; Wechsler et al., 2001; Zive et al., 2002; French et al., 2003; Wildey et al., 2000). The availability of competitive foods in a school may reduce participation in NSLP (Gleason, 1996), increase plate waste, and decrease nutrient intake (Templeton et al., 2005). Even when these foods do not directly reduce purchases of the NSLP meal, they are of concern to SFAs because they may contribute to overcon-sumption of calories at school.
The 2005 SNDA III found the presence of competitive foods to be widespread in schools, particularly in high schools. Competitive foods were available from vending machines in 98 percent of senior high schools, 97 percent of middle/junior high schools, and 27 percent of elementary schools in 2004-05 (Gordon et al., 2007). A la carte items were available for sale in 75 percent of elementary schools and over 90 percent of middle and high schools.
The Institute of Medicine recommended that nutrition standards be applied to all food served or sold in schools (IOM, 2005) because the impacts on student diets from restricting competitive foods may be limited if all sources are not addressed together (see Cullen et al., 2006, for more information). The GAO recommended that USDA’s authority to regulate “foods of minimal nutri-tional value” be extended to a wider class of foods (GAO, 2005).
SFAs and State agencies are already permitted to impose additional restric-tions on competitive foods in schools, and food vendors themselves have made changes. As of April 2005, 28 States had made efforts to restrict foods beyond USDA restrictions (GAO, 2005). These efforts appear to be infl u-encing the school food environment; the 2006 School Health Policies and Programs Study found that between 2000 and 2006, availability of low-fat a la carte foods increased (O’Toole et al., 2007).
Some school districts have made changes in cooperation with competitive beverage vendors that include switching from selling sodas to selling water; sports drinks, which have less sugar than sodas; and higher juice-content beverages. Industry-sponsored analysis found that soda consumption in schools declined 24 percent from 2002 to 2004 (Wescott, 2005). In 2006, the American Beverage Association announced that it would encourage bottlers to remove full-calorie soft drinks from schools and to limit beverages sold in schools to milk, juice, light juice, water, and no-calorie or low-calorie soda (American Beverage Association, 2006).
3Foods of minimal nutritional value are those that provide less than 5 percent of the RDI for each of eight specifi ed nutrients per serving. The specifi ed nutrients are protein, vitamin A, vitamin C, niacin, ribofl avin, thiamine, calcium, and iron.

32The National School Lunch Program: Background, Trends, and Issues / ERR-61
Economic Research Service/USDA
Both school administrators and foodservice authorities have expressed concern that efforts to restrict competitive foods to more healthful options could reduce revenue (GAO, 2005). Whereas the FNS-sponsored School Lunch and Breakfast Cost Study II suggested that revenues from reim-bursable meals subsidized nonprogram food service (Bartlett et al., 2008), GAO’s survey of competitive food revenues and their uses suggest that these concerns are not groundless.
Efforts to maintain revenues of both the SFAs and other entities that draw revenue from competitive foods while improving nutritional quality can be successful, but not always. Making It Happen (USDA, FNS, 2005), a collection of school nutrition success stories, provides several descriptions of school districts that made healthful changes to school meals while main-taining or increasing revenue. The keys to success in those cases were ener-getic leadership from one champion, such as a parent, a foodservice manager, or a school principal, and a team with diverse skills to implement and market changes. While size and income level infl uenced the strategies leading to success, SFAs in a wide range of sizes and income levels were represented among the success stories.
Most school food authorities in the Linking Education, Activity, and Food (LEAF) pilot project in California also maintained or increased revenue after piloting changes in the school nutrition environment mandated by California State law (Woodward-Lopez et al., 2005). Further, most directors reported that increases in costs associated with the pilot were largely offset by increases in revenue, although coping with increasing costs while meeting stricter standards for competitive foods was challenging.
Revenues going to entities outside the school foodservice authority, however, such as vending machines controlled by the school principal, decreased in all but 2 of 16 pilot sites, consistent with concerns reported by school adminis-trators in other studies. Schools reported diffi culty fi nding vending machine snacks that met the California nutritional requirements and were suffi ciently appealing to students to maintain sales volume.
The reported net gains in revenues by SFAs appeared to be the result of improvements in meals and serving areas, reduced appeal of a la carte and other competitive foods and beverages, and reduced access to competitive foods in some schools. Elimination of a la carte food sales was associ-ated with the greatest increases in reimbursable meal sales. Many of the schools increased meal participation, especially in the free meal category, refl ecting both increased enrollment for the free and reduced-price lunches and increased participation among enrollees as well. Some schools with high eligibility for free and reduced meals elected to provide universal free meals under Provision 2 or 3 of school lunch regulations (see “Overview of the National School Lunch Program” on page 1 for an explanation of these provisions).
Schools had greater diffi culty in maintaining net income if they had one or more of the following characteristics: large districts; shorter meal periods; open campuses that allowed students to leave for lunch; insuffi cient tech-nology for processing sales (resulting in long cafeteria lines and a higher likelihood of stigma associated with subsidized meals); inadequate tech-
33The National School Lunch Program: Background, Trends, and Issues / ERR-61
Economic Research Service/USDA
nology for menu planning, nutrient analysis, and accounting/inventory; diffi -culty monitoring compliance with nutrition standards; greater competition with nonfoodservice entities for sales; or greater emphasis on standardized testing (Woodward-Lopez et al., 2005).
In some districts, school nutrition directors advocating for stricter competi-tive food standards have a stronger voice as a result of the new requirement for local wellness policies by school year 2006-07. These policies, which must include school nutrition directors in their development, are mandated for each local educational agency participating in USDA’s school meals programs by the 2004 Child Nutrition and WIC Reauthorization Act.
Under the law, schools are expected to set goals for nutrition education, physical activity, and other school-based activities designed to promote student wellness. Schools must also establish nutrition standards for all foods that are available on each school campus during the schoolday. Nutrition guidelines for school meals may not be less restrictive than Federal policy. Schools are required to measure the implementation of the wellness policy and to involve in its development a broad group of stakeholders, including parents, school foodservice professionals, and school board members. The law allows individual districts to address these issues according to local priorities. Because the law provides no additional funding for this require-ment, however, the administrative cost of developing guidelines and monitoring them could increase the diffi culty of balancing the school food authority’s budget, even before any changes in costs and revenues resulting from implementing the policy itself.

34The National School Lunch Program: Background, Trends, and Issues / ERR-61
Economic Research Service/USDA
Administrative Issues: Access and Integrity Tradeoffs
In recent years, focus on the administration of the NSLP has revolved around questions of program access and integrity and issues of local-level manage-ment. USDA strives to balance the goals of ensuring program access to eligible households while making sure that only eligible households receive benefi ts and that operating costs are reasonable. For any program, achieving these goals is challenging. If the application procedure is too simple, ineli-gible families may be certifi ed. But if the required application procedure is diffi cult to complete, eligible families may choose not to apply. And, if the application procedure is complicated and rigorously administered, operating costs increase.
The NSLP serves millions of children each day, and because the administra-tors of the program at the local level are primarily educational institutions, the amount of administrative resources that can be assigned to program integrity concerns is limited. The application requirements that have evolved are more simplifi ed than those of other major food and nutrition assistance programs, refl ecting the NSLP’s large size, the need for a low-cost adminis-trative component, and the perception of the program’s target population—children—as being a more vulnerable population. This has led to debates about how best to improve the integrity dimensions of the program while not compromising the other goals.
Access to NSLP may be especially important for households that have low incomes but do not participate in other food and nutrition assistance programs. Newman and Ralston (2006) found that two-thirds of students receiving free lunches resided in households that did not participate in the Food Stamp Program or in TANF, even though the students’ household income levels were probably low enough to qualify for benefi ts. Interpreting these fi ndings requires caution, since participation in food assistance programs is generally under-reported on surveys. Further, many of these households may not have been eligible for either program, even though they have low incomes; they may have had assets above the asset limit, for example. On the other hand, some households may have been truly eligible for other assistance but felt more of a stigma associated with the Food Stamp Program or TANF participation than with NSLP participation. Some may have chosen to participate in the NSLP precisely because it has fewer eligi-bility requirements. Policies in the Food Stamp Program and TANF that may discourage participation include asset limits, proof of income, and in-person interviews.
In 2004, Congress passed the Child Nutrition and WIC Reauthorization Act, which addressed many concerns about NSLP access and integrity. One important change was to extend NSLP eligibility from 1 month to the full school year. Other changes to the program included mandatory use of direct certifi cation (which previously had been an option) and the refi nement of procedures for verifying the eligibility of students, once they are approved. Verifi cation procedures now take place earlier in the year, SFAs with high rates of nonresponse to verifi cation requests must draw larger samples for verifi cation among more error-prone applications, and SFAs may use admin-

35The National School Lunch Program: Background, Trends, and Issues / ERR-61
Economic Research Service/USDA
istrative data from other public assistance programs to verify certifi cation status. Many of these changes were made in response to specifi c concerns about program integrity that arose in the late 1990s and early 2000s.
Erroneous Payments Closely Studied
Over the last decade, USDA’s FNS has sought to address the issue of erro-neous payments and, in particular, seemingly high rates of ineligibility among participating students, a problem that was initially referred to as “overcertifi cation.” More recently, the broader notion of erroneous payments has become the focus, encompassing overcertifi cation and undercertifi cation (when eligible applicants are denied) as well as errors made in the reimburse-ment process. Concerns over erroneous payments arose from early studies commissioned by FNS that found rates of overcertifi cation ranging from 19 to 27 percent (USDA, OIG, 1997; USDA, FNS, 1999). The estimate of 27 percent came from a study using data from the U.S. Census Bureau’s Current Population Survey (CPS), which allows for measures of annual income eligi-bility. However, another study using data from a different Census Bureau survey, SIPP, found no evidence of overcertifi cation (see Neuberger and Greenstein, 2003). SIPP data allow for monthly measures of eligibility, which matches better with NSLP eligibility determination.
To further address the issue, FNS commissioned studies that used school-level data and limited household surveys (Hulsey et al., 2004; Burghardt et al., 2004a; Burghardt et al., 2004b; Gleason et al., 2003; USDA, FNS, 2007c; USDA, FNS, 2005b; and USDA, FNS, 2003). Over all of these studies, total overcertifi cation error was estimated to be around 25 percent, though the esti-mates differed greatly by type of school and type of application process, and none of the estimates was nationally representative.
The studies focused on measuring three possible sources of error as causes for overcertifi cation:
• Household reporting errors: Inaccurate provision of information by the household regarding household size or total income (intentional or not).
• Administrative errors: Mistakes in calculation or data transfer that could be made in the determination of household income and student eligibility.
• Income volatility: Changes in household income or household size during the school year that affect household eligibility status.
The studies showed that all three types of error contributed to total certifi ca-tion error, though no one study directly compared the effects of each of the three. Income volatility, which is discussed further in this section, was found to be important in the past policy regime, though it is no longer a possible source of error as students are now considered eligible for the full school year based on 1 month of eligible income.
More recently, FNS published the results of a comprehensive, nationally representative study of erroneous payments made in the 2005-06 school year called “National School Lunch Program/School Breakfast Program Access, Participation, Eligibility, and Certifi cation (APEC) Study” (Ponza et al., 2007). The study measured various sources of erroneous payments by using

36The National School Lunch Program: Background, Trends, and Issues / ERR-61
Economic Research Service/USDA
surveys of households and SFA directors, administrative data, and observa-tional data. Unlike the previous studies, APEC accounted for errors made in the accounting process, such as cashiers’ errors and summation errors made in the reporting process. These estimates provide baseline measures of errors for the new policy regime where certifi cation covers the full year, verifi ca-tion procedures are more focused, and direct certifi cation is required of all schools.
The APEC study provides estimates of erroneous payments as measured by the sum of overpayments and underpayments. The total net cost to the government is also provided, and this measure shows that the amount of erroneous payments was positive on balance, given that overpayments were found to be higher than underpayments. Erroneous payments—including overpayments and underpayments—that were due to certifi cation error in the NSLP were about $759 million, and those due to noncertifi cation error (aggregation errors and the like) were about $555 million. The net cost to the government of certifi cation errors was $387 million, and the cost of noncerti-fi cation errors was $292 million. To put the net fi gures in context, they repre-sent 5 and 4 percent of total NSLP spending in that year, which was $8.06 billion.
Household error was found to be about three times higher than administrative error in total certifi cation error: 23 percent of applicants were found to have misreported either their household income or their household size, whereas 8 percent of applicants were affected by administrative error. Administrative errors were more likely to be errors of overcertifi cation, at 6 percent, than undercertifi cation, at 2 percent. This was also the case for household errors, though it was less pronounced, with overcertifi ed errors at 13.5 percent and undercertifi ed errors at 9.7 percent.
The certifi cation process was more accurate in the determination of free meal eligibility than it was in the determination of reduced-price eligibility. One-fourth of reduced-price meal recipients were found to be ineligible for either reduced-price or free meals, while 14 percent of free-meal recipients were found to be ineligible for free meals. But even larger was the rate of undercertifi cation among reduced-price recipients: one-third of reduced-price eligible students were eligible for free meals.
Longer Eligibility Period Reduces Overcertifi cation
One of the most important legislative changes affecting NSLP is the new defi nition of the eligibility period: after being initially certifi ed, households are now eligible for the whole school year. Before the law changed in 2004, households were required to report income changes in excess of $50 per month. If a household’s income increased over the eligibility limit for either free or reduced-price lunch in any month after it had been certifi ed, it was ineligible. Households seldom reported such changes, and only a small percentage of households were ever checked. Under the old rules for verifi ca-tion, a sample of households was asked to report then-current income in mid-December of each year. If a household’s income did not match the eligibility criteria for which it had qualifi ed at the start of the school year, its benefi ts were adjusted. Under the new rules for verifi cation, households are permitted

37The National School Lunch Program: Background, Trends, and Issues / ERR-61
Economic Research Service/USDA
to present their income from the month of initial certifi cation (or any inter-vening month) for verifi cation of their status.
Income volatility could have had a signifi cant effect before the law was changed. Using data from SIPP, Newman (2006) found that under the prior rules, many households could become ineligible for the program during the year due to monthly income changes. Two-thirds of lower income house-holds experienced enough income volatility to cause one or more changes in their monthly eligibility status for either a reduced-price or free lunch during the year. Of the households that were income-eligible for subsidized lunches at the beginning of the school year, an estimated 27 percent were no longer eligible for benefi ts by December due to income changes. This estimate of error due to income volatility may account for a large share of previous esti-mates of overcertifi cation rates (though it does not take into account whether or not eligible households applied in August). Studies in the early 1990s similarly showed that short-term income volatility was an important determi-nant of NSLP eligibility dynamics (St. Pierre and Puma, 1992). And, another recent study examining the application and certifi cation processes with school-level data (Burghardt et al., 2004a) also found that income volatility led to ineligibility.
Documentation Requirements May Deter Applicants
Another policy proposal that was studied, but not adopted, was that of requiring households to provide upfront income documentation when they apply for the program. This proposal was put forth as a way to reduce inac-curacies that stem from household misreporting. In 2002, FNS sponsored a pilot project and an evaluation of this proposed policy and several other policies. Burghardt et al. (2004b) evaluated the policies by matching pilot school districts with 12 school districts that volunteered to participate as comparison sites. The study estimated the effects of the pilot practices on three targeting goals: deterrence of ineligible families, reduction of barriers to eligible families, and accuracy among all certifi ed students. The results revealed that upfront documentation did not signifi cantly affect overall certi-fi cation accuracy; ineligible families were as unlikely to apply as they would in comparison sites, but the requirement raised application barriers and did deter eligible families.
In another volume of the same study, analysts found that upfront documenta-tion and other policies designed to reduce certifi cation errors signifi cantly increased administrative error rates (Hulsey et al., 2004). Overall, upfront documentation was found to be ineffective because reporting errors were more likely to be due to a family not reporting all income sources, rather than incorrectly citing the sources that were reported. The APEC study also found that household misreporting was often the result of not counting the incomes of nonprimary household members, such as a student’s uncle or aunt.
Direct Certifi cation Removes a Barrier for Applicants
In addition to the change in the eligibility period, another important policy change in the 2004 legislation was the mandated use of direct certifi cation. The new law required all schools to phase in the use of direct certifi cation

38The National School Lunch Program: Background, Trends, and Issues / ERR-61
Economic Research Service/USDA
over the next 3 to 4 years depending on school size. In a study of the preva-lence and effects of direct certifi cation, Gleason et al. (2003) found that direct certifi cation improved both program access and integrity. Direct certifi cation was found to lead to an increase in NSLP participation among all enrolled students by about 400,000 students, and, more importantly, an increase in the percentage of students certifi ed for free meals. They found that direct certi-fi cation could lead to a decrease in the rate of ineligibility among certifi ed students.
In summary, research has shown that mandatory direct certifi cation and the extension of eligibility to the school year are two policies that effectively reduce error and attract eligible students. Other detailed changes to veri-fi cation procedures, which partially target families with earnings close to the eligibility limit, will help improve program integrity (though perhaps contribute to higher error rates since more error-prone applications may be targeted).
The APEC study provided a detailed look at the sources of erroneous payments and, by extension, specifi c ways to reduce them. The study found that household misreporting is often due to incomplete reports of all income sources, and that administrative reporting error often comes from processing incomplete applications. More thorough emphasis on the need to report all incomes and to process complete applications should reduce these errors. The study also found that noncertifi cation errors were exacerbated by high rates of cashier errors from some, mostly large, schools. Identifying the source of these types of errors—whether through cashier training improvements or better guidance to SFA directors—should help reduce future errors. The APEC study provided the most thorough analysis of certifi cation errors to date. It also broadened the notion of errors by examining noncertifi cation errors, and thus, suggested ways to reduce erroneous payments throughout the program.

39The National School Lunch Program: Background, Trends, and Issues / ERR-61
Economic Research Service/USDA
Conclusions
The National School Lunch Program is the second largest food and nutrition assistance program in the United States, serving millions of children every day. From its creation, it grew to become an important component of most schoolchildren’s diets, offering meals that aim to meet up-to-date dietary guidelines at varying levels of fi nancial subsidy, based on student need.
Access to free and reduced-price meals in the NSLP has been and continues to be a priority of the program. Unlike other major food and nutrition assis-tance programs, the NSLP is more decentralized, with most of the program’s administration carried out at the local level. The application requirements for eligibility are relatively simple, which enhances participation and imposes a low level of administrative burden for schools. Recent changes to eligibility rules and improvements in the application and verifi cation processes are expected to enhance program integrity and effi ciency.
Over time, schools have faced many different kinds of challenges in oper-ating the program. In earlier years, schools struggled to equip full-service cafeterias and ensure that children had enough to eat. More recently, concern over childhood obesity has placed schools on the front lines of efforts to improve children’s diets. While NSLP participants have higher intakes of calcium and fi ber—nutrients underconsumed by children—they also have higher fat intakes.
Some critics of NSLP argue that USDA’s donation of commodities, such as cheese and meat, to the program and the requirement that milk be served with every lunch contribute to these higher fat intakes (Yeoman, 2003). While intakes of milk and meat by participants were higher than those of nonpartici-pants, data from the most rigorous studies available to date show that calorie intake of participants was not signifi cantly higher. Studies of the program’s effects on obesity are contradictory.
Fat intakes of participants do remain a nutritional concern, and many States and localities have adopted more stringent restrictions on both meals and “competitive foods”—a la carte or vending machine items sold to generate extra revenue for the school food authority or the school as a whole. Yet, schools already face a “trilemma” involving the meal’s nutrition, student participation, and program cost. Improving the nutritional content of school meals may raise program costs, especially if it includes the necessary changes in food purchases, preparation, and marketing to prevent lower participation or higher plate waste. Similarly, both school administrators and school food authorities have struggled to keep budgets balanced as they implement restrictions on competitive foods. Other cost pressures, such as increases in health care costs and charges of indirect costs by school districts, make this balancing even more diffi cult.
As new policies emerge to address these concerns, whether at the local or Federal levels, research will continue to be required to evaluate their effec-tiveness. USDA’s ERS and FNS are conducting research on many of these issues. These analyses will help stakeholders understand the impacts of the program and policy issues that the NSLP will continue to face in the future.

40The National School Lunch Program: Background, Trends, and Issues / ERR-61
Economic Research Service/USDA
References
American Beverage Association (2006). “America’s Students To See Changes in Beverage Options as They Return to School This Fall,” news release, August 30, http://www.ameribev.org/news-detail/index.aspx?nid=63, accessed January 12, 2007.
Bartholomew, J.B., and E.M. Jowers (2006). “Increasing Frequency of Lower Fat Entrees Offered at School Lunch: An Environmental Change Strategy To Increase Healthful Selections,” Journal of the American Dietetic Association 106(2):248-52.
Bartlett, Susan, Frederic Glantz, and Christopher Logan (2008). School Lunch and Breakfast Cost Study II, Special Nutrition Programs Report No. CN-08-MCII, U.S. Department of Agriculture, Food and Nutrition Service, Offi ce of Research, Nutrition and Analysis, April, http://www.fns.usda.gov/oane/MENU/Published/CNP/FILES/MealCostStudy.pdf, accessed June 2, 2008.
Bergman, Ethan, Nancy S. Buergel, Annaka Femrite, Timothy F. Englund, and Michael R. Braunstein (2003). Relationships of Meal and Recess Schedules to Plate Waste in Elementary Schools, report prepared for the National Food Service Management Institute, http://www.nfsmi.org/Information/meal_recess_report.pdf, accessed May 26, 2006.
Besharov, Douglas (2003). “Growing Overweight and Obesity in America: The Potential Role of Federal Nutrition Programs,” testimony before the Committee on Agriculture, Nutrition, and Forestry, April 3, http://agriculture.senate.gov/Hearings/03ap3besh.pdf, accessed December 22, 2006.
Burghardt, J., Silva, T., and Hulsey, L. (2004a). Case Study of National School Lunch Program Verifi cation Outcomes in Large Metropolitan School Districts, Special Nutrition Report No. CN-04-AV3, U.S. Department of Agriculture, Food and Nutrition Service, http://www.fns.usda.gov/oane/MENU/Published/CNP/FILES/NSLPcasestudy.pdf, accessed June 2, 2008.
Burghardt, John, Philip Gleason, Michael Sinclair, Rhoda Cohen, Lara Hulsey, and Julita Milliner-Waddell (2004b). Evaluation of the National School Lunch Program Application/Verifi cation Pilot Projects, Volume I: Impacts on Deterrence, Barriers, and Accuracy, U.S. Department of Agriculture, Food and Nutrition Service, Offi ce of Analysis, Nutrition, and Evaluation, February, http://www.fns.usda.gov/oane/MENU/Published/CNP/FILES/NSLPPilotVol1.pdf, accessed June 2, 2008.
Burghardt, John, Anne Gordon, Nancy Chapman, Philip Gleason, and Thomas Fraker (1993). The School Nutrition Dietary Study: School Food Service, Meals Offered, and Dietary Intakes, U.S. Department of Agriculture, Food Nutrition Service, Offi ce of Analysis and Evaluation, October,
41The National School Lunch Program: Background, Trends, and Issues / ERR-61
Economic Research Service/USDA
http://www.fns.usda.gov/oane/MENU/Published/CNP/FILES/SNDA-FoodServ-Pt1.pdf, accessed June 2, 2008
Buzby, J.C., and J.F. Guthrie (2002). Plate Waste in School Nutrition Programs: Final Report to Congress, E-FAN-02-009, U.S. Department of Agriculture, Economic Research Service, March, www.ers.usda.gov/publications/efan02009/, accessed June 27, 2007.
Casey, Patrick H., Pippa M. Simpson, Jeffrey M. Gossett, Margaret L. Bogle, Catherine M. Champagne, Carol Connell, David Harsha, Beverly McCabe-Sellers, James M. Robbins, Janice E. Stuff, and Judith Weber (2006). “The Association of Child and Household Food Insecurity With Childhood Overweight Status,” Pediatrics 118:e1406-e1413.
Cullen, Karen, Kathey Watson, Issa Zakeri, and Katherine Ralston (2006). “Exploring Changes on Middle School Lunch Consumption after Local School Food Service Policy Modifi cations,” Public Health Nutrition 9(6): 814-820.
Cullen, K.W., J. Eagan, T. Baranowski, E. Owens, and C. de Moor (2000). “Effect of A La Carte and Snack Bar Foods at School on Children’s Lunchtime Intake of Fruits and Vegetables,” Journal of the American Dietetic Association 100(12):1482-6.
Demas, A. (1998). “Low-Fat School Lunch Programs: Achieving Acceptance,” The American Journal of Cardiology 82(10B):80T-82T.
Food Research Action Center (FRAC). FRAC News Digest, April 22, 2008, http://frac.org/digest/index.htm, accessed April 22, 2008.
Fox, M.K., M.K. Crepinsek, P. Connor, M. Battaglia (2001). School Nutrition Dietary Assessment Study II: Final Report, U.S. Department of Agriculture, Food and Nutrition Service, April, http://www.fns.usda.gov/oane/MENU/Published/CNP/FILES/SNDAIIfi nd.pdf, accessed January 9, 2006.
Fox, Mary Kay, William Hamilton, and Biing-Hwan Lin (2004a). Effects of Food Assistance and Nutrition Programs on Nutrition and Health, Volume 4, Executive Summary of the Literature Review, Food Assistance and Nutrition Research Report No. 19-4, U.S. Department of Agriculture, Economic Research Service, December, http://www.ers.usda.gov/publications/fanrr19-4/fanrr19-4.pdf, accessed June 2, 2008.
Fox, Mary Kay, William Hamilton, and Biing-Hwan Lin (2004b). Effects of Food Assistance and Nutrition Programs on Nutrition and Health, Volume 3, Literature Review, Food Assistance and Nutrition Research Report No. 19-3, U.S. Department of Agriculture, Economic Research Service, October, http://www.ers.usda.gov/publications/fanrr19-3/fanrr19-3.pdf, accessed June 2, 2008.
42The National School Lunch Program: Background, Trends, and Issues / ERR-61
Economic Research Service/USDA
French, S.A., M. Story, J.A. Fulkerson, A.F. Gerlach (2003). “Food Environment in Secondary Schools: A La Carte, Vending Machines, Food Policies and Practices,” American Journal of Public Health 93(7):1161-7.
Glantz, F.B., R. Berg, D. Porcari, E. Sackoff, and S. Pazer (1994). School Lunch Eligible Non-Participants: Final Report, Submitted to U.S. Department of Agriculture, Food and Nutrition Service, under Contract No. 53-3198-018, December, http://www.fns.usda.gov/oane/MENU/Published/CNP/FILES/EligNonPart-Pt1.pdf, accessed June 2, 2008.
Gleason, Phillip, and Carol Suitor (2003). “Eating at School: How the National School Lunch Program Affects Children’s Diets,” American Journal of Agricultural Economics 85(4):1047-61.
Gleason, P. and C. Suitor (2001). Children’s Diets in the Mid-1990s: Dietary Intake and Its Relationship With School Meal Participation, Report No. CN-01-CD1, U.S. Department of Agriculture, Food and Nutrition Service, January, http://www.fns.usda.gov/oane/MENU/Published/CNP/FILES/ChilDiet.pdf, accessed June 2, 2008.
Gleason, Phillip, Tania Tasse, Kenneth Jackson, and Patricia Nemeth (2003). Direct Certifi cation in the National School Lunch Program: Impacts on the Program Access and Integrity Final Report, FANRR-03-009, U.S. Department of Agriculture, Economic Research Service, January, http://www.ers.usda.gov/Publications/EFAN03009/, accessed June 2, 2008.
Gleason, Phillip (1996). Student Participation in the School Nutrition Programs: An Econometric and Simulation Model, report submitted to U.S. Department of Agriculture, Food and Nutrition Service, August.
Gordon, Anne, Mary Kay Crepinsek, Renee Nogales, and Elizabeth Condon (2007a). School Nutrition Dietary Assessment Study-III: Volume II: Student Participation and Dietary Intakes, Report No. CN-07-SNDA-III, November, http://www.fns.usda.gov/oane/MENU/Published/CNP/FILES/SNDAIII-Vol2.pdf, accessed June 2, 2008.
Gordon, Anne, Mary Kay Crepinsek, Renee Nogales, and Elizabeth Condon (2007b). School Nutrition Dietary Assessment Study-III: Volume I: School Foodservice, School Food Environment, and Meals Offered and Served, Report No. CN-07-SNDA-III, November, http://www.fns.usda.gov/oane/MENU/Published/CNP/FILES/SNDAIII-Vol1.pdf, accessed June 2, 2008.
Gunderson, Gordon W. (1971). “National School Lunch Program: Background and Development,” U.S. Department of Agriculture, Food and Nutrition Service, http://www.fns.usda.gov/cnd/lunch/AboutLunch/ProgramHistory.htm, accessed April 4, 2007.

43The National School Lunch Program: Background, Trends, and Issues / ERR-61
Economic Research Service/USDA
Hanson, Kenneth (2003). Importance of Child Nutrition Programs to Agriculture, Food Assistance Research Brief, Food Assistance and Nutrition Research Report Number 34-12, U.S. Department of Agriculture, Economic Research Service, July, http://www.ers.usda.gov/publications/fanrr34/fanrr34-12/fanrr34-12.pdf, accessed June 2, 2008.
Harnack, L., P. Snyder, M. Story, R. Holliday, L. Lytle, and D. Neumark-Sztainer (2000). “Availability of A La Carte Food Items in Junior and Senior High Schools: A Needs Assessment,” Journal of the American Dietetic Association 100(6):701-3.
Hofferth, Sandra, and Sally Curtin (2005). “Poverty, Food Programs, and Childhood Obesity,” Journal of Policy Analysis and Management 24(4): 703-726.
Hulsey, Lara, Philip Gleason, and James Ohls (2004). Evaluation of the National School Lunch Program Application/Verifi cation Pilot Projects, Volume V: Analysis of Applications, Special Nutrition Program Report No. CN-040-AV4, U.S. Department of Agriculture, Food and Nutrition Service.
Institute of Medicine (2005). “Schools,” in Preventing Childhood Obesity: Health in the Balance, Washington DC: National Academies Press, http://books.nap.edu/openbook.php?record_id=11015&page=237, accessed June 2, 2008.
Jones, S.J., L. Jahns, B. Laraia, and B. Haughton (2003). “Lower Risk of Overweight in School-Aged Food Insecure Girls Who Participate in Food Assistance: Results From the Panel Study of Income Dynamics Child Development Supplement,” Archives of Pediatrics & Adolescent Medicine 157(8):780-84.
Liquori, T., P.D. Koch, I.R. Contento, and J. Castle (1998). “The Cookshop Program: Outcome Evaluation of a Nutrition Education Program Linking Lunchroom Experiences With Classroom Cooking Experiences,” Journal of Nutrition Education 30(5):302-313.
Logan, Chris, and Ryan Kling (2005). School Food Authority Characteristics Survey: Descriptive Analysis Memorandum and Tables, report submitted to Food and Nutrition Service Offi ce of Analysis, Nutrition, and Evaluation, U.S. Department of Agriculture, by Abt Associates and Mathematica Policy Research, Inc., August 12.
Long, S.K. (1991). “Do the School Nutrition Programs Supplement Household Food Expenditures?” Journal of Human Resources 26(4):654-78.
Luepker, R.V., C.L. Perry, S.M. McKinlay, P.R. Nador, G.S. Parcel, E.J. Stone, L.S. Webber, J.P. Elder, H.A. Feldman, C.C. Johnson, S.H. Kelder, and M.W. Wu, for the CATCH Collaborative Group (1996). “Outcomes of a Field Trial To Improve Children’s Dietary Patterns and Physical Activity: The Child and Adolescent Trial for Cardiovascular
44The National School Lunch Program: Background, Trends, and Issues / ERR-61
Economic Research Service/USDA
Health (CATCH),” Journal of the American Medical Association 275(10):766-76.
Lutz, Steven, Jay Hirschman, and David Smallwood (1999). “National School Lunch and School Breakfast Program Reforms, in America’s Eating Habits: Changes and Consequences, Elizabeth Frazao (ed.), Agriculture Information Bulletin No.750, U.S. Department of Agriculture, Economic Research Service, April, http://www.ers.usda.gov/publications/aib750/, accessed June 2, 2008.
MacDonald, James M., Charles R. Handy, and Gerald E. Plato (1998). Food Procurement by USDA’s Farm Service Agency, Agricultural Economic Report No.766, U.S. Department of Agriculture, Economic Research Service, September, http://www.ers.usda.gov/publications/aer766/aer766.pdf, accessed June 2, 2008.
Neuberger, Zoë, and Robert Greenstein (2003). “New Analysis Shows ‘Overcertifi cation’ For Free or Reduced-Price School Meals Has Been Overstated,” Washington, DC: Center for Budget and Policy Priorities, http://www.cbpp.org/7-15-03wic.pdf, accessed June 2, 2008..
Newman, Constance (2006). The Income Volatility See-Saw: Implications for School Lunch, Economic Research Report No. 23, U.S. Department of Agriculture, Economic Research Service, August, http://www.ers.usda.gov/Publications/err23/err23.pdf accessed June 2, 2008.
Newman, Constance, and Katherine Ralston (2006). Data Profi les of National School Lunch Program Participants From Two National Surveys, Economic Information Bulletin No. 17, U.S. Department of Agriculture, Economic Research Service, August, accessed June 2, 2008.
Ogden, C.L., M.D. Carroll, L.R. Curtin, M.A. McDowell, C.J. Tabak, and K.M. Flegal (2006). “Prevalence of Overweight and Obesity in the United States, 1999-2004,” Journal of the American Medical Association 295:1549-1555.
O’Toole, Terrence, Susan Anderson, Claire Miller, and Joanne Guthrie. “Nutrition Services and Foods and Beverages Available at School: Results From the School Health Policies and Programs Study 2006.” Journal of School Health 77(8): 500-521.
Ponza, Michael, Philip Gleason, Lara Hulsey, and Quinn Moore (2007). NSLP/SBP Access, Participation, Eligibility, and Certifi cation Study: Erroneous Payments in the NSLP and SBP. Volume 1: Study Findings. Special Nutrition Programs Report No. CN-07-APEC. U.S. Department of Agriculture, Food and Nutrition Service, Offi ce of Research, Nutrition, and Analysis, November, http://www.fns.usda.gov/oane/MENU/Published/CNP/FILES/apecvol1.pdf, accessed June 2, 2008.

45The National School Lunch Program: Background, Trends, and Issues / ERR-61
Economic Research Service/USDA
Prentice, G. (2002). “Marketing School Milk to Children: A Review of Key Findings From the School Milk Pilot Test,” presented at the Healthy School Summit: Taking Action for Children’s Nutrition and Fitness, Washington, DC, October 7-8, http://www.actionforhealthykids.com/docs/speakers/p_prentice.pdf
Produce for Better Health Foundation (2003). “Eat Your Colors Every Day Salad Bar and Salad Options Project in Florida Schools,” http://www.5aday.com/pdfs/industry/fl abrochure.pdf, accessed December 23, 2005.
Rainville, Alice Jo, Kay N. Wolf, and Deborah H. Carr (2005). Barriers to Recess Placement Prior to Lunch in Elementary Schools, National Food Service Management Institute, http://www.nfsmi.org/Information/research_summaries/barriers_elem_recess.htm, accessed October 29, 2007.
Reynolds, K.D., T. Baranowski, D. Bishop, J. Gregson, and T. Nicklas (2001). “5 A Day Behavior Change Research in Children and Adolescents,” Chapter 10 in 5 A Day for Better Health Program, National Institutes of Health and National Cancer Institute, September, pp. 133-149, http://5aday.nci.nih.gov/about/mono.html, accessed January 9, 2006.
Rose, Donald, and Nicholas Bodor (2006). “Household Food Insecurity and Overweight Status in Young School Children: Results From the Early Childhood Longitudinal Study,” Pediatrics 117:464-473.
Schanzenbach, Diane Whitmore (2005). “Do School Meals Contribute to Childhood Obesity?” Harris School Working Paper 5.13, University of Chicago, Harris School of Public Policy Studies.
School Nutrition Association (2007). “2007 Legislative Issues Paper,” http://ektron.schoolnutrition.org/uploadedfi les/SchoolNutrition.org/News_&_Publications/School_Foodservice_News/New_Folder/2007_LEGISLATIVE_ISSUE_PAPER.pdf, accessed August 3, 2007.
School Nutrition Association (2006). 2006 Indirect Costs Study, http://www.schoolnutrition.org/uploadedFiles/SchoolNutrition.org/News_&_Publications/School_Foodservice_News/New_Folder/Indirect%20Costs%20Report_Final%20Draft.pdf, accessed October 24, 2007.
Slusser, W., W. Cumberland, B. Browdy, L. Lange, and C. Neumann (2007). “A School Salad Bar Increases Frequency of Fruit and Vegetable Consumption Among Children Living in Low-Income Households,” Public Health Nutrition, July 5.
Snyder, M.P., M. Story, and L.L. Trenkner (1992). “Reducing Fat and Sodium in School Lunch Programs: The LUNCHPOWER! Intervention Study,” Journal of the American Dietetic Association 92(9):1087-91.

46The National School Lunch Program: Background, Trends, and Issues / ERR-61
Economic Research Service/USDA
St. Pierre, Robert G., and Michael J. Puma (1992). “Controlling Federal Expenditures in the National School Lunch Program: The Relationship Between Changes in Household Eligibility and Federal Policy,” Journal of Policy Analysis and Management 11(1):42-57.
Story, M., M. Hayes, and B. Kalina (1996). “Availability of Foods in High Schools: Is There Cause for Concern?” Journal of the American Dietetic Association 96(2):123-6.
Templeton, S.M. Marlette, and M. Panemangalore (2005). “Competitive Foods Increase the Intake of Energy and Decrease the Intake of Certain Nutrients by Adolescents Consuming School Lunch,” Journal of the American Dietetic Association 105:215:220.
U.S. Department of Agriculture, Food and Nutrition Service (USDA, FNS) (2007a). “National School Lunch Program: Participation and Lunches Served,” http://www.fns.usda.gov/pd/slsummar.htm, accessed April 4, 2007.
U.S. Department of Agriculture, Food and Nutrition Service (USDA, FNS) (2007b). “Federal Costs of School Food Programs,” http://www.fns.usda.gov/pd/cncosts.htm, accessed October 25, 2007.
U.S. Department of Agriculture, Food and Nutrition Service (USDA FNS) (2007c). “Accuracy of SFA Processing of School Lunch Applications—Regional Offi ce Review of Applications (RORA) 2006,” U.S. Department of Agriculture, Food and Nutrition Service, Offi ce of Analysis, Nutrition, and Evaluation, April, http://www.fns.usda.gov/oane/MENU/Published/CNP/FILES/rora2006.pdf, accessed October 23, 2007.
U.S. Department of Agriculture, Food and Nutrition Service (USDA, FNS) (2006). Release of School Year 2007 Meat and Poultry Surveys and Dollar Guidance for Group A Commodity Groups, FOCUS Bulletin Vol. 2006, No. 602, March 2, http://www.fns.usda.gov/fdd/focus/2006bulletins/FB602-SY07_MeatPoultrySurveyReleases.pdf, accessed September 24, 2007.
U.S. Department of Agriculture, Food and Nutrition Service (USDA, FNS) (2005a). “2005 Dietary Guidelines for Americans and the New Dietary Reference Intakes: Potential Implications for NSLP and SBP Meals,” presented at the School Nutrition Association Annual National Conference, Baltimore, MD, August, http://www.fns.usda.gov/cnd/Presentations/2005DietaryGuidelinesforAmericans.pdf, accessed April 27, 2007.
U.S. Department of Agriculture, Food and Nutrition Service (USDA, FNS) (2005b). “Accuracy of SFA Processing of School Lunch Applications—Regional Offi ce Review of Applications (RORA) 2005,” December, http://www.fns.usda.gov/oane/menu/Published/CNP/FILES/rora05.pdf, accessed April 2, 2007.
47The National School Lunch Program: Background, Trends, and Issues / ERR-61
Economic Research Service/USDA
U.S. Department of Agriculture, Food and Nutrition Service (USDA, FNS) (2003). School Food Authority Administration of National School Lunch Program: Free and Reduced Price Eligibility Determination, Offi ce of Analysis, Nutrition and Evaluation, Nutrition Assistance Program Report Series, August, http://www.fns.usda.gov/oane/MENU/Published/CNP/FILES/rova.pdf, accessed June 2, 2008.
U.S. Department of Agriculture, Food and Nutrition Service, (USDA, FNS) Offi ce of Analysis, Nutrition, and Evaluation (1999a). The Story of Team Nutrition: Pilot Study Outcome Report: Final Report, prepared by Prospect Associates and Westat, Contract 53-3198-4-038, July, http://www.fns.usda.gov/oane/MENU/Published/CNP/cnp-archive.htm, accessed January 9, 2005.
U.S. Department of Agriculture, Food and Nutrition Service (USDA, FNS) (1999b). Current Population Survey Analysis of NSLP Participation and Income, Offi ce of Analysis, Nutrition and Evaluation, Nutrition Assistance Program Report Series, October, http://www.fns.usda.gov/oane/MENU/Published/CNP/FILES/nslpcps.pdf.
U.S. Department of Agriculture, Food and Nutrition Service (1990-2008). Program Information Report (Keydata): U.S. Summary, Program Reports, Analysis and Monitoring Branch, Budget Division.
U.S. Department of Agriculture, Food and Nutrition Service, U.S. Department of Health and Human Services, Centers for Disease Control and Prevention, and U.S. Department of Education (2005). Making It Happen! School Nutrition Success Stories, January, http://www.fns.usda.gov/TN/Resources/makingithappen.html, accessed June 2, 2008.
U.S. Department of Agriculture, Offi ce of Inspector General (USDA, OIG) (1997). Food and Consumer Service, National School Lunch Program Verifi cation of Applications in Illinois, Audit Report No. 27010-0011-Ch, August.
U.S. Department of Agriculture, Offi ce of Budget and Policy Analysis (1998-2007). USDA Budget Explanatory Notes for Committee on Appropriations: Food and Nutrition Service.
U.S. Department of Health and Human Services (DHHS) (1991). Healthy People 2000: National Health Promotion and Disease Prevention Objectives, DHHS Publication No. (PHS) 91-50212.
U.S. Government Accountability Offi ce (GAO) (2005). School Meals Program: Competitive Foods Are Widely Available and Generate Substantial Revenues for Schools, August, http://www.gao.gov/new.items/d05563.pdf, accessed January 9, 2006.
U.S. Government Accountability Offi ce (2003). School Meals Program: Revenue and Expense Information for Selected States, August, http://www.gao.gov/new.items/d03569.pdf, accessed January 9, 2006.
48The National School Lunch Program: Background, Trends, and Issues / ERR-61
Economic Research Service/USDA
Wagner, Barbara, Benjamin Senaver, and Ford Runge (2007). “An Empirical Analysis of and Policy Recommendations To Improve the Nutritional Quality of School Meals,” Review of Agricultural Economics 29(4):672-88.
Wechsler, H., N.D. Brener, S. Kuester, C. Miller (2001). “Food Service and Foods and Beverages Available at School: Results From the School Health Policies and Programs Study 2000,” Journal of School Health 71(7):313-323.
Wemmerus, Nancy E., Elyse S. Forkosh, and Douglas Almond (1996). Characteristics of National School Lunch and School Breakfast Program Participants, U.S Department of Agriculture, Food and Consumer Service, Offi ce of Analysis and Evaluation, May, http://www.fns.usda.gov/oane/MENU/Published/CNP/FILES/NSLPChar.pdf.
Wescott, Robert (2005). “Measuring the Purchases of Soft Drinks by Students in U.S. Schools,” American Beverage Association, http://www.ameribev.org/industry-issues/school-beverage-guidelines/studies/download.aspx?id=64.
Whitaker, R.C., J.A. Wright, T.D. Koepsell, A.J. Finch, and B.M. Psaty (1994). “Randomized Intervention To Increase Children’s Selection of Low-fat Foods in School Lunches,” Journal of Pediatrics 125(4):535-40.
Whitaker, R.C., J.A. Wright, A.J. Finch, and B.M. Psaty (1993). “An Environmental Intervention to Reduce Dietary Fat in School Lunches,” Pediatrics 91(6):1107-11.
Wildey, M., B., S.Z. Pampalone, R.L. Pelletier, M.M. Zive, J.P. Elder, and J.F. Sallis (2000). “Fat and Sugar Levels Are High in Snacks Purchased From Student Stores in Middle Schools,” Journal of The American Dietetic Association 100(3):319-322.
Woodward-Lopez G., A. Vargas, S. Kim, C. Proctor, Diemoz L. Hiort-Lorenzen, and P. Crawford (2005). LEAF Cross-Site Evaluation: Fiscal Impact Report, Center for Weight and Health, University of California, Berkeley, www.cnr.berkeley.edu/cwh/activities/LEAF.shtml.
Yeoman, Barry (2003). “Unhappy Meals,” Mother Jones, January/February, http://www.motherjones.com/news/feature/2003/01/ma_207_01.html, accessed December 22, 2006.
Zive, M.M., J.P. Elder, J.J. Prochaska, T.L. Conway, R.L. Pelletier, S. Marshall, and J.F. Sallis (2002). “Sources of Dietary Fat in Middle Schools,” Preventive Medicine 35(4):376-382.