national scan-level life cycle assessment for production
TRANSCRIPT

Center for Agricultural
and Rural Sustainability
• • •
Technical Report 3Q-2012-01
National Scan-level Life Cycle Assessment for Production of US Peanut Butter
i
Table of Contents
EXECUTIVE SUMMARY ................................................................................................ 1
1 INTRODUCTION .................................................................................................... 5
2 LCA METHODOLOGY ............................................................................................. 7 2.1 GOAL AND SCOPE DEFINITION ................................................................................................. 8
2.1.1 Goal ............................................................................................................................................ 8 2.1.2 Project Scope and System Boundaries ...................................................................................... 8 2.1.3 Audience ..................................................................................................................................... 9 2.1.4 Functional Unit ........................................................................................................................... 9 2.1.5 Allocation ................................................................................................................................. 10 2.1.6 Life Cycle Impact Assessment ................................................................................................... 11 2.1.7 Cut-Off Criteria ......................................................................................................................... 12
2.2 LIFE CYCLE INVENTORIES ....................................................................................................... 12 2.2.1 Uncertainty ............................................................................................................................... 13 2.2.2 Software, Database and Model Validation .............................................................................. 13 2.2.3 Emission Factors ....................................................................................................................... 13 2.2.4 Industry Sector Model Development ........................................................................................ 15
3 SCAN LEVEL RESULTS AND ANALYSIS ................................................................... 33 3.1 RECIPE LIFE CYCLE IMPACT ASSESSMENT ................................................................................. 33
3.1.1 Highest Weighted Characterization Categories ....................................................................... 35 3.1.2 Lesser Characterization Categories .......................................................................................... 38
3.2 GREENHOUSE GAS AND CLIMATE CHANGE ............................................................................... 40 3.2.1 Cultivation Practice Comparison for Greenhouse Gases .......................................................... 43
3.3 UNCERTAINTY ANALYSIS ....................................................................................................... 44 3.4 SUMMARY OF SIMAPRO® MODELING ...................................................................................... 46
4 CONCLUSIONS .................................................................................................... 47 4.1 LCIA USING RECIPE MIDPOINT ............................................................................................. 47 4.2 LCIA USING IPCC 2007 GWP .............................................................................................. 48
4.2.1 Cradle to Grave ........................................................................................................................ 48 4.2.2 Peanut Production Scenarios .................................................................................................... 49
REFERENCES ............................................................................................................. 50
A. ADDITIONAL MODEL PARAMETERS FOR INDUSTRY SECTORS ............................... 53
B. ADDITIONAL RESULTS TABLES AND FIGURES ....................................................... 59
C. CRADLE TO ROASTER EMISSIONS ANALYSIS......................................................... 62

ii
List of Figures Figure ES-1*. Peanut butter industry climate change impacts, cradle to grave, kg CO2e per kg peanut butter
produced ......................................................................................................................................................... 2
Figure ES-2*. Total emissions for conventional and strip till cultivation practices in units of CO2 equivalents. Results determined using the Greenhouse Gas Protocol. ............................................................................... 3
Figure ES-3*. Monte Carlo uncertainty analysis results, 95% confidence interval, as compared with the initial SimaPro® model output and industry estimates for various packaged goods (EWG, 2011). ......................... 4
Figure 1-1. U.S. domestic use of peanuts (Pooley, 2005) .............................................................................................. 6
Figure 2-1. Stages of a life cycle assessment ................................................................................................................ 8
Figure 2-2. Overview of peanut butter production process .......................................................................................... 9
Figure 2-3. Process flow of national weighted average cultivation processes ............................................................ 18
Figure 2-4. Buying Point input/output flow diagram ................................................................................................... 19
Figure 2-5. Sheller input/output flow diagram ............................................................................................................ 22
Figure 2-6. Blancher input/output flow diagram ......................................................................................................... 25
Figure 2-7. Roaster input/output flow diagram .......................................................................................................... 25
Figure 2-8. Processing and packaging input/output flow diagram .............................................................................. 27
Figure 2-9. Retail input/output flow diagram .............................................................................................................. 29
Figure 3-1. ReCiPe midpoint impact analysis, cradle to grave ..................................................................................... 34
Figure 3-2. Recipe midpoint impact analysis, cradle to retail gate .............................................................................. 35
Figure 3-3. ReCiPe midpoint impact analysis for human toxicity characterization category, cradle to retail gate. .... 36
Figure 3-4. ReCiPe midpoint impact analysis for marine ecotoxicity characterization category, cradle to retail gate. ....................................................................................................................................................................... 37
Figure 3-5. ReCiPe midpoint impact analysis for freshwater ecotoxicity characterization category, cradle to retail gate. ............................................................................................................................................................... 38
Figure 3-6. IPCC 2007 GWP cradle to grave impact analysis, kg CO2e per kg peanut butter produced ...................... 41
Figure 3-7. Comparison of GHG emissions from various food types (EWG, 2011) ...................................................... 42
Figure 3-8. IPCC 2007 GWP impact analysis process flow contributors, cradle to retail gate ..................................... 43
Figure 3-9. IPCC 2007 GWP impact analysis for conventional and strip till cultivation practices in units of CO2e ..... 44
Figure 3-10. Probability distribution function for GHG emissions for peanut butter (kg Peanut Butter/kg CO2e). 95% confidence interval displayed on chart as red vertical lines. ........................................................................ 45
Figure 3-11. Monte Carlo uncertainty analysis results, 95% confidence interval, as compared with the initial SimaPro® model output and industry estimates for various packaged goods (EWG, 2011). ....................... 46
Figure C-1. kg CO2e emissions per kg roasted nuts produced. IPCC 2007 GWP method ........................................... 62
Figure C-2. Percentage of total CO2e emissions by life cycle stage ............................................................................. 63
Figure C-3. CO2e emissions by input. Life cycle inputs contributing less than 1% of the total emissions are not shown. ........................................................................................................................................................... 63

iii
List of Tables Table 2-1. National Average 16oz Peanut Butter Product (The Peanut Institute, 2010) ............................................ 10
Table 2-2. Peanut supply chain product loss approximation....................................................................................... 11
Table 2-3. Midpoint Categories in the ReCiPe impact assessment methodology (Thoma, et al., 2010) ..................... 12
Table 2-4. Diesel combustion emission factors ........................................................................................................... 14
Table 2-5. Gasoline combustion emission factors ....................................................................................................... 14
Table 2-6. Natural Gas combustion emission factors .................................................................................................. 15
Table 2-7. Liquid Propane combustion emission factors ............................................................................................. 15
Table 2-8. Weighted average for peanut cultivation in the US ................................................................................... 16
Table 2-9. Summary of Georgia peanut enterprise budget inputs and outputs by production scenario for one acre of cultivated land (UGA, 2011) ...................................................................................................................... 17
Table 2-10. Farm model input and output processes for nation average aggregate farm peanut production .......... 17
Table 2-11. Buying Point model input and output processes ...................................................................................... 19
Table 2-12. Sheller model input and output processes ............................................................................................... 21
Table 2-13. Sheller chemical and pesticide inputs....................................................................................................... 23
Table 2-14. Blancher model input/output parameters ............................................................................................... 24
Table 2-15. Roaster model input/output parameters ................................................................................................. 24
Table 2-16. Summary of all material inputs to a 16 oz jar of peanut butter .............................................................. 26
Table 2-17. Transportation diesel totals for materials that make up a 16 oz peanut butter product on a per ton basis. .............................................................................................................................................................. 27
Table 2-18. Retail model input/output parameters .................................................................................................... 29
Table 2-19. Retail waste flows ..................................................................................................................................... 30
Table 2-20. National average dishwasher use data (Thoma, et al., 2012)................................................................... 31
Table 2-21. National average peanut butter and consumer behavior data (Hogass, 2002) ....................................... 31
Table 2-22. Summary of consumer disposal assumptions .......................................................................................... 32
Table 3-1. IPCC 2007 GWP cradle to grave impact analysis, kg CO2e per kg of peanut butter produced ................... 41
Table 3-2. Greenhouse Gas Protocol results by impact category and cultivation method ......................................... 43
Table A-1. Farm chemical inputs ................................................................................................................................. 53
Table A-2. Farm chemical inputs, continued ............................................................................................................... 54
Table A-3. Blancher and roaster cleaner use per ton of peanuts produced ................................................................ 55
Table A-4. Blancher and roaster pesticide use per ton of peanuts produced ............................................................. 56
Table A-5. Processing ingredient inputs and diesel transport requirement for 1 ton of ingredients ......................... 57
Table A-6. Packaging material inputs and diesel transport requirements for 1 ton of materials ............................... 58
Table B-1. Fossil depletion process flow impacts for 1 kg peanut butter .................................................................... 59
Table B-2. Freshwater eutrophication process flow impacts for 1 kg peanut butter .................................................. 59

iv
Table B-3. Terrestrial Acidification process flow impacts for 1 kg of peanut butter ................................................... 60
Table B-4. Particulate matter formation process flow impacts for 1kg of peanut butter ........................................... 60
Table B-5. Photochemical oxidant formation process flow impacts for 1kg of peanut butter ................................... 61
1
Executive Summary
The purpose of this study was to perform a scan-level life cycle assessment (LCA) and impact
analysis for peanut butter production in the U.S. Objectives for the LCA were: 1) a literature review of
the peanut industry, 2) a life cycle inventory (LCI) review, and 3) an assessment of a variety of impacts
including carbon. The literature review of the peanut industry is submitted as an attachment to this
report. This document provides a description of the life cycle inventory, assessment, and impact results.
The project scope included environmental effects at a national scale in order to put into context
the environmental impacts that can be attributed to the entire life cycle of a 1 lb jar of peanut butter in
the United States. A complete model of the peanut butter supply chain accounting for extractions from
nature through final disposal of packaging materials was constructed using life cycle inventory data from
survey results, scientific and industry literature, expert opinion, existing manufacturers’ LCAs, other
industry provided data sets, and U.S. based unit processes from the U.S. Life Cycle Inventory housed at
the National Renewable Energy Laboratory (NREL, 2012).
The primary impact categories were evaluated using the ReCiPe impact analysis model
(Goedkoop, Heijungs, Schryver, Struijs, & Van Zelm, 2008). ReCiPe identified toxicity impacts from
emissions from four main processes: natural gas production, disposal of municipal waste, disposal of
coal byproducts, and pesticide use. Natural gas production and use was associated with drying (buying
point) and roasting. Disposal of municipal waste was associated with blanching, roasting, and
processing. Disposal of coal byproducts was associated with processes on the farm. Pesticide impacts
were primarily associated with farm operations, however, pesticide use amounts reported at the sheller,
blancher, and roaster were in quantities large enough to be used in the model.
A scan level impact assessment was also performed for greenhouse gas emissions using the
Intergovernmental Panel on Climate Change’s (IPCC) 2007 Global Warming Potential (GWP) model
evaluated for impacts at the 100 year point (Frischknecht & Jungbluth, 2007). Greenhouse gas (GHG)
emissions were measured in kg CO2 equivalent (kg CO2e) per kg peanut butter produced. IPCC 2007
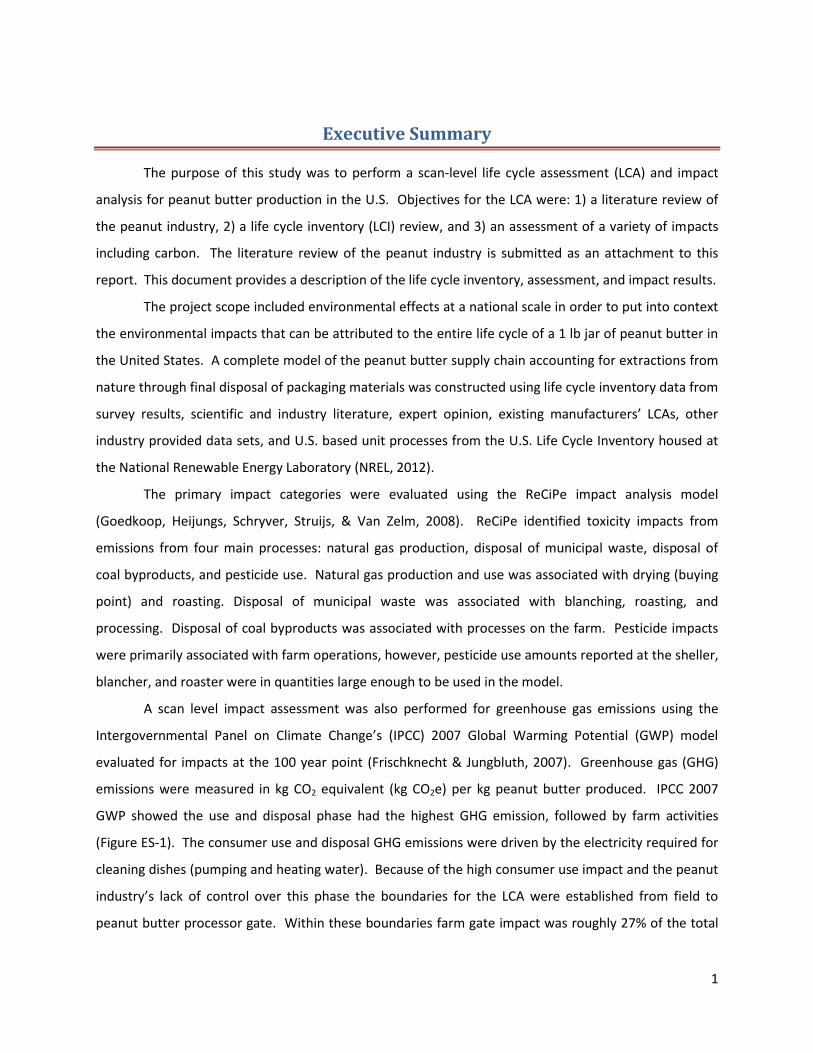
GWP showed the use and disposal phase had the highest GHG emission, followed by farm activities
(Figure ES-1). The consumer use and disposal GHG emissions were driven by the electricity required for
cleaning dishes (pumping and heating water). Because of the high consumer use impact and the peanut
industry’s lack of control over this phase the boundaries for the LCA were established from field to
peanut butter processor gate. Within these boundaries farm gate impact was roughly 27% of the total
2
greenhouse gas emissions from the supply chain with the next highest contributor being the peanut
butter processor at 22%. The production of electricity by bituminous coal was the most significant
process contributor to greenhouse gases across the supply chain. This electricity is used to power all of
the processes from the buying point to retail with its most significant use at the peanut butter
processor. The complete cradle to grave life cycle impact assessment for peanut butter shows a GHG
impact of 2.64 kg CO2e.
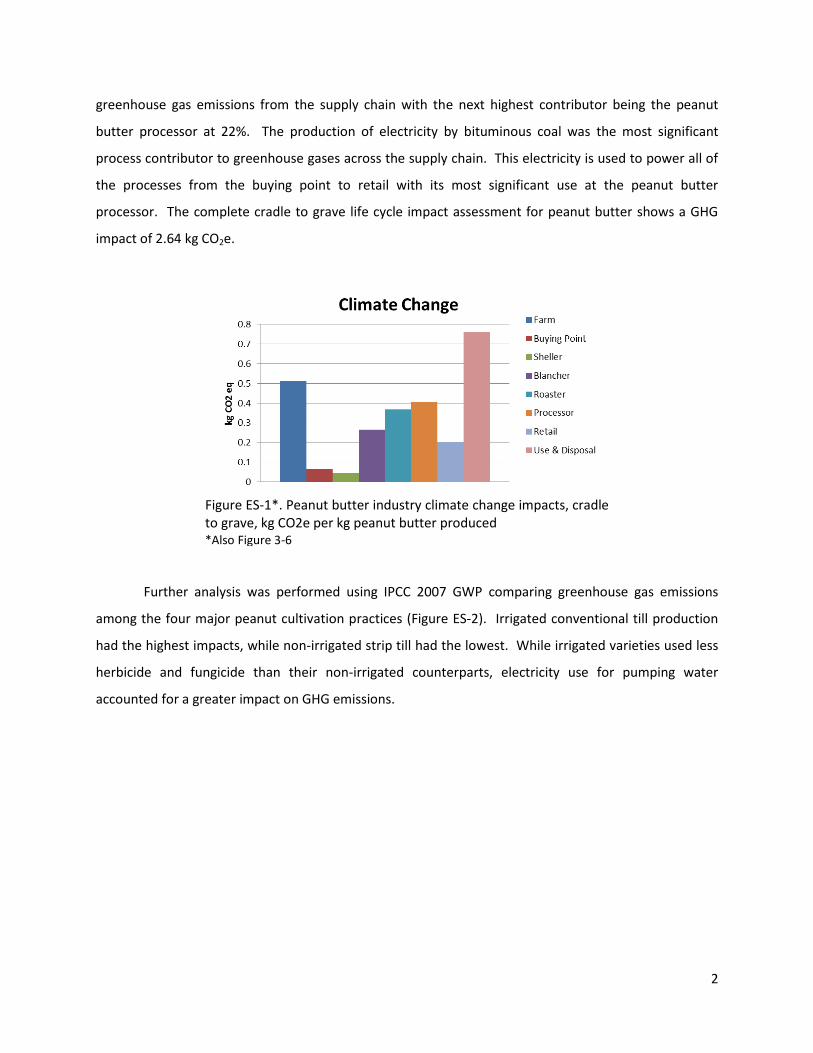
Further analysis was performed using IPCC 2007 GWP comparing greenhouse gas emissions
among the four major peanut cultivation practices (Figure ES-2). Irrigated conventional till production
had the highest impacts, while non-irrigated strip till had the lowest. While irrigated varieties used less
herbicide and fungicide than their non-irrigated counterparts, electricity use for pumping water
accounted for a greater impact on GHG emissions.
Figure ES-1*. Peanut butter industry climate change impacts, cradle to grave, kg CO2e per kg peanut butter produced *Also Figure 3-6
3
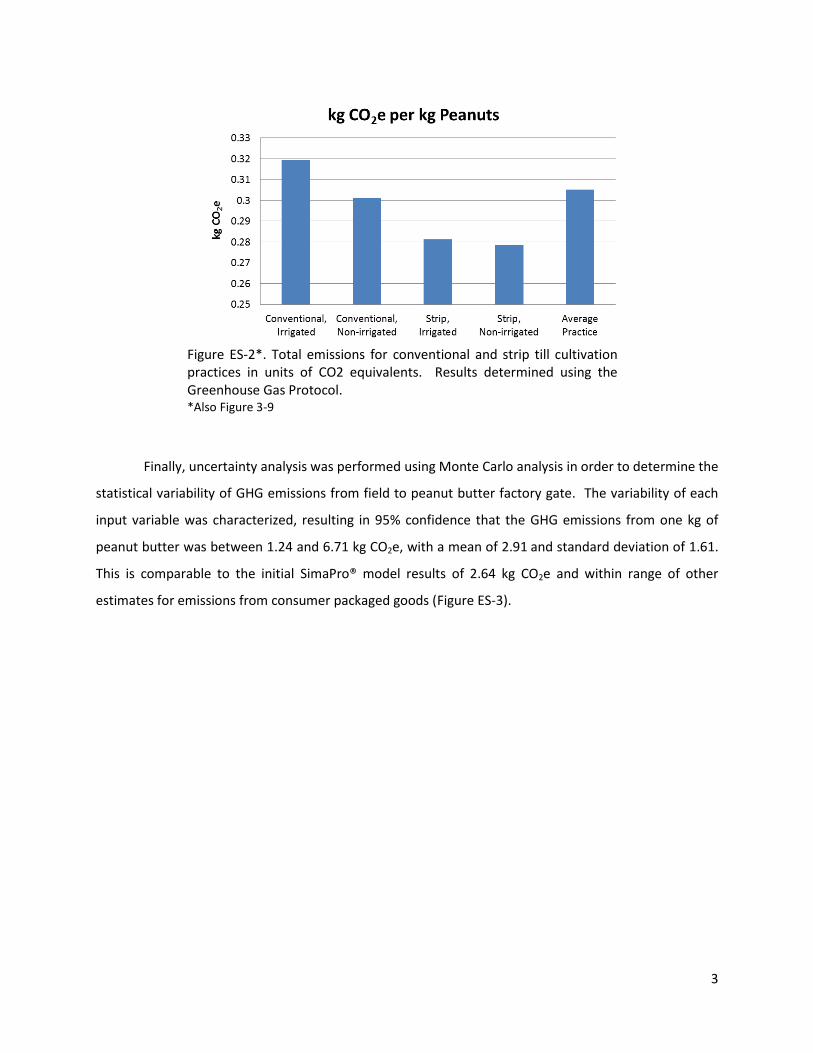
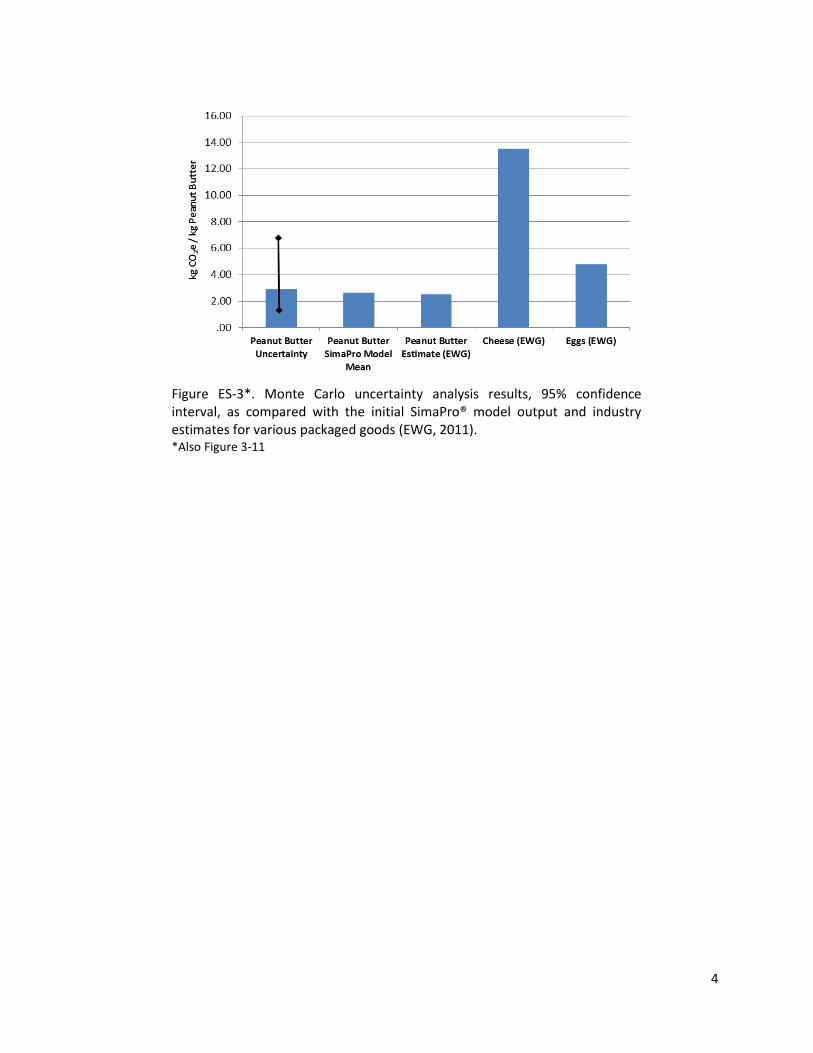
Finally, uncertainty analysis was performed using Monte Carlo analysis in order to determine the
statistical variability of GHG emissions from field to peanut butter factory gate. The variability of each
input variable was characterized, resulting in 95% confidence that the GHG emissions from one kg of
peanut butter was between 1.24 and 6.71 kg CO2e, with a mean of 2.91 and standard deviation of 1.61.
This is comparable to the initial SimaPro® model results of 2.64 kg CO2e and within range of other
estimates for emissions from consumer packaged goods (Figure ES-3).
Figure ES-2*. Total emissions for conventional and strip till cultivation practices in units of CO2 equivalents. Results determined using the Greenhouse Gas Protocol. *Also Figure 3-9
4
Figure ES-3*. Monte Carlo uncertainty analysis results, 95% confidence interval, as compared with the initial SimaPro® model output and industry estimates for various packaged goods (EWG, 2011). *Also Figure 3-11
5
1 Introduction
Corporate social responsibility, including sustainability, is one of the top priorities for executives
in the consumer goods industry, according to the 2010 “Top of Mind” survey sponsored by The
Consumer Goods Forum (The Consumer Goods Forum, 2010). Retailers, suppliers, manufacturers, and
distributors are seeking ways to improve their operations using the framework of sustainability.
Consumers continue to ask for green products and services and express an interest in understanding the
sustainability of the products they purchase as well. There is an increasing willingness to make
purchasing decisions based on what they know about the environmental impacts of a product. Thus,
the peanut industry and the American Peanut Council identified a need to conduct a cradle-to-grave life
cycle assessment (LCA) for U.S. peanut products focused on quantifying embodied energy, emissions to
air, and the consumption of water and other natural resources. There was also the additional need to
assess the impacts of these inventory flows on climate change (global warming potential), resource
depletion, and human and ecosystem health.
Life cycle assessment (LCA) is a tool to account for complete interactions and combined effects
in a product chain. LCAs can provide quantitative, confirmable, and manageable models to evaluate
production processes, analyze options for innovation, and improve understanding of the complexity in
systems. LCAs have been used as a tool to identify “hot spots” in the production chain that may
introduce opportunities for simultaneously lowering environmental impacts and improving efficiency
and profitability (Hogass, 2002). This LCA will allow the peanut industry to position its products in the
market place in terms of their sustainable attributes and respond proactively to consumer concerns. It
will provide a milestone that will guide the peanut industry to engage more sustainable practices and
reduce environmental impacts, while validating those reductions through science-based product LCA.
Peanut production in the United States resulted in 3.96 billion pounds of product during the
2010 growing season, corresponding to a 7% increase in production from the previous year. Peanuts
produced in the U.S. are mostly used in food and confection products. Value-added peanut products
have been developed which have a number of applications including bakery, confectionery and the
general consumer market. Among these are: peanut butter, snack peanuts, peanut candy, roasted in-
shell, peanut oil/meal, and seed/residual as shown in Figure 1-1.
The largest area of consumption of peanuts in the U.S. is from peanut butter, which consumes
around 32% of the peanuts produced in the U.S. each year (Figure 1-1) (Pooley, 2005). As the
manufacture of peanut products expands, energy requirements along the process chain will increase.

6
Food production processes like those involved in the manufacture of peanuts represent one of the
largest industrial sectors in the world, resulting in significant amounts of energy use and greenhouse gas
(GHG) emissions. Though emissions and other production outputs have been shown to impact
environmental quality at multiple scales, quantifying the environmental impacts of specific
manufacturing processes can be difficult (Roy, et al., 2009).
The goal of this project was to quantify a variety of impacts from U.S. peanut butter using Life
Cycle Assessment. Specific objectives for the LCA included: 1) Reviewing existing literature related to the
sustainability of peanut products; 2) Defining the detailed data requirements for the project; 3)
Gathering and analyzing data from provided and available sources - including literature, economic
census, USDA, and peanut plant surveys; and 4) Computing the life cycle inventories and evaluating
environmental impact metrics using linked unit process models in SimaPro®. The overarching goal of
this work will be to equip peanut industry stakeholders with timely, science-based environmental
performance data to inform decision-making and drive innovative new products, process and services.
Figure 1-1. U.S. domestic use of peanuts (Pooley, 2005)
7
2 LCA Methodology
LCA is a tool to evaluate the environmental impacts of a product or process throughout the
entire life cycle. For agricultural products, LCA begins with production of fertilizers, then crop
cultivation, processing, use, and disposal of wastes associated with its end-use. This includes identifying
and quantifying energy and materials used, wastes released to the environment, calculating
environmental impact, interpreting results, and identifying improvement opportunities.
This LCA has been structured following ISO 14040:2006, and ISO 14044:2006 standards which
provide an internationally accepted method of conducting LCAs, while leaving significant degrees of
flexibility in methodology to customize individual projects to their desired application and outcomes.
Broadly, an LCA consists of four stages (Figure 2-1):
1) Define the goal and scope – including appropriate metrics (e.g. greenhouse gas
emissions, water consumption, hazardous materials generated, and/or quantity of
waste)
2) Conduct life cycle inventories (collection of data that identifies the system inputs and
outputs and discharges to the environment)
3) Perform impact assessment
4) Analyze and interpret the results
The goal and scope definition phase is a planning process that involves defining and describing
the product, process or activity, establishing the aims and context in which the LCA is to be performed,
and identifying the life cycle stages and environmental impact categories to be reviewed for the
assessment. The depth and breadth of LCA can differ considerably depending on the goal of the LCA.
The life cycle inventory (LCI) analysis is the second phase of the LCA. The LCI is an inventory of
input/output material and energy flows in the system of interest. The analysis involves identifying and
quantifying energy, water, materials and environmental releases (e.g. air emissions, solid wastes,
wastewater discharge) during each stage of the life cycle.
The life cycle impact assessment phase (LCIA) is the third phase of the LCA. This step quantifies
the human and ecological impacts of material consumption and environmental emissions identified
during the inventory analysis. Interdependencies often exist between impact categories, and poor
decisions can be made when only a single impact metric is used as the basis of the assessment. For this
study, eutrophication, acidification, ozone depletion, land use, and other impact categories were
analyzed using Impact 2002 and ReCiPe, two LCIA models integrated into SimaPro® 7.0, an ISO 1404x

8
compliant platform for performing LCA. Life cycle interpretation is the final phase of the LCA procedure,
in which the results are summarized and discussed. Its goal is to identify the most significant
environmental impacts and the associated life cycle stage, and highlight opportunities for potential
change or innovation.
2.1 Goal and Scope Definition
2.1.1 Goal
The primary goal of this study was to identify environmental impacts including greenhouse gas
(GHG) emissions associated with the production, consumption, and disposal of peanut butter in the
United States. The scope of this work does not include declarations to the consuming public.
2.1.2 Project Scope and System Boundaries
This life cycle assessment is a cradle-to-grave global impact assessment and carbon footprint
(global warming potential) analysis of U.S. peanut products. The data collected was primarily from the
year 2010. The system boundaries begin with peanut crop production, and end with the disposal of the
empty package/container by the consumer including recycling (where applicable), incineration, or
landfilling (Figure 2-2). Also included will be the full analyses of the upstream impacts of materials and
Figure 2-1. Stages of a life cycle assessment

9
energy consumed for each of these processes. Collection of detailed capital infrastructure data and the
corresponding GHG emissions are not included in this project.
2.1.3 Audience
For this life cycle assessment, the primary audience is food industry managers (farmers, peanut
processors, packaging companies, and retail) who may use the results to identify opportunities to
reduce GHG emissions and/or the consumption of natural resources. Consumers represent a second
potential audience for the study results. The LCA supports the peanut industry’s ability to work
proactively with retailers to educate consumers about agricultural and food sustainability issues.
2.1.4 Functional Unit
The functional unit of this study is defined as one pound of peanut butter as consumed by U.S.
consumers. For convenience, the analysis conducted in this study is for the 16oz peanut butter product
category and does not take into consideration processing and packaging material for additional product
sizes. Literature and survey data was used to define the components that make up a 16oz jar of peanut
butter. Using this data we created a national average 16oz peanut butter product that is an aggregate
representation of many different peanut butter brands (Table 2-1). All SimaPro® model inputs are for
the functional unit of 16oz, however, in the impact analysis we run the model for 1 kg of peanut butter.
Figure 2-2. Overview of peanut butter production process

10
This is accomplished in order to be able to compare the peanut butter life cycle with that of other
consumer packaged goods using a standard unit of comparison (1 kg).
2.1.5 Allocation
Where allocation of inputs is required, the allocation procedures follow the ISO 14044 allocation
hierarchy. There are three stages in the supply chain where allocation occurs: alternative products
produced during shelling, retail energy use, and a third stage for consumer travel and storage allocated
to peanut butter. We used an economic allocation model for the shelling processes, allocating a
percentage of the energy footprint based on the economic value of the functional unit produced as
compared to the other products. For retail and consumer use we followed the methods of the US Dairy
LCA study (Thoma, et al., 2012). Retail shelf space was allocated to determine the appropriate retail
energy demands. For consumer use, an allocation model was used that allocates a portion of families
grocery expenditures and grocery travel for the purchase of peanut butter.
Losses in the supply chain can be broken down into peanut byproducts and product losses.
Peanut byproducts account for the majority of loss and include gravel, dirt, and debris, peanut hulls, and
peanut skins. Losses attributed to byproducts do not have a significant economic value to warrant any
of the environmental burden of production. Product loss or waste in the supply chain include, poor
quality peanuts, processing and consumer waste. Total loss of mass in the supply chain for byproducts
Table 2-1. National Average 16oz Peanut Butter Product (The Peanut Institute, 2010)
mass (oz) mass (g)
16oz Peanut Butter
Peanuts 14.40 408.23
Sugar 1.17 33.17
Salt 0.20 5.67
Oil (Stabilizer) 0.24 6.80
Total 16.00 454.00
16oz Packaging
Lid/Seal1 0.39 11.1
Jar2 0.99 28.00
Label3 0.05 1.30
Total 1.43 40.40 1 Polypropylene lid with aluminum seal
2 PET Jar
3 Paper Label

11
and product loss combined are reported to represent an approximate 40% reduction of mass from
peanuts produced on farm to peanut paste consumed. This number is significantly lower at 19% if we
only include product loss. The majority of product loss in the supply chain occurs at the consumer level,
where we assumed that 20% of the peanut butter purchased is wasted (USDA-ERS, 2011). The burden
of product loss during manufacturing occurs between roasting and retail and was assumed to be a 3%
reduction of mass. Total losses (byproduct and product loss) used in the peanut butter model are
displayed in Table 2-2. These losses in the supply chain affect the reference flows of upstream
processes. In order to get the required flow of 14.4oz of peanut paste into the consumer use phase,
23.95oz of peanuts have to be produced on farm (Table 2-2).
2.1.6 Life Cycle Impact Assessment
For the our model analysis we used two impact assessment methodologies: ReCiPe midpoint
impact assessment and IPCC 2007 GWP. ReCiPe midpoint is a problem-oriented approach and uses
environmental themes such as climate change, terrestrial ecotoxicity, and ozone depletion to
communicate impacts (Heijungs, Goedkoop, Strujis, Effting, Sevenster, & Huppes, 2010) (Table 2-3).
Midpoint impact assessment uses equivalent values of reference chemicals such as CO2 equivalent or P
Table 2-2. Peanut supply chain product loss approximation
% Starting
Weight (oz)
Supply Chain Product Loss
Farm1 2% 23.95
Buying Points2 2% 23.48
Sheller3 22% 23.02
Blancher4 6% 18.87
Roaster5 2% 17.80
Processor6 2% 17.45
Retail7 1% 17.28
Consumer8 20% 14.40 1 (USDA, 2011)
2 Assumed loss due to peanut grading and debris
3 Survey reported loss including hulls, debris, and waste
4 Survey reported skin loss
5 Survey reported quality nut loss
6 Survey reported product loss
7 Assumed expiration and product damage loss
8 (Thoma, et al., 2010)

12
equivalent to measure impact. The IPCC 2007 GWP impact assessment methodology is a way of
reporting GHG emissions from peanut butter production on a kg CO2e basis. The main greenhouse gases
emitted by humans are: Carbon Dioxide, Methane, Nitrous Oxide, and Fluorinated Gases (EPA, 2012).
2.1.7 Cut-Off Criteria
In determining whether to include specific inputs, a one percent cut off threshold for the impact
analysis of any input was adopted; however, small flows were not omitted when data was readily
available. The one percent cutoff threshold was applied when running the impact analysis model. This
means that process flows contributing to less than one percent of the total impact for a specific impact
category were excluded from analysis. Emissions resulting from capital goods were also excluded from
the analysis.
2.2 Life Cycle Inventories
The Life Cycle Inventory stage of an LCA requires gathering input and output data for each
element of the system and for each process and product option. The major system elements are the
peanut butter industry sectors: farm, buying point, sheller, blancher, roaster, processor, distributor,
retail, and consumer. Each system is composed of smaller unit processes which correspond to their
primary inputs and outputs.
Literature was the informational foundation for the construction of the peanut butter life cycle
model. In addition to literature, multiple peanut industry experts were consulted throughout the study.
Data was required for each input and output and was sourced from survey results, scientific and
industry literature, expert opinion, existing manufacturers’ LCAs, other industry provided data sets, and
Table 2-3. Midpoint Categories in the ReCiPe impact assessment methodology (Thoma, et al., 2010)
Midpoint Categories Unit of measure Midpoint Category Unit of measure climate change kg CO2 eq freshwater ecotoxicity kg 1,4-DB eq ozone depletion kg CFC-11 eq
1 marine ecotoxicity kg 1,4-DB eq
terrestrial acidification kg SO2 eq ionizing radiation kg U235 eq freshwater eutrophication kg P eq agricultural land occupation m
2a (occupation of 1 yr)
marine eutrophication kg N eq urban land occupation m2a (occupation of 1 yr)
human toxicity kg 1,4-DB eq2 natural land transformation m
2
photochemical oxidant formation kg NMVOC3 water depletion m
3
particulate matter formation kg PM10 eq4 mineral resource depletion kg Fe eq
terrestrial ecotoxicity kg 1,4-DB eq fossil fuel depletion kg oil eq 1 chlorofluorocarbon-11 equivalent 2 1,4-dichlorobenzene 3 Non-Methane Volatile Organic Compounds 4 Particulate matter smaller than 10 micrometers
13
U.S. based unit processes from the U.S. Life Cycle Inventory housed at the National Renewable Energy
Laboratory (NREL, 2012). Unit processes were constructed within SimaPro® and linked to EcoInvent
upstream processes, which created a picture of the footprint for the entire system. Information and
data from two previous GHG emissions studies were also used for several processes within the peanut
butter model (Thoma, et al., 2012) (Thoma, et al., 2010).
2.2.1 Uncertainty
Monte Carlo simulation was used to quantify and characterize uncertainty from ranges of input
data. This process was rules-based and incorporated probability distributions for variable data that
reflected the knowledge and process uncertainty associated with the variable. Monte Carlo analysis is
indispensable for establishing defensible metrics for evaluation, providing a quantified measure of what
is known and what is unknown, as well as the inherent variability of a process.
2.2.2 Software, Database and Model Validation
SimaPro® software system for life cycle analysis, developed by Netherlands based Pre
Consulting, was used to create the framework for this LCA model. Background processes used to
develop the entire reference flow for a major process, such as injection molding for PET jars, are from
the EcoInvent and U.S. Life Cycle Inventory databases. All data, formulas, and assumptions within the
model have been reviewed by the author and at least one additional team member.
2.2.3 Emission Factors
2.2.3.1 Electricity
The scale of this analysis and the limited location information that was provided required that
we use a national average for electricity production. However, there are three electricity production
regions in the U.S.: Eastern Interconnection, Western Interconnection, and the Electric Reliability
Council of Texas (ERCOT) Interconnection (Deru & Torcellini, 2007). The use of the three main
interconnections as the basis for calculating environmental burdens from electricity production are
better than national, state, or even utility-level emission factors because there is virtually no electricity
energy transfer between the interconnect grids, so at this level there is some certainty about the actual
fuel mix used to provide electricity. However, due to the low resolution of data and the need for
confidentiality of sources, the national average mix of primary fuels was used to characterize power
plant emissions for all processes within this LCA.
14
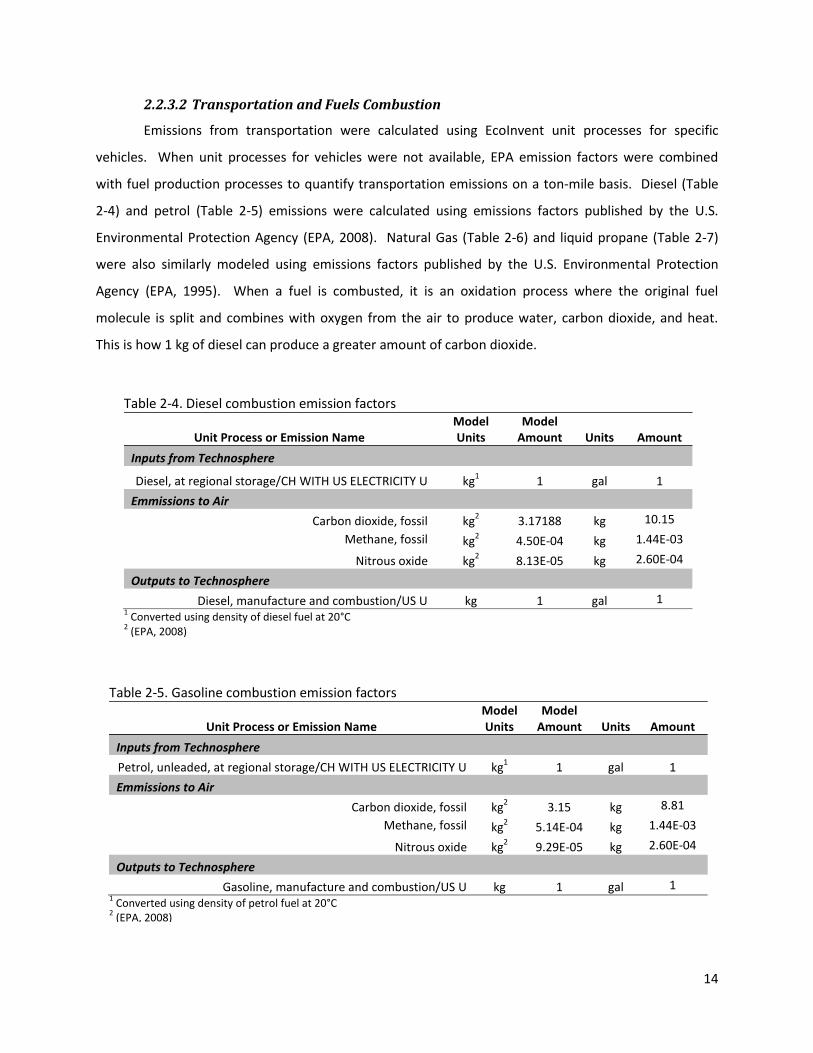
2.2.3.2 Transportation and Fuels Combustion
Emissions from transportation were calculated using EcoInvent unit processes for specific
vehicles. When unit processes for vehicles were not available, EPA emission factors were combined
with fuel production processes to quantify transportation emissions on a ton-mile basis. Diesel (Table
2-4) and petrol (Table 2-5) emissions were calculated using emissions factors published by the U.S.
Environmental Protection Agency (EPA, 2008). Natural Gas (Table 2-6) and liquid propane (Table 2-7)
were also similarly modeled using emissions factors published by the U.S. Environmental Protection
Agency (EPA, 1995). When a fuel is combusted, it is an oxidation process where the original fuel
molecule is split and combines with oxygen from the air to produce water, carbon dioxide, and heat.
This is how 1 kg of diesel can produce a greater amount of carbon dioxide.
Table 2-4. Diesel combustion emission factors
Unit Process or Emission Name Model Units
Model Amount Units Amount
Inputs from Technosphere
Diesel, at regional storage/CH WITH US ELECTRICITY U kg1 1 gal 1
Emmissions to Air
Carbon dioxide, fossil kg2 3.17188 kg 10.15
Methane, fossil kg2 4.50E-04 kg 1.44E-03
Nitrous oxide kg2 8.13E-05 kg 2.60E-04
Outputs to Technosphere
Diesel, manufacture and combustion/US U kg 1 gal 1 1 Converted using density of diesel fuel at 20°C
2 (EPA, 2008)
Table 2-5. Gasoline combustion emission factors
Unit Process or Emission Name Model Units
Model Amount Units Amount
Inputs from Technosphere
Petrol, unleaded, at regional storage/CH WITH US ELECTRICITY U kg1 1 gal 1
Emmissions to Air
Carbon dioxide, fossil kg2 3.15 kg 8.81
Methane, fossil kg2 5.14E-04 kg 1.44E-03
Nitrous oxide kg2 9.29E-05 kg 2.60E-04
Outputs to Technosphere
Gasoline, manufacture and combustion/US U kg 1 gal 1 1 Converted using density of petrol fuel at 20°C
2 (EPA, 2008)

15
2.2.4 Industry Sector Model Development
2.2.4.1 Farm
Input data for each peanut production practice was obtained from enterprise budgets prepared
by the University of Georgia Extension Agricultural and Applied Economics Department for the different
cultivation scenarios (UGA, 2011). The enterprise budgets provided information on the recommended
chemical, fuel, and other input amounts for one acre of cultivated land, along with the anticipated
yields. For this LCA, we analyzed the farm footprint based on an aggregate farm that is a weighted
average of each production practices inputs and outputs (Table 2-8). An industry estimate was provided
by the Agricultural Research Service of the USDA that roughly 80% of peanut farmers use conventional
tillage practices while 20% use strip tillage. Further, a U.S. peanut crop irrigation percentage of 35% was
also given (Lamb, 2012). The inputs and yields described in the Georgia crop budgets for all practices
Table 2-6. Natural Gas combustion emission factors
Unit Process or Emission Name Model Units
Model Amount Units Amount
Inputs from Technosphere
Natural gas, at evaporation plant/JP WITH US ELECTRICITY U kg1 1 m
3 1
Emmissions to Air
Carbon dioxide, fossil kg2 2.23 kg 1.92
Methane, fossil kg2 4.27E-05 kg 3.68E-05
Nitrous oxide kg2 4.09E-05 kg 3.52E-05
Outputs to Technosphere Natural Gas, manufacture and combustion/US U kg 1 m
3 1
1 Converted using density of Natural Gas at standard temperature and pressure
2 (EPA, 1995)
Table 2-7. Liquid Propane combustion emission factors
Unit Process or Emission Name Model Units
Model Amount Units Amount
Inputs from Technosphere
Propane/ butane, at refinery/RER WITH US ELECTRICITY U kg1 1 m
3 1
Emmissions to Air
Carbon dioxide, fossil kg2 2.94 kg 1713.52
Methane, fossil kg2 4.12E-05 kg 2.40E-02
Nitrous oxide kg2 1.85E-04 kg 1.08E-01
Outputs to Technosphere Propane, liquid, manufacture and combustion/US U kg 1 m
3 1
1 Converted using density of Liquid Propane at standard temperature and pressure
2 (EPA, 1995)
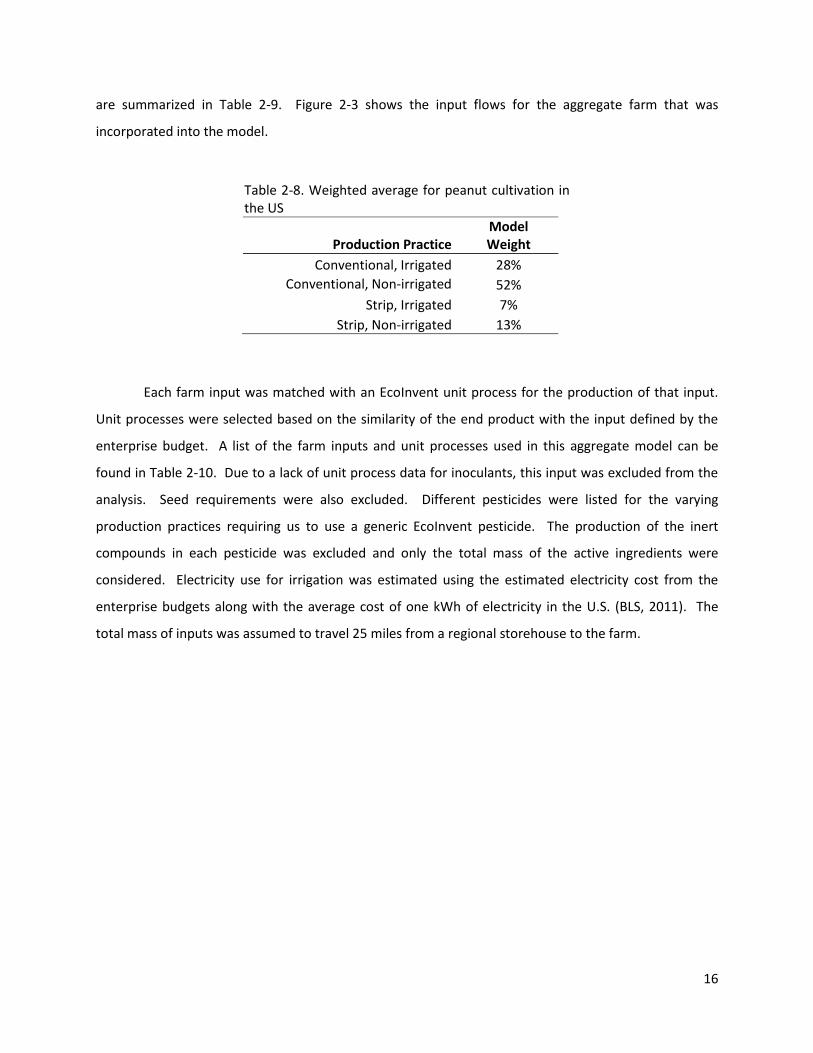
16
are summarized in Table 2-9. Figure 2-3 shows the input flows for the aggregate farm that was
incorporated into the model.
Each farm input was matched with an EcoInvent unit process for the production of that input.
Unit processes were selected based on the similarity of the end product with the input defined by the
enterprise budget. A list of the farm inputs and unit processes used in this aggregate model can be
found in Table 2-10. Due to a lack of unit process data for inoculants, this input was excluded from the
analysis. Seed requirements were also excluded. Different pesticides were listed for the varying
production practices requiring us to use a generic EcoInvent pesticide. The production of the inert
compounds in each pesticide was excluded and only the total mass of the active ingredients were
considered. Electricity use for irrigation was estimated using the estimated electricity cost from the
enterprise budgets along with the average cost of one kWh of electricity in the U.S. (BLS, 2011). The
total mass of inputs was assumed to travel 25 miles from a regional storehouse to the farm.
Table 2-8. Weighted average for peanut cultivation in the US
Production Practice Model Weight
Conventional, Irrigated 28%
Conventional, Non-irrigated 52%
Strip, Irrigated 7%
Strip, Non-irrigated 13%

17
Table 2-9. Summary of Georgia peanut enterprise budget inputs and outputs by production scenario for one acre of cultivated land (UGA, 2011)
Units
Conventional Strip Till
Non-Irrigated
Irrigated Non-
Irrigated Irrigated
Input
Seed lb 130 130 130 130
Inoculant lb 5 5 5 5
Cover Crop Seed bu - - 1.5 1.5
Fertilizer lb 0.5 0.5 0.5 0.5
Herbicide lb 4 1.1 5 2.7
Insecticide lb 14.2 14.2 14.2 14.2
Fungicide lb 7.2 5.7 7.2 5.7
Irrigation Electricity kWh - 265.2 - 212.1
Preharvest Fuel Use gal 9.2 9.2 5.2 5.2
Harvest Fuel Use gal 12 12 12 12
Output
Peanuts ton 1.4 2 1.4 2
Table 2-10. Farm model input and output processes for nation average aggregate farm peanut production
Units Amount Model Units
Model Amount SimaPro® Process Name
Input
Rye seed Bushel 0.3 g 2.18 Rye seed IP, at regional storehouse
Boron lb 0.5 g 0.07 Borax, anhydrous, powder, at plant Lime/Gypsum lb 1000 g 130.05 Lime, from carbonation, at regional
storehouse Pesticide lb 24.1 g 3.13 Pesticide, unspecified, at regional
storehouse
Preharvest Fuel Use gallon 8.4 g 7.58 Preharvest machinery fuel usage
Harvest Fuel Use gallon 12 g 10.84 Harvest machinery fuel usage
Electricity kWh 89.1 Wh 25.55 Electricity, low voltage, at grid
Output Farm Grade Peanuts ton 1.60 kg 0.41 Peanuts, at farm, conventional till,
non-irrigated/US U

18
2.2.4.2 Buying Points
Data for the Buying Points section of the model was derived mainly from returned survey data
for the year 2010. Survey questions centered mainly on fuel use, electricity use, and tons of peanuts
handled. The Buying Points model uses the national average Farm Grade Peanuts whose inputs were
incorporated from University of Georgia Agricultural Extension Services peanut crop budgets (UGA,
2011). Thirty eight buying point surveys were returned and all data was aggregated on a per ton basis.
All of the inputs to the buying point can be seen in Table 2-11. A flow chart diagraming the buying point
processes are shown in Figure 2-4.
Figure 2-3. Process flow of national weighted average cultivation processes

19
Diesel use was calculated by using the reported tonnage handled, the total distance traveled
round trip from the farm to the buying points, and the percentage of semis versus wagons used. The
percentage of semis and wagons was used to determine the average single trip total load capacity for a
particular Buying Point. The reported tonnage handled was then used to determine the number of trips
Table 2-11. Buying Point model input and output processes
Units Amount Model Units
Model Amount SimaPro® Process Name
Input Farm Grade Peanuts
a ton 1.03 kg 0.42 Peanuts, at farm, conventional
till, non-irrigated/US U Electricity
b KWh/ton 15.04 Wh 6.77 Electricity, low voltage, at grid,
US NREL/US Diesel gal/ton 0.44 g 0.65 Diesel, manufacture and
combustion/US U Natural Gas ft
3/ton 76.03 g 0.86 Natural Gas, manufacture and
combustion/US U Liquid Propane gal/ton 1.49 g 1.52 Propane, liquid, manufacture
and combustion/US U
Output
Sheller Grade Peanuts tons 1.0 kg 0.4 Peanuts, at Buying Points/US U a Farm Grade Peanut analysis was developed using University of Georgia peanut crop budgets, conventional
till/non-irrigated b Electricity use was calculated by summing the provided data for screening, cleaning, elevating, drying, and
building operations electricity on a per ton basis
Figure 2-4. Buying Point input/output flow diagram
20
necessary to transport the peanuts to the Buying Point. Trip distance from the Farm to the Buying Point
was then multiplied by the number of trips required and then converted to total amount of diesel used
by a applying a Semi and Wagon fuel efficiency estimate based on the percentage of Semis versus
Wagons. Reported yard diesel was combined with the transportation diesel.
Natural Gas and Liquid Propane use for drying peanuts was initially to be estimated using survey
data that requested the amounts of Natural Gas and Liquid Propane used on site. However, survey
response concerning these two factors was extremely low. We then developed a Natural Gas and Liquid
propane estimate from the ratio of Semis to Wagons, the total amount of peanuts dried, and a report
produced by the National Peanut Research Laboratory (NPRL) (Butts, 2010) indicating Natural Gas and
Liquid Propane consumption rates per ton of peanuts dried, assuming a standard initial moisture
content (IMC) of 17% and a cutoff moisture content of 10-11%.
Buying Point electricity use was developed by summing the estimated electricity consumption of
screening, cleaning, elevating, drying, and operations. Screening, cleaning, and elevation electricity use
was estimated using information provided by Larry Cunningham on standard motor sizes and specific
processing rates on a per ton basis (Cunningham, 2011). Drying Fan electricity on a per ton basis was
estimated based on research published in the Peanut Science journal (Blankenship & Chew, 1979).
Using a standard IMC of 17%, the following equation was used to determine the electricity requirements
on a per ton basis for drying fans where TEU is the Total Electricity Used in kWh per ton of peanuts
dried:
(Eq. 1)
Buying Point operations electricity was estimated from data from two specific buying points provided by
Larry Cunningham.
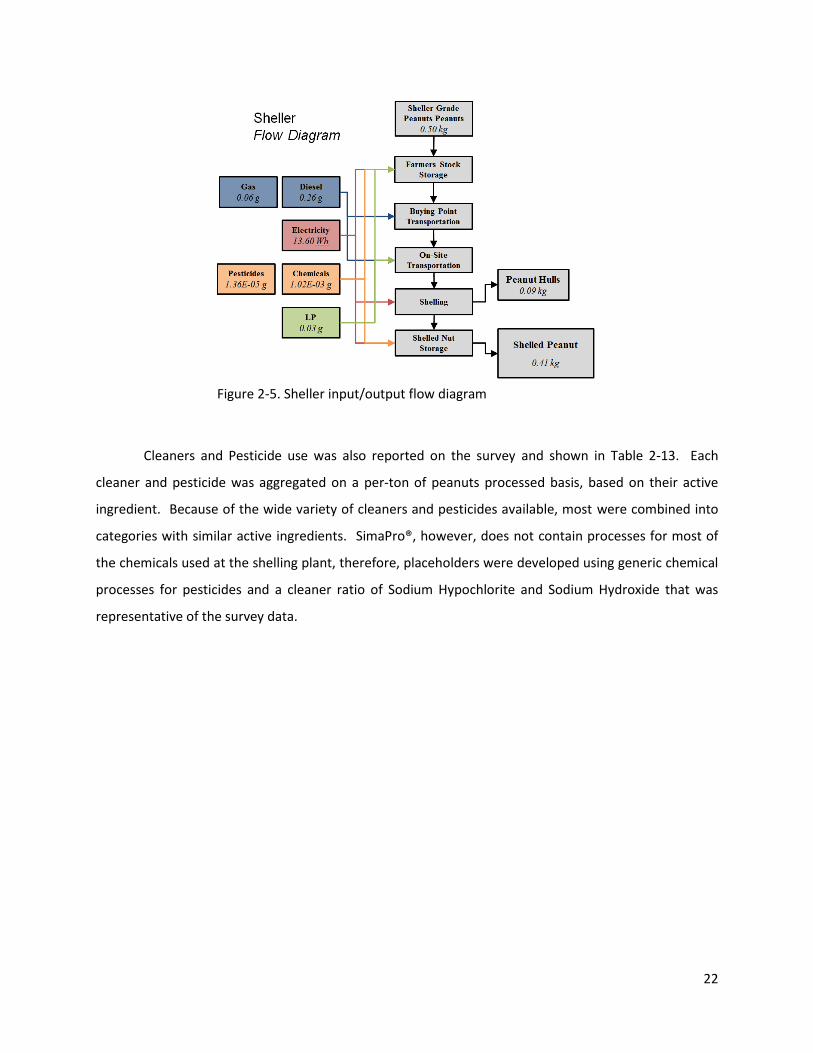
2.2.4.3 Sheller
Sheller model inputs were taken from returned survey data for the year 2010. Survey questions
were used to understand the basic inputs to the shelling process: Whole Peanuts, Electricity, Diesel,
Petrol, Liquid Propane, Polypropylene, Cleaners, and Pesticides. Sheller Grade Peanuts are peanuts that
have met grade at the Buying Points and are purchased by the Sheller. Five sheller surveys were
returned and all data was aggregated on a per ton basis. All of the inputs to the sheller can be seen in
Table 2-12. A flow chart diagraming the shelling processes is shown in Figure 2-5. Diesel and petrol

21
consumption by the sheller were calculated from the surveys using the combination of fuel used on-site
at the farmers stock storage, fuel used to transport the sheller grade peanuts from the farmer stock
storage to the shelling plant, fuel used to transport shelled peanuts to the shelled stock storage, and fuel
used to transport rejected peanuts back from the blancher.
Liquid Propane consumption from the survey was from forklift use at the shelling plant. The
total amount of Liquid Propane was reported for each plant and aggregated on a per ton of peanuts
processed basis. Electricity was a combination of reported electric forklift hours, shelling operations
electricity, and cold storage electricity. For facilities with operations other than shelling peanuts, an
allocation was assigned based on the reported percentage of energy used at the plant specifically for the
shelling of peanuts.
Table 2-12. Sheller model input and output processes
Units Amount Model Units
Model Amount SimaPro® Process Name
Input Sheller Grade
Peanuts1
ton 1.21 kg 0.50 Peants, at Buying Points/US U
Electricity KWh/ton 97.80 Wh 13.60 Electricity, low voltage, at grid, US NREL/US
Diesel gal/ton 0.58 g 0.26 Diesel, manufacture and combustion/US U
Gasoline gal/ton 0.16 g 0.06 Gasoline, manufacture and combustion/US U
Liquid Propane gal/ton 0.11 g 0.03 Propane, liquid, manufacture and combustion/US U
Cleaners2 kg/ton 7.36E-03 g 1.02E-03 Cleaners, combined value, at regional
storage/US U Pesticides
2 kg/ton 1.93E-02 g 2.68E-03 Pesticides, combined value, at regional
storage/US U
Output
Shelled Peanut ton 1.00 kg 0.41 Peanuts, shelled, at sheller/US U 1 Shelling Grade Peanut analysis was developed using survey data from the U.S. Peanut Shelling Industry
2 All pesticides, insecticides, and cleaners used were condensed into a single value and represented in the model using the
surrogates "Pesticides" and "Cleaners". Mass conversion assumes the density of water.
22
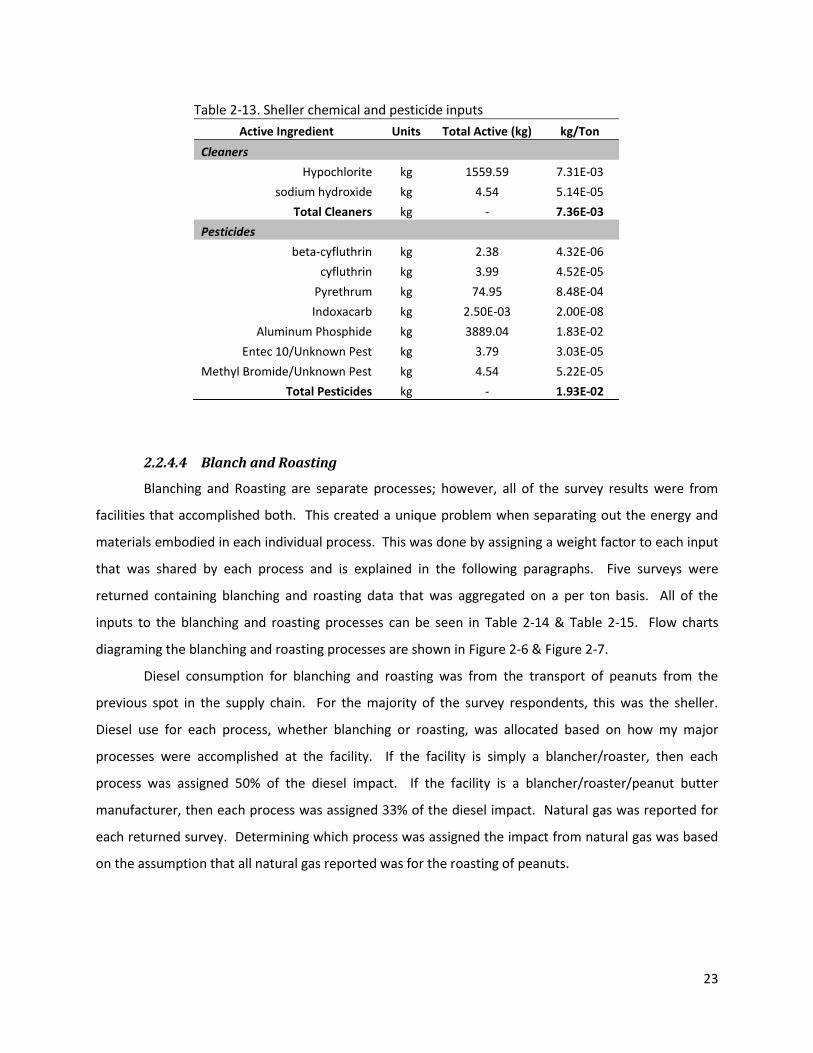
Cleaners and Pesticide use was also reported on the survey and shown in Table 2-13. Each
cleaner and pesticide was aggregated on a per-ton of peanuts processed basis, based on their active
ingredient. Because of the wide variety of cleaners and pesticides available, most were combined into
categories with similar active ingredients. SimaPro®, however, does not contain processes for most of
the chemicals used at the shelling plant, therefore, placeholders were developed using generic chemical
processes for pesticides and a cleaner ratio of Sodium Hypochlorite and Sodium Hydroxide that was
representative of the survey data.
Figure 2-5. Sheller input/output flow diagram
23
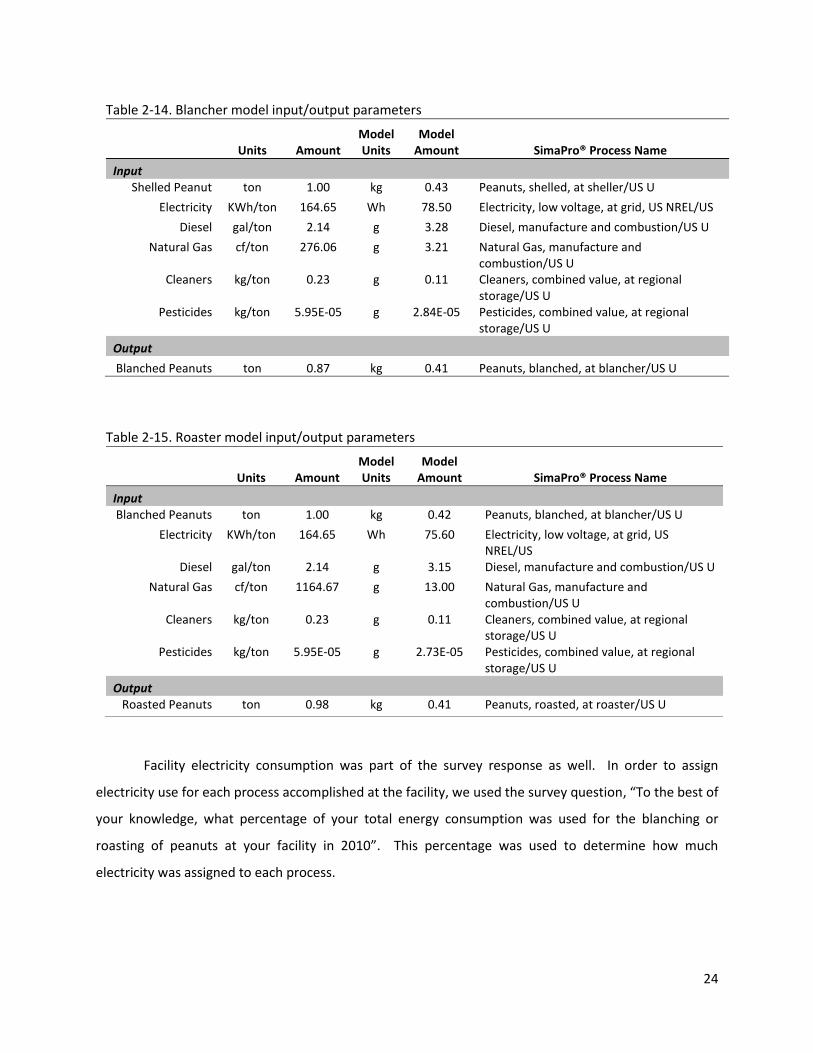
2.2.4.4 Blanch and Roasting
Blanching and Roasting are separate processes; however, all of the survey results were from
facilities that accomplished both. This created a unique problem when separating out the energy and
materials embodied in each individual process. This was done by assigning a weight factor to each input
that was shared by each process and is explained in the following paragraphs. Five surveys were
returned containing blanching and roasting data that was aggregated on a per ton basis. All of the
inputs to the blanching and roasting processes can be seen in Table 2-14 & Table 2-15. Flow charts
diagraming the blanching and roasting processes are shown in Figure 2-6 & Figure 2-7.
Diesel consumption for blanching and roasting was from the transport of peanuts from the
previous spot in the supply chain. For the majority of the survey respondents, this was the sheller.
Diesel use for each process, whether blanching or roasting, was allocated based on how my major
processes were accomplished at the facility. If the facility is simply a blancher/roaster, then each
process was assigned 50% of the diesel impact. If the facility is a blancher/roaster/peanut butter
manufacturer, then each process was assigned 33% of the diesel impact. Natural gas was reported for
each returned survey. Determining which process was assigned the impact from natural gas was based
on the assumption that all natural gas reported was for the roasting of peanuts.
Table 2-13. Sheller chemical and pesticide inputs
Active Ingredient Units Total Active (kg) kg/Ton
Cleaners
Hypochlorite kg 1559.59 7.31E-03
sodium hydroxide kg 4.54 5.14E-05
Total Cleaners kg - 7.36E-03
Pesticides
beta-cyfluthrin kg 2.38 4.32E-06
cyfluthrin kg 3.99 4.52E-05
Pyrethrum kg 74.95 8.48E-04
Indoxacarb kg 2.50E-03 2.00E-08
Aluminum Phosphide kg 3889.04 1.83E-02
Entec 10/Unknown Pest kg 3.79 3.03E-05
Methyl Bromide/Unknown Pest kg 4.54 5.22E-05
Total Pesticides kg - 1.93E-02
24
Facility electricity consumption was part of the survey response as well. In order to assign
electricity use for each process accomplished at the facility, we used the survey question, “To the best of
your knowledge, what percentage of your total energy consumption was used for the blanching or
roasting of peanuts at your facility in 2010”. This percentage was used to determine how much
electricity was assigned to each process.
Table 2-14. Blancher model input/output parameters
Units Amount Model Units
Model Amount SimaPro® Process Name
Input Shelled Peanut ton 1.00 kg 0.43 Peanuts, shelled, at sheller/US U
Electricity KWh/ton 164.65 Wh 78.50 Electricity, low voltage, at grid, US NREL/US
Diesel gal/ton 2.14 g 3.28 Diesel, manufacture and combustion/US U
Natural Gas cf/ton 276.06 g 3.21 Natural Gas, manufacture and combustion/US U
Cleaners kg/ton 0.23 g 0.11 Cleaners, combined value, at regional storage/US U
Pesticides kg/ton 5.95E-05 g 2.84E-05 Pesticides, combined value, at regional storage/US U
Output
Blanched Peanuts ton 0.87 kg 0.41 Peanuts, blanched, at blancher/US U
Table 2-15. Roaster model input/output parameters
Units Amount Model Units
Model Amount SimaPro® Process Name
Input Blanched Peanuts ton 1.00 kg 0.42 Peanuts, blanched, at blancher/US U
Electricity KWh/ton 164.65 Wh 75.60 Electricity, low voltage, at grid, US NREL/US
Diesel gal/ton 2.14 g 3.15 Diesel, manufacture and combustion/US U
Natural Gas cf/ton 1164.67 g 13.00 Natural Gas, manufacture and combustion/US U
Cleaners kg/ton 0.23 g 0.11 Cleaners, combined value, at regional storage/US U
Pesticides kg/ton 5.95E-05 g 2.73E-05 Pesticides, combined value, at regional storage/US U
Output
Roasted Peanuts ton 0.98 kg 0.41 Peanuts, roasted, at roaster/US U

25
Cleaners and Pesticide use reported on the survey are shown in Appendix A, Table A-3 and Table
A-4. Cleaners and pesticides were aggregated, combined by active ingredient, and replaced by
SimaPro® placeholders in a manner similar to the one used for the sheller.
2.2.4.5 Processing & Packaging Materials
Peanut butter processing and packaging for the purpose of this report will be considered a single
unit process, however, all surveys returned were for facilities where peanut butter processing was
accomplished alongside other processes, such as roasting and blanching. Similar to the blanching and
roasting section, we used a weighting factor where applicable in order to assign specific impacts to
individual processes. In order to input all of the processes into the SimaPro® model, we first broke
Figure 2-6. Blancher input/output flow diagram
Figure 2-7. Roaster input/output flow diagram
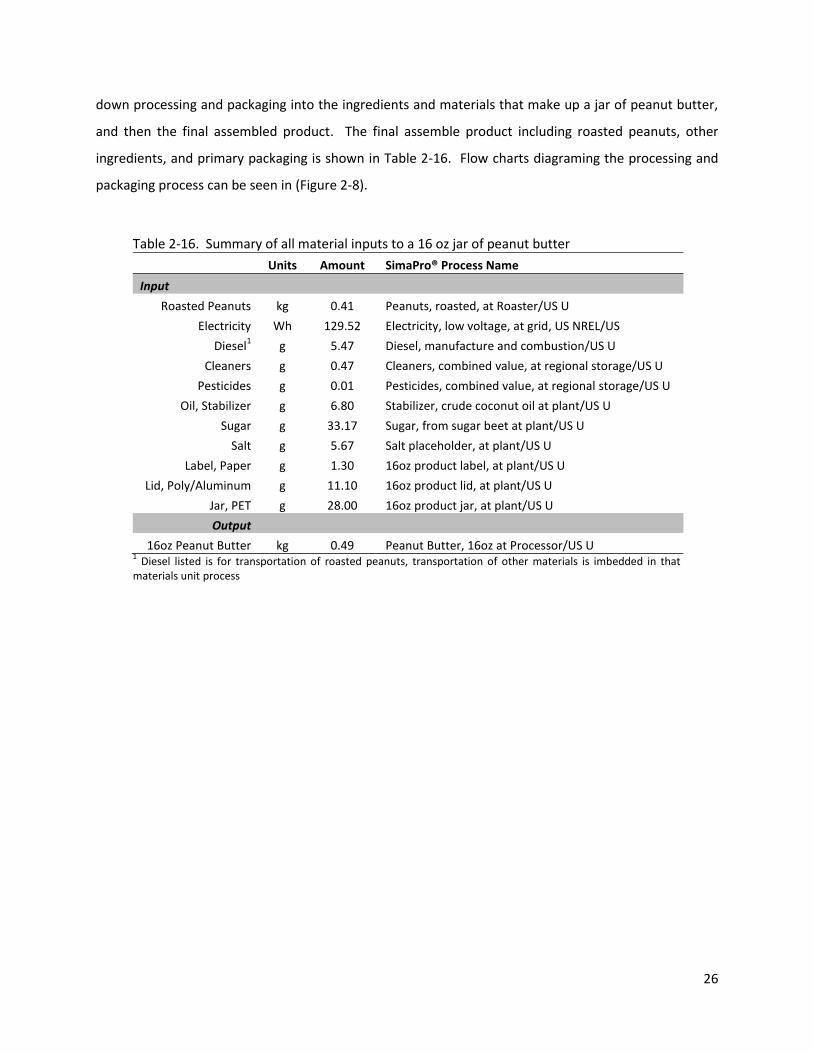
26
down processing and packaging into the ingredients and materials that make up a jar of peanut butter,
and then the final assembled product. The final assemble product including roasted peanuts, other
ingredients, and primary packaging is shown in Table 2-16. Flow charts diagraming the processing and
packaging process can be seen in (Figure 2-8).
Table 2-16. Summary of all material inputs to a 16 oz jar of peanut butter
Units Amount SimaPro® Process Name
Input
Roasted Peanuts kg 0.41 Peanuts, roasted, at Roaster/US U
Electricity Wh 129.52 Electricity, low voltage, at grid, US NREL/US
Diesel1 g 5.47 Diesel, manufacture and combustion/US U
Cleaners g 0.47 Cleaners, combined value, at regional storage/US U
Pesticides g 0.01 Pesticides, combined value, at regional storage/US U
Oil, Stabilizer g 6.80 Stabilizer, crude coconut oil at plant/US U
Sugar g 33.17 Sugar, from sugar beet at plant/US U
Salt g 5.67 Salt placeholder, at plant/US U
Label, Paper g 1.30 16oz product label, at plant/US U
Lid, Poly/Aluminum g 11.10 16oz product lid, at plant/US U
Jar, PET g 28.00 16oz product jar, at plant/US U
Output
16oz Peanut Butter kg 0.49 Peanut Butter, 16oz at Processor/US U 1 Diesel listed is for transportation of roasted peanuts, transportation of other materials is imbedded in that
materials unit process

27
Reported diesel use was for the transportation of roasted peanuts to the peanut butter
processor. Transportation diesel requirements for all other materials that make up a 16 oz jar of peanut
butter are inherent in that particular material’s unit process. The diesel amounts needed to move these
items are shown in Table 2-17.
Figure 2-8. Processing and packaging input/output flow diagram
Table 2-17. Transportation diesel totals for materials that make up a 16 oz peanut butter product on a per ton basis.
Product Assembly Amount
(ton)
Transport Diesel
(kg/ton)
Stabilizer Oil 1 26.69
Sugar 1 14.34
Salt 1 26.14
Jar 1 18.98
Label 1 60.96
Lid 1 26.98
Secondary Packaging 1 15.01

28
Cleaners and pesticide use in the processing phase did not have high reporting levels. It is
assumed in this report that similar types and amounts on a per ton basis of cleaners and pesticides were
used in the processing phase as were used at the roaster.
The additional peanut butter ingredients (oil, sugar, and salt) are represented as individual unit
processes. Each of these ingredients has a specific transportation diesel demand as well as
manufacturing flows within the SimaPro® Model. Table A-5 in Appendix A shows all of the individual
inputs for each ingredient.
Packaging includes primary (PET Jar, Polypropylene Lid, and Paper Label), secondary (cardboard
tray), and tertiary (palletized) packaging types. The types and associated mass of each material that
makes up the primary packaging can be seen in Table 2-1. Packaging was modeled using LCI data
collected from the American Peanut Council sustainability survey as well as similar packaging types used
in the Cheese LCA (Thoma, et al., 2012). Input flows and unit processes for each packaging type can be
seen in Appendix A, Table A-6.
2.2.4.6 Retail
After distribution from the processor to the retail gate, peanut butter is displayed on store
shelving for purchase by the consumer. During this phase, the two distinct emissions streams are
overhead electricity and overhead fuel. The Cheese LCA study was used to make estimates of the sales
volume, space occupancy, and energy demands of peanut butter. Cheese LCA electricity demand such
as ventilation, lighting, cooling, space heating, water heating, and other miscellaneous electrical loads
were applied to estimate overhead electricity demand for peanut butter at retail. For our purposes, we
assumed a similar shelf space allocation and final energy footprint for peanut butter while subtracting
the appropriate amount of energy that is used for the refrigeration of cheese and dairy products.
Peanut butter products were assumed to travel the same distance from the distributor as in the Cheese
LCA as well as use a similar amount of natural gas, according to shelf space (Thoma, et al., 2012). Table
2-18 contains the data that was used to populate the retail portion of the SimaPro® model. The retail
flow diagram can be seen in Figure 2-9.

29
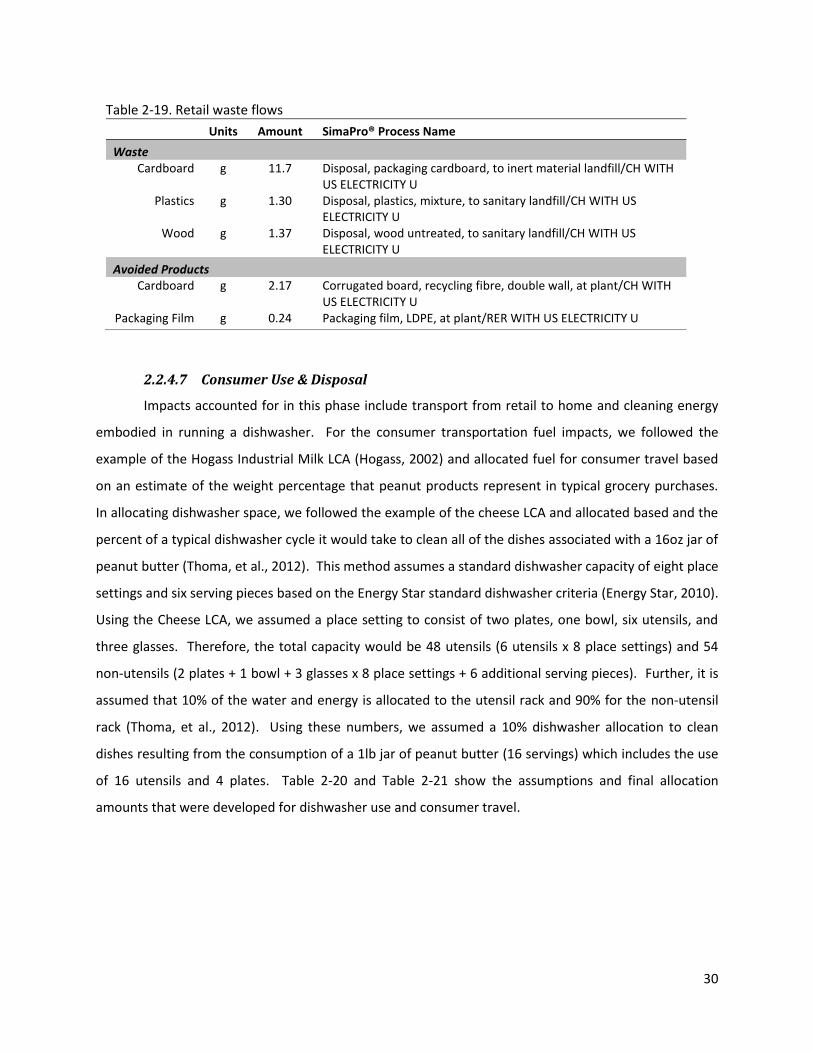
Waste flows from the retail sector are from secondary and tertiary packaging and consist of
cardboard, plastics, and wood (Table 2-19). We assumed a plastic and cardboard recycling rate of 29%,
which is in accordance with the national average (EPA, 2009). Waste from broken pallets was assumed
to be 10%, or a 90% reuse rate, which is in accordance with reuse rates seen in other peanut industry
sectors. Reuse and recycling flows are modeled in SimaPro® as “avoided products” which allows the
model to reduce the total impact from these items.
Figure 2-9. Retail input/output flow diagram
Table 2-18. Retail model input/output parameters
Units Amount SimaPro® Process Name
Input
16oz Peanut Butter g 0.49 Peanut Butter, 16oz at Processor/US U
Distribution1 g 500 Distribution, from processor/US U
Natural Gas2 g 0.45 Natural Gas, manufacture and combustion/US U
Electricity3 Wh 37.6 Electricity, low voltage, at grid, US NREL/US
Output
Peanut Butter at Retail kg 0.494 Peanut Butter, 16oz at retail/US U 1 Value is equal to the transport allocation that was used in the Cheese LCA
2 Value is density converted from Cheese LCA
3 Value is equal to the retail electricity demand from the Cheese LCA minus 45% refrigeration energy (Thoma,
et al., 2012)
30
2.2.4.7 Consumer Use & Disposal
Impacts accounted for in this phase include transport from retail to home and cleaning energy
embodied in running a dishwasher. For the consumer transportation fuel impacts, we followed the
example of the Hogass Industrial Milk LCA (Hogass, 2002) and allocated fuel for consumer travel based
on an estimate of the weight percentage that peanut products represent in typical grocery purchases.
In allocating dishwasher space, we followed the example of the cheese LCA and allocated based and the
percent of a typical dishwasher cycle it would take to clean all of the dishes associated with a 16oz jar of
peanut butter (Thoma, et al., 2012). This method assumes a standard dishwasher capacity of eight place
settings and six serving pieces based on the Energy Star standard dishwasher criteria (Energy Star, 2010).
Using the Cheese LCA, we assumed a place setting to consist of two plates, one bowl, six utensils, and
three glasses. Therefore, the total capacity would be 48 utensils (6 utensils x 8 place settings) and 54
non-utensils (2 plates + 1 bowl + 3 glasses x 8 place settings + 6 additional serving pieces). Further, it is
assumed that 10% of the water and energy is allocated to the utensil rack and 90% for the non-utensil
rack (Thoma, et al., 2012). Using these numbers, we assumed a 10% dishwasher allocation to clean
dishes resulting from the consumption of a 1lb jar of peanut butter (16 servings) which includes the use
of 16 utensils and 4 plates. Table 2-20 and Table 2-21 show the assumptions and final allocation
amounts that were developed for dishwasher use and consumer travel.
Table 2-19. Retail waste flows
Units Amount SimaPro® Process Name
Waste Cardboard g 11.7 Disposal, packaging cardboard, to inert material landfill/CH WITH
US ELECTRICITY U Plastics g 1.30 Disposal, plastics, mixture, to sanitary landfill/CH WITH US
ELECTRICITY U Wood g 1.37 Disposal, wood untreated, to sanitary landfill/CH WITH US
ELECTRICITY U
Avoided Products Cardboard g 2.17 Corrugated board, recycling fibre, double wall, at plant/CH WITH
US ELECTRICITY U Packaging Film g 0.24 Packaging film, LDPE, at plant/RER WITH US ELECTRICITY U
31
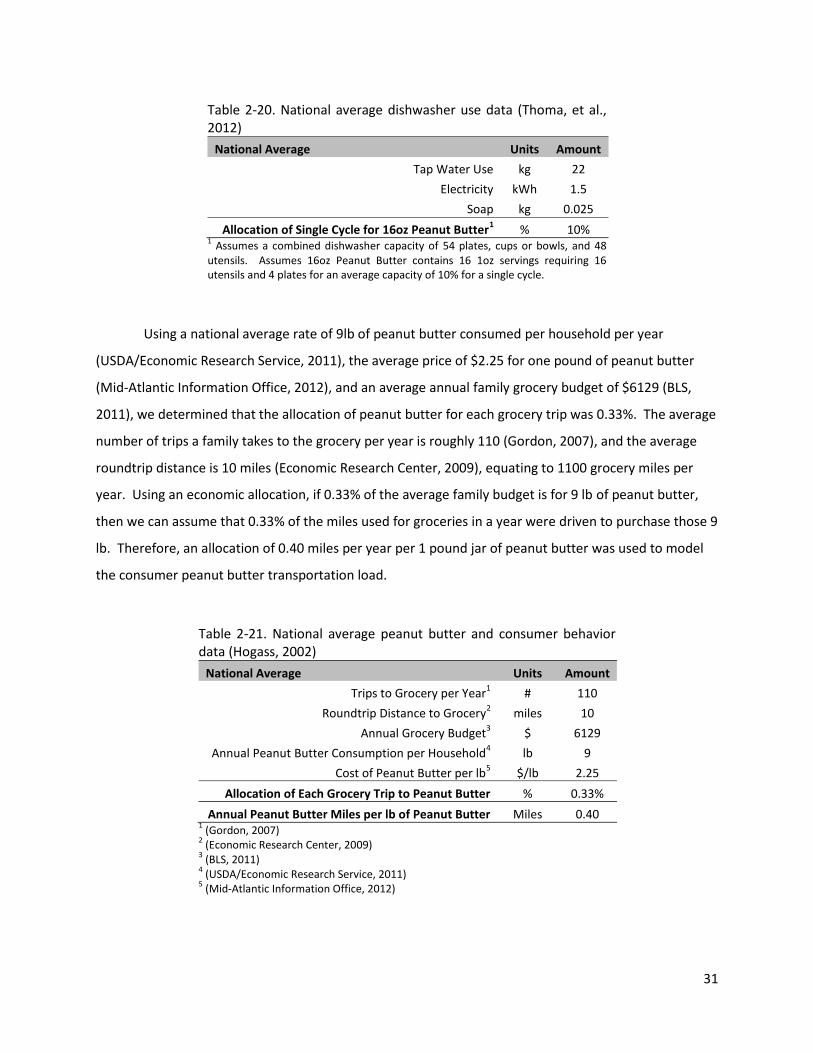
Using a national average rate of 9lb of peanut butter consumed per household per year
(USDA/Economic Research Service, 2011), the average price of $2.25 for one pound of peanut butter
(Mid-Atlantic Information Office, 2012), and an average annual family grocery budget of $6129 (BLS,
2011), we determined that the allocation of peanut butter for each grocery trip was 0.33%. The average
number of trips a family takes to the grocery per year is roughly 110 (Gordon, 2007), and the average
roundtrip distance is 10 miles (Economic Research Center, 2009), equating to 1100 grocery miles per
year. Using an economic allocation, if 0.33% of the average family budget is for 9 lb of peanut butter,
then we can assume that 0.33% of the miles used for groceries in a year were driven to purchase those 9
lb. Therefore, an allocation of 0.40 miles per year per 1 pound jar of peanut butter was used to model
the consumer peanut butter transportation load.
Table 2-20. National average dishwasher use data (Thoma, et al., 2012)
National Average Units Amount
Tap Water Use kg 22
Electricity kWh 1.5
Soap kg 0.025
Allocation of Single Cycle for 16oz Peanut Butter1 % 10%
1 Assumes a combined dishwasher capacity of 54 plates, cups or bowls, and 48
utensils. Assumes 16oz Peanut Butter contains 16 1oz servings requiring 16 utensils and 4 plates for an average capacity of 10% for a single cycle.
Table 2-21. National average peanut butter and consumer behavior data (Hogass, 2002)
National Average Units Amount
Trips to Grocery per Year1 # 110
Roundtrip Distance to Grocery2 miles 10
Annual Grocery Budget3 $ 6129
Annual Peanut Butter Consumption per Household4 lb 9
Cost of Peanut Butter per lb5 $/lb 2.25
Allocation of Each Grocery Trip to Peanut Butter % 0.33%
Annual Peanut Butter Miles per lb of Peanut Butter Miles 0.40 1 (Gordon, 2007)
2 (Economic Research Center, 2009)
3 (BLS, 2011)
4 (USDA/Economic Research Service, 2011)
5 (Mid-Atlantic Information Office, 2012)

32
There is a relatively small quantity of post-consumer waste generated, and it is modeled using
EcoInvent processes for landfill disposal. Recycled goods are attributed back to the model as an avoided
product, meaning that the recycling of certain goods lowers its overall impact. The package disposal
picture for a 16 oz peanut butter product is shown in Table 2-22.
Table 2-22. Summary of consumer disposal assumptions
Plastics % Amount (g)
Recycled1 32% 12.16
Incinerated1 14% 5.32
Landfilled1 54% 20.52
Aluminum
Recycled1 32% 0.35
Landfilled1 68% 0.75
1 (EPA, 2009)
33
3 Scan Level Results and Analysis
3.1 ReCiPe Life Cycle Impact Assessment
This model and life cycle inventory has been analyzed using an impact methodology called
ReCiPe Midpoint. There are 18 characterization categories within ReCiPe Midpoint which reflect issues
of direct environmental relevance. The midpoint impacts associated with the entire peanut butter life
cycle estimated by the ReCiPe Midpoint Model represent potential processes that could cause some
endpoint impact. In LCA the impact categories that directly derive from human activities and potentially
cause damage are midpoint impacts; the damage that ultimately results from these impact categories
are called endpoint categories. For the sake of consistency with the model analysis and comparison of
the results with other GHG studies, the results are presented for one kg of peanut butter (2.2 lb of
peanut butter), normalized for comparison to world values.
In the cradle to grave ReCiPe LCIA, the highest impact categories from peanut butter were human
human toxicity, freshwater ecotoxicity, and marine ecotoxicity characterization categories (
Figure 3-1). The life cycle phase with the greatest impact, Consumer Use and Disposal, is not in
the control domain of the peanut industry sector. The Consumer Use phase was influenced heavily by
the electricity demand used to clean dishes as part of peanut butter consumption. The peanut industry
has little to no control over how a product is used after it leaves the supply chain, and therefore no
power to reduce its environmental impact. The focus of the remaining ReCiPe impact analysis was the
supply chain up to and including retail (cradle to retail gate) with the remainder of the ReCiPe results
excluding consumer use and disposal. Figure 3-2 shows the ReCiPe impact assessment overview for
cradle to retail gate.

34
Figure 3-1. ReCiPe midpoint impact analysis, cradle to grave
0.
0.0005
0.001
0.0015
0.002
0.0025
0.003N
orm
aliz
ed
Imp
act
(Wo
rld
Fac
tors
)
Impact Characterization Categories
Consumer
Retail
Processor
Roaster
Blancher
Sheller
Buying Point
Farm
Analyzing 1 kg 'Consumer use phase/US U'; Method: ReCiPe Midpoint (H) V1.06 / World ReCiPe H /

35
Figure 3-2. Recipe midpoint impact analysis, cradle to retail gate
3.1.1 Highest Weighted Characterization Categories
In this section we will take a closer look at the top three characterization categories as analyzed
by ReCiPe for U.S. peanut butter production excluding consumer use and disposal. The top three as
previously discussed are human toxicity, marine ecotoxicity and freshwater ecotoxicity. All three share a
common unit of kg 1,4 Dichlorobenzene equivalent. 1,4 Dichlorobenzene is the reference chemical for
these characterization categories because it is anticipated to be a carcinogen in humans and animals and
because of its lipophilic properties, meaning it will accumulate in the fatty tissues of animals. In section
3.1.3 we will take a closer look at what peanut butter industry sector processes contribute to the
impacts shown below.
0.
0.0002
0.0004
0.0006
0.0008
0.001
0.0012
0.0014
0.0016
0.0018N
orm
aliz
ed
Imp
act
(Wo
rld
Fac
tors
)
Impact Characterization Categories
Retail
Processor
Roaster
Blancher
Sheller
Buying Point
Farm
Analyzing 1 kg 'Peanut Butter, 16oz at retail/US U'; Method: ReCiPe Midpoint (H) V1.06 / World ReCiPe H / Normalization / Excluding infrastructure processes

36
3.1.1.1 Human Toxicity
The factor of human toxicity encompasses human health damages by a chemical using dose and
inherent toxicity of a chemical (Hertwich, Mateles, Pease, & McKone, 2009). This factor can be
accounted for and applied to the human population, N, using Disability Adjusted Life Years (DALYS). The
main processes affecting Human Toxicity in the peanut butter production chain are natural gas
extraction, crude oil production, disposal of spoil from coal mininig, and bituminous coal electricity
production (Figure 3-3). Natural gas use is most predominant at the roaster. Peanut butter processing
contributes the most towards the production of crude oil for the transportation of materials involved in
making peanut butter. Processes on the farm are most responsible for the disposal of coal byproducts.
Bituminous coal for electricity production is needed for processes with high electricity demand, mainly,
the farm, blancher, roaster and processor.
Figure 3-3. ReCiPe midpoint impact analysis for human toxicity characterization category, cradle to retail gate.
3.1.1.2 Marine Ecotoxicity
The fate of essential metals such as Cobalt, Copper, Manganese, Molybdenum, and Zinc in the
ocean are the main driving factors behind marine ecotoxicity. Contributions to marine ecotoxicity are
primarily from disposal of municipal waste, disposal spoil from coal mining, and natural gas production
(Figure 3-4). The disposal of municipal waste impact is from the blancher, roaster, and processor
0.
0.005
0.01
0.015
0.02
0.025
0.03
0.035
0.04
0.045
kg 1
,4-D
B e
q
Natural gas, at extraction site
Natural gas, unprocessed, at extraction
Crude oil, at production
Disposal, spoil from coal mining, in surface landfill
Electricity, bituminous coal, at power plant
Pesticide unspecified, at regional storehouse
Disposal, municipal solid waste, 22.9% water, to sanitarylandfillDisposal, spoil from lignite mining, in surface landfill
Mercury, liquid, at plant
Phosphorous chloride, at plant
Discharge, produced water, onshore
Disposal, municipal solid waste, 22.9% water, to municipalincinerationRemaining processes

37
sectors. Disposal of spoil from coal mining is resultant from processes at the farm. Natural gas
production is primarily for peanut roasting.
Figure 3-4. ReCiPe midpoint impact analysis for marine ecotoxicity characterization category, cradle to retail gate.
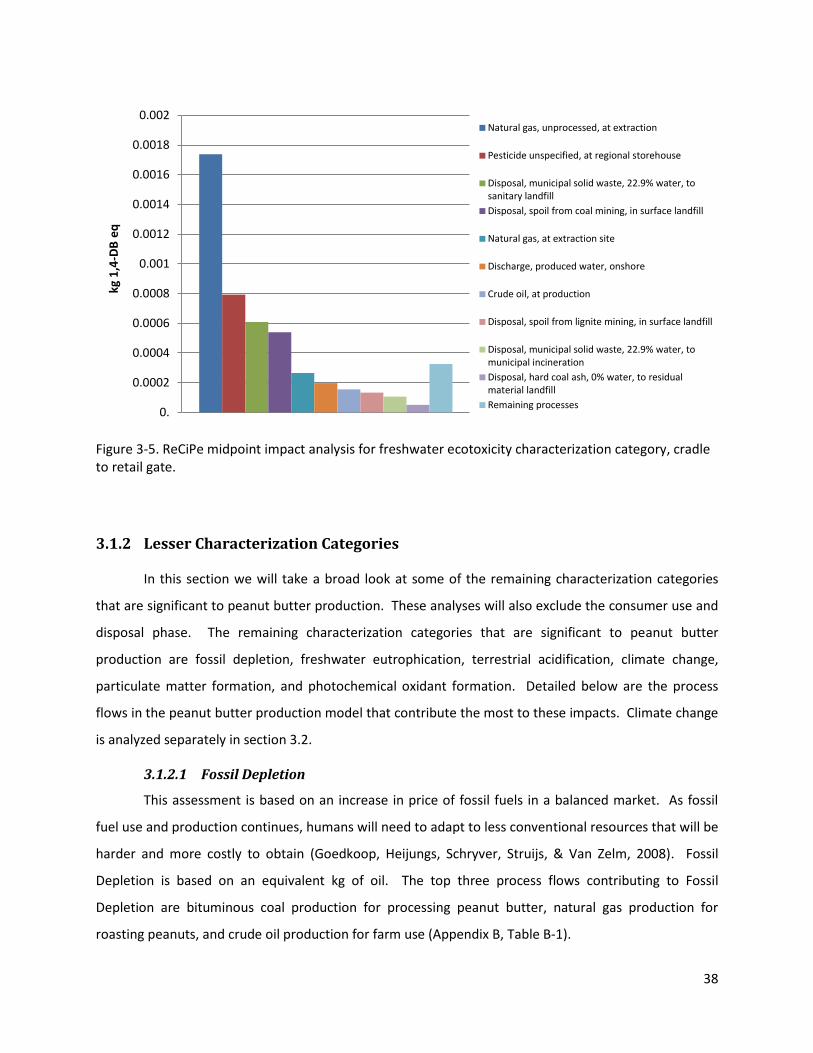
3.1.1.3 Freshwater Ecotoxicity
The characterization factor for freshwater ecotoxicity is comprised of three items:
environmental fate, accumulation in food chain, and the toxic effect of the chemical. A characterization
factor can be created for each chemical by the emission of one unit of chemical and its effect on human
toxicity and freshwater ecotoxicity (Berthoud, Maupu, Huet, & Poupart, 2011). The freshwater
ecotoxicity impact is dominated by unprocessed natural gas and pesticide use (Figure 3-5). The majority
of pesticides are used at the farm level, however, there are very small contributions made by buying
points, shelling, blanching, roasting, and processing. Natural gas demand is driven by the roasting
process.
0.
0.0001
0.0002
0.0003
0.0004
0.0005
0.0006
kg 1
,4-D
B e
q
Disposal, municipal solid waste, 22.9% water, to sanitarylandfillDisposal, spoil from coal mining, in surface landfill
Natural gas, unprocessed, at extraction
Natural gas, at extraction site
Pesticide unspecified, at regional storehouse
Crude oil, at production
Disposal, spoil from lignite mining, in surface landfill
Disposal, municipal solid waste, 22.9% water, to municipalincinerationOperation, lorry 7.5-16t
Discharge, produced water, offshore
Disposal, hard coal ash, 0% water, to residual materiallandfillDisposal, tailings from hard coal milling, in impoundment
Discharge, produced water, onshore
Disposal, nickel smelter slag, 0% water, to residual materiallandfillPhosgene, liquid, at plant
Remaining processes
38
Figure 3-5. ReCiPe midpoint impact analysis for freshwater ecotoxicity characterization category, cradle to retail gate.
3.1.2 Lesser Characterization Categories
In this section we will take a broad look at some of the remaining characterization categories
that are significant to peanut butter production. These analyses will also exclude the consumer use and
disposal phase. The remaining characterization categories that are significant to peanut butter
production are fossil depletion, freshwater eutrophication, terrestrial acidification, climate change,
particulate matter formation, and photochemical oxidant formation. Detailed below are the process
flows in the peanut butter production model that contribute the most to these impacts. Climate change
is analyzed separately in section 3.2.
3.1.2.1 Fossil Depletion
This assessment is based on an increase in price of fossil fuels in a balanced market. As fossil
fuel use and production continues, humans will need to adapt to less conventional resources that will be
harder and more costly to obtain (Goedkoop, Heijungs, Schryver, Struijs, & Van Zelm, 2008). Fossil
Depletion is based on an equivalent kg of oil. The top three process flows contributing to Fossil
Depletion are bituminous coal production for processing peanut butter, natural gas production for
roasting peanuts, and crude oil production for farm use (Appendix B, Table B-1).
0.
0.0002
0.0004
0.0006
0.0008
0.001
0.0012
0.0014
0.0016
0.0018
0.002kg
1,4
-DB
eq
Natural gas, unprocessed, at extraction
Pesticide unspecified, at regional storehouse
Disposal, municipal solid waste, 22.9% water, tosanitary landfill
Disposal, spoil from coal mining, in surface landfill
Natural gas, at extraction site
Discharge, produced water, onshore
Crude oil, at production
Disposal, spoil from lignite mining, in surface landfill
Disposal, municipal solid waste, 22.9% water, tomunicipal incineration
Disposal, hard coal ash, 0% water, to residualmaterial landfill
Remaining processes
39
3.1.2.2 Freshwater Eutrophication
The major limiting nutrient in freshwater is phosphorus. Subsequently, when freshwater is
saturated with phosphorus, eutrophication occurs. Phosphorus emissions can be evaluated with a
damage factor for the eutrophic swing in the freshwater (Goedkoop, Heijungs, Schryver, Struijs, & Van
Zelm, 2008). Freshwater eutrophication is measured based on a kg of phosphorus equivalence. Coal
waste disposal, pesticide use, and mining waste disposal stem primarily from on farm processes.
(Appendix B, Table B-2).
3.1.2.3 Terrestrial Acidification
As sulfates, nitrates, phosphates and other inorganic substances undergo atmospheric
deposition, an acidic shift can occur in the soil, harming plants that thrive at a certain pH value in the
soil. An acidic deviation in this value could not only promote the decline of a target plant species, but
also cause a shift in species occurrence (Goedkoop, Heijungs, Schryver, Struijs, & Van Zelm, 2008). This
characterization category is measured by kg sulfur-dioxide equivalent. Sulfur-dioxide, when oxidized in
the atmosphere, produces H2SO4 which in high concentrations can lead to acid rain. Major contributors
to Terrestrial Acidification were the production of bituminous coal for electricity and natural gas
production (Appendix B, Table B-3).
3.1.2.4 Particulate Matter Formation
Particulate Matter Formation refers to a solid or liquid mixture of organic and non-organic
substances with a diameter of less than 10 μm (PM10). The impacts of Particulate Matter Formation
include respiratory issues from inhalation, aerosols as well as other assorted health problems
(Goedkoop, Heijungs, Schryver, Struijs, & Van Zelm, 2008). Particulate Matter Formation is measured
by kg PM10 equivalence. The main contributor is the production of electricity by bituminous coal for all
peanut industry process which are electricity intensive (Appendix B, Table B-4).
3.1.2.5 Photochemical Oxidant Formation
Photochemical reactions cause the formation of atmospheric ozone which is hazardous to
humans, and leads to a greater occurrence and severity of many respiratory diseases such as asthma
and Chronic Obstructive Pulmonary Diseases. DALY’s are used to determine the severity of
Photochemical Oxidant Formation (Goedkoop, Heijungs, Schryver, Struijs, & Van Zelm, 2008).
Photochemical oxidant formation is based on equivalence to kg non-methane volatile organic
compounds (NMVOC). NMVOC’s are organic chemicals with high vapor pressure at room temperature,
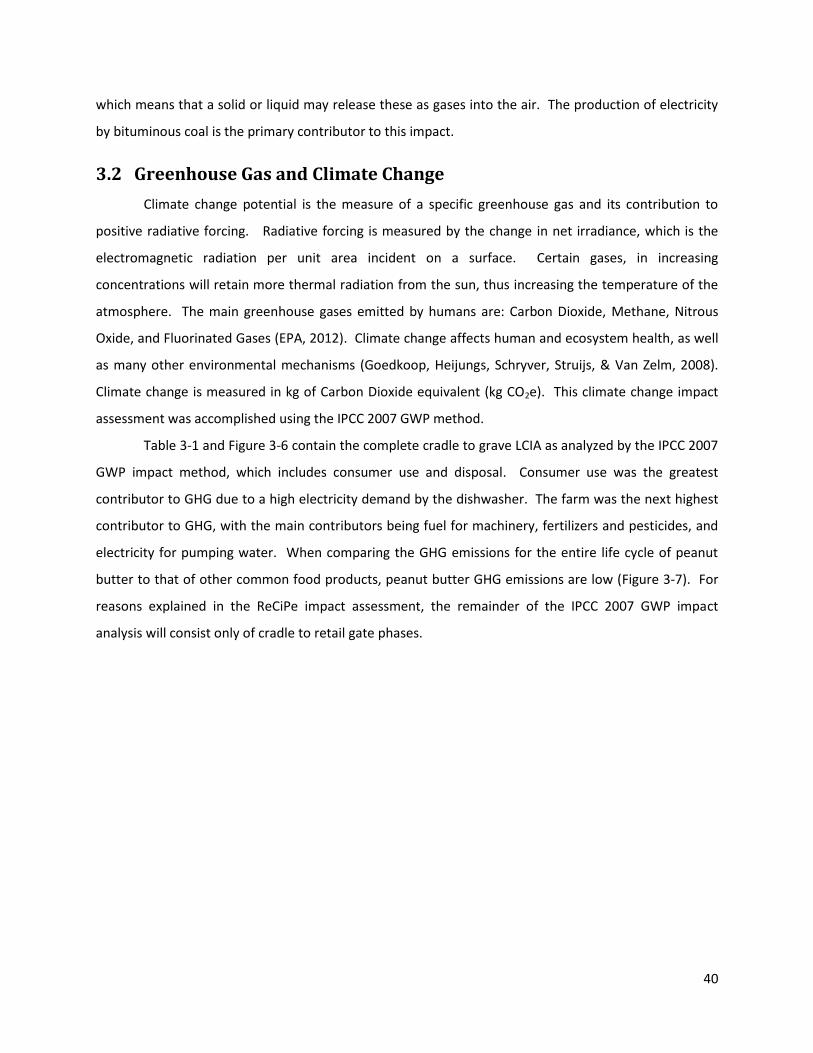
40
which means that a solid or liquid may release these as gases into the air. The production of electricity
by bituminous coal is the primary contributor to this impact.
3.2 Greenhouse Gas and Climate Change
Climate change potential is the measure of a specific greenhouse gas and its contribution to
positive radiative forcing. Radiative forcing is measured by the change in net irradiance, which is the
electromagnetic radiation per unit area incident on a surface. Certain gases, in increasing
concentrations will retain more thermal radiation from the sun, thus increasing the temperature of the
atmosphere. The main greenhouse gases emitted by humans are: Carbon Dioxide, Methane, Nitrous
Oxide, and Fluorinated Gases (EPA, 2012). Climate change affects human and ecosystem health, as well
as many other environmental mechanisms (Goedkoop, Heijungs, Schryver, Struijs, & Van Zelm, 2008).
Climate change is measured in kg of Carbon Dioxide equivalent (kg CO2e). This climate change impact
assessment was accomplished using the IPCC 2007 GWP method.
Table 3-1 and Figure 3-6 contain the complete cradle to grave LCIA as analyzed by the IPCC 2007
GWP impact method, which includes consumer use and disposal. Consumer use was the greatest
contributor to GHG due to a high electricity demand by the dishwasher. The farm was the next highest
contributor to GHG, with the main contributors being fuel for machinery, fertilizers and pesticides, and
electricity for pumping water. When comparing the GHG emissions for the entire life cycle of peanut
butter to that of other common food products, peanut butter GHG emissions are low (Figure 3-7). For
reasons explained in the ReCiPe impact assessment, the remainder of the IPCC 2007 GWP impact
analysis will consist only of cradle to retail gate phases.

41
Table 3-1. IPCC 2007 GWP cradle to grave impact analysis, kg CO2e per kg of peanut butter produced
kg CO2e/kg
peanut butter
Farm 0.511
Buying Point 0.064
Sheller 0.046
Blancher 0.265
Roaster1 0.369
Processor 0.406
Retail 0.204
Consumer Use & Disposal 0.762
Total 2.64 1 Dry roast process
Figure 3-6. IPCC 2007 GWP cradle to grave impact analysis, kg CO2e per kg peanut butter produced

42
The greatest impact on climate change from processes within the peanut butter industry,
excluding consumer use and disposal, stems from the production of electricity by bituminous coal
(Figure 3-8). This electricity is used to power all of the processes from the buying point to retail with its
most significant use at the peanut butter processor. The next highest contributor is from diesel use on
the farm. This can be seen by combining the preharvest and harvest machinery fuel use processes
(Figure 3-8).
Figure 3-7. Comparison of GHG emissions from various food types (EWG, 2011)

43
3.2.1 Cultivation Practice Comparison for Greenhouse Gases
In our final impact analysis, we examined the different peanut cultivation practices as described
by the Georgia crop budgets used to populate our model. The amount of CO2e for each cultivation
practice was again determined using the IPCC 2007 GWP method (Frischknecht & Jungbluth, 2007) in
SimaPro®. Table 3-2 shows the amount of CO2e produced for each production practice.
Table 3-2. Greenhouse Gas Protocol results by impact category and cultivation method
Conventional,
Irrigated Conventional, Non-irrigated
Strip, Irrigated
Strip, Non-irrigated
Average Practice
kg CO2 eq 0.320 0.301 0.281 0.279 0.305
The conventional till and irrigated scenarios resulted in higher emissions than the strip till and
non-irrigated scenarios, respectively (Figure 3-9). Processes that accounted for less than 1% of the
carbon dioxide produced were excluded. In all four cultivation scenarios, the input categories with the
largest contributions to carbon dioxide emissions were harvest and preharvest machinery fuel, as well as
insecticide applications.
Figure 3-8. IPCC 2007 GWP impact analysis process flow contributors, cradle to retail gate
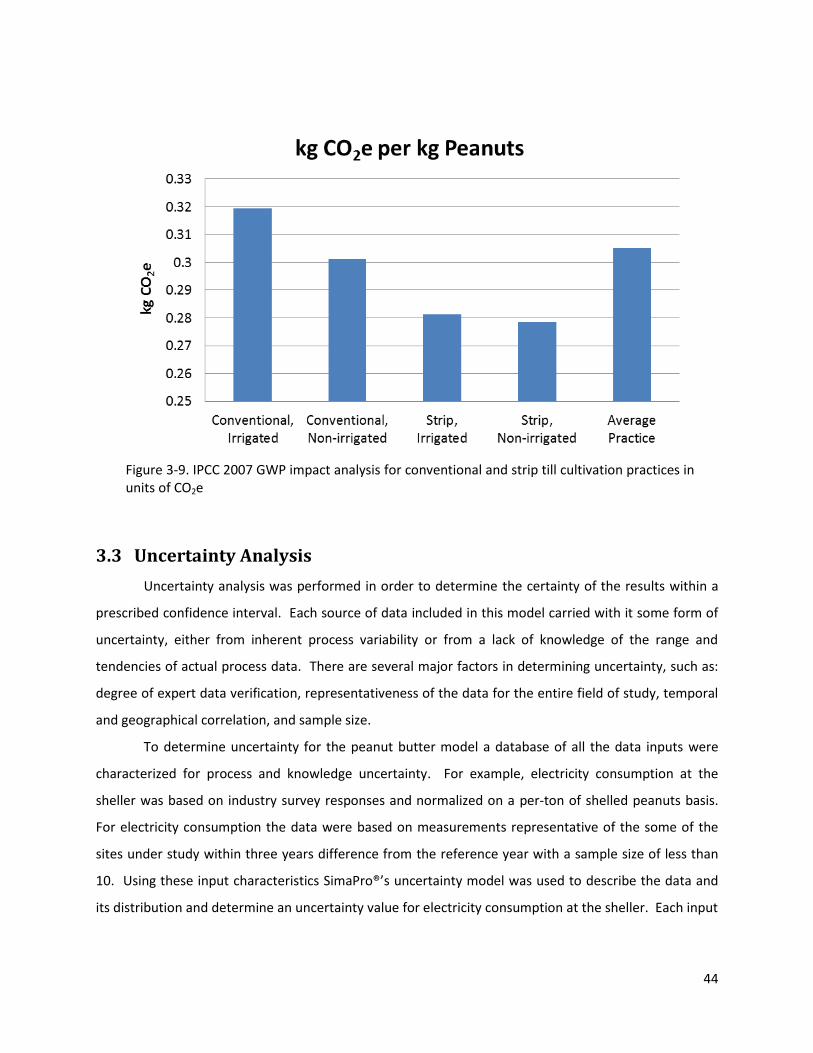
44
3.3 Uncertainty Analysis
Uncertainty analysis was performed in order to determine the certainty of the results within a
prescribed confidence interval. Each source of data included in this model carried with it some form of
uncertainty, either from inherent process variability or from a lack of knowledge of the range and
tendencies of actual process data. There are several major factors in determining uncertainty, such as:
degree of expert data verification, representativeness of the data for the entire field of study, temporal
and geographical correlation, and sample size.
To determine uncertainty for the peanut butter model a database of all the data inputs were
characterized for process and knowledge uncertainty. For example, electricity consumption at the
sheller was based on industry survey responses and normalized on a per-ton of shelled peanuts basis.
For electricity consumption the data were based on measurements representative of the some of the
sites under study within three years difference from the reference year with a sample size of less than
10. Using these input characteristics SimaPro®’s uncertainty model was used to describe the data and
its distribution and determine an uncertainty value for electricity consumption at the sheller. Each input
Figure 3-9. IPCC 2007 GWP impact analysis for conventional and strip till cultivation practices in units of CO2e
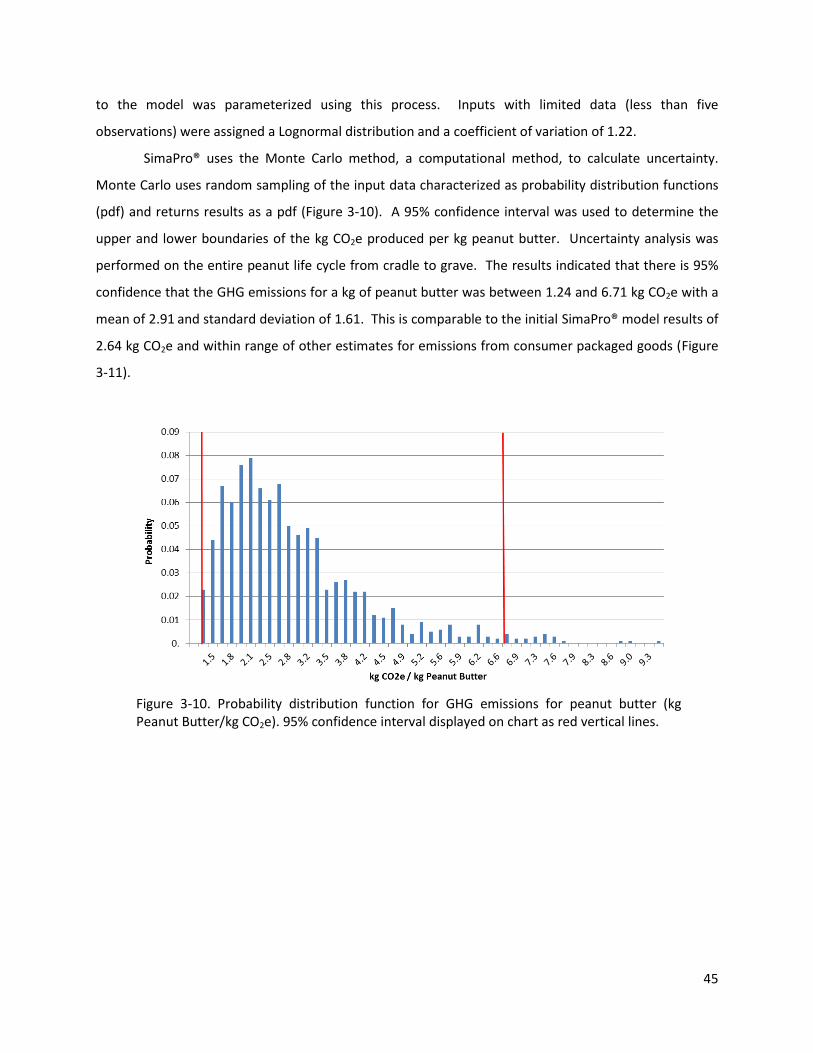
45
to the model was parameterized using this process. Inputs with limited data (less than five
observations) were assigned a Lognormal distribution and a coefficient of variation of 1.22.
SimaPro® uses the Monte Carlo method, a computational method, to calculate uncertainty.
Monte Carlo uses random sampling of the input data characterized as probability distribution functions
(pdf) and returns results as a pdf (Figure 3-10). A 95% confidence interval was used to determine the
upper and lower boundaries of the kg CO2e produced per kg peanut butter. Uncertainty analysis was
performed on the entire peanut life cycle from cradle to grave. The results indicated that there is 95%
confidence that the GHG emissions for a kg of peanut butter was between 1.24 and 6.71 kg CO2e with a
mean of 2.91 and standard deviation of 1.61. This is comparable to the initial SimaPro® model results of
2.64 kg CO2e and within range of other estimates for emissions from consumer packaged goods (Figure
3-11).
Figure 3-10. Probability distribution function for GHG emissions for peanut butter (kg Peanut Butter/kg CO2e). 95% confidence interval displayed on chart as red vertical lines.
46
3.4 Summary of SimaPro® modeling
A complete model of the peanut butter supply chain accounting for extractions from nature
through final disposal of packaging materials was constructed and life cycle inventory data from
publically available sources was used to support an analysis of multiple environmental impacts. The
primary impact categories were found using the ReCiPe impact analysis model. ReCiPe identified
toxicity impacts as significant and driven by emissions from four major processes: natural gas
production, disposal of municipal waste, disposal of coal byproducts, and pesticide use. Natural gas
production and use was associated primarily with the buying point where drying occurs and the roaster.
Disposal of municipal waste is associated with blanching, roasting, and processing. Disposal of coal
byproducts is associated with processes on the farm. Pesticides are usually associated with the farm,
however, significant pesticide use was reported at the sheller, blancher, and roaster.
An initial evaluation of our SimaPro® model concluded that 1kg of peanut butter produces 2.64
kg CO2e. Further, Monte Carlo uncertainty analysis revealed a mean of 2.91 kg CO2e with a 95%
confidence interval of 1.24 to 6.71 kg CO2e. The greatest impact on climate change from within the
peanut butter life cycle occurs at the consumer, followed by the farm and processor. The highest
processes impact stems from the production of electricity by bituminous coal. This electricity is used to
power all of the processes from the buying point to retail with its most significant use at the peanut
Figure 3-11. Monte Carlo uncertainty analysis results, 95% confidence interval, as compared with the initial SimaPro® model output and industry estimates for various packaged goods (EWG, 2011).

47
butter processor. Conventional till, irrigated peanuts incur the greatest amount of CO2e, which is
resultant from the electricity used to pump water.
4 Conclusions
The purpose of this analysis was to perform a scan-level life cycle assessment and impact
analysis for peanut butter production in the US. Objectives for the LCA were: 1) a literature review of
the peanut industry, 2) a life cycle inventory (LCI) review, and 3) an assessment of a variety of impacts
including carbon. This report provides a description of the life cycle inventory, assessment, and impact
results. Objective 1, the Literature Review of the peanut industry, was prepared in a separate
document. The results of Objectives 2 and 3 were presented in this document.
The project scope included environmental effects at a national scale in order to put into context
the environmental impacts that can be attributed to the entire life cycle of a 1 lb jar of peanut butter in
the United States. In the report, we focused on the factors in the peanut butter life cycle that were the
highest contributors to environmental impacts, specifically human toxicity, marine and freshwater
ecotoxicity, as well as climate change, which was an important impact for the peanut industry
shareholders. Most of the ReCiPe midpoint and IPCC 2007 GWP analysis did not include the consumer
phase because of a lack of control over this phase by the peanut industry.
4.1 LCIA Using ReCiPe Midpoint
ReCiPe midpoint impact analysis showed that human toxicity, marine ecotoxicity and freshwater
ecotoxicity were the three highest weighted characterization categories. All three share a common unit
of kg 1,4 Dichlorobenzene equivalent. The main processes affecting Human Toxicity in the peanut
butter production chain were natural gas extraction, crude oil production, disposal of coal byproducts,
and bituminous coal electricity production. Natural gas use was most predominant at the roaster.
Peanut butter processing contributed the most towards the production of crude oil for the
transportation of materials involved in making peanut butter. Processes on the farm were most
responsible for the disposal of coal byproducts. Bituminous coal for electricity production was needed
for processes with high electricity demand, mainly, the farm, blancher, roaster and processor. 31% of
the total Human Toxicity impact occurred at the farm and another 26% occurred at the roaster.
Contributions to marine ecotoxicity were primarily from disposal of municipal waste, disposal of
coal byproducts, and natural gas production. The disposal of municipal waste impact was from the
blancher, roaster, and processor sectors. Disposal of coal byproducts was resultant from processes at
48
the farm. The freshwater ecotoxicity impact was dominated by unprocessed natural gas and pesticide
use. The majority of pesticides were used at the farm level. Natural gas demand was driven by the
roasting process. The farm accounted for 35% of freshwater ecotoxicity and 35% of the marine
ecotoxicity impacts.
4.2 LCIA Using IPCC 2007 GWP
4.2.1 Cradle to Grave
This climate change impact assessment was accomplished using the IPCC 2007 GWP method
which uses units of kg CO2e. Consumer use was the greatest contributor to GHG due to a high electricity
demand by the dishwasher. However, consumer use was not included in the majority of the greenhouse
gas analysis. IPCC 2007 GWP assessed that the greatest impact on climate change from processes within
the peanut butter industry excluding consumer use stems from the production of electricity by
bituminous coal. This electricity is used to power all of the processes from the buying point to retail
with its most significant use at the peanut butter processor. Natural gas production for the roasting of
peanuts and on-farm diesel use were also significant contributors to the total CO2e produced.
Discounting consumer use, farm gate impact was roughly 27% of the total greenhouse gas emissions
from the supply chain with the next highest contributor being the peanut butter processor at 22%. The
complete cradle to grave life cycle impact assessment for peanut butter shows a GHG impact of 2.64 kg
CO2e. When comparing the GHG emissions for the entire life cycle of peanut butter to that of other
common food products, peanut butter GHG emissions were low.
We used the Monte Carlo method to determine the uncertainty associated with our model. A
95% confidence interval was used to determine the upper and lower boundaries of the kg CO2e
produced per kg peanut butter. Uncertainty analysis was performed on the entire peanut life cycle from
cradle to grave. The results indicated that there is 95% confidence that the GHG emissions for a kg of
peanut butter was between 1.24 and 6.71 kg CO2e with a mean of 2.91 and standard deviation of 1.61.
This is comparable to the initial SimaPro® model results of 2.64 kg CO2e and within range of other
estimates for emissions from consumer packaged goods.

49
4.2.2 Peanut Production Scenarios
In our final impact analysis, we examined the different peanut cultivation practices as described
by the Georgia crop budgets used to populate our model. The amount of CO2e for each cultivation
practice was again determined using the IPCC 2007 GWP method (Frischknecht & Jungbluth, 2007) in
SimaPro®. The conventional till and irrigated scenarios resulted in higher emissions than the strip till
and non-irrigated scenarios, respectively (Figure 3-9). Conventional tillage required more preharvest
diesel than strip till which stems from the greater amount of field preparation required in conventional
till. Irrigation required the use of electricity to drive the water pumps where as non-irrigated did not.
Non-irrigated practices used less herbicides and pesticides than irrigated peanuts, according to Georgia
crop budgets, however, it was not enough to offset CO2e produced through electricity production. In all
four cultivation scenarios, the input categories with the largest contributions to carbon dioxide
emissions were harvest and preharvest machinery fuel, as well as insecticide applications.
50
References
Berthoud, A., Maupu, P., Huet, C., & Poupart, A. (2011). Assessing freshwater ecotoxicity of agricultural
products. Springer-Verlag.
Blankenship, P. D., & Chew, V. (1979). Peanut Drying Energy Consumption. Peanut Science, 6, 10-13.
BLS. (2011). Average Energy Prices in Atlanta - September 2011. U.S. Bureau of Labor Statistics Southeast
Information Office. News Release. BLS.
BLS. (2011). Consumer Expenditures--2010. Bureau of Labor and Statistics.
Butts, C. (2010). 2010 Peanut Drying Research Summary Report. USDA, ARS, National Peanut Research
Laboratory.
Cunningham, L. (2011, November). R.L. Cunningham and Sons. (J. McCarty, Interviewer)
Deru, M., & Torcellini, P. (2007). "Source energy and emissions factors for energy use in buildings",
Technical Report NREL/TP-550-38617. National Renewable Energy Laboratory, June 2001.
Economic Research Center. (2009). Access to Affordable and Nutritious Food. U.S. Department of
Agriculture.
Energy Star. (2010). Dishwashers Key Product Criteria. Retrieved May 22, 2012, from Energy Star:
http://www.energystar.gov/index.cfm?c=dishwash.pr_crit_dishwashers
EPA. (1995). AP-42 Compilation of Air Pollutant Emission Factors. Office of Air Quality Planning and
Standards. EPA.
EPA. (1998). Compilation of Air Pollution Emission Factors, Publication AP-42, Section 2.4 Municipal Solid
Waste Landfills.
EPA. (2008). Direct Emissions from Mobile Combustion Sources. Office of Air and Radiation. Washington:
EPA.
EPA. (2009). Municipal Solid Waste Generation, Recycling,. United States Environmental Protection
Agency.
EPA. (2012, February 27). Climate Change - Greenhouse Gas Emissions. Retrieved May 15, 2012, from
EPA: http://www.epa.gov/climatechange/emissions/
EWG. (2011). Environmental Working Group Meat Eaters Guide: Methodology 2011. Environmental
Working Group.
FAO. (2010). Greenhouse Gas Emissions from the Dairy Sector - A Life Cycle Assessment. Food and
Agriculture Organization of the United Nations.

51
Frischknecht, R., & Jungbluth, N. (2007). Implementation of Life Cycle Impact Assessment Methods.
Duebendorf, Switzerland: EcoInvent Center.
Goedkoop, M., Heijungs, R., Schryver, A. D., Struijs, J., & Van Zelm, R. (2008). A life cycle impact
assessment method. ReCiPe.
Gordon, J. (2007). Grocery Store Trends and Strategies For Arlington, Virginia. Arlington Economic
Development.
Heijungs, R., Goedkoop, M., Strujis, J., Effting, S., Sevenster, M., & Huppes, G. (2010). Towards a life
cycle impact assessment method which comprises category indicators at the midpoint and the
endpoint level Report of the first project phase: Design of the new method.
Hertwich, E. G., Mateles, S. F., Pease, W. S., & McKone, T. E. (2009). Human toxicity potentials for life-
cycle assessment and toxics release inventory risk screening. SETAC.
Hogass, E. (2002). Life Cycle Assessment of Industrial Milk Production. International Journal of Life Cycle
Assessment, 7(2), 115-126.
IPCC. (2006). Intergovernmental Panel on Climate Change. Retrieved from IPCC Guidelines for National
Greenhouse Gas Inventories: http://www.ipcc-nggip.iges.or.jp/public/2006gl/vol5.html
Lamb, D. M. (2012, May 23). Supervisory Research Food Technologist. (J. McCarty, Interviewer)
Mid-Atlantic Information Office. (2012). Average retail food and energy prices, U.S. city average and
Midwest region. Bureau of Labor Statistics.
NREL. (2012, January 5). National Renewable Energy Laboratory. Retrieved March 2012, from U.S. Life
Cycle Inventory Database: http://www.nrel.gov/lci/
Peer, R., Thorneloe, S., & Epperson, D. (1993). A Comparison of Methods for Estimating Global Methane
Emissions from Landfills. Chemosphere, 26(1-4), 387-400.
PE-International. (2012). Life Cycle Assessment LCA Methodology. Retrieved May 15, 2012, from PE-
International: http://www.pe-international.com/topics/life-cycle-assessment-lca-methodology/
Pooley, P. (2005). Report on the Feasability of a Peanut Processing Facility in Santa Rosa County, Florida.
Santa Rosa: TEAM Santa Rosa Economic Development Council.
Roy, P., Nei, D., Orikasa, R., Xu, Q., Okadome, H., Nakamura, N., et al. (2009). A review of life cycle
assessment (LCA) on some food products. Journal of Food Engineering(90), 1-10.
SWANA. (1998). Comparision of Models for Predicting Landfill Methane Recovery, Publication No. GR-LG
0075.
The Consumer Goods Forum. (2010). Economic Concerns and Consumer Demand Remain Top Priorities
for Consumer Goods Industry. Press Release, Paris.

52
The Peanut Institute. (2010). The Peanut Institute. Retrieved April 2012, from Peanut Butter:
http://www.peanut-institute.org/peanut-products/peanut-butter.asp
Thoma, G., Matlock, M., Shonnard, D., Cummins, E., Neiderman, Z., Cothren, J., et al. (2010). National
Scan-Level Beyond Carbon Life Cycle Study for Production of US Dairy. Fayetteville: University of
Arkansas.
Thoma, G., Nutter, D., Ulrich, R., Kim, D. S., Norris, G., Milani, F., et al. (2012). Comprehensive Life Cycle
Assessment for Cheese and Whey Products. Fayetteville: University of Arkansas.
UGA. (2011). 2011 Peanut Update. Retrieved from The University of Georgia Cooperative Extension:
http://www.caes.uga.edu/commodities/fieldcrops/peanuts/2011peanutupdate/index2011.html
.
USDA. (2011, December 19). USDA-ERS. Retrieved April 2012, from Major Land Uses: Glossary:
http://www.ers.usda.gov/data/majorlanduses/glossary.htm
USDA/Economic Research Service. (2011). Peanuts: Per Capita availability, by type of product. USDA/
Economic Research Service.
USDA-ERS. (2011). Consumer-Level Food Loss Estimates and Their Use in the ERS Loss-Adjusted Food
Availability Data. USDA.

53
A. Additional Model Parameters for Industry Sectors
Table A-1. Farm chemical inputs
Product Name Active Ingredient Amount Units US EcoInvent Unit Process
Fertilizers
Boron - - - Borax, anhydrous, powder, at plant
Lime/Gypsum - - - Lime, from carbonation
Fungicides
Abound azoxystrobin 2.08 lb/gal Pesticide unspecified, at regional storehouse
Artisan flutolanil 3 lb/gal Pesticide unspecified, at regional storehouse
n/a propiconazole 0.6 lb/gal Pesticide unspecified, at regional storehouse
Bravo chlorothalonil 4.17 lb/gal chlorothalonil, at regional storage
Chlorothalonil chlorothalonil 6 lb/gal chlorothalonil, at regional storage
Tebuconazole tebuconazole 3.6 lb/gal Pesticide unspecified, at regional storehouse
Tilt/Bravo propiconazole 0.3 lb/gal Pesticide unspecified, at regional storehouse
n/a chlorothalonil 4 lb/gal chlorothalonil, at regional storage
Herbicides
2,4-D Amine Dimethylamine salt of 2,4-D-Dichlorophenoxyacetic acid
3.8 lb/gal 2, 4-D at regional storehouse
2,4-DB dimethylamine salt of butyric acid 1.75 lb/gal phenoxy-compounds, at regional storehouse
Cadre ammonium salt of imazapic 2 lb/gal Pyridine-compounds, at regional storehouse
Dual Magnum S-metolachlor 7.62 lb/gal Metolachlor, at regional storehouse
Glyphosate glyphosate 4 lb/gal Glyphosate, at regional storehouse
Gramaxone Inteon paraquat dichloride 2.762 lb/gal Bipyridylium-compounds, at regional storehouse
Prowl pendimethalin 3.8 lb/gal Pendimethalin, at regional storage
Select clethodim 0.97 lb/gal Pesticide unspecified, at regional storehouse
Sonolan ethalfluralin 3 lb/gal Dinitroaniline-compunds, at regional storehouse

54
Table A-2. Farm chemical inputs, continued
Product Name Active Ingredient Amount Units US EcoInvent Unit Process
Herbicides
Storm sodium salt of bentazon 2.67 lb/gal Benzo[thia]diazole-compounds, at regional storehouse
Storm (2nd a.i.) sodium salt of acifluorfen 1.33 lb/gal Diphenylether-compounds, at regional storehouse
Valor flumioxazin 51 % by mass Pesticide unspecified, at regional storehouse
Insecticides
Chlorpyrifos chloropyrifos - - organophosphorus-compounds, at regional warehouse
Karate Z lambda-cyhalothrin 2.08 lb/gal pyretroid-compounds, at regional storehouse
Steward indoxacarb 1.25 lb/gal diazine-compounds, at regional storehouse
Temik aldicarb 15 % by mass [thio]carbamate-compounds, at regional storehouse
Tracer spinosad 4 lb/gal Pesticide unspecified, at regional storehouse
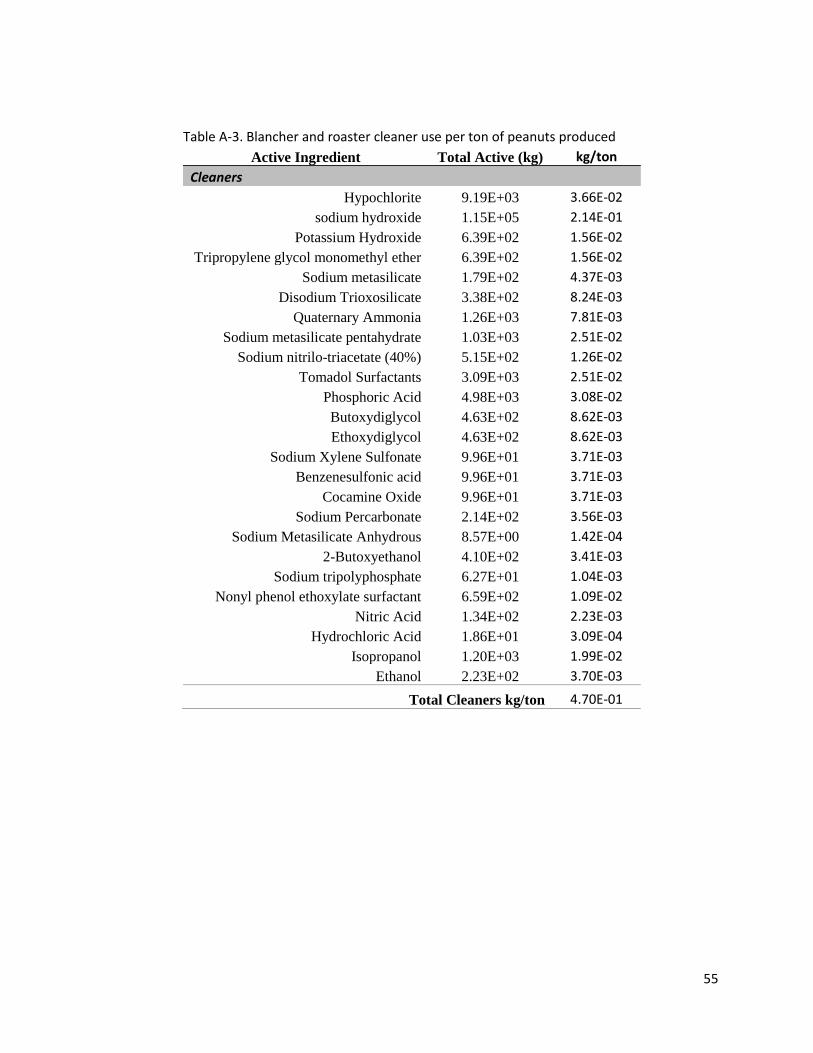
55
Table A-3. Blancher and roaster cleaner use per ton of peanuts produced
Active Ingredient Total Active (kg) kg/ton
Cleaners
Hypochlorite 9.19E+03 3.66E-02
sodium hydroxide 1.15E+05 2.14E-01
Potassium Hydroxide 6.39E+02 1.56E-02
Tripropylene glycol monomethyl ether 6.39E+02 1.56E-02
Sodium metasilicate 1.79E+02 4.37E-03
Disodium Trioxosilicate 3.38E+02 8.24E-03
Quaternary Ammonia 1.26E+03 7.81E-03
Sodium metasilicate pentahydrate 1.03E+03 2.51E-02
Sodium nitrilo-triacetate (40%) 5.15E+02 1.26E-02
Tomadol Surfactants 3.09E+03 2.51E-02
Phosphoric Acid 4.98E+03 3.08E-02
Butoxydiglycol 4.63E+02 8.62E-03
Ethoxydiglycol 4.63E+02 8.62E-03
Sodium Xylene Sulfonate 9.96E+01 3.71E-03
Benzenesulfonic acid 9.96E+01 3.71E-03
Cocamine Oxide 9.96E+01 3.71E-03
Sodium Percarbonate 2.14E+02 3.56E-03
Sodium Metasilicate Anhydrous 8.57E+00 1.42E-04
2-Butoxyethanol 4.10E+02 3.41E-03
Sodium tripolyphosphate 6.27E+01 1.04E-03
Nonyl phenol ethoxylate surfactant 6.59E+02 1.09E-02
Nitric Acid 1.34E+02 2.23E-03
Hydrochloric Acid 1.86E+01 3.09E-04
Isopropanol 1.20E+03 1.99E-02
Ethanol 2.23E+02 3.70E-03
Total Cleaners kg/ton 4.70E-01

56
Table A-4. Blancher and roaster pesticide use per ton of peanuts produced
Active Ingredient Total Active (kg) kg/ton
Pesticides
Pyrethrins 1.85E-01 2.73E-06
cyfluthrin 3.48E-01 5.13E-06
Piperonyl Butoxide 9.07E-01 3.38E-05
Pyriproxyfen 3.63E-02 1.35E-06
Magnesium Phosphide 2.22E-01 8.26E-06
Imidacloprid 1.13E-01 4.22E-06
Z-9 Tricosene 2.27E-02 8.45E-07
Deltamethrin 5.09E-01 1.90E-05
Bromethalin 4.95E-05 1.84E-09
Brodifacoum 8.14E-04 3.03E-08
Difethialone 3.84E-04 1.43E-08
Aluminum Phosphide 2.62E+00 4.35E-05
d-trans Alethrin 7.68E-03 1.27E-07
Phenothrin 7.14E-03 1.19E-07
Brodifacoum 2.49E-04 4.14E-09
9, 12-tetradecadien-1-yl acetate 1.11E-03 1.84E-08
Total Pesticides kg/ton 1.19E-04

57
Table A-5. Processing ingredient inputs and diesel transport requirement for 1 ton of ingredients
Units Amount SimaPro® Process Name
Stabilizer Oil Input
Coconut Oil ton 1.00 Crude coconut oil, at plant/PH WITH US ELECTRICITY U
Diesel kg 26.69 Diesel, manufacture and combustion/US U
Sugar Input Sugar ton 1.00 Sugar, from sugar beet, at sugar refinery/CH WITH US ELECTRICITY U
Diesel kg 14.34 Diesel, manufacture and combustion/US U
Salt Input
Salt ton 1.00 No SimaPro® process available
Diesel kg 26.14 Diesel, manufacture and combustion/US U

58
Table A-6. Packaging material inputs and diesel transport requirements for 1 ton of materials
Units Amount SimaPro® Process Name
Jar Input Jar, PET ton 1.00 Polyethylene terephthalate, granulate, bottle grade, at plant/RER WITH US Diesel,
manufacture and combustion/US U
Moulding Process ton 1.00 Injection moulding/RER WITH US ELECTRICITY U
Diesel kg 18.98 Diesel, manufacture and combustion/US U
Label Input Label, Paper ton 0.99 Paper, wood-containing, LWC, at regional storage/CH WITH US ELECTRICITY U
Label, Adhesive ton 0.01 Proxy_Adhesives and binders, at plant NREL /US
Diesel kg 60.96 Diesel, manufacture and combustion/US U
Lid Input
Polypropylene ton 0.90 Polypropylene, granulate, at plant/RER WITH US ELECTRICITY U
Aluminum ton 0.10 Aluminum, secondary, rolled NREL /RNA
Moulding Process ton 1.00 Injection moulding/RER WITH US ELECTRICITY U
Diesel kg 26.98 Diesel, manufacture and combustion/US U
Secondary Packaging Input
Packaging Film lb 10.00 Packaging film, LDPE, at plant/RER WITH US ELECTRICITY U Corrugated Box lb 90.00 Corrugated board, recycling fibre, double wall, at plant/CH WITH US ELECTRICITY U
Pallet p 1.00 EUR-flat pallet/RER WITH US ELECTRICITY U
Diesel kg 15.01 Diesel, manufacture and combustion/US U
Output
Stabilizer Oil ton 1.00 Stabilizer, crude coconut oil at plant/US U
Sugar ton 1.00 Sugar,from sugar beet at plant/US U
Salt ton 1.00 Salt placeholder, at plant/US U
Jar, PET ton 1.00 16oz product jar, at plant/US U
Label, Paper ton 1.00 16oz product label, at plant/US U
Lid, Poly and Aluminum ton 1.00 16oz product lid, at plant/US U
Secondary Packaging lb 150.00 16oz product, secondary packaging, at plant/US U

59
B. Additional Results Tables and Figures
Table B-7. Fossil depletion process flow impacts for 1 kg peanut butter
Process Name Units
Fossil Depletion kg Oil eq
Bituminous coal, at mine 0.1705
Natural gas, at extraction site 0.0978
Natural gas, unprocessed, at extraction 0.0564
Crude oil, at production onshore 0.0361
Crude oil, at production offshore 0.0292
Crude oil, at production onshore 0.027
Natural gas, at production onshore 0.025
Crude oil, at production onshore 0.0244
Crude oil, at production offshore 0.0243
Hard coal, at mine 0.0175
Crude oil, at production 0.0143
Crude oil, at production 0.0133
Lignite coal, at surface mine 0.0129
Natural gas, at production onshore 0.012
Natural gas, at production offshore 0.0113
Natural gas, at production onshore 0.0109
Remaining processes 0.0387
Table B-8. Freshwater eutrophication process flow impacts for 1 kg peanut butter
Process Name Units
Freshwater Eutrophication kg P eq
Disposal, spoil from coal mining, in surface landfill 4.11E-05
Pesticide unspecified, at regional storehouse 2.23E-05
Disposal, spoil from lignite mining, in surface landfill 1.04E-05 Disposal, basic oxygen furnace wastes, 0% water, to residual material landfill 1.32E-06
Remaining processes 4.33E-06
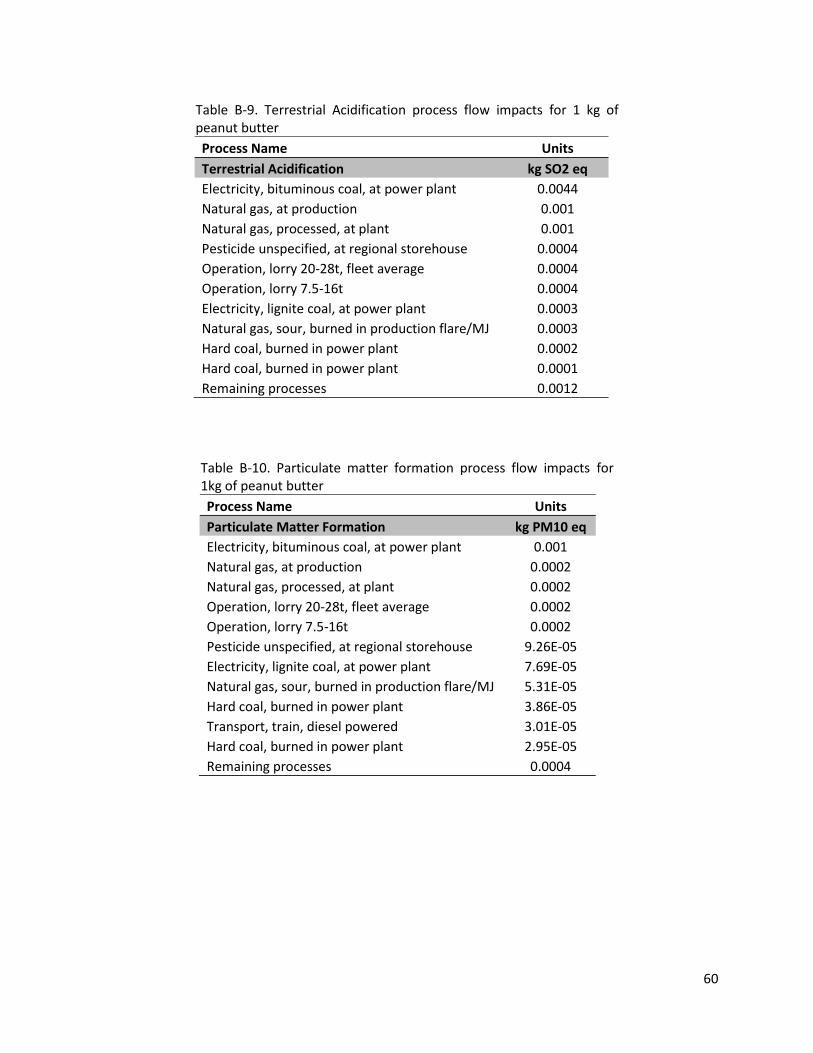
60
Table B-9. Terrestrial Acidification process flow impacts for 1 kg of peanut butter
Process Name Units
Terrestrial Acidification kg SO2 eq
Electricity, bituminous coal, at power plant 0.0044
Natural gas, at production 0.001
Natural gas, processed, at plant 0.001
Pesticide unspecified, at regional storehouse 0.0004
Operation, lorry 20-28t, fleet average 0.0004
Operation, lorry 7.5-16t 0.0004
Electricity, lignite coal, at power plant 0.0003
Natural gas, sour, burned in production flare/MJ 0.0003
Hard coal, burned in power plant 0.0002
Hard coal, burned in power plant 0.0001
Remaining processes 0.0012
Table B-10. Particulate matter formation process flow impacts for 1kg of peanut butter
Process Name Units
Particulate Matter Formation kg PM10 eq
Electricity, bituminous coal, at power plant 0.001
Natural gas, at production 0.0002
Natural gas, processed, at plant 0.0002
Operation, lorry 20-28t, fleet average 0.0002
Operation, lorry 7.5-16t 0.0002
Pesticide unspecified, at regional storehouse 9.26E-05
Electricity, lignite coal, at power plant 7.69E-05
Natural gas, sour, burned in production flare/MJ 5.31E-05
Hard coal, burned in power plant 3.86E-05
Transport, train, diesel powered 3.01E-05
Hard coal, burned in power plant 2.95E-05
Remaining processes 0.0004

61
Table B-11. Photochemical oxidant formation process flow impacts for 1kg of peanut butter
Process Name Units
Photochemical Oxidant Formation kg NMVOC
Electricity, bituminous coal, at power plant 0.0017
Operation, lorry 20-28t, fleet average 0.0008
Operation, lorry 7.5-16t 0.0007
Electricity, biomass, at power plant 0.0006
Natural gas, vented 0.0001
Natural gas, at production 0.0001
Transport, train, diesel powered 0.0001
Electricity, lignite coal, at power plant 0.0001
Pesticide unspecified, at regional storehouse 0.0001
Electricity, natural gas, at power plant 8.32E-05
Natural gas, processed, at plant 8.02E-05
Remaining processes 0.001
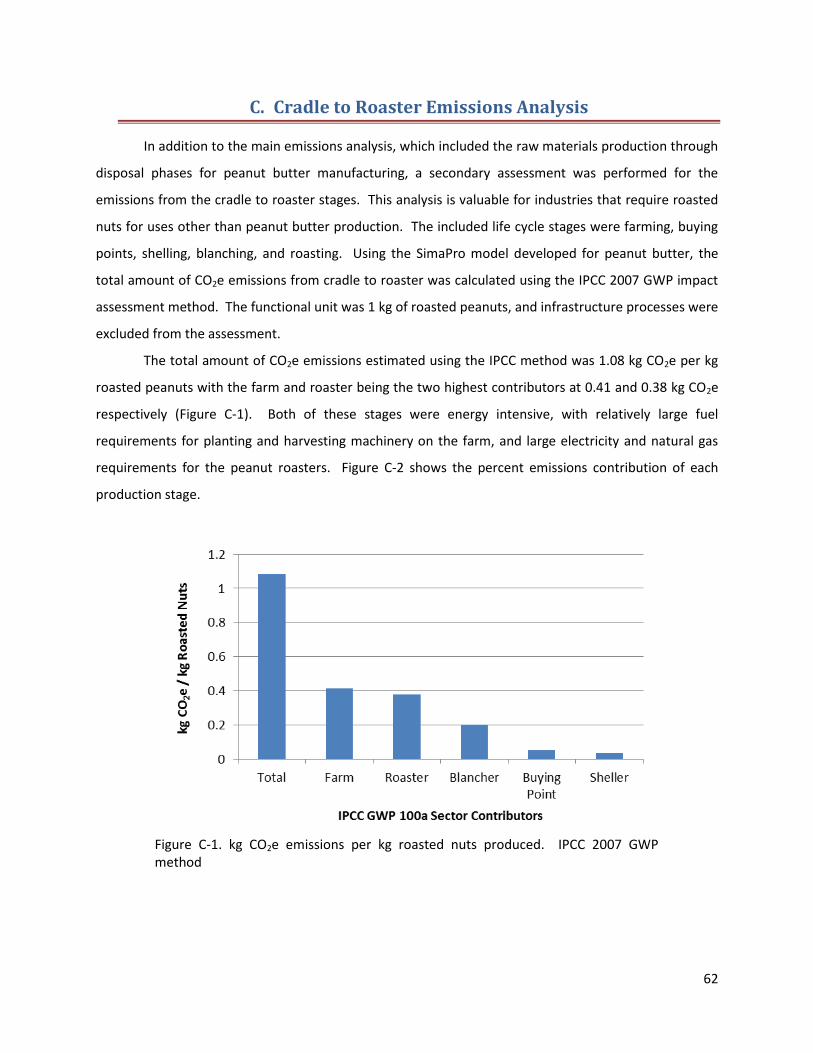
62
C. Cradle to Roaster Emissions Analysis
In addition to the main emissions analysis, which included the raw materials production through
disposal phases for peanut butter manufacturing, a secondary assessment was performed for the
emissions from the cradle to roaster stages. This analysis is valuable for industries that require roasted
nuts for uses other than peanut butter production. The included life cycle stages were farming, buying
points, shelling, blanching, and roasting. Using the SimaPro model developed for peanut butter, the
total amount of CO2e emissions from cradle to roaster was calculated using the IPCC 2007 GWP impact
assessment method. The functional unit was 1 kg of roasted peanuts, and infrastructure processes were
excluded from the assessment.
The total amount of CO2e emissions estimated using the IPCC method was 1.08 kg CO2e per kg
roasted peanuts with the farm and roaster being the two highest contributors at 0.41 and 0.38 kg CO2e
respectively (Figure C-1). Both of these stages were energy intensive, with relatively large fuel
requirements for planting and harvesting machinery on the farm, and large electricity and natural gas
requirements for the peanut roasters. Figure C-2 shows the percent emissions contribution of each
production stage.
Figure C-1. kg CO2e emissions per kg roasted nuts produced. IPCC 2007 GWP method

63
Figure C-2. Percentage of total CO2e emissions by life cycle stage

64
Figure C-3 shows the CO2e production from each input in the process, excluding inputs that
contributed to less than 1% of the total emissions. The inputs resulting in the largest amounts of CO2e
were electricity production, natural gas production and combustion, as well as farm fuel for planting and
harvesting machinery.
Figure C-3. CO2e emissions by input. Life cycle inputs contributing less than 1%
of the total emissions are not shown.