national result usa - npl characterization project 9345.1-09-0 epa/540/8-91/069 november 1991...
TRANSCRIPT

United StatesEnvironmental ProtectionAgency
Office of Solid Wasteand Emergency Response(OS~230)
PB92-963304EPN540/8-91/069November 1991
PB9296330411/11111111111111 11111111111111
&EPA SUPERFUND
NationalResults
ORDERING INFORMATION
The public may order additional copies of this document from:
National Technical Information Service (NTIS)U.S. Department of Commerce5285 Port Royal RoadSpringfield, VA 22161(703) 487-4600 or (800) 336-4700
This document is one in a series that includes the following documents:
NPL Characterization Project: National ResultsNPL Characterization Project: Region 1 ResultsNPL Characterization Project: Region 2 ResultsNPL Characterization Project: Region 3 ResultsNPL Characterization Project: Region 4 ResultsNPL Characterization Project: Region 5 ResultsNPL Characterization Project: Region 6 ResultsNPL Characterization Project: Region 7 ResultsNPL Characterization Project: Region 8 ResultsNPL Characterization Project: Region 9 ResultsNPL Characterization Project: Region 10 Results
CERCUS Characterization Project: National ResultsCERCUS Characterization Project: Region 1 ResultsCERCUS Characterization Project: Region 2 ResultsCERCUS Characterization Project: Region 3 ResultsCERCUS Characterization Project: Region 4 ResultsCERCUS Characterization Project: Region 5 ResultsCERCUS Characterization Project: Region 6 ResultsCERCUS Characterization Project: Region 7 ResultsCERCUS Characterization Project: Region 8 ResultsCERCUS Characterization Project: Region 9 ResultsCERCUS Characterization Project: Region 10 Results
PB92-963304PB92-963305PB92-963306PB92-963307PB92-963308PB92-963309PB92-963310PB92-963311PB92-963312PB92-963313PB92-963314
PB92-963315PB92-963316PB92-963317PB92-963318PB92-963319PB92-963320PB92-963321PB92-963322PB92-963323PB92-963324PB92-963325

Publication 9345.1-09-0EPA/540/8-91/069
November 1991
SUPERFUND
NPL CHARACTERIZATION PROJECT:
NATIONAL RESULTS
Office of Emergency and Remedial ResponseU.S. Environmental Protection Agency
Washington, D.C. 20460
ACKNOWLEDGEMENTS
The design and management of these studies was carried out by Penelope Hansen andCaroline Previ of the Site Assessment Branch in the Hazardous Site Evaluation Division, Officeof Emergency and Remedial Response. Final publication of the documents was under thedirection of Suzanne Wells and Mary Latka. EPA also greatly appreciates the efforts of thenumerous people who collected, collated, and analyzed the data and helped finalize thedocuments for publication. In particular, EPA would like to recognize Nermin Ahmad, AI Canepa,Catherine Brock, Arthur Johnson, Jennifer Nauen, Amy Newell, Nikki Koch, James Skiridulis, andJoe Vescio, who were instrumental in helping to design the study, coordinate data collection, andanalyze the information. We are also grateful for the many hours of work put in by our regionalcontacts in their efforts to collect the actual data: Marcia Brooks, Diana Coker, Deb Duffy, JoanDupont, Debbie Flood, Angie Garcia, Bill Glasser, Pressley Hatcher, Joyce Harney, SharonHayes, Kerry Herndon, Brian Holloway, Paul LaCourreye, Steve Maybury, Bill Messenger, CarlRodzewick, Bill Schaeffer, Dave Schaller, Betsy Shaver, John Toten, Steve Vaughn, and MurrayWarner. Finally, we would like to recognize Baxter Jones, Nancy O'Connor, and Brian Steglitz,who helped prepare the documents for publication.
ii
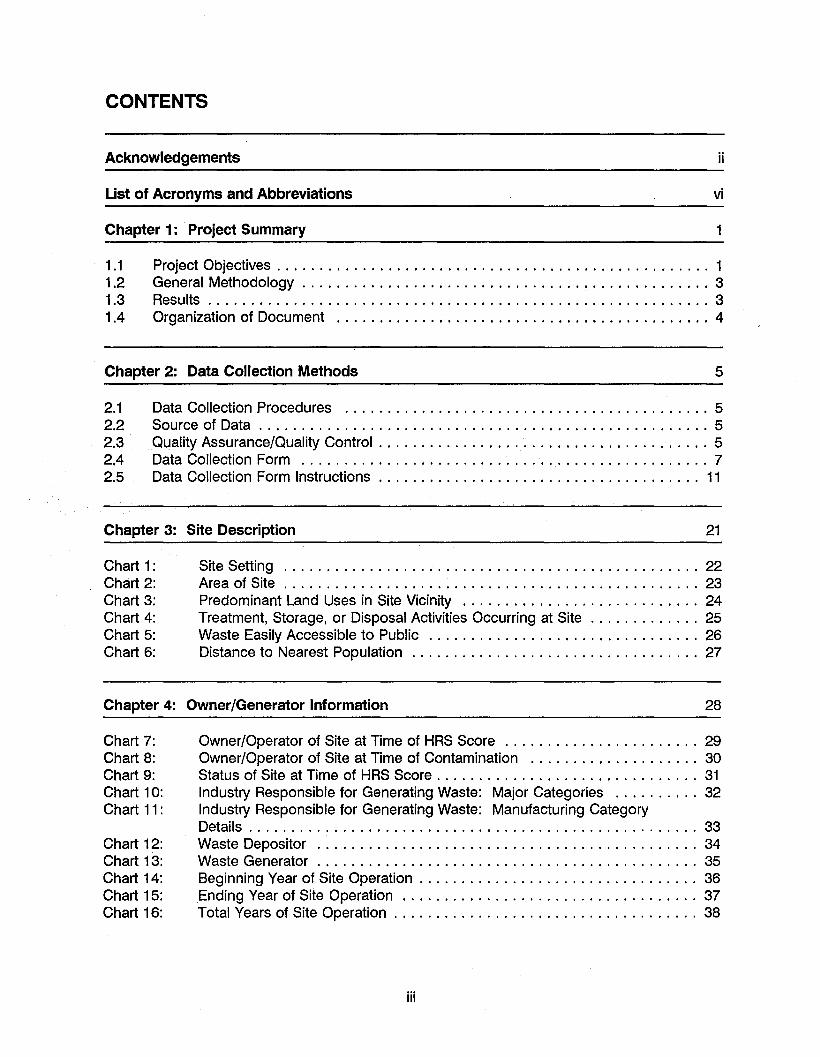
CONTENTS
Acknowledgements
List of Acronyms and Abbreviations
Chapter 1: Project Summary
ii
vi
1
1.1 Project Objectives . . . . . . . . . . . . . . . . . . . . . . . . . . . . . . . . . . . . . . . . . . . . . . . . . . . 11.2 General Methodology . . . . . . . . . . . . . . . . . . . . . . . . . . . . . . . . . . . . . . . . . . . . . . . . 31.3 Results. . . . . . . . . . . . . . . . . . . . . . . . . . . . . . . . . . . . . . . . . . . . . . . . . . . . . . . . . . . 31.4 Organization of Document 4
Chapter 2: Data Collection Methods 5
2.1 Data Collection Procedures 52.2 Source of Data . . . . . . . . . . . . . . . . . . . . . . . . . . . . . . . . . . . . . . . . . . . . . . . . . . . . . 52.3 Quality Assurance/Quality Control . . . . . . . . . . . . . . . . . . . . . . . . . . . . . . . . . . . . . . . 52.4 Data Collection Form 72.5 Data Collection Form Instructions . . . . . . . . . . . . . . . . . . . . . . . . . . . . . . . . . . . . . . 11
Chapter 3: Site Description 21
Chart 1:Chart 2:Chart 3:Chart 4:Chart 5:Chart 6:
Site Setting 22Area of Site . . . . . . . . . . . . . . . . . . . . . . . . . . . . . . . . . . . . . . . . . . . . . . . . . 23Predominant Land Uses in Site Vicinity 24Treatment, Storage, or Disposal Activities Occurring at Site . . . . . . . . 25Waste Easily Accessible to Public 26Distance to Nearest Population . . . 27
Chapter 4: Owner/Generator Information 28
Chart 7:Chart 8:Chart 9:Chart 10:Chart 11:
Chart 12:Chart 13:Chart 14:Chart 15:Chart 16:
Owner/Operator of Site at Time of HRS Score 29Owner/Operator of Site at Time of Contamination 30Status of Site at Time of HRS Score 31Industry Responsible for Generating Waste: Major Categories 32Industry Responsible for Generating Waste: Manufacturing CategoryDetails 33Waste Depositor 34Waste Generator . . . . . . . . . . . . . . . . . . . . . . . . . . . . . . . . . . . . . . . . . . . . . 35Beginning Year of Site Operation 36Ending Year of Site Operation 37Total Years of Site Operation 38
iii
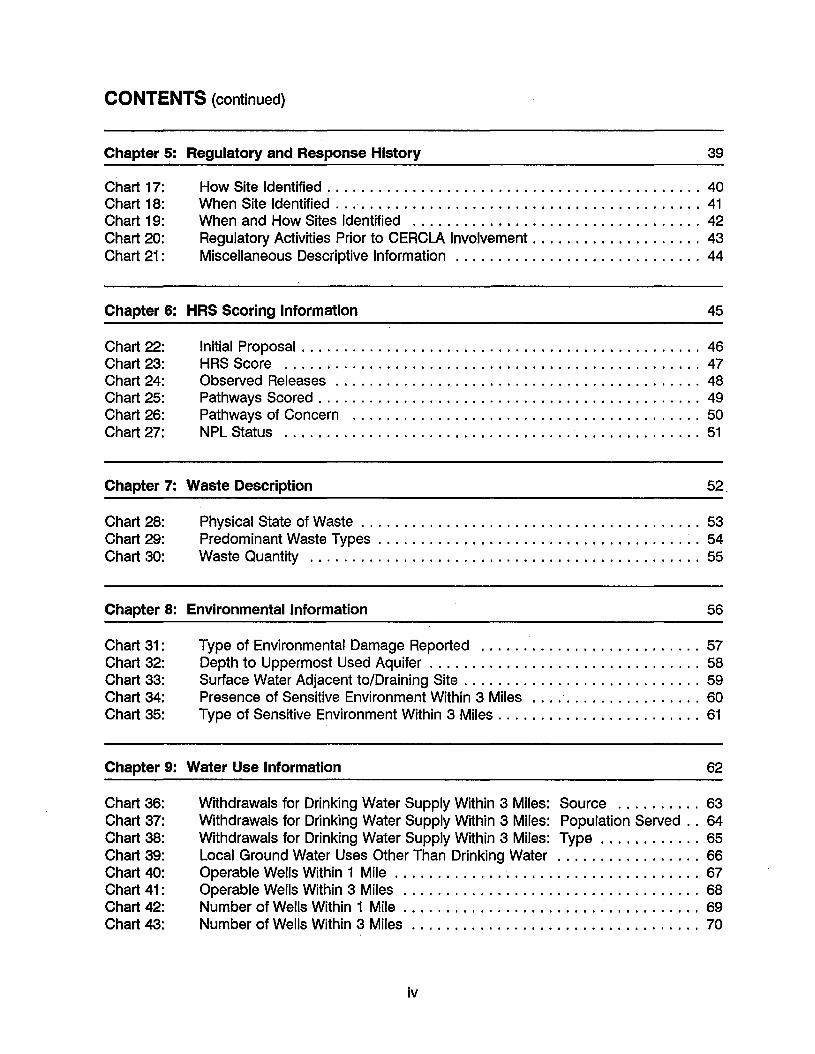
CONTENTS (continued)
Chapter 5: Regulatory and Response History 39
Chart 17:Chart 18:Chart 19:Chart 20:Chart 21:
How Site Identified . . . . . . . . . . . . . . . . . . . . . . . . . . . . . . . . . . . . . . . . . . . . 40When Site Identified 41When and How Sites Identified 42Regulatory Activities Prior to CERCLA Involvement. . . . . . . . . . . . . . . . . . . . 43Miscellaneous Descriptive Information 44
Chapter 6: HRS Scoring Information 45
Chart 22:Chart 23:Chart 24:Chart 25:Chart 26:Chart 27:
Initial Proposal . . . . . . . . . . . . . . . . . . . . . . . . . . . . . . . . . . . . . . . . . . . . . . . 46HRS Score 47Observed Releases 48Pathways Scored . . . . . . . . . . . . . . . . . . . . . . . . . . . . . . . . . . . . . . . . . . . . . 49Pathways of Concern 50NPL Status 51
Chapter 7: Waste Description 52.
Chart 28:Chart 29:Chart 30:
Physical State of Waste . . . . . . . . . . . . . . . . . . . . . . . . . . . . . . . . . . . . . . . . 53Predominant Waste Types . . . . . . . . . . . . . . . . . . . . . . . . . . . . . . . . . . . . . . 54Waste Quantity 55
Chapter 8: Environmental Information 56
Chart 31:Chart 32:Chart 33:Chart 34:Chart 35:
Type of Environmental Damage Reported 57Depth to Uppermost Used Aquifer . . . . . . . . . . . . . . . . . . . . . . . . . . . . . . . . 58Surface Water Adjacent to/Draining Site . . . . . . . . . . . . . . . . . . . . . . . . . . . . 59Presence of Sensitive Environment Within 3 Miles 60Type of Sensitive Environment Within 3 Miles. . . . . . . . . . . . . . . . . . . . . . . . 61
Chapter 9: Water Use Information 62
Chart 36:Chart 37:Chart 38:Chart 39:Chart 40:Chart 41:Chart 42:Chart 43:
Withdrawals for Drinking Water Supply Within 3 Miles: Source 63Withdrawals for Drinking Water Supply Within 3 Miles: PopUlation Served .. 64Withdrawals for Drinking Water Supply Within 3 Miles: Type . . . . . . . . . . . . 65Local Ground Water Uses Other Than Drinking Water 66Operable Wells Within 1 Mile . . . . . . . . . . . . . . . . . . . . . . . . . . . . . . . . . . . . 67Operable Wells Within 3 Miles 68Number of Wells Within 1 Mile . . . . . . . . . . . . . . . . . . . . . . . . . . . . . . . . . . . 69Number of Wells Within 3 Miles . . . . . . . . . . . . . . . . . . . . . . . . . . 70
iv
CONTENTS (continued)
Chart 44:Chart 45:Chart 46:
Appendices
Distance to Nearest Well 71Local Surface Water Uses Other Than Drinking Water 72Distance to Nearest Downstream Intake . . . . . . . . . . . . . . . . . . . . . . . . . . . . 73
74
Appendix A: Responses from "Other" Category 74
Appendix B: Sites Reviewed 79
Appendix C: National and Regional NPL Maps 97
v
LIST OF ACRONYMS AND ABBREVIATIONS
ATSOR
CERCLA
CERCUSDODDOE (USDOE)001 (USDOI)DOT (USOOT)OWEPAERRIS
FRFSGWHRSNFRAPNPDES
NPLPAPCBPCPPOTWQNQCRARCRA
RDRIRODSARA
SBA (USSBA)SISW
Agency for Toxic Substances andDisease RegistryComprehensive EnvironmentalResponse, Compensation, andLiability ActCERCLA Information SystemDepartment of DefenseDepartment of EnergyDepartment of the InteriorDepartment of TransportationDrinking WaterEnvironmental Protection AgencyEmergency and Remedial ResponseInformation SystemFederal RegisterFeasibility StudyGround WaterHazard Ranking SystemNo Further Remedial Action PlannedNational Pollutant DischargeElimination SystemNational Priorities ListPreliminary AssessmentPolychlorinated BiphenylPentachlorophenolPublicly Owned Treatment WorksQuality Assurance/Quality ControlRemedial ActionResource Conservation andRecovery ActRemedial DesignRemedial InvestigationRecord of DecisionSuperfund Amendments andReauthorization ActSmall Business AdministrationSite InspectionSurface Water
vi
CHAPTER 1: PROJECT SUMMARY
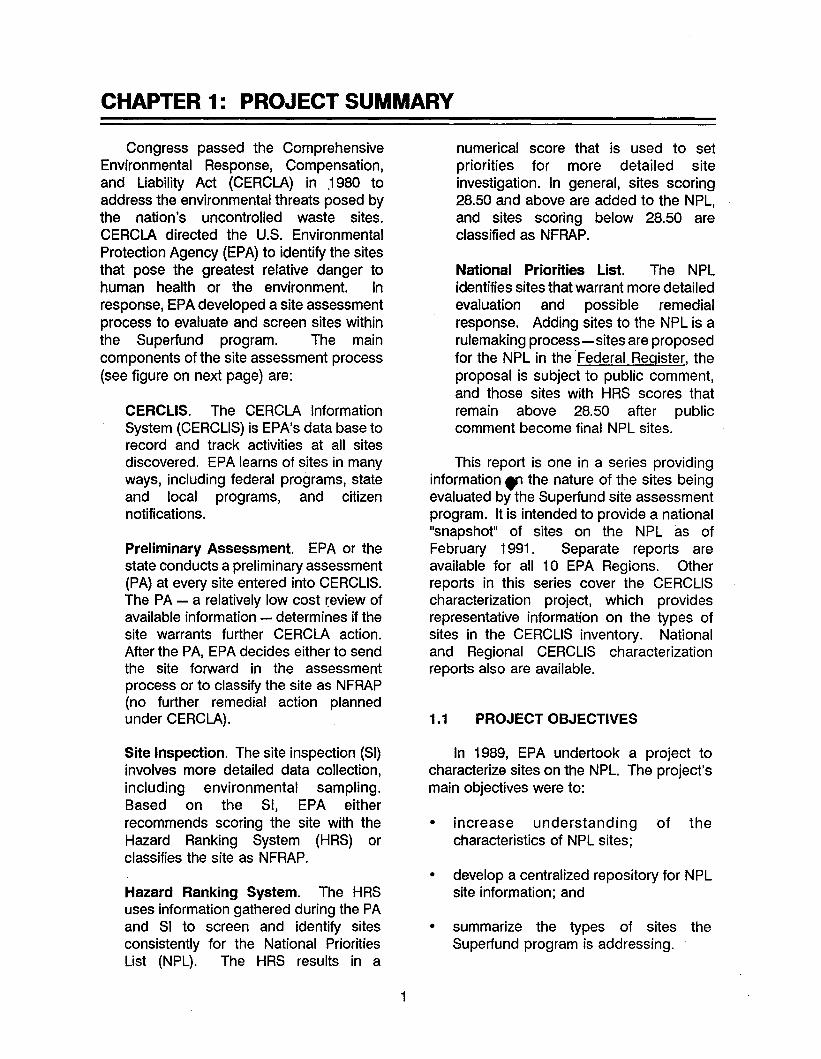
Congress passed the ComprehensiveEnvironmental Response, Compensation,and Liability Act (CERCLA) in .1980 toaddress the environmental threats posed bythe nation's uncontrolled waste sites.CERCLA directed the U.S. EnvironmentalProtection Agency (EPA) to identify the sitesthat pose the greatest relative danger tohuman health or the environment. Inresponse, EPA developed a site assessmentprocess to evaluate and screen sites withinthe Superfund program. The maincomponents of the site assessment process(see figure on next page) are:
CERCUS. The CERCLA InformationSystem (CERCUS) is EPA's data base torecord and track activities at all sitesdiscovered. EPA learns of sites in manyways, including federal programs, stateand local programs, and citizennotifications.
Preliminary Assessment. EPA or thestate conducts a preliminary assessment(PA) at every site entered into CERCUS.The PA - a relatively low cost review ofavailable information - determines if thesite warrants further CERCLA action.After the PA, EPA decides either to sendthe site forward in the assessmentprocess or to classify the site as NFRAP(no further remedial action plannedunder CERCLA).
numerical score that is used to setpriorities for more detailed siteinvestigation. In general, sites scoring28.50 and above are added to the NPL,and sites scoring below 28.50 areclassified as NFRAP.
National Priorities List. The NPLidentifies sites that warrant more detailedevaluation and possible remedialresponse. Adding sites to the NPL is arulemaking process - sites are proposedfor the NPL in the Federal Register, theproposal is subject to public comment,and those sites with HRS scores thatremain above 28.50 after publiccomment become final NPL sites.
This report is one in a series providinginformation., the nature of the sites beingevaluated by the Superfund site assessmentprogram. It is intended to provide a national"snapshot" of sites on the NPL as ofFebruary 1991 . Separate reports areavailable for all 10 EPA Regions. Otherreports in this series cover the CERCUScharacterization project, which providesrepresentative information on the types ofsites in the CERCUS inventory. Nationaland Regional CERCUS characterizationreports also are available.
1.1 PROJECT OBJECTIVES
• increase understanding of thecharacteristics of NPL sites;
In 1989, EPA undertook a project tocharacterize sites on the NPL. The project'smain objectives were to:
Site Inspection. The site inspection (SI)involves more detailed data collection,including environmental sampling.Based on the SI, EPA eitherrecommends scoring the site with theHazard Ranking System (HRS) orclassifies the site as NFRAP.
Hazard Ranking System. The HRSuses information gathered during the PAand SI to screen and identify sitesconsistently for the National PrioritiesList (NPL). The HRS results in a
1
•
•
develop a centralized repository for NPLsite information; and
summarize the types of sites theSuperfund program is addressing.
SUPERFUND PROCESS
Site Assessment Phase
Preliminary Site Hazard National
Discovery ~ CERCUS .. Assessment ~ Inspection .. Ranking~
PrioritiesSystem List(PA) (SI)(HRS) (NPL)
+ + +NFRAP (Information Provided to States
& Other Regulatory Authorities)
Removal Actions May Occur at Any Stage
Remedial Phase
~I
NationalRemedial
RecordRemedial Operation
PrioritiesInvestigation/
ofDesign/ and
Deletion
List ~ Feasibility ~ Decision • Remedial ~ Maintenance • of Site
(NPL)Study
(ROD)Action
(O&M)From NPL
(RI/FS) (RD/RA)
11OlIII4.---1 Removal Actions May Occur at Any Stage I----I~.I
2
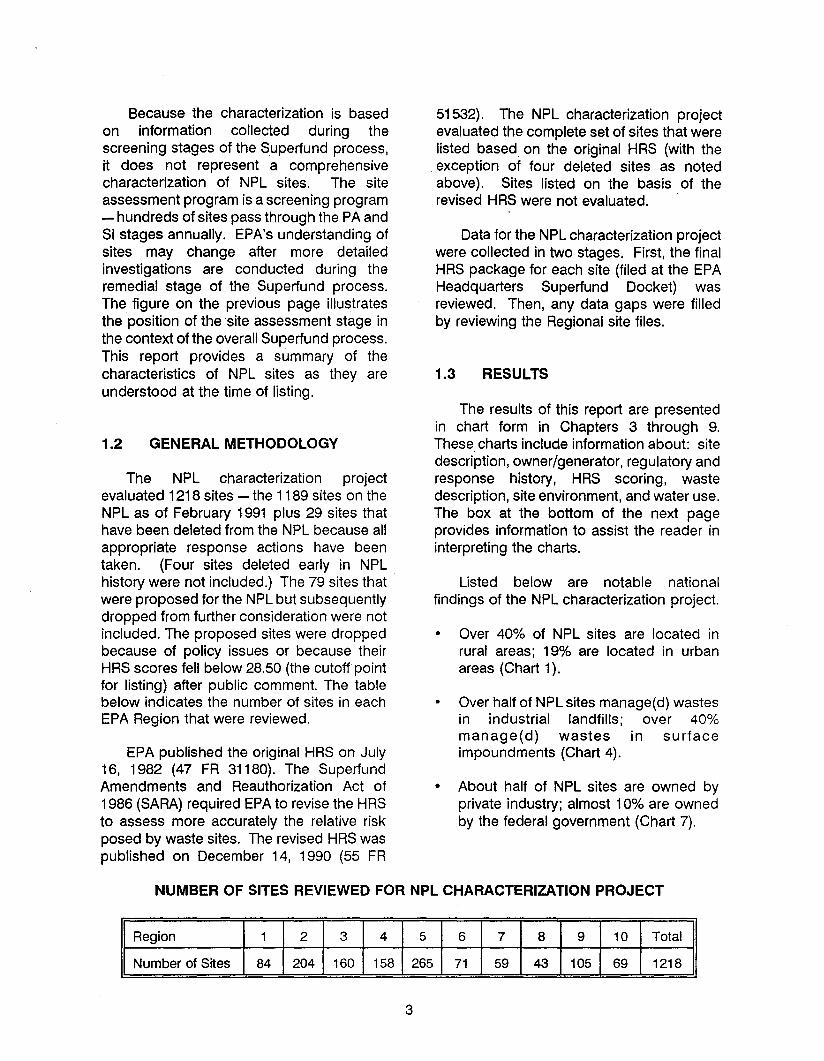
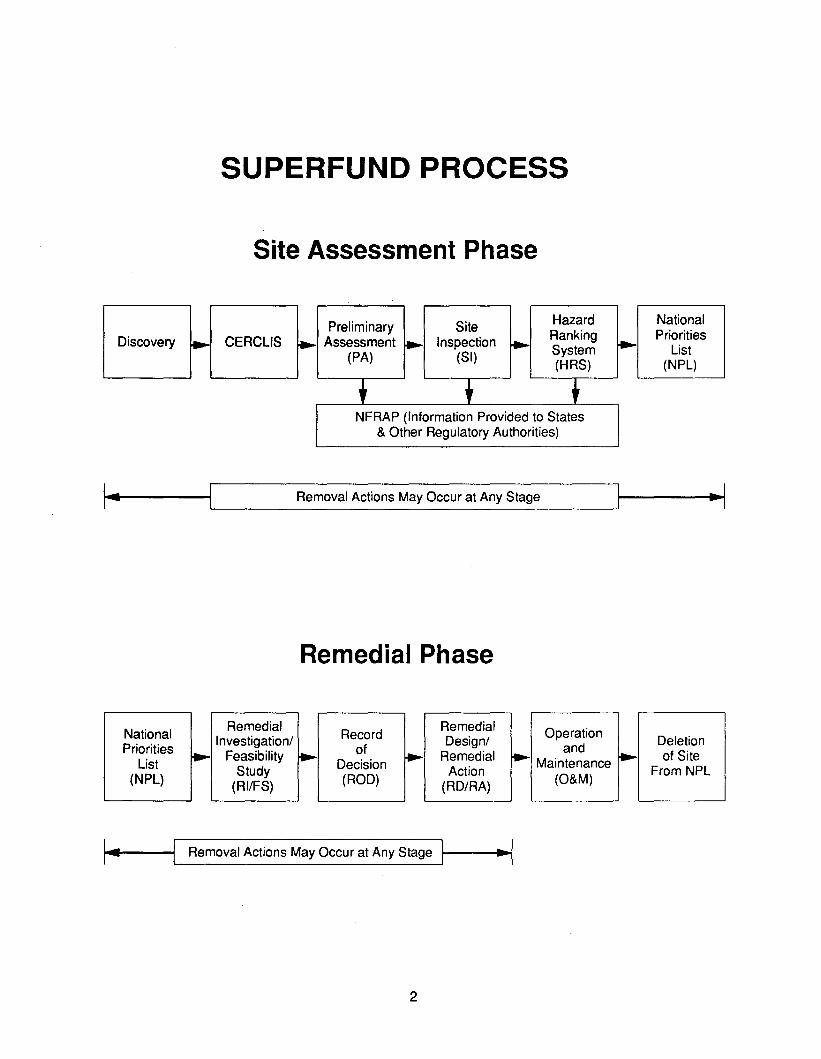
Because the characterization is basedon information collected during thescreening stages of the Superfund process,it does not represent a comprehensivecharacterization of NPL sites. The siteassessment program is a screening program- hundreds of sites pass through the PA andSI stages annually. EPA's understanding ofsites may change after more detailedinvestigations are conducted during theremedial stage of the Superfund process.The figure on the previous page illustratesthe position of the site assessment stage inthe context of the overall Superfund process.This report provides a summary of thecharacteristics of NPL sites as they areunderstood at the time of listing.
1.2 GENERAL METHODOLOGY
The NPL characterization projectevaluated 1218 sites - the 1189 sites on theNPL as of February 1991 pius 29 sites thathave been deleted from the NPL because allappropriate response actions have beentaken. (Four sites deleted early in NPLhistory were not included.) The 79 sites thatwere proposed for the NPL but subsequentlydropped from further consideration were notincluded. The proposed sites were droppedbecause of policy issues or because theirHRS scores fell below 28.50 (the cutoff pointfor listing) after public comment. The tablebelow indicates the number of sites in eachEPA Region that were reviewed.
EPA published the original HRS on July16, 1982 (47 FR 31180). The SuperfundAmendments and Reauthorization Act of1986 (SARA) required EPA to revise the HRSto assess more accurately the relative riskposed by waste sites. The revised HRS waspublished on December 14, 1990 (55 FR
51532). The NPL characterization projectevaluated the complete set of sites that werelisted based. on the original HRS (with theexception of four deleted sites as notedabove). Sites listed on the basis of therevised HRS were not evaluated.
Data for the NPL characterization projectwere collected in two stages. First, the finalHRS package for each site (filed at the EPAHeadquarters Superfund Docket) wasreviewed. Then, any data gaps were filledby reviewing the Regional site files.
1.3 RESULTS
The results of this report are presentedin chart form in Chapters 3 through 9.These charts include information about: sitedescription, owner/generator, regulatory andresponse history, HRS scoring, wastedescription, site environment, and water use.The box at the bottom of the next pageprovides information to assist the reader ininterpreting the charts.
Listed below are notable nationalfindings of the NPL characterization project.
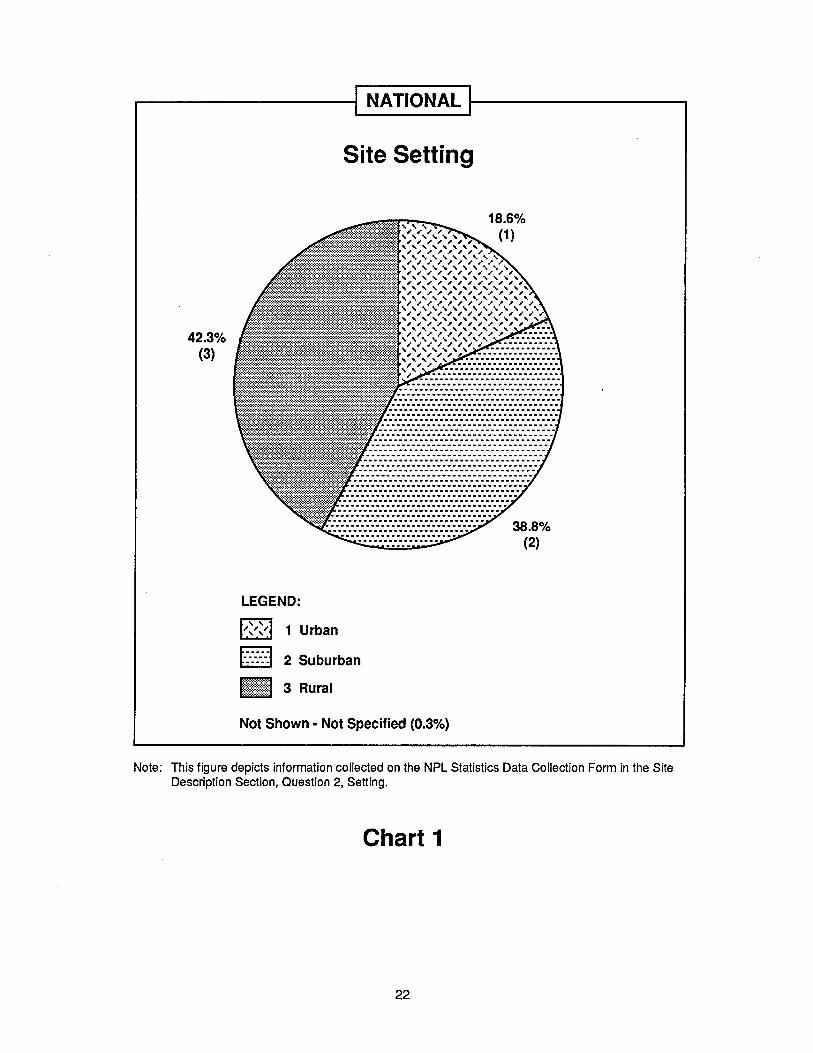
• Over 40% of NPL sites are located inrural areas; 19% are located in urbanareas (Chart 1).
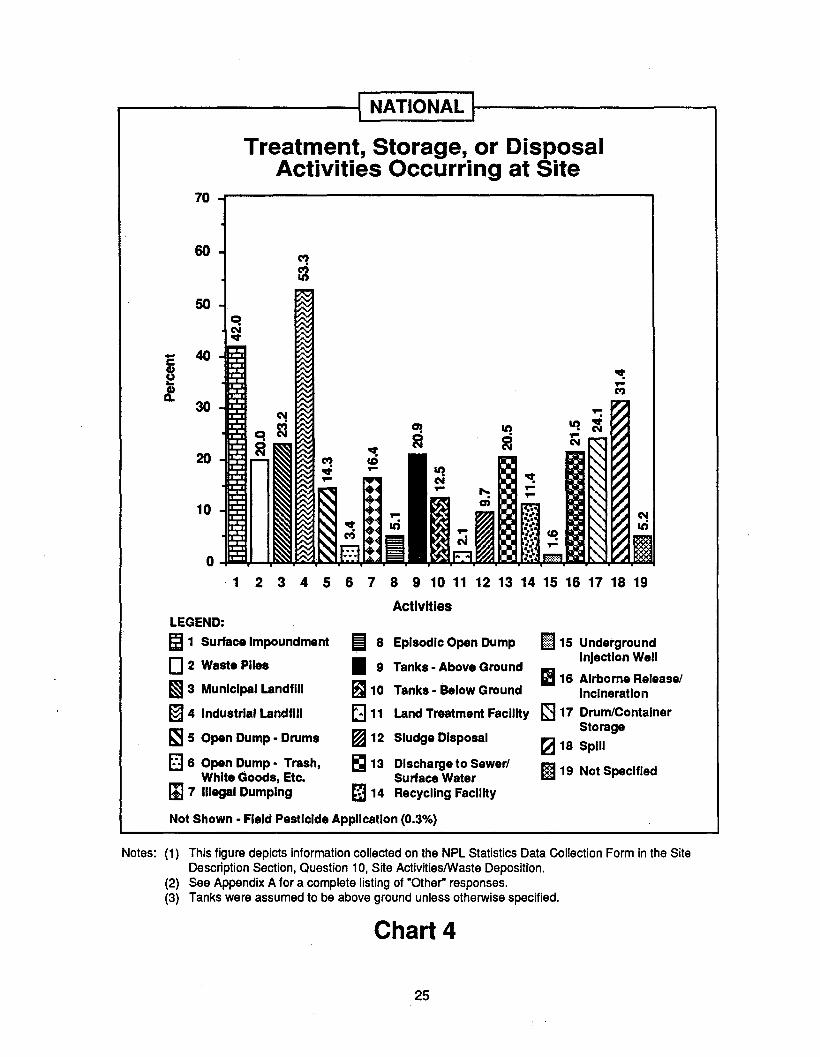
• Over half of NPL sites manage(d) wastesin industrial landfills; over 40%manage(d) wastes in surfaceimpoundments (Chart 4).
• About half of NPL sites are owned byprivate industry; almost 10% are ownedby the federal government (Chart 7).
NUMBER OF SITES REVIEWED FOR NPL CHARACTERIZATION PROJECT
Region 1 2 3 4 5 6 7 8 9 10 Total
Number of Sites 84 204 160 158 265 71 59 43 105 69 1218
3
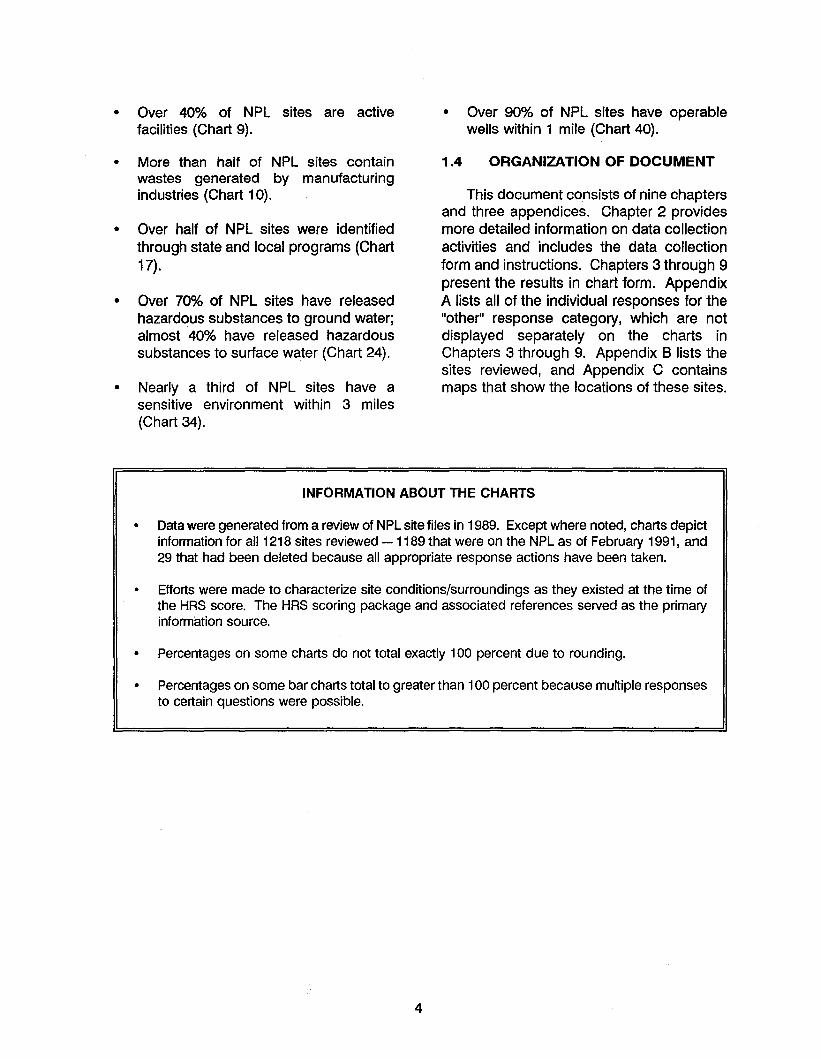
• Over 40% of NPL sites are activefacilities (Chart 9).
• More than half of NPL sites containwastes generated by manufacturingindustries (Chart 10).
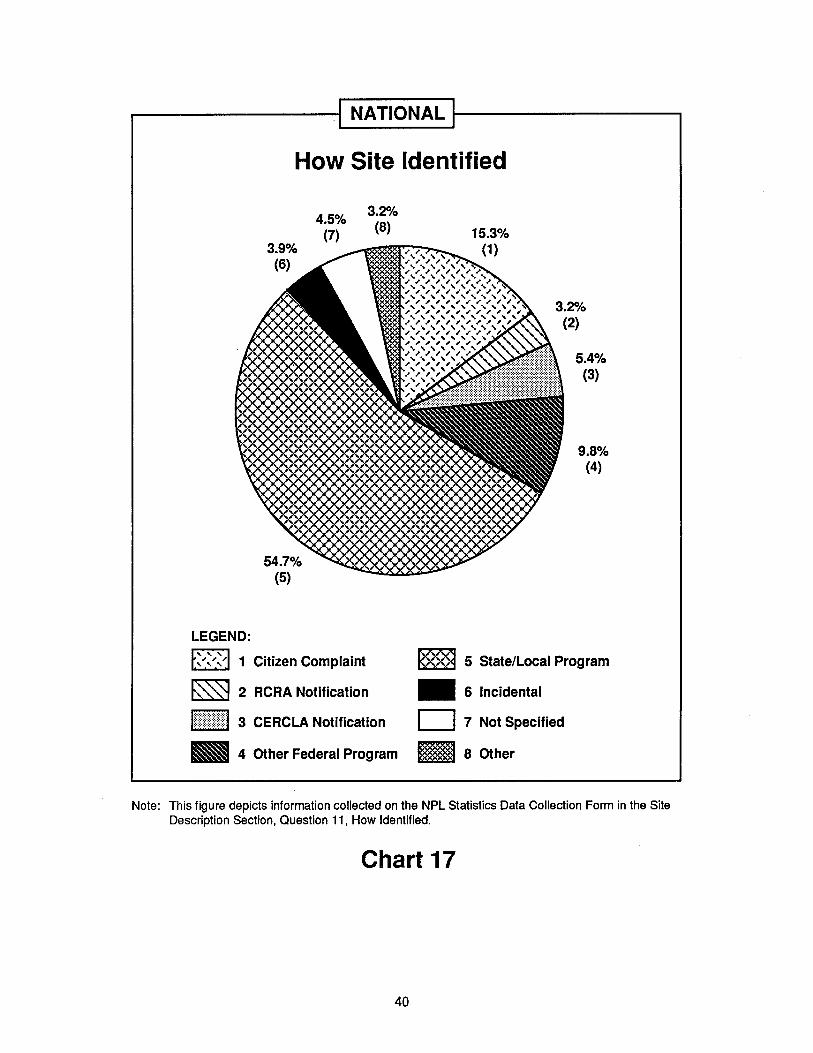
• Over half of NPL sites were identifiedthrough state and local programs (Chart17).
• Over 70% of NPL sites have releasedhazardous substances to ground water;almost 40% have released hazardoussubstances to surface water (Chart 24).
• Nearly a third of NPL sites have asensitive environment within 3 miles(Chart 34).
• Over 90% of NPL sites have operablewells within 1 mile (Chart 40).
1.4 ORGANIZATION OF DOCUMENT
This document consists of nine chaptersand three appendices. Chapter 2 providesmore detailed information on data collectionactivities and includes the data collectionform and instructions. Chapters 3 through 9present the results in chart form. AppendixA lists all of the individual responses for the"other" response category, which are notdisplayed separately on the charts inChapters 3 through 9. Appendix B lists thesites reviewed, and Appendix C containsmaps that show the locations of these sites.
INFORMATION ABOUT THE CHARTS
• Data were generated from a review of NPL site files in 1989. Except where noted, charts depictinformation for all 1218 sites reviewed - 1189 that were on the NPL as of February 1991, and29 that had been deleted because all appropriate response actions have been taken.
• Efforts were made to characterize site conditions/surroundings as they existed at the time ofthe HRS score. The HRS scoring package and associated references served as the primaryinformation source.
• Percentages on some charts do not total exactly 100 percent due to rounding.
• Percentages on some bar charts total to greater than 100 percent because multiple responsesto certain questions were possible.
4
CHAPTER 2: DATA COLLECTION METHODS
Before the NPL characterization project,information on NPL sites was available inindividual site files at EPA Headquarters andRegional offices. The project compiled andcentralized site-specific information on thecharacteristics of NPL sites. This chapterdescribes the data collection activities. Thetable on the next page summarizes theprocess used to collect data.
2.1 DATA COLLECTIONPROCEDURES
After developing the overall approach tothe NPL characterization project, EPAprepared a data collection form (see Section2.4). The design of the form was based inpart on the form used for the CERCUScharacterization project, an earliercompanion project. A few new questionswere added and some existing questionswere modified to capture information morepertinent Jo a study of NPL sites. Aninstruction manual (see Section 2.5) wasdeveloped to promote consistency andaccuracy in data collection. The datacollection form and instruction manualshould be consulted for a full explanation ofthe definitions used in the report. Datacollection procedures were tested on Region10 sites. As a result, a few modificationswere made to the data collection form. Themodified form, as shown in Section 2.4, wasused in the other nine Regions.
2.2 SOURCE OF DATA
Most of the questions on the datacollection form could be answered in the first
5
stage of the data collection process byreviewing HRS scoring packages at theHeadquarters Superfund Docket. Thesecond stage involved filling in data gaps atthe EPA Regional offices. Informationreviewed included HRS scoring packagereference documents such as Sl reports, PAreports, maps, and records of telephonecontacts. After data for all Regions werecollected and verified, the project teamcompiled one national data base. The database was then analyzed to calculateresponse frequencies for each of the datafields.
2.3 QUALITY ASSURANCE/QUALITY CONTROL
The first level of quality assurance/qualitycontrol (QNQC), conducted at the Regionaloffice, involved comparing the informationcollected at EPA Headquarters with theinformation available in the Regions and,where necessary, resolving differences.After information on the data collection formswas entered into the data base, the database was reviewed to ensure that theinformation had been properly transferred.A second level QNQC involved reviewingthe data base for completeness,consistency, and accuracy. In addition, thegraphics produced for this and all otherreports were checked for consistency withthe data base.
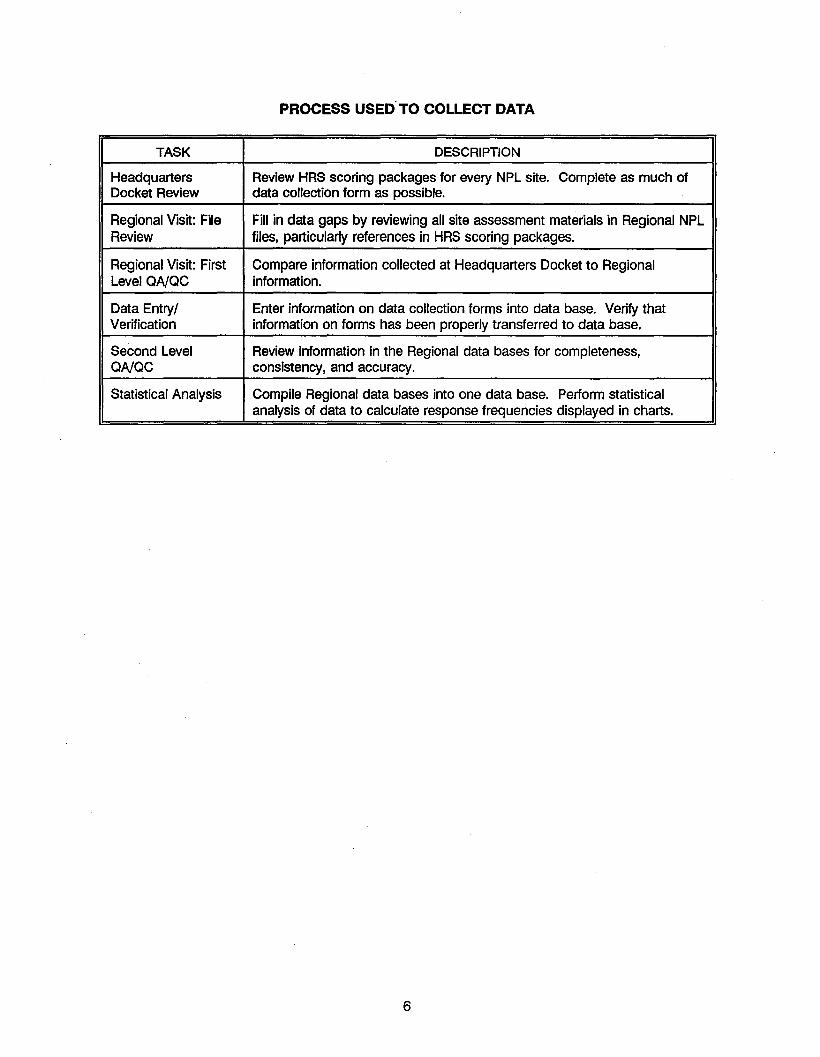
PROCESS USED· TO COLLECT DATA
TASK DESCRIPTION
Headquarters Review HRS scoring packages for every NPL site. Complete as much ofDocket Review data collection form as possible.
Regional Visit: File Fill in data gaps by reviewing all site assessment materials in Regional NPLReview files, particularly references in HRS scoring packages.
Regional Visit: First Compare information collected at Headquarters Docket to RegionalLevel QNQC information.
Data Entry/ Enter information on data collection forms into data base. Verify thatVerification information on forms has been properly transferred to data base.
Second Level Review information in the Regional data bases for completeness,QNQC consistency, and accuracy.
Statistical Analysis Compile Regional data bases into one data base. Perform statisticalanalysis of data to calculate response frequencies displayed in charts.
6
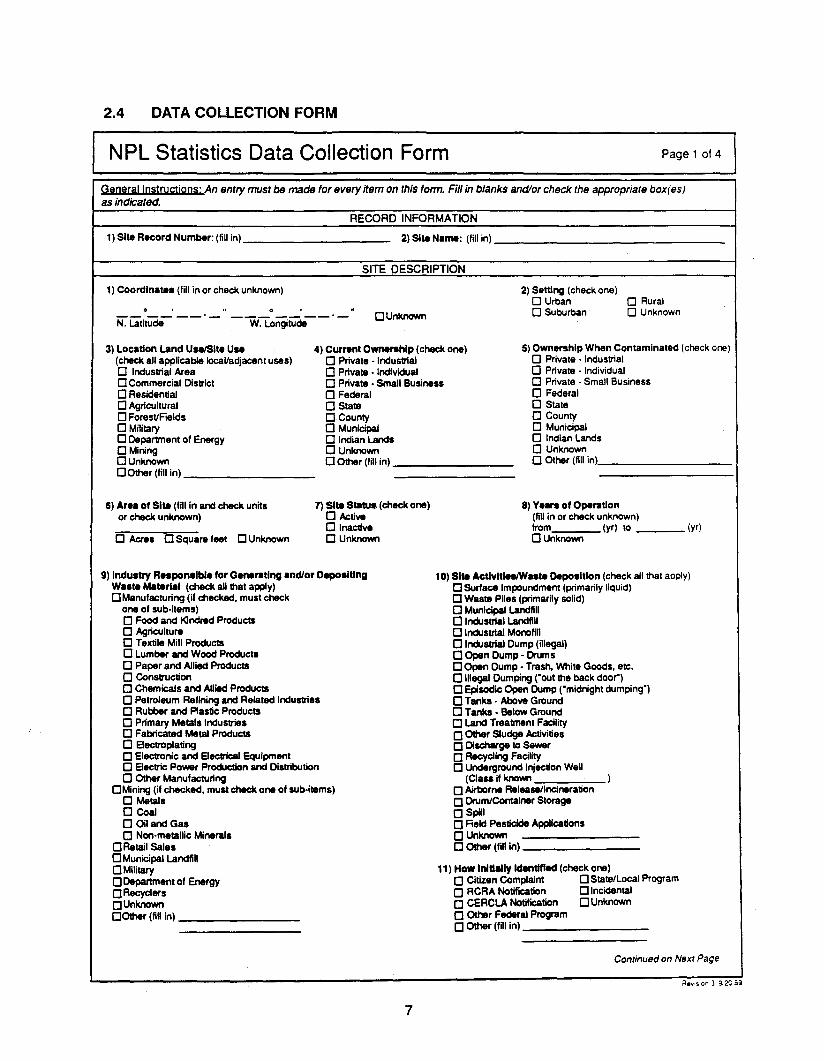
2.4 DATA COLLECTION FORM
NPL Statistics Data Collection Form Page 1 of 4
Geoerallostruetjoos; An entry must be made for every item on this form. Fill in blanks and/or check the appropriate box(es)as indicated.
RECORD INFORMATION
1) Site Record Number: (fill in) _ 2) Site Na.".; (fill in) _
SITE DESCRIPTION
1) Coordinates (fill in or check unknown)
oUnknown
2) Setting (check one)o Urbano Suburban
o Ruralo Unknown
5) Ownership When Contaminated (check one)o Private· Industrialo Prival8 • Individualo Private - Small Businesso Federalo Stateo Countyo Municipalo Indian Landso Unknowno Other (fill in) _
4) Current Ownership (check one)o Private· Industrialo Prival8 • Individualo Private· Small Businesso Federalo Stal8o Countyo Municipalo Indian Landso Unknowno Other (fill in) _
3) Location Land UselSlte U..(check all applicable local/adjacent uses)o Industrial AreaoCommercial Districto Residentialo Agriculturalo Forest/Fieldso Militaryo Department of Energyo Miningo UnknownOOther{fillin) _
6) Area of Site (fill In and check unitsor check unknown)
o Acres 0 Square feet 0 Unknown
7) SIte Status (cheek one)o Activeo lnaellveo Unknown
8) Ve.s of Operation(fill in or check unknown)from . (yr) to (yr)
o Unknown
9) Industry Responsible for Generating andior DeposItingWaste Material (check aU that apply)oManufacturing (if cheeked. must cheek
one of SUb-items)o Food and Klndred Productso Agricultureo Textile Mill Productso Lumber and Wood Productso Paper and Allied Productso Constructiono Chemicals and Allied Productso Petroleum Refining and Related Industrieso Rubber and Plastic Productso Primary Metals Industrieso Fabricated Metal Productso Electroplatingo Electronic and E1eetrica1 equipmento E1eclJie Power Production and Distributiono Other Manufacturing
OMining (if cheeked, must cheek one of sub-ll8ms)o Metalso Coalo Oil and Gaso Non-metallic Minerals
oRetail salesOMunieipal LandfilloMilitaryoDepartment of EnergyoReeyclersoUnknownOOther (fill in) _
10) Site ActlvltlnIWaste Deposition (cheek all that apply)o Surface Impoundment (primarily liqUid)o Wastlt Piles (primarily solid)o Municipal Landfillo Industrial Landfillo Industrial Monofillo Industrial Dump (illagal)o Open Dump - DrumsoOpen Dump - Trash, White Goods, etc.o Illegal Dumping (·out the back door")o Episodic Open Dump (·midnight dumping·)a Tanks - Above Groundo Tanks· Below Groundo Land Treatment Facilityo Other Sludge ActivitiesODiseharge to Sewero Recycling Facilityo Underground Injection Well
(Class if known )o Airborne Release/Incinerationo Drum/Container Storageo Spillo Field Pesticide Applicationso Unknowno Other (fHI in) _
11) How Initially identified (check one)o Citizen Complaint 0 Stal8/Local Programo RCRA Notification 0 Incidentalo CERCLA Notification 0 Unknowno Other Federal Programo Other (fill in) _
Continued on Next Page
7

NPL Statistics Data Collection FormSITE DESCRIPTION (CONTINUED)
Page 2 of 4
12) Material Deposited By (check one)o Present Owner 0 Present ando Former Owner Former OwnerDThird Party 0 UnknownDOther (fill in) _
13) Date Discovered(fill in or check unknown)__1__/ __ (mm/ddlyy)DUnknown
14) Material Source (check one)o Onsite Generatoro Offsite GeneratorDOnsite and Offsite GeneratorDUnknown
18) CERCLIS Number (fill in)
17) NPL StatusD Final D Proposed D Cleaned-up
15) Waste Easily Accessible(check one)D Ves D No D Unknown
19) HAS SCore (fill in)
16) FIrst PropoMd (check one)D Original List D Update 6D Update 1 D Update 7D Update 2 D Update 8D Update 3 D Update 9D Update 4 D Update 10o Update 5
20) Miscellaneous DescrlptlvelnformatJon (check all that apply)o Consists of Multiple Units 0 Other Emergency Action Has OccurredD Units Owned by Multiple Entities 0 NoneD Emergency Removal Has Occurred 0 Lead
WASTE DESCRIPTION
QuantitY/Units: (fill in one value for all solid wastesand check units or check unknown)D Unknown
o Organic Chemicalso Paints/Pigmentso PCBso PesticideS/Herbicideso Radioactive Wasteo Smelting WastesD Other (fill in) ~ _
QuantitY/Units: (fill in one value for all liquid wastesand check units or check unknown)o Unknown
o RadioactiveD SolventsoOther (fill in): _
1) Solid•• Waste Type: (check all that apply)o None
o Unknown
DAsbestosDCreosoteD Dioxins, PCPD Explosiveso Fly and Bottom Asho Inorganic ChemicalsD Laboratory/Hospital WastesD Metalso Mining Wasteso Municipal
2) Liquids· Wa.te Type: (check all that apply)o None
D Unknown
o AcidS/BasesD Inorganic Chemicalso Laboratory/Hospital Wasteso Metalso MunicipalD Oily Wasteso Organic ChemicalsD Paints/Pigmentso PCBso PesticideS/Herbicides
o Tonso Pounds
oQallons
o Cubic Yardso Cubic Feet
DOrums
D Tons 0 Cubic Vardsa Pounds D Cubic Feet
3) Siudg... Wa.te Type: (check au that apply)o None
o Unknown
o Inorganic Sludgeo Metal Sludgeo Municipalo Oily Wasteso Organic Sludgeo Painto POTW SlUdgeo RadioactiveoOther (fill in) _
QuantitY/Units: (fill in one value for all slUdges andcheck units or check unknown)o Unknown
Continued on Next Page
8
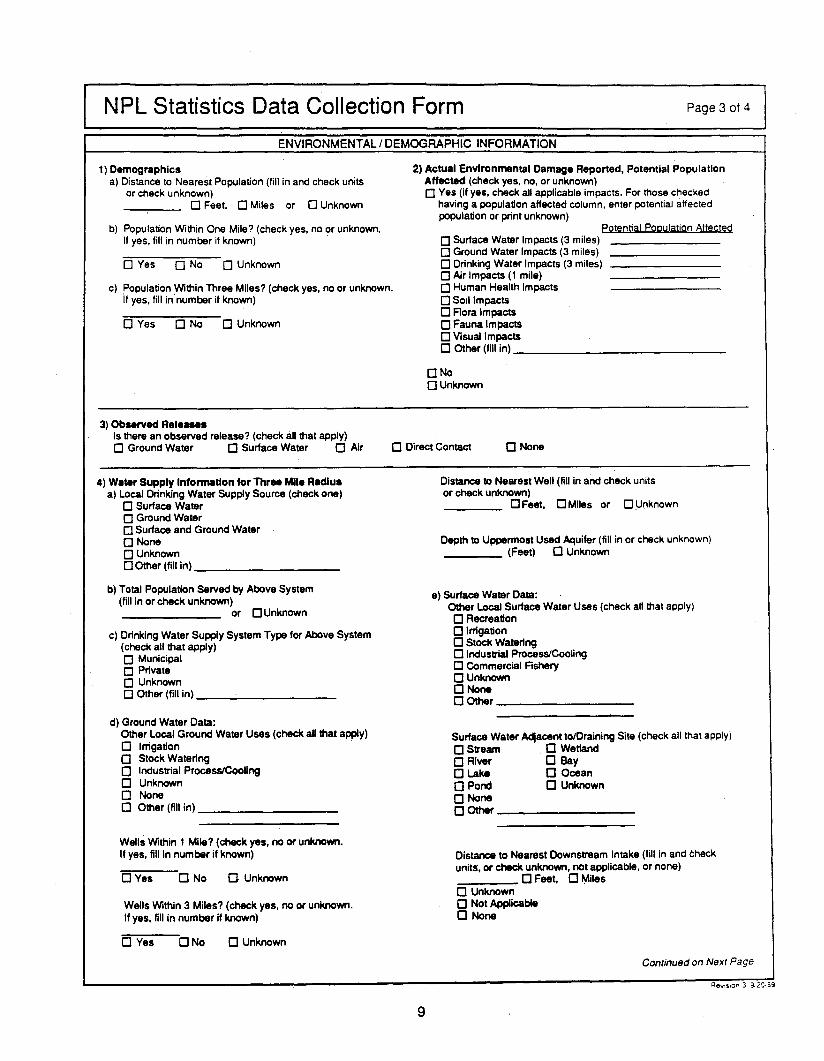
NPL Statistics Data Collection Form
ENVIRONMENTAL I DEMOGRAPHIC INFORMATION
Page 3 of 4
1) Demographicsa) Distance to Nearest Population (fill in and check units
or check unknown)o Feet. 0 Miles or 0 Unknown
b) Population Within One Mile? (check yes, no or unknown.If yes, fill in number if known) .
o Ves 0 No 0 Unknown
c) Population Within Three Miles? (check yes, no or unknown.If yes, fill in number if known)
o Ves 0 No 0 Unknown
2) Actual environmental Damage Reported, Potential PopulationAffected (check yes, no, or unknown)o Ves (if yes, check all applicable impacts. For those checked
haVing a population affected column, enter potential affectedpopulation or print unknown)
potential Population Affectedo Surface Water Impacts (3 miles)o Ground Water Impacts (3 miles)o Drinking Water Impacts (3 miles)o Air Impacts (1 mile)o Human Health Impactso Soil Impactso Flora Impactso Fauna Impactso Visual Impactso Other (fill in) _
ONoo Unknown
3) Observed Rele....Is there an observed release? (check all that apply)o Ground Water 0 Surface Water 0 Air o Direct Contact o None
4) Wa"" Supply Information for Three Mile Radlu.a) Local Drinking Water Supply Source (check one)
o Surface Watero Ground Watero Surface and Ground Watero Noneo UnknownoOther (fill in) _
b) Total Population served by Above System(fill in or check unknown)
or OUnknown
c) Drinking Water Supply System Type for Above System(check all that apply)o Municipalo Privateo Unknowno Other (fill in) __---: _
d) Ground Water Data:Other Local Ground Water Uses (check au that apply)o Irrigationo Stock Wateringo Industrial ProcessICooUngo Unknowno Noneo Other (fill in) _
Distance to Nearest Well (fill in and check unitsor check unknown)
oFeet, 0 Miles or 0 lJ!1known
Depth to Uppermost Used Aquifer (fill in or check unknown)____ (Feet) 0 Unknown
e) Surface Water Data:Other Local Surface Water Uses (check all that apply)o Recreationo Irrigationo Stock Wateringo Industrial Process/Coolingo Commercial Fisheryo Unknowno Noneo Other _
Surface Water Adjacent to/Draining Site (check all that apply)o Stream 0 Wetlando River 0 Bayo Lake 0 Oceano Pond 0 Unknowno Noneo Other _
Wells Within 1 Mile? (check yes, no or unknown.If yes, fill In number if known)
Wells Within 3 Miles? (check yes, no or unknown.If yes, fill in number if known)
OVes
o Yes
o No
ONo
o Unknown
o Unknown
Distance to Nearest Downstream Intake (fill in and theckunits, or check unknown, not applicable, or none)___--- 0 Feet, 0 Mileso Unknowna Not Applicableo None
Continued on Next Page
9
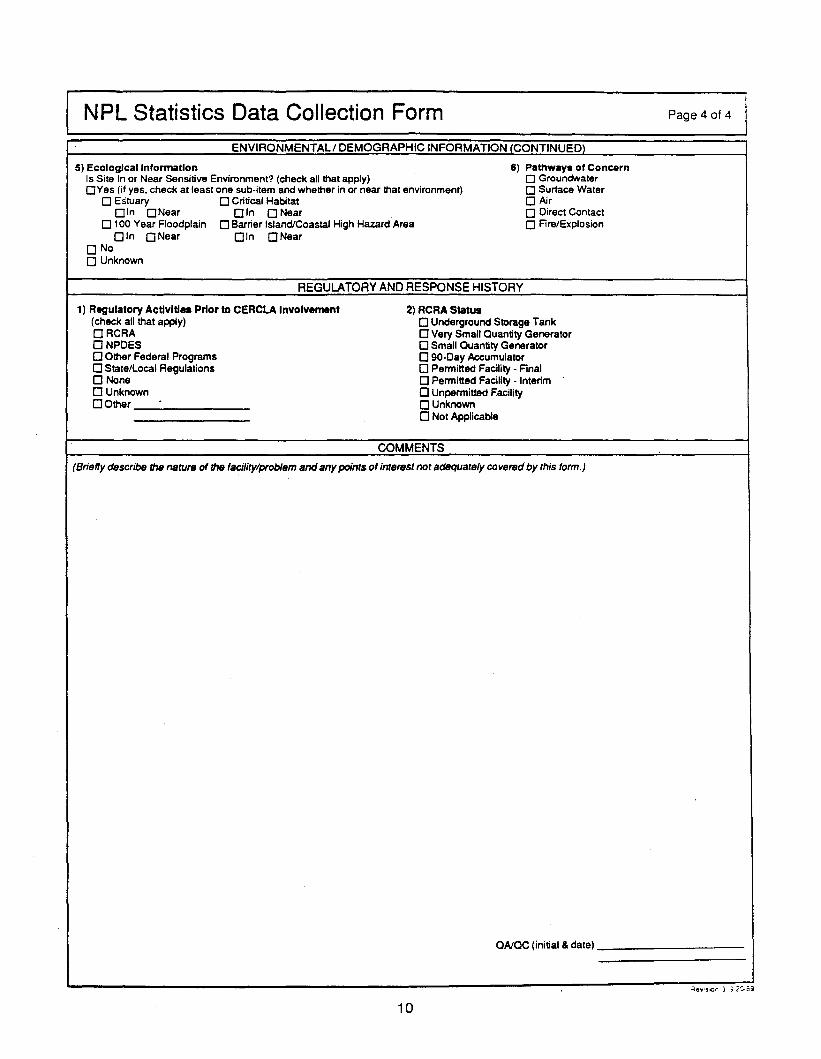
NPL Statistics Data Collection FormENVIRONMENTAL/ DEMOGRAPHIC INFORMATION (CONTINUED)
Page 4 of 4
5) Ecological InformationIs Site In or Near Sensitive Environment? (check all that apply)DYes (if yes. check at least one sub-item and whether in or near that environment)
D Estuary 0 Critical HabitatDin ONear 0 In 0 Near
0100 Year Floodplain 0 Barrier Island/Coastal High Hazard AreaDin o Near Din o Near
o Noo Unknown
6) Pathways of ConcernD Groundwatero Surface Watero Airo Direct Contacto Fire/Explosion
REGULATORY AND RESPONSE HISTORY
1) Regulatory Activities Prior to CERCLA Involvement(check all that apply)o RCRAo NPDESo Other Federal Programso State/Local Regulationso Noneo UnknownOOther _
2) RCRA Statuso Underground Storage Tanko Very Small Ouantity Generatoro Small Quantity Generatoro 90-Day Accumulatoro Permitted Facility. Finalo Permitted Facility· Interimo Unpermitted Facilityo Unknowno Not Applicable
COMMENTS
(Briefly describe the nature of the facility/problem andany points of interest not adequately covered by this form.)
OAtoe (initial & date) _
10
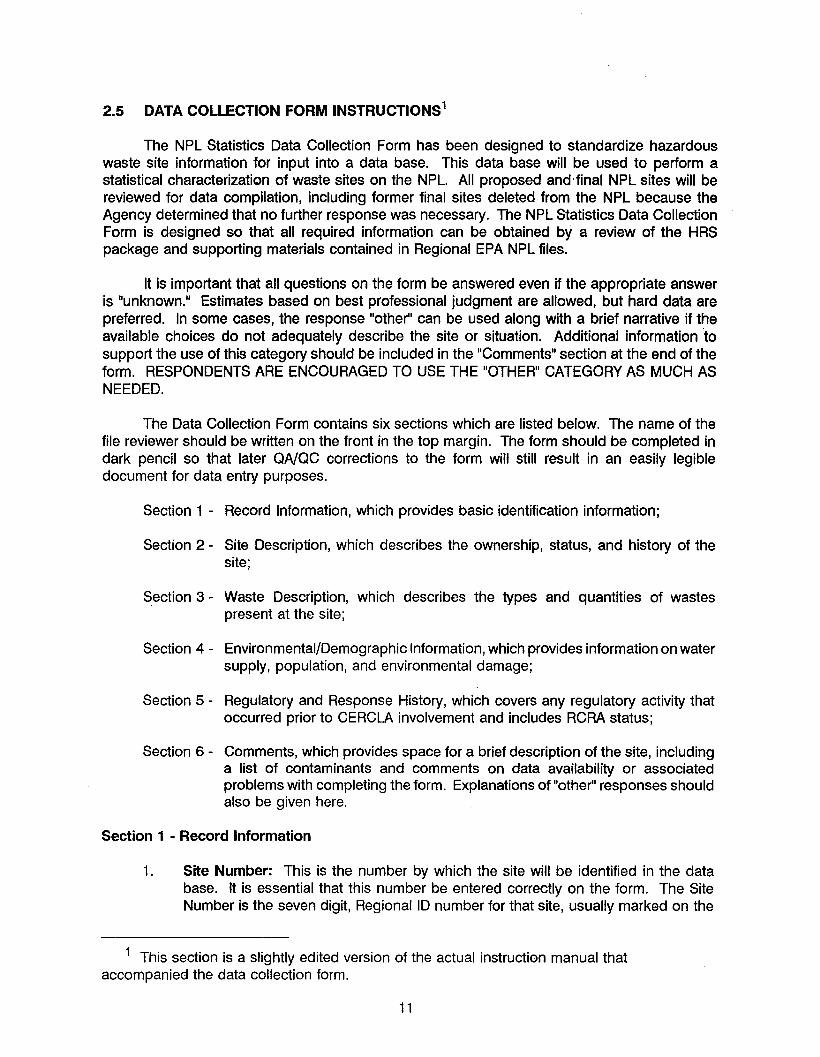
2.5 DATA COLLECTION FORM INSTRUCTIONS1
The NPL Statistics Data Collection Form has been designed to standardize hazardouswaste site information for input into a data base. This data base will be used to perform astatistical characterization of waste sites on the NPL. All proposed and'final NPL sites will bereviewed for data compilation, including former final sites deleted from the NPL because theAgency determined that no further response was necessary. The NPL Statistics Data CollectionForm is designed so that all required information can be obtained by a review of the HRSpackage and supporting materials contained in Regional EPA NPL files.
It is important that all questions on the form be answered even if the appropriate answeris "unknown." Estimates based on best professional judgment are allowed, but hard data arepreferred. In some cases, the response "other" can be used along with a brief narrative if theavailable choices do not adequately describe the site or situation. Additional information tosupport the use of this category should be included in the "Comments" section at the end of theform. RESPONDENTS ARE ENCOURAGED TO USE THE "OTHER" CATEGORY AS MUCH ASNEEDED.
The Data Collection Form contains six sections which are listed below. The name of thefile reviewer should be written on the front in the top margin. The form should be completed indark pencil so that later QNQC corrections to the form will still result in an easily legibledocument for data entry purposes.
Section 1 - Record Information, which provides basic identification information;
Section 2 - Site Description, which describes the ownership, status, and history of thesite;
Section 3 - Waste Description, which describes the types and quantities of wastespresent at the site;
Section 4 - Environmental/Demographic Information, which provides information on watersupply, population, and environmental damage;
Section 5 - Regulatory and Response History, which covers any regulatory activity thatoccurred prior to CERCLA involvement and includes RCRA status;
Section 6 - Comments, which provides space for a brief description of the site, includinga list of contaminants and comments on data availability or associatedproblems with completing the form. Explanations of "other" responses shouldalso be given here.
Section 1 - Record Information
1. Site Number: This is the number by which the site will be identified in the database. It is essential that this number be entered correctly on the form. The SiteNumber is the seven digit, Regional 10 number for that site, usually marked on the
1 This section is a slightly edited version of the actual instruction manual thataccompanied the data collection form.
11
HRS scoring package cover page. In the case of some proposed sites, an IDnumber indicating the Update Number is given and should be used. When enteringthe Site Number, it is required that the commonly accepted two letter abbreviationfor the state's name precede the Regional 10 number (or other number) for the site.
NOTE: If no identification number is available, use any reasonable means ofnumbering, but remember to precede the number with the stateabbreviation.
2. Site Name: This is the name of the site as identified on the NPL. .Copy thecomplete name of the site in the space provided. Also, enter the location of the site(town/county and state) directly below the site name.
Section 2 - Site Description
1. Coordinates: Enter the coordinates, latitude and longitude, of the site in degrees,minutes, seconds, and tenths of seconds. If tenths of a second are not given, enterzero as a default value in the appropriate space. If no coordinates are available atall, leave blank and mark "unknown," while specifying site location (eg., townshipand range) in the collection form's "Comments" section. Because latitude andlongitude pr~vide necessary input for interaction with other data bases, it isparticularly important that these values or descriptions be included.
2. Setting: Setting is a qualitative measure of population density near the site. Markthe appropriate box to indicate the character of the area surrounding the site."Urban" indicates central city areas, "suburban" indicates sites bordering orsurrounding urban areas, and "rural" indicates sites outside suburban areas. Selectthe one setting that best describes the site. This information may be derived froman accompanying map. Generally, the number of homes and/or industrial buildingsindicated on a map may be used to estimate the site setting. Since the characterof the area is relative to population density, a site in the center of a city such asRoanoke Rapids, which is located in rural North Carolina, would be classified as"urban."
3. Location Land Use/Site Use: The predominant land uses within approximately 1mile of the site location should be determined and all appropriate descriptionsidentified. If the land immediately adjacent to or on site is used for activitiesassociated with large numbers of people, or a sensitive environment which couldincrease the risk posed by the site, describe the appropriate land/site use in the"other" category. Examples of "others" include:
• railroad• airport• sports complex• wetland
• school/college• harbor/marina• federal/state park
Mining, military, or DOE should be checked only if they correspond to actual siteuse or immediately adjacent site use. Additionally, if the site or area had apredominant historical usage (e.g., railroad yard, landfill, power substation), identifythis in the "other" category with the words "past" or "previous."
12

4. Current Ownership: Check one appropriate box to indicate the type of ownershipof the site at the time of the HRS score. For purposes of this data field, operatorsmay be characterized as "owners" if ownership distinctions are not made. Forconsistency, treat the following situations as detailed below:
• If ownership/operation is by multiple individuals, businesses, or industries,indicate "other" and state the condition. However, if all owners belong to thesame category, it is not necessary to put this under "other;" simply check theappropriate category.
• When the site is a contaminated ground water plume, as defined bycontaminated wells, mark "other" and enter "contaminated ground waterplume."
5. Ownership When Contaminated: Check the appropriate box to indicate the typeof ownership at the time the site was contaminated. As in item #4, ownership refersto owner and/or operator if a distinction is not made. Procedures for ownershipwhen contaminated are similar to current ownership.
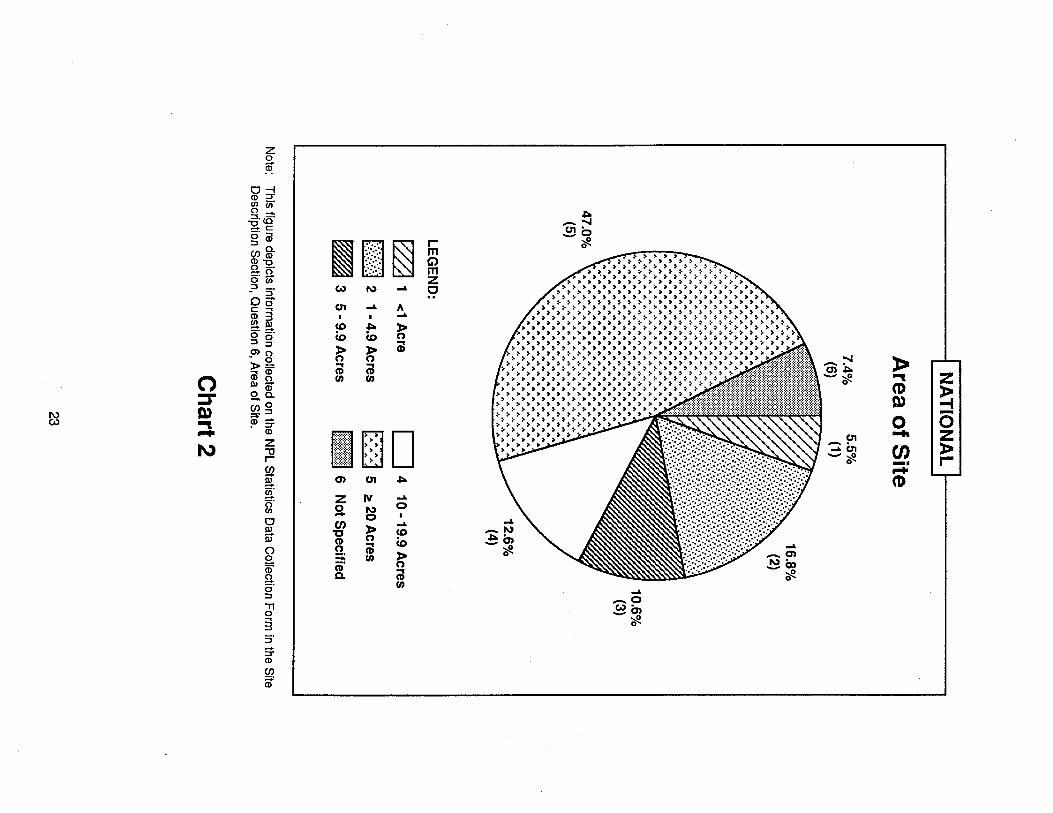
6. Area of Site: Indicate the area of the site, along with the appropriate units. Thearea of the site includes the "source" of the waste and the area that has come to becontaminated. If the area of the site is reported as a range, use the midpoint of therange. Again, this data field is intended to capture the area of contamination. So,for example, if there is a large facility but only a small area is actually contaminated,only the area of contamination should be entered. If the specific area ofcontamination is unknown, use the area of the facility, if reasonable (use bestprofessional jUdgment), and note this in the "Comments" section. For ground watercontamination plume sites, area refers to the planar area of the plume. Generally,the area of the site will be given in the narrative that accompanies the HRS scoringpackage.
7. Site Status: Check the appropriate box to indicate the status of the site at the timeof the HRS score. Sites are to be considered "active" if waste treatment, storage,or disposal activities are taking place at the time of the HRS score. These activitiesdo not necessarily have to be those that resulted in the site being considered forthe NPL. Sites that have changed ownership or operations are still considered"active" if the new operations possibly involve hazardous materials/wastes. "Inactive"sites are those at which treatment, storage, or disposal activities no longer occur.For consistency, address the following conditions as described below:
• Check "active" for those sites that currently have both active and inactivetreatment, storage, or disposal units.
• Consider contaminated ground water plume sites "active."
8. Years of Operation: Enter the beginning and ending years of waste treatment,storage, and/or disposal at the site. If the site is "active," enter the HRS date for theending date. Check "unknown" if the beginning or ending years of operation are notknown. For consistency: if waste activities occurred during only one year (e.g.,one-time event, accidental spill), the years of operation of the facility should be
13
entered, and noted in the "Comments" section. If the site is a contaminated groundwater plume, use a default value of 0001 and 0001 for the beginning and endingyears.
9. Industry Responsible for Generating Material: Check all appropriate boxes thatindicate industries responsible for generating the wastes that occur at the site. Thisrefers to the industry responsible for the waste, not the original product. Forexample, if a hardware store has drums of pesticides which leak, the industryresponsible is "retail" and not "manufacturing." It is important to try to categorize theindustry into one of the types listed for statistical analysis. If these listed industrytypes aren't applicable, check "other." Further information may be provided underthe "Comments" section.
For consistency among respondents, please note the following guidelines:
•
•
•
•
•
•
If the site is a military facility, only "military" should be checked.
Only check the "unknown" category if little or no information is available onthe responsible industry or industries.
"Food and kindred products" refers to food packaging/processing industries(e.g., canneries, bottlers) and the manufacturing of home goods such astoothpaste, shampoo, and cosmetics.
"Chemicals and allied products" also includes paint manufacturing.
Mark "electroplating" for any type of metal coating or metal finishing industry,unless the industry employs another type of coating as the predominantactivity (e.g., paint, plastic).
For the majority of cases, the "other" category should be used if a specificgeneral or subcategory of another type is not obvious. Examples of "other"categories include:
combination industrial!municipal landfillindustrial landfillwaste storage/transferfacilityPOlW
correctional facilitydistributor (gas, oil)salvage yardaircraft-relatedserviceradium processing
10. Site Activities/Waste Deposition: Check all appropriate boxes to indicate whattypes of treatment, storage, or disposal operations occur/occurred at the site. If theavailable categories are not sufficient to characterize the activities occurring at thesite, check "other" and supply a description. For consistency among respondents,please note the following guidelines:
• "Surface impoundments" should be restricted to primarily liquid containment.
• "Waste piles" may be covered or uncovered.
14

• IIlndustrial dumpll refers to an illegal waste pile of industrial trash, chemicals,debris, etc.
• IIl1legal dumpingll (llout the back doorll) indicates situations where wastes areintentionally disposed of in undesignated disposal areas (e.g., dumpingliquids and sludges onto the ground).
• IIEpisodic open dumpll is a site at which third parties illegally dump wastes,often times without the knowledge or approval of the site owner/operator.Note that lIepisodic open dumpll may be an appropriate category even for apermitted facility if, for example, area residents or industries dispose of wastesat the site without authorization.
• IITanks - above groundll should be checked when the type of tank is notinc:Hcated, unless the site is a gasoline retail station.
• 1I0ther sludge activityll refers to any sludge disposal action which cannotadequately be described by the other categories.
• IIDischarge to sewerll should be checked when wastes have been intentionallydischarged to either a sewer or a surface water body. This category does notrefer to wastes entering sewers or surface water as a result of secondary runoff. Permitted discharges should be noted in this category as well as in theIIRegulatory Activitiesll section.
• IIAirborne releasell should be checked when incinerators, boilers, fire or burnpits, excessive dust, etc., are present at the site.
• IIDrum/container storagell refers to intentional storage in specific areas.
• IISpillsll are accidental in nature, mostly one time only occurrences. Leakingdrums do not qualify as spills.
Once again, try to categorize the activities or check 1I0 therll and give a description.Examples of legitimate "othersll include:
•••
pesticide applicationsseptic tanks and leach fieldsdust suppression
•••
wash padssumpsdry wells
11. How Identified: Check the appropriate box to indicate how the site was initiallyidentified to the EPA Superfund Program. IIlncidentalll should be checked if the sitewas identified as a result of fortuitously driving by it, or by investigating another site.Anonymous complaints are categorized as IIcitizen complaints." 1I0ther Federalprogramll should be marked for site identification through programs such as theDOD Installation Restoration Program. Examples of possible 1I0 therll categoriesinclude Congressional inquiry (e.g., Eckhardt list) and ERRIS listing.
12. Material Deposited By: Indicate the entity responsible for the actual wastedeposition. For example, "present owner" would be checked if a private individual
15

authorized the dumping of chemical wastes on his property. However, ''third party"would be checked in the same scenar-io if the property owner had not authorized thedumping. Again, for this category, "owner" refers to owner and/or operator. Forconsistency, check ''third party" for all contaminated ground water plume sites.
13. Date Discovered: Enter two digits for the month, day, and year that the site wasidentified to the EPA Superfund Program. For example, June 27, 1982, would beentered as 06/27/82. In the event that the day or month is unknown, use 01 as thedefault value for each. If the date cannot be determined, check "unknown."
14. Material Source: Indicate whether the waste material was generated on site and/oroff site, as appropriate. Recyclers are considered "on-site generators." Forconsistency, check "off-site generator" for contaminated ground water plume sites.
15. Waste Easily Accessible: Indicate whether or not the waste is easily accessibleto the general public. On-site workers should not be considered for this data field.Items to be considered in judging accessibility include complete cover over thewaste area or a secure fence around the site. For example, waste material exposedat the surface in a park or playground is easily accessible, while waste exposed atthe surface of a site surrounded by a locked chain-link fence is not easilyaccessible. For consistency, the waste should be considered not easily accessiblefor contaminated ground water plume sites.
16. First Proposed: Check the appropriate box identifying in which update the site wasfirst proposed in the Federal Register (this is usually listed under site name on theNPL folder).
17. NPL Status: Check the NPL status of the site as of proposed Update #9, July1989. The NPL status of sites to be proposed for Update #10 should be markedas proposed.
18. CERCUS Number: Enter the 12-digit CERCUS number (usually on the SI form orCERCUS printout).
19. HRS Score: Enter the HRS site score (Sm) from the HRS scoring package. If thescoring has been amended, use the most recent score. In the "Comments" section,indicate the score for each of the migration pathways.
20. Miscellaneous Descriptive Information: Identify, as appropriate, multipleownership or emergency action conditions. Examples of "other emergency action,iinclude:
• well closing• distribution of bottled water
• fences• consent decrees
Additionally, the presence of lead (Pb) at a site should be noted in the appropriatedata field.
16

Section 3 - Waste Description
For data fields #1-3, wastes have been divided into three major groupings based on thephysical state of the waste: solid, liquid, and sludge. The physical state of the waste refers tothe waste as deposited and is usually identified as such in the HRS package or in the PA or SI.For example, slurries are identified as either liquid or sludge, rarely as solid. The presence ofeach of these waste states at the site needs to be determined, along with the quantities involved.Each waste state grouping has been further divided into the type of waste deposited. Theprocedure for completing this section, which should be followed for each waste state, is asfollows:
1-3 Solids, Liquids, Sludges: First determine if the particular waste state beingevaluated ("solid" will be used here as an example) is/was present at the site. Ifsolid wastes are/were not present, check "none." If solids are/were present, thenmark the' appropriate waste type. If the subcategories listed are not sufficient tocharacterize the particular waste stream, check "other." As with the previoussections, the evaluator should use the categories presented if possible, or check"other" and provide a brief description. Some examples of "other" waste streamsinclude:
• spent fuel• drilling muds (sludge)• dust• agricultural waste
• biological waste (animal carcasses)• batteries• construction debris
Finally, total the quantities of all waste streams and fill in the amount in the spaceprovided. Remember to mark the appropriate units.
NOTE: Identify the specific contaminants found at the site in the upper righthand corner of the "Comments" section.
Section 4 - Environmental/Demographic Information
1. Demographics:
a. Distance to Nearest Population: If known, provide the distance from the siteboundary to the nearest population. Also, indicate the unit of measure thatwas used. Population includes those persons occupying houses, apartmentbuildings, schools, and businesses. Use maps, if available, to provide bestestimates. If there is an on-site resident population, use 10 feet as a defaultvalue.
b. Population Within 1 Mile?: If there is a population within 1 mile of the site,check "yes" and enter the number of people within this radius. When thenumber of individual residences is known, the convention is to multiply by 3.8individuals/residence and use the product value as a reasonable population
. estimate. If a reasonable population estimate cannot be determined, check"yes" and leave the number field blank. A map may be used to determinepopulation. If no appropriate information is in the file, check "unknown."
17
c. Population Within 3 Miles?: Follow the same procedures as describedabove. Again, a map may be useful. If data are available regardingpopulation within 4 miles of the site, indicate this and use the information. Ifthis informati'on is not in the file, mark "unknown." By definition, if there ispopulation within 1 mile of the site, there is also population within 3 miles ofthe site.
2. Actual Environmental Damage Reported, Potential Population Affected: Indicatewhether actual environmental damage has been reported at this site. Note that thisdoes not include potential damage, only documented cases of actual impacts. Forexample, if the PA report states that leachate was observed entering an adjacentstream or wetland,this can be considered an actual surface water impact, even ifsampling results are not available. If ''yes,'' indicate the type of damage that wasreported and estimate the population that could potentially be affected. If thepotential population is not known, write "unknown" in the space provided. Pleasenote that, by definition, if an "HRS-observed release" has been scored for a givenpathway, then an environmental impact has been reported for that pathway.
NOTE: The number for potential population is often provided on the PA or SIform.
3. Observed Releases: Indicate whether an observed release of contaminants hasbeen documented. This information is available in the HRS scoring package.
4. Water Supply Information for a 3-Mile Radius:
a. Local Drinking Water Supply Source: Identify whether drinking watersupplies are drawn from surface water and/or ground water within 3 miles ofthe site. If, for example, the local area has a reservoir but some houseswithin 3 miles still use wells, then check "surface and ground water." If alldrinking water sources are outside of the 3-mile radius, this should be notedas "none."
b. Total Population Served: If available, provide the number of people servedby the water supply system indicated in #4a. Note that this populationshould reflect the population seNed by a source within ·3 miles of the site; itmay be more or less than the total population within 3 miles. For example,if a well located two miles from the site is used to serve the popUlation of acity of 60,000, the entire population of the city should be included even if thecity itself is outside of the 3-mile radius. If there is no drinking waterpopulation (all sources are outside 3-mile radius), use a default value of 01.
c. Drinking Water Supply System Type: Indicate the type of water supplysystem for the sources identified under #4a. "Municipal" should be indicatedfor any central water supply system, even if it is operated by a private watercompany, utility, or individual (e.g., trailer park serviced by one privatelyowned well).
18
d. Ground Water Data:
Other Local Ground Water Uses: Check all appropriate boxes forpredominant uses of ground water other than drinking water supply.Monitoring wells should not be considered. Some examples of "other" usesinclude commercial and dust control.
Wells Within 1 Mile?: If there are operable wells within 1 mile of the site,check ''yes'' and indicate the total number of wells used for any purpose,excluding monitoring wells.
Wells Within 3 Miles?: If there are operable wells within 3 miles of the site,check "yes" and indicate the total number of wells used for any purpose,excluding monitoring wells.
Distance to Nearest Well: Provide the distance from the site boundary tothe nearest operable well, excluding monitoring wells. Indicate what unit ofmeasure was used. If the well is located on site, use 10 feet as a defaultvalue. Note that by HRS definitions, the site boundary can be extended tothe farthest point of documented contamination attributable to the site.
Depth to the Uppermost Used Aquifer: Provide the depth from the groundsurface to the uppermost aquifer that is or may be used. If the uppermostaquifer is no longer used because of contamination attributable to the site,the depth to this aquifer should be entered. Always indicate the unit ofmeasure used. If a range of depth is given, use the midpoint value for thedata field. Use a default value of 1 foot if waste was directly deposited belowthe water level of the uppermost used aquifer.
NOTE: "Depth to the Uppermost Used Aquifer" is often provided in theHRS scoring package.
e. Surface Water Data:
Other Local Surface Water Uses: Mark all appropriate boxes for uses ofsurface water, other than drinking water supply, within 3 miles.
Surface Water Adjacent to/Draining Site: Identify all types of surface wateradjacent to or draining the site that could potentially be affected by overlandrunoff from the site. Use professional judgment and HRS definitions asnecessary.
Distance to Nearest Downstream Intake: Provide the distance to thenearest downstream intake in feet or miles, if known.
5. Ecological Information:
Is Site In Or Near Sensitive Environment?: Sensitive environments are defined asestuaries, 100 year floodplains, critical habitats (Federally designated only) andsome coastal areas. If the site is in or near one of these environments, indicate the
19
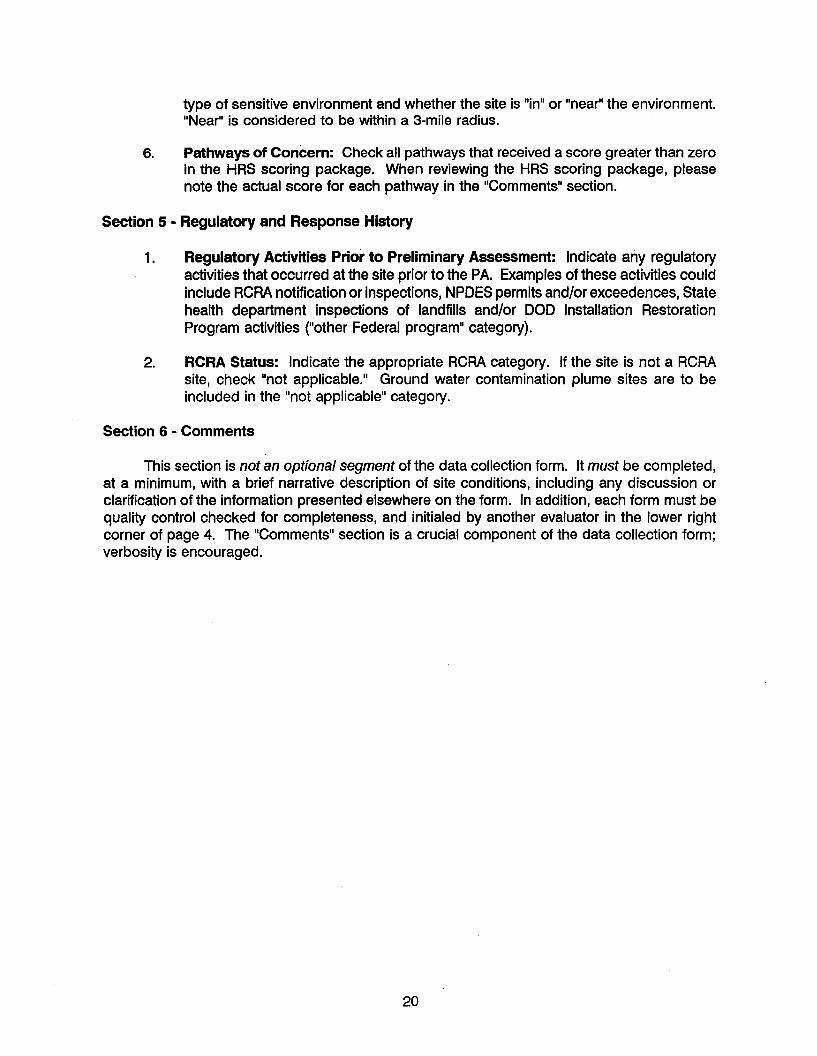
type of sensitive environment and whether the site is "in" or "near" the environment."Near" is considered to be within a 3-mile radius.
6. Pathways of Concern: Check all pathways that received a score greater than zeroin the HRS scoring package. When reviewing the HRS scoring package, pleasenote the actual score for each pathway in the "Comments" section.
Section 5 - Regulatory and Response History
1. Regulatory Activities Prior to Preliminary Assessment: Indicate any regulatoryactivities that occurred at the site prior to the PA. Examples of these activities couldinclude RCRA notification or inspections, NPDES permits and/or exceedences, Statehealth department inspections of landfills and/or DOD Installation RestorationProgram activities ("other Federal program" category).
2. RCRA Status: Indicate the appropriate RCRA category. If the site is not a RCRAsite, check "not applicable." Ground water contamination plume sites are to beincluded in the "not applicable" category.
Section 6 - Comments
This section is not an optional segment of the data collection form. It must be completed,at a minimum, with a brief narrative description of site conditions, including any discussion orclarification of the information presented elsewhere on the form. In addition, each form must bequality control checked for completeness, and initialed by another evaluator in the lower rightcorner of page 4. The "Comments" section is a crucial component of the data collection form;verbosity is encouraged.
20

CHAPTER 3: SITE DESCRIPTION
• Chart 1: Site Setting
• Chart 2: Area of Site
• Chart 3: Predominant Land Uses in Site Vicinity
• Chart 4: Treatment, Storage, or Disposal Activities Occurring at Site
• Chart 5: Waste Easily Accessible to Public
• Chart 6: Distance to Nearest Population
21
42.3%(3)
NATIONAL
Site Setting
LEGEND:
~E:::l
•1 Urban
2 Suburban
3 Rural
Not Shown - Not Specified (0.3%)
Note: This figure depicts information collected on the NPL Statistics Data Collection Form in the SiteDescription Section, Question 2, Setting.
Chart 1
22
zo(jj
z~oz»r-
>"""(I)Q)
o-It
(J)_....(I)
Ul":i:c.n-ff!.
......_.O).r::--ff!.
-"_ 0)
I\) •
- Q)~o
-"_0w·_0)
ff!.
-"_I\).r::-'_0)
ff!.
.r::-
-"oI
-"CDeo:J>o
m
DUl
IVI\)o:J>o@In
.---.>
> >>
> >>
0)
zSCI)'0CDo::;:(ii'0.
I~~
.r::-
r-
_......Ul'
m_0
G)
ff!.
mCo) I\)
Z-" !=?
Ul -"I I "-"
CD .r::-eo eo :J>0
:J> :J>...
0 0CD
@ ...In
CDIn
I
0-1<D::!:(fl (fl
0-.... -.-·co""9.c:o'al:::lo.en<D~ "2...... 00" en:::l _0- :::l
00c: ....<D 3(fllll..........o' o':::l :::l
mo• 0:r>=al ~III (jj00.-0en:::l
~::To <D
Z""0rsa~~
~;ro~III
o2mg.o:::l
"T1o35's:<D
~(jj
o~Q)"""I,..I\)
~

NATIONAL ~----------.
Predominant Land Usesin Site Vicinity
100 "T"""------------------,
82.0
1.2
1 2 3 4 5 6Land Uses
7 8 9
LEGEND:
• 1 Industrial Area ~ 6 Military
E8 2 Commercial District • 7 Department of Energy------
~ 3 Residential ~ 8 Mining
Q 4 Agricultural D 9 Not Specified~ ~ ~
~
~ 5 Forest/Fields
Notes: (1) This figure depicts information collected on the NPL Statistics Data Collection Form in theSite Description Section, Question 3, Location Land Use/Site Use.
(2) See Appendix A for a complete listing of "Other" responses.
Chart 3
24
NATIONAL 1-------------,
Treatment, Storage, or DisposalActivities Occurring at Site
70
60 e,t3
50qN'lilt
- 40c~If
30
1 2 3 4 5 6 7 8 9 10 11 12 13 14 15 16 17 18 19
ActivitiesLEGEND:
Ea 1 Surface Impoundment
o2 Waste Plies
mi 3 Municipal landfill
~ 4 Industrial landfill
~ 5 Open Dump· Drums
[)6 Open Dump· Trash,White Goods, Etc.
II] 7 Illegal Dumping
m8
• 9
~10
Ej 11
Fa 12
E; 13
m14
Episodic Open Dump
Tanks· Above Ground
Tanks· Below Ground
Land Treatment Facility
Sludge Disposal
Discharge to Sewer/Surface WaterRecycling Facility
II 15 UndergroundInjection Well
1316 Airborne ReleaselIncineration
~ 17 Drum/ContainerStorage
1;118 Spill
119 Not Specified
Not Shown· Field Pesticide Application (0.3%)
Notes: (1) This figure depicts information collected on the NPL Statistics Data Collection Form in the SiteDescription Section, Question 10, Site ActivitieslWaste Deposition.
(2) See Appendix A for a complete listing of "Other" responses.(3) Tanks were assumed to be above ground unless otherwise specified.
Chart 4
25
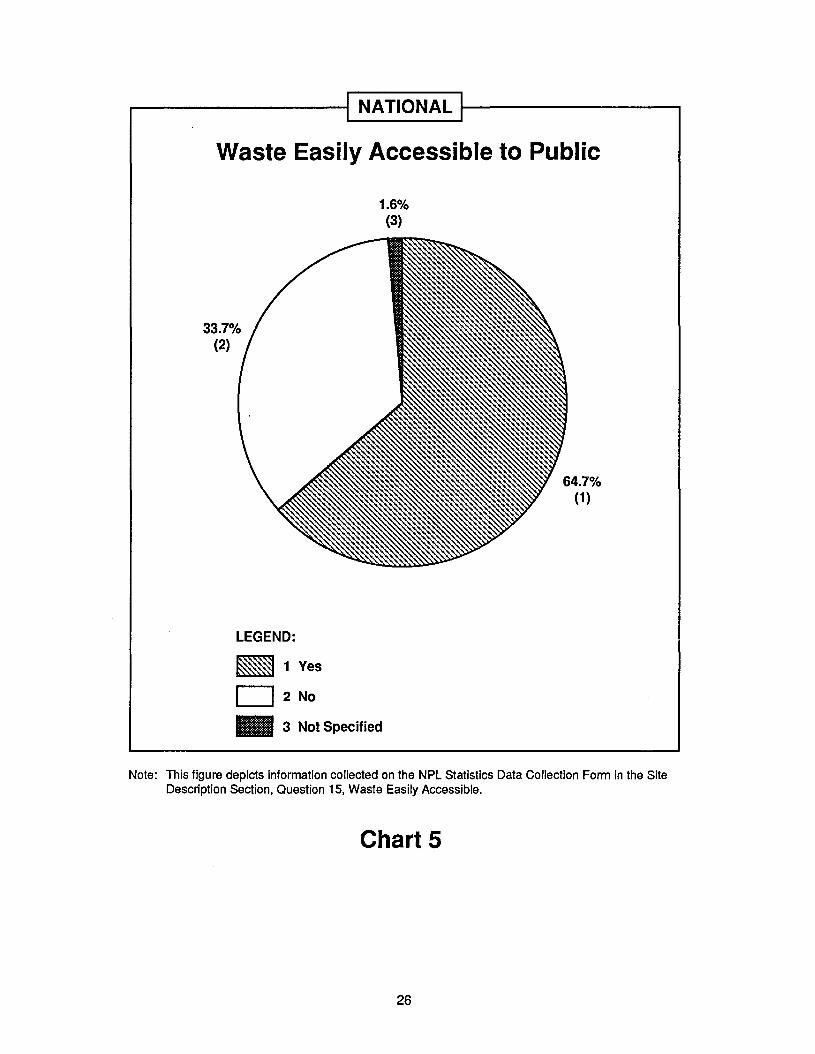
NATIONAL 1-----------.
Waste Easily Accessible to Public
1.6%(3)
LEGEND:
~ 1 Yes
D 2 No
• 3 Not Specified
Note: This figure depicts information collected on the NPL Statistics Data Collection Form in the SiteDescription Section, Question 15, Waste Easily Accessible.
Chart 5
26
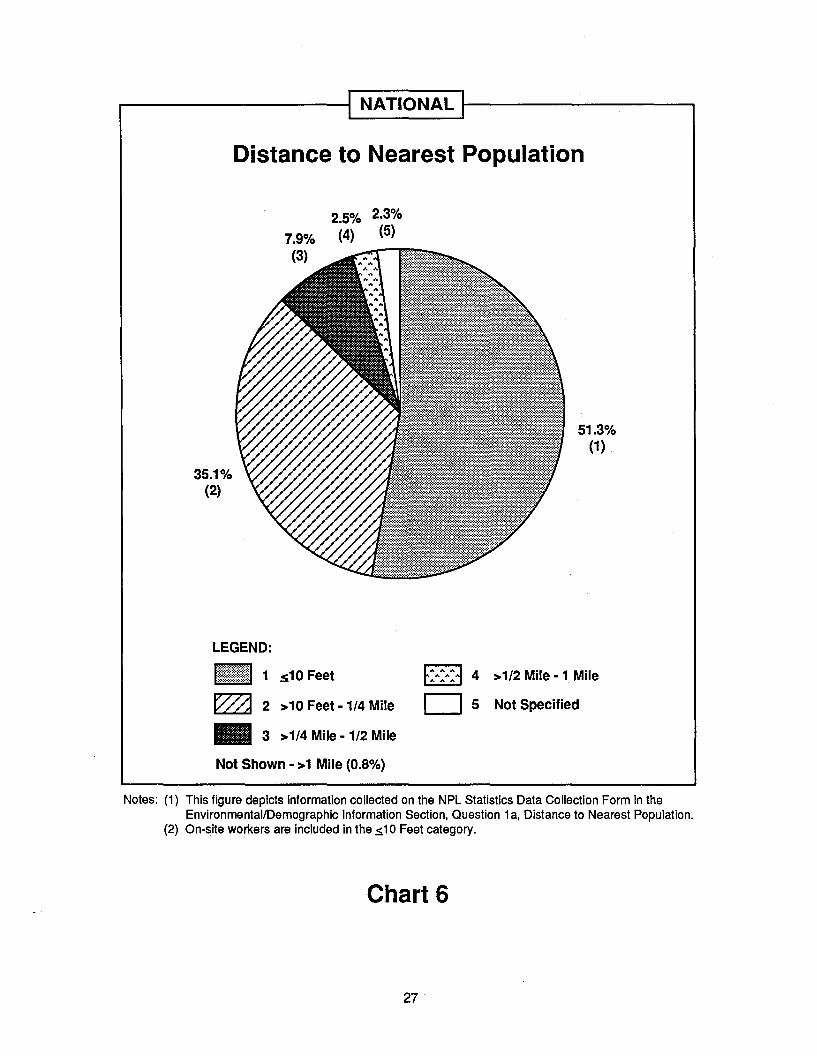
NATIONAL 1------------,
Distance to Nearest Population
2.5% 2.3%7.9% (4) (5)(3) _--m~_
35.1%(2)
51.3%(1)
LEGEND:
n~~~[~tttH~1 1 s10 Feet
~ 2 >10 Feet -1/4 Mile
• 3 >1/4 Mile -1/2 Mile
Not Shown - >1 Mile (0.8%)
:A:A> 4 >1/2 Mile -1. Mile
D 5 Not Specified
Notes: (1) This figure depicts information collected on the NPl Statistics Data Collection Form in theEnvironmental/Demographic Information Section, Question 1a, Distance to Nearest Population.
(2) On-site workers are included in the .s1 0 Feet category.
Chart 6
27
CHAPTER 4: OWNER/GENERATOR INFORMATION
• Chart 7: Owner/Operator of Site at Time of HRS Score
• Chart 8: Owner/Operator of Site at Time of Contamination
• Chart 9: Status of Site at Time of HRS Score
• Chart 10: Industry Responsible for Generating Waste: MajorCategories
• Chart 11: Industry Responsible for Generating Waste: ManufacturingCategory Details
• Chart 12: Waste Depositor
• Chart 13: Waste Generator
• Chart 14: Beginning Year of Site Operation
• Chart 15: Ending Year of Site Operation
• Chart 16: Total Years of Site Operation
28

NATIONAL
Owner/Operator of Site at Timeof HRS Score
3.0%(6)
1.1%(5)
9.9%(4)
5.6%(3)
11.6%(2)
49.2%(1)
LEGEND:
11~~ii, 1 Private· Industrial .5 State
2 Private· Individual
3 Private· Small Business
4 Federal
" """ " "" " "
" " "......" " "
6 County
7 Municipal
8 Other
Not Shown· Indian Lands (0.2%), Not Specified (0.6%)
Notes: (1) This figure depicts information collected on the NPL Statistics Data Collection Form in theSite Description Section, Question 4, Current Ownership.
(2) Contaminated ground water plume sites are included in the "Other" category.
Chart 7
29

NATIONAL I---------~
Owner/Operator of Site at Timeof Contamination
54.2%(1)
9.7%(7)
2.5%(5)
9.1%(2)
9.9%(4)
7'1%~(3)
[:=:=:=1 5 County
• 6 Municipal
f~~~~~~I 7 Other
LEGEND:
m1l@;~;~;1 1 Private· Industrial
~ 2 Private· Individual
~ 3 Private· Small Business
o 4 Federal
Not Shown· State (0.7%), Indian Lands (0.0%), Not Specified (0.3%)
Notes: (1) This figure depicts information collected on the NPL Statistics Data Collection Form in theSite Description Section, Question 5, Ownership When Contaminated.
(2) Contaminated ground water plume sites are included in the "Other" category.
Chart 8
30
56.4%(2)
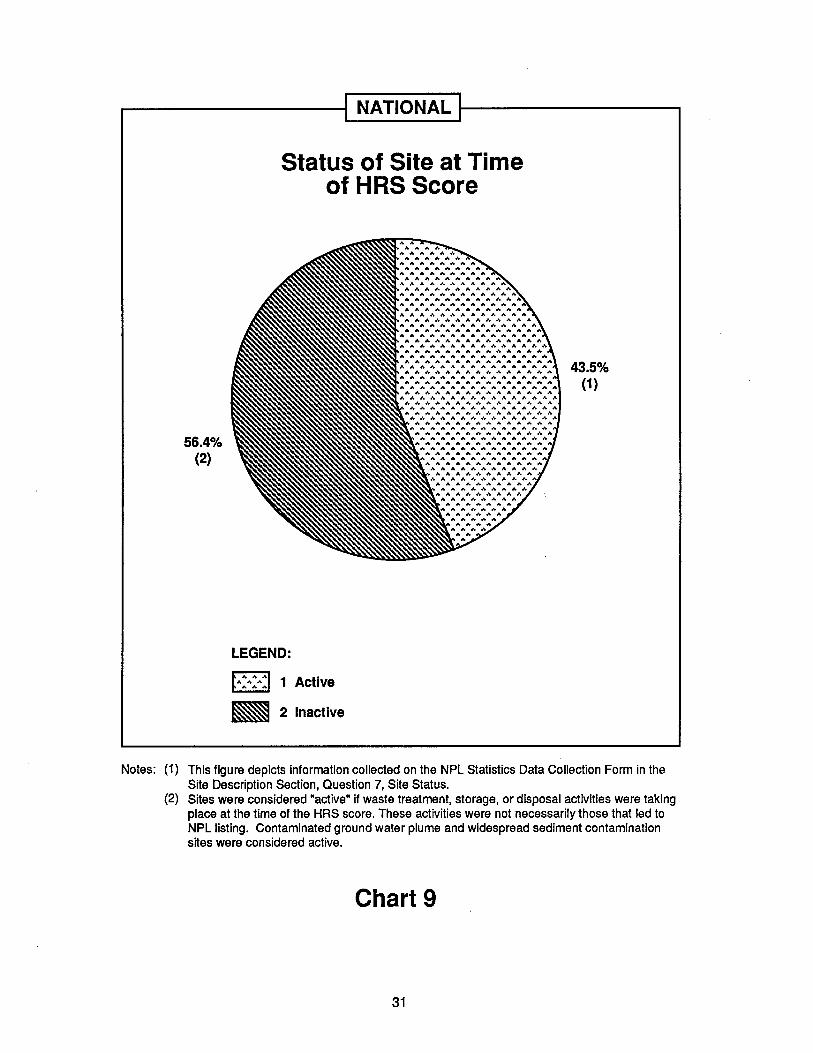
NATIONAL
Status of Site at Timeof HRS Score
AA"" "" A ""A "" A A.......A A A A "" ...
... ... ,. Ie .... ... '" '"... A ... ... ... oft, ... ...
A "" A A A A A A AA A A A A A A A A A
A A A A A A A A A A AA A A A A A A A A A A
A A A A A A A A A A A AA A A A A "" A A A A A A
A A A A A A A A A A A AA A A A A A A A A A A A
A A A A A A A A A A A A AA A A A A A A A A A A A A
A A A A A A A A A A A A A AA A A A A A A A A A A A A A
A A A A A A A A A A A A A AA A A A A A A A A A A A A A
A A A A A A A A A A A A A A AA A A A A A A A A A A A A A
A A A A A A A A A A A A A A ....A A A A A A A A A A A A A A A
A A A A A A A A A A A A A A AA A A A A A A A A A A A A A A
A A A A A A A A A A A A A A AA A A A A A A A A A A A A A A
A A A A A A A A A A A A A A A AA A A A A A A A A A A A A A A
A A A A A A A A A A A A A A A AA A A A A A A A A A A A A A A
A A A A A A A A A A A A A A AA A A .... A A A A A A A A A A A
A A A A A A A A A A A A A A AA A A A A A A A A A A A A A
A A A A A A A A A A A A A AA A A A A A A A A A A A A A
A A A A A A A A A A A A AA A A A A A A A A A A A A A
A A A A A A A A A A A A AA A A A A A A A A A A A
A A A A A A A A A A A AA A A A A A A A A A A A
A A A A A A A A A A AA A A A A A A A A ~
~ ~ ~ ~ ~ ~ ~ A A ~ ~
A A A A A A ~ A A AA A A A A A A A A
A A A A A A A A AA A A A A A A A
A A A ~ A "" ~A A A A A ". ...
". A A A A AA A A A A
A A A AA A A A
A AA
LEGEND:
A:A>: 1 Active
• 2 Inactive
43.5%(1)
Notes: (1) This figure depicts information collected on the NPL Statistics Data Collection Form in theSite Description Section, Question 7, Site Status.
(2) Sites were considered "active" if waste treatment, storage, or disposal activities were takingplace at the time of the HRS score. These activities were not necessarily those that led toNPL listing. Contaminated ground water plume and widespread sediment contaminationsites were considered active.
Chart 9
31
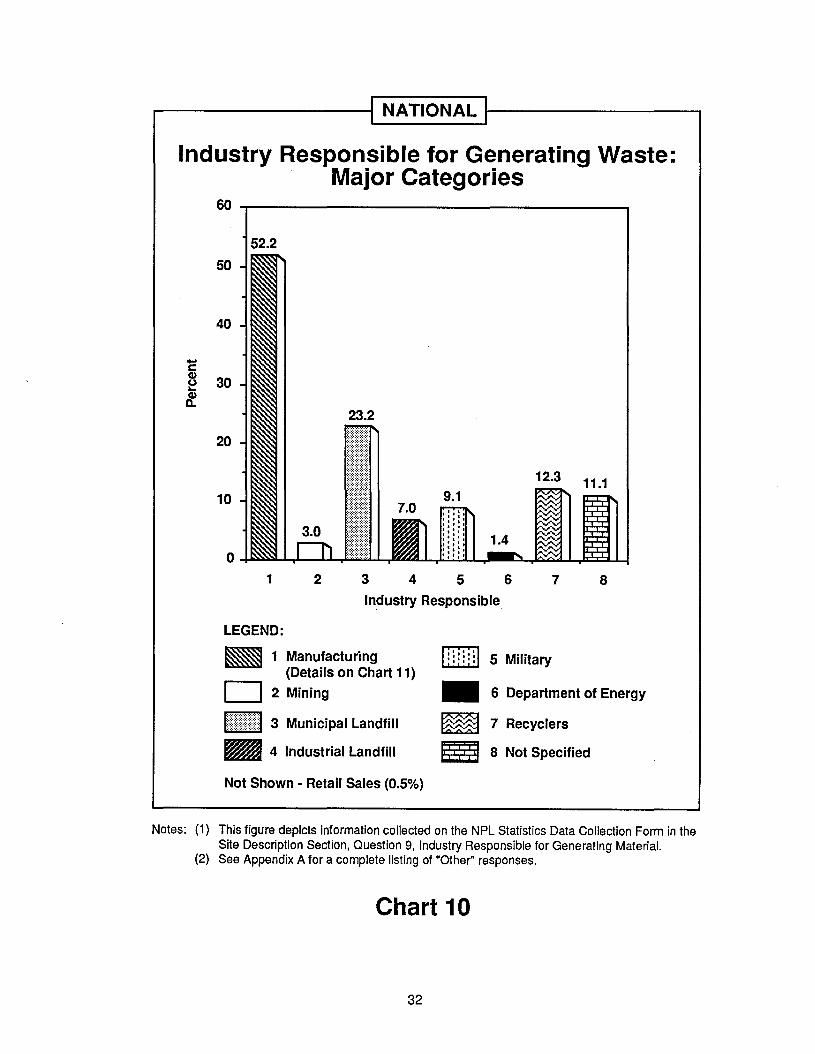
NATIONAL ~--------,
Industry Responsible for Generating Waste:Major Categories
60 "T"'""-------------------,
52.2
50
40
-c8 30...~
20
10
o1 2 345 6
Industry Responsible
7 8
LEGEND:
~ 1 Manufacturing(Details on Chart 11)
D 2 Mining
I~::::::::::::::~::::::::I 3 Municipal Landfill
• 4 Industrial Landfill
Not Shown - Retail Sales (0.5%)
......
. ::::: 5 Military
• 6 Department of Energy
~ 7 Recyclers
g 8 Not Specified
Notes: (1) This figure depicts information collected on the NPL Statistics Data Collection Form in theSite Description Section, Question 9, Industry Responsible for Generating Material.
(2) See Appendix A for a complete listing of "Other" responses.
Chart 10
32
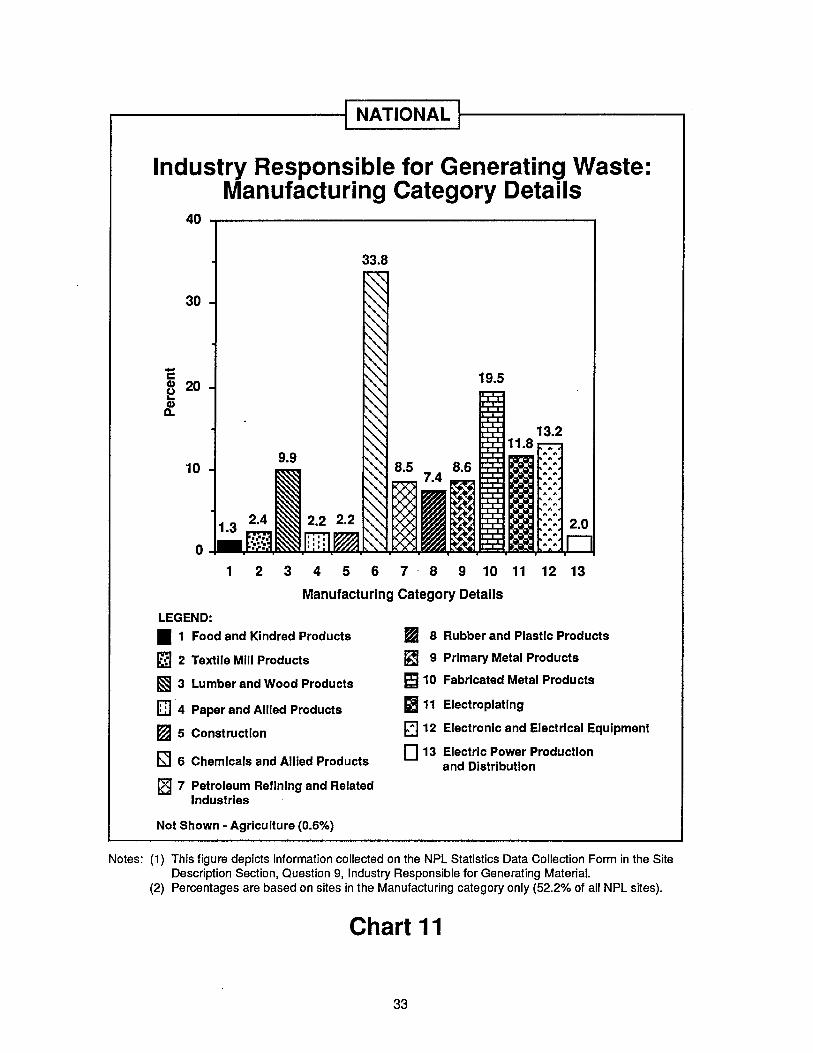
NATIONAL 1-----------.
Industry Responsible for Generating Waste:Manufacturing Category Details
40 -r----------------------,
33.8
30
-cCD 20~
~
10
1 2 3 4 5 6 7 8 9 10 11 12 13
Manufacturing Category Details
LEGEND:
• 1 Food and Kindred Products
~ 2 Textile Mill Products
~ 3 Lumber and Wood Products
/ill ·4 Paper and Allied Products
~ 5 Construction
(;J 6 Chemicals and Allied Products
I:a 7 Petroleum Refining and RelatedIndustries
Not Shown - Agriculture (0.6%)
• 8 Rubber and Plastic Products
~ 9 Primary Metal Products
EJ 10 Fabricated Metal Products
m11 Electroplating
012 Electronic and Electrical Equipment
013 Electric Power Productionand Distribution
Notes: (1) This figure depicts information collected on the NPL Statistics Data Collection Form in the SiteDescription Section, Question 9, Industry Responsible for Generating Material.
(2) Percentages are based on sites in the Manufacturing category only (52.2% of all NPL sites).
Chart 11
33
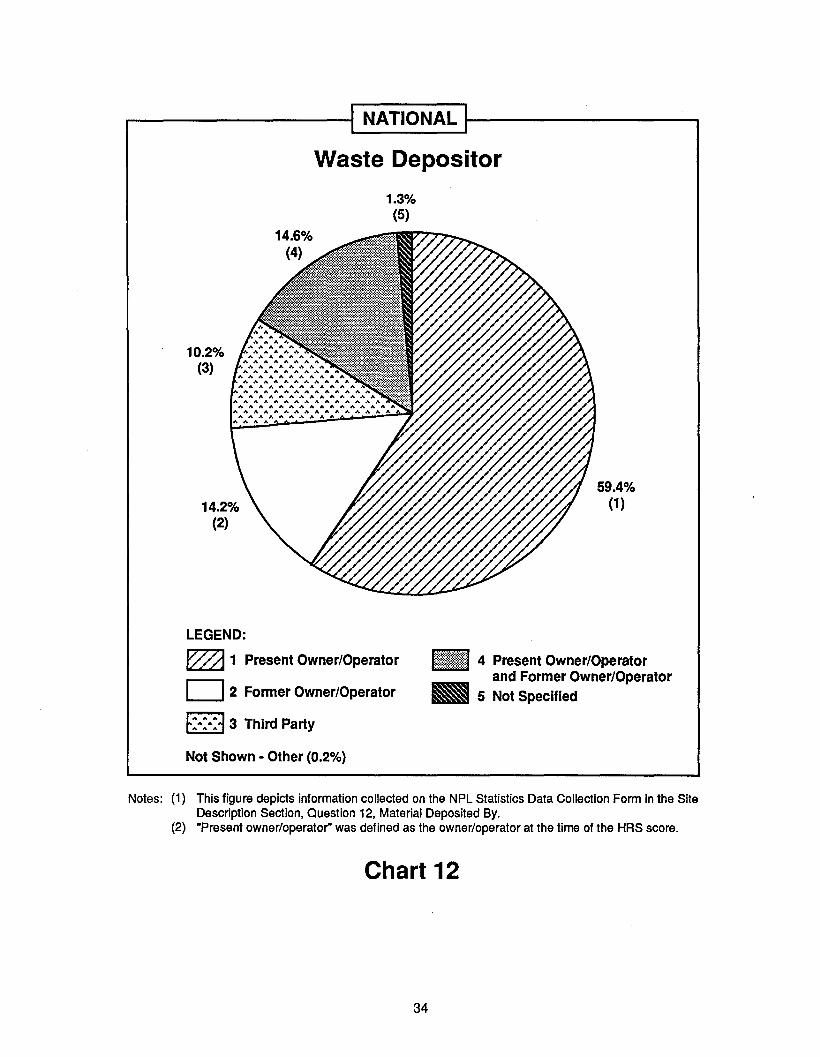
NATIONAL ~-------...,
Waste Depositor
1.3%(5)
10.2%(3)
LEGEND:
E2Z11 Present Owner/Operator
o 2 Former Owner/Operator
f:":,,:33 Third Party
Not Shown· Other (0.2%)
59.4%(1)
i~itmltl 4 Present Owner/Operatorand Former Owner/Operator
• 5 Not Specified
Notes: (1) This figure depicts information collected on the NPL Statistics Data Collection Form in the SiteDescription Section, Question 12, Material Deposited By.
(2) "Present owner/operator" was defined as the owner/operator at the time of the HRS score.
Chart 12
34

NATIONAL 1------------.,
Waste Generator
5.8%(3)
41.1%(2)
LEGEND:
~ 1 On-site Generator
D 2 Off-site Generator
• 3 On-site Generator and Off-site Generator
Not Shown - Not Specified (0.2%)
53.0%(1)
Notes: (1) This figure depicts information collected on the NPL Statistics Data Collection Form in theSite Description Section, Question 14, Material Source.
(2) "Off-site generator" was recorded for all contaminated ground water plume and widespreadsediment contamination sites.
Chart 13
35
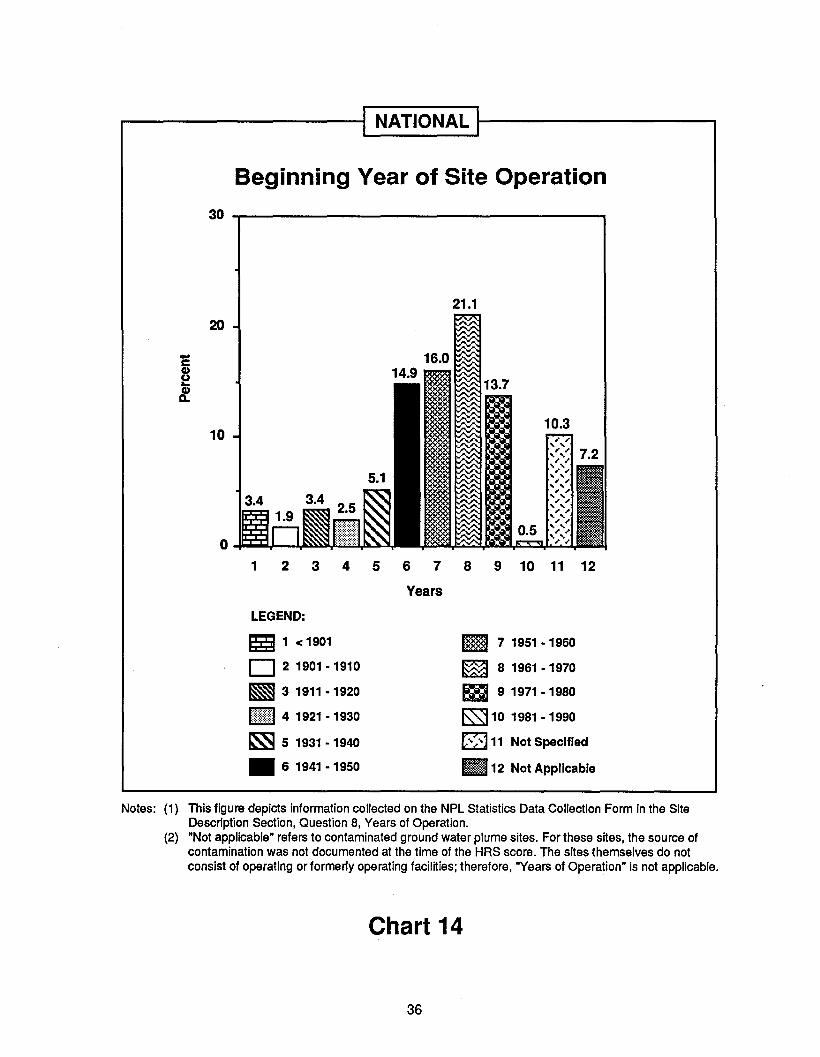
NATIONAL 1---------.....,
Beginning Year of Site Operation
30
21.120
-c8..~
10
1 2 3 4 5 6 7 8 9 10 11 12
Years
LEGEND:
~ 1 <1901
D 2 1901·1910
~ 3 1911·1920
IJi?m) 4 1921 . 1930
~ 5 1931 ·1940
• 6 1941·1950
m 7 1951·1960
~ 8 1961-1970
t3i 9 1971 ·1980
~ 10 1981 -1990
E2] 11 Not Specified
lIS 12 Not Applicable
Notes: (1) This figure depicts information collected on the NPL Statistics Data Collection Form in the SiteDescription Section, Question 8, Years of Operation.
(2) "Not applicable" refers to contaminated ground water plume sites. For these sites, the source ofcontamination was not documented at the time of the HRS score. The sites themselves do notconsist of operating or formeriy operating facilities; therefore, "Years of Operation" is not applicable.
Chart 14
36

NATIONAL 1----------,
Ending Year of Site Operation50 ,,-------------------...,
435
40
30 29.3
20
10
o~~-0.4 0.3 0.0
7.1
1 2 3 4 5 6 7 8 9 10 11 12 13
YearsLEGEND:
~ 1 Prior to 1980
D 2 1980
~ 3 1981
IjtttJ 4 1982
~ 5 1983
• 6 1984
~ 7 1985
~ 81986
m 91987
~ 10 1988
m11 1989
II 12 Not Specified
I: :::113 Not Applicable
Notes: (1) This figure depicts information collected on the NPL Statistics Data Collection Form in the SiteDescription Section, Question 8, Years of Operation.
(2) "Not applicable" refers to all NPL sites that were "active" at the time of the HRS score. "Active"sites by definition do not have an ending year of operation; therefore, they have been depictedas "not applicable" on this figure. Because all contaminated ground water plume sites werecharacterized as "active," they have also been depicted as "not applicable" on the figure.
Chart 15
37
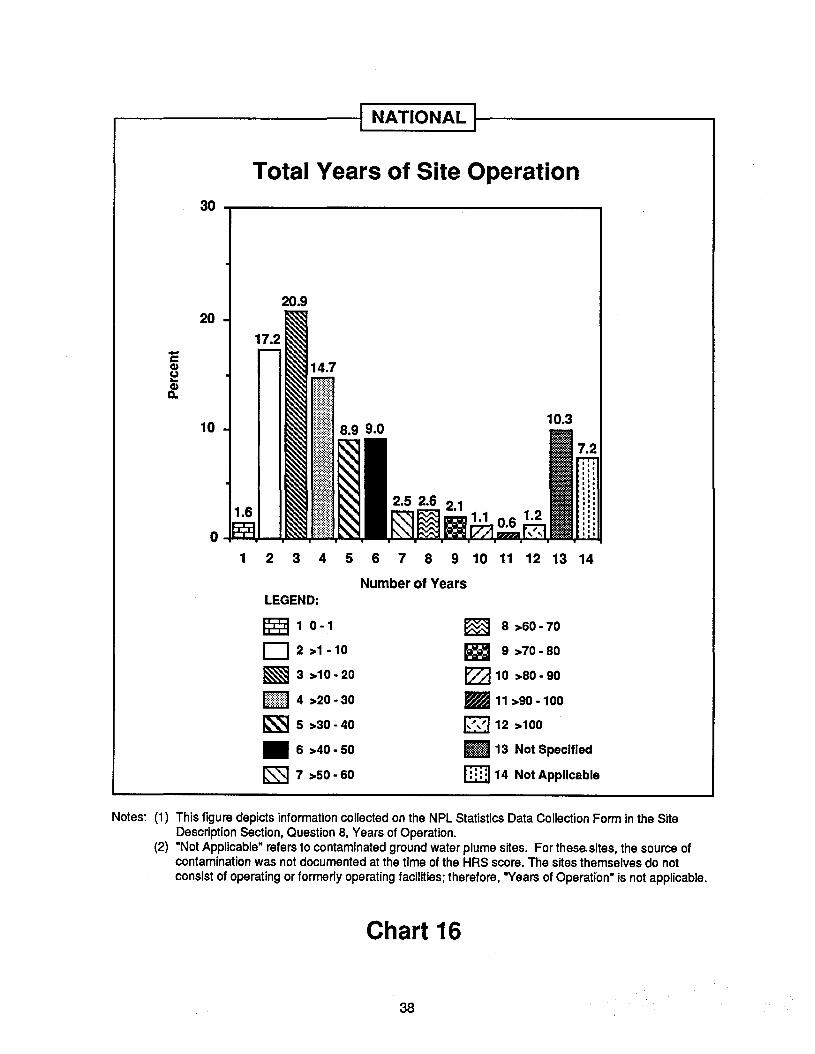
NATIONAL ~----------,
Total Years of Site Operation30 _-------------------,
20.920
-cG)(.)..~
10
0+-...............
1 2 3 4 5 6 7 8 9 10 11 12 13 14
Number of YearsLEGEND:
~ 10·1
0 2 >1.10
~ 3 >10·20
l:}}}:~~ 4 >20· 30
~ 5 >30·40
.6>40.50
~ 7 >50·60
~ 8 >60·70
~ 9 >70·80
IZ3 10 >80·90
.11 >90·100
",",..-112 >100
II 13 Not Specified
I:; :;114 Not Applicable
Notes: (1) This figure depicts information collected on the NPL Statistics Data Collection Form in the SiteDescription Section, Question 8, Years of Operation.
(2) "Not Applicable" refers to contaminated ground water plume sites. For these. sites, the source ofcontamination was not documented at the time of the HRS score. The sites themselves do notconsist of operating or formerly operating facilities; therefore, "Years of Operation" is not applicable.
Chart 16
38
CHAPTER 5: REGULATORY AND RESPONSE HISTORY
• Chart 17: How Site Identified
• Chart 18: When Site Identified
• Chart 19: When and How Sites Identified
• Chart 20: Regulatory Activities Prior to CERCLA Involvement
• Chart 21: Miscellaneous Descriptive Information
39
NATIONAL
How Site Identified
LEGEND:
3.9%(6)
54.7%(5)
4.5%(7)
3.2%(8) 15.3%
(1)
3.2%(2)
5.4%(3)
9.8%(4)
.... .... ....
.................. 1 Citizen Complaint
~ 2 RCRA Notification
1,::i::ii:iiiii:::iii:ii:J 3 CERCLA Notification
• 4 Other Federal Program
~ 5 State/Local Program
• 6 Incidental
D 7 Not Specified
mil 8 Other
Note: This figure depicts information collected on the NPL Statistics Data Collection Form in the SiteDescription Section, Question 11, How Identified.
Chart 17
40
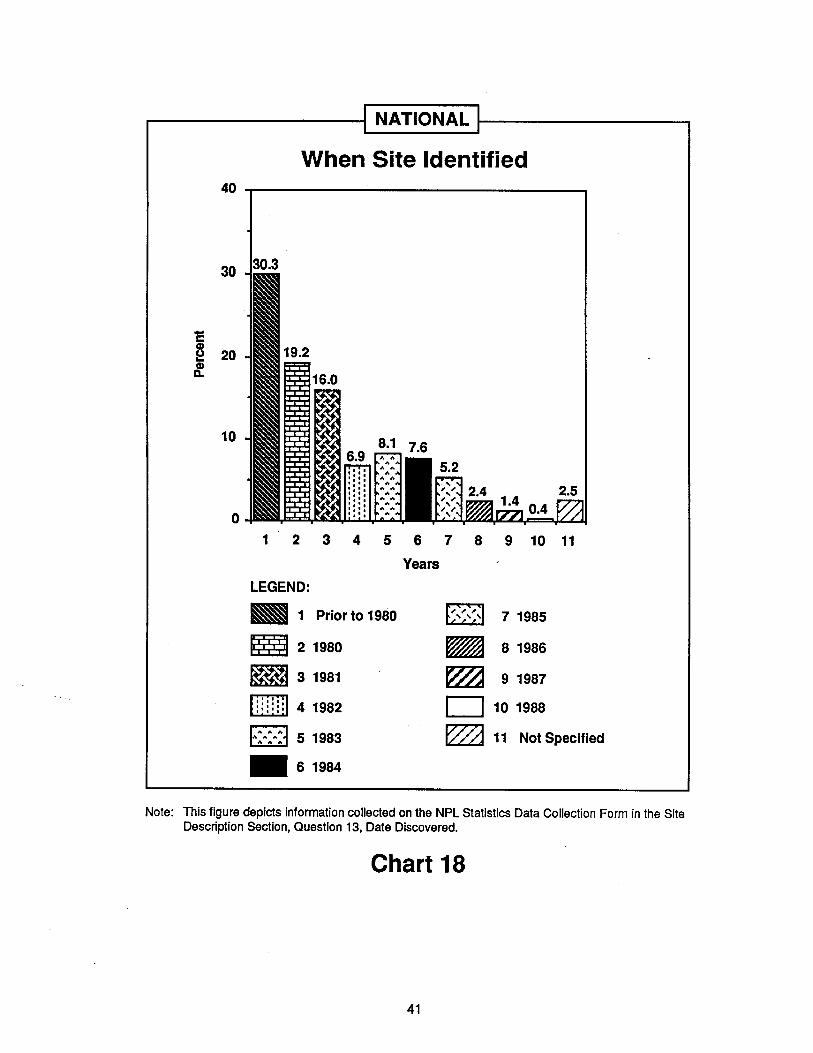
NATIONAL 1-----------.
When Site Identified40 "T"""-------------------,
30 30.3
c~ 20
&?
10
o1 2 3 4 5 6 7 8 9 10 11
Years
LEGEND:
• 1 Prior to 1980 ~ 7 1985' , ,
m 2 1980 • 8 1986
~ 3 1981 ~ 9 1987,1,1,1
4 1982 D 10 1988.1,1,1.1.1.1
A A A
5 1983 ~ 11 Not SpecifiedA A AA A A
.61984
Note: This figure depicts information collected on the NPL Statistics Data Collection Form in the SiteDescription Section, Question 13, Date Discovered.
Chart 18
41
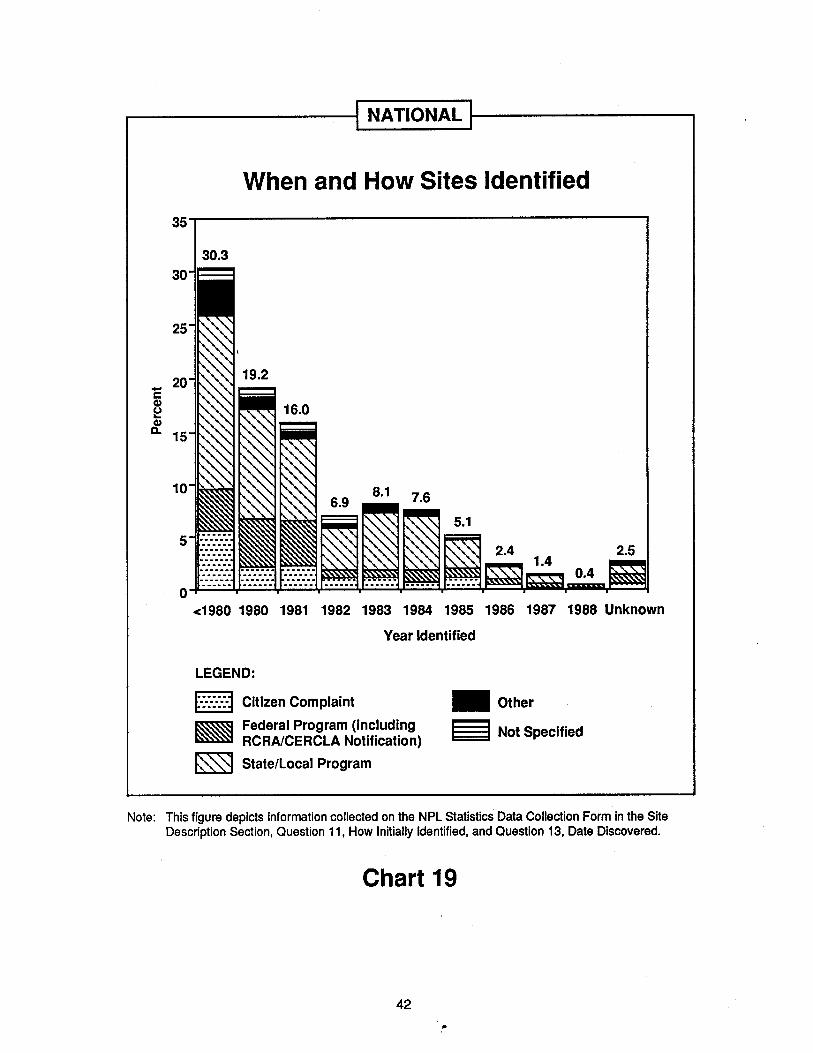
NATIONAL J-----------.,
When and How Sites Identified35-------------------------,
30.3
25
20'ECI)
~
~ 15
10
52.5
oJl2]fj~8f~~~~~~~~~~<1980 1980 1981 1982 1983 1984 1985 1986 1987 1988 Unknown
Year Identified
LEGEND:
~E:::::I
•~
Citizen Complaint
Federal Program (includingRCRAICERCLA Notification)
State/Local Program
• Other
~ Not Specified
Note: This figure depicts information collected on the NPL Statistics Data Collection Form in the SiteDescription Section, Question 11, How Initially Identified, and Question 13, Date Discovered.
Chart 19
42

...------------1 NATIONAL 1------------,
Regulatory Activities Prior toCERCLA Involvement
Regulatory Activities
LEGEND:
~ 1 RCRA
.2 NPDES
1:::::::::::::::::1 3 Other Federal Programs
~ 4 State/Local Regulations
.5 None
o 6 Not Specified
Note: This figure depicts information collected on the NPL Statistics Data Collection Form in theRegulatory and Response History Section, Question 1, Regulatory Activities Prior to CERCLAInvolvement.
Chart 20
43
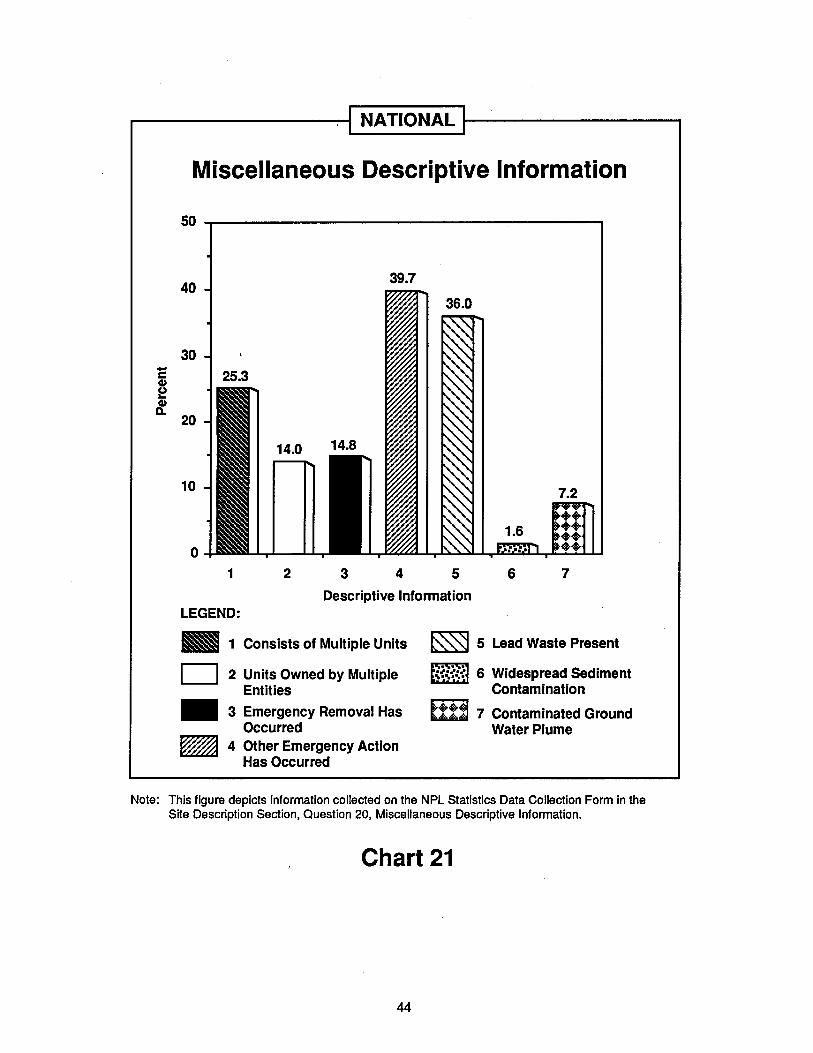
NATIONAL 1---------......
Miscellaneous Descriptive Information
50 -r----------------------,
40
30
20
10
o
39.7
1.6
7.2
••••••••1 2 3 4 5 6 7
Descriptive InformationLEGEND:
• 1 Consists of Multiple Units ISSSl 5 Lead Waste Present
D
•m2 Units Owned by Multiple
Entities
3 Emergency Removal HasOccurred
4 Other Emergency ActionHas Occurred
,!,!,! 6 Widespread SedimentContamination
~ 7 Contaminated GroundWater Plume
Note: This figure depicts information collected on the NPL Statistics Data Collection Form in theSite Description Section, Question 20, Miscellaneous Descriptive Information.
Chart 21
44
CHAPTER 6: HRS SCORING INFORMATION
• Chart 22: Initial Proposal
• Chart 23: HRS Score
• Chart 24: Observed Releases
• Chart 25: Pathways Scored
• Chart 26: Pathways of Concern
• Chart 27: NPL Status
45
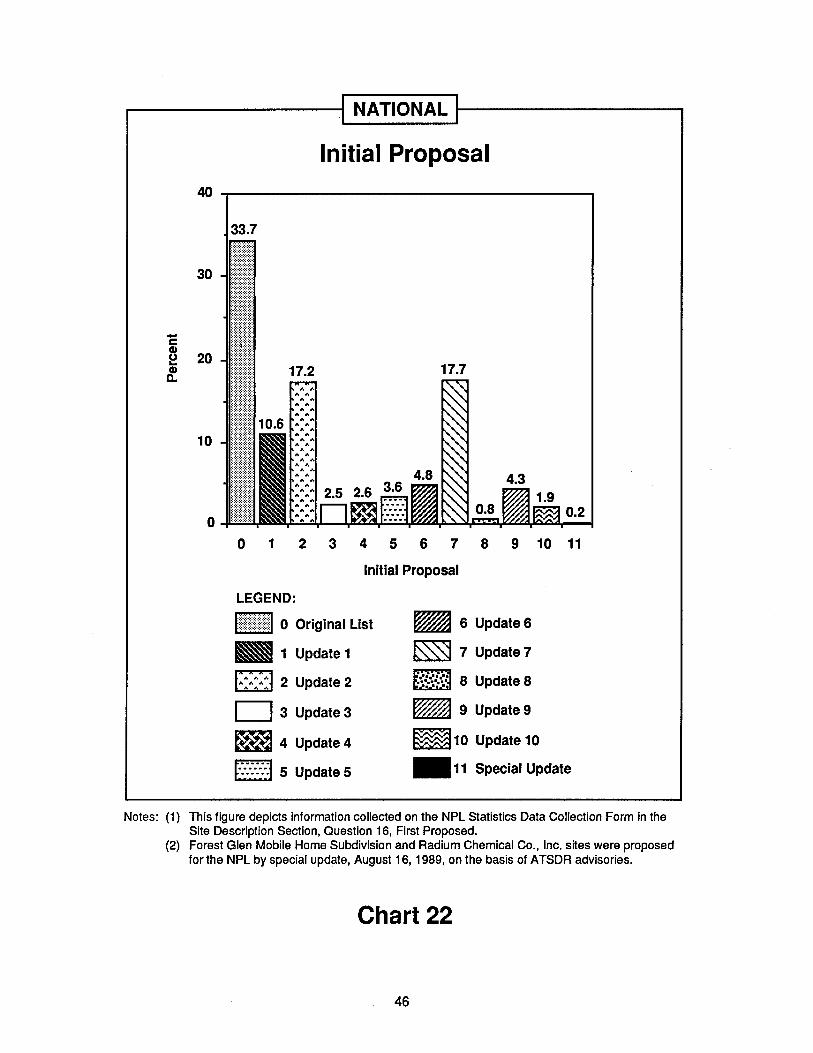
NATIONAL 1---------....,
Initial Proposal
40
33.7
30
-c~ 20~
10
o
17.2 17.7
0.2
o 1 2 3 4 5 6 7 8 9 10 11
Initial Proposal
LEGEND:
h:~~::~:~:::::~:::::H 0 Original List
• 1 Update1
F:::::J 2 Update 2
03 Update3
~ 4 Update4
t:::::::::::J 5 Update 5
• 6 Update6
~ 7 Update7
-::.-::.-:. 8 Update 8
• 9 Update9
mJ10 Update 10
.11 Special Update
Notes: (1) This figure depicts information collected on the NPL Statistics Data Collection Form in theSite Description Section, Question 16, First Proposed.
(2) Forest Glen Mobile Home Subdivision and Radium Chemical Co., Inc. sites were proposedfor the NPL by special update, August 16, 1989, on the basis of ATSDR advisories.
Chart 22
46
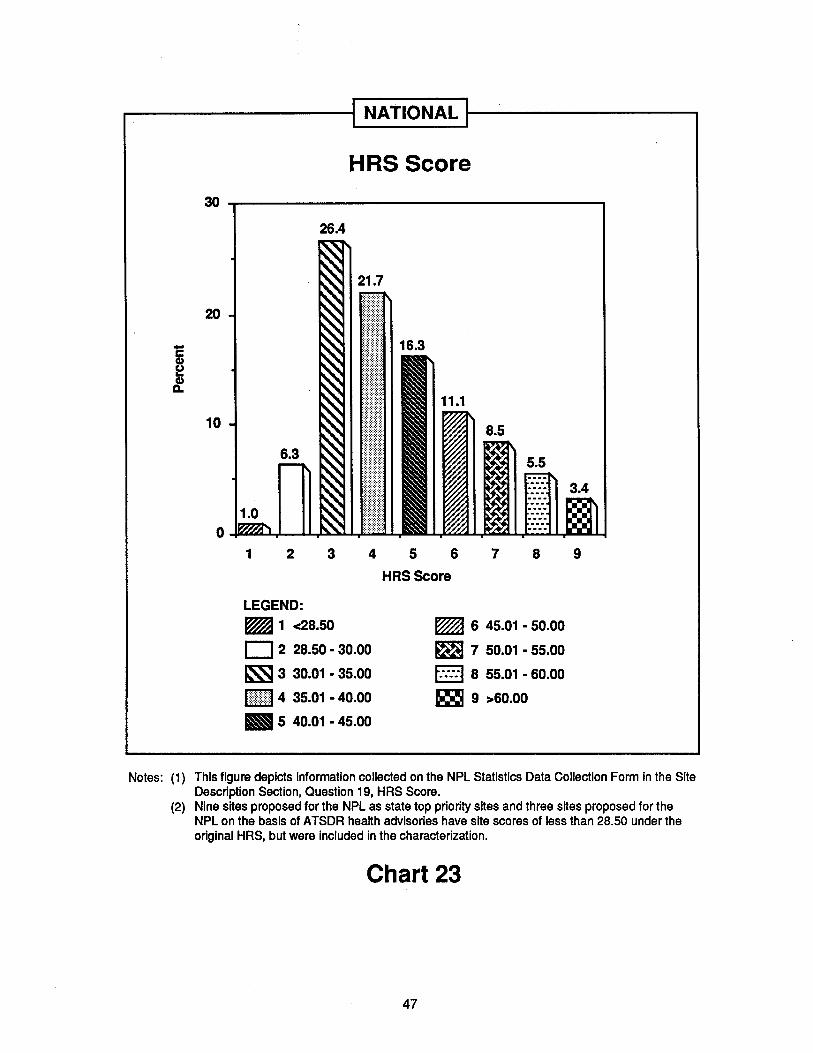
NATIONAL 1------------.
HRS Score
30 ...._----------------------,
26.4
1 2 3 456
HRSScore
7 8 9
LEGEND:
~ 1 <28.50
o 2 28.50·30.00
~ 3 30.01 ·35.00
lr:r:ri] 4 35.01 - 40.00
• 5 40.01 - 45.00
~ 6 45.01 ·50.00
~ 7 50.01 - 55.00
f::::l 8 55.01 - 60.00
m 9 >60.00
Notes: (1) This figure depicts information collected on the NPL Statistics Data Collection Form in the SiteDescription Section, Question 19, HRS Score.
(2) Nine sites proposed for the NPL as state top priority sites and three sites proposed for theNPL on the basis of ATSDR health advisories have site scores of less than 28.50 under theoriginal HRS. but were included in the characterization.
Chart 23
47
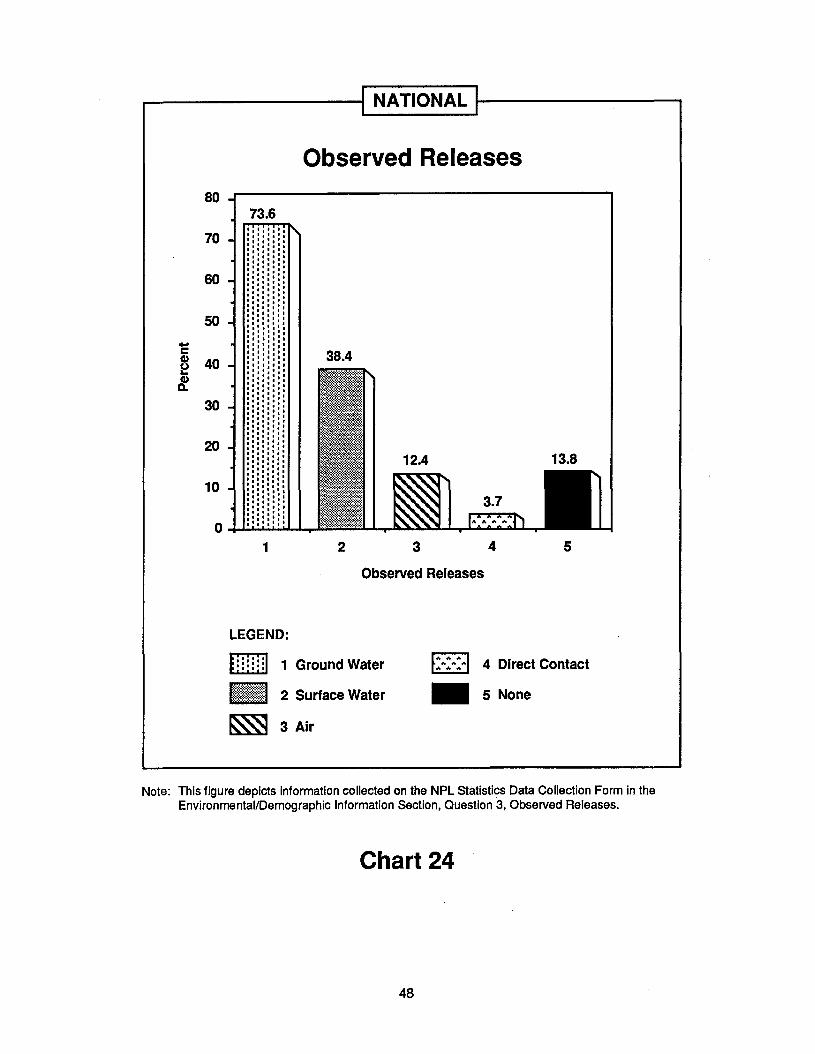
NATIONAL
Observed Releases
80
70
60
50
-c 38.4G> 40u..~
30
20 '..I. :... ,, ,
10 ' ,, ,, ,, ,, ,, ,, ,, .0 ' ,
1 2 3 4 5
Observed Releases
LEGEND:
1 Ground Water
2 Surface Water
~ 3 Air
:A:A:'" 4 Direct Contact
• 5 None
Note: This figure depicts information collected on the NPL Statistics Data Collection Form in theEnvironrnentallDemographic Information Section, Question 3, Observed Releases.
Chart 24
48

NATIONAL 1-----------,
Pathways Scored
70.8
54
37.9"" ,. "" Ito.. .. .."",. .... ,... .. ..A A A A.. .. ..... ... o'It "".. .. ..... ... A A.. .. ..A ,. A A.. .. ...... "" '" A.. .. ..A .... A "".. .. ..A A .... ....
".:,.:,.:,. 5.2... Ie ... A.. .. ...... .... .... ...
32
100
90
80
70
60-c8 50..~ 40
30
20
10
0
1
Pathways
LEGEND:
:::::: 1 Ground Water
1111 2 Surface Water
~ 3 Air
:,.:...:... 4 Direct Contact
1111 5 Fire/Explosion
Notes: (1) This figure depicts Information collected on the NPL Statistics Data Collection Form in theEnvlronrnentalJDemographic Information section, Question 6, Pathways of Concern.
(2) A "Pathway SCored" Is defined as any pathway that received a score greater than zero underthe HRS scoring package.
Chart 25
49

.....---------:i. NATIONAL 1-------------,
Pathways of Concern
43
8.9
2
90 851
80
70
60
- 50cCD0...
40CDD.
30 .'20 '.,···10 ········0 ,
1
Pathway
LEGEND:
:::::: 1 Ground Water
11~1!1!~!~11!11 2 Surface Water
~ 3 Air
• 4 No Pathway ~ 50.00
Notes: (1) This figure depicts information collected on the NPL Statistics Data Collection Form in theEnvlronmentallDemographic Information Section, Question 6, Pathways of Concern.
(2) A "Pathway of Concern" is defined as any pathway that received a score of greater than orequal to 50.00. Under the original HRS, a score of 50.00 on any pathway gives a site scoreof greater than the 28.50 cutoff for NPL eligibility.
Chart 26,
50

NATIONAL 1-----------,
NPL Status
2.4%(2)
97.6%(1)
LEGEND:
1:~ld!!j::::11 Final
D 2 Deleted/All Appropriate Response Actions Taken
Note: This figure depicts Information collected on the NPL Statistics Data Collection Form in the SiteDescription Section, Question 17, NPL Status.
Chart 27
51
CHAPTER 7: WASTE DESCRIPTION
• Chart 28: Physical State of Waste
• Chart 29: Predominant Waste Types
• Chart 30: Waste Quantity
52
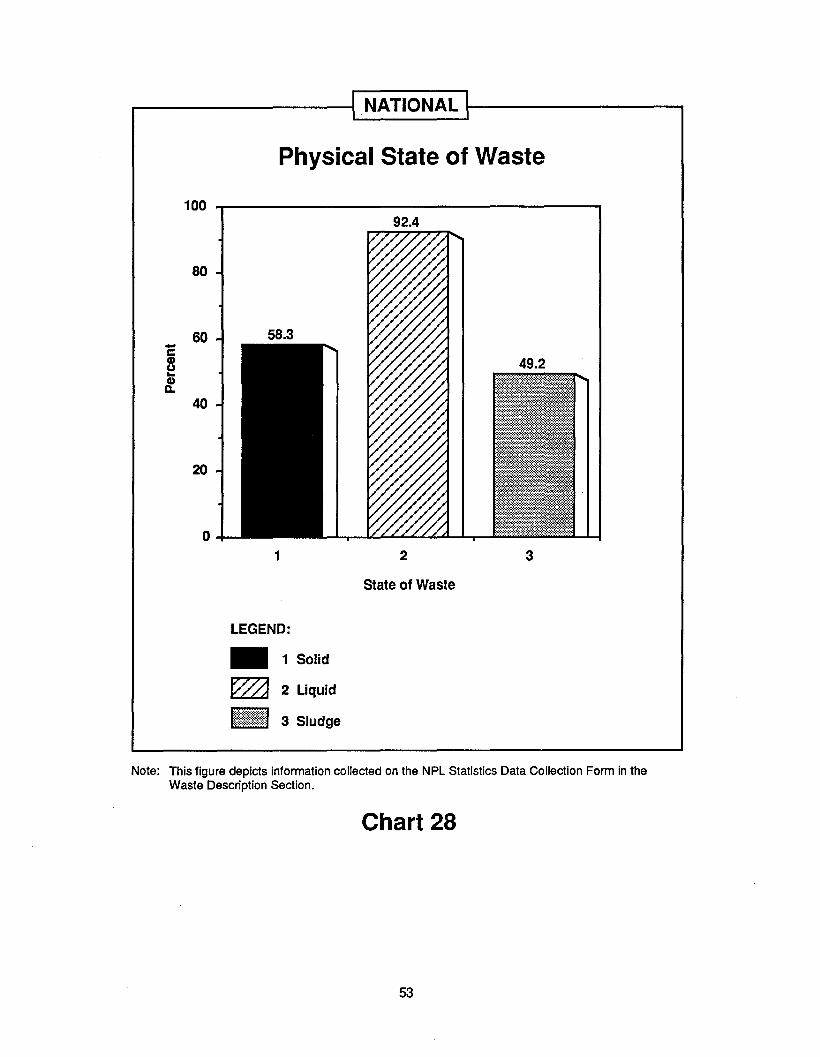
NATIONAL ~--------
Physical State of Waste
100 _------------------........,
80
60
40
20
o1
LEGEND:
• 1 Solid
~ 2 Liquid
1!!!~!:!l!@i!i:il 3 Sludge
2
State of Waste
3
Note: This figure depicts information collected on the NPL Statistics Data Collection Form in theWaste Description Section.
Chart 28
53
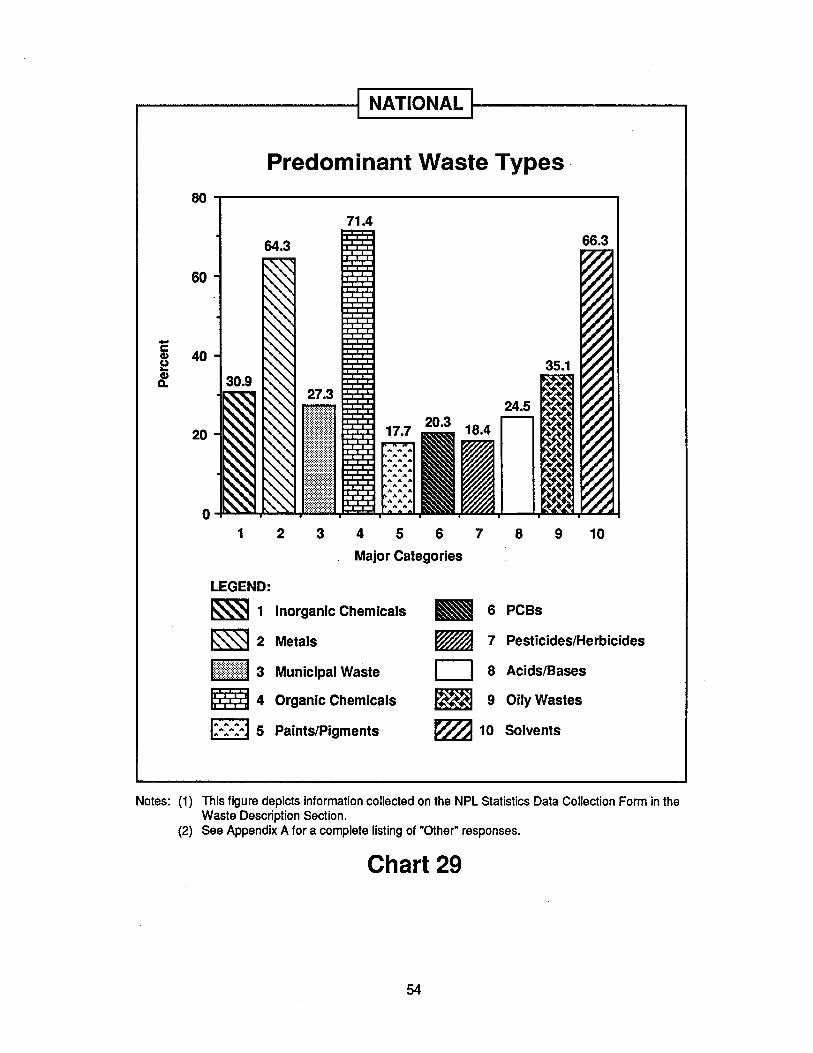
NATIONAL ~---------,
Predominant Waste Types,80 .....------------------------.
71.4
1 2 3 4 5 6 7 8 9 10
Major Categories
LEGEND:
~ 1 Inorganic Chemicals • 6 PCBs
~ 2 Metals rm 7 Pesticides/Herbicides
• 3 Municipal Waste D 8 Acids/Bases
m 4 Organic Chemicals ~ 9 Oily Wastes
" .. " 5 Paints/Pigments ~ 10 Solventstill A A
" " "
Notes: (1) This figure depicts information collected on the NPL Statistics Data Collection Form in theWaste Description Section.
(2) See Appendix A for a complete listing of "Other" responses.
Chart 29
54
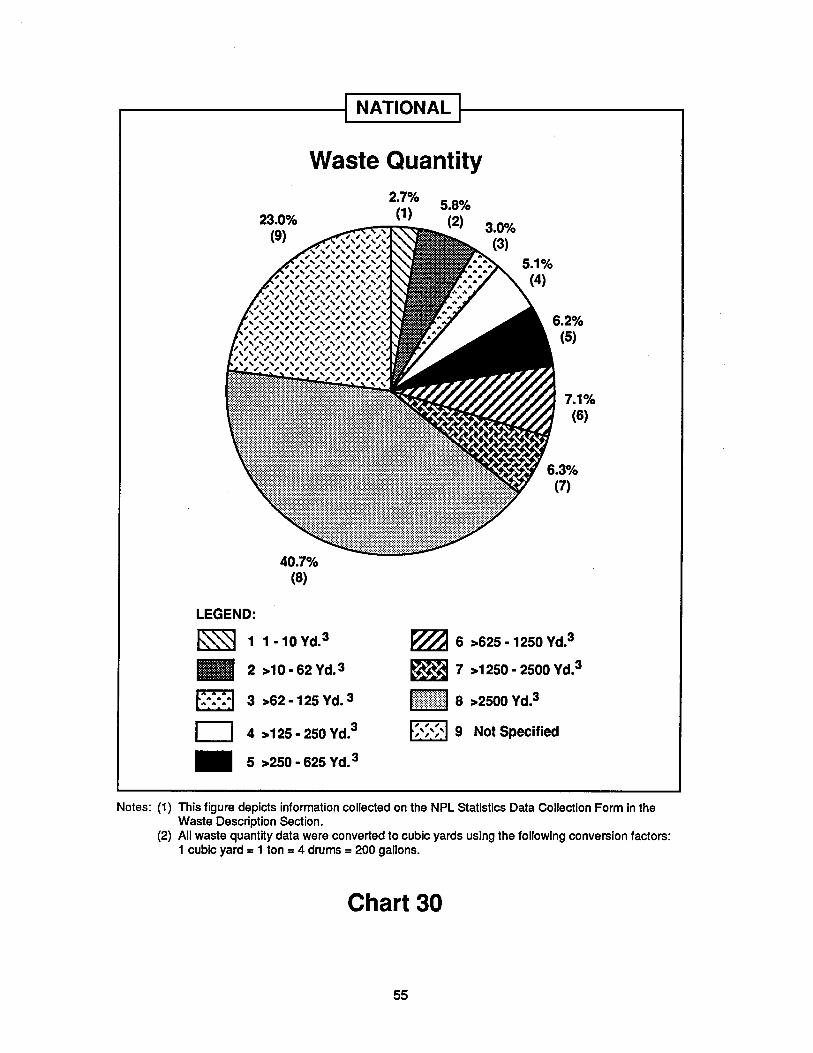
NATIONAL
Waste Quantity
7.1%(6)
2.7%(1)
40.7%(8)
23.0%(9)
LEGEND:
~ 1 1-10Yd.3
• 2 >10-62Yd. 3
f=:=:=:1 3 >62 -125 Yd. 3
~ 6 >625 - 1250 Yd.3
~ 7 >1250-2500Yd.3
I:ifi@iii:i:ii:iij:il 8 >2500 Yd.3
o•
4 >125 - 250 Yd.3
5 >250 - 625 Yd. 3
Notes: (1) This figure depicts information collected on the NPL Statistics Data Collection Form in theWaste Description Section.
(2) All waste quantity data were converted to cubic yards using the following conversion factors:1 cubic yard = 1 ton = 4 drums = 200 gallons.
Chart 30
55
CHAPTER 8: ENVIRONMENTAL INFORMATION
• Chart 31: Type of Environmental Damage Reported
• Chart 32: Depth to Uppermost Used Aquifer
• Chart 33: Surface Water Adjacent to/Draining Site
• Chart 34: Presence of Sensitive Environment Within 3 Miles
• Chart 35: Type of Sensitive Environment Within 3 Miles
56
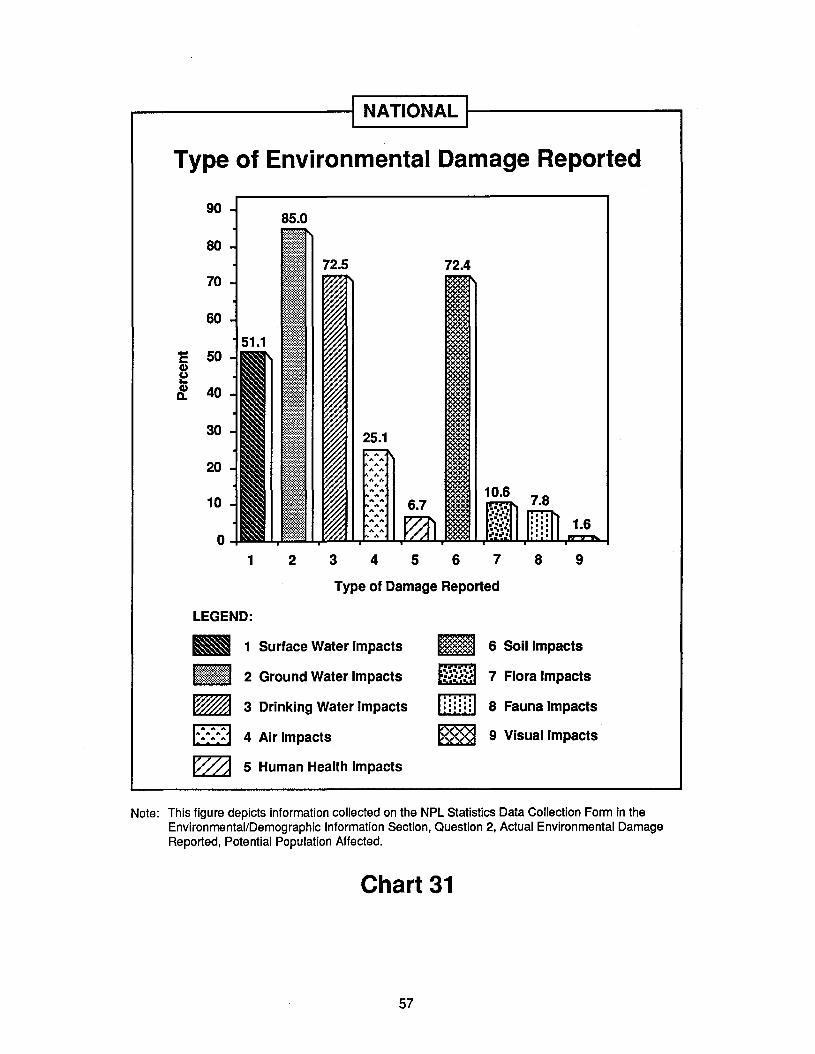
NATIONAL 1--------_
Type of Environmental Damage Reported
85.090
80
70
60
- 50cCI)(.)..CI) 40D.
30
20
10
0
1 2 3 4 5 6 7 8
1.6
9
Type of Damage Reported
LEGEND:
• 1 Surface Water Impacts
IBi~l~l11 2 Ground Water Impacts
~ 3 Drinking Water ImpactsA A A
AhA,,"... 4 Air Impacts.
~ 5 Human Health Impacts
m 6 Soil Impacts
"::::,.":,. 7 Flora Impacts
1,1.1,: : : : : : 8 Fauna Impacts
~ 9 Visual Impacts
Note: This figure depicts information collected on the NPL Statistics Data Collection Form in theEnvironmental/Demographic Information Section, Question 2, Actual Environmental DamageReported, Potential Population Affected.
Chart 31
57
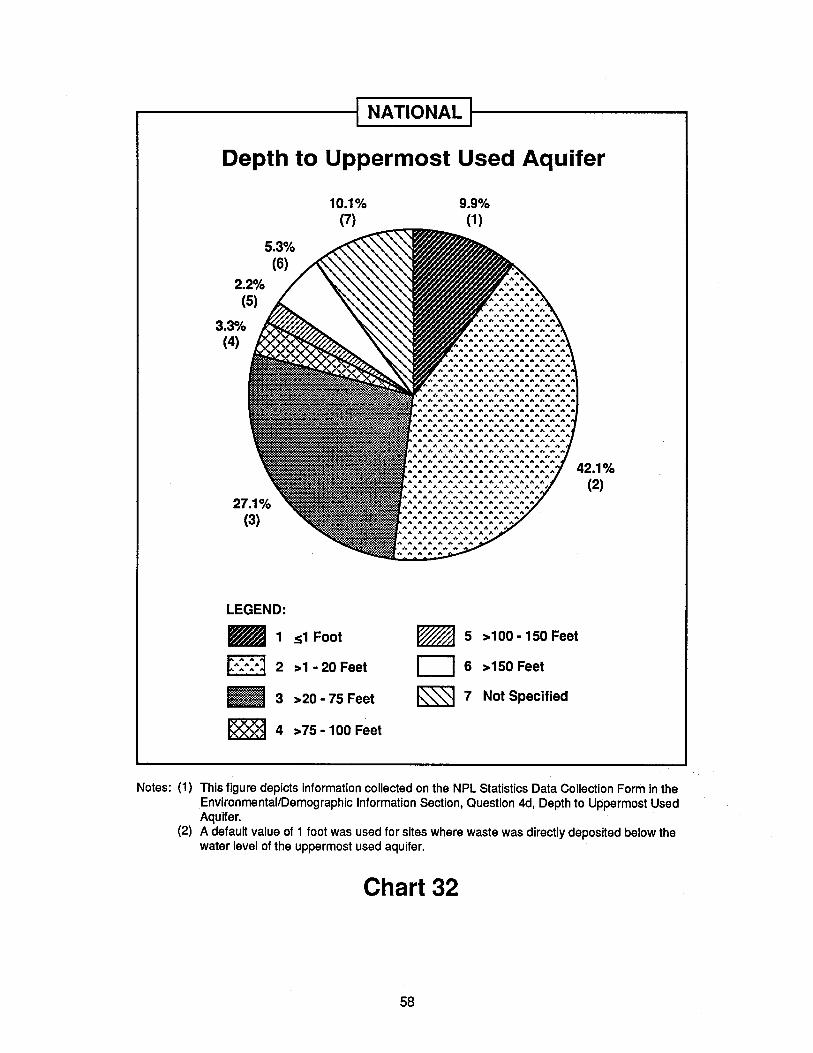
NATIONAL
Depth to Uppermost Used Aquifer
5.3%(6)
2.2%(5)
3.3%(4)
10.1%(7)
9.9%(1)
.... .... .. ..A .... ... ...
"'" A .... A A", A A A A
"" A""'.... ....A A A A A A
A A "'" .... A .... ..."" A A A A A A A
A A A A .... A A A ....A .... A A A .... A .... ....
A A A A .... .... A A A ....A A A A A A A A A A ....
~ A A A A .... .... .... .... .... AA A A A A A A A .... .... A
A A A A .... A A A A .... .... AA .... A A A A A A .... .... A A
.... A A A A A A A A A .... A AA A A A A A A A .... .... A .... A
A A .... .... A A .... .... .... A .... .... A AA A A A A A A A A .... A A A .... A
A .... A A A A .... .... A .... .... .... .... A AA A A A A A A A .... .... A A A A A
A A A A A A A A .... .... A A .... A AA .... A A A .... A A A A A A A A .... ....
A A A A A A .... .... A .... .... A .... A ....A A A A A A A A A A A A A A A ....
A A .... A A A A A A A .... ... .... A A ........ A A A .... .... A A A .... A A .... .... A
A A A A A A .... .... .... .... A A A A ... AA A .... A A .... .... A .... A A .... A
.... A ,. A A A A A ............ A AA A A A A A A A A A .... A A A A
A A A A A .... A A A A .... A A A ....... A A A A A .... A .... A A A A ... A A
A A A A A A A A A ... .... A A A AA A .... A A A A A A A A A A .... A
A A A .... A .... .... A A A A .... .... ........ .... A A A A .... A A A A .... A A A
.... A A A A A A A A A A A A AA A A A A .... .... A ... A A A A A
.... A A A A A A .... A A A A ........ A A A A A ... A A .... .... A A
A A A .... .... A .... A A A A A A ....A A .... A .... .... .... A A A A A A
A A .... A .... A A .... A A A A ........ .... A .... A .... A A .... A A ....
A A A A A A A A A A A AA A A A A A A A A A A
A A A A A A A A A AA A A A A A A A A
A A A A A A A A AA A A "" "" A "" A
A "'" A "'" A ""... A A "" ""
LEGEND:
• 1 $1 Foot ~ 5 >100 -150 Feet
~ 0 6 >150 Feet.. .. .. 2 >1 - 20 Feet.. ..
• 3 >20 -75 Feet ~ 7 Not Specified
~ 4 >75 -100 Feet
Notes: (1) This figure depicts information collected on the NPL Statistics Data Collection Form in theEnvironmentallDemographic Information Section, Question 4d, Depth to Uppermost UsedAquifer.
(2) A default value of 1 foot was used for sites where waste was directly deposited below thewater level of the uppermost used aquifer.
Chart 32
58
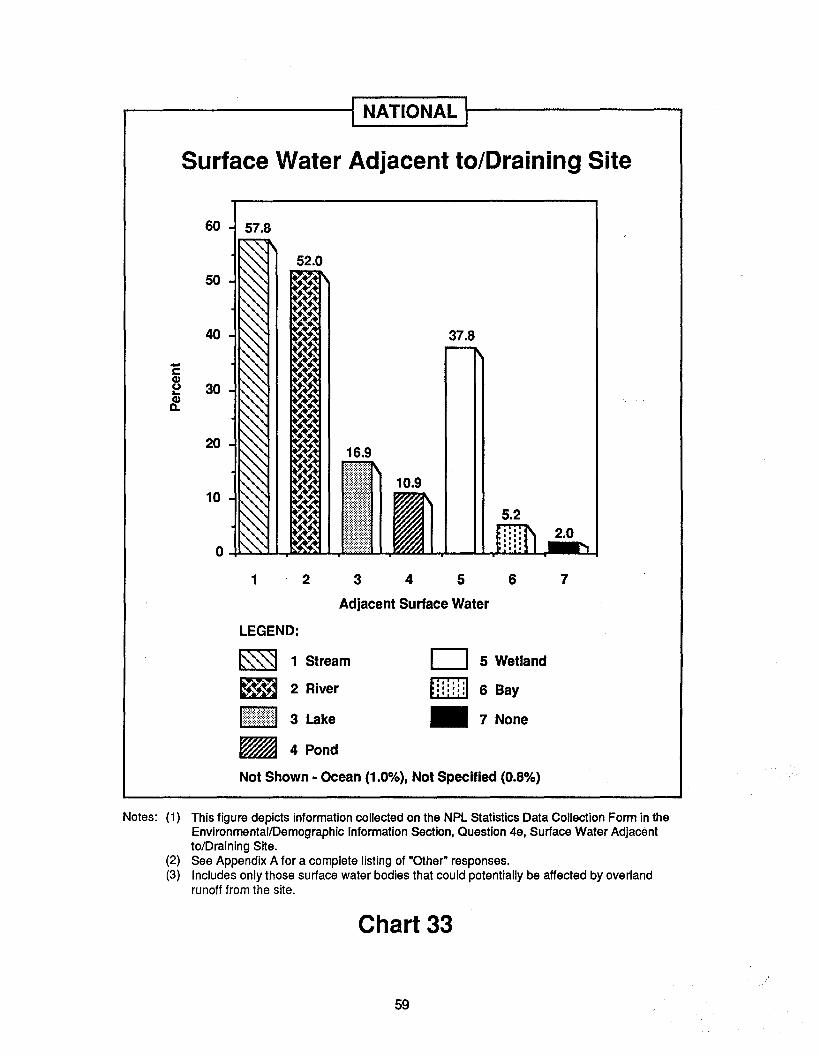
.-------------1 NATIONAL 1----------,
Surface Water Adjacent to/Draining Site
60 57.8
50
40
-c~ 30£f
20
10
1 2 3 4 5 6
2.0
7
D 5 Wetland
.1.1.16 Bay.:.:.:
• 7 None
Adjacent Surface Water
LEGEND:
~ 1 Stream
~ 2 River
1::t:t}::::::~::1 3 Lake
• 4 Pond
Not Shown· Ocean (1.0%), Not Specified (0.8%)
Notes: (1) This figure depicts information collected on the NPL Statistics Data Collection Form in theEnvironrnentallDemographic Information Section, Question 4e, Surface Water AdjacenttolDraining Site.
(2) See Appendix A for a complete listing of "Other" responses.(3) Includes only those surface water bodies that could potentially be affected by overland
runoff from the site.
Chart 33
59
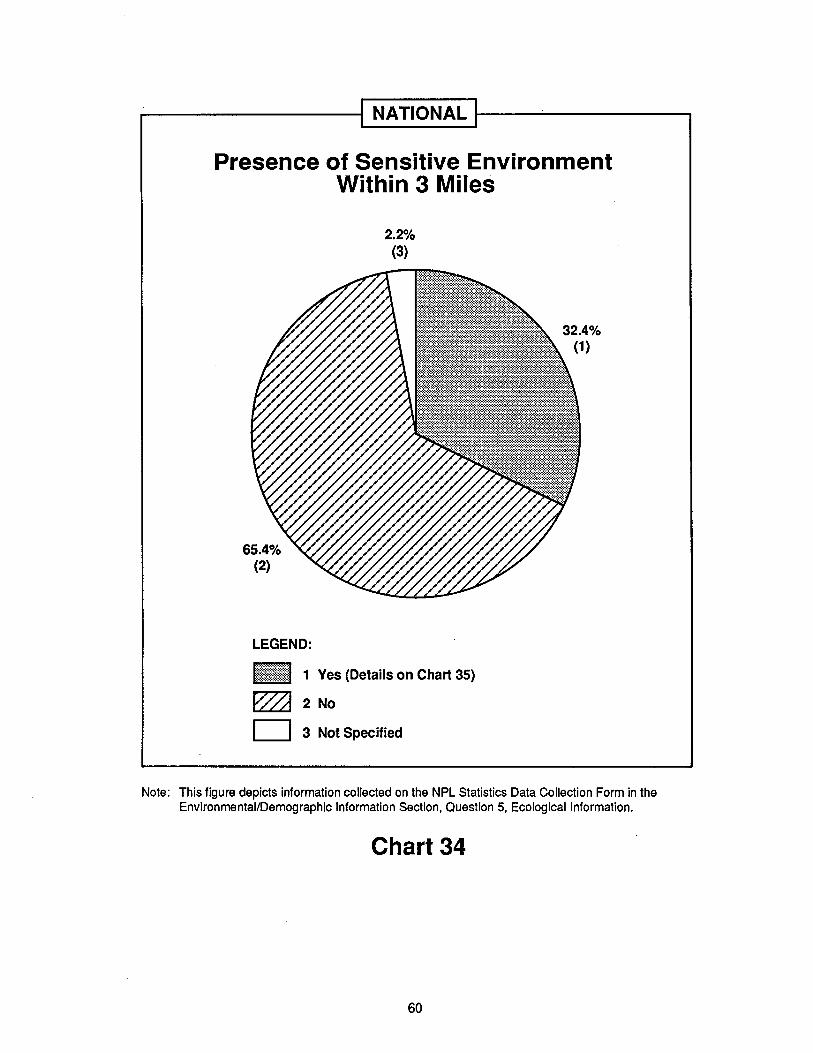
r-----------1 NATIONAL 1------.;....-----....,
Presence of Sensitive EnvironmentWithin 3 Miles
2.2%(3)
65.4%(2)
LEGEND:
I~i~i~~~i~i~~~i~i~itl 1 Yes (Details on Chart 35)
~ 2No
D 3 Not Specified
Note: This figure depicts information collected on the NPL Statistics Data Collection Form in theEnvironmentallDemographic Information Section, Question 5, Ecological Information.
Chart 34
60
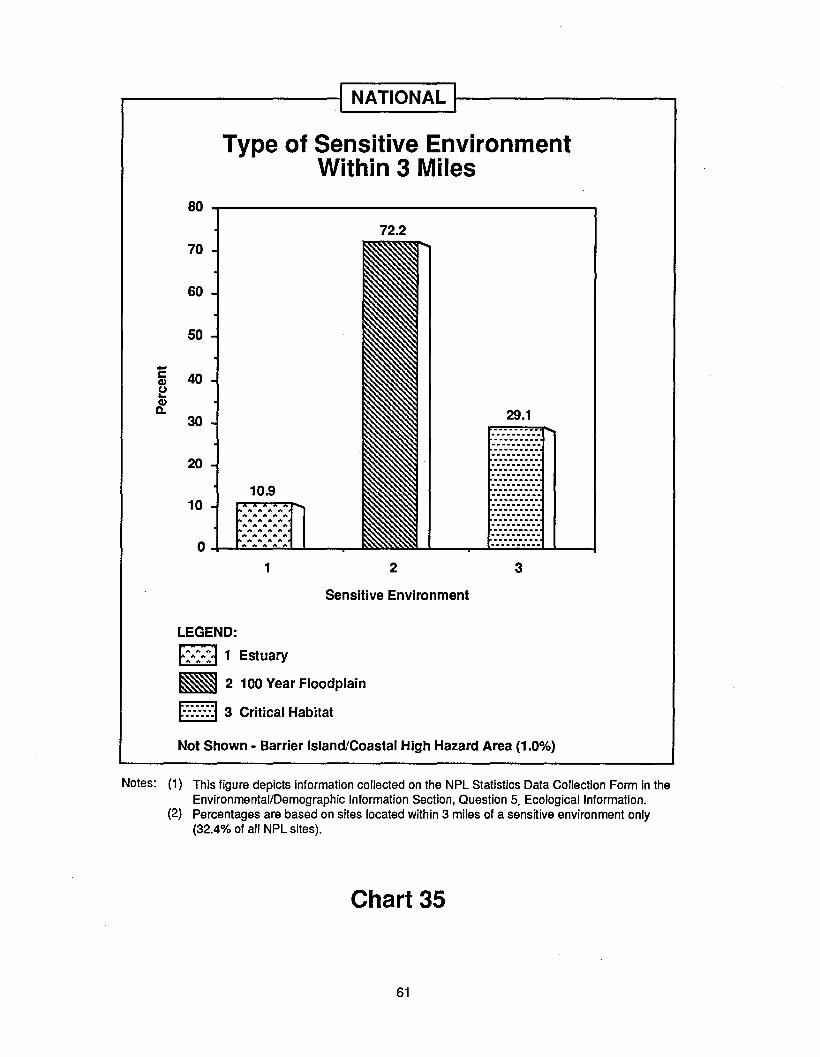
NATIONAL 1-----------,
Type of Sensitive EnvironmentWithin 3 Miles
72.2
80
70
60
50
-c: 40(I)
~(I)D.
30
20
10.910
A "" "" ""A "'" A A A</Ie "" ". A
"" ..... "" A ""A "'" A A
"'" A A A ...
0 A ... "'" """A"""" ... ""
1 2
29.1.. _--- .... _-- ......._------ ..._-- .... _- ...... _-- ........ _--.. -._ -.... _- .--_ _.-........................._-..........................._.........................._-.._-- ..... _- .-- _--
3
Sensitive Environment
LEGEND:
F:,.:,.:J 1 Estuary
• 2 100 Year Floodplain
t-:-:-:-:-:-:) 3 Critical Habitat
Not Shown - Barrier Island/Coastal High Hazard Area (1.0%)
Notes: (1) This figure depicts information collected on the NPL Statistics Data Collection Form in theEnvironmentallDemographic Information Section, Question 5, Ecological Information.
(2) Percentages are based on sites located within 3 miles of a sensitive environment only(32.4% of all NPL sites).
Chart 35
61

CHAPTER 9: WATER USE INFORMATION
• Chart 36: Withdrawals for Drinking Water Supply Within 3 Miles:Source
• Chart 37: Withdrawals for Drinking Water Supply Within 3 Miles:Population Served
• Chart 38: Withdrawals for Drinking Water Supply Within 3 Miles: Type
• Chart 39: Local Ground Water Uses Other Than Drinking Water
• Chart 40: Operable Wells Within 1 Mile
• Chart 41: Operable Wells Within 3 Miles
• Cbart 42: Number of Wells Within 1 Mile
• Chart 43: Number of Wells Within 3 Miles
• Chart 44: Distance to Nearest Well
• Chart 45: Local Surface Water Uses Other Than Drinking Water
• Chart 46: Distance to Nearest Downstream Intake
62

NATIONAL 1--------....,
Withdrawals for Drinking Water SupplyWithin 3 Miles: Source
2.5% 1.8%(4) (1)·
82.5%(2)
LEGEND:
o 1 Surface Water
I~~~~~~~~~~~~~I~~~~~~~~U 2 Ground Water
~ 3 Surface and Ground Water
_ 4 None
Not Shown - Not Specified (0.2%)
Note: This figure depicts information collected on the NPL Statistics Data Collection Form in theEnvironmentallDemographic Information Section, Question 4a, Local Drinking Water SupplySource.
Chart 36
63
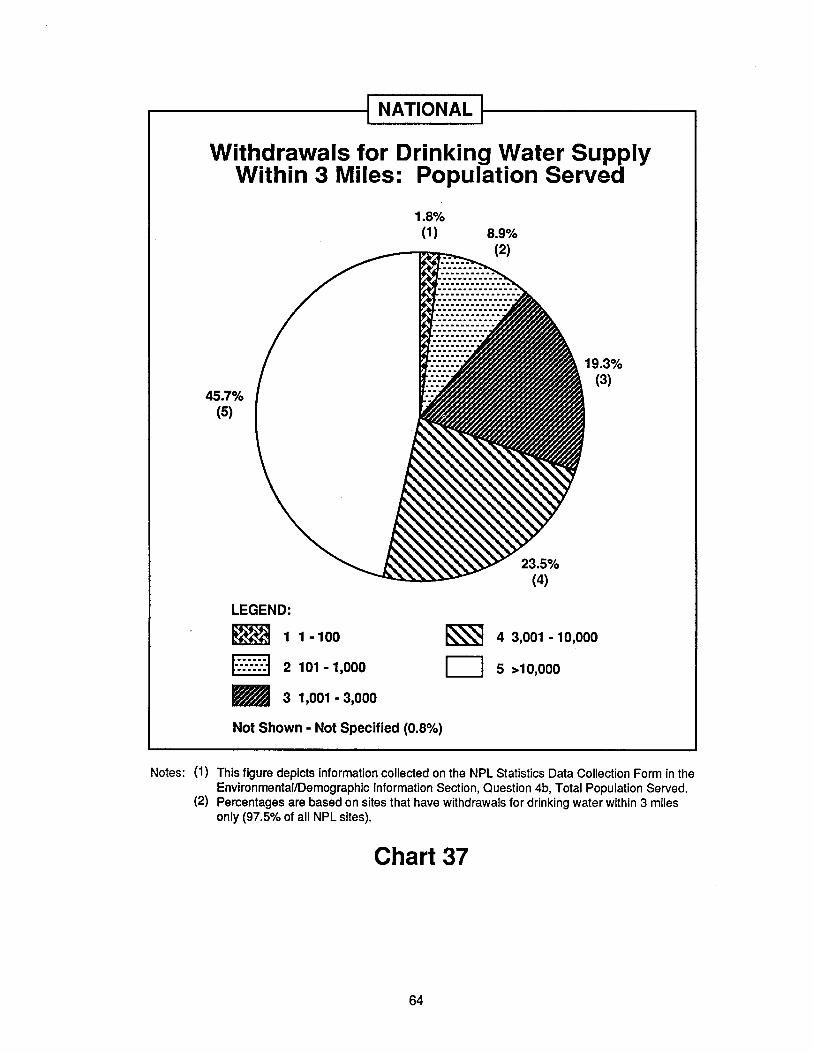
...------------t NATIONAL 1---------...,
Withdrawals for Drinking Water SupplyWithin 3 Miles: Population Served
19.3%(3)
1.8%(1) 8.9%
(2)
45.7%(5)
LEGEND:
~ 11·100
f::::::] 2 101· 1,000
• 3 1,001 ·3,000
Not Shown· Not Specified (0.8%)
~ 4 3,001 ·10,000
D 5 >10,000
Notes: (1) This figure depicts information collected on the NPL Statistics Data Collection Form in theEnvironmentallDemographic Information Section, Question 4b, Total Population Served.
(2) Percentages are based on sites that have withdrawals for drinking water within 3 milesonly (97.5% of all NPL sites).
Chart 37
64

r-----------; NATIONAL 1---------...,
Withdrawals for Drinking Water SupplyWithin 3 Miles: Type
100 ,..----------------------,
80.4
2.5
lui 3 None
123Drinking Water Supply Type
LEGEND:
~ 1 Municipal
~ 2 Private
Not Shown - Not Specified (0.5%)
Note: This figure depicts information collected on the NPL Statistics Data Collection Form in theEnvironrnentallDemographic Information Section, Question 4c, Drinking Water Supply SystemType.
Chart 38
65
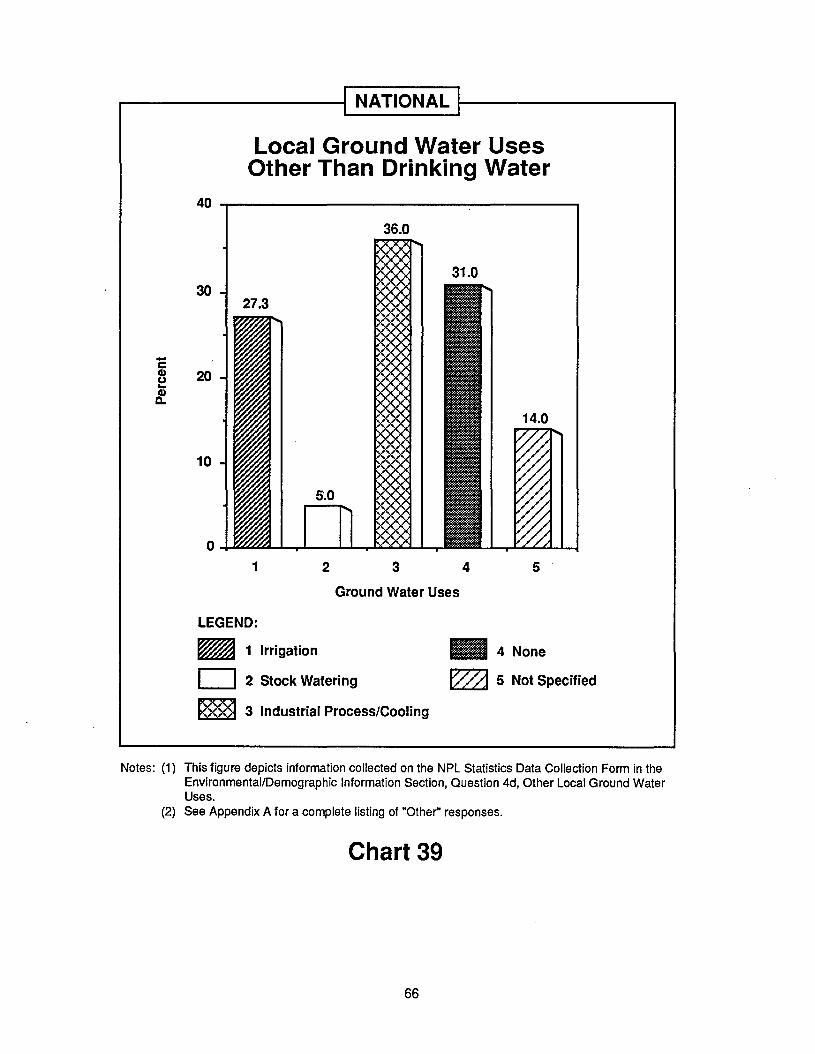
NATIONAL 1-----------,
Local Ground Water UsesOther Than Drinking Water
40 .,.....-------------------,
36.0
31.0
5.0
1 2 3
Ground Water Uses
4 5
LEGEND:
• 1 Irrigation
D 2 Stock Watering
~ 3 Industrial Process/Cooling
• 4 None
~ 5 Not Specified
Notes: (1) This figure depicts information collected on the NPL Statistics Data Collection Form in theEnvironmental/Demographic Information Section, Question 4d, Other Local Ground WaterUses.
(2) See Appendix A for a complete listing of "Other" responses.
Chart 39
66
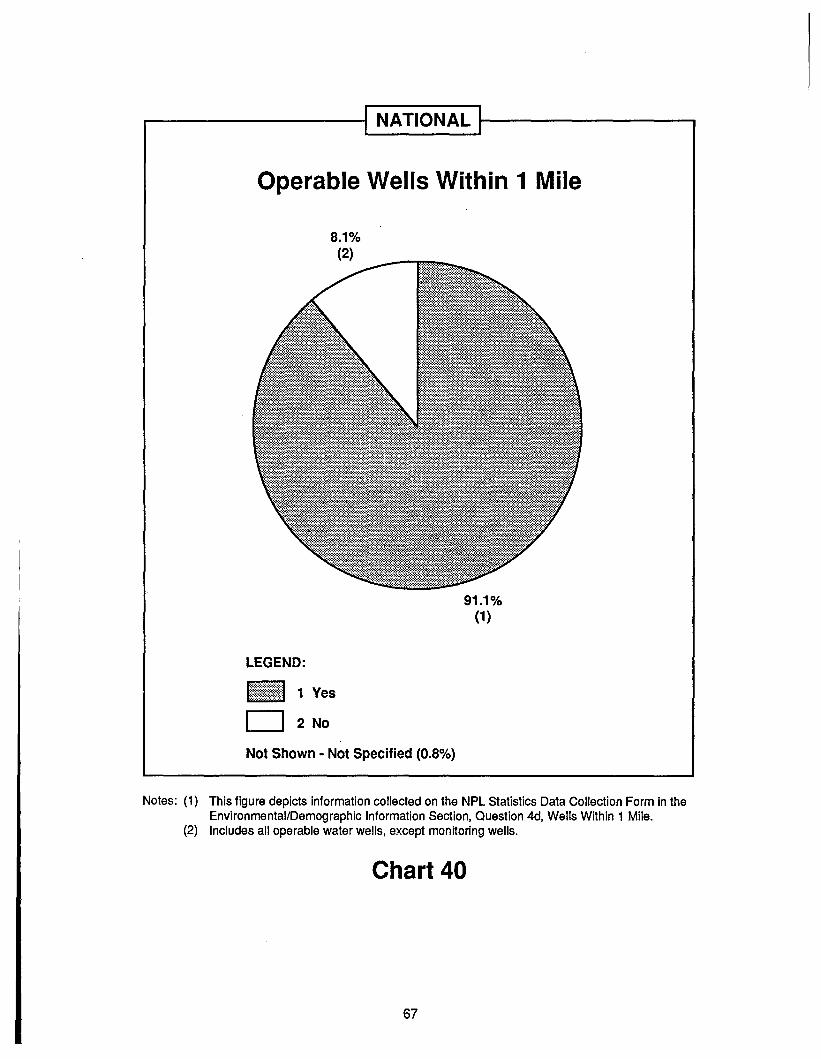
NATIONAL to-----------,
Operable Wells Within 1 Mile
8.1%(2)
91.1%(1)
LEGEND:
1~~i!~~~m~~~~!:1 1 Ves
D 2No
Not Shown· Not Specified (0.8%)
Notes: (1) This figure depicts information collected on the NPL Statistics Data Collection Form in theEnvironmental/Demographic Information Section, Question 4d, Wells Within 1 Mile.
(2) Includes all operable water wells, except monitoring wells.
Chart 40
67
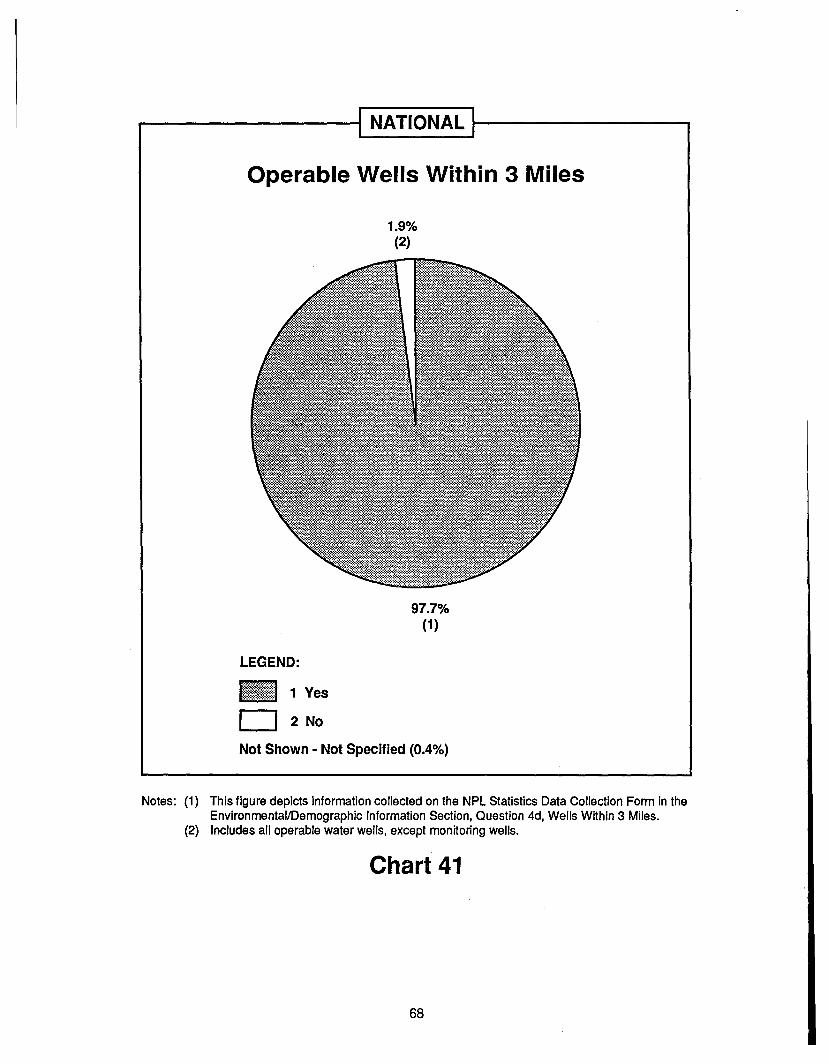
NATIONAL t------------,
Operable Wells Within 3 Miles
1.9%(2)
97.7%(1)
LEGEND:
~1lW~~~~11 1 Ves
D 2No
Not Shown· Not Specified (0.4%)
Notes: (1) This figure depicts information collected on the NPL Statistics Data Collection Form in theEnvironmentallDemographic Information Section, Question 4d, Wells Within 3 Miles.
(2) Includes all operable water wells, except monitoring wells.
Chart 41
68
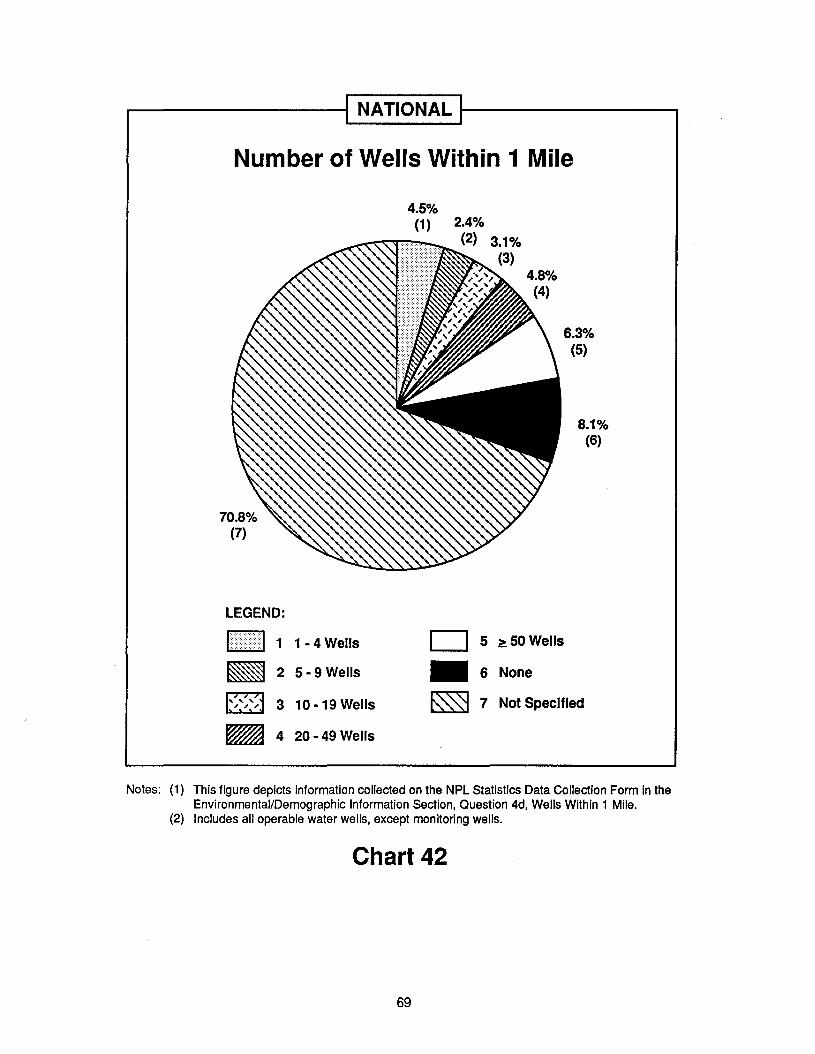
NATIONAL 1-------------,
Number of Wells Within 1 Mile
4.5%(1)
6.3%(5)
8.1%(6)
LEGEND:
• 1 1 ·4 Wells • 5 ~50We"s
• 2 5·9 Wells • 6 None
• 3 10 ·19 Wells ~ 7 Not Specified~ ~ ~.
• 4 20·49 Wells
Notes: (1) This figure depicts information collected on the NPL Statistics Data Collection Form in theEnvironmental/Demographic Information Section, Question 4d, Wells Within 1 Mile.
(2) Includes all operable water wells, except monitoring wells.
Chart 42
69

NATIONAL 1---------...,
Number of Wells Within 3 Miles
29.4%(5)
3.8%(3)
3.4%(1)
6.4%.(4)51.9%
(7)
1.9%(6)
LEGEND:
• 1 1 ·4 Wells 0 5 ~50 Wells
• 2 5·9 Wells • 6 None
~ 3 10 ·19 Wells ~ 7 Not Specified~ ~.........
• 4 20·49 Wells
Notes: (1) This figure depicts information collected on the NPL Statistics Data Collection Form in theEnvironmental/Demographic Information Section, Question 4d, Wells Within 3 Miles.
(2) Includes all operable water wells, except monitoring wells.
Chart 43
70
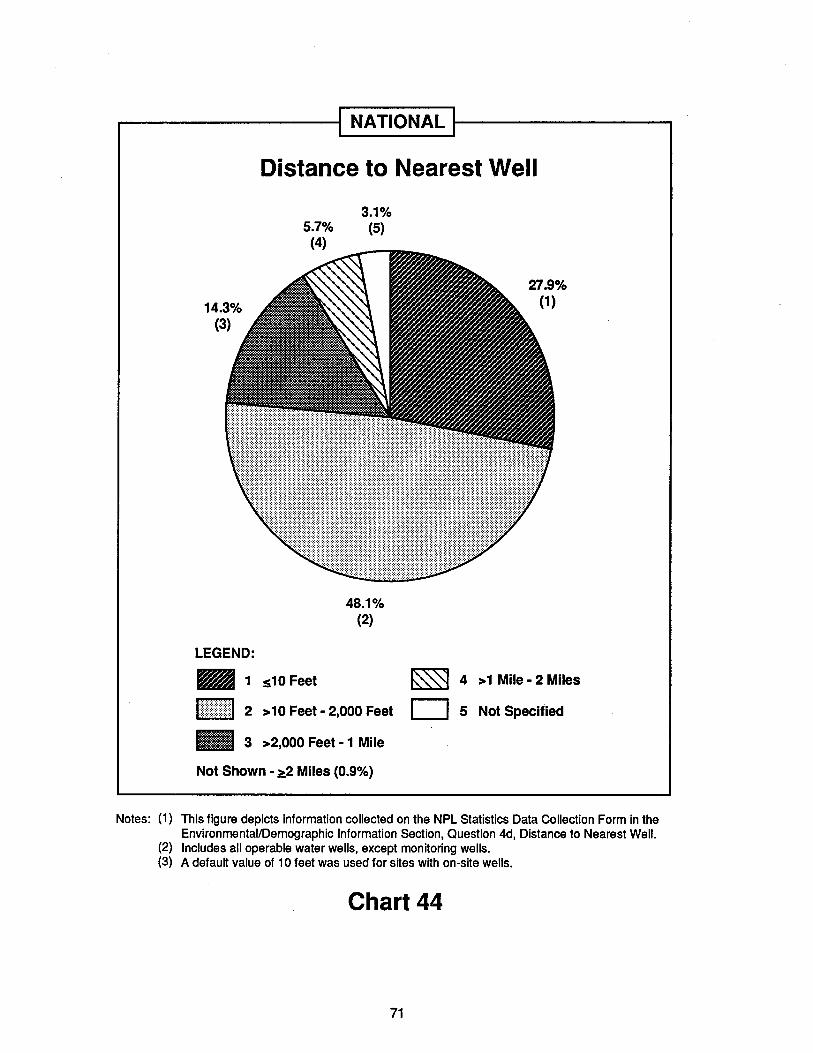
NATIONAL t------------,
Distance to Nearest Well
14.3%(3)
5.7%(4)
3.1%(5)
48.1%(2)
27.9%(1)
LEGEND:
• 1 .s10Feet
I:::~~~~::~::':~:::::~:~~:I 2 >10 Feet· 2,000 Feet
• 3 >2,000 Feet· 1 Mile
Not Shown· ~2 Miles (0.9%)
~ 4 >1 Mile· 2 Miles
D 5 Not Specified
Notes: (1) This figure depicts Information collected on the NPL Statistics Data Collection Form in theEnvironmentallDemographic Information Section, Question 4d, Distance to Nearest Well.
(2) Includes all operable water wells, except monitoring wells.(3) A default value of 10 feet was used for sites with on-site wells.
Chart 44
71
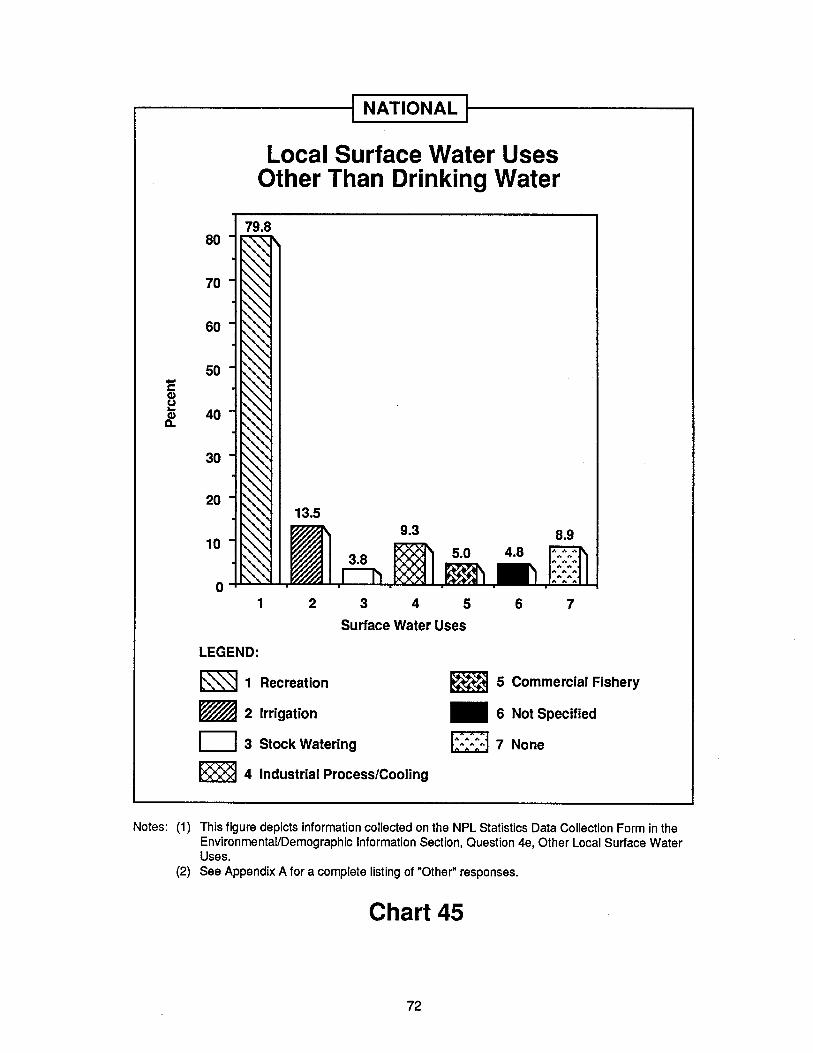
NATIONAL
Local Surface Water UsesOther Than Drinking Water
79.880
70
60
50-cCI)(,)~ 40CI)D.
30
20
10
01 2 3 4 5 6 7
Surface Water Uses
LEGEND:
~ 1 Recreation
~ 2 Irrigation
o 3 Stock Watering
~ 4 Industrial Process/Cooling
~ 5 Commercial Fishery
• 6 Not Specified
J::::::J 7 None
Notes: (1) This figure depicts information collected on the NPL Statistics Data Collection Form in theEnvironmentallDemographic Information Section, Question 4e, Other Local Surface WaterUses.
(2) See Appendix A for a complete listing of "Other" responses.
Chart 45
72

ZocDen
c_.tn,..Q)j()CD...0ZCDQ)
Z-:CD »tn :::!...
0C z0 »~ r-jtn,..-:CDQ)
3-j,..Q)~CD
f')N~o
...--~NO-'if.
..._ UIQ) ,_Co)
'if.
N-,Co) (X)-'if.
Co)-,oCloUl-'if.
- -, ............ '"~ ~ ~ ~ ~ , , , , ,
... ... ... ... ... ... ... ... ... ... ... ..., , , , , , , , , , / , / / -... ... ... ... ... ... ... ... ... ... ... ... ... ... ... ...~ , / / , / / / , / / / / , / / /
... ... ... ... ... ... ... ... ... ... ... ... ... ... ... ... .../ / / / / , / , , , , / / / / , / /... ... ... ... ... ... ... ... ... ... ... ... ... ... ... ... ... ...
/ / / / / / , / / , , , / / / / / /... ... ... ... ... ... ... ... ... ... ... ... ... ... ... ... ... .../ , / / / / / / , / / / / , / / , /... ... ... ... ... ... ... ... ... ... ... ... ... ... ... ... ... ...
/ / / / , / / / / / , / , / / / / / /... ... ... ... ... ... ... ... ... ... ... ... ... ... ... ... ... ...
/ / / , / , / / / / / / , / / , / /... ... ... ... ... ... ... ... ... ... ... ... ... ... ... ... ... ...
/ / , / / / , / / / / / / / / / , /... ... ... ... ... ... ... ... ... ... ... ... ... ... ... ... ... ... .../ , / , / / / / / , / / , / , / / /
... ... ... ... ... ... ... ... ... ... ... ... ... ... ... ... ... .../ / / / , / / , / , / , / , / , / /
... ... ... ... ... ... ... ... ... ... ... ... ... ... ... ... ..., / / / / , / , / , / / / / , / / ~... ... ... ... ... ... ... ... ... ... ... ... ... ... ... ... ... .../ , / / , / , / / / ~ ~ ~ ~ ~ ~ ~" " " " , , , , , , , , , , , , ,~ ~ ~ ~ ~ ~ ~ ~ ~ ~ ~ ~ ~ ~ ~ ~, , , , , " , , , , , , , , , ,~ ~ ~ ~ ~ ~ ~ ~ ~ ~ ~ ~ ~ ~ ~ ~, , , , , , , , , , " , , , , "
~ ~ ~ ~ ~ ~ ~ ~ ~ ~ ~ ~ ~ ~ ~ ~
""'''''''''''''',....h::'~__~~ ~ ~ ~ ~ ~ ~ ~ ~ , ~ ~ ~ , ~ ~ ~~~~~~.-_--
' ....','~' ....'~' ....'~"~"" ','~'"'"' ....'~'~ .... ..., , , , , , , , , , , , , , , , , , »~
.... ,~~~ .... ~~" .... , .... "~,,~,, ::::...., , , , , , , , , , , , , , , , , , :::;:;::.•..~,;,;,;,~,~,;,;,~,~,;,;,;,;,~,;,;,;,~~::::t~~~~;~;i~i:~:.;~~"""""""" ...... , ":::::::::::~ .... ~,,~~, .... ~ .... ~~~~ .... ,,~~~ ":::::::" ... "" ... ", ... "" ......... , "::'~ ~ .... .... " .... .... .... ~ ~ .... .... , " " " ~ ~ .... "" , , , , , , , , , , , , , , , , " " ...
~ .... , .... ~ .... .... ~ ~ .... ~ " .... " ~ ~ , ~ ~ .... - -.,., , , , , , , , , , , " , , , , , "'- , " , ~.:::...~ ............ "~ ........ ~~~ ........ ~~ .... ,, .... ~"" "::::~:"'- , , , , , , ... , , , , , , , " , , " " ~
.... ~ .... .... ~ .... ~ ~ ~ ~ .... ~ .... .... .... " .... .... .... ~ ", " , , , ... " " , " , , , , , , , "'- ... , ...~ .... .... .... .... ~ ~ .... .... .... ~ .... .... " .... .... ~ ~ .... " ...." , , , , " " , , , , , , , , , , " , , ,
.... .... .... .... ~ ~ .... .... .... ~ ~ .... " ~ " .... .... ~ " " ,, , " , " " , , " ... " , , , , ... , , ,~ .... .... ~ .... .... " ~ .... .... " " .... .... .... .... .... "~ , , , ... , , ... ... ... ... , , " , , ,
J " ~ .... " ~ .... .... " .... ~ ~ .... " ...., , , , , , , , , , , ... "- ...."................ ~ ~ .... ....
:::':::,',',','''::;
rmG')mzc
oClo
VN
~(j)til•
Co)
s:CDtil
...~boo"T1I'D!2.
UI
zo::::JI'D
:E==::::r5:Co)
~CDtil
~CD
N
VNboo
~I'D•...
II.)
s:CDtil
s:CD
Co)
V...
Q)
zgen
"CI'Do=(D'0.
~§§D
I RlI1:~:::11:::1~j111111j1jjj
5'::T<D
.-.-L-
5"om-l00::::l::rE" :e S. (ij0
g.~o=en ...... ::::ltelm3 ~~1Il<D<D-33.0.
_1Il<D3. C§ 12o~<D~~ 3 _.
o ::::ltel ......... 0III ....
-0 3::rillcr g:5"::::l..... 0o 0
3ijfan_0<Dgo.(/)0<D ::::ln::Tc5" <D::::lZ
o~f5g)!a IIIo' =:::::l!a~ cr<D en- 0Q~!a IIIlila::::l 0£ijf...... 00 ......Z o'<D ::::l1Il"TlmQ!a3
5'iiiA<D.en::::l5a~.
!a
::Toen<Dc:en<D0.o....
o-0
<Diil0"(Denc:~IIIo<D:e
*....
0.:::::!.::::lA5'
tel:e
*....enc:
-0-0~
:§
o::rQ)-:...~en
Cj

APPENDIX A: RESPONSES FROM ·OTHER" CATEGORY
74
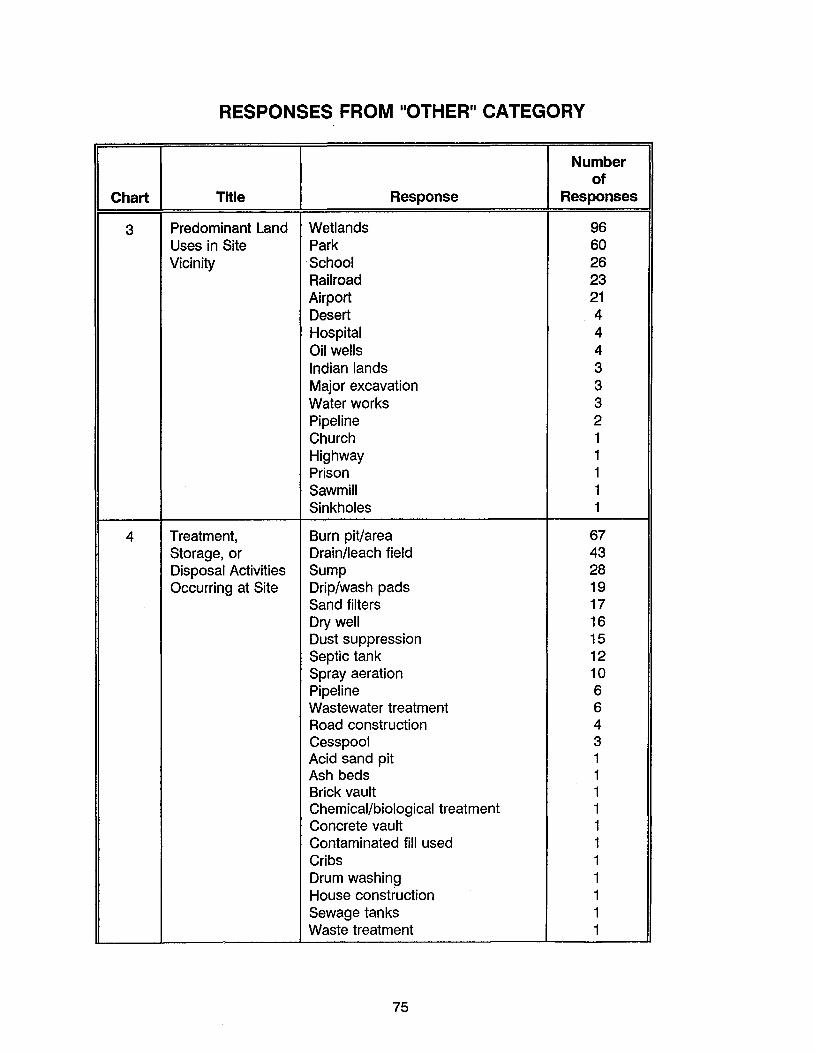
RESPONSES FROM "OTHER" CATEGORY
Numberof
Chart Title Response Responses
3 Predominant Land Wetlands 96Uses in Site Park 60Vicinity .School 26
Railroad 23Airport 21Desert 4Hospital 4Oil wells 4Indian lands 3Major excavation 3Water works 3Pipeline 2Church 1Highway 1Prison 1Sawmill 1Sinkholes 1
4 Treatment, Burn pit/area 67Storage, or Drain/leach field 43Disposal Activities Sump 28Occurring at Site Drip/wash pads 19
Sand filters 17Dry well 16Dust suppression 15Septic tank 12Spray aeration 10Pipeline 6Wastewater treatment 6Road construction 4Cesspool 3Acid sand pit 1Ash beds 1Brick vault 1Chemical/biological treatment 1Concrete vault 1Contaminated fill used 1Cribs 1Drum washing 1House construction 1Sewage tanks 1Waste treatment 1
75
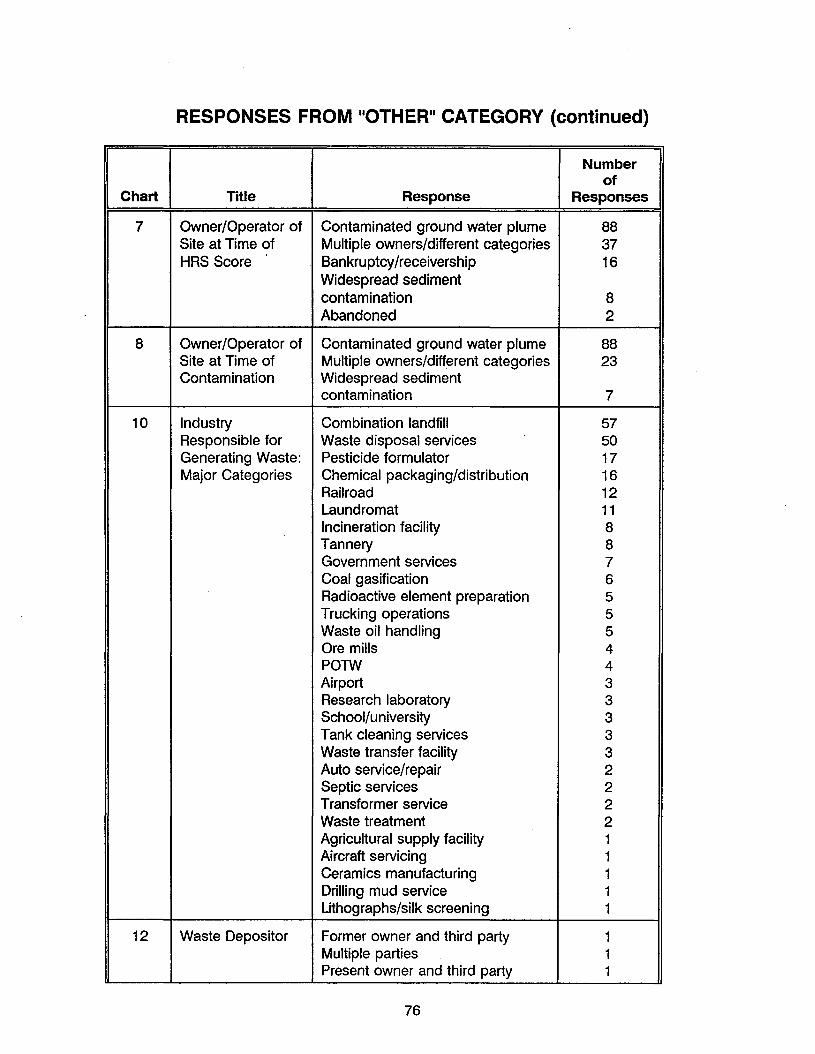
RESPONSES FROM "OTHER" CATEGORY (continued)
Numberof
Chart Title Response Responses
7 Owner/Operator of Contaminated ground water plume 88Site at Time of Multiple owners/different categories 37HRS Score Bankruptcy/receivership 16
Widespread sedimentcontamination 8Abandoned 2
8 Owner/Operator of Contaminated ground water plume 88Site at Time of Multiple owners/different categories 23Contamination Widespread sediment
contamination 7
10 Industry Combination landfill 57Responsible for Waste disposal services 50Generating Waste: Pesticide formulator 17Major Categories Chemical packaging/distribution 16
Railroad 12Laundromat 11Incineration facility 8Tannery 8Government services 7Coal gasification 6Radioactive element preparation 5Trucking operations 5Waste oil handling 5Ore mills 4POTW 4Airport 3Research laboratory 3School/university 3Tank cleaning services 3Waste transfer facility 3Auto service/repair 2Septic services 2Transformer service 2Waste treatment 2Agricultural supply facility 1Aircraft servicing 1Ceramics manufacturing 1Drilling mud service 1Uthographs/silk screening 1
12 Waste Depositor Former owner and third party 1Multiple parties 1Present owner and third party 1
76
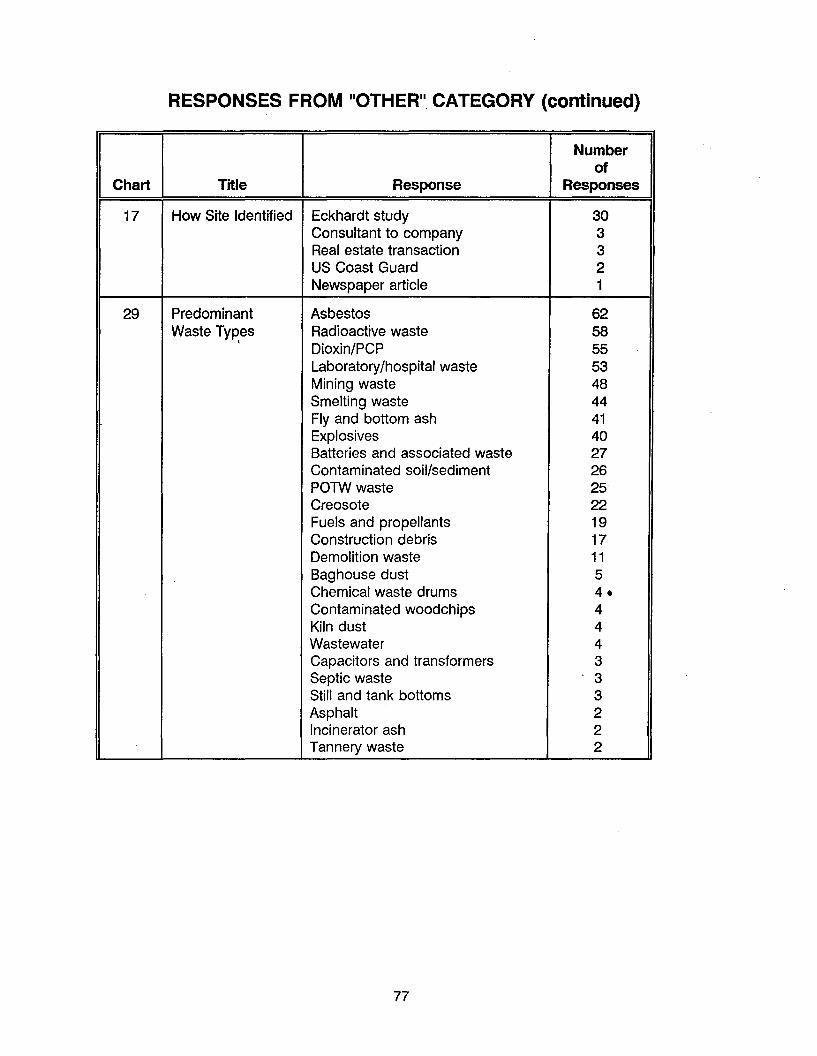
RESPONSES FROM nOTHERn CATEGORY (continued)
Numberof
Chart Title Response Responses
17 How Site Identified Eckhardt study 30Consultant to company 3Real estate transaction 3US Coast Guard 2Newspaper article 1
29 Predominant Asbestos 62Waste Types Radioactive waste 58.
Dioxin/PCP 55Laboratory/hospital waste 53Mining waste 48Smelting waste 44Fly and bottom ash 41Explosives 40Batteries and associated waste 27Contaminated soil/sediment 26POTW waste 25Creosote 22Fuels and propellants 19Construction debris 17Demolition waste 11Baghouse dust 5Chemical waste drums 4.Contaminated woodchips 4Kiln dust 4Wastewater 4Capacitors and transformers 3Septic waste 3Still and tank bottoms 3Asphalt 2Incinerator ash 2Tannery waste 2
77
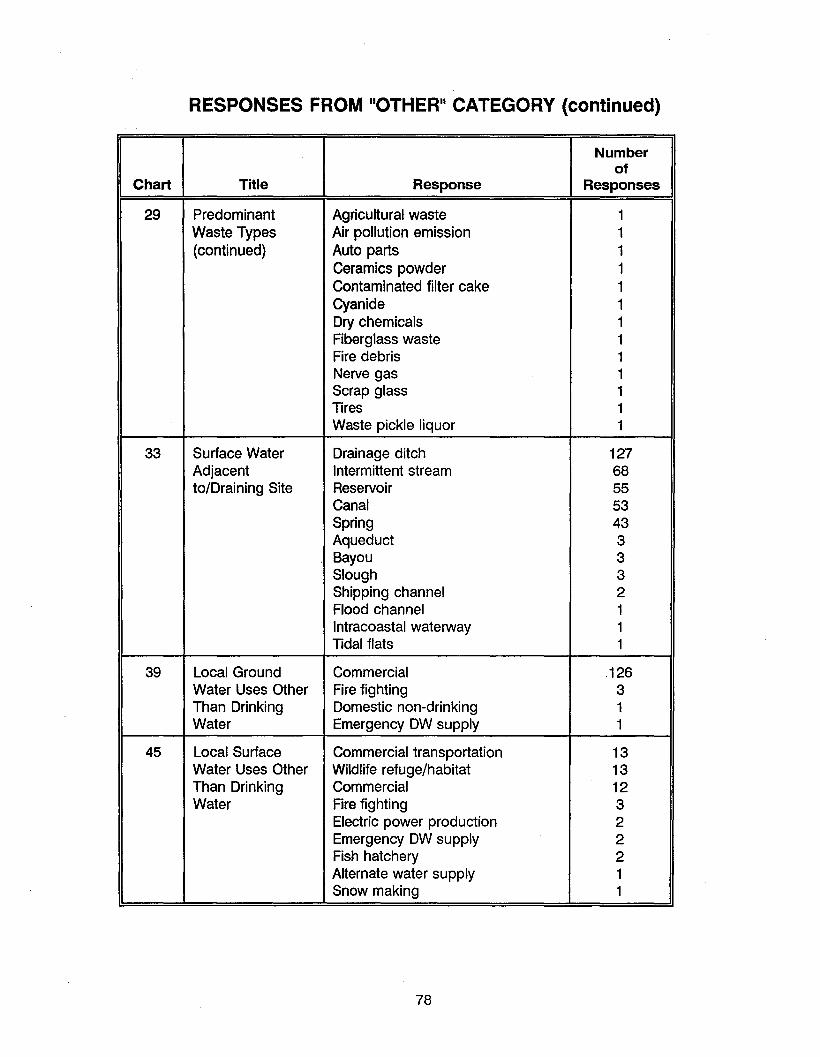
RESPONSES FROM nOTHERn CATEGORY (continued)
Numberof
Chart Title Response Responses
29 Predominant Agricultural waste 1Waste Types Air pollution emission 1(continued) Auto parts 1
Ceramics powder 1Contaminated filter cake 1Cyanide 1Dry chemicals 1Fiberglass waste 1Fire debris 1Nerve gas 1Scrap glass 1Tires 1Waste pickle liquor 1
33 Surface Water Drainage ditch 127Adjacent Intermittent stream 68to/Draining Site Reservoir 55
Canal 53Spring 43Aqueduct 3Bayou 3Slough 3Shipping channel 2Flood channel 1Intracoastal waterway 1Tidal flats 1
39 Local Ground Commercial 126Water Uses Other Fire fighting 3Than Drinking Domestic non-drinking 1Water Emergency OW supply 1
45 Local Surface Commercial transportation 13Water Uses Other Wildlife refuge/habitat 13Than Drinking Commercial 12Water Fire fighting 3
Electric power production 2Emergency OW supply 2Fish hatchery 2Alternate water supply 1Snow making 1
78
APPENDIX B: SITES REVIEWED
79
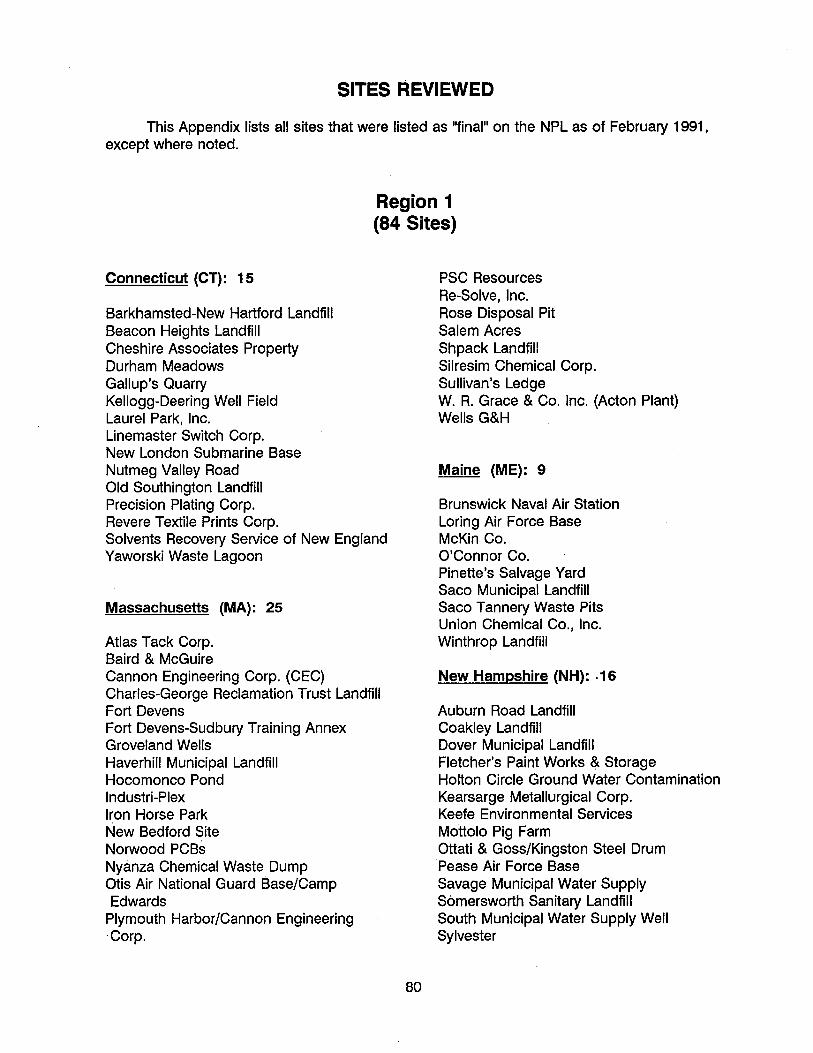
SITES REVIEWED
This Appendix lists all sites that were listed as ''final'' on the NPL as of February 1991,except where noted.
Region 1(84 Sites)
Connecticut (Cl): 15
Barkhamsted-New Hartford LandfillBeacon Heights LandfillCheshire Associates PropertyDurham MeadowsGallup's QuarryKellogg-Deering Well FieldLaurel Park, Inc.Linemaster Switch Corp.New London Submarine BaseNutmeg Valley RoadOld Southington LandfillPrecision Plating Corp.Revere Textile Prints Corp.Solvents Recovery Service of New EnglandYaworski Waste Lagoon
Massachusetts (MA): 25
Atlas Tack Corp.Baird & McGuireCannon Engineering Corp. (CEe)Charles-George Reclamation Trust LandfillFort DevensFort Devens-Sudbury Training AnnexGroveland WellsHaverhill Municipal LandfillHocomonco PondIndustri-PlexIron Horse ParkNew Bedford SiteNorwood PCBsNyanza Chemical Waste DumpOtis Air National Guard Base/CampEdwards
Plymouth Harbor/Cannon Engineering.Corp.
80
PSC ResourcesRe-Solve, Inc.Rose Disposal PitSalem AcresShpack LandfillSilresim Chemical Corp.Sullivan's LedgeW. R. Grace & Co. Inc. (Acton Plant)Wells G&H
Maine (ME): 9
Brunswick Naval Air StationLoring Air Force BaseMcKin Co.O'Connor Co.Pinette's Salvage YardSaco Municipal LandfillSaco Tannery Waste PitsUnion Chemical Co., Inc.Winthrop Landfill
New Hampshire (NH): .16
Auburn Road LandfillCoakley LandfillDover Municipal LandfillFletcher's Paint Works & StorageHolton Circle Ground Water ContaminationKearsarge Metallurgical Corp.Keefe Environmental ServicesMottolo Pig FarmOttati & Goss/Kingston Steel DrumPease Air Force BaseSavage Municipal Water SupplySomersworth Sanitary LandfillSouth Municipal Water Supply WellSylvester
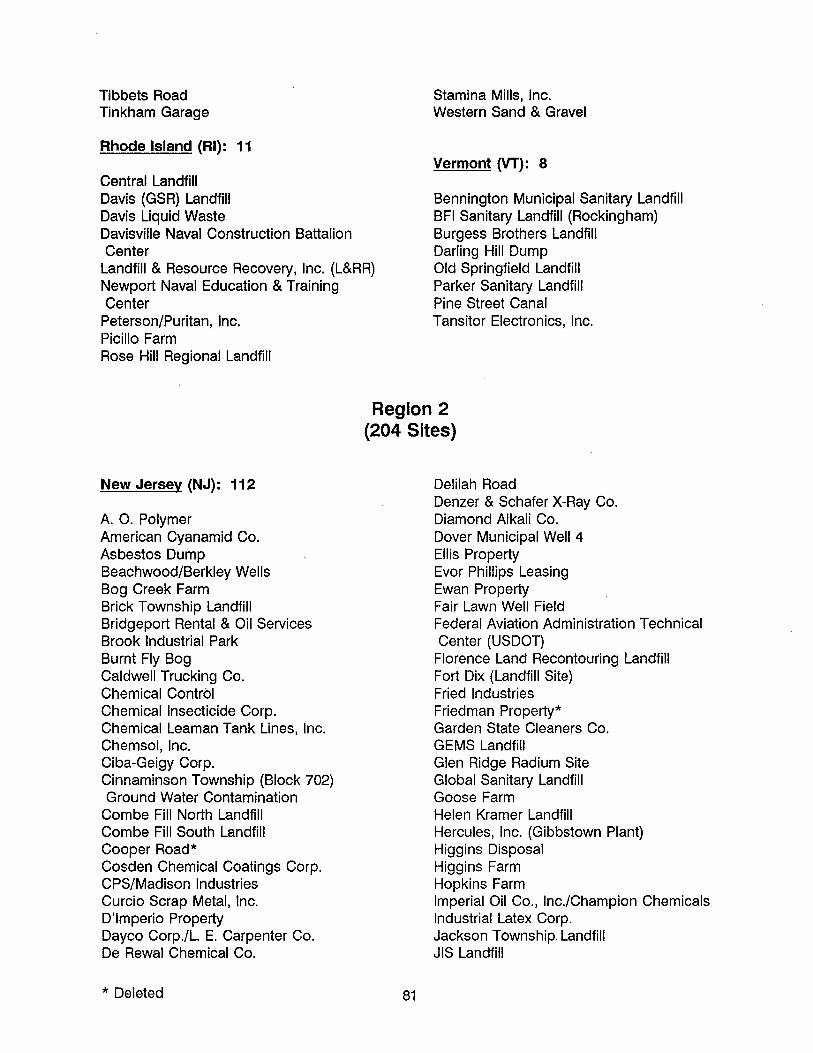
Tibbets RoadTinkham Garage
Rhode Island (RI): 11
Central LandfillDavis (GSR) LandfillDavis Liquid WasteDavisville Naval Construction BattalionCenter
Landfill & Resource Recovery, Inc. (L&RR)Newport Naval Education & TrainingCenter
Peterson/Puritan, Inc.Picillo FarmRose Hill Regional Landfill
Stamina Mills, Inc.Western Sand & Gravel
Vermont (VT): 8
Bennington Municipal Sanitary LandfillBFI Sanitary Landfill (Rockingham)Burgess Brothers LandfillDarling Hill DumpOld Springfield LandfillParker Sanitary LandfillPine Street CanalTansitor Electronics, Inc.
New Jersey (NJ): 112
A. O. PolymerAmerican Cyanamid Co.Asbestos DumpBeachwood/Berkley WellsBog Creek FarmBrick Township LandfillBridgeport Rental & Oil ServicesBrook Industrial ParkBurnt Fly BogCaldwell Trucking Co.Chemical ControlChemical Insecticide Corp.Chemical Leaman Tank Lines, Inc.Chemsol, Inc.Ciba-Geigy Corp.Cinnaminson Township (Block 702)Ground Water Contamination
Combe Fill North LandfillCombe Fill South LandfillCooper Road*Cosden Chemical Coatings Corp.CPS/Madison IndustriesCurcio Scrap Metal, Inc.D'imperio PropertyDayco Corp./L. E. Carpenter Co.De Rewal Chemical Co.
* Deleted
Region 2(204 Sites)
Delilah RoadDenzer & Schafer X-Ray Co.Diamond Alkali Co.Dover Municipal Well 4Ellis PropertyEvor Phillips LeasingEwan PropertyFair Lawn Well FieldFederal Aviation Administration TechnicalCenter (USDOT)
Florence Land Recontouring LandfillFort Dix (Landfill Site)Fried IndustriesFriedman Property*Garden State Cleaners Co.GEMS LandfillGlen Ridge Radium SiteGlobal Sanitary LandfillGoose FarmHelen Kramer LandfillHercules, Inc. (Gibbstown Plant)Higgins DisposalHiggins FarmHopkins FarmImperial Oil Co., Inc./Champion ChemicalsIndustrial Latex Corp.Jackson Township LandfillJIS Landfill
81
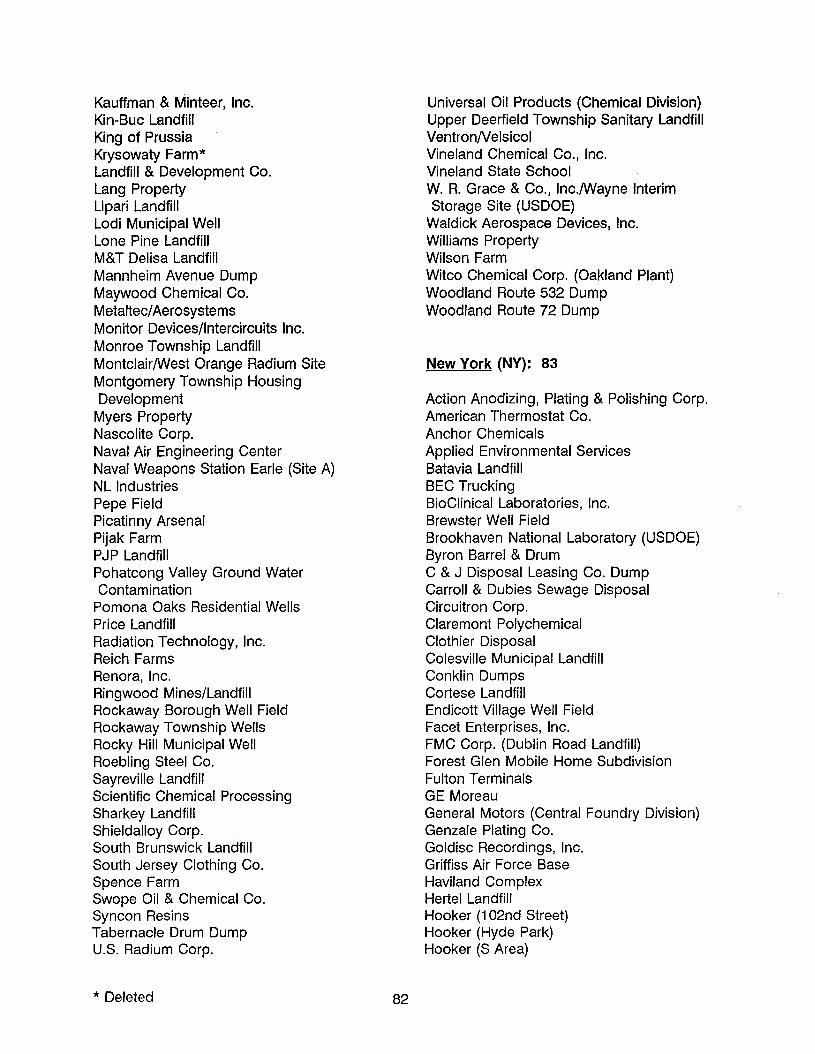
Kauffman & Minteer, Inc.Kin-Buc LandfillKing of PrussiaKrysowaty Farm*Landfill & Development Co.Lang PropertyLipari LandfillLodi Municipal WellLone Pine LandfillM&T Delisa LandfillMannheim Avenue DumpMaywood Chemical Co.Metaltec/AerosystemsMonitor Devices/lntercircuits Inc.Monroe Township LandfillMontclairlWest Orange Radium SiteMontgomery Township HousingDevelopment
Myers PropertyNascolite Corp.Naval Air Engineering CenterNaval Weapons Station Earle (Site A)NL IndustriesPepe FieldPicatinny ArsenalPijak FarmPJP LandfillPohatcong Valley Ground WaterContamination
Pomona Oaks Residential WellsPrice LandfillRadiation Technology, Inc.Reich FarmsRenora, Inc.Ringwood Mines/LandfillRockaway Borough Well FieldRockaway Township WellsRocky Hill Municipal WellRoebling Steel Co.Sayreville LandfillScientific Chemical ProcessingSharkey LandfillShieldalloy Corp.South Brunswick LandfillSouth Jersey Clothing Co.Spence FarmSwope Oil & Chemical Co.Syncon ResinsTabernacle Drum DumpU.S. Radium Corp.
* Deleted 82
Universal Oil Products (Chemical Division)Upper Deerfield Township Sanitary LandfillVentronNelsicolVineland Chemical Co., Inc.Vineland State SchoolW. R. Grace & Co., Inc.lWayne InterimStorage Site (USDOE)
Waldick Aerospace Devices, Inc.Williams PropertyWilson FarmWitco Chemical Corp. (Oakland Plant)Woodland Route 532 DumpWoodland Route 72 Dump
New York (NY): 83
Action Anodizing, Plating & Polishing Corp.American Thermostat Co.Anchor ChemicalsApplied Environmental ServicesBatavia LandfillBEC TruckingBioClinical Laboratories, Inc.Brewster Well FieldBrookhaven National Laboratory (USDOE)Byron Barrel & DrumC & J Disposal Leasing Co. DumpCarroll & Dubies Sewage DisposalCircuitron Corp.Claremont PolychemicalClothier DisposalColesville Municipal LandfillConklin DumpsCortese LandfillEndicott Village Well FieldFacet Enterprises, Inc.FMC Corp. (Dublin Road Landfill)Forest Glen Mobile Home SubdivisionFulton TerminalsGE MoreauGeneral Motors (Central Foundry Division)Genzale Plating Co.Goldisc Recordings, Inc.Griffiss Air Force BaseHaviland ComplexHertel LandfillHooker (102nd Street)Hooker (Hyde Park)Hooker (S Area)
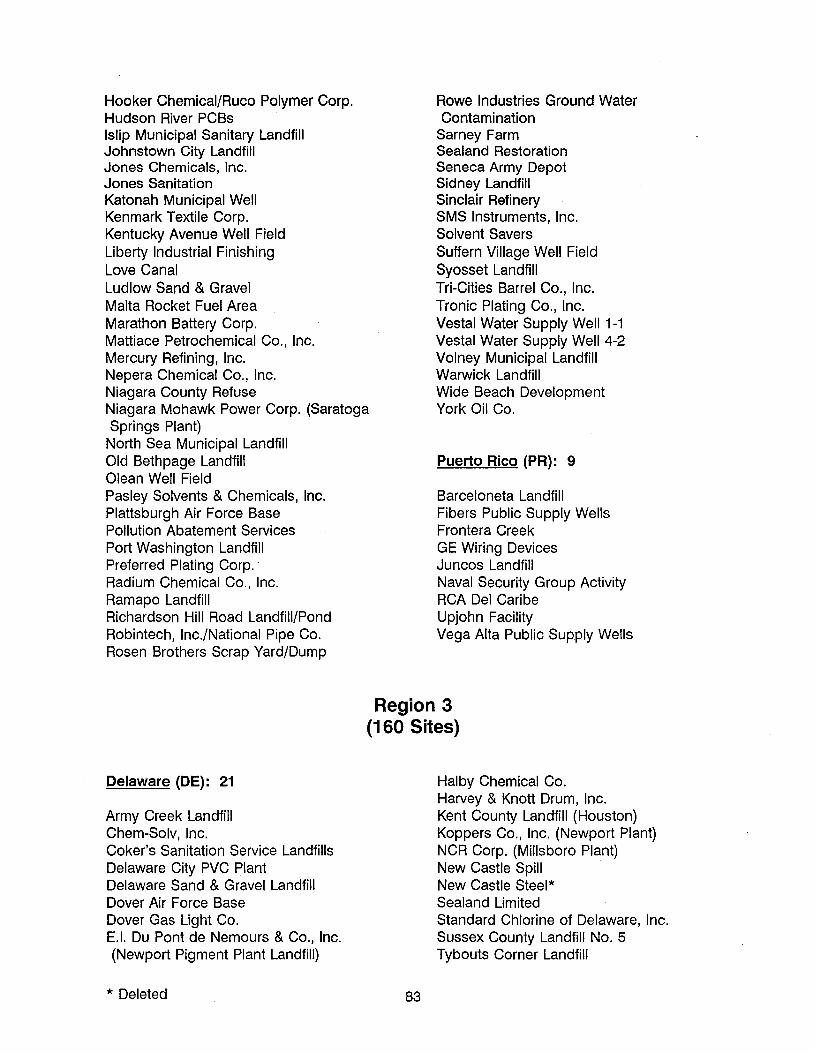
Hooker Chemical/Ruco Polymer Corp.Hudson River PCBsIslip Municipal Sanitary LandfillJohnstown City LandfillJones Chemicals, Inc.Jones SanitationKatonah Municipal WellKenmark Textile Corp.Kentucky Avenue Well FieldLiberty Industrial FinishingLove CanalLudlow Sand & GravelMalta Rocket Fuel AreaMarathon Battery Corp.Mattiace Petrochemical Co., Inc.Mercury Refining, Inc.Nepera Chemical Co., Inc.Niagara County RefuseNiagara Mohawk Power Corp. (SaratogaSprings Plant)
North Sea Municipal LandfillOld Bethpage LandfillOlean Well FieldPasley Solvents & Chemicals, Inc.Plattsburgh Air Force BasePollution Abatement ServicesPort Washington LandfillPreferred Plating Corp.Radium Chemical Co., Inc.Ramapo LandfillRichardson Hill Road Landfill/PondRobintech, Inc./National Pipe Co.Rosen Brothers Scrap Yard/Dump
Rowe Industries Ground WaterContamination
Sarney FarmSealand RestorationSeneca Army DepotSidney LandfillSinclair RefinerySMS Instruments, Inc.Solvent SaversSuffern Village Well FieldSyosset LandfillTri-Cities Barrel Co., Inc.Tronic Plating Co., Inc.Vestal Water Supply Well 1-1Vestal Water Supply Well 4-2Volney Municipal LandfillWarwick LandfillWide Beach DevelopmentYork Oil Co.
Puerto Rico (PR): 9
Barceloneta LandfillFibers Public Supply WellsFrontera CreekGE Wiring DevicesJuncos LandfillNaval Security Group ActivityRCA Del CaribeUpjohn FacilityVega Alta Public Supply Wells
Delaware (DE): 21
Army Creek LandfillChem-Solv, Inc.Coker's Sanitation Service LandfillsDelaware City PVC PlantDelaware Sand & Gravel LandfillDover Air Force BaseDover Gas Light Co.E.1. Du Pont de Nemours & Co., Inc.(Newport Pigment Plant Landfill)
* Deleted
Region 3(160 Sites)
Halby Chemical Co.Harvey & Knott Drum, Inc.Kent County Landfill (Houston)Koppers Co., Inc. (Newport Plant)NCR Corp. (Millsboro Plant)New Castle Spill .New Castle Steel*Sealand LimitedStandard Chlorine of Delaware, Inc.Sussex County Landfill No.5Tybouts Corner Landfill
83

Tyler Refrigeration PitWildcat Landfill
Marvland (MD): 12
Aberdeen Proving Ground (EdgewoodArea)
Aberdeen Proving Ground (MichaelsvilleLandfill)
Anne Arundel County Landfill.Bush Valley LandfillChemical Metals Industries, Inc.*Kane & Lombard Street DrumsLimestone RoadMid-Atlantic Wood Preservers, Inc.Middletown Road Dump*Sand, Gravel & StoneSouthern Maryland Wood TreatingWoodlawn County Landfill
Pennsylvania (PA): 101
A.I.W. Frank/Mid-County MustangAladdin PlatingAmbler Asbestos PilesAMP, Inc. (Glen Rock Facility)Avco Lycoming (Williamsport Division)Bally Ground Water ContaminationBell LandfillBendix Flight Systems DivisionBerkley Products Co. DumpBerks LandfillBerks Sand PitBlosenski LandfillBoarhead FarmsBrodhead CreekBrown's Battery BreakingBruin LagoonButler Mine TunnelButz LandfillC & D RecyclingCentre County KeponeCommodore Semiconductor GroupCraig Farm DrumCroydon TCECryoChem, Inc.Delta Quarries & Disposal, Inc./StotlerLandfill
Dorney Road Landfill
* Deleted 84
Douglassville DisposalDrake ChemicalDublin TCE SiteEast Mount ZionEastern Diversified MetalsElizabethtown LandfillEnterprise Avenue*Fischer & Porter Co.Havertown PCPHebelka Auto Salvage YardHeleva LandfillHellertown Manufacturing Co.Henderson RoadHranica LandfillHunterstown RoadIndustrial LaneJacks Creek/Sitkin Smelting & Refining,Inc.
Keystone Sanitation LandfillKimberton SiteLackawanna RefuseLansdowne Radiation SiteLehigh Electric & Engineering Co.*Letterkenny Army Depot (Property DisposalOffice Area)
Letterkenny Army Depot (Southeast Area)Lindane DumpLord-Shope LandfillMalvern TCEMcAdoo AssociatesMetal BanksMiddletown Air FieldMill Creek DumpModern Sanitation LandfillMoyers LandfillMW ManufacturingNaval Air Development Center (8 WasteAreas)
North Penn - Area 1North Penn - Area 12North Penn - Area 2North Penn - Area 5North Penn - Area 6North Penn - Area 7Novak Sanitary LandfillOccidental Chemical Corp./Firestone Tire &Rubber Co.
Ohio River ParkOld City of York LandfillOsborne Landfill
Palmerton Zinc PilePaoli Rail YardPresque Isle*Publicker Industries Inc.RaymarkRecticon/Allied Steel Corp.Reeser's Landfill*Resin DisposalRevere Chemical Co.River Road Landfill (Waste Management,Inc.)
Route 940 Drum DumpSaegertown Industrial AreaSalford QuarryShriver's CornerStanley KesslerStrasburg LandfillTaylor Borough DumpTobyhanna Army DepotTonolli Corp.Tysons DumpVoortman Farm*Wade (ABM)*Walsh LandfillWestinghouse Electric Corp. (Sharon Plant)Westinghouse Elevator Co. PlantWestline SiteWhitmoyer LaboratoriesWilliam Dick LagoonsYork County Solid Waste and RefuseAuthority Landfill
Virginia rJA): 21
Abex Corp.Arrowhead Associates/Scovill Corp.Atlantic Wood Industries, Inc.Avtex Fibers, Inc.Buckingham County LandfillC & R Battery Co., Inc.Chisman CreekCulpeper Wood Preservers, Inc.Defense General Supply CenterDixie Caverns County LandfillFirst Piedmont Corp. Rock Quarry (Route719)
Greenwood Chemical Co.H & H Inc., Burn PitL. A. Clarke & SonsMatthews Electroplating*Rentokil, Inc. (Virginia Wood PreservingDivision)
Rhinehart Tire Fire DumpSaltville Waste Disposal PondsSaunders Supply Co.Suffolk City LandfillU.S. Titanium
West Virginia (WV): 5
Fike Chemical, Inc.Follansbee SiteLeetown PesticideOrdnance Works Disposal AreasWest Virginia Ordnance
Region 4(158 Sites)
Alabama (AL): 12
Alabama Army Ammunition PlantAnniston Army Depot (Southeast IndustrialArea)
Ciba-Geigy Corp. (Mcintosh Plant)Interstate Lead Co. (ILCO)Mowbray Engineering Co.Olin Corp. (Mcintosh Plant)
'" Deleted 85
Perdido Ground Water ContaminationRedwing Carriers, Inc. (Saraland)Stauffer Chemical Co. (Cold Creek Plant)Stauffer Chemical Co. (LeMoyne Plant)1. H. Agriculture & Nutrition Co.(Montgomery Plant)
Trianaffennessee River
Florida (FL): 54
Agrico Chemical Co.Airco Plating Co.Alpha Chemical Corp.American Creosote Works, Inc. (PensacolaPlant)
Anaconda Aluminum Co./Milgo ElectronicsAnodyne, Inc.B&B Chemical Co., Inc.Beulah LandfillBMI - TextronBrown Wood PreservingCabot/KoppersCecil Field Naval Air StationChemform, Inc.City Industries, Inc.Coleman-Evans Wood Preserving Co.Davie LandfillDubose Oil Products Co.Florida Steel Corp.Gold Coast Oil Corp.Harris Corp. (Palm Bay Plant)Hipps Road LandfillHollingsworth Solderless TerminalHomestead Air Force BaseJacksonville Naval Air StationKassauf-Kimerling Battery DisposalMadison County Sanitary LandfillMiami Drum ServicesMunisport LandfillNorthwest 58th Street LandfillParramore Surplus*Peak Oil Co./Bay Drum Co.Pensacola Naval Air StationPepper Steel & Alloys, Inc.Petroleum Products Corp.Pickettville Road LandfillPioneer Sand Co.Piper AircraftNero Beach Water & SewerDepartment
Reeves Southeast Galvanizing Corp.Sapp Battery SalvageSchuylkill Metals Corp.Sherwood Medical IndustriesSixty-Second Street DumpStandard Auto Bumper Corp.Sydney Mine Sludge PondsTaylor Road LandfillTower Chemical Co.
* Deleted 86
Tri-City Oil Conservationist, Inc.*Varsol Spill*Whitehouse Oil PitsWilson Concepts of Florida, Inc.Wingate Road Municipal Incinerator DumpWoodbury Chemical Co. (Princeton Plant)Yellow Water Road DumpZellwood Ground Water Contamination
Georgia (GA): 13
Cedartown Industries, Inc.Cedartown Municipal LandfillDiamond Shamrock Corp. LandfillFirestone Tire & Rubber Co. (Albany Plant)Hercules 009 LandfillMarine Corps Logistics BaseMarzone Inc./Chevron Chemical Co.Mathis Brothers Landfill (South Marble TopRoad)
Monsanto Corp. (Augusta Plant)Powersville SiteRobins Air Force Base (Landfill #4/SludgeLagoon)
T. H. Agriculture & Nutrition Co. (AlbanyPlant)
Woolfolk Chemical Works, Inc.
Kentucky (KY): 17
A. L. Taylor (Valley of Drums)AircoB. F. GoodrichBrantley LandfillCaldwell Lace Leather Co., Inc.Distler BrickyardDistler FarmFort Hartford Coal Co. Stone QuarryGeneral Tire & Rubber Co. (MayfieldLandfill)
Green River Disposal, Inc.Howe Valley LandfillLee's Lane LandfillMaxey Flats Nuclear DisposalNewport DumpRed Penn Sanitation Co. LandfillSmith's FarmTri-City Disposal Co.
Mississippi (MS): 2
Flowood SiteNewsom Brothers/Old ReichholdChemicals, Inc.
North Carolina (NC): 23
ABC One Hour CleanersAberdeen Pesticide DumpsBenfield Industries, Inc.Bypass 601 Ground Water ContaminationCamp Lejeune Military ReseNationCape Fear Wood PreseNingCarolina Transformer Co.Celanese Corp. (Shelby Fiber Operations)Charles Macon Lagoon & Drum StorageChemtronics, Inc.FCX, Inc. (Statesville Plant)FCX, Inc. (Washington Plant)Geigy Chemical Corp. (Aberdeen Plant)Hevi-Duty Electric Co.Jadco-Hughes FacilityJFD Electronics/Channel MasterKoppers Co., Inc. (Morrisville Plant)Martin-Marietta, Sodyeco, Inc.National Starch & Chemical Corp.North Carolina State University (Lot 86,Farm Unit #1)
New Hanover County Airport Burn PitPCB Spills*Potter's Septic Tank Service Pits
South Carolina (Se): 23
Beaunit Corp. (Circular Knit & DyeingPlant)
Carolawn, Inc.Elmore Waste DisposalGeiger (C & MOil)
* Deleted 87
Golden Strip Septic Tank SeNiceHelena Chemical Co. LandfillIndependent Nail Co.Kalama Specialty ChemicalsKoppers Co., Inc. (Florence Plant)Leonard Chemical Co., Inc.Lexington County Landfill AreaMedley Farm Drum DumpPalmetto Recycling, Inc.Palmetto Wood PreseNingPara-Chem SouthernRochester PropertyRock Hill Chemical Co.Sangamo Weston, Inc./Twelve-MileCreek/Lake Hartwell PCB Contamination
Savannah River Site (USDOE)SCRDI Bluff RoadSCRDI DixianaTownsend Saw Chain Co.Wamchem, Inc.
Tennessee (TN): 14
American Creosote Works, Inc. (JacksonPlant)
Amnicola DumpArlington Blending & PackagingCarrier Air Conditioning Co.Gallaway PitsLewisburg DumpMallory Capacitor Co.Milan Army Ammunition PlantMurray-Ohio DumpMurray-Ohio Manufacturing Co.(Horseshoe Bend Dump)
North Hollywood DumpOak Ridge ReseNation (USDOE)Velsicol Chemical Corp. (HardemanCounty)
Wrigley Charcoal Plant
Illinois (Il): 37
Region 5(265 Sites)
Indiana (IN): 35
A & F Material Reclaiming, Inc.Acme Solvent Reclaiming, Inc. (MorristownPlant)
Adams County Quincy Landfills 2&3Amoco Chemicals (Joliet Landfill)Beloit Corp.Belvidere Municipal LandfillByron Salvage YardCentral Illinois Public Service Co.Cross Brothers Pail Recycling (Pembroke)DuPage County Landfill/Blackwell ForestPreserve
Galesburg/Koppers Co.H.O.D. LandfilllIada Energy Co.Interstate Pollution Control, Inc.Johns-Manville Corp.Joliet Army Ammunition Plant (LoadAssembly-Packing Area)
Joliet Army Ammunition Plant(Manufacturing Area)
Kerr-McGee (Kress Creek/West Branch ofDuPage River)
Kerr-McGee (Reed-Keppler Park)Kerr-McGee (Residential Areas)Kerr-McGee (Sewage Treatment Plant)LaSalle Electric UtilitiesLenz Oil Service, Inc.MIG/Dewane LandfillNL Industries!Taracorp Lead SmelterOutboard Marine Corp.Pagel's PitParsons Casket Hardware Co.Petersen Sand & Gravel*Sangamo Electric Dump/Crab OrchardNational Wildlife Refuge (USDOI) ,
Savanna Army Depot ActivitySoutheast Rockford Ground WaterContamination
Tri-County Landfill Co./Waste Managementof Illinois, Inc.
Velsicol Chemical Corp. (Illinois)Wauconda Sand & GravelWoodstock Municipal. LandfillYeoman Creek Landfill
* Deleted 88
American Chemical Service, Inc.Bennett Stone QuarryCarter Lee Lumber Co.Columbus Old Municipal Landfill #1Conrail Rail Yard (Elkhart)Continental Steel Corp.Douglass Road/Uniroyal, Inc., LandfillEnvirochem Corp.Fisher-CaloFort Wayne Reduction DumpGalen Myers Dump/Drum SalvageHimco, Inc., DumpInternational Minerals & Chemical Corp.(Terre Haute East Plant)*
Lake Sandy Jo (M&M Landfill)Lakeland Disposal Service, Inc.Lemon Lane LandfillMain Street Well FieldMarion (Bragg) DumpMIDCOIMIDCO IINeal's Dump (Spencer)Neal's Landfill (Bloomington)Ninth Avenue DumpNorthside Sanitary Landfill, IncPoer Farm*Prestolite Battery DivisionReilly Tar & Chemical Corp. (IndianapolisPlant)
Seymour Recycling Corp.Southside Sanitary LandfillTippecanoe Sanitary Landfill, IncTri-State PlatingWaste, Inc., LandfillWayne Waste OilWedzeb Enterprises, Inc.Whiteford Sales & Service/NationaLease
Michigan (MI): 78
Adam's PlatingAlbion-Sheridan Township LandfillAllied Paper, Inc./PortageCreek/Kalamazoo River
American Anodco, Inc.Anderson Development Co.Auto Ion Chemicals, Inc.Avenue "E" Ground Water ContaminationBarrels, Inc.Bendix Corp./Allied AutomotiveBerlin & FarroBofors Nobel, Inc.Burrows SanitationButterworth #2 LandfillCannelton Industries, Inc.Carter Industrials, Inc.Cemetery DumpCharlevoix Municipal WellChem CentralClare Water SupplyCliff/Dow DumpDuell & Gardner LandfillElectrovoiceFolkertsma RefuseForest Waste ProductsG&H LandfillGrand Traverse Overall Supply Co.Gratiot County LandfillH. Brown Co., Inc.Hedblum IndustriesHi-Mill Manufacturing Co.Ionia City LandfillJ & L LandfillK&L Avenue LandfillKaydon Corp.Kent City Mobile Home ParkKentwood LandfillKysor Industrial Corp.Liquid Disposal, Inc.Mason County LandfillMcGraw Edison Corp.Metal Working ShopMetamora LandfillMichigan Disposal Service (Cork StreetLandfill)
Motor Wheel, Inc.Muskegon Chemical Co.North Bronson Industrial AreaNorthernaire PlatingNovaco IndustriesOrganic Chemicals, Inc.Ossineke Ground Water ContaminationOtt/Story/Cordova Chemical Co.Packaging Corp. of America
* Deleted 89
Parsons Chemical Works, Inc.Peerless Plating Co.Petoskey Municipal Well FieldRasmussen's DumpRockwell International Corp. (Allegan Plant)Rose Township DumpRoto-Finish Co., Inc.SCA Independent LandfillShiawassee RiverSouth Macomb Disposal Authority(Landfills #9 and #9a)
Southwest Ottawa County LandfillSparta LandfillSpartan Chemical Co.Spiegelberg LandfillSpringfield Township DumpState Disposal Landfill, Inc.Sturgis Municipal WellsTar LakeThermo-Chem, Inc.Torch LakeU.S. AviexVelsicol Chemical Corp. (Michigan)Verona Well FieldWash King LaundryWaste Management of Michigan (HollandLagoons)
Whitehall Municipal Wells*
Minnesota (MN): 43
Adrian Municipal Well FieldAgate Lake ScrapyardArrowhead Refinery Co.Boise Cascade/Onan Corp./Medtronics,Inc.
Burlington Northern (Brainerd/Baxter Plant)Dakhue Sanitary LandfillEast Bethel Demolition LandfillFMC Corp. (Fridley Plant)Freeway Sanitary LandfillGeneral Mills/Henkel Corp.Joslyn Manufacturing &" Supply Co.Koch Refining Co./N-Ren Corp.Koppers CokeKummer Sanitary LandfillKurt Manufacturing Co.LaGrand Sanitary LandfillLehillier/Mankato Site

Long Prairie Ground Water ContaminationMacGillis & Gibbs Co./Bell Lumber & PoleCo.
Morris Arsenic Dump*Naval Industrial Reserve Ordnance PlantNew Brighton/Arden HillsNL Industriesrraracorp/Golden AutoNutting Truck & Caster Co.Oak Grove Sanitary LandfillOakdale DumpOlmsted County Sanitary LandfillPerham Arsenic SitePine Bend Sanitary LandfillReilly Tar & Chemical Corp. (St. Louis ParkPlant)
Ritari Post & PoleSouth Andover SiteSt. Augusta Sanitary Landfill/Engen DumpSt. Louis River SiteSt. Regis Paper Co.Twin Cities Air Force Reserve Base (SmallArms Range Landfill)
Union Scrap Iron & Metal Co.University of Minnesota (RosemountResearch Center)
Waite Park WellsWashington County LandfillWaste Disposal EngineeringWhittaker Corp.Windom Dump
Ohio (OH): 33
Allied Chemical & Ironton CokeAlsco AnacondaArcanum Iron & MetalBig D CampgroundBowers LandfillBuckeye ReclamationChem-DyneCoshocton LandfillE. H. Schilling LandfillFeed Materials Production Center (USDOE)Fields BrookFultz LandfillIndustrial Excess LandfillLaskin/Poplar Oil Co.Miami County IncineratorMound Plant (USDOE)
* Deleted 90
Nease ChemicalNew Lyme LandfillOld MillOrmet Corp.Powell Road LandfillPristine, Inc.Reilly Tar & Chemical Corp. (Dover Plant)Republic Steel Corp. QuarrySanitary Landfill Co. (Industrial WasteDisposal Co., Inc.)
Skinner LandfillSouth Point PlantSummit NationalTRW, Inc. (Minerva Plant)United Scrap Lead Co., Inc.Van Dale JunkyardWright-Patterson Air Force BaseZanesville Well Field
Wisconsin (WI): 39
Algoma Municipal LandfillBetter Brite Plating Co. Chrome & ZincShops
City Disposal Corp. LandfillDelavan Municipal Well #4Eau Claire Municipal Well FieldFadrowski Drum DisposalHagen FarmHechimovich Sanitary LandfillHunts Disposal LandfillJanesville Ash BedsJanesville Old LandfillKohler Co. LandfillLauer I Sanitary LandfillLemberger Landfill, Inc.Lemberger Transport & RecyclingMadison Metropolitan Sewage DistrictLagoons
Master Disposal Service LandfillMid-State Disposal, Inc. LandfillMoss-American (Kerr-McGee Oil Co.)Muskego Sanitary LandfillN. W. Mauthe Co., Inc.National Presto Industries, Inc.Northern Engraving Co.Oconomowoc Electroplating Co., IncOmega Hills North LandfillOnalaska Municipal Landfill
Sauk County Landfill·Schmalz DumpScrap Processing Co., Inc.Sheboygan Harbor & RiverSpickler LandfillStoughton City LandfillTomah ArmoryTomah Fairgrounds
Arkansas (AR): 11
Arkwood, Inc.Cecil Lindsey*Frit IndustriesGurley PitIndustrial Waste ControlJacksonville Municipal LandfillMid-South Wood ProductsMidland ProductsMonroe Auto Equipment Co. (ParagouldPit)
Rogers Road Municipal LandfillVertac, Inc.
Louisiana (LA): 11
Bayou BonfoucaBayou Sorrel SiteCleve ReberCombustion, Inc.D. L. Mud, Inc.Dutchtown Treatment PlantGulf Coast Vacuum ServicesLouisiana Army Ammunition PlantOld Inger Oil RefineryPAB Oil & Chemical Service, Inc.Petro-Processors of Louisiana Inc.
New Mexico (NM): 10
AT & SF (Clovis)Cal West Metals (USSBA)Cimarron Mining Corp.
* Deleted
Tomah Municipal Sanitary LandfillWaste Management of Wisconsin, Inc.(Brookfield Sanitary Landfill)
Waste Research & Reclamation Co.Wausau Ground Water ContaminationWheeler Pit
Region 6(71 Sites)
Cleveland MillHomestake Mining Co.Lee Acres Landfill (USDaI)Pagano SalvagePrewitt Abandoned RefinerySouth ValleyUnited Nuclear Corp.
Oklahoma (OK): 10
Compass Industries (Avery Drive)Double Eagle Refinery Co.Fourth Street Abandoned RefineryHardage/CrinerMosley Road Sanitary LandfillOklahoma Refining Co.Sand Springs Petrochemical ComplexTar Creek (Ottawa County)Tenth Street Dump/JunkyardTinker Air Force Base (SoldierCreek/Building 3001)
Texas (TX): 29
Air Force Plant #4 (General Dynamics)Bailey Waste DisposelBio-Ecology Systems, Inc.Brio Refining, Inc.Crystal Chemical Co.Crystal City AirportDixie Oil Processors, Inc.French, Ltd.Geneva Industries/Fuhrmann EnergyHarris (Farley Street)*
91
Highlands Acid PitKoppers Co., Inc. (Texarkana Plant)Lone Star Army Ammunition PlantLonghorn Army Ammunition PlantMateo, Inc.North Cavalcade StreetOdessa Chromium #1Odessa Chromium #2 (Andrews Highway)Pesses Chemical Co.Petro-Chemical Systems, Inc. (TurtleBayou)
Sheridan Disposal ServicesSikes Disposal PitsSol Lynn/Industrial TransformersSouth Cavalcade StreetStewco, Inc.Tex-Tin Corp.Texarkana Wood Preserving Co.Triangle Chemical Co.United Creosoting Co.
Region 7(59 Sites)
Iowa (IA): 20
Aidex Corp.Des Moines TCEE. I. Du Pont de Nemours & Co., Inc.(County Road X23)
Electro-Coatings, Inc.Fairfield Coal Gasification PlantFarmers' Mutual CooperativeIowa Army Ammunition PlantJohn Deere (Ottumwa Works Landfills)LaBounty SiteLawrence Todtz FarmLehigh Portland Cement Co.Mid-America Tanning Co.Midwest Manufacturing/North FarmNorthwestern States Portland Cement Co.Peoples Natural Gas Co.Red Oak City LandfillShaw Avenue DumpSheller-Globe Corp. DisposalVogel Paint & Wax Co.White Farm Equipment Co. Dump
Kansas (KS): 11
29th & Mead Ground Water ContaminationArkansas City DumpBig River Sand Co.Cherokee CountyDoepke Disposal (Holliday)
92
Fort RileyHydro-Flex Inc.Johns' Sludge PondObee RoadPester Refinery Co.Strother Field Industrial Park
Missouri (MO): 22
Bee Cee Manufacturing Co.Conservation Chemical Co.Ellisville SiteFulbright LandfillKern-Pest LaboratoriesLake City Army Ammunition Plant(Northwest Lagoon)
Lee ChemicalMinker/Stout/Romaine CreekMissouri Electric WorksNorth-U Drive Well ContaminationOronogo-Duenweg Mining BeltQuality PlatingShenandoah StablesSolid State Circuits, Inc.St. Louis Airport/Hazelwood InterimStorage/Futura Coatings Co.
Syntex FacilityTimes Beach SiteValley Park TCEWeldon Spring Quarry/Plant/Pits(USDOE/Army)

Weldon Spring Former Army OrdnanceWorks
Westlake LandfillWheeling Disposal Service Co. Landfill
Nebraska (NE): 6
1Oth Street SiteCornhusker Army Ammunition Plant
Colorado (CO): 16
Air Force Plant PJKSBroderick Wood ProductsCalifornia GulchCentral City-Clear CreekChemical Sales Co.Denver Radium SiteEagle MineLincoln ParkLowry LandfillMarshall LandfillRocky Flats Plant (USDOE)Rocky Mountain ArsenalSand Creek IndustrialSmuggler MountainUravan Uranium Project (Union CarbideCorp.)
Woodbury Chemical Co.
Montana (MT): 8
Anaconda Co. SmelterEast Helena SiteIdaho Pole Co.Libby Ground Water ContaminationMilltown Reservoir SedimentsMontana Pole and TreatingMouat IndustriesSilver Bow Creek/Butte Area
Hastings Ground Water ContaminationLindsay Manufacturing Co.Nebraska Army Ordnance Plant (Former)Waverly Ground Water Contamination
Region 8(43 Sites)
North Dakota (NO): 2
Arsenic Trioxide SiteMinot Landfill
South Dakota (SO): 3
Ellsworth Air Force BaseWhitewood CreekWilliams Pipe Line Co. Disposal Pit
Utah (UT): 11
Hill Air Force BaseMidvale SlagMonticello Mill Tailings (USDOE)Monticello Radioactively ContaminatedProperties
Ogden Defense DepotPortland Cement (Kiln Dust 2 & 3)Rose Park Sludge PitSharon Steel Corp. (Midvale Tailings)Tooele Army Depot (North Area)Utah Power & Light/American Barrel Co.Wasatch Chemical Co. (Lot 6)
Wyoming (WY): 3
Baxter/Union Pacific Tie TreatingF. E. Warren Air Force BaseMystery Bridge Rd/U.S. Highway 20
93

Region 9(105 Sites)
American Samoa (AS): 1
Taputimu Farm*
Arizona (AZ): 11
Apache Powder Co.Hassayampa LandfillIndian Bend Wash AreaLitchfield Airport AreaLuke Air Force BaseMotorola, Inc. (52nd Street Plant)Mountain View Mobile Home Estates*Nineteenth Avenue LandfillTucson International Airport AreaWilliams Air Force BaseYuma Marine Corps Air Station
California (CA): 88
Advanced Micro Devices, Inc. (Building915)
Advanced Micro Devices, Inc.Aerojet General Corp.Applied MaterialsAtlas Asbestos MineBarstow Marine Corps Logistics BaseBeckman Instruments (Porterville Plant)Brown & Bryant, Inc. (Arvin Plant)Camp Pendleton Marine Corps BaseCastle Air Force BaseCeltor Chemical WorksCoalinga Asbestos MineCoast Wood PreservingCrazy Horse Sanitary LandfillCTS Printex, Inc.Del Norte Pesticide StorageEdwards Air Force BaseEI Toro Marine Corps Air StationFairchild Semiconductor Corp. (MountainView Plant)
Fairchild Semiconductor Corp. (South SanJose Plant)
Firestone Tire & Rubber Co. (Salinas Plant)
* Deleted 94
Fort OrdFresno Municipal Sanitary LandfillGeorge Air Force BaseHewlett-Packard (620-640 Page Mill Road)Hexcel Corp.Industrial Waste ProcessingIntel Corp. (Mountain View Plant)Intel Corp. (Santa Clara III)Intel MagneticsIntersi! Inc./Siemens ComponentsIron Mountain MineJ.H. Baxter & Co.Jasco Chemical Corp.Jibboom JunkyardKoppers Co., Inc (Oroville Plant)Lawrence Livermore National Laboratory(USDOE)
Lawrence Livermore National Laboratory(Site 300) (USDOE)
Liquid Gold Oil Corp.Lorentz Barrel & Drum Co.Louisiana-Pacific Corp.March Air Force BaseMather Air Force BaseMcClellan Air Force Base (Ground WaterContamination)
McCollMGM BrakesModesto Ground Water ContaminationMoffett Naval Air StationMonolithic MemoriesMontrose Chemical Corp.National Semiconductor Corp.Newmark Ground Water ContaminationNorton Air Force BaseOperating Industries, Inc., LandfillPacific Coast Pipe LinesPurity Oil Sales, Inc.Raythe'on Corp.Riverbank Army Ammunition PlantSacramento Army DepotSan Fernando Valley (Area 1)San Fernando Valley (Area 2)San Fernando Valley (Area 3)San Fernando Valley (Area 4)San Gabriel Valley (Area 1)
San Gabriel Valley (Area 2)San Gabriel Valley (Area 3)San Gabriel Valley (Area 4)Selma Treating Co.Sharpe Army DepotSola Optical USA, Inc.South Bay Asbestos AreaSouthern California Edison Co. (VisaliaPoleyard)
Spectra-Physics, Inc.StringfellowSulphur Bank Mercury MineSynertek, Inc. (Building 1)T. H. Agriculture & Nutrition Co.Teledyne SemiconductorTracy Defense DepotTravis Air Force BaseTreasure Island Naval Station-HuntersPoint Annex
TRW Microwave, Inc. (Building 825)United Heckathorn Co.Valley Wood Preserving, Inc.Waste Disposal, Inc.Watkins-Johnson Co. (Stewart Division)Western Pacific RailroadWestinghouse Electric Corp. (SunnyvalePlant)
Alaska (AK): 6
Alaska Battery EnterprisesArctic SurplusEielson Air Force BaseElmendorf Air Force BaseFort WainwrightStandard Steel & Metals Salvage Yard(USDOT)
Idaho (10): 9
Arrcom (Drexler Enterprises)Bunker Hill Mining & MetallurgicalEastern Michaud Flats ContaminationIdaho National Engineering Laboratory
* Deleted
Commonwealth of Marianas (CM): 1
PCB Warehouse*
Guam (GU): 1
Ordot Landfill
Hawaii (HI): 1
Schofield Barracks
Nevada (NV): 1
Carson River Mercury Site
Trust Territories (IT): 1
PCB Wastes*
Region 10(69 Sites)
Kerr-McGee Chemical Corp. (Soda SpringsPlant)
Monsanto Chemical Co. (Soda SpringsPlant)
Mountain Home Air Force BasePacific Hide & Fur Recycling Co.Union Pacific Railroad Co.
Oregon (OR): 8
Allied Plating, Inc.Gould, Inc.Joseph Forest ProductsMartin-Marietta Aluminum Co.Teledyne Wah ChangUmatilla Army Depot (Lagoons)
95
Union Pacific Railroad Co. Tie TreatingPlant
United Chrome Products, Inc.
Washington rNA): 46
ALCOA (Vancouver Smelter)American Crossarm & Conduit Co.American Lake GardensBangor Naval Submarine BaseBangor Ordnance DisposalBonneville Power Administration RossComplex (USDOE)
Centralia Municipal LandfillColbert LandfillCommencement Bay, Near ShorefTideFlats
Commencement Bay, South TacomaChannel
Fairchild Air Force Base (4 Waste Areas)FMC Corp. (Yakima Pit)Fort Lewis (Landfill No.5)Fort Lewis Logistics CenterFrontier Hard Chrome, Inc.General Electric Co. (Spokane Shop)Greenacres LandfillHanford 100-AreaHanford 11 OO-AreaHanford 200-AreaHanford 300-Area
* Deleted 96
Harbor Island (Lead)Hidden Valley Landfill (Thun Field)Kaiser Aluminum Mead WorksLakewood SiteMcChord Air Force Base (WashRackfTreatment Area)
Mica LandfillMidway LandfillNaval Air Station, Whidbey Island (AultField)
Naval Air Station, Whidbey Island(Seaplane Base)
Naval Undersea Warfare EngineeringStation (4 Waste Areas)
North Market StreetNorthside LandfillNorthwest TransformerNorthwest Transformer (South HarknessStreet)
Old Inland PitPacific Car & Foundry Co.
. Pasco Sanitary LandfillPesticide Lab (Yakima)Queen City FarmsSeattle Municipal Landfill (Kent Highlands)Silver Mountain MineToftdahl Drums*Western Processing Co., Inc.Wyckoff Co./Eagle HarborYakima Plating Co.

APPENDIX C: NATIONAL AND REGIONAL NPLMAPS
97
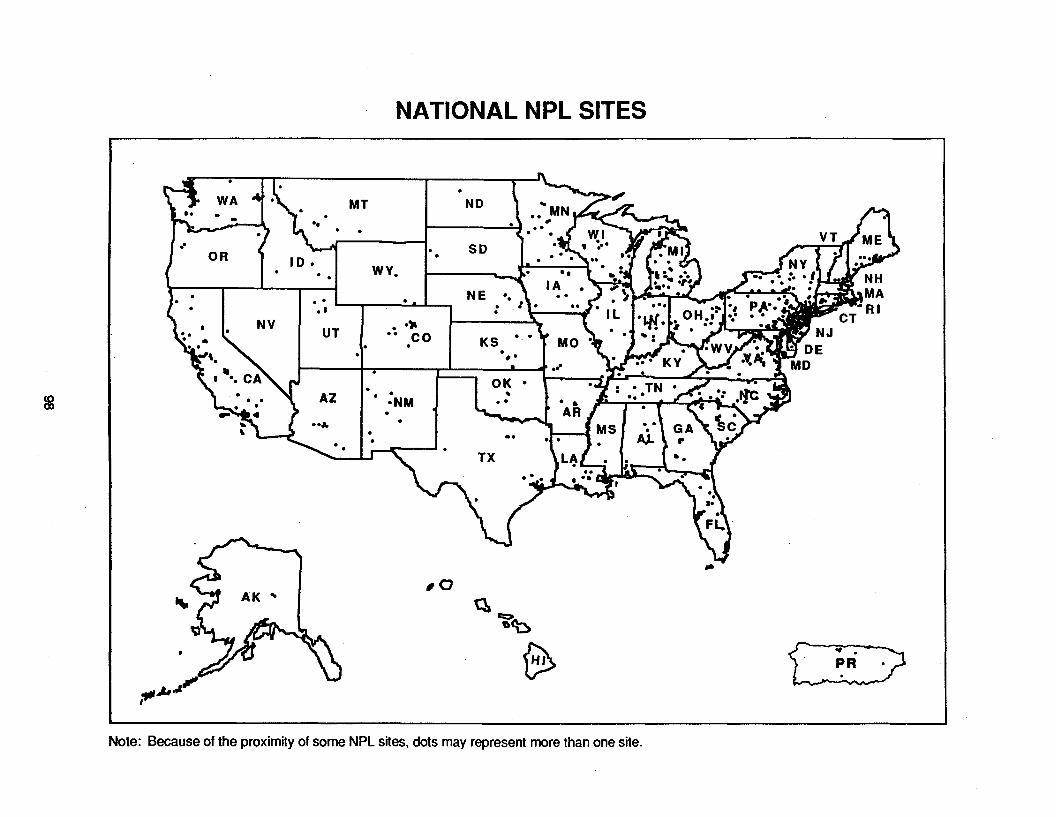
NATIONAL NPL SITES
NE
"0 SO
NH~~MA
• RICT
NJ
9 DEMO
00
,.
o~"
oo
0>
KS
~~~Cb>
o :NM
o 0"00 co
"
,0
WYo
oo
MT I NO
m
Note: Because of the proximity of some NPl sites, dots may represent more than one site.
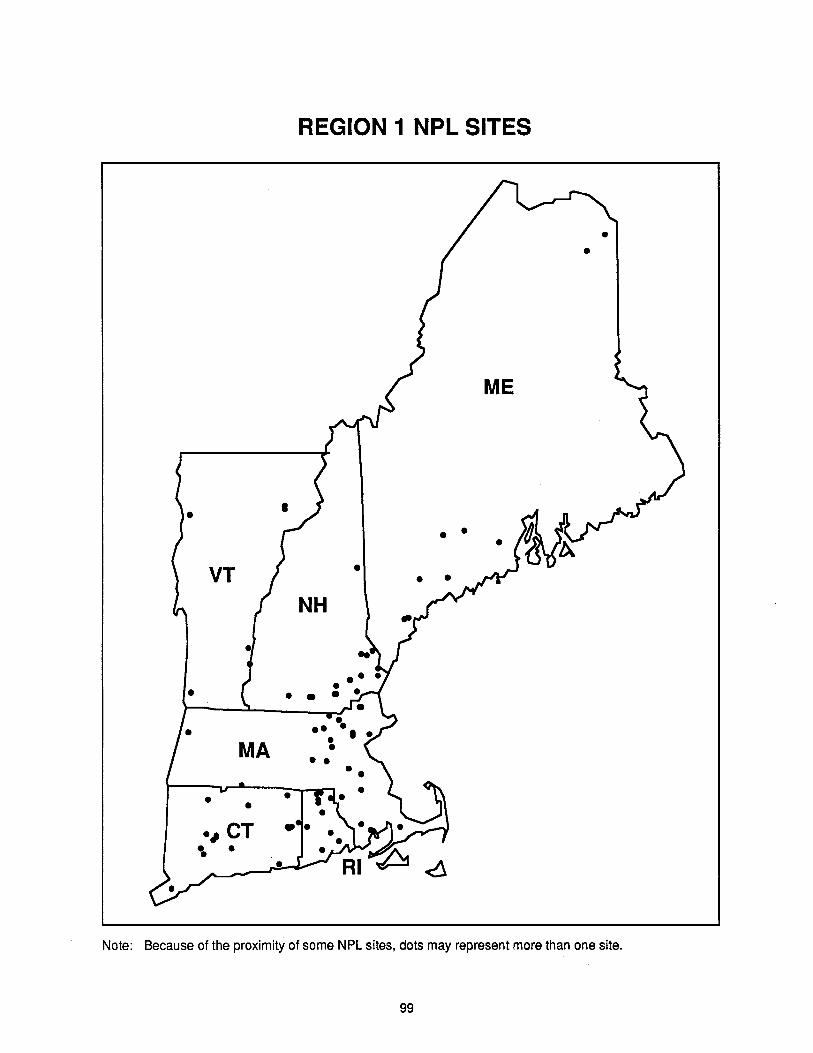
REGION 1 NPL SITES
••
•
ME
• •
• ••NH
•
• •
•
•
MA
VT
•
•.~ CT
\ .
•
Note: Because of the proximity of some NPL sites, dots may represent more than one site.
99
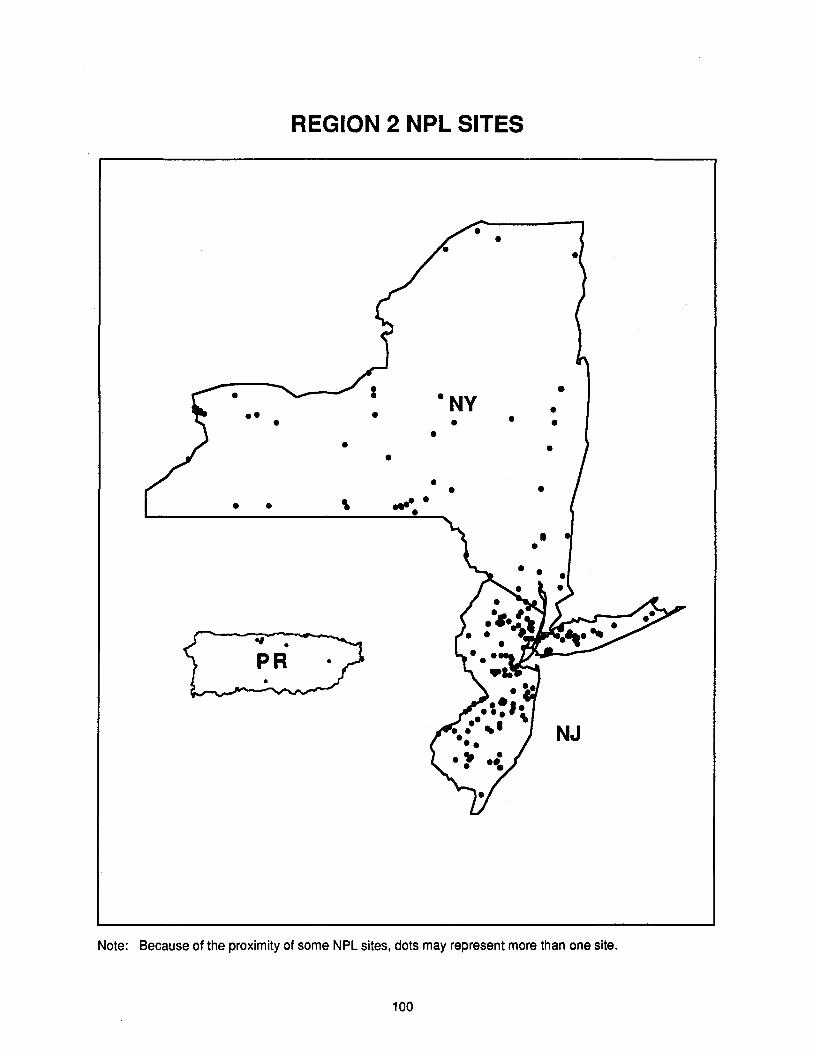
REGION 2 NPL SITES
••••
•
••
•·NY
•
.... .•
•
•
\
•
Note: Because of the proximity of some NPL sites. dots may represent more than one site.
100
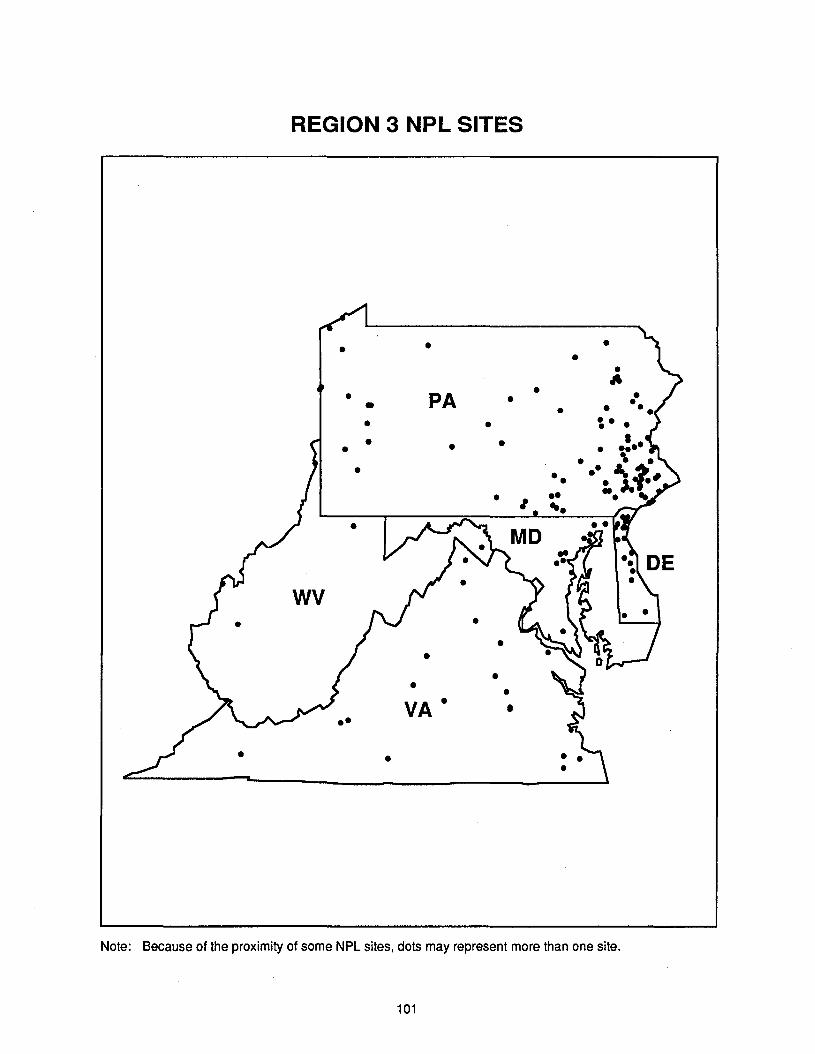
REGION 3 NPL SITES
••
••
•
••VA •
•
• •• • •~•• PA •• •
• •• • ••
• ••• I ••'.
•
••
WV
•
Note: Because of the proximity of some NPL sites, dots may represent more than one site.
101
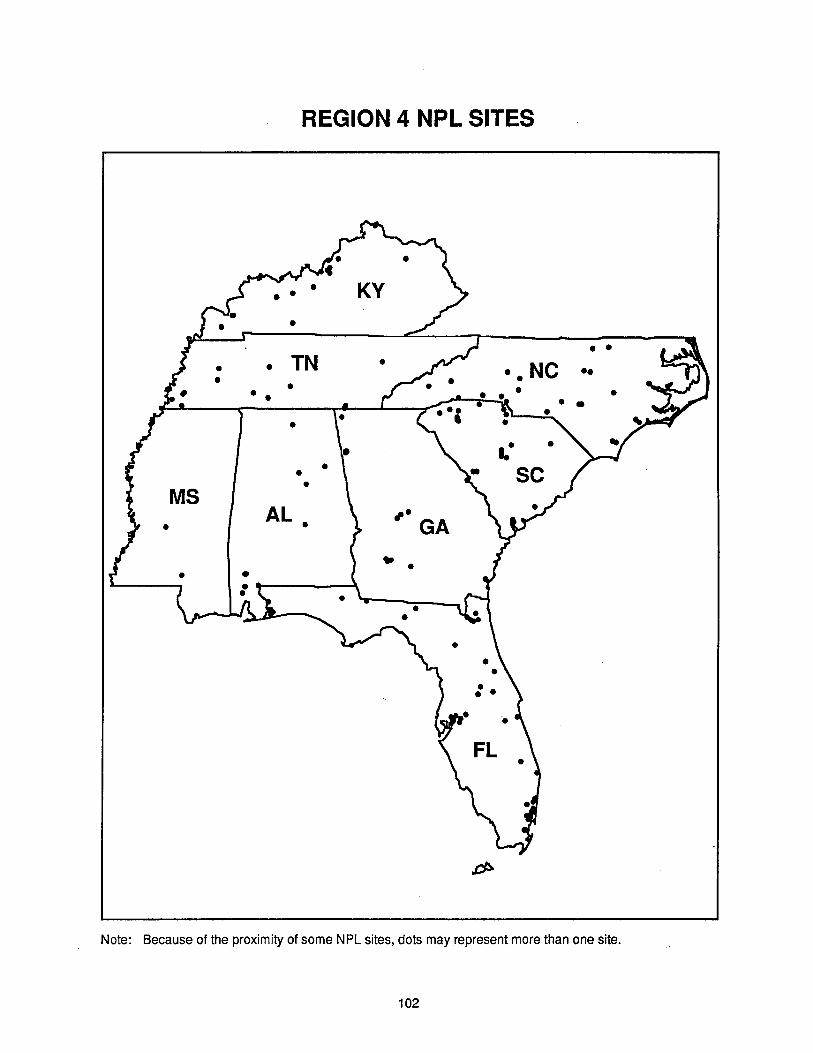
REGION 4 NPL SITES
• •• NC •••
•• •
Note: Because of the proximity of some NPL sites, dots may represent more than one site.
102
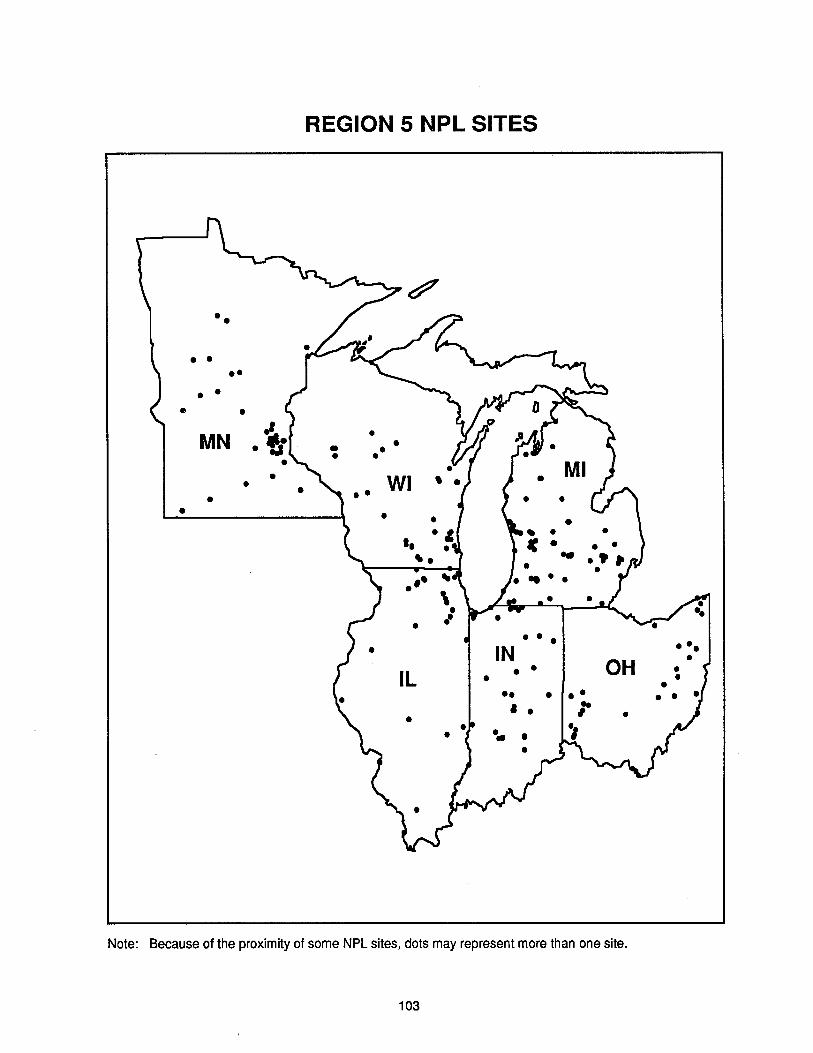
REGION 5 NPL SITES
••
• •••
• •• •
MN •• • ••• •
• WI• ••• • •
••••• ...•
• • • •• INIL • • OH •• •
•• •, . ••• •• •
Note: Because of the proximity of some NPL sites, dots may represent more than one site.
103

REGION 6 NPL SITES
•OK •
• • ••• • • •• NM • AR•
•• 'lI •
••
TX
• •
Note: Because of the proximity of some NPL sites, dots may represent more than one site.
104

REGION 7 NPL SITES
.. .
• •
• •
MO
•
••
•
•
IA
••,
••
•
••
KS
NE
Note: Because of the proximity of some NPL sites, dots may represent more than one site.
105

REGION 8 NPL SITES
• •
MT NO
••
• SO•
wv •
• •• •• t
• ··r.UT • • CO
• ••
Note: Because of the proximity of some NPL sites, dots may represent more than one site.
106
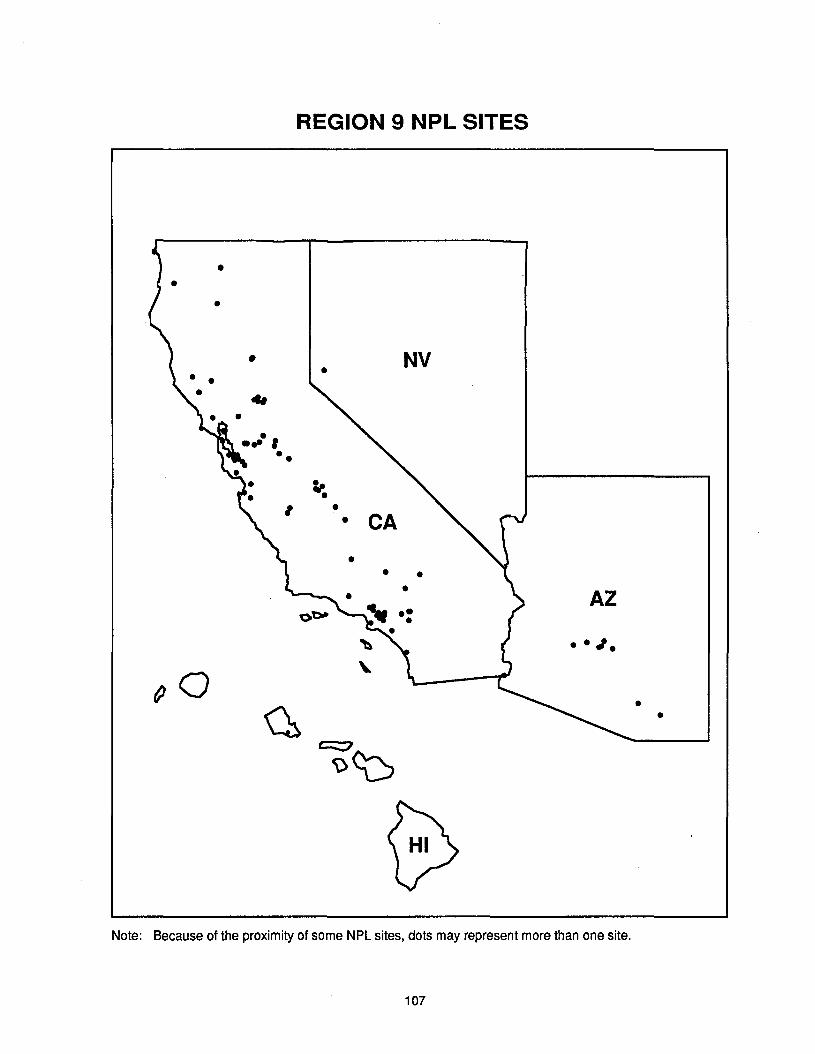
REGION 9 NPL SITES
•
NV••..•
~•I •• CA
• • •• AZ.-• ..~.
~O •G •
~<1:)
Note: Because of the proximity of some NPL sites, dots may represent more than one site.
107
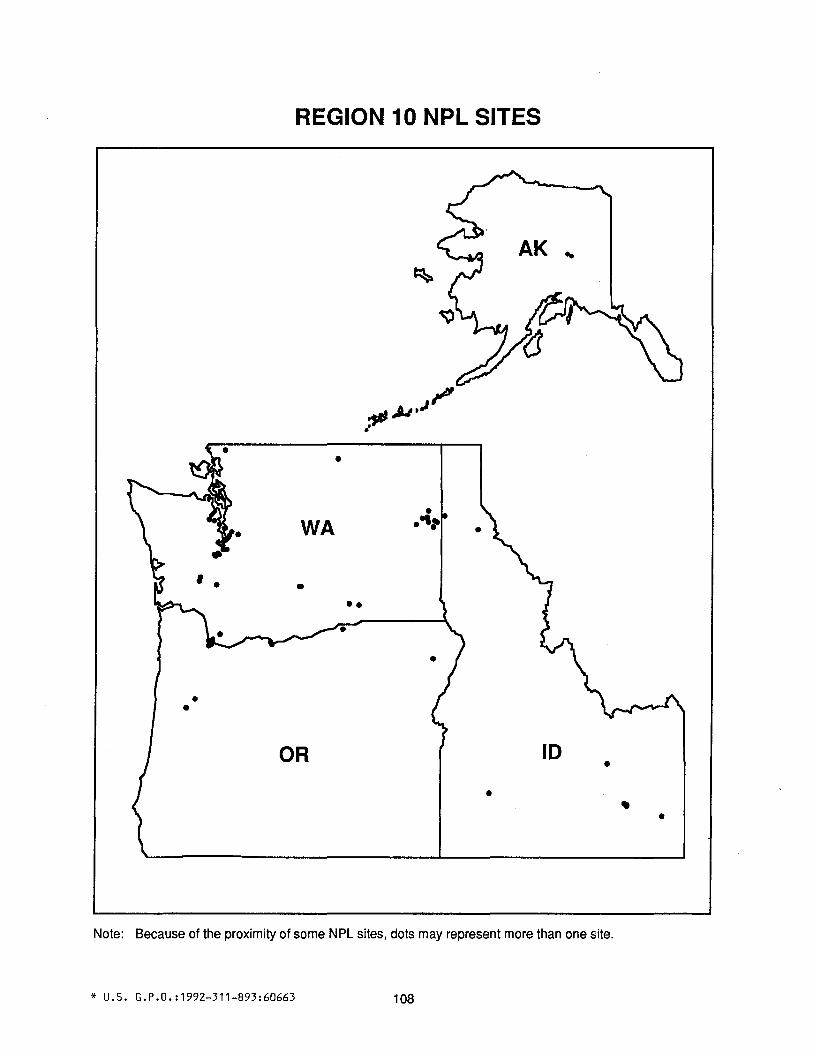
REGION 10 NPL SITES
AK ..
••
•
WA
•
OR
• •
•.et~
•
10•
• •
Note: Because of the proximity of some NPL sites, dots may represent more than one site.
* u.s. G.P.O.:1992-311-B93:60663 108