national renewable energy policy & action plan
TRANSCRIPT

national
REnEWaBlE EnERGY
PoliCY & aCtion Plan
This report has been prepared based on in-depth consultations and series of discussions with various stakeholders includingthe Members of Parliament, the Government authorities and agencies, the electricity supply industry, the power utilities, theRE industry, the professional bodies, the NGOs, the consumers associations, the national and international experts, and otherrelevant parties, as presented to and endorsed by the Jawatankuasa Perancangan Pelaksanaan Pembekalan Elektrik Dan Tarif
(JPPPET) on 17th November 2008.
2-SEDA RE Policy-Inner_SEDA Policy Book 8/24/11 8:34 AM Page i

National Renewable Energy Policy and Action Planii
EXECUTIVE SUMMARYSince 2001 Malaysia has made efforts towards renewable energy development where the principle adopted was using themarket forces to deliver the intended outcomes towards electricity generation. The result of the last 8 years provides valuablelessons in identifying the issues arising from such an approach and the key lesson is that a ‘business-as-usual’ approach is notsustainable, appropriate nor productive.
In order to design a more effective policy, renewable energy policy must be recognised as a convergence of energy, industrialand environmental policies.
The reasons for the introduction of a new convergent and forward-looking RE policy are:(1) Addressing the renewable energy market failure. The evidence shows that the market has failed to produce the
desired outcome, particularly due to the lack of a proper and effective regulatory framework;
(2) Provision of long-term sustainability by avoiding stop-start strategies, having sufficient outcomes and securingthe commitment of all stakeholders;
(3) Provision of a new growth industry in Malaysia;
(4) Recognising that the environment is an economic growth contributor, which can be leveraged to spur innovation(as compared to invention);
(5) Effectively diffuse RE technology, thereby improving on human capital and utilisation; and
(6) Avoidance of the incoherence of existing RE policy and the sending of mixed signals that affect businessdecisions.
The evidence gleaned from the last 8 years of the SREP programme, the Biogen and the MBIPV projects establish the existenceof 8 issues which if not addressed would perpetuate the problems indefinitely. The issues are:
Issues Drawing Lessons(1) Market failure exists:
The RE market “fails” due to misuse of monopsony powerand information asymmetries; the RE market is alsoconstrained by financial and technological factors.
Market failure will be perpetuated unless the causes of suchfailure, viz. unequal bargaining position of the utility and REproject proponents, significant transaction costs in terms of thetime needed to conclude a REPPA, and the monopsony power ofthe utility to agree to the requests of the RE project proponent,are properly addressed.
(2) Constraints: Inherent factors that constrain the performance of themarket.
The market should not solely be relied upon to achieve theintended outcome as steps should be taken to ameliorate theeconomic, financial and technological constraints that areimpeding market performance.
(3) Arbitrary price setting: RE prices set arbitrarily.
RE prices must be based on sound economic principles and allowfor full cost recovery. Anything less will affect the viability of theRE project.
(4) Tensions and trade-offs:The predicament of expecting that the utility will bear thehigher costs of RE power (due to the higher RE price).
The predicament can be addressed by the introduction of amechanism for sharing the cost of RE amongst all members ofsociety, as environmental improvement is a non-excludable publicgood.
(5) Absence of Regulatory Framework:Market failure compounded by absence of a properregulatory framework, which prevents proper and legalaction from being taken.
Regulatory frameworks provide the necessary foundation forachieving the desired outcome, and it sends a strong signal tothe market of the Government’s commitment. The existing ESAis inadequate, inappropriate and insufficient to be used as thelegal basis to support RE businesses growth.
(6) Poor governance:Poor governance detrimentally affects the participation ofstakeholders and legitimacy of the action.
Governance can be strengthened and improved through theintroduction of the regulatory framework where governanceprinciples are embedded.
(7) Limited Oversight:No concerted oversight of implementation problems.
Oversight and implemented function need to be in separateorganisations for improved accountability.
(8) Lack of institutional measures:Lack of proper institutional measures to meet informationaland technological needs.
Information asymmetry needs to be overcome through properinformation dissemination, advocacy and awareness actions.
Access to and the type of information should be made availableexpeditiously in order to assist in the private firm’s decisionmaking process with regards to investing in RE.
Table (i): RE Implementation Issues
2-SEDA RE Policy-Inner_SEDA Policy Book 8/24/11 8:34 AM Page ii
iii
Renewable Energy (RE) Policy
Therefore the proposed forward-looking RE Policy comprises:
(1) A Policy Statement with a vision that provides long-term goals that all stakeholders should strive to realise.
Enhancing the utilisation of indigenous renewable energy resources to contribute towards National electricitysupply security and sustainable socio-economic development.
(2) 5 Policy Objectives: The forward-looking RE Policy has five objectives that embody elements of energy, industryand environmental policies, making it convergent in nature.
(1) To increase RE contribution in the national power generation mix;
(2) To facilitate the growth of the RE industry;
(3) To ensure reasonable RE generation costs;
(4) To conserve the environment for future generation; and
(5) To enhance awareness on the role and importance of RE.
(3) Policy Mission: To achieve the policy objectives, a policy mission comprising five strategic thrusts have beenidentified:
Thrust 1: Introduce Appropriate Regulatory Framework
This requires the introduction of an appropriate, robust and efficient regulatory framework which would addressmarket failures and provides incentives for firms to enter into the RE generation market.
The regulatory framework would be the primary vehicle for the introduction of the feed-in-tariff (FiT) mechanismwhich will act as a catalyst for the progressive entry of RE power generation businesses and other related aspectsof RE development.
It is envisaged that with the reduced environmental pollution coming from increased RE usage, the society atlarge benefits. This would mean that society must play its part by contributing towards RE development througha fund to be used to pay for the RE power. Payment of this contribution, which can be embedded into theelectricity tariff structure, must be made to a specific RE Fund and not become part of the receipts byGovernment (as such receipts must be paid into the Consolidated Fund).
There are consequently direct spill-over effects as such a regulatory framework would act as a catalyst for theemergence of RE industries, undertaking of R&D in RE technology and innovation (e.g. via improved boilertechnologies etc.). The measurable outcomes of this thrust include the rate of increase in the use of RE, thedecreasing (or plateaued) rate of fossil fuel consumption for conventional power generation and reduction ofCO2 emissions.
Thrust 2: Provide Conducive Environments for RE businesses
The 2nd Policy Objective identifies the importance of the growth of the RE industry. A definition of the “REindustry” provides clarity of this industrial sector. The 1st Policy Objective refers to RE generation, which wouldcover generation, distribution and sale of energy; while it is proposed that the term “RE industry” refer to themanufacturing of RE components or RE finished products (e.g. boilers, turbines, PV modules, etc.), supportindustries to the RE manufacturing sector, and RE service providers (e.g. technicians, consultants, engineers,builders) who support RE power generation. The focus of this thrust is on RE industry and RE power generation(which collectively are referred to as RE businesses or RE industry).
The conducive environment package would encompass the provision of fiscal incentives, and indirect assistancein the form of reducing the transaction costs for financing, using GLCs and MNCs to lead the charge, andproviding assistance to SMEs to participate in the RE business. These are in addition to the feed-in tariff that ofitself provides a stimulus for people to enter the RE power generation sector.
2-SEDA RE Policy-Inner_SEDA Policy Book 8/24/11 8:34 AM Page iii

National Renewable Energy Policy and Action Planiv
Thrust 3: Intensify Human Capital Development
RE is a new technology in Malaysia and there is an urgent need for human capital to be developed to supportthe emerging RE Industries. Yet there is a need for a short-term (stop-gap) measure to fill the human capitalvoid in Malaysia by encouraging knowledge workers to relocate to Malaysia.
Thrust 4: Enhance RE Research And Development
The focus of the R&D is not on invention1 but on innovation2. For example, the improvements in the microchipwere due to innovation (i.e. the idea of “standing on the shoulders of giants”).
Therefore the implementation of a systemic R&D programme that leads to innovative products and services ispreferable as this can accelerate the growth of the RE Industry in the country. Innovation also enhances thediffusion of RE technology by making the technology cheaper and easier to use. This can strengthen businesses’competitive edge.
Thus, it is necessary to develop an R&D implementation plan that articulates the demand, identifies the use ofregulation to spur innovation and provides appropriate support for R&D activities. All RE related R&D effortscoupled with effective innovations should result in robust downstream activities. This would in the end affectthe industry tremendously and benefit the country in terms of economic gains.
Thrust 5: Design And Implement An RE Advocacy Programme
Advocacy programmes that are tailored with specific messages for specific audiences should be implemented.For example an advocacy programme targeted at investors and RE market entrants will need to convey a messagethat is subtly different from that of a general public advocacy programme designed to secure buy-in to the ideaof societal payments for a clean environment. The common aim of all advocacy programmes is to increase theawareness of all stakeholders of the benefits and advantages of utilising RE and participation in RE businesses.
Thrust 1 is the most important foundation for the five (5) policy objectives, whilst Thrusts 2, 3 and 4 provide thestimulus and conducive environment for businesses to enter this market. Since the RE Policy is a forward-looking policywith new approaches it is important for its success that buy-in by relevant stakeholders and society at large is securedand this could be achieved through Thrust 5.
RE Action Plan
The specific actions needed to provide the most effective results should take one of two forms which are: (i) Direct actions to create or establish the necessary institutional arrangements; and(ii) Supporting measures to encourage and nurture the growth and development of the RE businesses.
The detailed report provides for the prioritisation of the main actions. The full scope of the action plan should beimplemented within 2 months after the RE Law is passed. The estimated direct cost of implementing the RE ActionPlan over a 5 year period using available data is RM 1.5 billion (this does not include the amount to be contributed tothe RE Fund and the cost of indirect incentives).
RE Targets and Success Indicators
As the RE Policy is a new and forward-looking policy, it is important and necessary that evaluation be done periodically,to empirically ascertain whether these actions are bearing fruit or require change mid-stream, and by which theoutcomes of the Policy Objectives be monitored and realised. Accordingly evaluation criteria have been drawn up foreach Thrust, and planned base line assessments are to be undertaken to provide the basis for future evaluation. Detailsof the criteria are set out in Chapter 8.
1 Invention is defined as the creation of a new product or process.2 Innovation is defined as the making of changes in existing products or services by introducing new methods, ideas or products.
2-SEDA RE Policy-Inner_SEDA Policy Book 8/24/11 8:34 AM Page iv

v
In conclusion this RE Policy is necessary for the development and growth of the RE businesses in Malaysia whilst at the sametime one of the vital mitigation initiatives in reducing our green house gas emission from the continued burning of fossil fuelsin electricity generation. The old ways of doing things no longer applies, and the country must move in a direction which ismore progressive. The Action Plan shows that the policy objectives can be achieved on the condition the RE Law and Feed-in Tariff (FiT) which is supported by the RE Fund are introduced. These are the foundations on which the actions for the otherthrusts are based upon.
Year EndingCum. Total RE
(MW)Share of RECapacity
Annual REGeneration (GWh)
RE MixAnnual CO2
Avoidance (tonne)
2011 217 1% 1,228 1% 773,325
2015 975 6% 5,374 5% 3,385,406
2020 2,065 10% 11,227 9% 7,073,199
2030 3,484 13% 16,512 10% 10,402,484
2050 11,544 34% 25,579 13% 16,114,871
Table (ii): RE Policy Planned Outcome
RE PolicyVision & Objectives
Advocacy Programme
Strategic Thrust 1: Foundation: RE Law
Strategic Thrust 2:
Conducive REBusiness
Environments
Strategic Thrust 3:Human Capital
Development
Strategic Thrust 4:RE R&D
Action Plan
Vision & ObjecVision & ObjecolicRE P
estiv ecyyolic
onmenvirrEnnvirBusiness
e Ronducivve RECConducivhrust 2:T
egic taStrra
t
ounda
ts elopmenvvelopmenDeevapital CCapital
Human hrust 3:T
egic tt aStrra
onmen
e RE
hrust 1: F FoundaTegic ttegic aStrra w
tion Plancction PlanARE R&Dhrust 4:T
egic ttegic aStra
ation: RE L Laounda
Figure (i): Synergies of RE Action Plan (Strategic Thrusts) leading towards a successful RE Policy
2-SEDA RE Policy-Inner_SEDA Policy Book 8/24/11 8:34 AM Page v

National Renewable Energy Policy and Action Planvi
1. Introduction 1
2. Key Facts 22.1. Chronology of Events 22.2. Status of RE Developments (2001 – 2009) 32.3. Fiscal Incentives 8
3. Key Issues Affecting RE Development 93.1. Existence of Market Failure 93.2. Existence of Constraints 103.3. Arbitrary RE Price Setting 123.4. Business Tensions and Trade-offs 123.5. Lack of an Efficient Regulatory Framework 133.6. Governance Issues 143.7. Information Cost and Access 153.8. Lessons Drawn from Key Issues 16
4. Need For RE Policy And Action Plan 184.1. Introduction 184.2. National Green Technology Policy 184.3. Lessons Learnt from Germany: World Leader in Renewable Energy Technology Applications 184.4. Reasons for RE Policy and Action Plan RE 24
5. Renewable Energy Resources and SMART Targets 295.1. Importance and Relevance of RE in Meeting Malaysia’s Energy Requirements 295.2. Renewable Energy Resources in Malaysia 305.3. Biomass Wastes and Biogas Potential 305.4. Mini-Hydro Potential 325.5. Solar Power Potential 335.6. Solid Wastes Potential 365.7. Targets for Renewable Energy Development 37
6. The Renewable Energy Policy 416.1. Policy Vision 416.2. Policy Objectives 416.3. RE Strategic Thrusts 41
7. RE Action Plan: Implementation Approach 447.1. Strategic Thrust 1: Introduce Appropriate Regulatory Framework 447.2. Strategic Thrust 2: Provide Conducive Environments for RE Businesses 537.3. Strategic Thrust 3: Intensify Human Capital Development 577.4. Strategic Thrust 4: Enhance RE Research and Technology 597.5. Strategic Thrust 5: Design and Implement an RE Advocacy Programme 647.6. Summary 66
8. Evaluation Criteria and Success Indicators 698.1. Base Lining 698.2. Thrust 1 Criteria 708.3. Thrust 2 Criteria 718.4. Thrusts 3, 4 and 5 Criteria 72
9. Conclusion 73
Acknowledgement & references 75
Annex A: Current SREP Programme Guidelines 77Annex B: Renewable Energy Feed-in Tariff (RE-FiT) Law 78Annex C: Additional Measures to Support Strategic Thrust 1 82Annex D: Alternative Incentive Offering Mechanisms 83
TABLE OF CONTENTS
2-SEDA RE Policy-Inner_SEDA Policy Book 8/24/11 8:34 AM Page vi

vii
LIST OF ABBREVIATIONS USED
BCSDM - Business Council for Sustainable Development Malaysia
CDM - Clean Development Mechanisms
CRC - Cooperative Research Centre
DANCED - Danish Co-operation for the Environment and Development
DSD - Department of Skills Development in MOHR
EC - Energy Commission, the English language version of the Suruhanjaya Tenaga
EFB - Empty Fruit Bunches
EPU - Economic Planning Unit, Prime Minister’s Department
ESA - Electricity Supply Act 1990 (Act 447)
IPC - International Procurement Centres
IPP - Independent Power Producers
JAS - Jabatan Alam Sekitar
KPKT - Kementerian Perumahan & Kerajaan Tempatan
KPPK - Kementerian Perusahan Perladangan dan Komoditi
KTAK - Kementerian Tenaga, Air dan Komunikasi, the former name of Kementerian Tenaga,
Tenaga Hijau dan Air (KeTTHA)
KTKM - Kementerian Tenaga, Komunikasi dan Multimedia, the former name of KTAK
MBIPV - Malaysia Building Integrated Photovoltaic
MECM - Ministry of Energy, Communications and Multimedia, the former name of MEWC
MEWC - Ministry of Energy, Water and Communications, the former name of
Ministry of Energy, Green Technology and Water (MEGTW)
MOHE - Ministry of Higher Education
MOHR - Ministry of Human Resource
MOSTI - Ministry of Science, Technology and Innovation
MPOB - Malaysia Palm Oil Board
NIMBY - Not In My Back Yard
OHQ - Operational Headquarters
POME - Palm Oil Mill Effluent
PPA - Power Purchase Agreements between IPPs and TNB
PTM - Pusat Tenaga Malaysia
R&D - Research and Development
RDC - Regional Distribution Centres
RE - Renewable Energy
RE - Representative Offices
REPPA - Renewable Energy Power Purchase Agreement
RO - Regional Offices
SCORE - Special Committee on Renewable Energy, established under the MECM
SESB - Sabah Electricity Sdn Bhd
SREP - Small Renewable Energy Power
ST - Suruhanjaya Tenaga
TNB - Tenaga Nasional Berhad, a Government-linked corporation that is primarily the single
largest distributor and retailer in Peninsular Malaysia
UBBL - Uniform Building By-Laws
2-SEDA RE Policy-Inner_SEDA Policy Book 8/24/11 8:34 AM Page vii

National Renewable Energy Policy and Action Plan1
1. INTRODUCTION
This report identifies the need and rationale for a convergence of energy, industrial growth, environmental and informationdissemination policies and proposes a new and forward-looking Renewable Energy (RE) Policy. The Report is structured asfollows:
Chapter 2 Key FactsSets out the chronology of the introduction and development of RE in Malaysia and the key facts gleanedfrom the various RE programmes.
Chapter 3 Key Issues Affecting REIdentifies the key issues and lessons that can be drawn from the facts.
Chapter 4 Need for RE Policy and Action PlanDevelops the rationale for and objectives of a convergent RE policy, drawing on the lessons and key issues setout in Chapter 3.
Chapter 5 The RE Resources and Smart TargetsIdentify and analyse the technical potential of renewable energy resources and identify the SMART targetsfor the renewable energy.
Chapter 6 The Renewable Energy PolicySets out the RE Policy vision, objectives and mission (strategic thrusts).
Chapter 7 RE Action Plan: Implementation ApproachDetails the implementation actions under each strategic thrust towards achieving the policy objectives.
Chapter 8 Evaluation Criteria and Success IndicatorsIdentifies the evaluation criteria to gauge the successes and achievements of the RE Policy and Action Plan.
Chapter 9 ConclusionConcludes by showing the relationship of the various strategic thrusts to each other and the building blocks.
2-SEDA RE Policy-Inner_SEDA Policy Book 8/24/11 8:34 AM Page 1

2
No. Date Description Of Study, Policy Or Programme
1. 1980s Stand alone solar photovoltaic systems for electricity supply to rural communities and remote areas in Malaysia.
2. 1999 Study on the development of a “Strategy for Renewable Energy as the Fifth Fuel” by KTKM (with the supportof DANCED). This study assessed the RE potential in Malaysia and recommended the legal, regulatory andfinancial framework to encourage the utilisation of renewable resources.
Prime Minister announced at the World Renewable Energy Congress in Kuala Lumpur that RE is the nationalfifth fuel.
3. April 2001 RE utilisation as fifth fuel incorporated into the 8th Malaysia Plan, which identified the various tools to promotegreater utilisation of RE (namely demonstration projects, commercialisation of research findings, extension offinancial and fiscal incentives).
4. May 2001 Small Renewable Energy Power (SREP) Program announced. The SREP Program encourages the production ofRE by small power generation plants by allowing these producers to sell electricity generated to electricitydistributors or retailers, such as TNB.
5. 2002 Biogen Full Scale Model (Biogen FSM) Demonstration Project was initiated.
SREP Guidelines for the initial phase issued by the Special Approval Committee SREP Programme.
Prices for electricity generated using RE and sold to TNB was to be negotiated on a “willing buyer-willing seller”and “take and pay” basis, and documented in a REPPA. REPPA terms were similarly open to negotiation.
6. July 2005 MBIPV - a 5 year Programme financed by GOM-UNDP (GEF) that expires in 2010 was launched to promoteuse of PV technology in buildings.
7. March 2006 9th Malaysia Plan states that “the sources of fuel will be diversified through greater utilisation of renewableenergy. A market-based approach will be promoted to ensure efficient allocation of resources. Emphasis willbe given to further reduce the dependency on petroleum products by increasing the use of alternative fuels”.
8. 2006 Study on SREP Programme and RE development in Malaysia undertaken by DANIDA.
9. July 2006 Increase of RE price to RM0.19/kWh for biomass and biogas3.
10. August 2007 Increase of RE price to RM0.21/kWh for biomass and biogas3.
2. KEY FACTS
The design and formulation of a new and forward-looking RE Policy is guided by the relevant facts and lessons learnt fromcurrent efforts of renewable energy development in Malaysia.
2.1. Chronology of Events
Malaysia’s RE policy and programmes have been in existence for almost 30 years and Table 2.1 below chronologicallysummarises the policies and programmes that have been introduced in Malaysia.
3 See TNB’s 2008 Annual Report at p. 68
Table 2.1: Malaysian RE Studies, Policies and Programmes
2-SEDA RE Policy-Inner_SEDA Policy Book 8/24/11 8:34 AM Page 2

National Renewable Energy Policy and Action Plan3
The outputs of the various studies conducted are summarized in the table below:
No. Date of study Description of Study Key Outputs of Study
1. 1999 Study on the development of a “Strategy forRenewable Energy as the Fifth Fuel” by KTKM(with the support of DANCED).
(i) Identification of renewable energypotential from palm oil biomass wastesand effluents;
(ii) The conceptualisation of the SREPprogramme with the expectation thatthe palm oil mill industry would be a keyparticipant.
2. 2006 Study on SREP Programme and REdevelopment in Malaysia by DANIDA
The main barriers to RE development:
i. Tariff not meeting market IRRexpectations;
ii. Lack of long term fuel supply;iii. Lack of financing; andiv. Certain provisions in the REPPA were
unacceptable to SREP developers.
Specifically 3 categories of barriers which are:
(i) Financial – insufficient incentives fromGovernment, difficulty in sourcing offinancing and uncertainty of fuel costsas biomass has alternative uses;
(ii) Institutional/legal – limited interests,non-transparent way to connect to thegrid, maximum limit discouragesmedium size RE projects as outsidesupport scheme; and
(iii) Technical – limited local expertise andtechnology, under-developed palm oilbiomass boiler technology and localisedbiomass/biogas fuels (distance to loadcentre).
Table 2.2: RE Studies Conducted and Key Outputs
2.2. Status of RE Developments (2001 – 2009)
The period 2001 to 2008 spans two Malaysia Plans, i.e. the 8th and 9th Malaysia Plans which saw the introduction of threeprogrammes – the SREP programme, the Biogen Full Scale Model (Biogen FSM) Demonstration Project and the MBIPVprogramme.
The main outcomes for RE development during the period are summarised below:1. Small Renewable Energy Power Programme (SREP):
• 50 projects approved by SCORE with total generation capacity of 288 MW;• 40% of projects have been cancelled;• 24% of projects have been issued with licences;• 36% of projects could not commence because licences have yet to be issued;• only 53 MW of RE generation capacity has been connected to the electricity grid (2001-2009);
2-SEDA RE Policy-Inner_SEDA Policy Book 8/24/11 8:34 AM Page 3

4
2. In 2009, one Biogen FSM Demonstration Projects has been commissioned (i.e. the MHES Asia’s 13 MW powerplant) and the FELDA Serting 500 kW power plant is expected to be commissioned in the 1st half of 2010.
3. There are more than 400MW off-grid electricity capacity primarily produced by private palm oil millers;
4. About 1 MW of cumulative grid-connected PV installations in more than 100 buildings throughout Malaysia(mostly in Klang Valley).
As at December 2009, 53 MW RE power generations have been generated and connected to the grid. It is expected that by2010 the generating capacity of SREP projects will reach 65MW.
2.2.1. SREP Programme
Nature
The SREP Programme is a fully private sector funded initiative. Private sector participants need to meet their own fundingneeds via the use of internally generated funds or borrowings from commercial financial institutions. Under the SREPProgramme, small power generation plants (limited to not more than 10 MW capacity) which utilise RE resources sell (export)electricity to the utility company through the distribution grid system (usually at 11 kV).
All SREP Program projects must be submitted for approval by SCORE, a committee established under the Ministry of Energy,Green Technology and Water (KeTTHA). Members of the committee are appointed from various agencies and otherstakeholders in the electricity sector. The SCORE Secretariat in the Suruhanjaya Tenaga (ST) processes and validates all SREPapplications and the successful applicant would be granted a licence to operate by the ST which is the regulator of theMalaysian electricity industry.
Technologies and Fuel Supply
The most popular technologies under the SREP programme are biomass (using palm oil empty fruit bunches), biogas (frompalm oil mills effluent), mini-hydro and municipal solid waste. The wider use of solar PV has recently gained prominence dueto the implementation of the MBIPV programme but generally not considered as SREP.
Palm oil mills were considered inefficient biomass power plants because of the disproportionate RE input-output ratio of theexisting mill technology, i.e. a disproportionately large volume of EFB has to be burnt to produce a given quantity of energy.Thus mills need to upgrade their plants to realise the full benefit of biomass. Furthermore for those technologies that rely ona fuel source such as EFB, rice husk, wood residue or POME, obtaining reliable fuel supply is a key factor to project viability.
It was observed that suppliers of EFBs for biomass power plants, upon recognising the economic value of an essential inputto biomass power generation, could exercise its market power by introducing economic terms and conditions (where noneexisted before) for the supply of EFB.4 Evidence of such circumstances was documented in the 2006 DANIDA Study whichhighlighted the difficulties faced by RE plant operators in obtaining long term biomass fuel supply agreements. Commonlythe duration of most EFB supply agreements was no more than 3 years.
This situation has a direct effect of reducing the viability of the RE project as the buyer of energy (i.e. the utility) could not beassured of on-going long term supply given the RE plant is dependent on EFB fuel supply agreements of relatively shortduration compared to the REPPA agreements which are for a longer period of time.
Example: Rice husk and wood residue as fuelProposals to construct RE plants using wood residues and rice husk as fuel were received andapproved by SCORE. Notwithstanding the approval, these proposals did not progress any furtherbecause (as noted by industry observers), the proposed capacity of 10MW for the rice husk powerproject was too ambitious and (as realised by the project proponents themselves) it was difficultand costly to collect the required quantity of fuel (i.e. rice husk and wood residue) to make theproject feasible.
4 In economics, an essential input is one for which demand is price-inelastic. Buyers of an essential input have very limited recourse to lower their demand significantly whena seller increases the price of that input.
2-SEDA RE Policy-Inner_SEDA Policy Book 8/24/11 8:34 AM Page 4

National Renewable Energy Policy and Action Plan5
Energy Prices
The SREP Guidelines state the price of electricity generated using RE is to be agreed by the relevant parties throughnegotiations on a “willing buyer-willing seller” basis. This means the Regulator (ST) or the Government will not set the energyprice the utility must pay to the RE power producer.
Another important issue to note is the price for electricity generated using RE according to the SREP Guidelines is on a “takeand pay” basis. The utility company will only pay the RE power producer if the utility takes the electricity generated. Henceif the utility does not take any electricity in a given month, the RE power producer does not earn any revenue in that period.
Despite the SREP Guidelines stating that the price of RE electricity is to be negotiated, the price is evidently “declared” to bebetween 14 sen/kWh and 17 sen/kWh in the SREP Application Form 1/2002. The problems with the RE price levels being“declared” in the SREP Application Form 1/2002 are:
(a) They did not meet the RE project proponent’s or the market’s expected internal rate of return (IRR)5; and
(b) They did not reflect the full cost of RE supply.
These problems were not able to be mitigated when the level of RE price (for biomass and biogas power only) were revisedupwards. The price increase was seen to be arbitrary because economic costing studies carried for the purpose were notmade transparent. This may also create a market perception that the Government is preferring biomass and biogas as REsources for electricity generation over other sources. The RE price of both biomass and biogas generated power has beenrevised twice recently as in Table 2.3 below.
• July 2006, KTAK increased the price to RM0.19/kWh following the 12% increase in the retail tariff for conventionalpower in mid 2006; and
• August 2007, the price was raised to RM0.21/kWh by the Minister following discussions with TNB6.
RE prices Biomass Biogas Mini-hydro Solar PV
RM0.17/kWh X X X X
RM0.19/kWh (July 2006) X X - -
RM0.21/kWh (Aug 2007) X X - -
Table 2.3: Summary of RE Prices for Various RE Sources (Malaysia)
REPPA
In order for the legal relationship between the RE power producer and the utility to exist, a REPPA has to be entered into. Thisrequires negotiations between the utility company and the RE power producer because currently there is no standard REPPAagreement mandated by the relevant authority or law.
As a result, REPPAs were developed using the PPAs between the conventional IPPs and the utility company as a precedent. Itis observed that these REPPAs contained provisions that are unsuitable for RE power supply.
5 See the 2006 DANIDA Report at pages 12 and 156 It is understood that the direct intervention by the then Minister was necessary and resulted in agreement by TNB that such an increase was necessary in fulfilment of their
corporate social responsibility.
2-SEDA RE Policy-Inner_SEDA Policy Book 8/24/11 8:34 AM Page 5

6
In negotiating the terms and conditions of a REPPA, RE project proponents are confronted with issues which are:
(a) Time and resource constraints
Most RE power producers are small players who neither have the resources nor capacity to negotiate for acceptableterms and conditions. Furthermore, the fiscal incentives for a RE project are subject to the condition that the project isimplemented within 12 months. The combination of limited resources and time increased the pressures on RE powerproducers to capitulate and agree to terms favourable to the utility.
(b) Single buyer
The existence of a single buyer (i.e. the utility company) creates an unequal bargaining position, especially if the utilityexercises its monopsony power to seek terms that are more favourable to itself or more onerous to the RE powerproducer7. This has the effect of pressuring the RE power producer to agree to terms it may not usually accept.The Ministry of Energy, Water and Communications had in 2007 simplified and standardised the REPPA by removingsome inappropriate and unsuitable clauses for RE projects of up to 2 MW capacities. Proponents of more than 2 MWprojects will still have to negotiate the terms of REPPA with the utility.
(c) Interconnection
The cost to interconnect the RE power plant to the grid (including the cost of strengthening the system) according tothe SREP Guidelines is to be borne by the RE project proponent. Sometimes the costs are quite substantial especiallyif the location of the RE power plant is quite a distance from the grid which would be burdensome to the RE projectproponent.
Examples of unsuitable clauses in REPPA: (i) Performance provisions (i.e. facilities must deliver at the “specified annual capacity factor
calculated as an annual moving average”),
(ii) Penalty provisions (i.e. RE producers can be penalized 1 sen per kWh for every 2% shortfall inannual capacity factor, except for the first six months of billing when the project is still undertesting stage), or
(iii) Saving sharing provisions (i.e. where RE developers were to pay TNB, 50% of any savingsaccrued from CAPEX or tax reduction which deviates from the former’s original expectationswhen they submitted their financial models to TNB).
7 Notes: The DANIDA Report identified the REPPA was unfavourable for RE project developers.
2-SEDA RE Policy-Inner_SEDA Policy Book 8/24/11 8:34 AM Page 6

National Renewable Energy Policy and Action Plan7
Participants Expectation
From the feedback obtained the expectations of interested participants in the SREP Programme can be summarised as follows:(a) A pay-back period of between 3 to 5 years (especially by some palm oil millers8);
(b) A “high9” internal rate of return; and
(c) The SREP Program is not commercially attractive given the availability of alternative incentives in the form ofCDM10.
Most RE developers expected these are met when embarking on RE projects but to date its success is rather limited. Howeverin 2007 the RE price for biomass and biogas was increased to RM0.21/kWh which improve the situation and able to counter-balance the incentive in the CDM programme (only for biogas) or meet the expectations.
Progress of SREP Projects
Several RE projects approved between 2007 to 2009 have made significant progress. These projects will supply a total of 65MW when they are connected to the electricity grid by the end of 2010. It is worth noting these projects have progressedover a period during which changes were made to the key elements of the SREP Programme – namely an increase in theprice of electricity sold to the utility by RE producers, and the standardisation of REPPA to reduce the negotiation time periodfor RE capacity below 2 MW. These changes addressed the two factors found by the 2006 study to have impeded theimplementation of SREP projects.
2.2.2. Biogen Project
The Biogen Full Scale Model (Biogen FSM) Demonstration Project was initiated in 2002. Its main aim is to catalyse thedevelopment of RE projects through effective demonstration of the techno-economic viability of biomass and biogas gridconnected power generation projects, as well as through the provision of soft-loans to facilitate the development.The project is the cooperation between the Government of Malaysia and UNDP-GEF in which two full-scale model projectswould be constructed and scheduled for commission in early 2009. The Biogen Full Scale Model projects are:
(a) MHES Asia’s 13 MW RE power plant running on biomass using EFB as fuel; and
(b) FELDA Serting 500 kW RE power plant using biogas from palm oil mill effluents (POME).
During the implementation process there were initial interests of participants in the Biogen FSM Demonstration Project,however many withdrew from it citing the lack of adequate or sufficient returns on investments. The owner of MHES AsiaRE power plant also faced many constraints while implementing the project such as:
(a) Delays in approval of borrowings from local financial institutions;
(b) The treatment of project proponents as independent power producers akin to the existing IPPs in theconventional energy generation market; and
(c) Loan conditions that disbursement occurs when a plant is 80% complete.
8 The 3-5 year payback period is a usual palm oil mill industry norm. Any period longer than that runs contrary to usual investment return horizons, thus making it a difficultto convince palm oil millers to participate.
9 Palm Oil Millers are used to high returns of their investments and a payback period of their investment of as low as 2 to 3 years. This provides for a high IRR. This acts as adisincentive for them to venture into the RE power generation, particularly when the payback period for their investment is about 10 years (from biomass fired SREP projects).
10 CDMs gave the palm oil millers adequate returns for merely flaring the methane rather than generating power.
2-SEDA RE Policy-Inner_SEDA Policy Book 8/24/11 8:34 AM Page 7

8
2.2.3. MBIPV Project
The main goal of MBIPV Project is to reduce the long-term cost of solar photovoltaic technology through the developmentof a sustainable and widespread local market. The implementation of the MBIPV project is for 5 years from 2005 until 2010.The project is able to achieve the main objectives of increasing the capacity of PV technology applications in buildings by330% and reducing the technology unit cost by 20% from the baseline. Through the Suria 1000 programme, the MBIPVProject provides grants which are awarded through a bidding system to homeowners and companies to partially finance thecapital and installation costs of a PV system. The level of financial assistance provided in the early phases of the programmewas higher than that provided in the later phases.
In all phases of the programme, successful bidders would contribute their own money to finance the purchase and installationof a solar PV system. Income from sale of electricity to the distribution grid is based on a net-metering scheme (in creditbasis where the price for PV electricity is equivalent to the price of purchased electricity). The installed capacity of a PV systemfor a residential home is typically between 4kW to 10kW.
The following facts are some of the milestones that have been achieved under the MBIPV Project:(a) Since 2006, on average the cost of a PV system has dropped from RM31,000/kWp to RM26,000/kWp. All other
things being equal, consumers may have responded to the cheaper cost by increasing the quantity demandedof PV systems;
(b) Despite the lower level of financial assistance provided, the bidding for such assistance became more competitivewhich reflects:
i. The objectivity of both the bidding process and selection criteria;
ii. The willingness of consumers to bear a higher portion of the finances required to purchase and install aPV system; and
iii. Environmentally friendly or green technology is getting positive attention from the consumers.
2.3. Fiscal Incentives
The Government has introduced fiscal incentives to stimulate the growth and interests in the RE sector since 2000 whichincludes:
(a) The grant of pioneer status with tax exemption of 100% of statutory income, and an extension of the pioneerstatus from 5 years to 10 years11;
(b) Investment tax allowance of 100% on qualifying capital expenditures incurred within a 5-year period, with theallowance offset against 100% of statutory income for each year of assessment12; and
(c) Import duty and sales tax exemptions.
All of the current fiscal incentives are provided with the condition of an expiry date 31st December 2010 which is the end ofthe ninth Malaysia Plan. These incentives would be evaluated for future fiscal incentives to be considered by the Government.
11 Note: This is an increase from the original exemption of 70% of statutory income.12 Note: This is an increase from 60% of the qualifying capital expenditure.
2-SEDA RE Policy-Inner_SEDA Policy Book 8/24/11 8:34 AM Page 8

National Renewable Energy Policy and Action Plan9
3. KEY ISSUES AFFECTING RE DEVELOPMENT
Introducing a new policy requires clear identification and definition of the issues that need to be addressed, otherwise thepolicy may be misdirected or fail. The key issues and lessons in RE development in Malaysia are summarised in Table 3.1 belowand elaborated in the proceeding sub-chapters 3.2.
Issues Issues(1) Market failure exists:
The RE market was not successful due to the monopsonypower and information asymmetries; and also constrainedby financial and technological factors.
Market failure will be perpetuated unless the causes of suchfailure, viz. unequal bargaining position of the utility and REproject proponents, significant transaction costs in terms of thetime needed to conclude a REPPA, and the monopsony power ofthe utility to agree to the requests of the RE project proponentare properly addressed.
(2) Constraints: Inherent factors that constrain the performance of themarket.
The market should be assisted to achieve the intended outcome(increase in RE power generation); steps should be taken toameliorate the economic, financial and technological constraintsthat are impeding market performance.
(3) Arbitrary price setting: RE prices are set without transparent mechanism.
RE prices must be based on sound economic principles and allowfor full cost recovery. Anything less than full cost recovery (orefficient prices) will affect the viability of the RE project.
(4) Tensions and trade-offs:The predicament of expecting the utility will bear the highercosts of RE power.
The predicament can be addressed by the introduction of amechanism for sharing the cost of RE amongst all members ofsociety, as environmental improvement is a non-excludable publicgood.
(5) Absence of Regulatory Framework:The absence of a proper regulatory framework, inhibitseffective legal action from being taken.
Regulatory frameworks provide the necessary foundation forachieving the desired outcome, and it sends a strong signal tothe market of the government’s commitment. The existing ESAis inadequate and insufficient to be used as the legal basis tosupport RE Businesses growth.
(6) Poor governance:Limited and ineffective governance affects the participationof stakeholders and legitimacy of the action.
Governance can be strengthened and improved through theintroduction of the regulatory framework where governanceprinciples are embedded.
(7) Limited OversightLimited concerted oversight of implementation problems.
Oversight and implemented functions need to be in separateorganisations for improved accountability;
(8) Lack of institutional measures:Lack of systematic institutional measures to meetinformational and technological needs.
Information asymmetry requirements which need to solvedthrough proper information dissemination, advocacy andawareness actions.
Access to and the type of information should be made availableexpeditiously to assist in the private firm’s decision makingprocess for investments in RE.
Table 3.1: Summary of Key Issues and Lessons
3.1. Existence of Market Failure
In a market economy like in Malaysia, the questions of what, how and for whom resources would be allocated are primarilyresolved through the interplay of supply (by producers of goods and services) and demand (by consumers). A market workswell in providing the sorts of goods and services people wish to buy and can do so at least cost, so long as certain conditionsare present. The most important of these conditions are:
(a) There are no significant externalities. An externality is a significant cost of production (or consumption) that isnot fully borne by the producer (or consumer); e.g. a producer who does not bear the costs of pollution willover-produce the good that is the source of the pollution.
(b) Firms in the market face competition from other existing firms, from imports, as well as the threat of new firmsentering the market. A single-seller (monopolist) is likely to exploit the absence of competitive threats (e.g. byselling an essential product at a higher than competitive price), whereas a single-buyer (monopsonist) is likelyto behave opportunistically (e.g. to only do business with firms that accept terms and conditions favourable tothe buyer).
2-SEDA RE Policy-Inner_SEDA Policy Book 8/24/11 8:34 AM Page 9
10
(c) Adequate information about the quality and characteristics of goods and services is provided or made availableto buyers at reasonable cost; and a party in a transaction does not know substantially more than the other party.
Where and when one or a combination of such conditions is not met in the real-world, a market failure occurs andGovernment can and should intervene to prevent resources from being allocated inefficiently.
3.1.1. Evidence of Market Failure
The discussions in Chapter 2 show the existence of market failure in RE development of the country based on the facts whichare:
(a) In the SREP Programme, leaving agreements to be reached between parties may allow the party with marketpower or more information to take advantage of its bargaining strength to the detriment of the other party.Examples are the very short term fuel (EFB) supply agreements or the long negotiation time for a REPPA.
(b) EFB is seen as an essential source of fuel for some technology-specific RE producers, the supplier of EFBs couldand in fact did exercise its market position and power to the detriment of the buyers of EFB. As a result, the REproducers who are dependent on EFB are unable to secure long term supply contracts (of more than 3 years)with guaranteed availability at a price that is significantly higher than expected.
(c) An information asymmetry exists between RE project proponents and the utility (as the utility is more experiencedin electricity supply) is able to justify the existence of certain clauses in a REPPA on technical grounds whichcannot be rebutted by the RE project proponent. This could compel RE project proponents to acceptunfavourable terms and conditions.
(d) It is well-known that CO2 or GHG is emitted by the burning of fossil fuel. The costs of such pollutants (i.e. theexternality) have yet to be taken into account in the production decisions and behaviour of the utility and IPPs.There may be over-production of electricity using fossil fuel and this is aggravated when the cost of the inputto conventional power production is subsidised.
In Malaysia, the Government’s role and involvement in the energy supply industry is well-established and can be expected tocontinue for some time in the future. The Government needs to recognise the conditions that cause market failure andaddress these issues.
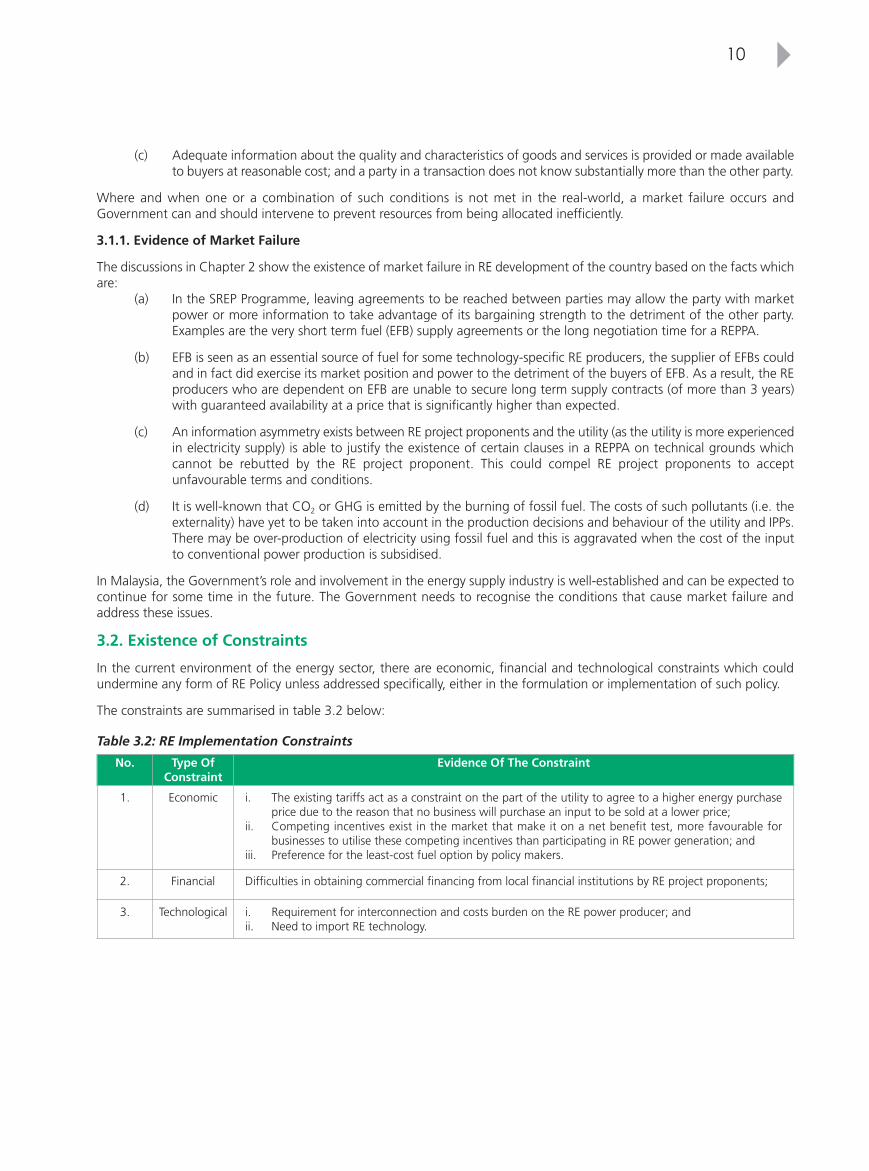
3.2. Existence of Constraints
In the current environment of the energy sector, there are economic, financial and technological constraints which couldundermine any form of RE Policy unless addressed specifically, either in the formulation or implementation of such policy.
The constraints are summarised in table 3.2 below:
No. Type OfConstraint
Evidence Of The Constraint
1. Economic i. The existing tariffs act as a constraint on the part of the utility to agree to a higher energy purchaseprice due to the reason that no business will purchase an input to be sold at a lower price;
ii. Competing incentives exist in the market that make it on a net benefit test, more favourable forbusinesses to utilise these competing incentives than participating in RE power generation; and
iii. Preference for the least-cost fuel option by policy makers.
2. Financial Difficulties in obtaining commercial financing from local financial institutions by RE project proponents;
3. Technological i. Requirement for interconnection and costs burden on the RE power producer; andii. Need to import RE technology.
Table 3.2: RE Implementation Constraints
2-SEDA RE Policy-Inner_SEDA Policy Book 8/24/11 8:34 AM Page 10

National Renewable Energy Policy and Action Plan11
3.2.1. Economic Constraints
(i) Controlled and Low Electricity Tariffs
The average electricity tariffs in Malaysia are generally low despite the increases in June 2006 by 12% and again in July 2008by 23% (average). The government in March 2009 had reduced the average electricity tariffs by 5%. Notwithstanding themovement of tariffs over the past 3 years, a fundamental concern is that the tariffs are artificially low due to the fossil fuelsubsidy the Government provides (directly or indirectly) and have not accounted the external costs. This means that the realcosts of electricity is not passed to consumers which perpetuates consumer expectations of low retail tariffs.
This report takes as given the state of the current energy tariffs and assumes that it is the intention of Government to reduceover time, the existing subsidies and also include the external costs. Therefore in such a situation the low tariffs act as adisincentive (or even a commercial hindrance) for the utility to agree to a higher purchase price for RE. The utility being apublic listed company with diverse shareholders owe the shareholders an obligation to meet financial targets and profitforecasts which it would not be able to do by buying RE at a price higher than the permitted retail energy tariffs.
Consequently there is a need for the policy to manage two opposite demands which are:(a) The requirement for an efficient RE price which provides the necessary incentive for firms to enter the RE market;
and
(b) The need for the utility to meet its financial responsibilities to its shareholders. This means the financial burdenan efficient RE price places on the utility needs to be managed by alternative means.
(ii) Competing Incentives
The existence of different market choices can create competing incentives and private firms will choose the lowest cost toimplement or produce the greatest benefit to them; i.e. a net benefit test. The available competing market choices are theCDM, which will improve energy efficiency or participation in RE generation. Based on a net-benefit test, firms will choosean approach that maximises the benefit to them at the lowest cost.
(iii) Least Cost Option
RE programmes or projects faced significant economic impediments because the economics of conventional energy usingfossil fuels is less costly compared to renewable energy sources. With such an economic situation, it is not surprising thatinterest in RE projects is rather low. The lack of promotion of RE as a source of fuel for power generation by policy makersaggravates the marginalisation of RE from the mainstream because of the signals that are given to the market.
3.2.2. Financial Constraints
The approach of the current SREP programme relies on private capital and the availability of funds is a significant necessity.A review of the RE projects reveals that RE project proponents experienced difficulties in securing funding from local financialinstitutions. This occurs from a lack of knowledge or expertise amongst financial institutions to evaluate RE projects that seekfunding, imposition of terms and conditions which treat RE funding as a conventional loan (and not similar to non-recourseproject financing as adopted with IPP funding), greater risk mitigation measures to reduce the exposure of the financialinstitution to the risk of non-payment or a default. The latter resulted in reduced duration of the loan tenure to approximately8 years, imposition of stringent conditions for drawdown particularly after an advanced stage of construction and higherinterests rates.
As a consequence the availability of capital to fund RE projects is very much lacking, and this adds as a disincentive to privateenterprise from developing any RE project. Only those with better access to capital (either ready capital via internally generatedfunds or with other assets to provide security to financial institutions) would be able to overcome the financial difficulties.This reduces the available pool of private sector participants and accordingly has a knock-on effect on the number of REplants built and commissioned.
3.2.3. Technological Constraints
There are two technological constraints on the viability of RE projects which are:
(i) Interconnection
The cost to interconnect the RE power plant to the grid including strengthening of the system is according to the SREPGuidelines, to be borne by the RE project proponent. Such a requirement adds to the capital costs burden of RE projectproponents, thereby increasing the capital requirement and affecting the financial viability of the RE project. However if such
2-SEDA RE Policy-Inner_SEDA Policy Book 8/24/11 8:34 AM Page 11

12
costs are to be borne by the RE power producer then such costs must be reflected in the RE prices, so that the costs can berecovered. This would make the RE price an efficient price. However current RE prices were not transparent thus affectingthe viability of the RE projects.
(ii) RE Technology
This burden is particularly significant because of the technology costs in RE projects. Advanced RE technologies (e.g. modernand efficient gasification boilers) that are imported could be very expensive and also subjected to significant technology costs(e.g. royalty payments for use of the intellectual property within the RE technology). Such costs would add to the capitalburden of firms which in turn creates a feedback loop for higher RE tariffs. Consequently only firms with sufficient financialmeans could participate, but more significantly this has the potential to exclude small and medium, but equally if not moreentrepreneurial enterprises from entering this market.
Example: Technology CostsOne of the approved RE power plant utilises a gasifier technology (referred to as “envirocycler”)licensed from a Canadian patent. This technology would result in greater efficiency of energyconversion as compared to the conventional direct combustion of EFB.
The capital cost of the gasifier amounted to RM14 million whilst the royalty payment amountedto 32% of the total project cost.
The existing constraints mean any measures designed to implement the policy should address these constraints in a meaningfulway without distorting the market (e.g. by providing subsidies). The opportunity is available for the proper management ofthese constraints in an effective and efficient manner which enables the policy to be sustainable over the long term.
3.3. Arbitrary RE Price Setting
The original intention as expressed in the SREP Guidelines was for the RE prices to be market-based. However there wereinstances of informal price settings made by the Government which lacked the adoption of economic principles. The RE pricesfor biomass and biogas were raised in 2006 and 2007 and not for other RE sources which reflects two key issues:
(a) The lack of the application of economic principles in price setting to ensure the basis is transparent and clear;and
(b) The substitution of a “principles-based” approach for an individual’s perception or understanding of the “right”price (i.e. arbitrary setting of RE prices without regard to efficiency of the price).
3.4. Business Tensions and Trade-offs
Existence of business tensions necessitates a trade-off, where the business must make a choice. In the case of RE developmentin Malaysia, the demand on the utility (as the market for retail and distribution has not been liberalised) to fund RE by payinghigher prices to RE power producers is the opposite of the demand on the same utility to improve its financial performanceand the return on its assets.
This financial improvement is needed because:(a) The utility is a publicly listed company, and
(b) Its majority shareholder is Khazanah Nasional which has introduced the “Rainbow Books” in the GLCTransformation programme13.
These create tensions causing supremacy seeking in the utility, and the result is the utility will support the demand for financialimprovement. Consequently there is little or no incentive for the utility to concede anything when dealing with RE powerproducers as it sees itself in a “lose-lose” situation.
13 Details of the GLC Transformation programme are available at http://www.pcg.gov.my/index.asp (accessed on 25 Feb 2009)
2-SEDA RE Policy-Inner_SEDA Policy Book 8/24/11 8:34 AM Page 12

National Renewable Energy Policy and Action Plan13
On the other hand, there is the expectation of RE power producers especially from the palm oil industry (i.e. biomass andbiogas) of high IRRs and short pay-back periods, create a demand for higher RE prices. These demands have resulted in pricechanges and other actions viewed as being taken against the utility or not in the utility’s interests but that of the palm oilindustry.
However there is a need to recognise the use of RE produces a public good - i.e. improvement in the environmental conditionthrough the reduction in GHG emissions. In Malaysia, the total GHG emissions for the year 2006 amounted to 169,829GgCO2 and the power sector is identified as one of the major and largest contributors with 56,203 GgCO2 accounting for33% of the emissions. Whilst it is recognised the various types of fossil fuels (e.g. coal) used in power generation contributedifferent amounts of GHG into the atmosphere, it must be noted that renewable energy such as biomass either releaseminimal amounts of GHG carbon-neutral, or the same amount of carbon dioxide as it absorbs, while wind and solar has zeroemissions.
One of the outcomes of RE is a public good, which is non-rivalrous and non-excludable (i.e. other members of society cannotbe excluded from enjoying it, nor does one’s consumption of it reduces its availability). This means those who pay for thisbenefit cannot exclude others who do not pay (but who can still enjoy the good).
The current scenario would create a dilemma amongst consumers due to these factors: (a) The expectation of a high price for RE especially for biomass and biogas by the RE power producers;
(b) The need by the utility for RE prices to be as low as energy generated from fossil fuels;
(c) The expectation of the associated costs of RE programme should be borne by someone other than the utility;and
(d) The outcome of RE power production is a non-rivalrous and non-excludable good.
The approach that could be adopted to date is to use political will to persuade the utility to bear these costs; but such anapproach limits the growth of RE power plants. This also leads to the question of who should be made to bear the costs.
Cost Bearing
Placing the RE costs solely on the utility’s shoulder (as is the case to date) creates tremendous tensions for the utility especiallyas it has to meet its key performance indicators set under the GLC Transformation programme, its public company status andtreated as part of the government. The result is that the utility will find ways to minimise their cost exposure.
Alternatively if the RE producers bear the costs (i.e. being the difference between the actual cost to generate and the pricethey receive for selling it to the utility) they have no incentive to enter the market.
If the cost burden is placed on the Government, it means an opportunity costs and competition amongst other programmesfor funding. However it must be recognised the Government revenue is not unlimited and must be used efficiently andeffectively.
Therefore placing the RE cost burden on all levels of consumers whether they are households or businesses is an effectiveand efficient mechanism because:
(a) It is a consumption based burden, since the more one consumes the higher the amount to be contributed;
(b) It implicitly recognises the “polluter-pays” principle; and
(c) The existing collection mechanism can be used thereby minimising transaction costs.
3.5. Lack of an Efficient Regulatory Framework
It is observed current regulatory framework is inadequate to address the myriad issues pertaining to RE as a fifth fuel inelectricity generation. For example under Section 26 of the Electricity Supply Act (ESA), the power to fix tariffs is in the handsof licensees with the proviso such tariffs are to be approved by the Minister before being applied. The ESA also requires
2-SEDA RE Policy-Inner_SEDA Policy Book 8/24/11 8:34 AM Page 13

14
“installations” to have proper safety supervision undertaken by the resident engineer as prescribed in the ElectricityRegulations. It is silent on the provision making available the rights of a power producer to require or demand interconnectionof its power plant to the grid, nor is there any provision to deal with the risk of the grid operator behaving anti-competitively(since the grid is a natural monopoly and needs to be regulated as such).
The lack of mandatory requirement to enable access and interconnection means, any interconnection needs to be donevoluntarily by the grid operator, through the use of contracts. These contracts could supplement the deficiency in the currentregulatory framework, but their ability is dependent on the possibility of regulatory intervention to avoid abuse of marketpower. Further network access prices are not applicable in Malaysia since the transmission and distribution charges in theform of network access prices or use of system charges are not levied by the utility. The only form of such charges is theexpenses that TNB as a licensee incurs in providing a supply line to a person requiring the supply of electricity, which is not a“network access price”.
Without a robust, effective and efficient regulatory framework that provides clear rules (and minimises discretionary powers)the default mechanism is to rely on regulatory negotiations, i.e. negotiations to achieve an outcome which is similar had theoutcome been specified in regulations. This consumes time and effort of all parties and may not necessarily produce thedesired results.
The SREP programme evidenced that private capital will only be an effective means to introduce a new technology if there isa favourable and supportive regulatory environment and where sufficient and adequate return on investment exists. Withoutthese elements, the market will not work to support the introduction and take up of new technology.
Additionally RE developers were also subjected to procedures and processes of other agencies such as the Department ofEnvironment (DOE) for environmental impact assessments, State Authorities for land conversion approvals and for waterabstraction rights and permissions (in mini-hydro) and planning permission from local authorities.
These requirements are nevertheless applicable to all parties intending to generate power in Malaysia; and are not unique toRE power producers only. However there is a compliance cost which needs to be managed or reduced; and an opportunitycost incurred because of administrative delays could be due to lack of awareness from the stakeholders of RE developmentin the country.
3.6. Governance Issues
Good governance is a system that is transparent, accountable, just and fair, participatory and responsive to people’s needs.Governance is important because it provides a means, in which the institutional framework operates, clarifies the roles ofinterested parties and avoids or minimises conflicts of interests. Without proper governance, institutional structures may lackeffectiveness to play an efficient and legitimate role in spear heading RE development.
Institutions are of two types – formal or informal. Formal institutions are set up within the ambit of legislation or regulationswhile informal institutions exist within the ambit of administrative actions which may be sanctioned, recognised or supportedby the state. It is now recognised institutional systems may be one of the causes of sustainability problems and barriers toaddressing policy problems. Systems which are not transparent or fully accountable are precisely those that are resilient,powerful and resistant to change.
3.6.1. The Roles and Responsibilities of SCORE
The creation of a special committee referred to as SCORE is a mechanism determined by the government to facilitate thedevelopment of RE projects in the country. Its main role is to approve the SREP projects which are processed and validated byST who serves as the secretariat to the committee. However since the establishment of the SCORE in 2001, it is observed themembers may have influenced the government in determining the policy direction of SREP projects. The members of the SCORE include the MPOB and the utility (TNB) among others and the presence of these interested partiesin the decision making process may create potential for conflicts of interests. Evidences of the possibility of such conflicts ofinterests are:
(a) The setting of RE prices at RM0.21/kWh for biomass and biogas which directly benefits palm oil mills representedby MPOB; and
(b) The standardisation of REPPA for under 2 MW RE plants which would benefit TNB as the company is still ableto negotiate REPPAs for RE plants above 2 MW capacity.
2-SEDA RE Policy-Inner_SEDA Policy Book 8/24/11 8:34 AM Page 14

National Renewable Energy Policy and Action Plan15
Improving governance means avoiding situations where conflicts of interests may arise in instances where parties interestedin the outcome of a decision are involved in the decision-making process. The inputs of both TNB and MPOB are valuable,yet the interplay of their respective vested interests may distort the decision-making process.
MPOB and TNB can and should be required to make transparent submissions to a public consultation held under the aegisof SCORE, whilst allowing the decision maker to arrive at an independent decision that is beneficial to the country as a whole.
3.6.2. No Oversight
Implementation of the SREP Programme or RE Policy should be systematic and may need a legally constituted implementingagency. It is noted that the SREP projects approvals are made by SCORE not by ST as the industry regulator. There are guidelinesfor potential investors or firms to follow however in the implementation process it seems SCORE has descended into therealms of implementation i.e. approving of RE projects. The consequence of this is that there is no institution performing anoversight role to ensure that policy goals are achieved.
It is noted that the increase of RE prices as well as getting the utility to agree to standardisation of the terms of REPPA arenot based on transparent processes and procedures which may be open to question or challenge.
The lack of an oversight body to ensure the policy targets are met or at least to hold the implementing agency accountablereduces the effectiveness of the governance framework resulting in the limited success of RE development in the country.
3.7. Information Cost and Access
For any new technology to take root, having access to the appropriate information is essential. When firms do not haveaccess to proper information, there is a greater likelihood of relying on their own perception or using proxies to drawconclusions and make decisions.
Access to information that facilitates proper decision making is also an essential element for the mobilisation of capital.Furthermore there is a cost to accessing and processing information for decision making, and this cost makes it prohibitivefor small RE projects to undertake the information gathering, processing and assessing on their own.
There has been little assistance in provision of relevant information to interested parties, with the result of decisions beingmade largely on assumption basis.
Examples of decisions made based on general assumption:(a) Biomass plant of 10 MW relying on assumption that wood and rice husk for fuel are available,
while in reality the collection and quantity of such fuel is insufficient or the 10 MW plantintended is too ambitious;
(b) Biomass plant using EFB which need to be purchased when it is believed it would be givenaway free.
Minimisation of information costs could provide a direct assistance to firms interested in entering or participating in RE projects.
2-SEDA RE Policy-Inner_SEDA Policy Book 8/24/11 8:34 AM Page 15
16
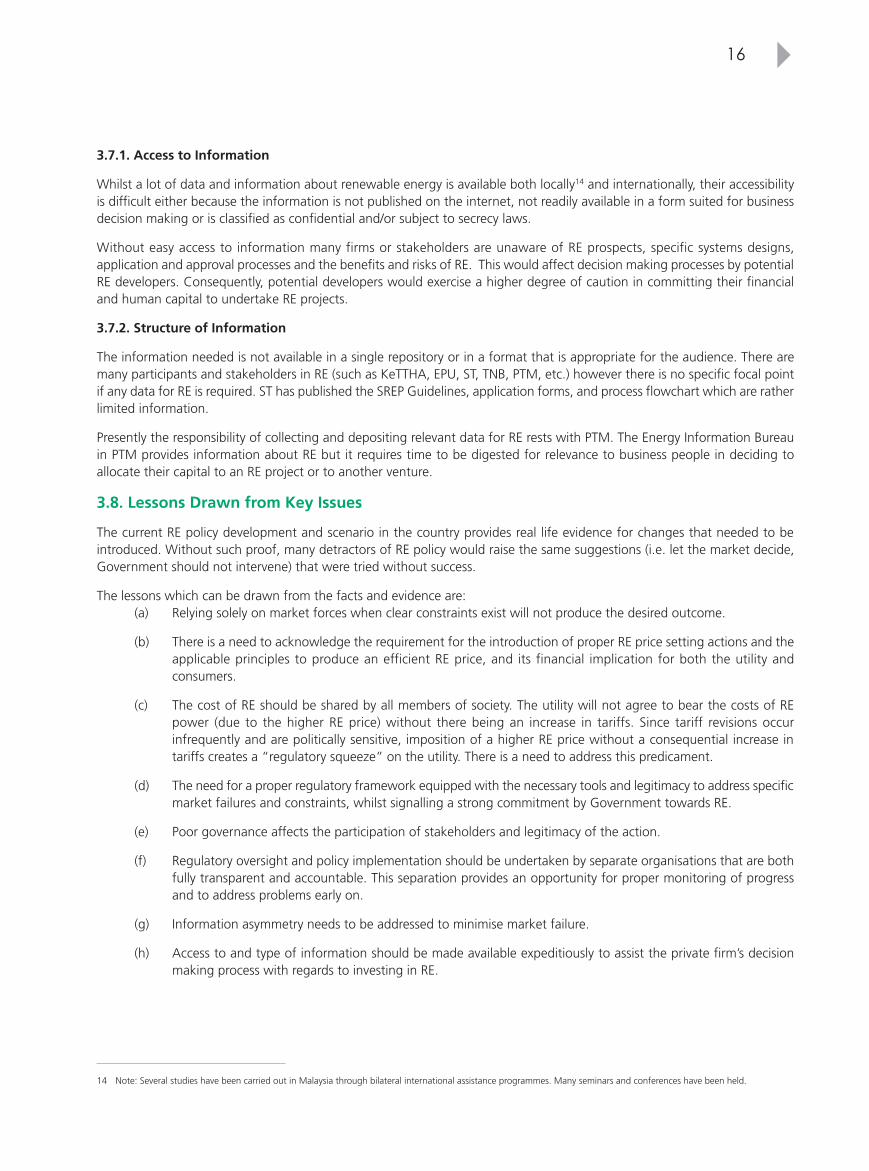
3.7.1. Access to Information
Whilst a lot of data and information about renewable energy is available both locally14 and internationally, their accessibilityis difficult either because the information is not published on the internet, not readily available in a form suited for businessdecision making or is classified as confidential and/or subject to secrecy laws.
Without easy access to information many firms or stakeholders are unaware of RE prospects, specific systems designs,application and approval processes and the benefits and risks of RE. This would affect decision making processes by potentialRE developers. Consequently, potential developers would exercise a higher degree of caution in committing their financialand human capital to undertake RE projects.
3.7.2. Structure of Information
The information needed is not available in a single repository or in a format that is appropriate for the audience. There aremany participants and stakeholders in RE (such as KeTTHA, EPU, ST, TNB, PTM, etc.) however there is no specific focal pointif any data for RE is required. ST has published the SREP Guidelines, application forms, and process flowchart which are ratherlimited information.
Presently the responsibility of collecting and depositing relevant data for RE rests with PTM. The Energy Information Bureauin PTM provides information about RE but it requires time to be digested for relevance to business people in deciding toallocate their capital to an RE project or to another venture.
3.8. Lessons Drawn from Key Issues
The current RE policy development and scenario in the country provides real life evidence for changes that needed to beintroduced. Without such proof, many detractors of RE policy would raise the same suggestions (i.e. let the market decide,Government should not intervene) that were tried without success.
The lessons which can be drawn from the facts and evidence are:(a) Relying solely on market forces when clear constraints exist will not produce the desired outcome.
(b) There is a need to acknowledge the requirement for the introduction of proper RE price setting actions and theapplicable principles to produce an efficient RE price, and its financial implication for both the utility andconsumers.
(c) The cost of RE should be shared by all members of society. The utility will not agree to bear the costs of REpower (due to the higher RE price) without there being an increase in tariffs. Since tariff revisions occurinfrequently and are politically sensitive, imposition of a higher RE price without a consequential increase intariffs creates a “regulatory squeeze” on the utility. There is a need to address this predicament.
(d) The need for a proper regulatory framework equipped with the necessary tools and legitimacy to address specificmarket failures and constraints, whilst signalling a strong commitment by Government towards RE.
(e) Poor governance affects the participation of stakeholders and legitimacy of the action.
(f) Regulatory oversight and policy implementation should be undertaken by separate organisations that are bothfully transparent and accountable. This separation provides an opportunity for proper monitoring of progressand to address problems early on.
(g) Information asymmetry needs to be addressed to minimise market failure.
(h) Access to and type of information should be made available expeditiously to assist the private firm’s decisionmaking process with regards to investing in RE.
14 Note: Several studies have been carried out in Malaysia through bilateral international assistance programmes. Many seminars and conferences have been held.
2-SEDA RE Policy-Inner_SEDA Policy Book 8/24/11 8:34 AM Page 16

National Renewable Energy Policy and Action Plan17
3.8.1. Actions Required for RE Development
Based on the aforementioned lessons, the actions need to be taken are:
(1) Introduce a regulatory framework which addresses the following key points:(a) Market failure issues pertaining to RE plants including information asymmetry and the existing constraints;(b) Provide certainty to investors;(c) Minimise regulatory or political capture by interested parties;(d) Setting of RE prices based on sound economic principles;(e) Establishment of an effective implementing agency for renewable energy development;(f) Provide for society to contribute towards the cost of RE (via a contribution system based on consumption of
energy); and(g) Creation of a fund in which the contributions are to be paid into including the terms of operation and use of
the fund.(2) Develop a cost sharing mechanism and determine payment obligations; (3) Introduce good governance system to ensure consistency of applications;(4) Introduce clarity of roles between the implementing agency and the agency tasked with oversight functions to ensure
full accountability; and(5) Disseminate relevant and pertinent information to firms intending to participate in the RE industry, to minimise
information costs.
Details of the action items are explored later in Chapter 7.
3.8.2. Summary
The actions identified in 3.8.1 above together with the lessons are summarised in Table 3.3 below:
Lessons drawn from real-life situation Actions required
(1) Inappropriate to rely solely on market forces, when clear constraintsexist, will not produce the desired outcome;
Introduce a new regulatory framework to address market failure issuespertaining to RE plants and the constraints.
(2) RE prices should be based on clear economic principles and tomanage the financial implication for the utility;
RE prices must be based on sound economic principles for finallyachieving full cost recovery. Anything less than full cost recovery orefficient prices will affect the viability of RE project. There is a need tointroduce a new regulatory framework that:
(i) Empower the regulator;(ii) Sets the applicable principles for RE price setting based on sound
economic principles of efficiency;(iii) Provide for the cost of RE to be borne by society at large (via a
contribution system based on consumption of energy).
(3) The cost of RE should be shared by all members of society, becauseit is unreasonable to expect the utility to bear the higher costs ofRE power without an increase in tariffs. Since tariff revisions occurinfrequently and are politically sensitive, imposition of a higher REprice without a consequential increase in tariffs creates a“regulatory squeeze” on the utility. There is a need to address thispredicament.
For cost to be shared by society a mechanism needs to be provided in alaw that:
(i) Determines the manner of calculating the contribution; (ii) Obliges a person to pay; and (iii) Identifies the terms of operation and use of the fund. This can only
be done through the introduction of an appropriate statute.
(4) The need for a proper regulatory framework Develop the appropriate regulatory framework which is rule-based toprovide certainty to investors and minimise regulatory or political captureby interested parties.
(5) Poor governance affects the participation of stakeholders andlegitimacy of the action;
Prescribe a good governance system within the regulatory framework toensure consistency of application and certainty to investors.
(6) Oversight and implementation function needs to be in separateorganisations for accountability;
Introduce clarity of roles between the implementing agency and theagency tasked with oversight functions to ensure full accountability
(7) Information asymmetry needs to be addressed Introduce a regulatory framework that address information asymmetryproblems, such as by prescribing the terms and conditions of a REPPAwithout any limitation
(8) Access to and type of information should be made availableexpeditiously in order to assist in the private firm’s decision makingprocess with regards to investing in RE.
Disseminate relevant and pertinent information to firms intending toparticipate in the RE industry, to minimise information costs.
Table 3.3: Summary of Lessons Drawn and Required Actions
2-SEDA RE Policy-Inner_SEDA Policy Book 8/24/11 8:34 AM Page 17

18
4.1. Introduction
A Renewable Energy Policy is essentially a policy for change by sending a clear message to all stakeholders (including societyat large) of the importance and necessity of sustainable development. Continuing with the old ways is no longer a viable andsustainable option for Malaysia, and all stakeholders must take on a contributory role. A business-as-usual approach is nolonger tenable. There must firstly be recognition and acceptance that any RE policy is a convergence of energy, industry,environment, green technology and information dissemination policies. Such a convergence provides both tremendouschallenge and opportunity in its design.
It must further be acknowledged that Government policy provides the market with proper signals which are translated intoinvestment decisions by businesses. For example if Government were to introduce a policy on imposition of a carbon tax onfirms which emit CO2, then this signals to the firms to either exit the market, or to invest in CO2 sequestration or storagesystems or improve their production process to minimise the CO2 emission to the permitted quantity if they wish to remainin the market. The choice of action in response to the signal sent by Government is left to the individual firm to select. Clearand robust government policy is necessary to push to overcome business inertia, which can act as an impediment to change.As a consequence the importance of policy to business decision cannot be understated.
There are six reasons for a Renewable Energy Policy:
4. NEED FOR RE POLICY AND ACTION PLAN
Reason 1 To address current market failure;
Reason 2 To provide long term sustainability;
Reason 3 To stimulate a new growth industry;
Reason 4 To recognise the importance of the environment as an economic growth contributor;
Reason 5 To develop human capital resources particularly in the field of R&D in RE technologies; and
Reason 6 To improve the coherence of current policy.
4.2. National Green Technology Policy
The Federal Government having realised the important role of green technology has launched the National Green TechnologyPolicy to spearhead green technology sector development in the country. The National Green Technology Policy has a strategicrole which spans beyond achieving energy autonomy and mitigating climate change, which is one of the emerging drivers ofeconomic growth for our country.
The government envision green technology is the choice made by most countries and would play a vital role in mapping outa low carbon economy for the country. The government had made a commitment to the global society that Malaysia wouldseek to reduce its emission of GHG thus apart from contributing to mitigation measures to combat climate change, greentechnology is to be the driver of the nation’s economic growth.
Four Pillars of National Green Technology Policy15
The National Green Technology Policy is built on four pillars:• Energy: Seek to attain energy independence and promote efficient utilisation;• Environment: Conserve and seek to enhance the natural environment and promote mitigation measures;• Economy: Enhance the national economic development through the use of technology; and• Social: Improve the quality of life for all.
The RE Policy and Action Plan is an initial effort towards the progress of the National Green Technology Policy to ensure thegovernment’s effort would bear fruit and the vision become a reality.
4.3. Lessons Learnt from Germany: World Leader in Renewable Energy Technology Applications
Germany’s renewable energy programme begun with the 250 MW windmill prototype programme in 1986. In 1989, itintroduced the 100 MW demonstration programme and subsidy, which was increased to 250 MW two years later. In 1990,the government launched the 1,000 Roof PV Programme which was later upgraded to the 100,000 solar roofs programmein 1999.
15 Source: Green Technology Policy, 2009
2-SEDA RE Policy-Inner_SEDA Policy Book 8/24/11 8:34 AM Page 18
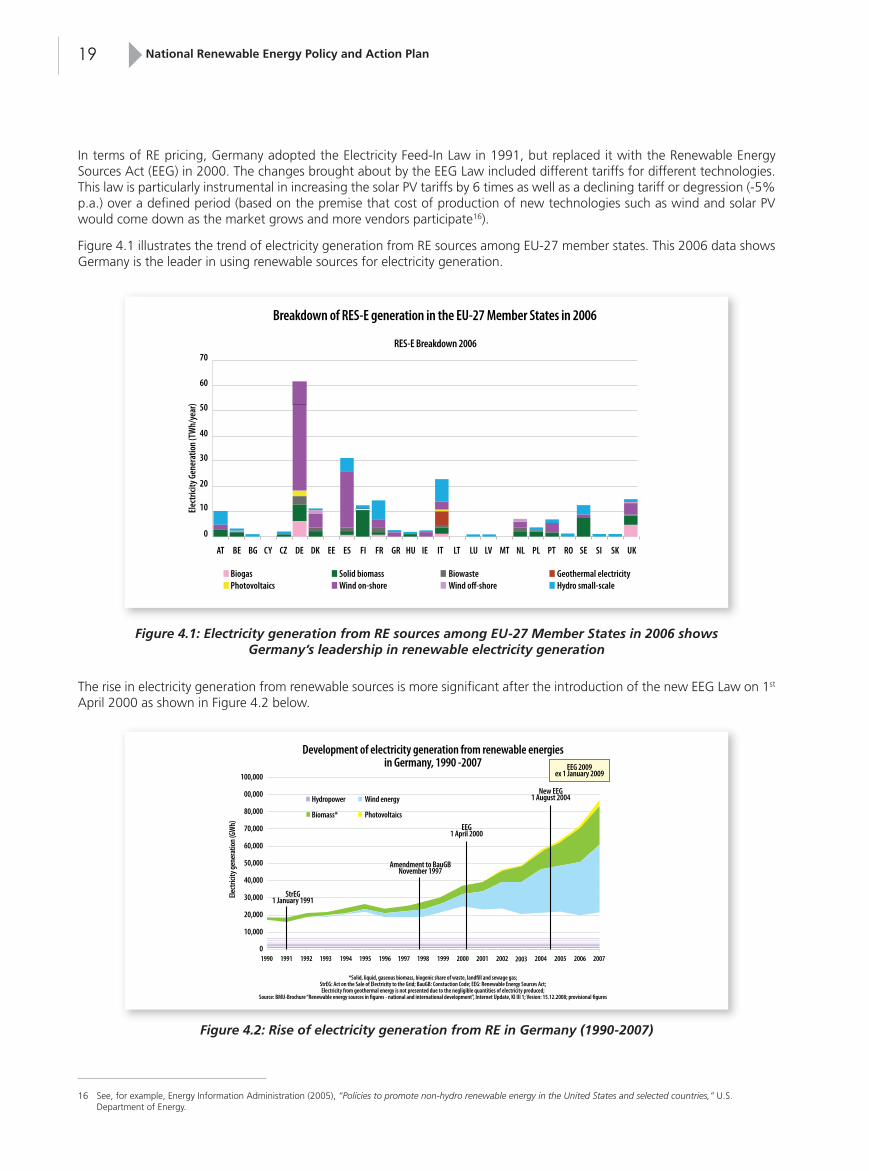
National Renewable Energy Policy and Action Plan19
In terms of RE pricing, Germany adopted the Electricity Feed-In Law in 1991, but replaced it with the Renewable EnergySources Act (EEG) in 2000. The changes brought about by the EEG Law included different tariffs for different technologies.This law is particularly instrumental in increasing the solar PV tariffs by 6 times as well as a declining tariff or degression (-5%p.a.) over a defined period (based on the premise that cost of production of new technologies such as wind and solar PVwould come down as the market grows and more vendors participate16).
Figure 4.1 illustrates the trend of electricity generation from RE sources among EU-27 member states. This 2006 data showsGermany is the leader in using renewable sources for electricity generation.
The rise in electricity generation from renewable sources is more significant after the introduction of the new EEG Law on 1st
April 2000 as shown in Figure 4.2 below.
Figure 4.1: Electricity generation from RE sources among EU-27 Member States in 2006 showsGermany’s leadership in renewable electricity generation
Figure 4.2: Rise of electricity generation from RE in Germany (1990-2007)
16 See, for example, Energy Information Administration (2005), “Policies to promote non-hydro renewable energy in the United States and selected countries,” U.S.Department of Energy.
2-SEDA RE Policy-Inner_SEDA Policy Book 8/24/11 8:34 AM Page 19

20
Figure 4.3: Total turnover from RE in Germany in 2007
The expansion of renewable energy sources in Germany has been an unprecedented success. Since the beginning of 2000,the share of the total final energy consumption from RE has more than doubled. The German Government had set the targetof generating 12.5% of gross electricity consumption from RE by the year 2010. By 2007, this target had already beensignificantly exceeded at 14%.
The development status of renewable energy sources in Germany in 2007 are:• 8.6% of total final energy consumption (electricity, heat, fuel; 2006: 7.5%).• 14.2% of gross electricity consumption (2006: 11.7%).• 6.6% of final energy consumption for heat (2006: 5.8%).• 7.6% of fuel consumption (2006: 6.3%).• 6.7% of primary energy consumption (2006: 5.6%).• Wind energy: following a gross increase in installed capacity of 1,667 MW in 2007, a total of 22,247 MW was installed
as at end of 2007, and around 39.5 TWh of electricity produced. • Bio-energy: more than 17.4 TWh was produced from solid, liquid and gaseous biomass (the total figure including
biogenic waste, landfill gas and sewage gas was 23.8 TWh).• Hydro-power: Installed capacity remained more or less constant where 20.7 TWh of electricity produced.• Solar power: With an additional 1,100 MW of capacity built in 2007, with 3.5 TWh of electricity produced. The
installation of new solar thermal collector area has fallen but remains at a high level of around 940,000 m2 with atotal installed area of 9.6 million m2.
• Geothermal: Germany’s second geothermal power plant has begun operation in 2007.
4.3.1. Economic benefits from EEG Law
In recent years, RE has developed into a significant economic contribution in Germany. Between 2003 and 2007, total turnoverfrom RE sources increased from about 10 billion Euros to approximately 25 billion Euros, corresponding to an increase of150% from the year 2003. The level of total turnover in 2007 (25 billion Euros) is equivalent to the tax revenues of the federalstate of Baden-Wuerttemberg in 2006 (about 24 billion Euros).
2-SEDA RE Policy-Inner_SEDA Policy Book 8/24/11 8:34 AM Page 20

National Renewable Energy Policy and Action Plan21
Renewable energy is an important jobs creator for Germany and the continuous expansion in 2007 helped to create or securenumerous jobs as in Figure 4.4. In 2007, it is estimated nearly 250,000 jobs in Germany were attributed to the RE sector. Thistranslates into an increase of about 55% compared to 2004 (approximately 160,000 jobs). At least 60% of the jobs are thedirect effect of the EEG Law. This is supplemented by jobs associated with public and charitable funding to promoterenewables including public sector employees.
Figure 4.4: Job figures from RE in Germany (2004 – 2007)
4.3.2. Cost to Electricity Consumers
Electricity from renewable energy sources which is eligible for remuneration under the EEG Law (feed-in tariff) is still moreexpensive from conventional energy sources. To date, the resulting total costs have been calculated according to the followingformula:
4.3.2. Cost to Electricity Consumers
The feed-in tariff (FiT) paid to plant operators are published by the Association of German Network Operators in an auditedannual account. The electricity purchase costs avoided as a result of FiT can only be approximated, since these are tradesecrets and there is no general database available.The cost of FiT which is shared among the electricity consumers (including the special provision for electricity intensivecompanies), is equivalent to just under 5% of the costs for one kWh of household electricity in 2007 (an average of 20.7cents/kWh). In 2007, the cost of the FiT to an average household with an electricity consumption of 3,500 kWh per annumwas around 3 Euros per month.
4.3.3. Effects of RE on Electricity Prices
When assessing the economic effects of the promotion of RE by the EEG Law, as well as considering the market value of theFiT electricity, it is also necessary to take into account the impacts of electricity generation from RE on wholesale electricity
2-SEDA RE Policy-Inner_SEDA Policy Book 8/24/11 8:34 AM Page 21

22
Figure 4.5: Merit order effect
Figure 4.6: Reduction of electricity cost due to merit order effect
market prices. The fact that priority is given to the feed-in of renewables would in the short term, lead to a lowering ofelectricity prices on the wholesale market.
The market price of electricity is determined by the most expensive power station still needed to satisfy the demand forelectricity (merit order). Because priority is given to RE via EEG Law, demand for conventional electricity is reduced. Inaccordance with the merit order, therefore, the most expensive power plants are no longer needed to meet the demand, andthe market price falls accordingly. This effect is known as the merit order effect, as shown in Figure 4.5.
Scientific studies commissioned by the BMU, prepared on the basis of a detailed electricity market model, suggested thatover the past three years, the merit order effect has reduced the cost of electricity purchased via the spot market by between2.5 and 7.8 Euros/MWh (see Figure 4.6 below). Hence, the merit order effect reduces the purchasing costs to electricitysuppliers, which in turn tends to lower electricity prices.
2-SEDA RE Policy-Inner_SEDA Policy Book 8/24/11 8:34 AM Page 22

National Renewable Energy Policy and Action Plan23
4.3.4. R&D on RE Technologies
Research and development projects (R&D) on renewable energy sources are eligible for support under the FederalGovernment’s Energy Research Programme. Investments in renewable energies help to conserve scarce resources, reducedependency on energy imports, and protect the climate and environment. Technical innovations help to reduce the cost ofrenewable electricity. The German Environment Ministry (BMU) is responsible for application oriented project funding in thefield of renewable energy sources (except biomass).
The BMU funds R&D in the field of renewable energies, also with a view to enhance job market policy. Research fundingstrengthens the leading international position and competitiveness of German companies and research institutions helpingto create jobs in a growing world market.
The aims and main focus of research support by the German government are:• To lower the cost of renewable energy systems;• To ensure ecologically sound and nature-friendly advancement;• To promote resource-conserving production methods;• To optimise integration into the electricity grid;• To ensure the rapid transfer of technology from research to market;• To promote system-based integrated solutions, such as combinations of thermal insulation, house technology and
renewable energies in the buildings sector;• To encourage transboundary projects and technologies for use primarily in other countries;• To strengthen the competitiveness of German companies and research institutes;• To promote cross-sectoral research (economic issues, jobs, system studies etc.).
In 2007 a total of 177 new projects with a total volume of more than 100 million Euros were approved by the BMU in thefields of photovoltaics, geothermal energy, wind energy, low-temperature solar thermal energy, solar thermal power plantsas well as overall strategy and overarching issues. The main share of newly approved funding went to photovoltaics and windenergy. There is a particularly pressing need for R&D work in the field of photovoltaics because the FiT rates show the highestdegression in these areas, and it is vital suitable cost reductions are achieved. In addition there is still a huge potential forinnovation in this field. Ultimately, it is also to safeguard Germany’s leading international position in photovoltaics researchand improving the competitiveness of German companies in a rapidly expanding global market.
In the area of wind energy research, the biggest challenges are in the offshore sector. In 2007, approval was granted for thefirst research projects in Germany’s first offshore test field “alpha ventus”. High-level support is also given to research in otherareas.
4.3.5. Scenario for an Intensified Expansion of RE in Germany
The 2006 scenario in Germany illustrates the potential development of energy supply until the year 2050. Through theintensified expansion of renewable energy sources and more efficient use of energy, it is possible to reduce CO2 emissionsby 80% compared to the 1990 levels. It is anticipated that as early as 2020, 18% of final energy consumption and around27% of gross electricity generation can be met from RE sources.
By the year 2050, RE could account for approximately half of total primary energy consumption. Also by then 80% of electricityconsumption could be derived from RE and approximately 48% of heat consumption. Thus renewables could potentiallycontribute 42% to fuel consumption.
2-SEDA RE Policy-Inner_SEDA Policy Book 8/24/11 8:34 AM Page 23

24
4.4. Reasons for RE Policy and Action Plan RE
4.4.1. Reason 1: To Address Current Market Failure
The details of market failures have been discussed in Chapter 3.1. A new RE Policy is critically needed to devise strategies inaddressing the RE-specific market failures to avoid perpetuating the associated inefficiencies into the future. This provides aclear signal to businesses on the importance of RE as a source of electricity to the country which can positively influence theinvestment decisions by these firms.
4.4.2. Reason 2: To Provide Long Term Sustainability
Long term sustainability is vital for the RE policy because of the length of time needed for the technology to become costcompetitive (grid-parity). This means the policy designed needs to militate against stop-start strategies, have clarity of outcomesand secure the commitment of all stakeholders.
4.4.2.1. Avoid Stop and Start Strategies
Countries that adopted short-term strategies usually ended up with “start-stop” RE development efforts and lack long-termcommitments in the utilisation of renewable energy resources. In these short-term targets, the contribution of RE in total fuelmix is considered insignificant and unpredictable for long-term dependability and electric utilities cannot be blamed forcontinuing to ignore RE and focussing instead on planning for large centralised conventional or nuclear power plants in futuregeneration mix.
The German RE programme began in 1986 and the policies have been enhanced and improved over the last 23 years. Thekey lesson learnt in the German experience is that the significant increase in RE power plants and businesses was when aneffective incentive mechanism was introduced i.e. the feed-in-tariff and supported by legislation (Renewable Energy SourcesAct).
As a result of this strategy the policy was no longer subjected to the changes in the political office nor was there a concernthe policies would take a stop-start approach. Successive governments did not change the course of the policy but learntlessons and enhanced the policy which has been implemented.
4.4.2.2. Sufficiency of Outcomes
The outcomes of a policy need to be clearly identified, especially if public funds are needed to provide soft loans or otherfinancial assistance. The need for specifying outcomes enables the policy to gather support from the stakeholders since theywould recognise the policy is to produce a public value17.
The current RE policy states that RE is to be used as a fifth fuel and targets (in terms of generation capacity to be installed)are stated in the Malaysia Plans. However, the convergent nature of RE means the generation capacity which is only onedimension of the policy and the industry growth or environmental improvements need to be identified, in order to completethe RE Policy.
4.4.2.3. Commitment by All Stakeholders
There is a need for long term commitment by all stakeholders with Government playing a leadership role. In Malaysia wherethe leadership role has been played by Government (with industry taking a “follow-the-leader” approach) the success orfailure of any new policy requires the presence of clear political will, change champions and supportive regulatory framework.
Therefore revising the existing policy to secure such commitment is necessary. Currently the focus of the policy is on RE as afuel. This immediately excludes the public who are key stakeholders from the purview of the policy. It becomes a specificindustry policy, the value of which is not seen or recognised fully by stakeholders, particularly the public. Accordingly, it isnecessary that a new RE policy be developed in order to secure the commitment of all stakeholders.
17 Note: Public value is a concept introduced by Moore, to identify what citizens should expect of public managers. Thus public sector managers should be focusing on creatingpublic value by their actions. See Moore, M.H. (1995) “Creating Public Value” Harvard University Press at p.27 et seq.
2-SEDA RE Policy-Inner_SEDA Policy Book 8/24/11 8:34 AM Page 24
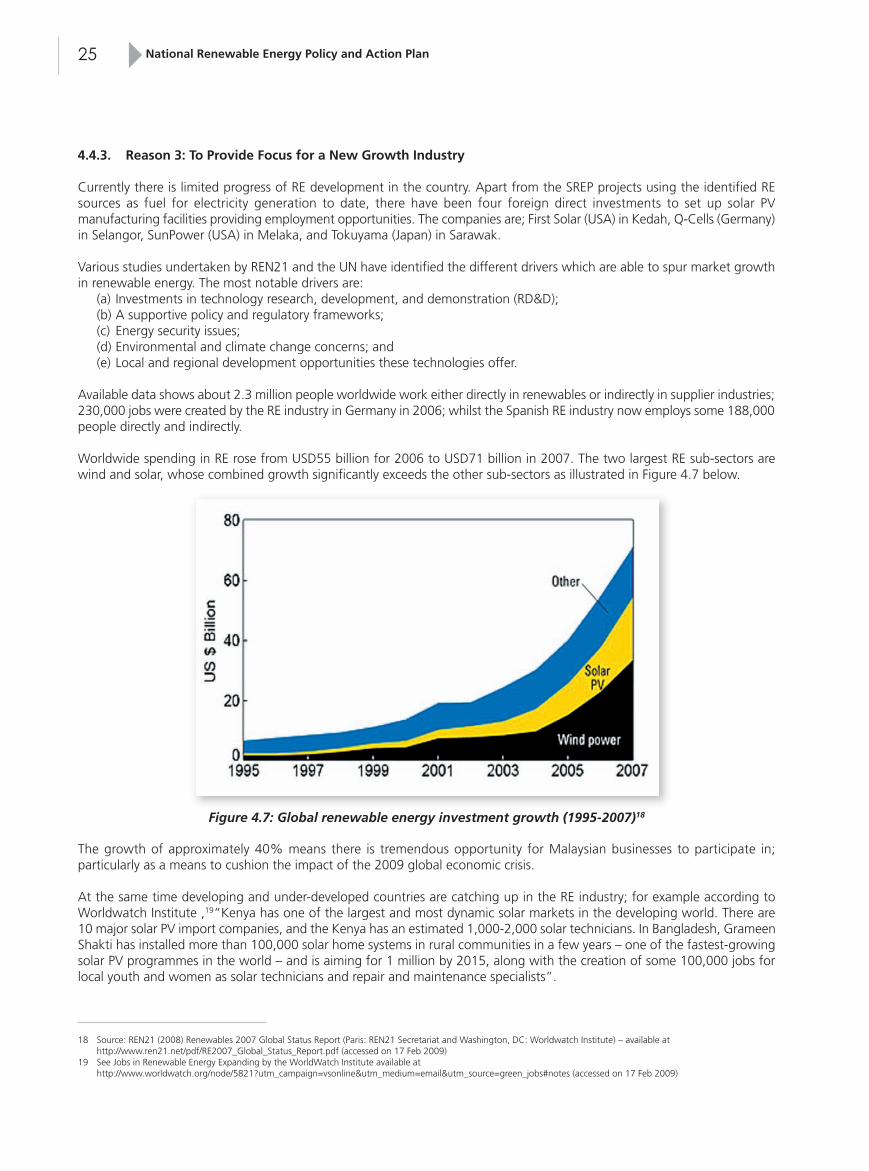
National Renewable Energy Policy and Action Plan25
4.4.3. Reason 3: To Provide Focus for a New Growth Industry
Currently there is limited progress of RE development in the country. Apart from the SREP projects using the identified REsources as fuel for electricity generation to date, there have been four foreign direct investments to set up solar PVmanufacturing facilities providing employment opportunities. The companies are; First Solar (USA) in Kedah, Q-Cells (Germany)in Selangor, SunPower (USA) in Melaka, and Tokuyama (Japan) in Sarawak.
Various studies undertaken by REN21 and the UN have identified the different drivers which are able to spur market growthin renewable energy. The most notable drivers are:
(a) Investments in technology research, development, and demonstration (RD&D); (b) A supportive policy and regulatory frameworks; (c) Energy security issues; (d) Environmental and climate change concerns; and (e) Local and regional development opportunities these technologies offer.
Available data shows about 2.3 million people worldwide work either directly in renewables or indirectly in supplier industries;230,000 jobs were created by the RE industry in Germany in 2006; whilst the Spanish RE industry now employs some 188,000people directly and indirectly.
Worldwide spending in RE rose from USD55 billion for 2006 to USD71 billion in 2007. The two largest RE sub-sectors arewind and solar, whose combined growth significantly exceeds the other sub-sectors as illustrated in Figure 4.7 below.
The growth of approximately 40% means there is tremendous opportunity for Malaysian businesses to participate in;particularly as a means to cushion the impact of the 2009 global economic crisis.
At the same time developing and under-developed countries are catching up in the RE industry; for example according toWorldwatch Institute ,19“Kenya has one of the largest and most dynamic solar markets in the developing world. There are10 major solar PV import companies, and the Kenya has an estimated 1,000-2,000 solar technicians. In Bangladesh, GrameenShakti has installed more than 100,000 solar home systems in rural communities in a few years – one of the fastest-growingsolar PV programmes in the world – and is aiming for 1 million by 2015, along with the creation of some 100,000 jobs forlocal youth and women as solar technicians and repair and maintenance specialists”.
Figure 4.7: Global renewable energy investment growth (1995-2007)18
18 Source: REN21 (2008) Renewables 2007 Global Status Report (Paris: REN21 Secretariat and Washington, DC: Worldwatch Institute) – available athttp://www.ren21.net/pdf/RE2007_Global_Status_Report.pdf (accessed on 17 Feb 2009)
19 See Jobs in Renewable Energy Expanding by the WorldWatch Institute available athttp://www.worldwatch.org/node/5821?utm_campaign=vsonline&utm_medium=email&utm_source=green_jobs#notes (accessed on 17 Feb 2009)
2-SEDA RE Policy-Inner_SEDA Policy Book 8/24/11 8:34 AM Page 25
26
Opportunities in this sector lie in the manufacturing and export of RE components (e.g. turbines or components) or feed-stock (e.g. silicon) although currently undertaken by India and China20; the creation/emergence of support industries tomanufacturing facilities (e.g. outsourcing R&D services); and the creation of specialized service providers, which can beexported to the region; need to be capitalised.
Therefore an RE policy which provides the impetus and incentives for both large enterprises and SMEs to invest in the REsector will provide positive effects and outcomes, via export activities, job creation, foreign and domestic direct investments,emergence of support industries and services (e.g. solar technicians, maintenance specialist) and technology development;thereby pushing Malaysia up the knowledge value chain.
4.4.4. Reason 4: To Recognise the Importance of the Environment as an Economic Growth Contributor
According to a 2005 report21, the world market for environmental goods and services is estimated to be worth 425 billionEuros and is likely to grow to 565 billion Euros by 2010. Michael Porter of Harvard University showed that countries withhigh environmental standards often have market-leading firms and record better economic performance compared to thosewith lower standards. This is because high standards can stimulate innovation both in firms selling environmental solutionsand in those having to comply.
The conclusion is that there is now significant evidence from international research that good environmental managementand regulation does not impede overall competitiveness and economic development; but can be beneficial by creating pressurewhich drives innovation and alerts businesses about resource inefficiencies and new opportunities.
4.4.4.1. Spurring Innovation and RE Take-up
Fossil fuel combustion and the corresponding increases in carbon emissions is identified as one the main contributor to theglobal warming problem. Malaysia ratified the Kyoto Protocol in 2002 thus can do its part under the United NationsFramework Convention on Climate Change (UNFCCC). The mitigation measures and response need to be taken to the threatof global warming by supporting RE projects which will reduce green house gas (GHG) emissions. In addition, RE projects canlead to very cost-effective emission abatement opportunities and represent choice opportunities for investments under theClean Development Mechanism (CDM).
In Malaysia, the total CO2-equivalent emissions for the year 2006 amounted to 169,829 GgCO2. The power sector is themajor and largest contributor with 56,203 GgCO2 which accounted for 33% of the emissions. Whilst the various types offossil fuels used in power generation, contribute various amounts of GHG into the atmosphere, biomass energy is carbon-neutral, releasing the same amount of carbon dioxide as it absorbs, while wind and solar has zero emissions.
Percentage of CO2-equivalent of different fossil fuelsNatural gas based power generation contributed 57% of the total power sector emissions andcoal based power generation contributed 40%. However, coal only accounted for 29% (5,743ktoe) of the total fossil fuel consumed by the power sector as compared to 69% of natural gas(13,761 ktoe), as coal emits more CO2-equivalent per MWh compared to natural gas.
The current existence of CO2-equivalent and GHG emissions from various economic sectors in the Malaysian environmentprovides an opportunity for the new RE policy to address ways and means by which such emissions can be mitigated. Evidenceavailable shows that providing for stricter environmental standards will cause innovation to emerge within companies affectedand at the same time result in environmental goods and services being provided. Such environmental standards can also spurthe take up of RE as a clean energy source and as a counter-measure to the current emissions by conventional energyproducers.
20 Note: In China, the two primary domestic manufacturers were Goldwind and Sinovel Wind, with 33 percent and 6 percent of the Chinese market, respectively, in 2006. By2007, there were more than 40 Chinese firms aspiring to manufacture wind turbines commercially, many of which were engaged in prototype development and testing,and a handful that were beginning to produce commercial turbines during 2006/2007 [see Renewables 2007 Global Status Report available athttp://www.ren21.net/pdf/RE2007_Global_Status_Report.pdf (accessed on 17 Feb 2009)]
21 See “The Contribution of Good Environmental Regulation to Competitiveness”, (Nov 2005) available from http://www.eea.europa.eu/about-us/documents/prague_statement/prague_statement-en.pdf (accessed on 18 Feb 2009).
2-SEDA RE Policy-Inner_SEDA Policy Book 8/24/11 8:34 AM Page 26

National Renewable Energy Policy and Action Plan27
Therefore an opportunity exist for an RE policy to recognise the importance of environmental management both as a sourcefor a cleaner environment and as an economic contributor. This means the RE policy can and should introduce specificinitiatives to provide a push to overcome business inertia, to alert and educate companies about resource efficiencies and thepotential for technological improvement.
4.4.5. Reason 5: To Spur RE Technological Diffusion
Adoption of RE technology into the mainstream requires an effective diffusion process. The adoption of all forms of newtechnology follows an “S” curve, with the primary difference being their length of time. Shapira (1996)22 points out that“technology can diffuse in multiple ways and with significant variations, depending on the particular technology, across time,over space, and between different industries and enterprise types. Moreover, the effective use of diffused technologies byfirms frequently requires organizational, workforce, and follow-on technical changes”.
Furthermore the economics of diffusion needs to be carefully considered since diffusion is not a trivial process, takes a longperiod of time to occur and is equally important as innovation. A new technology would not have an economic impact untilit becomes widespread in the economy.
RE technology is experiencing the same diffusion process and the speed or pace of the diffusion domestically is reflected inthe presence or absence of two key drivers namely:
(a) Significant technical hurdles (skills-driver); and
(b) Significant commercial hurdles (economic-driver).
Studies23 have shown there is a positive correlation between skill and new technology adoption. The current policy focuseson RE only as fuel and it is not suited for promoting or accelerating RE technology diffusion. Thus new policy measures areneeded to promote or accelerate the diffusion of technology and to address the impediments in technology diffusion byfocussing on up-skilling and reducing the economic hurdle to technology adoption.
4.4.6. Reason 6: To Improve on the Coherence of Current Policy
A review of the existing renewable energy policies evidenced the lack of coherence amongst the various current policies. Thishas the unintended effect of sending mixed signals to the market on the importance of RE relating to commitment towardsRE introduction, and the recognition of the cost of the environmental externalities produced by the business-as-usual approach.
The lack of coherence of the RE Policy with the other policies is shown below:
(a) In the 9th Malaysia Plan (9MP) emphasis is given to coal as a fuel for generating electricity as coal is decided as a fuelfor generating electricity. The share of coal will be increased to 36.5% by 2010 to address the issue on the security ofelectricity supply together with minimising generation cost while the environmental objectives are taken intoconsideration. This has put less emphasis on the role of RE as the fifth fuel which is an indication that RE may not behigh on the Government’s policy agenda;
(b) Technology-specific supports for RE development are not actively pursued by the government. Malaysia may alreadyhave the advantage to certain technologies e. g. biomass and biogas which have managed to enjoy some incentivesprovided for by the government. However some technologies e.g. PV are still in the infancy stage and needs morefacilities and incentives to be provided for so that the development could be fast tracked.
(c) The promotion of environmental self-discipline by the National Policy on the Environment 2002 via a “self-regulatory”framework is not consistent with the polluter-pays principle it preaches since there is no incentive for a polluter towant to achieve the next best situation (e.g. minimise pollution levels) without regulatory intervention.
22 Shapria, P (1996) “An Overview of Technology Diffusion Policies and Programmes to Enhance the Technological Absorptive Capabilities of Small and Medium Enterprises”,A background paper prepared for the Organization for Economic Cooperation and Development Directorate for Science, Technology and Industry, available athttp://www.prism.gatech.edu/~jy5/pubs/oecdtech.htm (accessed on 18 Feb 2009).
23 See Bartel and Lichtenberg (1987) “The Comparative Advantage of Educated Workers in Implementing New Technology,” Review of Economics and Statistics 69 (1987),pp 1-11, Doms, Dunne, and Troske (1997) “Workers, Wages, and Technology,” Quarterly Journal of Economics 112 (1997), 253 - 290, Caselli and Coleman (2001) “Cross-Country Technology Diffusion: The Case of Computers,” American Economic Review 91 (2001), 328, all cited in Mukoyama, T. (2003) “A Theory of Technology Diffusion”available at http://129.3.20.41/eps/mac/papers/0303/0303010.pdf (accessed on 18 Feb 2009).
2-SEDA RE Policy-Inner_SEDA Policy Book 8/24/11 8:34 AM Page 27

28
4.4.6.1. Effect of Mixed Signals
Government policies provide the market with signals for proper and sound investment decisions by businesses, with thechoice of action left to the individual firm to select. When mixed signals are sent to the business sector the degree ofuncertainty over Government’s commitment towards RE is exacerbated thus affecting firms’ investment decisions.
These mixed signals are:
(a) RE development is not an important agenda for the government compared to the conventional fuel source forelectricity generation.
There is a strong emphasis on supply and diversification fossil fuel for power generation as set out in the NationalEnergy Policy, Four-Fuel Diversification Policy, the National Depletion Policy and the 9MP. The introduction ofthe Fifth Fuel Policy provided the impetus for RE development; however there is no comprehensive and effectivemechanism to spearhead the development in a systematic manner and the progress has been rather minimalafter nine years of implementation.
(b) A “business-as-usual” approach is preferable to one that requires change.
There is insufficient policy support for managing environmental externalities because:
(1) The National Policy on the Environment 2002 emphasises polluter-pays principle, whilst on the otherhand the Environmental Quality Act 1976 does not prescribe minimum standards of air or noise quality.The Act is seen without appropriate incentives and penalties, in which for firms to adopt the strategy ofself-regulation are unlikely to act (voluntarily); and
(2) The National Energy Policy strongly advocates the supply objective with limited concern and emphasison the environmental objective. However despite acknowledging emission form the energy sectorconstitutes one of the biggest contributors to the detriment of the environment, there is minimal effortfrom the government to address this critical issue. This provides the signal to the market that theimportance of environmental protection in the country is of low priority.
There are currently different signals being conveyed to the market. The government needs to address this matter quickly andurgently. For the market to respond positively the government needs to undertake the necessary action and strategies toavert the current situation.
2-SEDA RE Policy-Inner_SEDA Policy Book 8/24/11 8:34 AM Page 28
National Renewable Energy Policy and Action Plan29
5. RENEWABLE ENERGY RESOURCES AND SMART TARGETS
5.1. Importance and Relevance of RE in Meeting Malaysia’s Energy Requirements
In planning for the electricity requirements of the country, the Government, Regulator (ST) and the Utilities (TNB, SESB)presently do not consider RE to have any significant impact on power generation. Thus RE contribution is not factored intogeneration expansion analysis because:
(a) The growth of RE in Malaysia to date has been insignificant. Using historical growth data to project RE scenariointo the future is a risky move as it puts the country’s energy security in a precarious situation. Ensuring thenation’s sufficient and affordable supply of energy is paramount to ensure its stability in pursuit of economicdevelopment and all these has put renewable energy at a disadvantage.
(b) The potential of renewable energy is still perceived to be small and insignificant and would not be able to serveas a long-term solution to the energy problem in this country.
(c) Energy from RE facilities is considered not dependable as compared to conventional energy sources as they areoften subject to fluctuations in fuel availability or primary energy such as wind and sunlight.
(d) RE facilities could not compete with conventional energy in terms of scale on unit sizes.
(e) RE is expensive compared to conventional energy sources.
Commonly, for the electric utilities, the options for future energy supply are from traditional fuel sources such as large scalehydropower, coal and gas. The choices made usually reflect the strong influence of fuel costs and the lack of internalisationof the costs of the environmental damages or negative impacts on the environment.
Fuel such as coal is seen to be more economic because there are still large coal reserves available globally. However thedemand for coal is rapidly rising especially with energy-hungry countries such as China and India. For example it is well knownthat China is building a coal power plant every two weeks. Thus in the future using coal means that Malaysia would have tocompete with these countries for the fuel which may not be viable for Malaysia. The continuation of Malaysia’s use of naturalgas to provide the fuel for energy generation cannot be sustained for the long term due to limited reserves we currentlyhave. Also the impact of using carbon-based fuels for energy generation leads to environmental degradation and climatechange. Large scale hydropower systems which are the most common source of renewable energy could be the preferredchoice but have significant long-term environmental impact because of the destruction to the forests due to impounding.
Thus looking at these scenarios, alternative fuels need to be explored. Nuclear power has seen a new revival, as more countrieslook to nuclear power as a means to address their energy demands. Compared to other conventional energy sources (otherthan hydropower), it does not emit any greenhouse gases; but there are long-term nuclear waste disposal issues, risk ofmisuse and nuclear proliferation issues arising from waste fuel re-processing; which raises national security issues. Alsoselecting nuclear as an option would require a considerable amount of lead time and a significant amount of investment tobe made.
Thus the time is right for the government to consider RE as a choice for sources of fuel for future power generation. It isclean as there is no or limited amount of greenhouse gases emitted, sustainable (biomass is available from our palm oilplantations), readily available and has a positive socio-economic development for the country. Finally the development costsfor RE is expected to decline whilst the development costs for conventional energy is expected to rise.
5.1.1. Grid Parity
Grid parity occurs when the cost of generating renewable electricity is equivalent or cheaper than the cost of generatingelectricity from conventional fossil fuel or nuclear energy. The time for this to happen varies between countries or locations,depending on specific cost of the fuel, the peak energy cost as well as the external cost to protect the environment.
Electricity from RE has a higher initial cost as it is a new technology and not directly subsidised, while the costs of fossil fueland nuclear energy are expected to continuously rise. When grid-parity is achieved RE would then be applied primarily dueto economic reason as it would be the cheaper choice.
2-SEDA RE Policy-Inner_SEDA Policy Book 8/24/11 8:34 AM Page 29

30
Figure 5.1: Costs of renewable and conventional energy sources24
5.2. Renewable Energy Resources in Malaysia
Malaysia is blessed with many indigenous RE sources. The RE sources identified are:(a) Palm oil biomass wastes (usually EFB and PKS) and palm oil mill effluents;(b) Mini-hydro;(c) Solar power;(d) Solid waste and land-fill gas; (e) Wind energy* and geothermal*;(f) Wastes and gases from agro-based* and farming industries*.
* Note: The detail resources potentials are yet to be fully examined and verified.
The potential of some of these major RE resources are examined below to arrive at the targets set out in Chapter 5.7 of thisreport.
5.3. Biomass Wastes and Biogas Potential
Malaysia is the world’s second largest producer of crude palm oil (CPO). The by-products from the mills processing palm oilinclude solid wastes from the empty fruit bunches (EFB), mesocarp fibres, palm kernel shells (PKS) and palm oil mill effluent(POME).
A study by PTM/SIRIM estimated that in 2002, 362 palm oil mills in the country processed about 59.8 million tonnes of freshfruit bunches (FFB) and produced 11.9 million tonnes of CPO. From this a total of 22.6 million tonnes of solid biomass (EFB,fibres and PKS) and 41.9 million tonnes of POME were generated from the palm oil industry. The palm oil industry has sincegrown at an average rate of 7.5% p.a. and in 2006, more than 15.8 million tonnes of CPO were produced. In general, it canbe concluded that all figures relating to EFB, POME and energy potential from wastes were all revised upwards by 33% from2002 to 2006. By 2009, the numbers of palm oil mills in the country have grown to 417. Table 5.1 identifies the number ofpalm oil factories in Malaysia which can produce a quantity of biomass necessary for a 10 MW class EFB power generationplant. There are 17 factories located in Sabah and Sarawak, whilst 12 are in Peninsular Malaysia.
24 Source: Federal Ministry for the Environment, Nature Conservation and Nuclear Safety, Germany
2-SEDA RE Policy-Inner_SEDA Policy Book 8/24/11 8:34 AM Page 30
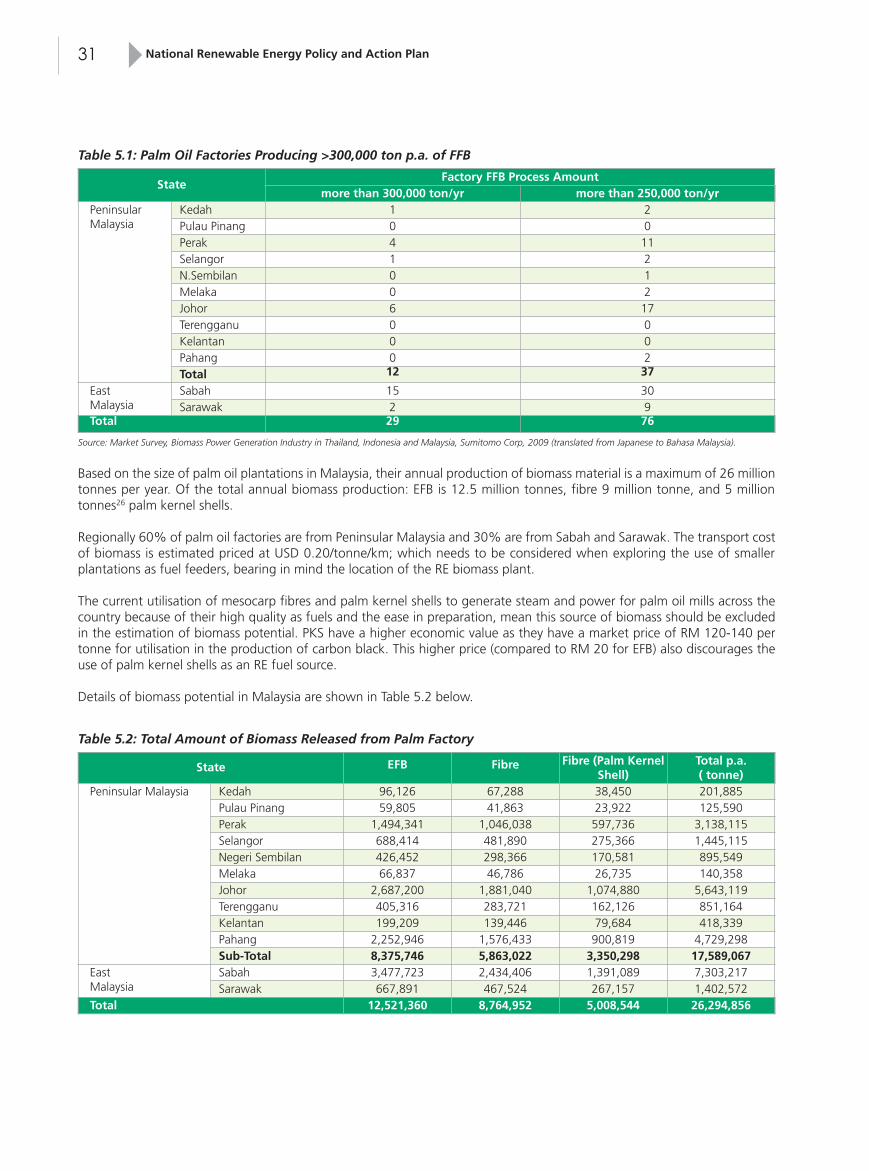
National Renewable Energy Policy and Action Plan31
StateFactory FFB Process Amount
more than 300,000 ton/yr more than 250,000 ton/yrPeninsularMalaysia
Kedah 1 2Pulau Pinang 0 0Perak 4 11Selangor 1 2N.Sembilan 0 1Melaka 0 2Johor 6 17Terengganu 0 0Kelantan 0 0Pahang 0 2Total 12 37
East Malaysia
Sabah 15 30Sarawak 2 9
Total 29 76
Table 5.1: Palm Oil Factories Producing >300,000 ton p.a. of FFB
State EFB Fibre Fibre (Palm KernelShell)
Total p.a. ( tonne)
Peninsular Malaysia Kedah 96,126 67,288 38,450 201,885Pulau Pinang 59,805 41,863 23,922 125,590Perak 1,494,341 1,046,038 597,736 3,138,115Selangor 688,414 481,890 275,366 1,445,115Negeri Sembilan 426,452 298,366 170,581 895,549Melaka 66,837 46,786 26,735 140,358Johor 2,687,200 1,881,040 1,074,880 5,643,119Terengganu 405,316 283,721 162,126 851,164Kelantan 199,209 139,446 79,684 418,339Pahang 2,252,946 1,576,433 900,819 4,729,298Sub-Total 8,375,746 5,863,022 3,350,298 17,589,067
East Malaysia
Sabah 3,477,723 2,434,406 1,391,089 7,303,217Sarawak 667,891 467,524 267,157 1,402,572
Total 12,521,360 8,764,952 5,008,544 26,294,856
Table 5.2: Total Amount of Biomass Released from Palm Factory
Source: Market Survey, Biomass Power Generation Industry in Thailand, Indonesia and Malaysia, Sumitomo Corp, 2009 (translated from Japanese to Bahasa Malaysia).
Based on the size of palm oil plantations in Malaysia, their annual production of biomass material is a maximum of 26 milliontonnes per year. Of the total annual biomass production: EFB is 12.5 million tonnes, fibre 9 million tonne, and 5 milliontonnes26 palm kernel shells.
Regionally 60% of palm oil factories are from Peninsular Malaysia and 30% are from Sabah and Sarawak. The transport costof biomass is estimated priced at USD 0.20/tonne/km; which needs to be considered when exploring the use of smallerplantations as fuel feeders, bearing in mind the location of the RE biomass plant.
The current utilisation of mesocarp fibres and palm kernel shells to generate steam and power for palm oil mills across thecountry because of their high quality as fuels and the ease in preparation, mean this source of biomass should be excludedin the estimation of biomass potential. PKS have a higher economic value as they have a market price of RM 120-140 pertonne for utilisation in the production of carbon black. This higher price (compared to RM 20 for EFB) also discourages theuse of palm kernel shells as an RE fuel source.
Details of biomass potential in Malaysia are shown in Table 5.2 below.
2-SEDA RE Policy-Inner_SEDA Policy Book 8/24/11 8:34 AM Page 31

32
State Installed Capacity (MW)Peninsular Malaysia Kedah 1.556
Perak 3.207Terengganu 1.936Kelantan 3.158Pahang 3.504Sub-Total 13.361
East Malaysia Sabah 8.335Sarawak 7.297
Total 28.993
Table 5.3: Installed Capacity of Mini-Hydro Power Stations in Malaysia
Source: National Energy Balance 2007
A recent survey of 100 palm oil mills carried out by PTM in 2008 has shown that on average, about 22% (by weight of palmoil fresh fruit bunches (FFB) in the milling process were left over as EFB. Most of the mesocarp fibres from the fruits are utilized(98%) for energy generation for self-consumption, topped up by palm kernel shells (38%) as fuels. These figures confirm thecommercial value of palm kernel shells which are being sold for other purposes.
The RE potential lies in the use of EFB and POME. However the EFB have multiple purposes and are used by the palm oilplantation as follows: 62% for mulching25, 6% composting, 11% burned in incineration, 5% sold commercially and 16%being dumped somewhere in the plantation. Incineration without energy extraction is only allowed by the DOE for olderplants from the time they were approved and constructed, but not for newer plants.
5.3.1. Biomass and Biogas Power Estimate
Based on 2008 data’s, 20 million tonnes of EFB were produced where the total initial potential for power generation is 1,065MW. Based on PTM’s study, 20% of the EFB produced can be used for power generation amounting to 213 MW. For biogas,the potential is approximately 217 MW based on 58 million tonnes of POME (Source: MPOB, 2008). This estimate is basedon an “as-is” basis.
However with a more conducive RE policy and action plan, improvements in existing combustion efficiency in palm oil mills(that can extract more energy from the mesocarp fibres and shells as well as from the EFB) can be expected26; the amountfor mulching would be reduced to a more optimal level27 and open incineration would be abolished; the estimate could berevised.
In 2008, the MPOB unveiled “The Roadmap for Palm Oil Industry and Latest Advances in the Industry” which will have adirect impact on the use of palm oil EFB as a biomass fuel for RE sources. This is because MPOB seeks to increase industryproductivity, empower technology, expand investment, modernize infrastructure and ensure sustainability and advance theindustry towards increased yield and oil extraction rate (OER), reduced wastes (reduced POME and zero discharge), increasedconversion of wastes into non-energy products.
Taking into consideration these factors for purposes of target setting, a potential of 1,340 MW connected to grid from palmoil biomass by 2030 is therefore considered realistic and achievable. This is a very conservative estimate as it is expected thepalm oil industry is forecasted to continue growing and increasing in output despite decreasing rate of new acreage beingconverted to palm oil plantations.
The reliance on EFB and other agriculture waste as fuel for biomass plants means that the size of the land used for palm oilplantations and agriculture is limited. The acreage of palm oil plantations is expected not to exceed 4,000 hectares. Thereforethe inherent limitations of biomass mean that a reliable maximum capacity that can be made available is 1,340 MW by 2030.
5.4. Mini-Hydro Potential
Although Malaysia has had the experience and expertise in mini-hydro systems since the 1970s, these have not been exploitedfor added advantage to the country. At the same time data on mini-hydro potential sites, their respective power potentials,etc. are not easily available because rivers are under the jurisdiction of the state authorities.
25 Mulching is a process where the EFB were used to cover the soil surrounding young palm trees in replanting so as to retain water in the soil and eventually decomposing toact as organic fertilizer.
26 Currently, on average, 7% of fibres and 16% or shells are still discarded.27 Currently 62% of EFB is used for mulching.
2-SEDA RE Policy-Inner_SEDA Policy Book 8/24/11 8:34 AM Page 32
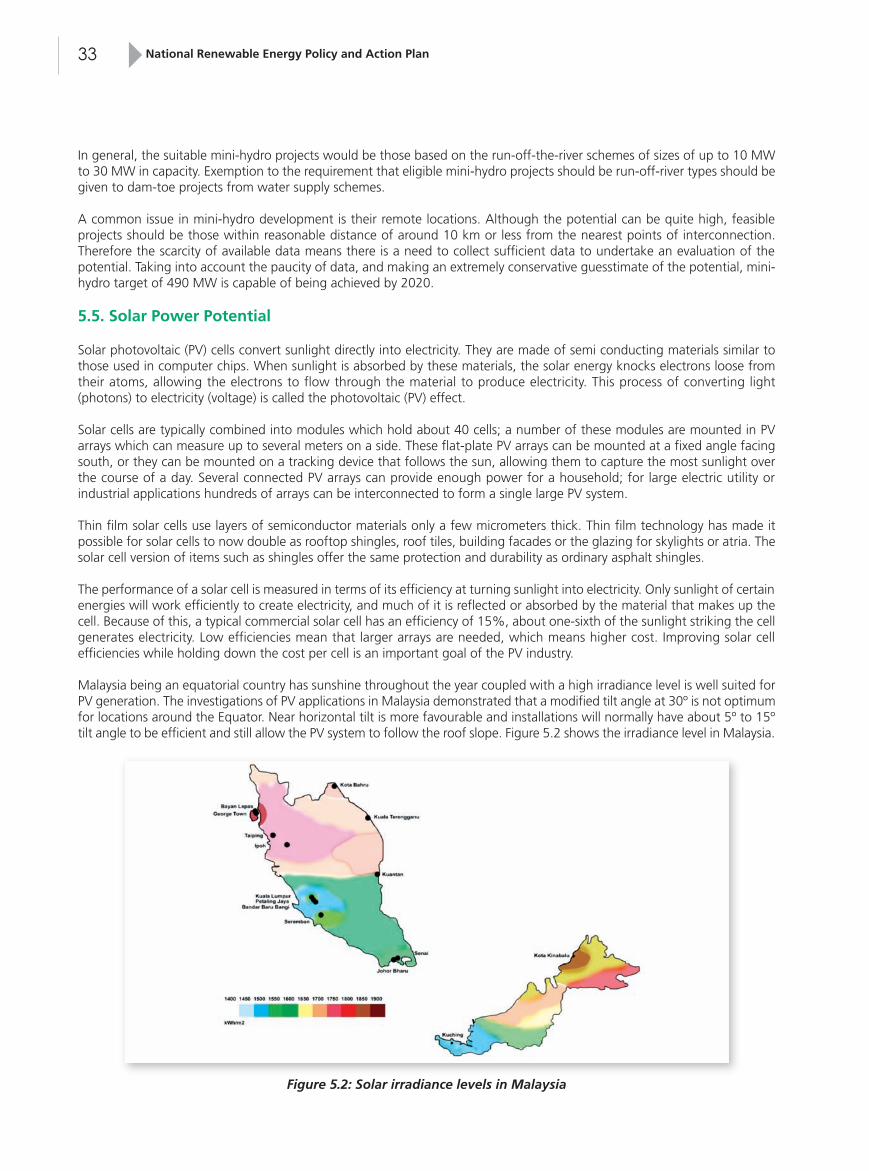
National Renewable Energy Policy and Action Plan33
In general, the suitable mini-hydro projects would be those based on the run-off-the-river schemes of sizes of up to 10 MWto 30 MW in capacity. Exemption to the requirement that eligible mini-hydro projects should be run-off-river types should begiven to dam-toe projects from water supply schemes.
A common issue in mini-hydro development is their remote locations. Although the potential can be quite high, feasibleprojects should be those within reasonable distance of around 10 km or less from the nearest points of interconnection.Therefore the scarcity of available data means there is a need to collect sufficient data to undertake an evaluation of thepotential. Taking into account the paucity of data, and making an extremely conservative guesstimate of the potential, mini-hydro target of 490 MW is capable of being achieved by 2020.
5.5. Solar Power Potential
Solar photovoltaic (PV) cells convert sunlight directly into electricity. They are made of semi conducting materials similar tothose used in computer chips. When sunlight is absorbed by these materials, the solar energy knocks electrons loose fromtheir atoms, allowing the electrons to flow through the material to produce electricity. This process of converting light(photons) to electricity (voltage) is called the photovoltaic (PV) effect.
Solar cells are typically combined into modules which hold about 40 cells; a number of these modules are mounted in PVarrays which can measure up to several meters on a side. These flat-plate PV arrays can be mounted at a fixed angle facingsouth, or they can be mounted on a tracking device that follows the sun, allowing them to capture the most sunlight overthe course of a day. Several connected PV arrays can provide enough power for a household; for large electric utility orindustrial applications hundreds of arrays can be interconnected to form a single large PV system.
Thin film solar cells use layers of semiconductor materials only a few micrometers thick. Thin film technology has made itpossible for solar cells to now double as rooftop shingles, roof tiles, building facades or the glazing for skylights or atria. Thesolar cell version of items such as shingles offer the same protection and durability as ordinary asphalt shingles.
The performance of a solar cell is measured in terms of its efficiency at turning sunlight into electricity. Only sunlight of certainenergies will work efficiently to create electricity, and much of it is reflected or absorbed by the material that makes up thecell. Because of this, a typical commercial solar cell has an efficiency of 15%, about one-sixth of the sunlight striking the cellgenerates electricity. Low efficiencies mean that larger arrays are needed, which means higher cost. Improving solar cellefficiencies while holding down the cost per cell is an important goal of the PV industry.
Malaysia being an equatorial country has sunshine throughout the year coupled with a high irradiance level is well suited forPV generation. The investigations of PV applications in Malaysia demonstrated that a modified tilt angle at 30º is not optimumfor locations around the Equator. Near horizontal tilt is more favourable and installations will normally have about 5º to 15ºtilt angle to be efficient and still allow the PV system to follow the roof slope. Figure 5.2 shows the irradiance level in Malaysia.
Figure 5.2: Solar irradiance levels in Malaysia
2-SEDA RE Policy-Inner_SEDA Policy Book 8/24/11 8:34 AM Page 33

34
The details yearly average values of solar irradiance are set out in Table 5.4.
Towns in Malaysia kWh/m2
Kuching 1470Bandar Baru Bangi 1487
Petaling Jaya 1571Kuala Lumpur 1571Seremban 1572Kuantan 1601
Johor Bahru 1625Senai 1629
Kota Bharu 1705Kuala Terengganu 1714
Ipoh 1739Taiping 1768
Kota Kinabalu 1900Bayan Lepas 1809George Town 1785
Table 5.4: Irradiance (Yearly Average Value) by Towns in Malaysia
Country Installed PV in 2007 PV in 2008 (E) PV in 2009 (E)
Germany 1,150 1,700 2,500
Spain 512 2,600 500
USA 240 330 800
Japan 210 250 500
Italy 70 160 550
Korea 50 90 150
France 45 130 220
China 20 40 65
India 22 28 50
Portugal 15 30 50
Australia 12 15 40
Greece 2 20 200
Rest of Europe 40 60 129
Rest of World 120 160 210
Total(approximately) 2,508 MW 5,613 MW 5,964 MW
CAGR ≈ 36% ≈ 60% ≈ 40%
Growth year to year ≈ 60% ≈ 124% ≈ 6%
Table 5.5: Growth Trends in PV
Looking at the yearly average values of solar irradiance in Malaysia it is foreseen that we need to take advantage of thissituation as many European countries with lower irradiance already have an aggressive solar PV promotional policy whichincludes Germany and Spain.
PV technology appears to offer the most suitable long-term prospect for RE. Worldwide trends in the development and useof solar PV are significant, as shown in Table 5.5.
2-SEDA RE Policy-Inner_SEDA Policy Book 8/24/11 8:34 AM Page 34

National Renewable Energy Policy and Action Plan35
Latest news show that this trend is accelerating even faster than earlier anticipated as many nations around the world arejumping on the bandwagon of solar technology. The technology would soon reach technical maturity, as conversion efficiencyis near the peak, and reliability in terms of lifetime cycle reaching more than 25 years.
As can be seen in Figure 5.3 below, global growth in solar PV panel production was estimated to grow at 53% per annumwhile prices per kW have come down by 3% to 4% per annum
Development efforts are no longer focused so much at improving conversion efficiency (e.g. kW output per square metersurface area),29 but more in bringing production costs and prices down per kW of photovoltaic capacity. In Malaysia this moveis to ensure the price of solar technology would soon be affordable to all levels of society.
5.5.1. Solar Power Estimate
As a rule of thumb, a three storey energy efficient building in Malaysia installed with solar PV panels on its 1,000 m2 roofmay be able to generate all the electricity that it needs30. Taller urban buildings have higher density of occupancy but not alarge volume per square meter of roof area, hence roof-top solar PV modules cannot provide all the energy needs for thesetypes of buildings31.
The real opportunity for solar PV lies in homes (residential areas), warehouses, and other low-rise commercial buildings.Factories, however, typically consume high levels of energy due to production machineries or similar equipment, and willnever be expected to be energy self-sufficient through solar PV but can provide the large roof spaces for solar PV.
In estimating the solar power potential in Malaysia and the setting of targets, it is recognised that the constraint is not somuch on the availability of solar irradiation, but more on the availability of funding and the domestic and internationalproduction facilities to cope with demand. Currently the Malaysian solar PV module market is subjected to and focuses onthe global market, and even current local production outputs are directed towards export to high growth demand in Europe,USA and Japan.
Figure 5.3: World costs and price trends for solar photovoltaic28
28 Source: Photon International, September and October 2007 issues29 Of course, there is still scope for further technical improvements, as it was reported that increased energy outputs from newer PV modules can be achieved because of
better sensitivity to a wider spectrum in the solar radiation. 30 Design of the PTM Zero-Energy Building in PTM’s Energy Smart, Issue 0017, Quarter 1.31 Thin-film PV panels fitted on building façades can increase energy outputs, but again they are only applicable at the higher floors to avoid shadow areas.
2-SEDA RE Policy-Inner_SEDA Policy Book 8/24/11 8:34 AM Page 35

36
Therefore a reasonable target for grid-connected solar PV as building integrated (BIPV) application is 850 MW by 2030 (andmore than 8,000 MW by 2050) that can grow unlimitedly as it is not constraint by land availability. This is arrived at by thefollowing assumptions:
(a) Using 2003 data and suitable building roof surfaces the estimated amount of energy PV can produce isapproximately 6,500 MW (i.e. ≈ 65 million m2 x 100 W/m2);
(b) The building roof surfaces are from 40% of total number of households (i.e. 2.5 million houses) and 5% oftotal commercial buildings (i.e. about 40,000 commercial buildings)32;
(c) Solar BIPV energy opportunity ≈ 7.8 TWh, about 21% of residential and commercial electricity demand in 2005(1 kW = 1200 kWh/year)
5.6. Solid Wastes Potential
Traditionally in Malaysia the most economic option of solid waste disposal is through landfills or dumpsites. The stategovernments upon recognising that ineffective solid waste management would result in catastrophic environmental problemssuch as water resource pollution from leachate and also health reasons have adopted using sanitary landfills instead. Howeversome municipalities are still using open dumpsites to manage their solid waste.
Current data from the Ministry of Housing and Local Government suggest that the total waste collected and disposed perday in Malaysia is approximately 21,000 tonnes. From Table 5.6 below it is seen that the states of Selangor, Johor and Sarawakproduce the most amount of solid waste, while Perak, Pahang, Sabah and Sarawak have high numbers of dumping sites inthe states.
5.6.1. Solid Wastes Power Estimate
Based on the current data it is estimated from solid wastes (RDF, incineration, sanitary landfills): 378 MW can be installed by2024. This is based on the assumption that 30,000 tonnes/day of solid wastes would be produced as projected by KPKT,followed by 3% annual growth post 2024 according to increase of the population.
Additionally there are already many solid waste dumping sites that have been closed as shown in Table 5.6 previously. Thesesites have potential to generate electricity from landfill gases33 that is already available.
State Waste collected and dumped per day (MT/d)
Number of operating dumping sites
Number of closed dumping sites
Perlis 120 1 1
Kedah 1,504 12 3
Penang 1,800 1 2
Perak 1,864 21 9
Pahang 1,094 20 12
Selangor 3,240 7 11
Kuala Lumpur 1,950 1 7
Negeri Sembilan 1,162 8 10
Melaka 906 2 5
Johor 2,439 13 21
Kelantan 729 13 5
Terengganu 651 9 12
Sabah 1,174 20 1
Sarawak 2,001 51 12
Total per day 20,633 179 111
Table 5.6: Total Waste Generation in Malaysia34
32 Source: TNB statistics based on their customer information33 See the existing TNB’s 2MW Jana Landfill power plant in Puchong, Selangor.34 Source: Jabatan Sisa Pepejal, Ministry of Housing and Local Government (2008)
2-SEDA RE Policy-Inner_SEDA Policy Book 8/24/11 8:34 AM Page 36

National Renewable Energy Policy and Action Plan37
Currently, an integrated waste management plant owned by Core Competency/Recycle Energy is already operating inSemenyih, Selangor managing the solid waste of the Kajang municipality. This plant with a capacity of sorting and treatinga maximum 1,000 tonnes per day also has a power generation plant. From the normal intake of 700 tonnes/day of wastes,the plant can sort the combustible waste and generate a gross power of 8 MW of which 5.5 MW are available for export tothe utility.
If all future waste-to-energy plants are based on this integrated concept involving recycling initiative, etc, the power potentialfor target setting would naturally be reduced as other waste products are either recycled or directed towards more value-added products.
5.7. Targets for Renewable Energy Development
5.7.1. “SMART” Targets for Renewable Energy
Based on the detailed analysis above and taking into consideration the technical limitations (particularly of the availability offuel sources) and the need for sustainability, the suitable targets for renewable energy must be specific, measurable, achievable,realistic and time-specific (i.e. SMART). These SMART targets are a conservative assessment of Malaysia’s RE resources, witha sensitivity of ± 10%.
Given the present low actual capacity of RE projects, the development of RE has to be accelerated to grow at 18% ofcompounded annual growth rate (CAGR) from 2010 to 2030. For the CAGR to be achieved many strategies need to beemployed. The overall SMART targets for short, medium and long term are as follows:
Electricity Capacity Mix: By 2015, total capacity from RE is targeted to reach 975MW or 6% of total peak electricity demandcapacity by 2015;
Electricity (Energy) Mix: By 2015, total electricity mix from RE is targeted to reach 5.3 TWh/year or 5% of total electricitygenerated.
Electricity Capacity Mix: By 2020, total capacity from RE is targeted to reach 2,065 MW or 11% of total peak electricitydemand capacity by 2020;
Electricity (Energy) Mix: By 2020, total electricity mix from RE is targeted to reach 11.2 TWh/year or 9% of total electricitygenerated.
Electricity Capacity Mix: By 2030, total capacity from RE is targeted to reach 3,484 MW or 14% of total peak electricitydemand capacity by 2030;
Electricity (Energy) Mix: By 2030, total electricity mix from RE is targeted to reach 16.5 TWh/year or 11% of total electricitygenerated.
Table 5.7 indicates the projected SMART targets for RE development in Malaysia. The targets are projected until year 2050when RE would constitute 11.5GW or 36% of total peak electricity demand capacity and 29.3 TWh/year or 15% of totalelectricity generated.
2-SEDA RE Policy-Inner_SEDA Policy Book 8/24/11 8:34 AM Page 37

38
Year Ending
Cum. Biomass (MW)
Cum. Biogas(MW)
Cum. Mini-Hydro (MW)
Cum. Solar PV (MW)
Cum. Solid Wastes (MW)
Cum. Total RE(MW)
2011 110 20 60 7 20 217
2015 330 100 290 55 200 975
2020 800 240 490 175 360 2,065
2025 1,190 350 490 399 380 2,809
2030 1,340(1) 410(2) 490(3) 854 390 3,484
2035 1,340(1) 410(2) 490(3) 1,677 400 4,317
2040 1,340(1) 410(2) 490(3) 3,079 410 5,729
2045 1,340(1) 410(2) 490(3) 5,374 420 8,034
2050 1,340(1) 410(2) 490(3) 8,874 430 11,544
Table 5.7: SMART targets
Notes to Table 5.7:(1) The maximum potential can be realised from palm oil EFB and agro-based industry;
(2) The maximum potential can be realised from POME, agro-based and farming industries;
(3) The maximum potential can be realised from mini-hydro.The assumptions used in Table 5.7 are:
(1) RE plant lifespan is 25-30 years, whereby old plants will be replaced or upgraded.
(2) RE Technical potential:i. Biomass (EFB, agro-based): 1,340 MW will be reached by 2028.
ii. Biogas (POME, agro-based, farming): 410 MW will be reached by 2028.
iii. Mini-hydro (not exceeding 30 MW): 490 MW will be reached by 2020.
iv. Solar PV (grid-connected): unlimited.
v. Solid waste (RDF, incineration, sanitary landfill): 378 MW will be reached by 2024 (at 30,000 tonne/dayof solid waste as projected by KPKT, followed by 3% annual growth post 2024).
Figures 5.4 and 5.5 indicate modestly the potential of RE in terms of national installed power capacity and electricity generationunder the SMART target. It is critical to recognise this scenario is only possible when the proposed National RE Policy andAction Plan is implemented, in particular the Strategic Thrust 1. The thrust which is on introducing an appropriate regulatoryframework (RE Law which facilitates the feed-in tariff and funding mechanisms) are instituted and effectively implemented.
Figure 5.4: Cumulative RE installed capacity
2-SEDA RE Policy-Inner_SEDA Policy Book 8/24/11 8:34 AM Page 38

National Renewable Energy Policy and Action Plan39
Under the umbrella of the RE Law, it is expected that for the first 15 to 20 years, biomass energy would have a significantrole to play until it reaches the limitation of the plantations. Solar energy is anticipated to play a very important role in thelong-term, as it is the only unlimited source of energy with significant capacity available in the country. The impact of electricityproduction from solar energy is expected to greatly increase because solar technology is progressing fast whereby its efficiencywould leap over the coming years.
5.7.2 GHG Emission Reduction
Malaysia has ratified the Kyoto Protocol in 2002 a move to show the government’s seriousness and commitment to reduceour carbon footprints through escalating green technology applications in all sectors of the economy. Thus effective mitigationmeasures to reduce GHG need to be taken with special focus given to main sectors emitting GHG which are electricitygeneration and transport.
It is well known fact that using renewable energy is an effective measure to reduce GHG emission from the electricity sector.Generating electricity using RE is environment friendly because it has minimal or zero emission. Many countries around theglobe are embarking on serious RE development as initial measures to the global warming phenomenon which has becomethe focus of the global society.
Malaysia has made the voluntary commitment at the United Nations Climate Change Conference 2009 (COP 15) to reduce40% of its emission intensity of GDP by the year 2020 compared to 2005 levels. Based on the SMART targets, by 2020, REwill be 11% or 2,065MW from the electricity peak demand mix. It is projected that 60,584GWh electricity will be generatedfrom RE sources contributing towards the reduction of 42 million tonne CO2 from the power sector.
The detailed targets for energy (by RE resources) and environmental CO2 avoidance are shown in Table 5.8.
Figure 5.5: Annual electricity production from RE resources
2-SEDA RE Policy-Inner_SEDA Policy Book 8/24/11 8:34 AM Page 39

40
YearAnnual
Biomass GWhAnnual
Biogas GWhAnnual Mini-Hydro GWh
Annual SolarPV GWh
Annual SWGWh
Annual REElectricity(GWh)
Annual CO2Avoidance(tonne/yr)
CumulativeCO2
Avoidance (tonne)
CumRE
(MW)
2011 675 123 300 7.7 123 1,228 846,975 846,975 217
2015 2,024 613 1,450 61 1,223 5,374 3,707,825 10,816,136 975
2020 4,906 1,472 2,450 194 2,208 11,229 7,747,900 41,803,181 2,065
2025 7,297 2,146 2,450 456 2,330 14,680 10,128,817 88,071,821 2,809
2030 8,217 2,514 2,450 1,019 2,392 16,592 11,448,339 143,444,366 3,484
2035 8,217 2,514 2,450 2,128 2,453 17,762 12,255,721 202,908,742 4,317
2040 8,217 2,514 2,450 4,170 2,514 19,865 13,707,192 268,207,951 5,729
2045 8,217 2,514 2,450 7,765 2,575 23,522 16,229,914 343,765,293 8,034
2050 8,217 2,514 2,450 13,540 2,637 29,358 20,256,975 436,426,797 11,544
Table 5.8: Energy and Environmental Target from 2011 to 2050
The applicable assumptions to Table 5.8 are:
(1) No loss of RE plant capacity (old plants are replaced or upgraded).
(2) RE electricity generation:
i. 1 MW of biogas and biomass (consumes 25,000 tonne/year/MW of wastes) generate 6,132 MWh/year(70% capacity factor);
ii. 1 MW of mini-hydro generates 5,000 MWh/year (57% capacity factor);
iii. 1 MW solar PV generates 1,100 MWh/year (13% capacity factor, but is expected to significantly increasein the future);
iv. 1 MW of solid wastes (consumes 100 tonne/day/MW) generate 6,132 MWh/year (70% capacity factor).
(3) 1 MWh of RE electricity avoids 0.63 tonne of CO2.
2-SEDA RE Policy-Inner_SEDA Policy Book 8/24/11 8:34 AM Page 40
National Renewable Energy Policy and Action Plan41
6. THE RENEWABLE ENERGY POLICY
This Chapter sets out a proposed vision statement and the set of objectives and related strategic thrusts of a forward-lookingRE Policy.
The new RE policy is intended to transform Malaysia to become a leader in renewable energy and also in green technologyapplications. This will ensure that Malaysia will develop into a nation that is able to satisfy its own energy needs fromindigenous RE resources, be independent from fuel imports, a leader in green technology development while able to conserveits natural environment so that it can also be enjoyed by the future generation. A sustainable local RE industry could ensurethe green house gas emission due to power generation from fossil fuel be mitigated while creating a new source of economicactivity for the country. It is envisaged the new RE Policy would be able to put Malaysia on the forefront amongst ASEANcountries to pursue green technology aggressively towards a more sustainable future for the country.
6.1. Policy Vision
A policy vision for RE development in Malaysia provides for the long-term goal that all stakeholders should strive towardsrealisation. The policy statement is crafted to be all encompassing addressing the aspects role and the importance of RE innational development as stated below:
Enhancing the utilisation of indigenous renewable energy resources to contributetowards National electricity supply security and sustainable socio-economicdevelopment.
6.2. Policy Objectives
A forward-looking RE Policy embodies elements of energy, industry and environmental policies making it convergent in natureand is reflected in the five objectives which have been set for RE:
(1) To increase RE contribution in the national power generation mix;
(2) To facilitate the growth of the RE industry;
(3) To ensure reasonable RE generation costs;
(4) To conserve the environment for future generation; and
(5) To enhance awareness on the role and importance of RE.
6.3. RE Strategic Thrusts
To achieve these policy objectives, five strategic thrusts have been identified which would enable Malaysia to pursue REdevelopment more aggressively. The strategic thrusts are:
Thrust 1: Introduce Appropriate Regulatory Framework
This requires an appropriate, robust and efficient regulatory framework which would address market failuresand provide incentives for firms to enter into the RE generation market be introduced and implemented.
The regulatory framework should provide for the introduction of a feed-in-tariff (FiT), a catalyst for the entry ofRE power generation businesses, RE industries and R&D in RE. Furthermore with the reduction of environmentalpollution means the society must also play its part by making a contribution to a fund that would be used topay for the RE power. This is especially important as the retail tariffs contain subsidies and have today beenreduced and exclude the external costs. A mechanism could be employed by embedding into the electricitytariff structure a certain cost which must be made to a specific RE Fund.
There are consequently direct spill-over effects from a regulatory framework which would act as a catalyst forthe emergence of RE industries, undertaking of R&D in RE technology and innovation (e.g. via improved boilertechnologies etc.). The measurable outcomes of this thrust include the rate of increase in the use of RE, thegradual decreasing (or constant) rate of fossil fuel consumption for conventional power generation and reductionof the CO2 emissions.
2-SEDA RE Policy-Inner_SEDA Policy Book 8/24/11 8:34 AM Page 41

42
Thrust 2: Provide Conducive Environments for RE Businesses
The 2nd Policy Objective identifies the need for the growth of the RE industry. A definition of the “RE industry”provides clarity of the ambit of this industrial sector. Since the 1st Policy Objective refers to RE generation, whichwould cover generation, distribution and sale of energy. It is proposed that the term “RE industry” refers to themanufacturing of RE components or RE finished products (e.g. boilers, turbines, PV modules, etc.), supportindustries to the RE manufacturing sector, and RE service providers (e.g. technicians, consultants, engineers,builders) who support RE power generation. The focus of this thrust is on RE industry and RE power generation(which collectively are referred to as RE businesses).
The stimulus package would encompass the provision of fiscal incentives, and indirect assistance in the form ofreducing the transaction costs for financing, using GLCs and MNCs to lead the charge, and providing assistanceto SMEs to participate in the RE business. These are in addition to the feed-in-tariff which provides an incentivefor people to enter the RE power generation sector.
Thrust 3: Intensify Human Capital Development
RE is a new technology in Malaysia and there is a need for human capital to be developed in order to supportthe emerging RE Industries. Yet there is a need for a short-term (stop-gap) measure to fill the human capitalvoid in Malaysia by encouraging knowledge workers to relocate to Malaysia.
Thrust 4: Enhance RE Research and Development
The focus of the R&D is not on invention35 but on innovation36. For example, the improvements in the microchipwere due to innovation (i.e. the idea of “standing on the shoulders of giants”).
Therefore the implementation of a systemic R&D programme which leads to innovative products and servicesto accelerate the growth of the RE Industry is required. Innovation also enhances the diffusion of RE by makingthe technology cheaper and easier to use and strengthen businesses competitive edge.
Thus it is necessary to develop an R&D implementation plan which articulates the demand, identifies the use ofregulation to spur innovation and provides appropriate support for R&D activities.
Thrust 5: Design and Implement an RE Advocacy Programme
Advocacy programmes are tailored with specific messages for specific audiences should be implemented. For example anadvocacy programme targeted at investors and RE market entrants will need to convey a message that is subtly differentfrom a general public advocacy programme designed to secure buy-in to the idea of societal payments for clean environment.The common aim of all advocacy programmes is to increase the awareness of all stakeholders of the benefits and advantagesof utilising RE and participation in RE businesses.
Policy mission should be reviewed and (as necessary) embellished over time, once the foundation has been laid. For examplewhen the policy is reviewed in five years time, the original mission of Thrust 1 would have been accomplished with theimplementation of an appropriate regulatory framework. Nonetheless, it may need to be improved further or as necessary,replaced by a new thrust as part of the ongoing mission to realise the Policy Vision.
35 Invention is defined as the creation of a new product or process.36 Innovation is defined as the making of changes in existing products or services by introducing new methods, ideas or products.
2-SEDA RE Policy-Inner_SEDA Policy Book 8/24/11 8:34 AM Page 42
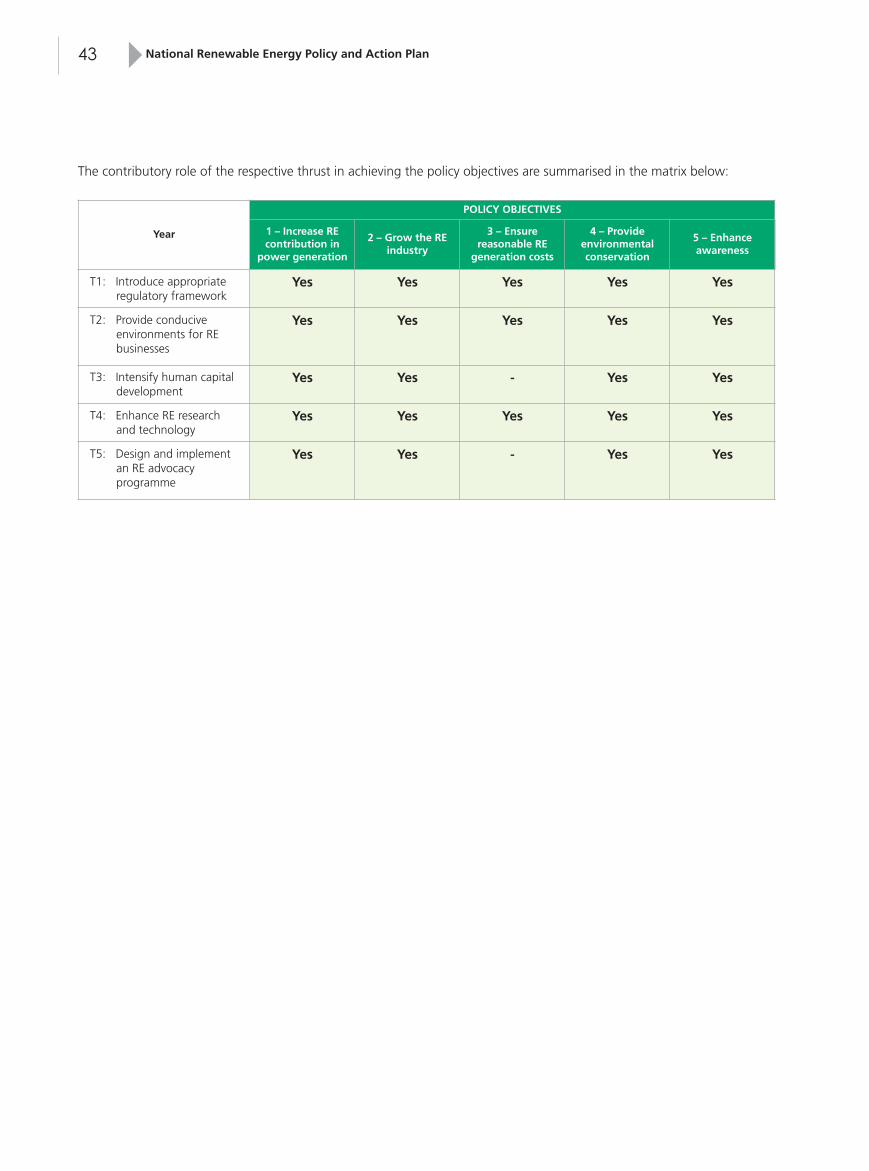
National Renewable Energy Policy and Action Plan43
The contributory role of the respective thrust in achieving the policy objectives are summarised in the matrix below:
Year
POLICY OBJECTIVES
1 – Increase REcontribution in
power generation
2 – Grow the REindustry
3 – Ensurereasonable RE
generation costs
4 – Provideenvironmentalconservation
5 – Enhanceawareness
T1: Introduce appropriateregulatory framework
Yes Yes Yes Yes Yes
T2: Provide conduciveenvironments for REbusinesses
Yes Yes Yes Yes Yes
T3: Intensify human capitaldevelopment
Yes Yes - Yes Yes
T4: Enhance RE researchand technology
Yes Yes Yes Yes Yes
T5: Design and implementan RE advocacyprogramme
Yes Yes - Yes Yes
2-SEDA RE Policy-Inner_SEDA Policy Book 8/24/11 8:34 AM Page 43
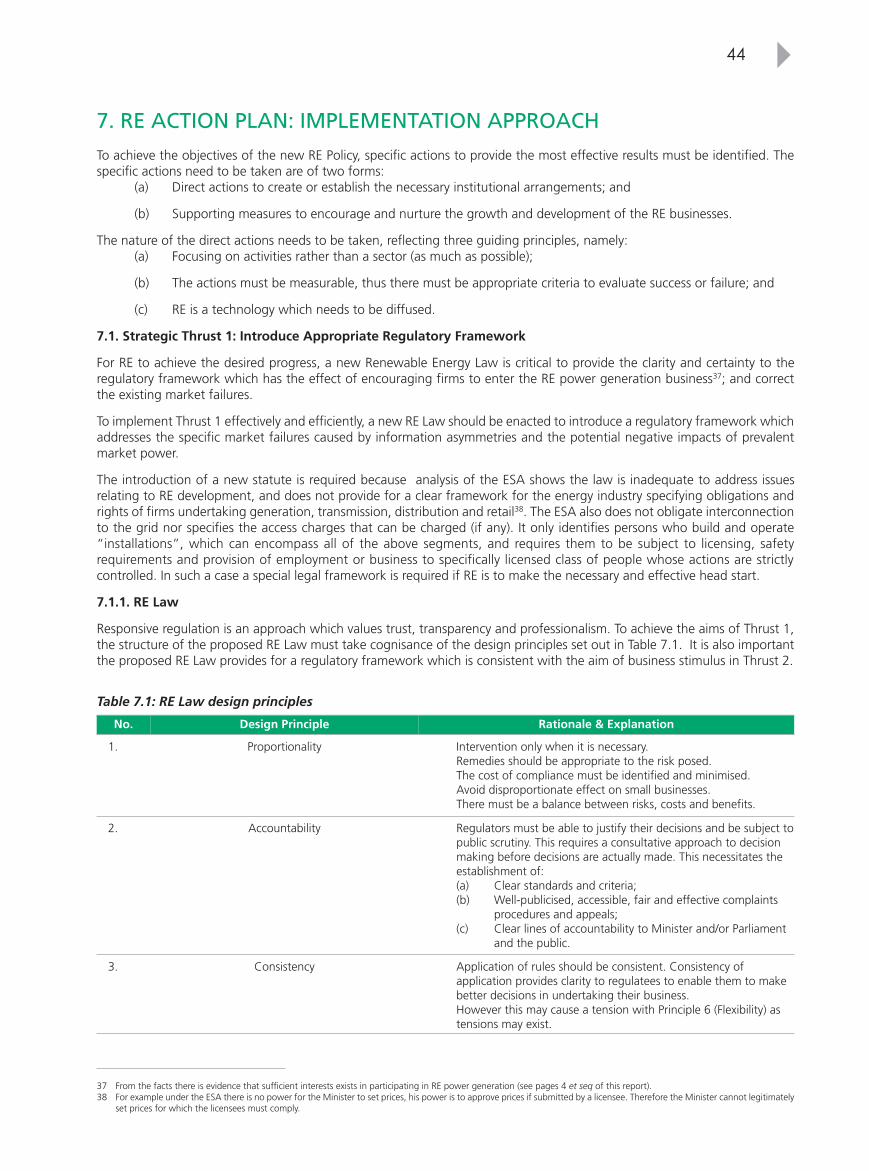
44
No. Design Principle Rationale & Explanation
1. Proportionality Intervention only when it is necessary.Remedies should be appropriate to the risk posed.The cost of compliance must be identified and minimised.Avoid disproportionate effect on small businesses.There must be a balance between risks, costs and benefits.
2. Accountability Regulators must be able to justify their decisions and be subject topublic scrutiny. This requires a consultative approach to decisionmaking before decisions are actually made. This necessitates theestablishment of:(a) Clear standards and criteria;(b) Well-publicised, accessible, fair and effective complaints
procedures and appeals;(c) Clear lines of accountability to Minister and/or Parliament
and the public.
3. Consistency Application of rules should be consistent. Consistency ofapplication provides clarity to regulatees to enable them to makebetter decisions in undertaking their business. However this may cause a tension with Principle 6 (Flexibility) astensions may exist.
Table 7.1: RE Law design principles
7. RE ACTION PLAN: IMPLEMENTATION APPROACH
To achieve the objectives of the new RE Policy, specific actions to provide the most effective results must be identified. Thespecific actions need to be taken are of two forms:
(a) Direct actions to create or establish the necessary institutional arrangements; and
(b) Supporting measures to encourage and nurture the growth and development of the RE businesses.
The nature of the direct actions needs to be taken, reflecting three guiding principles, namely: (a) Focusing on activities rather than a sector (as much as possible);
(b) The actions must be measurable, thus there must be appropriate criteria to evaluate success or failure; and
(c) RE is a technology which needs to be diffused.
7.1. Strategic Thrust 1: Introduce Appropriate Regulatory Framework
For RE to achieve the desired progress, a new Renewable Energy Law is critical to provide the clarity and certainty to theregulatory framework which has the effect of encouraging firms to enter the RE power generation business37; and correctthe existing market failures.
To implement Thrust 1 effectively and efficiently, a new RE Law should be enacted to introduce a regulatory framework whichaddresses the specific market failures caused by information asymmetries and the potential negative impacts of prevalentmarket power.
The introduction of a new statute is required because analysis of the ESA shows the law is inadequate to address issuesrelating to RE development, and does not provide for a clear framework for the energy industry specifying obligations andrights of firms undertaking generation, transmission, distribution and retail38. The ESA also does not obligate interconnectionto the grid nor specifies the access charges that can be charged (if any). It only identifies persons who build and operate“installations”, which can encompass all of the above segments, and requires them to be subject to licensing, safetyrequirements and provision of employment or business to specifically licensed class of people whose actions are strictlycontrolled. In such a case a special legal framework is required if RE is to make the necessary and effective head start.
7.1.1. RE Law
Responsive regulation is an approach which values trust, transparency and professionalism. To achieve the aims of Thrust 1,the structure of the proposed RE Law must take cognisance of the design principles set out in Table 7.1. It is also importantthe proposed RE Law provides for a regulatory framework which is consistent with the aim of business stimulus in Thrust 2.
37 From the facts there is evidence that sufficient interests exists in participating in RE power generation (see pages 4 et seq of this report).38 For example under the ESA there is no power for the Minister to set prices, his power is to approve prices if submitted by a licensee. Therefore the Minister cannot legitimately
set prices for which the licensees must comply.
2-SEDA RE Policy-Inner_SEDA Policy Book 8/24/11 8:34 AM Page 44
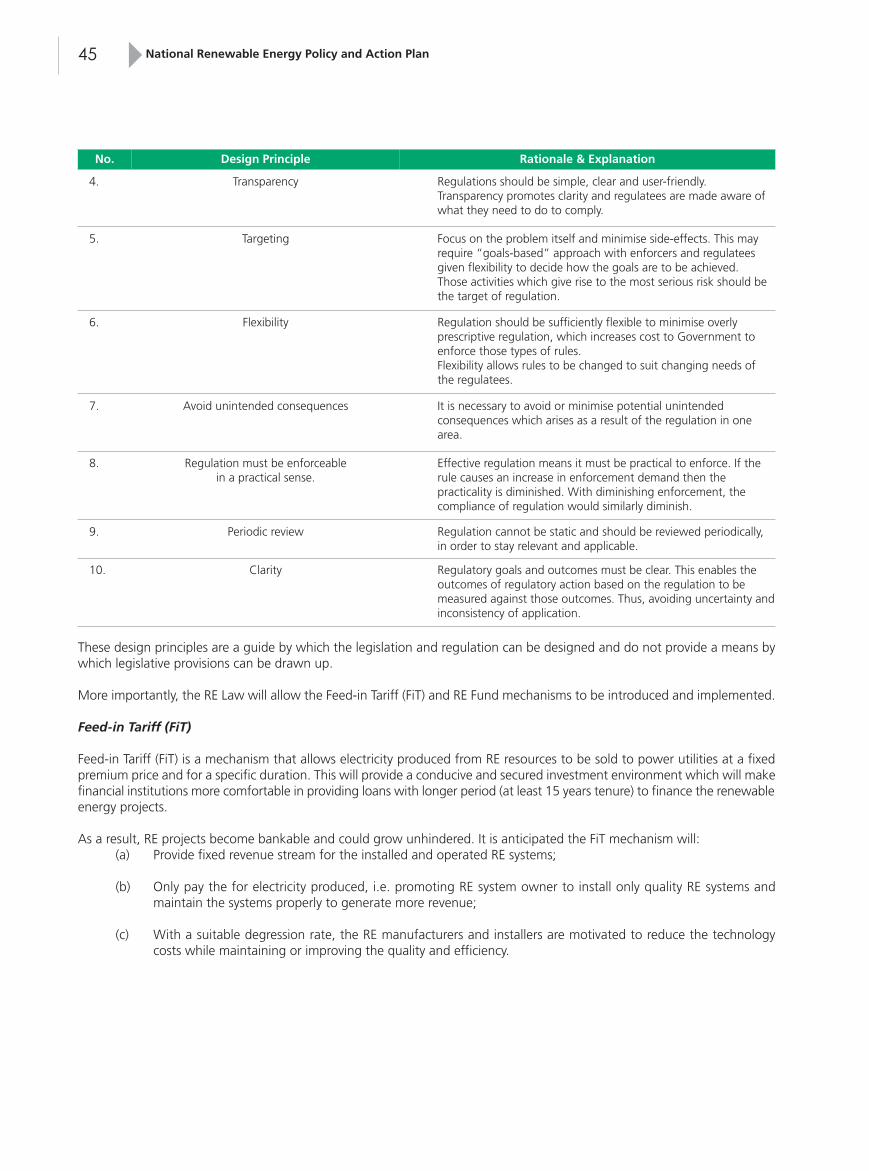
National Renewable Energy Policy and Action Plan45
No. Design Principle Rationale & Explanation
4. Transparency Regulations should be simple, clear and user-friendly.Transparency promotes clarity and regulatees are made aware ofwhat they need to do to comply.
5. Targeting Focus on the problem itself and minimise side-effects. This mayrequire “goals-based” approach with enforcers and regulateesgiven flexibility to decide how the goals are to be achieved.Those activities which give rise to the most serious risk should bethe target of regulation.
6. Flexibility Regulation should be sufficiently flexible to minimise overlyprescriptive regulation, which increases cost to Government toenforce those types of rules.Flexibility allows rules to be changed to suit changing needs ofthe regulatees.
7. Avoid unintended consequences It is necessary to avoid or minimise potential unintendedconsequences which arises as a result of the regulation in onearea.
8. Regulation must be enforceablein a practical sense.
Effective regulation means it must be practical to enforce. If therule causes an increase in enforcement demand then thepracticality is diminished. With diminishing enforcement, thecompliance of regulation would similarly diminish.
9. Periodic review Regulation cannot be static and should be reviewed periodically,in order to stay relevant and applicable.
10. Clarity Regulatory goals and outcomes must be clear. This enables theoutcomes of regulatory action based on the regulation to bemeasured against those outcomes. Thus, avoiding uncertainty andinconsistency of application.
These design principles are a guide by which the legislation and regulation can be designed and do not provide a means bywhich legislative provisions can be drawn up.
More importantly, the RE Law will allow the Feed-in Tariff (FiT) and RE Fund mechanisms to be introduced and implemented.
Feed-in Tariff (FiT)
Feed-in Tariff (FiT) is a mechanism that allows electricity produced from RE resources to be sold to power utilities at a fixedpremium price and for a specific duration. This will provide a conducive and secured investment environment which will makefinancial institutions more comfortable in providing loans with longer period (at least 15 years tenure) to finance the renewableenergy projects.
As a result, RE projects become bankable and could grow unhindered. It is anticipated the FiT mechanism will: (a) Provide fixed revenue stream for the installed and operated RE systems;
(b) Only pay the for electricity produced, i.e. promoting RE system owner to install only quality RE systems andmaintain the systems properly to generate more revenue;
(c) With a suitable degression rate, the RE manufacturers and installers are motivated to reduce the technologycosts while maintaining or improving the quality and efficiency.
2-SEDA RE Policy-Inner_SEDA Policy Book 8/24/11 8:34 AM Page 45

46
Report Year Findings
United Nations Development Programme(2008): Promotion of Wind Energy –Lessons Learned From InternationalExperience and UNDP-GEF Projects,Chapter 1: Public Policies
2008 The report stated “feed-In tariff policies have been very effective inGermany, Spain and Denmark, leading to the world’s first, second andfifth installed wind energy capacities.
France and Portugal have also used Feed-In tariffs to become fastgrowing wind energy countries with 810 MW and 695 MW installed in2006, bringing them to 10th and 9th place in terms of installed capacity”(pg. 16).
International Energy Agency (2008):Deploying Renewables – Principles forEffective Policies
2008 The report summarised “feed-in tariffs are more effective and cheaperthan quotas for renewable energy”.
Ernst & Young (2008): Renewable EnergyCountry Attractiveness Indices
2008 The report concluded “feed-in Tariffs are cheaper than trading system”whereby comparing the cost to consumer in delivering renewableelectricity, “the Germany’s EEG is cheaper at 2.6 p/kWh as compared toUnited Kingdom’s Renewable Obligation (RO) at 3.2 p/kWh” (pg. 13).
The report also summarised “feed-in tariffs have the benefit of curbingthe cost to the energy consumer of renewable in the context of rising oilprices” (pg. 4).
Stern, N. (2007): The Economics ofClimate Change - Stern Review, Part IV:Policy Responses for Mitigation
2007 The Stern Report (2007) on the financial costs of global climate changewas published by the former chief economist of the World Bank, NicolasStern.
Part IV of the report (Policy Responses for Mitigation) gives a shortoverview of the existing of incentives for renewable energy projects anddifferentiates between price based (e.g. FiT Laws) and quantity based(e.g. Tradable Green Certificates) support mechanisms. It points outbased on existing experience price-based support mechanisms (i.e. FiT)achieves a “larger deployment at lower costs” as compared to tradablequotas (see pg.366).”
Federal Environmental Agency (2006):Monitoring and evaluation of policyinstruments to support renewableelectricity in EU Member States - FinalReport
2006 The report compares FiT and quota systems (Tradable Green Certificates(TGCs) / Renewable Portfolio Standards (RPS)). The report concludes that“feed-in tariffs (FiTs) have been more successful in triggering aconsiderable increase of RE technologies in almost all the countries inwhich they have been introduced and where their effectiveness was notsignificantly hampered by major barriers (administrative barriers, gridaccess, etc.)” (pg. 88).
The report states “the risk premium required by investors can beminimised by the high level of price security given by feed-in tariffs, thuslowering the overall costs for consumers and assuring relativelyhomogenous premium costs for society over time” (pg. 88).
The disadvantage of FiT mechanism is that it does not address the first cost barrier of high incremental cost. However, thiscan be addressed through soft loan support or financial packages. As proven in some countries, this barrier will be removedby itself once the financial institutions get involved in RE projects under the secured environment which FiT mechanismprovides.
Independent evaluations undertaken between 2006 and 2008 reveal and confirm that a Feed-in Tariff (FiT) mechanism is veryeffective in introducing and growing the number of RE power plants, spurring innovation and spearheading the growth ofthe economy through the emergence of new RE Industry compared to the quota system or renewable portfolio standard(RPS). A summary of these reports findings are set out in the table below.
Table 7.2: Verifications of Feed-in Tariff (FiT) Effectiveness
2-SEDA RE Policy-Inner_SEDA Policy Book 8/24/11 8:34 AM Page 46

National Renewable Energy Policy and Action Plan47
Prior to the year 2004, the quota system (also known as renewable portfolio standard or RPS) was a popular mechanismadopted by various Governments to promote RE deployment. Under the quota systems (RPS), the Government sets a targetfor renewable electricity production which increases over time. Most quota systems allow the target to be met by producingthe renewable energy directly and the RE investments are recovered via tradable ‘Green Certificates’.
Nonetheless, the success of Germany’s RE market and subsequent replications by 20 European countries of the German’sEEG (Renewable Energy Sources Act) proved that FiT mechanism is more effective. This shows FiT is a more effectivemechanism deployed to achieve renewable energy targets.
A comparison between feed-in tariff and quota system mechanisms are described in Table 7.3 below.
Feed-in Tariff (FiT) Quota System (Renewable Portfolio Standard)
• Proven to be the cheaper option;• Performance based incentive, encourages reliable operation;• Provides long-term investment security and returns;• Creates stable and predictable revenue to pay for cost of
investment;• Degression and periodic reviews allow and stimulate system
price reductions due to technological advances (e.g. solarPV);
• Simple to implement, specific RE developments and FiT costscan be pre-determined and planned in advance;
• Encourage smaller and distributed power producers andnew industries – creates greater number of jobs.
• Less successful in achieving targets (e.g. UK, Sweden);• Involves tradable green certificates which are unpredictable
in prices;• Must have a penalty system;• Requires strong enforcement mechanisms;• No clear identification of source of funds to meet additional
costs;• Unpredictable RE prices and costs because of bidding and
trade;• Usually only one RE technology would be promoted;• Usually only bigger company (with resources) would be
interested to become developers.
Feed-in tariff needs to be introduced through a legal instrument to guarantee success and effective implementation. Thereforea new law usually a Renewable Energy Law will have to be introduced which contain specific details of the feed-in tariffprices, degression, the duration, obligations of various parties, and the review process.
Setting up high feed-in tariff rates for the RE technology at the first instance will not guarantee a success without incorporatingthe other critical success factors which are described below. In almost all cases, the feed-in tariff rates are empirical valuesand need to be reviewed or adjusted (of the degression) to suit the growth of RE market. Most importantly, the growth ofthe RE market is dependent on the available RE fund to pay for the incremental cost of the higher feed-in tariff rates, andthis will then limit the achievable RE capacities. Nonetheless, this limitation (if not too small) will provide a realistic opportunityfor the local RE industry to grow and mature, and not ‘booming’ out of hand. This relationship is shown Figure 7.1
Table 7.3: Comparison between Feed-in Tariff (FiT) and Quota System (RPS)
Figure 7.1: Example of relationship between PV market growth and feed-in tariff rates
2-SEDA RE Policy-Inner_SEDA Policy Book 8/24/11 8:34 AM Page 47

48
Outline of RE Law
For an RE Law to be effective it must address the following key points:(1) RE prices (FiT) – creation of a price (i.e. FiT) setting mechanism anchored on economic principles of efficiency and full-
cost recovery. The FiT should be designated a regulated price for which negotiations between parties are neithernecessary nor allowed. Different levels of FiT, together with a degression rate should be set for different types of REtechnologies. These prices and degression rates should be reviewed at least tri-annually. A detailed explanation ofFeed-in-Tariff (FiT) is set out in Annex B of this Report and a more detail information is available fromhttp://www.onlinepact.org;
(2) Details relating to the setting up and operation of the RE Fund and specifying the contribution obligations of consumersmust be made. The simplest approach is to set a contribution rate applied to the quantity of conventional electricityconsumed, as the more one consumes the more one should be responsible for the pollution emitted by conventionalgenerators;
(3) Obligation to interconnect – the power utilities (grid operators or distributors) must be obliged to interconnect withpriority access for transmission and distribution. The cost of interconnection must be borne fairly and reasonably onthe basis of shallow connection charging, i.e.:• The RE producers will pay for the costs of the equipment needed to connect their plant physically to the nearest
point of the electricity distribution grid; • The power utilities will pay any cost for reinforcement of the network, costs which are passed to the final
consumers by including them in the system charges (as rate base) upon the next tariff review.
(4) REPPA – the standardisation of terms and conditions of the REPPA to minimise negotiations between the utility andthe RE producer.
Consequential amendments to other statutes may be needed to avoid inconsistencies with this new law.
Critical Success Factors for the RE Law
The critical success factors identified for RE Law are: (1) Access to the grid must be guaranteed. Utilities must be legally obliged to accept all electricity generated by private
RE producers;
(2) Tariffs for RE (FiT) must be high enough to produce a return on investment plus a profit (not excessively) to act as anincentive for firms to enter the market39;
(3) Tariffs for RE (FiT) must be fixed for a long enough period (REPPA is typically 20 years) to give certainty. In addition, itwill also provide businesses with the security for market development and project financing40;
(4) There must be a "degression" for the FiT to promote cost reduction to achieve “grid parity”, where an annual stepwisereduction in tariffs by a certain percentage is mandated .
A degression encourages would be RE system purchasers to invest early rather than later (leading to increase in plantingof RE power generation systems). It can also add pressure on manufacturers of RE power systems to innovate, so thatthey continually reduce their production costs, which in turn increases the affordability of the RE power system forsubsequent installation of RE systems41;
(5) Adequate fund is created to pay for the feed-in tariff (or the incremental cost between higher FiT and the displacedelectricity cost) and guarantee the payment for the whole contract period. The size of the fund will significantlydetermine the amount of RE capacity (limit) that can be generated.
39 Notes: The current German tariff is 49 euro cents per kilowatt-hour (roughly RM2.50), about two and a half times the retail price of electricity.40 Notes: In Germany the degression was 5% in 2008, increasing to 8% by 2009.41 An intending RE power producer will only buy PV if the cost of the system is less than the sale price. This means that PV suppliers need to ensure that their prices are
reasonable.
2-SEDA RE Policy-Inner_SEDA Policy Book 8/24/11 8:34 AM Page 48
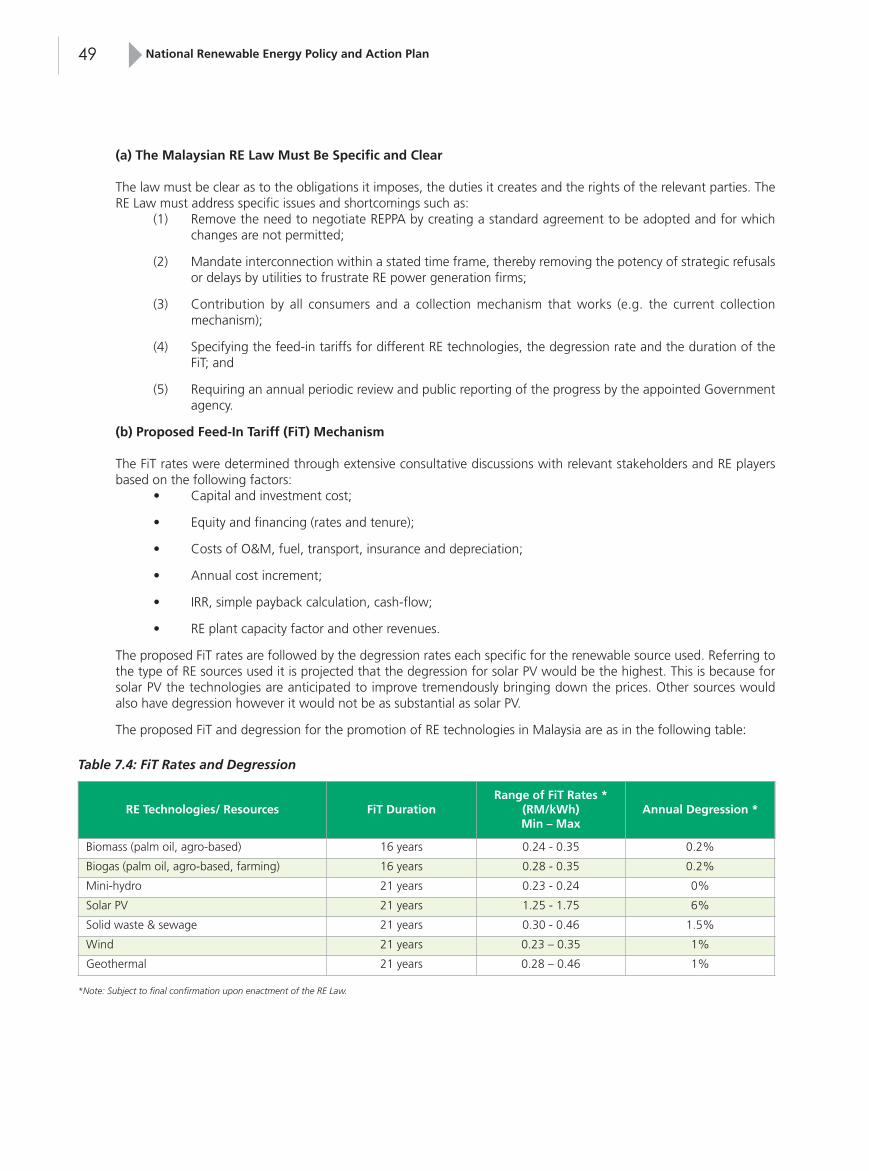
National Renewable Energy Policy and Action Plan49
(a) The Malaysian RE Law Must Be Specific and Clear
The law must be clear as to the obligations it imposes, the duties it creates and the rights of the relevant parties. TheRE Law must address specific issues and shortcomings such as:
(1) Remove the need to negotiate REPPA by creating a standard agreement to be adopted and for whichchanges are not permitted;
(2) Mandate interconnection within a stated time frame, thereby removing the potency of strategic refusalsor delays by utilities to frustrate RE power generation firms;
(3) Contribution by all consumers and a collection mechanism that works (e.g. the current collectionmechanism);
(4) Specifying the feed-in tariffs for different RE technologies, the degression rate and the duration of theFiT; and
(5) Requiring an annual periodic review and public reporting of the progress by the appointed Governmentagency.
(b) Proposed Feed-In Tariff (FiT) Mechanism
The FiT rates were determined through extensive consultative discussions with relevant stakeholders and RE playersbased on the following factors:
• Capital and investment cost;
• Equity and financing (rates and tenure);
• Costs of O&M, fuel, transport, insurance and depreciation;
• Annual cost increment;
• IRR, simple payback calculation, cash-flow;
• RE plant capacity factor and other revenues.
The proposed FiT rates are followed by the degression rates each specific for the renewable source used. Referring tothe type of RE sources used it is projected that the degression for solar PV would be the highest. This is because forsolar PV the technologies are anticipated to improve tremendously bringing down the prices. Other sources wouldalso have degression however it would not be as substantial as solar PV.
The proposed FiT and degression for the promotion of RE technologies in Malaysia are as in the following table:
RE Technologies/ Resources FiT DurationRange of FiT Rates *
(RM/kWh)Min – Max
Annual Degression *
Biomass (palm oil, agro-based) 16 years 0.24 - 0.35 0.2%
Biogas (palm oil, agro-based, farming) 16 years 0.28 - 0.35 0.2%
Mini-hydro 21 years 0.23 - 0.24 0%
Solar PV 21 years 1.25 - 1.75 6%
Solid waste & sewage 21 years 0.30 - 0.46 1.5%
Wind 21 years 0.23 – 0.35 1%
Geothermal 21 years 0.28 – 0.46 1%
Table 7.4: FiT Rates and Degression
*Note: Subject to final confirmation upon enactment of the RE Law.
2-SEDA RE Policy-Inner_SEDA Policy Book 8/24/11 8:34 AM Page 49

50
Year
Average RetailElectricity Tariff(with projected
increment)
Annual ElectricitySales (TNB)
Annual 2%Contribution Fee
Cumulative Sizeof RE Fund
Cumulative FiTCost (lessDisplaced
Electricity Cost,borne by TNB)
Annual RE FundBalance (less FiT
Cost & Fees)
2009 31.31 sen/kWh RM 26 Billion RM 0 RM 0 RM 0 RM 0
2011 33.50 sen/kWh RM 30 Billion RM 580 Million RM 580 Million RM 160 Million RM 412 Million
2015 36.85 sen/kWh RM 38 Billion RM 730 Million RM 3.2 Billion RM 2 Billion RM 1.21Billion
2020 40.53 sen/kWh RM 48 Billion RM 940 Million RM 7.4 Billion RM 6.7 Billion RM 282 Million
2025 49.05 sen/kWh RM 68 Billion RM 1.2 Billion RM 12.8 Billion RM 12.1 Billion RM 153 Million
2030 53.95 sen/kWh RM 84 Billion RM 1.6Billion RM 20.1 Billion RM 15.6 Billion RM 3.7 Billion
2035 53.95 sen/kWh RM 91 Billion RM 0 - RM 17.7 Billion RM 1.6 Billion
2040 53.95 sen/kWh RM 96 Billion RM 0 - RM 18.7 Billion RM 519 Million
2045 53.95 sen/kWh RM 101 Billion RM 0 - RM 19.1 Billion RM 87 Million
2050 53.95 sen/kWh RM 106 Billion RM 0 - RM 19.2 Billion RM 6 Million
TOTAL RM 20.1Billion RM 19.72 Billion N/a
Table 7.5: FiT Cost and RE Fund
(c) Contribution Mechanism of the RE Fund
The principle adopted here is all electricity consumers would be required to contribute to the RE Fund and this obligationmust be specified, including the mechanism by which the contribution amount is ascertained. There should be nodifficulty in ascertaining the amount and a simple mechanism is best, such as a contribution system based onconsumption.
Thus, it is recommended that a minimum contribution rate of 2% (equivalent to not more than 0.65 cents/kWh) to beembedded into the tariff pricing upon the next electricity tariff review and it would remain until the year 2030. Thecollection of the RE Fund could be retained for implementation until 2050 or when the tariff for electricity from REsources is equal to the tariff from fossil sources a period when it is said to achieve grid parity. When grid parity isachieved, electricity from renewable sources would be the preferred choice because it is environment friendly andcompetitive compared to fossil sources.
(d) Setting Up of the RE Fund
The Fund needed for FiT implementation must be prescribed by the RE Law in order that contributions can be paid toit legally. If the fund is not specified in the RE Law then any such payments if received by Government must be paid tothe Consolidated Fund or if received by the utility risked being mixed with its own funds. This can affect the legitimacyof the fund and jeopardise public’s trust in the system. The availability and size of the fund will directly determine theoverall RE capacity that can be installed in each year, as well as guarantee the payment for FiT throughout the contractperiod.
The fund is to be managed by a professional fund manager appointed by the Government, where the fund’sgovernance structure, role and responsibilities must be set out in the RE Law with no room for discretion which couldbe misused. The payment to the power utilities for the cost of FiT (less the value of displaced electricity) shall beefficiently and expeditiously disbursed.
The RE Fund in the first year of collection would amount to RM 580 million. The projected collection is for a 20 yearperiod (until 2030) about RM 20.1 billion. The structure, governance and responsibilities of the Fund Manager wouldbe stipulated in the RE Law to ensure transparency and integrity. The total FiT cost and RE Fund is illustrated in Table7.5.
Assumptions: Electricity tariff is increased by 6% in 2010 (4% for TNB and 2% for the RE Fund).
2-SEDA RE Policy-Inner_SEDA Policy Book 8/24/11 8:34 AM Page 50
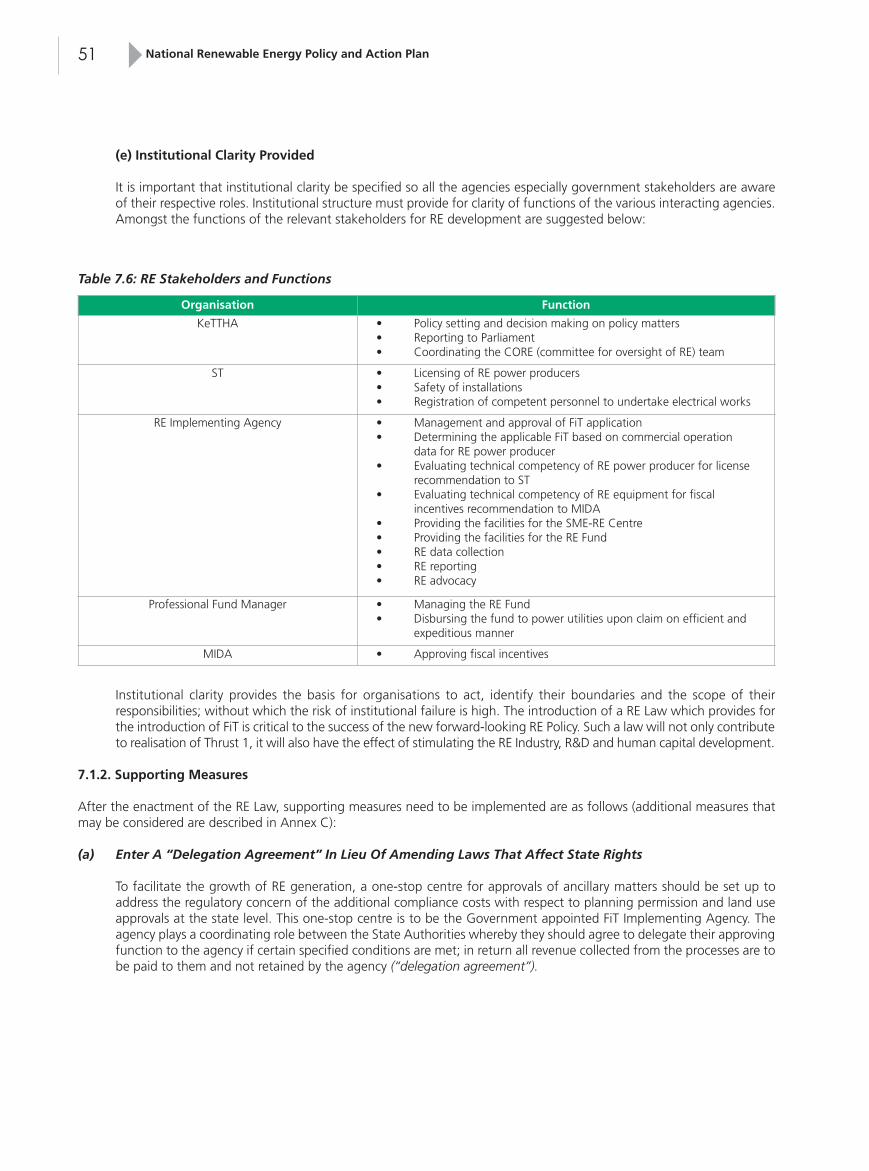
National Renewable Energy Policy and Action Plan51
(e) Institutional Clarity Provided
It is important that institutional clarity be specified so all the agencies especially government stakeholders are awareof their respective roles. Institutional structure must provide for clarity of functions of the various interacting agencies.Amongst the functions of the relevant stakeholders for RE development are suggested below:
Organisation Function
KeTTHA • Policy setting and decision making on policy matters• Reporting to Parliament• Coordinating the CORE (committee for oversight of RE) team
ST • Licensing of RE power producers• Safety of installations• Registration of competent personnel to undertake electrical works
RE Implementing Agency • Management and approval of FiT application• Determining the applicable FiT based on commercial operation
data for RE power producer• Evaluating technical competency of RE power producer for license
recommendation to ST• Evaluating technical competency of RE equipment for fiscal
incentives recommendation to MIDA• Providing the facilities for the SME-RE Centre• Providing the facilities for the RE Fund • RE data collection• RE reporting• RE advocacy
Professional Fund Manager • Managing the RE Fund• Disbursing the fund to power utilities upon claim on efficient and
expeditious manner
MIDA • Approving fiscal incentives
Table 7.6: RE Stakeholders and Functions
Institutional clarity provides the basis for organisations to act, identify their boundaries and the scope of theirresponsibilities; without which the risk of institutional failure is high. The introduction of a RE Law which provides forthe introduction of FiT is critical to the success of the new forward-looking RE Policy. Such a law will not only contributeto realisation of Thrust 1, it will also have the effect of stimulating the RE Industry, R&D and human capital development.
7.1.2. Supporting Measures
After the enactment of the RE Law, supporting measures need to be implemented are as follows (additional measures thatmay be considered are described in Annex C):
(a) Enter A “Delegation Agreement” In Lieu Of Amending Laws That Affect State Rights
To facilitate the growth of RE generation, a one-stop centre for approvals of ancillary matters should be set up toaddress the regulatory concern of the additional compliance costs with respect to planning permission and land useapprovals at the state level. This one-stop centre is to be the Government appointed FiT Implementing Agency. Theagency plays a coordinating role between the State Authorities whereby they should agree to delegate their approvingfunction to the agency if certain specified conditions are met; in return all revenue collected from the processes are tobe paid to them and not retained by the agency (“delegation agreement”).
2-SEDA RE Policy-Inner_SEDA Policy Book 8/24/11 8:34 AM Page 51

52
Conceptually therefore the delegation agreement would provide for:
(1) Scope of agreement: Delegate authority to the Government appointed agency grant the planning permissionsand land use approvals if specified conditions are met;
(2) Conditions for approval: A common set of conditions must be agreed with the State Authorities against whichthe agency can exercise the delegated authority to approve an application on behalf of the State Authority.These conditions must be documented in the agreement;
(3) Fees: State Authority is to specify the amount of fees the agency should collect from applicants, and such sumsare to be paid over to the relevant State Authority. The agency’s administrative costs in undertaking this is to beprovided by the Federal Government;
(4) Duration: The agreement is for a finite period (say 5 years);
(5) Renewal: State Authorities must consent to renewal, not automatic;
(6) Governance: The agreement must provide for proper governance and accountability of the agency to the StateAuthorities.
The use of an agreement to facilitate the emergence of a new industry is a new and novel concept in Malaysia. It is anticipatedto provide a better and more efficient means to undertake the activity without the need to amend the relevant laws.
The agreement requires the appointed agency to “negotiate” with all State Authorities on a common set of conditions forthe grant of approvals for RE generation only. For example – the conditions of land use conversion if a planning permissionis required for an RE facility within a residential area. For any matters beyond the specified conditions, the agency must referto the relevant State Authority for approvals.
Such an approach does not require any amendments to the laws affecting land use and planning, thereby minimising (if nottotally eliminating) any concerns of State Authorities’ with federalisation or reduction of state rights.
(b) Improve environmental standards to spur innovation
Studies in the EU have shown increasing environmental standards do not decrease economic activity but insteadimproves economic activity (in general) and innovation (in particular)42. Malaysia’s current environmental standards canbe improved because:
(1) The applicable principal legislation (Environmental Quality Act 1974), preserves and supports the externalisingof cost of environmental damage, as there is no need for firms to adopt cost-effective technologies to ensurecompliance is minimised thereby reinforcing a “business-as-usual” thinking;
(2) Despite providing for the licensing of noise and air polluters, there are no prescribed regulations which specifythe acceptable noise levels or ambient air quality standards. The Department of the Environment (DOE) in 198843
has provided guidelines to the air quality with respect to CO2, SOx, NOx, particulate and suspended particulateand noise planning guideline issued on 200444 only.
The lack of appropriate environmental regulations has the exact opposite effect as firms and businesses in Malaysiaadopt least-cost options, continue to pollute (unless higher standard countries demand action) and generally considercompliance with environmental standards as unimportant (i.e. NIMBY syndrome).
Once the RE Law is introduced, a support measure is to improve the environmental standards. This would have theeffect of improving technology use (i.e. more efficient boilers in palm oil mills) which in turn will spur the need forR&D and business growth. KeTTHA may need to work with the DOE to secure the introduction of these new standards.
42 See “The Contribution of Good Environmental Regulation to Competitiveness” by the Network of Heads of European Environment Protection Agencies (November 2005)43 See DOE’s Air Quality Guideline available at http://www.doe.gov.my/dmdocuments/Udara/3%20RMAQG.pdf (accessed on 8 May 2008)44 DOE’s Noise Pollution Guidelines (2004) available at http://www.doe.gov.my/dmdocuments/guidelineBunyiBising.pdf (accessed on 8 May 2008)
2-SEDA RE Policy-Inner_SEDA Policy Book 8/24/11 8:34 AM Page 52

National Renewable Energy Policy and Action Plan53
7.2. Strategic Thrust 2: Provide Conducive Environments for RE Businesses
Malaysia has been successful in attracting foreign direct investment through the provision of a package of incentives tied toperformance (i.e. export). Existing FDI policy which encourages the setting up of manufacturing related services sector45 inRE should continue. According to Grant Thornton’s 2008 International Business Report, the primary constraints faced byMalaysian businesses compared to East Asian businesses and Global businesses are skilled workers, demand or orders fortheir products or services, working capital and financing costs, as shown in Figure 7.2 below.
Figure7.2: Business constraints46
The institutional arrangement to implement this thrust effectively requires the intervention of Economic Planning Unit (EPU)to coordinate the actions of various Government ministries and agencies to develop RE as one of the new areas for nationaleconomic growth, and Ministry of Finance and Bank Negara Malaysia for financing and fiscal related actions.
Direct actions need to be taken to encourage entry into the RE market, with supporting actions aimed at stimulating demandfor RE goods or services. The main actions are summarised and described in Table 7.7 below.
Type Description of Main Action
Financial (i) Creation of an evaluation process for lending to RE power producers
Fiscal (ii) Continuation of existing fiscal incentives(iii) Special incentives to use locally created/developed R&D (this can also stimulate T4)(iv) Local content incentives
SMEs (v) Create an RE Centre for SMEs (this can support T5)
Corporate (vi) Involve GLCs and specifying their RE contribution(vii) Involve existing MNCs in RE activities
Table 7.7: Summary of Thrust 2 Main Actions
45 Note: This sector covers the establishments of OHQ, IPC, RDC, RO and RE and other support services such as integrated logistics services, integrated market support services,integrated central utility facilities, cold chain facilities for food products, research and development (R&D), and renewable energy
46 Source: International Business Report 2008 – Malaysia, produced by Grant Thornton
2-SEDA RE Policy-Inner_SEDA Policy Book 8/24/11 8:34 AM Page 53

54
7.2.1. Creation of Evaluation Process for Lending to RE Power Producers
This action is to smoothen the entry into either RE power generation or the RE Industry sector by addressing the financialdifficulties currently faced. RE producers have found it difficult to secure loans because the financial institutions were unawareof the nature of RE business activity. Such difficulties can be overcome by creating a RE funding evaluation process whichexisting financial institutions must subscribe to and apply.
This is not new as there exist similar approaches for example the simplified lending process to small and medium scaleindustries backed by a guarantee from the Credit Corporation of Malaysia or in the provision of micro-credit.
The problem faced by RE producers is not that there are insufficient funds in the capital market but the lack of skills of thefinancial institution to evaluate the applications and provide the funds expeditiously. The treatment of RE borrowers as anormal corporate debtor ignores the nature of the RE project; particularly with the introduction of a feed-in-tariff in the newRE Law. This provides added security to the financial institutions in lending to RE power generation projects.
Through the creation of a standard evaluation process by the financial institutions, the provision of working capital to REproducers in a timely and appropriate fashion can be realised. This allows for the unlocking of the capital market for REproducers instead of Government having to provide funds for them.
To create the standard evaluation process, the Government should use leading banks (at least two banks in which theGovernment is a shareholder) to lead the way by setting up RE financing teams who are trained in RE and can draw up thestandard evaluation criteria and process to be implemented. Mandating the evaluation process can be undertaken by BNM.Additionally the banks should be given specific RE loan targets by the Government for which they are to be held accountablefor failing to meet those targets.
As a stand-by provision, the Government can offer financial assistance to RE power generation firms that are unable to securefunding despite there being an agreed and understood evaluation process. This financial assistance fund is estimated to beRM 500 million to be used over 5 years.
7.2.2. Continue Existing Fiscal Incentives
The set of Government fiscal incentives is not a long term or sustainable policy tool. It does have the immediate effect ofencouraging the establishment of a new sector, and can have positive direct impacts47 on the viability of RE projects byincreasing the IRR and cash-flow. On the other hand, the incentive effect of some fiscal measures may be marginal, e.g. thebenefits of tax relief may be considered marginal by an investor, especially when the existing corporate tax rate is sufficientlylow.
Therefore for the short-term the existing fiscal incentives offered should be continued. An evaluation of their relevance andusefulness to firms should be undertaken in Year 4 after the RE Law has been brought into force, to determine if any revisionsare required. However it is projected by 2019 the fiscal incentives should be permanently discontinued.
7.2.3. Special Incentives to Use Locally Created/Developed R&D
This action is related to Thrust 4. Firms which adopt and use locally created or developed R&D for RE should be grantedspecial fiscal reliefs by the Government in order to stimulate the innovation system to produce local RE technology (ofcomparable quality and cost to international benchmark). This would enable to create a demand for local RE technology byRE power generation firms. The special fiscal reliefs are:
(a) Group tax relief - so losses in one subsidiary can be used to offset the profits in another; and
(b) Double deduction of the costs of the local innovation or R&D in RE technology used.
47 Note: The positive direct impacts are on internal rates of return (IRR) and payback periods for implementing RE projects by (i) increasing IRR by as much as 2% and (ii) reducingthe payback period by as much as 3 years. The indirect effect is to lower the burden of a company’s annual taxes between 32% to 53% via investment tax allowance, thusincreasing the bank-ability of RE and cash flow.
2-SEDA RE Policy-Inner_SEDA Policy Book 8/24/11 8:34 AM Page 54

National Renewable Energy Policy and Action Plan55
The grant of group tax relief provides the ability of a group of companies to benefit from the investment by a member of thegroup in RE. Hence if a member incurs a loss, such loss can be used by a profitable member of the group to reduce its taxliability. That loss can arise from low sales in a market which is still not sufficiently mature; or from the double deduction ofthe cost of acquiring the local innovation which changes the profit to a loss. This incentive is proposed for a period of 10years.
7.2.4. Local Content Incentives
Manufacturers of RE finished products and components for export should be encouraged to use local material in their finishedproducts and components. This can help develop a supply chain for the large RE manufacturers.The incentives would be:
(a) The provision of double deduction of the costs of local material as an allowable expense (for domesticmanufacturers only) if the local content is in excess of 50% with a proviso this deduction is for a maximumperiod of 4 years;
(b) For foreign manufacturers investing in Malaysia, the incentive is to either extend their tax holiday by a further2 years or if they have adopted an investment tax allowance, the grant of a 2 year tax holiday. This incentive isonly available when the local content has exceeded 50%. The incentive is a one-time provision. Hence whenthe foreign manufacturer has reached 50.1% local content it can apply for the 2 year tax holiday, and upon theexpiry of the 2nd year, this tax holiday incentive is no longer available.
The local content requirement and incentive should be extended to utilisation of local services, and firms who use in excessof 50% local service providers would be eligible to a waiver or refund of all service tax paid.
7.2.5. Create an RE Centre for SMEs
This action is related to Thrust 5. The SME sector in Malaysia is a significant group accounting for 32% GDP (2005), 56.34%jobs created (2005) and employing 5.6 million workers48. However the SME sector lacks informational assistance to ventureinto new areas despite having the necessary entrepreneurialism. SMEs often find it difficult to select and apply the mostappropriate science and technology to grow their business or to venture into new areas such as RE generation or RE Industry.
To assist the SME sector to participate in this new market, Government should consider establishing a RE Centre in the REImplementation Agency. The establishment of a RE Centre with clear objectives will help SMEs to engage effectively with therelevant parties in the National RE Innovation System. The Centre should focus on providing information to SMEs about REtechnologies, opportunities and risks; and assist them to participate in incentive programmes, and match their interests withpossible partners or providers.
Such a RE Centre should be able to secure advices from a government appointed agency with cooperation from SMIDEC.This agency would have the expertise and competency to advise and assist SMEs with RE specific matters while SMIDEC willhave an overall responsibility for all sectors in which SMEs are involved in and not the RE expertise.
The illustrative cost estimates for the establishment and operations of the RE Centre based on 10 personnel renting appropriatepremises and having the necessary facilities is RM 20 million over five years.
7.2.6. Involve GLCs and Specifying Their RE Contributions
This action calls for Government Linked Companies (GLC) to support and participate in RE generation because they eitherhave suitable RE resources, for example Sime Darby is in the palm oil plantation businesses thus can use the palm oil waste(EFB or POME) for power generation or that they have assets which can be shown as demonstration projects.
48 SME Annual Report 2007 published by Bank Negara Malaysia and available at http://www.smeinfo.com.my/index.php?&pg=286&ch=2&ac=727&lang=en (accessed on 20Feb 2009)
2-SEDA RE Policy-Inner_SEDA Policy Book 8/24/11 8:34 AM Page 55

56
Furthermore according to the Putrajaya Committee49 on GLC Transformation, the role that GLCs are to have is to be high-performing entities which are critical for the future prosperity of Malaysia. The GLC Transformation programme covers 2additional areas, namely delivery of significant benefits to stakeholders and a strong corporate social responsibility.
The rationale for getting the GLCs involved is to enable the Government to leverage these external assets to kick-start thegrowth of the RE generation sector, which in turn will spur the development and growth of RE Businesses. The leveragingtakes the form of direct participation in RE generation either as a viable business or as a demonstration project. Such leveragingby Government of these assets is consistent with the GLC Transformation programme to deliver significant benefits tostakeholders (not just shareholders) and for GLCs to have a strong corporate social responsibility (which can be evidenced byGLCs participation in Government’s socially beneficial programme). From their efforts of helping to improve the environmentthrough the reduction of CO2-equivalent emissions, introduction of clean technologies and creation of new job opportunities,the GLCs would provide significant benefits to the people of Malaysia.
The role of the Government is also important as an incentive for the GLCs to be involved, it is necessary for Government to:(a) Identify those who can contribute directly since not all GLCs are suitable for the undertaking of RE generation;
and
(b) Specify the RE contribution by specified GLCs which should be monitored by KeTTHA and could be mademandatory.
The suggested approach of Government identifying GLCs and specifying the RE targets by them is consistent with a leveragingof these assets by government for the benefit of the people as a whole. The possible identifications and targets for GLCs roleare summarised below:
GLC Identity RE Contribution to meet SMART Target Min. RE allocation target in 2020
Malaysia Airports BIPV when refurbish airports in and aroundMalaysia
10%
Sime Darby, Felda, Golden HopePlantations etc
Biomass and biogas 10% + 5% (respectively)
UEM Solid waste 30%
Regional Development Authority BIPV for new buildings 5%
Sykt Prasarana Negara Berhad BIPV at rail and bus stations 3%
Sykt. Perumahan Kerajaan BIPV + new residential areas 20%
Table 7.8: RE Target for GLCs
7.2.7. Involve Existing MNCs in RE Activities
Malaysia has a significant number of MNCs that are not only environmentally conscious (such as IKEA, INTEL, Western Digital,Daimler and many others), but have their long standing relationships with local suppliers. In a sense, this is a ‘natural asset’in the country which could be exploited positively by Government. The MNCs should be encouraged to engage in REgeneration for themselves and/or to exert their positive influence on local suppliers to encourage them to do likewise. Thisrequires KeTTHA or the Government appointed agency to engage with MNCs to discuss ways by which they can help andwhat Government can offer as incentives. The incentive scheme will be formulated upon the adoption of the RE Policy.
7.2.8. Additional Measures
Other additional measures are specifically targeted at building refurbishment, to help stimulate the emergence of RE PowerGeneration and further development of RE Industries.
49 Putrajaya Committee on GLC High Performance (PCG) (http://www.pcg.gov.my) was formed in January 2005 to follow through and catalyse the GLC Transformation Program.PCG is chaired by the Second Finance Minister, with participation from the heads of the Government-Linked Investment Companies (GLIC.’s) namely Khazanah Nasional Bhd(KNB), Permodalan Nasional Bhd (PNB), Employees Provident Fund (EPF), Lembaga Tabung Amanah Tentera (LTAT), Lembaga Urusan Tabung Haji (LTH), and representativesfrom the Ministry of Finance Inc. (MOF) and the Prime Minister’s Office, to work together to monitor developments and to recommend further measures of improvements.
2-SEDA RE Policy-Inner_SEDA Policy Book 8/24/11 8:34 AM Page 56

National Renewable Energy Policy and Action Plan57
(i) Strategic use of public procurement
Government should use its public procurement power strategically to spur RE generation and industry growth.Government should, in upgrading its federal buildings include the use of building integrated RE as a requirement. Thiswill create the demand for RE materials and skills which in turn will encourage market entry of related businesses. Thestrategic use of Government’s procurement power can demonstrate Government’s commitment to RE, which will inturn motivate the participation of the private sector. This can be achieved by incorporating design elements for REtechnology, in particular BIPV, into the Government’s (EPU) Standard and Cost guidelines and procedures. This alsorequires the respective Government agency implementing the construction or renovation tenders to provide preferencefor RE technologies and tolerance for the additional cost incurred which could be partially off-set by the displacedbuilding materials.
(ii) Rewards for new buildings (including refurbishment) that incorporate BIPV
Special rewards should be provided to commercial and agriculture building owners that integrate RE technologies (e.g.PV in building claddings) into their new or refurbishment buildings, such as:(a) Group tax relief – so losses in one subsidiary can be used to offset the profits in another;
(b) Special expenditure relief in the form of a 125% deduction of allowable expense or as part of the investmenttax allowance; and
(c) Reduction of import duties and/or sales tax for RE related equipment for a 3 year period.
Whilst in an economic downturn, it is possible for building owners to take the opportunity to refurbish their buildingsto be prepared when the economy improves. Those who are prepared to do so would benefit from the availability ofthese rewards. The possible loss in revenue by the Government may, however, be small in comparison to the effect ofstimulating the growth of RE businesses.
7.2.9. Alternative Choice of Implementing Mechanism
Instead of the usual mechanisms by which incentives are provided by Governments (i.e. where incentives are prescribed andavailable to those who apply), offering incentives in unique ways may be considered as the mechanism itself may provide anincentive to interested parties to be first or choose Malaysia as their investment destination. Details of the proposed alternativemechanisms are set out in Annex C of the report. Obviously more in-depth analyses of these alternative mechanisms areneeded before they can be implemented.
7.3. Strategic Thrust 3: Intensify Human Capital Development
Human capital development is a key thrust because it has the potential to create the greatest impact on the country. Malaysia’sKnowledge Economy Master Plan identifies the importance of human resource development as it can increase the overallproductivity and adaptability of the Malaysian economy which is fundamental for the transition to the K-economy, and callson the Government to build the necessary infrastructure50. The focus on human capital development in Thrust 3 is in linewith the K-economy master plan. Recognising this, there is unfortunately a current lack of available courses which are of useand relevant to RE businesses.
However as the percentage of those with tertiary education in the country is small (about 13.9% as at 2001), encouragingindividuals to enter tertiary colleges is a necessary step to increasing this percentage. This requires a determination of whatmotivates a person to have a tertiary education; and how the Government can provide incentives for such individuals.
The proposed actions are designed to simultaneously build up the local expertise and skilled workers in RE, and to providethe right incentives for ordinary individuals to acquire new skills and expertise. However these actions are subject to a ‘sunset’condition. The institutional arrangement to implement this thrust effectively requires the intervention of Ministry of Finance,Ministry of Higher Education, Ministry of Human Resources and other relevant Government agencies to coordinate the actionsin intensifying the human capital development to meet the requirement of the RE industry.
50 Additionally the Government is called to improve the function of the markets in order to unleash the creative power of markets, while the private sector should be proactivein increasing its knowledge capability and knowledge content of its activities as well as raise its international competitiveness to a new threshold.
2-SEDA RE Policy-Inner_SEDA Policy Book 8/24/11 8:34 AM Page 57
58
7.3.1. Incorporate RE in Technical and Tertiary Curricula
The availability of RE technology courses in local IHLs and training centres would need to be increased. This can be donethrough the collaboration with relevant ministries in designing an RE course curriculum which meets the need of RE. Certifyingtraining courses according to the National Skills Development Act 2006 and the Malaysian Qualifying Board should also bepursued. Discussions would be required with DSD and MOHE on the course structure. This move is anticipated to producegraduates and technical personnel who would be ready to work in the RE industry.
7.3.2. Development of Training Institutes and Centre of Excellence
The availability of adequate and quality training facilities would need to be enhanced to meet the expected demand for REcourses. Such facilities also need to meet certain international standards for quality RE education and cater for technicalcompetency and professional as well as management levels. Centre of Excellence (CoE) for RE should also be created atuniversities to further promote high class facility which will produce quality graduates and researches.
7.3.3. Provision of a Subsidy and Fiscal Reliefs
Providing the necessary courses at institutions of higher learning and technical training centres may of themselves notnecessarily produce the necessary skills. Since most Malaysians prize education, providing an education incentive would notonly stimulate demand, it will also expedite the take up of these courses. The direct action calls for the provision of a subsidyfor RE technical training and/or fiscal reliefs to individuals who pay the course fees for graduate courses in RE at institutes ofhigher learning, as detailed below.
(i) Technical training subsidy
The technical training, for which the fees for RE courses are subsidised (e.g. RE technician’s courses), must be certifiedunder the National Skills Development Act 2006. There are potentially 232 technical training centres in and aroundMalaysia51 which could provide such RE courses, and provides easier accessibility for intending trainees. An advocacyprogramme targeted at training centres would be used to encourage them to introduce RE technical training courses.
Those individuals who wish to improve themselves will benefit from the subsidy and payment to the training institutionshould only be made upon confirmation the individuals have completed the course. Timing for the payment of thesubsidy is after the eligible individuals completes the course within the time limit set by the college and are awardedthe appropriate certificate, and not before. This is to avoid subsidising individuals who drop-out of the course andfraud by the centre. However the centres receipt of this subsidy is still subject to income tax.
It is necessary to engage with the Department of Skills Development (“DSD”), Ministry of Human Resource to securethe introduction of the RE curriculum at these training centres. The illustrative cost estimate of the subsidy is projectedat RM100 million over 5 years.
(ii) Fiscal reliefs for higher education
Fiscal reliefs for the costs of graduate courses should be given to individuals who undertake graduate courses in REwith local institutes of higher learning (IHLs). The total fee payable in a tax year to the IHL would be treated as anallowable expense from the individual total income.
Such a fiscal relief will encourage individuals to undertake RE course, which will encourage IHLs to offer coursesinvolving RE. The likely impact on Government is minimal since the number of individuals prepared to undertake REcourses may be small, yet the benefits of such incentive would outweigh its costs to Government.
Currently the field of engineering and architecture is not a popular choice of course among students. This is attributedto the fact that these courses are difficult to gain entrance to and the coursework are very demanding. Table 7.9 belowshows in 2007, only 14,574 or 18% out of 83,119 graduates are from the field of the engineering and architecture.The same trend is also seen in the post-graduate (non-doctoral) and students who undertook doctoral courses inengineering and architecture in local universities (public and private) are 12% and 15% respectively.
51 See Department of Skill Development, Ministry of Human Resources, at http://espkm.nvtc.gov.my/Modules/2.4_MIS/2.4.3_SearchEngine/frmSearchACCentres.aspx (accessedon 24 February 2009)
2-SEDA RE Policy-Inner_SEDA Policy Book 8/24/11 8:34 AM Page 58

National Renewable Energy Policy and Action Plan59
Usually only 8% of all graduates went to pursue a post-graduate course. Therefore if an optimistic assumption of 20% onall engineering and architecture graduates who would pursue a post-graduate degree due to the fiscal relief, the likely numberof individuals who would benefit would be 3,000. This will have a significant impact on the availability of RE skill sets inMalaysia, but not necessarily on the amount of tax collected.
Both the training subsidy and fiscal reliefs should sunset over time to avoid entrenching a human capital development programwhich is subsidy-laden. The proposed duration of the incentives is 4 years for applications and once granted will be applicablefor the duration of the course.
7.3.4. Additional Measure
Permit withdrawal from the HRDFFirms in Malaysia have been obliged to contribute a percentage of their employees’ salary to the Human ResourceDevelopment Fund (HRDF). Withdrawal from the HRDF is permitted to pay for training at approved training facilities. Thereforeif there are firms who are willing to or have entered the RE generation or RE Industry markets, these firms should be permittedto withdraw their contribution from the HRDF to pay for the cost of retraining of their personnel. This requires the facilitieswhich provide RE skills training have prior approval by HRDF. Discussions with HRDF are needed for there to be a smooth andsimple approval process for the training facility. This would reduce the financial burden on firms who are willing to enter thisindustry but require appropriately trained personnel.
7.4. Strategic Thrust 4: Enhance RE Research and Technology
It must be recognised and acknowledged whilst there are positive economic benefits to Malaysia from greater private sectorinvestment in R&D, the principal limit to the amount of businesses outlay is the perceived returns in the marketplace. If thereis no or low returns, the private sector is unlikely to make an investment. This raises the question on the role which theGovernment can play to stimulate R&D in RE in Malaysia, and what strategies could employed to accomplish the mission.
The state of the art of RE technology has progressed significantly when clear incentives were introduced by Governmentpolicy. However the current state of plants and equipments using biomass as a combustion fuel is inefficient. At the sametime there are some RE technologies which require indigenous R&D to be undertaken to make them viable domestically.
This situation provides an opportunity for firms to enter and develop indigenous RE technology to be offered for biomassplant upgrading to improve efficiencies. R&D incentives targeting this action (rather than the sub-sector RE-biomass) wouldbear more positive fruits.
7.4.1. R&D Issues and Innovation System
An innovation system comprises actors, networks and institutions (including regulation), and their interaction with each other.Walz et al53 conclude that innovation processes are shaped by the following factors:-
(a) Innovation is not a linear process, but consists of many feedback loops between invention, technology developmentand diffusion;
All facultiesEngineering & Architecture
Engineering &Architecture as % of all
faculties
Total number of graduates 83119 14574 18%
Post graduate (non-doctoral) 9313 1155 12%
Ph.D 719 108 15%
Table 7.9: Number of Graduates in 2007 from Local Universities52
52 Source: MOHE at http://www.mohe.gov.my/web_statistik/index.htm?navcode=NAV038?m=3&navcode=NAV038&subcode=SUB001&lang=ENG (accessed on 24 Feb. 09)53 Walz R., Ragwitz R., and Schleich J., “Regulation and innovation: the case of renewable energy technologies” Fraunhofer Institute Innovation and System Research, Germany
2-SEDA RE Policy-Inner_SEDA Policy Book 8/24/11 8:34 AM Page 59

60
(b) Innovation is embedded in production of knowledge and socio-economic development and institution leading to pathdependency;
(c) Producer-user interaction and learning in the market makes early diffusion important;
(d) There is a need to differentiate between diversification of solutions and selection towards dominant designs;
(e) Stability of framework conditions which in general enhances innovation processes; and
(f) Communication between actors on various levels is essential to disseminate knowledge and to gain new insights.
The interaction of the various actors in RE, as illustrated by Walz et al, is illustrated in Figure 7.3 below. It begins with (1) thedemand for RE technologies, which leads to (2) the supplier of the technology and (3) investors in RE technology. REtechnology demand leads to (4) transmission and distribution of electricity. The interactions are not one-way but bi-directionalindicating each could influence the other. Along each of these interactions, policy could have an influence.
Figure 7.3: The triple role of regulation within the system of innovation of wind energy
The diffusion for the technology becomes an important aspect which influences various functions of an innovation system.Innovations in RE technologies, according to Walz et al are shaped by regulation. Further high level of regulation is neededto foster diffusion of the technologies.
7.4.2. State of R&D in Malaysia
Research and development are essential for the emergence of inventions and innovations in society. Malaysia’s 2005 R&Dexpenditure as a percentage of GDP as reported by MOSTI is 0.64%54. In comparison, the R&D expenditures of Singapore,Taiwan and Japan are 3, 4 and 5 times respectively compared to that of Malaysia.
However R&D activities are held back by insufficient funding, lack of expertise and poor co-ordination of R&D among researchinstitutions. Duplication of R&D efforts is not uncommon. The lack of commercialisation of R&D in RE technologies reducesthe support which R&D firms need.
Effective research activity is also a pre-requisite to attracting R&D investment. Local research institutions have a poor trackrecord of commercialisation of R&D activities, specifically RE technology. There is also a lack of coordinated research activityundertaken in RE technology by these research institutions.
54 Source: National Survey of Research and Development 2008 Report – Data for Year 2006 from Ministry of Science, Technology and Innovation available athttp://www.mosti.gov.my/mosti/failpdf/fact&figure.pdf (accessed on 13 Feb 2009).
2-SEDA RE Policy-Inner_SEDA Policy Book 8/24/11 8:34 AM Page 60

National Renewable Energy Policy and Action Plan61
Research Funding Focus
Government has allocated RM 4.4 billion in the 9th Malaysia Plan to fund R&D activities as shown in Table 7.1055 below.
Research focus area Amount in RM million (9MP allocation)
Biotechnology sector 550
ICT sector 878
Research funding (Science Fund) 966.5
Pre-commercialisation of research (Techno & Inno Funds) 1,275.8
Commercialisation of R&D 115
STI 40.5
Human capital 550
Table 7.10: Amount of Funds Allocated for R&D
Technology Cluster Sub-Areas within the Technology Cluster
i) Information and Communication Technology (ICT) • Information System• ICT Infrastructure• Software• Emerging Information Technology• Communication• Security System• Signal Processing• Database Technology• ICT Application
ii) Biotechnology • Plant• Animal• Food• Biopharmacy• Molecular Biology• Medical Biotechnology• Industrial/ Environmental Biotechnology
iii) Industry • Advanced Materials• Advanced Manufacturing• Nanotechnology• Alternative Energy• Radiation Technology• Waste to Wealth• Processing Technology• Engineering Development• Environment
Table 7.11: Pre-commercialisation and Commercialisation R&D Focus Areas
Of the total RM 4.4 billion, RM 1.4 billion has been allocated for pre-commercialisation and commercialisation funding infive areas i.e. biotechnology, ICT, industry, sea to space and S&T Core with the 3 following areas having sub-focus areas.
There is inherently a strong focus on the funding of ICT and biotechnology R&D (as can be clearly seen by the total amountof both specific and general funds made available to these two sectors). This naturally edges out RE as it must compete forboth recognition and funding with other technology areas which already have a high degree of Government support.
R&D Policy Actions in RE
Currently there is no specific policy or roadmap for R&D specifically focussing on RE. Most research institutions and universitiesmap out their own path for R&D based on the priority and interests of their management. In the government sector theresponsibility of charting the path for R&D for any particular area is under the jurisdiction of MOSTI.
55 Available from MOSTI.
2-SEDA RE Policy-Inner_SEDA Policy Book 8/24/11 8:34 AM Page 61

62
MOSTI has made some initial efforts to increase R&D in RE. The steps that have been taken to support R&D in RE technologiesinclude:
(a) Establishing two committees in recognition of the need for a systematic national R&D for RE, namely the RETask Force chaired by the Deputy Minister MOSTI and RE Technical Working Group chaired by SIRIM;
(b) Identifying the focus areas of the RE technology research and R&D - namely biomass, biogas and solar;
(c) Utilising the Techno and Science Funds to provide grants for R&D activities in new RE technologies; and
(d) Developing a specific budget for research in RE technologies.
Current Status of R&D in Malaysia
The current public sector funding for R&D has a strong focus on the biotechnology and ICT sectors. These two sectors accountfor 33% of the total available funds for R&D (without taking into account the focus areas of the general funds). The pre-commercialisation and commercialisation funding is available for only five specific technology clusters.
RE is not identified as one of the focus areas for R&D thus it has to compete with other subjects for research funds. As aresult, RE research is subject to a high degree of competition amongst the various technology clusters funded (i.e. intercompetition) as well as competition amongst technologies within the ambit of “Alternative Energy” (which includes nuclearas well as renewable energy, i.e. intra competition). As a result it is unlikely generic funding of RE research would be successful,when such a clear preference towards ICT and biotechnology sectors exists.
The current status of R&D whilst is a positive move towards supporting the Strategic Thrust 4, is inadequate because theactions are geared towards provision of money, instead of developing a conducive environment which encourages R&Dactivities in RE technologies. The Australian approach provides valuable lessons as they have reported the creation of conduciveenvironment is an important element. R&D focus should be on the activities which will help the sector, i.e. activity basedfocus and monitored and performance specific.
Further, the gaps in the current approach should be addressed. The Government needs to play a leadership role to guide theprivate sector involved in R&D as the private sector:
(a) Is very conscious about costs (about 70% of Malaysian businesses think cost management is a main source ofcompetitive advantage); and
(b) Is not sufficiently putting focus on innovation as a source of competitive advantage (only 44% of Malaysianbusinesses consider innovation as a source of competitive advantage)56.
In Malaysia the provision of public money by the Government may be insufficient however the Government can play a keyrole to help identify the research needs (i.e. the problem to be solved) and which research funding could be made available.
56 International Business Report 2008 – country focus (Malaysia), Grant Thorton available at www.internationalbusinessreport.com
2-SEDA RE Policy-Inner_SEDA Policy Book 8/24/11 8:34 AM Page 62

National Renewable Energy Policy and Action Plan63
7.4.3. Develop an RE R&D Action Plan
Government should not expect the R&D activity to produce inventions but the thrust should be considered a success if R&Dactivity produces innovation. The difference between the two words “invention” and “innovation” needs to be clearlyappreciated, in order that expectations are clear57 and funding could also be made available for innovative processes oractions.
The key features of the RE R&D Action Plan are as listed in Table 7.12 below:
Features of R&D action plan Feature Details
Demand articulation The problem requires research to be done – e.g. improving the efficiency ofbiomass boilers will be identified. This is called “demand articulation”:
• Demand articulation - defines the problem to be solved by the research,identification of the technology and market availability;
• Should be prescribed in RE Research Flagship which has specificobjectives framed by a good understanding of the needs of researches,users, customers and the community;
• The role could be played by Government as private sector does not seeinnovation source of competitive advantage.
Sunset clause: Demand articulation should be for a specific duration of 5 yearsand if it needs to be extended, a debate in Parliament is necessary to amendthe enabling law.
Market information Whilst initially using demand articulation will help local firms identify the marketbut over time the government should refrain from doing so.
Therefore the R&D Action Plan should provide for the availability of marketinformation so firms will be able to identify market potential of research areas.
Resources – Availability of skilled people Without adequate skilled workers R&D programmes have a low chance tosucceed.Therefore:
(i) Permit the importation of high quality foreign skilled workers (i.e.knowledge workers) to address the immediate shortage.
(ii) Encourage local individuals to undertake post-graduate courses via theincentive programme (in Thrust 3).
Resources – Facilities Requirement of establishment of an RE research lab/ Centre of Excellence whichthe research cooperatives can use.
Resources – Financial Provide funds by the Government; and continue with the R&D fiscal incentivesis required. Funds would be subject to the performance and monitoringframework.
Institutional features Design an effective institutional framework, where the joint venture of publicand private sectors is reflected in a cooperative research centre, with thesefeatures
(i) Close interaction between researchers and users of research; (ii) Industry contribution to the centre’s education programmes to produce
industry-ready graduates; and (iii) As a place where higher degree programmes can be undertaken.
Table 7.12: Key Features of RE R&D Action Plan
57 R&D funding is not about patent filing only. Availability of invention is a small arena of R&D activity. Innovation is the primary action of R&D. Not all innovation can bepatented because of legal requirements in Patent Laws which may not be met. This does not mean that there is no protection or that there is no value to the innovation.Governments should realise this difference and R&D activities should be supported if they are to innovate the RE technologies.
2-SEDA RE Policy-Inner_SEDA Policy Book 8/24/11 8:34 AM Page 63

64
Features of R&D action plan Feature Details
Monitoring and evaluation framework The recipient of the funds must be subject to a proper monitoring andevaluation mechanism which is fair, transparent and accountable.
A fair and proper monitoring and evaluation mechanism is transparent andaccountable without any risks of bias or a conflict of interests.
Governance Clear and transparent rules for awarding funds to bidders, avoidance ofconflicts of interests, proper and legally binding undertakings to preserveintellectual property of bidders; accountability process and grievancemechanism.
Feed-in-Tariff law Introduce a feed-in-tariff law with the specified degression which willencourage technological innovation to reduce the RE technology cost.
Roles and Responsibilities Clearly identifying the roles and responsibilities of the parties and theiraccountability.
The illustrative estimates of the cost of Thrust 4 is about RM 600million to be spent on capital and operational expenditureas well as funding of R&D activities.
The institutional arrangement to implement this thrust effectively requires the intervention of Ministry of Science, Technologyand Innovation, Ministry of Higher Education and other relevant Government agencies to develop and implement the RER&D Action Plan.
7.5. Strategic Thrust 5: Design and Implement an RE Advocacy Programme
The RE Policy must continue to build or acquire political capital because of the long term nature of policy to bear fruits.Malaysia is unfortunately fond of showing immediate success “through harvesting low hanging fruits” (i.e. easy targets ormore visible ones). However RE Policy is not a short term policy nor can a short term approach produce positive results.Without long term political capital the sustainability of the RE Policy may diminish as it would not be able to attract authorityand funds from the political authority. Consequently a policy advocacy programme is needed which helps build political capitalfor the sustainability of the RE policy.
What is a Policy Advocacy Programme
A policy advocacy programme (sometimes referred to as social marketing) is a programme designed to provide informationof the policy, its objectives and its outcomes to the stakeholders to achieve and sustain on-going public support. Furthermoreadvocacy programmes provide results to the public and political authority.
The objective of a policy advocacy programme is not just about providing factual information but the provision of informationwhich helps build political sustainability of the policy (i.e. buy-in) and minimise policy resistance.
Rationale
The introduction of RE Policy is a significant change from the “business-as-usual” approach which requires differentstakeholders’ contribution and support. Civil society as the contributor of the public fund, needs to be convinced that theidea of the fund and the contribution is sound and there is no risk the fund will be abused.
Thus different stakeholders have different interests and it is important these are addressed by way of tailored messages totarget audiences. Nonetheless the soundness of policy is and should be advocated as the common theme. If there is no clearadvocacy programme the stakeholders on whom the success of the policy depends on will turn against it, and the policy isdoomed no matter how suitable, appropriate or effective it may have been.
Therefore the rationale for the advocacy programme is to win the cooperation and support of various stakeholders to securetheir willing participation for the future success of the RE policy which will bring benefits to the society.
2-SEDA RE Policy-Inner_SEDA Policy Book 8/24/11 8:34 AM Page 64

National Renewable Energy Policy and Action Plan65
Types of Advocacy Programmes
Awareness programmes are one type of the range of advocacy programmes which should be adopted. Another approach isthe commissioning of independent evaluations published locally or engaging third party public sector bodies to organiseworkshops, discussion forums, seminars or case studies or even public hearings, briefings or consultations. Social marketingis another form of advocacy programme.
However all advocacy programmes are designed to achieve two objectives which are to provide information and securesupport for a new action by Government.
7.5.1. Design an Advocacy Programme
A pre-requisite of successful advocacy is a programme design which takes into account the target audience, the timing ofthe programme and the message to be given. This means the implementation of the advocacy programme has to be carriedout in phases.
Table 7.13 provides an indication of the target audience and the possible message in each phase of the advocacy programme.
Target audience Phase 1 (Understanding) Message Phase 2 (Participation) Message
Public-at-large
1. Environmental awareness and overcome the NIMBYsyndrome, and commitment to environmental sustainability;
2. RE Law, its purpose and how it benefits them;3. How RE benefits people;4. Importance of the contribution mechanism and the RE Fund.
5. Report to the people the status of RE initiatives;6. Inform of the training incentives to encourage
them to take up the courses;7. Identify the R&D programmes they may want to
participate.
Schools
1. Environmental awareness, commitment to environmentalsustainability
2. How RE benefits people
3. Environmental awareness strengthening4. How RE benefits people
Banks
1. Viability of funding RE projects 2. Viability of funding RE projects3. Solicit feedback on ways to improve process4. lending process evaluation with banks
GLCs1. Environmental awareness, overcome the NIMBY syndrome
and commitment to environmental sustainability;2. RE Law, its purpose and how it benefits them;3. How RE benefits people;4. Importance of the contribution mechanism & the fund.5. Incentives on offer for improved involvement;6. Their involvement – what can they do;7. Incentives on offer for improved involvement.
8. Make them the messenger of the variousinitiatives that Government is introducing.
9. Get them to encourage their suppliers to look atRE businesses as an option.
10. Showcase their RE activity
MNCs
Publicly ListedCompanies &other largeenterprises
SMEs
1. Environmental awareness, overcome the NIMBY syndrome& commitment to environmental sustainability;
2. RE Law, its purpose and how it benefits them;3. How RE benefits people;4. Importance of the contribution mechanism and the RE Fund.5. How can they become RE Businesses
6. Inform them of specific investment opportunities7. How and why they should become RE businesses
Regulatory bodies1. The role that they can play to help achieve the Thrusts 2. Ensure that their policies and regulatory
instruments are consistent with the RE Policy.
The Third Sector581. The role that they can play to help achieve the Thrusts2. Be the champion for the RE Law, contribution and RE Fund
3. Make them the messenger of the variousinitiatives that Government is introducing.
Governmentagencies (e.g.DOE, MOHR,MIDA, EPU etc)
1. Environmental awareness & overcome the NIMBY syndrome;2. RE Law, its purpose and how it benefits them;3. How RE benefits people;4. Be the champion for the RE Law, contribution and RE Fund
5. Environmental awareness and overcome theNIMBY syndrome;
6. RE Law, its purpose and how it benefits them;7. How RE benefits people;8. Be the champion for the RE Law, contribution and
RE Fund;9. Promote RE Businesses.
Table 7.13: Phases of RE advocacy programme
Note: The regulatory bodies would encompass such as BNM, SC, MCMC, SPAN, Cooperative Commission, CCM, BURSA.
58 The Third Sector is the sector that is neither the public sector nor the private sector. It encompasses civil society and NGOs or any organization not within the first two.
2-SEDA RE Policy-Inner_SEDA Policy Book 8/24/11 8:34 AM Page 65

66
Features of Advocacy Programme Detail explanation
Specifying champions within andoutside KeTTHA
These champions are people who believe in the new RE Policy and are the spokespersonon all matters relating to the RE Policy. Their enthusiasm can be harnessed to secure othersupporters.
Methods to use all media and the newmedia
A proper media usage plan is needed to maximise the reach of the message to allstakeholders. This way the cost of face to face meetings can be avoided completely.
Indentify all stakeholders All stakeholders should be identified (not just be category but by name if possible).
Sufficient flexibility The programme must be sufficiently flexible to adapt to changes in the social, business,economic and political climate of the country.
Periodic monitoring & evaluation Periodic monitoring and evaluation of the results produced by the programme is necessaryin order to continue, change or revise the detailed activities of the Advocacy Programme.
Table 7.14: Key Features of the RE Advocacy Programme
Thrusts Direct Main Action to be takenPolicy Objectives
1 2 3 4 5
T1 Introduce RE Law √ √ √ √ √
T2
Create lending evaluation process √ √ √
Continue with current fiscal incentives √ √ √
Special incentives for using local R&D tech. √ √ √ √
Local content incentives √ √
Market entry for SMEs via SME RE Centre √ √ √
RE Contribution by GLCs √ √ √ √
Involving MNCs √ √ √
T3
Technical and tertiary curricula √ √ √ √
RE training institutes and Centre of Excellence √ √ √ √
Financial and fiscal incentives for technical and tertiary education √ √ √ √
T4 Develop a RE R&D Action Plan √ √ √ √ √
T5 Design an Advocacy Programme that promotes understanding √ √ √ √
Table 7.15: Actions under each Thrust and their impact on Policy Objectives
The key features of the Advocacy Programme are:
The estimated cost of the advocacy programme over a 5 year period is RM 120 million.
The institutional arrangement to implement this thrust effectively requires the intervention of Ministry of Information,Communication and Culture, Ministry of Education and other relevant Government agencies to design and implement theRE advocacy programme.
7.6. Summary
7.6.1. Impact on Policy Objectives
The direct main actions of each Thrust and their impact and influence on realising the five Policy Objectives are summarisedin the matrix in Table 7.15.
The direct main actions of each Thrust also addressed the key issues affecting RE as identified and discussed in Chapter 3, asshown in Table 7.16 below. Thus, with the effective implementation of each of the Strategic Thrust the barriers to REdeployment would be removed.
2-SEDA RE Policy-Inner_SEDA Policy Book 8/24/11 8:35 AM Page 66
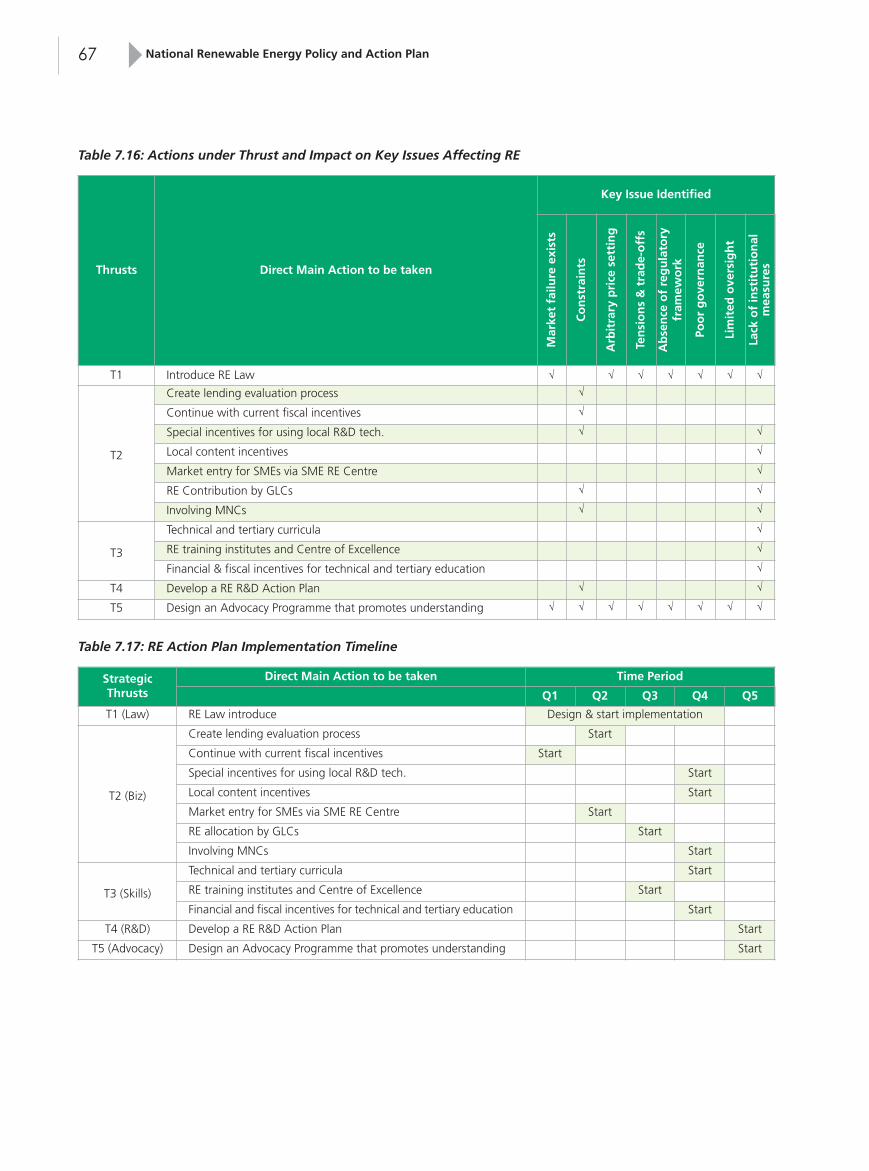
National Renewable Energy Policy and Action Plan67
Thrusts Direct Main Action to be taken
Key Issue Identified
Mar
ket fa
ilure
exi
sts
Const
rain
ts
Arb
itra
ry p
rice
set
ting
Tensions & tra
de-
offs
Abse
nce
of re
gula
tory
fram
ework
Poor gove
rnan
ce
Lim
ited
ove
rsig
ht
Lack
of in
stitutional
mea
sure
s
T1 Introduce RE Law √ √ √ √ √ √ √
T2
Create lending evaluation process √
Continue with current fiscal incentives √
Special incentives for using local R&D tech. √ √
Local content incentives √
Market entry for SMEs via SME RE Centre √
RE Contribution by GLCs √ √
Involving MNCs √ √
T3
Technical and tertiary curricula √
RE training institutes and Centre of Excellence √
Financial & fiscal incentives for technical and tertiary education √
T4 Develop a RE R&D Action Plan √ √
T5 Design an Advocacy Programme that promotes understanding √ √ √ √ √ √ √ √
Table 7.16: Actions under Thrust and Impact on Key Issues Affecting RE
Strategic Thrusts
Direct Main Action to be taken Time Period
Q1 Q2 Q3 Q4 Q5
T1 (Law) RE Law introduce Design & start implementation
T2 (Biz)
Create lending evaluation process Start
Continue with current fiscal incentives Start
Special incentives for using local R&D tech. Start
Local content incentives Start
Market entry for SMEs via SME RE Centre Start
RE allocation by GLCs Start
Involving MNCs Start
T3 (Skills)
Technical and tertiary curricula Start
RE training institutes and Centre of Excellence Start
Financial and fiscal incentives for technical and tertiary education Start
T4 (R&D) Develop a RE R&D Action Plan Start
T5 (Advocacy) Design an Advocacy Programme that promotes understanding Start
Table 7.17: RE Action Plan Implementation Timeline
2-SEDA RE Policy-Inner_SEDA Policy Book 8/24/11 8:35 AM Page 67

68
Thrusts Direct Costs Period & Purpose
T2 RM 500 million Over 5 years to provide financial assistance to RE developers/companies.
T2 RM 20 million Over 5 years for the setup and operational cost of RE centre for SMEs.
T3 RM 100 million Over 5 years for subsidy towards RE technical trainings.
T4 RM 600 million Over 5 years for RE R&D fund and action plan.
T5 RM 120 million Over 5 years for RE advocacy programme.
All Up to RM 100 million Over 5 years to develop the RE programmes and for annual baseline studies.
Table 7.18: Direct Costs to the Government
Development cost for the detail programmes RM million
1. Feed-in tariff and RE Fund mechanisms 1
2. Financial assistance mechanism to RE developers 2
3. SME centre and mechanism 0.5
4. Technical training subsidy mechanism 3
5. RE R&D action plan 2
Sub-total 8.5
Table 7.19: Costs to Development Programmes and Mechanisms of RE Action Plan
7.6.3. Direct Cost and Development Budget
The estimates of the funds the Government will have to spend over the next 5 years in implementing the various Thrusts ofthe RE Action Plan, being moneys the Government will actually pay out (but excluding moneys not received e.g. tax revenuebecause of tax breaks or reliefs) is approximately (2011-2015) RM 1.5 billion.
Note: The 2% collection from electricity revenues for the RE Fund is not included as developmental budget. The O&M cost and service fees for the utilities and implementingagencies in implementing the feed-in tariff are covered by the RE Fund. However, the cost of designing the detail of the RE Act, feed-in tariff and RE Fund mechanisms should beincluded as the developmental budget.
Stakeholders
Gen
eral
print m
edia
(new
spap
ers/
mag
azin
es)
TV/ ra
dio
Web
info
Loca
l sem
inar
/ w
ork
shop
Road
show
/ ex
hib
itio
n
Tech
nolo
gy
dem
onst
rations
Loca
l stu
dy
visits
Inte
rnat
ional
missions/
busines
s m
eetings
Inte
rnat
ional
sem
inar
/w
ork
shop
Inte
rnat
ional
cooper
atio
n
Focused local media/ activities
MNCs X X X X X X X publications
Public listed companies & large enterprises X X X X X X X publications
SMEs X X X X X X X X publications, awards
The Third sector X X X X X X
Regulatory bodies X X X X X X X X
Gov agencies X X X X X X X X
Members of Parliament X X X X X publications
Implementing agencies and RE experts X X X X X X
Year Total RM million %
2011 5 4 2 3 4 8 1 2 1 1 4 35 29%
2012 5 3.5 1 3 2 1 1 2 1 1 3 23.5 20%
2013 4 3 1 2.5 4 1 1 2 1 1 5 25.5 21%
2014 3.5 2 1 2.5 2 1 0.5 1.5 1 1 3 19 16%
2015 3 2 1 2 2.5 1 0.5 1 1 1 2 17 14%
TOTAL 20.5 14.5 6 13 14.5 12 4 8.5 5 5 17 120 100%
% 17%12% 5% 11%12%10% 3% 7% 4% 4% 14%
Table 7.20: Detail Activities and Corresponding Budget for RE Advocacy Programme (Thrust 4)
2-SEDA RE Policy-Inner_SEDA Policy Book 8/24/11 8:35 AM Page 68

National Renewable Energy Policy and Action Plan69
In determining the effectiveness of the implementation of the RE strategic thrusts to achieve both the RE Policy Objectivesand the Policy Vision, it is necessary to develop the evaluation criteria and identify the success indicators. This would allowfor the creation of a base-line against which evidence can be obtained to determine if any improvement or positive progresshas been achieved; and proposals for changes without relying on emotional response to a situation or personal intuitionmade.
The data obtained in subsequent years will help determine if there has been improvement from the baseline or otherwise.This provides the empirical evidence necessary for the continued support of the policy. Detractors will be hard-pressed toargue against empirical data showing positive results.
As the RE Policy is a new and forward-looking policy it is important the evaluation be done periodically. The success indicatorsmay be reviewed from time to time to determine its relevance and ambition of the Government. Without such evaluation,policy makers will not be able to empirically ascertain whether the actions identified for each Thrust are bearing fruit orrequire change mid-stream. Only through evaluation can the outcomes of the Policy Objectives be realised.
8.1. Base Lining
There is a need to undertake a baseline assessment of Malaysia position with regards to RE power generation, RE Industry,R&D in RE technology, public awareness of RE and skill levels. This provides the basis for future assessments and evaluationto determine whether an action is to continue, revised or removed altogether. Developing a base line helps identify the datarequirements for current and future assessments as well as data collection issues. For most of the thrusts a base line needsto be established.
The initial amount funding required breakdown of costs for determining the various baselines identifies would be RM 11.5million as in Table 8.1.
8. EVALUATION CRITERIA AND SUCCESS INDICATORS
Baseline studies RM million per annum
1. Detail RE resources and targets (capacity and energy mix) 2
2. RE technology cost 1
3. Number and types of RE businesses (developers) in the country 0.5
4. Number of RE jobs and types 0.5
5. Number of SMEs in RE business and sector 0.5
6. Number of banks providing RE financing, rates and terms 0.5
7. Number of RE licenses and REPPAs 0
8. Local resources and contents in applied RE technologies/ systems 3
9. Number of RE importer and technology 0.5
10. Number of institutes of higher learning offering RE courses and types 0.5
11. Number of technical colleges with RE courses and types 0
12. Number of RE students enrolled and passed (and quality) 0
13. Number of locals employed in RE business 1
14. Number of local RE R&D applied in the RE industry (local/ international) 0.5
15. Number of R&D collaboration and joint-ventures 0
16. Public awareness of RE 1
17. Public acceptance of RE 0
18. Public’s willingness to invest in RE 0
Sub-total 11.5
Table 8.1: Baseline Costs (per Annum)
2-SEDA RE Policy-Inner_SEDA Policy Book 8/24/11 8:35 AM Page 69

70
Year EndingCum. Total RECapacity (MW)
Share of RE Capacity
Annual REGeneration (GWh)
RE MixAnnual CO2
Avoidance (tonne)
2011 217 1% 1,228 1% 773,325
2015 975 6% 5,374 5% 3,385,406
2020 2,065 10% 11,227 9% 7,073,199
2025 2,809 12% 14,662 10% 9,237,274
2030 3,484 13% 16,512 10% 10,402,484
2035 4,317 15% 17,479 10% 11,011,455
2040 5,729 19% 19,082 10% 12,021,673
2045 8,034 25% 21,668 11% 13,650,739
2050 11,544 34% 25,579 13% 16,114,871
Table 8.2: SMART Targets
Undertaking a comprehensive baseline work would cost approximately RM 50 million to RM 100 million depending on thenumber of baselines to be done, the extent of the baseline and the availability of data to develop the baseline.
8.2. Thrust 1 Criteria
The criteria for a successful regulatory framework are as follows.
8.2.1. RE SMART Targets
Based on the detailed analysis set out in Chapter 5, the SMART targets to be achieved at different points of time form thebasis of the key success indicators for the RE Action Plan as set out below. The SMART target is a very important aspirationto be achieved but room must be given for it to be achieved. A tolerance of 10% of the target is allowable and the targetsalso need to be reviewed periodically every 3 year period.
2-SEDA RE Policy-Inner_SEDA Policy Book 8/24/11 8:35 AM Page 70

National Renewable Energy Policy and Action Plan71
No Performance factors Weight Reason
1. Turnover from the construction of renewable energypowered installations
0.5 The nature of constructing RE power plants is notsufficiently unique to be easily identifiable. Therefore toavoid over-stating the benefit, turnover from constructionindustry is reduced by 50%.
2. Jobs created 1 Key outcome is socio-economic development which isshown by these criteria. This has direct relationship withthe actions
3. New firms entering the RE business 1
4. SMEs entering the RE industry 1
5. Loans provided by commercial banks 0.5 Lending per se may not be attributable solely to theActions, as firms with strong balance sheets and assetsmay be able to secure financing regardless of the use ofthe funds. Hence a 50% discount is to be applied.
6. Turnover of the RE industry 1 Key outcome is socio-economic development which isshown by these criteria. This has direct relationship withthe actions
7. Number of REPPAs signed within a specified time period(say 1 month, 3 months etc).
1 This is indicative of the effectiveness of the RE Law
8. Local content in RE industrial products 1 Key outcome is socio-economic development which isshown by these criteria. This has direct relationship withthe Actions
9. Number of distributors of imported RE products 1 This is a counter-measure to local content and R&D. Ifmore businesses are distributors then the stimuli needsto be change.
Table 8.3: Performance Factors for Thrust 2
8.2.2. Number of RE Businesses
Another success criterion is the number of RE Businesses which have entered the RE power generation and RE industrymarkets. An increased in number of RE businesses mean the regulatory framework is providing the necessary incentive, clarityand support needed for their entry. Therefore data of this RE businesses needs to be collected.
8.3. Thrust 2 Criteria
8.3.1. Performance Factors
Table 8.3 identifies the performance factors to be used to evaluate strategic Thrust 2, the weightage and their reasons.
8.3.2. Develop Baseline
Identifying the performance baseline provides the basis for improvements. Increase in percentage terms of performancefactors would evidence the actions taken to implement Thrust 2 are bearing positive results.
Therefore it is necessary to firstly determine the performance baseline of the RE industry as at 2009. The baseline shouldobtain data for the same evaluation points as identified in sub-chapter 8.3.1 above. The development of this baseline andobtaining appropriate data from relevant agencies or surveys would provide the empirical basis for determining whether theThrust 2 main actions are producing the outcome (i.e. Policy Objective). This is realised when there is evidence of an increasefrom the baseline. If there is no increase or a decrease, two follow up actions may be required:
(a) Change the advocacy programme; or
(b) Review and revise the actions in this Thrust.
2-SEDA RE Policy-Inner_SEDA Policy Book 8/24/11 8:35 AM Page 71

72
8.4. Thrusts 3, 4 and 5 Criteria
8.4.1. Evaluation of Thrust 3
Based on the main action for Thrust 3, the performance criteria should be:(a) Number of Institutes of Higher Learning that offer courses where RE is included as the main focus;
(b) Number of technical training colleges that offer quality and recognised technical training courses in RE;
(c) The number of students graduating from the technical and tertiary colleges in the specified course (includingpost-graduate courses); and
(d) The number of trained graduates hired by the private sector.
8.4.2. Baseline and Periodic Surveys
To evaluate Thrust 3, a base line is to be undertaken to determine the current situation to ascertain whether the introductionof technical and tertiary incentives have produced the required results. It also provides a defence to any allegation the datais not legitimate. If the result is zero (as expected) it is the base from which the programme starts.
Periodic surveys
Periodically (i.e. bi-annually) undertake a survey of the same target group (of randomly selected subjects) to determine if theprogramme is showing improvement. If there has been no movement or a reduction the programme needs to be revised.
8.4.3. Evaluation for Thrust 4
The RE R&D implementation plan should develop its own evaluative measures. However one measure which should not beused is the number of patent filings because the R&D is focused on innovation (rather than invention) and patenting containslegal restrictions such as the concept of prior art.
8.4.4. Evaluation for Thrust 5
The method by which success of this Thrust is to be measured is through public surveys. What is analysed is the increasebetween survey years. If the awareness survey shows there has been an increase of awareness in the public from the previousyear, the advocacy programme should continue.
Base lining
A base-line of the target group should be determined. This group is surveyed to determine the level of awareness of RE Policyin general and Government’s initiatives. The information obtained from Phase 1 can inform the design of survey questions insubsequent years. Base lining provides a basis for determining the level of awareness, which can be compared by subsequentsurveys to see if the level of awareness is rising. This would indicate that the advocacy programme is working.
Periodic surveys
Periodically (i.e. bi-annually) undertake a survey of the same group to determine if the advocacy programme has improvedthe awareness, buy-in and participation of the target group. If there has been no movement or a reduction the advocacyprogramme needs to be revised.
2-SEDA RE Policy-Inner_SEDA Policy Book 8/24/11 8:35 AM Page 72

National Renewable Energy Policy and Action Plan73
The SREP programme introduced by the Government of Malaysia has been implemented for almost eight years. However theprogress of RE development in the country has been quite minimal. Studies and reviews have been done with the expectationthe palm oil mills would be a key participant of the programme because they had the raw materials (EFB) to be used as a fuelsource to generate electricity. There were many who were enamoured by this good idea – it was logical, attractive andleveraged national strengths. However what appeared to be a good idea has been frustrated by the market, evidencing thatGovernment cannot predict how markets will work or perform.
It was believed the palm oil industry would have been very attracted at the opportunity to use their waste to produce electricityhowever they were cautious. In fact post-implementation studies showed the palm oil mills had been utilising their EFBs andother oil palm wastes for fuel to generate power for their own use. Interests however unexpectedly came from third partydevelopers who made the assumption that the EFB had little or no value and palm oil mills would readily give it away for free.The scenario which has developed was these third party developers created a market for the EFB by introducing a demandwhich resulted in the suppliers knowing they could sell their EFBs rather than give it away for free. This led to fuel supplyagreements being needed and with severe limitations.
Initially the government has made the decision that electricity generated from using biomass and biogas were given a highertariff (i.e. 21 sen/kWh) as compared to mini-hydro (17 sen/kWh) when it was perceived the target SREP participants wouldbe the palm oil industry. This however does not result in the anticipated rapid growth of RE generation from biomass sources.
There are many different technologies which can be used to generate renewable energy-such as mini-hydro, solar PV,geothermal and wind. R&D activities in these areas are generating newer, cost-effective and innovative solutions andtechnologies. The RE industry is an area which Malaysia can actively participate in and could become a world leader.
We are approaching the end of the 9th Malaysia Plan and preparations need to be made for the 10th Malaysia Plan. The timingis right for the government to make available a new RE Policy as a continuing effort after the launching of the National GreenTechnology Policy last July 2009. This opportunity provides the avenue for a complete overhaul of the existing RE Policy inorder to promote a sustainable and forward-looking renewable energy development in the country and pursue greentechnology development in a systematic and aggressive manner. Sufficient policy experiences exist today in many countriessuch as Germany, Spain, Italy, Japan, Korea and even developing countries such as Thailand compared to the situation a fewyears ago.
The recommended RE Policy is clear, robust and forward-looking. With the policy and the introduction of the renewableenergy law which includes the provision of a mandatory feed-in tariff, RE Fund and an implementing agency, it is anticipatedthat there will be significant and positive impacts on the economy of the country, as evidence from the case studies fromother countries who have introduced such measures.
The Renewable Energy Law requires an Act of Parliament to be introduced. This is a key and fundamental thrust of the REPolicy. It is the foundation upon which the success of the entire policy rests. If such an Act of Parliament is not introduced oris delayed, then there would be no conducive regulatory environment that is needed to spur the growth of RE in Malaysia.In fact the environment would be no different than the one that exist currently.
The RE Law is the foundation upon which Thrusts 2, 3 and 4 sit, indicating that without the RE Law it would be very difficultfor these Thrusts to produce results, be successful or gain traction amongst stakeholders. Whilst the overlay of the advocacyprogramme shows that Thrust 5 is necessary to bring on board all stakeholders to support the changes introduced the REPolicy. This is graphically represented as follows:
9. CONCLUSION
2-SEDA RE Policy-Inner_SEDA Policy Book 8/24/11 8:35 AM Page 73

74
RE PolicyVision & Objectives
Advocacy Programme
Strategic Thrust 1: Foundation: RE Law
Strategic Thrust 2:
Conducive REBusiness
Environments
Strategic Thrust 3:Human Capital
Development
Strategic Thrust 4:RE R&D
Action Plan
Vision & ObjecVision & ObjecolicRE P
estiv ecyyolic
onmenvirrEnnvirBusiness
e Ronducivve RECConducivhrust 2:T
egic taStrra
t
ounda
ts elopmenvvelopmenDeevapital CCapital
Human hrust 3:T
egic tt aStrra
onmen
e RE
hrust 1: F FoundaTegic ttegic aStrra w
tion Plancction PlanARE R&Dhrust 4:T
egic tte aStra
ation: RE L Laounda
Figure 9.1: Synergies of RE Action Plan (Strategic Thrusts) leading towards a successful RE Policy
The policy requires effective and reasonable evaluation criteria which provide a basis for determining whether the policy hasbeen successful or not. Therefore detailed SMART targets are proposed for both energy and capacity targets that RE is toachieve at various intervals. It is anticipated that 13% power capacity and 10% energy generation will come from RE by2030. This would avoid 131 million tones of CO2 being produced by the conventional power generation sector.
The proposed estimate of the direct cost of implementing the various thrusts including developing the baselines for properevaluation is RM1.5 billion over a 5 year period (this cost does not include the contribution to the RE Fund).
In addition, there are other criterion that have been designed to be used to assess the success or failure of the other thrusts,including undertaking of a baseline assessment, so there is appropriate evidence of the state of play today.
There are however, other policy areas, such as conventional energy price subsidies, the energy market in Malaysia, mass andpublic transport systems, vehicle taxes, biofuels and environmental standards and pollution, that should be addressed ifrenewable energy is to be promoted wholeheartedly and as a main-stream energy source for Malaysia. These areas are underthe purview of many Ministries and agencies and are outside the scope of this Report.
In conclusion the success of the forward-looking RE Policy and Action Plan is dependent not only on the actions and supportof the Government but also of the private-sector and the Third sector (i.e. NGOs etc.). The RE Policy and Action Plan must beseen by all stakeholders as producing public value, sustainable from a political and legal standpoint and must beadministratively feasible. Only when all of these elements are in place can and will the policy be successful. Consequently itis forecasted the RE Policy and Action Plan would enable new businesses to emerge, new jobs to be created and new growthareas to be developed, paving the way for Malaysia to become the leading country in this region for green technologies andlow carbon economic growth.
2-SEDA RE Policy-Inner_SEDA Policy Book 8/24/11 8:35 AM Page 74
National Renewable Energy Policy and Action Plan75
[1] Allocation under 9MP available at Ministry of Science, Technology and Innovation
[2] Bartel and Lichtenberg (1987) “The Comparative Advantage of Educated Workers in Implementing NewTechnology,” Review of Economics and Statistics 69 (1987), pp 1-11,
[3] Caselli and Coleman (2001) “Cross-Country Technology Diffusion: The Case of Computers,” American EconomicReview 91 (2001), 328,
[4] Chapter 4 Prevention and Control of Pollution and Environmental Degradation of the National Policy on theEnvironment 2002, available athttp://www.doe.gov.my/dmdocuments/natonal%20policy/National%20Policy%20on%20the%20Environment%20on%2010.19.151.21/dasar.pdf (accessed on 8 May 2008)
[5] Department of Skill Development, Ministry of Human Resources, athttp://espkm.nvtc.gov.my/Modules/2.4_MIS/2.4.3_SearchEngine/frmSearchACCentres.aspx (accessed on 24 February2009)
[6] Design of the PTM Zero-Energy Building in PTM’s Energy Smart, Issue 0017, Quarter 1.
[7] DOE’s Air Quality Guidelines available at http://www.doe.gov.my/dmdocuments/Udara/3%20RMAQG.pdf (accessedon 8 May 2008)
[8] DOE’s Noise Pollution Guidelines (2004) available at http://www.doe.gov.my/dmdocuments/guidelineBunyiBising.pdf(accessed on 8 May 2008)
[9] Doms, Dunne, and Troske (1997) “Workers, Wages, and Technology,” Quarterly Journal of Economics 112 (1997),253 - 290,
[10] Energy Information Administration (2005), “Policies to promote non-hydro renewable energy in the United Statesand selected countries,” U.S. Department of Energy
[11] Ernst & Young (2008): Renewable Energy Country Attractiveness Indices
[12] Federal Environmental Agency (2006): Monitoring and evaluation of policy instruments to support renewableelectricity in EU Member States - Final Report
[13] Federal Ministry for the Environment, Nature Conservation and Nuclear Safety, Germany
[14] GLC Transformation programme are available at http://www.pcg.gov.my/index.asp (accessed on 25 Feb 2009)
[15] Graduates from private and public tertiary centres (2007) published by Ministry of Higher Education, Malaysiaavailable athttp://www.mohe.gov.my/web_statistik/index.htm?navcode=NAV038?m=3&navcode=NAV038&subcode=SUB001&lang=ENG (accessed on 24 Feb. 09)
[16] Information on landfill etc provided by Jabatan Sisa Pepejal, Ministry of Housing and Local Government (2008)
[17] International Business Report 2008 – Malaysia, produced by Grant Thornton
[18] International Energy Agency (2008): Deploying Renewables – Principles for Effective Policies
[19] Jobs in Renewable Energy Expanding by the WorldWatch Institute available athttp://www.worldwatch.org/node/5821?utm_campaign=vsonline&utm_medium=email&utm_source=green_jobs#notes (accessed on 17 Feb 2009)
[20] Koridor Utara at http://www.ncer.com.my/?q=manufacturing/develop_new_subsectors (accessed on 19 Feb 2009)
[21] Moore, M.H. (1995) “Creating Public Value” Harvard University Press
ACKNOWLEDGEMENT & REFERENCES
2-SEDA RE Policy-Inner_SEDA Policy Book 8/24/11 8:35 AM Page 75

76
[22] Mukoyama, T. (2003) “A Theory of Technology Diffusion” available athttp://129.3.20.41/eps/mac/papers/0303/0303010.pdf (accessed on 1
[23] National Survey of Research and Development 2008 Report – Data For Year 2006 from Ministry of Science,Technology and Innovation available at http://www.mosti.gov.my/mosti/failpdf/fact&figure.pdf (accessed on 13 Feb2009)
[24] Network of Heads of European Environment Protection Agencies (November 2005) “The Contribution of GoodEnvironmental Regulation to Competitiveness, (Nov 2005) available from http://www.eea.europa.eu/about-us/documents/prague_statement/prague_statement-en.pdf (accessed on 18 Feb 2009)
[25] Renewables 2007 Global Status Report (Paris: REN21 Secretariat and Washington, DC:Worldwatch Institute) –available at http://www.ren21.net/pdf/RE2007_Global_Status_Report.pdf (accessed on 17 Feb 2009) )
[26] Shapria, P (1996) “An Overview of Technology Diffusion Policies and Programmes to Enhance the TechnologicalAbsorptive Capabilities of Small and Medium Enterprises”, A background paper prepared for the Organization forEconomic Cooperation and Development Directorate for Science, Technology and Industry, available athttp://www.prism.gatech.edu/~jy5/pubs/oecdtech.htm (accessed on 18 Feb 2009)
[27] SME Annual Report 2007 published by Bank Negara Malaysia and available athttp://www.smeinfo.com.my/index.php?&pg=286&ch=2&ac=727&lang=en (accessed on 20 Feb 2009)
[28] SREP Guidelines available from MEWC’s website athttp://www.ktak.gov.my/template01.asp?contentid=252&tt=1&parentid=13 (accessed on 11 February 2009)
[29] Stern, N. (2007): The Economics of Climate Change - Stern Review, Part IV: Policy Responses for Mitigation
[30] TNB’s 2008 Annual Report
[31] TNB’s customer information data
[32] United Nations Development Programme (2008): Promotion of Wind Energy – Lessons Learned From InternationalExperience And UNDP-GEF Projects, Chapter 1: Public Policies
[33] Walz R., Ragwitz R., and Schleich J., “Regulation and innovation: the case of renewable energy technologies”Fraunhofer Institute Innovation and System Research, Germany
[34] World costs and price trends for solar PV available at Photon International, Issue September and October 2007
[35] Policy Action on Climate Change Toolkit (PACT) http://www.onlinepact.org (World Future Council)
[36] Supporting Solar Photovoltaic Electricity: An Argument for Feed-in Tariffs, European Photovoltaic IndustryAssociation
[37] Evaluation of different feed-in tariff design options – Best practice paper for the International Feed-In Cooperation,A. Klein, B. Pfluger, A.Held, M. Ragwitz, G. Resch, T. Faber
[38] Feed-in Tariffs: Accelerating the Deployment of Renewable Energy, Miguel Mendoca
[39] EEG – THE RENEWABLE ENERGY SOURCES ACT, The success story of sustainable policies for Germany, FederalMinistry for the Environment, Nature Conservation and Nuclear Safety (BMU)
[40] Renewable energy sources in figures – national and international development, Federal Ministry for theEnvironment, Nature Conservation and Nuclear Safety (BMU)
[41] Australian Policy Online http://www.apo.org.au
[42] National Energy Balance 2007, Pusat Tenaga Malaysia
2-SEDA RE Policy-Inner_SEDA Policy Book 8/24/11 8:35 AM Page 76

National Renewable Energy Policy and Action Plan77
Annex A: Current SREP Programme Guidelines
“During this initial phase, SCORE will adopt the following Guidelines in promoting the development of grid-connected smallRE power plants:
1. SREP shall apply to all types of renewable sources of energy, including biomass, biogas, municipal waste, solar,mini-hydro and wind.
2. Project developers will have to negotiate the Renewable Electricity Purchase Agreement with the relevant Utility,including the selling price on a willing-seller, willing buyer basis, based on take and pay.
3. The RE electricity producer shall be given a licence for a period of 21 years, to be effective from the date ofcommissioning of the plant.
4. RE electricity producers will be responsible for all the costs of the grid-connection, the relevant Utility systemreinforcement (electric cables, transformer, switchgears and other protection equipment) and the necessarymetering installation. The distribution grid interconnection shall be made at a voltage between 11 – 33 kV.
5. The small RE power plant shall be located within a distance of 10km from the nearest interconnection point.Exception is given for hydro power generation project.
6. No stand-by charges shall be levied. However, if back energy is requested by project developers, it will be chargedaccordingly with the prevailing tariff.
7. Power generation through co-generation technology shall be given special preference.
8. Maximum capacity of a small RE power plant designed for sale of power to the grid shall be 10 MW. A powerplant can be more than 10 MW in size, but the maximum capacity that will be allowed for power export to thedistribution grid will be no more than 10 MW.
9. The small RE power plant must be ready for grid-connection within 12 months from the date of approval forsuch grid connection. This is applicable for existing plant that wishes to connect to the grid. However, in thecase of proposals for setting up new RE power plants (or where “re-powering” is proposed) that require theinstallation of new boilers or turbo-generator systems, the plant shall be commissioned within 24 months. Thestipulated period of construction until commissioning shall be counted from the date of signing of the RenewableElectricity Purchase Agreement (REPA) between the developer and the utility.
10. The RE power plant must meet all environmental regulations set by the Department of Environment (DoE), andthe developer of the project is responsible for obtaining the necessary approval of DoE, and any other statutoryapprovals required.
11. The minimum of 30% equity in an RE power plant project must be by Bumiputera shareholder(s). Foreignagency/company is allowed to participate in SREP project with maximum participation equity of 30%.”
Source: Extract from the KTAK’s website59
59 KTAK’s website available at http://www.ktak.gov.my/template01.asp?contentid=252&tt=1&parentid=13 (accessed on 11 February 2009)
2-SEDA RE Policy-Inner_SEDA Policy Book 8/24/11 8:35 AM Page 77
78
Annex B: Renewable Energy Feed-in Tariff (RE-FiT) Law
B.1. What is a Feed-in Tariff (FiT) Law
Renewable energy (RE) Feed-in Tariff (FiT) is a mechanism that allows electricity that is produced from RE resources to be soldto power utilities at a fixed premium price and for a specific duration. A Feed-in Tariff Law has proven to be the best availablemechanism for accelerating the uptake of renewable energy in grid-connected areas. Furthermore, a good FiT system is atruly democratic policy because:
• It is cost-effective for the public to generate their own clean electricity; • It returns the control to generate electricity to the people.
B.2. What is not a FiT Law
There are many kinds of support mechanisms promoting electricity supply from renewable sources, with various names, allover the world. Whilst they can be combined with FiTs, it is important to distinguish FiT Laws from these other mechanismse.g. quota systems and tender schemes (see B.9 for further details).
B.3. How do FiTs work
FiTs oblige energy utilities to buy renewable energy from producers, at a mandated price. By guaranteeing access to the gridand setting a favourable price per unit of power, FiTs ensure that renewable energy is a sound long-term investment, forcompanies, for industry, and for individuals, thereby creating a strong economic incentive for investing in renewable energy.
B.4. Who pays for the FiTs
The most common method for funding the FiT involves sharing the costs amongst all end-users (electricity consumers). Theresult being that the increase in price per household is very small among the users.
B.5. What are the benefits of a FiT Law
When designed effectively, FITs are proven to:
• Reduce CO2 emissions by replacing fossil fuel-based power production with clean, renewable sources of energy.• Create jobs, for example in 2006 the German renewables industry employs around 234,000 people. Almost 60% of
which were employed as a direct result of the German FiT Law.• Help secure domestic energy supply, enabling countries to reduce their reliance on imported fossil fuels.• Guarantee investment security for renewable energy investors.• Drive technological innovation.• Provide fair market conditions for renewables, which without this renewables would be unable to fairly compete with
heavily subsidised conventional energy.
B.6. Impact of Feed-in Tariff: Example of Germany
The German Government pioneered in the year 2000 an effective FiT mechanism that is now replicated in many countriesaround the world (e.g. Spain, Greece, France, Italy, Portugal, South Korea, Switzerland, etc, for the full list please refer to B.8post). An evaluation in 2007 by the German Federal Ministry for the Environment, Nature Conservation and Nuclear Safety(BMU) identified the main impacts of FiT are as follows:
(1) By 2006, Germany achieved 12% (30,924 MW) of RE share in the gross energy consumption as compared toonly 6.3% (11,448 MW) in year 2000 (see Figure B.1).
(2) In 2006, more than 230,000 people have been employed in the RE sector due to the rapid development of theRE industry.
2-SEDA RE Policy-Inner_SEDA Policy Book 8/24/11 8:35 AM Page 78
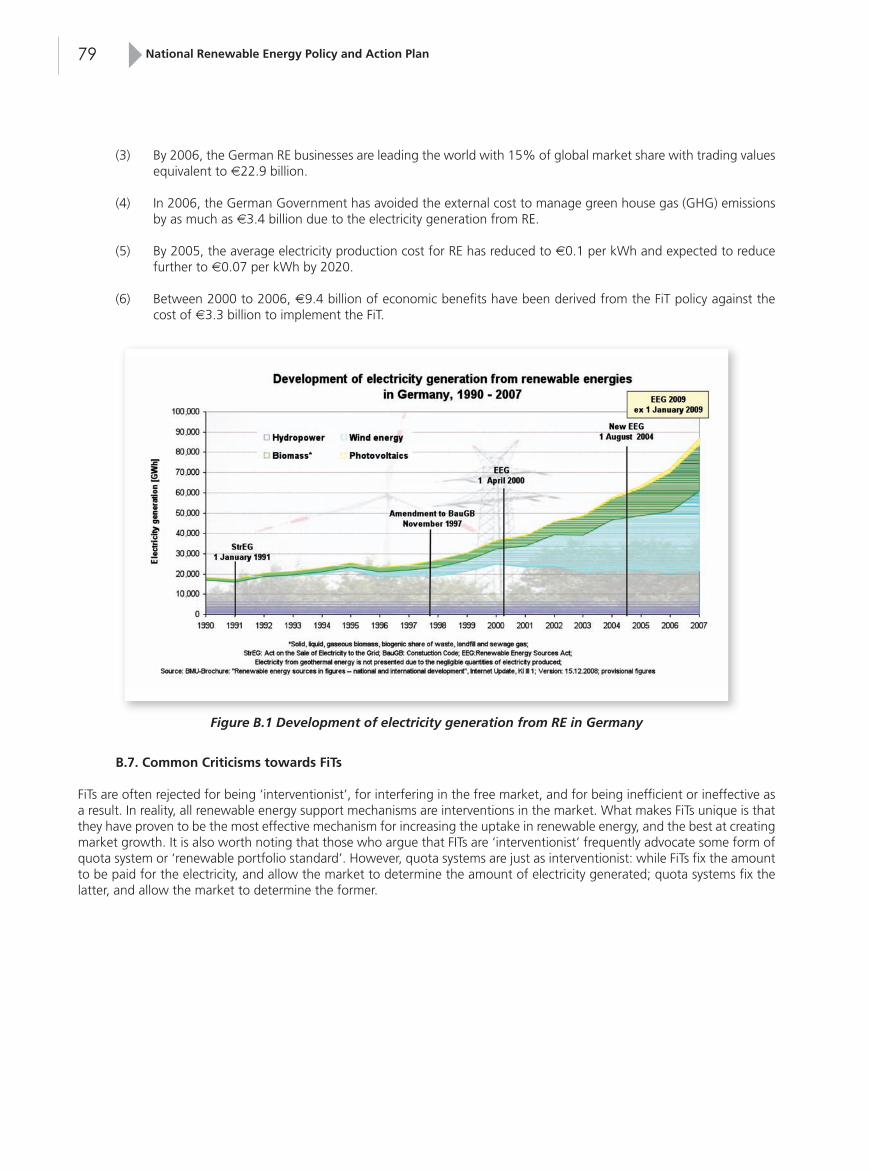
National Renewable Energy Policy and Action Plan79
(3) By 2006, the German RE businesses are leading the world with 15% of global market share with trading valuesequivalent to €22.9 billion.
(4) In 2006, the German Government has avoided the external cost to manage green house gas (GHG) emissionsby as much as €3.4 billion due to the electricity generation from RE.
(5) By 2005, the average electricity production cost for RE has reduced to €0.1 per kWh and expected to reducefurther to €0.07 per kWh by 2020.
(6) Between 2000 to 2006, €9.4 billion of economic benefits have been derived from the FiT policy against thecost of €3.3 billion to implement the FiT.
Figure B.1 Development of electricity generation from RE in Germany
B.7. Common Criticisms towards FiTs
FiTs are often rejected for being ‘interventionist’, for interfering in the free market, and for being inefficient or ineffective asa result. In reality, all renewable energy support mechanisms are interventions in the market. What makes FiTs unique is thatthey have proven to be the most effective mechanism for increasing the uptake in renewable energy, and the best at creatingmarket growth. It is also worth noting that those who argue that FITs are ‘interventionist’ frequently advocate some form ofquota system or ‘renewable portfolio standard’. However, quota systems are just as interventionist: while FiTs fix the amountto be paid for the electricity, and allow the market to determine the amount of electricity generated; quota systems fix thelatter, and allow the market to determine the former.
2-SEDA RE Policy-Inner_SEDA Policy Book 8/24/11 8:35 AM Page 79

80
B.8. Where has FiT been introduced?
The table below identifies the various countries that have introduced FITs Laws as at the end of 2008.
Africa Americas Asia Australasia Europe
AlgeriaKenyaMauritius
ArgentinaBrazil Canada*Costa RicaEcuadorNicaraguaUnited States*
India*IndonesiaIsraelJapan*Korea (South)PakistanPhilippines Sri LankaThailandTurkeyUkraine
Australia* Austria CroatiaCyprusCzech RepublicDenmarkEstoniaFranceGermanyGreeceHungaryIrelandItalyLatviaLithuaniaLuxembourgMacedoniaMaltaNetherlandsPortugalSlovak RepublicSloveniaSpainSwitzerland
B.9. Alternative Non-FiT Mechanisms
Quota Systems (Renewable Portfolio Standard) and Tradable Green Certificates
Under Quota Systems, the Government sets a target for renewable electricity production that increases over time, building amarket for renewable electricity. Most Quota Systems allow the target to be met by producing the renewable energy directlyor by purchasing ‘credits’. For the trade of those ‘credits’ an additional mechanism called ‘Tradable Green Certificates’ or‘Renewable Energy Certificates’ or ‘Credits’ is usually established.
Examples of Quota Systems in the United States: In the United States, Quota Systems arecalled Renewable Portfolio Standards (RPS). For example, California's RPS requires 20% ofelectricity for retail sales to be produced from renewable sources by 2010, and increases therequirement to 33% by 2020. [California Energy Commission website: http://www.energy.ca.gov].Texas's RPS required 2,000 MW of additional energy from renewable sources by 2009. WhenTexas met that goal, the RPS then increased to require 5,880 MW of electricity from renewablesources by 2015 (of which, 500 MW must come from non-wind resources) and 10,000 MW inrenewable energy capacity by 2025. [Texas State Energy Conservation Office website:http://www.seco.cpa.state.tx.us].
Examples of Quota Systems in Europe: In Europe, the systems are called Quotas, and areusually combined with a mechanism for trading renewable energy certificates (Tradable GreenCertificates). For example, the Renewable Obligation for England and Wales requires all licensedelectricity suppliers to provide a percentage of their electricity from renewable sources. It sets anescalating target, increasing to 10% by 2010, and 20% by 2020. Electricity suppliers can buyRenewable Obligation Certificates (ROCs) to meet the required percentage or pay a ‘buy-out price’for each MWh of non-compliance (£34.30 per MWh for 1st April 2007 to 31st March 2008). [UK'sRenewables Obligation website: http://www.ofgem.gov.uk].
2-SEDA RE Policy-Inner_SEDA Policy Book 8/24/11 8:35 AM Page 80

National Renewable Energy Policy and Action Plan81
Tradable Green Certificates (TGCs), known as Renewable Energy Certificates or Credits (RECs) in the United States, are atradable verification that a certain amount of electricity was produced from renewable sources. Renewable electricity producersare given certificates for renewable electricity they produce. Producers sell these certificates separately from the electricitythat is produced. Buyers of these certificates most often use them to meet a required target under a Quota System, but canalso purchase them to be ‘green’.
The terms TGC, RPS, and Quota are sometimes used interchangeably in Europe to refer to systems with a quota target andtradable certificates available to help meet that target.
Tender Schemes
Tender schemes (or competitive bidding) are offers (or ‘tenders’) for renewable electricity producers to supply renewableelectricity up to a target predefined by the Government. Producers put forth bids and those with the lowest prices areawarded long term contracts or power purchase agreements. Tendering can be used to meet any target, such as those undera Quota System.
2-SEDA RE Policy-Inner_SEDA Policy Book 8/24/11 8:35 AM Page 81

82
Annex C: Additional Measures to Support Strategic Thrust 1
C.1. Amend building codes and UBBL to include use of building integrated RE systems
A review of existing building codes and in particular the UBBL is necessary to determine what changes (if any) should bemade so that building owners will integrate renewable energy systems (e.g. use of PV for cladding) into their building designs.For the non-residential buildings, this can be achieved through the inclusion of MS 1525 (Malaysian Standard: Code of Practiceon Energy Efficiency and Renewable Energy for Non-Residential Buildings) into the UBBL, and subsequently can be extendedto the new residential buildings. By including such design requirements into regulation, future designs of new buildings (oreven refurbished buildings) will take into account the integration of renewable energy systems, which can spur introductionof RE power generation systems (thereby supporting the achievement of the SMART RE targets) and further stimulate theentry of new support and service businesses in the RE Industry.
C.2. Introduce a building rating system (Green Building)
Regulation can be used to require that buildings be subject to a rating system60 and certified. Hence buildings which arecertified can claim to use energy more efficiently when compared to conventional buildings, contribute directly to theintroduction of RE, have healthier work and living environments (which contribute to higher productivity) and improvedemployee health and comfort. The demand for healthier work and living environments can provide strong incentives todevelopers to comply.
Countries such as Singapore, USA, Australia, and Hong Kong have introduced a national building rating system along thelines of LEED.
The introduction of a building rating system can help the realisation of “green” buildings in the country and specifically theutilisation of renewable energy systems within the building or the use of renewable energy itself.This building rating system can be made mandatory at a later stage for new and refurbished buildings, so that the ownerswill have their buildings rated. No criminal penalty should be imposed for failure to meet the standards, but instead incentivesshould be given for achieving a “green” rating.
60 A common building rating system is the Leadership in Energy and Environmental Design (LEED) Green Building Rating System. In Malaysia, the Green Building Index (GBI) isbeing developed by PAM and ACEM and would be launched in first half of 2009.
2-SEDA RE Policy-Inner_SEDA Policy Book 8/24/11 8:35 AM Page 82

National Renewable Energy Policy and Action Plan83
No Key Details Details
1. Frequency of offer of incentives at least bi-annually or tri-annually
2. Bidding rules Investors submit closed bids for incentives to be provided (where theyspecify the incentives); incentives are tied to performance;performance must achieve the outcome; outcome specified by KTAKwhich is tied to RE Policy, and incentives granted when evidence ofperformance is made available (ex post)
3. Governance of bidding Necessary to ensure trust in the process; need transparency to buildtrust
4. Evaluation of the bidding Evaluation process made transparent, without any party politics beinginvolved;
5. Empowerment KeTTHA must be empowered to provide the incentives asked for bywinning bidders. This requires legislative provision.
6. Sunset The incentive programme is to be sunset after a defined period orwhen a particular outcome is achieved (e.g. number of jobs) wherethe private sector will continue with the investment regardless of theincentives
7. Benefits Only genuine players who can contribute will participate.
D.2. Offering Mechanism 2: Personalised Incentives Mechanism
This mechanism is referred to as the “Personalised Incentive Mechanism”. This mechanism works on the basis that as itcannot be ascertained ex ante as to the exact package of incentives or benefits that firms may want, it may be more efficientto allow interested firms to bid for a package of incentives that they would need in return for meeting Government’s targetsin RE or the Policy Objectives.
Successful bidders do not receive the grant of the incentives or benefits unless they start to show that the requiredperformance and specified outcomes are being achieved.
Key details of bidding system for the PIM are:
Annex D: Alternative Incentive Offering Mechanisms
D. Annex D
These are details of the 2 conceptual proposals referred to in sub-chapter 7.2.9 of the Report (relating to Thrust 2), whichmay quicken the pace of investment or increase the attractiveness of investing in Malaysia.
D.1. Offering Mechanism 1: Declining Incentives
This mechanism is referred to as the “1st Mover Advantage Mechanism”. In this mechanism, the type of benefits or incentivesare specified by Government and fully made available to applicants through a specific time window. After the lapse of thespecified time-window, the benefits or incentives are still made available but the scope is reduced (by value or by type ofincentives offered) to all “latecomers”. Such a programme is designed to motivate firms to compete to be first-movers inorder to receive the full range of benefits. Coupled with a sound and proper evaluation of applicants, such a programmecould result in specified RE policy targets (e.g. MW capacity or job creation) being met by efficient “first movers”. Some ofthe conceptual details of the 1st MAM are:
No Key Details Details
1. Package of benefits or incentives Scope of benefits: Fiscal; financial, people, land and construction ofRE plant (part of climate protection initiation). These incentives can becombined for the incentive package to the 1st movers.
2. Time period to apply before reduction 2 years
3. Incentives for 2nd and subsequent movers Incentives reduced – e.g. fiscal benefits reduced from say 100% taxexemption to 60% tax exemption; financial assistance withdrawn
4. Programme lifespan Limited to 8 years (4 cycles of 2 years each)
2-SEDA RE Policy-Inner_SEDA Policy Book 8/24/11 8:35 AM Page 83