national plan for the efficient and equitable …s3.amazonaws.com/zanran_storage/ · the...
TRANSCRIPT

FINAL DOCUMENT
1
MODERNISATION OF TERTIARY SERVICES PROJECT
NATIONAL PLAN FOR THE EFFICIENT
AND EQUITABLE DEVELOPMENT OF TERTIARY AND REGIONAL HOSPITAL SERVICES
June 2004 Updated Version
Modernisation of Tertiary Services Project Team
National Department of Health
June 2004

FINAL DOCUMENT
2
Funding: The European Union’s Public Health Sectoral Support Programme has funded the
Modernisation of Tertiary Services Project. The conclusions and views expressed in this
document are those of the authors, and do not reflect the off icial policy or position of the
European Commission.
Acknowledgements:
The Modernisation of Tertiary Services Project Team (Martin Hensher, Matsie Seritsane
and Rolize Kruger) has prepared this document. Dr. Kamy Chetty has provided overall
leadership for the MTS process. We also wish to acknow ledge the support and guidance
provided by from Dr. Thabo Sibeko and Mr Gerrit Muller. Other members of the
Directorate: Health Financing & Economics w hose efforts have played an important role in
developing this w ork include Vishal Brijlal, Luvuyo Baba, Siyabonga Jikw ana, Dolly
Mabusela, Bridget Maclou, Pamela Ntutela and Sello Setagane. Rod Bennet and Andy
Burn of the Chief Directorate: Hospital Services have provided important advice and
contributions to the development of the MTS models. Shantell Vorster and Marcel Hutton
of AFRICON developed the Travel and Referral Analysis model. Managers in all nine
provincial health departments provided detailed feedback on earlier drafts. We are also
extremely grateful to the management and staff of all the hospitals w ho participated in the
costing study. Marion Ahern of Gauteng Province and Willem van Rooyen, Vera Declan
and Andy Cunningham of Western Cape Province require special acknow ledgement for
their time and assistance. Finally, this exercise could not have been completed w ithout
the enthusiastic participation of the many hundreds of members of the different specialty
groups, or w ithout the f inancial support of the European Union.

FINAL DOCUMENT
3
CONTENTS Section Title Page Executive Summary 4 1 Background 9 2 Objectives of the Modernisation of Tertiary Services 10 3 Desired Outputs 10 4 General Approach 12 5 Key Issues from the Strategic Framew ork 14 6 Guiding Principles 14 7 The Modernisation of Tertiary Services Planning Model 16 8 Components and Methods Used in the Planning Model 19 9 Key Assumptions 21 10 Limitations of the Model 24 11 Current Situation 25 12 The Planned Future Configuration of Services 29
-Tertiary hospital services -Regional hospital services
29 31
13 Projected w orkload Option 32 14 Key resources required 33 15 Recurrent funding requirements 37 16 Capital costs 42 17 Impact on patient access and equity 44 18 Implementation Process and Plan 47 19 References 50 Appendices: Services to be Provided by Level of Hospital A Assumptions and Sources B Eff iciency & Sustainability Assumptions C Validation of Costing Mo D Cost Model – Unit Costs per Specialty E Length of Stay and Day Case Rates by Specialty F Staff ing Model – Activity per Specialist G Specialist Staff ing Requirements by Specialty, 2014 H Patient Separation and Outpatient Visit Rates per 1000 population I Detailed Scenario Outputs J Maps of Hospital Locations per Scenario K

FINAL DOCUMENT
4
EXECUTIVE SUMMARY
1. Background
Government f inancing of the health sector has since 1996 in real terms been
experiencing a dow nward trend, thus placing the provision of tertiary and quaternary
care in the public hospital sector under enormous pressure. Also adversely affected are
regional hospitals, w hich are increasingly becoming f inancially “squeezed” betw een
primary health care and tertiary and regional hospitals. The Review of Highly
Specialised Services conducted by the National Department of Health in 2001 and the
National Health Accounts Project of 2000 highlighted some of the problems experienced
by these levels of care.
It has thus become apparent that serious change and potentially major shifts in the way
in w hich the public hospital system provides tertiary care are needed. Consequently, the
Health MINMEC and PHRC decided that a project geared tow ards modernising tertiary,
highly specialised and regional services should be undertaken by the National
Department of Health.
2. Objectives of the Modernisation of Tertiary Services
The Modernisation of Tertiary Services (MTS) seeks to develop a credible, long- term
plan for the provision of tertiary and highly specialised care w ithin the South African
public health system, w here these services are both modernised and reconfigured. The
aim is to ensure that such services are optimally reconfigured to provide equitable
access to eff icient, high quality and cost effective care, in a manner that is both
affordable and sustainable in the medium and long term. The MTS has been developed
as part of the Integrated Health Planning Framew ork.
3. Desired Outputs
The primary output of the MTS is a service development and relocation plan for tertiary
and regional services that is agreed upon by both the provincial and national
Departments of Health and all relevant stakeholders. The key components of w hich are
an agreed target configuration for all national referral, provincial tertiary and regional
health services, by service/ specialty, province and institution, funded human resources,

FINAL DOCUMENT
5
capital and procurement plans to achieve the said configuration, appropriate recurrent
funding vehicles for both the transition period and the longer term, and an
implementation and transition plan, w ith designated responsibilit ies for all components.
4. General Approach
The approach adopted is one that integrates stakeholder inputs, technical analysis and
modelling, and consensus building. The key activit ies that w ere integrated to develop
the MTS Planning Model consist of stakeholder input of clinical experts from fif ty
specialties and subspecialties, a Strategic Framew ork based upon the synthesis of
critical messages and information gathered from reports prepared by the clinicians, a
cost model w hose results were used as baseline data for the MTS planning model, a
Patient Travel and Referral Analysis Model w hich constructs Thiessen and drive-time
polygons to determine the catchment population to be served by a hospital at different
levels of care and calculates the travel t ime and costs of travel betw een different
hospitals, HR Information from Vulindlela, Persal and the Gauteng Province and f inally
the IHPF and Hospital Revitalisation Plan.
A technical consensus has been built via the follow ing activities:
• Tw o rounds of consultative workshops with the MTS specialty groups during 2002 and 2003
• Detailed comment by and consultation w ith specialty groups on the Draft
Strategic Framew ork document, and w ider consultation on the Strategic
Framew ork via the MTS w ebsite
• Tw o detailed briefings of provincial Heads of Health at PHRC in November 2003
and March 2004
• Tw o rounds of one-day workshops with provincial managers in each province to consult and take feedback on drafts of the plan, in January - February 2004 and
April - May 2004
• National technical w orkshops with provincial managers on the Strategic
Framew ork and MTS models in March 2003 and June 2004
The MTS Project Team is confident that this process is one of the most extensive
consultative planning exercises ever undertaken in the South African public health

FINAL DOCUMENT
6
sector; extensive improvements to the w ork have taken place follow ing every stage of
the consultation, highlighting the value of prioritising the consultative planning approach.
5. Guiding Principles
A set of principles and values w ere developed to guide the future development and
reconfiguration of public referral hospitals in South Africa. These principles have been
distilled from existing policy, from legislative and constitutional principles, and from the
stakeholder consultation process. They are the follow ing:
• Government must actively w ork to realise progressively the right of access of all
South Africans to appropriate, high-quality referral hospital care, given available
resources.
• Current centres of excellence in tertiary care must be preserved and not undermined
by change. The reduction of inequalit ies must explicit ly involve the strengthening
and development of services, and should not be a crude process of “redistribution”.
• Ensuring equitable access to care does not alw ays require that services must be
evenly distributed in geographic terms. The health system should facilitate the
health service user in accessing services, be that by local provision or by the
provision of transport to ensure that patients can travel safely to distant treatment
centres.

FINAL DOCUMENT
7
• Any reconfiguration of services must ensure that service and care quality is of the
highest attainable level at all t imes given available resources.
• Public referral hospitals must become the employer of choice for health professionals, through comprehensive action on remuneration, w orking conditions,
and development of clear career paths.
• Health professionals training, especially that of medical specialists must be more
closely linked to the requirements of the public health system, to allow the production
of personnel w ith the required skills.
• Clinical equipment and physical infrastructure must be modern, fully functional,
adequately maintained and replaced on a regular basis. A particular focus must be
placed on expanded investment in appropriate and up-to-date diagnostic radiology
equipment, as current deficits in this specialty hamper activity across a w ide range of
services.
• Services must be adequately and sustainably funded.
• Service delivery must be eff icient, effective, and w ell managed, offering value for
money in the use of public funds. Management and funding arrangements must
support and promote the smooth operation of an integrated referral system, and not
reinforce divisions between levels of care or across provincial boundaries.
• Reconfiguration of tertiary hospital services cannot be considered in isolation from
the adequacy of regional hospital services.
6. The Modernisation of Tertiary Services Planning Model
The MTS planning model is based directly on the organisation of services across levels
of care. The most important features of the services to be provided at each level are as
follow s:
Regional Hospital Services – ensuring that every regional hospital provides a
specialist-led service (with at least one full-time specialist per discipline available on site by 2009, and a minimum of tw o per discipline by 2014) in each of the eight core
specialties, namely Anaesthetics, Radiology, Medicine, Surgery, Mental Health,
Obstetrics & Gynaecology, Orthopaedic Surgery, and Paediatr ic Medicine, in line w ith
the Draft Regional Hospitals Package of Care. The fundamental difference betw een the
proposed model and the current situation lies in the stipulation that each regional
hospital must employ at least one specialist per discipline. This development w ill
FINAL DOCUMENT
8
fundamentally transform the capability of regional hospitals to provide specialist-led care
in relatively close proximity to the patient’s residence.
Tertiary Hospital Services – providing a comprehensive set of specialist-led services to
a defined geographical catchment population (determined by transport access criteria,
and not by provincial borders). These include key referral specialties not available at
regional hospital level, such as ENT, Infectious Diseases, Ophthalmology, Paediatric
Surgery, Plastic & Reconstructive Surgery, Urology, and Vascular Surgery. Each
Tertiary Hospital w ould act as the hub for the provision of specialised emergency and
trauma care w ithin its catchment area, providing a specialised Major Trauma Centre, a
full ICU service under the supervision of a specialist Intensivist (including dedicated
Paediatric ICU), and a dedicated Burns Unit. It w ould also house a mult idisciplinary
Rehabilitation Centre, incorporating dedicated stroke care and spinal injury beds.
It w ill take several years of sustained investment to develop the full range of Tertiary
Hospital Services. Thus, an interim target has also been developed. Various hospitals
will be designated as “Developing Tertiary Hospitals”. During this period, a number of
smaller specialt ies w ould be provided by outreach from the parent National Referral
Hospital, until such time that local services and staff were in place. Addit ional resources
are allocated to the relevant National Referral Hospitals to provide this support.
National Referral Hospital Services – a set of sub-specialty or highly specialised, purely referral services, taking referrals from a netw ork of Tertiary and regional hospitals
(including the Tertiary Hospital at w hich they are located), and generally serving a
population draw n from more than one province. Sub-specialty services provided at this
level w ould include Cardiology and Cardiothoracic Surgery, Neurology and
Neurosurgery, Oncology (medical, radiation and surgical), Nuclear Medicine, Renal
Transplant, and a range of Paediatr ic sub-specialties
Central Referral Units – the ult imate t ip of the referral chain, providing access at one or
tw o locations nationally to extremely specialised and expensive services (e.g. heart and
lung transplant, bone marrow transplant, liver transplant, PET scan, cochlear implant
etc.).
The plan uses this categorisation of desired referral hospital services as the building
blocks for developing the future configuration of regional and tert iary and regional
hospitals. It is assumed that - w here provided - National Referral Hospital Services w ill
alw ays be co-located w ith Tertiary Hospital Services (in order to reduce duplication of
FINAL DOCUMENT
9
essential services). Similarly, it is assumed that Central Referral Units w ill alw ays be
“bolted on” to National Referral Hospital Services.
The MTS Travel and Analysis Model w as used to measure the proportion of the
population that does not have access to both regional and tertiary hospital services.
Based on the outcomes w e were able to reconfigure services in a manner that ensures
that a large proportion of the population can access services thus reducing inequit ies.
The key output of the MTS planning model is the generation of resource requirements in
2009/10 and 2014/15 for each hospital, by level of care and by province, specif ically,
total costs per specialty, level of care and hospital, total number of beds required, total
number of health professionals required (w ith a special focus on medical specialists) and
the capital costs of upgrading facilities and equipment and dow ngrading or dow nsizing
hospitals as required by the particular scenario.
The MTS Cost Model w as also used to assess the degree of under-funding of current
services. If current regional and tert iary hospital services w ere to be funded at levels
adequate to accommodate demand for drugs and consumables, and to ensure that
infrastructure and equipment are maintained and replaced adequately, funding for
regional hospitals w ould need to increase immediately by 38%, and for tertiary and
regional hospitals by 35%.
The required funding levels involve very large increases relative to current expenditure. To achieve the target levels of provision and quality improvement by 2009 w ould require
annual average real funding increases of 8.5% betw een now and the end of the decade.
How ever, over the period to 2014, sustained real annual average grow th of 6% would be
suff icient to yield these targets. The scale of these increases is less daunting if they are
view ed in terms of their share of Gross Domestic Product. The GDP for the year
2005/06 w as R1,108 billion. Baseline expenditure on regional and tertiary hospitals w as
1.4% of GDP. If relatively modest real GDP grow th rates are assumed over the next ten
years (4% and 6%), the plan’s funding requirement w ould represent only 1.4 to 1.5% of
GDP in 2009, and 1.5% to 1.6% in 2014.
Extensive international evidence indicates that national health expenditure displays
positive income elasticity both across countries and over time. In all developed
countries, the share of total economic output (Gross Domestic Product, or GDP) devoted
to health has consistently risen as GDP rises – i.e. as a country gets richer, it spends
relatively more on health. Thus the sooner health receives a realistic allocation that is
not based on historic activity but future developments that are in line w ith the country’s

FINAL DOCUMENT
10
economic output, can w e then realise one of the key goals of the Department of Health
that of ensuring better health for all South Africans.
1. Background
Government f inancing of the health sector has since 1996 been experiencing a
dow nward trend in real terms. The chronic under-funding of the health sector has
placed the provision of tertiary and quaternary care in the public hospital sector under
enormous pressure. It has also led to the health system’s inability to keep up w ith the
ever-increasing demand for services and consequently compromised quality of care and eff iciency in service delivery. Thus undermining the vision of the National Department of
Health, w hich is to provide “ a caring and humane society in which all South Africans
have access to affordable, good quality health care”1.
The Review of Highly Specialised Services conducted by the National Department of
Health in 2001 highlighted some of the problems experienced by these levels of care. It
identif ied a variety of problems that w ere inherent in the provision of tertiary care, the
major ones being the presence of glaring geographic inequalities in access to tertiary
care, duplication of services and problems relating to the eff iciency and sustainability of
current providers.2 Also, many tertiary and specialised services, especially for major
disciplines tended to manage patients below the level of care for which they are
designated, hence the ineff icient use of resources.3 At the same time, the National
Health Accounts Project 4 identif ied that regional hospitals w ere increasingly becoming
“squeezed” f inancially, falling outside both the policy imperative of targeting resources to
primary health care services and the ring-fenced conditional grants for tertiary and
regional hospitals.
Experience over the last f ive to ten years has also indicated that high quality tertiary
hospital services have important indirect benefits for the health system as a whole.
Tertiary and regional hospitals serve as centres of excellence for the dissemination of
quality improvements, and as hubs for professional development and leadership. It is
1 Department of Health. Health Sector Strategic Framework, 1999 – 2004. 2 Department of Health. Research Findings and Policy Implications of the Review of Highly Specialised Services in the Public Hospital Sector, 26 June 2001. 3 Vallabhjee, K N. & Jinabhai, CC. et al. Levels of Health Care at Academic and Regional Hospitals in KwaZulu-Natal, South African Medical Journal, 1997: vol. 87 (10) 4 Thomas S, Muirhead D. National Health Accounts Project: the public sector report. Pretoria, Department of Health, 2000.

FINAL DOCUMENT
11
increasingly clear that – w hether or not they receive an appropriate share of resources
relative to low er levels of care – tertiary and regional hospitals are the capstone of the
public health system. They cannot stand in isolation; but w ithout the presence of high
quality and w ell-resourced referral centres, primary health care and low er-level hospital
systems w ill become dysfunctional and w ill fail in their missions.
Thus, it has become apparent that serious change and potentially major shifts in the w ay
in w hich the public hospital system provides tertiary care are needed. Consequently, the
Health MINMEC and PHRC decided that a project geared tow ards modernising tertiary
and highly specialised services should be undertaken by the National Department of
Health.
2. Objectives of the Modernisation of Tertiary Services
The Modernisation of Tertiary Services project (MTS) seeks to develop a credible, long-
term plan for the provision of tertiary and highly specialised care w ithin the South African
public health system, w here these services are both modernised and reconfigured. The
aim is to ensure that such services are optimally reconfigured to provide equitable
access to eff icient, high quality and cost effective care, in a manner that is both
affordable and sustainable in the medium and long term. The MTS is being developed
as part of the Integrated Health Planning Framew ork.
3. Desired Outputs
The primary output of the MTS is a service development and relocation plan for tertiary
and regional services that is agreed upon by both the provincial and national
Departments of Health and all relevant stakeholders. The key components of w hich
being:
• An agreed target configuration for all national referral and provincial tertiary health services, by service/ specialty, province and institution,
• A funded human resources plan to achieve the said configuration, including
appropriate changes to incentives and career pathw ays,

FINAL DOCUMENT
12
• A funded capital and procurement plan to achieve the configuration,
• Appropriate recurrent funding vehicles for both the transition period and the longer term, and
• An implementation and transition plan, w ith designated responsibilit ies for all
components.
4. General Approach
The approach adopted is one that integrates stakeholder inputs, technical analysis and
modelling, and consensus building, w hich feeds into the MTS planning model used in
the development of a feasible and sustainable plan. The follow ing are the key activities
that w ere integrated to develop the MTS Planning Model:
4.1 Stakeholder input
Betw een August 2002 and March 2003, the Modernisation of Tertiary Services team of
the National Department of Health convened a series of w orkshops for clinical experts
from fif ty specialties and subspecialties from the public sector, health sciences faculties
and other allied health professions, funded by the European Union. Over 500 health professionals participated in these w orkshops. These experts w ere given an opportunity
to discuss the current status of service provision, likely future developments in their
specialties and identify the best w ay forward for the provision of tertiary services given
current and future economic, social and epidemiological realit ies facing South Africa.
Using a structured reporting format that w as provided, the specialty groups were asked
to provide a detailed w ritten report on the outcomes of their discussions.

FINAL DOCUMENT
13
4.2 Strategic Framew ork
The detailed reports prepared by the different focus groups of specialists formed the
basis of the Strategic Framew ork for the Modernisation of Tertiary Hospital Services5.
The Strategic Framew ork is attached as Appendix A. The Strategic Framew ork is a
synthesis of both the critical messages and information that w ere gleaned from these
reports, and arranged into specif ic options and scenarios of organisational and structural
changes to tertiary care service delivery. The Strategic Framew ork was then converted
into a number of detailed, costed options that are part of the planning model, w hich
specify the necessary locations, resource, funding and capital investments that are
required.
4.3 Cost Model
To inform the modeling and planning exercises, a step-dow n costing study of a number
of regional and tertiary level hospitals viz. Boitumelo, Witbank, Universitas, Pelonomi,
Kimberly, Red Cross, Groote Schuur and Tygerberg was conducted. All recurrent and
capital costs w ere matched to cost centres (clinical, administrative and support).
Administrative and support overheads were then allocated step-wise to low er cost
centres; and ultimately, end-user cost centres i.e. clinical specialt ies and sub-specialties.
Thus, enabling the calculation of the full cost per cost centre per unit of activity for both
inpatient and outpatient activity. The results w ere then used as baseline data for the
MTS planning model.
4.4 Patient Travel and Referral Analysis Model
Poor referral systems betw een regional and tertiary hospitals, and lack of patient
transport coupled w ith poor management thereof, are often cited as major contributors to
continuing inequitable access to specialised services. Changes in service
configurations, operation and location of many tertiary services that may result from the
MTS process w ill have huge implications for patient travel times, thus should be proper ly
accounted for in the planning model and travel costs should not be shifted to patients.
Using European Union funding, AFRICON Consulting w ere engaged to develop a Travel
and Referral Analysis geographic information system model (know n as TRA hereafter).
The model constructs Thiessen and drive-time polygons to determine the catchment
5 National Department of Health, Strategic Framework For The Modernisation of Tertiary Hospital Services, May 2003.

FINAL DOCUMENT
14
population to be served by a hospital at different levels of care and calculates the travel
time and costs of travel betw een different hospitals.
4.5 HR Information
Reconfiguration of services entails ensuring that there are adequate and appropriate
health professionals available to render services. Part of the MTS process was to
identify w here the professionals are, and whether they are working at hospitals that are
of appropriate levels of care w here their skills can be fully utilised. This proved to be
surprisingly diff icult, as most provinces and hospitals w ere not able to provide detailed
breakdow ns of data on specialist staff by discipline by hospital (far less on groups such
as specialised nurses). Indeed, only Gauteng Province w as able to provide
comprehensive data on specialists by discipline. Thus, Gauteng data w ere used as the
basis for the specialist-staff ing model developed by the team. Aggregate information
was gathered from Vulindlela and Persal, from w hich data were obtained on health
professionals in post as of February 2006.
4.6 IHPF and Hospital Revitalisation Plan
To ensure that the MTS is consistent w ith other planning init iat ives w ithin the
Department, assumptions that w ere used in the planning model are the same as those
used in the Integrated Health Planning Framew ork and the Hospital Revitalisation Plan. The MTS plan is explicitly designed to be a component part of the IHPF, allow ing full
integration of planning for all levels of care.
4.7 National Tertiary Services Grant Review
Follow ing the recent review of the National Tertiary Services Grant, it w as decided that
decisions on any changes to the future allocation of funds for tertiary services should be
deferred until the MTS Plan had been completed. This w ill allow funding decisions to be
based upon a holistic strategy that accommodates future developments, and not simply
on historic activity levels.
4.8 Technical Consensus Development
A technical consensus has been built via the follow ing activities:

FINAL DOCUMENT
15
• Tw o rounds of consultative workshops with the MTS specialty groups during
2002 and 2003
• Detailed comment by and consultation w ith specialty groups on the Draft Strategic Framew ork document, and w ider consultation on the Strategic
Framew ork via the MTS w ebsite
• Tw o detailed briefings of provincial Heads of Health at PHRC in November 2003
and March 2004
• Tw o rounds of one-day workshops with provincial managers in each province to
consult and take feedback on drafts of the option appraisal and plan, in January -
February 2004 and April - May 2004
• National technical w orkshops with provincial managers on the Strategic Framew ork and MTS models in March 2003 and June 2004
The MTS Project Team is confident that this process is one of the most extensive
consultative planning exercises ever undertaken in the South African public health sector;
extensive improvements to the w ork have taken place follow ing every stage of the
consultation, highlighting the value of prioritising the consultative planning approach.
5. Key issues from the Strategic Framework
The Strategic Framew ork spells out in detail the challenges facing the tertiary hospital
sector, and the problems that must be resolved to ensure that the hospital system
becomes sustainable in the long term. In summary, the core policy problems, w hich must
be addressed, are the follow ing:
• Reducing geographical inequit ies in access to regional and tertiary hospital
services, w ithout destabilising services in established centres of excellence
• Recruitment and retention of health professionals w ith the appropriate training and expertise
• Achievement of a more appropriate balance betw een regional and tertiary hospital
services, and achieving a more integrated management of the referral system –
both to improve eff iciency and equity
• Ensuring that those services w hich are to be offered w ill be adequately and
sustainably funded, and to overcome the negative effects of current under-funding

FINAL DOCUMENT
16
6. Guiding Principles
In developing a plan to guide the future development and reconfiguration of public
referral hospitals in South Africa, the MTS Project Team has developed a set of
principles and values to guide the exercise. These principles have been distilled from
existing policy, from legislative and constitutional pr inciples, and from the stakeholder
consultation process. They are the follow ing:
1. Government must actively w ork to realise progressively the right of access of all South
Africans to appropriate, high-quality referral hospital care, given available resources.
Thus, preventable inequalit ies in access to care must, over time, be minimised or
eliminated.
2. Current centres of excellence in tertiary care must be preserved and not undermined
by change; thus, reduction of inequalit ies must explicit ly involve the strengthening and
development of services, and must not be a crude process of “redistribution”. Far
from promoting improved access to services, undermining existing tertiary centres is
likely to result in signif icant negative consequences for the functionality of district and
regional health services.
3. Ensuring equitable access to care does not alw ays require that services must be
evenly distributed in geographic terms (although, in terms of emergency care,
geographical distribution is an important factor). The key principle is that the health system should facilitate the health service user in accessing services, be that by local
provision or by the provision of transport to ensure that patients can travel safely to
distant treatment centres. Considerable strengthening of patient transport systems
must therefore underpin any development plan.
4. Any reconfiguration of services must ensure that service and care quality is of the
highest attainable level at all t imes given available resources.
5. Public referral hospitals must become the employer of choice for health professionals,
through comprehensive action on remuneration, w orking conditions, and development
of clear career paths.
6. Health professionals training, especially that of medical specialists must be more
closely linked to the requirements of the public health system, to allow the production
of personnel w ith the required skills.
7. Clinical equipment and physical infrastructure must be modern, fully functional,
adequately maintained and replaced on a regular basis, to avoid the problems of
obsolescence and break dow n which are too prevalent at present. A particular focus
must be placed on expanded investment in appropriate and up-to-date diagnostic

FINAL DOCUMENT
17
radiology equipment, as current deficits in this specialty hamper activity across a w ide
range of services.
8. Services must be adequately and sustainably funded.
9. Service delivery must be eff icient, effective, and w ell managed, offering value for
money in the use of public funds. Management and funding arrangements must
support and promote the smooth operation of an integrated referral system, and not
reinforce divisions between levels of care or across provincial boundaries.
10. Reconfiguration of tertiary hospital services cannot be considered in isolation from the
adequacy of regional hospital services; requirements for strengthening of regional
hospitals w ill therefore be an integral part of the plan.

FINAL DOCUMENT
18
7. The Modernisation of Tertiary Services Planning Model
Currently, tertiary hospital services (and, indeed, regional hospital services) are very
disparate in nature; and in only a few hospitals is a fully comprehensive range of
services offered. Certain hospitals currently funded by the NTSG provide only a handful
of genuinely specialised services, with the vast bulk of their activity clearly being that of
regional hospital specialties. By contrast, the largest central hospitals provide most
specialty and sub-specialty services. A key output of the stakeholder consultation
process was the generation of a consensus view on a comprehensive package of
specialties and services to be provided in different types of tertiary (or referral) hospitals.
Appendix A presents the products of this effort (based on “Model C” as developed in the
MTS Strategic Framew ork). It outlines in detail the services to be provided at four
different levels of the hospital system, namely:
Regional Hospitals Services - services to be provided at every Regional hospital
“Developing” Tertiary Hospital Services - a limited set of supra-regional services, to
be developed at a hospital en route to offering “Fully Developed” Tertiary services (see
next point)
Fully Developed Tertiary Hospital Services (“Tertiary 1”)– a full set of supra-regional
services to be provided at each referral hospital serving a network of regional hospitals,
centred around a strong core of specialists in the main specialties. A key element of this level w ill be the provision of specialised 24-hour specialist-led trauma services to support
regional hospitals.
National Referral Hospital Services (“Tertiary 2”) – a set of very specialised, supra-
provincial services, which would be provided at a small number of sites nationw ide
(w hich would be added “on top” of Tertiary Hospital Services at a handful of hospitals)
Central Referral Units (“Tertiary 3”) – super-specialised national referral units to be
provided at one or perhaps tw o locations nationally
The diagram below shows the relationships betw een these different levels of hospital
services, and the nature of the referral pathw ay from regional to tertiary hospital, and from
tertiary hospital to national referral service, and thence to central referral unit.

FINAL DOCUMENT
19
Central Referral Unit
Regional Hospitals Regional Hospitals
The MTS planning model is based directly on the organisation of services across these
levels as described in detail in Model C of the Strategic Framew ork (p34-37). Detailed
listings of the services available at each level are provided in Appendix A. The most
important features of the services to be provided at each level can be summarised as
follow s:
Regional Hospital Services – ensuring that every regional hospital provides a
specialist-led service (w ith at least one full-t ime specialist per discipline available on site
by 2009, and tw o by 2014) in each of the eight core specialties, namely Anaesthetics,
Radiology, Medicine, Surgery, Mental Health, Obstetrics & Gynaecology, Orthopaedic
Surgery, and Paediatric Medicine, in line w ith the Draft Regional Hospitals Package of Care6. The fundamental difference between the proposed model and the current
situation lies in the stipulation that each regional hospital must employ at least eight
specialists by 2009, and doubling this target to 16 by 2014 – w hen most regional
hospitals currently make do w ith less than half this number. Providing comprehensive
specialist-led services in these core specialties at all regional hospitals w ould profoundly
improve the capability and quality of care available at this level.
6 National Department of Health. “A regional hospital service package for South Africa: a draft proposal.” July 2002.
National Referral Services
Tertiary Hospital
National Referral Services
Tertiary Hospital Tertiary Hospital
Tertiary Hospital

FINAL DOCUMENT
20
Tertiary Hospital Services – providing a comprehensive set of specialist-led services to
a defined geographical catchment population (determined by transport access criteria,
and not by provincial borders). These include key referral specialties not available at
regional hospital level, such as ENT, Infectious Diseases, Ophthalmology, Paediatr ic
Surgery, Plastic & Reconstructive Surgery, Urology, and Vascular Surgery. Critically,
each Tertiary Hospital w ould act as the hub for the provision of specialised emergency
and trauma care w ithin its catchment area, providing a specialised Major Trauma
Centre, a full ICU service under the supervision of a specialist Intensivist (including
dedicated Paediatric ICU), and a dedicated Burns Unit. It w ould also house a
multidisciplinary Rehabilitation Centre, incorporating dedicated stroke care and spinal
injury beds. Existing “central” hospitals generally provide most of the required Tertiary
Hospital services already (but not fully comprehensively), although most w ould require
signif icant equipment upgrading.
At a number of hospitals, it w ill clearly take several years of sustained investment to
develop the full range of Tertiary Hospital Services. Therefore, an interim target has
also been developed. Various hospitals w ill be designated as “Developing Tertiary Hospitals”. They w ould expand their services to offer the scope of service outlined in
Appendix A page 2 (“Developing Tertiary Hospital Services”) by 2009/10. During this
period, a number of smaller specialt ies w ould be provided by outreach from the parent National Referral Hospital, until such time as local services and staff w ere in place. The
modelling exercise explicitly awards additional resources to the relevant National
Referral Hospitals to provide this support. By 2014/15, the f irst wave of “Developing
Tertiary” hospitals w ould have expanded further to offer the scope of service set out in
Appendix A page 3 (“Fully Developed Tertiary Hospital Services”). The existing central
hospitals – w hich currently offer a much more comprehensive set of services – w ould all
qualify for “Fully Developed” status by 1009/10. While it is envisaged that each province
should possess at least one “developing” or “fully developed tertiary hospital, it is
important to note that most of these hospitals w ill of necessity treat patients from more
than one province, in order to ensure that population drive-time access targets are met.
National Referral Hospital Services – a set of sub-specialty or highly specialised,
purely referral services, taking referrals from a netw ork of Tertiary hospitals (including
the Tertiary Hospital at w hich they are located), and generally serving a population
draw n from more than one province. Sub-specialty services provided at this level w ould
include Cardiology and Cardiothoracic Surgery, Neurology and Neurosurgery, Oncology
(medical, radiation and surgical), Nuclear Medicine, Renal Transplant, and a range of

FINAL DOCUMENT
21
Paediatric sub-specialties. The impact on patient travel costs of providing a greater or
smaller number of centres providing this level of service is explicitly modelled.
Central Referral Units – the ult imate t ip of the referral chain, providing access at one or
tw o locations nationally to extremely specialised and expensive services (e.g. heart and
lung transplant, bone marrow transplant, liver transplant, PET scan, cochlear implant
etc.).
The modelling that follow s uses this categorisation of desired referral hospital services
as the building blocks to develop a plan for the future configuration of regional and
tertiary and regional hospitals (see Appendix A). Further, it is assumed that - w here
provided - National Referral Hospital Services w ill alw ays be co-located with Tertiary
Hospital Services (in order to reduce duplication of essential services). Similarly, it is
assumed that Central Referral Units w ill alw ays be “bolted on” to National Referral
Hospital Services.
8. Components and Methods used in the Planning Model
The foundation of the MTS Planning Model is a database of the most recent nationally
available information on activity, staff ing and expenditure levels of each hospital
currently designated as either a regional hospital or a National Tertiary Services Grant
hospital. Other levels of hospital (i.e. district and specialised hospitals) have been
excluded from the analysis. The model allow s for each hospital to be re-categorised by
the user into one of the four MTS categories described above. The Travel and Referral
Analysis model w as used to construct baseline catchment populations (excluding
estimated members of medical schemes) for each hospital. Drive time polygons w ere
constructed for each hospital (w ith a drive time of one hour for regional, tw o hours for
tertiary, and four hours for national referral services). The TRA allows calculation of the
population in areas of overlap between drive time polygons (essential in urban areas,
where hospitals may be relatively close together). Thiessen polygons then map out the
boundary of equidistant points betw een hospitals of a given level of care; the population
within a given hospital’s Thiessen polygon is therefore closer to that hospital than to any
other. The catchment population for a given hospital thus comprises all persons in that
hospital’s dr ive time polygon (truncated w here it meets another hospital’s drive t ime
polygon), plus the population of the Thiessen polygon w ho fall outside the drive time
polygon. This method therefore assigns the entire population of the country to a hospital
catchment area, w hile giving due w eight to drive time and ease of road access.
Admission rates (strictly defined as “patient separations”, rather than admissions) and

FINAL DOCUMENT
22
outpatient rates per 1000 population for each specialty and service (as per the MTS
categorisation of services) w ere then calculated for each hospital’s activity level and
catchment population, using Census 2001 population data. This allow ed an analysis of
current geographic variations in access to referral hospital services, from w hich
benchmarks can be set to improve access in underserved areas. An analysis of current
productivity (average length of stay by specialty and day case) was also undertaken, to
provide best practice benchmarks for these tw o variables, based on current best practice
(see Appendix B for details of all assumptions used).
The MTS Planning Model then projects likely population grow th to 2009/10 and 2014/15;
calculates the total estimated number of inpatient separations and outpatient visits in
2009/10 by level of care, based upon extrapolation of current activity levels or user-
defined activity benchmarks per 1000 population; allows the user to define different
configurations of hospitals by choosing the future level of care of each hospital; allocates
this activity across all hospitals (given their proposed level of care), based on their
catchment population; and calculates the number of inpatient admissions, day cases and
bed days, based on user-defined productivity benchmarks (average length of stay, day
case rate and bed occupancy). The model assigns activity based on w hichever is the
higher activity rate: that hospital’s current activity per 1000 population, or the current
national 33rd percentile activity rate (in 2009/10), or the national median activity rate (in 2014/15). Thus, hospitals w ith high activity rates at present are not penalised, w hile
those w ith low rates see their activity increased; in this way, the equity gap in access to
services is reduced by “pulling up the bottom performers”, rather than by pulling dow n
top performers. The model explicit ly allocates addit ional w orkload and outreach
responsibilit ies to w ell-established centres to cover the development period w hile
services are built up in under-served areas. Thus, a proportion of activities at
“Developing Tertiary” hospitals are explicitly assigned to that hospital’s parent National
Referral Hospital.
Having allocated projected future w orkload; the model then combines a number of
productivity and sustainability improvements (see below for details) to adjust current
costs per specialty. Details of the validation testing of the MTS cost model are provided
at Appendix C. The model then generates the resource requirements in 2009/10 for
each regional and tertiary hospital, by level of care and by province, specif ically:
• Total costs per specialty, level of care and hospital
• Total number of beds required

FINAL DOCUMENT
23
• Total number of health professionals required (with a special focus on medical
specialists)
• The capital costs of upgrading facilities and equipment and dow ngrading or dow nsizing hospitals as required by the particular scenario
The TRA model is then used to assess the cost of transporting the estimated number of
referrals generated by each hospital to its “parent” facility (e.g. from a regional hospital
to a Tertiary Hospital). The TRA uses a comprehensive database of the South African
road netw ork to establish the shortest (in terms of time) road distance betw een facilities,
and then calculates the cost per trip for the number of patients estimated to require
referral.
An option appraisal w as undertaken7 to assess w hich of three scenarios offered the
most cost-effective configuration of services to achieve a specif ied and equitable level of
access to regional and tertiary hospital services for the w hole population. This option
appraisal assessed access, feasibility, eff iciency and Net Present Value of lifetime costs,
and concluded that an optimal balance betw een eff icient operation and population
access to tertiary care could be achieved w ith seventeen tertiary hospitals distributed
across the country. Providing few er tertiary hospitals w ould deprive large segments of
the population of timely access to tertiary emergency care, while providing more
hospitals w ould result in a number of very small hospitals, w hose clinical and economic
viability w ould be questionable. The plan as described below is based on the “preferred
option” as identif ied by the option appraisal, w ith some minor modif ications follow ing the
f inal round of provincial consultations.
9. Key Assumptions
A detailed description of all assumptions used in the model and relevant sources is
provided in Appendix B. This section briefly summarises some of the more important
assumptions of w hich readers should be aw are.
• Productivity improvements – the model assumes that, by 2009/10, all regional and tertiary hospitals are able to achieve the current performance of the best 33% of
hospitals in each specialty in average length of stay and day case rate, and that of
the current best 25% for 2014. The rationale for this choice is the fact that these
7 Modernisation of Tertiary Services Project. “Options for the efficient and equitable development of tertiary hospital services.” March 2004.

FINAL DOCUMENT
24
levels of performance are undeniably achievable in the South African setting, as
they are already being met by certain public hospitals.
• Drug expenditure – across the board, it has been assumed that drug expenditure
will need to rise by 25% by 2009/10 in order to provide uninterrupted access to
cost-effective drugs, and to ensure adequate funding for ongoing treatment of
chronic conditions. Where specialty groups identif ied specif ic new drugs which w ill
need to be accommodated in the next few years, further adjustments have been
made to the cost model (e.g. in the case of Xigris for infection control in intensive
care patients, statins in cardiology etc. - see Appendix B for details)
• Radiology – the model allocates signif icant funding for replacement and addit ional equipment for diagnostic radiology at all levels, as this w as regarded as a key
priority by a majority of the specialty group reports
• Radiotherapy – previous work (e.g. the “Review of Highly Specialised Services”)
has highlighted the par lous age and condit ion of the equipment stock in
radiooncology. Specif ic provision has therefore been made for a comprehensive
renew al and replacement programme in this specialty at each National Referral
Hospital
• Buildings and Equipment – the cost model allocates increased expenditure to reflect sustainable long-term requirements for expenditure on maintenance and
replacement (in line w ith the Integrated Health Planning Framew ork and Strategic
Health Facilities Transformation Model)
• Capital costs – the model allocates funding for upgrading / expansion of hospitals
where required at the full cost per bed of a new -build project plus equipment costs;
and for dow n-sizing and dow n-grading (at 12.5% of the cost per bed of a new-build
project) to cover conversion or decommissioning costs. A limited number of new
build projects (to build regional hospitals w here none currently exist, and to replace
a small number of tertiary and regional hospitals) have been costed, follow ing
extensive consultation w ith provinces
• Economies of scale in hospital operation are exhausted once hospitals exceed
approximately 600 beds – thus, in terms of unit costs, there is no evidence of any
cost advantage in operating a 2000 bed hospital versus an 800 bed hospital (and
there may in fact be diseconomies of scale for very large hospitals)8 9
8 Centre for Reviews and Dissemination. Effective Health Care Bulletin: Hospital volume and health care outcomes, costs and patient access. Nuffield Institute for Health, University of Leeds, and NHS Centre for Reviews and Dissemination, University of York 1996. 9 Zere E, McIntyre D, Addison T. Technical efficiency and productivity of public sector hospitals in three South African provinces. Paper submitted to South African Journal of Economics.

FINAL DOCUMENT
25
• Level of Care - “Fully Developed” tertiary hospitals are “twinned” with a nearby
large regional hospital, to operate as a complex – for example, the New Pretoria
Academic Hospital and Kalafong Hospital are tw inned in this fashion; similarly,
Chris Hani Baragw anath w ill be completely redeveloped into tw o entirely new
hospitals, one regional and one tert iary. In general, regional hospital (“level tw o”)
workload and trauma w orkload w ill be undertaken at the regional tw in, and more
highly specialised activity at the tertiary tw in (but w ith local f lexibility on the precise
arrangements). By contrast, the model explicit ly assumes that a proportion of
activity in general specialties in a “Developing Tertiary” hospital is, in effect,
regional or “Level 2” activity (see Appendix B for details). Thus a “Developing Tertiary” Hospital is explicitly allocated a regional hospital catchment population in
the analysis (w hich w ill be signif icantly smaller than its tertiary catchment
population), in addit ion to the catchment populations w hich relate to the higher
level services offered by that hospital. This decision reflects the fact that most
“Developing Tertiary” hospitals were originally regional hospitals, and tend to be
located in smaller cities w here it would not be eff icient to offer a separate regional
hospital. If a Tertiary hospital is dow ngraded to regional hospital status, the model
splits its activity betw een regional and tertiary levels on the same basis, w ith
tertiary w orkload reallocated to the remaining tertiary hospitals. How ever, the
model also explicitly assumes that there is no place for Level 1 or District Hospital
activity in a tertiary hospital; w ork is ongoing w ith individual provinces to cost the
requirements for a district hospital to be collocated w ith “Developing Tertiary”
hospitals w here none currently exists.
• Referral Rates – the model assumes that 20% of inpatients and outpatients at
each level of care are likely to require referral to a higher level10
• Staff ing Requirements – the model calculates staff ing levels based on current
Gauteng specialist, registrar and medical off icer to w orkload ratios, given the
activity levels generated by the model. These rates are compared w ith the minimum staff complement per unit / discipline (as developed by specialty groups),
and the model selects w hichever is the higher.
• Staff Remuneration – the model provides for increased real salaries for health
professionals and other staff, given the importance of remuneration issues in the
stakeholder consultation and recent policy developments. A 3% real average
10 Centre for Health Systems Research & Development / Health Care Management Programme. “Asse ssment of current health care referral systems in the RSA: a study of the current referral patterns, including the views and experiences of users and providers of health services”. University of the Free State, September 2000.

FINAL DOCUMENT
26
annual increase (equivalent to 16% total increase by 2009, and 34% by 2014) has
been assumed for health professionals and a 2% real increase for other staff. It is
the view of the MTS Project Team that these real increases should be carefully
targeted tow ards particular skills deficits.
Readers should also note that certain hospitals in close geographical proximity to each
other and w hich have integrated services have been grouped together as one location
for ease of use within the TRA model. Such groupings include hospitals w hich already
operate as complexes i.e. Pietersburg and Mankw eng hospitals, Klerksdorp and
Tshepong etc. Johannesburg and Helen Joseph / Coronation Hospitals are treated in
this w ay, as are Groote Schuur and Red Cross Hospitals, in both cases due to proximity
and service links. Grouping these hospitals avoids the creation of artif icial and
misleading catchment populations around individual component hospitals. This should
in no w ay be interpreted as implying that the future plan requires the actual
centralisation of these hospitals onto a single site. The development of the plan
explicitly takes into account existing provincial plans as far as possible, follow ing
examination of provincial SPS documents and discussion w ith provincial managers.
10. Limitations of the Model
Data limitations of potential signif icance include the follow ing. First, hospital Minimum
Data Set activity data are still only available for the year 2001, due to incomplete submission of data by certain provinces. Second, data on referral rates remain largely
absent in South Africa; the University of Free State study cited above remains the only
signif icant source of data in this area, but the highest level of care on w hich it collects
information w as the regional hospital. Third, data are currently available on the
distribution of specialists in the public sector by province and hospital by specialty or
sub-specialty only for Gauteng and Free State provinces. It is thus currently not
possible to compare the national requirements for specialists by discipline generated by
the model w ith current baseline data.
This exercise has deliberately excluded consideration of district hospitals and primary
health care services, on the basis that their inclusion w ould have become
unmanageable. How ever, the Integrated Health Planning Framew ork provides
estimates of provision and funding requirements for these levels of care on a province-
by-province basis, allow ing a comprehensive estimate of health service funding needs.

FINAL DOCUMENT
27
11. Current Situation
In developing the model and scenarios, an analysis w as undertaken of those hospitals
currently in receipt of the National Tertiary Services Grant. It identif ied that several
hospitals receive NTSG funding, yet provide only a very limited range (less than 15%) of
the service basket, w hich comprises the NTSG. Hence, these hospitals cannot currently
be view ed as tertiary hospitals, and are effectively regional hospitals w hich offer a
limited number of more specialised services; their local populations cannot realistically
be said to be able to access tertiary services at these hospitals. Hospitals in this
category were Cecilia Makiw ane (Eastern Cape), both Rob Ferreira and Witbank (Mpumalanga), and Rustenburg (North West). These hospitals have therefore been
counted as “regional” hospitals in the baseline analysis (although Rob Ferreira is
explicitly targeted for development as a tertiary centre in the plan).
Table 1: Current Tertiary hospitals Province Hospital Eastern Cape Frere Port Elizabeth Umtata Free State Universitas Gauteng Chris Hani Baragwanath George Mukhari (formerly Ga-Rankuwa) Johannesburg & Helen Joseph Pretoria Academic KwaZulu Natal Durban Complex Grey's Limpopo Polokwane / Mankweng Mpumalanga Nil Northern Cape Kimberley North West Klerksdorp / Potchefstroom Western Cape Groote Schuur & Red Cross Tygerberg
Details of current activities by level of care are provided in Appendix I and in the text
below . In summary, total activity in 2001 by level of care was as follows:

FINAL DOCUMENT
28
Table 2: 2005 Baseline Activity
Regional Hospitals Tertiary hospitals Inpatient Separations & Day Cases
1,133,666
1,119,685
Outpatient Visits
4,880,377
5,708,967
The TRA suite developed for the MTS process allows analysis of the number and
proportion of the South African population living w ithin a given drive time of different
types of health facilities. This analysis has been undertaken at baseline, and for each
of the future scenarios. At present, as Table 3 show s, 80% of the South African
population live w ithin 60 minutes’ dr ive of a regional hospital; 81% of the population lives
within 120 minutes’ drive of one of the tertiary hospitals listed in Table 1.
Table 3: Population Access to Public Hospitals
Province Regional * Tertiary ** Eastern Cape 60% 85%Free Sate 86% 80%Gauteng 100.0% 100%Kw aZulu Natal 78% 73%Limpopo 72% 77%Mpumalanga 80% 54%Northern Cape 35% 47%North West 75% 83%Western Cape 89% 86%South Africa 80% 81%
* Regional: w ithin 60 minutes’ drive ** Tertiary: w ithin 120 minutes’ drive
Not surprisingly, given its dense and urban population, small area and large hospital base,
100% of Gauteng residents have adequate access to regional and tertiary hospitals. At
the opposite extreme, due to its huge area and sparse population, Northern Cape has the
low est levels of population access to referral hospital services. It is also important to note
that the absence of effective tertiary hospital services in Nelspruit mean that nearly half of
the Mpumalanga population (those living in the eastern half of the province) do not have 2-
hour access to a tertiary centre.
Current inequities in access to referral hospital care are further highlighted by Table 4,
which presents current (2005/06) inpatient and day case separations per 1000 population
for the total catchment populations of hospitals by province. These catchments are not
identical to provincial populations, as they frequently cross provincial boundaries; if
anything, the f igures in Table 4 tend to understate the degree of inequity between

FINAL DOCUMENT
29
provinces, as all inhabitants of a catchment area are equally likely to access hospital care
(w hen, in fact, urban residents living nearer to hospitals are more likely to access care
than rural residents living further aw ay). Nonetheless, the table show s a greater than
three-fold difference between the province w ith the low est referral hospital utilisation rate
(Limpopo) and that w ith the highest (Gauteng).
Table 4: Inpatient & Day Case Separations per 1000 Catchment Population
Province Regional Tertiary Combined Eastern Cape 10 17 27Free State 19 46 65Gauteng 42 31 73Kw aZulu Natal 53 15 68Limpopo 18 6 24Mpumalanga 25 25Northern Cape 67 67North West 9 36 45Western Cape 34 40 73South Africa 31 25 56Ratio of Maximum to Minimum 5.9 11.3 3.4

FINAL DOCUMENT
30
Actual expenditure for 2005/06 on regional and tertiary hospitals, is show n in Table 5a.
This is compared w ith 2005/06 budgets for the programmes “Provincial Hospitals” and
“Central Hospitals” in Table 5b. The MTS categories of “regional” and “tertiary” are not
directly analogous to “provincial” and “central” hospitals in the programme budget
structure. This is because several hospitals, w hich already receive signif icant NTSG
funding (e.g. Frere, Port Elizabeth, Umtata, Polokw ane / Mankw eng) are counted as
“provincial” hospitals under the current programme structure. How ever, the total amount
displays a very close f it (1.1% variance).
Table 5a: Actual Expenditure, 2005/2006
(‘000s of Rands) Total Expenditure Regional Hospitals
7,659,904
Tertiary
8,810,189
Combined Total
16,470,093
Table 5b: Budgets, 2005/06
(‘000s of Rands) Total Expenditure Provincial Hospitals
8,504,760
Central Hospitals
9,539,312
Combined Total
17,044,072
Before considering the funding requirements of the future plan, an analysis of current
funding and activity levels w as undertaken using the cost model. This analysis stripped
out the large pay increases for health professionals that are assumed for health
professionals under the future scenarios. It concentrated simply on assessing, at current
activity levels, w hat level of funding w ould be required to provide current services
sustainably (i.e. w ith suff icient expenditure on drugs, consumables, equipment and
maintenance to ensure that services do not deteriorate). The results of this analysis are
reproduced below :

FINAL DOCUMENT
31
Table 6: Current Under-funding of Hospital Services
(‘000s of Rands)
Actual Expenditure
Sustainable Level of Expenditure
Funding Deficit
Regional
7,659,904
10,589,181
38%
Tertiary
8,810,189
11,881,463 35%
Combined
16,470,093
22,470,644 36%
As Table 6 clearly show s, it w ould appear that both regional and tertiary hospitals are
presently signif icantly under-funded for the mission they have been assigned and the
levels of demand w ith w hich they must cope – even before any consideration is given to
future needs. Overall, the public referral hospital system appears to receive only about
three-quarters of the funding it currently needs to provide services of adequate quality
and to avoid the deterioration of infrastructure and equipment. This brief analysis of
baseline data therefore underlines the critical importance of several of the key principles of the MTS process, namely those relating to the need to improve access to care and to
ensure that services are adequately and sustainably funded.
12. The Planned Future Configuration of Services
Tertiary hospitals
As described above, the Option Appraisal identif ied a preferred option for the overall
configuration of tertiary hospital services. One further change was made to this
preferred option follow ing the f inal round of provincial consultation, and as a result of
further analysis. This w as to remove Bongani (Goldfields) Hospital in the Free State as
a candidate for “Developing Tertiary” status, and to replace it w ith Ngw elezana Hospital
in Kw aZulu Natal. The MTS Project Team is satisf ied that upgrading Ngw elezana
Hospital w ould have a signif icantly greater impact on population access than would be
the case in Bongani (Goldfields). Tables 7 and 8 below therefore spell out the planned
configuration of tertiary and regional hospitals in 2009 and 2014 respectively.

FINAL DOCUMENT
32
Table 7: Tertiary hospitals, 2009 Province Hospital Developing
Tertiary Hospital Services
Fully Developed
Tertiary Hospital Services
National Referral Services
Central Referral
Unit
E. Cape Port Elizabeth Yes - - - Frere Yes - - - Umtata Yes - - - Free State Universitas - Yes Yes Gauteng Chris Hani Bara - Yes - - George Mukhari - Yes - - Johannesburg - Yes Yes Yes New Pretoria Academic - Yes Yes - KZN Inkosi Albert Luthuli - Yes Yes - Greys - Yes - - Ngwelezana Yes - - - Limpopo Polokwane/ Mankweng Yes - Yes - Mpumalanga Rob Ferreira Yes - - - N. Cape Kimberley Yes - - - North West Klerksdorp Yes - - - W.Cape Groote Schuur &
Red Cross - Yes Yes Yes
Tygerberg - Yes - - Total 7 10 6 2
Table 8: Tertiary hospitals, 2014
Province Hospital Fully Developed Tertiary Hospital Services
National Referral Services
Central Referral
Unit
E. Cape Port Elizabeth Yes - - Frere Yes - - Umtata Yes - - Free State Universitas Yes Yes Gauteng Chris Hani Bara Yes - - George Mukhari Yes - - Johannesburg Yes Yes Yes New Pretoria Academic Yes Yes - KZN Inkosi Albert Luthuli Yes Yes - Greys Yes - - Ngwelezana Yes - - Limpopo Polokwane/Mankweng Yes Yes - Mpumalanga Rob Ferreira Yes - - N. Cape Kimberley Yes - - North West Klerksdorp Yes - - W.Cape Groote Schuur &
Red Cross Yes Yes Yes
Tygerberg Yes - - Total 17 6 2

FINAL DOCUMENT
33
As can be seen from Table 7, the plan envisages building up a core of developing
tertiary hospitals in the under-served regions (Port Elizabeth, Frere, Umtata, Kimberley,
Klerksdorp, Ngw elezana, Rob Ferreira, Polokw ane), w hile retaining tertiary services at
the w ell-established centres. How ever, there would be some consolidation of National
Referral Services, which would be removed from Tygerberg, Chris Hani Bargaw anath
and George Mukhari hospitals and centralised at Johannesburg, Pretor ia and Groote
Schuur / Red Cross. National Referral Services w ill continue to be developed at
Polokw ane Hospital, building on progress to date (and providing a platform for
MEDUNSA to offer a full range of training opportunit ies in Polokw ane, rather than the
more restricted range of specialties to be offered at George Mukhari). It should be noted
that in specif ic cases w here f ixed plant and equipment makes such a consolidation
inappropriate (e.g. the superior radiotherapy facilities at Tygerberg), there w ould clearly
be room for f lexibility at local level; how ever, the general pr inciple is clearly to reduce
local duplication of high level national referral services.
Four tertiary hospitals w ould be completely rebuilt as new build projects: Rob Ferreira in
Nelspruit, Kimberley Hospital, Chris Hani Baragw anath Hospital in Sow eto and
Tygerberg Hospital in Cape Tow n. In the case of both Chris Hani and Tygerberg
Hospitals, a new , smaller scale modern tertiary hospital w ould be built alongside a new
regional hospital, allow ing more cost-effective management of caseload.
It is assumed that all Tert iary hospitals w ill, by 2009, achieve the current 33rd percentile
activity rate per 1000 population, w here this rate exceeds their current actual activity
rate. This approach allow s well-established centres to continue at current activity rates
per 1000 population, w hile pulling “Developing Tertiary” centres upwards from their
current low levels tow ards a relatively modest target, which will nonetheless lead to a
signif icant reduction in geographical variation in activity rates.
Regional Hospitals
An explicit objective of expanding population access to regional hospital services is
pursued by assuming that all regional hospitals w ill, by 2009, achieve at least the current
median admission rate (i.e. the admission rate achieved by the top 50% of hospitals), if
this is not already exceeded. The same holds for outpatient visits per 1000 population.
This objective reflects the follow ing considerations:

FINAL DOCUMENT
34
• The need to reflect the grow ing burden of disease from the triple epidemic of
HIV/AIDS and TB, trauma and violence, and non-communicable diseases, most
of which w ill manifest itself at regional hospital level.
• A limited shift of activity out of tertiary hospitals and into the regional level
• The need to reduce geographical inequities in access to regional hospital care,
as far as possible through expanding access in under-served areas, rather than
by reducing access in w ell-served areas
• A reflection of the fact that signif icant strengthening of the number of specialists
employed in regional hospitals and of the general capability of this level of care
will itself induce increased demand for services
This assumption means that regional hospital activity effectively grows faster than
tertiary activity, and reflects a deliberate policy decision to attempt to reduce inequities
and improve care quality rapidly at this level of care. In addition to general
strengthening of services, several regional hospitals w ill be completely rebuilt: Cecilia
Makiw ane in the Eastern Cape, and King Edw ard VIII, Edendale and Prince Mshiyeni in
Kw aZulu Natal. Completely new regional hospitals w ill be built in Upington and De Aar
(Northern Cape), and Vryburg (North West). As noted, “tw in” regional hospitals w ill be
built alongside reduced tertiary units as part of the total redevelopment of Chris Hani Baragw anath and Tygerberg Hospitals.
13. Projected Future Workload and Capacity
Projected Workload
As described earlier, the model allows a projection of estimated w orkload by level of
care, given factors such as population grow th, improvements in the balance of care
betw een regional and tertiary level, and efforts to improve service access in currently
under-served areas. Table 9 show s aggregate inpatient and day case w orkload over the
plan period.
Table 9: Inpatient & Day Case Separations
Regional Tertiary 1 National Referral
Central Units
Total Tertiary
Combined Total
Baseline 1,133,666 642,118 428,865 48,702 1,028,689 2,253,351Plan 2009 1,592,237 580,672 101,347 13,950 695,969 2,288,206Plan 2014 1,929,114 791,364 102,132 13,702 907,199 2,836,313

FINAL DOCUMENT
35
Betw een 2005 and 2009, a signif icant shift of workload w ould occur between Tertiary
and Regional levels. Thereafter, regional w orkload w ould continue to increase, but due
mainly to improving utilisation levels in under-served areas. Tertiary activity would
increase somew hat, as the “Developing Tertiary” hospitals achieve their full potential to
improve access in under-served areas. Tables 10 and 11 break dow n this activity by
province for regional and tertiary levels.
Table 10: Regional Hospital Inpatient & Day Case Separations
Province Baseline 2009 2014 Eastern Cape 74,053 138,750 172,157Free State 40,691 90,753 112,619Gauteng 368,986 466,382 533,862Kw aZulu Natal 363,764 413,661 509,680Limpopo 75,474 127,232 165,706Mpumalanga 61,907 67,180 86,659Northern Cape 0 13,203 17,436North West 14,980 79,999 104,622Western Cape 133,811 195,077 226,372South Africa 1,133,666 1,592,237 1,929,114
Table 11: Tertiary Hospital Inpatient & Day Case Separations
Province Baseline 2009 2014 Eastern Cape 168,719 97,286 143,189Free State 81,318 26,940 31,499Gauteng 311,845 221,345 769,182Kw aZulu Natal 116,251 109,037 676,971Limpopo 36,453 58,652 260,628Mpumalanga 31,815 23,127 131,265Northern Cape 49,614 22,578 50,045North West 88,159 54,041 166,907Western Cape 235,511 82,962 321,850South Africa 1,119,685 695,969 2,836,313
The rebalancing of activity betw een tertiary and regional levels is particular ly noticeable in
Gauteng and Western Cape, w here “tertiary” hospitals have traditionally treated a large
proportion of their regional w orkload. How ever, some of this change also reflects
expanding capacity in neighbouring provinces (e.g. Eastern Cape), and a reduced reliance
on traditional tertiary centres.
The overall increase in inpatient activity described above w ould take place against a
small overall reduction in outpatient activity, as show n in Table 12 below . This is the
result of the parallel strengthening of district health systems over the plan period, w hich
would enable a signif icant proportion of current non-referred “walk in” patients to be

FINAL DOCUMENT
36
more appropriately treated in pr imary health care and district hospitals, for the minor
ailments w ith w hich they typically present at both regional and tertiary hospital OPDs.
Table 12: Outpatient Visits
Regional Tertiary 1 National Referral Central Units Total Tert iary
Combined Total
Baseline 4,880,377 2,924,761 2,596,451 187,755 5,708,967 10,589,344Plan 2009 3,639,497 4,027,144 1,432,869 149,779 5609,792 9,249,289Plan 2014 3,881,487 5,185,719 1,527,938 156,379 6,870,036 10,751,524
14. Key Resources Required
Increasing inpatient activity loads w ill be accommodated in a rather smaller bed stock,
due to improved length of stay, bed occupancy and increased day case treatment rates.
Signif icant investment has been identif ied to support the measures required to improve
bed productivity, including use of patient hotels, construction of dedicated day surgery
units at regional and tertiary hospitals, and strengthening of patient transport systems to
facilitate scheduling and discharge planning. Table 13 describes the aggregate beds
required to manage the projected w orkload. Table 14 show s regional beds per province,
while Table 15 shows tertiary beds per province and institution.
Table 13: Total Bed Numbers
Regional Tertiary 1 National Referral
Central Units
Total Tertiary
Combined Total
Baseline 17,713 10,993 2,842 2,253 16,088 33,807Plan 2009 19,324 5,270 2,410 1,494 9,173 28,497Plan 2014 19,722 7,964 1,067 171 9,203 28,925
Table 14: Regional Hospital Beds by Province
Province Baseline 2009 2014 Eastern Cape 1,431 1,711 1,788Free State 767 1,128 1,167Gauteng 5,020 5,416 5,262Kw aZulu Natal 6,361 5,130 5,271Limpopo 931 1,557 1,707Mpumalanga 1,331 826 894Northern Cape 0 161 180North West 381 974 1,077Western Cape 1,509 2,421 2,376South Africa 17,713 19,324 19,722

FINAL DOCUMENT
37
Table 15 clearly shows the scale of restructuring required at some of the largest tertiary
hospitals, as large portions of w orkload are shifted to “tw inned” regional hospitals,
leaving a smaller, leaner and more technologically concentrated tertiary hospital to focus
on a more complex case-mix. It is clear that, by 2014, “tw in” regional hospitals should
also be under development at Umtata and Polokw ane, to avoid these hospitals
becoming excessively large. The Polokw ane / Mankw eng complex already offers this
potential.
* Table 15a: Tertiary hospitals and Bed Requirements, 2009
Province Hospital Baseline Tertiary 1 National Referral
Central Units Total
Eastern Cape Frere 0 382 382 Port Elizabeth 168 255 255 Umtata 978 594 594 Sub-total 1,146 1,231 0 0 1,231Free State Universitas 437 165 231 397 Sub-total 437 165 231 0 397Gauteng Chris Hani Bara Tertiary 2,531 1,112 1,112 George Mukhari 1,753 544 544 Johannesburg Tertiary 1,074 339 273 116 729 New Pretoria Academic 770 425 132 557 Sub-total 6,128 2,420 405 116 2,942Kw aZulu Natal Inkosi Albert Luthuli 1,135 265 414 679 Grey's 456 493 493 Ngw elezana 483 288 288 Sub-total 2,074 1,046 414 0 1,460Limpopo Polokw ane / Mankw eng 500 587 190 777 Sub-total 500 587 190 0 777Mpumalanga Rob Ferreira 308 286 286 Sub-total 308 286 0 0 286Northern Cape Kimberley 0 286 286 Sub-total 0 286 0 0 286North West Klerksdorp / Potchefstroom 815 543 543 Sub-total 815 543 0 0 543Western Cape Groote Schuur & Red Cross 1,179 385 324 56 765 Tygerberg Tertiary 0 486 486 Sub-total 1,179 871 324 56 1,251National Total 12,587 7,435 1,564 172 9,173
* A reduction in hospital beds can only be achieved if efficiency targets are improved

FINAL DOCUMENT
38
* Table 15b: Tertiary hospitals and Bed Requirements, 2014
Province Hospital Baseline Tertiary 1 National Referral
Central Units Total
Eastern Cape Frere 773 408 408 Port Elizabeth 168 333 333 Umtata 978 663 663 Sub-total 1,919 1,404 0 0 1,404Free State Universitas 437 171 148 319 Sub-total 437 171 148 0 319Gauteng Chris Hani Bara Tertiary 2,531 877 877 George Mukhari 1,753 555 555 Johannesburg Tertiary 1,074 214 184 113 511 New Pretoria Academic 770 364 89 452 Sub-total 6,128 2,010 273 113 2,395Kw aZulu Natal Inkosi Albert Luthuli 1,135 232 279 511 Grey's 456 674 674 Ngw elezana 483 463 463 Sub-total 2,074 1,369 279 0 1,648Limpopo Polokw ane / Mankw eng 500 804 128 932 Sub-total 500 804 128 0 932Mpumalanga Rob Ferreira 308 431 431 Sub-total 308 431 0 0 431Northern Cape Kimberley 0 423 423 Sub-total 0 423 0 0 423North West Klerksdorp / Potchefstroom 815 529 529 Sub-total 815 529 0 0 529Western Cape Groote Schuur & Red Cross 1,179 349 239 58 647 Tygerberg Tertiary 0 475 475 Sub-total 1,179 834 239 58 1,122National Total 13,360 7,975 1,067 171 9,203
* A reduction in hospital beds can only be achieved if efficiency targets are improved

FINAL DOCUMENT
Confidential – Draft for discussion
39
Central to the achievement of the quality and access improvements w hich form the core
objective of this plan is an expansion in the number of medical specialists in the public
health sector. Table 16 summarises the number of specialists required by the plan
(Appendix G provides a more detailed breakdow n of specialist numbers by discipline).
* Table 16: Public Sector Specialists per Province, 2014
Province Baseline* 2014 Eastern Cape 201 77Free State 393 94Gauteng 714 283KwaZulu Natal 1,051 261Limpopo 143 88Mpumalanga 60 50Northern Cape 29 16North West 43 57Western Cape 1,031 146South Africa 3,665 1,072
* Baseline includes any specialists working outside regional / tertiary hospitals
* Table exclude registrars
While a doubling of the number of specialists w orking in the public sector by 2014 may
seem a daunting target, it is important to remember that there are currently some 8,800
registered medical specialists in the country. Thus, achieving these targets w ill require
not only enhanced training efforts to produce more specialists, but also appropriate
incentives to attract personnel out of private practice – hence the strong emphasis
placed on improving remuneration.
15. Recurrent Funding Requirements
In order to achieve the developments described in the scenarios, and to place service
provision onto a fully sustainable basis (as described in Appendix B), very signif icant real
funding increases w ill be required. Table 17 summarises the aggregate hospital
operating costs by level of care in 2009 and 2014.

FINAL DOCUMENT
Confidential – Draft for discussion
40
Table 17: Hospital operating costs, 2009/10 and 2014/15
R Millions Regional Tertiary 1 National Referral Central Units
Total Tertiary
Combined Total
Baseline 7,659,904 4,055,316 2,896,852 1,858,020 8,810,189 16,470,093Plan 2009 10,589,181 6,835,252 4,691,283 354,927 11,881,463 22,470,644Plan 2014 12,960,097 8,763,130 4,687,47 386,676 13,837 26,797,379
(Millions of Rands, constant 2005/06 prices)
Table 17 show s that funding for both regional and hospitals w ill need to grow by nearly
65% in real terms by 2014 to accommodate w orkload increases and required quality
improvements (including the 25% increase w hich is already required to make good
current under-funding). Regional hospitals funding w ould need to grow by 69% over the
decade, w hile tertiary hospital funding w ould need to grow slightly less, by 35%. Table
18 shows regional hospital funding requirements for 2014 by province.
Table 18: Regional Hospital Funding Requirement
Province Baseline 2009 2014 Eastern Cape 588 871 1,081Free State 702 602 752Gauteng 1,886 3,042 3,591Kw aZulu Natal 2,798 2,518 3,226Limpopo 473 824 1,061Mpumalanga 499 440 556Northern Cape 0 81 107North West 273 482 630Western Cape 439 1,724 1,952South Africa 7,659 10,589 12,860
(Millions of Rands, constant 2004/05 prices)
Table 19: Tertiary Hospital Funding Requirement
Province Baseline 2009 2014 Eastern Cape 573 1,075 1,545Free State 525 882 880Gauteng 3,634 3,660 3,619Kw aZulu Natal 1,175 2,236 2,786Limpopo 493 1,094 1,481Mpumalanga 0 261 502Northern Cape 280 248 342North West 416 445 572Western Cape 1,711 1,975 2,107South Africa 8,810 11,881 13,837
(Millions of Rands, constant 2004/05 prices)

FINAL DOCUMENT
Confidential – Draft for discussion
41
Table 20: Combined Funding Requirement
Province Baseline 2009 2014 Eastern Cape 1,161 1,946 2,626Free State 1,227 1,484 1,632Gauteng 5,520 6,702 7,210Kw aZulu Natal 3,973 4,754 6,012Limpopo 966 1,918 2,542Mpumalanga 499 701 1,058Northern Cape 280 329 449North West 689 927 1,202Western Cape 2,150 33,699 4,059South Africa 16,469 22,470 26,697
(Millions of Rands, constant 2005/06 prices)
Table 21 decomposes the sources of the increased funding requirement, to show what
proportion of the additional funds needed are generated by each cost driver in the cost
model. Overall, half of the additional funding requirement is, in fact, generated by
workload - an increased workload in regional hospitals and the shift to a more complex
casemix in tertiary and regional hospitals. Not surprisingly, the improved staff
remuneration envisaged by the plan is the next most important cost driver.
Table 21: Contribution of Key Cost Drivers to Increased Funding Needs
Regional Tertiary Combined Cost Increase due to Workload Increases 53% 45% 49%Cost Reduction due to LOS Savings -9% -7% -8%Cost Increase due to Drugs 16% 17% 16%Cost Increase due to Sustainable Maintenance 6% 12% 9%Cost Increase due to Improved Remuneration 34% 33% 34%
A small but critical component of the overall system strengthening envisaged by the MTS process is the development of an eff icient and effective patient transport system.
This serves two key objectives: to improve patient access to referral services, by
reducing cost barriers; and to improve eff icient hospital operation, by facilitating
discharge planning and outpatient scheduling. The cost in 2014 of running an integrated
non-emergency patient transport system from regional hospital to tertiary hospital level is
show n in Table 22.

FINAL DOCUMENT
Confidential – Draft for discussion
42
Table 22: Patient transport costs, 2014 (Millions of Rands, Constant 2005 pr ices)
Regional Tertiary National Referral Combined Total 18,602,631 15,272,966 4,954,898 38,830,495
These transport costs are based on using contracted bus services, taking non-acute
patients from one hospital to its “parent” referral centre and back again. Acutely ill
patients w ould require ambulance transport, the costs of which are captured in parallel
work on Emergency Medical Services. These costs are clearly miniscule w hen view ed
in the context of overall running costs, yet w ould make a signif icant impact on improving
access and eff icient scheduling, admission and discharge planning for referral services.
The combined operating costs of hospitals plus patient transport w ould therefore be as
follow s in 2014.
Table 23: Total operating costs, 2014 (Millions of Rands, Constant 2005 prices)
Regional Tertiary National Referral Central Referral All Tertiary Combined Total 12,619 8,970 4,760 384 14,114 26,733
Clearly, the required funding levels involve very large increases relative to current
expenditure. To achieve the target levels of provision and quality improvement by 2009
would require annual average real funding increases of 8.5% between now and the end
of the decade (see Table 21). How ever, over the period to 2014, sustained real annual
average growth of 6% would be suff icient to yield these targets. These rates of growth
are substantial – yet a 6% annual real grow th target is in the same league as the current
rate of increase being given to the United Kingdom National Health Service to make
good past under-funding – a highly analogous situation.
Table 24: Real annual average funding growth required, 2004 to 2010
To 2009 To 2014 Regional 9.5% 6.6%Tertiary 7.7% 5.5%Combined 8.5% 6.0%
The scale of these increases is rather less daunting if they are view ed in terms of their
share of Gross Domestic Product. The GDP for the year 2005/06 was R 1,108 billion11.
Baseline expenditure on regional and tertiary and regional hospitals is therefore currently
some 1.4% of GDP. If relatively modest real GDP grow th rates are assumed over the
11 National Treasury. “Budget Review 2004”

FINAL DOCUMENT
Confidential – Draft for discussion
43
next ten years (4% and 6%), the plan’s funding requirement w ould represent only 1.4 to
1.5% of GDP in 2009, and 1.5% to 1.6% in 2014. Extensive international evidence
indicating that national health expenditure displays an unambiguously positive income
elasticity both across countries and over time12. These analyses consistently indicate
tw o important long-term trends in the evolution of health expenditure:
• In all developed countries, the share of total economic output (Gross Domestic
Product, or GDP) devoted to health has consistently risen as GDP rises – i.e. as
a country gets richer, it spends relatively more on health.
• That this relationship betw een health spending and GDP over time (and across countries at the same point in t ime) is, in fact, the most accurate long-term
predictor of health expenditure – w ith or w ithout adjustment for the specif ic
inf luences described above.
Estimates have been constructed of the magnitude of this long-term relationship
betw een GDP and health expenditure (the “income elasticity of demand” of health care
expenditure – summar ised in Getzen, 2000). Tw o studies of the United States have
indicated that, in the long run, every 1% increase in US GDP leads to a 1.6% increase in
health expenditure. Eight international studies, examining data for different periods from
1961 to 1987, indicated that, in other countries, a 1% long- term increase in GDP w as
associated w ith increases in health expenditure ranging betw een 1.2% and 1.4%.
Individual countries can make policy choices, w hich limit the operation of this
relationship betw een GDP and health expenditure for a period of time. Most notably, the
United Kingdom has consistently suppressed the rate of growth of health expenditure
over tw o decades, so that it now spends a substantially low er proportion of GDP on
health than its European neighbours w ith similar levels of economic development.
How ever, a massive programme of reinvestment and increased funding for the NHS has
just commenced, w ith the explicit aim of pumping public health expenditure up from
6.5% of GDP today to betw een 9.4 and 11% of GDP in tw enty years time. Set against
this context, aiming to increase the share of South African public hospital expenditure
from 1.1% of GDP to 1.5% of GDP over ten years seems rather less challenging.
12 Getzen T.E. Health care is an individual necessity and a national luxury: applying multi level decision models to the analysis of health care expenditures. Journal of Health Economics 2000; 19:259-270. Getzen T.E., Poullier J-P. International health spending forecasts: concepts and evaluation. Social Science and Medicine 1992; 34:1057-1068. Schieber G.J. Health expenditures in major industrialized countries, 1960-87. Health Care Financing Review 1990; 11:159-168.

FINAL DOCUMENT
Confidential – Draft for discussion
44
16. Capital Costs
A substantial capital investment programme w ould be required to ensure that the
hospital infrastructure is modernised. This w ould involve investment in health facilities
themselves (both the building of new facilities or units, upgrading w orks, and closure and
demolit ion of old and sub-standard buildings); in clinical equipment in general; in a major
programme of procurement of modern and eff icient diagnostic radiology equipment; and
the development of patient hotels and dedicated diagnostic day surgery units at tertiary
and regional hospitals. Table 24 show s the overall capital costs of strengthening
regional hospitals by 2014 (including identif ied new build projects).
Table 24: Regional hospitals capital upgrading costs (Millions of Rands)
Buildings 3,082Equipment 399Diagnostic Radiology 238Patient Hotel 202Day Surgery Units 1,450Total 5,371
Table 25: Regional hospitals capital upgrading costs by province (Millions of Rands)
Province By 2014 Eastern Cape 430Free State 234Gauteng 910Kw aZulu Natal 1,930Limpopo 224Mpumalanga 188Northern Cape 204North West 350Western Cape 899South Africa 5,371
Capital expenditure requirements for tertiary hospitals are signif icantly greater than
those of regional hospitals, reflecting the more capital-intensive infrastructure of higher
level hospitals, and the additional costs of essential init iatives such as dedicated day
surgery units and patient hotels.

FINAL DOCUMENT
Confidential – Draft for discussion
45
Table 26: Tertiary hospitals capital costs to 2010 (Millions of Rands)
Expenditure Area: New Build Hospitals 4,381General Facilities 3,018Patient Hotels 1,293Day Surgery Units 1,275Equipment Refit 1,008Diagnostic Radiology 424Radiotherapy 900Total 12,298
Table 27: Tertiary hospitals capital costs to 2014 (Millions of Rands)
Province Concentrated Eastern Cape 1,455Free State 358Gauteng 3,296Kw aZulu Natal 1,994Limpopo 1,264Mpumalanga 1,084Northern Cape 954North West 310Western Cape 1,583South Africa 12,298
Overall, total capital expenditure requirements by province are summarised in Table 28.

FINAL DOCUMENT
Confidential – Draft for discussion
46
Table 28: Combined capital costs to 2014 (Millions of Rands)
Province Concentrated Eastern Cape 1,885Free State 592Gauteng 4,206Kw aZulu Natal 3,923Limpopo 1,488Mpumalanga 1,272Northern Cape 1,159North West 660Western Cape 2,482South Africa 17,669
17. Impact on Patient Access and Equity
A key benefit of the service improvements proposed in this plan lies in bringing tertiary
and regional hospital services closer to the population, thus improving access and
reducing inequity. The TRA model is able to calculate the proportion of the population
who live w ithin a given drive time of a hospital. This analysis has been conducted for the
current situation and for the situation once the plan has been implemented. As can be
seen from Table 29, the improvement in accessibility w ould be very substantial. This is
due to the fact that the plan w ould place large populations in Mpumalanga and Kw aZulu
because the plan w ould place tw o new hospitals w ithin reach of large populations in
Mpumalanga and Kw aZulu Natal w hose current access to tertiary care is very poor.
This access improvement w ould have signif icant positive impacts on the outcomes of
complex trauma cases, on the ability to provide cheap and effective follow up, on
scheduling and discharge planning, and on the costs of specialists providing outreach
support to low er level facilities.

FINAL DOCUMENT
Confidential – Draft for discussion
47
Table 29: Proportion of population living w ithin 2 hours’ drive of tertiary hospital
Current Plan Province Baseline Outcome Eastern Cape 84.7% 84.7%Free State 80.1% 80.1%Gauteng 100.0% 100.0%Kw aZulu Natal 73.1% 84.1%Limpopo 77.5% 87.6%Mpumalanga 53.8% 91.4%Northern Cape 46.7% 46.7%North West 83.4% 83.4%Western Cape 86.2% 86.2%South Africa 81.3% 87.5%
Improvements in regional hospital access are summarised in Table 29. While the overall
impact on access appears small, the upgrading of Upington, De Aar and Vryburg
Hospitals dramatically improves access in Northern Cape and North West respectively,
and tw o upgraded hospitals in Kw aZulu Natal also improve the position in that province.
Table 30: Proportion of population living w ithin 1 hour’s drive of regional hospital
Current Plan Province Baseline Outcome Eastern Cape 60.5% 60.5%Free State 86.3% 86.3%Gauteng 100.0% 100.0%Kw aZulu Natal 77.5% 83.8%Limpopo 72.3% 72.3%Mpumalanga 80.1% 80.1%Northern Cape 34.6% 69.0%North West 74.6% 85.6%Western Cape 89.2% 89.2%South Africa 79.8% 82.6%
It should be noted that solutions to the poor level of regional hospital access in the
Eastern Cape are actively being sought. The province w as not able to designate a
suitable site for a new regional hospital, as there are complex challenges regarding
staff ing in the areas of greatest need.

FINAL DOCUMENT
Confidential – Draft for discussion
48
The plan w ill not only improve equity by allow ing better physical access, but also by
increasing utilisation rates in under-served regions of the country. Tables 30 to 32 show
how the overall disparity between the highest and the low est hospital admission rates
will be reduced by half by 2014 – in other w ords, the degree of inequity in referral
hospital utilisation w ill be half that seen today.
Table 31: Regional Hospital Inpatient Separations per 1000 Catchment Population
Province Baseline 2009 2014Eastern Cape 10.0 23.3 27.7Free State 19.0 42.8 50.8Gauteng 42.3 55.7 61.2Kw aZulu Natal 53.2 45.4 53.5Limpopo 18.2 25.6 32.0Mpumalanga 24.8 22.6 28.0Northern Cape 16.3 20.7North West 9.0 29.7 37.3Western Cape 33.6 51.5 57.1South Africa 31.1 39.1 45.4Max:Min Ratio 5.9 3.4 3.0
Table 32: Tertiary 1 Inpatient Separations per 1000 Catchment Population
Province Baseline 2009 2014Eastern Cape 16.8 15.2 21.3Free State 46.4 8.4 11.1Gauteng 30.5 17.0 17.7Kw aZulu Natal 15.2 10.4 16.8Limpopo 6.0 10.8 18.1Mpumalanga 11.0 19.8Northern Cape 67.4 25.4 35.2North West 35.5 27.4 30.3Western Cape 39.8 16.3 18.8South Africa 25.1 14.7 19.2Max:Min Ratio 11.3 3.2 3.2

FINAL DOCUMENT
Confidential – Draft for discussion
49
Table 33: Regional & All Tertiary Inpatient Separations per 1000 Population
Province Baseline 2009 2014Eastern Cape 26.8 38.5 49.0Free State 67.1 53.9 64.5Gauteng 74.9 74.9 81.0Kw aZulu Natal 69.9 58.0 72.4Limpopo 24.1 38.6 52.2Mpumalanga 24.8 33.6 47.8Northern Cape 67.4 41.7 55.9North West 44.6 57.2 67.6Western Cape 82.1 73.0 81.1South Africa 59.2 56.3 67.0Max:Min Ratio 3.4 2.2 1.7
18. Implementation Processes and Planning
Implementation of the plan w ould involve the follow ing key components, w hich w ill be led
by the MTS Project Manager. The MTS Project Team has recently been established
with funding for three years’ implementation activit ies, comprising a Project Manager and
Administrator.
Preparatory Phase (2004 to 2005):
• Negotiation of increased recurrent funding for regional and tertiary hospitals to
improve quality and sustainability of services, and to place health system on
funding trajectory required to achieve MTS plan objectives (commencing
2004/05 adjustment budget)
• Audit of location of specialists and other specialised staff (e.g. specialised nursing staff, professions allied to medicine etc.) by discipline by hospital; gap
analysis of baseline relative to estimated future needs; development of
recruitment, training, retention and remuneration policies to secure skilled
personnel w here required
• Development, phasing and packaging of capital projects, and integration into
the Hospital Revitalisation programme
• Development of referral netw orks, agreements and protocols, accompanied by
incremental development of national patient transport system for inter-hospital
transport of non-acute referred patients
• Negotiation w ith Health Sciences faculties to provide academic, teaching and research links at all “developing tertiary” hospitals, w ith a progressive plan to
expand academic presence and career paths at each tertiary hospital
FINAL DOCUMENT
Confidential – Draft for discussion
50
• Negotiation of implementation plans and targets w ith each province, and
development of project milestones, indicators and performance management
framew orks for ongoing programme review
• Consideration of revisions to the programme budget structure for “provincial hospitals” and “central hospitals”, to ensure that tertiary hospitals can be
identif ied as such w ithin the programme structure
• Finalisation of any required changes to National Tertiary Services Grant
conditions, grant framew ork and monitoring systems
Phase 1 (2005 to 2009):
• Front-loaded investment in specialised personnel, infrastructure and equipment
at existing main tertiary hospitals in Gauteng, Kw aZulu Natal, Free State and
Western Cape to act as capacity expanders for other provinces (commencing
2005/06)
• National coordination of equipment procurement to exploit bulk purchasing pow er
• Investment at all tertiary hospitals in dedicated diagnostic and day surgery
units, patient hotels
• Staged investment in and expansion of Frere, Port Elizabeth, Umtata,
Kimberley, Klerksdorp, Ngw elezana, Polokw ane and Rob Ferreira hospitals to
provide the basket of “developing tertiary” hospital services by 2009
(commencing 2005/06, but main effort falling betw een 2007/08 and 2009/10)
• Progressive development of national referral services at Polokw ane
• Recruitment of additional specialists to regional hospitals to achieve the goal of
employing at least one specialist per discipline per regional hospital by 2009
(commencing immediately)
• Major review of implementation progress in 2008/09, with powers to determine
whether or not hospitals and provinces have achieved their objectives, and to
redirect resources if necessary
• Ongoing productivity improvements to achieve length of stay and day case rate targets by 2009

FINAL DOCUMENT
Confidential – Draft for discussion
51
Phase 2 (2010/11 to 2014/15)
• Second w ave of recruitment of specialists to regional hospitals (objective to
double number of specialists at this level betw een 2009 and 2014)
• Continued investment in “developing tertiary” hospitals to provide the full basket of “Fully Developed” tertiary hospital services by 2014/15, accompanied
by w inding dow n of outreach support from Phase 1 “parent” hospitals
• Continue productivity improvements to achieve 2014 targets
• Preparation for next ten year plan to commence by 2012/13
APPENDIX A – FINAL DOCUM ENT
References
1. Department of Health. Health Sector Strategic Framew ork, 1999 – 2004.
2. Department of Health. Research Findings and Policy Implications of the Review of Highly
Specialised Services in the Public Hospital Sector, 26 June 2001.
3. Getzen T.E. Health care is an individual necessity and a national luxury: applying multilevel
decision models to the analysis of health care expenditures. Journal of Health Economics
2000; 19:259-270.
4. Getzen T.E., Poullier J-P. International health spending forecasts: concepts and evaluation.
Social Science and Medicine 1992; 34:1057-1068.
5. Financial and Fiscal Commission: Submission MTEF 2004-2007 “Tow ards a review of the
intergovernmental f iscal relations system.” April 2003, p65-66.
6. National Department of Health, Strategic Framew ork For The Modernisation of Tertiary
Hospital Services, May 2003.
7. National Department of Health, Strategic Framew ork For The Modernisation of Tertiary
Hospital Services, May 2003.
8. National Treasury. “Budget Review 2004”
9. Schieber G.J. Health expenditures in major industrialized countries, 1960-87. Health Care
Financing Review 1990; 11:159-168.
10. Thomas S, Muirhead D. National Health Accounts Project: the public sector report. Pretoria, Department of Health, 2000.
11. Vallabhjee, K N. & Jinabhai, CC. et al. Levels of Health Care at Academic and Regional
Hospitals in Kw aZulu-Natal, South African Medical Journal, 1997: vol. 87 (10)
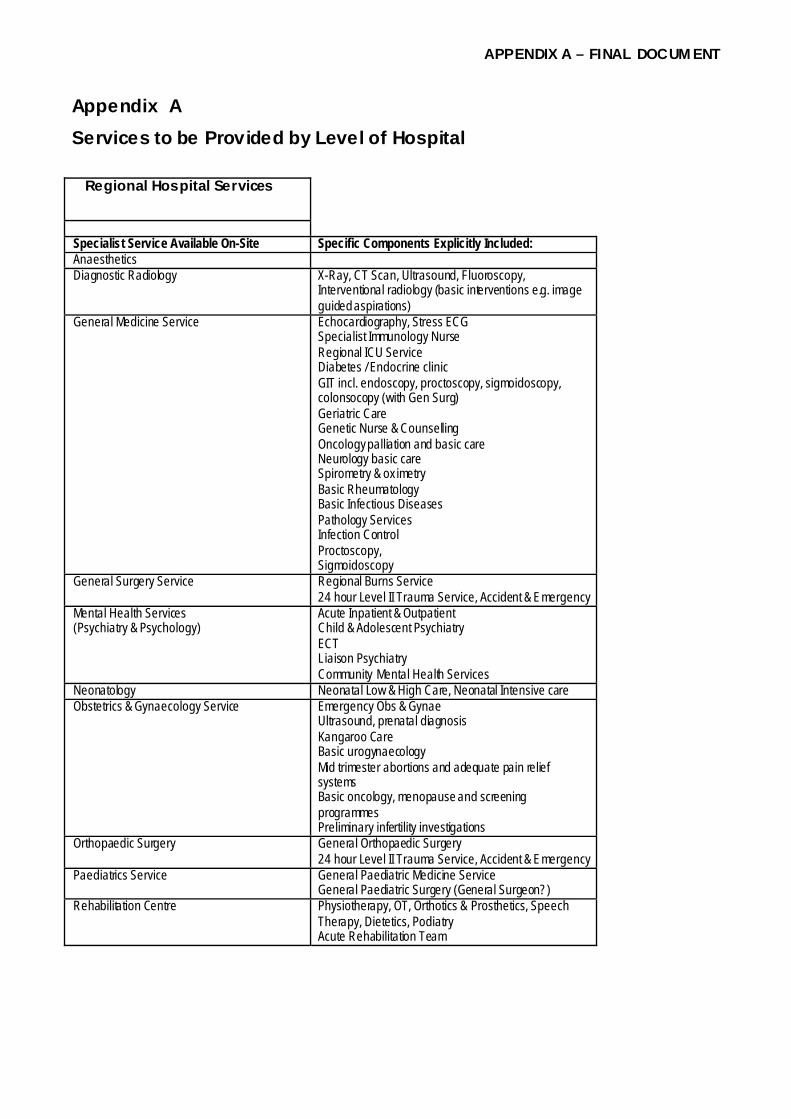
APPENDIX A – FINAL DOCUM ENT
Appendix A Services to be Provided by Level of Hospital
Regional Hospital Services
Specialist Service Available On-Site Specific Components Explicitly Included: Anaesthetics Diagnostic Radiology X-Ray, CT Scan, Ultrasound, Fluoroscopy,
Interventional radiology (basic interventions e.g. image guided aspirations)
General Medicine Service
Echocardiography, Stress ECG Specialist Immunology Nurse Regional ICU Service Diabetes / Endocrine clinic GIT incl. endoscopy, proctoscopy, sigmoidoscopy, colonsocopy (with Gen Surg) Geriatric Care Genetic Nurse & Counselling Oncology palliation and basic care Neurology basic care Spirometry & ox imetry Basic Rheumatology Basic Infectious Diseases Pathology Services Infection Control Proctoscopy, Sigmoidoscopy
General Surgery Service
Regional Burns Service 24 hour Level II Trauma Service, Accident & Emergency
Mental Health Services (Psychiatry & Psychology)
Acute Inpatient & Outpatient Child & Adolescent Psychiatry ECT Liaison Psychiatry Community Mental Health Services
Neonatology Neonatal Low & High Care, Neonatal Intensive care Obstetrics & Gynaecology Service
Emergency Obs & Gynae Ultrasound, prenatal diagnosis Kangaroo Care Basic urogynaecology Mid trimester abortions and adequate pain relief systems Basic oncology, menopause and screening programmes Preliminary infertility investigations
Orthopaedic Surgery General Orthopaedic Surgery 24 hour Level II Trauma Service, Accident & Emergency
Paediatrics Service
General Paediatric Medicine Service General Paediatric Surgery (General Surgeon?)
Rehabilitation Centre Physiotherapy, OT, Orthotics & Prosthetics, Speech Therapy, Dietetics, Podiatry Acute Rehabilitation Team

APPENDIX A – FINAL DOCUM ENT
“Developing” Tertiary
Hospital Services
n.b. Hospital in process of expanding to provide “ Full” tertiary services (see next page)
Specialist Service Available On-Site Specific Components Explicitly Included: Anaesthetics Burns Unit Specialised Burns ICU & Theatre Critical Care & ICU Full ICU Service Diagnostic Radiology
X-Ray, Multi-slice CT Scan, Ultrasound, Fluoroscopy, Mammography, Colour Doppler US, Interventional Radiology, Angiography
General Medicine Service
Angiography AT Scan Coronary Care Echocardiography, Stress ECG Endoscopy, proctoscopy, sigmoidoscopy, colonsocopy (with Gen Surg) Genetic Nurse & Counselling Oncology palliation and basic care
General Surgery Service Complex & High Acuity Care Mental Health Services (Psychiatry & Psychology)
Child and adolescent psychiatry; Old-age psychiatry; Forensic psychiatry; Substance abuse; Liaison psychiatry; Eating disorders; Inpatient psychotherapy; Social psychiatry; Acute psychotic (complicated); Acute non-psychotic (complicated)
Neonatology Neonatal Intensive Care Unit Nephrology Acute renal failure / clinical nephrological problems / dialysis
complication Obstetrics & Gynaecology Service
As Regional plus: Fetal / Maternal Medicine
Orthopaedic Surgery Sub-Specialty Orthopaedics Outreach Ambulatory Specialist Services (Specialists travel out from parent National Referral Hospital – during capacity expansion phase and until local specialists become available)
Dermatology, ENT Surgery, Gastroenterology, Infectious Diseases, Plastic & Reconstructive Surgery, Respiratory Medicine, Urology, Vascular Surgery (n.b. unless already available locally)
Paediatric Medicine Specialist General Paediatricians with special interest Paediatric Surgery Specialist Paediatric Surgery Service Paediatric ICU Full Paediatric ICU Service Rehabilitation Centre
Physiotherapy, OT, Orthotics & Prosthetics, Speech Therapy, Dietetics, Podiatry, Audiology Acute Rehabilitation Team incl. Spinal beds Stroke Unit
Trauma Tertiary Major Trauma Centre
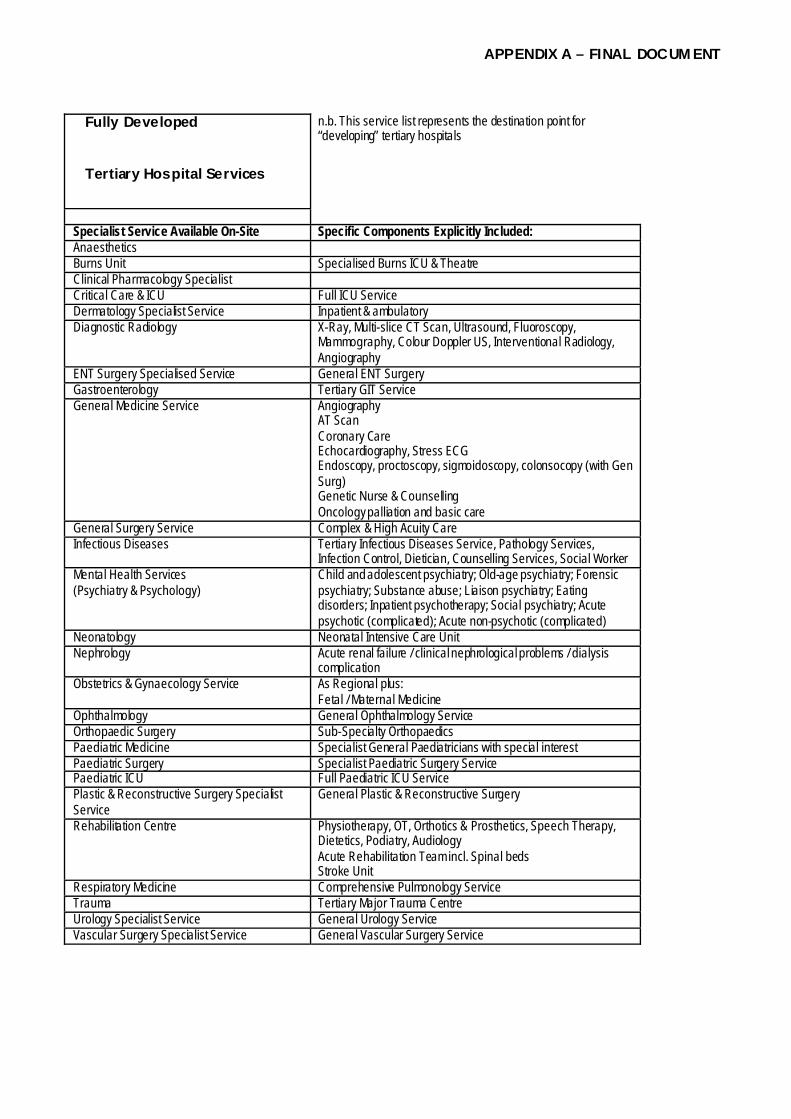
APPENDIX A – FINAL DOCUM ENT
Fully Developed
Tertiary Hospital Services
n.b. This service list represents the destination point for “developing” tertiary hospitals
Specialist Service Available On-Site Specific Components Explicitly Included: Anaesthetics Burns Unit Specialised Burns ICU & Theatre Clinical Pharmacology Specialist Critical Care & ICU Full ICU Service Dermatology Specialist Service Inpatient & ambulatory Diagnostic Radiology
X-Ray, Multi-slice CT Scan, Ultrasound, Fluoroscopy, Mammography, Colour Doppler US, Interventional Radiology, Angiography
ENT Surgery Specialised Service General ENT Surgery Gastroenterology Tertiary GIT Service General Medicine Service
Angiography AT Scan Coronary Care Echocardiography, Stress ECG Endoscopy, proctoscopy, sigmoidoscopy, colonsocopy (with Gen Surg) Genetic Nurse & Counselling Oncology palliation and basic care
General Surgery Service Complex & High Acuity Care Infectious Diseases Tertiary Infectious Diseases Service, Pathology Services,
Infection Control, Dietician, Counselling Services, Social Worker Mental Health Services (Psychiatry & Psychology)
Child and adolescent psychiatry; Old-age psychiatry; Forensic psychiatry; Substance abuse; Liaison psychiatry; Eating disorders; Inpatient psychotherapy; Social psychiatry; Acute psychotic (complicated); Acute non-psychotic (complicated)
Neonatology Neonatal Intensive Care Unit Nephrology Acute renal failure / clinical nephrological problems / dialysis
complication Obstetrics & Gynaecology Service
As Regional plus: Fetal / Maternal Medicine
Ophthalmology General Ophthalmology Service Orthopaedic Surgery Sub-Specialty Orthopaedics Paediatric Medicine Specialist General Paediatricians with special interest Paediatric Surgery Specialist Paediatric Surgery Service Paediatric ICU Full Paediatric ICU Service Plastic & Reconstructive Surgery Specialist Service
General Plastic & Reconstructive Surgery
Rehabilitation Centre
Physiotherapy, OT, Orthotics & Prosthetics, Speech Therapy, Dietetics, Podiatry, Audiology Acute Rehabilitation Team incl. Spinal beds Stroke Unit
Respiratory Medicine Comprehensive Pulmonology Service Trauma Tertiary Major Trauma Centre Urology Specialist Service General Urology Service Vascular Surgery Specialist Service General Vascular Surgery Service

APPENDIX A – FINAL DOCUM ENT
National Referral Hospital
Services
n.b. Offered only at certain designated tertiary hospitals
(“Adds on” to a Tertiary Hospital) Specialist Service Available On-Site Specific Components Explicitly Included: Cardiology Echocardiography, Ultrasound, Electrocardiography,
Stress Testing, ECG Holter Pacemaker follow-up, Cath Lab, Electrophysiology Ablation
Cardiothorac ic Surgery Full Cardiothoracic Serv ice Clinical Immunology Tertiary Clinical Immunology Craniofacial Surgery Critical Care & ICU Additional ICU Capacity Diagnostic Radiology MRI Interventional Neuroradiology ENT Surgery Specialised ENT Serv ice Endocrinology Tertiary Endocrinology Serv ice Geriatrics Specialised Geriatric Serv ice Haematology Tertiary Haematology Serv ice Human Genetics Tertiary Genetics Serv ice Infectious Diseases Clinical Research Capacity Medical & Radiation Oncology Tertiary Oncology Centre Neurosurgery Tertiary Specialist Neurosurgery Serv ice Nuclear Medicine Tertiary Nuclear Medicine Centre Obstetrics & Gynaecology Serv ice
Oncology Urogynaecology Reproductive Medicine
Ophthalmology Specialised Ophthalmology Serv ice Orthopaedic Surgery Orthopaedic Oncology Plastic & Reconstructive Surgery Tertiary Plastic & Reconstructive Surgery Renal Transplant Renal Transplant Unit Rheumatology Tertiary Rheumatology Serv ice Urology Tertiary Urology Serv ice Vascular Surgery Tertiary Vascular Surgery Serv ice Paediatric Cardiology Paediatric ICU Additional Paediatric ICU Capacity Paediatric Endocrinology Paediatric Gastroenterology Paediatric Haematology & Oncology Paediatric Infectious Diseases Paediatric Nephrology Dialysis & Renal Transplant Paediatric Neurology Paediatric Respiratory Medicine & Allergology

APPENDIX A – FINAL DOCUM ENT
Central Referral Units
(“Add on” to a National Referral Hospital)
n.b. offered only at Johannesburg and Groote Schuur / Red Cross
Specialist Service Available On-Site Specific Components Explicitly Included:
{ Cardiology Cardioverter Defibrillator & LV Assist Devices Unit { Cardiothoracic Surgery Heart & Lung Transplant Unit { Respiratory Medicine National Pulmonology Referral Centre:
Lung volume reduction, Lung Transplant Maxillofacial Surgery National Referral Centre
{ { {
Diagnostic Radiology National PET Scan Interventional Neuroradiology Cardiac Imaging
{ Nuclear Medicine PET or gamma-PET { { { { {
Medical & Radiation Oncology National Oncology Referral Centre: Bone Marrow Transplant, IMRT, Intraoperative Radiation, Stereotactic Radiation, PET Scan planning; laminar flow, cryopreservation, stem cell harvesting, T-cell depletion facilities
{ Haematology Bone Marrow Transplantation Unit
{ Hepatology Specialist Liver Unit { Liver Transplant Liver Transplant Unit { {
General Surgery National Surgical Referral Centre: Liver and major pancreatic resections, TME
{ {
Nephrology National Nephrology Centre: Pancreas-kidney / Liver-kidney Transplant
Clinical Immunology National Referral Centre Clinical Pharmacology National Policy Support Unit Dermatology National Referral Centre Endocrinology National Endocrinology Referral Centre ENT Cochlear Implant
Skull Base Surgery Human Genetics National Genetics Centre Ophthalmology Super-Specialist Ophthalmology Service Infectious Diseases National Institute for Communicable Diseases National Paediatric Referral Centre:
{ { {
Paediatric Medicine & Surgery Organ transplantation, epilepsy surgery, craniofacial surgery; certain high-cost / complex ity medical interventions
{ Paediatric Gastroenterology Transplant Surgery, Metabolic Laboratory { Paediatric Haematology & Oncology Bone Marrow Transplant { { { {
Paediatric Neurology Complex epileptic surgery, complex neuromuscular patients, neurodegenerative and metabolic patients, Video telemetry, intracranial mapping, neuro-metabolic lab.
{ {
Paediatric Rheumatology Specialised Paediatric Rheumatology including Bone Marrow Transplant, DEXA scans, Interleukin levels, joint replacement
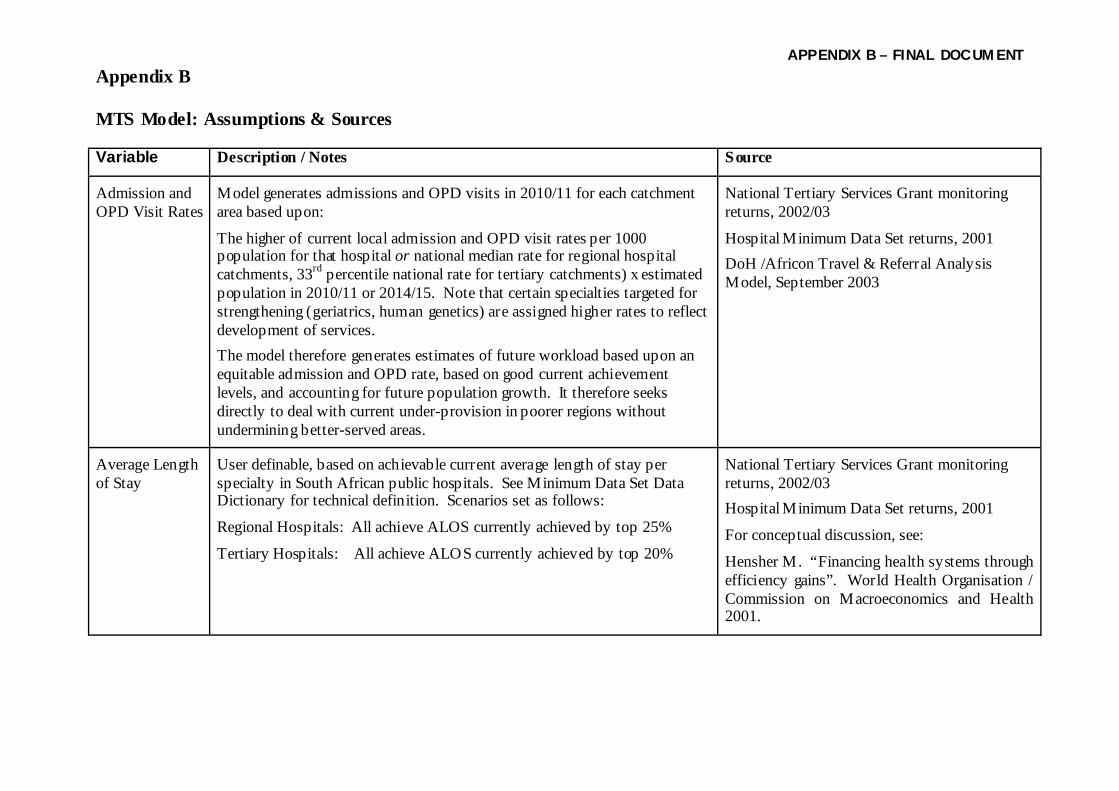
APPENDIX B – FINAL DOCUM ENT
Appendix B MTS Model: Assumptions & Sources Variable Description / Notes Source
Admission and OPD Visit Rates
Model generates admissions and OPD visits in 2010/11 for each catchment area based upon:
The higher of current local admission and OPD visit rates per 1000 population for that hospital or national median rate for regional hospital catchments, 33rd percentile national rate for tertiary catchments) x estimated population in 2010/11 or 2014/15. Note that certain specialties targeted for strengthening (geriatrics, human genetics) are assigned higher rates to reflect development of services. The model therefore generates estimates of future workload based upon an equitable admission and OPD rate, based on good current achievement levels, and accounting for future population growth. It therefore seeks directly to deal with current under-provision in poorer regions without undermining better-served areas.
National Tertiary Services Grant monitoring returns, 2002/03
Hospital Minimum Data Set returns, 2001 DoH /Africon Travel & Referral Analysis Model, September 2003
Average Length of Stay
User definable, based on achievable current average length of stay per specialty in South African public hospitals. See Minimum Data Set Data Dictionary for technical definition. Scenarios set as follows:
Regional Hospitals: All achieve ALOS currently achieved by top 25%
Tertiary Hospitals: All achieve ALOS currently achieved by top 20%
National Tertiary Services Grant monitoring returns, 2002/03 Hospital Minimum Data Set returns, 2001
For conceptual discussion, see:
Hensher M. “Financing health systems through efficiency gains”. World Health Organisation / Commission on Macroeconomics and Health 2001.

APPENDIX B – FINAL DOCUM ENT
Bed Occupancy User definable. Default values based on international best practice: Regional - 80% Tertiary 1 – 80% Tertiary 2 – 85% Tertiary 3 – 90%
Baghurst A, Place M, Posnett J. “Dynamics of bed use in accommodating emergency admissions: stochastic simulation model.” British Medical Journal 1999; 319:155-158.
Barnum H, Kutzin J. “Public hospitals in developing countries: resource use, cost, financing.” Washington, The World Bank 1993.
Hensher M. “Financing health systems through efficiency gains”. World Health Organisation / Commission on Macroeconomics and Health 2001.
Buildings and Capital Expenditure
Upgrading costs of additional capacity:
Tertiary Hospital @ R 1,060,410 per bed Regional Hospital @ R 545,567 per bed
Downgrading costs of bed closures (12.5% of new build cost):
Tertiary Hospital @ R 132,551 per bed Regional Hospital @ R 68,196 per bed
1 x Dedicated day surgery unit per tertiary hospital @ R 75 million each
1 x patient hotel per tertiary hospital @ R 100,000 per bed (1 patient hotel bed per 10 inpatient beds)
National Department of Health, National Strategic Health Facilities Transformation Funding Model, 2003
Catchment Populations
Catchment population per hospital calculated for each level of hospital (Regional, Tertiary 1, Tertiary 2, Tertiary 3) on basis of population per census Enumerator Area falling within concentric drive time polygons; population outside drive time polygons assigned to Thiessen polygons. Census 2001 population data, uplifted by Stats SA population growth formula
DoH /Africon Travel & Referral Analysis Model, September 2003

APPENDIX B – FINAL DOCUM ENT
Cost per Day Case
Increasing DC rate requires estimation of cost per day case. Basis for calculation:
Variable costs per admission for relevant specialty, plus 50% of fixed cost of one bed day for relevant specialty
National Department of Health, Costing of Regional & Tertiary Hospitals, 2003
Day Case Rate User definable, based on achievable current day case rates per specialty in South African public hospitals.
Day Case Rate = Day Cases ÷(Inpatient Separations + Day Cases)
Scenarios set as follows: Regional Hospitals: All achieve ALOS currently achieved by top 75%
Tertiary Hospitals: All achieve ALOS currently achieved by top 80%
National Tertiary Services Grant monitoring returns, 2002/03
Hospital Minimum Data Set returns, 2001
For conceptual discussion, see:
Hensher M. “Financing health systems through efficiency gains”. World Health Organisation / Commission on Macroeconomics and Health 2001.
Hensher M, Edwards N. Hospital provision, activity and productivity in England since the 1980s. British Medical Journal 1999; 319:911-914.
Discount Rate Discount rates of 8% and 10% have been used in Net Present Value calculations, reflecting rates typically used in SA project appraisals
Gautrain project appraisal
SA National Roads Agency
Drug Expenditure
Specialty groups were asked to identify specific new drugs (currently unavailable in the public sector) which will need to be accommodated over the next few years. Only a minority of groups identified any such drugs. These were then assigned a cost factor as a multiple of current average drug expenditure per admission (10% of the cost per admission), based on estimated additional cost of the drugs and scale of demand. See last page of this appendix for details.
Specialty Group Reports

APPENDIX B – FINAL DOCUM ENT
Economies of Scale
Hospitals smaller than 200 beds show increasing returns to scale; hospitals over 600 beds in size show diseconomies of scale; implying optimal hospital size typically lies between 200 and 600 beds. It is therefore assumed that new hospitals or major reprovision projects should bear this optimal size range in mind
Centre for Reviews and Dissemination. Effective Health Care Bulletin: Hospital volume and health care outcomes, costs and patient access. Nuffield Institute for Health, University of Leeds, and NHS Centre for Reviews and Dissemination, University of York 1996.
Zere E, McIntyre D, Addison T. Technical efficiency and productivity of public sector hospitals in three South African provinces. Paper submitted to South African Journal of Economics.
Efficiency Savings
Length of Stay reductions: Reduced length of stay does not yield a one-for-one reduction in costs as a) variable costs per admission are largely insensitive to ALOS, b) as ALOS reduces, the average acuity and care needs of remaining inpatient days increases. ALOS impact on costs modeled as follows:
30% ALOS reduction yields 11% reduction in cost per admission 40% ALOS reduction yields 14% reduction in cost per admission
Increasing Day Case rate:
Switching inpatient separations to day cases will achieve cost savings equivalent to (Cost per Admission minus Cost per Day Case)
Barnum H, Kutzin J. “Public hospitals in developing countries: resource use, cost, financing.” Washington, The World Bank 1993.
National Department of Health, Costing of Regional & Tertiary Hospitals, 2003
Equipment – General
Model incorporates following allowances for general equipment:
New tertiary beds @ R477,664 per bed New regional beds @ R 92,298 per bed
General equipment upgrade and refit @ R 100,000 per tertiary bed and R 25,000 per regional bed
National Department of Health, Costing of Regional & Tertiary Hospitals, 2003

APPENDIX B – FINAL DOCUM ENT
Equipment - Radiology
Specific additional capacity in Diagnostic Radiology has been costed as follows:
Regional Hospital – Single-slice CT @ R2.1 million plus Digital Fluoroscopy @ R 2 million Tertiary 1 Hospital – 6 slice CT @ R 4.5 million, Digital Fluoroscopy @ R 2 million, Angiography suite @ R 6 million Tertiary 2 Hospital – MRI 1T short bore magnet @ R 7.5 million Tertiary 3 Hospital – PET & cyclotron @ R 50 million, additional MRI @ R 7.5 million plus 16 slice CT @ R 8.5 million
Diagnostic Radiology Specialty Group Report
Siemens Ltd, Medical Engineering Division
Hospital Activity Data: Regional hospitals
Hospital Minimum Data Set returns, 2001 National Department of Health
Hospital Activity Data: Tertiary hospitals
National Tertiary Services Grant monitoring returns, 2002/03.
Hospital Minimum Data Set returns, 2001. All services in Tertiary hospitals were incorporated to ensure that the full spectrum was accommodated and to ensure that “spill-over” effects are accounted for.
Non-NTSG services data residuals were estimated as follows: General Medicine = MDS “Medicine” minus all other NTSG medical General Surgery = MDS “Surgery” minus all other NTSG surgical Obs & Gynae = MDS Maternity plus MDS Gynaecology Orthopaedics = MDS Orthopaedics minus NTSG Spinal Injury Mental Health = MDS Psychiatry Paediatric Medicine = MDS Paediatrics minus NTSG Paediatric Surgery and NTSG Neonatology Trauma = MDS Surgery x 12.5% Urology = MDS Surgery x 7.5%
National Department of Health
(Based on observed proportions in tertiary hospital costing study)
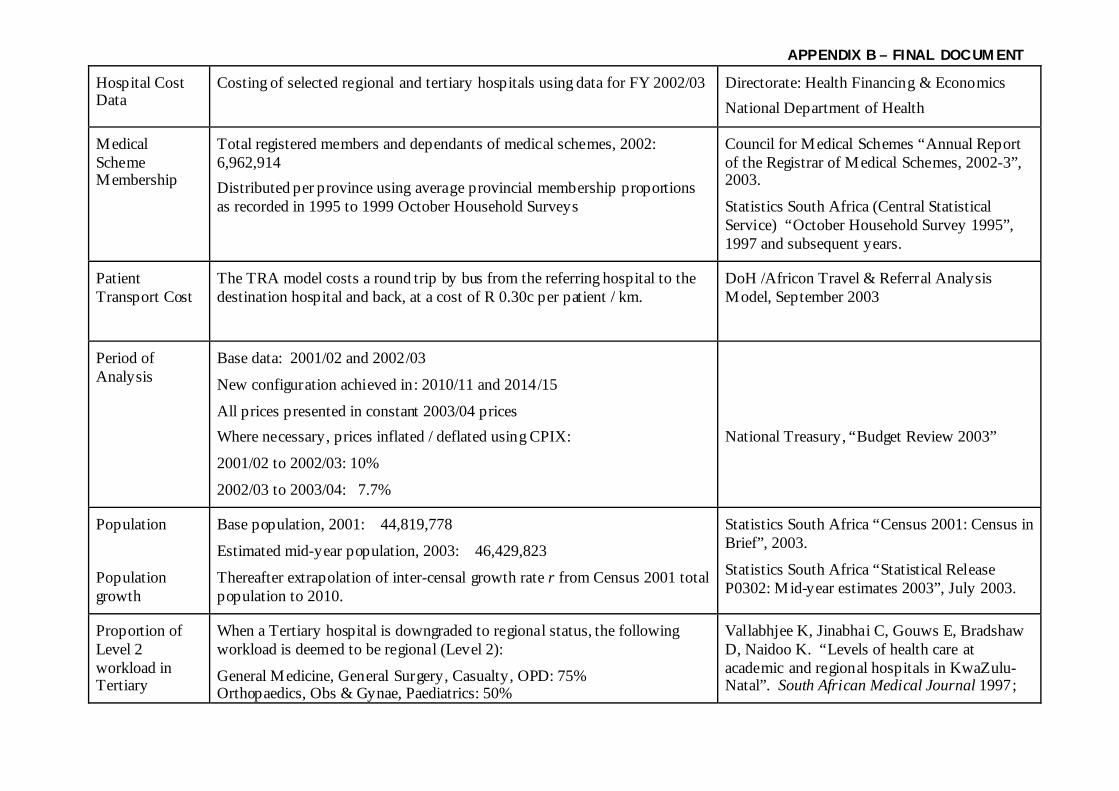
APPENDIX B – FINAL DOCUM ENT
Hospital Cost Data
Costing of selected regional and tertiary hospitals using data for FY 2002/03 Directorate: Health Financing & Economics National Department of Health
Medical Scheme Membership
Total registered members and dependants of medical schemes, 2002: 6,962,914 Distributed per province using average provincial membership proportions as recorded in 1995 to 1999 October Household Surveys
Council for Medical Schemes “Annual Report of the Registrar of Medical Schemes, 2002-3”, 2003.
Statistics South Africa (Central Statistical Service) “October Household Survey 1995”, 1997 and subsequent years.
Patient Transport Cost
The TRA model costs a round trip by bus from the referring hospital to the destination hospital and back, at a cost of R 0.30c per patient / km.
DoH /Africon Travel & Referral Analysis Model, September 2003
Period of Analysis
Base data: 2001/02 and 2002/03
New configuration achieved in: 2010/11 and 2014/15
All prices presented in constant 2003/04 prices Where necessary, prices inflated / deflated using CPIX:
2001/02 to 2002/03: 10%
2002/03 to 2003/04: 7.7%
National Treasury, “Budget Review 2003”
Population
Population growth
Base population, 2001: 44,819,778
Estimated mid-year population, 2003: 46,429,823
Thereafter extrapolation of inter-censal growth rate r from Census 2001 total population to 2010.
Statistics South Africa “Census 2001: Census in Brief”, 2003.
Statistics South Africa “Statistical Release P0302: Mid-year estimates 2003”, July 2003.
Proportion of Level 2 workload in Tertiary
When a Tertiary hospital is downgraded to regional status, the following workload is deemed to be regional (Level 2):
General Medicine, General Surgery, Casualty, OPD: 75% Orthopaedics, Obs & Gynae, Paediatrics: 50%
Vallabhjee K, Jinabhai C, Gouws E, Bradshaw D, Naidoo K. “Levels of health care at academic and regional hospitals in KwaZulu-Natal”. South African Medical Journal 1997;

APPENDIX B – FINAL DOCUM ENT
Hospitals All remaining workload is assumed to be shifted to other Tertiary hospitals (as Tertiary 1)
87: 1355-1359. Financial and Fiscal Commission. “Submission – Medium Term Expenditure Framework 2004-2007: towards a review of the intergovernmental fiscal relations system”. April 2003.
Referral Rates from level to level
Regional to T1: 20% of Separations / OPD Visits at referring hospital
T1 to T2: 20% of Separations / OPD Visits at referring hospital
T2 to T3: 20% of Separations / OPD Visits at referring hospital
Centre for Health Systems Research & Development / Health Care Management Programme. “Assessment of current health care referral systems in the RSA: a study of the current referral patterns, including the views and experiences of users and providers of health services”. University of the Free State, September 2000.
Staff in Post Health Professionals in post as of March 2003 by hospital (pay point). PERSAL – National Department of Health
Staffing Requirements by Specialty
Regional Hospitals – Draft Regional Hospitals Package and MTS specialty group outputs
Tertiary Hospitals – MTS Specialty Group outputs
These represent minimum requirements; larger hospitals would be in position to employ additional personnel as required. Base calculations attempt to identify the minimum key personnel required to make the reconfigured system work effectively, as a guide for HR planning and training.
National Department of Health. “Discussion document: strategic framework for the modernisation of tertiary hospital services.” May 2003. National Department of Health. “A regional hospital service package for South Africa: a draft proposal.” July 2002.
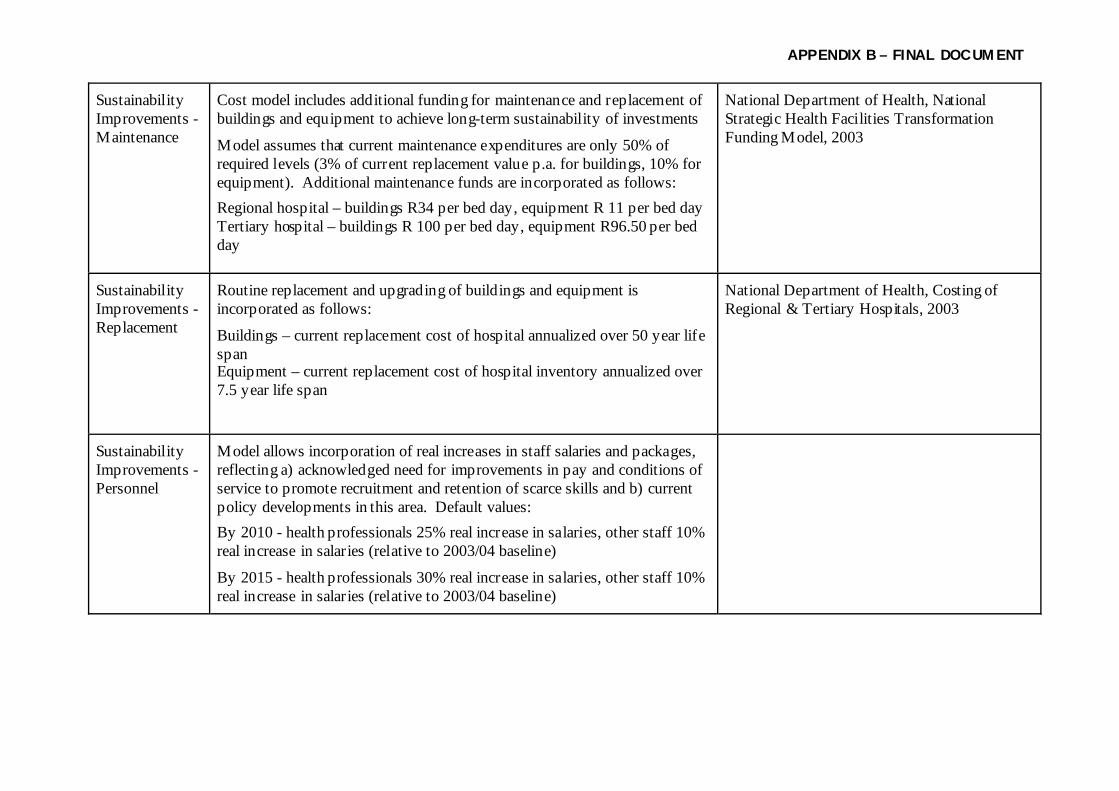
APPENDIX B – FINAL DOCUM ENT
Sustainability Improvements - Maintenance
Cost model includes additional funding for maintenance and replacement of buildings and equipment to achieve long-term sustainability of investments
Model assumes that current maintenance expenditures are only 50% of required levels (3% of current replacement value p.a. for buildings, 10% for equipment). Additional maintenance funds are incorporated as follows: Regional hospital – buildings R34 per bed day, equipment R 11 per bed day Tertiary hospital – buildings R 100 per bed day, equipment R96.50 per bed day
National Department of Health, National Strategic Health Facilities Transformation Funding Model, 2003
Sustainability Improvements - Replacement
Routine replacement and upgrading of buildings and equipment is incorporated as follows:
Buildings – current replacement cost of hospital annualized over 50 year life span Equipment – current replacement cost of hospital inventory annualized over 7.5 year life span
National Department of Health, Costing of Regional & Tertiary Hospitals, 2003
Sustainability Improvements - Personnel
Model allows incorporation of real increases in staff salaries and packages, reflecting a) acknowledged need for improvements in pay and conditions of service to promote recruitment and retention of scarce skills and b) current policy developments in this area. Default values: By 2010 - health professionals 25% real increase in salaries, other staff 10% real increase in salaries (relative to 2003/04 baseline)
By 2015 - health professionals 30% real increase in salaries, other staff 10% real increase in salaries (relative to 2003/04 baseline)
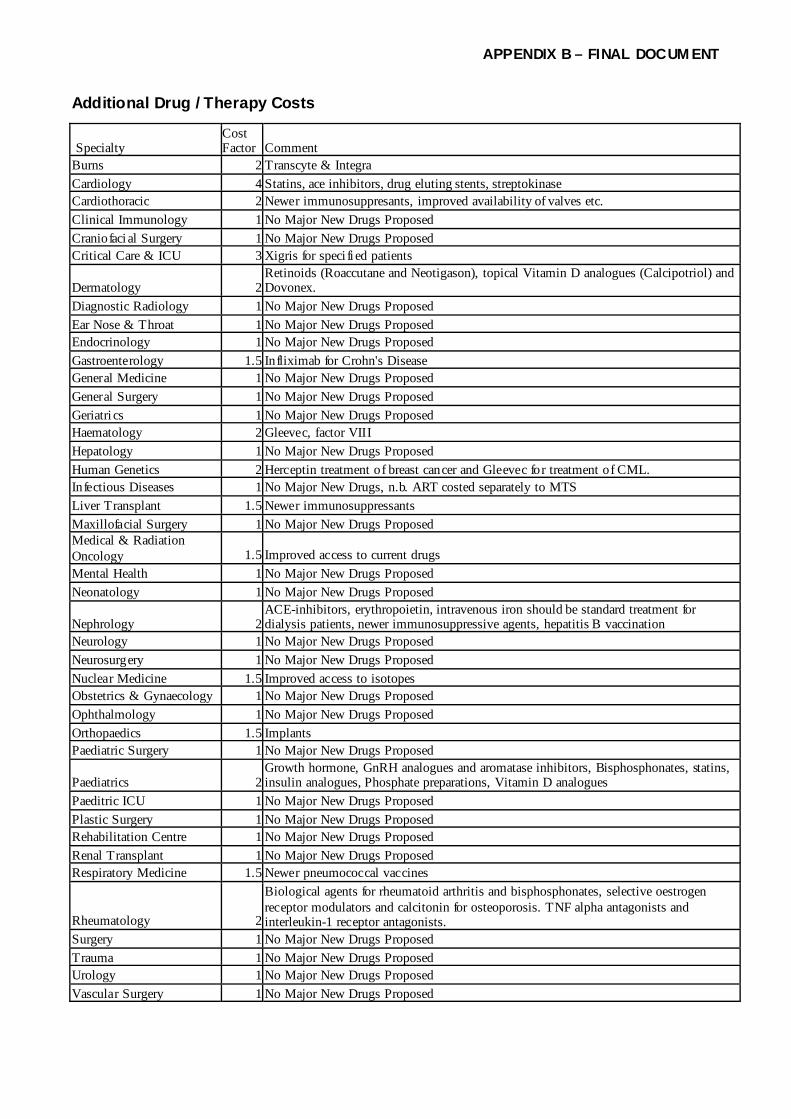
APPENDIX B – FINAL DOCUM ENT
Additional Drug / Therapy Costs
Specialty Cost Factor Comment
Burns 2 Transcyte & Integra Cardiology 4 Statins, ace inhibitors, drug eluting stents, streptokinase Cardiothoracic 2 Newer immunosuppresants, improved availability of valves etc. Clinical Immunology 1 No Major New Drugs Proposed Craniofaci al Surgery 1 No Major New Drugs Proposed Critical Care & ICU 3 Xigris for speci fi ed patients
Dermatology 2Retinoids (Roaccutane and Neotigason), topical Vitamin D analogues (Calcipotriol) and Dovonex.
Diagnostic Radiology 1 No Major New Drugs Proposed Ear Nose & Throat 1 No Major New Drugs Proposed Endocrinology 1 No Major New Drugs Proposed Gastroenterology 1.5 Infliximab for Crohn's Disease General Medicine 1 No Major New Drugs Proposed General Surgery 1 No Major New Drugs Proposed Geriatri cs 1 No Major New Drugs Proposed Haematology 2 Gleevec, factor VIII Hepatology 1 No Major New Drugs Proposed Human Genetics 2 Herceptin treatment of breast cancer and Gleevec for treatment of CML. Infectious Diseases 1 No Major New Drugs, n.b. ART costed separately to MTS Liver Transplant 1.5 Newer immunosuppressants Maxillofacial Surgery 1 No Major New Drugs Proposed Medical & Radiation Oncology 1.5 Improved access to current drugs Mental Health 1 No Major New Drugs Proposed Neonatology 1 No Major New Drugs Proposed
Nephrology 2ACE-inhibitors, erythropoietin, intravenous iron should be standard treatment for dialysis patients, newer immunosuppressive agents, hepatitis B vaccination
Neurology 1 No Major New Drugs Proposed Neurosurgery 1 No Major New Drugs Proposed Nuclear Medicine 1.5 Improved access to isotopes Obstetrics & Gynaecology 1 No Major New Drugs Proposed Ophthalmology 1 No Major New Drugs Proposed Orthopaedics 1.5 Implants Paediatric Surgery 1 No Major New Drugs Proposed
Paediatrics 2Growth hormone, GnRH analogues and aromatase inhibitors, Bisphosphonates, statins, insulin analogues, Phosphate preparations, Vitamin D analogues
Paeditric ICU 1 No Major New Drugs Proposed Plastic Surgery 1 No Major New Drugs Proposed Rehabilitation Centre 1 No Major New Drugs Proposed Renal Transplant 1 No Major New Drugs Proposed Respiratory Medicine 1.5 Newer pneumococcal vaccines
Rheumatology 2
Biological agents for rheumatoid arthritis and bisphosphonates, selective oestrogen receptor modulators and calcitonin for osteoporosis. TNF alpha antagonists and interleukin-1 receptor antagonists.
Surgery 1 No Major New Drugs Proposed Trauma 1 No Major New Drugs Proposed Urology 1 No Major New Drugs Proposed Vascular Surgery 1 No Major New Drugs Proposed

APPENDIX C – FINAL DOCUM ENT
Appendix C Efficiency and Sustainability Assumptions Cost per Admission - Regional Subtract Add Subtract Add Start % ALOS Drug Share Admin Cost Staff Real Income Direct Costs 72% Fixed 76% 5% 18%Variable 24% 6% Overhead 28% 2% 0% 3%Total 7% 6% 0% 21% Length of Stay Reduction 20% Hotel & Facilities % Total 9% Assumed reduction in admin costs 0% Assumed real income increase - professionals 34% Assumed real income increase - others 22% Cost per Bed Day - Regional Add Sustainable Maintenance Buildings Equipment Total Additional Cost per Bed Day 3400% 1100% 4500% Assumed adequacy of current spending 50% Cost per OP Visit - Regional Add Subtract Add Drug Share Admin Cost Staff Real Income Adjusted Cost per OP Visit 6% 0% 21%

APPENDIX C – FINAL DOCUM ENT
Efficiency and Sustainability Assumptions Add Add Add Subtract Add Add Cost per Day Case Admission Drug Share Bed Day Admin Cost Staff Real Income Equipment Variable Cost Component of Admission 24% 12% 38% 0% 21% 300% Cost per Admission - Tertiary Subtract Add Subtract Add Start % ALOS Drug Share Admin Cost Staff Real Income Direct Costs 78% Fixed 76% 6% 16% Variable 24% 6% Overhead 22% 1% 0% 2% Total 7% 6% 0% 18% Length of Stay Reduction 20% Hotel & Facilities % Total 6% Assumed reduction in admin costs 0% Assumed real income increase - professionals 34% Assumed real income increase - others 22% Cost per Bed Day - Tertiary Add Sustainable Maintenance Buildings Equipment Total Additional Cost per Bed Day 10000% 9650% 19650% Assumed adequacy of current spending 50% Cost per OP Visit - Tertiary Add Subtract Add Drug Share Admin Cost Staff Real Income Adjusted Cost per OP Visit 6% 0% 18% Add Add Add Subtract Add Add Cost per Day Case - Tertiary Admission Drug Share Bed Day Admin Cost Staff Real Income Equipment Maintenance Variable Cost Component of Admission 24% 10% 38% 0% 18% 1800%

APPENDIX D –FINAL DOCUM ENT
APPENDIX D
Results of Validation of MTS Cost Model
General
As described in the main report, the MTS Cost Model is based upon the results of a step-down cost
analysis of eight hospitals conducted by the Directorate: Health Financing & Economics during 2003;
these results are then adjusted in line with assumptions described in detail in the main report and in
Appendix B.
In order to ensure that the MTS Cost Model is a valid and appropriate basis for estimating the future costs
of hospital provision, a detailed validation exercise was undertaken to assess the model’s accuracy in
predicting current levels of expenditure on regional and tertiary hospitals.
Approach
The most complete dataset of actual expenditure data per hospital currently available to the MTS team
relates to financial year 2001/02, and was extracted from FMS records. The cost model operates in
current (i.e. 2003/04) prices. FMS expenditures per hospital typically do not include capital expenditures
on replacement and upgrading of buildings and equipment, while the cost model does incorporate the
annualized costs of capital and equipment replacement. In order to make cost model consistent with
actual FMS data, two adjustments were made to the cost model outputs:
• They were deflated to 2001/02 prices (deflator 2002/03 7.7%, 2001/02 10%)
• They were reduced by the average value of the capital and equipment replacement costs (a factor of
-14% for tertiary hospitals and –7.8% for regional hospitals)
These adjustments then allowed a direct comparison of aggregate cost model outputs with aggregate
actual expenditures, and a statistical analysis of the relationship between model predicted expenditure and
actual expenditure for each hospital.
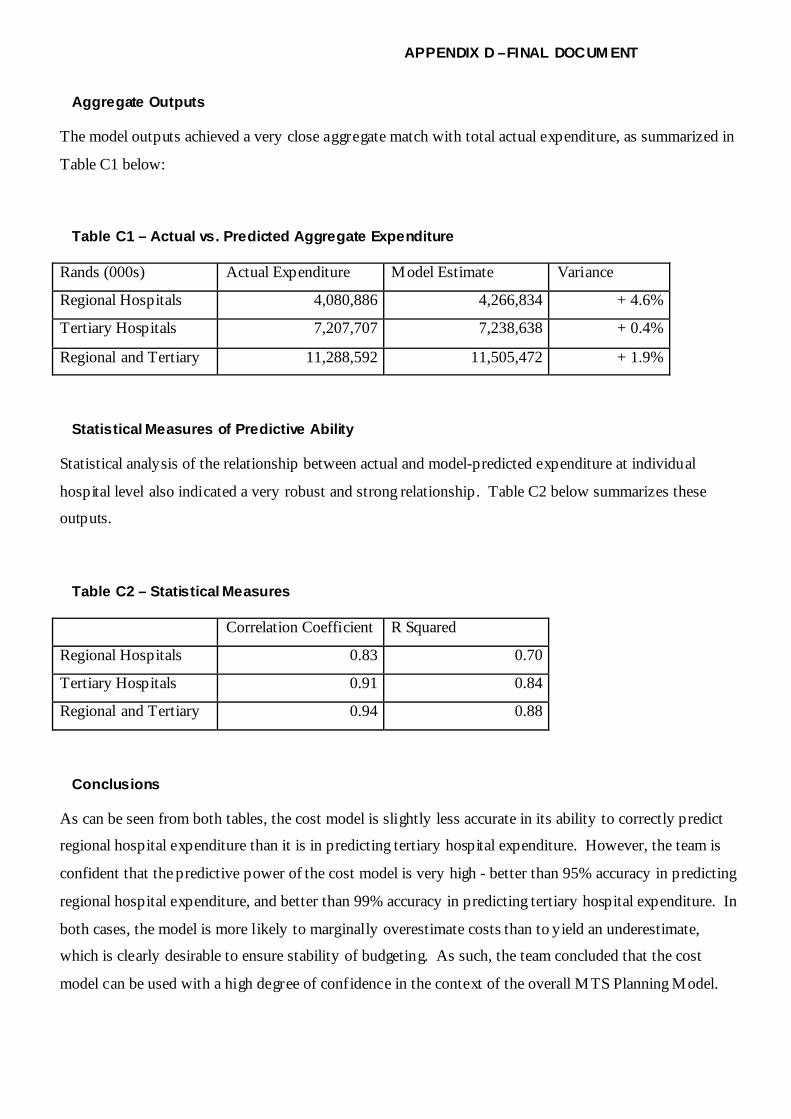
APPENDIX D –FINAL DOCUM ENT
Aggregate Outputs
The model outputs achieved a very close aggregate match with total actual expenditure, as summarized in
Table C1 below:
Table C1 – Actual vs. Predicted Aggregate Expenditure
Rands (000s) Actual Expenditure Model Estimate Variance
Regional Hospitals 4,080,886 4,266,834 + 4.6%
Tertiary Hospitals 7,207,707 7,238,638 + 0.4%
Regional and Tertiary 11,288,592 11,505,472 + 1.9%
Statistical Measures of Predictive Ability
Statistical analysis of the relationship between actual and model-predicted expenditure at individual
hospital level also indicated a very robust and strong relationship. Table C2 below summarizes these
outputs.
Table C2 – Statistical Measures
Correlation Coefficient R Squared
Regional Hospitals 0.83 0.70
Tertiary Hospitals 0.91 0.84
Regional and Tertiary 0.94 0.88
Conclusions
As can be seen from both tables, the cost model is slightly less accurate in its ability to correctly predict
regional hospital expenditure than it is in predicting tertiary hospital expenditure. However, the team is
confident that the predictive power of the cost model is very high - better than 95% accuracy in predicting
regional hospital expenditure, and better than 99% accuracy in predicting tertiary hospital expenditure. In
both cases, the model is more likely to marginally overestimate costs than to yield an underestimate,
which is clearly desirable to ensure stability of budgeting. As such, the team concluded that the cost
model can be used with a high degree of confidence in the context of the overall MTS Planning Model.

APPENDIX D –FINAL DOCUM ENT
Cost Model – Current Unit Costs 2003/2004
Current costs of study hospitals, before application of eff iciency and sustainability assumptions.
REGIONAL / LEV EL II HOSPITAL SERV ICES Inpatient Separations Inpatient Days Outpatient Visits Day Cases Medicine 3,525 482 850Tuberculosis 3,525 482 850Surgery 6,353 720 1,458Orthopaedics 5,695 738 1,353Psychiatry 6,634 894 1,594Maternity 2,199 644 702Gynaecology 3,632 1,976 1,616Paediatrics 3,061 429 743Total 373 Casualty 373 TERTIARY 1 ("TERTIARY HOSPITAL SERV ICES") Inpatient Separations Inpatient Days Outpatient Visits Day Cases Burns 26,582 1,068 5,644 5,127Clinical Pharmacology 1,000,000 Crit ical Care & ICU 19,871 3,013 4,940Dermatology 19,279 1,783 396 4,223Diagnostic Radiology 743 0Ear Nose & Throat 6,170 1,932 493 2,032Gastroenterology 17,277 2,541 995 4,256General Medicine 3,348 457 403 807General Surgery 6,033 684 403 1,385Infectious Diseases 36,510 1,478 859 7,048Mental Health 9,113 1,044 473 2,097Neonatology 27,285 237 4,834Nephrology 8,869 1,735 1,252 2,400Obstetrics & Gynaecology 3,449 1,877 403 1,534Ophthalmology 5,609 1,757 450 1,848Orthopaedics 5,409 701 403 1,285Paediatric Medicine 2,907 407 380 706Paediatric Surgery 11,661 3,236 340 3,633Paeditric ICU 25,441 3,878 0 6,335Plastic & Reconstructive Surgery 14,901 5,982 1,294 5,566Rehabilitation Centre 176,031 0 620 30,418Respiratory Medicine 17,420 1,781 1,039 3,901Trauma 6,033 684 403 1,385Urology 6,033 684 403 1,385Vascular Surgery 16,364 1,562 617 3,609Remaining OPD Visits 373

APPENDIX D –FINAL DOCUM ENT
TERTIARY 2 (NATIONAL REFERRAL HOSPITAL SERV ICES) Inpatient Separations Inpatient Days Outpatient Visits Day Cases Cardiology 13,159 2,467 698 3,507Cardiothoracic Surgery 14,769 1,981 563 3,543Clinical Immunology 15,466 2,138 1,950 3,742Craniofacial Surgery 1,330 0 110 230Crit ical Care & ICU 19,871 3,013 0 4,940Diagnostic Radiology 743 0Ear Nose & Throat 6,170 1,932 493 2,032Endocrinology 19,203 2,302 912 4,469Geriatrics 66,409 4,890 801 13,921Haematology 28,578 2,459 1,392 6,168Human Genetics 14,055 0 751 2,429Infectious Diseases 36,510 1,478 859 7,048Medical & Radiation Oncology 25,004 2,926 576 5,784Neurosurgery 38,219 4,110 2,944 8,659Nuclear Medicine 3,162 0 3,162 546Neurology 15,517 1,918 444 3,640Ophthalmology 5,609 1,757 450 1,848Orthopaedics 19,001 1,998 620 4,283Plastic & Reconstructive 14,901 5,982 1,294 5,566Renal Transplant 17,277 2,541 995 4,256Rheumatology 9,325 1,766 753 2,494Urology 10,212 2,146 1,276 2,838Vascular Surgery 16,364 1,562 617 3,609T2 Paediatrics 17,751 1,745 1,452 3,940

APPENDIX D –FINAL DOCUM ENT
TERTIARY 3 (CENTRAL REFERRAL UNITS) Inpatient Separations Inpatient Days Outpatient Visits Day Cases Group 1 - Chest Cardiology 13,159 2,467 698 3,507Cardiothoracic 14,769 1,981 563 3,543Respiratory Medicine 17,420 1,781 1,039 3,901Group 2 - Radiology Radiology 743 0Nuclear Medicine 3,162 0 3,162 546Medical & Radiation Oncology 25,004 2,926 576 5,784Haematology 28,578 2,459 1,392 6,168Group 3 - Liver & Pancreas Hepatology 17,277 2,541 995 4,256Liver Transplant 17,277 2,541 995 4,256Surgery 11,327 1,771 899 2,843Nephrology 8,869 1,735 1,252 2,400National Referral Centres: Clinical Immunology 15,466 2,138 1,950 3,742Clinical Pharmacology 3,000,000 Dermatology 19,279 1,783 396 4,223Endocrinology 19,203 2,302 912 4,469ENT 6,170 1,932 493 2,032Human Genetics 14,055 0 751 2,429Ophthalmology 5,609 1,757 450 1,848Infectious Diseases 36,510 1,478 859 7,048Maxillofacial Surgery 3,495 2,983 924 2,095Paediatrics 17,751 1,745 1,452 3,940

APPENDIX E – FINAL DOCUMENT
Cost Model – Model Costs 2009 Appendix E
REGIONAL / LEV EL II HOSPITAL SERV ICES
Inpatient Separations
Sustainable Maintenance
Outpatient Visits Day Cases
Medicine 4449 45 895Tuberculosis 4449 45 895Surgery 8018 45 1526Orthopaedics 7188 45 1423Psychiatry 8373 45 1678Maternity 2775 45 763Gynaecology 4584 45 1802Paediatrics 3864 45 784Total 456 Casualty 456 TERTIARY 1 ("TERTIARY HOSPITAL SERVICES")
Inpatient Separations Inpatient Days
Outpatient Visits Day Cases
Burns 34256 197 6998 8250Clinical Pharmacology 1000000 87218Crit ical Care & ICU 26801 197 9399Dermatology 24845 197 491 6553Diagnostic Radiology 877 18Ear Nose & Throat 7581 197 582 2255Gastroenterology 21747 197 1204 5539General Medicine 4114 197 476 901General Surgery 7413 197 476 1530Infectious Diseases 44860 197 1014 7680Mental Health 11198 197 558 2309Neonatology 33526 197 5259Nephrology 11430 197 1552 3537Obstetrics & Gynaecology 4238 197 476 1715Ophthalmology 6893 197 530 2052Orthopaedics 6808 197 488 1694Paediatric Medicine 3572 197 448 790Paediatric Surgery 14328 197 402 4013Paeditric ICU 31260 197 6952Plastic & Reconstructive Surgery 18310 197 1527 6157Rehabilitation Centre 216295 197 732 Respiratory Medicine 21927 197 1257 5147Trauma 7413 197 476 1530Urology 7413 197 476 1530Vascular Surgery 20107 197 728 3956Total Tert iary 1 services Remaining OPD Visits 418

APPENDIX E – FINAL DOCUMENT
Cost Model – Model Costs 2009
TERTIARY 2 (NATIONAL REFERRAL HOSPITAL SERVICES)
Inpatient Separations Inpatient Days
Outpatient Visits Day Cases
Cardiology 18537 197 950 7810Cardiothoracic Surgery 19034 197 698 5369Clinical Immunology 19004 197 2301 4111Craniofacial Surgery 1634 197 130 267Crit ical Care & ICU 26801 197 0 9399Diagnostic Radiology 877 18Ear Nose & Throat 7581 197 582 2255Endocrinology 23595 197 1077 4902Geriatrics 81598 197 945 15188Haematology 36830 197 1726 9603Human Genetics 18114 197 931 4055Infectious Diseases 44860 197 1014 7680Medical & Radiation Oncology 31473 197 697 7588Neurosurgery 46960 197 3473 9474Nuclear Medicine 3981 197 3827 768Neurology 19066 197 524 3997Ophthalmology 6893 197 530 2052Orthopaedics 23347 197 732 4694Plastic & Reconstructive 18310 197 1527 6157Renal Transplant 21228 197 1174 4675Rheumatology 12017 197 934 3685Urology 12547 197 1505 3132Vascular Surgery 20107 197 728 3956T2 Paediatrics 22876 197 1801 6093

APPENDIX E – FINAL DOCUMENT
Appendix E
TERTIARY 3 (CENTRAL REFERRAL UNITS)
Inpatient Separations Inpatient Days
Outpatient Visits Day Cases
Group 1 - Chest Cardiology 16958 197 950 7810Cardiothoracic 17261 197 698 5369Respiratory Medicine 19837 197 1257 5147 Group 2 - Radiology Radiology 877 18Nuclear Medicine 3601 197 3827 768Medical & Radiation Oncology 28473 197 697 7588Haematology 33400 197 1726 9603 Group 3 - Liver & Pancreas Hepatology 19155 197 1174 4675Liver Transplant 19674 197 1204 5539Surgery 12559 197 1061 3130Nephrology 10365 197 1552 3537 National Referral Centres: Clinical Immunology 17148 197 2301 4111Clinical Pharmacology 3000000 Dermatology 21375 197 467 4625Endocrinology 21291 197 1077 4902ENT 6841 197 582 2255Human Genetics 16427 197 931 4055Ophthalmology 6219 197 530 2052Infectious Diseases 40479 197 1014 7680Maxillofacial Surgery 3875 197 1090 2343Paediatrics 20746 197 1801 6093

APPENDIX F – FINAL DOCUM ENT
Appendix F
Length of Stay and Day Case Rates
The tables below provide descriptive statistics on current day case rates and lengths of stay. The columns marked in bold denote the target values used in the model.
Regional Hospitals: Day Case Rate
Mean Median 75 percentile 80 percentile 90 percentile Medicine 13.7% 6.6% 17.2% 24.5% 30.1%Tuberculosis 14.7% 14.7% 20.0% 21.1% 23.2%Surgery 7.8% 5.2% 10.9% 11.3% 13.8%Orthopaedics 19.0% 19.0% 26.2% 27.6% 30.5%Psychiatry 33.3% 33.3% 33.3% 33.3% 33.3%Maternity 7.0% 5.2% 9.9% 11.0% 14.9%Gynaecology 25.6% 25.6% 35.9% 37.9% 42.0%Paediatrics 8.0% 4.5% 11.4% 12.6% 18.2%Total 6.9% 5.5% 8.4% 9.7% 15.1% Tertiary Hospital Services: Day Case Rate Mean Median 75 percentile 80 percentile 90 percentile Burns 29.9% 23.0% 52.1% 56.3% 64.5%Critical Care & ICU 4.3% 4.9% 6.7% 6.7% 7.5%Dermatology 34.7% 11.5% 67.0% 82.9% 91.5%Ear Nose & Throat 12.2% 15.1% 15.4% 16.6% 18.9%Gastroenterology 15.0% 15.0% 15.0% 15.0% 15.0%General Medicine 15.5% 3.6% 15.5% 26.0% 49.7%General Surgery 23.5% 13.9% 39.1% 41.3% 49.7%Infectious Diseases 15.8% 1.5% 15.9% 24.5% 41.7%Mental Health 4.1% 2.0% 5.5% 6.2% 7.6%Neonatology 5.0% 5.1% 6.7% 8.0% 10.5%Nephrology 65.3% 78.4% 94.0% 96.4% 99.6%Obstetrics & Gynaecology 8.8% 6.8% 13.7% 14.0% 15.6%Ophthalmology 34.3% 29.8% 56.3% 57.3% 64.8%Orthopaedics 7.4% 5.0% 7.7% 8.2% 15.0%Paediatric Medicine 10.1% 5.7% 9.5% 12.3% 23.0%Paediatric Surgery 14.9% 14.2% 17.5% 20.1% 29.5%

APPENDIX F – FINAL DOCUM ENT
Plastic & Reconstructive Surgery 17.9% 24.5% 27.1% 27.5% 32.3%Rehabilitation Centre 1.3% 1.3% 1.3% 1.3% 1.3%Respiratory Medicine 18.6% 20.6% 28.6% 31.4% 34.6%Trauma 0.0% 0.0% 0.0% 0.0% 0.0%Urology 16.1% 10.5% 21.7% 30.0% 34.4%Vascular Surgery 11.8% 2.4% 5.4% 6.3% 32.1%Total Tertiary 1 services 13.8% 9.5% 17.0% 19.7% 23.2% National Referral Hospital Services: Day Case Rate Mean Median 75 percentile 80 percentile 90 percentile Cardiology 17% 4% 34% 37% 45%Cardiothoracic Surgery 12% 4% 16% 20% 29%Clinical Immunology 54% 52% 87% 90% 95%Craniofacial Surgery 9% 6% 12% 15% 19%Endocrinology 9% 5% 11% 12% 21%Haematology 35% 5% 76% 79% 86%Human Genetics 33% 33% 43% 45% 50%Medical & Radiation Oncology 8% 6% 11% 14% 18%Neurology 26% 7% 43% 57% 77%Neurosurgery 3% 2% 5% 5% 8%Nuclear Medicine 100% 100% 100% 100% 100%Renal Transplant 22% 22% 33% 35% 40%Rheumatology 15% 2% 22% 27% 35%Total T2 services 16% 19% 21% 23% 25% Central Referral Services: Day Case Rate Group 3 - Liver & Pancreas Mean Median 75 percentile 80 percentile 90 percentile Hepatology 0.15 0.15 0.15Liver Transplant 0.06 0.06 0.06Surgery 0.27 0.03 0.29 0.44 0.72
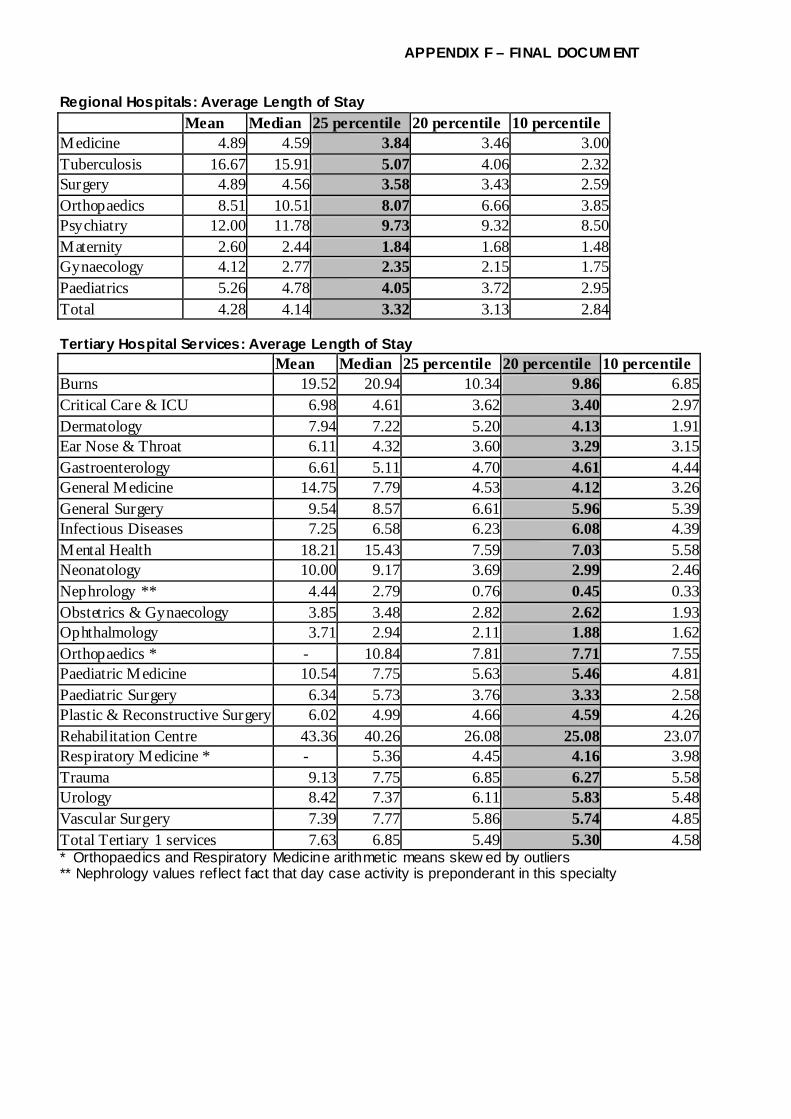
APPENDIX F – FINAL DOCUM ENT
Regional Hospitals: Average Length of Stay Mean Median 25 percentile 20 percentile 10 percentile
Medicine 4.89 4.59 3.84 3.46 3.00Tuberculosis 16.67 15.91 5.07 4.06 2.32Surgery 4.89 4.56 3.58 3.43 2.59Orthopaedics 8.51 10.51 8.07 6.66 3.85Psychiatry 12.00 11.78 9.73 9.32 8.50Maternity 2.60 2.44 1.84 1.68 1.48Gynaecology 4.12 2.77 2.35 2.15 1.75Paediatrics 5.26 4.78 4.05 3.72 2.95Total 4.28 4.14 3.32 3.13 2.84 Tertiary Hospital Services: Average Length of Stay Mean Median 25 percentile 20 percentile 10 percentile Burns 19.52 20.94 10.34 9.86 6.85Critical Care & ICU 6.98 4.61 3.62 3.40 2.97Dermatology 7.94 7.22 5.20 4.13 1.91Ear Nose & Throat 6.11 4.32 3.60 3.29 3.15Gastroenterology 6.61 5.11 4.70 4.61 4.44General Medicine 14.75 7.79 4.53 4.12 3.26General Surgery 9.54 8.57 6.61 5.96 5.39Infectious Diseases 7.25 6.58 6.23 6.08 4.39Mental Health 18.21 15.43 7.59 7.03 5.58Neonatology 10.00 9.17 3.69 2.99 2.46Nephrology ** 4.44 2.79 0.76 0.45 0.33Obstetrics & Gynaecology 3.85 3.48 2.82 2.62 1.93Ophthalmology 3.71 2.94 2.11 1.88 1.62Orthopaedics * - 10.84 7.81 7.71 7.55Paediatric Medicine 10.54 7.75 5.63 5.46 4.81Paediatric Surgery 6.34 5.73 3.76 3.33 2.58Plastic & Reconstructive Surgery 6.02 4.99 4.66 4.59 4.26Rehabilitation Centre 43.36 40.26 26.08 25.08 23.07Respiratory Medicine * - 5.36 4.45 4.16 3.98Trauma 9.13 7.75 6.85 6.27 5.58Urology 8.42 7.37 6.11 5.83 5.48Vascular Surgery 7.39 7.77 5.86 5.74 4.85Total Tertiary 1 services 7.63 6.85 5.49 5.30 4.58* Orthopaedics and Respiratory Medicine arithmetic means skew ed by outliers ** Nephrology values reflect fact that day case activity is preponderant in this specialty

APPENDIX F – FINAL DOCUM ENT
National Referral Hospital Services: Average Length of Stay Mean Median 25 percentile 20 percentile 10 percentile Cardiology 6.90 4.73 3.87 3.56 3.07Cardiothoracic Surgery 7.72 7.84 6.63 6.52 5.85Clinical Immunology 7.29 6.76 5.66 5.44 5.00Craniofacial Surgery 6.62 7.07 4.40 4.10 3.28Endocrinology 7.29 6.98 4.59 3.96 3.63Geriatrics 0.00 0.00 0.00 0.00 0.00Haematology 10.46 4.74 3.85 3.43 2.55Human Genetics 4.77 4.40 3.01 2.81 2.71Medical & Radiation Oncology 8.70 7.93 6.29 6.25 2.92Neurology 8.67 7.78 6.58 6.10 4.11Neurosurgery 11.39 8.34 7.18 7.11 6.77Nuclear Medicine 4.67 4.02 3.22 3.05 2.73Renal Transplant * 11.48 12.67 7.15 5.86 4.93Rheumatology 6.97 5.07 4.41 4.09 3.42Total T2 services 7.04 6.15 5.09 4.76 4.66* Renal transplant ALOS refers to all admissions of prospective and past recipients, not simply to immediate post-transplant stay Central Referral Services: Average Length of Stay Mean Median 75 percentile 80 percentile 90 percentile Group 3 - Liver & Pancreas Hepatology 0.15 0.15 0.15Liver Transplant 0.06 0.06 0.06Surgery 0.27 0.03 0.29 0.44 0.72
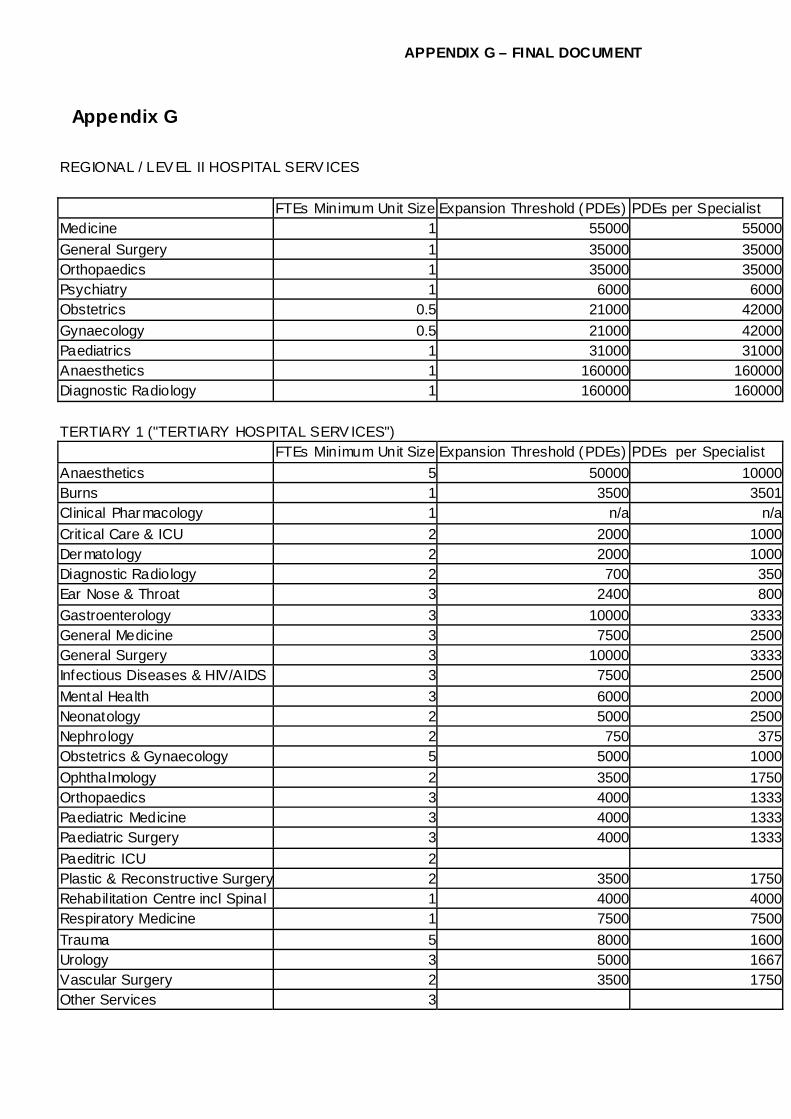
APPENDIX G – FINAL DOCUMENT
Appendix G
REGIONAL / LEV EL II HOSPITAL SERV ICES FTEs Minimum Unit Size Expansion Threshold (PDEs) PDEs per Specialist Medicine 1 55000 55000General Surgery 1 35000 35000Orthopaedics 1 35000 35000Psychiatry 1 6000 6000Obstetrics 0.5 21000 42000Gynaecology 0.5 21000 42000Paediatrics 1 31000 31000Anaesthetics 1 160000 160000Diagnostic Radiology 1 160000 160000 TERTIARY 1 ("TERTIARY HOSPITAL SERV ICES") FTEs Minimum Unit Size Expansion Threshold (PDEs) PDEs per Specialist Anaesthetics 5 50000 10000Burns 1 3500 3501Clinical Pharmacology 1 n/a n/aCrit ical Care & ICU 2 2000 1000Dermatology 2 2000 1000Diagnostic Radiology 2 700 350Ear Nose & Throat 3 2400 800Gastroenterology 3 10000 3333General Medicine 3 7500 2500General Surgery 3 10000 3333Infectious Diseases & HIV/AIDS 3 7500 2500Mental Health 3 6000 2000Neonatology 2 5000 2500Nephrology 2 750 375Obstetrics & Gynaecology 5 5000 1000Ophthalmology 2 3500 1750Orthopaedics 3 4000 1333Paediatric Medicine 3 4000 1333Paediatric Surgery 3 4000 1333Paeditric ICU 2 Plastic & Reconstructive Surgery 2 3500 1750Rehabilitation Centre incl Spinal 1 4000 4000Respiratory Medicine 1 7500 7500Trauma 5 8000 1600Urology 3 5000 1667Vascular Surgery 2 3500 1750Other Services 3

APPENDIX G – FINAL DOCUMENT
TERTIARY 2 (NATIONAL REFERRAL HOSPITAL SERV ICES) FTEs Minimum Unit Size Expansion Threshold (PDEs) PDEs per Specialist Anaesthetics 4 50000 12500Cardiology 3 2000 667Cardiothoracic Surgery 3 3500 1167Clinical Immunology 1 7500 7500Craniofacial Surgery 3 3500 1167Crit ical Care & ICU 1 2000 2000Diagnostic Radiology 2 700 350Ear Nose & Throat 1 2400 2400Endocrinology 2 7500 3750Geriatrics 3 7500 2500Haematology 3 7500 2500Human Genetics 4 7500 1875Infectious Diseases 1 7500 7500Medical & Radiation Oncology 10 1500 150Neurology 4 2000 500Neurosurgery 5 2000 400Nuclear Medicine 3 1500 500Obstetrics & Gynaecology 3 5000 1667Ophthalmology 2 3500 1750Other Services 3 Plastic & Reconstructive 1 3500 3500Renal Transplant 3 3500 1167Rheumatology 3 7500 2500Urology 1 5000 5000Vascular Surgery 1 3500 3500T2 Paediatric Sub-Specialt ies 15 4000 267Rehabilitation (incl. Spinal Injury) 1 4000 4000

APPENDIX G – FINAL DOCUMENT
TERTIARY 3 (CENTRAL REFERRAL UNITS) FTEs Minimum Unit Size Expansion Threshold (PDEs) PDEs per Specialist Group 1 - Chest Cardiology 1 n/a n/aCardiothoracic 1 n/a n/aRespiratory Medicine 1 n/a n/a Group 2 - Radiology Radiology 1 n/a n/aNuclear Medicine 1 n/a n/aMedical & Radiation Oncology 1 n/a n/aHaematology 1 n/a n/a Group 3 - Liver & Pancreas Hepatology 2 n/a n/aLiver Transplant 2 n/a n/aSurgery 1 n/a n/aNephrology 1 n/a n/a National Referral Centres: Clinical Immunology 1 n/a n/aClinical Pharmacology 3 n/a n/aDermatology 2 n/a n/aEndocrinology 2 n/a n/aENT 2 n/a n/aHuman Genetics 2 n/a n/aOphthalmology 2 n/a n/aInfectious Diseases 2 n/a n/aMaxillofacial Surgery 3 n/a n/aPaediatrics 10 n/a n/a

APPENDIX H – FINAL DOCUM ENT
Appendix H
Specialist Requirement for Tertiary and Regional Hospitals 2014
Specialists Anaesthetics 242Burns 26Cardiology 37Cardiothoracic Surgery 21Clinical Immunology 8Clinical Pharmacology 6Craniofacial Surgery 18Critical Care & ICU 40Dermatology 39Diagnostic Radiology 248Ear Nose & Throat 52Endocrinology 16Gastroenterology 39General Medicine 218Other Services 0General Surgery 219Geriatrics 18Haematology 20Hepatology 4Human Genetics 28Infectious Diseases & HIV/AIDS 43Liver Transplant 4Maxillofacial Surgery 6Medical & Radiation Oncology 89Mental Health 167Neonatology 27Nephrology 49Neurology 24Neurosurgery 39Nuclear Medicine 25Obstetrics & Gynaecology 246Ophthalmology 76Orthopaedics 227Paediatric Medicine & Surgery 465Paediatric ICU 0Plastic & Reconstructive Surgery 34Rehabilitation (incl. Spinal Injury) 23Renal Transplant 18Respiratory Medicine 18Rheumatology 18Trauma 65Urology 54Vascular Surgery 32Total Requirement 3,052

APPENDIX I – FINAL DOCUM ENT
Appendix I Total Separations (Inpatient plus Day Cases) Regional Hospitals Current rates per 1000 Populations
33 percentile Mean Median 66 percentile 75 percentile
80 percentille Median
Offset Downgraded T1 Rate in Use
Medicine 7.58 8.89 11.86 19.18 21.51 23.48 11.86 0.47 12.33Tuberculosis 0.32 0.36 0.43 1.16 1.31 1.40 0.43 0.43Surgery 6.69 8.27 11.05 15.22 17.35 19.45 11.05 0.43 11.48Orthopaedics 0.23 0.03 0.25 0.26 0.41 0.51 0.25 0.03 0.27Psychiatry 0.09 0.08 0.18 0.26 1.30 1.92 0.18 0.18Maternity 7.66 8.27 10.36 13.42 16.58 16.97 10.36 0.28 10.63Gynaecology 0.44 0.13 0.67 0.88 1.47 1.82 0.67 0.67Paediatrics 3.90 5.20 5.19 7.66 9.24 10.34 5.19 0.11 5.30Total 29.19 30.93 40.61 50.23 60.61 68.28 40.61 40.61
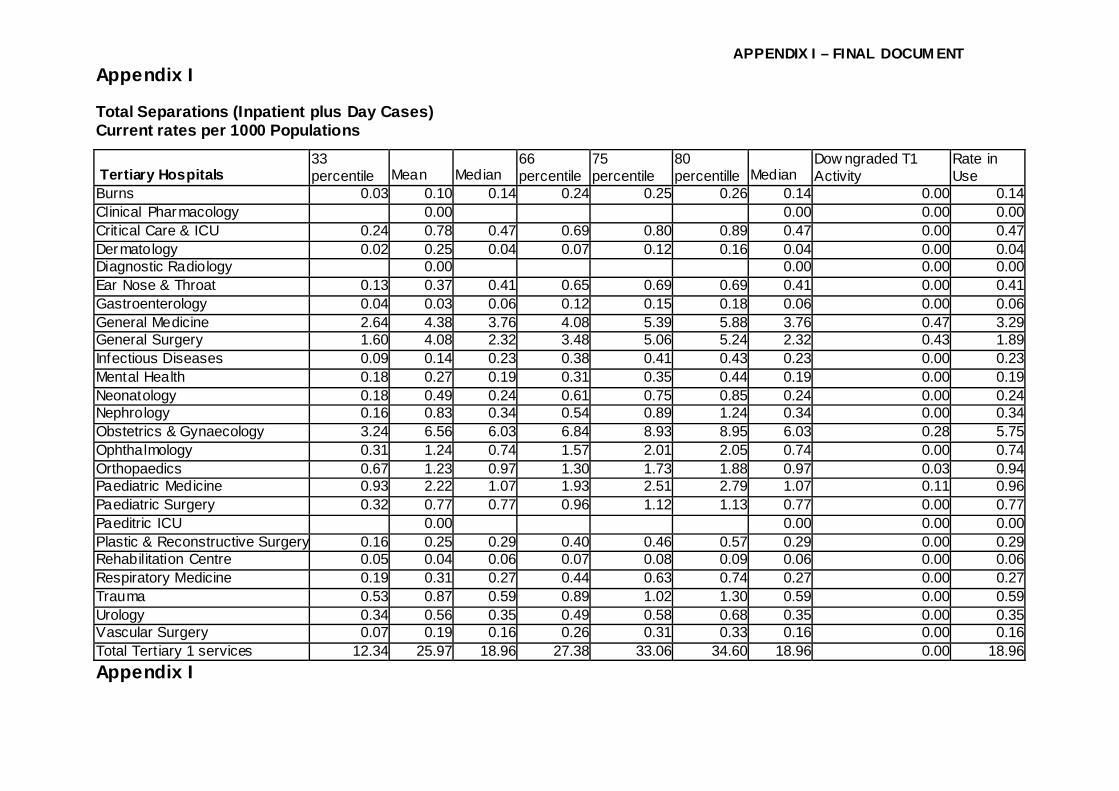
APPENDIX I – FINAL DOCUM ENT
Appendix I Total Separations (Inpatient plus Day Cases) Current rates per 1000 Populations
Tertiary Hospitals 33 percentile Mean Median
66 percentile
75 percentile
80 percentille Median
Dow ngraded T1 Activity
Rate in Use
Burns 0.03 0.10 0.14 0.24 0.25 0.26 0.14 0.00 0.14Clinical Pharmacology 0.00 0.00 0.00 0.00Crit ical Care & ICU 0.24 0.78 0.47 0.69 0.80 0.89 0.47 0.00 0.47Dermatology 0.02 0.25 0.04 0.07 0.12 0.16 0.04 0.00 0.04Diagnostic Radiology 0.00 0.00 0.00 0.00Ear Nose & Throat 0.13 0.37 0.41 0.65 0.69 0.69 0.41 0.00 0.41Gastroenterology 0.04 0.03 0.06 0.12 0.15 0.18 0.06 0.00 0.06General Medicine 2.64 4.38 3.76 4.08 5.39 5.88 3.76 0.47 3.29General Surgery 1.60 4.08 2.32 3.48 5.06 5.24 2.32 0.43 1.89Infectious Diseases 0.09 0.14 0.23 0.38 0.41 0.43 0.23 0.00 0.23Mental Health 0.18 0.27 0.19 0.31 0.35 0.44 0.19 0.00 0.19Neonatology 0.18 0.49 0.24 0.61 0.75 0.85 0.24 0.00 0.24Nephrology 0.16 0.83 0.34 0.54 0.89 1.24 0.34 0.00 0.34Obstetrics & Gynaecology 3.24 6.56 6.03 6.84 8.93 8.95 6.03 0.28 5.75Ophthalmology 0.31 1.24 0.74 1.57 2.01 2.05 0.74 0.00 0.74Orthopaedics 0.67 1.23 0.97 1.30 1.73 1.88 0.97 0.03 0.94Paediatric Medicine 0.93 2.22 1.07 1.93 2.51 2.79 1.07 0.11 0.96Paediatric Surgery 0.32 0.77 0.77 0.96 1.12 1.13 0.77 0.00 0.77Paeditric ICU 0.00 0.00 0.00 0.00Plastic & Reconstructive Surgery 0.16 0.25 0.29 0.40 0.46 0.57 0.29 0.00 0.29Rehabilitation Centre 0.05 0.04 0.06 0.07 0.08 0.09 0.06 0.00 0.06Respiratory Medicine 0.19 0.31 0.27 0.44 0.63 0.74 0.27 0.00 0.27Trauma 0.53 0.87 0.59 0.89 1.02 1.30 0.59 0.00 0.59Urology 0.34 0.56 0.35 0.49 0.58 0.68 0.35 0.00 0.35Vascular Surgery 0.07 0.19 0.16 0.26 0.31 0.33 0.16 0.00 0.16Total Tert iary 1 services 12.34 25.97 18.96 27.38 33.06 34.60 18.96 0.00 18.96Appendix I

APPENDIX I – FINAL DOCUM ENT
Total Separations (Inpatient plus Day Cases) Current rates per 1000 Populations
National Referral Services
33 percentile Mean Median
66 percentile
75 percentile
80 percentille Median
Dow ngraded T1 Activity
Rate in Use
0.00 Cardiology 0.33 0.66 0.40 0.42 0.43 0.45 0.40 0.40Cardiothoracic Surgery 0.12 0.26 0.14 0.15 0.16 0.25 0.14 0.14Clinical Immunology 0.01 0.05 0.01 0.02 0.02 0.03 0.01 0.01Craniofacial Surgery 0.03 0.06 0.03 0.06 0.07 0.08 0.03 0.03Crit ical Care & ICU 0.00 0.05 0.05Diagnostic Radiology 0.00 0.00 0.00Ear Nose & Throat 0.00 0.00 0.00Endocrinology 0.06 0.14 0.07 0.07 0.07 0.08 0.07 0.07Geriatrics 0.00 0.10 Assumption 0.10Haematology 0.13 0.19 0.17 0.45 0.61 0.69 0.17 0.17Human Genetics 0.01 0.05 0.01 0.01 0.01 0.01 0.01 80%ile 0.01Infectious Diseases 0.00 0.00 0.00Medical & Radiation Oncology 0.28 0.59 0.36 0.62 0.77 0.84 0.36 0.36Neurology 0.23 0.00 0.00 0.00 0.00 0.23 0.23Neurosurgery 0.14 0.33 0.14 0.18 0.20 0.28 0.14 0.14Nuclear Medicine 0.05 0.10 0.06 0.17 0.24 0.27 0.06 0.06Obstetrics & Gynaecology 0.00 0.00 0.00Ophthalmology 0.00 0.00 0.00Orthopaedics 0.00 0.00 0.00Plastic & Reconstructive 0.00 0.00 0.00Renal Transplant 0.00 0.02 0.00 0.03 0.05 0.06 0.02 0.02Rheumatology 0.06 0.05 0.08 0.10 0.11 0.11 0.08 0.08Urology 0.00 0.00 0.00Vascular Surgery 0.00 0.00 0.00T2 Paediatrics 0.00 0.20 Assumption 0.20Total T2 services 1.23 2.72 1.44 1.65 1.77 2.50 1.44 1.44

APPENDIX I – FINAL DOCUM ENT
Central Referral Units 33 percentile Mean Median
66 percentile
75 percentile
80 percentille Median Rate in Use
Group 1 - Chest 0.00 0.00Cardiology 0.00 0.02 0.02Cardiothoracic 0.00 0.02 0.02Respiratory Medicine 0.00 0.02 0.02 Group 2 - Radiology Radiology 0.00 0.00 0.00Nuclear Medicine 0.00 0.00 0.00Medical & Radiation Oncology 0.00 0.00 0.00Haematology 0.00 0.00 0.00 Group 3 - Liver & Pancreas Hepatology 0.00 0.00 0.00Liver Transplant 0.01 0.00 0.01 0.01 0.01 0.01 0.01 0.01Surgery 0.09 0.09 0.09 0.09 0.09 0.09 0.03 0.03Nephrology 0.00 0.00 0.00 National Referral Centres: 0.00 0.00 0.00 0.00 0.00 0.00 0.00Clinical Immunology 0.00 0.02 0.02Clinical Pharmacology 0.00 0.02 0.02Dermatology 0.00 0.02 0.02Endocrinology 0.00 0.02 0.02ENT 0.00 0.02 0.02Human Genetics 0.00 0.02 0.02Ophthalmology 0.00 0.02 0.02Infectious Diseases 0.00 0.02 0.02Maxillofacial Surgery 0.00 0.02 0.02Paediatrics 0.00 0.02 0.02Total T3 services 0.09 0.09 0.09 0.09 0.09 0.09 0.09 0.09

APPENDIX I – FINAL DOCUM ENT
Total Outpatient Visits Current Rates per 1000 Populations
Regional Hospitals 33 percentile Mean Median 66 percentile 75 percentile
80 percentille Median Offset Downgraded T1 Rate in Use
Medicine 0.00 Tuberculosis 0.00 Surgery 0.00 Orthopaedics 0.00 Psychiatry 0.00 Maternity 0.00 Gynaecology 0.00 Paediatrics 0.00 Total 71.70 87.56 99.41 134.88 169.53 231.23 99.41 13.79 113.19Casualty 26.37 34.66 49.69 75.91 94.97 113.70 49.69 49.69

APPENDIX I – FINAL DOCUM ENT
Total Outpatient Visits Current Rates per 1000 Populations
Tertiary hospitals 33 percentile Mean Median 66 percentile 75 percentile
80 percentille Median Offset Downgraded T1 Rate in Use
Burns 0.11 0.13 0.18 0.23 0.29 0.35 0.18 0.00 0.18Clinical Pharmacology 0.00 0.00 0.00 0.00Critical Care & ICU 0.41 0.29 0.45 0.66 0.77 1.19 0.45 0.00 0.45Dermatology 1.09 4.03 2.19 3.54 4.72 5.89 2.19 0.00 2.19Diagnostic Radiology 1.34 3.35 2.26 2.46 3.20 5.27 2.26 0.00 2.26Ear Nose & Throat 1.86 1.87 2.76 2.84 4.85 5.53 2.76 0.00 2.76Gastroenterology 0.62 0.13 0.92 0.96 0.99 1.00 0.92 0.00 0.92General Medicine 0.00 0.00 0.00 0.00General Surgery 0.00 0.00 0.00 0.00Infectious Diseases 0.40 0.55 1.02 1.72 2.12 2.80 1.02 0.00 1.02Mental Health 0.00 0.00 0.00 0.00Neonatology 0.06 0.11 0.11 0.25 0.38 0.45 0.11 0.00 0.11Nephrology 0.99 2.49 1.49 4.12 6.21 6.70 1.49 0.00 1.49Obstetrics & Gynaecology 1.76 6.65 2.97 13.14 14.29 14.76 2.97 0.06 2.90Ophthalmology 2.71 6.22 5.31 11.02 13.05 13.74 5.31 0.00 5.31Orthopaedics 3.16 6.08 5.56 9.92 12.58 12.72 5.56 0.00 5.55Paediatric Medicine 0.00 0.00 0.00 0.00Paediatric Surgery 0.33 0.72 0.47 0.80 1.13 1.25 0.47 0.00 0.47Paeditric ICU 0.00 0.00 0.00 0.00Plastic & Reconstructive Surgery 0.71 0.87 1.47 2.17 2.28 2.32 1.47 0.00 1.47Rehabilitation Centre 0.29 0.10 0.34 0.46 0.52 0.56 0.34 0.00 0.34Respiratory Medicine 1.14 1.58 1.20 3.24 3.62 3.82 1.20 0.00 1.20Trauma 17.82 29.69 25.32 30.58 34.55 35.92 25.32 0.00 25.32Urology 0.00 0.00 0.00 0.00Vascular Surgery 0.15 0.36 0.45 0.79 1.27 1.34 0.45 0.00 0.45Total Tertiary 1 services 30.49 65.24 42.33 76.13 94.53 120.52 42.33 0.06 42.27Remaining OPD Visits 33.22 111.77 58.80 123.97 152.90 163.46 58.80 13.73 45.08
0.00 0.00 0.00 0.00 0.00 0.00 0.00 13.79 -13.79

APPENDIX I – FINAL DOCUM ENT
Total Outpatient Visits Current Rates per 1000 Populations National Referral Services 33 percentile Mean Median 66 percentile 75 percentile 80 percentille Median Offset Downgraded T1 Rate in Use 0.00 Cardiology 1.32 3.46 1.33 1.33 1.34 1.76 1.33 1.33Cardiothoracic Surgery 0.12 0.45 0.15 0.36 0.48 0.52 0.15 0.15Clinical Immunology 0.11 1.64 0.15 0.32 0.41 0.46 0.15 0.15Craniofacial Surgery 0.94 0.45 0.99 1.04 1.07 1.09 0.99 0.99Critical Care & ICU 0.00 0.00 0.00Diagnostic Radiology 0.00 0.20 Assumption 0.20Ear Nose & Throat 0.00 0.20 Assumption 0.20Endocrinology 0.53 1.40 0.55 1.14 1.47 2.07 0.55 0.55Geriatrics 0.00 0.20 Assumption 0.20Haematology 0.17 0.65 0.34 0.70 0.89 1.24 0.34 0.34Human Genetics 0.08 0.11 0.09 0.22 0.29 0.33 0.09 80%ile 0.09Infectious Diseases 0.00 0.15 0.15Medical & Radiation Oncology 3.09 5.84 4.93 7.82 9.45 10.10 4.93 4.93Neurology 0.44 2.60 0.50 0.50 0.50 0.64 0.50 0.50Neurosurgery 0.70 0.84 1.11 1.53 1.76 3.24 1.11 1.11Nuclear Medicine 1.82 1.82 1.82Obstetrics & Gynaecology 0.00 0.50 0.50Ophthalmology 0.00 0.60 0.60Orthopaedics 0.00 0.90 0.90Plastic & Reconstructive 0.52 0.00 0.74 0.92 1.03 1.08 0.74 0.74Renal Transplant 0.44 0.32 0.54 0.63 0.98 1.18 0.54 0.54Rheumatology 0.67 0.20 0.20Urology 0.00 0.20 0.20Vascular Surgery 0.00 0.04 0.04T2 Paediatrics 10.32 0.00 14.40 14.46 14.49 20.16 14.40 14.40Total T2 services 0.00 30.84 30.84

APPENDIX I – FINAL DOCUM ENT
Central Referral Units 33 percentile Mean Median 66 percentile 75 percentile 80 percentille Median Offset Downgraded T1 Rate in Use Group 1 - Chest Cardiology 0.00 0.20 0.20Cardiothoracic 0.00 0.20 0.20Respiratory Medicine 0.00 0.20 0.20 Group 2 - Radiology Radiology 0.00 0.20 0.20Nuclear Medicine 0.00 0.20 0.20Medical & Radiation Oncology 0.00 0.20 0.20Haematology 0.00 0.20 0.20 Group 3 - Liver & Pancreas Hepatology 0.02 0.00 0.00Liver Transplant 0.07 0.15 0.07 0.07 0.07 0.07 0.07 0.07Surgery 0.02 0.00 0.02 0.02 0.02 0.02 0.20 0.20Nephrology 0.00 0.00 0.00 National Referral Centres: Clinical Immunology 0.00 0.20 0.20Clinical Pharmacology 0.00 0.20 0.20Dermatology 0.00 0.20 0.20Endocrinology 0.00 0.20 0.20ENT 0.00 0.20 0.20Human Genetics 0.00 0.20 0.20Ophthalmology 0.00 0.20 0.20Infectious Diseases 0.00 0.20 0.20Maxillofacial Surgery 0.00 0.20 0.20Paediatrics 0.17 0.20 0.20Total T3 services 0.09 0.00 0.09 0.09 0.09 0.09 3.67 3.67

APPENDIX J - FINAL DOCUM ENT
Appendix J Beds Baseline Province Regional Tertiary Total Eastern Cape 1,431 2,637 4,068 Free State 767 1,613 2,380 Gauteng 5,020 6,128 11,148 Kw aZulu Natal 6,361 3,038 9,399 Limpopo 913 500 1,413 Mpumalanga 1,331 308 1,639 Northern Cape 0 0 0 North West 381 1,447 1,828 Western Cape 1,509 1,179 2,688 South Africa 17,713 16,850 34,563 Medical Specialists Province Total Eastern Cape 58 Free State 148 Gauteng 641 Kw aZulu Natal 227 Limpopo 26 Mpumalanga 8 Northern Cape 13 North West 14 Source: Persal Western Cape 448 All medical specialists (excl. dental)
South Africa 1,583 Includes those w orking outside regional and tertiary hospitals

APPENDIX J - FINAL DOCUM ENT
Total Patient Separations (Inpatients plus Day Cases) Prov ince Regional Tertiary 1 Tertiary 2 Tertiary 3 Total Tertiary Combined Total Eastern Cape 74,053 125,536 35,023 8,160 168,719 242,772Free State 40,691 78,458 2,860 0 81,318 122,009Gauteng 368,986 46,478 247,261 18,106 311,845 680,831KwaZulu Natal 363,764 87,183 27,258 1,810 116,251 480,015Limpopo 75,474 28,194 8,259 0 36,453 111,927Mpumalanga 61,907 31,815 0 0 31,815 93,722Northern Cape 0 29,833 17,951 1,830 49,614 49,614North West 14,980 79,275 8,884 0 88,159 103,139Western Cape 133,811 135,346 81,369 18,796 235,511 369,322South Africa 1,133,666 642,118 428,865 48,702 1,119,685 2,253,351
Outpatient Visits
Prov ince Regional Tertiary 1 Tertiary 2 Tertiary 3 Total Tertiary Combined Total Eastern Cape 221,129 360,759 208,982 50,429 620,170 841,299Free State 186,354 295,905 409 3,748 300,062 486,416Gauteng 1,674,322 1,004,309 822,267 119,228 1,945,804 3,620,126KwaZulu Natal 1,778,799 708,252 122,420 4,742 835,414 2,614,213Limpopo 335,534 116,671 18,156 0 134,827 470,361Mpumalanga 235,003 160,113 0 0 160,113 395,116Northern Cape 0 22,396 39,737 1,325 63,458 63,458North West 72,400 52,532 331,677 0 384,209 456,609Western Cape 376,836 203,824 1,052,803 8,283 1,264,910 1,641,746South Africa 4,880,377 2,924,761 2,596,451 187,755 5,708,967 10,589,344

APPENDIX J - FINAL DOCUM ENT
Total Service Recurrent Costs (2004/05 prices) Province Regional Tertiary Total Eastern Cape 651,877,243 586,880,618 1,238,757,861 Free State 657,269,654 511,513,214 1,168,782,868 Gauteng 1,667,360,455 3,533,662,739 5,201,023,194 Kw aZulu Natal 1,850,723,323 1,242,283,748 3,093,007,070 Limpopo 323,063,682 275,761,547 598,825,229 Mpumalanga 609,393,366 0 609,393,366 Northern Cape 0 269,175,366 269,175,366 North West 260,658,731 219,503,399 480,162,130 Western Cape 632,075,483 1,596,138,993 2,228,214,476 South Africa 6,652,421,936 8,234,919,624 14,887,341,560

APPENDIX J - FINAL DOCUM ENT
Scenario 20 09 Beds Prov ince Regional Tertiary 1 Tertiary 2 Tertiary 3 Total Tertiary Combined Total Eastern Cape 1,711 1,231 0 0 1,231 2,942Free State 1,128 165 231 0 397 1,524Gauteng 5,416 2,421 405 116 2,942 8,358KwaZulu Natal 5,130 1,047 414 0 1,460 6,590Limpopo 1,557 587 190 0 777 2,334Mpumalanga 826 286 0 0 286 1,112Northern Cape 161 286 0 0 286 448North West 974 543 0 0 543 1,517Western Cape 2,421 870 324 56 1,251 3,671South Africa 19,324 7,436 1,565 172 9,173 28,497
Specialists Prov ince Regional Tertiary 1 Tertiary 2 Tertiary 3 Total Tertiary Combined Total Eastern Cape 42 88 0 0 88 130Free State 60 49 96 0 146 206Gauteng 175 335 172 37 544 719KwaZulu Natal 149 169 116 0 285 434Limpopo 43 48 84 0 132 175Mpumalanga 25 30 0 0 30 55Northern Cape 16 33 0 0 33 49North West 32 42 0 0 42 75Western Cape 96 148 100 37 285 381South Africa 638 943 568 74 1,585 2,223
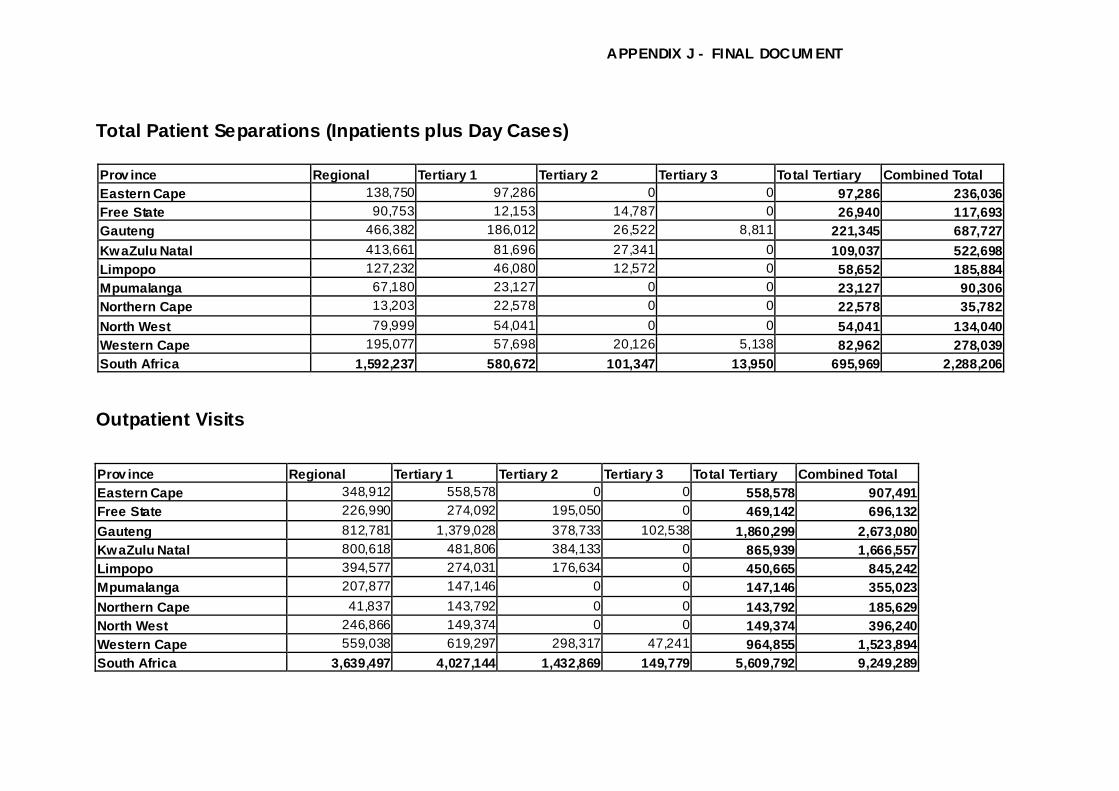
APPENDIX J - FINAL DOCUM ENT
Total Patient Separations (Inpatients plus Day Cases) Prov ince Regional Tertiary 1 Tertiary 2 Tertiary 3 Total Tertiary Combined Total Eastern Cape 138,750 97,286 0 0 97,286 236,036Free State 90,753 12,153 14,787 0 26,940 117,693Gauteng 466,382 186,012 26,522 8,811 221,345 687,727KwaZulu Natal 413,661 81,696 27,341 0 109,037 522,698Limpopo 127,232 46,080 12,572 0 58,652 185,884Mpumalanga 67,180 23,127 0 0 23,127 90,306Northern Cape 13,203 22,578 0 0 22,578 35,782North West 79,999 54,041 0 0 54,041 134,040Western Cape 195,077 57,698 20,126 5,138 82,962 278,039South Africa 1,592,237 580,672 101,347 13,950 695,969 2,288,206
Outpatient Visits Prov ince Regional Tertiary 1 Tertiary 2 Tertiary 3 Total Tertiary Combined Total Eastern Cape 348,912 558,578 0 0 558,578 907,491Free State 226,990 274,092 195,050 0 469,142 696,132Gauteng 812,781 1,379,028 378,733 102,538 1,860,299 2,673,080KwaZulu Natal 800,618 481,806 384,133 0 865,939 1,666,557Limpopo 394,577 274,031 176,634 0 450,665 845,242Mpumalanga 207,877 147,146 0 0 147,146 355,023Northern Cape 41,837 143,792 0 0 143,792 185,629North West 246,866 149,374 0 0 149,374 396,240Western Cape 559,038 619,297 298,317 47,241 964,855 1,523,894South Africa 3,639,497 4,027,144 1,432,869 149,779 5,609,792 9,249,289

APPENDIX J - FINAL DOCUM ENT
Scenario 2014 Beds Prov ince Regional Tertiary 1 Tertiary 2 Tertiary 3 Total Tertiary Combined Total Eastern Cape 1,788 1,404 0 0 1,404 3,193Free State 1,167 171 148 0 319 1,486Gauteng 5,262 2,009 273 113 2,396 7,658KwaZulu Natal 5,271 1,369 279 0 1,648 6,919Limpopo 1,707 804 128 0 932 2,639Mpumalanga 894 431 0 0 431 1,325Northern Cape 180 423 0 0 423 603North West 1,077 529 0 0 529 1,606Western Cape 2,376 824 239 58 1,122 3,498South Africa 19,722 7,964 1,067 171 9,203 28,925
Specialists Prov ince Regional Tertiary 1 Tertiary 2 Tertiary 3 Total Tertiary Combined Total Eastern Cape 77 193 0 0 193 270Free State 94 49 87 0 137 231Gauteng 283 342 164 42 548 831KwaZulu Natal 261 250 102 0 352 613Limpopo 88 128 80 0 207 296Mpumalanga 50 65 0 0 65 115Northern Cape 16 87 0 0 87 103North West 57 95 0 0 95 152Western Cape 146 157 96 42 295 441South Africa 1,072 1,367 529 84 1,980 3,052

APPENDIX J - FINAL DOCUM ENT
Total Patient Separations (Inpatients plus Day Cases) Prov ince Regional Tertiary 1 Tertiary 2 Tertiary 3 Total Tertiary Combined Total Eastern Cape 172,157 143,189 0 0 143,189 315,347Free State 112,619 16,566 14,932 0 31,499 144,118Gauteng 533,862 200,145 26,558 8,616 235,320 769,182KwaZulu Natal 509,680 139,899 27,392 0 167,291 676,971Limpopo 165,706 82,326 12,595 0 94,921 260,628Mpumalanga 86,659 44,607 0 0 44,607 131,265Northern Cape 17,436 32,609 0 0 32,609 50,045North West 104,622 62,285 0 0 62,285 166,907Western Cape 226,372 69,737 20,655 5,086 95,478 321,850South Africa 1,929,114 791,364 102,132 13,702 907,199 2,836,313
Outpatient Visits Prov ince Regional Tertiary 1 Tertiary 2 Tertiary 3 Total Tertiary Combined Total Eastern Cape 364,286 793,313 0 0 793,313 1,157,599Free State 240,529 294,538 203,645 0 498,183 738,712Gauteng 866,252 1,381,063 395,421 107,056 1,883,540 2,749,792KwaZulu Natal 895,782 865,049 401,059 0 1,266,108 2,161,890Limpopo 411,963 495,447 184,417 0 679,864 1,091,827Mpumalanga 217,037 266,767 0 0 266,767 483,804Northern Cape 43,681 159,801 0 0 159,801 203,482North West 257,744 255,316 0 0 255,316 513,060Western Cape 584,214 674,425 343,396 49,323 1,067,144 1,651,358South Africa 3,881,487 5,185,719 1,527,938 156,379 6,870,036 10,751,524

APPENDIX K - FINAL DOCUMENT
PREFERRED OPTION (2014)
REGIONAL AND TERTIARY HOSPITALS

APPENDIX K - FINAL DOCUMENT
PREFERRED OPTION (2014)
TERTIARY HOSPITALS