national open university of nigeria school of …nouedu.net/sites/default/files/2017-03/bio...
TRANSCRIPT

1
NATIONAL OPEN UNIVERSITY OF NIGERIA
SCHOOL OF ARTS AND SOCIAL SCIENCES
COURSE CODE: BIO 316
COURSE TITLE: INTRODUCTION TO BIOINFORMATICS

2
Course Code : BIO 316 Course Title : Introduction to Bioinformatics Credit units : 1Unit Course Team : Dr. Idowu Adewumi Taiwo (Developer/Writer) University of Lagos Course Editor: Professor J. Okpuzor University of Lagos Programme Leader: Professor A. Adebanjo Course Coordinator: Adams Abiodun E. NATIONAL OPEN UNIVERSITY OF NIGERIA National Open University of Nigeria Headquarters 14/16 Ahmadu Bello Way Victoria Island Lagos. Abuja Office No 5 Dar es Salam Street Off Aminu Kano Crescent Abuja.

3
MODULE 1 Unit 1: UNIT 1 The Nature and History of Bioinformatics UNIT 2 Databases UNIT 3 Database Format Unit 1: The Nature and History of Bioinformatics Content 1.0 Introduction 2.0 Objectives 3.0 Main Content 3.1 What is Bioinformatics 3.1.1 Definition 3.1.2 Historical Development 4.0 Conclusion 5.0 Summary 6.0 Tutor Marked Assessment 7.0 References/Further Reading 1.0 Introduction
In the 21st century,Biology is being transformed from a purely laboratory-based science to an information science too. The information refers to comprehensive view of DNA sequences, RNA expression and protein interactions. Due to explosion of sequence and structure information available to researchers, people have become optimistic to get answer of fundamental biomedical problems. Similar progress has also been made in computer-based technology also.
In 1987, when the Human Genome Project was conceived of, the field of bioinformatics was in its infancy. Today, bioinformatics has become a recognized discipline on its own, born out of the necessity to bring together the information sciences and the biological sciences in understanding the wealth of data that has been created through various projects around the world.
2.0 Objectives
(i) To give bioinformatics a standard definition (ii) To know the stages and the processes involved in the development of
bioinformatics as a discipline. 3.0 Main Content 3.1 What is Bioinformatics

4
3.1.1 Definition Bioinformatics can be defined as management and analysis of biological information stored in databases.
3.1.2 Historical Development In 1962, using sequence variability, Zuckerkandl and Pauling proposed a new strategy to study evolutionary relationsbetween the organisms which is called „molecular evolution‟. This theory was based on the facts that similarity exists among the functionally related (homologous) protein sequences Margaret O. Dayhoff found that during evolution protein sequences undergo changes according to certain patterns such as: (i) preferential alteration (replacement) in amino acids with amino acids of similar physic-chemical characteristics (but not randomly), (ii) no replacement of some amino acids (e.g. tryptophan) by any other amino acids, and (iii) ;development of a point accepted mutation (PAM) on the basis of several bomologous sequences.
Further work on sequence comparison on the basis of quantitative strategy was carried out. In 1965, Dayhoff and co-workers collected all the protein sequences known at that time and catalogued them as the Atlas of Protein Sequence and Structure which was first published by the National Biomedical Research Foundation. Later on collection of such macromolecular sequences was published under the above title from 1965-1978. The above printed book laid the foundation for the resources that the entire biotechnology community now depends for day-to-day work in computational biology. The development of computer methods pioneered by Dayhoff and her research group is applicable: (i) in comparing protein sequences, (ii) detecting distantly related sequences and duplication within sequences, and (iii) deducing the evolutionary histories from alignment of protein sequences.
In 1980, the advent of the DNA sequence database led to the next phase in database sequence information through establishment of a data library by the European Molecular Biology Laboratory (EMBL). The purpose of establishing data library was to collect, organize and distribute data on nucleotide sequence and other information related to them. The European Bioinformatics Institute (EBI) is its successor that is situated at Hinxton, Cambridge, United Kingdom.
In 1984, the National Biomedical Research Foundation (NBRF) established the protein information resource (PIR). The NBRF helps the scientists in identifying and interpreting the information of protein sequences.
In 1988, the National Institute of Health (NIH), U.S.A. developed the National Centre for Biotechnology Information (NCBI) as a division of the National Library of Medicine (NLM) to develop information system in molecular biology. The DNA Databank of Japan (DDBJ) at Mishima joined the data collecting collaboration a few years later.

5
The NCBI built the GenBank, the National Institute of Health (NIH) genetic sequence database GenBank is an annotated collection of all publically available nucleotide and protein sequences. The record within GenBank represents single contig (contiguous) selection of DNA or RNA with annotations. In 1988, the three partners (DDBJ, EMBL and GenBank) of the International Nucleotide SequenceDatabaseCollaboration had a meeting and agreed to use a common format. All the therecentres provide separate points of data submission, yet exchange this information daily making the same database available at large. All the three centres are collecting, direct submitting and distributing them so that each centre has copies of all the sequences. Hence, they can act as a primary distribution centre for these sequences. Moreover, all the databases have collaboration with each other. They regularly exchange their data.
New sequence data are accumulating day-by-day. Therefore, there is a need for powerful software so that sequences can be analyzed. For the development of algorighms [any sequence of actions (e.g. computational steps) that perform a particular task] firm basis of mathematics is needed. Now mathematicians, biologists and computer scientists are taking much interest in bioinformatics. Moreover, biologists are curious to ask reservoir of all such information because they are widely interconnected through network.
Thus bioinformatics is aimed at: (i) the development of powerful software for data analysis, and (ii) benefit the researchers through disseminating the scientifically investigated knowledge, etc. The nucleotide and amino acid monomers are represented by limited alphabets. The properties of biopolymers i.e. macromolecules (e.g. DNA, RNA proteins) are such that they can be transformed into sequences having digital symbols. Genetic data and other biological data are differentiated by these digital data. This resulted in the progress of bioinformatics.
In a parallel track, the foundations for the Swiss-Prot protein sequence database also were laid in the early 1980s, when Amos Bairoch at the University of Geneva converted PIR‟s Atlas to a format similar to that used by EMBL for its nucleotide database. In this initial release, called PIR+, additional information about each of the proteins was added, increasing its value as a curated, well-annotated source of information on proteins. In this initial release, called PIR+, additional information about each of the proteins was added, increasing its value as a curated, well-annotated source of information on proteins. In the summer of 1986, Bairoch began distributing PIR+ on the US BIONET (a precursor to the Internet), renaming it Swiss-Prot. At that time, it contained t he grand sum of 3900 protein sequences; this was seen as an over-whelming amount of data, in stark contrast to today‟s standards. Because Swiss-Prot and EMBL followed similar formats, a natural collaboration developed between these two European groups; these collaborative efforts strengthened when both EMBL and Swiss-Prot‟s operations were moved to EMBL‟s EBI in Hinxton, UK. One of the first collaborative projects undertaken was to create a new supplement to Swiss-Prot. Maintaining the high quality y of Swiss-Prot entries is a time-consuming process

6
involving extensive sequence analysis and detailed curation by expert annotators (Apweiler, 2001). So as to allow the quick release of protein sequence data not yet annotated to Swiss-Prot‟s stringent standards, a new database called TrEMBL (for “translation of EMBL nucleotide sequences”) was created. This supplement to Swiss-Prot initially consisted of computationally annonated entries derived from the translation of all coding sequences (CDS) found in DDBJ/EMBL/GenBank, including only data that was not already present in Swiss-Prot.
Data flow for submissions and updates between the databases 4.0 Conclusion
After the completion of sequencing of human genome and the genome of other organisms, there was an explosion of data. Bioinformatics grew out of the need to develop software for management, analysis and dissemination of enormous information resulting from the accumulated data.
5.0 Summary
Historically, protein databases were prepared first.; then. Nucleotide databases. Various bodies were involved in the formation of various databases. Dayhoff and others prepared Atlas of Protein Sequence. EMBL succeeded by EBI, developed a DNA sequence database. NBRF established PIR while NCBI built the GenBank. DDBJ later joined the data collection collaboration. The three main
SRS
ENTREZ
GenBank
DDBJ EMBL
NCBI
EBI
CIB
Submissions & Updates
getentry
Submissions & Updates
Submissions & Updates
Submissions & Updates

7
partners of the International Nucleotide Sequence Database Collaboration are Genbank, EMBL and DDBJ.
6.0 Tutor Marked Assessment Que: (1) What type of databases were prepared first and what led to their
establishment? (2) Explain the circumstance that led to the development of bioinformatics.
Ans: (1) Protein databases were prepared first. (2) After Zuckerkandl and Pauling proposd molecular evolution based on similarities in protein sequences, Margaret O. Dayhoff and other workers, supporting the principle of molecular evolution, collecte all orotein sequences known at that time and catalogued them as the Atlass of protein Sequence and Structure.
7.0 References/Further Reading
Apweiler R. 2005. Sequence Databases. In: Bioinformatics – Apractical guide to the analysis of genes and proteins. 3rd Ed. John Wiley & Sons Inc. Publication.
Bairoch A., Apweiler r. 2000. The SWISS-PROT Protein Sequence Database
and its supplement Tr GMBL.Nucleic Acid Research.28: 45-48. Benson DA, Karsch-Mizrachi T; Lipman DJ, Ostell J, Wheeler DL 2004.GenBank
update Nucleic Acids Research. 32: D23-D26.
Unit 2: Databases Content 1.0 Introduction 2.0 Objectives 3.0 Main Content 3.1 Classification of Databases 3.1.1 Classification based on the Level of Processing of Information 3.1.1.1 Primary Databases 3.1.1.2 Secondary Databases 3.1.1.3 Composite Databases 3.1.2 Classification based on the Nature of Information 3.1.2.1 Nucleotide Sequence Databases 3.1.2.2 Protein Sequence Databases 4.0 Conclusion 5.0 Summary 6.0 Tutor Marked Assessment 7.0 References/Further Reading
1.0 Introduction

8
Databases are computer-based organization of sequence and structural data of biomolecules. They can be referred to as electronic filling cabinets, a convenient and efficient way of storing vast amount of information. Historically, the protein database were prepared first, then nucleotide databases. In 1959, V.M. Ingram first made attempt to compare sickle cell haemoglobin and normal haemoglobin, and demonstrated their homology. In due course of time the other proteins associated with similar biological function were also compared. This resulted in more protein sequencing and accumulation of vast information. Hence, it is realized to have databases so that using computation software the proteins can be quickly compared.
The most important contribution that sequence databases make to the biological community is making the sequences themselves accessible.
2.0 Objective (i)To know what bioinformatics databases are (ii) To the types of biological databases (ii) To know the importance of biological databases in bioinformatics 3.0 Main Content 3.1 Classification of Databases
The databases are broadly classified according to the level of processing of information contained in it. In this respect databases can be classified into three categories (a) primary database, (b) secondary database, and (c) composite database. Moreover, based on the nature of biological information concerning the molecules, data bases can be classified into two categories: sequence databases which can be (i) nucleotide or/and protein data bases and (ii) structural databases that involves only protein databases.
3.1.1 Classification based on the Level of Processing of Information 3.1.1.1Primary Databases
They contain information of the sequence or structure alone of either protein or nucleic acid e.g. PIR or protein sequences, GenBank and DDBJ for genome sequences. Primary database tools are effective for identifying the sequence similarities, but analysis of output is sometimes difficult and cannot always answer some of the more sophisticated questions of sequence analysis. In 1998, GenBank obtained more than a million of sequences from more than 18,000 organisms.
The primary databases contain, for the most part, experimental results (with some interpretation), but are not a curated review. Curated reviews are found in what are called secondary databases. The nucleotide sequences in DDBJ/EMBL/GenBank are derived from the sequencing of a biological molecule that exists in a test tube, somewhere in a lab. They do not represent sequences that are a consensus of a population, not do they represent some other computer-generated string of letters. This framework has consequences in the

9
interpretation of sequence analysis. Each such DNA and RNA sequence will be annotated to describe the analysis from experimental results that indicate why that sequence was determined in the first place. A great majority of the protein sequences available in public databases have not been determined experimentally, which may have downstream implications when analyses are performed. For example, the assignment of a product name or function qualifier based on a subjective interpretation of a similarity analysis (e.g. BLAST) can be very useful, but sometimes can be misleading. Therefore, the DNA, RNA, or protein sequences are the “computable” items to be analyzed, and they represent the most valuable component of primary databases.
3.1.1.2Secondary Databases They contain derived-information from the primary databases, for example, information on conserved sequence, signature sequence and active site residues of protein families by using SCOP, Emotif, ETC. It is more useful than the primary databases. Orthology provides an important layer of information when considering phylogenetic relationships between the genes. Depending on the type of analysis method used, relationship may be elucidated in considerable detail including super-family, family, sub-family and species-specific sequence levels.
3.1.1.3Composite Databases The composite databases is obviating the need to search multiple resources. The SCOP is structural classification of proteins in which the proteins are classified into hierarchial levels such as classes, folds, super-families.
A moderate database pertaining to protein sequence and structural correlations on the „Net‟ was established in 1991. This database was called PROSIT which later on was strengthened with database on sequence analysis and comparison of protein sequences known as SEQUANALREE.
3.1.2 Classification based on the Nature of Information 3.1.2.1Nucleotide Sequence Databases
The major sources of nucleotide sequence data are the databases involved in the International Nucleotide Sequence Data base Collaboration: DDBJ, EMBL, and GenBank: again, new or updated data are shared between these three entities once every 24 hours. This transfer is facilitated by the use of common data formas for the kinds of information that is described in detail below.
DDBJ/EMBL/GenBank nucleotide records often are the primary source of sequence and biological information from which records in other databases are derived. Because so many other databases are dependent on the accuracy of DDBJ/EMBL/GenBank records, some important considerations immediately come to the fore: - If a coding sequence is not indicated on a nucleic acid record, it will not
lead to the creation of a record in the protein databases. Sequence

10
similarity searches against the protein databases, which are the most sensitive way of doing sequence similarity searches (Chapter 11), therefore may miss important biological relationships.
- If a coding feature in a DDBJ/EMBL/GenBank record contains incorrect information about the protein, this incorrect information will be passed on to other databases directly derived from the record: it could even be propagated to other nucleotide and protein records on the basis of sequence similarity.
- If important information about a protein is not entered in the appropriate place within a sequence record, any programs that are designed to extract information from these records more than likely will miss the information, meaning that the information will not filter down to other databases.
3.1.2.2Protein Sequence Databases
With the availability of hundreds of complete genome sequences from both prokaryotes and eukaryotes, efforts are now focused on the identification and functional analysis of the proteins encoded by these genomes. The large-scale analysis of these proteins ahs started to generate huge amounts of data, in large part because of a range of newly developed technologies in protein science. For example, mass spectrometry now is used widely in protein identification and in determining the nature of posttranslational modifications. These and other methods make it possible to identify large numbers of proteins quickly, to map their interactions.
4.0 Conclusion
Given DDBJ/EMBL/GenBank‟s role as the archive of all publicly available DNA, RNA and protein sequences, the continued usefulness of this resource is highly dependent on the quality of data found in it.
5.0 Summary
The rapid pace of discovery in the genomic and proteomic works requires that databases are built in a way that facilitates not just the storage of these data, but the efficient handling and retrieval of information from these databases. Several databases are now available, and they can be classified based on the level of processing of information or on the nature of information contained therein.
6.0 Tutor Marked Question Que: (1) Differentiate between a primary and a secondary database (2) (a) Name the primary databases and give their website (b) Why are they regarded as the primary databases?
(3) Name the appropriate databases for reporting errors and give the website for reporting such errors when they are found.

11
Ans:(1) A primary database contain for the most part an experimental results, but are not a curated review unlike the secondary databases.
(2) The primary databases and their websites are: DDBJ http://www.ddbj.nig.ac.jp/ EMBL http://www.ebi.ac.uk/embl/ GenBank http://www.ncbi.nlm.nih.gov/Web/GenBank
(3) The databases for reporting errors and their website for that purpose are:
DDBJ [email protected] EMBL [email protected] GenBank [email protected]
7.0 References/Further Reading Apweiler R. 2005. Sequence Databases. In: Bioinformatics – Apractical guide to
the analysis of genes and proteins. 3rd Ed. John Wiley & Sons Inc. Publication.
Bairoch A., ApweilerR. 2000. The SWISS-PROT Protein Sequence Database
and its supplement Tr GMBL.Nucleic Acid Research.28: 45-48. Benson DA, Karsch-Mizrachi T; Lipman DJ, Ostell J, Wheeler DL 2004.GenBank
update Nucleic Acids Research. 32: D23-D26.
Unit 3: Database Format Content 1.0 Introduction 2.0 Objectives 3.0 A Dissection of Nucleotide Sequence Flatflles 4.0 Conclusion 5.0 Summary 6.0 Tutor Marked Assessment 7.0 References/Further Reading
1.0 Introduction
The elementary format underlying the information held in DDBJ/EMBL/GenBank is the flatfile. The correspondence between individual flatfile formats facilitates the exchange of data between each of these databases; in most cases, fields can be mapped on a one-to-one basis from one flatfile format to the other. Over time, various file formats have been adopted and have found continued, widespread use; others have fallen to the wayside for a variety of reasons. The success of a given format depends on its usefulness in a variety of contexts, as well as its power in effectively containing the types of biological information that need to be achieved and communicated to the community.

12
In its simplest form, a sequence record can be represented as a string of nucleotides with some basic tag or identifier. The most widelyused of these simple formats is FASTA, which provides an easy way of handling primary data for both humans and computers. Thus, although information in DDBJ/EMBL/GenBank is basically in flatfile format, the nucleotide sequence information in the flatfile is in FASTA format. FASTA nucleotide sequence records take the following form:
Note: The dotted lines represent several nucleotides usually there are 60 characters per line. Only two lines out of many are shown for brevity.
The greater than character (>) designate the beginning of a new sequence record; this line is called the definition line or def line. After „>‟ is t he accession version number (U54469.1).
The accession.version number is followed by the DNA sequence either in uppercase or lower case letters.
More detail can sometimes be added to this format making it more complex. For instance one can add more information to the def line making it more informative:
The above modified FASTA file now has information on the source database (gb, for GenBank), its accession.version number (U54469.1), a LOCUS name identifier (in GenBank), or entry name identifier (in EMBL; DMU54469), and a short description of what biological entity the sequence represents.
3.0 A Dissection of Nucleotide Sequence Flatflles
Since flatfiles represent the elementary unit of information within DDBJ/EMBL/GenBank and facilitate the interchange of information between these databases, it is important to understand what each individual field within the flatfile represents and what kinds of information can be found in various parts of the record. At this time, the DDBJ and GenBankflatfile formats are nearly identical, whereas EMBL uses line-type prefixes; these prefixes indicate the type of information p resent within each line of the record. Flatfiles can be separated into three major parts:
>U54469.1 CGGTTGCAACTTCCGGAATTCCGGCCAAGTCGTCAGTCACGTACTCGGTTGCAACTTCCG ATTCCGGCCAAGTCGTCAGTCGGTTGCGTACTCGGTTGCAACTTCCGAACTTCCGGACAC
>gb$U54469.1 $/$DMU5469 Drosophila melanogaster eukaryotic initiation factor 4E (eIF4E) gene, alternative splice products, complete cds

13
(i) The Header:which contains the information (descriptors) that apply to the entire record;
(ii) The features: which are the annotations on the record; and (iii) The Nucleotide Sequence: All major nucleotide database flatfiles end
with ??on the last line of the record.
4.0 Conclusion
Flatfile format is the basic unit of information within the primary databases (DDBJ/EMBL/GenBank(. It facilitates interchange of information between these databases.
5.0 Summary
Sequence information are presented as FASTA format in the basic flatfiles. Flatfiles can be separated into Header, the features and the sequence.
6.0 Tutor Marked Assessment Que: Given the following databases, describe briefly the type of information that
could be obtained from them. NCBI‟s GenBank, EMBL, DDBJ, SWISS-PROT, OMIM Ans: NCBI‟s GenBank - All known nucleotides and proteins sequences EMBL - All known nucleotides and proteins sequences DDBJ - All known nucleotides and proteins sequences SWISS-PROT - Annotated protein database OMIM - Catalogue of human genetic diseases 7.0 References/Further Reading
Apweiler R. 2005. Sequence Databases. In: Bioinformatics – Apractical guide to the analysis of genes and proteins. 3rd Ed. John Wiley & Sons Inc. Publication.
Bairoch A., Apweiler r. 2000. The SWISS-PROT Protein Sequence Database
and its supplement Tr GMBL.Nucleic Acid Research.28: 45-48. Benson DA, Karsch-Mizrachi T; Lipman DJ, Ostell J, Wheeler DL 2004.GenBank
update Nucleic Acids Research. 32: D23-D26. MODULE 2 UNIT 1 Basic Tasks and Processes in Bioinformatics UNIT 2 Database Search and sequence Retrieval Techniques UNIT 3 BLAST-Basic Local Alignment Search Tool UNIT 4 Data Mining Unit 1: Basic Tasks and Processes in Bioinformatics

14
Content 1.0 Introduction 2.0 Objectives 3.0 Main Content 3.1 Important Definitions, Processes and Tasks in Bioinformatics 4.0 Conclusion 5.0 Summary 6.0 Tutor Marked Assessment 7.0 References/Further Reading 1.0 Introduction
In Module 1, a foundation in Bioinformatics has been laid. It is important to note that Bioinformatics is a practical field. Module 2 will therefore focused on a more practical approach to Bioinformatics.
2.0 Objectives (i) To know the definitions of basic terms in bioinformatics (ii) To know the fundamental processes in bioinformatics (iii) to have an insight into how to carry out the basic processes in bioinformatics 3.0 Main Content 3.1 Important Definitions, Processes and Tasks in Bioinformatics
AACOMP(Ident, Sim) These are search tools at the Expasy server that use the composition of an amino acid sequence, rather than the sequence itself, to find sequences in a database (SWISS-PROT) with similar composition. (The composition of a query is searched against a database of the compositions of sequences in SWISS-PROT).
AACompident inputs the composition of the query and is useful when the query sequence is not known. In fact, it may be used to identify the sequence from its composition. AACompSim inputs a query sequence and computes its composition internally.
Accession Number This is a unique identifier to a GenBank sequence record. The typical format is 1-2 letters followed by 4-6 digits. Here are a few fictitious though syntactically correct examples: AG123456, BF43251.
BLAST (Basic Local Alignment Search Tool) This is a popular sequence-based database searching program. It performs, one-by-one, a heuristic, local alignment of the query seq3uence to each sequence in the specified database. (Heuristic means non-optimal. Local means as opposed to global). BLAST is much faster than dynamic programming, while remaining effective Dynamic programming computes optimal

15
local alignments). BLAST returns a list of hits ranked by E-value. The lower the E-value of a hit, the more significant it is.
BLASTN This is the version of BLAST that searches a nucleotide sequence against a nucleotide database. It uses a primitive substitution matrix (match=1, mismatch = -2).
BLASTP This is the version of BLAST that searches a protein sequence against a protein database. It supports searches using the BLOSUM or the PAM family of substitution matrices. BLOSUM62 is the most popular matrix used in BLAST searches.
BLASTX This is the version of BLAST that searches a nucleotide sequence against a protein database by translating the nucleotide sequence in all frames.
BLAST2SEQUENCES This is a version of BLAST which locally aligns two sequences, instead of searching one sequence against a database.
BLOSUM This is a family of substitution matrices for scoring alignments, for example when doing BLAST searches. BLOSUM62 is the most widely used member of this family.
BOOTSTRAP This is a statistical method used to access the robustness of phylogenetic trees produced by various tree-building methods. The original multiple alignment from which a phylogenetic tree was first produced is used to generate numerous bootstrap alignment. Thus a bootstrap alignment has the same number of columns as the original alignment. A phylogenetic tree is built from each bootstrap alignment. Once all the trees have been built, these trees may be compared to yield a consensus tree or consensus subtrees. Well-conserved branches (or more generally, subtrees) are often deemed as reliable.
CLUSTALW This is a popular multiple alignment tool based on the progressive alignment method.
CLUSTER ANALYSIS This is a computational and statistical procedure for partitioning a data set into subsets of similar items. It is often used to group together genes with similar expression patterns (or experiments with similar response patterns of genes) from microarray gene expression data. It is also used to group together proteins

16
with similar sequences or similar structure (many protein classification databases are constructed this way).
CONSERVED DOMAIN DATABASE This is a database at NCBI which may be used to locate domains in a protein sequence. Domain motifs, represented as position-specific weight matrix profiles, are scanned against sequence to find which motifs hit where.
DOT MATRIX This is a nice way to visualize a local alignment, especially many alignments of pairs of possibly overlapping, fragments in the two sequences.The horizontal and vertical axes correspond to the two sequences. Solid diagonal lines denote aligned fragments.
DDBJ This is the Japanese sibling of GenBank.
EMBL This is the European sibling of GenBank, an annotated collection of all public domain DNA and protein sequences.
ENSEMBL This is a web server which provides access to automatically generated annotations of the genomes of complex organisms such as humans. One can search the human genome, browse chromosomes, find genes, find genomic sequences similar to a given protein sequence, etc.
ENTREZ This is a text-based search engine for bioinformatics databases, at NCBI. It provides access to a literature database (PubMed), nucleotide database (GenBank), protein sequence database, 3D Structure database (MMDB), Genome database (complete genome assemblies), population sets, and Online Mendelian Inheritance in Man (OMIM).
FASTA This is a program similar to BLAST for heuristic local alignment and for sequence-based database searching.
FASTA FORMAT This is a widely used format for DNA and protein sequences. Many search tools accept sequences in this format. For each sequence, there is a header line beginning with > followed by one or more lines containing the sequence itself, as illustrated below.
>sequence header ACAGAAA

17
>Sequence header >ACAAAGA
GENBANK This is the premier database of nucleotide sequences. It is in flat file format.
GENSCAN This is a popular genefinding program. It uses hidden Markov models
GLOBAL ALIGNMENT This is a full alignment of two nucleotide or protein sequences, with gaps inserted in one or both sequences, as needed.
GRAIL This is a popular genefinding program. It uses neural networks to combine information about predicted local sites such as splice sites with predicted coding regions.
LOCAL ALIGNMENT This is the process of finding and aligning highly similar regions of two DNA or protein sequences. NEME This is a tool for automatically discovering motifs (represented by ungapped position weight matrix profiles) from a set of related protein or DAN sequences. The motif discovery algorithm is based on fitting a two-component mixture model to the given set of sequences, using the EM algorithm. One component describes the motif by a fixed-width position-weight matrix profile. The other component models background, i.e. all other positions in the sequences.
MULTIPLE ALIGNMENT This is a global alignment of more than two nucleotide or protein sequences. The alignment is typically scored by scoring each column of the alignment and adding up the column scores. Gaps costs may be incurred in the score of a column, or separately. One way to score a column is by its degree of conservedness (more conserved columns, indicate better scoring alignments). This can be done by computing the information content of the column. A more widely used method is called the sum-of-pairs method. In this method, the score of a column is the sum of the scores of all distinct pairs of letters in the column, where a pair of letters is scored via a substitution matrix (such as BLOSUM or PAM in the case of protein sequences). A multiple alignment is also a first step in phylogenetic tree-building.
NEIGHBOR-JOINING METHOD

18
This is a phylogenetic tree-building method that is “one notch above” the UPGMA tree-building method.
PARSIMONY This is a character-based method for constructing a phylogenetic tree from a multiply aligned set of sequences. The parsimony of a tree is defined as the minimum number of substitutions required to produce a given set of sequences, placed a particular way the leaves of the tree. The parsimony of a tree may be computed efficiently by a clever method. It is much more time consuming to find the tree which has maximum parsimony (minimum number of substitutions).
PHI-BLAST Pattern Hit Initiated BLAST. This is a version of BLAST that inputs a protein sequence and a regular expression pattern in it. It may be used to find other protein sequences that not only contain the same patter n but are also similar to the input protein sequence in the proximity of the occurrence of the pattern, in the two sequences. This is illustrated below:
PHYLOGENETIC ANALYSIS This is the process of building a phylogenetic tree from a given set of sequences (or other data). The first step is to do a multiple alignment of the sequences, using CLUSTALW perhaps. The second step is to clean up the multiple alignment (remove outlying sequences, handle gaps, downweight overrepresented sequences, etc.). The third step is to build one or more trees, using a distance-based method, a parsimony method, or a likelihood-based method. The fourth step (which may interact with earlier steps) is to assess the quality of the built trees perhaps using bootstrap.
PREDICTPROTEIN This web server features the class of PHD programs for predicting secondary structure, solvent accessibility, and transmembrane helices, as well as programs for prediction of tertiary structure, coiled-coil regions, etc. At the same site, in the Meta PredictProtein section is another secondary structure prediction program, JPRED, which takes a consensus between a number of methods. There are also three other programs for predicting transmembrane helices, TMHMM, TOPRED, and DAS. The tertiary structure prediction programs include TOPITS, SWISS-MODEL, and CPHmodels.
PRINCIPAL COMPONENTS ANALYSIS This is a method of visualizing high-dimensional data by transforming it into a very low-dimensional space (usually 1, 2 or 3D). The transformation is achieved (by rotating and translating the axes of the original space) in such a way that the first few axes describe the data as best as possible. The remaining axes may then be “thrown away”, with possibly some (but hopefully not a lot) of loss of information.

19
RESTRICTION MAP CONSTRUCTION Restriction enzymes cut foreign DAN at locations called restriction sites. A restriction map is a map of these locations in the DNA. These locations are not determined experimentally. What is determined experimentally are some properties of fragments formed after the DNA has been cut by various restriction enzymes in various ways. From this data, a restriction map is then constructed by a nontrivial computer algorithm. Graph theory and algorithms are often used.
SWISS-PROT This is a curated database of protein sequences with ahigh level of annotation (functions of a protein, domains in it, etc) and low redundancy.
TANDEM REPEAT FINDER This is a tool that finds tandem repeats ---two or more exact or near-exact copies of the same sequence fragment that are adjacent--- in a nucleotide sequence.
THREADING This is an alignment of a protein sequence to the 3D structure of another protein.
TOPITS This is a program for predicting the tertiary structure of a protein from its sequence. It uses a database of secondary structure strings derived from tertiary structures in PDB. (This database has one such string for each tertiary structure in PDB). First, this program uses the PHDsec program to predict the secondary structure string sse(x) of a protein sequence x. Next, it aligns, one by one, this predicted string sse( ) with each secondary structure string in the database (Alignments are x done via dynamic programming).
TREMBL This is an automatically annotated adjunct to SWISS-PROT. UPGMA This is a distance-based method for building a phylogenetic tree from a multiply aligned set of sequences. It performs a hierarchical clustering of the given data set, which yields this tree.
4.0 Conclusion
Several processes and tasks can be performed in Bioinformatics with a view to answering various biological questions. A good approach is to define the bioinformatic problems clearly and map out the processes to employ in solving the problems.
5.0 Summary

20
There are several problem solving tools, techniques, processes and tasks in Bioinformatics. They include data retrieval in which data retrieval systems like Entrez can be used. Sequence alignment can be done using various BLAST facilities. Phylogenetic trees can be built from aligned sequences.
6.0 Tutor Marked Assessment Que: Complete the following sentences as appropriate: (1) The most important data retrieval system is …………………………..
(2) A method used for building a phylogenetic tree from a multiple aligned set of sequence …………………………..
(3) Curated database of protein sequences (4) A global alignment of more than two protein sequences (5) A pop8lar gene finding program (6) A procedure for partitioning a data set into subsets of similar items.
Ans: (1) Entrez of NCBI (2) UPGMA (3) SWISS-PROT (4) Multiple alignment (5) Genscan (6) Cluster analysis 7.0 References/Further Reading
Dubey R.C. 1993. A textbook of Biotechnology Multicolour Illustrative Edition. S.
Chand & Co. Ltd. New Delhi. Narayanem P. 2005. Bioinformatics: A Primer. 1st Ed.New Age International (P)
Ltd. New Delhi. Lee PS & Lee KH 2000.Genomic Analysis.Curr.Opin.Struct. Biol. 11: 171.
Unit 2: Database Search and Data Retrieval Techniques Content 1.0 Introduction 2.0 Objectives 3.0 Main Content 3.1 Coding for Nucleotide Bases and Amino Acid Residues in Sequence Information 3.2 Database Search 3.3 Sequence Retrieval 3.4 Selected Search Sites and Sequence Retrieval Tools 3.4.1 ENTREZ 3.4.2 OMIM (Online Mendelian Inheritance in Man): 3.4.3 PubMed (Publishers on Medicine) 3.4.4 Sequence Retrieval System (SRS) 4.0 Conclusion 5.0 Summary
21
6.0 Tutor Marked Assessment 7.0 References/Further Reading 1.0 Introduction
The completion of sequencing of a number of model organisms, along with the continued sequencing of others, underscores the necessity for all biologists to learn how to make their way effectively through this sequence space. GenBank, or any other biological database for that matter, serves little purpose unless the database can be easily searched and entries can be retrieved in a usable, meaningful format. Otherwise, sequencing efforts have no useful end, because the biological community as a whole cannot make use of the information hidden within these millions of bases and amino acids. Much effort has gone into making such data accessible to the average user, and the programs and interfaces resulting from these efforts are the focus of this chapter. The discussion centers on querying databases at the National Center for Biotechnology Information (NCB) because these more “general” repositories are far and away the ones most often accessed by biologists, but attention is also given to a specialized databases that provide information not necessarily found through Entrez.
2.0 Objectives
To be able to retrieve biological information from various database sources using various retrieval techniques.
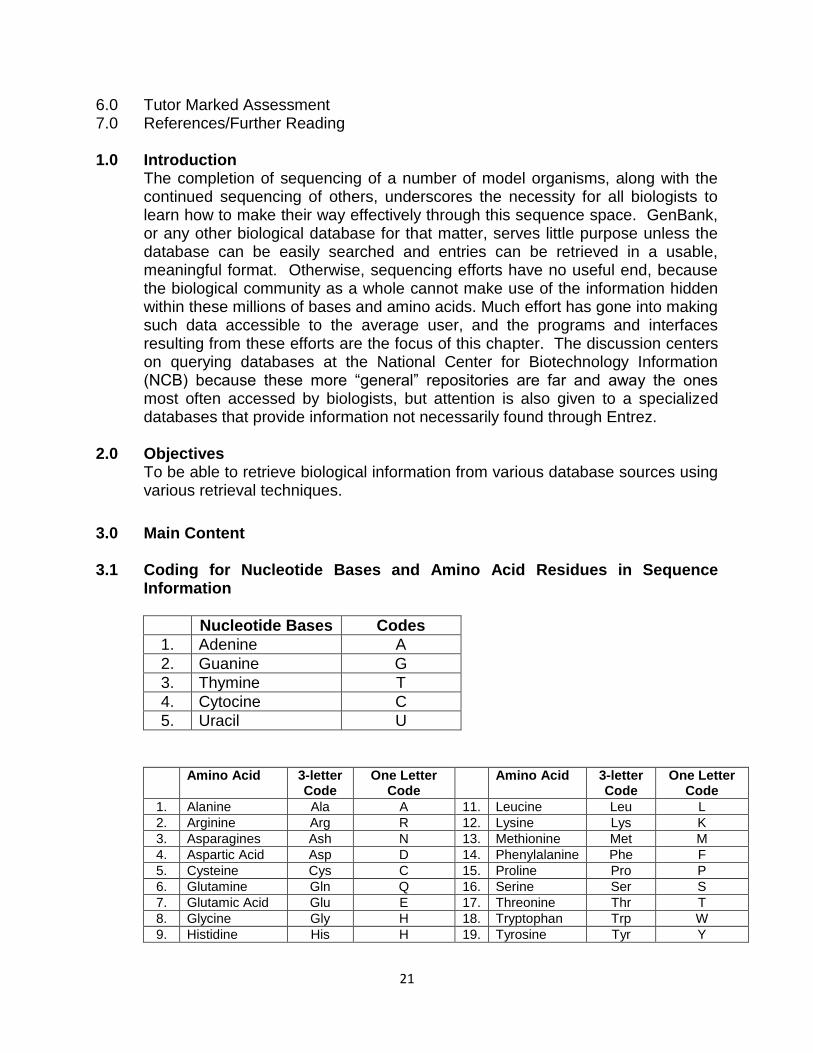
3.0 Main Content 3.1 Coding for Nucleotide Bases and Amino Acid Residues in Sequence
Information
Nucleotide Bases Codes
1. Adenine A
2. Guanine G
3. Thymine T
4. Cytocine C
5. Uracil U
Amino Acid 3-letter Code
One Letter Code
Amino Acid 3-letter Code
One Letter Code
1. Alanine Ala A 11. Leucine Leu L
2. Arginine Arg R 12. Lysine Lys K
3. Asparagines Ash N 13. Methionine Met M
4. Aspartic Acid Asp D 14. Phenylalanine Phe F
5. Cysteine Cys C 15. Proline Pro P
6. Glutamine Gln Q 16. Serine Ser S
7. Glutamic Acid Glu E 17. Threonine Thr T
8. Glycine Gly H 18. Tryptophan Trp W
9. Histidine His H 19. Tyrosine Tyr Y
22
10. IsoLeucine Ile I 20. Valine Val V
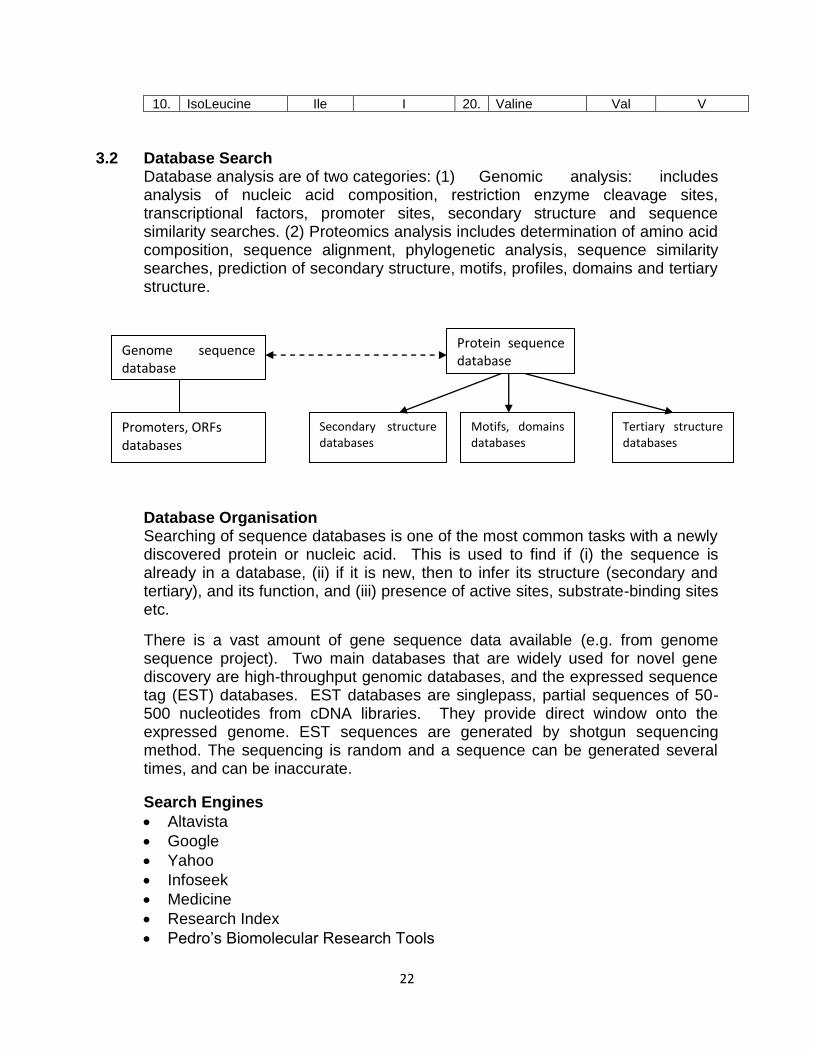
3.2 Database Search
Database analysis are of two categories: (1) Genomic analysis: includes analysis of nucleic acid composition, restriction enzyme cleavage sites, transcriptional factors, promoter sites, secondary structure and sequence similarity searches. (2) Proteomics analysis includes determination of amino acid composition, sequence alignment, phylogenetic analysis, sequence similarity searches, prediction of secondary structure, motifs, profiles, domains and tertiary structure.
Database Organisation Searching of sequence databases is one of the most common tasks with a newly discovered protein or nucleic acid. This is used to find if (i) the sequence is already in a database, (ii) if it is new, then to infer its structure (secondary and tertiary), and its function, and (iii) presence of active sites, substrate-binding sites etc.
There is a vast amount of gene sequence data available (e.g. from genome sequence project). Two main databases that are widely used for novel gene discovery are high-throughput genomic databases, and the expressed sequence tag (EST) databases. EST databases are singlepass, partial sequences of 50-500 nucleotides from cDNA libraries. They provide direct window onto the expressed genome. EST sequences are generated by shotgun sequencing method. The sequencing is random and a sequence can be generated several times, and can be inaccurate.
Search Engines
Altavista
Yahoo
Infoseek
Medicine
Research Index
Pedro‟s Biomolecular Research Tools
Genome sequence database
Protein sequence database
Promoters, ORFs databases
Motifs, domains databases
Tertiary structure databases
Secondary structure databases

23
Search Sites
DDBJ : (http://www.ddbj.nig.ac.jp/). (DNA Databank of Japan). A nucleic acid database.
EBI : (http://www.ebi.ac.uk/). (European Bioinformatics Institute; UK, an outstation of the EMBL).
EMBL : (http://www.ebi.ac.uk/). (European Molecular Biology Laboratory; Germany).
ExPASy : (http://www.expasy.ch/). Expert Protein Analysis System, a Molecular Biology Server, Switzerland, with SWISS-PROT, PROSITE, 2D-PAGE, an other proteomics tools. Key site for protein sequence and structure information.
GenBank : (http://www.ncbi.nlm.nih.gov/Web/GenBank/). GenBank of the National Institute of Health (NIH, USA genetic sequence database is an annotated collection of all publicly available DNA sequences. GenBank is a part of the International nucleotide sequence database, which is comprised of the DNA databank of Japan (DDBJ), the European Molecular Biology Laboratory (EMBL, Germany) and GenBank at NCBI, USA.
GRAIL : (http://compbio.ornl.gov/Grail-1.3/). Gene Recognition and Assembly Internet Link software. A suite of tools designed to provide analysis and putative annotation of DNA sequences both interactively and through the use of automated computation.
NCBI : (http://www.ncbi.nlm.nih.gov/). (National Center for Biotechnology Information; NIH, USA)
OMIM : (http://www3.ncbi.nlm.nih-gov/Omim). On-line Mendelian inheritance in Man (for human genes and genomics at NCBI).
Sanger Center : (http://www.sanger.ac.uk/DataSearch/). Genomic sequencing and genomics analysis server (UK).
PUBMED : (http://www.ncbi.nlm.nih.gov/PubMed/). Covers mainly medical literature.
SWISS-PROT : (http://expasy.hcuge.ch/sprot/sprot-top.html). A protein sequence database (Switzerland).
3.3 SequenceRetrieval Tools
BLAST : Basic Local Alignment and Search Tool (Home Page:

24
NCBI, USA) sequence retrieval and sequence similarity search engine, which consists of a suite of programs – BLASTN (nucleotide BLAST), BLASTP (Protein BLAST), BLASTX (Translated BLAST), PhyloBLAST and PIR-BLAST.
CLEVER : Command-line ENTREZ Version from NCBI. It is an interactive tool to browse ENTREZ database using only test input/output.
ENTREZ : (http://www3.ncbi.nlm.nih.gov/ENTREZ). ENTREZ is a powerful search engine, a part of NCBI server. The NCBI contains all the nucleotide and protein sequences in GenBank and Medicine. The program allows one to start with only tentative set of keywords, or a sequence identified in the laboratory, and rapidly accesses a set of relevant list and a list related database sequences.
FASTA : (http://www2.igh.cnrs.fr/bin/fasta-guess.cgi). Sequence retrieval and similarity search database.
FETCH : FETCH is sequence retrieval program that retrieves sequences from the GenBank and other databases. The program requires the exact locus name or accession number of a sequence.
LOOKUP : LOOKUP is a sequence retrieval program that uses SRS (Sequence Retrieval System) and is useful if the accession number is not known, but one wishes to download sequences of all proteins related to the query protein. LOOKUP identifies sequence by name, accession number, keyword, title, reference, feature or date. The output is a list of sequences.
3.4 Selected Database Search and Sequence Retrieval Facilities
GenBank contains 7 millions sequence record covering 9 million nucleotide bases. Unless the databases are easily searched and entries retrieved in a usable and meaningful format, the biological databases serve a little purpose. Moreover, efforts made on sequencing will not be meaningful if biological community as a whole cannot make use of the information hidden within millions of bases and amino acids. There are several database retrieval tools such as ENTREZ, LOCUSTLINK, TAXONOMY BROWSER, etc.
3.4.1 Sequence Retrieval Tools: ENTREZ
The integrated information database retrieval system of NCBI is called Entrez. It is most utilized of all biological database systems. Using Entrez system you can access literature, prepare genome map, sequences (both protein and

25
nucleotides) and get structural data (3 D). To be very clear, Entrez is not a database, but it is the interface through which all of its component databases can be accessed and traversed. Entrez has ability to retrieve the related sequence structures and references.The Entrez information space includes PubMed records, nucleotide and protein sequence data, three-dimensional structure information, and mapping information. The strength of Entrez lies in the fact that all of this information, across numerous component databases, can be accessed by issuing one and only one query. Entrez is able to offer integrated information retrieval through the use of two types of connection between database entries: neighboring and hard links.
3.4.2 OMIM (Online Mendelian Inheritance in Man):
OMIM is a non-sequence-based information resource that is very much useful in genomics. It is a web-based electronic version of catalogue that contains thousands of entries for human genes and genetic disorders. It serves as a phenotypic companion to Human Genome Project. It was founded by Victor McKusick at the Hohns Hopkins University (McKusick, 1998). A concise textual information is provided by OMIM from the published literature on the conditions of human having genetic disorders and full citation information. At the NCBI, the online version of OMIM is housed. Also links are provided to Entrez from all references cited within each OMOM entry. Internet resource for OMIM is: http://www.ncbi.nlm.nih.gov/omim. The OMIM cytogenetic and morbid maps present cytogenetic locations for those genes with published locations and provide an alphabetical list of all the diseases described in OMIM. Therefore, it is necessary to consider the results of web-based biology reported in the scientific literature in order to validate the findings generated through computer-based comparative analysis. Hence, integration of scientific data with the literature is an important step for creating a unified information resource in the life science. For this purpose, individuals are provided with a direct link from OMIM to PubMed, the NCBI literature system. It is very easy to perform OMIM searches. A simple query is performed by search engine on the basis of one or more words typed into a search window. Consequently, a list of documents is returned containing the query words. The users can select one or more disorders from the list so as to see the full text of OMIM entry.
3.4.3PubMed (Publishers on Medicine)
PubMed is a Web search interface that provides to over 11 million journal citation in MEDLINE and contains links to full text articles at participating publisher‟s web site. PubMed provides web-based access to over 11 million citations, abstracts and indexing terms for journal articles in the biomedical sciences. It also includes links to full-text journals. At present about 20 million searches are conducted per month and over 1,40,000 users seek information daily through PubMed.

26
3.4.4Sequence Retrieval System (SRS) The SRS has been created by Swiss Institute of Bioinformatics and the European Bioformatics Institute, who have also created the Swiss-PROT database. SRS allows retrieval from an extensive catalogue of more than 75 public biological databases. The link button is SRS will allow you to get all the entries in one databank which are linked to an entry (or entries) in another database. Hyperlinks made links between the entries.
4.0 Conclusion
There are several interfaces for the retrieval of information from biological databases, however, NCBI Entrez system is the most widely used.Students are strongly encouraged to practice by using the various retrieval tools. This is the only way by which mastery and confidence can be gained
5.0 Summary
Biological information in databases is so voluminous that efficient data retrieval systems are crucial. Several retrieval tools are now available, and students should have substantial practice using these tools in order to gain mastery and confidence. NCBI Entrez is especially important in this regard.
6.0 Tutor Marked Assessment Que: Your investigation has to do with a molecule called human neutrophil
elastase. Search for relevant entries on this enzyme and get a detail information including the sequence of the enzyme.
Ans: The starting point for retrieval of sequences and structures is ENTREZ: * Go to htt://www.ncbi.nlm.nih.gov/Entrez/ * Select protein * Enter the search terms HUMAN ELASTASE * Click on GO
- The program returns 668 answers. Each entry can be clicked for more detail information.
7.0 References/Further Reading
Apweiler R. 2005. Sequence Databases. In: Bioinformatics – Apractical guide to the analysis of genes and proteins. 3rd Ed. John Wiley & Sons Inc. Publication.
Bairoch A., Apweiler r. 2000. The SWISS-PROT Protein Sequence Database
and its supplement Tr GMBL.Nucleic Acid Research.28: 45-48. Benson DA, Karsch-Mizrachi T; Lipman DJ, Ostell J, Wheeler DL 2004.GenBank
update Nucleic Acids Research. 32: D23-D26.

27
Unit 3: Sequence Alignment and BLAST - Basic Local alignment Search Tool Content 1.0 Introduction 2.0 Objectives 3.0 Main Content 3.1 Sequence Alignment Analysis 3.1.1 General Consideration 3.1.2 Pairwise Sequence Alignment 3.1.3 Dotplot Analysis 3.1.4 Global Alignment 3.1.5 Local Alignment 3.1.6 Multiple Sequence Alignment (MSA) 3.2 BLAST – Basic Local Alignment Search Tool: DNA-DNA Alignment. 3.3 Comparing Amino Acid Sequences for Proteins in Different Organisms 3.4 Further Activity in BLASTn 4.0 Conclusion 5.0 Summary 6.0 Tutor Marked Assessment 7.0 References/Further Reading
1.0 Introduction
Sequence alignment is the process of lining up two or more sequences to achieve maximal levels of identity (and conservation, in the case of amino acid sequences) for the purpose of assessing the degree of similarity and the possibility of homology. Sequence similarity analysis is the single most powerful method for structural and functional inference of homology between proteins databases. Sequence similarity analysis allows the inference of homology between proteins and homology can help one to infer whether the similarity in sequences would have similarity in function. Methods of analysis can be grouped into two categories – (i) sequence alignment-based search, (ii) profile-based search.
Fundamentally, sequence-based alignment searches are string-matching procedures. A sequence of interest (the query sequence) is compared with sequences (targets) in a databank-either pair-wise (two at a time) or with multiple target sequences, by searching for a series of individual characters. Two sequences are aligned by writing them across a page in two rows. Identical or similar characters are placed in the same column and non-identical characters can be placed opposite a gap in the other sequence. Gap is a space introduced into an alignment to compensate for insertions and deletions in one sequence relative to another. In optimal alignment, non-identical characters and gaps are placed to bring as many identical or similar characters as possible into vertical register.

28
The objective of sequence alignment analysis is to analyze sequence data to make reliable prediction on protein structure, function and evolution vis a vis the three-dimensional structure. Such studies include detection of orthologous (same function in different species), and paralogous (different but related functions within an organisms) features. Sequence-similarity searches of unknown sequences to databases are commonly used in biological laboratories as the first approach to obtain clues about the function of a newly sequenced genes. The National Center for Biotechnology Information (NCBI) provides the Basic Local alignment Search Tool (BLAST) that allows for rapid comparison of nucleotide and protein query sequences to database sequences. The BLAST algorithm works by identifying short common regions of similarity (words) between a query sequence and database sequences. These words are of fixed lengths (4 amino acids for proteins and 11 base pairs for nucleotides) and are considered to be the minimum length needed to guarantee finding meaningful and significant patterns of similarity. Once a “word” is identified it is extended in either direction to search for extended regions of similarity between the query and the matched sequence, in order to determine the maximum level of identity between the two sequences being compared. This lining up of the two sequences is called an alignment and the solutions provided by BLAST are given in the form of alignments.
2.0 Objectives
Understand the meaning of sequence alignment and know the different types
of sequence alignment.
Students will learn how to use the BLAST programs to compare DNA-DNA Alignment.
Students will learn how to compare amino acid sequences for certain proteins in different organisms
Students will know the use and the importance of other types of BLASTs.
3.0 Main Content 3.1 Sequence Alignment Analysis 3.1.1 General Considerration Generally our task in sequence alignment is as follow: Given two or more sequences, we wish to – (i) assess their similarity (ii) determine residue-residue correspondences (iii) observe pattern of conservation and variability (iv) infer evolutionary relationship
Any assignment of correspondences that preserves the order of the residues within the sequences is an alignment. Gaps may be introduced.

29
Given the following text strings: First string = a b c d e Second string = a c d e f A reasonable alignment will be: a b c d e – a - c d e f We must define criteria so that algorithm can choose the best alignment. For instance consider the following nucleotide sequences:
g c t g a a c g and c t a t a a t c The ollowing alignments can be considered: An uninformative alignment will be - - - - - - - - - g c t g a a c g
, g c t g a a c g - - - - - - - - An alignment without gaps g c t g a a c g
c t a t a a t c An alignment with gaps g c t g a – a - c g
c - - t a t a a t c Best alignment g c t g - aa- c g c t a t a a t c -
3.1.2 Pairwise Sequence Alignment
Pair-wise alignment is a fundamental process sin sequence comparison analysis. Pair-wise alignment of two sequences (DNA or protein) is relatively straightforward computational problem. In a pair-wise comparison, if gaps or local alignments are not considered (i.e. fixed-length sequences), the optimal alignment method can be tried and the number of computations required for two sequences is roughly proportional to the square of the average length, as is the case in dotplot comparison. The problem becomes complicated, and not feasible by optimal alignment method, when gaps and local alignments are considered.
That a program may align two sequences is not a proof that a relationship exists between them. Statistical values are used to indicate the level of confidence that should be attached to an alignment. A maximum match between two sequences is defined to be the largest number of amino acids from on protein that can be matched with those of another protein, while allowing for all possible deletions. A penalty is introduced to provide a barrier to arbitrary gap insertion.
3.1.3 Dotplot Analysis
The dotplot is a table of matrix representing a visual representation of similarities between two aequences. Dotplot analysis is essentially a signal-to-noise graph, used in visual comparison of two sequences and to detect regions of close

30
similarity between them. The concept of similarity between two sequences can be discerned by dotplots. Two sequences are written along and x- and y-axes, and dots are plotted at all positions where identical residues are observed, that is, at the intersection of every row and column that has the same letter in both the sequences. Within the dotplot, a diagonal unbroken stretch of dots will indicate a region where two sequences are identical. Table: A Dotplot Profile
A S L S L
A +
S + +
L + +
S + +
L + +
3.1.4 Global Alignment
Global alignment is an alignment of two nucleic acid or protein sequences over their entire length. The Needleman-Wunsch algorithm (GAP program) is one of the methods to carry out pair-wise global alignment of sequences by comparing a pair of residues at a time. Comparisons are made from the smallest unit of significance, a pair of amino acids, one from each protein. All possible pairs are represented by a two-dimensional array (one sequence along x-axis and the other along y-axis), and pathways through the array represent all possible comparisons (every possible combination of match, mismatch and insertion and deletion). Statistical significance is determined by employing a scoring system; for a match = 1 and mismatch = 0 (or any other relative scores) and penalty for a gap.
3.1.5 Local Alignment
Local alignment is an alignment of some portion of two nucleic acid or protein sequences.Smith-Waterman algorithm is a variation of the dynamic programming approach to generate local optimal alignments, best alignment method for sequences for which no evolutionary relatedness is known. The program finds the region or regions of highest similarity between two sequences, thus generating one or more islands of matches or sub-alignment in the aligned sequences. Local alignments are more suitable and meaningful for (i) aligning sequences that are similar along some of their lengths but dissimilar in others, (ii) sequences that differ in length, or (iii) sequences that share conserved regions or domains.
3.1.6 Multiple Sequence Alignment (MSA)

31
Multiple sequence alignment is an alignment of three or more sequences with gaps inserted in the sequences such that residues with common structural positions and/or ancestral residues are aligned in the same column. The goal of multiple sequence alignment process is to generate a concise, information-rich table of sequence data to obtain relatedness of sequences to a gene family. A multiple sequence alignment is a 2-D table, in which rows represent individual sequences and columns the residue positions. Similar residues are brought into vertical register.
Table : Multiple Sequence Alignment of a highly conserved Region of a Protein Family
1 2 3 4 5 6 7
I G A G G V G K II G G G S G G L III G A R G V G K IV G A S G V G K V G G A G V G K VI G A G E S G K VII G G G G S G F VIII G A C G V G K
Consensus Sequence
G A/G g g v G K
3.2 BLAST – Basic Local Alignment Search Tool: DNA-DNA Alignments
BLAST Algorithm
Program Query Database
BLASTN Nucleotide Nucleotide
BLASTP Protein Protein
BLASTX Nucleotide: 6 frame translation Protein
TBLASTN Protein Nucleotide: 6 frame translation
TBLASTX Nucleotide: 6 frame translation Nucleotide: 6 frame translation

32
It will be rewarding going through the following exercise using BLAST. Consider the DNA sequence below: Note: Since it is DNA-DNA alignment, we use BLASTn Sample DNA Sequence: ATGGATTATCAAGTGTCAAGTCCAATCTATGACATCAATTATTATACATCGGAGCCCTGCCAAAAAATCAATGTGAAGCAAATCGCAGCCCGCCTCCTGCCTCCGCTCTACTCACTGGTGTTCATCTTTGGTTTTGTGGGCACATGCTGGTCATCCTCATCCTGATAAACTGCAAAAGGCTGAAGAGCATGACTGACATCTACCTGCTCAATGGCCATCTCTGACCTGTTTTTCCTTCTTACTGTCCCCTTCTGGGCTCACTATGCTGCCGCCCAGTGGGACTTTGGAAATACAATGTGTCAACTCTTGACAGGGCTCTATTTTATAGGCTTCTTCTCTGGAATCTTCTTCACTCCTCCTGACAATCGATAGGTACCTGGCTGTCGTCCATGCTGTGTTTGCTTTAAAAGCCAGGACGGTCACCTTTGGGGTGGTGACAAGTGTGATCACTTGGGTGGTGGCTGTGTTTGCGTCTCTCCCAGGAATCATCTTTACCAGATCTCAAAAAGAAGGTCTTCATTACACCTGCAGCTCTCATTTTCCATACAGTCAGTATCAATTCTGGAGAATTTCCAGACATTAAAGATAGTCATCTTGGGGCTGGTCCTGCCGCTGCTTGTCATGGTCATCTGCTACTCGGAATCCTAAAAACTCTGCTTCGGTGTCGAAATGAGAAGAAGAGGCACAGGGCTGTGAGGCTTATCTTCACCATCATGATTGTTTATTTTCTCTTCTGGGCTCCCTACAACATTGTCCTTCTCCTGAACACCTTCCAGGAATTCTTTGGCCTGAATAATTGCAGTAGCTCTAACAGGTTGGACCAAGCTATGCAGGTGACAGAGACTCTTGGGATGACGCACTGCTGCATCAACCCCATCATCTATGCCTTTGTCGGGGAGAAGTTCAGAAACTACCTCTTAGTCTTCTTCCAAAAGCACATTGCCAAACGCTTCTGCAAATGCTGTTCTATTTTCCAGCAAGAGGCTCCCGAGCGAGCAAGCTCAGTTTACACCCGATCCACTGGGGAGCAGGAAATATCTGTGGGCTTGTGA
1. From the NCBI home page (http://www.ncbi.nlm.nih.gov) follow the “BLAST”
link
2. Then from “Genomes” select “Human”
3. Paste the sequence above into the box (note that it is in FASTA format)
4. Click on “Begin Search”
5. Wait for a short while then try “Format”
Aligned (similar) regions are in rectangles

33
3.2 Comparing Amino Acid Sequences for ProteinsIn Different Organisms.
Part A. Hemoglobin Comparison
1. Open up your internet browser. 2. Go to the site: http://www.ncbi.nlm.nih.gov 3. In the upper left corner of the website, search “all databases” for hemoglobin.
You will get a page showing a variety of articles and genetic information e.g. “Pub Med” lists thousands of original papers related to hemoglobin, and “Nucleotide” reveals the sequence of the mRNA for hemoglobin in a variety of organisms.
4. HomoloGene. This will give you dozens of choices where you can compare the protein sequences of the various organisms. Just below the tab for “Limits” change the “display” to FASTA. You will then see the amino acid sequence of each organism (in a one letter code – for interpretation of the code go to http://www.chem.csustan.edu/chem4400/code.htm
5. Choose one of the comparisons (with at least five organisms) and using the human as a base, count the number of amino acid differences for the other organisms.
6. Using this data, calculate the % of similarity of each organism to the human.
100 – (Number of differences/total amino acids X 100) = % similarity
Part B. Gene of Interest Repeat the process above with any gene or protein that is of interest to you.

34
Part C. How many genes? For an up-to-date report of the number of genes in various organisms, go back to the original NCBI site in step 2, and search “HomoloGene” and leave the space after the word “for” blank. You will see a recent count of identified genes for about 18 organisms.
3.3 Further Activity OnBLASTn.
You will need to determine the source from which the following DNA fragment was obtained by comparing the “unknown 1” nucleotide sequence (query sequence) against a nucleotide sequence database using BLASTn.
>Unknown 1 gagcaggtgcctcactatcgacaagccctagacatgatcttggacctggaacctgatgaagagctggaagacaaccccaaccagagtgacttgattgagcaggcggccgagatgctctatgggttgatccacgcccgctacatcctcaccaaccggggcattgcacaaatgttggaaaagtaccagcaaggagactttggctactgtcctcgagtatactgtgagaaccagccgatgcttcccatcggcctttcggacatcccaggagaggccatggtgaagctctactgccccaagtgcatggacgtgtacacacccaagtcctctaggcaccaccacacggatggcgcatacttcggcactggtttccctcacatgctcttcatggtgcatcccgagtaccggcccaagcggccggccaaccagtttgtgcccaggctctacggtttcaagatccatccaatggcctaccagctgcagctccaagccgccagcaacttcaagagcccagtcaagacgattcgctgagtgccctcccacctcctctgcctgtgacaccaccgtccctccgctgccaccctttcaggaagtctatggtttttagt
To perform BLAST on this sequence,, follow the steps below:
1. Go to the NCBI web page by typing the URL http://www.ncbi.nlm.nih.gov/ 2. Go to BLAST. 3. Go to “Nucleotide BLAST under “Basic BLAST.” 4. Insert the query sequences (Unknown 1) in the window provided 5. Hit “BLAST.”
You will be prompted with a window informing you that your request was successfully submitted to BLAST. It will assign you a “Request ID”. (NOTE: The NCBI web page is changing constantly, so the figures presented in this example may differ from those you may encounter).

35
Get back to your BLAST result page. Look at the graphical view of the results. You will see a set of parallel horizontal bars of different colors and lengths. The color indicates the level of similarity between the query sequence and the matching sequence from the database. A red bar denotes a high similarity score while black denotes very low similarity between the two sequences.

36
Below the graph there is a list of sequences from the database producing significant alignments described by a one-line summary called “description.” The alignments are sorted by E-values (expected values) with the lowest score (0.0) presented at the top of the list. The E-values represent the probability of obtaining the particular alignment by chance rather than by real sequence similarity. Therefore the lower the value the more significant the alignment. E-values are very useful in helping one to decide what results are more meaningful. In addition to E-values, the description provides a score value, which is another statistical value to represent the alignment. The score of the alignment gives you an estimation of how accurate the alignment is; the higher the score the better. Click on one of the bars to obtain the alignment. Notice that the window at the top of the graphical view shows the „description‟ for the selected bar. You can also retrieve the alignment by clicking on one of the “descriptions” below the graph or by scrolling down the page. You will obtain your alignment in the following form:

37
The first part of the result is the “description” with a link to the source from which the matching sequence was obtained, and a description of the sequence. Following the description is the statistical information for the alignment, including the score, the E-value, the “identities” (the ratio of the number of nucleotides considered in the alignment to the number of well-matched nucleotides). In this case the identity is 100%, indicating that 605 nucleotides analyzed form the query sequence were identical to 605 nucleotides in the sequence of Rat casein II beta subunit. If you look at the alignment you will see that both sequences are identical. The low E-value (0.0) together with the high score (1199) and the 100% identity strongly suggest that the “Unknown 1” sequence comes from a rat and is a portion of the casein kinase II beta subunit (CK2) mRNA sequence. You can obtain the complete record (the source for the matching sequence). Click on the NCBI-gi accession number in the sequence description that links to the full sequence of the gene. You will be prompted with a page containing a complete description of the sequence, including the accession number under which the sequence is stored in the database, the name of the gene and of the organism from where the sequence was obtained, a complete taxonomic origin for the organism, a reference to the publication reporting the sequence with comments about the sequence, and the protein and nucleotide sequences. This page also includes “Links” to other relevant sections on NCBI like PubMed, Taxon Browser, Gene etc.

38
4.0 Conclusion
The ability to perform pairwise sequence alignments and to interpret the results from such analyses has become commonplace. These methods have undergone continual evolution, keeping pace with the types and scale of data that are being generated both in individual laboratories and by systematic, organismal sequencing projects.
5.0 Summary BLAST or Basic Local Alignment Search Tool is an NCBI application. BLAST is an invaluable program for searching through GenBank and other databases to find DNA- and protein-sequence similarities. There are various versions of BLAST, and these include BLASTN, BLASTP, BLASTX, TBLASTN, MEGABLAST, and Psi-BLAST.
Accession number
Gene name
Taxonomic report
Link to PubMed

39
6.0 Tutor Marked Assessment Que: Part of a candidate gene from human genome was sequenced. Using
bioinformatics facilities, determine its position in the human genome. Ans: Because the sequence is known to come from human, the most
appropriate thing to do is to run a MegaBLAST from the BLAST page for analyzing the human genome. The link is found under the Genomes section of the BLAST homepage. The sequence of interest is pasted into the query box in FASTA format. Check USE MEGABLAST box. Then click BEGIN SEARCH.
The hits that map to genomic contiqs on chromosome 9 are obtained.
7.0 References/Further Reading
Dubey R.C. 1993. A textbook of Biotechnology Multicolour Illustrative Edition. S. Chand & Co. Ltd. New Delhi.
Narayanem P. 2005. Bioinformatics: A Primer. 1st Ed.New Age International (P)
Ltd. New Delhi. Lee PS & Lee KH 2000.Genomic Analysis.Curr.Opin.Struct. Biol. 11: 171.
Unit 4: Phylogenetic Analysis Content 1.0 Introduction 2.0 Objectives 3.0 Main Content 3.1 Phylogeny 3.2 Phylogenetic Analysis 3.3 Tree Analysis 3.4 Rooted and Unrooted Trees 3.5 Phenetic and Cladistic Methods in Phylogenetic Analysis 3.6 Phylogenetic softwares 4.0 Conclusion 5.0 Summary 6.0 Tutor Marked Assessment 7.0 References/Further Reading
1.0 Introduction
Phylogenetic analysis is the analysis of evolutionary relationships. You learned about sequence alignment in the last unit. In sequence alignment, evolutionary theory was assumed as the basis. This assumption stems from the believe that similarity implies coancestry. An understanding of evolutionary theory, therefore,

40
is critical to appropriate interpretation of bioinformatics results. However, it has been well documented that the closest BLAST hit is not often the nearest neighbor; that is, the sequence that is listed first in the BLAST output as being similar to the query sequence is not necessarily the closest according to phylogenetic analysis. The issue of convergent evolution, whereby evolutionary pressure forces sequences to be similar despite the fact that they had different ancestors, should be borne in mind. Knowing how to handle such issues and appreciating the need to perform robust evolutionary analyses is an important component of bioinformatics analysis.
2.0 Objectives The objectives of the unit are to: (i) know the scope of phylogenetic analyses.
(ii) be able to interpret bioinformatics analyses involving sequence alignments in an evolutionary context.
(iii) know the fundamentals of phylogenetics and interpreting phylogenetic trees.
(iv) know the differences between common phylogenetic methods (v) know common phylogenetic softwares and their different uses.
3.0 Main Content 3.1 Phylogeny
The field of phylogeny has the goals of working out the relationships among species, populations, individuals or genes. Relationship is considered in the sense of kinship or genealogy. This means assignment oif a scheme of descendants of a common ancestor. Evolutionary relationship gives us a glimpse of historical development of life.
Several characters can be used for phylogenetic studies. Indeed, many molecular properties have been used. Serological and cross-reactivity was used from the beginning of the last century until superseded by direct use of sequences. Today, DNA sequences provide the best measures of similarities among species for phylogenetic analysis. Phylogenetics is sometimes called cladistics, because the word clade a set of descendants from a single ancestor is derived from the greek word for branch.
3.2 Phylogenetic Tree
Phylogenetic relationship is usually expressed as a tree called phylogenetic or evolutionary tree. In a tree, taxa are grouped into clades through a tree that comprises of a series of branches and nodes that mark bifurcating points in the branches. A characteristic phylogenetic tree is made up of a root, nodes, branches and leaves. There are different ways of visualizing a tree as shown below:

41
Fig. : Phylogenetic Trees
3.3 Tree Analysis (i) The connectivity of a tree is referred to as tree topology.
(ii) the branch lengths are no significant i.e. they do not indicate the degree of divergence but the branching order
(iii) By adding up branches between each taxa, one can estimate the degree of divergence.
(iv) For instance, adding up branches 1, 2 and 3 indicates the degree of divergence between fly and mouse. Adding up 1, 2 and 4 indicates the degree of divergence fly and human.
(v) In this example, the difference is branch length will infer that fly and mouse are slightly more related to each other than fly and human.
(vi) Only the horizontal branches are significant. The vertical branches are used just to separate out the taxa and to make them easier to view.
3.4 Rooted and Unrooted Trees Consider two phylogenetic trees below:
Analysis
In „A‟, the tree is rooted showing all the descendants of a single original ancestral species. Thus, rooted trees show directionality. In „B‟ the tree is unrooted because it does not show an original ancestral species. Thus, unrooted trees do not show directionality. An additional data froman outgroup, an ancestral species, might allow us to root the tree.
Clade
fly
human
mouse
nodes
branches
Clade or cluster
nodes
branches
Clade or cluster
fly
mouse
human
A B
root
chimpazee human
mouse
rat
human
mouse
rat
chimpazee
A: Rooted Tree B: Unrooted Tree

42
3.5 Phenetic and Cladistic Methods in Phylogenetic Analysis The two common phylogenetic analytical methods are phonetic or clustering approach and cladistic approach. Phonetic (clustering) approach are capable of producing a tree even in the absence of evolutionary relationships. A simple clustering procedure e.g. UPGMA or unweighted Pair Group Method with Arithmetic Mean use pairwise dissimilarities. A modification of the UPGMA method called Neighbour-Joining is designed to correct the unequal rates of evolution in different branches of the tree. Cladistic methods on the other hand deal with evolutionary patterns implied by the possible trees relating to a set of taxa. The most popular cladistic methods in molecular phylogeny are the maximum parsimony and maximum likelihood approaches. They are used for sequence data; they cannot be used for anatomical characters like height. Maximum parsimony method defines an optimal tree as the one that postulates the minimal mutations while maximum likelihood method assigns quantitative probabilities to mutational events rather than merely counting them.
3.6 Phylogenetic Softwares Below are some phylogenetic analysis software resources on the internet:
(1) PHYLIP:http://evolution.genetics.washinton.edu/phylip.html
(2) PhyloBLAST: http://www.pathogenomics.bc.ca/phyloBLAST/
(3) Phylogenetic analysis: http://phylogeny.arizona.edu/tree/programs Computer Programs:programs.html
(4) PhylogenyResources:http://www.ucmp.berkeley.edu/subway/phylogen. html
(5) Phylogeny Programs http://evolution.genetics.washington.edu/
Phylip/software.html
(6) TreeView: http://taxonomy.zoology.gla.ac.uk/rod/treeview.html
(7) Clustal: http://www.igbmc.u.strasb.fr/Bioinfo
(8) Genedoc: http://www.psc.edu/biomed/genedoc
(9) PAUP . 4.0 Conclusion
Data mining is a follow-up to database search. Data mining gives biological meaning to a search.
5.0 Summary Database search are computer-based procedures which can be of two categories: (i) genomic analysis and (ii) proteomic analysis. Once the database search
is complete, the next course of action is data mining, analysis, and modeling procedures. The processes involves primary sequence

43
alignment, secondary and tertiary structure prediction, homology modeling.
6.0 Tutor Marked Assessment
Que: A news story relayed recent development on colorectal cancer and informed that Bert Volgestein at the John Hopkins University School of Medicine was the principal investigator.
(1) Using PubMed find out how many papers Dr. Vogelstein has written
on the subject of colorectal neoplasm are available. Ans: To answer this question, issue a query against PubMed from the NCBI
Home Page. Change the Search pull-down to PubMed, and use “VolgelsteinB” (AU) and “colorectal neoplasms” (MH) as the search query. The (AU) restricts the search to where Dr. Volgelstein is an author (rather than cited or mentioned in the text), and the (MH) limits the search by subject. The search returned 161 entries at the time of this writing.
7.0 References/Further Reading
Dubey R.C. 1993. A textbook of Biotechnology Multicolour Illustrative Edition. S. Chand & Co. Ltd. New Delhi.
Narayanem P. 2005. Bioinformatics: A Primer. 1st Ed.New Age International (P)
Ltd. New Delhi. Lee P.S.& Lee K.H. 2000.Genomic Analysis.Curr.Opin.Struct. Biol. 11: 171.