national highway traffic safety administration national ... · the national 911 program is housed...
TRANSCRIPT

2015 National 911 Progress Report
National Highway Traffic Safety Administration
National 911 Program
Washington, DC
February 2016
About the National 911 Program
The mission of the National 911 Program is to provide Federal leadership in supporting and promoting optimal 911 services. It was created as a point of coordination for activities among 911 stakeholders and to provide information that can be used to improve the 911 system. We do that by developing a variety of tools and resources including tools that can be used to plan and implement Next Generation (NG) 911.
The National 911 Program is housed within the Office of Emergency Medical Services at the National Highway Traffic Safety Administration (NHTSA) – part of the U.S. Department of Transportation (USDOT).
The data within the National 911 Progress Report was collected as part of a project entitled, the “911 Resource Center” which is operated by Booz Allen Hamilton under contract with NHTSA of the USDOT.
DISCLAIMER
This publication is distributed by the USDOT, NHTSA, in the interest of information exchange. The opinions, findings, and conclusions expressed in this publication are those of the authors and not necessarily those of the USDOT or NHTSA. The United States Government assumes no liability for its contents or use thereof.
US Department of Transportation 1200 New Jersey Ave SE Washington, DC 20590

2015 National 911 Progress Report Table of Contents
Contents Acronym List ................................................................................................................................................ iv
Executive Summary ....................................................................................................................................... 1
Introduction .................................................................................................................................................. 4
National 911 Program and Resource Center ................................................................................................ 4
Profile Database ............................................................................................................................................ 4
Data Element Responses ............................................................................................................................ 10
Baseline Data and Progress Benchmarks Elements .................................................................................... 10
Baseline Data: 3.1.1: Data Element Group: Administrative Data ............................................................... 13
3.1.1.1: Year for which Data is being Reported by State ............................................................................ 13
3.1.1.2: Public Availability of State 911 Data .............................................................................................. 14
3.1.2: Data Element Group: System Data ................................................................................................... 15
3.1.2.1: Total Number of 911 Calls Delivered, Based on Local and Regional 911 Authority Data, and Aggregated at the State Level ..................................................................................................................... 15
3.1.2.2: Data Element Sub-Group: Call Volume by Type ............................................................................ 16
3.1.2.2.1: Number of Wireline Calls ............................................................................................................ 16
3.1.2.2.2: Number of Cellular Calls ............................................................................................................. 17
3.1.2.2.3: Number of Voice over Internet Protocol (VoIP) Calls ................................................................. 18
3.1.2.2.4: Number of Multi-line Telephone System (MLTS) Calls ............................................................... 19
3.1.2.2.5: Number of Text-to-911 Messages .............................................................................................. 20
3.1.2.3: Total Number of Sub-State 911 Authorities in a State .................................................................. 21
3.1.2.4: Data Element Sub-Group: Level of Service (LOS) Provided/Available, and Organized by Sub-State 911 Authority .............................................................................................................................................. 22
3.1.2.4.1: No 911 Authority – Calls to 911 are Remote Call Forwarded Only ............................................ 22
3.1.2.4.2: Number of 911 Authorities Where LOS is Limited to Basic 911 ................................................. 23
3.1.2.4.3: Number of 911 Authorities with Enhanced 911 LOS .................................................................. 24
3.1.2.4.4: Number of 911 Authorities with Wireless Phase I LOS as the Highest LOS Available ................ 25
3.1.2.4.5: Number of 911 Authorities with Wireless Phase II LOS as the Highest LOS Available ............... 26
3.1.2.4.6: Number of 911 Authorities that Provide Enhanced 911 LOS for VoIP ....................................... 27
3.1.2.5: Data Element Sub-Group: Percentage of Population and Land Area Served by Each Defined LOS .................................................................................................................................................................... 28
3.1.2.5.1: Percentage of Population with No 911 Authority ...................................................................... 28
3.1.2.5.2: Percentage of Population Served by 911 Authorities with Basic 911 LOS Only ......................... 29
3.1.2.5.3: Percentage of Population Served by 911 Authorities that Provide Enhanced 911 LOS ............. 30
i
2015 National 911 Progress Report Table of Contents
3.1.2.5.4: Percentage of Population Served by 911 Authorities that Provide Wireless Phase I (WPI) LOS as the Highest LOS Available ........................................................................................................................... 31
3.1.2.5.5: Percentage of Population Served by 911 Authorities that Provide Wireless Phase II (WPII) LOS as the Highest LOS Available ....................................................................................................................... 32
3.1.2.5.6: Percentage of Population Served by 911 Authorities that Provide Enhanced 911 LOS for VoIP 33
3.1.2.5.7: Percentage of Geographic Area with No 911 Authority ............................................................. 34
3.1.2.5.8: Percentage of Geographic Area Served by 911 Authorities with Basic 911 LOS Only ................ 35
3.1.2.5.9: Percentage of Geographic Area Served by 911 Authorities that Provide Enhanced 911 LOS .... 36
3.1.2.5.10: Percentage of Geographic Area Served by 911 Authorities that Provide Wireless Phase I (WPI) LOS as the Highest LOS Available ...................................................................................................... 37
3.1.2.5.11: Percentage of Geographic Area Served by 911 Authorities that Provide Wireless Phase II (WPII) LOS as the Highest LOS Available ..................................................................................................... 38
3.1.2.5.12: Percentage of Geographic Area Served by 911 Authorities that Provide Enhanced 911 LOS for VoIP ............................................................................................................................................................. 39
3.1.2.6: State Adoption of its Own Common Definitions for Each LOS ...................................................... 40
3.1.2.7: Nationally Standardized Service Level Definitions ......................................................................... 40
3.1.2.8: Data Element Sub-Group: Total Number of Primary and Secondary PSAPs within a State .......... 42
3.1.2.8.1: Total Number of Primary PSAPs within a State .......................................................................... 42
3.1.2.8.2: Total Number of Secondary PSAPs within a State ...................................................................... 43
3.1.3: Data Element Group: Financial Data ................................................................................................. 44
3.1.3.1: Financial Data Reporting Period Type ............................................................................................ 44
3.1.3.2: Annual Revenue for All 911 Authorities ........................................................................................ 45
3.1.3.2.1: Annual Revenue by 911 Authority Source .................................................................................. 46
3.1.3.3: Annual Costs by 911 Authority ...................................................................................................... 49
Progress Benchmarks: 3.2.1: Data Element Group: Planning ..................................................................... 50
3.2.1.1: Statewide NG911 Plan Adopted .................................................................................................... 50
3.2.1.2: Sub-State 911 Authority NG911 Plan Adopted .............................................................................. 51
3.2.1.3: Statewide NG911 Concept of Operations Developed ................................................................... 52
3.2.1.4: Sub-State 911 Authority Concept of Operations Developed ......................................................... 53
3.2.2: Data Element Group: Procurement .................................................................................................. 54
3.2.2.1: Statewide Request for Proposal Released ..................................................................................... 54
3.2.2.2: 911 Authority RFP Released ........................................................................................................... 55
3.2.2.3: Statewide Components Specified for Procurement ...................................................................... 56
3.2.2.4: Sub-State 911 Authority Components Being Procured ................................................................. 58
3.2.2.5: Captures whether a State Contract for the NG911 Part, Function, or Component Identified Above Has Been Awarded ........................................................................................................................... 60
ii

2015 National 911 Progress Report Table of Contents
3.2.2.6: Number of 911 Authorities Statewide that Have Awarded a Contract for these System Components and/or Functions ................................................................................................................... 61
3.2.2.7: Statewide Installation and Testing ................................................................................................. 62
3.2.2.8: Number of Sub-State 911 Authorities Statewide that Have Installed and Tested These System Components and/or Functions ................................................................................................................... 63
3.2.2.9: Data Element Sub-Group: Agreements (Capacity and Service Level) that Have/Have Not Been Reached with Originating Service Providers ............................................................................................... 64
3.2.2.9.1: List of (Capacity and Service Level) that Have Been Reached with Telecommunications Carriers/Providers ....................................................................................................................................... 64
3.2.2.9.2: Providers With No Agreements In Place ..................................................................................... 66
3.2.3: Data Element Group: Transition ....................................................................................................... 67
3.2.3.1: Percentage of NG911 Authority Systems that Can Process and Interpret Location and Caller Information ................................................................................................................................................. 67
3.2.3.2: Percentage of the Total State Population Served by NG911 Capable Services ............................. 68
3.2.3.3: Percentage of the Geographical Area of a State Served by NG911 Capable Services ................... 69
3.2.4: Data Element Group: Operations ..................................................................................................... 70
3.2.4.1: ESInet connected PSAPs................................................................................................................. 70
3.2.4.2: CPE Handling IP Calls ...................................................................................................................... 71
3.2.4.3: Number of Operational ESInets Deployed within the State .......................................................... 72
3.2.4.4: Percentage of the Master Street Address Guide (MSAG) to Geographic Information System (GIS) Data Synchronization Progress ................................................................................................................... 73
Conclusion ................................................................................................................................................... 74
iii

2015 National 911 Progress Report Acronym List
Acronym List Table 1 below includes a list of acronyms used throughout this report.
Table 1. List of Acronyms
Acronym Definition ALI Automatic Location Identification ANI Automatic Number Identification BCF Border Control Function
DHCP Dynamic Host Configuration Protocol DNS Domain Name System E911 Enhanced 911 ECRF Emergency Call Routing Function
ESInet Emergency Services IP Network ESRP Emergency Services Routing Proxy FCC Federal Communications Commission GIS Geographic Information Systems IP Internet Protocol
LOS Level of Service LoST Location-to-Service Translation Protocol MLTS Multi-line Telephone System NENA National Emergency Number Association NG911 Next Generation 911 NHTSA National Highway Traffic Safety Administration
NRC National 911 Resource Center PSAP Public Safety Answering Point RFP Request for Proposal SR Selective Router
USDOT United States Department of Transportation VoIP Voice over Internet Protocol
iv
2015 National 911 Progress Report Executive Summary
Executive Summary The National 911 Program was created to provide Federal leadership and coordination in promoting optimal 911 services. The Program is housed within the Office of Emergency Medical Services at the National Highway Traffic Safety Administration (NHTSA) – part of the U.S. Department of Transportation (USDOT). The National 911 Program is responsible for developing, collecting, and disseminating information concerning practices, procedures, and technology used in the implementation of 911 services. The program operates and maintains a “National 911 Profile Database” (Profile Database) for collecting and analyzing data that can be used to characterize the status of the statewide 911 systems that comprise the National 911 system.
The Profile Database contains information that can be used to characterize the status and basic functions of State 911 agencies as well as to measure and report on their progress of implementing advanced 911 systems using innovative technology and operations. These data are useful to States and 911 stakeholders in the development of effective policies, planning, and implementation strategies at all levels of government.
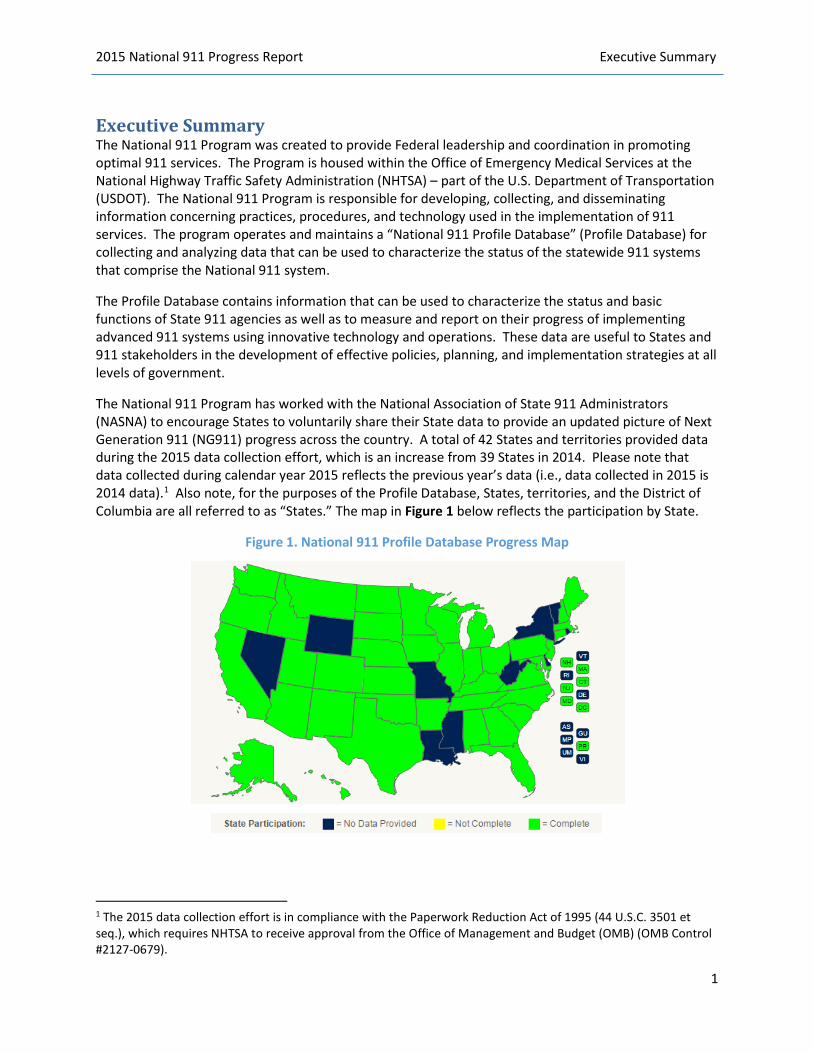
The National 911 Program has worked with the National Association of State 911 Administrators (NASNA) to encourage States to voluntarily share their State data to provide an updated picture of Next Generation 911 (NG911) progress across the country. A total of 42 States and territories provided data during the 2015 data collection effort, which is an increase from 39 States in 2014. Please note that data collected during calendar year 2015 reflects the previous year’s data (i.e., data collected in 2015 is 2014 data).1 Also note, for the purposes of the Profile Database, States, territories, and the District of Columbia are all referred to as “States.” The map in Figure 1 below reflects the participation by State.
Figure 1. National 911 Profile Database Progress Map
1 The 2015 data collection effort is in compliance with the Paperwork Reduction Act of 1995 (44 U.S.C. 3501 et seq.), which requires NHTSA to receive approval from the Office of Management and Budget (OMB) (OMB Control #2127-0679).
1
2015 National 911 Progress Report Executive Summary
Analysis of the data collected during 2015 identified multiple key findings:
Finding 1: The Majority of 911 Calls Are Increasingly Received from Cellular Phones
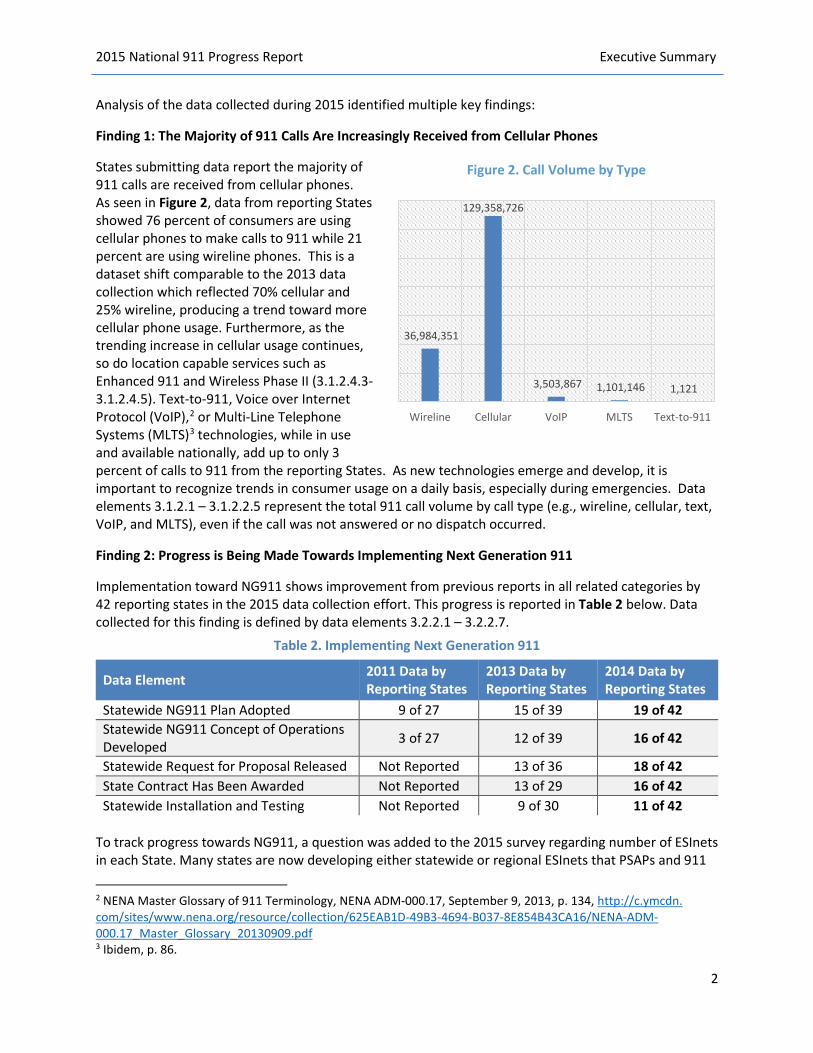
States submitting data report the majority of 911 calls are received from cellular phones. As seen in Figure 2, data from reporting States showed 76 percent of consumers are using cellular phones to make calls to 911 while 21 percent are using wireline phones. This is a dataset shift comparable to the 2013 data collection which reflected 70% cellular and 25% wireline, producing a trend toward more cellular phone usage. Furthermore, as the trending increase in cellular usage continues, so do location capable services such as Enhanced 911 and Wireless Phase II (3.1.2.4.3-3.1.2.4.5). Text-to-911, Voice over Internet Protocol (VoIP),2 or Multi-Line Telephone Systems (MLTS)3 technologies, while in use and available nationally, add up to only 3 percent of calls to 911 from the reporting States. As new technologies emerge and develop, it is important to recognize trends in consumer usage on a daily basis, especially during emergencies. Data elements 3.1.2.1 – 3.1.2.2.5 represent the total 911 call volume by call type (e.g., wireline, cellular, text, VoIP, and MLTS), even if the call was not answered or no dispatch occurred.
Finding 2: Progress is Being Made Towards Implementing Next Generation 911
Implementation toward NG911 shows improvement from previous reports in all related categories by 42 reporting states in the 2015 data collection effort. This progress is reported in Table 2 below. Data collected for this finding is defined by data elements 3.2.2.1 – 3.2.2.7.
36,984,351
129,358,726
3,503,867 1,101,146 1,121
Wireline Cellular VoIP MLTS Text-to-911
Table 2. Implementing Next Generation 911
Data Element 2011 Data by Reporting States
2013 Data by Reporting States
2014 Data by Reporting States
Statewide NG911 Plan Adopted 9 of 27 15 of 39 19 of 42 Statewide NG911 Concept of Operations Developed 3 of 27 12 of 39 16 of 42
Statewide Request for Proposal Released Not Reported 13 of 36 18 of 42 State Contract Has Been Awarded Not Reported 13 of 29 16 of 42 Statewide Installation and Testing Not Reported 9 of 30 11 of 42
To track progress towards NG911, a question was added to the 2015 survey regarding number of ESInets in each State. Many states are now developing either statewide or regional ESInets that PSAPs and 911
2 NENA Master Glossary of 911 Terminology, NENA ADM-000.17, September 9, 2013, p. 134, http://c.ymcdn. com/sites/www.nena.org/resource/collection/625EAB1D-49B3-4694-B037-8E854B43CA16/NENA-ADM-000.17_Master_Glossary_20130909.pdf 3 Ibidem, p. 86.
Figure 2. Call Volume by Type
2
2015 National 911 Progress Report Executive Summary
authorities can access for 911 service. Data element 3.2.4.3 presents information on ESInets, by State. Future National Progress Reports will identify the growth in ESInets over time.
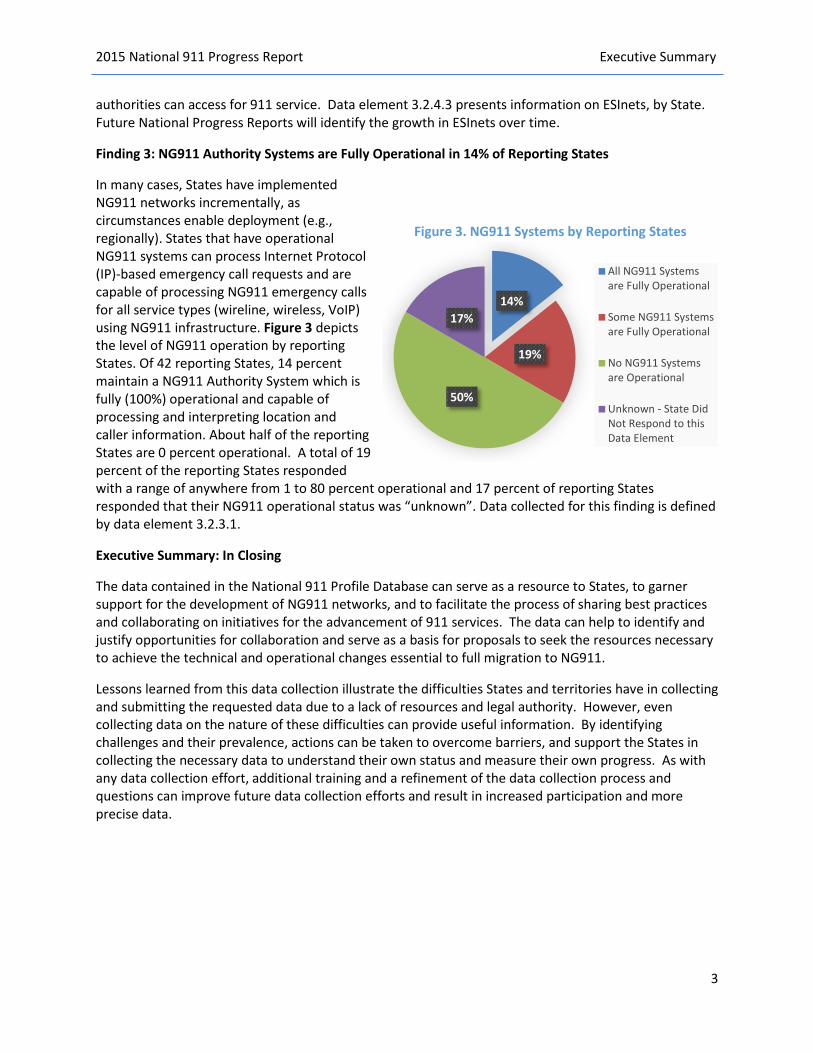
Finding 3: NG911 Authority Systems are Fully Operational in 14% of Reporting States
In many cases, States have implemented NG911 networks incrementally, as circumstances enable deployment (e.g., regionally). States that have operational NG911 systems can process Internet Protocol (IP)-based emergency call requests and are capable of processing NG911 emergency calls for all service types (wireline, wireless, VoIP) using NG911 infrastructure. Figure 3 depicts the level of NG911 operation by reporting States. Of 42 reporting States, 14 percent maintain a NG911 Authority System which is fully (100%) operational and capable of processing and interpreting location and caller information. About half of the reporting States are 0 percent operational. A total of 19 percent of the reporting States responded with a range of anywhere from 1 to 80 percent operational and 17 percent of reporting States responded that their NG911 operational status was “unknown”. Data collected for this finding is defined by data element 3.2.3.1.
Executive Summary: In Closing
The data contained in the National 911 Profile Database can serve as a resource to States, to garner support for the development of NG911 networks, and to facilitate the process of sharing best practices and collaborating on initiatives for the advancement of 911 services. The data can help to identify and justify opportunities for collaboration and serve as a basis for proposals to seek the resources necessary to achieve the technical and operational changes essential to full migration to NG911.
Lessons learned from this data collection illustrate the difficulties States and territories have in collecting and submitting the requested data due to a lack of resources and legal authority. However, even collecting data on the nature of these difficulties can provide useful information. By identifying challenges and their prevalence, actions can be taken to overcome barriers, and support the States in collecting the necessary data to understand their own status and measure their own progress. As with any data collection effort, additional training and a refinement of the data collection process and questions can improve future data collection efforts and result in increased participation and more precise data.
14%
19%
50%
17%
All NG911 Systemsare Fully Operational
Some NG911 Systemsare Fully Operational
No NG911 Systemsare Operational
Unknown - State DidNot Respond to thisData Element
Figure 3. NG911 Systems by Reporting States
3
2015 National 911 Progress Report Introduction
Introduction Historically, there has been a general lack of data depicting the status of 911 and Next Generation 911 (NG911) implementation nationwide to enable 911 stakeholders to answer basic questions such as:
• How many primary public safety answering points (PSAPs) does a specific State have? • How many wireline and wireless 911 calls are answered per year? • How many States have issued request for proposals (RFPs) for NG911 procurements? • How many PSAPS are NG911 capable or have migrated to NG911?
In an effort to acquire data that is valuable to 911 stakeholders, the National 911 Program worked with the National Association of State 911 Administrators (NASNA) to develop a database whose data elements are both useful and feasible to collect. The National 911 Profile Database was developed, containing 56 data elements. NASNA also assisted with efforts to develop a Data Dictionary and an online data submission tool, which was trial tested in 2010.
During calendar year 2012, data from 2011 was successfully collected from a total of 27 States. During the summer of 2014, the National 911 Program repeated the data collection effort for by collecting 2013 data from 39 States to achieve an updated picture of NG911 implementation across the country. In the summer of 2015, the program again repeated data collection efforts, this time receiving data from a total of 42 States.
The purpose of this report is to provide a summary of the data collected during calendar year 2015. Data collected during this most recent effort reflects 2014 data and highlights the status of State progression toward NG911, as well as essential 911 statistics that will be valuable for 911 stakeholders. This report provides State-by-State data, thus providing a wealth of information and allowing States to utilize the data for collaborative purposes. States with similar attributes may want to work together to identify and implement workable strategies for deploying NG911. Neighboring States may want to compare data to understand the issues inherent in creating interstate NG911 connections. National and Federal partners may want to create an overall picture of the status of NG911 implementation and provide opportunities for communities with identified deployment challenges.
National 911 Program and Resource Center The National 911 Program was created to provide Federal leadership and coordination in promoting optimal 911 services. More specifically, the Program is responsible for developing, collecting, and disseminating information concerning practices, procedures, and technology used in the implementation of 911 services. To collect and disseminate this information, the National 911 Program houses the National 911 Resource Center (NRC). The purpose of the Resource Center is to provide useful information and resources to the 911 community. The NRC operates and maintains a “National 911 Profile Database” (Profile Database) for collecting and compiling data which can be used to characterize the demographics of the statewide 911 systems that comprise the national 911 network. It can also be used to measure and report on the progress of 911 authorities to enhance their existing systems and to implement NG911.
Profile Database The Profile Database was designed to collect information to assist the 911 community by providing basic demographic information on the characteristics of the National 911 system, as well as progress on implementation of NG911. Data related to operations, finance, and progress toward NG911 at the State
4
2015 National 911 Progress Report Introduction
level will be useful to 911 stakeholders in the development of effective policies, planning, and implementation strategies at all levels of government. Having access to data will be valuable when justifying a position on proposed legislation, or the implementation of NG911 in a State or county. During the Profile Database data collection effort of 2014, an online survey tool was created for States and territories to easily enter their data. A map (see Figure 4 on pg. 7) was also developed, which provided States with a real-time visual of current progress of the data collection effort.
Data Dictionary After NASNA completed the list of data elements, the National 911 Program, with continued stakeholder input, completed a detailed Data Dictionary that identified data elements in 2010. The purpose of the Data Dictionary is to provide a clear definition of the data elements included in the Profile Database, as well as the parameters for filling out and submitting data using the online survey tool. The Data Dictionary contains tables that define each element and provides a description of the information being requested from reporting entities such as:
• The title assigned to the data element• The database data type corresponding to the data element involved (i.e., number, text, drop
down)• The size (in bytes) allowed by the data type of the data element involved• The form input type (i.e., numbers versus letters)• A narrative description of the data element• Any reporting instructions associated with the data element
Within the Data Dictionary, data elements were grouped into two categories – Baseline Data and Progress Benchmarks:
• Baseline Data reflect the current status and nature of 911 operations from State to State. Thesedata elements are largely descriptive in nature and are intended to provide a generaldemographic view of existing 911 services across the country.
• Progress Benchmarks reflect the status of State efforts to implement NG911 systems andcapabilities. These data elements are largely implementation or deployment benchmarksagainst which progress can be measured.
Data element definitions are reviewed by the staff of the Resource Center and National 911 Program on a yearly basis based upon information gathered through the data collection and reporting process, as well as feedback provided by reporting entities. This process allows data definitions to be evaluated and revised to improve future data collection.
Data Collection and Reporting Process All 50 states, the District of Columbia, and six territories (American Samoa, Guam, Minor Outlying Islands, Northern Mariana Islands, Puerto Rico, and the U.S. Virgin Islands) were invited to participate in the Profile Database data collection effort. For the purposes of the Profile Database, states, territories, and the District of Columbia are all referred to as “States.”
To kick off the effort, the National 911 Program provided in-depth information to members of the National Association of State 911 Administrators (NASNA) at their annual June meeting. Following the presentation, NASNA members are asked to reaffirm their State point of contact for data submission.
5
2015 National 911 Progress Report Introduction
In May of 2015, the National 911 Program hosted two training webinars for State designees to provide guidance on survey administration and logistics. A reference guide was created for State designees to assist individuals in accessing the Profile Database site and utilizing its functions.
In June and July of 2015, the online survey tool was opened for input of State data. After the online survey tool was closed for submissions, the National 911 Program evaluated the data, followed up with States for clarification on specific data elements, and produced this report. The data collection effort greatly benefited from the support of NASNA and its members in advocating for data submission and promoting the benefits the data will provide to the 911 community. In addition, the National Emergency Number Association (NENA) assisted in analyzing the data and provided valuable insights on key findings and overall accuracy.
The National 911 Program obtained formal clearance from the Office of Management and Budget (OMB) for this data collection (OMB Control Number 2127-0679). 4
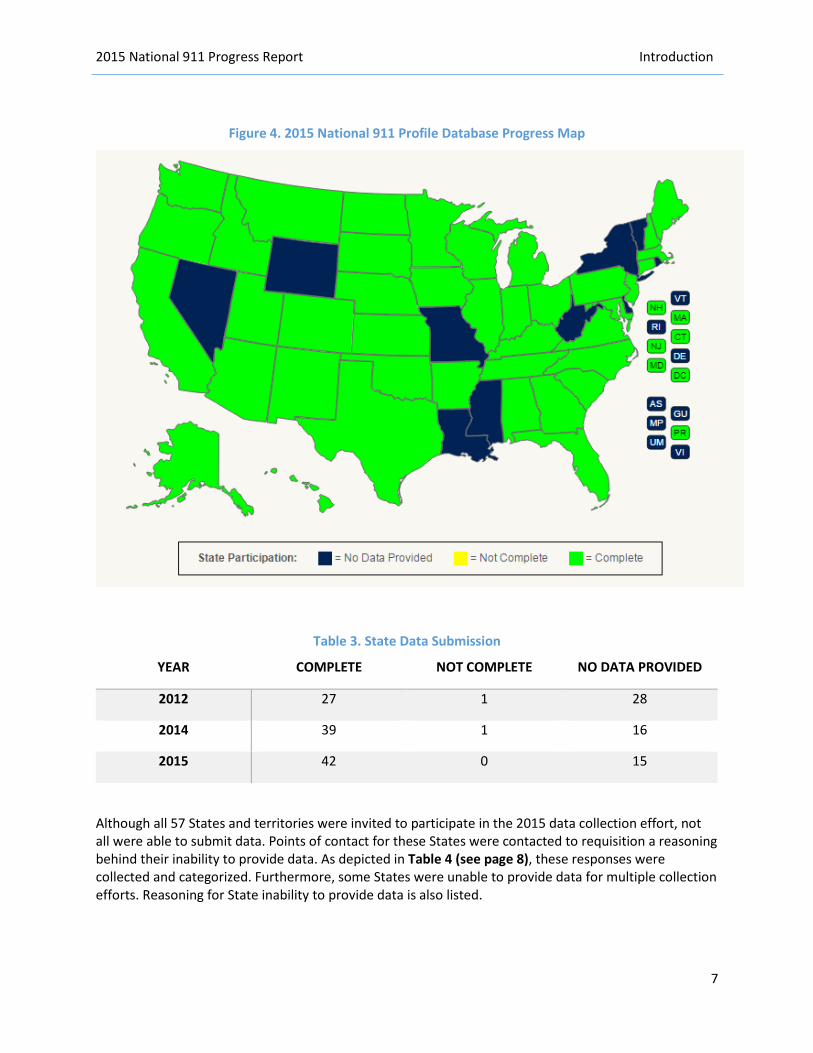
State Participation The National 911 Profile Database Progress Map in Figure 4 (see pg. 7) depicts State participation for the 2015 Profile Database data collection effort. State participation is represented by three colors on the map: blue indicates no data provided; yellow indicates a State did not complete their data collection submission; and green indicates States completed their data collection and submission. In 2015, all States who collected data also fully completed their submission. As illustrated in Table 3 (see pg. 7), the number of participating States has improved from previous years. In 2015, 42 States completed data submission, compared to 39 in 2014 and 27 in 2012.
4 Ibid.
6
2015 National 911 Progress Report Introduction
Figure 4. 2015 National 911 Profile Database Progress Map
Table 3. State Data Submission
YEAR COMPLETE NOT COMPLETE NO DATA PROVIDED
2012 27 1 28
2014 39 1 16
2015 42 0 15
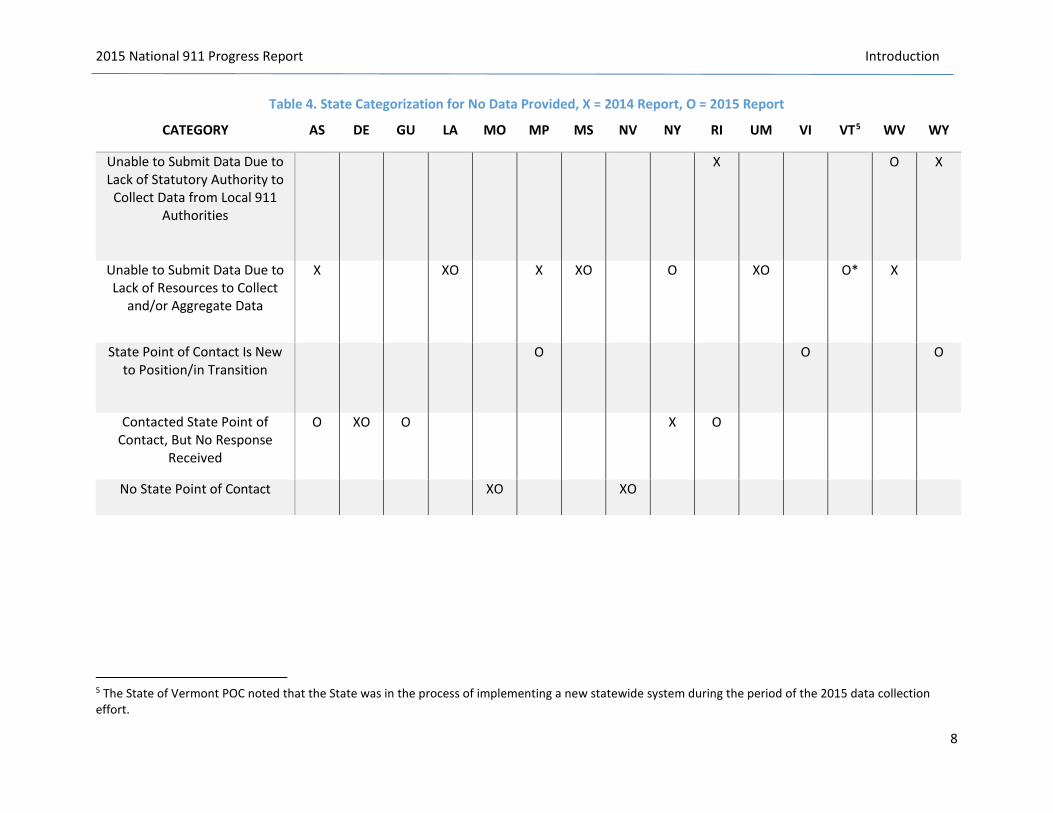
Although all 57 States and territories were invited to participate in the 2015 data collection effort, not all were able to submit data. Points of contact for these States were contacted to requisition a reasoning behind their inability to provide data. As depicted in Table 4 (see page 8), these responses were collected and categorized. Furthermore, some States were unable to provide data for multiple collection efforts. Reasoning for State inability to provide data is also listed.
7
2015 National 911 Progress Report Introduction
Table 4. State Categorization for No Data Provided, X = 2014 Report, O = 2015 Report
CATEGORY AS DE GU LA MO MP MS NV NY RI UM VI VT5 WV WY
X O X
X XO X XO O XO O* X
O O O
O XO O X O
Unable to Submit Data Due to Lack of Statutory Authority to
Collect Data from Local 911 Authorities
Unable to Submit Data Due to Lack of Resources to Collect
and/or Aggregate Data
State Point of Contact Is New to Position/in Transition
Contacted State Point of Contact, But No Response
Received
No State Point of Contact XO XO
5 The State of Vermont POC noted that the State was in the process of implementing a new statewide system during the period of the 2015 data collection effort.
8
2015 National 911 Progress Report Introduction
Accuracy of the Data The data contained in this report were analyzed; however there may have been misinterpretations of certain data elements or data could have been entered incorrectly. Data was verified through a variety of methods6 including, but not limited to following up with States, who were extremely responsive; working with NENA; working with 911 system component subject matter experts; and utilizing the Federal Communications Commission (FCC) 911 Master PSAP Registry.7 Data reported in the following sections represent actual responses received from States.
Challenges and Lessons Learned Using feedback from reporting State points of contact and while administering the 2015 Profile Database data collection effort, several challenges and lessons learned were discovered. The National 911 Program has identified these challenges and lessons as opportunities to continue improving the data collection effort every year. There were many challenges and lessons learned during the 2015 data collection effort, which are listed below.
Challenges:
• Many States still lack essential resources to collect and/or aggregate data. • Conveying universal definitions for technical specifications in data elements can be difficult and
lead to misinterpretation by a State point of contact. Lessons Learned:
• Planning and timing the data collection effort in conjunction with the FCC report could improve participation from State points of contact. Several data elements collected by the FCC coincide with elements defined by NHTSA.
• Open-ended questions can lead to misinterpretation of what is being requested by State points of contact.
• Refining levels of service, revenue, and percentage questions can lead to more accurate responses by State points of contact.
6 The National Emergency Number Association (NENA) 911 Deployment Map aided in checking the accuracy of levels of service. The map can be found at the following link: http://nena.ddti.net/ 7 Federal Communications Commission (FCC), 911 Master PSAP Registry spreadsheet: http://www.fcc.gov /encyclopedia/9-1-1-master-psap-registry.
9
2015 National 911 Progress Report Data Element Responses
Data Element Responses The National Profile Database survey included two sections for which data was requested: Baseline Data and Progress Benchmarks. Detailed responses by State for each data element within the survey are provided in the following tables. The data collected during calendar year 2015 reflects 2014 data, the date collected in 2014 reflects data from 2013, and the data collected during calendar year 2012 reflects data from 2011.
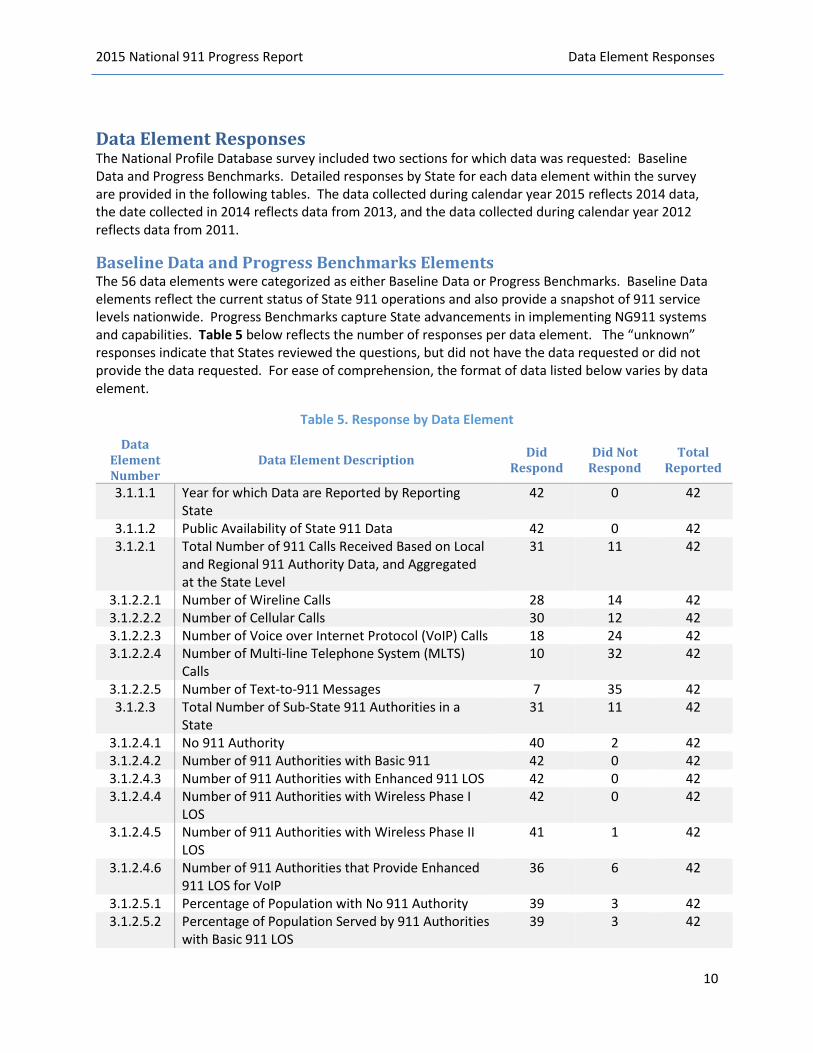
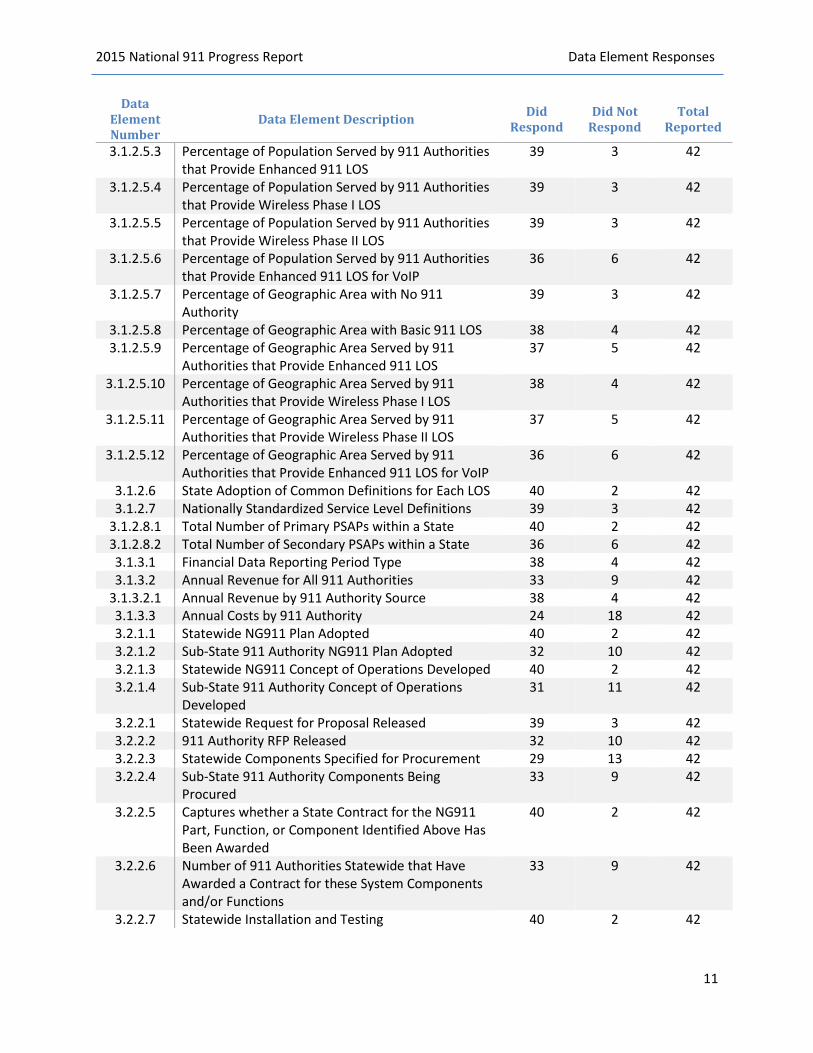
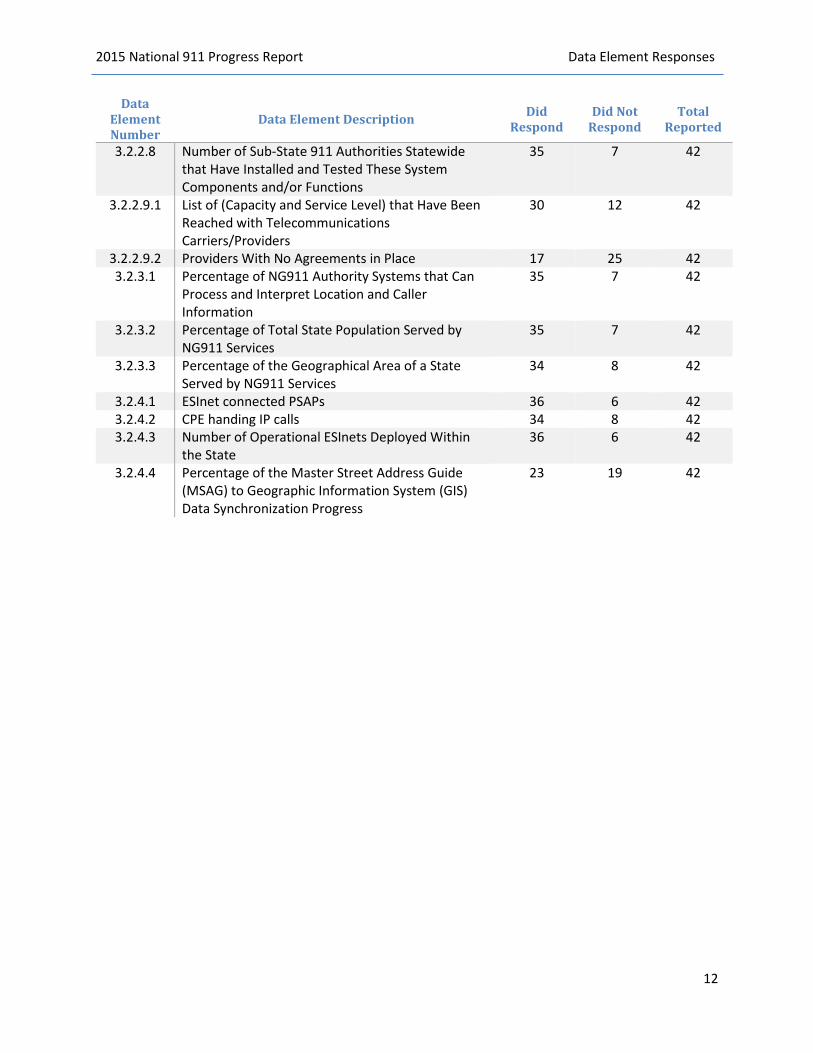
Baseline Data and Progress Benchmarks Elements The 56 data elements were categorized as either Baseline Data or Progress Benchmarks. Baseline Data elements reflect the current status of State 911 operations and also provide a snapshot of 911 service levels nationwide. Progress Benchmarks capture State advancements in implementing NG911 systems and capabilities. Table 5 below reflects the number of responses per data element. The “unknown” responses indicate that States reviewed the questions, but did not have the data requested or did not provide the data requested. For ease of comprehension, the format of data listed below varies by data element.
Table 5. Response by Data Element
Data Element Number
Data Element Description Did Respond
Did Not Respond
Total Reported
3.1.1.1 Year for which Data are Reported by Reporting State
42 0 42
3.1.1.2 Public Availability of State 911 Data 42 0 42 3.1.2.1 Total Number of 911 Calls Received Based on Local
and Regional 911 Authority Data, and Aggregated at the State Level
31 11 42
3.1.2.2.1 Number of Wireline Calls 28 14 42 3.1.2.2.2 Number of Cellular Calls 30 12 42 3.1.2.2.3 Number of Voice over Internet Protocol (VoIP) Calls 18 24 42 3.1.2.2.4 Number of Multi-line Telephone System (MLTS)
Calls 10 32 42
3.1.2.2.5 Number of Text-to-911 Messages 7 35 42 3.1.2.3 Total Number of Sub-State 911 Authorities in a
State 31 11 42
3.1.2.4.1 No 911 Authority 40 2 42 3.1.2.4.2 Number of 911 Authorities with Basic 911 42 0 42 3.1.2.4.3 Number of 911 Authorities with Enhanced 911 LOS 42 0 42 3.1.2.4.4 Number of 911 Authorities with Wireless Phase I
LOS 42 0 42
3.1.2.4.5 Number of 911 Authorities with Wireless Phase II LOS
41 1 42
3.1.2.4.6 Number of 911 Authorities that Provide Enhanced 911 LOS for VoIP
36 6 42
3.1.2.5.1 Percentage of Population with No 911 Authority 39 3 42 3.1.2.5.2 Percentage of Population Served by 911 Authorities
with Basic 911 LOS 39 3 42
10
2015 National 911 Progress Report Data Element Responses
Data Element Number
Data Element Description Did Respond
Did Not Respond
Total Reported
3.1.2.5.3 Percentage of Population Served by 911 Authorities that Provide Enhanced 911 LOS
39 3 42
3.1.2.5.4 Percentage of Population Served by 911 Authorities that Provide Wireless Phase I LOS
39 3 42
3.1.2.5.5 Percentage of Population Served by 911 Authorities that Provide Wireless Phase II LOS
39 3 42
3.1.2.5.6 Percentage of Population Served by 911 Authorities that Provide Enhanced 911 LOS for VoIP
36 6 42
3.1.2.5.7 Percentage of Geographic Area with No 911 Authority
39 3 42
3.1.2.5.8 Percentage of Geographic Area with Basic 911 LOS 38 4 42 3.1.2.5.9 Percentage of Geographic Area Served by 911
Authorities that Provide Enhanced 911 LOS 37 5 42
3.1.2.5.10 Percentage of Geographic Area Served by 911 Authorities that Provide Wireless Phase I LOS
38 4 42
3.1.2.5.11 Percentage of Geographic Area Served by 911 Authorities that Provide Wireless Phase II LOS
37 5 42
3.1.2.5.12 Percentage of Geographic Area Served by 911 Authorities that Provide Enhanced 911 LOS for VoIP
36 6 42
3.1.2.6 State Adoption of Common Definitions for Each LOS 40 2 42 3.1.2.7 Nationally Standardized Service Level Definitions 39 3 42
3.1.2.8.1 Total Number of Primary PSAPs within a State 40 2 42 3.1.2.8.2 Total Number of Secondary PSAPs within a State 36 6 42 3.1.3.1 Financial Data Reporting Period Type 38 4 42 3.1.3.2 Annual Revenue for All 911 Authorities 33 9 42
3.1.3.2.1 Annual Revenue by 911 Authority Source 38 4 42 3.1.3.3 Annual Costs by 911 Authority 24 18 42 3.2.1.1 Statewide NG911 Plan Adopted 40 2 42 3.2.1.2 Sub-State 911 Authority NG911 Plan Adopted 32 10 42 3.2.1.3 Statewide NG911 Concept of Operations Developed 40 2 42 3.2.1.4 Sub-State 911 Authority Concept of Operations
Developed 31 11 42
3.2.2.1 Statewide Request for Proposal Released 39 3 42 3.2.2.2 911 Authority RFP Released 32 10 42 3.2.2.3 Statewide Components Specified for Procurement 29 13 42 3.2.2.4 Sub-State 911 Authority Components Being
Procured 33 9 42
3.2.2.5 Captures whether a State Contract for the NG911 Part, Function, or Component Identified Above Has Been Awarded
40 2 42
3.2.2.6 Number of 911 Authorities Statewide that Have Awarded a Contract for these System Components and/or Functions
33 9 42
3.2.2.7 Statewide Installation and Testing 40 2 42
11
2015 National 911 Progress Report Data Element Responses
Data Element Number
Data Element Description Did Respond
Did Not Respond
Total Reported
3.2.2.8 Number of Sub-State 911 Authorities Statewide that Have Installed and Tested These System Components and/or Functions
35 7 42
3.2.2.9.1 List of (Capacity and Service Level) that Have Been Reached with Telecommunications Carriers/Providers
30 12 42
3.2.2.9.2 Providers With No Agreements in Place 17 25 42 3.2.3.1 Percentage of NG911 Authority Systems that Can
Process and Interpret Location and Caller Information
35 7 42
3.2.3.2 Percentage of Total State Population Served by NG911 Services
35 7 42
3.2.3.3 Percentage of the Geographical Area of a State Served by NG911 Services
34 8 42
3.2.4.1 ESInet connected PSAPs 36 6 42 3.2.4.2 CPE handing IP calls 34 8 42 3.2.4.3 Number of Operational ESInets Deployed Within
the State 36 6 42
3.2.4.4 Percentage of the Master Street Address Guide (MSAG) to Geographic Information System (GIS) Data Synchronization Progress
23 19 42
12
2015 National 911 Progress Report Data Element Responses
Baseline Data: 3.1.1: Data Element Group: Administrative Data
3.1.1.1: Year for which Data is being Reported by State
Question Select the year for which data are being reported by your State.
Definition The calendar year (January 1 through December 31) on which information or data was initially entered and/or updated. Data entered for a particular calendar year must apply to that calendar year. In addition to that date, the system will automatically maintain a history of changes to data elements, up to and including the last update. This is important because it indicates how old the information in the database is.
It is recognized that fiscal data entered may reflect a reporting State’s fiscal year and not a calendar year.
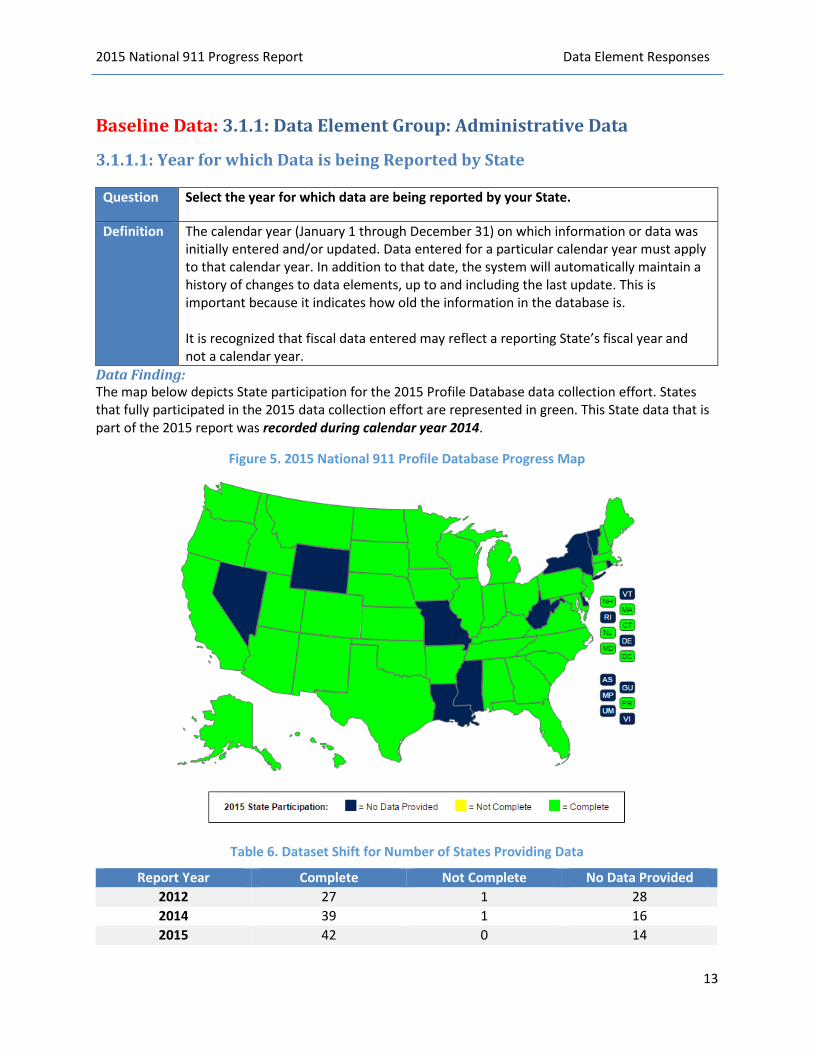
Data Finding: The map below depicts State participation for the 2015 Profile Database data collection effort. States that fully participated in the 2015 data collection effort are represented in green. This State data that is part of the 2015 report was recorded during calendar year 2014.
Figure 5. 2015 National 911 Profile Database Progress Map
Table 6. Dataset Shift for Number of States Providing Data
Report Year Complete Not Complete No Data Provided 2012 27 1 28 2014 39 1 16 2015 42 0 14
13
2015 National 911 Progress Report Data Element Responses
3.1.1.2: Public Availability of State 911 Data
Question Is your data publicly available?
Definition This element asserts that a State’s 911 data are or are not available to the public.
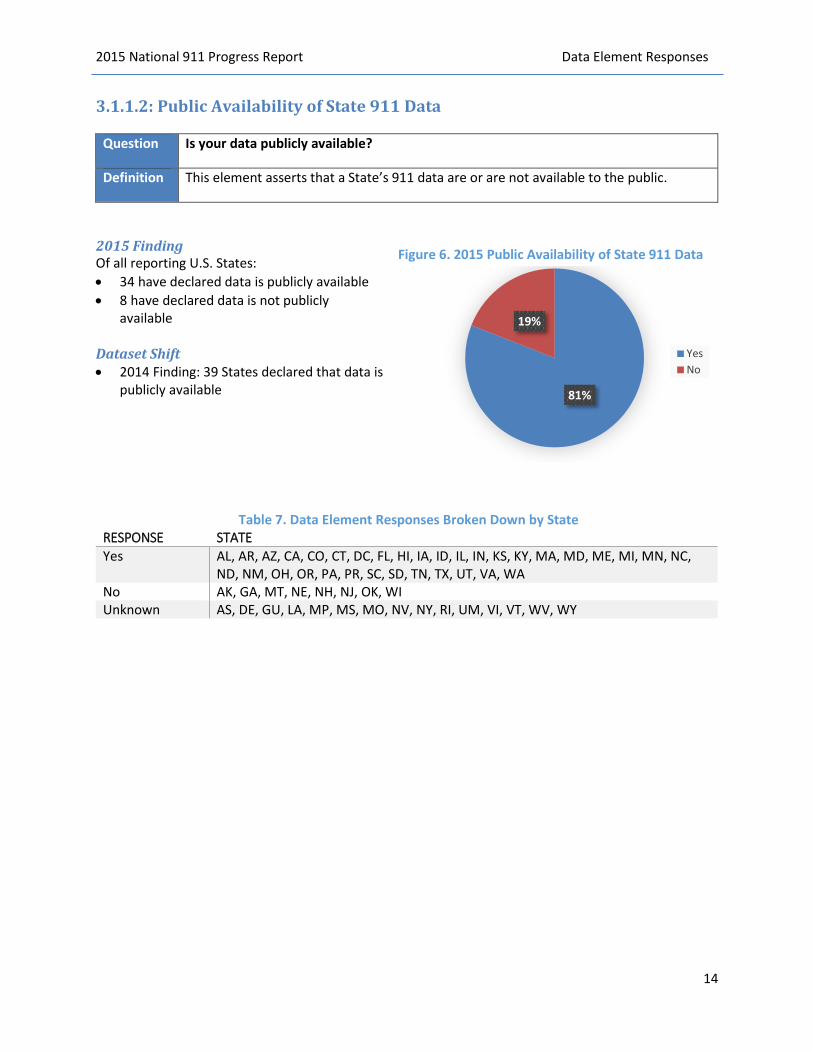
2015 Finding Of all reporting U.S. States: • 34 have declared data is publicly available• 8 have declared data is not publicly
available
Dataset Shift • 2014 Finding: 39 States declared that data is
publicly available
Table 7. Data Element Responses Broken Down by State RESPONSE STATE Yes AL, AR, AZ, CA, CO, CT, DC, FL, HI, IA, ID, IL, IN, KS, KY, MA, MD, ME, MI, MN, NC,
ND, NM, OH, OR, PA, PR, SC, SD, TN, TX, UT, VA, WA No AK, GA, MT, NE, NH, NJ, OK, WI Unknown AS, DE, GU, LA, MP, MS, MO, NV, NY, RI, UM, VI, VT, WV, WY
81%
19%
YesNo
Figure 6. 2015 Public Availability of State 911 Data
14

2015 National 911 Progress Report Data Element Responses
3.1.2: Data Element Group: System Data
3.1.2.1: Total Number of 911 Calls Delivered, Based on Local and Regional 911 Authority Data, and Aggregated at the State Level
Question Enter the total number of 911 calls delivered to “primary” PSAPs in your State, even if not answered or no dispatch occurred.
Definition Total number of calls delivered to 911 authorities for the calendar year, aggregated to the State level.8
Table 8. Total Number of 911 Calls Delivered to “Primary” PSAPs
State Response State Response TX 26,231,419 MN 3,230,292 CA 25,764,527 PR 3,117,995 FL 20,180,248 KS 3,093,693 IL 11,469,029 AR 2,695,391 PA 8,892,027 CT 2,172,374 NJ 7,684,796 OR 1,736,433 NC 7,295,651 HI 1,640,000 AZ 6,429,810 DC 1,377,053 CO 6,295,867 NM 1,249,948 WA 5,935,096 NE 973,107 MI 5,890,159 UT 968,796 IN 5,243,302 ME 646,900
MD 4,755,059 NH 485,588 VA 4,391,679 SD 319,450 MA 3,905,589 AK 243,510 KY 3,349,617
No Response: AL, GA, IA, ID, MT, ND, OH, OK, SC, TN, WI Did Not Report Data: AS, DE, GU, LA, MP, MS, MO, NV, NY, RI, UM, VI, VT, WV, WY
2015 Finding Of all U.S. States and territories
• The total number of delivered 911 calls based on 31 reporting States was 177,664,405 • 11 of 42 reporting States chose not to respond to this question
Dataset Shift • 2014 Finding: of 30 reporting States the total number of calls was 147,690,005 • 2014 Finding: 10 of 40 reporting States chose not to respond to this question
8 NENA Master Glossary of 911 Terminology, NENA ADM-000.17, September 9, 2013, p. 98, http://c.ymcdn.com /sites/www.nena.org/resource/collection/625EAB1D-49B3-4694-B037-8E854B43CA16/NENA-ADM-000.17_Master_Glossary_20130909.pdf.
15
2015 National 911 Progress Report Data Element Responses
3.1.2.2: Data Element Sub-Group: Call Volume by Type
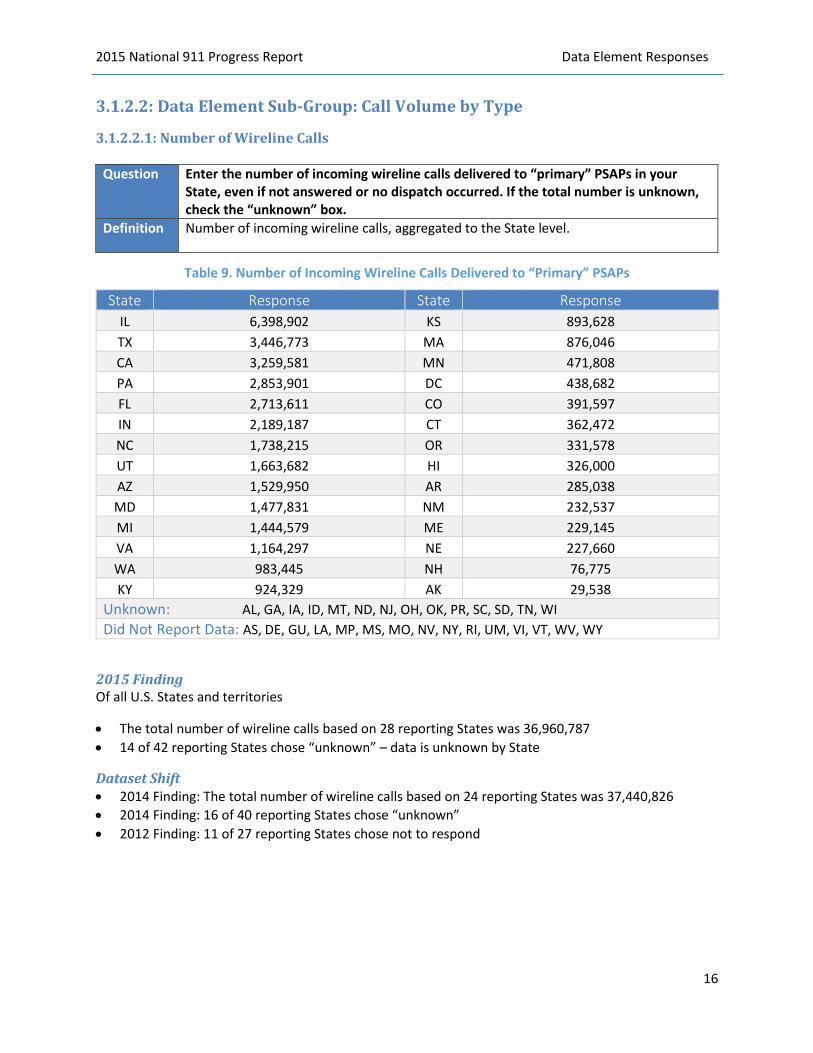
3.1.2.2.1: Number of Wireline Calls
Question Enter the number of incoming wireline calls delivered to “primary” PSAPs in your State, even if not answered or no dispatch occurred. If the total number is unknown, check the “unknown” box.
Definition Number of incoming wireline calls, aggregated to the State level.
Table 9. Number of Incoming Wireline Calls Delivered to “Primary” PSAPs
State Response State Response IL 6,398,902 KS 893,628 TX 3,446,773 MA 876,046 CA 3,259,581 MN 471,808 PA 2,853,901 DC 438,682 FL 2,713,611 CO 391,597 IN 2,189,187 CT 362,472 NC 1,738,215 OR 331,578 UT 1,663,682 HI 326,000 AZ 1,529,950 AR 285,038 MD 1,477,831 NM 232,537 MI 1,444,579 ME 229,145 VA 1,164,297 NE 227,660 WA 983,445 NH 76,775 KY 924,329 AK 29,538
Unknown: AL, GA, IA, ID, MT, ND, NJ, OH, OK, PR, SC, SD, TN, WI Did Not Report Data: AS, DE, GU, LA, MP, MS, MO, NV, NY, RI, UM, VI, VT, WV, WY
2015 Finding Of all U.S. States and territories
• The total number of wireline calls based on 28 reporting States was 36,960,787 • 14 of 42 reporting States chose “unknown” – data is unknown by State
Dataset Shift • 2014 Finding: The total number of wireline calls based on 24 reporting States was 37,440,826 • 2014 Finding: 16 of 40 reporting States chose “unknown” • 2012 Finding: 11 of 27 reporting States chose not to respond
16
2015 National 911 Progress Report Data Element Responses
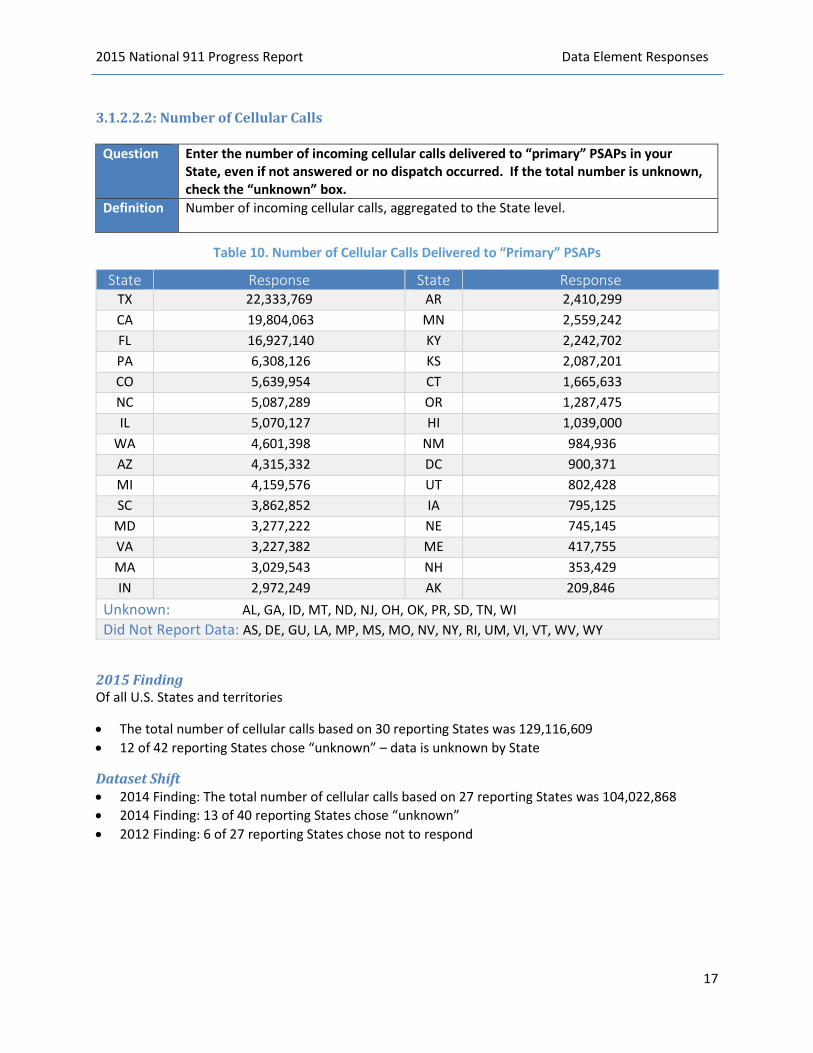
3.1.2.2.2: Number of Cellular Calls
Question Enter the number of incoming cellular calls delivered to “primary” PSAPs in your State, even if not answered or no dispatch occurred. If the total number is unknown, check the “unknown” box.
Definition Number of incoming cellular calls, aggregated to the State level.
Table 10. Number of Cellular Calls Delivered to “Primary” PSAPs
State Response State Response TX 22,333,769 AR 2,410,299 CA 19,804,063 MN 2,559,242 FL 16,927,140 KY 2,242,702 PA 6,308,126 KS 2,087,201 CO 5,639,954 CT 1,665,633 NC 5,087,289 OR 1,287,475 IL 5,070,127 HI 1,039,000
WA 4,601,398 NM 984,936 AZ 4,315,332 DC 900,371 MI 4,159,576 UT 802,428 SC 3,862,852 IA 795,125
MD 3,277,222 NE 745,145 VA 3,227,382 ME 417,755 MA 3,029,543 NH 353,429 IN 2,972,249 AK 209,846
Unknown: AL, GA, ID, MT, ND, NJ, OH, OK, PR, SD, TN, WI Did Not Report Data: AS, DE, GU, LA, MP, MS, MO, NV, NY, RI, UM, VI, VT, WV, WY
2015 Finding Of all U.S. States and territories
• The total number of cellular calls based on 30 reporting States was 129,116,609 • 12 of 42 reporting States chose “unknown” – data is unknown by State
Dataset Shift • 2014 Finding: The total number of cellular calls based on 27 reporting States was 104,022,868 • 2014 Finding: 13 of 40 reporting States chose “unknown” • 2012 Finding: 6 of 27 reporting States chose not to respond
17
2015 National 911 Progress Report Data Element Responses
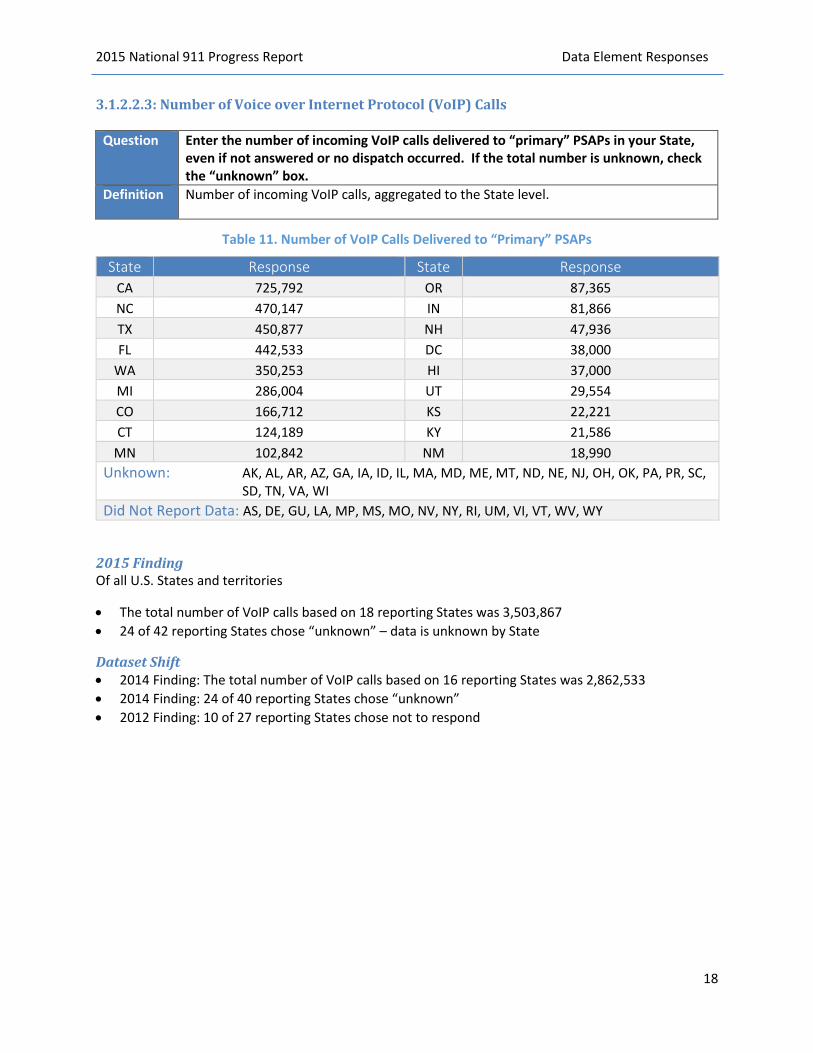
3.1.2.2.3: Number of Voice over Internet Protocol (VoIP) Calls
Question Enter the number of incoming VoIP calls delivered to “primary” PSAPs in your State, even if not answered or no dispatch occurred. If the total number is unknown, check the “unknown” box.
Definition Number of incoming VoIP calls, aggregated to the State level.
Table 11. Number of VoIP Calls Delivered to “Primary” PSAPs
State Response State Response CA 725,792 OR 87,365 NC 470,147 IN 81,866 TX 450,877 NH 47,936 FL 442,533 DC 38,000
WA 350,253 HI 37,000 MI 286,004 UT 29,554 CO 166,712 KS 22,221 CT 124,189 KY 21,586
MN 102,842 NM 18,990 Unknown: AK, AL, AR, AZ, GA, IA, ID, IL, MA, MD, ME, MT, ND, NE, NJ, OH, OK, PA, PR, SC, SD, TN, VA, WI Did Not Report Data: AS, DE, GU, LA, MP, MS, MO, NV, NY, RI, UM, VI, VT, WV, WY
2015 Finding Of all U.S. States and territories
• The total number of VoIP calls based on 18 reporting States was 3,503,867 • 24 of 42 reporting States chose “unknown” – data is unknown by State
Dataset Shift • 2014 Finding: The total number of VoIP calls based on 16 reporting States was 2,862,533 • 2014 Finding: 24 of 40 reporting States chose “unknown” • 2012 Finding: 10 of 27 reporting States chose not to respond
18
2015 National 911 Progress Report Data Element Responses
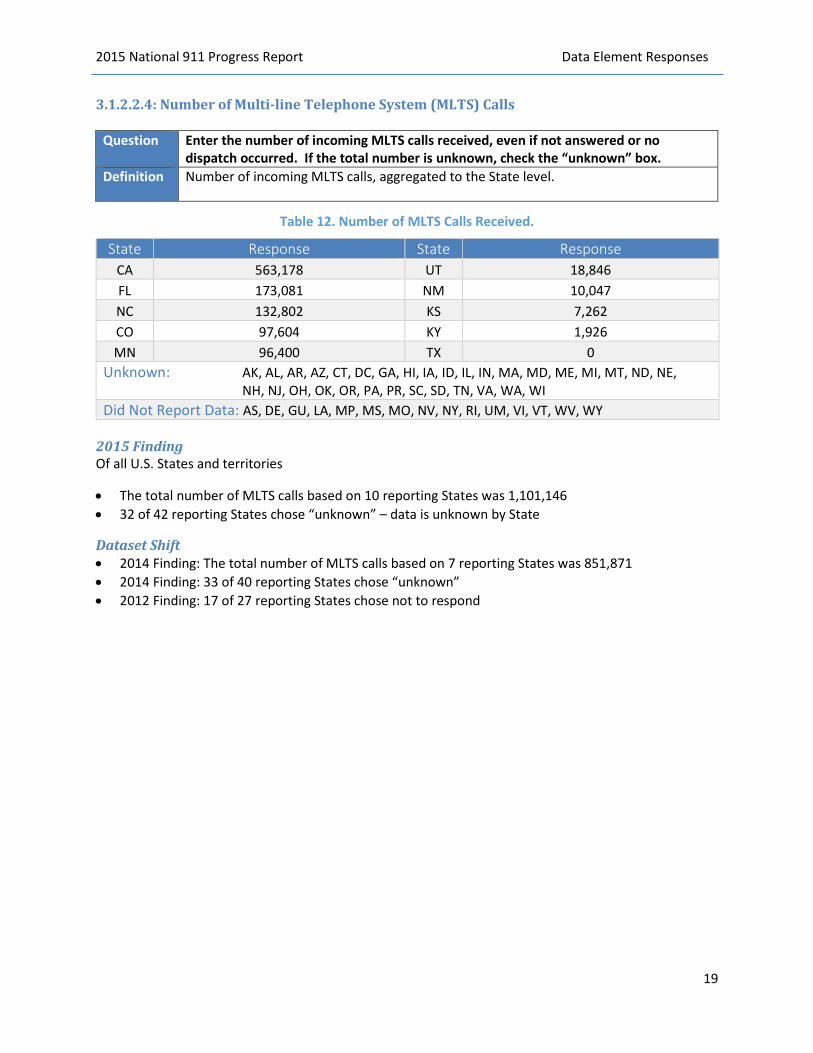
3.1.2.2.4: Number of Multi-line Telephone System (MLTS) Calls
Question Enter the number of incoming MLTS calls received, even if not answered or no dispatch occurred. If the total number is unknown, check the “unknown” box.
Definition Number of incoming MLTS calls, aggregated to the State level.
Table 12. Number of MLTS Calls Received.
State Response State Response CA 563,178 UT 18,846 FL 173,081 NM 10,047 NC 132,802 KS 7,262 CO 97,604 KY 1,926 MN 96,400 TX 0
Unknown: AK, AL, AR, AZ, CT, DC, GA, HI, IA, ID, IL, IN, MA, MD, ME, MI, MT, ND, NE, NH, NJ, OH, OK, OR, PA, PR, SC, SD, TN, VA, WA, WI Did Not Report Data: AS, DE, GU, LA, MP, MS, MO, NV, NY, RI, UM, VI, VT, WV, WY
2015 Finding Of all U.S. States and territories
• The total number of MLTS calls based on 10 reporting States was 1,101,146 • 32 of 42 reporting States chose “unknown” – data is unknown by State
Dataset Shift • 2014 Finding: The total number of MLTS calls based on 7 reporting States was 851,871 • 2014 Finding: 33 of 40 reporting States chose “unknown” • 2012 Finding: 17 of 27 reporting States chose not to respond
19
2015 National 911 Progress Report Data Element Responses
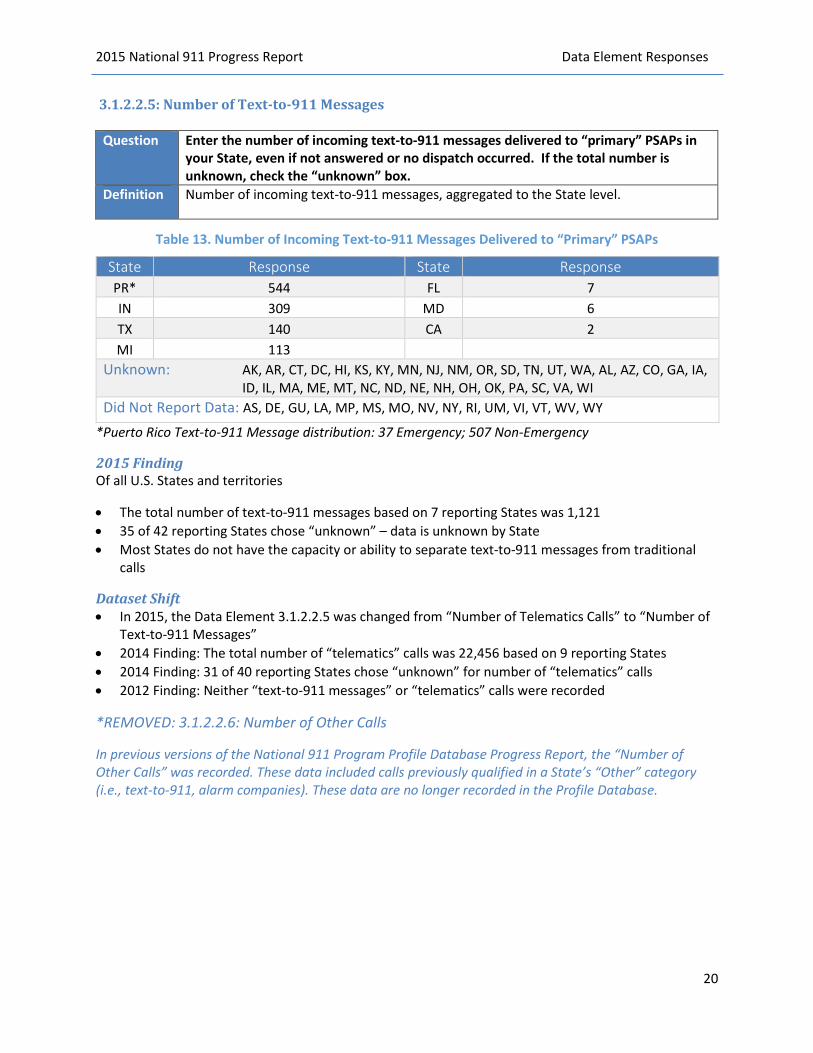
3.1.2.2.5: Number of Text-to-911 Messages
Question Enter the number of incoming text-to-911 messages delivered to “primary” PSAPs in your State, even if not answered or no dispatch occurred. If the total number is unknown, check the “unknown” box.
Definition Number of incoming text-to-911 messages, aggregated to the State level.
Table 13. Number of Incoming Text-to-911 Messages Delivered to “Primary” PSAPs
State Response State Response PR* 544 FL 7 IN 309 MD 6 TX 140 CA 2 MI 113
Unknown: AK, AR, CT, DC, HI, KS, KY, MN, NJ, NM, OR, SD, TN, UT, WA, AL, AZ, CO, GA, IA, ID, IL, MA, ME, MT, NC, ND, NE, NH, OH, OK, PA, SC, VA, WI Did Not Report Data: AS, DE, GU, LA, MP, MS, MO, NV, NY, RI, UM, VI, VT, WV, WY
*Puerto Rico Text-to-911 Message distribution: 37 Emergency; 507 Non-Emergency
2015 Finding Of all U.S. States and territories
• The total number of text-to-911 messages based on 7 reporting States was 1,121 • 35 of 42 reporting States chose “unknown” – data is unknown by State • Most States do not have the capacity or ability to separate text-to-911 messages from traditional
calls
Dataset Shift • In 2015, the Data Element 3.1.2.2.5 was changed from “Number of Telematics Calls” to “Number of
Text-to-911 Messages” • 2014 Finding: The total number of “telematics” calls was 22,456 based on 9 reporting States • 2014 Finding: 31 of 40 reporting States chose “unknown” for number of “telematics” calls • 2012 Finding: Neither “text-to-911 messages” or “telematics” calls were recorded
*REMOVED: 3.1.2.2.6: Number of Other Calls
In previous versions of the National 911 Program Profile Database Progress Report, the “Number of Other Calls” was recorded. These data included calls previously qualified in a State’s “Other” category (i.e., text-to-911, alarm companies). These data are no longer recorded in the Profile Database.
20
2015 National 911 Progress Report Data Element Responses
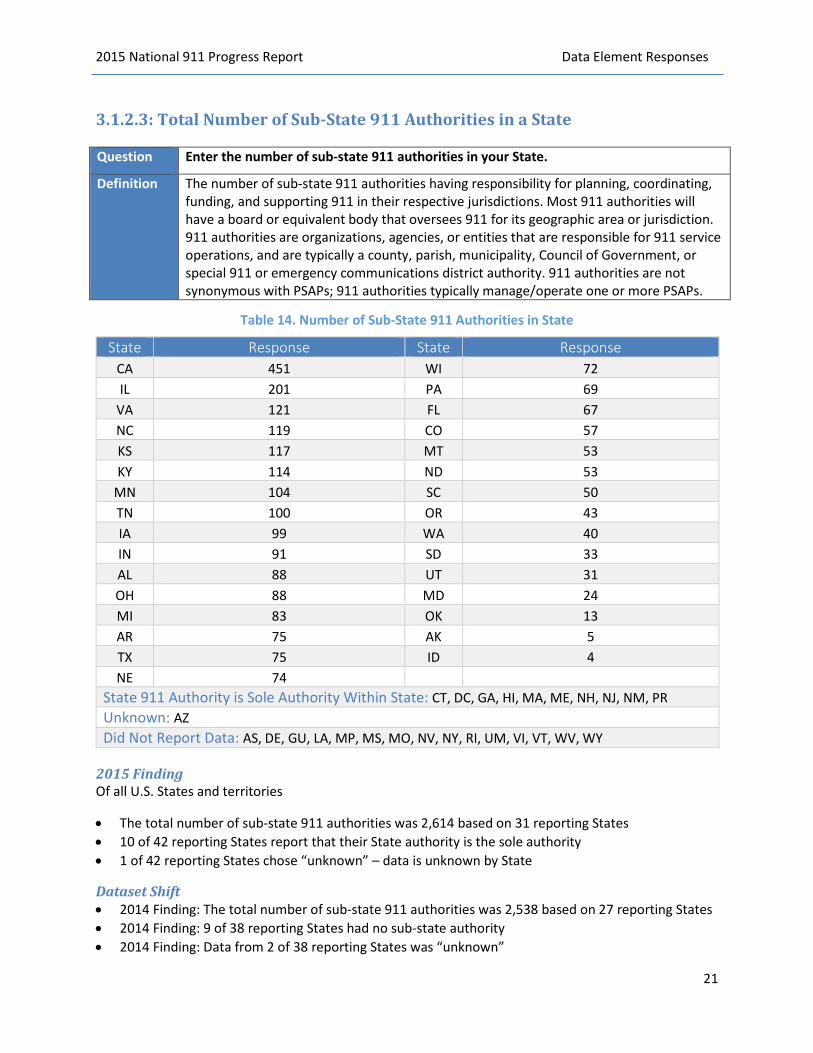
3.1.2.3: Total Number of Sub-State 911 Authorities in a State
Question Enter the number of sub-state 911 authorities in your State.
Definition The number of sub-state 911 authorities having responsibility for planning, coordinating, funding, and supporting 911 in their respective jurisdictions. Most 911 authorities will have a board or equivalent body that oversees 911 for its geographic area or jurisdiction. 911 authorities are organizations, agencies, or entities that are responsible for 911 service operations, and are typically a county, parish, municipality, Council of Government, or special 911 or emergency communications district authority. 911 authorities are not synonymous with PSAPs; 911 authorities typically manage/operate one or more PSAPs.
Table 14. Number of Sub-State 911 Authorities in State
State Response State Response CA 451 WI 72 IL 201 PA 69
VA 121 FL 67 NC 119 CO 57 KS 117 MT 53 KY 114 ND 53
MN 104 SC 50 TN 100 OR 43 IA 99 WA 40 IN 91 SD 33 AL 88 UT 31 OH 88 MD 24 MI 83 OK 13 AR 75 AK 5 TX 75 ID 4 NE 74
State 911 Authority is Sole Authority Within State: CT, DC, GA, HI, MA, ME, NH, NJ, NM, PR Unknown: AZ Did Not Report Data: AS, DE, GU, LA, MP, MS, MO, NV, NY, RI, UM, VI, VT, WV, WY
2015 Finding Of all U.S. States and territories
• The total number of sub-state 911 authorities was 2,614 based on 31 reporting States• 10 of 42 reporting States report that their State authority is the sole authority• 1 of 42 reporting States chose “unknown” – data is unknown by State
Dataset Shift • 2014 Finding: The total number of sub-state 911 authorities was 2,538 based on 27 reporting States• 2014 Finding: 9 of 38 reporting States had no sub-state authority• 2014 Finding: Data from 2 of 38 reporting States was “unknown”
21

2015 National 911 Progress Report Data Element Responses
3.1.2.4: Data Element Sub-Group: Level of Service (LOS) Provided/Available, and Organized by Sub-State 911 Authority
3.1.2.4.1: No 911 Authority – Calls to 911 are Remote Call Forwarded Only
Question Enter the number of counties in your State that have no 911 authority.
Definition The number of counties where there is no 911 service and where the telecommunications service providers, in compliance with the Federal Communications Commission’s (FCC) Fifth Report & Order, direct 911 calls to a PSAP in areas where one has been designated or, in areas where a PSAP has not been designated, to an existing statewide default answering point or another appropriate local emergency authority. The intent of this Order was to ensure that all 911 calls would get answered. These types of arrangements do not use dedicated 911 trunks. Carriers comply by using remote call forwarding. Remote call forwarding simply forwards a 911 call to a 10-digit telephone number, usually an existing emergency telephone number for the local or county law enforcement agency. This arrangement does not constitute 911 “service.”
Table 15. Counties with No 911 Authority
The only State with counties that do not have a 911 Authority is Illinois (IL). Illinois’ response to this data element is 13 counties. All Counties Have 911 Authority: AK, AL, AR, CA, CO, CT, DC, FL, HI, IA, ID, IN, KS, KY, MA, MD, ME,
MI, MN, MT, NC, ND, NE, NH, NJ, NM, OH, OK, OR, PA, PR, SC, SD, TN, TX, UT, VA, WA, WI
Unknown: AZ, GA Did Not Report Data: AS, DE, GU, LA, MP, MS, MO, NV, NY, RI, UM, VI, VT, WV, WY
2015 Finding Of all U.S. States and territories
• The total number of counties with no 911 authority is 13 based on 1 reporting State• 39 of 42 reporting States are completely covered by one or more 911 authority• Data from 2 of 42 reporting States is “unknown” – State did not respond to this data element
Dataset Shift • 2014 Finding: The total number of counties with no 911 authority was 10 based on 1 reporting State• 2014 Finding: 38 of 40 reporting States were completely covered by one or more 911 authorities• 2014 Finding: Data from 1 of 40 reporting States was “unknown”
22
2015 National 911 Progress Report Data Element Responses
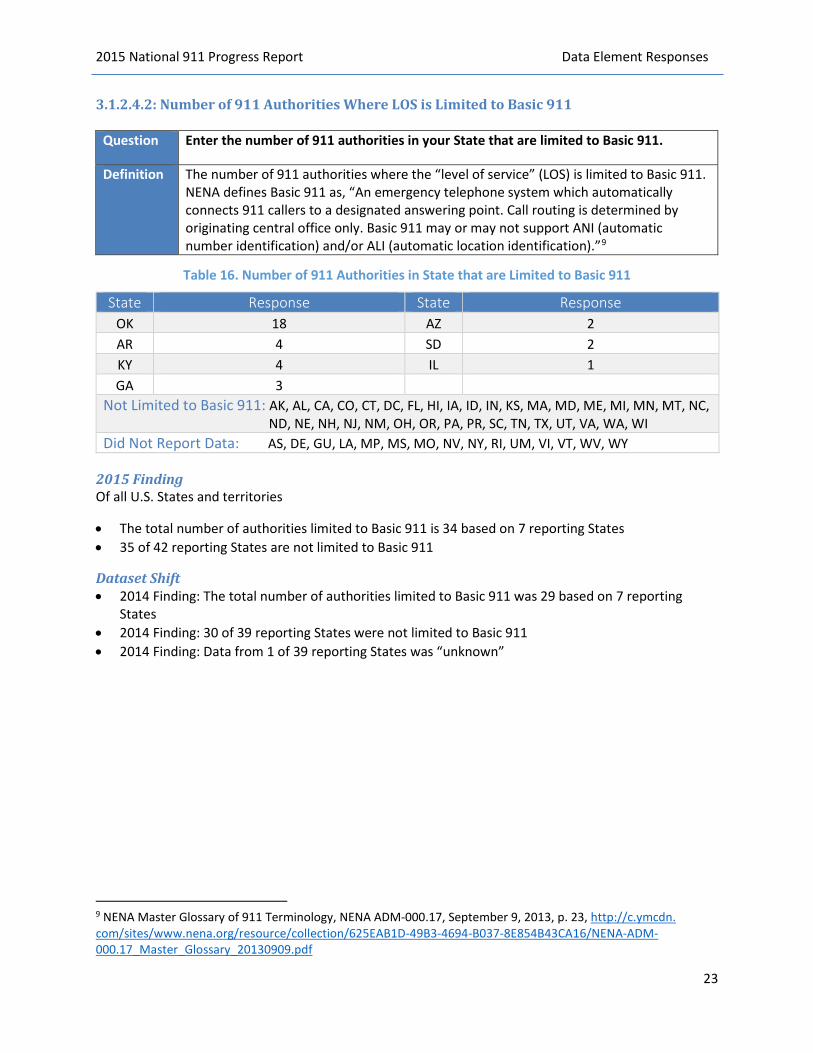
3.1.2.4.2: Number of 911 Authorities Where LOS is Limited to Basic 911
Question Enter the number of 911 authorities in your State that are limited to Basic 911.
Definition The number of 911 authorities where the “level of service” (LOS) is limited to Basic 911. NENA defines Basic 911 as, “An emergency telephone system which automatically connects 911 callers to a designated answering point. Call routing is determined by originating central office only. Basic 911 may or may not support ANI (automatic number identification) and/or ALI (automatic location identification).”9
Table 16. Number of 911 Authorities in State that are Limited to Basic 911
State Response State Response OK 18 AZ 2 AR 4 SD 2 KY 4 IL 1 GA 3
Not Limited to Basic 911: AK, AL, CA, CO, CT, DC, FL, HI, IA, ID, IN, KS, MA, MD, ME, MI, MN, MT, NC, ND, NE, NH, NJ, NM, OH, OR, PA, PR, SC, TN, TX, UT, VA, WA, WI
Did Not Report Data: AS, DE, GU, LA, MP, MS, MO, NV, NY, RI, UM, VI, VT, WV, WY
2015 Finding Of all U.S. States and territories
• The total number of authorities limited to Basic 911 is 34 based on 7 reporting States• 35 of 42 reporting States are not limited to Basic 911
Dataset Shift • 2014 Finding: The total number of authorities limited to Basic 911 was 29 based on 7 reporting
States• 2014 Finding: 30 of 39 reporting States were not limited to Basic 911• 2014 Finding: Data from 1 of 39 reporting States was “unknown”
9 NENA Master Glossary of 911 Terminology, NENA ADM-000.17, September 9, 2013, p. 23, http://c.ymcdn. com/sites/www.nena.org/resource/collection/625EAB1D-49B3-4694-B037-8E854B43CA16/NENA-ADM-000.17_Master_Glossary_20130909.pdf
23
2015 National 911 Progress Report Data Element Responses
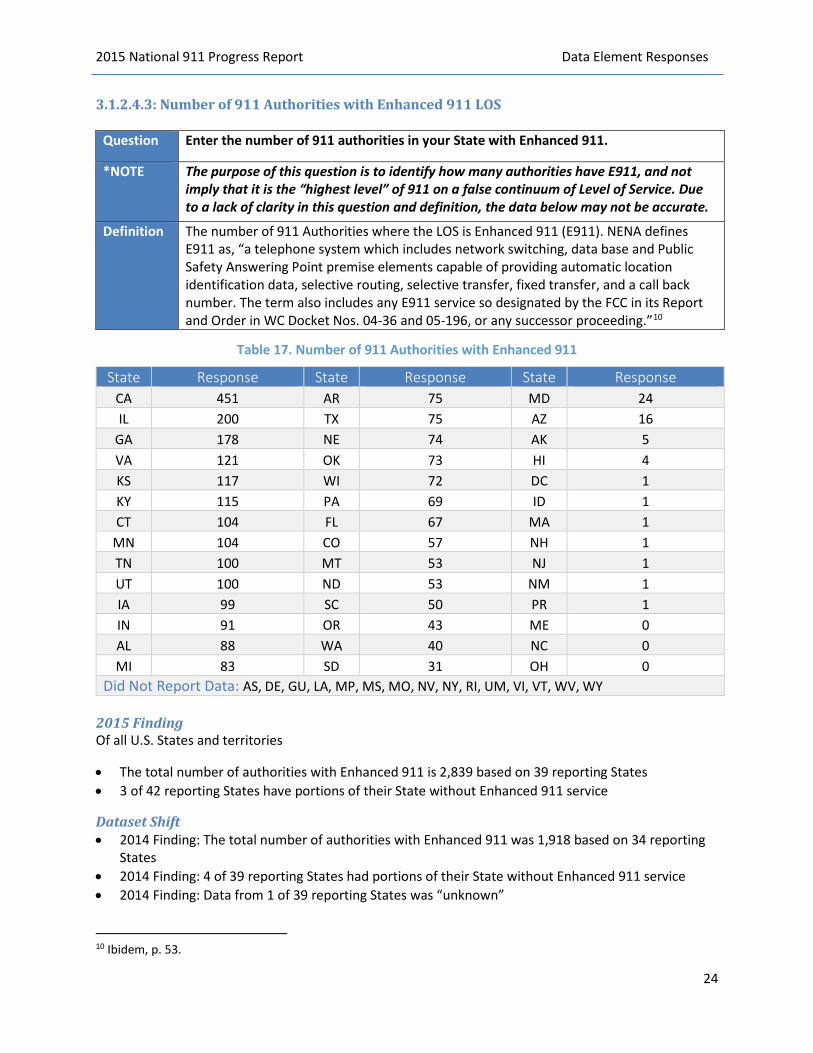
3.1.2.4.3: Number of 911 Authorities with Enhanced 911 LOS
Question Enter the number of 911 authorities in your State with Enhanced 911.
*NOTE The purpose of this question is to identify how many authorities have E911, and not imply that it is the “highest level” of 911 on a false continuum of Level of Service. Due to a lack of clarity in this question and definition, the data below may not be accurate.
Definition The number of 911 Authorities where the LOS is Enhanced 911 (E911). NENA defines E911 as, “a telephone system which includes network switching, data base and Public Safety Answering Point premise elements capable of providing automatic location identification data, selective routing, selective transfer, fixed transfer, and a call back number. The term also includes any E911 service so designated by the FCC in its Report and Order in WC Docket Nos. 04-36 and 05-196, or any successor proceeding.”10
Table 17. Number of 911 Authorities with Enhanced 911
State Response State Response State Response CA 451 AR 75 MD 24 IL 200 TX 75 AZ 16
GA 178 NE 74 AK 5 VA 121 OK 73 HI 4 KS 117 WI 72 DC 1 KY 115 PA 69 ID 1 CT 104 FL 67 MA 1
MN 104 CO 57 NH 1 TN 100 MT 53 NJ 1 UT 100 ND 53 NM 1 IA 99 SC 50 PR 1 IN 91 OR 43 ME 0 AL 88 WA 40 NC 0 MI 83 SD 31 OH 0
Did Not Report Data: AS, DE, GU, LA, MP, MS, MO, NV, NY, RI, UM, VI, VT, WV, WY
2015 Finding Of all U.S. States and territories
• The total number of authorities with Enhanced 911 is 2,839 based on 39 reporting States• 3 of 42 reporting States have portions of their State without Enhanced 911 service
Dataset Shift • 2014 Finding: The total number of authorities with Enhanced 911 was 1,918 based on 34 reporting
States• 2014 Finding: 4 of 39 reporting States had portions of their State without Enhanced 911 service• 2014 Finding: Data from 1 of 39 reporting States was “unknown”
10 Ibidem, p. 53.
24
2015 National 911 Progress Report Data Element Responses
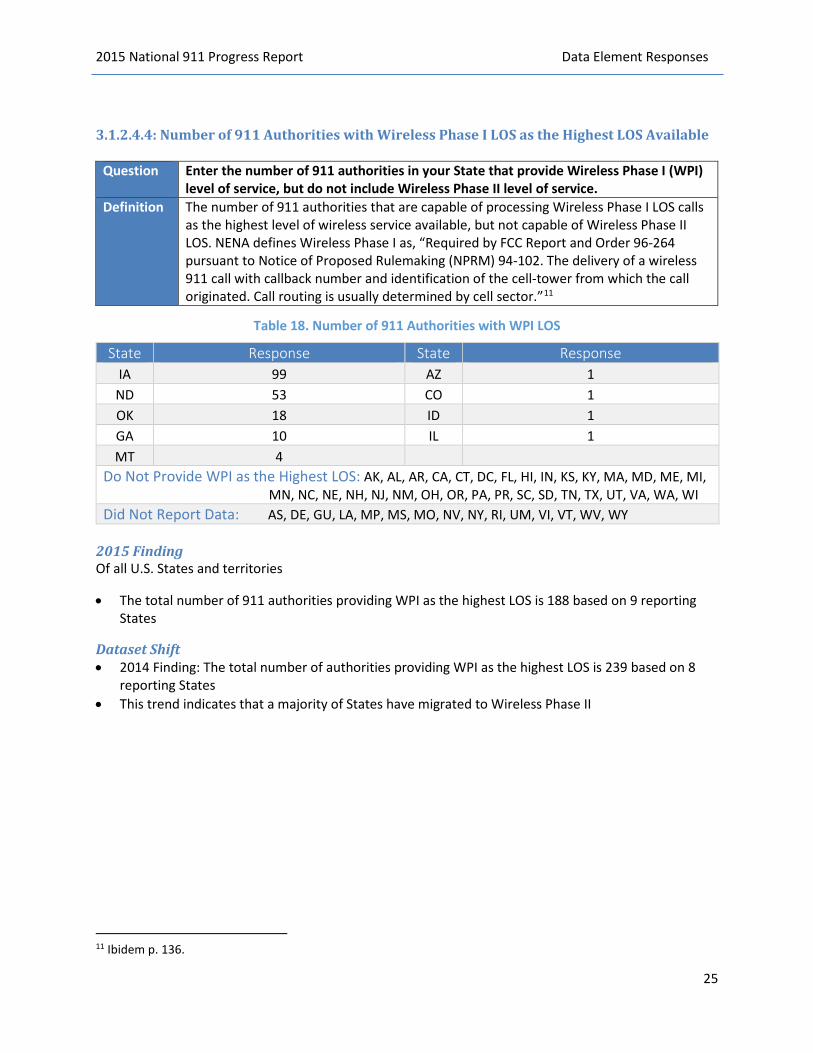
3.1.2.4.4: Number of 911 Authorities with Wireless Phase I LOS as the Highest LOS Available
Question Enter the number of 911 authorities in your State that provide Wireless Phase I (WPI) level of service, but do not include Wireless Phase II level of service.
Definition The number of 911 authorities that are capable of processing Wireless Phase I LOS calls as the highest level of wireless service available, but not capable of Wireless Phase II LOS. NENA defines Wireless Phase I as, “Required by FCC Report and Order 96-264 pursuant to Notice of Proposed Rulemaking (NPRM) 94-102. The delivery of a wireless 911 call with callback number and identification of the cell-tower from which the call originated. Call routing is usually determined by cell sector.”11
Table 18. Number of 911 Authorities with WPI LOS
State Response State Response IA 99 AZ 1 ND 53 CO 1 OK 18 ID 1 GA 10 IL 1 MT 4
Do Not Provide WPI as the Highest LOS: AK, AL, AR, CA, CT, DC, FL, HI, IN, KS, KY, MA, MD, ME, MI, MN, NC, NE, NH, NJ, NM, OH, OR, PA, PR, SC, SD, TN, TX, UT, VA, WA, WI Did Not Report Data: AS, DE, GU, LA, MP, MS, MO, NV, NY, RI, UM, VI, VT, WV, WY
2015 Finding Of all U.S. States and territories
• The total number of 911 authorities providing WPI as the highest LOS is 188 based on 9 reporting States
Dataset Shift • 2014 Finding: The total number of authorities providing WPI as the highest LOS is 239 based on 8
reporting States • This trend indicates that a majority of States have migrated to Wireless Phase II
11 Ibidem p. 136.
25
2015 National 911 Progress Report Data Element Responses
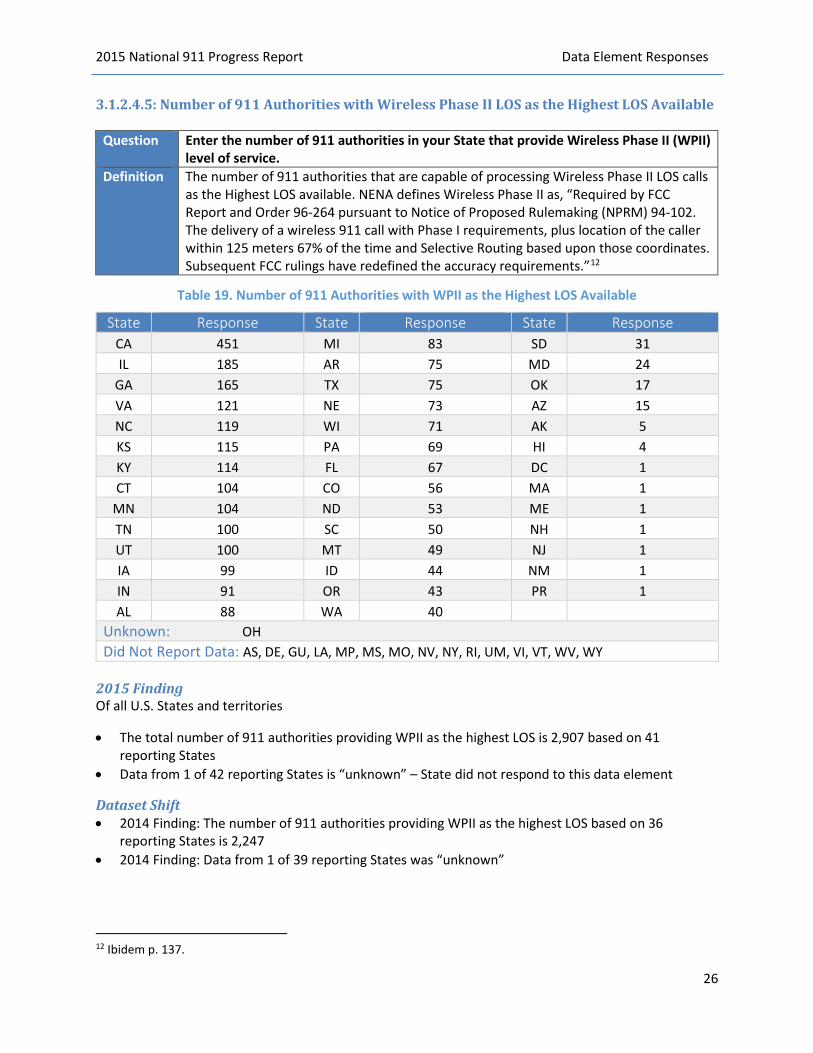
3.1.2.4.5: Number of 911 Authorities with Wireless Phase II LOS as the Highest LOS Available
Question Enter the number of 911 authorities in your State that provide Wireless Phase II (WPII) level of service.
Definition The number of 911 authorities that are capable of processing Wireless Phase II LOS calls as the Highest LOS available. NENA defines Wireless Phase II as, “Required by FCC Report and Order 96-264 pursuant to Notice of Proposed Rulemaking (NPRM) 94-102. The delivery of a wireless 911 call with Phase I requirements, plus location of the caller within 125 meters 67% of the time and Selective Routing based upon those coordinates. Subsequent FCC rulings have redefined the accuracy requirements.”12
Table 19. Number of 911 Authorities with WPII as the Highest LOS Available
State Response State Response State Response CA 451 MI 83 SD 31 IL 185 AR 75 MD 24
GA 165 TX 75 OK 17 VA 121 NE 73 AZ 15 NC 119 WI 71 AK 5 KS 115 PA 69 HI 4 KY 114 FL 67 DC 1 CT 104 CO 56 MA 1
MN 104 ND 53 ME 1 TN 100 SC 50 NH 1 UT 100 MT 49 NJ 1 IA 99 ID 44 NM 1 IN 91 OR 43 PR 1 AL 88 WA 40
Unknown: OH Did Not Report Data: AS, DE, GU, LA, MP, MS, MO, NV, NY, RI, UM, VI, VT, WV, WY
2015 Finding Of all U.S. States and territories
• The total number of 911 authorities providing WPII as the highest LOS is 2,907 based on 41reporting States
• Data from 1 of 42 reporting States is “unknown” – State did not respond to this data element
Dataset Shift • 2014 Finding: The number of 911 authorities providing WPII as the highest LOS based on 36
reporting States is 2,247• 2014 Finding: Data from 1 of 39 reporting States was “unknown”
12 Ibidem p. 137.
26
2015 National 911 Progress Report Data Element Responses
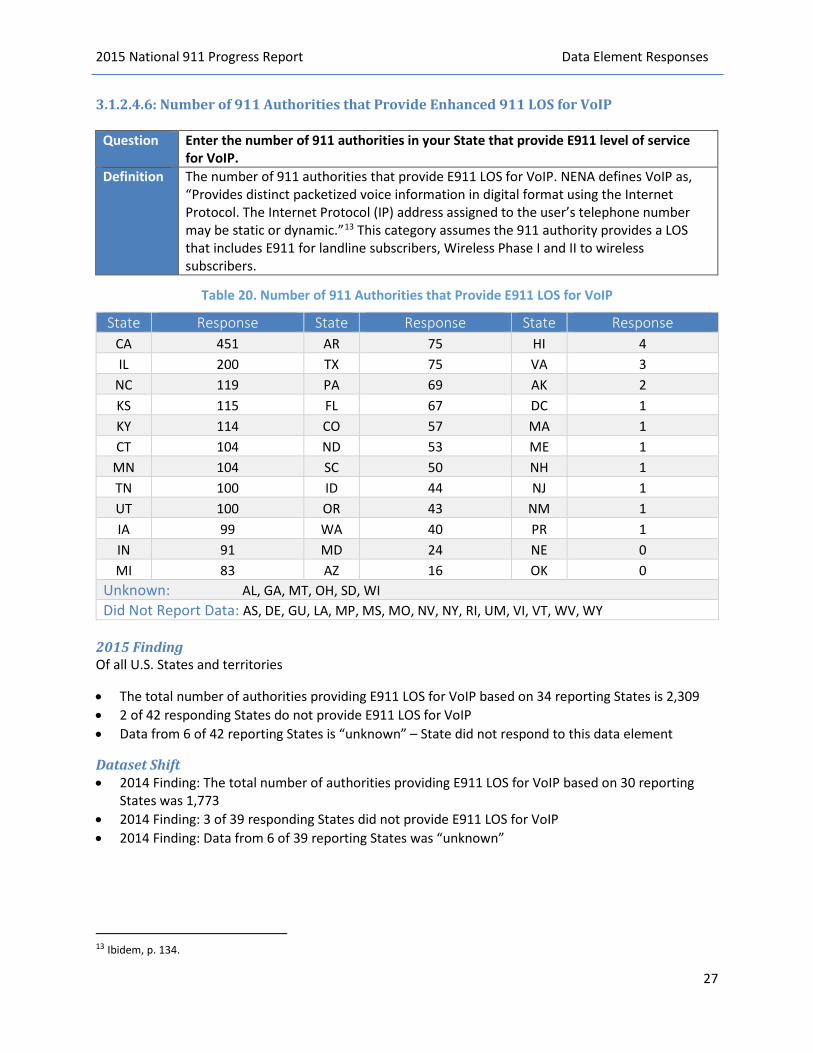
3.1.2.4.6: Number of 911 Authorities that Provide Enhanced 911 LOS for VoIP
Question Enter the number of 911 authorities in your State that provide E911 level of service for VoIP.
Definition The number of 911 authorities that provide E911 LOS for VoIP. NENA defines VoIP as, “Provides distinct packetized voice information in digital format using the Internet Protocol. The Internet Protocol (IP) address assigned to the user’s telephone number may be static or dynamic.”13 This category assumes the 911 authority provides a LOS that includes E911 for landline subscribers, Wireless Phase I and II to wireless subscribers.
Table 20. Number of 911 Authorities that Provide E911 LOS for VoIP
State Response State Response State Response CA 451 AR 75 HI 4 IL 200 TX 75 VA 3
NC 119 PA 69 AK 2 KS 115 FL 67 DC 1 KY 114 CO 57 MA 1 CT 104 ND 53 ME 1
MN 104 SC 50 NH 1 TN 100 ID 44 NJ 1 UT 100 OR 43 NM 1 IA 99 WA 40 PR 1 IN 91 MD 24 NE 0 MI 83 AZ 16 OK 0
Unknown: AL, GA, MT, OH, SD, WI Did Not Report Data: AS, DE, GU, LA, MP, MS, MO, NV, NY, RI, UM, VI, VT, WV, WY
2015 Finding Of all U.S. States and territories
• The total number of authorities providing E911 LOS for VoIP based on 34 reporting States is 2,309 • 2 of 42 responding States do not provide E911 LOS for VoIP • Data from 6 of 42 reporting States is “unknown” – State did not respond to this data element
Dataset Shift • 2014 Finding: The total number of authorities providing E911 LOS for VoIP based on 30 reporting
States was 1,773 • 2014 Finding: 3 of 39 responding States did not provide E911 LOS for VoIP • 2014 Finding: Data from 6 of 39 reporting States was “unknown”
13 Ibidem, p. 134.
27
2015 National 911 Progress Report Data Element Responses
3.1.2.5: Data Element Sub-Group: Percentage of Population and Land Area Served by Each Defined LOS
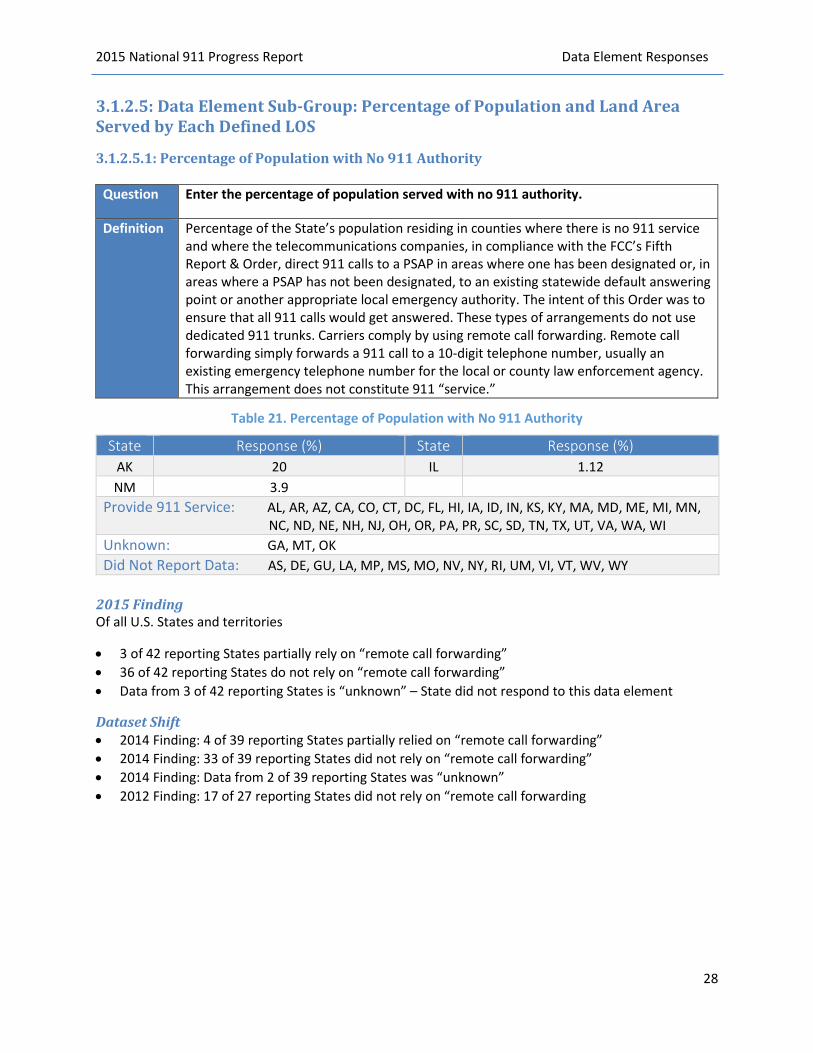
3.1.2.5.1: Percentage of Population with No 911 Authority
Question Enter the percentage of population served with no 911 authority.
Definition Percentage of the State’s population residing in counties where there is no 911 service and where the telecommunications companies, in compliance with the FCC’s Fifth Report & Order, direct 911 calls to a PSAP in areas where one has been designated or, in areas where a PSAP has not been designated, to an existing statewide default answering point or another appropriate local emergency authority. The intent of this Order was to ensure that all 911 calls would get answered. These types of arrangements do not use dedicated 911 trunks. Carriers comply by using remote call forwarding. Remote call forwarding simply forwards a 911 call to a 10-digit telephone number, usually an existing emergency telephone number for the local or county law enforcement agency. This arrangement does not constitute 911 “service.”
Table 21. Percentage of Population with No 911 Authority
State Response (%) State Response (%) AK 20 IL 1.12 NM 3.9
Provide 911 Service: AL, AR, AZ, CA, CO, CT, DC, FL, HI, IA, ID, IN, KS, KY, MA, MD, ME, MI, MN, NC, ND, NE, NH, NJ, OH, OR, PA, PR, SC, SD, TN, TX, UT, VA, WA, WI Unknown: GA, MT, OK Did Not Report Data: AS, DE, GU, LA, MP, MS, MO, NV, NY, RI, UM, VI, VT, WV, WY
2015 Finding Of all U.S. States and territories
• 3 of 42 reporting States partially rely on “remote call forwarding” • 36 of 42 reporting States do not rely on “remote call forwarding” • Data from 3 of 42 reporting States is “unknown” – State did not respond to this data element
Dataset Shift • 2014 Finding: 4 of 39 reporting States partially relied on “remote call forwarding” • 2014 Finding: 33 of 39 reporting States did not rely on “remote call forwarding” • 2014 Finding: Data from 2 of 39 reporting States was “unknown” • 2012 Finding: 17 of 27 reporting States did not rely on “remote call forwarding
28
2015 National 911 Progress Report Data Element Responses
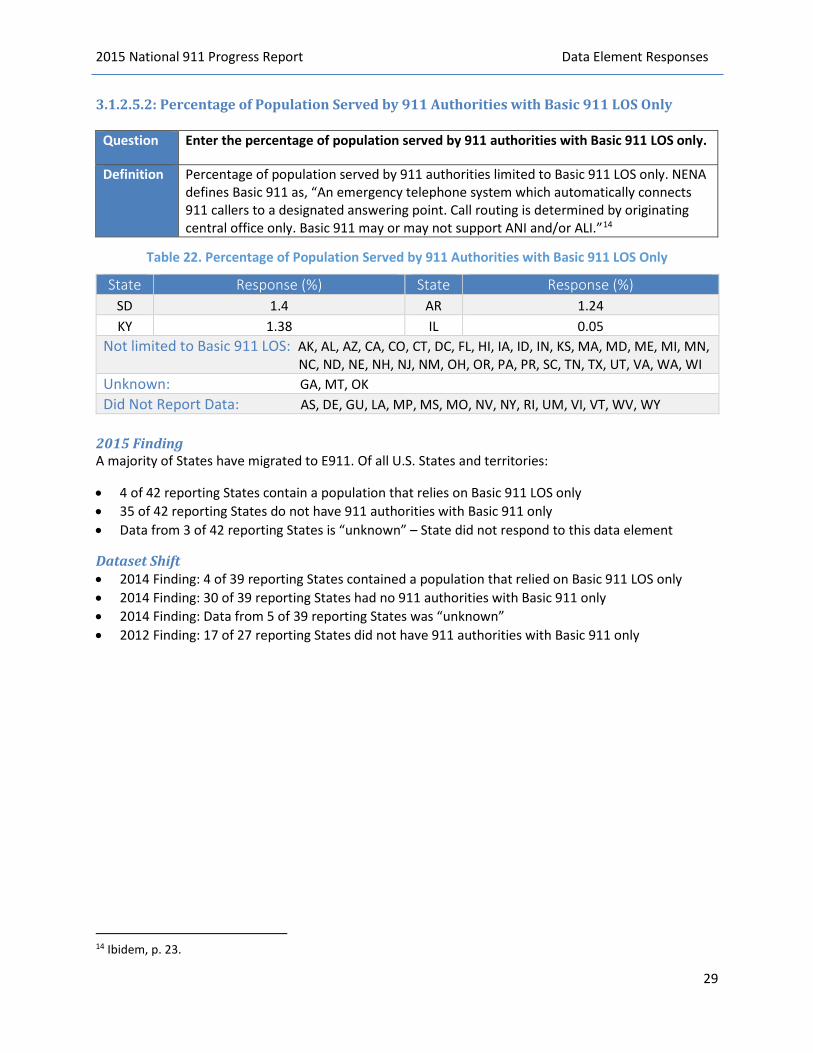
3.1.2.5.2: Percentage of Population Served by 911 Authorities with Basic 911 LOS Only
Question Enter the percentage of population served by 911 authorities with Basic 911 LOS only.
Definition Percentage of population served by 911 authorities limited to Basic 911 LOS only. NENA defines Basic 911 as, “An emergency telephone system which automatically connects 911 callers to a designated answering point. Call routing is determined by originating central office only. Basic 911 may or may not support ANI and/or ALI.”14
Table 22. Percentage of Population Served by 911 Authorities with Basic 911 LOS Only
State Response (%) State Response (%) SD 1.4 AR 1.24 KY 1.38 IL 0.05
Not limited to Basic 911 LOS: AK, AL, AZ, CA, CO, CT, DC, FL, HI, IA, ID, IN, KS, MA, MD, ME, MI, MN, NC, ND, NE, NH, NJ, NM, OH, OR, PA, PR, SC, TN, TX, UT, VA, WA, WI Unknown: GA, MT, OK Did Not Report Data: AS, DE, GU, LA, MP, MS, MO, NV, NY, RI, UM, VI, VT, WV, WY
2015 Finding A majority of States have migrated to E911. Of all U.S. States and territories:
• 4 of 42 reporting States contain a population that relies on Basic 911 LOS only • 35 of 42 reporting States do not have 911 authorities with Basic 911 only • Data from 3 of 42 reporting States is “unknown” – State did not respond to this data element
Dataset Shift • 2014 Finding: 4 of 39 reporting States contained a population that relied on Basic 911 LOS only • 2014 Finding: 30 of 39 reporting States had no 911 authorities with Basic 911 only • 2014 Finding: Data from 5 of 39 reporting States was “unknown” • 2012 Finding: 17 of 27 reporting States did not have 911 authorities with Basic 911 only
14 Ibidem, p. 23.
29

2015 National 911 Progress Report Data Element Responses
3.1.2.5.3: Percentage of Population Served by 911 Authorities that Provide Enhanced 911 LOS
Question Enter the percentage of population served by 911 authorities that provide Enhanced 911 LOS.
Definition Percentage of population served by 911 authorities that provide Enhanced 911 LOS. NENA defines E911 as, “A telephone system which includes network switching, data base and Public Safety Answering Point premise elements capable of providing automatic location identification data, selective routing, selective transfer, fixed transfer, and a call back number. The term also includes any E911 service so designated by the Federal Communications Commission in its Report and Order in WC Docket Nos. 04-36 and 05-196, or any successor proceeding.”15
Table 23. Percentage of Population Served by 911 Authorities that Provide Enhanced 911 LOS
State Response (%) State Response (%) IL 98.9 AZ 98.5
AR 98.76 NM 96.1 KY 98.62 AK 80 SD 98.6
100% Population Served: AL, CA, CO, CT, DC, FL, HI, IA, ID, IN, KS, MA, MD, ME, MI, MN, NC, ND, NE, NH, NJ, OH, OR, PA, PR, SC, TN, TX, UT, VA, WA, WI Unknown: GA, MT, OK Did Not Report Data: AS, DE, GU, LA, MP, MS, MO, NV, NY, RI, UM, VI, VT, WV, WY
2015 Finding Of all U.S. States and territories:
• 32 of 42 reporting States provide E911 LOS to 100% of its population • 7 of 42 reporting States provide E911 LOS to at least 80% of its population • Data from 3 of 42 reporting States is “unknown” – State did not respond to this data element
Dataset Shift • 2014 Finding: 28 of 39 reporting States provided E911 LOS to 100% of its population • 2014 Finding: 8 of 39 reporting States provided E911 LOS to at least 80% of its population • 2014 Finding: Data from 3 of 39 reporting States was “unknown”
15 Ibidem, p. 53.
30
2015 National 911 Progress Report Data Element Responses
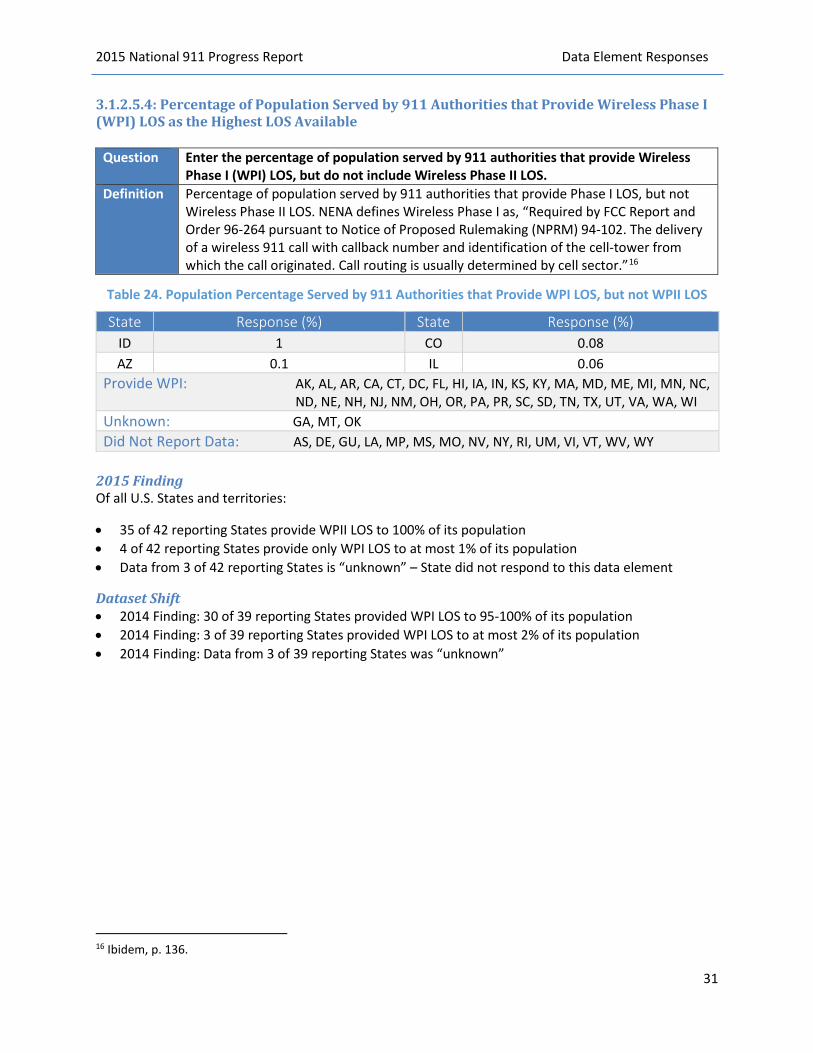
3.1.2.5.4: Percentage of Population Served by 911 Authorities that Provide Wireless Phase I (WPI) LOS as the Highest LOS Available
Question Enter the percentage of population served by 911 authorities that provide Wireless Phase I (WPI) LOS, but do not include Wireless Phase II LOS. Percentage of population served by 911 authorities that provide Phase I LOS, but not Wireless Phase II LOS. NENA defines Wireless Phase I as, “Required by FCC Report and Order 96-264 pursuant to Notice of Proposed Rulemaking (NPRM) 94-102. The delivery of a wireless 911 call with callback number and identification of the cell-tower from which the call originated. Call routing is usually determined by cell sector.”16
Table 24. Population Percentage Served by 911 Authorities that Provide WPI LOS, but not WPII LOS
State Response (%) State Response (%) ID 1 CO 0.08 AZ 0.1 IL 0.06
Provide WPI: AK, AL, AR, CA, CT, DC, FL, HI, IA, IN, KS, KY, MA, MD, ME, MI, MN, NC, ND, NE, NH, NJ, NM, OH, OR, PA, PR, SC, SD, TN, TX, UT, VA, WA, WI
Unknown: GA, MT, OK Did Not Report Data: AS, DE, GU, LA, MP, MS, MO, NV, NY, RI, UM, VI, VT, WV, WY
2015 Finding Of all U.S. States and territories:
• 35 of 42 reporting States provide WPII LOS to 100% of its population• 4 of 42 reporting States provide only WPI LOS to at most 1% of its population• Data from 3 of 42 reporting States is “unknown” – State did not respond to this data element
Dataset Shift • 2014 Finding: 30 of 39 reporting States provided WPI LOS to 95-100% of its population• 2014 Finding: 3 of 39 reporting States provided WPI LOS to at most 2% of its population• 2014 Finding: Data from 3 of 39 reporting States was “unknown”
16 Ibidem, p. 136.
31
Definition
2015 National 911 Progress Report Data Element Responses
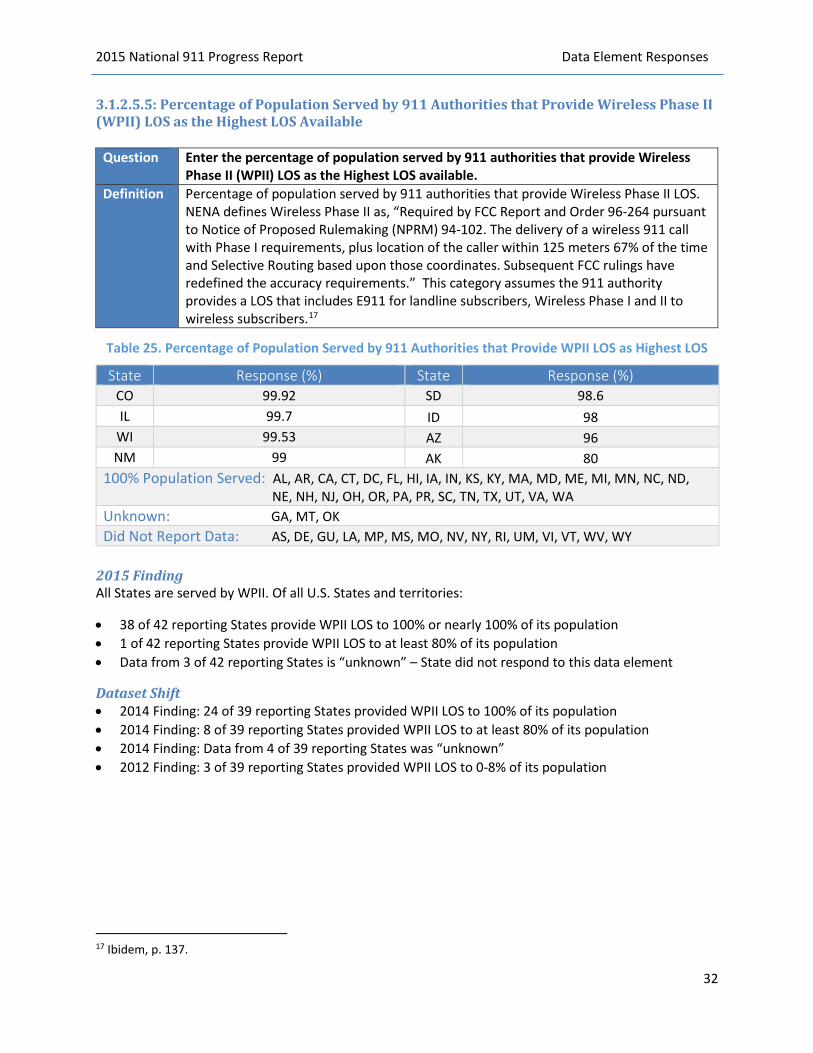
3.1.2.5.5: Percentage of Population Served by 911 Authorities that Provide Wireless Phase II (WPII) LOS as the Highest LOS Available
Question Enter the percentage of population served by 911 authorities that provide Wireless Phase II (WPII) LOS as the Highest LOS available.
Definition Percentage of population served by 911 authorities that provide Wireless Phase II LOS. NENA defines Wireless Phase II as, “Required by FCC Report and Order 96-264 pursuant to Notice of Proposed Rulemaking (NPRM) 94-102. The delivery of a wireless 911 call with Phase I requirements, plus location of the caller within 125 meters 67% of the time and Selective Routing based upon those coordinates. Subsequent FCC rulings have redefined the accuracy requirements.” This category assumes the 911 authority provides a LOS that includes E911 for landline subscribers, Wireless Phase I and II to wireless subscribers.17
Table 25. Percentage of Population Served by 911 Authorities that Provide WPII LOS as Highest LOS
State Response (%) State Response (%) CO 99.92 SD 98.6 IL 99.7 ID 98
WI 99.53 AZ 96 NM 99 AK 80
100% Population Served: AL, AR, CA, CT, DC, FL, HI, IA, IN, KS, KY, MA, MD, ME, MI, MN, NC, ND, NE, NH, NJ, OH, OR, PA, PR, SC, TN, TX, UT, VA, WA Unknown: GA, MT, OK Did Not Report Data: AS, DE, GU, LA, MP, MS, MO, NV, NY, RI, UM, VI, VT, WV, WY
2015 Finding All States are served by WPII. Of all U.S. States and territories:
• 38 of 42 reporting States provide WPII LOS to 100% or nearly 100% of its population • 1 of 42 reporting States provide WPII LOS to at least 80% of its population • Data from 3 of 42 reporting States is “unknown” – State did not respond to this data element
Dataset Shift • 2014 Finding: 24 of 39 reporting States provided WPII LOS to 100% of its population • 2014 Finding: 8 of 39 reporting States provided WPII LOS to at least 80% of its population • 2014 Finding: Data from 4 of 39 reporting States was “unknown” • 2012 Finding: 3 of 39 reporting States provided WPII LOS to 0-8% of its population
17 Ibidem, p. 137.
32
2015 National 911 Progress Report Data Element Responses
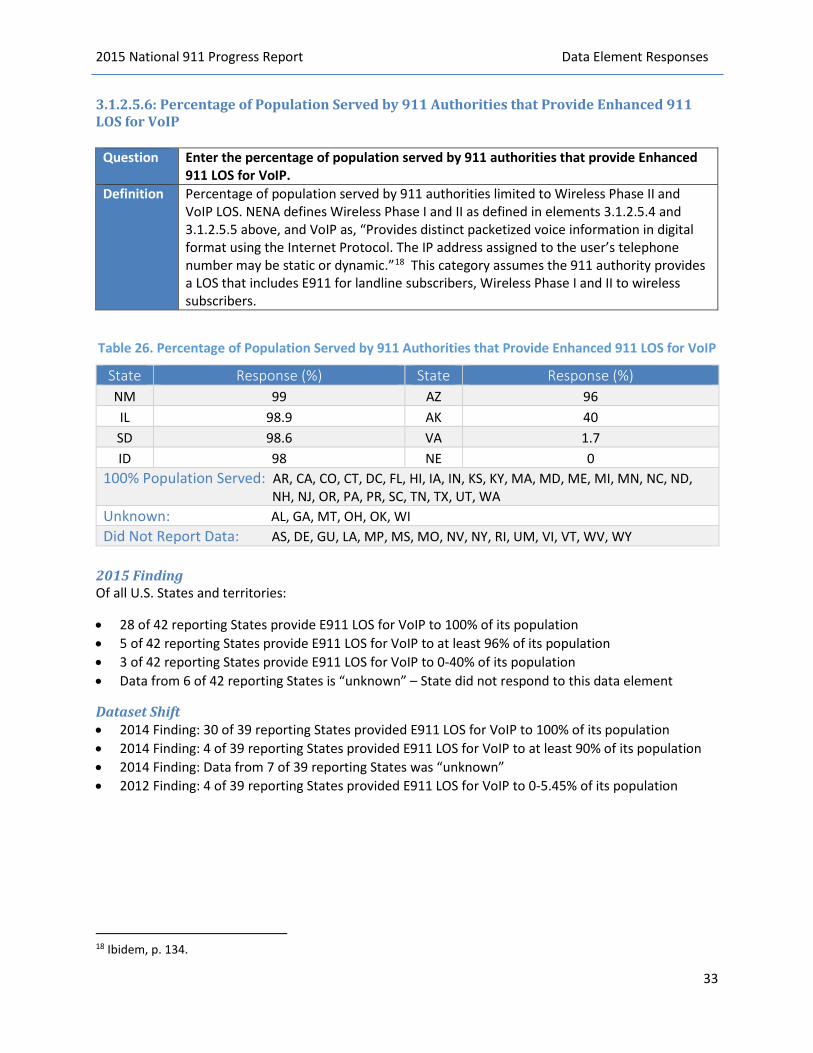
3.1.2.5.6: Percentage of Population Served by 911 Authorities that Provide Enhanced 911 LOS for VoIP
Question Enter the percentage of population served by 911 authorities that provide Enhanced 911 LOS for VoIP.
Definition Percentage of population served by 911 authorities limited to Wireless Phase II and VoIP LOS. NENA defines Wireless Phase I and II as defined in elements 3.1.2.5.4 and 3.1.2.5.5 above, and VoIP as, “Provides distinct packetized voice information in digital format using the Internet Protocol. The IP address assigned to the user’s telephone number may be static or dynamic.”18 This category assumes the 911 authority provides a LOS that includes E911 for landline subscribers, Wireless Phase I and II to wireless subscribers.
Table 26. Percentage of Population Served by 911 Authorities that Provide Enhanced 911 LOS for VoIP
State Response (%) State Response (%) NM 99 AZ 96 IL 98.9 AK 40 SD 98.6 VA 1.7 ID 98 NE 0
100% Population Served: AR, CA, CO, CT, DC, FL, HI, IA, IN, KS, KY, MA, MD, ME, MI, MN, NC, ND, NH, NJ, OR, PA, PR, SC, TN, TX, UT, WA Unknown: AL, GA, MT, OH, OK, WI Did Not Report Data: AS, DE, GU, LA, MP, MS, MO, NV, NY, RI, UM, VI, VT, WV, WY
2015 Finding Of all U.S. States and territories:
• 28 of 42 reporting States provide E911 LOS for VoIP to 100% of its population • 5 of 42 reporting States provide E911 LOS for VoIP to at least 96% of its population • 3 of 42 reporting States provide E911 LOS for VoIP to 0-40% of its population • Data from 6 of 42 reporting States is “unknown” – State did not respond to this data element
Dataset Shift • 2014 Finding: 30 of 39 reporting States provided E911 LOS for VoIP to 100% of its population • 2014 Finding: 4 of 39 reporting States provided E911 LOS for VoIP to at least 90% of its population • 2014 Finding: Data from 7 of 39 reporting States was “unknown” • 2012 Finding: 4 of 39 reporting States provided E911 LOS for VoIP to 0-5.45% of its population
18 Ibidem, p. 134.
33
2015 National 911 Progress Report Data Element Responses
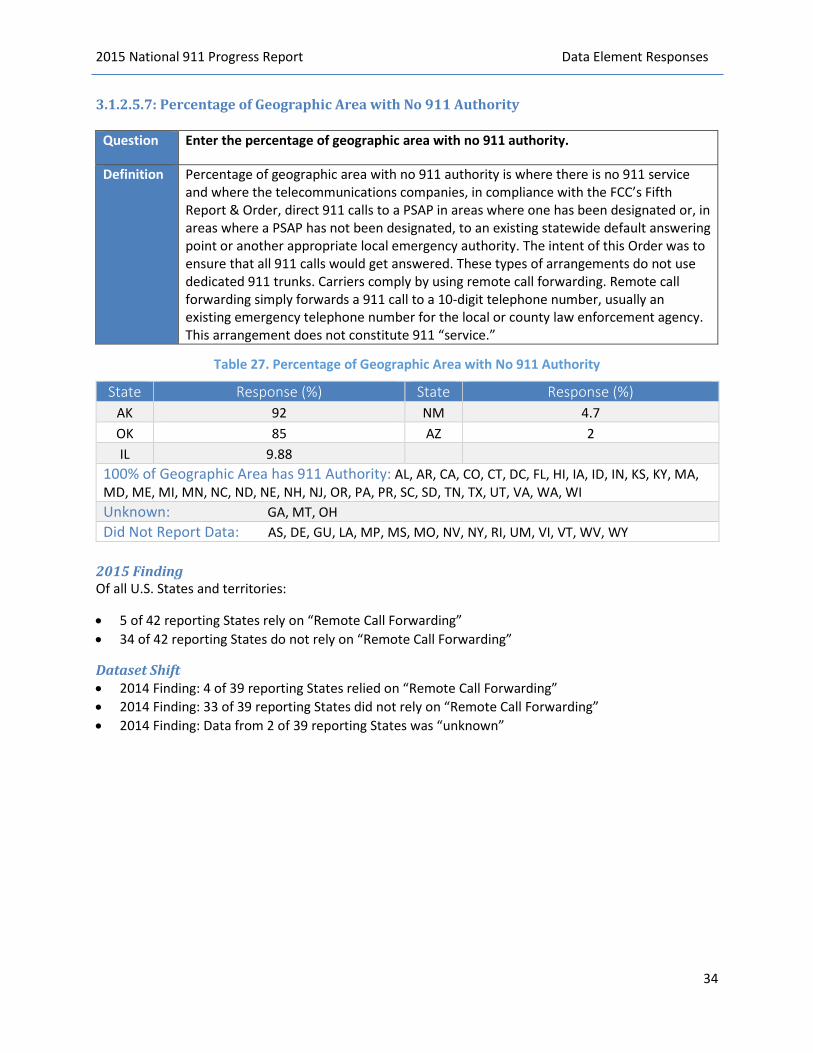
3.1.2.5.7: Percentage of Geographic Area with No 911 Authority
Question Enter the percentage of geographic area with no 911 authority.
Definition Percentage of geographic area with no 911 authority is where there is no 911 service and where the telecommunications companies, in compliance with the FCC’s Fifth Report & Order, direct 911 calls to a PSAP in areas where one has been designated or, in areas where a PSAP has not been designated, to an existing statewide default answering point or another appropriate local emergency authority. The intent of this Order was to ensure that all 911 calls would get answered. These types of arrangements do not use dedicated 911 trunks. Carriers comply by using remote call forwarding. Remote call forwarding simply forwards a 911 call to a 10-digit telephone number, usually an existing emergency telephone number for the local or county law enforcement agency. This arrangement does not constitute 911 “service.”
Table 27. Percentage of Geographic Area with No 911 Authority
State Response (%) State Response (%) AK 92 NM 4.7 OK 85 AZ 2 IL 9.88
100% of Geographic Area has 911 Authority: AL, AR, CA, CO, CT, DC, FL, HI, IA, ID, IN, KS, KY, MA, MD, ME, MI, MN, NC, ND, NE, NH, NJ, OR, PA, PR, SC, SD, TN, TX, UT, VA, WA, WI Unknown: GA, MT, OH Did Not Report Data: AS, DE, GU, LA, MP, MS, MO, NV, NY, RI, UM, VI, VT, WV, WY
2015 Finding Of all U.S. States and territories:
• 5 of 42 reporting States rely on “Remote Call Forwarding” • 34 of 42 reporting States do not rely on “Remote Call Forwarding”
Dataset Shift • 2014 Finding: 4 of 39 reporting States relied on “Remote Call Forwarding” • 2014 Finding: 33 of 39 reporting States did not rely on “Remote Call Forwarding” • 2014 Finding: Data from 2 of 39 reporting States was “unknown”
34

2015 National 911 Progress Report Data Element Responses
3.1.2.5.8: Percentage of Geographic Area Served by 911 Authorities with Basic 911 LOS Only
Question Enter the percentage of geographic area served by 911 authorities with Basic 911 LOS only.
Definition Percentage of geographic area served by 911 authorities limited to Basic 911 LOS only. NENA defines Basic 911 as, “An emergency telephone system which automatically connects 911 callers to a designated answering point. Call routing is determined by originating central office only. Basic 911 may or may not support ANI and/or ALI.”19
Table 28. Percentage of Geographic Area Served by 911 Authorities with Basic LOS Only
State
NM 4.7 IL 0.05
Not limited to Basic 911 LOS: AK, AL, AZ, CA, CO, CT, DC, FL, HI, IA, ID, IN, KS, MA, MD, ME, MI, MN, NC, ND, NE, NH, NJ, OR, PA, PR, SC, TN, TX, UT, VA, WA, WI
Did Not Report Data: AS, DE, GU, LA, MP, MS, MO, NV, NY, RI, UM, VI, VT, WV, WY
2015 Finding A majority of States have migrated to E911. Of all U.S. States and territories:
• 5 of 42 reporting States contain a geographic area that relies on Basic 911 LOS only• 33 of 42 reporting States do not rely on Basic 911 LOS only• Data from 4 of 42 reporting States in “unknown” – State did not respond to this data element
Dataset Shift • 2014 Finding: 5 of 39 reporting States contained a geographic area that relied on Basic 911 LOS only• 2014 Finding: 32 of 39 reporting States did not rely on Basic 911 LOS only• 2014 Finding: Data from 2 of 39 reporting States was “unknown”
19 Ibidem, p 23.
35
Resonse (%) State Response (%) 10
3.47 KY
OK SD 2.4
Unknown: AR, GA, MT, OH
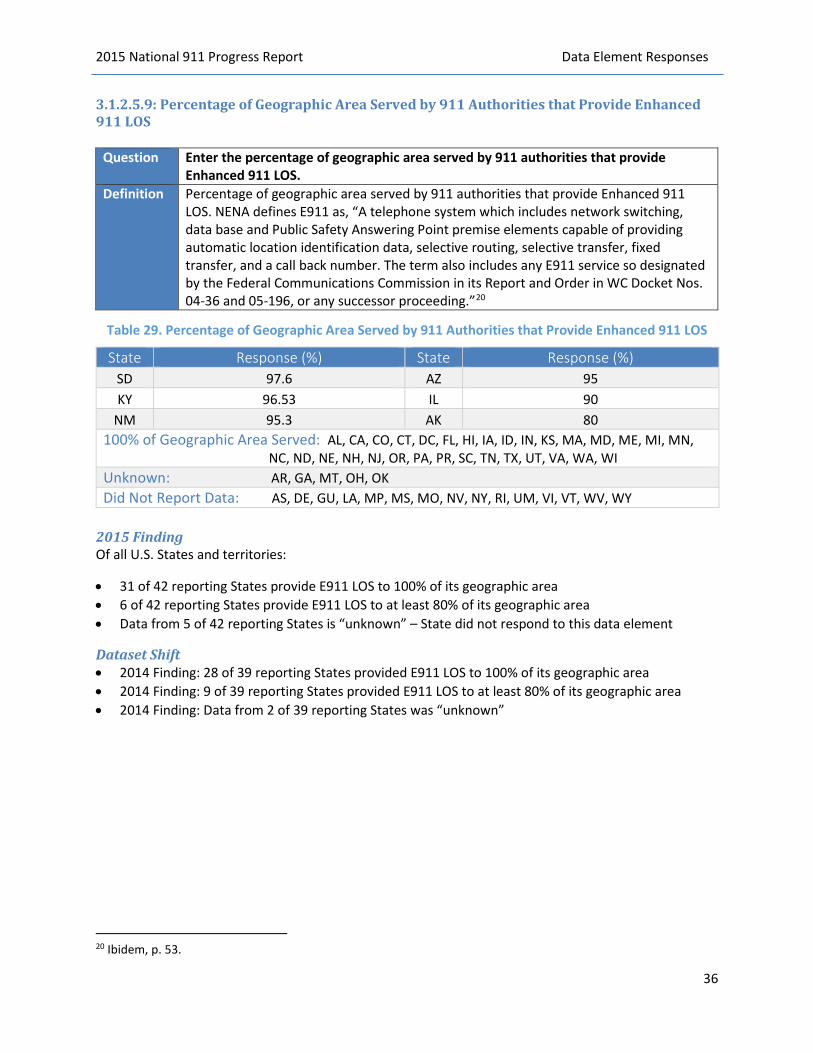
2015 National 911 Progress Report Data Element Responses
3.1.2.5.9: Percentage of Geographic Area Served by 911 Authorities that Provide Enhanced 911 LOS
Question Enter the percentage of geographic area served by 911 authorities that provide Enhanced 911 LOS.
Definition Percentage of geographic area served by 911 authorities that provide Enhanced 911 LOS. NENA defines E911 as, “A telephone system which includes network switching, data base and Public Safety Answering Point premise elements capable of providing automatic location identification data, selective routing, selective transfer, fixed transfer, and a call back number. The term also includes any E911 service so designated by the Federal Communications Commission in its Report and Order in WC Docket Nos. 04-36 and 05-196, or any successor proceeding.”20
Table 29. Percentage of Geographic Area Served by 911 Authorities that Provide Enhanced 911 LOS
State Response (%) State Response (%) SD 97.6 AZ 95 KY 96.53 IL 90
NM 95.3 AK 80 100% of Geographic Area Served: AL, CA, CO, CT, DC, FL, HI, IA, ID, IN, KS, MA, MD, ME, MI, MN, NC, ND, NE, NH, NJ, OR, PA, PR, SC, TN, TX, UT, VA, WA, WI Unknown: AR, GA, MT, OH, OK Did Not Report Data: AS, DE, GU, LA, MP, MS, MO, NV, NY, RI, UM, VI, VT, WV, WY
2015 Finding Of all U.S. States and territories:
• 31 of 42 reporting States provide E911 LOS to 100% of its geographic area • 6 of 42 reporting States provide E911 LOS to at least 80% of its geographic area • Data from 5 of 42 reporting States is “unknown” – State did not respond to this data element
Dataset Shift • 2014 Finding: 28 of 39 reporting States provided E911 LOS to 100% of its geographic area • 2014 Finding: 9 of 39 reporting States provided E911 LOS to at least 80% of its geographic area • 2014 Finding: Data from 2 of 39 reporting States was “unknown”
20 Ibidem, p. 53.
36

2015 National 911 Progress Report Data Element Responses
3.1.2.5.10: Percentage of Geographic Area Served by 911 Authorities that Provide Wireless Phase I (WPI) LOS as the Highest LOS Available
Question Enter the percentage of geographic area served by 911 authorities that provide Wireless Phase I (WPI) LOS, but do not include Wireless Phase II LOS.
Definition Percentage of geographic area served by 911 authorities that provide Wireless Phase I LOS, but not Wireless Phase II LOS. NENA defines Wireless Phase I as, “Required by FCC Report and Order 96-264 pursuant to Notice of Proposed Rulemaking (NPRM) 94-102. The delivery of a wireless 911 call with callback number and identification of the cell-tower from which the call originated. Call routing is usually determined by cell sector.”21
Table 30. Percentage of Geographic Area Served by 911 Authorities that Provide WPI LOS, but not WPII
State Response (%) State Response (%) ID 2 AZ 0.01 CO 0.66 IL 0.01
Provide WPI to 100% of Geographic Area: AK, AL, AR, CA, CT, DC, FL, HI, IA, IN, KS, KY, MA, MD, ME, MI, MN, NC, ND, NE, NH, NJ, NM, OH, OR, PA, PR, SC, SD, TN, TX, UT, VA, WA, WI Unknown: GA, MT, OK Did Not Report Data: AS, DE, GU, LA, MP, MS, MO, NV, NY, RI, UM, VI, VT, WV, WY
2015 Finding Of all U.S. States and territories:
• 35 of 42 reporting States provide WPI LOS to 100% of its geographic area • 3 of 42 reporting States only provide WPI LOS to at most 2% of its geographic area • Data from 4 of 42 reporting States is “unknown” – State did not respond to this data element
Dataset Shift • 2014 Finding: 33 of 39 reporting States provided WPI LOS to 100% of its geographic area • 2014 Finding: 4 of 39 reporting States only provided WPI LOS to at most 2% of its geographic area • 2014 Finding: Data from 2 of 39 reporting States was “unknown”
21 Ibidem p. 136
37
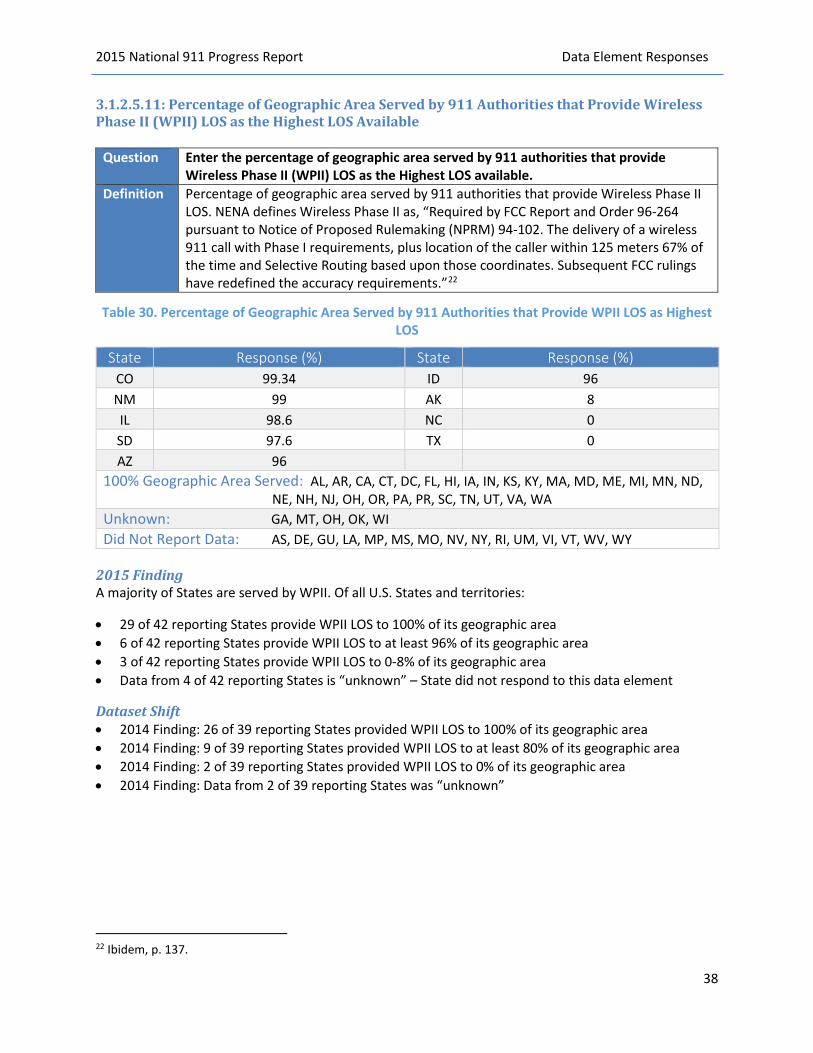
2015 National 911 Progress Report Data Element Responses
3.1.2.5.11: Percentage of Geographic Area Served by 911 Authorities that Provide Wireless Phase II (WPII) LOS as the Highest LOS Available
Question Enter the percentage of geographic area served by 911 authorities that provide Wireless Phase II (WPII) LOS as the Highest LOS available.
Definition Percentage of geographic area served by 911 authorities that provide Wireless Phase II LOS. NENA defines Wireless Phase II as, “Required by FCC Report and Order 96-264 pursuant to Notice of Proposed Rulemaking (NPRM) 94-102. The delivery of a wireless 911 call with Phase I requirements, plus location of the caller within 125 meters 67% of the time and Selective Routing based upon those coordinates. Subsequent FCC rulings have redefined the accuracy requirements.”22
Table 30. Percentage of Geographic Area Served by 911 Authorities that Provide WPII LOS as Highest LOS
State Response (%) State Response (%) CO 99.34 ID 96 NM 99 AK 8 IL 98.6 NC 0 SD 97.6 TX 0 AZ 96
100% Geographic Area Served: AL, AR, CA, CT, DC, FL, HI, IA, IN, KS, KY, MA, MD, ME, MI, MN, ND, NE, NH, NJ, OH, OR, PA, PR, SC, TN, UT, VA, WA
Unknown: GA, MT, OH, OK, WI Did Not Report Data: AS, DE, GU, LA, MP, MS, MO, NV, NY, RI, UM, VI, VT, WV, WY
2015 Finding A majority of States are served by WPII. Of all U.S. States and territories:
• 29 of 42 reporting States provide WPII LOS to 100% of its geographic area• 6 of 42 reporting States provide WPII LOS to at least 96% of its geographic area• 3 of 42 reporting States provide WPII LOS to 0-8% of its geographic area• Data from 4 of 42 reporting States is “unknown” – State did not respond to this data element
Dataset Shift • 2014 Finding: 26 of 39 reporting States provided WPII LOS to 100% of its geographic area• 2014 Finding: 9 of 39 reporting States provided WPII LOS to at least 80% of its geographic area• 2014 Finding: 2 of 39 reporting States provided WPII LOS to 0% of its geographic area• 2014 Finding: Data from 2 of 39 reporting States was “unknown”
22 Ibidem, p. 137.
38

2015 National 911 Progress Report Data Element Responses
3.1.2.5.12: Percentage of Geographic Area Served by 911 Authorities that Provide Enhanced 911 LOS for VoIP
Question Enter the percentage of geographic area served by 911 Authorities that provide Enhanced 911 LOS for VoIP.
Definition Percentage of geographic area served by 911 Authorities that provide E911 LOS to VoIP users. NENA defines VoIP as, “Provides distinct packetized voice information in digital format using the Internet Protocol. The IP address assigned to the user’s telephone number may be static or dynamic.” This category assumes the 911 authority provides a LOS that includes E911 for landline subscribers, Wireless Phase I and II to wireless subscribers.23
Table 31. Percentage of Geographic Area Served by 911 Authorities that Provide E911 LOS for VoIP
State Response (%) State Response (%) SD 97.6 IL 90 AZ 96 VA 5.45 ID 96 AK 0
NM 95.3 NE 0 100% Geographic Area Served: AR, CA, CO, CT, DC, FL, HI, IA, IN, KS, KY, MA, MD, ME, MI, MN, NC, ND, NH, NJ, OR, PA, PR, SC, TN, TX, UT, WA Unknown: AL, GA, MT, OH, OK, WI Did Not Report Data: AS, DE, GU, LA, MP, MS, MO, NV, NY, RI, UM, VI, VT, WV, WY
2015 Finding Of all U.S. States and territories:
• 28 of 42 reporting States provide E911 LOS for VoIP to 100% of its geographic area • 5 of 42 reporting States provide E911 LOS for VoIP to at least 90% of its geographic area • 3 of 42 reporting States provide E911 LOS for VoIP to 0-5.45% of its geographic area • Data from 6 of 42 reporting States is “unknown” – State did not respond to this data element
Dataset Shift • 2014 Finding: 24 of 39 reporting States provided E911 LOS for VoIP to 100% of its geographic area • 2014 Finding: 4 of 39 reporting States provided E911 LOS for VoIP to at least 95% of its geographic
area • 2014 Finding: Data from 7 of 39 reporting States was “unknown” • 2012 Finding: 4 of 39 reporting States provided E911 LOS for VoIP to 0-41% of its geographic area
23 Ibidem, p. 134.
39
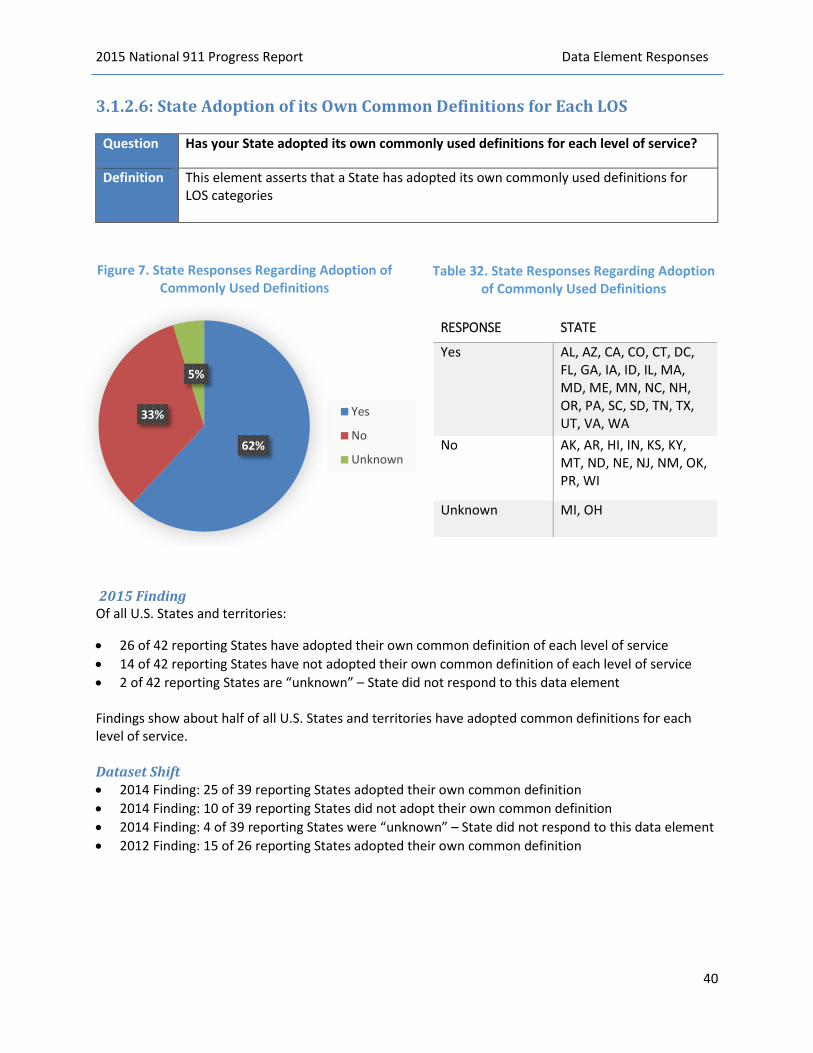
2015 National 911 Progress Report Data Element Responses
3.1.2.6: State Adoption of its Own Common Definitions for Each LOS
Question Has your State adopted its own commonly used definitions for each level of service?
Definition This element asserts that a State has adopted its own commonly used definitions for LOS categories
62%
33%
5%
Yes
No
Unknown
Table 32. State Responses Regarding Adoption of Commonly Used Definitions
RESPONSE STATE
No
2015 Finding Of all U.S. States and territories:
• 26 of 42 reporting States have adopted their own common definition of each level of service• 14 of 42 reporting States have not adopted their own common definition of each level of service• 2 of 42 reporting States are “unknown” – State did not respond to this data element
Findings show about half of all U.S. States and territories have adopted common definitions for each level of service.
Dataset Shift • 2014 Finding: 25 of 39 reporting States adopted their own common definition• 2014 Finding: 10 of 39 reporting States did not adopt their own common definition• 2014 Finding: 4 of 39 reporting States were “unknown” – State did not respond to this data element• 2012 Finding: 15 of 26 reporting States adopted their own common definition
Figure 7. State Responses Regarding Adoption of Commonly Used Definitions
40
Yes AL, AZ, CA, CO, CT, DC, FL, GA, IA, ID, IL, MA, MD, ME, MN, NC, NH, OR, PA, SC, SD, TN, TX, UT, VA, WA AK, AR, HI, IN, KS, KY, MT, ND, NE, NJ, NM, OK, PR, WI
MI, OH Unknown

2015 National 911 Progress Report Data Element Responses
3.1.2.7: Nationally Standardized Service Level Definitions
Question Has your State utilized nationally standardized definitions for each level of service?
Definition This element asserts that the State has utilized nationally standardized service level definitions
69%
24%
7%
Figure 8. 2015 Responses by Reporting States
Yes
No
Unknown
Table 33. State Responses Regarding Nationally Standardized Definitions
RESPONSE STATE
2015 Finding Of all U.S. States and territories:
• 29 have utilized nationally standardized definitions for each level of service• 10 have not utilized nationally standardized definitions for each level of service• 3 are “unknown” – State did not respond to this data element
Findings show more than half of all U.S. States and territories have utilized nationally standardized definitions for each level of service.
Dataset Shift • 2014 Finding: 27 of 39 reporting States utilized nationally standardized definitions• 2014 Finding: 8 of 39 reporting States did not utilize nationally standardized definitions• 2014 Finding: 4 of 39 reporting States were “unknown” – State did not respond to this data element• 2012 Finding: 17 of 26 reporting States utilized nationally standardized definitions
41
Yes AL, AR, AZ, CA, CT, DC, FL, HI, IA, ID, IL, IN, KS, MD, ME, MN, MT, NC, ND, NH, NJ, OR, PA, PR, SC, TN, TX, UT, WA AK, CO, KY, MA, NE, NM, OK, SD, VA, WI
GA, MI, OH
AS, DE, GU, LA, MP, MS, MO, NV, NY, RI, UM, VI, VT, WV, WY
No
Unknown
Did Not Report Data

2015 National 911 Progress Report Data Element Responses
3.1.2.8: Data Element Sub-Group: Total Number of Primary and Secondary PSAPs within a State
3.1.2.8.1: Total Number of Primary PSAPs within a State
Question Enter the number of primary PSAPs within your State.
Definition NENA defines a primary PSAP as, “A PSAP to which 911 calls are routed directly from the 911 Control Office.” 24
Table 34. Number of Primary PSAPs
State Response State Response State Response TX 505 KS 117 ID 46 CA 400 IA 115 OR 43 IL 272 KY 115 NM 42
MA 249 CT 104 AK 34 NJ 182 MN 104 SD 33 GA 181 AR 103 UT 31 FL 158 CO 88 ME 26 MI 147 AZ 77 MD 24 OK 144 NE 74 ND 22 TN 132 PA 69 HI 6 IN 131 WA 55 NH 2 VA 121 MT 53 PR 2 NC 119 SC 50 DC 1 AL 118
Unknown: OH, WI Did Not Report Data: AS, DE, GU, LA, MP, MS, MO, NV, NY, RI, UM, VI, VT, WV, WY
*Two reporting States are “unknown” – State did not respond to this data element
24 Ibidem, p. 98.
42
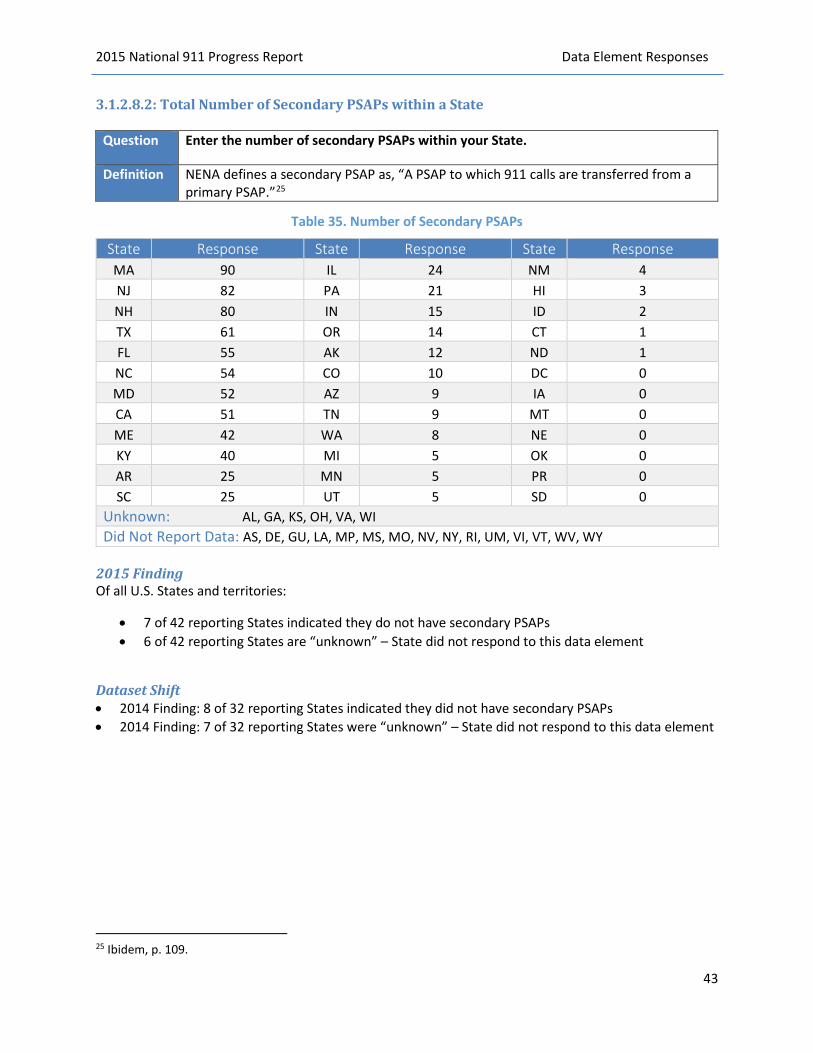
2015 National 911 Progress Report Data Element Responses
3.1.2.8.2: Total Number of Secondary PSAPs within a State
Question Enter the number of secondary PSAPs within your State.
Definition NENA defines a secondary PSAP as, “A PSAP to which 911 calls are transferred from a primary PSAP.”25
Table 35. Number of Secondary PSAPs
State Response State Response State Response MA 90 IL 24 NM 4 NJ 82 PA 21 HI 3 NH 80 IN 15 ID 2 TX 61 OR 14 CT 1 FL 55 AK 12 ND 1 NC 54 CO 10 DC 0 MD 52 AZ 9 IA 0 CA 51 TN 9 MT 0 ME 42 WA 8 NE 0 KY 40 MI 5 OK 0 AR 25 MN 5 PR 0 SC 25 UT 5 SD 0
Unknown: AL, GA, KS, OH, VA, WI Did Not Report Data: AS, DE, GU, LA, MP, MS, MO, NV, NY, RI, UM, VI, VT, WV, WY
2015 Finding Of all U.S. States and territories:
• 7 of 42 reporting States indicated they do not have secondary PSAPs • 6 of 42 reporting States are “unknown” – State did not respond to this data element
Dataset Shift • 2014 Finding: 8 of 32 reporting States indicated they did not have secondary PSAPs • 2014 Finding: 7 of 32 reporting States were “unknown” – State did not respond to this data element
25 Ibidem, p. 109.
43

2015 National 911 Progress Report Data Element Responses
3.1.3: Data Element Group: Financial Data
3.1.3.1: Financial Data Reporting Period Type
Question Select the type of reporting period your State uses for reporting financial data.
Definition Identifies the type of reporting period for which the reported financial data applies (i.e., calendar year, fiscal year, or where the calendar year is the fiscal year). This will provide context for the evaluation of reported data.
33%
55%
2%
10%
FIgure 9. 2015 Responses by Reporting States on Financial Data Reporting Period
Type
Calendar
Fiscal Year
Calendar Year isFiscal Year
Unknown
Table 36. Financial Data Reporting Period Type
RESPONSE STATE
2015 Finding Of all U.S. States and territories:
• 14 of 42 reporting States follow a calendar year to report financial data• 23 of 42 reporting States follow a fiscal year to report financial data• 1 of 42 reporting States indicate their calendar year is equivalent to their fiscal year• 4 of 42 reporting States are “unknown” – State did not respond to this data element
Dataset Shift • 2014 Finding: 13 of 35 reporting States followed a calendar year to report financial data• 2014 Finding: 22 of 35 reporting States followed a fiscal year to report financial data• 2014 Finding: 4 of 35 reporting States are “unknown” – State did not respond to this data element
44
Calendar Year AK, AR, CA, CO, IA, KS, MI, MN, ND, NE, NJ, PA, SC, SD
AL, AZ, CT, DC, FL, HI, IL, IN, KY, MA, MD, ME, MT, NC, NH, NM, OR, PR, TN, TX, UT, VA, WA
ID
GA, OH, OK, WI
AS, DE, GU, LA, MP, MS, MO, NV, NY, RI, UM, VI, VT, WV, WY
Fiscal Year
Calendar Year Is Fiscal Year Unknown
Did Not Report Data

2015 National 911 Progress Report Data Element Responses
3.1.3.2: Annual Revenue for All 911 Authorities
Question Enter the total annual revenue (e.g., special emergency communications taxes, agency fees) for the current reporting year (2014) for all 911 authorities within your State.
Definition Total annual revenue for the current reporting year (2014) for all 911 authorities in a State (local, county, regional, and State) derived from all sources, including, but not limited to 911 surcharges or service fees, and aggregated to the State level.
Table 37. Annual Revenue for All 911 Authorities
State Response State Response State Response FL $ 214,216,433.00 WA $ 91,529,550.00 PR $ 20,838,225.00 IL $ 213,983,628.00 MA $ 74,685,294.00 KS $ 20,337,748.19 TX $ 208,478,516.24 IN $ 72,423,922.00 AZ $ 17,589,405.00 PA $ 186,518,003.52 MN $ 61,445,468.07 SD $ 13,996,971.71 MI $ 185,201,591.62 MD $ 55,420,071.59 NE $ 13,793,706.37 TN $ 126,235,569.00 VA $ 54,305,437.00 MT $ 12,000,000.00 NJ $ 121,000,000.00 AR $ 46,510,146.26 NM $ 11,811,512.00 KY $ 116,262,000.00 CO $ 42,900,000.00 NH $ 10,590,841.00 OR $ 107,378,517.00 CT $ 36,700,000.00 DC $ 10,489,000.00 AL $ 97,616,533.00 UT $ 24,498,594.60 ME $ 8,172,405.00 CA $ 97,077,234.00 ID $ 20,879,778.16 WI $ 0
Total Annual Revenue: $2,394,886,101.33 Unknown: AK, GA, HI, IA, NC, ND, OH, OK, SC Did Not Report Data: AS, DE, GU, LA, MP, MS, MO, NV, NY, RI, UM, VI, VT, WV, WY
2015 Finding Of all U.S. States and territories:
• The total combined annual revenue from 33 of 42 reporting States is $2,394,886,101.33 • 9 of 42 reporting States are “unknown” – State did not respond to this data element
Dataset Shift • 2014 Finding: The total combined annual revenue from 29 of 39 reporting States was
$1,785,259,469 • 2014 Finding: 10 reporting States are “unknown” – State did not respond to this data element
45
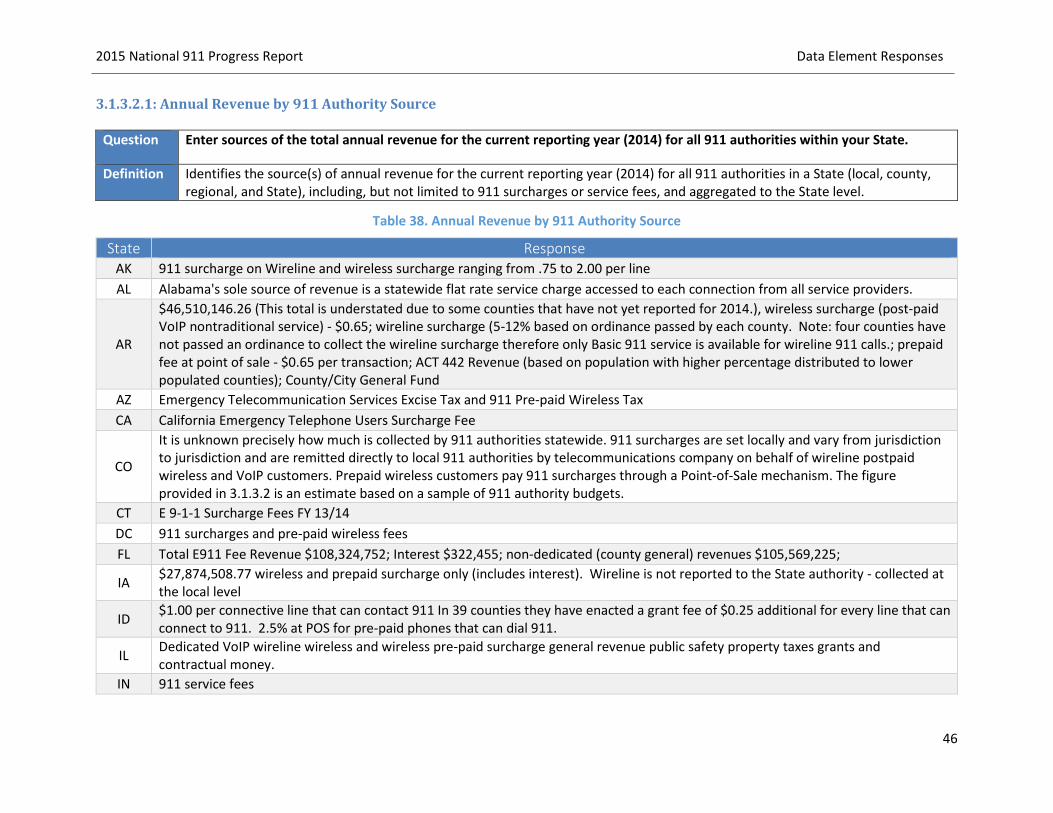
2015 National 911 Progress Report Data Element Responses
3.1.3.2.1: Annual Revenue by 911 Authority Source
Question Enter sources of the total annual revenue for the current reporting year (2014) for all 911 authorities within your State.
Definition Identifies the source(s) of annual revenue for the current reporting year (2014) for all 911 authorities in a State (local, county, regional, and State), including, but not limited to 911 surcharges or service fees, and aggregated to the State level.
Table 38. Annual Revenue by 911 Authority Source
State Response AK 911 surcharge on Wireline and wireless surcharge ranging from .75 to 2.00 per line AL Alabama's sole source of revenue is a statewide flat rate service charge accessed to each connection from all service providers.
AR
$46,510,146.26 (This total is understated due to some counties that have not yet reported for 2014.), wireless surcharge (post-paid VoIP nontraditional service) - $0.65; wireline surcharge (5-12% based on ordinance passed by each county. Note: four counties have not passed an ordinance to collect the wireline surcharge therefore only Basic 911 service is available for wireline 911 calls.; prepaid fee at point of sale - $0.65 per transaction; ACT 442 Revenue (based on population with higher percentage distributed to lower populated counties); County/City General Fund
AZ Emergency Telecommunication Services Excise Tax and 911 Pre-paid Wireless Tax CA California Emergency Telephone Users Surcharge Fee
CO
It is unknown precisely how much is collected by 911 authorities statewide. 911 surcharges are set locally and vary from jurisdiction to jurisdiction and are remitted directly to local 911 authorities by telecommunications company on behalf of wireline postpaid wireless and VoIP customers. Prepaid wireless customers pay 911 surcharges through a Point-of-Sale mechanism. The figure provided in 3.1.3.2 is an estimate based on a sample of 911 authority budgets.
CT E 9-1-1 Surcharge Fees FY 13/14 DC 911 surcharges and pre-paid wireless fees FL Total E911 Fee Revenue $108,324,752; Interest $322,455; non-dedicated (county general) revenues $105,569,225;
IA $27,874,508.77 wireless and prepaid surcharge only (includes interest). Wireline is not reported to the State authority - collected at the local level
ID $1.00 per connective line that can contact 911 In 39 counties they have enacted a grant fee of $0.25 additional for every line that can connect to 911. 2.5% at POS for pre-paid phones that can dial 911.
IL Dedicated VoIP wireline wireless and wireless pre-paid surcharge general revenue public safety property taxes grants and contractual money.
IN 911 service fees
46

2015 National 911 Progress Report Data Element Responses
State Response
KS
The amount reported in 3.1.3.2 above is derived from a user fee collected by communications service providers. This fee is currently set at $0.53 per device capable of accessing 911. Additionally a 1.06% of retail sales of prepaid wireless devices is assessed at the point of sale. In addition to the amount reported above local units of government support 911 Authorities throughout the State with general fund monies to a much greater extent than the reported fees. The specific amount of general fund tax monies utilized to support 911 is not currently available. Expenditure amounts in the following question do not include the general fund costs.
KY Local general fund appropriations - (est. 37%); Local dedicated 911 surcharges i.e. landline fee or per parcel assessment - (est. 32%); State 911 surcharge on CMRS connections (cell phones) - (est. 25%); State general fund support to Ky. State Police PSAPs - (est. 6%)
MA Dedicated 911 surcharges MD Dedicated 9-1-1 surcharge
ME E911 Surcharge (State) $8,172,405, General Fund $3,069,966 (General Fund appropriation is not an actual revenue so it was not reported above in the 2014 reporting year.)
MI State surcharge distribution State training fund contracts local 911 surcharge local 911 mileages general fund grants MN 911 surcharges and fees MT Tax on every 911 accessible device per statute.
NC At the State level we can provide only the 911 surcharge amount of revenue and expenditures at the PSAP level. We are not able to provide any report on general revenue or other funding sources used at the local level.
ND 911 fees per device or line. General fund.
NE The amounts included reflect landline and wireless 911 surcharges. PSAPs also benefit from local general funds and occupation tax assessed at the local level but those amounts are not available.
NH 911 phone surcharge
NJ State funds the 911 infrastructure statewide from the 911 System and Emergency Response Fee PSAPs are required to fund all operational costs generally from local and county taxes.
NM New Mexico’s Enhanced 911 Act (Section 63-9D-1 et. seq. NMSA 1978) mandates a $.51 surcharge per month on each subscriber’s landline telephone and a $.51 surcharge per month on each subscriber’s cellular telephone.
OR $39,470,386 in statewide 911 tax. Remainder is local monies. PA 1. Wireline Surcharge Revenue, 2. Wireless Surcharge Revenue to include Prepaid and Postpaid, 3. VoIP Surcharge Revenue
PR We are reporting revenues for fiscal year 2013-2014. The only sources of revenue for FY 2013-2014 were surcharges and service fees in the monthly cellphone and telephone bills.
SC Landline 911 fees are collected at the local jurisdiction level and the State is not involved with those monies. The State does not know the total revenues from landline in the State. Wireless 911 fees are remitted to the State and distributed back to the counties according to SC Code of Laws Section 23 Chapter 47. Surcharge collections for 2014 totaled $28,458,896.05.
47
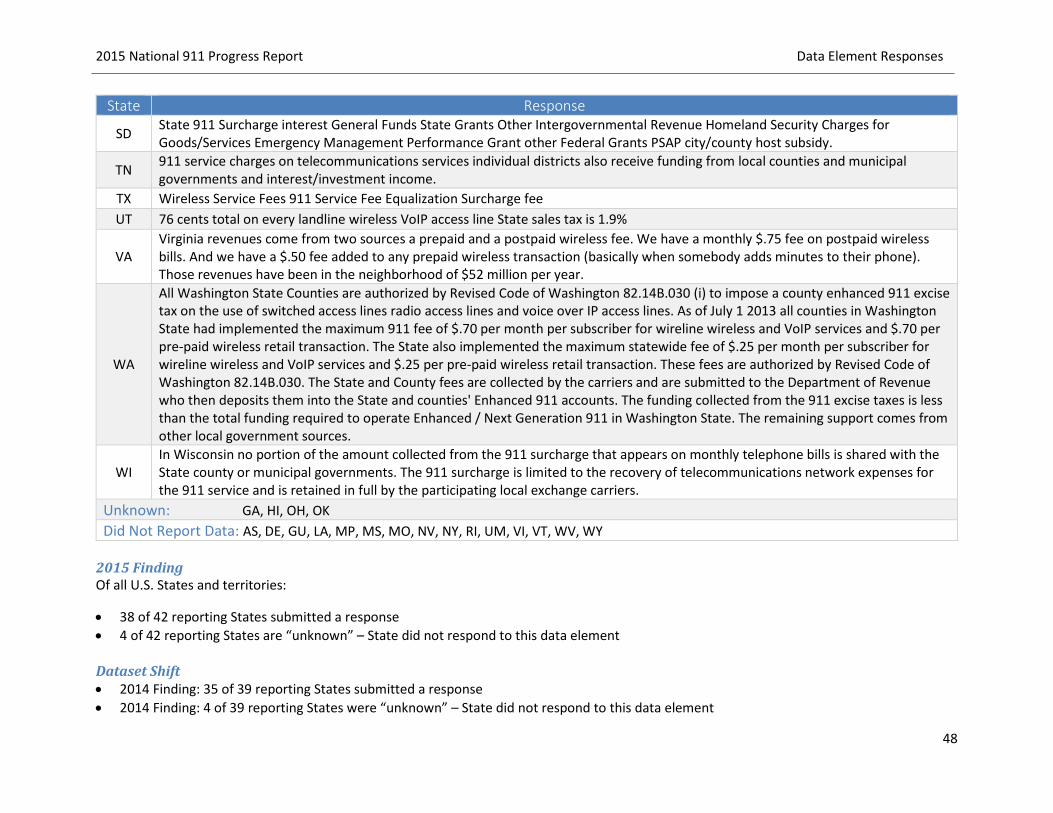
2015 National 911 Progress Report Data Element Responses
State Response
SD State 911 Surcharge interest General Funds State Grants Other Intergovernmental Revenue Homeland Security Charges for Goods/Services Emergency Management Performance Grant other Federal Grants PSAP city/county host subsidy.
TN 911 service charges on telecommunications services individual districts also receive funding from local counties and municipal governments and interest/investment income.
TX Wireless Service Fees 911 Service Fee Equalization Surcharge fee UT 76 cents total on every landline wireless VoIP access line State sales tax is 1.9%
VA Virginia revenues come from two sources a prepaid and a postpaid wireless fee. We have a monthly $.75 fee on postpaid wireless bills. And we have a $.50 fee added to any prepaid wireless transaction (basically when somebody adds minutes to their phone). Those revenues have been in the neighborhood of $52 million per year.
WA
All Washington State Counties are authorized by Revised Code of Washington 82.14B.030 (i) to impose a county enhanced 911 excise tax on the use of switched access lines radio access lines and voice over IP access lines. As of July 1 2013 all counties in Washington State had implemented the maximum 911 fee of $.70 per month per subscriber for wireline wireless and VoIP services and $.70 per pre-paid wireless retail transaction. The State also implemented the maximum statewide fee of $.25 per month per subscriber for wireline wireless and VoIP services and $.25 per pre-paid wireless retail transaction. These fees are authorized by Revised Code of Washington 82.14B.030. The State and County fees are collected by the carriers and are submitted to the Department of Revenue who then deposits them into the State and counties' Enhanced 911 accounts. The funding collected from the 911 excise taxes is less than the total funding required to operate Enhanced / Next Generation 911 in Washington State. The remaining support comes from other local government sources.
WI In Wisconsin no portion of the amount collected from the 911 surcharge that appears on monthly telephone bills is shared with the State county or municipal governments. The 911 surcharge is limited to the recovery of telecommunications network expenses for the 911 service and is retained in full by the participating local exchange carriers.
Unknown: GA, HI, OH, OK Did Not Report Data: AS, DE, GU, LA, MP, MS, MO, NV, NY, RI, UM, VI, VT, WV, WY
2015 Finding Of all U.S. States and territories:
• 38 of 42 reporting States submitted a response • 4 of 42 reporting States are “unknown” – State did not respond to this data element Dataset Shift • 2014 Finding: 35 of 39 reporting States submitted a response • 2014 Finding: 4 of 39 reporting States were “unknown” – State did not respond to this data element
48
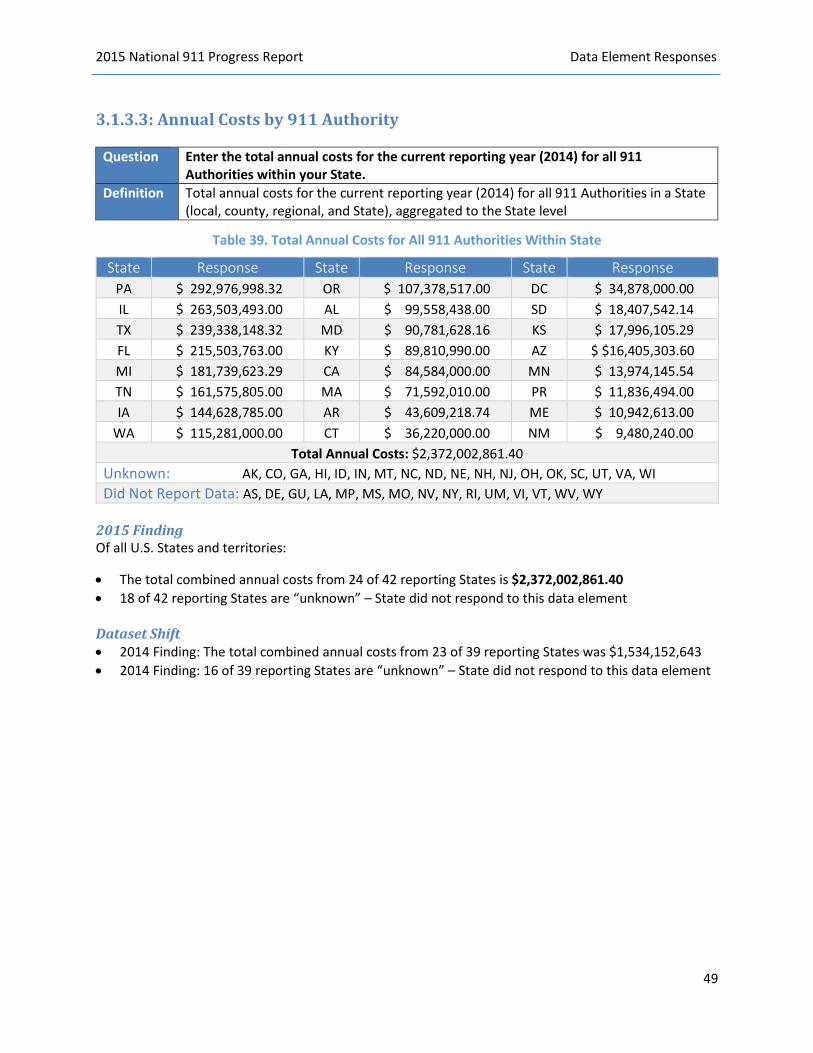
2015 National 911 Progress Report Data Element Responses
3.1.3.3: Annual Costs by 911 Authority
Question Enter the total annual costs for the current reporting year (2014) for all 911 Authorities within your State.
Definition Total annual costs for the current reporting year (2014) for all 911 Authorities in a State (local, county, regional, and State), aggregated to the State level
Table 39. Total Annual Costs for All 911 Authorities Within State
State Response State Response State Response PA $ 292,976,998.32 OR $ 107,378,517.00 DC $ 34,878,000.00 IL $ 263,503,493.00 AL $ 99,558,438.00 SD $ 18,407,542.14 TX $ 239,338,148.32 MD $ 90,781,628.16 KS $ 17,996,105.29 FL $ 215,503,763.00 KY $ 89,810,990.00 AZ $ $16,405,303.60 MI $ 181,739,623.29 CA $ 84,584,000.00 MN $ 13,974,145.54 TN $ 161,575,805.00 MA $ 71,592,010.00 PR $ 11,836,494.00 IA $ 144,628,785.00 AR $ 43,609,218.74 ME $ 10,942,613.00
WA $ 115,281,000.00 CT $ 36,220,000.00 NM $ 9,480,240.00 Total Annual Costs: $2,372,002,861.40
Unknown: AK, CO, GA, HI, ID, IN, MT, NC, ND, NE, NH, NJ, OH, OK, SC, UT, VA, WI Did Not Report Data: AS, DE, GU, LA, MP, MS, MO, NV, NY, RI, UM, VI, VT, WV, WY
2015 Finding Of all U.S. States and territories:
• The total combined annual costs from 24 of 42 reporting States is $2,372,002,861.40 • 18 of 42 reporting States are “unknown” – State did not respond to this data element Dataset Shift • 2014 Finding: The total combined annual costs from 23 of 39 reporting States was $1,534,152,643 • 2014 Finding: 16 of 39 reporting States are “unknown” – State did not respond to this data element
49
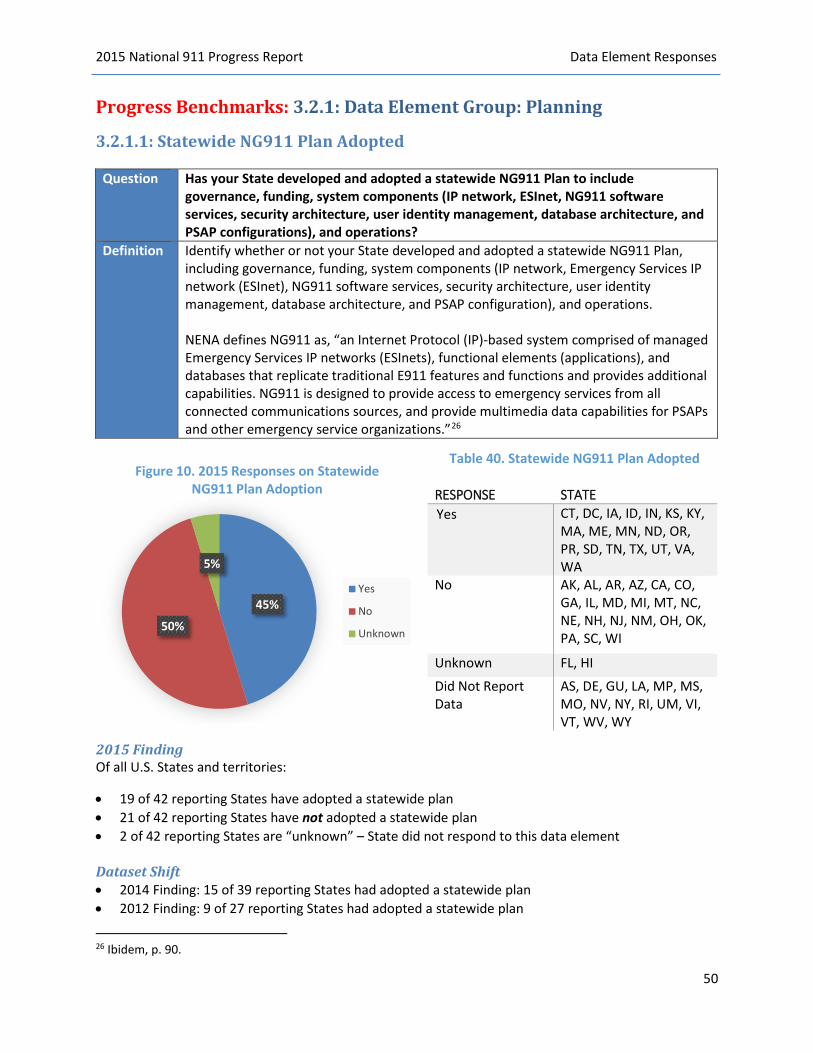
2015 National 911 Progress Report Data Element Responses
Progress Benchmarks: 3.2.1: Data Element Group: Planning
3.2.1.1: Statewide NG911 Plan Adopted
Question Has your State developed and adopted a statewide NG911 Plan to include governance, funding, system components (IP network, ESInet, NG911 software services, security architecture, user identity management, database architecture, and PSAP configurations), and operations?
Definition Identify whether or not your State developed and adopted a statewide NG911 Plan, including governance, funding, system components (IP network, Emergency Services IP network (ESInet), NG911 software services, security architecture, user identity management, database architecture, and PSAP configuration), and operations.
NENA defines NG911 as, “an Internet Protocol (IP)-based system comprised of managed Emergency Services IP networks (ESInets), functional elements (applications), and databases that replicate traditional E911 features and functions and provides additional capabilities. NG911 is designed to provide access to emergency services from all connected communications sources, and provide multimedia data capabilities for PSAPs and other emergency service organizations.”26
45%
50%
5%
Figure 10. 2015 Responses on Statewide NG911 Plan Adoption
Yes
No
Unknown
Table 40. Statewide NG911 Plan Adopted
RESPONSE STATE
2015 Finding Of all U.S. States and territories:
• 19 of 42 reporting States have adopted a statewide plan• 21 of 42 reporting States have not adopted a statewide plan• 2 of 42 reporting States are “unknown” – State did not respond to this data element
Dataset Shift • 2014 Finding: 15 of 39 reporting States had adopted a statewide plan• 2012 Finding: 9 of 27 reporting States had adopted a statewide plan
26 Ibidem, p. 90.
50
Yes CT, DC, IA, ID, IN, KS, KY, MA, ME, MN, ND, OR, PR, SD, TN, TX, UT, VA, WA AK, AL, AR, AZ, CA, CO, GA, IL, MD, MI, MT, NC, NE, NH, NJ, NM, OH, OK, PA, SC, WI
FL, HI
AS, DE, GU, LA, MP, MS, MO, NV, NY, RI, UM, VI, VT, WV, WY
No
Unknown
Did Not Report Data
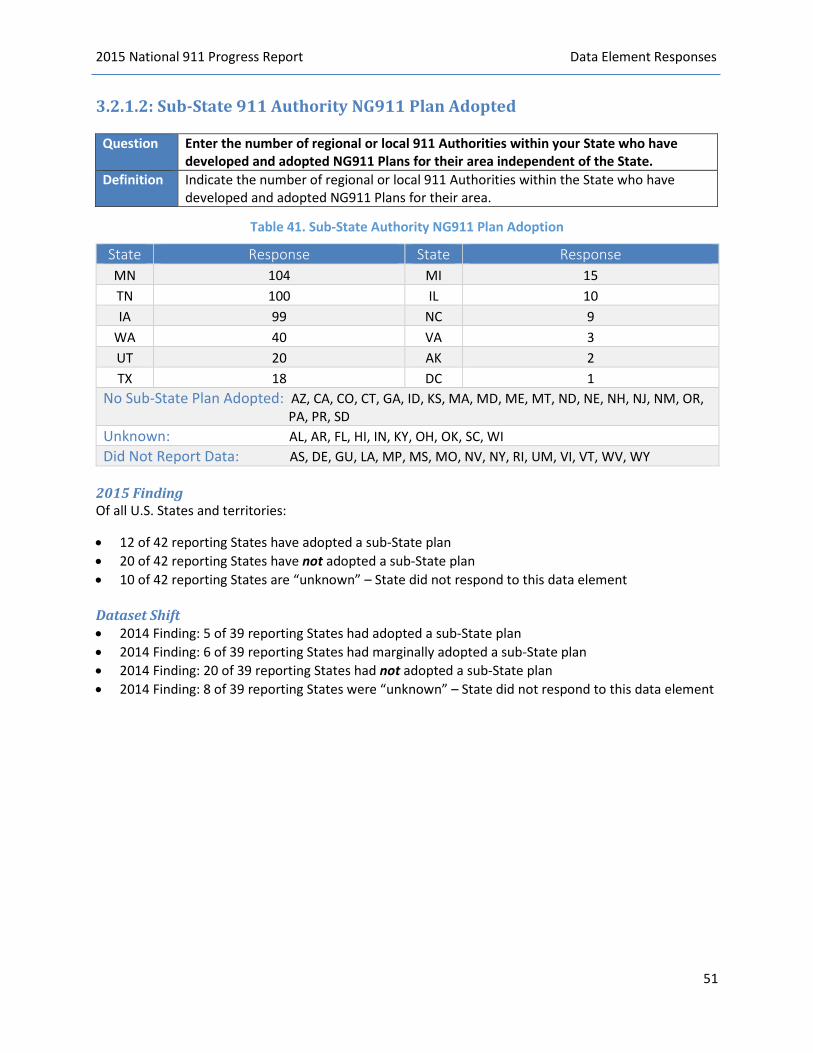
2015 National 911 Progress Report Data Element Responses
3.2.1.2: Sub-State 911 Authority NG911 Plan Adopted
Question Enter the number of regional or local 911 Authorities within your State who have developed and adopted NG911 Plans for their area independent of the State.
Definition Indicate the number of regional or local 911 Authorities within the State who have developed and adopted NG911 Plans for their area.
Table 41. Sub-State Authority NG911 Plan Adoption
State Response State Response MN 104 MI 15 TN 100 IL 10 IA 99 NC 9
WA 40 VA 3 UT 20 AK 2 TX 18 DC 1
No Sub-State Plan Adopted: AZ, CA, CO, CT, GA, ID, KS, MA, MD, ME, MT, ND, NE, NH, NJ, NM, OR, PA, PR, SD Unknown: AL, AR, FL, HI, IN, KY, OH, OK, SC, WI Did Not Report Data: AS, DE, GU, LA, MP, MS, MO, NV, NY, RI, UM, VI, VT, WV, WY
2015 Finding Of all U.S. States and territories:
• 12 of 42 reporting States have adopted a sub-State plan • 20 of 42 reporting States have not adopted a sub-State plan • 10 of 42 reporting States are “unknown” – State did not respond to this data element Dataset Shift • 2014 Finding: 5 of 39 reporting States had adopted a sub-State plan • 2014 Finding: 6 of 39 reporting States had marginally adopted a sub-State plan • 2014 Finding: 20 of 39 reporting States had not adopted a sub-State plan • 2014 Finding: 8 of 39 reporting States were “unknown” – State did not respond to this data element
51
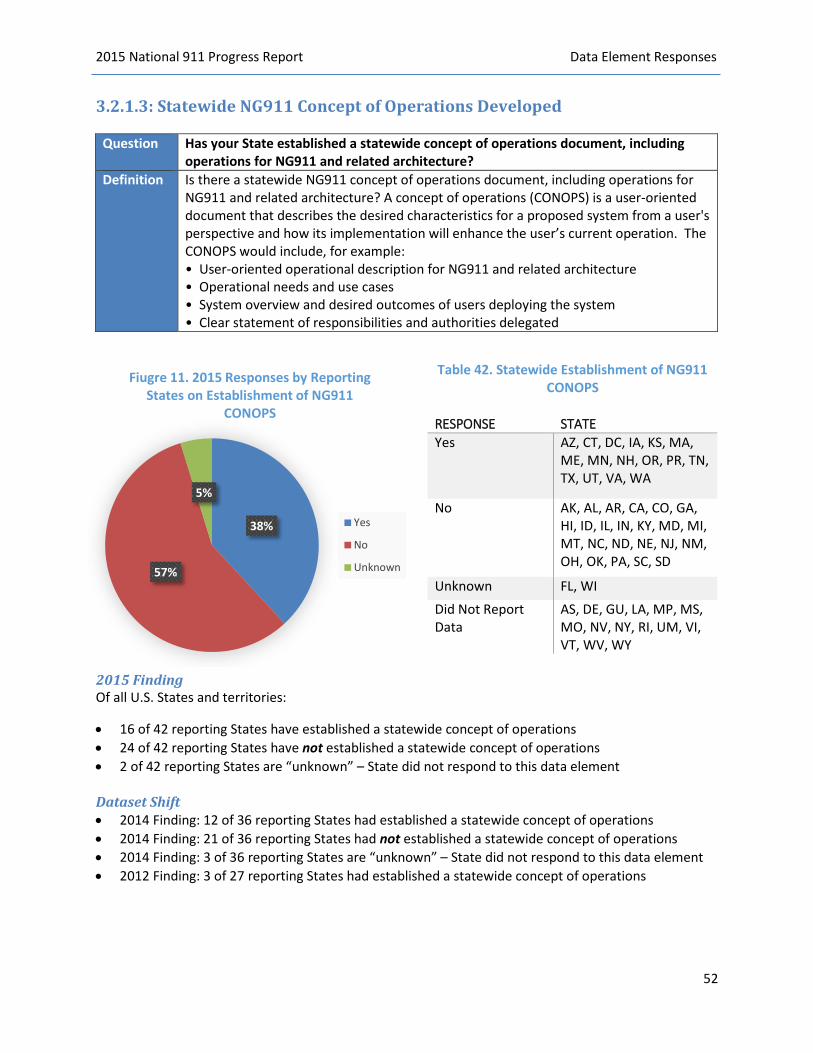
2015 National 911 Progress Report Data Element Responses
3.2.1.3: Statewide NG911 Concept of Operations Developed
Question Has your State established a statewide concept of operations document, including operations for NG911 and related architecture?
Definition Is there a statewide NG911 concept of operations document, including operations for NG911 and related architecture? A concept of operations (CONOPS) is a user-oriented document that describes the desired characteristics for a proposed system from a user's perspective and how its implementation will enhance the user’s current operation. The CONOPS would include, for example: • User-oriented operational description for NG911 and related architecture• Operational needs and use cases• System overview and desired outcomes of users deploying the system• Clear statement of responsibilities and authorities delegated
38%
57%
5%
Fiugre 11. 2015 Responses by Reporting States on Establishment of NG911
CONOPS
Yes
No
Unknown
Table 42. Statewide Establishment of NG911 CONOPS
RESPONSE STATE
2015 Finding Of all U.S. States and territories:
• 16 of 42 reporting States have established a statewide concept of operations• 24 of 42 reporting States have not established a statewide concept of operations• 2 of 42 reporting States are “unknown” – State did not respond to this data element
Dataset Shift • 2014 Finding: 12 of 36 reporting States had established a statewide concept of operations• 2014 Finding: 21 of 36 reporting States had not established a statewide concept of operations• 2014 Finding: 3 of 36 reporting States are “unknown” – State did not respond to this data element• 2012 Finding: 3 of 27 reporting States had established a statewide concept of operations
52
Yes AZ, CT, DC, IA, KS, MA, ME, MN, NH, OR, PR, TN, TX, UT, VA, WA
AK, AL, AR, CA, CO, GA, HI, ID, IL, IN, KY, MD, MI, MT, NC, ND, NE, NJ, NM, OH, OK, PA, SC, SD
FL, WI AS, DE, GU, LA, MP, MS, MO, NV, NY, RI, UM, VI, VT, WV, WY
No
UnknownDid Not Report Data

2015 National 911 Progress Report Data Element Responses
3.2.1.4: Sub-State 911 Authority Concept of Operations Developed
Question Enter the number of regional or local 911 authorities within your State who have developed an NG911 concept of operations for their area.
Definition Indicate the number of regional or local 911 Authorities within the State who have developed a concept of operations for their area.
Table 43. Number of Sub-State 911 Authorities with Established NG911 CONOPS
State Response State Response MN 104 MI 15 TN 100 NC 6 IA 99 VA 3
WA 40 AK 2 UT 30 NH 1 TX 18
No Sub-State Concept Developed: AZ, CA, CO, CT, DC, HI, ID, KS, MA, MD, ME, MT, ND, NE, NJ, NM, OR, PA, PR, SD Unknown: AL, AR, FL, GA, IL, IN, KY, OH, OK, SC, WI Did Not Report Data: AS, DE, GU, LA, MP, MS, MO, NV, NY, RI, UM, VI, VT, WV, WY
2015 Finding Of all U.S. States and territories:
• 11 of 42 reporting States have developed a sub-State concept of operations • 20 of 42 reporting States have not developed a sub-State concept of operations • 11 of 42 reporting States are “unknown” – State did not respond to this data element Dataset Shift • 2014 Finding: 4 of 39 reporting States had developed a sub-State concept of operations • 2014 Finding: 5 of 39 reporting States had marginally developed a sub-State concept of operations • 2014 Finding: 20 of 39 reporting States had not developed a sub-State concept of operations • 2014 Finding: 10 of 39 reporting States were “unknown” – State did not respond to this data
element
53
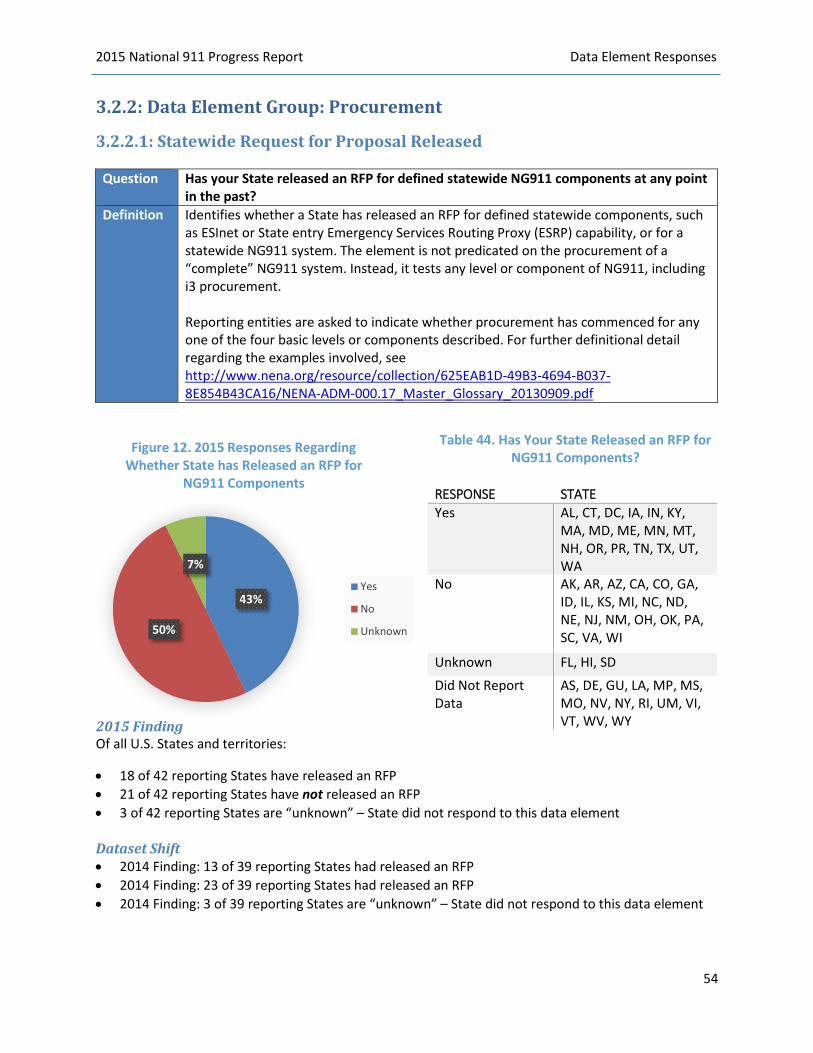
2015 National 911 Progress Report Data Element Responses
3.2.2: Data Element Group: Procurement
3.2.2.1: Statewide Request for Proposal Released
Question Has your State released an RFP for defined statewide NG911 components at any point in the past?
Definition Identifies whether a State has released an RFP for defined statewide components, such as ESInet or State entry Emergency Services Routing Proxy (ESRP) capability, or for a statewide NG911 system. The element is not predicated on the procurement of a “complete” NG911 system. Instead, it tests any level or component of NG911, including i3 procurement.
Reporting entities are asked to indicate whether procurement has commenced for any one of the four basic levels or components described. For further definitional detail regarding the examples involved, see http://www.nena.org/resource/collection/625EAB1D-49B3-4694-B037-8E854B43CA16/NENA-ADM-000.17_Master_Glossary_20130909.pdf
43%
50%
7%
Figure 12. 2015 Responses Regarding Whether State has Released an RFP for
NG911 Components
Yes
No
Unknown
Table 44. Has Your State Released an RFP for NG911 Components?
RESPONSE STATE
2015 Finding Of all U.S. States and territories:
• 18 of 42 reporting States have released an RFP• 21 of 42 reporting States have not released an RFP• 3 of 42 reporting States are “unknown” – State did not respond to this data element
Dataset Shift • 2014 Finding: 13 of 39 reporting States had released an RFP• 2014 Finding: 23 of 39 reporting States had released an RFP• 2014 Finding: 3 of 39 reporting States are “unknown” – State did not respond to this data element
54
AL, CT, DC, IA, IN, KY, MA, MD, ME, MN, MT, NH, OR, PR, TN, TX, UT, WA AK, AR, AZ, CA, CO, GA, ID, IL, KS, MI, NC, ND, NE, NJ, NM, OH, OK, PA, SC, VA, WI
FL, HI, SD AS, DE, GU, LA, MP, MS, MO, NV, NY, RI, UM, VI, VT, WV, WY
Yes
No
UnknownDid Not Report Data
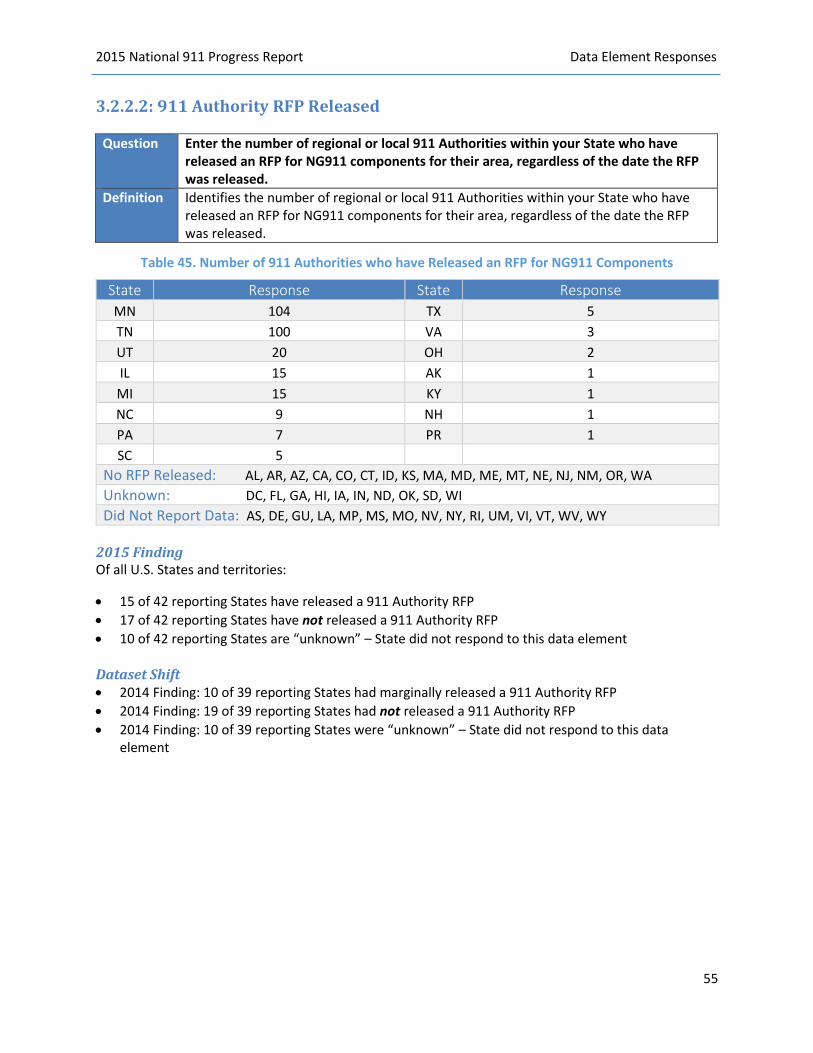
2015 National 911 Progress Report Data Element Responses
3.2.2.2: 911 Authority RFP Released
Question Enter the number of regional or local 911 Authorities within your State who have released an RFP for NG911 components for their area, regardless of the date the RFP was released.
Definition Identifies the number of regional or local 911 Authorities within your State who have released an RFP for NG911 components for their area, regardless of the date the RFP was released.
Table 45. Number of 911 Authorities who have Released an RFP for NG911 Components
State Response State Response MN 104 TX 5 TN 100 VA 3 UT 20 OH 2 IL 15 AK 1 MI 15 KY 1 NC 9 NH 1 PA 7 PR 1 SC 5
No RFP Released: AL, AR, AZ, CA, CO, CT, ID, KS, MA, MD, ME, MT, NE, NJ, NM, OR, WA Unknown: DC, FL, GA, HI, IA, IN, ND, OK, SD, WI Did Not Report Data: AS, DE, GU, LA, MP, MS, MO, NV, NY, RI, UM, VI, VT, WV, WY
2015 Finding Of all U.S. States and territories:
• 15 of 42 reporting States have released a 911 Authority RFP • 17 of 42 reporting States have not released a 911 Authority RFP • 10 of 42 reporting States are “unknown” – State did not respond to this data element Dataset Shift • 2014 Finding: 10 of 39 reporting States had marginally released a 911 Authority RFP • 2014 Finding: 19 of 39 reporting States had not released a 911 Authority RFP • 2014 Finding: 10 of 39 reporting States were “unknown” – State did not respond to this data
element
55

2015 National 911 Progress Report Data Element Responses
3.2.2.3: Statewide Components Specified for Procurement
Question If the response to 3.2.2.1 is "Yes," list which parts, functions, or components of NG911 are being procured in your State.
Definition Based upon a positive response to element 3.2.2.1, this element provides detail on what parts, functions, or components for NG911 are being procured. Parts, functions, or components are described in data element 3.2.2.1 above.
Table 46. Statewide Components Specified for Procurement
State Response AZ NG911 Network, Equipment and Equipment Maintenance. IA Basic IP Network, NG911 Applications KY ESInet and NG Transition Components. MI IP Netwoek/ESI Net in the Upper Penninsula
MN We have procured a combination of elements in Level 1, 2, 3, and 4. GIS data is being collected and maintained at the local levels and aggregated and standardized at the State level for eventual ECRF/LVF purposes.
MT
None. PSAPs coming on to the statewide system will be responsible for an annual, per seat flat fee of $18,000. This flat fee is used to recover the recurring costs of circuits and equipment and to create a reserve fund for future costs of geospatial routing and other i3 services.
NC Routers: every IP network is the routers and the links between the routers Firewalls Domain Name System (DNS) servers Dynamic Host Configuration Protocol (DHCP) servers
ND NG911 Capable CPE is being procured by local 911 Authorities. PR 1. Basic IP Network, 2. NG911 Applications, 3. NG911 Transition components. TN Call handling equipment (i3 compliant ANI/ALI controllers) to include peripheral equipment and recorders
TX
Basic IP Network (general purpose. common to any outsources IP networ2, ESInet (hardware, software, databases unique to an Emergency Services IP Network, supports specific emergency services applications, whether is supports NG911 or not). Examples include: "Forest Guide Emergency Call Routing Function (ESRF), Agency locator function 3.NG911 Applications (eg. hardware, software, databases unique or necessary to NG911 services). Examples include: Location Validation Function (LVF) PSAP and other emergency agencies credentialing authority (core services, Policy store/editor. The rest of the BCF )not included in the firewall) 4. NG911 Transition components. Examples include: Legacy service gateway, Legacy PSAP gateway, Legacy SR gateway (where legacy services enter NG911 via Service Provider switches operating as selective routers, either partially or fully as tandems.
UT Level 2
56
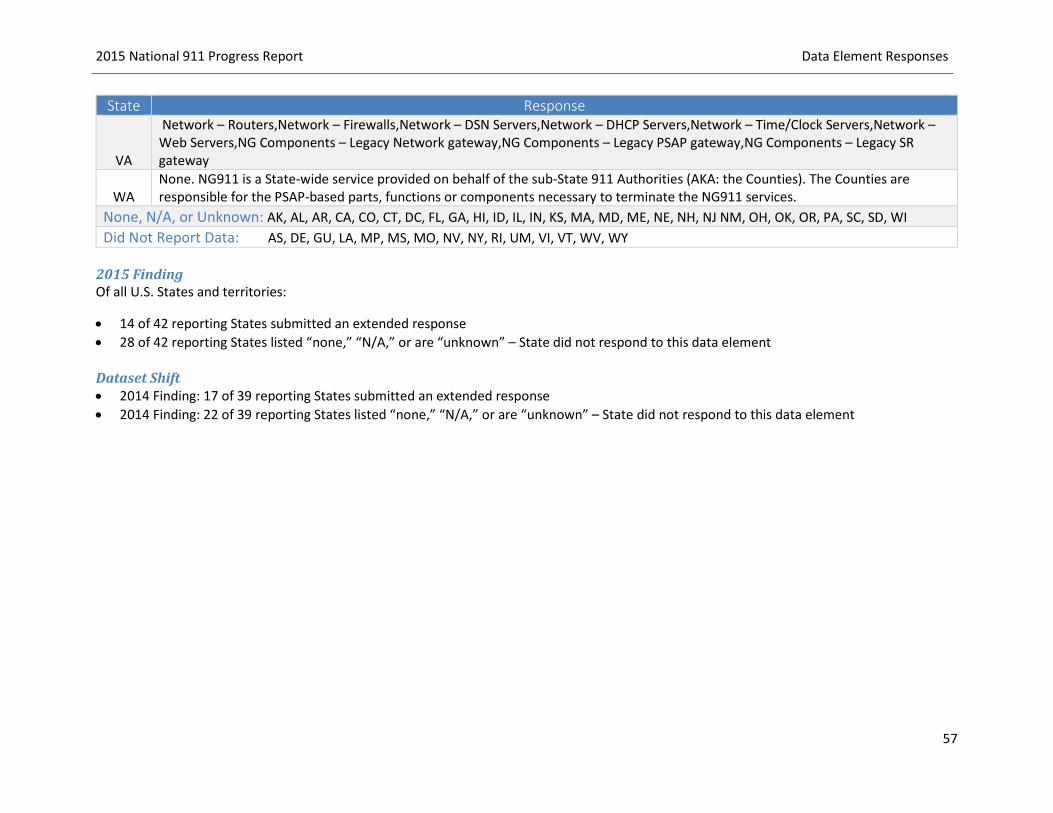
2015 National 911 Progress Report Data Element Responses
State Response
VA
Network – Routers,Network – Firewalls,Network – DSN Servers,Network – DHCP Servers,Network – Time/Clock Servers,Network – Web Servers,NG Components – Legacy Network gateway,NG Components – Legacy PSAP gateway,NG Components – Legacy SR gateway
WA None. NG911 is a State-wide service provided on behalf of the sub-State 911 Authorities (AKA: the Counties). The Counties are responsible for the PSAP-based parts, functions or components necessary to terminate the NG911 services.
None, N/A, or Unknown: AK, AL, AR, CA, CO, CT, DC, FL, GA, HI, ID, IL, IN, KS, MA, MD, ME, NE, NH, NJ NM, OH, OK, OR, PA, SC, SD, WI Did Not Report Data: AS, DE, GU, LA, MP, MS, MO, NV, NY, RI, UM, VI, VT, WV, WY
2015 Finding Of all U.S. States and territories:
• 14 of 42 reporting States submitted an extended response • 28 of 42 reporting States listed “none,” “N/A,” or are “unknown” – State did not respond to this data element Dataset Shift • 2014 Finding: 17 of 39 reporting States submitted an extended response • 2014 Finding: 22 of 39 reporting States listed “none,” “N/A,” or are “unknown” – State did not respond to this data element
57

2015 National 911 Progress Report Data Element Responses
3.2.2.4: Sub-State 911 Authority Components Being Procured
Question If the response to 3.2.2.1 is "Yes," list which parts, functions, or components of NG911 are being procured by regional or local 911 authorities within your State.
Definition Based upon sub-State 911 Authorities within a reporting State that have released RFPs (see element 3.2.2.2), this element requests States to summarize what parts, functions, or components for NG911 are being procured by regional or local 911 Authorities. Said parts, functions, or components are described in data element 3.2.2.1 above.
Table 47. Sub-State Authority Components Procured
State Response
AL
The following components have been procured in the specified categories: 1. Basic IP Network: Routers, Firewalls, Domain Name System (DNS) servers, Dynamic Host Configuration Protocol (DHCP) servers 2. ESInet: Emergency Call Routing Function (ECRF), “Agency locator” functions 3. NG911 Applications: Location Validation Function (LVF), PSAP and other emergency agencies credentialing authority (core service), Emergency entity name/IP address service, Logging services, Emergency service routing proxies (ESRPs), Bridging services, Authentication service (core service) 4. NG911 Transition components: Legacy service gateway, Legacy PSAP gateway, Legacy SR gateway
CA 1. Basic IP Network (general purpose, common to any outsourced IP network) – Routers: every IP network is the routers and the links between the routers, Firewalls, Time/clock servers 4. NG911 Transition components—Legacy service gateway, Legacy PSAP gateway, Legacy SR gateway
CT
ESI net, NG911 Applications - hardware and software, NG911 Transition Components, all will use the Connecticut Public Safety Network - an ultra-high speed and flexible fiber optic data network that will serve as a base transport infrastructure and interconnectivity pathway for public safety related applications and services throughout the State. Its primary purpose is to provide the required connectivity for the upcoming implementation of Next Generation (NG911) service.
DC ESInet related items to be a part of Maryland's statewide IP network (Network Maryland). This network will become the main platform of a statewide ESInet.
IA NG911 Applications (GIS) ESInet (Secondary ESInet) IN All ESInet fund, NG911 features listed KY To date we have only released on an RFP for an ESInet. MA All four. MD We procured vendors for levels 1, 2, 3, and 4 during calendar year 2013. ME 1, 2, 3, 4 full service provider MN We have procured a combination of elements in Levels 1, 2, 3 and 4
58
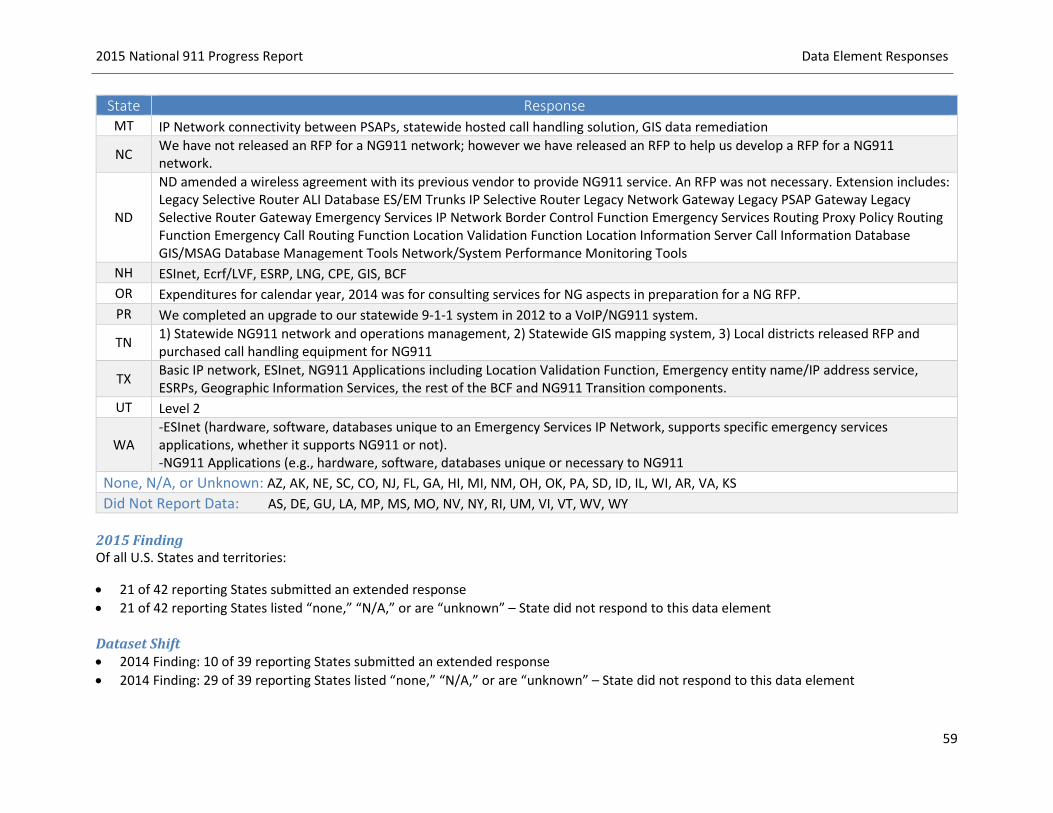
2015 National 911 Progress Report Data Element Responses
State Response MT IP Network connectivity between PSAPs, statewide hosted call handling solution, GIS data remediation
NC We have not released an RFP for a NG911 network; however we have released an RFP to help us develop a RFP for a NG911 network.
ND
ND amended a wireless agreement with its previous vendor to provide NG911 service. An RFP was not necessary. Extension includes: Legacy Selective Router ALI Database ES/EM Trunks IP Selective Router Legacy Network Gateway Legacy PSAP Gateway Legacy Selective Router Gateway Emergency Services IP Network Border Control Function Emergency Services Routing Proxy Policy Routing Function Emergency Call Routing Function Location Validation Function Location Information Server Call Information Database GIS/MSAG Database Management Tools Network/System Performance Monitoring Tools
NH ESInet, Ecrf/LVF, ESRP, LNG, CPE, GIS, BCF OR Expenditures for calendar year, 2014 was for consulting services for NG aspects in preparation for a NG RFP. PR We completed an upgrade to our statewide 9-1-1 system in 2012 to a VoIP/NG911 system.
TN 1) Statewide NG911 network and operations management, 2) Statewide GIS mapping system, 3) Local districts released RFP and purchased call handling equipment for NG911
TX Basic IP network, ESInet, NG911 Applications including Location Validation Function, Emergency entity name/IP address service, ESRPs, Geographic Information Services, the rest of the BCF and NG911 Transition components.
UT Level 2
WA -ESInet (hardware, software, databases unique to an Emergency Services IP Network, supports specific emergency services applications, whether it supports NG911 or not). -NG911 Applications (e.g., hardware, software, databases unique or necessary to NG911
None, N/A, or Unknown: AZ, AK, NE, SC, CO, NJ, FL, GA, HI, MI, NM, OH, OK, PA, SD, ID, IL, WI, AR, VA, KS Did Not Report Data: AS, DE, GU, LA, MP, MS, MO, NV, NY, RI, UM, VI, VT, WV, WY
2015 Finding Of all U.S. States and territories:
• 21 of 42 reporting States submitted an extended response • 21 of 42 reporting States listed “none,” “N/A,” or are “unknown” – State did not respond to this data element Dataset Shift • 2014 Finding: 10 of 39 reporting States submitted an extended response • 2014 Finding: 29 of 39 reporting States listed “none,” “N/A,” or are “unknown” – State did not respond to this data element
59

2015 National 911 Progress Report Data Element Responses
3.2.2.5: Captures whether a State Contract for the NG911 Part, Function, or Component Identified Above Has Been Awarded
Question Has your State awarded contracts for the procured components and/or functions defined in 3.2.2.3 either during this survey year or earlier?
Definition This data element specifically relates to the detail identified by data element 3.2.2.3 (i.e., the NG911 part, function, and/or component acknowledged), and solicits a “yes” or “no” response.
38%
57%
5%
Figure 13. 2015 Responses by Reporting States on Awards of State Contracts for NG911
Yes
No
Unknown
Table 48. State Responses on Status of Awarded Contracts for NG911
RESPONSE STATE
No
Did Not Report Data
2015 Finding Of all U.S. States and territories:
• 16 of 42 reporting States have awarded a State contract• 24 of 42 reporting States have not awarded a State contract• 2 of 42 reporting States are “unknown” – State did not respond to this data element
Dataset Shift • 2014 Finding: 13 of 39 reporting States had awarded a State contract• 2014 Finding: 22 of 39 reporting States had not awarded a State contract• 2014 Finding: 4 of 39 reporting States are “unknown” – State did not respond to this data element
60
Yes AL, CT, DC, HI, IA, IN, MA, MD, ME, MN, ND, PR, TN, TX, UT, WA
AK, AR, AZ, CA, CO, GA, ID, IL, KS, KY, MI, MT, NC, NE, NH, NJ, NM, OH, OK, OR, PA, SC, VA, WI
FL, SD
AS, DE, GU, LA, MP, MS, MO, NV, NY, RI, UM, VI, VT, WV, WY
Unknown
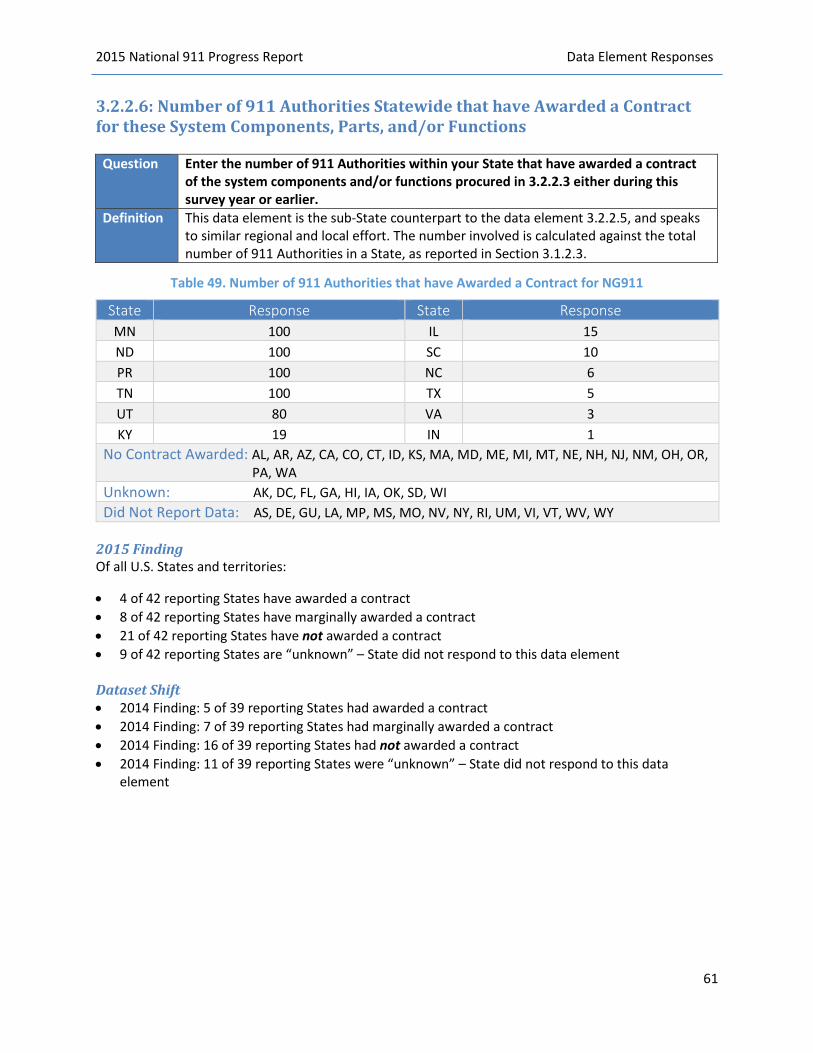
2015 National 911 Progress Report Data Element Responses
3.2.2.6: Number of 911 Authorities Statewide that have Awarded a Contract for these System Components, Parts, and/or Functions
Question Enter the number of 911 Authorities within your State that have awarded a contract of the system components and/or functions procured in 3.2.2.3 either during this survey year or earlier.
Definition This data element is the sub-State counterpart to the data element 3.2.2.5, and speaks to similar regional and local effort. The number involved is calculated against the total number of 911 Authorities in a State, as reported in Section 3.1.2.3.
Table 49. Number of 911 Authorities that have Awarded a Contract for NG911
State Response State Response MN 100 IL 15 ND 100 SC 10 PR 100 NC 6 TN 100 TX 5 UT 80 VA 3 KY 19 IN 1
No Contract Awarded: AL, AR, AZ, CA, CO, CT, ID, KS, MA, MD, ME, MI, MT, NE, NH, NJ, NM, OH, OR, PA, WA
Unknown: AK, DC, FL, GA, HI, IA, OK, SD, WI Did Not Report Data: AS, DE, GU, LA, MP, MS, MO, NV, NY, RI, UM, VI, VT, WV, WY
2015 Finding Of all U.S. States and territories:
• 4 of 42 reporting States have awarded a contract• 8 of 42 reporting States have marginally awarded a contract• 21 of 42 reporting States have not awarded a contract• 9 of 42 reporting States are “unknown” – State did not respond to this data element
Dataset Shift • 2014 Finding: 5 of 39 reporting States had awarded a contract• 2014 Finding: 7 of 39 reporting States had marginally awarded a contract• 2014 Finding: 16 of 39 reporting States had not awarded a contract• 2014 Finding: 11 of 39 reporting States were “unknown” – State did not respond to this data
element
61

2015 National 911 Progress Report Data Element Responses
3.2.2.7: Statewide Installation and Testing
Question Has the NG911 part, function, and/or component defined in 3.2.2.3 been installed/deployed and tested at the State level, regardless of when the part, function, and/or component was installed and tested?
Definition This data element specifically relates to the contract detail identified above, and solicits a “yes” or “no” response (i.e., it is asking reporting States to indicate whether the NG911 part, function, and/or component involved has been installed/deployed and tested), regardless of when the part, function, and/or component was installed and tested. From that, a list of States that reported they have met this milestone can be generated.
26%
69%
5%
Figure 14. Statewide Installation and Testing
Yes
No
Unknown
Table 50. Statewide Installation and Testing
RESPONSE STATE
No
Did Not Report Data 2015 Finding
Of all U.S. States and territories:
• 11 of 42 reporting States have installed/deployed and tested• 29 of 42 reporting States have not installed/deployed and tested• 2 of 42 reporting States are “unknown” – State did not respond to this data element
Dataset Shift • 2014 Finding: 9 of 39 reporting States had installed/deployed and tested• 2014 Finding: 27 of 39 reporting States had not installed/deployed and tested• 2014 Finding: 3 of 39 reporting States are “unknown” – State did not respond to this data element
62
Yes AL, CA, CT, IN, ME, MN, ND, PR, TN, UT, WA
AK, AR, AZ, CO, DC, GA, HI, IA, ID, IL, KS, KY, MA, MD, MI, MT, NC, NE, NH, NJ, NM, OH, OK, OR, PA, SC, TX, VA, WI FL, SD
AS, DE, GU, LA, MP, MS, MO, NV, NY, RI, UM, VI, VT, WV, WY
Unknown

2015 National 911 Progress Report Data Element Responses
3.2.2.8: Number of Sub-State 911 Authorities Statewide that Have Installed and Tested These System Components and/or Functions
Question Enter the number of 911 Authorities within your State that have installed/deployed and tested the components and/or functions defined in 3.2.2.3.
Definition This is the sub-State counterpart to data element 3.2.2.7, and speaks to similar regional and local effort. The number involved is calculated against the total number of 911 Authorities in a State, as reported in Section 3.1.2.3.
Table 51. Number of Sub-State 911 Authorities that Have Installed and Tested System Components and Functions
State Response State Response MN 100 IL 17 AL 86 CA 8 TN 75 SC 5 IN 31 VA 3 KY 22 AK 2 UT 20 TX 2
No Installation and Testing: AR, AZ, CO, CT, DC, ID, KS, MA, MD, ME, MI, MT, NC, ND, NE, NH, NJ, NM, OH, OR, PA, PR, WA Unknown: FL, GA, HI, IA, OK, SD, WI Did Not Report Data: AS, DE, GU, LA, MP, MS, MO, NV, NY, RI, UM, VI, VT, WV, WY
2015 Finding Of all U.S. States and territories:
• 1 of 42 reporting States has installed/deployed and tested • 11 of 42 reporting States have marginally installed/deployed and tested • 23 of 42 reporting States have not installed/deployed and tested • 7 of 42 reporting States are “unknown” – State did not respond to this data element Dataset Shift • 2014 Finding: 2 of 39 reporting States had installed/deployed and tested • 2014 Finding: 8 of 39 reporting States had marginally installed/deployed and tested • 2014 Finding: 20 of 39 reporting States had not installed/deployed and tested • 2014 Finding: 9 of 39 reporting States were “unknown” – State did not respond to this data element
63

2015 National 911 Progress Report Data Element Responses
3.2.2.9: Data Element Sub-Group: Agreements (Capacity and Service Level) that Have/Have Not Been Reached with Originating Service Providers
3.2.2.9.1: List of (Capacity and Service Level) that Have Been Reached with Telecommunications Carriers/Providers
Question Provide a list of service providers that have executed agreements with your State. Enter information with comma or carriage returns below.
Definition The data element asks reporting States to provide a list of service providers with whom signed agreements have been reached for each State (or appropriate jurisdiction), where such agreements are necessary to ensure consistent and reliable NG911 service.
Table 52. List of Service Providers that Have Executed Agreements with Each Responding State
State Response
AL All wireless service providers serving Alabama, Alabama Supercomputer Authority, Bandwidth.com Inc., Auburn University Montgomery
CA AT&T, Verizon, AT&T Mobility, Verizon Wireless
CO None. Currently, all 911 service to PSAPs is handled by CenturyLink, which has service level agreements in their 911 tariff, but that tariff does not address NG911.
CT Single State Provider A&T - one contract, Fiber Provider: Fibertech, Network Manager: State of CT, Dept. of Administrative Services (SLA).
DC Verizon
IA State has had a contract with TCS since June 2010 for a statewide NG911 ESInet. State has had a contract with GeoComm since February 2014 for statewide GIS data layer development
IN AT&T, INdigital Telecom MA General Dynamics Information Technology MD GeoComm, TeleCommunications Systems, Inc. MI Peninsula Fiber Network
MN There are too many service providers to list, but to the best of our knowledge, we have an agreement with all service providers doing business in the State of Minnesota.
ND CenturyLink, Dakota Carrier Network
PR The following wireless companies completed the deployment of text to 9-1-1 services to their clients within the Puerto Rico jurisdiction during 2014: AT&T, Sprint, T-Mobile and OpenMobile. The last company to do so will be Claro. They completed the deployment in July 2015.
64

2015 National 911 Progress Report Data Element Responses
State Response TN AT&T TX AT&T, Intrado, TCS UT CenturyLink, Intrado, TCS, Synergem, Direct Technologies, Emergency CallWorks, Frontier Communications, Motorola WA All regulated carriers and carriers with interconnect agreements operating within Washington State.
WI
In Wisconsin, the installation and maintenance of the 911 network in a given county are authorized by a contract that the county enters into with participating local exchange carriers. This contract specifies in detail the network design for the county 911 service, sets the amount of the 911 surcharge, and identifies the obligations of the parties to operate, maintain and repair the 911 network. Wis. Stat. § 256.35(3)(b)3. No agreements between a State agency and originating service providers exist.
None, N/A, or Unknown: AK, AR, AZ, FL, GA, HI, ID, IL, KS, KY, ME, MT, NC, NE, NH, NJ, NM, OH, OK, OR, PA, SC, SD, VA Did Not Report Data: AS, DE, GU, LA, MP, MS, MO, NV, NY, RI, UM, VI, VT, WV, WY
2015 Finding Of all U.S. States and territories:
• 18 of 42 reporting States submitted an extended response • 24 of 42 reporting States listed “none,” “N/A,” or are “unknown” – State did not respond to this data element Dataset Shift • 2014 Finding: 15 of 39 reporting States submitted an extended response • 2014 Finding: 24 of 39 reporting States listed “none,” “N/A,” or are “unknown” – State did not respond to this data element
65
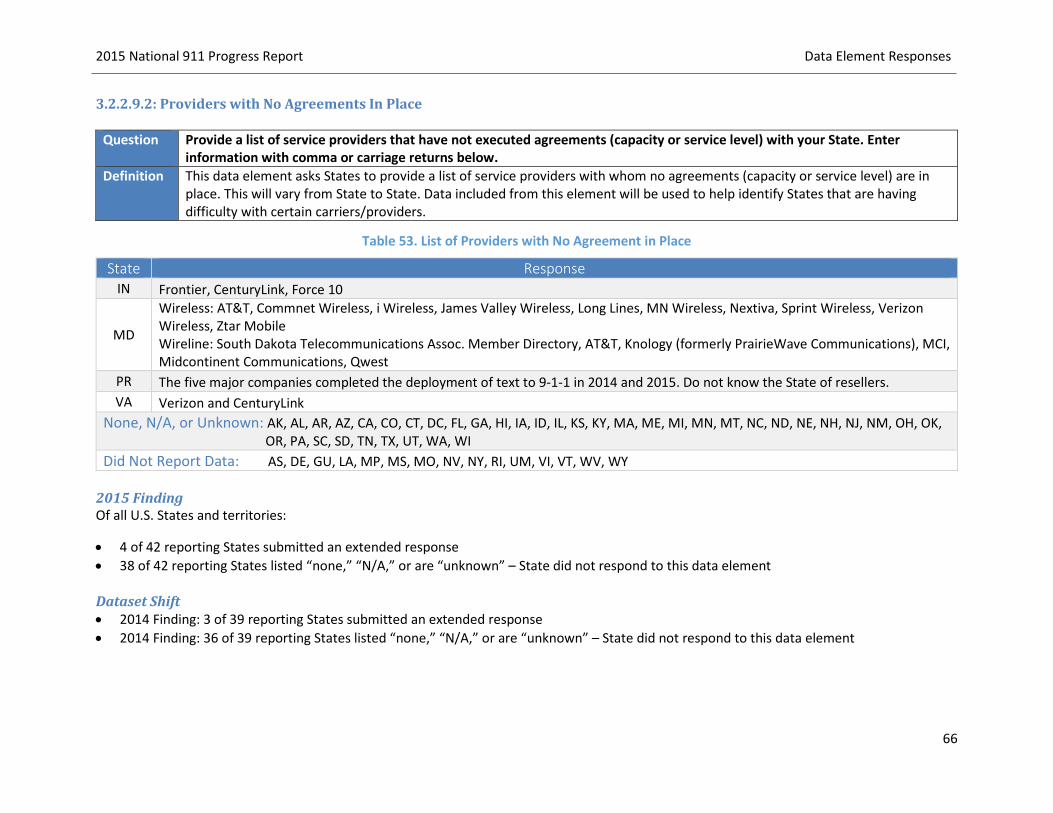
2015 National 911 Progress Report Data Element Responses
3.2.2.9.2: Providers with No Agreements In Place
Question Provide a list of service providers that have not executed agreements (capacity or service level) with your State. Enter information with comma or carriage returns below.
Definition This data element asks States to provide a list of service providers with whom no agreements (capacity or service level) are in place. This will vary from State to State. Data included from this element will be used to help identify States that are having difficulty with certain carriers/providers.
Table 53. List of Providers with No Agreement in Place
State Response IN Frontier, CenturyLink, Force 10
MD
Wireless: AT&T, Commnet Wireless, i Wireless, James Valley Wireless, Long Lines, MN Wireless, Nextiva, Sprint Wireless, Verizon Wireless, Ztar Mobile Wireline: South Dakota Telecommunications Assoc. Member Directory, AT&T, Knology (formerly PrairieWave Communications), MCI, Midcontinent Communications, Qwest
PR The five major companies completed the deployment of text to 9-1-1 in 2014 and 2015. Do not know the State of resellers. VA Verizon and CenturyLink
None, N/A, or Unknown: AK, AL, AR, AZ, CA, CO, CT, DC, FL, GA, HI, IA, ID, IL, KS, KY, MA, ME, MI, MN, MT, NC, ND, NE, NH, NJ, NM, OH, OK, OR, PA, SC, SD, TN, TX, UT, WA, WI Did Not Report Data: AS, DE, GU, LA, MP, MS, MO, NV, NY, RI, UM, VI, VT, WV, WY
2015 Finding Of all U.S. States and territories:
• 4 of 42 reporting States submitted an extended response • 38 of 42 reporting States listed “none,” “N/A,” or are “unknown” – State did not respond to this data element Dataset Shift • 2014 Finding: 3 of 39 reporting States submitted an extended response • 2014 Finding: 36 of 39 reporting States listed “none,” “N/A,” or are “unknown” – State did not respond to this data element
66

2015 National 911 Progress Report Data Element Responses
3.2.3: Data Element Group: Transition
3.2.3.1: Percentage of NG911 Authority Systems that Can Process and Interpret Location and Caller Information
Question Enter the percentage of NG911 authority systems that are capable of processing and interpreting location and caller information within your State.
Definition This data element reflects the percentage of 911 authority systems in each State that are capable of processing NG911 emergency calls for all service types (wireline, wireless, VoIP) using NG911 infrastructure (NG911 capable means infrastructure and geographic information systems [GIS]). Specifically, this is the percentage of total 911 authorities in a State that have implemented NG911 systems for all service types. Systems not being converted would not factor into this element.
Table 54. Percentage of NG911 Authority Systems that Can Process and Interpret Information
State Response (%) State Response (%) AL 100 TN 70 IA 100 CA 8
ME 100 NC 6 PA 100 SC 5 PR 100 IL 3.48 WA 100 VA 2.5 UT 80 TX 1
No Authority Systems: AK, AZ, CO, CT, DC, GA, ID, KS, KY, MA, MD, MI, MN, MT, ND, NE, NH, NJ, NM, OR, SD Unknown: AR, FL, HI, IN, OH, OK, WI Did Not Report Data: AS, DE, GU, LA, MP, MS, MO, NV, NY, RI, UM, VI, VT, WV, WY
2015 Finding Of all U.S. States and territories:
• 6 of 42 reporting States can 100% process and interpret location and caller information • 8 of 42 reporting States can marginally process and interpret location and caller information • 21 of 42 reporting States cannot process and interpret location and caller information • 7 of 42 reporting States are “unknown” – State did not respond to this data element Dataset Shift • 2014 Finding: 8 of 39 reporting States could process and interpret location and caller information
o These States were: AL, IA, IN, MN, PR, VI, VT, WA o IN chose not to respond this year; VI and VT did not participate in the survey this year
• 2014 Finding: 6 of 39 reporting States could marginally process and interpret information • 2014 Finding: 20 of 39 reporting States could not process and interpret location and caller
information • 2014 Finding: 5 of 39 reporting States were “unknown” – State did not respond to this data element
67

2015 National 911 Progress Report Data Element Responses
3.2.3.2: Percentage of the Total State Population Served by NG911 Capable Services
Question Enter the percentage of population receiving IP-delivered 911 calls within your State.
Definition Similar to data element 3.2.3.1, this element reflects the percentage of the population for a reporting State served by IP-capable 911 services meeting industry-accepted definitions for NG911.
Note, using NENA’s i3 standard alone is not the same as an NG911 system. The i3 standard only describes the network, components, and interfaces required to establish NG911 service. To deploy a “full function” NG911 system, States will need equipment and software vendors, access network providers, and originating service providers, all elements not included in the i3 standard.
Table 55. Percentage of State Population Served by NG911 Capable Services
State Response (%) State Response (%) IA 100 AK 20
ME 100 SC 10 PR 100 NC 6 TN 100 MI 3 UT 80 CA 2.16 WA 60 TX 2 IN 33 VA 1.73 KY 26 IL 1.53
No Population Served: AR, AZ, CO, CT, DC, GA, ID, KS, MA, MD, MN, ND, NE, NH, NJ, NM, OR, PA, SD Unknown: AL, FL, HI, MT, OH, OK, WI Did Not Report Data: AS, DE, GU, LA, MP, MS, MO, NV, NY, RI, UM, VI, VT, WV, WY
2015 Finding Of all U.S. States and territories:
• 4 of 42 reporting States have 100% population served by NG911 capable services• 12 of 42 reporting States marginally have population served by NG911 capable services• 19 of 42 reporting States do not have population served by NG911 capable services• 7 of 42 reporting States are “unknown” – State did not respond to this data element
Dataset Shift • 2014 Finding: 5 of 39 reporting States had 100% population served by NG911 capable services
o These States were: AL, IA, PR, VI, VTo AL chose not to respond this year; VI and VT did not participate in the survey this year
• 2014 Finding: 7 of 39 reporting States marginally had population served by NG911 capable services• 2014 Finding: 20 of 39 reporting States did not have population served by NG911 capable services• 2014 Finding: 7 of 39 reporting States were “unknown” – State did not respond to this data element
68

2015 National 911 Progress Report Data Element Responses
3.2.3.3: Percentage of the Geographical Area of a State Served by NG911 Capable Services
Question Enter the percentage of geographical area where PSAPs receive IP-delivered 911 calls within your State.
Definition Similar to data element 3.2.3.2, this data element specifically reflects the percentage of geographic area served (as opposed to population) by NG911 services. Data from this will help differentiate progress for those jurisdictions that have dense urban populations, and reflect IP-capable 911 services meeting industry-accepted definitions for NG911. They may be serving a large percentage of the population but may be serving a very small geographic portion of the State. This metric could indirectly help gauge progress for rural areas.
Table 56. Percentage of Geographical Area Served by NG911 Capable Services
State Response (%) State Response (%) IA 100 UT 15
ME 100 SC 10 PR 100 AK 8 TN 100 VA 5.45 WA 44.3 IL 4.76 CA 21.49 NC 1 MI 18 TX 0.01 KY 15
No Geo. Area Served: AR, AZ, CO, CT, DC, GA, ID, KS, MA, MD, MN, ND, NE, NH, NJ, NM, OR, PA, SD Unknown: AL, FL, HI, IN, MT, OH, OK, WI Did Not Report Data: AS, DE, GU, LA, MP, MS, MO, NV, NY, RI, UM, VI, VT, WV, WY
2015 Finding Of all U.S. States and territories:
• 4 of 42 reporting States have 100% geographic area NG911 capable service • 11 of 42 reporting States marginally have geographic area NG911 capable service • 19 of 42 reporting States do not have geographic area NG911 capable service • 8 of 42 reporting States are “unknown” – State did not respond to this data element Dataset Shift • 2014 Finding: 5 of 39 reporting States had 100% geographic area NG911 capable service
o These States were: AL, IA, PR, VI, VT • 2014 Finding: 7 of 39 reporting States marginally had geographic area NG911 capable service • 2014 Finding: 21 of 39 reporting States did not have geographic area NG911 capable service • 2014 Finding: 6 of 39 reporting States were “unknown” – State did not respond to this data element
69

2015 National 911 Progress Report Data Element Responses
3.2.4: Data Element Group: Operations
3.2.4.1: ESInet Connected PSAPs
Question Enter the percentage of ESInet connected PSAPs in your State out of the total number of primary PSAPs in your State.
Definition This question is designed to track the progress of ESInet deployments and PSAP connectivity to ESInets for call delivery. This includes PSAPs that are receiving IP calls from an ESInet, but have a Legacy PSAP Gateway (LPG) converting the calls back into analog to be processed by the CPE.
Table 57. Percentage of ESInet Connected PSAPs
State Response (%) State Response (%) AL 100 TX 64.59 CT 100 PA 34 IA 100 IN 33
ME 100 KY 19 MN 100 CA 7.5 WA 100 SC 6 UT 80 MI 5 TN 75 IL 4.41 ND 68
No ESInet Connected PSAPs: AK, AR, AZ, CO, DC, GA, ID, KS, MA, MD, MT, NC, NE, NH, NJ, NM, OR, SD, VA Unknown: FL, HI, OH, OK, PR, WI Did Not Report Data: AS, DE, GU, LA, MP, MS, MO, NV, NY, RI, UM, VI, VT, WV, WY
2015 Finding Of all U.S. States and territories:
• 6 of 42 reporting States have 100% ESInet connected PSAPs • 11 of 42 reporting States marginally have ESInet connected PSAPs • 29 of 42 reporting States do not have ESInet connected PSAPs • 6 of 42 reporting States are “unknown” – State did not respond to this data element Dataset Shift This data element has been changed for 2015. The previous element and responses are as follows: Percentage of the planned NG911 Systems (as identified in the State’s NG911 Plan) that are operational for NG911 call-taking.
• 2014 Finding: 8 of 39 reporting States were operational for NG911 call-taking o These States were: AL, CT, IA, MN, PR, VA, VI, VT
• 2014 Finding: 5 of 39 reporting States were marginally operational for NG911 call-taking • 2014 Finding: 20 of 39 reporting States were not operational for NG911 call-taking • 2014 Finding: 6 of 39 reporting States were “unknown” – State did not respond to this data element
70
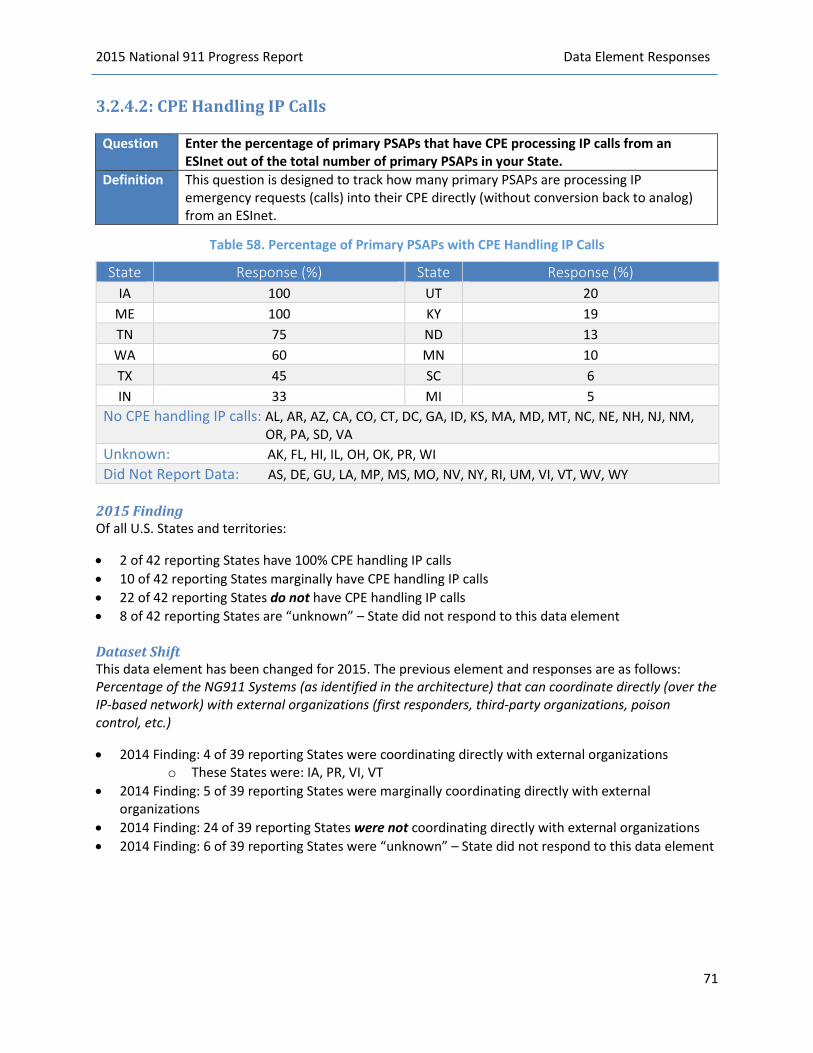
2015 National 911 Progress Report Data Element Responses
3.2.4.2: CPE Handling IP Calls
Question Enter the percentage of primary PSAPs that have CPE processing IP calls from an ESInet out of the total number of primary PSAPs in your State.
Definition This question is designed to track how many primary PSAPs are processing IP emergency requests (calls) into their CPE directly (without conversion back to analog) from an ESInet.
Table 58. Percentage of Primary PSAPs with CPE Handling IP Calls
State Response (%) State Response (%) IA 100 UT 20
ME 100 KY 19 TN 75 ND 13 WA 60 MN 10 TX 45 SC 6 IN 33 MI 5
No CPE handling IP calls: AL, AR, AZ, CA, CO, CT, DC, GA, ID, KS, MA, MD, MT, NC, NE, NH, NJ, NM, OR, PA, SD, VA Unknown: AK, FL, HI, IL, OH, OK, PR, WI Did Not Report Data: AS, DE, GU, LA, MP, MS, MO, NV, NY, RI, UM, VI, VT, WV, WY
2015 Finding Of all U.S. States and territories:
• 2 of 42 reporting States have 100% CPE handling IP calls • 10 of 42 reporting States marginally have CPE handling IP calls • 22 of 42 reporting States do not have CPE handling IP calls • 8 of 42 reporting States are “unknown” – State did not respond to this data element Dataset Shift This data element has been changed for 2015. The previous element and responses are as follows: Percentage of the NG911 Systems (as identified in the architecture) that can coordinate directly (over the IP-based network) with external organizations (first responders, third-party organizations, poison control, etc.)
• 2014 Finding: 4 of 39 reporting States were coordinating directly with external organizations o These States were: IA, PR, VI, VT
• 2014 Finding: 5 of 39 reporting States were marginally coordinating directly with external organizations
• 2014 Finding: 24 of 39 reporting States were not coordinating directly with external organizations • 2014 Finding: 6 of 39 reporting States were “unknown” – State did not respond to this data element
71

2015 National 911 Progress Report Data Element Responses
3.2.4.3: Number of Operational ESInets Deployed within the State
Question Enter the total number of operational ESInets deployed within your State.
Definition The number of ESInets deployed and operational within the State that are delivering IP calls to primary PSAPs. NENA27 defines an ESInet as a managed IP network that is used for emergency services communications, and which can be shared by all public safety agencies. It provides the IP transport infrastructure upon which independent application platforms and core functional processes can be deployed, including, but not restricted to, those necessary for providing NG911 services. ESInets may be constructed from a mix of dedicated and shared facilities. ESInets may be interconnected at local, regional, State, federal, national, and international levels to form an IP-based inter-network (network of networks).
Table 59. Number of Operational ESInets Deployed within State
State Response State Response UT 4 IL 1 SC 3 ME 1 IA 2 MI 1 KY 2 MN 1 PA 2 ND 1 AL 1 OH 1 CA 1 TN 1 CT 1 TX 1 DC 1 WA 1
No ESInets Deployed: AK, AR, AZ, CO, GA, HI, ID, KS, MA, MD, MT, NE, NH, NJ, NM, OR, SD, VA Unknown: FL, IN, NC, OK, PR, WI Did Not Report Data: AS, DE, GU, LA, MP, MS, MO, NV, NY, RI, UM, VI, VT, WV, WY
2015 Finding Of all U.S. States and territories:
• 5 of 42 reporting States have 2 or more operational ESInets deployed • 13 of 42 reporting States have at least 1 operational ESInet deployed • 18 of 42 reporting States do not have ESInet connected PSAPs • 6 of 42 reporting States are “unknown” – State did not respond to this data element Dataset Shift This data element is a new addition to the Profile Database Progress Report. There is no dataset shift.
27 NENA Master Glossary of 911 Terminology, NENA ADM-000.17, September 9, 2013, p. 98, http://c.ymcdn.com /sites/www.nena.org/resource/collection/625EAB1D-49B3-4694-B037-8E854B43CA16/NENA-ADM-000.17_Master_Glossary_20130909.pdf.
72

2015 National 911 Progress Report Data Element Responses
3.2.4.4: Percentage of the Master Street Address Guide (MSAG) to Geographic Information System (GIS) Data Synchronization Progress
Question Enter the percentage of address authorities within your State that have geocoded their addresses to a GIS ready format.
Definition The percentage of all the civic addresses in the State that have been geocoded into geospatial points. This occurs by synchronizing the Master Street Address Guide (MSAG) civic addresses to a geographic information system (GIS) geospatial database of road centerlines, site / structure locations, and related spatial databases.
Converting civic addresses into GIS information enables NG911 systems to geospatially route calls and is necessary for other NG911 services.
Table 10. Percentage of Addresses that are Geocoded
State Response (%) State Response (%) DC 100 ND 90 IN 100 UT 90
ME 100 KS 51.28 TN 100 WA 50 CT 99 TX 35 MA 99 MN 5
No Geocoded Addresses: AZ, MI, MT, NE, NH, NJ, NM, OR, PA, SC, SD Unknown: AK, AL, AR, CA, CO, FL, GA, HI, IA, ID, IL, KY, MD, NC, OH, OK, PR, VA, WI Did Not Report Data: AS, DE, GU, LA, MP, MS, MO, NV, NY, RI, UM, VI, VT, WV, WY
2015 Finding Of all U.S. States and territories:
• 4 of 42 reporting States have 100% geocoded addresses• 4 of 42 reporting States have 90-99% geocoded addresses• 4 of 42 reporting States have 5-51% geocoded addresses• 11 of 42 reporting States do not have geocoded addresses• 19 of 42 reporting States are “unknown” – State did not respond to this data element
Dataset Shift This data element is a new addition to the Profile Database Progress Report. There is no dataset shift.
73
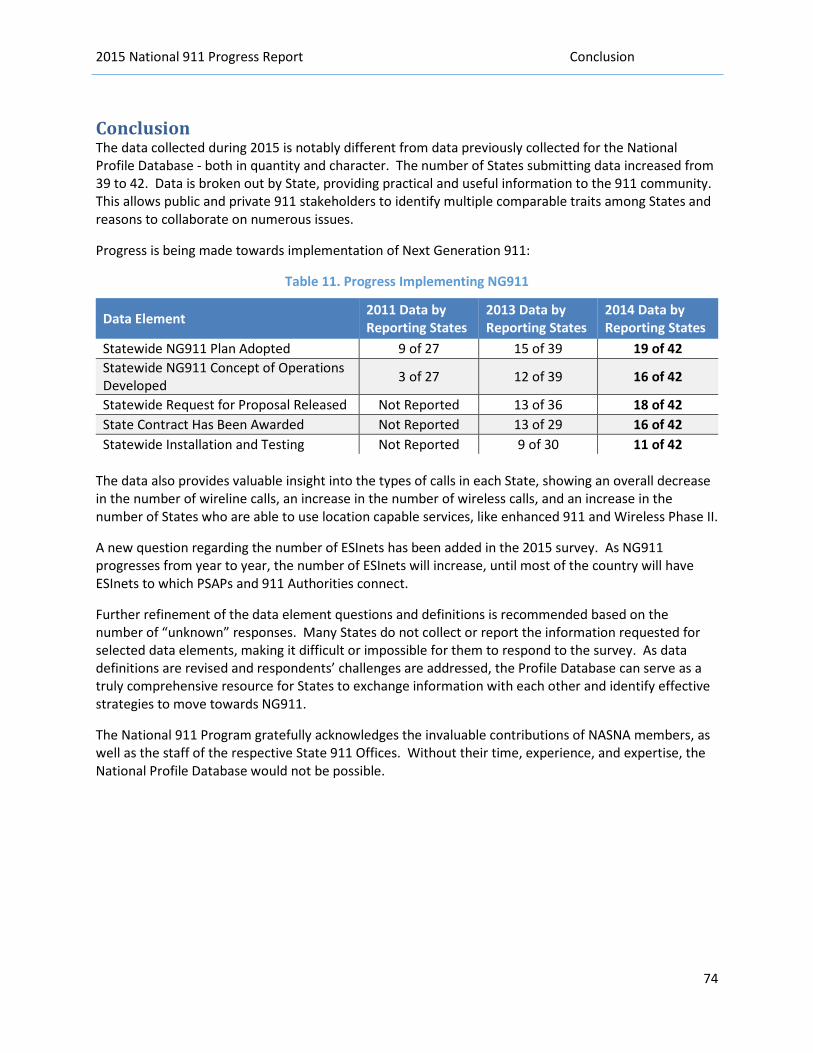
2015 National 911 Progress Report Conclusion
Conclusion The data collected during 2015 is notably different from data previously collected for the National Profile Database - both in quantity and character. The number of States submitting data increased from 39 to 42. Data is broken out by State, providing practical and useful information to the 911 community. This allows public and private 911 stakeholders to identify multiple comparable traits among States and reasons to collaborate on numerous issues.
Progress is being made towards implementation of Next Generation 911:
Table 11. Progress Implementing NG911
Data Element 2011 Data by Reporting States
2013 Data by Reporting States
2014 Data by Reporting States
Statewide NG911 Plan Adopted 9 of 27 15 of 39 19 of 42 Statewide NG911 Concept of Operations Developed 3 of 27 12 of 39 16 of 42
Statewide Request for Proposal Released Not Reported 13 of 36 18 of 42 State Contract Has Been Awarded Not Reported 13 of 29 16 of 42 Statewide Installation and Testing Not Reported 9 of 30 11 of 42
The data also provides valuable insight into the types of calls in each State, showing an overall decrease in the number of wireline calls, an increase in the number of wireless calls, and an increase in the number of States who are able to use location capable services, like enhanced 911 and Wireless Phase II.
A new question regarding the number of ESInets has been added in the 2015 survey. As NG911 progresses from year to year, the number of ESInets will increase, until most of the country will have ESInets to which PSAPs and 911 Authorities connect.
Further refinement of the data element questions and definitions is recommended based on the number of “unknown” responses. Many States do not collect or report the information requested for selected data elements, making it difficult or impossible for them to respond to the survey. As data definitions are revised and respondents’ challenges are addressed, the Profile Database can serve as a truly comprehensive resource for States to exchange information with each other and identify effective strategies to move towards NG911.
The National 911 Program gratefully acknowledges the invaluable contributions of NASNA members, as well as the staff of the respective State 911 Offices. Without their time, experience, and expertise, the National Profile Database would not be possible.
74