national heart failure audit - ucl · pdf filebritish society for heart failure ... national...
TRANSCRIPT

Title
1 National Heart Failure Audit April 2013-March 2014
NATIONAL HEART
FAILURE AUDIT
APRIL 2013 - MARCH 2014
BRITISH SOCIETY FOR HEART FAILURE

2 National Heart Failure Audit April 2013-March 2014
AcknowledgmentsThe National Heart Failure Audit is managed by the National Institute for Cardiovascular Outcomes Research (NICOR), which is part of the National Centre for Cardiovascular Prevention and Outcomes, based at University College London. The National Heart Failure Audit is commissioned by the Healthcare Quality Improvement Partnership (HQIP) as part of the National Clinical Audit and Patient Outcomes Programme (NCAPOP). The Heart Failure Audit is one of the largest and oldest audits within the NICOR portfolio.
The National Heart Failure Audit was established in 2007. The BSH, with Theresa McDonagh, Henry Dargie and John Cleland, drove this initiative including developing the original audit dataset. Specialist clinical knowledge and leadership is provided by the British Society for Heart Failure (BSH) and the audit’s clinical lead, Professor Theresa McDonagh. The current strategic direction and development of the audit is determined by the audit Steering Group. This includes major stakeholders in the audit, including cardiologists, the BSH, heart failure specialist nurses, clinical audit and effectiveness managers, cardiac networks, patients, NICOR managers and developers, and HQIP. See Appendix A for current Steering Group membership.
We would especially like to thank the contribution of all NHS Trusts, Welsh Heath Boards and the individual nurses, clinicians and audit teams who collect data and participate in the audit. Without this input the audit could not continue to produce credible analysis, or to effectively monitor and assess the standard of heart failure care in England and Wales.
Published on 20 October 2015. The HF Audit report is usually published ahead of the annual, autumn, meeting of the BSH to ensure maximum impact and dissemination of the findings. This report has been delayed because of difficulties accessing the HES data in a timely fashion for the year 2013-2014.
The contents of this report may not be published or used commercially without permission.
This report is available online at www.ucl.ac.uk/nicor/audits/heartfailure/reports. Hospital level tables are also published on http://data.gov.uk. Participation analysis is published at http://www.hqip.org.uk/parcar/.
Please contact [email protected] for further information about the report.
National Heart Failure AuditNational Institute for Cardiovascular Outcomes Research (NICOR) Institute of Cardiovascular Science, University College London2nd Floor, Nomura House, 1 St. Martin’s Le Grand, London EC1A 4NP
Tel: 0203 108 3929Email: [email protected]
NICOR (National Institute for Cardiovascular Outcomes Research) is a partnership of clinicians, IT experts, statisticians, academics and managers which manages six cardiovascular clinical audits and four clinical registers. NICOR analyses and disseminates information about clinical practice in order to drive up the quality of care and outcomes for patients.
The British Society for Heart Failure (BSH) is a national organisation of healthcare professionals which aims to improve care and outcomes for patients with heart failure by increasing knowledge and promoting research about its diagnosis, causes and management.
The Healthcare Quality Improvement Partnership (HQIP) is led by a consortium of the Academy of Medical Royal Colleges, the Royal College of Nursing and National Voices. Its aim is to promote quality improvement, and in particular to increase the impact of clinical audit in England and Wales. HQIP hosts the contract to manage and develop the National Clinical Audit and Patient Outcomes Programme (NCAPOP). The programme comprises 40 clinical audits that cover care provided to people with a wide range of medical, surgical and mental health conditions.
Founded in 1826, UCL (University College London) was the first English university established after Oxford and Cambridge, the first to admit students regardless of race, class, religion or gender, and the first to provide systematic teaching of law, architecture and medicine. It is among the world’s top universities, as reflected by performance in a range of international rankings and tables. UCL currently has 24,000 students from almost 140 countries, and more than 9,500 employees. Its annual income is over £800 million.
This report was written and compiled by Polly Mitchell, Damian Marle, Akosua Donkor, Aminat Shote, Theresa McDonagh, Suzanna Hardman, Henry Dargie, John Cleland, with input from the National Heart Failure Audit Steering Group. See Appendix A for current Steering Group membership.
Data cleaning and analysis was carried out by Aminat Shote. Data extraction and linkage was carried out by Marion Standing and Andrew Harrison.
Authors
3National Heart Failure Audit April 2013-March 2014
Tel: 0203 108 3929Email: [email protected]
National Heart Failure Audit
April 2013 - March 2014
The seventh annual report for the National Heart Failure Audit presents findings and recommendations based on patients with an unscheduled admission to hospital, who were discharged or died with a primary diagnosis of heart failure between 1 April 2013 and 31 March 2014. The report covers all NHS Trusts in England and Health Boards in Wales that admit patients with acute heart failure.
The report is aimed at all those involved in collecting data for the National Heart Failure Audit, including those involved in collecting data for the National Heart Failure Audit, as well as clinicians, hospital chief executives, managers, clinical governance leads commissioners, patient groups and many others. The report includes clinical findings at national and local levels and patient outcomes.

4 National Heart Failure Audit April 2013-March 2014
1. Foreword 5
2. Summary 6 2.1 National Heart Failure Audit 6
2.2 Findings 6
2.2.1 Participation and case ascertainment 6
2.2.2 Demographics 6
2.2.3 Hospitalisation 7
2.2.4 Diagnosis 7
2.2.5 Treatment 7
2.2.6 Monitoring and follow-up 7
2.2.7 Hospital level analysis 7
2.2.8 Mortality 8
2.2.9 Differences between England and Wales 8
3. Recommendations 9 3.1 NICE guidelines 9
3.2 Data quality 9
3.3 Clinical coding of heart failure 9
3.4 Specialist input into care 9
3.5 Therapeutic treatment on discharge 9
4. Introduction 10 4.1 Heart failure 10
4.2 The National Heart Failure Audit 10
4.3 Audit governance 10
4.4 Dataset 11
4.5 Scope and methodology 11
4.6 Data collection and IT 11
4.7 Reporting 11
4.8 Use of audit data 12
4.9 Analysis 12
5. National findings 13 5.1 Data cleaning and data quality 13
5.2 Participation 13 5.2.1 Number of records 13
5.2.2 Case ascertainment 13
5.2.3 Diagnosis of heart failure 14
5.3 Hospital care 14 5.3.1 Main place of care 14
5.3.2 Specialist care 14
5.3.3 Length of stay 15
5.4 Demographics 16 5.4.1 Age 16
5.4.2 Age and gender 16
5.4.3 Index of multiple deprivation 16
5.5 Aetiology and comorbidity 17
5.6 Diagnosis 18
5.6.1 Echo 18
5.6.2 Echo diagnosis 18
5.7 Treatment on discharge for LVSD 19
5.8 Monitoring and follow-up 21
5.9 Outcomes 22 5.9.1 Mortality measures 22
5.9.2 In-hospital death 23
5.9.3 Trends in in-hospital death 24
5.10 Post discharge mortality rates 24 5.10.1 30-day mortality 24
5.10.2 One-year mortality (2013/14) 27
5.10.3 Five-year mortality (2009-14) 31
6. Hospital-level analysis 34 6.1 Participation and case ascertainment 34 6.1.1 Participation and case ascertainment in England 34
6.1.2 Participation and case ascertainment in Wales 43
6.2 Clinical practice analysis 44 6.2.1 In-hospital care in England 44
6.2.2 Treatment and management on discharge in England 52
6.2.3 In-hospital care in Wales 66
6.2.4 Treatment and management on discharge in Wales 67
7. Appendices 69
8. Glossary 70
9. References 72
Contents

5National Heart Failure Audit April 2013-March 2014
Title
Of all of the health concerns of the general public, cancer probably ranks the highest. Yet heart failure is more likely to strike them than cancer, untreated heart failure has a worse prognosis than most cancers, heart failure patients do not all enjoy the right to a specialist consultation within two weeks, and heart failure costs the NHS more than cancer. Heart failure outcomes need not be as poor as they are and there is a long way to go before heart failure care matches the quality and consistency of care that cancer patients receive.
In spite of this it is heartening to see the National Heart Failure Audit demonstrating that care has improved steadily in the years since the audit began. Care is better as greater use is made of evidence-based treatments, as prescription of ACE inhibitors, beta blockers & MRAs becomes commonplace and as more people are having their care delivered by a specialist Multi-Disciplinary Team (MDT). However, overall mortality this year is flat and there are challenges ahead.
The ageing population and constrained budgets will continue to increase the pressure on service delivery. As a heart failure patient I see the answer in a more ruthless use of the evidence base, including optimal titration of patients on the key agents; and for every patient to be treated on a cardiology ward under the care of an MDT. The fearless holding of patients in hospital until they are ready to be discharged will reduce the yo-yoing of patients into readmission, and the use of rehabilitation with an educational component will help patients become experts in their own condition and reduce the burden on the health service.
As more care is moved into the community, so a greater integration of GPs and Heart Failure Nurse Specialists into the MDT will further elevate the quality of care. In England, such integration will benefit GPs as the commissioners and deliverers of long-term care.
In summary, I am eternally grateful for the care that I received when I was diagnosed and I want to see clinicians continue their drive for ever-improving heart failure care so that it compares with cancer treatment. I also want to see Chief Executives give clinicians the space to deliver optimal care, with its higher up-front costs but lower long-term costs as patients enjoy their lives with their families rather than coming back into hospital.
Richard Mindham Patient Representative, National Heart Failure Audit Steering Group
1 Foreword

Title
6 National Heart Failure Audit April 2013-March 2014
2.1 National Heart Failure AuditThe National Heart Failure Audit was established in 2007 to understand contemporary practice with the aim of helping clinicians improve the quality of heart failure services and to achieve better outcomes for patients. The audit aims to capture data on clinical indicators which have a proven link to improved outcomes, and to encourage the increased use of clinically recommended diagnostic tools, disease modifying treatments and referral pathways.
The audit is funded and commissioned by the Healthcare Quality Improvement Partnership (HQIP) as part of their National Clinical Audit and Patient Outcomes Programme (NCAPOP). IT development, statistical analysis and project management is provided by the National Institute for Cardiovascular Outcomes Research (NICOR), which is based in the Institute of Cardiovascular Science at University College London. The British Society for Heart Failure (BSH) provides clinical direction to the audit, with Professor Theresa McDonagh, Consultant Cardiologist at King’s College Hospital, acting as the clinical lead.
The National Heart Failure Audit aims to collect data on every unscheduled admission to hospital due to heart failure, in England and Wales. These patients should all receive a coded primary diagnosis of heart failure, and numbers submitted to the audit are compared with the discharge coded episodes for heart failure. Eligible hospitals are thus those sites with unscheduled heart failure admissions. This report covers all records submitted to the audit where the date of discharge is between 1 April 2013 and 31 March 2014.
2.2 FindingsThe National Heart Failure Audit for the year 2013/14 is the most comprehensive yet, with a 25% increase in data submission, yet reports very similar in-hospital and one-year mortality outcomes for people admitted to hospital with acute heart failure during the 2013/14 audit cycle to those previously reported for the 2012/13 cohort. This reflects improved prescribing rates of disease modifying therapies (see below), alongside specialist input. These findings cannot be attributed to any noteworthy difference in the age, co-morbidities or disease severity of patients across the two years but reflect better adherence to NICE and other guidelines.
Mortality rates remain variable, reflecting the diversity of clinical care alongside patient characteristics. Good clinical management by heart failure and cardiology specialists continues to result in significantly better outcomes for patients; mortality is reduced in hospital and in the month following discharge for those patients receiving this care. Furthermore, the cumulative analyses again demonstrate that the quality of care during an index admission continues to confer noticeable mortality benefit for some years following discharge.
Increasing the standard of care depends on healthcare professionals, improvement groups and commissioners using audit data to monitor performance, encourage progress, and ensure adequate provision of acute hospital heart failure care. Hospitals will also find reviewing their own audit data is a powerful tool to change and to improve practice.
The data from the HF audit has been used to model acute HF care and alongside randomised controlled trails has informed the most recent NICE Acute HF Guidance (2014), which we anticipate translating into further improvements in acute HF care in the ensuing years.
2.2.1 Participation and case ascertainment
Between April 2013 and March 2014, all 143 eligible NHS Trusts in England and all six eligible Health Boards in Wales submitted data to the audit. In England 193 out of 195 hospitals submitted data (99%), and in Wales 16 out of 17 hospitals took part (94%).
Table 1: Records submitted and case ascertainment in 2013/14
Region Records submitted (n)
HES/PEDW primary HF discharges (n)
Case ascertainment (%)
Overall 54654 63941 85
England 51428 59820 86
Wales 3226 4121 76
To date the National Heart Failure Audit has collected and analysed data on 240,710 acute heart failure admissions (from October 2006 to March 2014). The current audit cycle is the most comprehensive to date with 55,040 acute HF admissions leaving hospital between 1 April 2013 and 31 March 2014. After data cleaning and exclusion of invalid records, the total number of records is 54,654. This is an increase of 25% from the 43,894 admissions recorded in 2012/13. This was made up of 51,428 from English hospitals and 3,226 from Welsh hospitals.
The audit represents 85% of all heart failure coded discharges or deaths in England and Wales. This comprises 51,428 heart failure admissions in England, 86% of the 59,820 patients coded as heart failure in Hospital Episode Statistics (HES), and 3,226 admissions in Wales, representing 76% of the 4,121 total recorded by the Patient Episode Database for Wales (PEDW).
2.2.2 Demographics
The patients’ median age was 80 years; 67% were over 75 years. The median age at admission was almost 5 years greater in women compared to men, and approximately 5 years lower in the most socio-economically deprived quintile compared to those in the least deprived group.
2 Summary

7National Heart Failure Audit April 2013-March 2014
Many patients had multiple co-morbidities – almost half had ischaemic heart disease, over half had hypertension, and a quarter had both. Myocardial infarction, arrhythmia and diabetes were also very common. Approximately 80% of patients were breathless on minimal exertion or at rest at first admission, and roughly 50% exhibited moderate or severe peripheral oedema.
The demographics of the patients in the 2013/14 audit cycle are very similar to those recorded last year, suggesting the audit is being implemented in a consistent fashion. Given the advanced age, disease burden, complex health issues, and the increased number of patients with these multiple co-morbidities, the reported maintenance in survival this year is particularly remarkable.
2.2.3 Hospitalisation
Half of the patients in the audit were treated on cardiology wards, 40% on general medical wards, and 11% on other wards, which includes care of the elderly (COTE). Men and younger patients were more likely to be treated on a cardiology ward.
60% of patients were seen by a consultant cardiologist, 19% by a heart failure nurse specialist, 5% by any other consultant with specialist skills for heart failure management, and, overall, 78% of patients were seen by one of more of the above heart failure specialists. Of those patients not treated on a cardiology ward, only a quarter were seen by a consultant cardiologist, though about 60% of these patients saw one or more clinicians from the specialist heart failure team.
The mean length of stay was 12 days, and the median stay was 8 days. Patients who received specialist input had longer lengths of stay than those receiving no specialist input into their management. Heart failure specialists appear more rigorous in ensuring patients receive optimal care and are stable prior to discharge, which is expected to translate into better outcomes including fewer early readmissions to hospital and a lower mortality.
2.2.4 Diagnosis
99% of patients received an electrocardiogram (ECG), and 91% had an imaging test of heart function, usually an echocardiogram (echo). Most patients (70%) had left ventricular systolic dysfunction (LVSD); 28% of patients were diagnosed with valve disease, 10% with diastolic dysfunction and 7% with left ventricular hypertrophy. These diagnoses are not mutually exclusive. Women and older patients were less likely to have LVSD to explain their heart failure.
2.2.5 Treatment
Overall prescription rates for disease modifying treatments for those patients with heart failure due to left ventricular systolic dysfunction have improved when compared with those for 2012/13.
Most (85%) patients with LVSD, and without a stated contraindication, were prescribed an ACE inhibitor, or an ARB, which is at a comparable level to the previous year but in a larger cohort of patients, 85% were prescribed a beta blocker at discharge which compares with 82% last year, and 51% were prescribed an MRA compared with just 39% in the previous cohort. However, only 41% (22,408) of patients with LVSD were prescribed all three of these disease modifying drugs. Whilst this is an increase from 39% (17,119) of patients in 2012/13, and translates into a 5% (5,290 patients), relative increase in triple therapy, it is disappointing that the opportunity to modify outcomes in so many acute HF admissions has again been missed.
The patients with HF due to LVSD who leave hospital with a prescription of these drugs have far better outcomes than those who do not. Since the prescribing rates do not include patients for whom the therapies are contraindicated arguably the prescription rates for ACE inhibitor and beta blocker should be at or near 100%, with MRAs close behind. However, prior to publication of the 2014 first NICE Acute HF guidance, there has been scope for cynics to defer these treatments, notwithstanding the clear recommendations from the ESC in the updated 2012 HF guidance.
2.2.6 Monitoring and follow-up
Over half of the patients in the audit were referred for cardiology follow-up, and almost 60% were referred for follow-up with a heart failure nurse specialist, although only 10% of patients were referred to cardiac rehabilitation services. These data suggest improving service provision compared to previous audit years. Only 4% were formally referred to specialist palliative care services; however, as many aspects of palliative care are routinely delivered by members of the heart failure team this figure needs to be interpreted with care.
Patients treated on cardiology wards and those seen by heart failure specialists were more likely to receive referrals to heart failure follow-up services, which are shown to have a beneficial impact on outcomes.
2.2.7 Hospital level analysis
For hospitals that submitted at least 50 patient records to the audit, hospital-level analysis is published for ten clinical indicators. These analyses are published to allow hospitals to benchmark their practice against each other, and against the national average.
In 2013/14 50% of all records submitted to the audit by each hospital should have all of the mandatory fields completed, that is, with no ‘unknown’ values. In 2014/15, 70% of all records submitted by each hospital must meet this level of completeness.

8 National Heart Failure Audit April 2013-March 2014
2.2.8 Mortality
In-hospital mortality has been maintained at 9.5% in 2013/14.
Mortality rates for patients who survived to discharge in 2013/14 are similar to previous years.. The maintained level of survival matches the increased prescribing rates, treatment in specialist wards, and referral to heart failure follow-up services. We hope this improvement will be sustained or increase in future years.
Despite this, there is still significant variation in mortality rates dependent on the quality of treatment received by patients. For mortality, there is marked improvement associated with treatment in a cardiology ward and prescription of evidence-based therapies, seen not only in single-variable analysis, but also in multivariate analysis, when other confounding factors are taken into account.
Notably, in-hospital mortality stood at 7% for patients treated on cardiology wards, compared to 11% for those treated on general medical wards and 14% for patients treated on other wards.
6% of patients who survived to discharge died in the 30 days following discharge.
The audit encourages hospitals to regularly review their audit data, both in order to monitor and drive changes in clinical practice, and to ensure high data quality. As of April 2014, hospitals were expected to enter data on at least 70% of heart failure discharges, which ensures a more accurate picture of the variation in the treatment and management of heart failure at a hospital level.
2.2.9 Differences between England and Wales
Healthcare service provision was devolved to Wales in 1999, since then a number of significant changes have been made to the delivery of medical care in heart failure management between Wales and England. The organisation of healthcare in both countries has been subject to major reconfiguration and the infrastructure of cardiac services in Wales is different to England.
There are 2 cardiac networks in Wales (North and South), with 5 Health Boards within the South Wales Cardiac Network and 1 Health Board in the North Wales cardiac network.
All 6 eligible Welsh Health Boards submitted data to NHFA in 2013/14. There has been a clear year by year increase in the number of cases reported by Welsh centres since the NHFA began (figure 1).
Echocardiography and the use of prognostically beneficial medication (‘triple therapy’) in Wales for patients with LVSD based on NHFA data compares favourably with English data. However, access to Heart Failure Specialist Nurse care for these patients appears to be poorer; given the recognised
mortality and morbidity benefits associated with this service, this needs to be explored further and addressed.
With the continued support of the Welsh Cardiac networks and driven by the recently published Welsh Heart Disease Delivery plan which highlights the importance of cardiac audit, the Welsh Health Boards aim to increase their participation in the NHFA; ultimately leading to improved heart failure management in Wales.
Figure 1: Number of records submitted to the National Heart Failure Audit by Welsh hospitals (2010-14)
3500
3000
2500
2000
1500
1000
500
0 2010-’11 2011-’12 2012-’13 2013-’14
9National Heart Failure Audit April 2013-March 2014
3.1 NICE guidelinesThe National Heart Failure Audit supports the clinical indicators recommended by the National Institute for Health and Care Excellence (NICE) in its existing heart failure guidelines: ‘Chronic heart failure: Management of chronic heart failure in adults in primary and secondary care’ (CG108) and ‘Chronic heart failure quality standards’ (QS9), where these are applicable to acute heart failure admissions. The first NICE guideline on Acute Heart Failure (CG 187) was published in October 2014, and so implementation is not reflected in the current audit cycle.
3.2 Data qualityThe National Heart Failure Audit has developed a minimum data standard in an attempt to ensure the records submitted to the audit are fit for purpose. As the audit works towards developing a risk model over the next two years, the minimum data standard focuses on the core dataset and a reduction in the number of fields marked ‘unknown’. This will maximise the number of records that can be used in the risk model. NICOR will create an online tool to monitor compliance with the minimum data standard, to allow hospitals to keep track of
their progress.
3.3 Clinical coding of heart failureThe coding of heart failure continues to be problematic, and this year 9% of records were excluded if the patient did not have a confirmed diagnosis of heart failure, and did not have any clinical indication of heart failure. All acute patients with a discharge code indicating a diagnosis of heart failure should be included in the audit. This allows us to understand and report on the extent of the problems with clinical coding. If miscoded patients are identified, please discuss this with your local coding department as soon as the problem is identified.
3.4 Specialist input into carePatients should be treated on a cardiology ward whenever appropriate and possible.
When it is not possible, or other co-morbidities suggest a different specialist ward may be provide better care, patients should still receive input from a heart failure specialist – usually a consultant cardiologist or another consultant with
specific remit for heart failure patients.
3.5 Therapeutic treatment on dischargeA number of clinical guidelines advise on best practice in the treatment and management of heart failure. They consistently recommend a set of evidence-based therapies and disease management strategies.
These include using echocardiography to accurately diagnose heart failure; prescribing beta blockers, angiotensin converting enzyme (ACE) inhibitors, angiotensin receptor blockers (ARBs) and mineralocorticoid receptor antagonists (MRAs) for patients with heart failure due to left ventricular systolic dysfunction; and the involvement of specialist heart failure clinicians in the management of heart failure patients.
3 Recommendations

10 National Heart Failure Audit April 2013-March 2014
4.1 Heart failureHeart Failure is a complex clinical syndrome characterised by a malfunction of the pumping action of the heart which causes high filling pressures and/or reduced cardiac output. This commonly leads to fluid retention in the lungs, causing undue breathlessness even at rest, and swelling of the legs or ankles. Heart failure may have a major adverse effect on quality of life and more than a third of patients suffer from major depression.
Heart failure is caused by abnormalities in the structure and function of the heart, for example damaged heart tissue following a heart attack, cardiomyopathy (deterioration of the heart muscle), valve disease or high blood pressure. It is thought around 70% of all heart failure cases are caused by coronary heart disease. Cardiac dysrhythmia (irregular heartbeat) and kidney dysfunction often contribute to and complicate heart failure.
Depending on the definition applied, 1-2 million people in the UK suffer from heart failure, a number that will continue to rise due to an ageing population, improved survival rates following a heart attack, and more effective treatments. British Heart Foundation (BHF) statistics estimating the incidence and prevalence of heart failure in the UK, using Clinical Practice Research Datalink (CPRD) data, show both rise steeply with age.
Heart failure results in a large burden on the NHS, accounting for around one million inpatient bed-days – 2% of the NHS total – and 5% of all emergency hospital admissions.Survival rates for heart failure patients are variable, dependent on the age and severity of disease of the patient, and the quality of care they receive. Outcomes are consistently poor for patients who receive suboptimal care, but input from heart failure specialists and prescription of evidence-based heart failure therapies have a significant impact on prognosis and life expectancy. The National Heart Failure Audit has reported around one in ten patients dying in hospital, and of those who survive between one-quarter and one-third dying within the year of their admission. However these mortality rates are beginning to reduce, reflecting more consistent implementation of guidelines for recommended practice.
A number of clinical guidelines advise on the best practice for the treatment and management of heart failure they consistently recommend a set of evidence-based therapies and disease management strategies.
This includes using echocardiography to diagnose heart failure accurately; the prescription of beta blockers, angiotensin converting enzyme (ACE) inhibitors, angiotensin receptor blockers (ARBs) and mineralocorticoid receptor antagonists (MRAs) for patients with heart failure due to left ventricular systolic dysfunction (LVSD); and the involvement of specialist
heart failure clinicians in the management of heart failure patients, both in hospital and following discharge.
4.2 The National Heart Failure AuditClinical audit is a quality improvement process for healthcare practitioners and providers, which aims to enhance the care of patients by systematically reviewing medical practice against explicit criteria, modifying it where necessary.
The National Heart Failure Audit was established in 2007 with the aim of helping clinicians improve the quality of heart failure services and to achieve better outcomes for patients. The audit aims to capture data on clinical indicators which have a proven link to improved outcomes, and to encourage the increased use of clinically recommended diagnostic tools, disease modifying treatments and referral pathways.
Over the past seven years, having collected over 200,000 records, the audit has consistently shown that following existing clinical guidelines for best practice results in significantly better outcomes for patients. The clinical standards used by the National Heart Failure Audit include NICE Clinical Guidance for Chronic Heart Failure (2010), NICE chronic heart failure quality standards (2011), and European Society of Cardiology guidelines for the diagnosis and treatment of acute and chronic heart failure (2012). The audit dataset corresponds to these standards and is able to evaluate the implementation of these existing evidence-based recommendations by hospitals in England and Wales.
4.3 Audit governanceThe audit is funded and commissioned by the Healthcare Quality Improvement Partnership (HQIP) and, along with the five other NICOR audits, is one of around 35 audits in their National Clinical Audit and Patient Outcomes Programme (NCAPOP).
IT development, statistical analysis and project management is provided by the National Institute for Cardiovascular Outcomes Research (NICOR), which is based in the Institute of Cardiovascular Science at University College London.
The British Society for Heart Failure (BSH) provides clinical direction to the audit, with Professor Theresa McDonagh, Consultant Cardiologist at King’s College Hospital, acting as the clinical lead. The BSH is a professional society for clinicians and healthcare professionals with a specialism or interest in heart failure.
The audit’s development and strategy is determined by a Steering Group, which meets quarterly, and whose membership is made up of a variety of stakeholders in the audit, including cardiologists, specialist nurses, clinical audit and effectiveness managers, cardiac networks and patients. The full list of current Steering Group members can be found in appendix 1.
4 Introduction

11National Heart Failure Audit April 2013-March 2014
4.4 DatasetThe dataset covers the patient’s personal and demographic information, symptoms and signs on admission.
The dataset is regularly reviewed and updated to ensure it remains in line with contemporary guidance. In April 2014 the audit dataset was revised to cut down on data items not being used strictly for audit analysis, and to ensure the data collected are sufficient to calculate risk adjusted mortality. The current dataset, the paper pro forma to aid data collection, and a user guide, can be found on the NICOR website.
4.5 Scope and methodologyThe National Heart Failure Audit collects data on all patients with an unscheduled admission to hospital in England and Wales who are discharged with a coded primary diagnosis of heart failure. This is designated by the following ICD-10 codes:
• I11.0 Hypertensive heart disease with (congestive) heart failure
• I25.5 Ischaemic cardiomyopathy
• I42.0 Dilated cardiomyopathy
• I42.9 Cardiomyopathy, unspecified
• I50.0 Congestive heart failure
• I50.1 Left ventricular failure
• I50.9 Heart failure, unspecified
Patients admitted for elective procedures, for example elective pacemaker implantation or angiography, are not included. Patients must be over 18 to be eligible for inclusion in the audit.
Participation in the audit is mandated by NHS England’s NHS Standard Contracts for 2013/14 and 2014/15, and by the NHS Wales National Clinical Audit and Outcome Review Plan 2013/14.
In 2013/14, Trusts have been expected to include all patients discharged with a primary diagnosis of heart failure in the audit. As a minimum, 70% of heart failure admissions – as recorded by Hospital Episode Statistics (HES) in England or Patient Episode Database of Wales (PEDW) in Wales – must be included in the audit.
Although a large proportion of the treatment of heart failure occurs in the community, the National Heart Failure Audit currently only covers unscheduled admissions to hospital. Extension of the audit to primary care is under consideration, with a pilot project in the pipeline.
4.6 Data collection and ITAll data are submitted electronically by hospital into a protected central database via a secure online database. Each hospital user can access the NICOR data collection system and submit records, view, edit and export their existing records and view online analysis based on the data currently in the database.
NICOR has designed security mechanisms that allow only authorised users to access information on the NICOR data collection and reporting system. Users are only able to see records submitted by their own organisation and published information contains only comparative analysis figures. System security meets the requirements of the Ethics and Confidentiality Committee (ECC) of the National Information Governance Board (NIGB), which has granted UCL approval under section 251 of the NHS Act 2006 to process patient identifiable audit data.
Data can be inputted manually or imported from locally developed systems and third party commercial databases such as TOMCAT, PATS and DATACAM. Cardiology units may enter their data into the central audit database in three ways:
• Direct data entry using the online data entry form, either using the web portal or Lotus Notes.
• Uploading of electronic data (in CSV file format) from existing local IT systems, currently via Lotus Notes only.
An import facility will be implemented for the web-based application by the end of 2015.
User roles vary between hospitals but the personnel involved in collecting and inputting data tend to be Heart Failure specialist nurses, clinical audit leads and clinical effectiveness managers. The time taken to manually input the core data fields for an individual patient ranges between 5 and 20 minutes depending on the complexity of the case, the quality of the clinical notes and whether the patient is known to the heart failure team or not.
4.7 ReportingNICOR provides immediate feedback to each participating hospital on the quality of diagnosis, care and patient outcomes. This is in the form of online views which provide comparative information for each hospital about the quality of current activity against the national average, and regional and cardiac network (a collection of centres providing cardiac care within a particular geographical region) averages. These online views are currently available for all Lotus Notes users, and will be updated and made available for web portal users over the course of this contract period.
Hospitals can also export the data they submit to the database and can carry out local analysis on it.
12 National Heart Failure Audit April 2013-March 2014
5 National Findings
4.8 Use of audit dataHospital level analysis is currently published on data.gov.uk in csv format, which is publically accessible for use by any member of the public or regulatory body. The audit is currently part of NCAPOP and on the Quality Accounts list for 2014/15. Trusts must include their participation status in their Quality Account.
NICOR is currently in discussions with NHS England and Monitor about the development of a Best Practice Tariff for heart failure using National Heart Failure Audit data to evidence whether hospitals are employing good practice in the treatment and management of their heart failure patients. If the heart failure best practice tariff is chosen for inclusion in the 2015/16 best practice tariff list, participation in the audit (i.e. achieving the case ascertainment target set by the audit) and meeting a target for percentage of patients seen by a heart failure specialist is likely to be used as a measure of good practice in the first year.
4.9 AnalysisAll analyses presented were performed by the NICOR analysis team. Many aspects of the analyses, including data cleaning, recoding and validity checks, were run on a set of meta-data tables curated by the team. Data recodes are reviewed annually by the clinical lead to ensure the analyses are properly specified, transparent and reproducible.
Duplicate records were identified via the combination of patients’ pseudonymised NHS number, date of admission, and date of discharge. Where a duplicate is identified the most recently created record was retained for analyses. NHS numbers associated with more than one patient determined by additional fields such as age and gender were excluded as discrepant records; in addition, records with conflicting life status were excluded as discrepant records.
Mortality analyses used the index record in the analysis period and also excluded patients without an NHS number. It is not possible to identify an index record for the analytic period in order to link to mortality data and obtain the mortality status.
For almost all of the descriptive statistics presented, percentages were rounded to 0 decimal places. There were some analyses where percentage breakdowns add up to slightly more or less than 100%. This is not an error it is simply a consequence of rounding.

13National Heart Failure Audit April 2013-March 2014
5.1 Data cleaning and data qualityThe National Heart Failure Audit has collected 240,710 records of admissions to hospitals for heart failure between October 2006 and March 2014. 55,040 of these admissions had a discharge date between 1 April 2013 and 31 March 2014.
Table 2: Number of records excluded from analysis in 2013/14 analysis
Records excluded 2013/14 (n)
Records excluded 2006-14 (n)
Dataset Reason
11 60 Total (Admission + Readmission)
Missing or invalid hospital identifier
354 3082 Total (Admission + Readmission)
Duplicate records
9 140 Total (Admission + Readmission)
Discrepant patient identifier
12 4128 Total (Admission + Readmission)
Time to discharge <0
After data cleaning and exclusion of invalid records, the total number of records was 54,654.
Table 3: Number of records excluded from mortality analysis in 2013/14
Records excluded 1-year mortality analysis (n)
Records excluded 5-year mortality analysis (n)
Reason
1124 1535 No life status
388 1306 Time from discharge to follow-up either <0 or >longest possible interval
3236 6967 Missing NHS number
The total number of patients discharged with a confirmed diagnosis of heart failure in 2013/2014 was 48080. The total number of patients without a coded diagnosis of heart failure with breathlessness, oedema, and an echo dysfunction was 3263.
5.2 ParticipationIn 2013/14, 213 hospitals from 143 NHS Trusts in England and six Local Health Boards in Wales discharged patients with a coded diagnosis of heart failure according to HES and PEDW.
All of these institutions submitted data to the audit – the audit has therefore succeeded in meeting its target, recruiting 100% of Trusts and Health Boards for the first time. However three hospitals did not submit any data to the audit, two in England and one in Wales:
Scarborough General Hospital (York Teaching Hospital NHS Foundation Trust)
• Trafford General Hospital (Central Manchester University Hospitals NHS Foundation Trust)
• Ysbyty Ystrad Fawr (Aneurin Bevan Health Board)
In England, 103 of the 143 eligible institutions (72%) met the National Heart Failure Audit participation requirements of submitting more than 70% of their HES-recorded heart failure discharges. 70% was chosen as the cut-off point because this was the overall case ascertainment rate aimed for in the 2012/13 audit. A further 24 Trusts (17%) submitted between 50% and 70% of their HES figures.
In Wales five Health Boards (83%) met the participation requirements.
In 2014/15, Trusts are expected to include all patients discharged with a primary diagnosis of heart failure in the audit. A minimum of 70% of HES recorded heart failure discharges meeting the audit inclusion criteria will be accepted as a minimum.
5.2.1 Number of records
In 2013/14 the National Heart Failure Audit recorded 54,654 admissions to hospital with heart failure, following data cleaning. This is an increase of 25% from the 43,894 admissions recorded in 2012/13. This was made up of 51,428 from English hospitals and 3,226 from Welsh hospitals.
5.2.2 Case ascertainment
The total number of cases where a patient was discharged with a primary diagnosis of heart failure recorded by HES and PEDW in 2013/14 was 63,941. The National Heart Failure Audit therefore currently represents 85% of all emergency heart failure admissions in England and Wales. This represents 86% of the 59,820 HES-recorded heart failure discharges in England, and 76% of the 4,121 PEDW-recorded heart failure discharges in Wales.
The number of emergency admissions to hospital with a primary discharge diagnosis of heart failure recorded by HES and PEDW is very similar to last year. In 2012/13 the audit recorded a 59% case ascertainment out of 63,341 recorded discharges. PEDW numbers remain broadly similar (4,121 in 2012/13 v. 4,165 in 2013/14). Nonetheless, the number of records submitted to the audit has increased in both England and Wales since 2012/13.
In England records were submitted on a total of 51,428 heart failure admissions, 86% of the 59,820 patients with heart failure recorded by HES in 2013/14; in Wales 3,226 records were submitted to the audit, 76% of the 4,121 total reported by PEDW in 2013/14. This marks a vast improvement on the 47% case ascertainment recorded in Wales in 2012/13.
5 National findings

14 National Heart Failure Audit April 2013-March 2014
While the 2013/14 PEDW data used for case ascertainment is final, 2012/13 HES data is provisional as final HES data is not released until November. In 2011/12 the difference between the provisional data and the final Annual Refresh for HES Emergency Admission data was a 0.02% increase in the number of admissions. It was therefore deemed appropriate to use the provisional data as it offers a better comparator for case ascertainment than the final 2011/12 HES data. Participation and case ascertainment by hospital can be found in section 4.9 of this report.
5.2.3 Diagnosis of heart failure
Of the 54,654 patients in the 2013/14 audit, 4,859 (8.9%) were excluded from analysis in this report because the diagnosis of heart failure could not be confirmed despite having a heart failure clinical code given as their primary diagnosis on discharge.
The audit records whether a patient has been given a clinical diagnosis of heart failure as a way of determining the accuracy of the clinical coding of heart failure. A diagnosis of heart failure is defined by the audit as a diagnosis confirmed by imaging or brain natriuretic peptide (BNP) measurement either during the current admission or at a previous time. It is acknowledged that in some cases a clinician may justifiably diagnose heart failure in the absence of tests.
Patients with no clinical diagnosis of heart failure, those exhibiting either breathlessness or oedema on admission, who also had a recorded echo abnormality, were determined to have heart failure and were included in the audit. The remaining 4,859 patients were excluded from the analysis in this report on the basis they did not have heart failure. These records remain included in hospital participation and case ascertainment figures on the assumption they were coded as having heart failure on discharge from hospital.
5.3 Hospital care
5.3.1 Main place of care
As in previous years, around half of all patients were treated in a cardiology ward for the majority of their time in hospital (table 4). In addition to the 40% treated on general medical wards, 11% of patients were treated in other wards – this includes care of the elderly wards and any other specialist wards.
Table 4: Main place of care overall
Index admissions (%)
Readmission (%)
Cardiology ward 49 51
General medical ward 40 38
Other ward 11 12
Table 5: Main place of care by sex
Men (%) Women (%)
Cardiology ward 54 43
General medical ward 36 45
Other ward 10 13
Table 6: Main place of care by age
<75 years (%) ≥75 years (%)
Cardiology ward 63 42
General Medical ward 29 45
Other ward 8 13
Patients were more likely to be treated on a cardiology ward if male (table 5) and younger (table 6), men are admitted to hospital with heart failure at a younger age than women, therefore age may account for the apparent sex bias. Older heart failure patients with multiple co-morbidities may be treated on care of the elderly or generalist wards rather than specialist cardiology wards.
5.3.2 Specialist care
In April 2012 the audit added a number of new fields to its database. These included a more detailed assessment of the specialist input received by the patient. Over half of all patients were seen by a cardiologist on their index admission in 2013/14, approximately 20% were seen by a heart failure nurse specialist, and 6% were seen by another consultant with a specific remit for heart failure patients (table 7). Overall around 80% of patients were seen by a heart failure specialist in some capacity, both on first admission and on readmission.
The audit also records whether a patient was seen by a member of the heart failure multidisciplinary team (MDT). An MDT is a group of specialists which, in the case of heart failure, will be led by a consultant with an interest in heart failure, often a consultant cardiologist, and may include heart failure nurse specialists, pharmacists, dieticians, physiotherapists, psychologists and primary care physicians. The majority of patients in the audit were seen by a member of an MDT (table 7).

15National Heart Failure Audit April 2013-March 2014
Table 7: Overall specialist input
First admission (%)
Readmission (%)
Consultant cardiologist 60 63
Heart failure nurse specialist
19 18
Other consultant with interest in heart failure
5 5
Any HF specialist 78 80
Other clinician 27 26
Input from HF MDT 66 68
Table 8: HF specialist input by gender
Men (%) Women (%)
Consultant cardiologist 65 54
Heart failure nurse specialist
18 19
Other consultant with interest in heart failure
5 6
Any HF specialist 82 74
Other clinician 24 32
Input from HF MDT 69 62
Table 9: HF specialist input by age
<75 years (%) ≥75 years (%)
Consultant cardiologist 74 53
Heart failure nurse specialist
15 20
Other consultant with interest in heart failure
4 6
Any HF specialist 87 74
Other clinician 19 31
Input from HF MDT 73 62
Men were more likely to have input from a heart failure specialist, and by a cardiologist, than women (table 8). They were also more likely to have input into their management by a member of the MDT. Women were more likely than men to be seen only by clinicians who do not have a heart failure specialism. Again, this is likely to be linked to the tendency for women to be treated on non-cardiology wards.
Older patients were also less likely to receive specialist input or to be seen by a cardiologist than younger patients although they were more likely to see a heart failure nurse specialist or non-cardiology consultant with an interest in heart failure (table 9).
Table 10: HF specialist input by place of care
Cardiology ward (%)
General medical ward (%)
Other ward (%)
Consultant cardiologist 94 28 25
Heart failure nurse specialist
8 28 31
Other consultant with interest in heart failure
2 9 8
Any HF specialist 98 59 59
Other clinician 6 47 47
Input from HF MDT 80 51 56
Unsurprisingly, the vast majority of patients treated on a cardiology ward were seen by a cardiologist or another heart failure specialist (table 10).Interestingly, the majority of patients treated on general and other wards also received specialist input into their management. A quarter of patients on general medical and other wards were seen by a consultant cardiologist, and around 60% of patients on these wards were seen by a heart failure specialist.
Patients treated on cardiology wards were substantially less likely to be seen by a heart failure nurse specialist.
5.3.3 Length of stay
Both mean and median lengths of stay remain long, with considerable spread (table 10).
Table 11: Length of stay overall
Index admission Readmission
Mean LOS (days) 12±14 12±13
Median LOS (days) 8 (IQR 4-16) 8 (IQR 4-16)
Table 12: Length of stay by place of care
Cardiology ward
General medical ward
Other ward
Mean LOS (days) 13±13 12±4 13±16
Median LOS (days) 9 (IQR 5-16) 7 (IQR 3-15) 8 (IQR 3-17)
Patients treated on general medical wards had shorter lengths of stay than those treated on cardiology wards and other wards; this may indicate sub-optimal treatment and premature discharge rather than good practice (table 12), especially when viewed in light of the benefits of care on cardiology wards. The long mean length of stay recorded in other wards could be due to the inclusion of care of the elderly wards in this group, which will include some of the sickest patients.
16 National Heart Failure Audit April 2013-March 2014
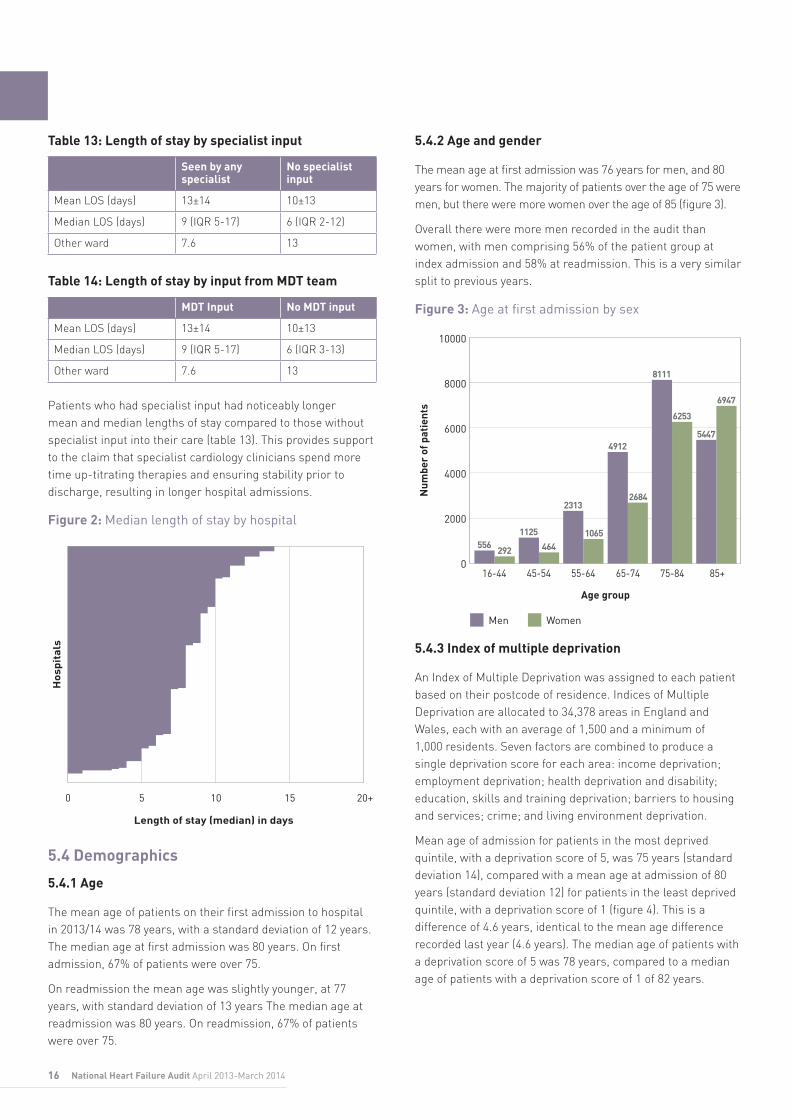
Table 13: Length of stay by specialist input
Seen by any specialist
No specialist input
Mean LOS (days) 13±14 10±13
Median LOS (days) 9 (IQR 5-17) 6 (IQR 2-12)
Other ward 7.6 13
Table 14: Length of stay by input from MDT team
MDT Input No MDT input
Mean LOS (days) 13±14 10±13
Median LOS (days) 9 (IQR 5-17) 6 (IQR 3-13)
Other ward 7.6 13
Patients who had specialist input had noticeably longer mean and median lengths of stay compared to those without specialist input into their care (table 13). This provides support to the claim that specialist cardiology clinicians spend more time up-titrating therapies and ensuring stability prior to discharge, resulting in longer hospital admissions.
Figure 2: Median length of stay by hospital
0 5 10 15 20+
Hos
pit
als
Length of stay (median) in days
5.4 Demographics
5.4.1 Age
The mean age of patients on their first admission to hospital in 2013/14 was 78 years, with a standard deviation of 12 years. The median age at first admission was 80 years. On first admission, 67% of patients were over 75.
On readmission the mean age was slightly younger, at 77 years, with standard deviation of 13 years The median age at readmission was 80 years. On readmission, 67% of patients were over 75.
5.4.2 Age and gender
The mean age at first admission was 76 years for men, and 80 years for women. The majority of patients over the age of 75 were men, but there were more women over the age of 85 (figure 3).
Overall there were more men recorded in the audit than women, with men comprising 56% of the patient group at index admission and 58% at readmission. This is a very similar split to previous years.
Figure 3: Age at first admission by sex
Age group
Num
ber
of p
atie
nts
10000
8000
6000
4000
2000
0 16-44 45-54 55-64 65-74 75-84 85+
Men Women
8111
6253
2684
4912
1065
2313
464
1125
292556
6947
5447
5.4.3 Index of multiple deprivation
An Index of Multiple Deprivation was assigned to each patient based on their postcode of residence. Indices of Multiple Deprivation are allocated to 34,378 areas in England and Wales, each with an average of 1,500 and a minimum of 1,000 residents. Seven factors are combined to produce a single deprivation score for each area: income deprivation; employment deprivation; health deprivation and disability; education, skills and training deprivation; barriers to housing and services; crime; and living environment deprivation.
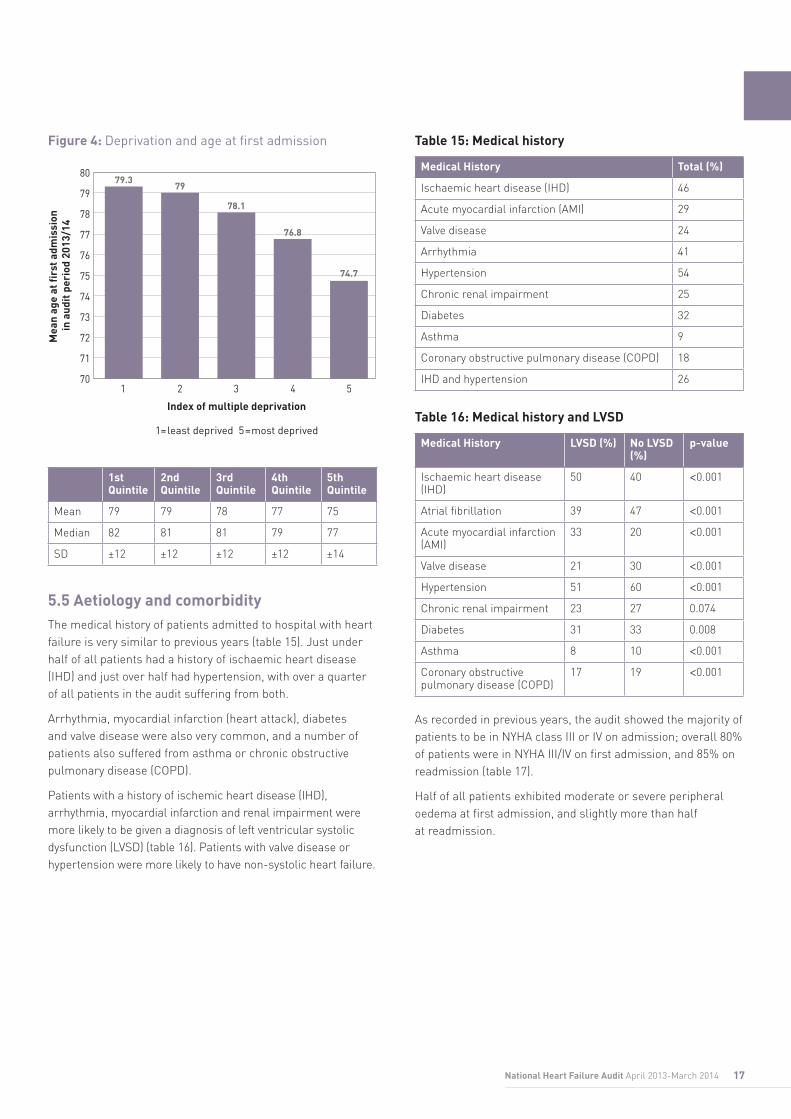
Mean age of admission for patients in the most deprived quintile, with a deprivation score of 5, was 75 years (standard deviation 14), compared with a mean age at admission of 80 years (standard deviation 12) for patients in the least deprived quintile, with a deprivation score of 1 (figure 4). This is a difference of 4.6 years, identical to the mean age difference recorded last year (4.6 years). The median age of patients with a deprivation score of 5 was 78 years, compared to a median age of patients with a deprivation score of 1 of 82 years.
17National Heart Failure Audit April 2013-March 2014
Figure 4: Deprivation and age at first admission
Index of multiple deprivation
Mea
n ag
e at
firs
t adm
issi
on
in a
udit
per
iod
2013
/14
80
79
78
77
76
75
74
73
72
71
70 1 2 3 4 5
74.7
76.8
78.1
7979.3
1=least deprived 5=most deprived
1st Quintile
2nd Quintile
3rd Quintile
4th Quintile
5th Quintile
Mean 79 79 78 77 75
Median 82 81 81 79 77
SD ±12 ±12 ±12 ±12 ±14
5.5 Aetiology and comorbidityThe medical history of patients admitted to hospital with heart failure is very similar to previous years (table 15). Just under half of all patients had a history of ischaemic heart disease (IHD) and just over half had hypertension, with over a quarter of all patients in the audit suffering from both.
Arrhythmia, myocardial infarction (heart attack), diabetes and valve disease were also very common, and a number of patients also suffered from asthma or chronic obstructive pulmonary disease (COPD).
Patients with a history of ischemic heart disease (IHD), arrhythmia, myocardial infarction and renal impairment were more likely to be given a diagnosis of left ventricular systolic dysfunction (LVSD) (table 16). Patients with valve disease or hypertension were more likely to have non-systolic heart failure.
Table 15: Medical history
Medical History Total (%)
Ischaemic heart disease (IHD) 46
Acute myocardial infarction (AMI) 29
Valve disease 24
Arrhythmia 41
Hypertension 54
Chronic renal impairment 25
Diabetes 32
Asthma 9
Coronary obstructive pulmonary disease (COPD) 18
IHD and hypertension 26
Table 16: Medical history and LVSD
Medical History LVSD (%) No LVSD (%)
p-value
Ischaemic heart disease (IHD)
50 40 <0.001
Atrial fibrillation 39 47 <0.001
Acute myocardial infarction (AMI)
33 20 <0.001
Valve disease 21 30 <0.001
Hypertension 51 60 <0.001
Chronic renal impairment 23 27 0.074
Diabetes 31 33 0.008
Asthma 8 10 <0.001
Coronary obstructive pulmonary disease (COPD)
17 19 <0.001
As recorded in previous years, the audit showed the majority of patients to be in NYHA class III or IV on admission; overall 80% of patients were in NYHA III/IV on first admission, and 85% on readmission (table 17).
Half of all patients exhibited moderate or severe peripheral oedema at first admission, and slightly more than half at readmission.

18 National Heart Failure Audit April 2013-March 2014
Table 17: Symptoms and signs of heart failure
Symptoms/sign of heart failure
Total on admission (%)
Total on readmission (%)
NYHA class I/II 19 16
NYHA class III 45 45
NYHA class IV 37 39
No/mild peripheral oedema
49 45
Moderate peripheral oedema
32 33
Severe peripheral oedema
19 22
5.6 DiagnosisThe percentage of patients receiving an echo was identical to 2012/13 in 2013/14 at 91%, indicating NICE guidelines are broadly followed; they recommend echocardiography for all patients with a previous MI or raised BNP levels (table 18). Almost all patients receive an ECG.
Table 18: Diagnostic tests
Diagnostic tests Total received (%)
ECG 99
Echo 91
5.6.1 Echo
The vast majority of patients received an echo; this is in line with current diagnostic guidelines, but as the main diagnostic test for heart failure, almost universal usage of echo is expected (table 19).
Table 19: Receipt of echo by age
<75 years (%) ≥75 years (%)
Received echo 95 90
Echo not done (planned) 3 4
Echo not done (not planned) 2 5
Men were more likely than women to have received an echo (table 20). These are the same as the findings in previous years.
Table 20: Receipt of echo by gender
Men (%) Women (%)
Received echo 93 90
Echo not done (planned) 3 5
Echo not done (not planned) 4 6
Table 21: Receipt of echo by place of care
Cardiology ward (%)
General medical ward (%)
Other ward (%)
Received echo 97 87 87
Echo not done (planned) 1 7 5
Echo not done (not planned) 2 6 8
Similarly, in line with previous findings, patients treated on cardiology wards were more likely to receive an echo (table 21). Most striking is the difference between the percentages receiving an echo when they were treated by a specialist (95%) to the percentage receiving an echo who also received no specialist input into their care (81%) (table 22).
Table 22: Receipt of echo by specialist input
Seen by any HF specialist (%)
No specialist input (%)
Received echo 95 81
Echo not done (planned) 2 9
Echo not done (not planned) 3 11
5.6.2 Echo diagnosis
Of those people who had an echo, the following diagnoses were given (table 23). Note that patients could be given a diagnosis of more than one of the following options. No patient with HF should have a normal echo.
Table 23: Overall echo diagnosis
Echo diagnosis Total (%)
Normal echo 3
Left ventricular systolic dysfunction (LVSD) 70
Left ventricular hypertrophy (LVH) 7
Valve disease 28
Diastolic dysfunction 10
Other diagnosis 10
Younger patients were more likely to have HF due to LVSD, whereas in those over 75, although HF due to LVSD remained common other types of HF also increased (table 24). Of all patients who received an echo, men were more likely to be diagnosed with LVSD and women were more likely to be given a diagnosis of other types of heart failure (table 25).
Patients could be given a diagnosis of more than one of the options below, but could not be given a ‘normal’ echo diagnosis in combination with any other diagnosis.

19National Heart Failure Audit April 2013-March 2014
Table 24: Echo diagnosis by age
Echo diagnosis <75 years (%)
≥75 years (%)
Normal echo 3 4
Left ventricular systolic dysfunction (LVSD)
79 66
Left ventricular hypertrophy (LVH) 6 8
Valve disease 20 32
Diastolic dysfunction 9 11
Other diagnosis 10 11
Table 25: Echo diagnosis by gender
Echo diagnosis Men (%) Women (%)
Normal echo 3 4
Left ventricular systolic dysfunction (LVSD)
78 60
Left ventricular hypertrophy (LVH)
6 8
Valve disease 24 33
Diastolic dysfunction 9 13
Other diagnosis 10 12
5.7 Treatment on discharge for LVSDAll analyses concerning therapies prescribed on discharge only applies to those patients who were given a diagnosis of LVSD and who survived to discharge.
Prescription rates of ACE inhibitors and ARBs remain broadly similar to those recorded in 2012/13 (table 26), albeit in a larger cohort of patients. Prescription of diuretics and digoxin also remains similar to last year. Beta blocker use appears to have risen (from 82% in 2012/13 to 85%), as has use of MRA (from 39% in 2012/13 to 50%).
41% of patients were discharged on all three of the recommended therapies for heart failure – ACE inhibitor/ARB, beta blocker and MRA. Outcomes analysis from the audit (see section 5) shows patients discharged on all three drugs have better outcomes following discharge than those. The low number of patients receiving this triple therapy is therefore disappointing.
Table 26: Overall treatment on discharge for LVSD
Medication Total prescribed (%)
ACE inhibitor 73
ARB 19
ACE and/or ARB 85
Beta blocker 85
MRA 51
ACEI and/or ARB, beta blocker and MRA 41
Loop diuretic 91
Thiazide diuretic 5
Digoxin 22
As recorded in previous years, men are marginally more likely to be prescribed ACE inhibitors or ARBs and beta blockers and somewhat more likely to be prescribed MRAs. Men are, however, substantially more likely to receive all three (table 27). This effect is exacerbated when comparing younger and older age groups, younger patients being substantially more likely to be prescribed any of ACE inhibitors/ARBs, beta blockers or MRAs, and more likely to be prescribed all three on discharge (table 28).
Older patients are more likely to be prescribed loop diuretics than their younger counterparts (table 28). Figure 5 shows how the use of ACE inhibitors, beta blockers and MRAs declines with age, while the use of loop diuretics increases. Use of ARBs remains fairly stable across age groups.
As seen in previous years, those treated on a cardiology ward or seen by a cardiology specialist are more likely to be prescribed ACE inhibitors or ARBs, beta blockers and MRAs than those treated on general medical wards and other wards, and those not seen by a specialist doctor or nurse (tables 29 and 30).
Table 27: Treatment on discharge for LVSD by gender
Medication Men (%) Women (%)
ACE inhibitor 74 70
ARB 17 21
ACE and/or ARB 86 84
Beta blocker 86 84
MRA 53 47
ACEI and/or ARB, beta blocker and MRA
44 37
Loop diuretic 91 91
Thiazide diuretic 6 4
Digoxin 21 23

20 National Heart Failure Audit April 2013-March 2014
Table 28: Treatment on discharge for LVSD by age
Medication <75 years (%)
≥75 years (%)
ACE inhibitor 79 68
ARB 18 19
ACE and/or ARB 90 81
Beta blocker 89 82
MRA 59 45
ACEI and/or ARB, beta blocker and MRA
51 34
Loop diuretic 88 93
Thiazide diuretic 7 4
Digoxin 21 21
Table 29: Treatment on discharge for LVSD by place of care
Medication Cardiology ward (%)
General medical ward (%)
Other ward (%)
ACE inhibitor 76 69 69
ARB 19 17 19
ACE and/or ARB 88 79 81
Beta blocker 88 78 80
MRA 57 47 43
ACEI and/or ARB, beta blocker and MRA
48 38 32
Loop diuretic 90 95 93
Thiazide diuretic 6 6 4
Digoxin 22 21 22
Table 30: Treatment on discharge for LVSD by specialist input
Medication Seen by any HF specialist (%)
No specialist input (%)
ACE inhibitor 74 64
ARB 19 18
ACE and/or ARB 87 75
Beta blocker 87 74
MRA 54 34
ACEI and/or ARB, beta blocker and MRA
45 21
Loop diuretic 90 94
Thiazide diuretic 6 3
Digoxin 22 23
Figure 5: Prescription of disease modifying therapies in LVSD by age
ACEi and/or ARB Beta blocker
ACEi Loop
MRAARB
Age GroupP
resc
ribe
d at
dis
char
ge (%
)
100
90
80
70
60
50
40
30
20
10
0
16-44 45-54 55-64 65-74 75-84 85+
Patients treated in a cardiology ward for the majority of their admission were more likely to receive ACE inhibitors/ARBs, beta blockers and MRAs (table 29). Levels of prescription in general medical wards and other wards were similar for each of these therapies.
Cardiology patients were more likely to receive all three of these treatments than patients treated on general and other wards (table 30).
Loop diuretic prescription was high across all wards, although slightly higher in general wards.
Figure 6: Five-year trends in prescription of disease modifying therapies in LVSD
Year
Pre
scri
bed
at d
isch
arge
(%)
100
90
80
70
60
50
40
30
20
10
0
ACEi and/or ARB MRABeta blocker
2009/2010 2010/2011 2011/2012 2012/2013 2013/2014

21National Heart Failure Audit April 2013-March 2014
5.8 Monitoring and follow-upOf those patients who survived to discharge, over half were referred to cardiology and heart failure nurse follow-up services (table 31). Some heart failure nurse clinics are only intended for LVSD patients, and almost 80% of all patients with a diagnosis of LVSD were referred for follow-up with a specialist nurse. Referral to specialist follow-up is associated with better outcomes, with the benefits showing even several years after discharge.
The audit records whether patients were referred to a cardiac rehabilitation programme on discharge; 10% of patients were referred to these services. This number should perhaps be higher as the Cardiovascular Disease Outcomes Strategy, published in March 2013, sets an aim for hospitals to refer a third of heart failure patients to cardiac rehabilitation programmes.
Palliative care referrals remain low, which is surprising and disappointing given the high age of the heart failure patient population and the high mortality rates within a year of discharge.
Table 31: Overall referral to follow-up services
Service Total referred (%)
Cardiology follow-up 54
Heart failure nurse follow-up 58
Heart failure nurse follow-up (LVSD patients only)
69
Cardiac rehabilitation 10
Care of the elderly follow-up 14
GP follow-up 79
Palliative care 4
Men and younger patients were more likely than women and those over 75 to receive referrals to specialist follow-up services and cardiac rehab programmes (tables 32 and 33). The figures for cardiac rehab referrals exclude those patients for whom referral was not applicable and those who declined treatment.
Table 32: Referral to follow-up services on discharge by gender
Service Men (%) Women (%)
Cardiology follow-up 60 48
Heart failure nurse follow-up 63 51
Cardiac rehabilitation 12 8.4
Table 33: Referral to follow-up services on discharge by age
Service <75 years (%)
≥75 years (%)
Cardiology follow-up 71 45
Heart failure nurse follow-up 65 53
Cardiac rehabilitation 15 8
Unsurprisingly, and as recorded in previous years, patients were also far more likely to receive specialist follow-up when treated on cardiology wards (table 34). Cardiology patients were more than twice as likely to be referred to a cardiac rehab programme.
Patients who received specialist heart failure care were around three times more likely to be referred to follow-up with a cardiologist or heart failure nurse, and twice as likely to be referred to a cardiac rehab programme on discharge (table 35).
Table 34: Referral to follow-up services on discharge by main place of care
Service Cardiology ward (%)
General medical ward (%)
Other ward (%)
Cardiology follow-up 72 37 34
Heart failure nurse follow-up
68 47 49
Cardiac rehabilitation 15 7 4
Table 35: Referral to follow-up services on discharge by specialist input
Service Seen by any HF specialist (%)
No specialist input (%)
Cardiology follow-up 63 23
Heart failure nurse follow-up 67 22
Cardiac rehabilitation 13 3
Table 36: Follow-up appointment with MDT
Follow-up appointment Total (%)
Follow-up appointment with MDT scheduled
55
Appointment scheduled within two weeks of discharge
31
Over half of patients were referred for a follow-up appointment with the heart failure MDT on discharge, and a third had their appointment planned for within two weeks of leaving hospital (table 36). The NICE clinical guideline and quality standard for heart failure recommend people admitted to hospital because of heart failure receive a clinical assessment from a member of the heart failure MDT within two weeks of discharge.

22 National Heart Failure Audit April 2013-March 2014
5.9 Outcomes
5.9.1 Mortality measures
There are five separate mortality measures reported at the national level in this report:
• In-hospital mortality for the 2013/14 population
• In-hospital mortality for the 2009-14 population
• 30-day mortality for survivors to discharge
• Mortality for survivors to discharge in the 2013/14 population
• Mortality for survivors to discharge in the 2009-14 population
A Cox proportional hazards model was produced for each measure to show the hazards associated with risk factors for each group of patients. This year’s risk adjustment is more thorough than the previous year’s. A random effects Cox regression model for in-hospital analysis was implemented to account for clustering.
The survival model for the 2013/14 analysis was generated from data submitted to the audit; only 36% of patient records had complete data on all variables. Despite the 25% increase in admission records submitted to NICOR, there has been an absolute decrease of 4% in the records used in the multivariate analyses. The quality of data submitted must improve for the number of records available for multivariate regression analysis to increase.
Multiple imputation, the process of generating more than one potential dataset which the data could have been (as opposed to single imputation which fills in missing data once), was not restricted to complete case only. The imputed datasets were analysed, and their results combined appropriately to give a final result. Multiple imputation was performed in STATA.19 using the ice command, 60 imputations were performed.
In April 2012 the dataset was revised to include a series of new fields to collect information about heart rate, systolic blood pressure, and the relevant aspects of a full blood count. The mortality analyses which look at only data from 2013/14 include these factors; providing a more sophisticated risk adjustment.
The analyses of 2009-14 data used a smaller group of risks, as only the data from 2013-14 would include the recent additions to the dataset. The hazards associated with these risks in the 2009-14 analysis may be exaggerated as they do not take into account the confounding factors which are included in the 2013-14 analyses.
The main risks associated with acute heart failure are well documented; the factors included in the model were identified from the initial literature review, rather than using the data to identify risk factors from statistical significance.
After identifying the risk factors, the level of increase or decrease the continuous variable risk factors (systolic blood pressure, haemoglobin, heart rate) should be measured against was determined. There were different considerations for the different risk factors.
For blood pressure, a 10 mmHG increase is standardly cited in the literature; with other variables the spread of the data determined what unit increase to use – haemoglobin had a very small spread, so a decrease of 1g/dL was used as a measure of hazard. Conversely, creatinine had a very large spread, so an increase of 10umol/L was used. As potassium is a U-shaped variable, with both low and high values conferring an increased risk, four levels were used to measure the hazard of different potassium levels. These were determined based on clinical judgement of normal measurements. Consistently having a low potassium (≤3.5 mEq/L) was a greater hazard than having a slightly high potassium level (4.5-5.5 mEq/L), and having a very high potassium (>5.5 mEq/L) is associated with the greatest hazard.
A patient’s length of stay in hospital appeared to be a linear variable with higher mortality hazard associated with a longer length of stay. All-cause and cardiovascular mortality is distinguished in the analysis of survival post discharge.
The Cox regression analysis had a low proportion of complete records available for analysis; this was due to the addition of established risk factors as core fields following the dataset revision in 2012. For 31 (14.9%) hospitals there were no records eligible for a complete case multivariate Cox regression analysis as a result of missing data in these fields. 26 of these hospitals submitted at least 30 records to the audit in the report year.
At least 90% of records submitted by Colchester General Hospital, Queen Alexandra Hospital, Royal Derby Hospital and Salisbury District Hospital contributed to the regression analyses, but on average 41% of the data submitted by hospitals contributed to the regression analysis. It is important that complete data – especially fields relevant to all audit analyses – is submitted to eliminate bias introduced by incomplete records.
Currently 66 (31.7%) hospitals submitted at least 50% of valid post-discharge data in all regression analysis fields, which is a decrease from 36.4% in 2012/2013 audit year. We expected hospitals to submit at least 50% of information required in the regression analysis fields by 2013/2014 and anticipate 70% by 2014/2015.
As a result of high level of missingness a more thorough analysis is required since bias is introduced by the exclusion of patient records, but there were similarities in results obtained from both imputed and complete case analyses.
23National Heart Failure Audit April 2013-March 2014
5.9.2 In-hospital death
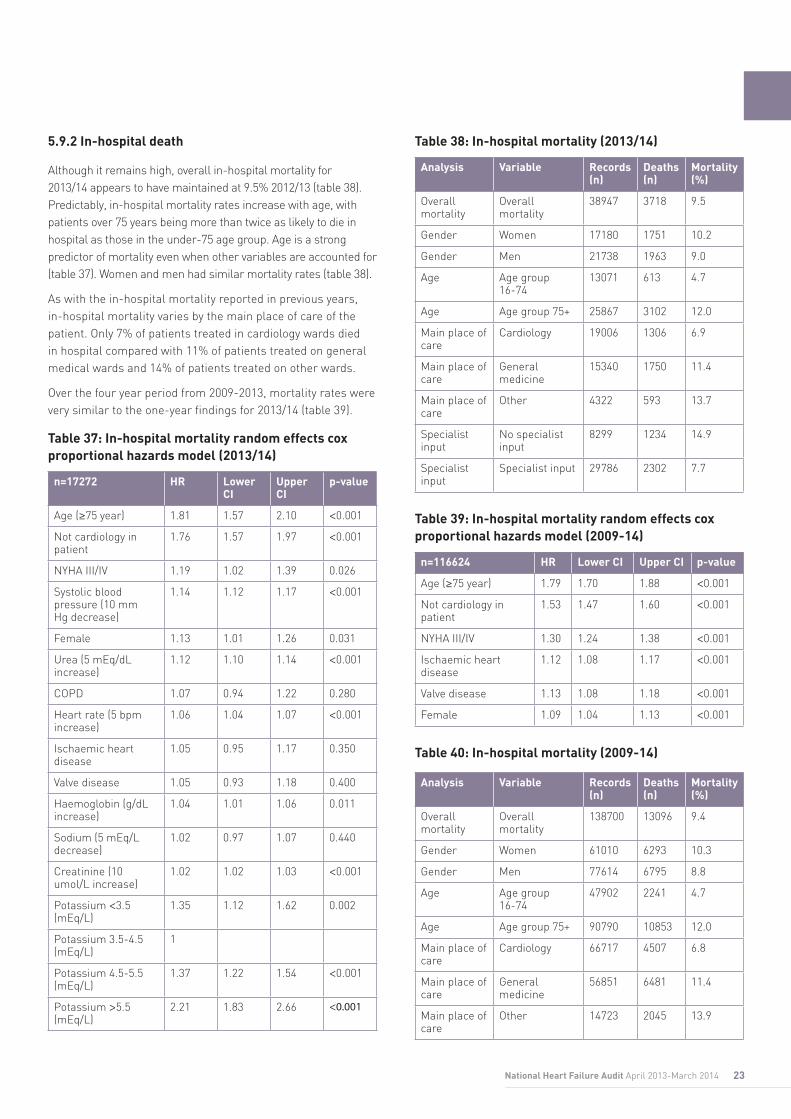
Although it remains high, overall in-hospital mortality for 2013/14 appears to have maintained at 9.5% 2012/13 (table 38). Predictably, in-hospital mortality rates increase with age, with patients over 75 years being more than twice as likely to die in hospital as those in the under-75 age group. Age is a strong predictor of mortality even when other variables are accounted for (table 37). Women and men had similar mortality rates (table 38).
As with the in-hospital mortality reported in previous years, in-hospital mortality varies by the main place of care of the patient. Only 7% of patients treated in cardiology wards died in hospital compared with 11% of patients treated on general medical wards and 14% of patients treated on other wards.
Over the four year period from 2009-2013, mortality rates were very similar to the one-year findings for 2013/14 (table 39).
Table 37: In-hospital mortality random effects cox proportional hazards model (2013/14)
n=17272 HR Lower CI
Upper CI
p-value
Age (≥75 year) 1.81 1.57 2.10 <0.001
Not cardiology in patient
1.76 1.57 1.97 <0.001
NYHA III/IV 1.19 1.02 1.39 0.026
Systolic blood pressure (10 mm Hg decrease)
1.14 1.12 1.17 <0.001
Female 1.13 1.01 1.26 0.031
Urea (5 mEq/dL increase)
1.12 1.10 1.14 <0.001
COPD 1.07 0.94 1.22 0.280
Heart rate (5 bpm increase)
1.06 1.04 1.07 <0.001
Ischaemic heart disease
1.05 0.95 1.17 0.350
Valve disease 1.05 0.93 1.18 0.400
Haemoglobin (g/dL increase)
1.04 1.01 1.06 0.011
Sodium (5 mEq/L decrease)
1.02 0.97 1.07 0.440
Creatinine (10 umol/L increase)
1.02 1.02 1.03 <0.001
Potassium <3.5 (mEq/L)
1.35 1.12 1.62 0.002
Potassium 3.5-4.5 (mEq/L)
1
Potassium 4.5-5.5 (mEq/L)
1.37 1.22 1.54 <0.001
Potassium >5.5 (mEq/L)
2.21 1.83 2.66 <0.001
Table 38: In-hospital mortality (2013/14)
Analysis Variable Records (n)
Deaths (n)
Mortality (%)
Overall mortality
Overall mortality
38947 3718 9.5
Gender Women 17180 1751 10.2
Gender Men 21738 1963 9.0
Age Age group 16-74
13071 613 4.7
Age Age group 75+ 25867 3102 12.0
Main place of care
Cardiology 19006 1306 6.9
Main place of care
General medicine
15340 1750 11.4
Main place of care
Other 4322 593 13.7
Specialist input
No specialist input
8299 1234 14.9
Specialist input
Specialist input 29786 2302 7.7
Table 39: In-hospital mortality random effects cox proportional hazards model (2009-14)
n=116624 HR Lower CI Upper CI p-value
Age (≥75 year) 1.79 1.70 1.88 <0.001
Not cardiology in patient
1.53 1.47 1.60 <0.001
NYHA III/IV 1.30 1.24 1.38 <0.001
Ischaemic heart disease
1.12 1.08 1.17 <0.001
Valve disease 1.13 1.08 1.18 <0.001
Female 1.09 1.04 1.13 <0.001
Table 40: In-hospital mortality (2009-14)
Analysis Variable Records (n)
Deaths (n)
Mortality (%)
Overall mortality
Overall mortality
138700 13096 9.4
Gender Women 61010 6293 10.3
Gender Men 77614 6795 8.8
Age Age group 16-74
47902 2241 4.7
Age Age group 75+ 90790 10853 12.0
Main place of care
Cardiology 66717 4507 6.8
Main place of care
General medicine
56851 6481 11.4
Main place of care
Other 14723 2045 13.9
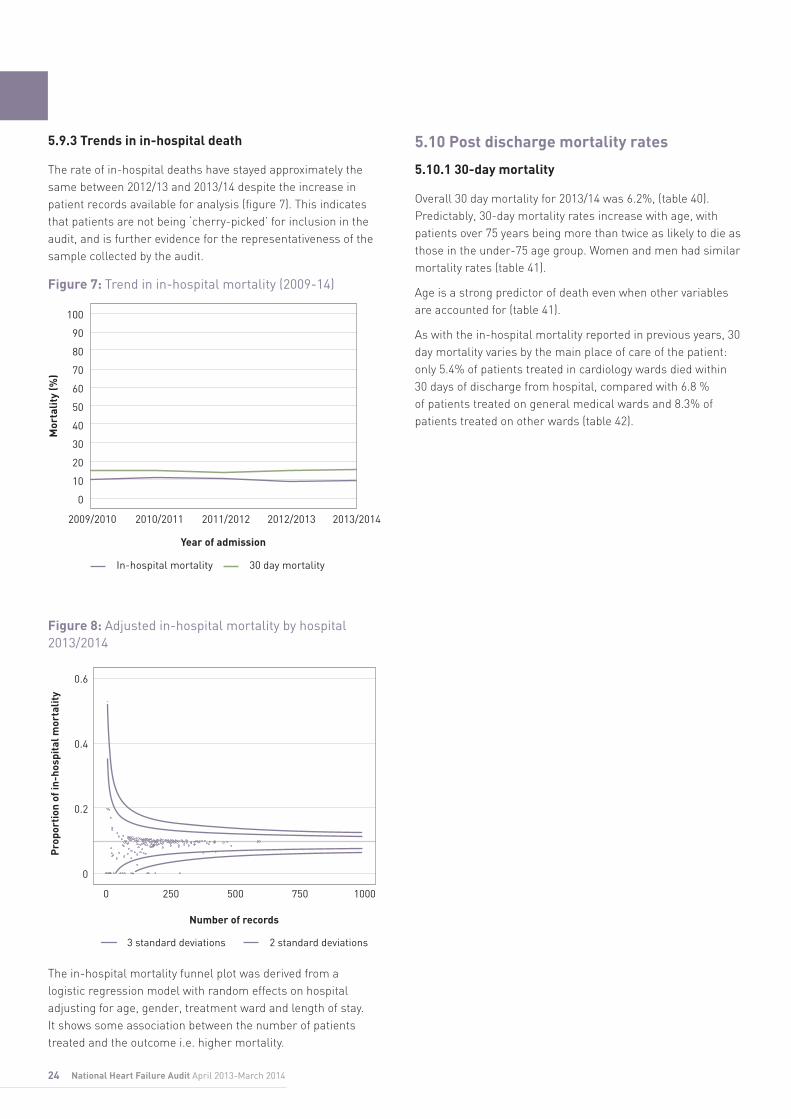
24 National Heart Failure Audit April 2013-March 2014
5.9.3 Trends in in-hospital death
The rate of in-hospital deaths have stayed approximately the same between 2012/13 and 2013/14 despite the increase in patient records available for analysis (figure 7). This indicates that patients are not being ‘cherry-picked’ for inclusion in the audit, and is further evidence for the representativeness of the sample collected by the audit.
Figure 7: Trend in in-hospital mortality (2009-14)
Year of admission
Mor
talit
y (%
)
100
90
80
70
60
50
40
30
20
10
0
In-hospital mortality 30 day mortality
2009/2010 2010/2011 2011/2012 2012/2013 2013/2014
Figure 8: Adjusted in-hospital mortality by hospital 2013/2014
Number of records
Pro
port
ion
of in
-hos
pita
l mor
talit
y
0.6
0.4
0.2
0
0 250 500 750 1000
3 standard deviations 2 standard deviations
The in-hospital mortality funnel plot was derived from a logistic regression model with random effects on hospital adjusting for age, gender, treatment ward and length of stay. It shows some association between the number of patients treated and the outcome i.e. higher mortality.
5.10 Post discharge mortality rates
5.10.1 30-day mortality
Overall 30 day mortality for 2013/14 was 6.2%, (table 40). Predictably, 30-day mortality rates increase with age, with patients over 75 years being more than twice as likely to die as those in the under-75 age group. Women and men had similar mortality rates (table 41).
Age is a strong predictor of death even when other variables are accounted for (table 41).
As with the in-hospital mortality reported in previous years, 30 day mortality varies by the main place of care of the patient: only 5.4% of patients treated in cardiology wards died within 30 days of discharge from hospital, compared with 6.8 % of patients treated on general medical wards and 8.3% of patients treated on other wards (table 42).

25National Heart Failure Audit April 2013-March 2014
Table 41: All-cause 30-day mortality cox proportional hazards model (2013/14)
Analysis Variable Records (n) Deaths (n) Mortality (%)
Overall mortality Overall mortality 35229 2200 6.2
Gender Women 15429 945 6.1
Gender Men 19775 1254 6.3
Age Age group 16-74 12458 444 3.6
Age Age group 75+ 22765 1755 7.7
Main place of care Cardiology 17700 954 5.4
Main place of care General medicine 13590 925 6.8
Main place of care Other 3729 309 8.3
Specialist input No specialist input 7065 530 7.5
Specialist input Specialist input 27484 1627 5.9
Diagnosis No LVSD 12122 737 6.1
Diagnosis LVSD 22340 1404 6.3
ACE inhibitor (all) No ACE inhibitor 9327 676 7.2
ACE inhibitor (all) ACE inhibitor 18390 690 3.8
ACE inhibitor (LVSD only) No ACE inhibitor 4951 367 7.4
ACE inhibitor (LVSD only) ACE inhibitor 13159 503 3.8
ACEI/ARB (all) No ACEI or ARB 6039 554 9.2
ACEI/ARB (all) ACEI and/or ARB 22900 839 3.7
ACEI/ARB (LVSD only) No ACEI or ARB 2839 292 10.3
ACEI/ARB (LVSD only) ACEI and/or ARB 16028 590 3.7
Beta Blockers (all) No beta blocker 6357 495 7.8
Beta Blockers (all) Beta blocker 24134 1225 5.1
Beta Blockers (LVSD) No beta blocker 2993 262 8.8
Beta Blockers (LVSD) Beta blocker 16804 857 5.1
Loop diuretic (all) No loop diuretics 2628 177 6.7
Loop diuretic (all) Loop diuretics 31012 1781 5.7
Loop diuretic (LVSD) No loop diuretics 1957 119 6.1
Loop diuretic (LVSD) Loop diuretics 19262 1127 5.9
Additive drugs No ACEI/ARB, beta blocker or MRA 1776 203 11.4
Additive drugs Discharged on ACEI/ARB only 2122 86 4.1
Additive drugs Discharged on ACEI/ARB and beta blocker 7349 270 3.7
Additive drugs Discharged on ACEI/ARB, beta blocker and MRA 8077 274 3.4
Additive drugs (LVSD only) No ACEI/ARB, beta blocker or MRA 661 93 14.1
Additive drugs (LVSD only) Discharged on ACEI/ARB only 1054 45 4.3
Additive drugs (LVSD only) Discharged on ACEI/ARB and beta blocker 5056 186 3.7
Additive drugs (LVSD only) Discharged on ACEI/ARB, beta blocker and MRA 6666 226 3.4
Discharge planning No discharge planning 3111 231 7.4
Discharge planning Discharge planning 29590 1770 6.0
HF nurse follow-up No HF nurse follow-up 14298 1013 7.1
HF nurse follow-up HF nurse follow-up 19321 1040 5.4
Cardiology follow-up No cardiology follow-up 15502 1357 8.8
Cardiology follow-up Cardiology follow-up 18400 685 3.7

26 National Heart Failure Audit April 2013-March 2014
Table 42: All-cause 30-day mortality from admission cox proportional hazards model (2013/14)
n=12943 HR Lower CI Upper CI p-value
No cardiology follow-up 1.92 1.60 2.31 <0.001
No ACE inhibitor and/or ARB
1.56 1.31 1.85 <0.001
No Loop diuretics 1.55 1.19 2.02 0.001
Age (≥75 year) 1.49 1.23 1.82 <0.001
NYHA III/IV 1.37 1.09 1.72 0.006
Ischaemic heart disease
1.23 1.05 1.45 0.010
Sodium (5 mEq/L decrease)
1.17 1.09 1.26 <0.001
Systolic blood pressure (10 mm Hg decrease)
1.13 1.09 1.18 <0.001
No beta blocker 1.12 0.93 1.34 0.220
Urea (5 mEq/dL increase)
1.11 1.07 1.15 <0.001
Not cardiology in patient
1.08 0.91 1.29 0.370
Male 1.05 0.89 1.24 0.590
COPD 1.04 0.85 1.27 0.730
Haemoglobin (g/dL decrease)
1.03 0.99 1.07 0.150
Creatinine (10 umol/L increase)
1.02 1.01 1.03 0.001
Length of stay 0- 4 days 1
Length of stay 5-8 days 1.03 0.79 1.33 0.830
Length of stay 9-15 days
1.17 0.92 1.50 0.210
Length of stay ≥16 days 2.12 1.70 2.65 <0.001
Figure 9: 30-day all-cause mortality from admission
Days
Surv
ival
(%)
100
90
80
70
60
50
40
30
20
10
0
0 5 10 15 20 25 30
Figure 10: 30-day all-cause mortality from admission by place of care
DaysSu
rviv
al (%
)
100
90
80
70
60
50
40
30
20
10
0
0 5 10 15 20 25 30
FemaleMaleCardiologyGeneral MedicineOther
No. at risk
Cardiology 19015 18746 18420 18160 17872 17633 17445
General Medicine
15342 14878 14443 14080 13787 13534 13302
Other 4322 4144 4033 3903 3804 3728 3648
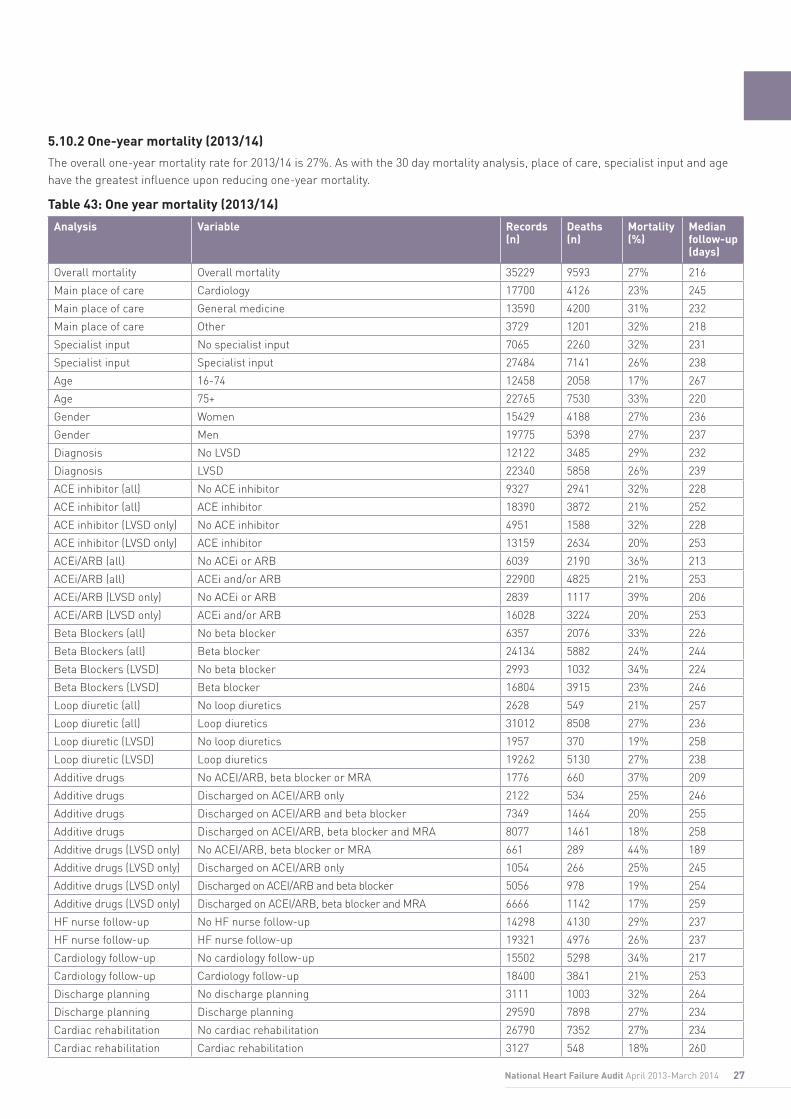
27National Heart Failure Audit April 2013-March 2014
5.10.2 One-year mortality (2013/14)
The overall one-year mortality rate for 2013/14 is 27%. As with the 30 day mortality analysis, place of care, specialist input and age have the greatest influence upon reducing one-year mortality.
Table 43: One year mortality (2013/14)
Analysis Variable Records (n)
Deaths (n)
Mortality (%)
Median follow-up (days)
Overall mortality Overall mortality 35229 9593 27% 216
Main place of care Cardiology 17700 4126 23% 245
Main place of care General medicine 13590 4200 31% 232
Main place of care Other 3729 1201 32% 218
Specialist input No specialist input 7065 2260 32% 231
Specialist input Specialist input 27484 7141 26% 238
Age 16-74 12458 2058 17% 267
Age 75+ 22765 7530 33% 220
Gender Women 15429 4188 27% 236
Gender Men 19775 5398 27% 237
Diagnosis No LVSD 12122 3485 29% 232
Diagnosis LVSD 22340 5858 26% 239
ACE inhibitor (all) No ACE inhibitor 9327 2941 32% 228
ACE inhibitor (all) ACE inhibitor 18390 3872 21% 252
ACE inhibitor (LVSD only) No ACE inhibitor 4951 1588 32% 228
ACE inhibitor (LVSD only) ACE inhibitor 13159 2634 20% 253
ACEi/ARB (all) No ACEi or ARB 6039 2190 36% 213
ACEi/ARB (all) ACEi and/or ARB 22900 4825 21% 253
ACEi/ARB (LVSD only) No ACEi or ARB 2839 1117 39% 206
ACEi/ARB (LVSD only) ACEi and/or ARB 16028 3224 20% 253
Beta Blockers (all) No beta blocker 6357 2076 33% 226
Beta Blockers (all) Beta blocker 24134 5882 24% 244
Beta Blockers (LVSD) No beta blocker 2993 1032 34% 224
Beta Blockers (LVSD) Beta blocker 16804 3915 23% 246
Loop diuretic (all) No loop diuretics 2628 549 21% 257
Loop diuretic (all) Loop diuretics 31012 8508 27% 236
Loop diuretic (LVSD) No loop diuretics 1957 370 19% 258
Loop diuretic (LVSD) Loop diuretics 19262 5130 27% 238
Additive drugs No ACEI/ARB, beta blocker or MRA 1776 660 37% 209
Additive drugs Discharged on ACEI/ARB only 2122 534 25% 246
Additive drugs Discharged on ACEI/ARB and beta blocker 7349 1464 20% 255
Additive drugs Discharged on ACEI/ARB, beta blocker and MRA 8077 1461 18% 258
Additive drugs (LVSD only) No ACEI/ARB, beta blocker or MRA 661 289 44% 189
Additive drugs (LVSD only) Discharged on ACEI/ARB only 1054 266 25% 245
Additive drugs (LVSD only) Discharged on ACEI/ARB and beta blocker 5056 978 19% 254
Additive drugs (LVSD only) Discharged on ACEI/ARB, beta blocker and MRA 6666 1142 17% 259
HF nurse follow-up No HF nurse follow-up 14298 4130 29% 237
HF nurse follow-up HF nurse follow-up 19321 4976 26% 237
Cardiology follow-up No cardiology follow-up 15502 5298 34% 217
Cardiology follow-up Cardiology follow-up 18400 3841 21% 253
Discharge planning No discharge planning 3111 1003 32% 264
Discharge planning Discharge planning 29590 7898 27% 234
Cardiac rehabilitation No cardiac rehabilitation 26790 7352 27% 234
Cardiac rehabilitation Cardiac rehabilitation 3127 548 18% 260
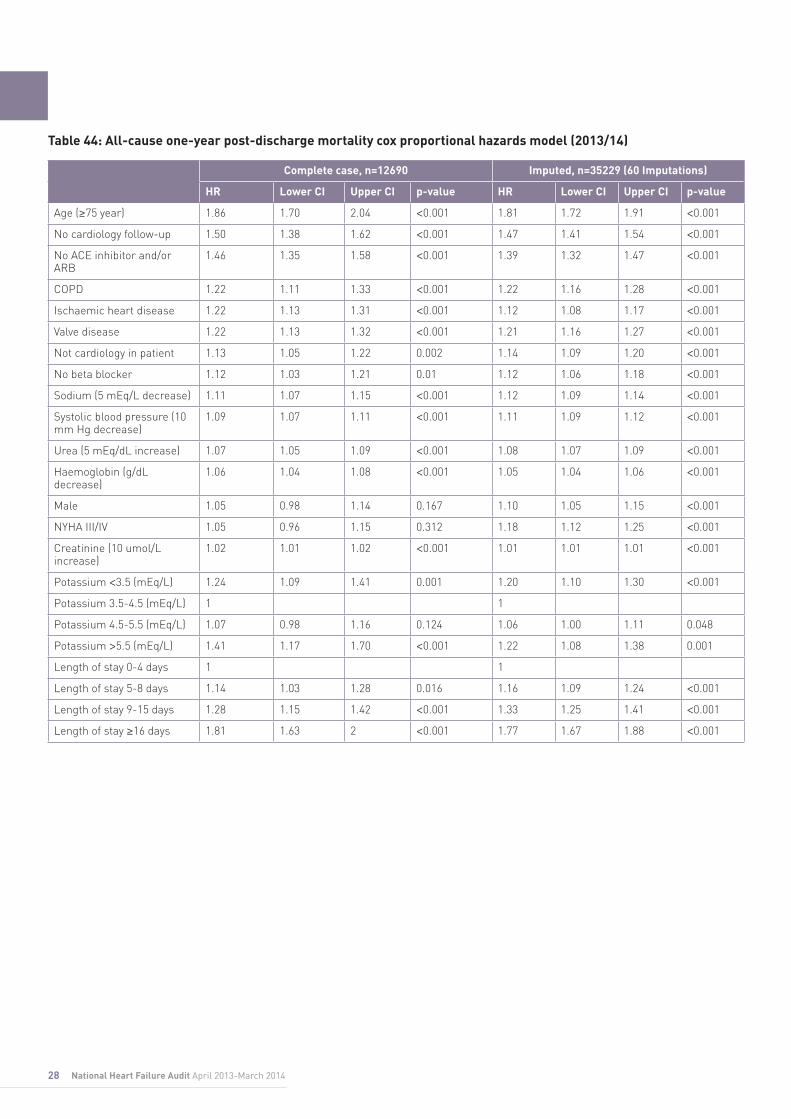
28 National Heart Failure Audit April 2013-March 2014
Table 44: All-cause one-year post-discharge mortality cox proportional hazards model (2013/14)
Complete case, n=12690 Imputed, n=35229 (60 Imputations)
HR Lower CI Upper CI p-value HR Lower CI Upper CI p-value
Age (≥75 year) 1.86 1.70 2.04 <0.001 1.81 1.72 1.91 <0.001
No cardiology follow-up 1.50 1.38 1.62 <0.001 1.47 1.41 1.54 <0.001
No ACE inhibitor and/or ARB
1.46 1.35 1.58 <0.001 1.39 1.32 1.47 <0.001
COPD 1.22 1.11 1.33 <0.001 1.22 1.16 1.28 <0.001
Ischaemic heart disease 1.22 1.13 1.31 <0.001 1.12 1.08 1.17 <0.001
Valve disease 1.22 1.13 1.32 <0.001 1.21 1.16 1.27 <0.001
Not cardiology in patient 1.13 1.05 1.22 0.002 1.14 1.09 1.20 <0.001
No beta blocker 1.12 1.03 1.21 0.01 1.12 1.06 1.18 <0.001
Sodium (5 mEq/L decrease) 1.11 1.07 1.15 <0.001 1.12 1.09 1.14 <0.001
Systolic blood pressure (10 mm Hg decrease)
1.09 1.07 1.11 <0.001 1.11 1.09 1.12 <0.001
Urea (5 mEq/dL increase) 1.07 1.05 1.09 <0.001 1.08 1.07 1.09 <0.001
Haemoglobin (g/dL decrease)
1.06 1.04 1.08 <0.001 1.05 1.04 1.06 <0.001
Male 1.05 0.98 1.14 0.167 1.10 1.05 1.15 <0.001
NYHA III/IV 1.05 0.96 1.15 0.312 1.18 1.12 1.25 <0.001
Creatinine (10 umol/L increase)
1.02 1.01 1.02 <0.001 1.01 1.01 1.01 <0.001
Potassium <3.5 (mEq/L) 1.24 1.09 1.41 0.001 1.20 1.10 1.30 <0.001
Potassium 3.5-4.5 (mEq/L) 1 1
Potassium 4.5-5.5 (mEq/L) 1.07 0.98 1.16 0.124 1.06 1.00 1.11 0.048
Potassium >5.5 (mEq/L) 1.41 1.17 1.70 <0.001 1.22 1.08 1.38 0.001
Length of stay 0-4 days 1 1
Length of stay 5-8 days 1.14 1.03 1.28 0.016 1.16 1.09 1.24 <0.001
Length of stay 9-15 days 1.28 1.15 1.42 <0.001 1.33 1.25 1.41 <0.001
Length of stay ≥16 days 1.81 1.63 2 <0.001 1.77 1.67 1.88 <0.001

29National Heart Failure Audit April 2013-March 2014
Figure 11: All-cause mortality following discharge from hospital (2013/14)
Days
% S
urvi
ved
post
-dis
char
ge
100
90
80
70
60
50
40
30
20
10
0
0 100 200 300 400
No. at risk
All 35229 29905 20785 12668 5569
Figure 12: All-cause mortality following discharge from hospital by additive drug treatment on discharge (2013/14)
Days
% S
urvi
ved
post
-dis
char
ge
100
90
80
70
60
50
40
30
20
10
0
0 100 200 300 400
ACEi/ARB, beta blocker and MRAACEi/ARB and beta blockerACEi/ARBNo ACEi/ARB, beta blocker or MRA
No. at risk
ACE/ARB 2122 1877 1318 794 369
ACEi/ARB and beta blocker
7349 6611 4703 2976 1368
ACEi/ARB, beta blocker and MRA
8077 7343 5234 3190 1402
No ACEi/ARB, beta blocker or MRA
1776 1365 916 557 236
Figure 13: All-cause mortality following discharge from hospital by place of care (2013/14)
Days%
Sur
vive
d po
st-d
isch
arge
100
90
80
70
60
50
40
30
20
10
0
0 100 200 300 400
CardiologyGeneral MedicineOther
No. at risk
Cardiology 17700 15411 10835 6664 2838
General Medicine 13590 11303 7841 4733 2144
Other 3729 3031 2045 1237 565
Figure 14: All-cause mortality following discharge from hospital by cardiology follow up (2013/2014)
Days
% S
urvi
ved
post
-dis
char
ge
100
90
80
70
60
50
40
30
20
10
0
0 100 200 300 400
Cardiology follow-upNo cardiology follow-up
No. at risk
No 15502 12409 8338 4972 2184
Yes 18400 16455 11688 7215 3155

30 National Heart Failure Audit April 2013-March 2014
Figure 15: All-cause mortality following discharge from hospital by heart failure nurse follow up (2013/2014)
Days
% S
urvi
ved
post
-dis
char
ge
100
90
80
70
60
50
40
30
20
10
0
0 100 200 300 400
HF nurse follow-upNo HF nurse follow-up
No. at risk
No 14298 11981 8426 5112 2252
Yes 19321 16609 11448 6991 3076

31National Heart Failure Audit April 2013-March 2014
5.10.3 Five-year mortality (2009-14)
Overall the five year mortality for 2009-14 is 45.5%, (table 44). Predictably, these mortality rates increase with age, with patients over 75 years almost twice as likely to die as those in the under-75 age group. Women and men had approximately similar mortality rates (table 45). Five year mortality varies by the main place of care of the patient, those cared for in a cardiology setting have a lower mortality rate than those in non-cardiology settings (table 45).
Age is the strongest predictor of death even when other variables are accounted for (table 46).
Table 45: Five year mortality (2009-14)
Variable Analysis Records (n)
Deaths (n)
Mortality (%)
Median follow-up (days)
Overall mortality Overall mortality 125604 57169 45.5 473
Main place of care Cardiology 62210 24368 39.2 527
Main place of care General medicine 50370 26004 51.6 441
Main place of care Other 12678 6679 52.7 402
Age 16-74 45661 13419 29.4 643
Age 75+ 79937 43746 54.7 402
Gender Women 54717 25543 46.7 463
Gender Men 70819 31593 44.6 483
Diagnosis No LVSD 42701 21187 49.6 441
Diagnosis LVSD 79186 33967 42.9 493
ACE inhibitor (all) No ACE inhibitor 35724 18825 52.7 366
ACE inhibitor (all) ACE inhibitor 71344 28713 40.2 546
ACE inhibitor (LVSD only) No ACE inhibitor 18659 9681 51.9 434
ACE inhibitor (LVSD only) ACE inhibitor 50148 18956 37.8 561
ACEI/ARB (all) No ACEI or ARB 22885 13274 58.0 366
ACEI/ARB (all) ACEI and/or ARB 87211 35200 40.4 546
ACEI/ARB (LVSD only) No ACEI or ARB 10663 6236 58.5 352
ACEI/ARB (LVSD only) ACEI and/or ARB 60090 23003 38.3 557
Discharge by use of BB Not discharged on BB 31671 17999 56.8 456
Discharge by use of BB Discharged on BB 79493 31668 39.8 500
Beta Blockers (LVSD) No beta blocker 15595 8860 56.8 458
Beta Blockers (LVSD) Beta blocker 55495 20964 37.8 520
Loop diuretic (all) Not discharged on loop diuretics 10935 3840 35.1 595
Loop diuretic (all) Discharged on loop diuretics 109447 50892 46.5 467
Loop diuretic (LVSD) Not discharged on loop diuretics 7829 2384 30.5 628
Loop diuretic (LVSD) Discharged on loop diuretics 67887 30132 44.4 484
Additive drugs No ACEI/ARB, beta blocker or MRA 8138 5088 62.5 345
Additive drugs Discharged on ACEI/ARB only 12680 6561 51.7 569
Additive drugs Discharged on ACEI/ARB and beta blocker 29736 11104 37.3 586
Additive drugs Discharged on ACEI/ARB, beta blocker and MRA 25883 8773 33.9 546
Additive drugs (LVSD only) No ACEI/ARB, beta blocker or MRA 3060 1991 65.1 302
Additive drugs (LVSD only) Discharged on ACEI/ARB only 6499 3396 52.3 559
Additive drugs (LVSD only) Discharged on ACEI/ARB and beta blocker 20469 7333 35.8 601
Additive drugs (LVSD only) Discharged on ACEI/ARB, beta blocker and MRA 21016 6751 32.1 553
HF nurse follow-up No HF nurse follow-up 53449 25802 48.3 458
HF nurse follow-up HF nurse follow-up 66002 28388 43.0 490
Cardiology follow-up No cardiology follow-up 55773 30450 54.6 402
Cardiology follow-up Cardiology follow-up 64794 24010 37.1 552

32 National Heart Failure Audit April 2013-March 2014
Table 46: All-cause 5 year post-discharge mortality cox proportional hazards model (2009-14)
n=83547 HR Lower CI Upper CI p-value
Age (≥75 year) 1.99 1.94 2.04 <0.001
No ACE inhibitor and/or ARB
1.44 1.41 1.48 <0.001
No cardiology follow-up 1.38 1.35 1.41 <0.001
No beta blocker 1.26 1.24 1.29 <0.001
Valve disease 1.25 1.22 1.28 <0.001
Ischaemic heart disease
1.25 1.22 1.28 <0.001
Loop Diuretics 1.24 1.20 1.30 <0.001
Not cardiology in patient
1.15 1.12 1.17 <0.001
Male 1.14 1.12 1.17 <0.001
NYHA III/IV 1.13 1.10 1.16 <0.001
Length of stay 0- 4 days 1
Length of stay 5- 8 days 1.22 1.18 1.25 <0.001
Length of stay 9-15 days
1.45 1.41 1.49 <0.001
Length of stay ≥16 days 1.86 1.80 1.91 <0.001
Figure 16: All-cause mortality following discharge from hospital (2009-14)
Year
% S
urvi
ved
post
-dis
char
ge
100
90
80
70
60
50
40
30
20
10
0
0 1 2 3 4 5
No. at risk
All 125604 74015 43646 23880 10086 1631
Figure 17: All-cause mortality following discharge from hospital by additive drug treatment on discharge (2009-14)
Year
% S
urvi
ved
post
-dis
char
ge
100
90
80
70
60
50
40
30
20
10
0
0 1 2 3 4 5
ACEi/ARB, beta blocker and MRAACEi/ARB and beta blockerACEi/ARBNo ACEi/ARB, beta blocker or MRA
No. at risk
ACEi inhibitor/ARB
12680 8107 5245 3112 1412 233
ACEi inhibitor/ARB and beta blocker
29736 19770 12420 7093 2996 520
ACEi inhibitor/ARB, beta blocker and MRA
25883 16814 9897 5340 2230 304
No ACEi/ARB, beta blocker or MRA
8138 3920 2349 1255 501 90

33National Heart Failure Audit April 2013-March 2014
Figure 18: Overall all cause mortality following discharge from hospital by place of in-hospital care (2009-14)
Year
% S
urvi
ved
post
-dis
char
ge
100
90
80
70
60
50
40
30
20
10
0
CardiologyGeneral MedicineOther
0 1 2 3 4 5
No. at risk
Cardiology 62210 38840 23505 13113 5695 956
General Medicine
50370 28316 16250 8722 3498 516
Other 12678 6712 3828 2041 891 159
Figure 19: Overall all cause mortality following discharge from hospital by cardiology follow up (2009-14)
Year
% S
urvi
ved
post
-dis
char
ge
100
90
80
70
60
50
40
30
20
10
0
0 1 2 3 4 5
Cardiology follow-upNo cardiology follow-up
No. at risk
No 55773 29553 16623 8540 3364 514
Yes 64794 41781 25523 14545 6349 1051
Figure 20: Overall all cause mortality following discharge from hospital by heart failure nurse follow up (2009-14)
Year%
Sur
vive
d po
st-d
isch
arge
100
90
80
70
60
50
40
30
20
10
0
0 1 2 3 4 5
HF nurse follow-upNo HF nurse follow-up
No. at risk
No 53449 30679 18258 10037 4166 652
Yes 66002 39785 23331 12638 5360 865

34 National Heart Failure Audit April 2013-March 2014
Trus
t nam
eN
HS
Trus
t co
deTr
ust
reco
rds
subm
itte
d
HES
pr
imar
y H
F di
scha
rges
% H
ES
subm
itted
Par
tici
pati
on
stat
usN
ICO
R
hosp
ital
co
de
Hos
pita
l nam
eH
ospi
tal
reco
rds
subm
itte
d
6.1
Par
tici
pati
on a
nd c
ase
asce
rtai
nmen
tC
ase
asce
rtai
nmen
t is
mea
sure
d ag
ains
t the
num
ber
of e
mer
genc
y he
art f
ailu
re a
dmis
sion
s w
ith a
pri
mar
y di
scha
rge
diag
nosi
s of
hea
rt fa
ilure
, as
reco
rded
by
Hos
pita
l Epi
sode
St
atis
tics
(HES
) in
Engl
and
and
the
Pat
ient
Epi
sode
Dat
abas
e of
Wal
es (P
EDW
).
Cas
e as
cert
ainm
ent i
s re
port
ed b
y Tr
ust a
nd H
ealt
h B
oard
, alt
houg
h th
e nu
mbe
r of
rec
ords
sub
mitt
ed b
y ea
ch h
ospi
tal i
s al
so in
clud
ed in
this
tabl
e. T
rust
s ar
e co
unte
d as
fully
pa
rtic
ipat
ing
if th
ey s
ubm
itted
at l
east
70%
of t
heir
HES
figu
res
to th
e au
dit.
6.1.
1 P
arti
cipa
tion
and
cas
e as
cert
ainm
ent i
n En
glan
d
Engl
and
and
Wal
es54
654
6394
185
%
Engl
and
5142
859
820
86%
Ain
tree
Uni
vers
ity H
ospi
tal N
HS
Foun
datio
n Tr
ust
REM
467
394
119%
Yes
FAZ
Uni
vers
ity H
ospi
tal A
intr
ee46
7
Air
edal
e N
HS
Foun
datio
n Tr
ust
RC
F26
126
110
0%Ye
sA
IRA
ired
ale
Gen
eral
Hos
pita
l26
1
Ash
ford
and
St P
eter
's H
ospi
tals
NH
S Tr
ust
RTK
432
334
129%
Yes
SPH
St P
eter
's H
ospi
tal
432
Bar
king
, Hav
erin
g an
d R
edbr
idge
Uni
vers
ity H
ospi
tals
N
HS
Trus
tR
F439
865
061
%N
oK
GG
Kin
g G
eorg
e H
ospi
tal
122
OLD
Que
en's
Hos
pita
l Rom
ford
276
Bar
net a
nd C
hase
Far
m H
ospi
tals
NH
S Tr
ust
RVL
450
484
93%
Yes
BN
TB
arne
t Gen
eral
Hos
pita
l41
8
CH
SC
hase
Far
m H
ospi
tal
32
Bar
nsle
y H
ospi
tal N
HS
Foun
datio
n Tr
ust
RFF
254
328
77%
Yes
BA
RB
arns
ley
Hos
pita
l25
4
Bar
ts H
ealt
h N
HS
Trus
tR
1H83
910
4081
%Ye
s
NW
GN
ewha
m U
nive
rsity
Hos
pita
l30
5
SBH
St B
arth
olom
ews
Hos
pita
l6
LCH
The
Lond
on C
hest
Hos
pita
l29
LON
The
Roy
al H
ospi
tal L
ondo
n15
5
WH
CW
hipp
s C
ross
Uni
vers
ity H
ospi
tal
344
Bas
ildon
and
Thu
rroc
k U
nive
rsity
Hos
pita
ls N
HS
Foun
datio
n Tr
ust
RD
D36
440
690
%Ye
sB
AS
Bas
ildon
Uni
vers
ity H
ospi
tal
364
Bed
ford
Hos
pita
l NH
S Tr
ust
RC
125
925
810
0%Ye
sB
EDB
edfo
rd H
ospi
tal
259
6 H
ospi
tal-
leve
l ana
lysi
s

35National Heart Failure Audit April 2013-March 2014
Bla
ckpo
ol T
each
ing
Hos
pita
ls N
HS
Foun
datio
n Tr
ust
RXL
654
468
140%
Yes
VIC
Bla
ckpo
ol V
icto
ria
Hos
pita
l65
4
Bol
ton
NH
S Fo
unda
tion
Trus
tR
MC
192
373
51%
No
BO
LR
oyal
Bol
ton
Hos
pita
l19
2
Bra
dfor
d Te
achi
ng H
ospi
tals
NH
S Fo
unda
tion
Trus
tR
AE
411
492
84%
Yes
BR
DB
radf
ord
Roy
al In
firm
ary
411
Bri
ghto
n an
d Su
ssex
Uni
vers
ity H
ospi
tals
NH
S Tr
ust
RXH
690
543
127%
Yes
PR
HP
rinc
ess
Roy
al H
ospi
tal (
Hay
war
ds H
eath
)23
1
RSC
Roy
al S
usse
x C
ount
y H
ospi
tal
459
Buc
king
ham
shir
e H
ealt
hcar
e N
HS
Trus
tR
XQ38
628
313
6%Ye
sSM
VSt
oke
Man
devi
lle H
ospi
tal
167
AM
GW
ycom
be H
ospi
tal
219
Bur
ton
Hos
pita
ls N
HS
Foun
datio
n Tr
ust
RJF
257
295
87%
Yes
BR
TQ
ueen
's H
ospi
tal (
Bur
ton)
257
Cal
derd
ale
and
Hud
ders
field
NH
S Fo
unda
tion
Trus
tR
WY
587
470
125%
Yes
RH
IC
alde
rdal
e R
oyal
Hos
pita
l26
2
HU
DH
udde
rsfie
ld R
oyal
Infir
mar
y32
5
Cam
brid
ge U
nive
rsity
Hos
pita
ls N
HS
Foun
datio
n Tr
ust
RG
T45
246
497
%Ye
sA
DD
Add
enbr
ooke
's H
ospi
tal
452
Cen
tral
Man
ches
ter
Uni
vers
ity H
ospi
tals
NH
S Fo
unda
tion
Trus
tR
W3-
X29
837
979
%Ye
sM
RI
Man
ches
ter
Roy
al In
firm
ary
298
TRA
Traf
ford
Gen
eral
Hos
pita
l 0
Che
lsea
and
Wes
tmin
ster
Hos
pita
l NH
S Fo
unda
tion
Trus
tR
QM
127
141
90%
Yes
WES
Che
lsea
and
Wes
tmin
iste
r H
ospi
tal
127
Che
ster
field
Roy
al H
ospi
tal N
HS
Foun
datio
n Tr
ust
RFS
202
337
60%
No
CH
EC
hest
erfie
ld R
oyal
Hos
pita
l20
2
City
Hos
pita
ls S
unde
rlan
d N
HS
Foun
datio
n Tr
ust
RLN
476
369
129%
Yes
SUN
Sund
erla
nd R
oyal
Hos
pita
l47
6
Col
ches
ter
Hos
pita
l Uni
vers
ity N
HS
Foun
datio
n Tr
ust
RD
E50
349
610
1%Ye
sC
OL
Col
ches
ter
Gen
eral
Hos
pita
l50
3
Cou
ntes
s of
Che
ster
Hos
pita
l NH
S Fo
unda
tion
Trus
tR
JR39
326
814
7%Ye
sC
OC
Cou
ntes
s of
Che
ster
Hos
pita
l39
3
Cou
nty
Dur
ham
and
Dar
lingt
on N
HS
Foun
datio
n Tr
ust
RXP
583
558
104%
Yes
DA
RD
arlin
gton
Mem
oria
l Hos
pita
l26
7
DR
YU
nive
rsity
Hos
pita
l of N
orth
Dur
ham
316
Cro
ydon
Hea
lth
Serv
ices
NH
S Tr
ust
RJ6
356
323
110%
Yes
MAY
Cro
ydon
Uni
vers
ity H
ospi
tal
356
Dar
tfor
d an
d G
rave
sham
NH
S Tr
ust
RN
7-X
359
171
210%
Yes
DVH
Dar
ent V
alle
y H
ospi
tal
359
Der
by H
ospi
tals
NH
S Fo
unda
tion
Trus
tR
TG40
165
062
%N
oD
ERR
oyal
Der
by H
ospi
tal
401
Don
cast
er a
nd B
asse
tlaw
Hos
pita
ls N
HS
Foun
datio
n Tr
ust
RP
533
449
567
%N
oB
SLB
asse
tlaw
Hos
pita
l12
0
DID
Don
cast
er R
oyal
Infir
mar
y21
4
Dor
set C
ount
y H
ospi
tal N
HS
Foun
datio
n Tr
ust
RB
D21
118
011
7%Ye
sW
DH
Dor
set C
ount
y H
ospi
tal
211
Ealin
g H
ospi
tal N
HS
Trus
tR
C3
282
203
139%
Yes
EAL
Ealin
g H
ospi
tal
282
East
and
Nor
th H
ertf
ords
hire
NH
S Tr
ust
RW
H32
129
311
0%Ye
sLI
SLi
ster
Hos
pita
l22
8
QEW
Que
en E
lizab
eth
II H
ospi
tal
93

36 National Heart Failure Audit April 2013-March 2014
East
Che
shir
e N
HS
Trus
tR
JN22
221
410
4%Ye
sM
ACM
accl
esfie
ld D
istr
ict G
ener
al H
ospi
tal
222
East
Ken
t Hos
pita
ls U
nive
rsity
NH
S Fo
unda
tion
Trus
tR
VV62
377
680
%Ye
s
KC
CK
ent a
nd C
ante
rbur
y H
ospi
tal
211
QEQ
Que
en E
lizab
eth
the
Que
en M
othe
r H
ospi
tal
182
WH
HW
illia
m H
arve
y H
ospi
tal
230
East
Lan
cash
ire
Hos
pita
ls N
HS
Trus
tR
XR48
749
499
%Ye
sB
LAR
oyal
Bla
ckbu
rn H
ospi
tal
487
East
Sus
sex
Hea
lthc
are
NH
S Tr
ust
RXC
458
512
89%
Yes
CG
HC
onqu
est H
ospi
tal
222
Epso
m a
nd S
t Hel
ier
Uni
vers
ity H
ospi
tals
NH
S Tr
ust
RVR
-X40
537
810
7%Ye
s
DG
EEa
stbo
urne
Dis
tric
t Gen
eral
Hos
pita
l23
6
EPS
Epso
m H
ospi
tal
177
SHC
St H
elie
r H
ospi
tal
228
Frim
ley
Par
k H
ospi
tal N
HS
Foun
datio
n Tr
ust
RD
U48
938
612
7%Ye
sFR
MFr
imle
y P
ark
Hos
pita
l48
9
Gat
eshe
ad H
ealt
h N
HS
Foun
datio
n Tr
ust
RR
7-X
377
269
140%
Yes
QEG
Que
en E
lizab
eth
Hos
pita
l (G
ates
head
)37
7
Geo
rge
Elio
t Hos
pita
l NH
S Tr
ust
RLT
163
241
68%
No
NU
NG
eorg
e El
iot H
ospi
tal
163
Glo
uces
ters
hire
Hos
pita
ls N
HS
Foun
datio
n Tr
ust
RTE
198
544
36%
No
CH
GC
helt
enha
m G
ener
al H
ospi
tal
76
GLO
Glo
uces
ters
hire
Roy
al H
ospi
tal
122
Gre
at W
este
rn H
ospi
tals
NH
S Fo
unda
tion
Trus
tR
N3
498
381
131%
Yes
PM
SG
reat
Wes
tern
Hos
pita
l49
8
Guy
's a
nd S
t Tho
mas
' NH
S Fo
unda
tion
Trus
tR
J1-X
313
336
93%
Yes
STH
St T
hom
as' H
ospi
tal
313
Ham
pshi
re H
ospi
tals
NH
S Fo
unda
tion
Trus
tR
N5-
X42
140
710
3%Ye
sN
HH
Bas
ings
toke
and
Nor
th H
amps
hire
Hos
pita
l25
9
RH
CR
oyal
Ham
pshi
re C
ount
y H
ospi
tal
162
Har
roga
te a
nd D
istr
ict N
HS
Foun
datio
n Tr
ust
RC
D89
194
46%
No
HA
RH
arro
gate
Dis
tric
t Hos
pita
l89
Hea
rt o
f Eng
land
NH
S Fo
unda
tion
Trus
tR
R1-
X36
895
139
%N
o
EBH
Bir
min
gham
Hea
rtla
nds
Hos
pita
l17
6
GH
SG
ood
Hop
e H
ospi
tal
53
SOL
Solih
ull H
ospi
tal
139
Hea
ther
woo
d an
d W
exha
m P
ark
Hos
pita
ls N
HS
Foun
datio
n Tr
ust
RD
728
037
974
%Ye
sW
EXW
exha
m P
ark
Hos
pita
l28
0
Hin
chin
gbro
oke
Hea
lth
Car
e N
HS
Trus
tR
-X16
167
10%
No
HIN
Hin
chin
gbro
oke
Hos
pita
l16
Hom
erto
n U
nive
rsity
Hos
pita
l NH
S Fo
unda
tion
Trus
tR
QX
253
245
103%
Yes
HO
MH
omer
ton
Uni
vers
ity H
ospi
tal
253
Trus
t nam
eN
HS
Trus
t co
deTr
ust
reco
rds
subm
itte
d
HES
pr
imar
y H
F di
scha
rges
% H
ES
subm
itted
Par
tici
pati
on
stat
usN
ICO
R
hosp
ital
co
de
Hos
pita
l nam
eH
ospi
tal
reco
rds
subm
itte
d

37National Heart Failure Audit April 2013-March 2014
Hul
l and
Eas
t Yor
kshi
re H
ospi
tals
NH
S Tr
ust
RW
A80
251
015
7%Ye
sC
HH
Cas
tle H
ill H
ospi
tal
593
HR
IH
ull R
oyal
Infir
mar
y20
9
Impe
rial
Col
lege
Hea
lthc
are
NH
S Tr
ust
RYJ
455
697
65%
No
CC
HC
hari
ng C
ross
Hos
pita
l85
HA
MH
amm
ersm
ith H
ospi
tal
283
STM
St M
ary'
s H
ospi
tal P
addi
ngto
n87
Isle
of W
ight
NH
S P
CT
R1F
-X21
724
389
%Ye
sIO
WSt
Mar
y's
Hos
pita
l, N
ewpo
rt21
7
Jam
es P
aget
Uni
vers
ity H
ospi
tals
NH
S Fo
unda
tion
Trus
tR
GP
327
337
97%
Yes
JPH
Jam
es P
aget
Uni
vers
ity H
ospi
tal
327
Ket
teri
ng G
ener
al H
ospi
tal N
HS
Foun
datio
n Tr
ust
RN
Q37
645
383
%Ye
sK
GH
Ket
teri
ng G
ener
al H
ospi
tal
376
Kin
g’s
Col
lege
Hos
pita
l NH
S Fo
unda
tion
Trus
t*R
JZ33
281
341
%N
o
KC
H K
ing'
s C
olle
ge H
ospi
tal
332
BR
O P
rinc
ess
Roy
al U
nive
rsity
Hos
pita
l (B
rom
ley)
0
Kin
gsto
n H
ospi
tal N
HS
Trus
tR
AX
177
325
54%
No
KTH
Kin
gsto
n H
ospi
tal
177
Lanc
ashi
re T
each
ing
Hos
pita
ls N
HS
Foun
datio
n Tr
ust
RXN
688
468
147%
Yes
CH
OC
horl
ey a
nd S
outh
Rib
ble
Hos
pita
l22
9
RP
HR
oyal
Pre
ston
Hos
pita
l45
9
Leed
s Te
achi
ng H
ospi
tals
NH
S Tr
ust
RR
878
799
179
%Ye
sLG
ILe
eds
Gen
eral
Infir
mar
y78
7
Lew
isha
m H
ealt
hcar
e N
HS
trus
t/Le
wis
ham
and
G
reen
wic
h N
HS
Trus
t†R
J242
642
810
0%Ye
sG
WH
Que
en E
lizab
eth
Hos
pita
l (W
oolw
ich)
144
UH
L U
nive
rsity
Hos
pita
l Lew
isha
m28
2
Live
rpoo
l Hea
rt a
nd C
hest
Hos
pita
l NH
S Fo
unda
tion
Trus
tR
BQ
3833
115%
Yes
BH
LLi
verp
ool H
eart
and
Che
st H
ospi
tal
38
Luto
n an
d D
unst
able
Hos
pita
l NH
S Fo
unda
tion
Trus
tR
C9
316
303
104%
Yes
LDH
Luto
n an
d D
unst
able
Hos
pita
l31
6
Mai
dsto
ne a
nd T
unbr
idge
Wel
ls N
HS
Trus
tR
WF
382
424
90%
Yes
MA
IM
aids
tone
Hos
pita
l17
8
KSX
Tunb
ridg
e W
ells
Hos
pita
l20
4
Med
way
NH
S Fo
unda
tion
Trus
tR
PA16
728
658
%N
oM
DW
Med
way
Mar
itim
e H
ospi
tal
167
Mid
Che
shir
e H
ospi
tals
NH
S Fo
unda
tion
Trus
tR
BT
198
256
77%
Yes
LGH
Leig
hton
Hos
pita
l19
8
Mid
Ess
ex H
ospi
tal S
ervi
ces
NH
S Tr
ust
RQ
821
437
158
%N
oB
FHB
room
field
Hos
pita
l21
4
Mid
Sta
ffor
dshi
re N
HS
Foun
datio
n Tr
ust
RJD
-X13
423
557
%N
oSD
GSt
affo
rd H
ospi
tal
134
Mid
Yor
kshi
re H
ospi
tals
NH
S Tr
ust
RXF
-X80
464
812
4%Ye
sD
EWD
ewsb
ury
and
Dis
tric
t Hos
pita
l33
6
PIN
Pin
derfi
elds
Hos
pita
l46
8
* B
RO
join
ed K
ing’
s C
olle
ge H
ospi
tal N
HS
Foun
datio
n Tr
ust a
fter
Oct
ober
201
3. W
e ca
nnot
vou
ch fo
r th
e ac
cura
cy o
f the
cas
e as
cert
ainm
ent fi
gure
s fo
r th
is T
rust
due
to th
ese
inst
itutio
nal c
hang
es.
† G
WH
com
bine
d w
ith U
HL
to fo
rm L
ewis
ham
and
Gre
enw
ich
NH
S Tr
ust a
fter
Oct
ober
201
3. W
e ca
nnot
vou
ch fo
r th
e ac
cura
cy o
f the
cas
e as
cert
ainm
ent fi
gure
s fo
r th
is T
rust
due
to th
ese
inst
itutio
nal c
hang
es.
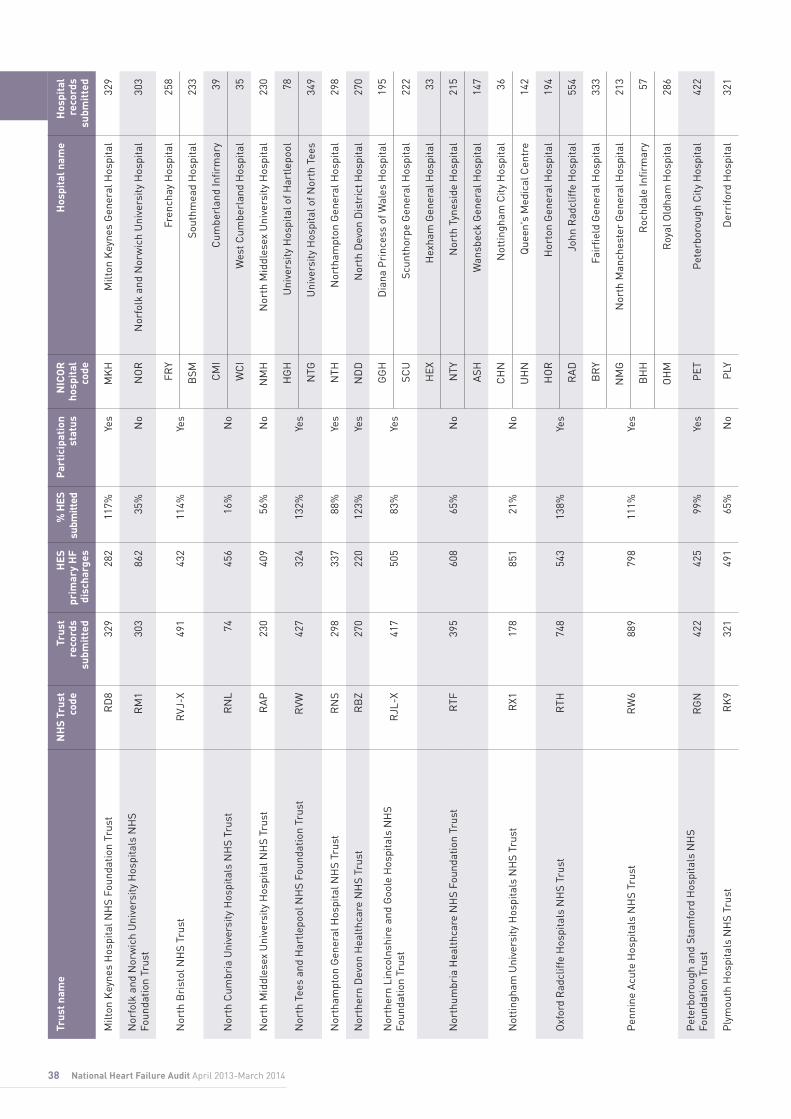
38 National Heart Failure Audit April 2013-March 2014
Milt
on K
eyne
s H
ospi
tal N
HS
Foun
datio
n Tr
ust
RD
832
928
211
7%Ye
sM
KH
Milt
on K
eyne
s G
ener
al H
ospi
tal
329
Nor
folk
and
Nor
wic
h U
nive
rsity
Hos
pita
ls N
HS
Fo
unda
tion
Trus
tR
M1
303
862
35%
No
NO
RN
orfo
lk a
nd N
orw
ich
Uni
vers
ity H
ospi
tal
303
Nor
th B
rist
ol N
HS
Trus
tR
VJ-X
491
432
114%
Yes
FRY
Fren
chay
Hos
pita
l25
8
BSM
Sout
hmea
d H
ospi
tal
233
Nor
th C
umbr
ia U
nive
rsity
Hos
pita
ls N
HS
Trus
tR
NL
7445
616
%N
oC
MI
Cum
berl
and
Infir
mar
y39
WC
IW
est C
umbe
rlan
d H
ospi
tal
35
Nor
th M
iddl
esex
Uni
vers
ity H
ospi
tal N
HS
Trus
tR
AP
230
409
56%
No
NM
HN
orth
Mid
dles
ex U
nive
rsity
Hos
pita
l23
0
Nor
th T
ees
and
Har
tlepo
ol N
HS
Foun
datio
n Tr
ust
RVW
427
324
132%
Yes
HG
HU
nive
rsity
Hos
pita
l of H
artle
pool
78
NTG
Uni
vers
ity H
ospi
tal o
f Nor
th T
ees
349
Nor
tham
pton
Gen
eral
Hos
pita
l NH
S Tr
ust
RN
S29
833
788
%Ye
sN
THN
orth
ampt
on G
ener
al H
ospi
tal
298
Nor
ther
n D
evon
Hea
lthc
are
NH
S Tr
ust
RB
Z27
022
012
3%Ye
sN
DD
Nor
th D
evon
Dis
tric
t Hos
pita
l27
0
Nor
ther
n Li
ncol
nshi
re a
nd G
oole
Hos
pita
ls N
HS
Foun
datio
n Tr
ust
RJL
-X41
750
583
%Ye
sG
GH
Dia
na P
rinc
ess
of W
ales
Hos
pita
l19
5
SCU
Scun
thor
pe G
ener
al H
ospi
tal
222
Nor
thum
bria
Hea
lthc
are
NH
S Fo
unda
tion
Trus
tR
TF39
560
865
%N
o
HEX
Hex
ham
Gen
eral
Hos
pita
l33
NTY
Nor
th T
ynes
ide
Hos
pita
l21
5
ASH
Wan
sbec
k G
ener
al H
ospi
tal
147
Not
tingh
am U
nive
rsity
Hos
pita
ls N
HS
Trus
tR
X117
885
121
%N
oC
HN
Not
tingh
am C
ity H
ospi
tal
36
UH
NQ
ueen
's M
edic
al C
entr
e14
2
Oxf
ord
Rad
cliff
e H
ospi
tals
NH
S Tr
ust
RTH
748
543
138%
Yes
HO
RH
orto
n G
ener
al H
ospi
tal
194
RA
DJo
hn R
adcl
iffe
Hos
pita
l55
4
Pen
nine
Acu
te H
ospi
tals
NH
S Tr
ust
RW
688
979
811
1%Ye
s
BR
YFa
irfie
ld G
ener
al H
ospi
tal
333
NM
GN
orth
Man
ches
ter
Gen
eral
Hos
pita
l21
3
BH
HR
ochd
ale
Infir
mar
y57
OH
MR
oyal
Old
ham
Hos
pita
l28
6
Pet
erbo
roug
h an
d St
amfo
rd H
ospi
tals
NH
S
Foun
datio
n Tr
ust
RG
N42
242
599
%Ye
sP
ETP
eter
boro
ugh
City
Hos
pita
l42
2
Ply
mou
th H
ospi
tals
NH
S Tr
ust
RK
932
149
165
%N
oP
LYD
erri
ford
Hos
pita
l32
1
Trus
t nam
eN
HS
Trus
t co
deTr
ust
reco
rds
subm
itte
d
HES
pr
imar
y H
F di
scha
rges
% H
ES
subm
itted
Par
tici
pati
on
stat
usN
ICO
R
hosp
ital
co
de
Hos
pita
l nam
eH
ospi
tal
reco
rds
subm
itte
d

39National Heart Failure Audit April 2013-March 2014
Poo
le H
ospi
tal N
HS
Foun
datio
n Tr
ust
RD
325
623
011
1%Ye
sP
GH
Poo
le G
ener
al H
ospi
tal
256
Por
tsm
outh
Hos
pita
ls N
HS
Trus
tR
HU
398
535
74%
Yes
QA
PQ
ueen
Ale
xand
ra H
ospi
tal
398
Rot
herh
am N
HS
Foun
datio
n Tr
ust
RFR
300
308
97%
Yes
RO
TR
othe
rham
Hos
pita
l30
0
Roy
al B
erks
hire
NH
S Fo
unda
tion
Trus
tR
HW
407
446
91%
Yes
BH
RR
oyal
Ber
kshi
re H
ospi
tal
407
Roy
al B
rom
pton
and
Har
efiel
d N
HS
Foun
datio
n Tr
ust
RT3
403
186
217%
Yes
HH
Har
efiel
d H
ospi
tal
199
NH
BR
oyal
Bro
mpt
on H
ospi
tal
204
Roy
al C
ornw
all H
ospi
tals
NH
S Tr
ust
REF
-X29
540
972
%Ye
sR
CH
Roy
al C
ornw
all H
ospi
tal
295
Roy
al D
evon
and
Exe
ter
NH
S Fo
unda
tion
Trus
tR
H8
375
308
122%
Yes
RD
ER
oyal
Dev
on &
Exe
ter
Hos
pita
l37
5
Roy
al F
ree
Lond
on N
HS
Trus
tR
AL
273
340
80%
Yes
RFH
Roy
al F
ree
Hos
pita
l27
3
Roy
al L
iver
pool
and
Bro
adgr
een
Uni
vers
ity H
ospi
tals
N
HS
Trus
tR
Q6
339
273
124%
Yes
RLU
Roy
al L
iver
pool
Uni
vers
ity H
ospi
tal
339
Roy
al S
urre
y C
ount
y H
ospi
tal N
HS
Foun
datio
n Tr
ust
RA
220
918
911
1%Ye
sR
SUR
oyal
Sur
rey
Cou
nty
Hos
pita
l20
9
Roy
al U
nite
d H
ospi
tal B
ath
NH
S Tr
ust
RD
117
239
943
%N
oB
ATR
oyal
Uni
ted
Hos
pita
l Bat
h17
2
Salfo
rd R
oyal
NH
S Fo
unda
tion
Trus
tR
M3
378
267
142%
Yes
SLF
Salfo
rd R
oyal
37
8
Salis
bury
NH
S Fo
unda
tion
Trus
tR
NZ
199
170
117%
Yes
SAL
Salis
bury
Dis
tric
t Hos
pita
l19
9
Sand
wel
l and
Wes
t Bir
min
gham
Hos
pita
ls N
HS
Trus
tR
XK-X
361
682
53%
No
DU
DB
irm
ingh
am C
ity H
ospi
tal
174
SAN
Sand
wel
l Gen
eral
Hos
pita
l18
7
Shef
field
Tea
chin
g H
ospi
tals
NH
S Fo
unda
tion
Trus
tR
HQ
476
693
69%
No
NG
SN
orth
ern
Gen
eral
Hos
pita
l47
6
Sher
woo
d Fo
rest
Hos
pita
ls N
HS
Foun
datio
n Tr
ust
RK
541
339
810
4%Ye
sK
MH
Kin
g's
Mill
Hos
pita
l40
7
NH
NN
ewar
k H
ospi
tal
6
Shre
wsb
ury
and
Telfo
rd H
ospi
tals
NH
S Tr
ust
RXW
127
532
24%
No
TLF
Pri
nces
s R
oyal
Hos
pita
l (Te
lford
)59
RSS
Roy
al S
hrew
sbur
y H
ospi
tal
68
Sout
h D
evon
Hea
lthc
are
NH
S Fo
unda
tion
Trus
tR
A9
507
406
125%
Yes
TOR
Torb
ay H
ospi
tal
507
Sout
h Lo
ndon
Hea
lthc
are
NH
S Tr
ust‡
RYQ
177
139
127%
Yes
BR
O P
rinc
ess
Roy
al U
nive
rsity
Hos
pita
l (B
rom
ley)
2
GW
H Q
ueen
Eliz
abet
h H
ospi
tal (
Woo
lwic
h)17
5
Sout
h Te
es H
ospi
tals
NH
S Fo
unda
tion
Trus
tR
TR37
234
210
9%Ye
sFR
HFr
iara
ge H
ospi
tal
26
SCM
Jam
es C
ook
Uni
vers
ity H
ospi
tal
346
‡ T
he S
outh
Lon
don
Hea
lthc
are
NH
S Tr
ust w
as d
isso
lved
aft
er O
ctob
er 2
013.
We
cann
ot v
ouch
for
the
accu
racy
of t
he c
ase
asce
rtai
nmen
t figu
res
for
this
Tru
st d
ue to
thes
e in
stitu
tiona
l cha
nges
.

Title
40 National Heart Failure Audit April 2013-March 2014
Sout
h Ty
nesi
de N
HS
Foun
datio
n Tr
ust
RE9
256
121
212%
Yes
STD
Sout
h Ty
nesi
de D
istr
ict H
ospi
tal
256
Sout
h W
arw
icks
hire
NH
S Fo
unda
tion
Trus
t R
JC21
318
511
5%Ye
sW
AR
War
wic
k H
ospi
tal
213
Sout
hend
Uni
vers
ity H
ospi
tal N
HS
Foun
datio
n Tr
ust
RA
J52
549
210
7%Ye
sSE
HSo
uthe
nd H
ospi
tal
525
Sout
hpor
t and
Orm
skir
k H
ospi
tal N
HS
Trus
tR
VY26
423
011
5%Ye
sSO
USo
uthp
ort a
nd F
orm
by D
istr
ict G
ener
al
Hos
pita
l26
4
St G
eorg
e's
Hea
lthc
are
NH
S Tr
ust
RJ7
516
528
98%
Yes
GEO
St G
eorg
e's
Hos
pita
l51
6
St H
elen
s an
d K
now
sley
Tea
chin
g H
ospi
tals
NH
S Tr
ust
RB
N27
028
794
%Ye
sW
HI
Whi
ston
Hos
pita
l27
0
Stoc
kpor
t NH
S Fo
unda
tion
Trus
tR
WJ
333
355
94%
Yes
SHH
Step
ping
Hill
Hos
pita
l33
3
Surr
ey a
nd S
usse
x H
ealt
hcar
e N
HS
Trus
tR
TP21
638
456
%N
oES
UEa
st S
urre
y H
ospi
tal
216
Tam
esid
e H
ospi
tal N
HS
Foun
datio
n Tr
ust
RM
P26
130
586
%Ye
sTG
ATa
mes
ide
Gen
eral
Hos
pita
l26
1
Taun
ton
and
Som
erse
t NH
S Fo
unda
tion
Trus
tR
BA
291
320
91%
Yes
MP
HM
usgr
ove
Par
k H
ospi
tal
291
The
Dud
ley
Gro
up N
HS
Foun
datio
n Tr
ust
RN
A39
036
410
7%Ye
sR
US
Rus
sells
Hal
l Hos
pita
l39
0
The
Hill
ingd
on H
ospi
tals
NH
S Fo
unda
tion
Trus
tR
AS
191
248
77%
Yes
HIL
Hill
ingd
on H
ospi
tal
191
The
Ipsw
ich
Hos
pita
l NH
S Tr
ust
RG
Q17
043
839
%N
oIP
SIp
swic
h H
ospi
tal
170
The
New
cast
le U
pon
Tyne
Hos
pita
ls N
HS
Foun
datio
n Tr
ust
RTD
496
425
117%
Yes
FRE
Free
man
Hos
pita
l and
Roy
al V
icto
ria
Infir
mar
y49
6
The
Nor
th W
est L
ondo
n H
ospi
tals
NH
S Tr
ust
RV8
288
612
47%
No
CM
HC
entr
al M
iddl
esex
Hos
pita
l94
NP
HN
orth
wic
k P
ark
Hos
pita
l19
4
The
Pri
nces
s A
lexa
ndra
Hos
pita
l NH
S Tr
ust
RQ
W12
730
142
%N
oPA
HP
rinc
ess
Ale
xand
ra H
ospi
tal
127
The
Que
en E
lizab
eth
Hos
pita
l Kin
g's
Lynn
NH
S Fo
unda
tion
Trus
tR
CX
289
386
75%
Yes
QK
LQ
ueen
Eliz
abet
h H
ospi
tal (
Kin
g's
Lynn
)28
9
The
Roy
al B
ourn
emou
th a
nd C
hris
tchu
rch
Hos
pita
ls N
HS
Foun
datio
n Tr
ust
RD
Z45
545
710
0%Ye
sB
OU
Roy
al B
ourn
emou
th G
ener
al H
ospi
tal
455
The
Roy
al W
olve
rham
pton
Hos
pita
ls N
HS
Trus
tR
L414
154
326
%N
oN
CR
New
Cro
ss H
ospi
tal
141
The
Whi
ttin
gton
Hos
pita
l NH
S Tr
ust
RK
E16
024
565
%N
oW
HT
Whi
ttin
gton
Hos
pita
l16
0
Uni
ted
Linc
olns
hire
Hos
pita
ls N
HS
Trus
tR
WD
412
757
54%
No
GR
AG
rant
ham
and
Dis
tric
t Hos
pita
l96
LIN
Linc
oln
Cou
nty
Hos
pita
l12
3
PIL
Pilg
rim
Hos
pita
l19
3
Trus
t nam
eN
HS
Trus
t co
deTr
ust
reco
rds
subm
itte
d
HES
pr
imar
y H
F di
scha
rges
% H
ES
subm
itted
Par
tici
pati
on
stat
usN
ICO
R
hosp
ital
co
de
Hos
pita
l nam
eH
ospi
tal
reco
rds
subm
itte
d

41National Heart Failure Audit April 2013-March 2014
Uni
vers
ity C
olle
ge L
ondo
n H
ospi
tals
NH
S
Foun
datio
n Tr
ust
RR
V33
324
213
8%Ye
sU
CL
Uni
vers
ity C
olle
ge H
ospi
tal
333
Uni
vers
ity H
ospi
tal o
f Nor
th S
taff
ords
hire
NH
S Tr
ust
RJE
731
801
91%
Yes
STO
Uni
vers
ity H
ospi
tal o
f Nor
th S
taff
ords
hire
731
Uni
vers
ity H
ospi
tal o
f Sou
th M
anch
este
r N
HS
Fo
unda
tion
Trus
tR
M2
240
339
71%
Yes
WYT
Wyt
hens
haw
e H
ospi
tal
240
Uni
vers
ity H
ospi
tal S
outh
ampt
on N
HS
Trus
tR
HM
327
475
69%
No
SGH
Sout
ham
pton
Gen
eral
Hos
pita
l32
7
Uni
vers
ity H
ospi
tals
Bir
min
gham
NH
S Fo
unda
tion
Trus
tR
RK
-X42
161
269
%N
oQ
EBQ
ueen
Eliz
abet
h H
ospi
tal (
Edgb
asto
n)42
1
Uni
vers
ity H
ospi
tals
Bri
stol
NH
S Fo
unda
tion
Trus
tR
A7
351
281
125%
Yes
BR
IB
rist
ol R
oyal
Infir
mar
y35
1
Uni
vers
ity H
ospi
tals
Cov
entr
y an
d W
arw
icks
hire
N
HS
Trus
tR
KB
453
590
77%
Yes
WA
LU
nive
rsity
Hos
pita
l Cov
entr
y45
3
Uni
vers
ity H
ospi
tals
of L
eice
ster
NH
S Tr
ust
RW
E83
911
9170
%Ye
sG
RL
Gle
nfiel
d H
ospi
tal
709
LER
Leic
este
r R
oyal
Infir
mar
y13
0
Uni
vers
ity H
ospi
tals
of M
orec
ambe
Bay
NH
S
Foun
datio
n Tr
ust
RTX
343
352
97%
Yes
FGH
Furn
ess
Gen
eral
Hos
pita
l15
8
RLI
Roy
al L
anca
ster
Infir
mar
y18
5
Wal
sall
Hea
lthc
are
NH
S Tr
ust
RB
K25
145
355
%N
oW
MH
Man
or H
ospi
tal
251
War
ring
ton
and
Hal
ton
Hos
pita
ls N
HS
Foun
datio
n Tr
ust
RW
W98
297
33%
No
WD
GW
arri
ngto
n H
ospi
tal
98
Wes
t Her
tfor
dshi
re H
ospi
tals
NH
S Tr
ust
RW
G58
746
912
5%Ye
sW
ATW
atfo
rd G
ener
al H
ospi
tal
587
Wes
t Mid
dles
ex U
nive
rsity
Hos
pita
l NH
S Tr
ust
RFW
251
211
119%
Yes
WM
UW
est M
iddl
esex
Uni
vers
ity H
ospi
tal
251
Wes
t Suf
folk
NH
S Fo
unda
tion
Trus
tR
GR
305
291
105%
Yes
WSH
Wes
t Suf
folk
Hos
pita
l30
5
Wes
tern
Sus
sex
Hos
pita
ls N
HS
Trus
tR
YR-X
684
732
93%
Yes
STR
St R
icha
rd's
Hos
pita
l30
7
WR
GW
orth
ing
Hos
pita
l37
7
Wes
ton
Are
a H
ealt
h N
HS
Trus
tR
A3
125
228
55%
No
WG
HW
esto
n G
ener
al H
ospi
tal
125
Wir
ral U
nive
rsity
Tea
chin
g H
ospi
tal N
HS
Foun
datio
n Tr
ust
RB
L40
546
088
%Ye
sW
IRA
rrow
e P
ark
Hos
pita
l40
5
Wor
cest
ersh
ire
Acu
te H
ospi
tals
NH
S Tr
ust
RW
P-X
275
604
46%
No
RED
Ale
xand
ra H
ospi
tal
196
WR
CW
orce
ster
shir
e R
oyal
Hos
pita
l79
Wri
ghtin
gton
, Wig
an a
nd L
eigh
NH
S Fo
unda
tion
Trus
tR
RF
501
303
165%
Yes
AEI
Roy
al A
lber
t Edw
ard
Infir
mar
y50
1
Wye
Val
ley
NH
S Tr
ust
RLQ
187
208
90%
Yes
HC
HC
ount
y H
ospi
tal H
eref
ord
187
Yeov
il D
istr
ict H
ospi
tal N
HS
Foun
datio
n Tr
ust
RA
419
517
511
1%Ye
sYE
OYe
ovil
Dis
tric
t Hos
pita
l19
5
York
Tea
chin
g H
ospi
tal N
HS
Foun
datio
n Tr
ust
RC
B33
462
753
%N
oYD
HTh
e Yo
rk H
ospi
tal
334
SCA
Scar
boro
ugh
Gen
eral
Hos
pita
l0

Title
42 National Heart Failure Audit April 2013-March 2014
6.1.
2 P
arti
cipa
tion
and
cas
e as
cert
ainm
ent i
n W
ales
Hea
lth
Boa
rd n
ame
Hea
lth
Boa
rd
reco
rds
subm
itte
d
PED
W
prim
ary
HF
disc
harg
es
% P
EDW
su
bmitt
edP
arti
cipa
tion
st
atus
NIC
OR
ho
spit
al
code
Hos
pita
l nam
eH
ospi
tal
reco
rds
subm
itte
d
Engl
and
and
Wal
es54
654
6380
286
%54
654
Wal
es32
2641
2178
%32
26
Abe
rtaw
e B
ro M
orga
nnw
g U
nive
rsity
Hea
lth
Boa
rd69
680
686
%Ye
s
MO
RM
orri
ston
Hos
pita
l28
7
PO
WP
rinc
ess
Of W
ales
Hos
pita
l26
1
SIN
Sing
leto
n H
ospi
tal
148
Ane
urin
Bev
an H
ealt
h B
oard
441
891
49%
No
NEV
Nev
ill H
all H
ospi
tal
240
GW
ER
oyal
Gw
ent H
ospi
tal
201
YYF
Ysby
ty Y
stra
d Fa
wr
0
Bet
si C
adw
alad
r U
nive
rsity
Hea
lth
Boa
rd67
880
185
%Ye
s
CLW
Gla
n C
lwyd
Hos
pita
l29
6
WR
XW
rexh
am M
aelo
r H
ospi
tal
225
GW
YYs
byty
Gw
yned
d H
ospi
tal
157
Car
diff
& V
ale
Uni
vers
ity H
ealt
h B
oard
427
522
82%
Yes
LLD
Uni
vers
ity H
ospi
tal L
land
ough
169
UH
WU
nive
rsity
Hos
pita
l of W
ales
258
Cw
m T
af H
ealt
h B
oard
423
485
87%
Yes
PC
HP
rinc
e C
harl
es H
ospi
tal
272
GW
ER
oyal
Gla
mor
gan
Hos
pita
l15
1
Hyw
el D
da H
ealt
h B
oard
561
616
91%
Yes
BR
GB
rong
lais
Gen
eral
Hos
pita
l19
1
WW
GG
lang
wili
Gen
eral
Hos
pita
l86
PP
HP
rinc
e P
hilip
Hos
pita
l13
9
WYB
With
ybus
h G
ener
al H
ospi
tal
145

43National Heart Failure Audit April 2013-March 2014
Title
Trus
t nam
eN
ICO
R
hosp
ital
co
de
Hos
pita
l nam
eH
eart
failu
re
adm
issi
ons
(n)
Rec
eive
d ec
ho (%
)C
ardi
olog
y in
pati
ent
(%)
Inpu
t fro
m
cons
ulta
nt
card
iolo
gist
(%
)
Inpu
t fro
m
spec
ialis
t (%
)
Ain
tree
Uni
vers
ity H
ospi
tal N
HS
Foun
datio
n Tr
ust
FAZ
Uni
vers
ity H
ospi
tal A
intr
ee45
899
%76
%81
%92
%
Air
edal
e N
HS
Foun
datio
n Tr
ust
AIR
Air
edal
e G
ener
al H
ospi
tal
233
90%
29%
35%
44%
Ash
ford
and
St P
eter
's H
ospi
tals
NH
S Tr
ust
SPH
St P
eter
's H
ospi
tal
414
81%
49%
53%
79%
Bar
king
, Hav
erin
g an
d R
edbr
idge
Uni
vers
ity H
ospi
tals
N
HS
Trus
tK
GG
Kin
g G
eorg
e H
ospi
tal
102
99%
40%
73%
95%
Bar
king
, Hav
erin
g an
d R
edbr
idge
Uni
vers
ity H
ospi
tals
N
HS
Trus
tO
LDQ
ueen
's H
ospi
tal R
omfo
rd25
210
0%29
%31
%70
%
Bar
net a
nd C
hase
Far
m H
ospi
tals
NH
S Tr
ust
BN
TB
arne
t Gen
eral
Hos
pita
l41
597
%67
%75
%83
%
Bar
net a
nd C
hase
Far
m H
ospi
tals
NH
S Tr
ust
CH
SC
hase
Far
m H
ospi
tal
3297
%41
%44
%66
%
Bar
nsle
y H
ospi
tal N
HS
Foun
datio
n Tr
ust
BA
RB
arns
ley
Hos
pita
l20
798
%34
%43
%71
%
Bar
ts H
ealt
h N
HS
Trus
tN
WG
New
ham
Uni
vers
ity H
ospi
tal
303
86%
85%
91%
91%
Bar
ts H
ealt
h N
HS
Trus
tSB
HSt
Bar
thol
omew
s H
ospi
tal
6*
**
*
Bar
ts H
ealt
h N
HS
Trus
tLC
HTh
e Lo
ndon
Che
st H
ospi
tal
2710
0%96
%96
%96
%
Bar
ts H
ealt
h N
HS
Trus
tLO
NTh
e R
oyal
Hos
pita
l Lon
don
125
100%
50%
49%
62%
Bar
ts H
ealt
h N
HS
Trus
tW
HC
Whi
pps
Cro
ss U
nive
rsity
Hos
pita
l26
510
0%30
%45
%70
%
Bas
ildon
and
Thu
rroc
k U
nive
rsity
Hos
pita
ls N
HS
Fo
unda
tion
Trus
tB
AS
Bas
ildon
Uni
vers
ity H
ospi
tal
293
100%
96%
90%
99%
Bed
ford
Hos
pita
l NH
S Tr
ust
BED
Bed
ford
Hos
pita
l25
797
%55
%62
%69
%
Bla
ckpo
ol T
each
ing
Hos
pita
ls N
HS
Foun
datio
n Tr
ust
VIC
Bla
ckpo
ol V
icto
ria
Hos
pita
l58
510
0%59
%63
%98
%
Bol
ton
NH
S Fo
unda
tion
Trus
tB
OL
Roy
al B
olto
n H
ospi
tal
189
96%
68%
84%
85%
Bra
dfor
d Te
achi
ng H
ospi
tals
NH
S Fo
unda
tion
Trus
tB
RD
Bra
dfor
d R
oyal
Infir
mar
y41
092
%42
%43
%78
%
Bri
ghto
n an
d Su
ssex
Uni
vers
ity H
ospi
tals
NH
S Tr
ust
PR
HP
rinc
ess
Roy
al H
ospi
tal (
Hay
war
ds H
eath
)23
181
%8%
46%
69%
Bri
ghto
n an
d Su
ssex
Uni
vers
ity H
ospi
tals
NH
S Tr
ust
RSC
Roy
al S
usse
x C
ount
y H
ospi
tal
458
86%
50%
54%
56%
Buc
king
ham
shir
e H
ealt
hcar
e N
HS
Trus
tSM
VSt
oke
Man
devi
lle H
ospi
tal
114
100%
0%11
%60
%
6.2
Clin
ical
pra
ctic
e an
alys
is
6.2.
1 In
-hos
pita
l car
e in
Eng
land
* in
dica
tes
that
sm
all n
umbe
rs (n
<50,
whe
re c
ase
asce
rtai
nmen
t is <7
0% o
r w
here
n<1
0) h
ave
been
sup
pres
sed.
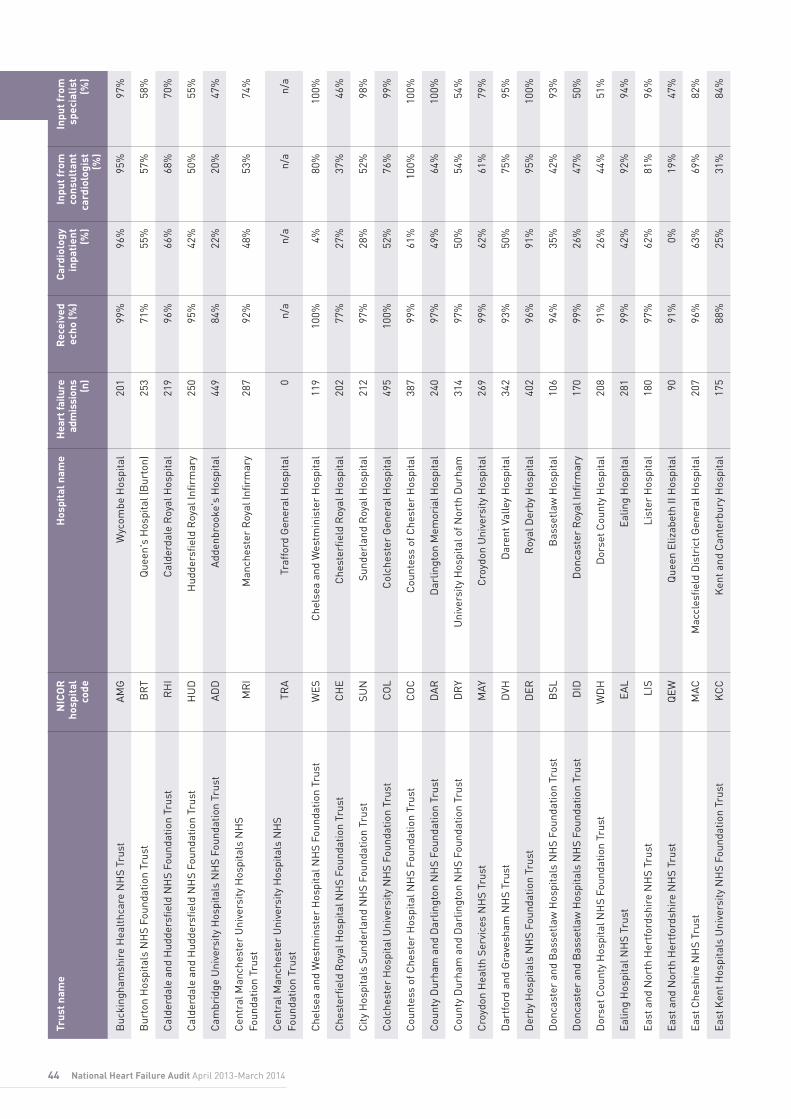
44 National Heart Failure Audit April 2013-March 2014
Buc
king
ham
shir
e H
ealt
hcar
e N
HS
Trus
tA
MG
Wyc
ombe
Hos
pita
l20
199
%96
%95
%97
%
Bur
ton
Hos
pita
ls N
HS
Foun
datio
n Tr
ust
BR
TQ
ueen
's H
ospi
tal (
Bur
ton)
253
71%
55%
57%
58%
Cal
derd
ale
and
Hud
ders
field
NH
S Fo
unda
tion
Trus
tR
HI
Cal
derd
ale
Roy
al H
ospi
tal
219
96%
66%
68%
70%
Cal
derd
ale
and
Hud
ders
field
NH
S Fo
unda
tion
Trus
tH
UD
Hud
ders
field
Roy
al In
firm
ary
250
95%
42%
50%
55%
Cam
brid
ge U
nive
rsity
Hos
pita
ls N
HS
Foun
datio
n Tr
ust
AD
DA
dden
broo
ke's
Hos
pita
l44
984
%22
%20
%47
%
Cen
tral
Man
ches
ter
Uni
vers
ity H
ospi
tals
NH
S
Foun
datio
n Tr
ust
MR
IM
anch
este
r R
oyal
Infir
mar
y28
792
%48
%53
%74
%
Cen
tral
Man
ches
ter
Uni
vers
ity H
ospi
tals
NH
S
Foun
datio
n Tr
ust
TRA
Traf
ford
Gen
eral
Hos
pita
l0
n/a
n/a
n/a
n/a
Che
lsea
and
Wes
tmin
ster
Hos
pita
l NH
S Fo
unda
tion
Trus
tW
ESC
hels
ea a
nd W
estm
inis
ter
Hos
pita
l11
910
0%4%
80%
100%
Che
ster
field
Roy
al H
ospi
tal N
HS
Foun
datio
n Tr
ust
CH
EC
hest
erfie
ld R
oyal
Hos
pita
l20
277
%27
%37
%46
%
City
Hos
pita
ls S
unde
rlan
d N
HS
Foun
datio
n Tr
ust
SUN
Sund
erla
nd R
oyal
Hos
pita
l21
297
%28
%52
%98
%
Col
ches
ter
Hos
pita
l Uni
vers
ity N
HS
Foun
datio
n Tr
ust
CO
LC
olch
este
r G
ener
al H
ospi
tal
495
100%
52%
76%
99%
Cou
ntes
s of
Che
ster
Hos
pita
l NH
S Fo
unda
tion
Trus
tC
OC
Cou
ntes
s of
Che
ster
Hos
pita
l38
799
%61
%10
0%10
0%
Cou
nty
Dur
ham
and
Dar
lingt
on N
HS
Foun
datio
n Tr
ust
DA
RD
arlin
gton
Mem
oria
l Hos
pita
l24
097
%49
%64
%10
0%
Cou
nty
Dur
ham
and
Dar
lingt
on N
HS
Foun
datio
n Tr
ust
DR
YU
nive
rsity
Hos
pita
l of N
orth
Dur
ham
314
97%
50%
54%
54%
Cro
ydon
Hea
lth
Serv
ices
NH
S Tr
ust
MAY
Cro
ydon
Uni
vers
ity H
ospi
tal
269
99%
62%
61%
79%
Dar
tfor
d an
d G
rave
sham
NH
S Tr
ust
DVH
Dar
ent V
alle
y H
ospi
tal
342
93%
50%
75%
95%
Der
by H
ospi
tals
NH
S Fo
unda
tion
Trus
tD
ERR
oyal
Der
by H
ospi
tal
402
96%
91%
95%
100%
Don
cast
er a
nd B
asse
tlaw
Hos
pita
ls N
HS
Foun
datio
n Tr
ust
BSL
Bas
setl
aw H
ospi
tal
106
94%
35%
42%
93%
Don
cast
er a
nd B
asse
tlaw
Hos
pita
ls N
HS
Foun
datio
n Tr
ust
DID
Don
cast
er R
oyal
Infir
mar
y17
099
%26
%47
%50
%
Dor
set C
ount
y H
ospi
tal N
HS
Foun
datio
n Tr
ust
WD
HD
orse
t Cou
nty
Hos
pita
l20
891
%26
%44
%51
%
Ealin
g H
ospi
tal N
HS
Trus
tEA
LEa
ling
Hos
pita
l28
199
%42
%92
%94
%
East
and
Nor
th H
ertf
ords
hire
NH
S Tr
ust
LIS
List
er H
ospi
tal
180
97%
62%
81%
96%
East
and
Nor
th H
ertf
ords
hire
NH
S Tr
ust
QEW
Que
en E
lizab
eth
II H
ospi
tal
9091
%0%
19%
47%
East
Che
shir
e N
HS
Trus
tM
ACM
accl
esfie
ld D
istr
ict G
ener
al H
ospi
tal
207
96%
63%
69%
82%
East
Ken
t Hos
pita
ls U
nive
rsity
NH
S Fo
unda
tion
Trus
tK
CC
Ken
t and
Can
terb
ury
Hos
pita
l17
588
%25
%31
%84
%
Trus
t nam
eN
ICO
R
hosp
ital
co
de
Hos
pita
l nam
eH
eart
failu
re
adm
issi
ons
(n)
Rec
eive
d ec
ho (%
)C
ardi
olog
y in
pati
ent
(%)
Inpu
t fro
m
cons
ulta
nt
card
iolo
gist
(%
)
Inpu
t fro
m
spec
ialis
t (%
)

45National Heart Failure Audit April 2013-March 2014
East
Ken
t Hos
pita
ls U
nive
rsity
NH
S Fo
unda
tion
Trus
tQ
EQQ
ueen
Eliz
abet
h th
e Q
ueen
Mot
her
Hos
pita
l15
777
%29
%33
%80
%
East
Ken
t Hos
pita
ls U
nive
rsity
NH
S Fo
unda
tion
Trus
tW
HH
Will
iam
Har
vey
Hos
pita
l18
982
%43
%41
%87
%
East
Lan
cash
ire
Hos
pita
ls N
HS
Trus
tB
LAR
oyal
Bla
ckbu
rn H
ospi
tal
461
65%
31%
50%
88%
East
Sus
sex
Hea
lthc
are
NH
S Tr
ust
CG
HC
onqu
est H
ospi
tal
193
99%
23%
24%
73%
East
Sus
sex
Hea
lthc
are
NH
S Tr
ust
DG
EEa
stbo
urne
Dis
tric
t Gen
eral
Hos
pita
l22
298
%44
%44
%92
%
Epso
m a
nd S
t Hel
ier
Uni
vers
ity H
ospi
tals
NH
S Tr
ust
EPS
Epso
m H
ospi
tal
176
79%
36%
51%
66%
Epso
m a
nd S
t Hel
ier
Uni
vers
ity H
ospi
tals
NH
S Tr
ust
SHC
St H
elie
r H
ospi
tal
226
83%
29%
41%
72%
Frim
ley
Par
k H
ospi
tal N
HS
Foun
datio
n Tr
ust
FRM
Frim
ley
Par
k H
ospi
tal
353
95%
54%
60%
71%
Gat
eshe
ad H
ealt
h N
HS
Foun
datio
n Tr
ust
QEG
Que
en E
lizab
eth
Hos
pita
l (G
ates
head
)34
710
0%56
%94
%97
%
Geo
rge
Elio
t Hos
pita
l NH
S Tr
ust
NU
NG
eorg
e El
iot H
ospi
tal
118
99%
40%
75%
79%
Glo
uces
ters
hire
Hos
pita
ls N
HS
Foun
datio
n Tr
ust
CH
GC
helt
enha
m G
ener
al H
ospi
tal
5074
%28
%30
%30
%
Glo
uces
ters
hire
Hos
pita
ls N
HS
Foun
datio
n Tr
ust
GLO
Glo
uces
ters
hire
Roy
al H
ospi
tal
7894
%50
%53
%53
%
Gre
at W
este
rn H
ospi
tals
NH
S Fo
unda
tion
Trus
tP
MS
Gre
at W
este
rn H
ospi
tal
498
93%
44%
51%
67%
Guy
's a
nd S
t Tho
mas
' NH
S Fo
unda
tion
Trus
tST
HSt
Tho
mas
' Hos
pita
l30
710
0%56
%82
%98
%
Ham
pshi
re H
ospi
tals
NH
S Fo
unda
tion
Trus
tN
HH
Bas
ings
toke
and
Nor
th H
amps
hire
Hos
pita
l21
710
0%33
%67
%73
%
Ham
pshi
re H
ospi
tals
NH
S Fo
unda
tion
Trus
tR
HC
Roy
al H
amps
hire
Cou
nty
Hos
pita
l15
097
%68
%84
%85
%
Har
roga
te a
nd D
istr
ict N
HS
Foun
datio
n Tr
ust
HA
RH
arro
gate
Dis
tric
t Hos
pita
l82
65%
39%
45%
52%
Hea
rt o
f Eng
land
NH
S Fo
unda
tion
Trus
tEB
HB
irm
ingh
am H
eart
land
s H
ospi
tal
174
98%
49%
54%
84%
Hea
rt o
f Eng
land
NH
S Fo
unda
tion
Trus
tG
HS
Goo
d H
ope
Hos
pita
l49
**
**
Hea
rt o
f Eng
land
NH
S Fo
unda
tion
Trus
tSO
LSo
lihul
l Hos
pita
l13
999
%76
%76
%91
%
Hea
ther
woo
d an
d W
exha
m P
ark
Hos
pita
ls N
HS
Fo
unda
tion
Trus
tW
EXW
exha
m P
ark
Hos
pita
l26
286
%28
%62
%71
%
Hin
chin
gbro
oke
Hea
lth
Car
e N
HS
Trus
tH
INH
inch
ingb
rook
e H
ospi
tal
14*
**
*
Hom
erto
n U
nive
rsity
Hos
pita
l NH
S Fo
unda
tion
Trus
tH
OM
Hom
erto
n U
nive
rsity
Hos
pita
l24
994
%35
%38
%46
%
Hul
l and
Eas
t Yor
kshi
re H
ospi
tals
NH
S Tr
ust
CH
HC
astle
Hill
Hos
pita
l49
510
0%77
%79
%95
%
Hul
l and
Eas
t Yor
kshi
re H
ospi
tals
NH
S Tr
ust
HR
IH
ull R
oyal
Infir
mar
y12
199
%4%
3%83
%
Impe
rial
Col
lege
Hea
lthc
are
NH
S Tr
ust
CC
HC
hari
ng C
ross
Hos
pita
l85
95%
28%
96%
100%
Impe
rial
Col
lege
Hea
lthc
are
NH
S Tr
ust
HA
MH
amm
ersm
ith H
ospi
tal
283
76%
33%
72%
91%
Impe
rial
Col
lege
Hea
lthc
are
NH
S Tr
ust
STM
St M
ary'
s H
ospi
tal P
addi
ngto
n85
100%
24%
55%
92%
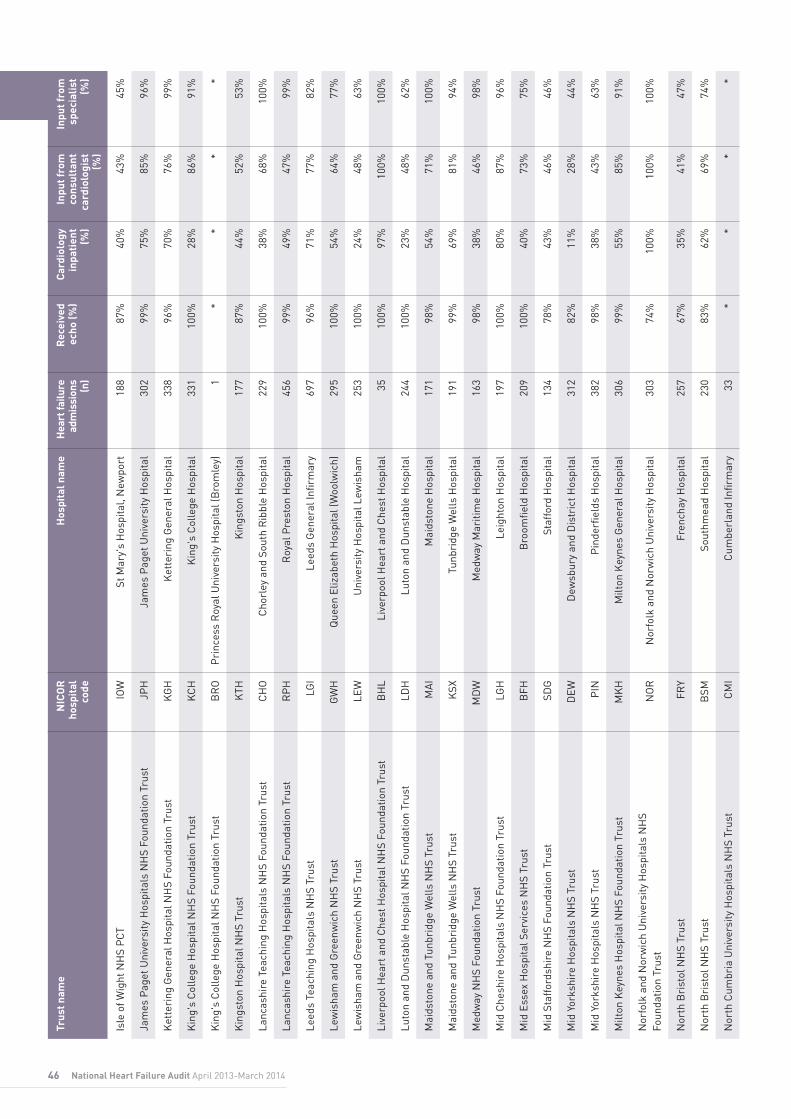
46 National Heart Failure Audit April 2013-March 2014
Trus
t nam
eN
ICO
R
hosp
ital
co
de
Hos
pita
l nam
eH
eart
failu
re
adm
issi
ons
(n)
Rec
eive
d ec
ho (%
)C
ardi
olog
y in
pati
ent
(%)
Inpu
t fro
m
cons
ulta
nt
card
iolo
gist
(%
)
Inpu
t fro
m
spec
ialis
t (%
)
Isle
of W
ight
NH
S P
CT
IOW
St M
ary'
s H
ospi
tal,
New
port
188
87%
40%
43%
45%
Jam
es P
aget
Uni
vers
ity H
ospi
tals
NH
S Fo
unda
tion
Trus
tJP
HJa
mes
Pag
et U
nive
rsity
Hos
pita
l30
299
%75
%85
%96
%
Ket
teri
ng G
ener
al H
ospi
tal N
HS
Foun
datio
n Tr
ust
KG
HK
ette
ring
Gen
eral
Hos
pita
l33
896
%70
%76
%99
%
Kin
g's
Col
lege
Hos
pita
l NH
S Fo
unda
tion
Trus
tK
CH
Kin
g's
Col
lege
Hos
pita
l33
110
0%28
%86
%91
%
Kin
g's
Col
lege
Hos
pita
l NH
S Fo
unda
tion
Trus
tB
RO
Pri
nces
s R
oyal
Uni
vers
ity H
ospi
tal (
Bro
mle
y)1
**
**
Kin
gsto
n H
ospi
tal N
HS
Trus
tK
THK
ings
ton
Hos
pita
l17
787
%44
%52
%53
%
Lanc
ashi
re T
each
ing
Hos
pita
ls N
HS
Foun
datio
n Tr
ust
CH
OC
horl
ey a
nd S
outh
Rib
ble
Hos
pita
l22
910
0%38
%68
%10
0%
Lanc
ashi
re T
each
ing
Hos
pita
ls N
HS
Foun
datio
n Tr
ust
RP
HR
oyal
Pre
ston
Hos
pita
l45
699
%49
%47
%99
%
Leed
s Te
achi
ng H
ospi
tals
NH
S Tr
ust
LGI
Leed
s G
ener
al In
firm
ary
697
96%
71%
77%
82%
Lew
isha
m a
nd G
reen
wic
h N
HS
Trus
tG
WH
Que
en E
lizab
eth
Hos
pita
l (W
oolw
ich)
295
100%
54%
64%
77%
Lew
isha
m a
nd G
reen
wic
h N
HS
Trus
tLE
WU
nive
rsity
Hos
pita
l Lew
isha
m25
310
0%24
%48
%63
%
Live
rpoo
l Hea
rt a
nd C
hest
Hos
pita
l NH
S Fo
unda
tion
Trus
tB
HL
Live
rpoo
l Hea
rt a
nd C
hest
Hos
pita
l35
100%
97%
100%
100%
Luto
n an
d D
unst
able
Hos
pita
l NH
S Fo
unda
tion
Trus
tLD
HLu
ton
and
Dun
stab
le H
ospi
tal
244
100%
23%
48%
62%
Mai
dsto
ne a
nd T
unbr
idge
Wel
ls N
HS
Trus
tM
AI
Mai
dsto
ne H
ospi
tal
171
98%
54%
71%
100%
Mai
dsto
ne a
nd T
unbr
idge
Wel
ls N
HS
Trus
tK
SXTu
nbri
dge
Wel
ls H
ospi
tal
191
99%
69%
81%
94%
Med
way
NH
S Fo
unda
tion
Trus
tM
DW
Med
way
Mar
itim
e H
ospi
tal
163
98%
38%
46%
98%
Mid
Che
shir
e H
ospi
tals
NH
S Fo
unda
tion
Trus
tLG
HLe
ight
on H
ospi
tal
197
100%
80%
87%
96%
Mid
Ess
ex H
ospi
tal S
ervi
ces
NH
S Tr
ust
BFH
Bro
omfie
ld H
ospi
tal
209
100%
40%
73%
75%
Mid
Sta
ffor
dshi
re N
HS
Foun
datio
n Tr
ust
SDG
Staf
ford
Hos
pita
l13
478
%43
%46
%46
%
Mid
Yor
kshi
re H
ospi
tals
NH
S Tr
ust
DEW
Dew
sbur
y an
d D
istr
ict H
ospi
tal
312
82%
11%
28%
44%
Mid
Yor
kshi
re H
ospi
tals
NH
S Tr
ust
PIN
Pin
derfi
elds
Hos
pita
l38
298
%38
%43
%63
%
Milt
on K
eyne
s H
ospi
tal N
HS
Foun
datio
n Tr
ust
MK
HM
ilton
Key
nes
Gen
eral
Hos
pita
l30
699
%55
%85
%91
%
Nor
folk
and
Nor
wic
h U
nive
rsity
Hos
pita
ls N
HS
Fo
unda
tion
Trus
tN
OR
Nor
folk
and
Nor
wic
h U
nive
rsity
Hos
pita
l30
374
%10
0%10
0%10
0%
Nor
th B
rist
ol N
HS
Trus
tFR
YFr
ench
ay H
ospi
tal
257
67%
35%
41%
47%
Nor
th B
rist
ol N
HS
Trus
tB
SMSo
uthm
ead
Hos
pita
l23
083
%62
%69
%74
%
Nor
th C
umbr
ia U
nive
rsity
Hos
pita
ls N
HS
Trus
tC
MI
Cum
berl
and
Infir
mar
y33
**
**

47National Heart Failure Audit April 2013-March 2014
Nor
th C
umbr
ia U
nive
rsity
Hos
pita
ls N
HS
Trus
tW
CI
Wes
t Cum
berl
and
Hos
pita
l31
**
**
Nor
th M
iddl
esex
Uni
vers
ity H
ospi
tal N
HS
Trus
tN
MH
Nor
th M
iddl
esex
Uni
vers
ity H
ospi
tal
205
85%
6%32
%69
%
Nor
th T
ees
and
Har
tlepo
ol N
HS
Foun
datio
n Tr
ust
HG
HU
nive
rsity
Hos
pita
l of H
artle
pool
7199
%61
%49
%49
%
Nor
th T
ees
and
Har
tlepo
ol N
HS
Foun
datio
n Tr
ust
NTG
Uni
vers
ity H
ospi
tal o
f Nor
th T
ees
253
100%
43%
53%
56%
Nor
tham
pton
Gen
eral
Hos
pita
l NH
S Tr
ust
NTH
Nor
tham
pton
Gen
eral
Hos
pita
l29
082
%53
%67
%89
%
Nor
ther
n D
evon
Hea
lthc
are
NH
S Tr
ust
ND
DN
orth
Dev
on D
istr
ict H
ospi
tal
270
91%
52%
61%
65%
Nor
ther
n Li
ncol
nshi
re a
nd G
oole
Hos
pita
ls N
HS
Fo
unda
tion
Trus
tG
GH
Dia
na P
rinc
ess
of W
ales
Hos
pita
l16
098
%70
%79
%84
%
Nor
ther
n Li
ncol
nshi
re a
nd G
oole
Hos
pita
ls N
HS
Fo
unda
tion
Trus
tSC
USc
unth
orpe
Gen
eral
Hos
pita
l20
297
%31
%22
%37
%
Nor
thum
bria
Hea
lthc
are
NH
S Fo
unda
tion
Trus
tH
EXH
exha
m G
ener
al H
ospi
tal
24*
**
*
Nor
thum
bria
Hea
lthc
are
NH
S Fo
unda
tion
Trus
tN
TYN
orth
Tyn
esid
e H
ospi
tal
173
98%
65%
71%
73%
Nor
thum
bria
Hea
lthc
are
NH
S Fo
unda
tion
Trus
tA
SHW
ansb
eck
Gen
eral
Hos
pita
l13
110
0%57
%60
%63
%
Not
tingh
am U
nive
rsity
Hos
pita
ls N
HS
Trus
tC
HN
Not
tingh
am C
ity H
ospi
tal
33*
**
*
Not
tingh
am U
nive
rsity
Hos
pita
ls N
HS
Trus
tU
HN
Que
en's
Med
ical
Cen
tre
100
88%
14%
35%
44%
Oxf
ord
Rad
cliff
e H
ospi
tals
NH
S Tr
ust
HO
RH
orto
n G
ener
al H
ospi
tal
186
92%
27%
51%
86%
Oxf
ord
Rad
cliff
e H
ospi
tals
NH
S Tr
ust
RA
DJo
hn R
adcl
iffe
Hos
pita
l50
189
%23
%64
%86
%
Pen
nine
Acu
te H
ospi
tals
NH
S Tr
ust
BR
YFa
irfie
ld G
ener
al H
ospi
tal
325
71%
28%
23%
45%
Pen
nine
Acu
te H
ospi
tals
NH
S Tr
ust
NM
GN
orth
Man
ches
ter
Gen
eral
Hos
pita
l20
379
%36
%46
%73
%
Pen
nine
Acu
te H
ospi
tals
NH
S Tr
ust
BH
HR
ochd
ale
Infir
mar
y48
64%
77%
9%15
%
Pen
nine
Acu
te H
ospi
tals
NH
S Tr
ust
OH
MR
oyal
Old
ham
Hos
pita
l27
482
%34
%48
%71
%
Pet
erbo
roug
h an
d St
amfo
rd H
ospi
tals
NH
S Fo
unda
tion
Trus
tP
ETP
eter
boro
ugh
City
Hos
pita
l38
192
%62
%60
%80
%
Ply
mou
th H
ospi
tals
NH
S Tr
ust
PLY
Der
rifo
rd H
ospi
tal
297
100%
38%
0%10
0%
Poo
le H
ospi
tal N
HS
Foun
datio
n Tr
ust
PG
HP
oole
Gen
eral
Hos
pita
l25
270
%20
%34
%74
%
Por
tsm
outh
Hos
pita
ls N
HS
Trus
tQ
AP
Que
en A
lexa
ndra
Hos
pita
l38
998
%76
%90
%98
%
Rot
herh
am N
HS
Foun
datio
n Tr
ust
RO
TR
othe
rham
Hos
pita
l27
993
%36
%57
%93
%
Roy
al B
erks
hire
NH
S Fo
unda
tion
Trus
tB
HR
Roy
al B
erks
hire
Hos
pita
l35
410
0%54
%77
%86
%
Roy
al B
rom
pton
and
Har
efiel
d N
HS
Foun
datio
n Tr
ust
HH
Har
efiel
d H
ospi
tal
194
98%
58%
89%
98%
Roy
al B
rom
pton
and
Har
efiel
d N
HS
Foun
datio
n Tr
ust
NH
BR
oyal
Bro
mpt
on H
ospi
tal
202
100%
95%
96%
99%
Roy
al C
ornw
all H
ospi
tals
NH
S Tr
ust
RC
HR
oyal
Cor
nwal
l Hos
pita
l19
598
%46
%55
%64
%

48 National Heart Failure Audit April 2013-March 2014
Roy
al D
evon
and
Exe
ter
NH
S Fo
unda
tion
Trus
tR
DE
Roy
al D
evon
& E
xete
r H
ospi
tal
349
67%
36%
48%
48%
Roy
al F
ree
Lond
on N
HS
Trus
tR
FHR
oyal
Fre
e H
ospi
tal
251
100%
41%
48%
62%
Roy
al L
iver
pool
and
Bro
adgr
een
Uni
vers
ity H
ospi
tals
N
HS
Trus
tR
LUR
oyal
Liv
erpo
ol U
nive
rsity
Hos
pita
l33
397
%65
%71
%89
%
Roy
al S
urre
y C
ount
y H
ospi
tal N
HS
Foun
datio
n Tr
ust
RSU
Roy
al S
urre
y C
ount
y H
ospi
tal
199
86%
54%
64%
79%
Roy
al U
nite
d H
ospi
tal B
ath
NH
S Tr
ust
BAT
Roy
al U
nite
d H
ospi
tal B
ath
170
95%
72%
75%
97%
Salfo
rd R
oyal
NH
S Fo
unda
tion
Trus
tSL
FSa
lford
Roy
al
341
77%
44%
41%
83%
Salis
bury
NH
S Fo
unda
tion
Trus
tSA
LSa
lisbu
ry D
istr
ict H
ospi
tal
199
85%
63%
70%
83%
Sand
wel
l and
Wes
t Bir
min
gham
Hos
pita
ls N
HS
Trus
tD
UD
Bir
min
gham
City
Hos
pita
l16
310
0%62
%94
%95
%
Sand
wel
l and
Wes
t Bir
min
gham
Hos
pita
ls N
HS
Trus
tSA
NSa
ndw
ell G
ener
al H
ospi
tal
182
99%
47%
95%
98%
Shef
field
Tea
chin
g H
ospi
tals
NH
S Fo
unda
tion
Trus
tN
GS
Nor
ther
n G
ener
al H
ospi
tal
465
98%
29%
56%
98%
Sher
woo
d Fo
rest
Hos
pita
ls N
HS
Foun
datio
n Tr
ust
KM
HK
ing'
s M
ill H
ospi
tal
403
75%
46%
63%
66%
Sher
woo
d Fo
rest
Hos
pita
ls N
HS
Foun
datio
n Tr
ust
NH
NN
ewar
k H
ospi
tal
6*
**
*
Shre
wsb
ury
and
Telfo
rd H
ospi
tals
NH
S Tr
ust
TLF
Pri
nces
s R
oyal
Hos
pita
l (Te
lford
)59
100%
61%
70%
100%
Shre
wsb
ury
and
Telfo
rd H
ospi
tals
NH
S Tr
ust
RSS
Roy
al S
hrew
sbur
y H
ospi
tal
6810
0%53
%63
%10
0%
Sout
h D
evon
Hea
lthc
are
NH
S Fo
unda
tion
Trus
tTO
RTo
rbay
Hos
pita
l50
774
%42
%48
%87
%
Sout
h Te
es H
ospi
tals
NH
S Fo
unda
tion
Trus
tFR
HFr
iara
ge H
ospi
tal
2610
0%0%
92%
100%
Sout
h Te
es H
ospi
tals
NH
S Fo
unda
tion
Trus
tSC
MJa
mes
Coo
k U
nive
rsity
Hos
pita
l33
810
0%79
%84
%98
%
Sout
h Ty
nesi
de N
HS
Foun
datio
n Tr
ust
STD
Sout
h Ty
nesi
de D
istr
ict H
ospi
tal
237
99%
61%
68%
95%
Sout
h W
arw
icks
hire
NH
S Fo
unda
tion
Trus
t W
AR
War
wic
k H
ospi
tal
181
92%
67%
78%
86%
Sout
hend
Uni
vers
ity H
ospi
tal N
HS
Foun
datio
n Tr
ust
SEH
Sout
hend
Hos
pita
l35
998
%57
%63
%70
%
Sout
hpor
t and
Orm
skir
k H
ospi
tal N
HS
Trus
tSO
USo
uthp
ort a
nd F
orm
by D
istr
ict G
ener
al
Hos
pita
l26
295
%48
%63
%77
%
St G
eorg
e's
Hea
lthc
are
NH
S Tr
ust
GEO
St G
eorg
e's
Hos
pita
l44
799
%38
%58
%88
%
St H
elen
s an
d K
now
sley
Tea
chin
g H
ospi
tals
NH
S Tr
ust
WH
IW
hist
on H
ospi
tal
270
99%
77%
91%
92%
Stoc
kpor
t NH
S Fo
unda
tion
Trus
tSH
HSt
eppi
ng H
ill H
ospi
tal
330
92%
28%
28%
76%
Surr
ey a
nd S
usse
x H
ealt
hcar
e N
HS
Trus
tES
UEa
st S
urre
y H
ospi
tal
214
81%
63%
73%
73%
Trus
t nam
eN
ICO
R
hosp
ital
co
de
Hos
pita
l nam
eH
eart
failu
re
adm
issi
ons
(n)
Rec
eive
d ec
ho (%
)C
ardi
olog
y in
pati
ent
(%)
Inpu
t fro
m
cons
ulta
nt
card
iolo
gist
(%
)
Inpu
t fro
m
spec
ialis
t (%
)

49National Heart Failure Audit April 2013-March 2014
Tam
esid
e H
ospi
tal N
HS
Foun
datio
n Tr
ust
TGA
Tam
esid
e G
ener
al H
ospi
tal
260
82%
43%
47%
59%
Taun
ton
and
Som
erse
t NH
S Fo
unda
tion
Trus
tM
PH
Mus
grov
e P
ark
Hos
pita
l29
175
%43
%49
%83
%
The
Dud
ley
Gro
up N
HS
Foun
datio
n Tr
ust
RU
SR
usse
lls H
all H
ospi
tal
351
99%
56%
53%
68%
The
Hill
ingd
on H
ospi
tals
NH
S Fo
unda
tion
Trus
tH
ILH
illin
gdon
Hos
pita
l18
689
%47
%60
%70
%
The
Ipsw
ich
Hos
pita
l NH
S Tr
ust
IPS
Ipsw
ich
Hos
pita
l16
457
%23
%29
%36
%
The
New
cast
le U
pon
Tyne
Hos
pita
ls N
HS
Foun
datio
n Tr
ust
FRE
Free
man
Hos
pita
l and
Roy
al V
icto
ria
Infir
mar
y48
990
%66
%76
%92
%
The
Nor
th W
est L
ondo
n H
ospi
tals
NH
S Tr
ust
CM
HC
entr
al M
iddl
esex
Hos
pita
l93
80%
22%
23%
28%
The
Nor
th W
est L
ondo
n H
ospi
tals
NH
S Tr
ust
NP
HN
orth
wic
k P
ark
Hos
pita
l19
473
%37
%38
%39
%
The
Pri
nces
s A
lexa
ndra
Hos
pita
l NH
S Tr
ust
PAH
Pri
nces
s A
lexa
ndra
Hos
pita
l11
893
%42
%47
%60
%
The
Que
en E
lizab
eth
Hos
pita
l Kin
g's
Lynn
NH
S
Foun
datio
n Tr
ust
QK
LQ
ueen
Eliz
abet
h H
ospi
tal (
Kin
g's
Lynn
)21
383
%38
%39
%83
%
The
Roy
al B
ourn
emou
th a
nd C
hris
tchu
rch
Hos
pita
ls N
HS
Foun
datio
n Tr
ust
BO
UR
oyal
Bou
rnem
outh
Gen
eral
Hos
pita
l45
367
%50
%52
%80
%
The
Roy
al W
olve
rham
pton
Hos
pita
ls N
HS
Trus
tN
CR
New
Cro
ss H
ospi
tal
6997
%22
%25
%69
%
The
Whi
ttin
gton
Hos
pita
l NH
S Tr
ust
WH
TW
hitt
ingt
on H
ospi
tal
160
98%
63%
83%
84%
Uni
ted
Linc
olns
hire
Hos
pita
ls N
HS
Trus
tG
RA
Gra
ntha
m a
nd D
istr
ict H
ospi
tal
9687
%64
%84
%84
%
Uni
ted
Linc
olns
hire
Hos
pita
ls N
HS
Trus
tLI
NLi
ncol
n C
ount
y H
ospi
tal
121
76%
47%
66%
72%
Uni
ted
Linc
olns
hire
Hos
pita
ls N
HS
Trus
tP
ILP
ilgri
m H
ospi
tal
191
84%
44%
71%
74%
Uni
vers
ity C
olle
ge L
ondo
n H
ospi
tals
NH
S Fo
unda
tion
Trus
tU
CL
Uni
vers
ity C
olle
ge H
ospi
tal
323
100%
52%
79%
98%
Uni
vers
ity H
ospi
tal o
f Nor
th S
taff
ords
hire
NH
S Tr
ust
STO
Uni
vers
ity H
ospi
tal o
f Nor
th S
taff
ords
hire
676
81%
40%
39%
74%
Uni
vers
ity H
ospi
tal o
f Sou
th M
anch
este
r N
HS
Fo
unda
tion
Trus
tW
YTW
ythe
nsha
we
Hos
pita
l23
582
%39
%49
%64
%
Uni
vers
ity H
ospi
tal S
outh
ampt
on N
HS
Trus
tSG
HSo
utha
mpt
on G
ener
al H
ospi
tal
324
100%
43%
42%
100%
Uni
vers
ity H
ospi
tals
Bir
min
gham
NH
S Fo
unda
tion
Trus
tQ
EBQ
ueen
Eliz
abet
h H
ospi
tal (
Edgb
asto
n)29
790
%31
%65
%70
%
Uni
vers
ity H
ospi
tals
Bri
stol
NH
S Fo
unda
tion
Trus
tB
RI
Bri
stol
Roy
al In
firm
ary
347
100%
98%
99%
100%
Uni
vers
ity H
ospi
tals
Cov
entr
y an
d W
arw
icks
hire
NH
S Tr
ust
WA
LU
nive
rsity
Hos
pita
l Cov
entr
y38
999
%68
%62
%82
%
Uni
vers
ity H
ospi
tals
of L
eice
ster
NH
S Tr
ust
GR
LG
lenfi
eld
Hos
pita
l66
998
%89
%86
%89
%
Uni
vers
ity H
ospi
tals
of L
eice
ster
NH
S Tr
ust
LER
Leic
este
r R
oyal
Infir
mar
y96
84%
0%0%
2%
Uni
vers
ity H
ospi
tals
of M
orec
ambe
Bay
NH
S Fo
unda
tion
Trus
tFG
HFu
rnes
s G
ener
al H
ospi
tal
158
99%
32%
63%
96%

50 National Heart Failure Audit April 2013-March 2014
Uni
vers
ity H
ospi
tals
of M
orec
ambe
Bay
NH
S Fo
unda
tion
Trus
tR
LIR
oyal
Lan
cast
er In
firm
ary
175
99%
13%
94%
100%
Wal
sall
Hea
lthc
are
NH
S Tr
ust
WM
HM
anor
Hos
pita
l25
010
0%44
%78
%10
0%
War
ring
ton
and
Hal
ton
Hos
pita
ls N
HS
Foun
datio
n Tr
ust
WD
GW
arri
ngto
n H
ospi
tal
9510
0%67
%75
%97
%
Wes
t Her
tfor
dshi
re H
ospi
tals
NH
S Tr
ust
WAT
Wat
ford
Gen
eral
Hos
pita
l57
984
%43
%51
%98
%
Wes
t Mid
dles
ex U
nive
rsity
Hos
pita
l NH
S Tr
ust
WM
UW
est M
iddl
esex
Uni
vers
ity H
ospi
tal
225
90%
25%
34%
91%
Wes
t Suf
folk
NH
S Fo
unda
tion
Trus
tW
SHW
est S
uffo
lk H
ospi
tal
283
91%
56%
39%
60%
Wes
tern
Sus
sex
Hos
pita
ls N
HS
Trus
tST
RSt
Ric
hard
's H
ospi
tal
300
93%
61%
69%
71%
Wes
tern
Sus
sex
Hos
pita
ls N
HS
Trus
tW
RG
Wor
thin
g H
ospi
tal
325
88%
40%
42%
82%
Wes
ton
Are
a H
ealt
h N
HS
Trus
tW
GH
Wes
ton
Gen
eral
Hos
pita
l69
100%
21%
25%
25%
Wir
ral U
nive
rsity
Tea
chin
g H
ospi
tal N
HS
Foun
datio
n Tr
ust
WIR
Arr
owe
Par
k H
ospi
tal
403
94%
56%
64%
78%
Wor
cest
ersh
ire
Acu
te H
ospi
tals
NH
S Tr
ust
RED
Ale
xand
ra H
ospi
tal
192
93%
21%
67%
67%
Wor
cest
ersh
ire
Acu
te H
ospi
tals
NH
S Tr
ust
WR
CW
orce
ster
shir
e R
oyal
Hos
pita
l78
100%
73%
82%
99%
Wri
ghtin
gton
, Wig
an a
nd L
eigh
NH
S Fo
unda
tion
Trus
tA
EIR
oyal
Alb
ert E
dwar
d In
firm
ary
437
98%
74%
84%
99%
Wye
Val
ley
NH
S Tr
ust
HC
HC
ount
y H
ospi
tal H
eref
ord
144
99%
52%
54%
54%
Yeov
il D
istr
ict H
ospi
tal N
HS
Foun
datio
n Tr
ust
YEO
Yeov
il D
istr
ict H
ospi
tal
186
99%
74%
88%
97%
York
Tea
chin
g H
ospi
tal N
HS
Foun
datio
n Tr
ust
SCA
Scar
boro
ugh
Gen
eral
Hos
pita
l0
n/a
n/a
n/a
n/a
York
Tea
chin
g H
ospi
tal N
HS
Foun
datio
n Tr
ust
YDH
The
York
Hos
pita
l29
389
%25
%42
%49
%
Trus
t nam
eN
ICO
R
hosp
ital
co
de
Hos
pita
l nam
eH
eart
failu
re
adm
issi
ons
(n)
Rec
eive
d ec
ho (%
)C
ardi
olog
y in
pati
ent
(%)
Inpu
t fro
m
cons
ulta
nt
card
iolo
gist
(%
)
Inpu
t fro
m
spec
ialis
t (%
)

51National Heart Failure Audit April 2013-March 2014
Trus
t nam
eN
ICOR
ho
spita
l co
de
Hos
pita
l nam
eH
eart
failu
re
adm
issi
ons
(n)
ACEI
on
disc
harg
e (%
)
ACEI
/AR
B o
n di
scha
rge
(%)
Bet
a bl
ocke
r on
di
scha
rge
(%)
MR
A on
di
scha
rge
(%)
Rec
eive
d di
scha
rge
plan
ning
(%
)
Ref
erra
l to
HF
nurs
e fo
llow
-up
(%)
Ref
erra
l to
HF
nurs
e fo
llow
-up
(LVS
D o
nly)
(%
)
Ref
erra
l to
card
iolo
gy
follo
w-u
p (%
)
Ref
erra
l to
car
diac
re
habi
litat
ion
(%)
Ain
tree
Uni
vers
ity
Hos
pita
l NH
S Fo
unda
tion
Trus
tFA
ZU
nive
rsity
Hos
pita
l A
intr
ee45
892
%97
%97
%48
%86
%82
%88
%77
%3%
Air
edal
e N
HS
Foun
datio
n Tr
ust
AIR
Air
edal
e G
ener
al
Hos
pita
l23
388
%93
%88
%64
%93
%17
%21
%22
%3%
Ash
ford
and
St P
eter
's
Hos
pita
ls N
HS
Trus
tSP
HSt
Pet
er's
Hos
pita
l41
499
%99
%10
0%10
0%92
%41
%56
%59
%21
%
Bar
king
, Hav
erin
g an
d R
edbr
idge
Uni
vers
ity
Hos
pita
ls N
HS
Trus
tK
GG
Kin
g G
eorg
e H
ospi
tal
102
49%
77%
76%
61%
75%
59%
77%
61%
10%
Bar
king
, Hav
erin
g an
d R
edbr
idge
Uni
vers
ity
Hos
pita
ls N
HS
Trus
tO
LDQ
ueen
's H
ospi
tal
Rom
ford
252
72%
83%
82%
62%
77%
72%
83%
64%
54%
Bar
net a
nd C
hase
Far
m
Hos
pita
ls N
HS
Trus
tB
NT
Bar
net G
ener
al
Hos
pita
l41
579
%93
%87
%62
%91
%59
%66
%78
%17
%
Bar
net a
nd C
hase
Far
m
Hos
pita
ls N
HS
Trus
tC
HS
Cha
se F
arm
H
ospi
tal
3288
%88
%10
0%69
%10
0%90
%94
%74
%14
%
Bar
nsle
y H
ospi
tal N
HS
Foun
datio
n Tr
ust
BA
RB
arns
ley
Hos
pita
l20
764
%81
%80
%46
%89
%44
%48
%63
%2%
Bar
ts H
ealt
h N
HS
Trus
tN
WG
New
ham
Uni
vers
ity
Hos
pita
l30
343
%55
%76
%33
%95
%68
%77
%75
%23
%
Bar
ts H
ealt
h N
HS
Trus
tSB
HSt
Bar
thol
omew
s H
ospi
tal
6*
**
**
**
**
Bar
ts H
ealt
h N
HS
Trus
tLC
HTh
e Lo
ndon
Che
st
Hos
pita
l27
71%
76%
95%
67%
94%
81%
93%
92%
8%
Bar
ts H
ealt
h N
HS
Trus
tLO
NTh
e R
oyal
Hos
pita
l Lo
ndon
125
57%
63%
85%
40%
92%
72%
84%
76%
8%
Bar
ts H
ealt
h N
HS
Trus
tW
HC
Whi
pps
Cro
ss
Uni
vers
ity H
ospi
tal
265
67%
83%
74%
43%
80%
69%
73%
39%
2%
6.2.
2 Tr
eatm
ent a
nd m
anag
emen
t on
disc
harg
e in
Eng
land

52 National Heart Failure Audit April 2013-March 2014
Bas
ildon
and
Thu
rroc
k U
nive
rsity
Hos
pita
ls N
HS
Foun
datio
n Tr
ust
BA
SB
asild
on U
nive
rsity
H
ospi
tal
293
75%
81%
86%
39%
100%
98%
98%
84%
53%
Bed
ford
Hos
pita
l NH
S Tr
ust
BED
Bed
ford
Hos
pita
l25
782
%91
%91
%61
%88
%34
%36
%69
%10
%
Bla
ckpo
ol T
each
ing
Hos
pita
ls N
HS
Foun
datio
n Tr
ust
VIC
Bla
ckpo
ol V
icto
ria
Hos
pita
l58
582
%91
%94
%44
%10
0%89
%89
%82
%1%
Bol
ton
NH
S Fo
unda
tion
Trus
tB
OL
Roy
al B
olto
n H
ospi
tal
189
95%
97%
100%
97%
99%
25%
32%
80%
4%
Bra
dfor
d Te
achi
ng
Hos
pita
ls N
HS
Foun
datio
n Tr
ust
BR
DB
radf
ord
Roy
al
Infir
mar
y41
092
%95
%96
%96
%88
%67
%82
%52
%1%
Bri
ghto
n an
d Su
ssex
U
nive
rsity
Hos
pita
ls N
HS
Trus
tP
RH
Pri
nces
s R
oyal
H
ospi
tal (
Hay
war
ds
Hea
th)
231
72%
85%
78%
45%
100%
47%
78%
39%
1%
Bri
ghto
n an
d Su
ssex
U
nive
rsity
Hos
pita
ls N
HS
Trus
tR
SCR
oyal
Sus
sex
Cou
nty
Hos
pita
l45
874
%85
%78
%52
%97
%52
%67
%54
%2%
Buc
king
ham
shir
e H
ealt
hcar
e N
HS
Trus
tSM
VSt
oke
Man
devi
lle
Hos
pita
l11
470
%74
%54
%43
%91
%44
%74
%21
%4%
Buc
king
ham
shir
e H
ealt
hcar
e N
HS
Trus
tA
MG
Wyc
ombe
Hos
pita
l20
155
%74
%82
%59
%98
%55
%67
%67
%15
%
Bur
ton
Hos
pita
ls N
HS
Foun
datio
n Tr
ust
BR
TQ
ueen
's H
ospi
tal
(Bur
ton)
253
91%
94%
94%
89%
81%
36%
60%
48%
3%
Cal
derd
ale
and
Hud
ders
field
NH
S Fo
unda
tion
Trus
tR
HI
Cal
derd
ale
Roy
al
Hos
pita
l21
973
%86
%83
%60
%95
%35
%50
%57
%5%
Cal
derd
ale
and
Hud
ders
field
NH
S Fo
unda
tion
Trus
tH
UD
Hud
ders
field
Roy
al
Infir
mar
y25
078
%89
%72
%48
%95
%46
%57
%32
%1%
Trus
t nam
eN
ICOR
ho
spita
l co
de
Hos
pita
l nam
eH
eart
failu
re
adm
issi
ons
(n)
ACEI
on
disc
harg
e (%
)
ACEI
/AR
B o
n di
scha
rge
(%)
Bet
a bl
ocke
r on
di
scha
rge
(%)
MR
A on
di
scha
rge
(%)
Rec
eive
d di
scha
rge
plan
ning
(%
)
Ref
erra
l to
HF
nurs
e fo
llow
-up
(%)
Ref
erra
l to
HF
nurs
e fo
llow
-up
(LVS
D o
nly)
(%
)
Ref
erra
l to
card
iolo
gy
follo
w-u
p (%
)
Ref
erra
l to
car
diac
re
habi
litat
ion
(%)

53National Heart Failure Audit April 2013-March 2014
Cam
brid
ge U
nive
rsity
H
ospi
tals
NH
S Fo
unda
tion
Trus
tA
DD
Add
enbr
ooke
's
Hos
pita
l44
984
%89
%92
%60
%37
%34
%35
%26
%3%
Cen
tral
Man
ches
ter
Uni
vers
ity H
ospi
tals
NH
S Fo
unda
tion
Trus
tM
RI
Man
ches
ter
Roy
al
Infir
mar
y28
776
%90
%92
%55
%82
%68
%76
%57
%9%
Cen
tral
Man
ches
ter
Uni
vers
ity H
ospi
tals
NH
S Fo
unda
tion
Trus
tTR
ATr
affo
rd G
ener
al
Hos
pita
l0
n/a
n/a
n/a
n/a
n/a
n/a
n/a
n/a
n/a
Che
lsea
and
Wes
tmin
ster
H
ospi
tal N
HS
Foun
datio
n Tr
ust
WES
Che
lsea
and
W
estm
inis
ter
Hos
pita
l11
975
%91
%75
%40
%99
%57
%69
%72
%8%
Che
ster
field
Roy
al
Hos
pita
l NH
S Fo
unda
tion
Trus
tC
HE
Che
ster
field
Roy
al
Hos
pita
l20
271
%82
%81
%32
%97
%43
%60
%20
%2%
City
Hos
pita
ls S
unde
rlan
d N
HS
Foun
datio
n Tr
ust
SUN
Sund
erla
nd R
oyal
H
ospi
tal
212
99%
99%
97%
31%
96%
93%
94%
78%
2%
Col
ches
ter
Hos
pita
l U
nive
rsity
NH
S Fo
unda
tion
Trus
tC
OL
Col
ches
ter
Gen
eral
H
ospi
tal
495
65%
74%
83%
33%
100%
99%
98%
25%
34%
Cou
ntes
s of
Che
ster
H
ospi
tal N
HS
Foun
datio
n Tr
ust
CO
CC
ount
ess
of
Che
ster
Hos
pita
l38
781
%87
%90
%44
%90
%51
%62
%37
%27
%
Cou
nty
Dur
ham
and
D
arlin
gton
NH
S Fo
unda
tion
Trus
tD
AR
Dar
lingt
on
Mem
oria
l Hos
pita
l24
062
%75
%85
%43
%79
%82
%81
%44
%5%
Cou
nty
Dur
ham
and
D
arlin
gton
NH
S Fo
unda
tion
Trus
tD
RY
Uni
vers
ity H
ospi
tal
of N
orth
Dur
ham
314
56%
70%
80%
28%
42%
41%
45%
32%
1%
Cro
ydon
Hea
lth
Serv
ices
N
HS
Trus
tM
AYC
royd
on U
nive
rsity
H
ospi
tal
269
73%
83%
83%
56%
96%
67%
79%
54%
2%
Dar
tfor
d an
d G
rave
sham
N
HS
Trus
tD
VHD
aren
t Val
ley
Hos
pita
l34
271
%86
%87
%36
%93
%16
%28
%52
%3%
Der
by H
ospi
tals
NH
S Fo
unda
tion
Trus
tD
ERR
oyal
Der
by
Hos
pita
l40
149
%71
%71
%27
%10
0%98
%98
%87
%9%
Don
cast
er a
nd B
asse
tlaw
H
ospi
tals
NH
S Fo
unda
tion
Trus
tB
SLB
asse
tlaw
Hos
pita
l10
673
%77
%75
%48
%93
%24
%33
%42
%4%

54 National Heart Failure Audit April 2013-March 2014
Don
cast
er a
nd B
asse
tlaw
H
ospi
tals
NH
S Fo
unda
tion
Trus
tD
IDD
onca
ster
Roy
al
Infir
mar
y17
069
%90
%83
%38
%96
%55
%63
%66
%4%
Dor
set C
ount
y H
ospi
tal
NH
S Fo
unda
tion
Trus
tW
DH
Dor
set C
ount
y H
ospi
tal
208
59%
72%
83%
43%
99%
27%
34%
36%
2%
Ealin
g H
ospi
tal N
HS
Trus
tEA
LEa
ling
Hos
pita
l28
153
%68
%85
%51
%98
%6%
7%84
%13
%
East
and
Nor
th
Her
tfor
dshi
re N
HS
Trus
tLI
SLi
ster
Hos
pita
l18
063
%81
%87
%41
%10
0%64
%75
%79
%13
%
East
and
Nor
th
Her
tfor
dshi
re N
HS
Trus
tQ
EWQ
ueen
Eliz
abet
h II
Hos
pita
l90
46%
63%
78%
32%
100%
33%
42%
31%
0%
East
Che
shir
e N
HS
Trus
tM
ACM
accl
esfie
ld
Dis
tric
t Gen
eral
H
ospi
tal
207
48%
69%
84%
34%
82%
67%
70%
66%
2%
East
Ken
t Hos
pita
ls
Uni
vers
ity N
HS
Foun
datio
n Tr
ust
KC
CK
ent a
nd
Can
terb
ury
Hos
pita
l17
580
%87
%75
%39
%72
%62
%78
%26
%28
%
East
Ken
t Hos
pita
ls
Uni
vers
ity N
HS
Foun
datio
n Tr
ust
QEQ
Que
en E
lizab
eth
the
Que
en M
othe
r H
ospi
tal
157
75%
84%
76%
60%
71%
55%
72%
11%
3%
East
Ken
t Hos
pita
ls
Uni
vers
ity N
HS
Foun
datio
n Tr
ust
WH
HW
illia
m H
arve
y H
ospi
tal
189
54%
81%
71%
49%
71%
70%
82%
36%
3%
East
Lan
cash
ire
Hos
pita
ls
NH
S Tr
ust
BLA
Roy
al B
lack
burn
H
ospi
tal
461
83%
99%
98%
61%
86%
76%
84%
74%
6%
East
Sus
sex
Hea
lthc
are
NH
S Tr
ust
CG
HC
onqu
est H
ospi
tal
193
69%
99%
68%
34%
100%
70%
74%
20%
0%
East
Sus
sex
Hea
lthc
are
NH
S Tr
ust
DG
EEa
stbo
urne
Dis
tric
t G
ener
al H
ospi
tal
222
73%
100%
75%
49%
99%
69%
77%
38%
0%
Epso
m a
nd S
t Hel
ier
Uni
vers
ity H
ospi
tals
NH
S Tr
ust
EPS
Epso
m H
ospi
tal
176
67%
76%
76%
59%
99%
59%
93%
53%
3%
Trus
t nam
eN
ICOR
ho
spita
l co
de
Hos
pita
l nam
eH
eart
failu
re
adm
issi
ons
(n)
ACEI
on
disc
harg
e (%
)
ACEI
/AR
B o
n di
scha
rge
(%)
Bet
a bl
ocke
r on
di
scha
rge
(%)
MR
A on
di
scha
rge
(%)
Rec
eive
d di
scha
rge
plan
ning
(%
)
Ref
erra
l to
HF
nurs
e fo
llow
-up
(%)
Ref
erra
l to
HF
nurs
e fo
llow
-up
(LVS
D o
nly)
(%
)
Ref
erra
l to
card
iolo
gy
follo
w-u
p (%
)
Ref
erra
l to
car
diac
re
habi
litat
ion
(%)

55National Heart Failure Audit April 2013-March 2014
Epso
m a
nd S
t Hel
ier
Uni
vers
ity H
ospi
tals
NH
S Tr
ust
SHC
St H
elie
r H
ospi
tal
226
56%
84%
89%
68%
95%
70%
94%
52%
1%
Frim
ley
Par
k H
ospi
tal
NH
S Fo
unda
tion
Trus
tFR
MFr
imle
y P
ark
Hos
pita
l35
352
%67
%71
%49
%50
%68
%77
%43
%2%
Gat
eshe
ad H
ealt
h N
HS
Foun
datio
n Tr
ust
QEG
Que
en E
lizab
eth
Hos
pita
l (G
ates
head
)34
783
%95
%95
%42
%99
%92
%96
%17
%60
%
Geo
rge
Elio
t Hos
pita
l NH
S Tr
ust
NU
NG
eorg
e El
iot
Hos
pita
l11
865
%74
%89
%42
%10
%0%
0%63
%1%
Glo
uces
ters
hire
Hos
pita
ls
NH
S Fo
unda
tion
Trus
tC
HG
Che
lten
ham
G
ener
al H
ospi
tal
5079
%87
%89
%86
%79
%32
%44
%32
%0%
Glo
uces
ters
hire
Hos
pita
ls
NH
S Fo
unda
tion
Trus
tG
LOG
louc
este
rshi
re
Roy
al H
ospi
tal
7883
%91
%94
%79
%70
%42
%50
%31
%0%
Gre
at W
este
rn H
ospi
tals
N
HS
Foun
datio
n Tr
ust
PM
SG
reat
Wes
tern
H
ospi
tal
498
75%
95%
82%
72%
100%
29%
50%
51%
7%
Guy
's a
nd S
t Tho
mas
' N
HS
Foun
datio
n Tr
ust
STH
St T
hom
as' H
ospi
tal
307
63%
78%
84%
51%
95%
81%
90%
78%
5%
Ham
pshi
re H
ospi
tals
NH
S Fo
unda
tion
Trus
tN
HH
Bas
ings
toke
and
N
orth
Ham
pshi
re
Hos
pita
l21
768
%81
%82
%46
%90
%59
%69
%24
%1%
Ham
pshi
re H
ospi
tals
NH
S Fo
unda
tion
Trus
tR
HC
Roy
al H
amps
hire
C
ount
y H
ospi
tal
150
67%
81%
75%
48%
100%
25%
29%
32%
1%
Har
roga
te a
nd D
istr
ict
NH
S Fo
unda
tion
Trus
tH
AR
Har
roga
te D
istr
ict
Hos
pita
l82
84%
95%
89%
46%
96%
27%
56%
48%
17%
Hea
rt o
f Eng
land
NH
S Fo
unda
tion
Trus
tEB
HB
irm
ingh
am
Hea
rtla
nds
Hos
pita
l17
470
%84
%73
%39
%99
%86
%88
%40
%5%
Hea
rt o
f Eng
land
NH
S Fo
unda
tion
Trus
tG
HS
Goo
d H
ope
Hos
pita
l49
**
**
**
**
*
Hea
rt o
f Eng
land
NH
S Fo
unda
tion
Trus
tSO
LSo
lihul
l Hos
pita
l13
974
%85
%81
%44
%10
0%83
%88
%49
%2%
Hea
ther
woo
d an
d W
exha
m P
ark
Hos
pita
ls
NH
S Fo
unda
tion
Trus
tW
EXW
exha
m P
ark
Hos
pita
l26
262
%78
%82
%55
%95
%53
%61
%74
%11
%
Hin
chin
gbro
oke
Hea
lth
Car
e N
HS
Trus
tH
INH
inch
ingb
rook
e H
ospi
tal
14*
**
**
**
**

56 National Heart Failure Audit April 2013-March 2014
Hom
erto
n U
nive
rsity
H
ospi
tal N
HS
Foun
datio
n Tr
ust
HO
MH
omer
ton
Uni
vers
ity H
ospi
tal
249
63%
87%
89%
36%
91%
49%
60%
55%
7%
Hul
l and
Eas
t Yor
kshi
re
Hos
pita
ls N
HS
Trus
tC
HH
Cas
tle H
ill H
ospi
tal
495
73%
80%
85%
57%
89%
66%
74%
89%
20%
Hul
l and
Eas
t Yor
kshi
re
Hos
pita
ls N
HS
Trus
tH
RI
Hul
l Roy
al In
firm
ary
121
44%
63%
78%
35%
90%
66%
78%
71%
2%
Impe
rial
Col
lege
H
ealt
hcar
e N
HS
Trus
tC
CH
Cha
ring
Cro
ss
Hos
pita
l85
77%
97%
74%
36%
100%
40%
54%
59%
3%
Impe
rial
Col
lege
H
ealt
hcar
e N
HS
Trus
tH
AM
Ham
mer
smith
H
ospi
tal
283
74%
90%
80%
68%
100%
31%
47%
61%
2%
Impe
rial
Col
lege
H
ealt
hcar
e N
HS
Trus
tST
MSt
Mar
y's
Hos
pita
l P
addi
ngto
n85
59%
82%
80%
64%
95%
66%
78%
64%
6%
Isle
of W
ight
NH
S P
CT
IOW
St M
ary'
s H
ospi
tal,
New
port
188
64%
86%
50%
45%
95%
20%
22%
15%
1%
Jam
es P
aget
Uni
vers
ity
Hos
pita
ls N
HS
Foun
datio
n Tr
ust
JPH
Jam
es P
aget
U
nive
rsity
Hos
pita
l30
269
%82
%81
%51
%89
%87
%91
%65
%1%
Ket
teri
ng G
ener
al
Hos
pita
l NH
S Fo
unda
tion
Trus
tK
GH
Ket
teri
ng G
ener
al
Hos
pita
l33
862
%73
%93
%75
%96
%59
%77
%59
%1%
Kin
g's
Col
lege
Hos
pita
l N
HS
Foun
datio
n Tr
ust
KC
HK
ing'
s C
olle
ge
Hos
pita
l33
183
%92
%92
%57
%89
%69
%81
%83
%24
%
Kin
g's
Col
lege
Hos
pita
l N
HS
Foun
datio
n Tr
ust
BR
OP
rinc
ess
Roy
al
Uni
vers
ity H
ospi
tal
(Bro
mle
y)1
**
**
**
**
*
Kin
gsto
n H
ospi
tal N
HS
Trus
tK
THK
ings
ton
Hos
pita
l17
760
%78
%62
%34
%94
%8%
13%
49%
22%
Lanc
ashi
re T
each
ing
Hos
pita
ls N
HS
Foun
datio
n Tr
ust
CH
OC
horl
ey a
nd S
outh
R
ibbl
e H
ospi
tal
229
80%
98%
95%
57%
99%
100%
99%
84%
15%
Trus
t nam
eN
ICOR
ho
spita
l co
de
Hos
pita
l nam
eH
eart
failu
re
adm
issi
ons
(n)
ACEI
on
disc
harg
e (%
)
ACEI
/AR
B o
n di
scha
rge
(%)
Bet
a bl
ocke
r on
di
scha
rge
(%)
MR
A on
di
scha
rge
(%)
Rec
eive
d di
scha
rge
plan
ning
(%
)
Ref
erra
l to
HF
nurs
e fo
llow
-up
(%)
Ref
erra
l to
HF
nurs
e fo
llow
-up
(LVS
D o
nly)
(%
)
Ref
erra
l to
card
iolo
gy
follo
w-u
p (%
)
Ref
erra
l to
car
diac
re
habi
litat
ion
(%)

57National Heart Failure Audit April 2013-March 2014
Lanc
ashi
re T
each
ing
Hos
pita
ls N
HS
Foun
datio
n Tr
ust
RP
HR
oyal
Pre
ston
H
ospi
tal
456
71%
82%
92%
41%
98%
99%
99%
73%
18%
Leed
s Te
achi
ng H
ospi
tals
N
HS
Trus
tLG
ILe
eds
Gen
eral
In
firm
ary
697
62%
79%
84%
59%
93%
70%
78%
74%
6%
Lew
isha
m a
nd G
reen
wic
h N
HS
Trus
tG
WH
Que
en E
lizab
eth
Hos
pita
l (W
oolw
ich)
295
81%
92%
82%
49%
88%
63%
80%
35%
0%
Lew
isha
m a
nd G
reen
wic
h N
HS
Trus
tLE
WU
nive
rsity
Hos
pita
l Le
wis
ham
253
70%
83%
89%
48%
76%
29%
45%
79%
1%
Live
rpoo
l Hea
rt a
nd C
hest
H
ospi
tal N
HS
Foun
datio
n Tr
ust
BH
LLi
verp
ool H
eart
and
C
hest
Hos
pita
l35
100%
100%
93%
53%
97%
60%
56%
93%
52%
Luto
n an
d D
unst
able
H
ospi
tal N
HS
Foun
datio
n Tr
ust
LDH
Luto
n an
d D
unst
able
Hos
pita
l24
482
%92
%82
%63
%90
%49
%63
%62
%7%
Mai
dsto
ne a
nd T
unbr
idge
W
ells
NH
S Tr
ust
MA
IM
aids
tone
Hos
pita
l17
169
%81
%86
%53
%75
%70
%84
%64
%1%
Mai
dsto
ne a
nd T
unbr
idge
W
ells
NH
S Tr
ust
KSX
Tunb
ridg
e W
ells
H
ospi
tal
191
77%
100%
90%
80%
87%
92%
96%
86%
7%
Med
way
NH
S Fo
unda
tion
Trus
tM
DW
Med
way
Mar
itim
e H
ospi
tal
163
83%
93%
96%
80%
96%
71%
89%
59%
11%
Mid
Che
shir
e H
ospi
tals
N
HS
Foun
datio
n Tr
ust
LGH
Leig
hton
Hos
pita
l19
775
%93
%91
%67
%97
%65
%68
%27
%1%
Mid
Ess
ex H
ospi
tal
Serv
ices
NH
S Tr
ust
BFH
Bro
omfie
ld H
ospi
tal
209
89%
98%
98%
49%
100%
99%
99%
65%
28%
Mid
Sta
ffor
dshi
re N
HS
Foun
datio
n Tr
ust
SDG
Staf
ford
Hos
pita
l13
477
%83
%74
%30
%70
%35
%53
%41
%2%
Mid
Yor
kshi
re H
ospi
tals
N
HS
Trus
tD
EWD
ewsb
ury
and
Dis
tric
t Hos
pita
l31
274
%83
%80
%39
%98
%51
%64
%42
%46
%
Mid
Yor
kshi
re H
ospi
tals
N
HS
Trus
tP
INP
inde
rfiel
ds
Hos
pita
l38
264
%83
%86
%57
%91
%57
%62
%58
%52
%
Milt
on K
eyne
s H
ospi
tal
NH
S Fo
unda
tion
Trus
tM
KH
Milt
on K
eyne
s G
ener
al H
ospi
tal
306
81%
95%
93%
67%
100%
32%
43%
77%
9%
Nor
folk
and
Nor
wic
h U
nive
rsity
Hos
pita
ls N
HS
Foun
datio
n Tr
ust
NO
RN
orfo
lk a
nd
Nor
wic
h U
nive
rsity
H
ospi
tal
303
77%
100%
100%
100%
100%
68%
73%
88%
5%
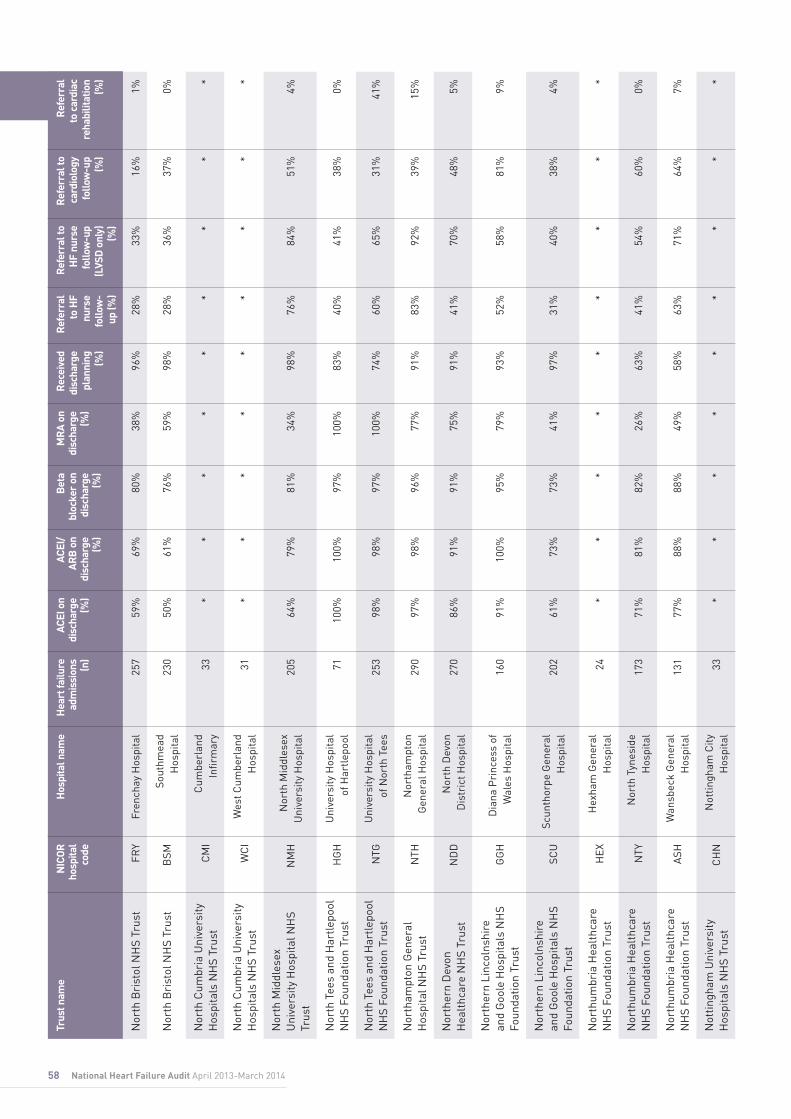
58 National Heart Failure Audit April 2013-March 2014
Nor
th B
rist
ol N
HS
Trus
tFR
YFr
ench
ay H
ospi
tal
257
59%
69%
80%
38%
96%
28%
33%
16%
1%
Nor
th B
rist
ol N
HS
Trus
tB
SMSo
uthm
ead
Hos
pita
l23
050
%61
%76
%59
%98
%28
%36
%37
%0%
Nor
th C
umbr
ia U
nive
rsity
H
ospi
tals
NH
S Tr
ust
CM
IC
umbe
rlan
d In
firm
ary
33*
**
**
**
**
Nor
th C
umbr
ia U
nive
rsity
H
ospi
tals
NH
S Tr
ust
WC
IW
est C
umbe
rlan
d H
ospi
tal
31*
**
**
**
**
Nor
th M
iddl
esex
U
nive
rsity
Hos
pita
l NH
S Tr
ust
NM
HN
orth
Mid
dles
ex
Uni
vers
ity H
ospi
tal
205
64%
79%
81%
34%
98%
76%
84%
51%
4%
Nor
th T
ees
and
Har
tlepo
ol
NH
S Fo
unda
tion
Trus
tH
GH
Uni
vers
ity H
ospi
tal
of H
artle
pool
7110
0%10
0%97
%10
0%83
%40
%41
%38
%0%
Nor
th T
ees
and
Har
tlepo
ol
NH
S Fo
unda
tion
Trus
tN
TGU
nive
rsity
Hos
pita
l of
Nor
th T
ees
253
98%
98%
97%
100%
74%
60%
65%
31%
41%
Nor
tham
pton
Gen
eral
H
ospi
tal N
HS
Trus
tN
THN
orth
ampt
on
Gen
eral
Hos
pita
l29
097
%98
%96
%77
%91
%83
%92
%39
%15
%
Nor
ther
n D
evon
H
ealt
hcar
e N
HS
Trus
tN
DD
Nor
th D
evon
D
istr
ict H
ospi
tal
270
86%
91%
91%
75%
91%
41%
70%
48%
5%
Nor
ther
n Li
ncol
nshi
re
and
Goo
le H
ospi
tals
NH
S Fo
unda
tion
Trus
tG
GH
Dia
na P
rinc
ess
of
Wal
es H
ospi
tal
160
91%
100%
95%
79%
93%
52%
58%
81%
9%
Nor
ther
n Li
ncol
nshi
re
and
Goo
le H
ospi
tals
NH
S Fo
unda
tion
Trus
tSC
USc
unth
orpe
Gen
eral
H
ospi
tal
202
61%
73%
73%
41%
97%
31%
40%
38%
4%
Nor
thum
bria
Hea
lthc
are
NH
S Fo
unda
tion
Trus
tH
EXH
exha
m G
ener
al
Hos
pita
l24
**
**
**
**
*
Nor
thum
bria
Hea
lthc
are
NH
S Fo
unda
tion
Trus
tN
TYN
orth
Tyn
esid
e H
ospi
tal
173
71%
81%
82%
26%
63%
41%
54%
60%
0%
Nor
thum
bria
Hea
lthc
are
NH
S Fo
unda
tion
Trus
tA
SHW
ansb
eck
Gen
eral
H
ospi
tal
131
77%
88%
88%
49%
58%
63%
71%
64%
7%
Not
tingh
am U
nive
rsity
H
ospi
tals
NH
S Tr
ust
CH
NN
ottin
gham
City
H
ospi
tal
33*
**
**
**
**
Trus
t nam
eN
ICOR
ho
spita
l co
de
Hos
pita
l nam
eH
eart
failu
re
adm
issi
ons
(n)
ACEI
on
disc
harg
e (%
)
ACEI
/AR
B o
n di
scha
rge
(%)
Bet
a bl
ocke
r on
di
scha
rge
(%)
MR
A on
di
scha
rge
(%)
Rec
eive
d di
scha
rge
plan
ning
(%
)
Ref
erra
l to
HF
nurs
e fo
llow
-up
(%)
Ref
erra
l to
HF
nurs
e fo
llow
-up
(LVS
D o
nly)
(%
)
Ref
erra
l to
card
iolo
gy
follo
w-u
p (%
)
Ref
erra
l to
car
diac
re
habi
litat
ion
(%)

59National Heart Failure Audit April 2013-March 2014
Not
tingh
am U
nive
rsity
H
ospi
tals
NH
S Tr
ust
UH
NQ
ueen
's M
edic
al
Cen
tre
100
84%
86%
70%
37%
46%
36%
40%
28%
0%
Oxf
ord
Rad
cliff
e H
ospi
tals
N
HS
Trus
tH
OR
Hor
ton
Gen
eral
H
ospi
tal
186
94%
97%
98%
93%
99%
89%
94%
34%
38%
Oxf
ord
Rad
cliff
e H
ospi
tals
N
HS
Trus
tR
AD
John
Rad
cliff
e H
ospi
tal
500
93%
99%
90%
93%
96%
81%
91%
59%
26%
Pen
nine
Acu
te H
ospi
tals
N
HS
Trus
tB
RY
Fair
field
Gen
eral
H
ospi
tal
325
71%
79%
81%
44%
61%
64%
76%
36%
1%
Pen
nine
Acu
te H
ospi
tals
N
HS
Trus
tN
MG
Nor
th M
anch
este
r G
ener
al H
ospi
tal
203
76%
80%
92%
43%
65%
76%
89%
41%
0%
Pen
nine
Acu
te H
ospi
tals
N
HS
Trus
tB
HH
Roc
hdal
e In
firm
ary
4833
%33
%0%
27%
53%
51%
100%
39%
0%
Pen
nine
Acu
te H
ospi
tals
N
HS
Trus
tO
HM
Roy
al O
ldha
m
Hos
pita
l27
486
%88
%90
%52
%65
%76
%90
%52
%1%
Pet
erbo
roug
h an
d St
amfo
rd H
ospi
tals
NH
S Fo
unda
tion
Trus
tP
ETP
eter
boro
ugh
City
H
ospi
tal
381
91%
96%
88%
84%
78%
65%
75%
58%
7%
Ply
mou
th H
ospi
tals
NH
S Tr
ust
PLY
Der
rifo
rd H
ospi
tal
297
66%
76%
87%
74%
100%
n/a
n/a
n/a
n/a
Poo
le H
ospi
tal N
HS
Foun
datio
n Tr
ust
PG
HP
oole
Gen
eral
H
ospi
tal
252
44%
66%
78%
32%
87%
55%
63%
29%
10%
Por
tsm
outh
Hos
pita
ls
NH
S Tr
ust
QA
PQ
ueen
Ale
xand
ra
Hos
pita
l38
964
%77
%80
%75
%10
0%87
%92
%31
%6%
Rot
herh
am N
HS
Foun
datio
n Tr
ust
RO
TR
othe
rham
Hos
pita
l27
955
%73
%77
%51
%77
%54
%61
%46
%23
%
Roy
al B
erks
hire
NH
S Fo
unda
tion
Trus
tB
HR
Roy
al B
erks
hire
H
ospi
tal
354
79%
91%
92%
50%
98%
84%
91%
34%
2%
Roy
al B
rom
pton
and
H
arefi
eld
NH
S Fo
unda
tion
Trus
tH
HH
arefi
eld
Hos
pita
l19
468
%90
%93
%81
%93
%69
%69
%94
%26
%
Roy
al B
rom
pton
and
H
arefi
eld
NH
S Fo
unda
tion
Trus
tN
HB
Roy
al B
rom
pton
H
ospi
tal
202
68%
91%
93%
71%
99%
47%
58%
97%
3%
Roy
al C
ornw
all H
ospi
tals
N
HS
Trus
tR
CH
Roy
al C
ornw
all
Hos
pita
l19
556
%64
%76
%37
%51
%43
%45
%45
%50
%

60 National Heart Failure Audit April 2013-March 2014
Roy
al D
evon
and
Exe
ter
NH
S Fo
unda
tion
Trus
tR
DE
Roy
al D
evon
&
Exet
er H
ospi
tal
349
100%
100%
100%
98%
72%
21%
23%
32%
3%
Roy
al F
ree
Lond
on N
HS
Trus
tR
FHR
oyal
Fre
e H
ospi
tal
251
71%
89%
93%
54%
95%
45%
58%
70%
1%
Roy
al L
iver
pool
and
B
road
gree
n U
nive
rsity
H
ospi
tals
NH
S Tr
ust
RLU
Roy
al L
iver
pool
U
nive
rsity
Hos
pita
l33
382
%96
%94
%51
%69
%74
%84
%59
%7%
Roy
al S
urre
y C
ount
y H
ospi
tal N
HS
Foun
datio
n Tr
ust
RSU
Roy
al S
urre
y C
ount
y H
ospi
tal
199
79%
90%
74%
29%
95%
44%
70%
55%
4%
Roy
al U
nite
d H
ospi
tal
Bat
h N
HS
Trus
tB
ATR
oyal
Uni
ted
Hos
pita
l Bat
h17
081
%84
%82
%70
%10
0%43
%39
%49
%6%
Salfo
rd R
oyal
NH
S Fo
unda
tion
Trus
tSL
FSa
lford
Roy
al
341
84%
95%
93%
56%
74%
72%
83%
54%
2%
Salis
bury
NH
S Fo
unda
tion
Trus
tSA
LSa
lisbu
ry D
istr
ict
Hos
pita
l19
960
%84
%84
%43
%10
0%60
%64
%29
%7%
Sand
wel
l and
Wes
t B
irm
ingh
am H
ospi
tals
N
HS
Trus
tD
UD
Bir
min
gham
City
H
ospi
tal
163
81%
93%
91%
54%
97%
73%
75%
85%
18%
Sand
wel
l and
Wes
t B
irm
ingh
am H
ospi
tals
N
HS
Trus
tSA
NSa
ndw
ell G
ener
al
Hos
pita
l18
278
%10
0%96
%94
%94
%96
%98
%87
%23
%
Shef
field
Tea
chin
g H
ospi
tals
NH
S Fo
unda
tion
Trus
tN
GS
Nor
ther
n G
ener
al
Hos
pita
l46
560
%71
%78
%48
%97
%49
%54
%22
%3%
Sher
woo
d Fo
rest
H
ospi
tals
NH
S Fo
unda
tion
Trus
tK
MH
Kin
g's
Mill
Hos
pita
l40
382
%90
%85
%58
%89
%45
%66
%42
%2%
Sher
woo
d Fo
rest
H
ospi
tals
NH
S Fo
unda
tion
Trus
tN
HN
New
ark
Hos
pita
l6
**
**
**
**
*
Shre
wsb
ury
and
Telfo
rd
Hos
pita
ls N
HS
Trus
tTL
FP
rinc
ess
Roy
al
Hos
pita
l (Te
lford
)59
82%
90%
83%
45%
100%
100%
100%
61%
9%
Trus
t nam
eN
ICOR
ho
spita
l co
de
Hos
pita
l nam
eH
eart
failu
re
adm
issi
ons
(n)
ACEI
on
disc
harg
e (%
)
ACEI
/AR
B o
n di
scha
rge
(%)
Bet
a bl
ocke
r on
di
scha
rge
(%)
MR
A on
di
scha
rge
(%)
Rec
eive
d di
scha
rge
plan
ning
(%
)
Ref
erra
l to
HF
nurs
e fo
llow
-up
(%)
Ref
erra
l to
HF
nurs
e fo
llow
-up
(LVS
D o
nly)
(%
)
Ref
erra
l to
card
iolo
gy
follo
w-u
p (%
)
Ref
erra
l to
car
diac
re
habi
litat
ion
(%)
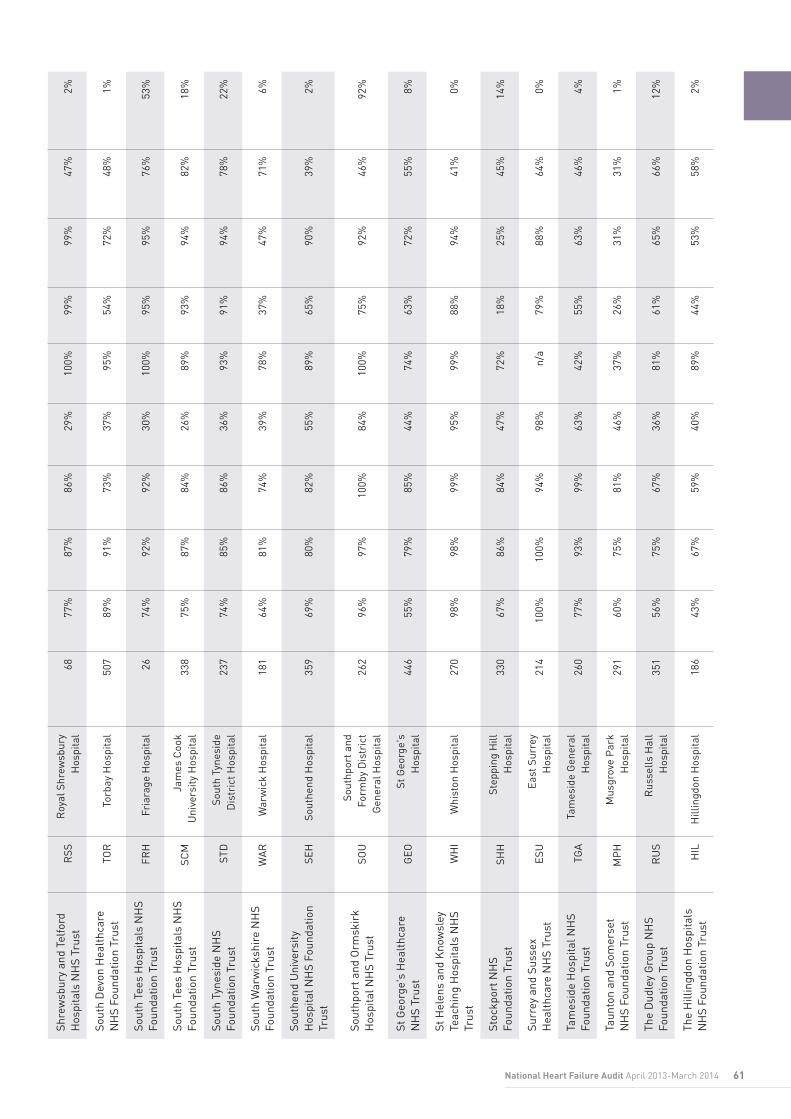
61National Heart Failure Audit April 2013-March 2014
Shre
wsb
ury
and
Telfo
rd
Hos
pita
ls N
HS
Trus
tR
SSR
oyal
Shr
ewsb
ury
Hos
pita
l68
77%
87%
86%
29%
100%
99%
99%
47%
2%
Sout
h D
evon
Hea
lthc
are
NH
S Fo
unda
tion
Trus
tTO
RTo
rbay
Hos
pita
l50
789
%91
%73
%37
%95
%54
%72
%48
%1%
Sout
h Te
es H
ospi
tals
NH
S Fo
unda
tion
Trus
tFR
HFr
iara
ge H
ospi
tal
2674
%92
%92
%30
%10
0%95
%95
%76
%53
%
Sout
h Te
es H
ospi
tals
NH
S Fo
unda
tion
Trus
tSC
MJa
mes
Coo
k U
nive
rsity
Hos
pita
l33
875
%87
%84
%26
%89
%93
%94
%82
%18
%
Sout
h Ty
nesi
de N
HS
Foun
datio
n Tr
ust
STD
Sout
h Ty
nesi
de
Dis
tric
t Hos
pita
l23
774
%85
%86
%36
%93
%91
%94
%78
%22
%
Sout
h W
arw
icks
hire
NH
S Fo
unda
tion
Trus
t W
AR
War
wic
k H
ospi
tal
181
64%
81%
74%
39%
78%
37%
47%
71%
6%
Sout
hend
Uni
vers
ity
Hos
pita
l NH
S Fo
unda
tion
Trus
tSE
HSo
uthe
nd H
ospi
tal
359
69%
80%
82%
55%
89%
65%
90%
39%
2%
Sout
hpor
t and
Orm
skir
k H
ospi
tal N
HS
Trus
tSO
USo
uthp
ort a
nd
Form
by D
istr
ict
Gen
eral
Hos
pita
l26
296
%97
%10
0%84
%10
0%75
%92
%46
%92
%
St G
eorg
e's
Hea
lthc
are
NH
S Tr
ust
GEO
St G
eorg
e's
Hos
pita
l44
655
%79
%85
%44
%74
%63
%72
%55
%8%
St H
elen
s an
d K
now
sley
Te
achi
ng H
ospi
tals
NH
S Tr
ust
WH
IW
hist
on H
ospi
tal
270
98%
98%
99%
95%
99%
88%
94%
41%
0%
Stoc
kpor
t NH
S Fo
unda
tion
Trus
tSH
HSt
eppi
ng H
ill
Hos
pita
l33
067
%86
%84
%47
%72
%18
%25
%45
%14
%
Surr
ey a
nd S
usse
x H
ealt
hcar
e N
HS
Trus
tES
UEa
st S
urre
y H
ospi
tal
214
100%
100%
94%
98%
n/a
79%
88%
64%
0%
Tam
esid
e H
ospi
tal N
HS
Foun
datio
n Tr
ust
TGA
Tam
esid
e G
ener
al
Hos
pita
l26
077
%93
%99
%63
%42
%55
%63
%46
%4%
Taun
ton
and
Som
erse
t N
HS
Foun
datio
n Tr
ust
MP
HM
usgr
ove
Par
k H
ospi
tal
291
60%
75%
81%
46%
37%
26%
31%
31%
1%
The
Dud
ley
Gro
up N
HS
Foun
datio
n Tr
ust
RU
SR
usse
lls H
all
Hos
pita
l35
156
%75
%67
%36
%81
%61
%65
%66
%12
%
The
Hill
ingd
on H
ospi
tals
N
HS
Foun
datio
n Tr
ust
HIL
Hill
ingd
on H
ospi
tal
186
43%
67%
59%
40%
89%
44%
53%
58%
2%

62 National Heart Failure Audit April 2013-March 2014
The
Ipsw
ich
Hos
pita
l NH
S Tr
ust
IPS
Ipsw
ich
Hos
pita
l16
474
%82
%83
%55
%93
%35
%60
%31
%0%
The
New
cast
le U
pon
Tyne
H
ospi
tals
NH
S Fo
unda
tion
Trus
tFR
EFr
eem
an H
ospi
tal
and
Roy
al V
icto
ria
Infir
mar
y48
963
%78
%71
%35
%90
%60
%66
%75
%6%
The
Nor
th W
est L
ondo
n H
ospi
tals
NH
S Tr
ust
CM
HC
entr
al M
iddl
esex
H
ospi
tal
9371
%83
%85
%40
%18
%17
%26
%29
%1%
The
Nor
th W
est L
ondo
n H
ospi
tals
NH
S Tr
ust
NP
HN
orth
wic
k P
ark
Hos
pita
l19
466
%78
%84
%29
%7%
10%
22%
30%
0%
The
Pri
nces
s A
lexa
ndra
H
ospi
tal N
HS
Trus
tPA
HP
rinc
ess
Ale
xand
ra
Hos
pita
l11
873
%87
%89
%62
%94
%33
%41
%70
%1%
The
Que
en E
lizab
eth
Hos
pita
l Kin
g's
Lynn
NH
S Fo
unda
tion
Trus
tQ
KL
Que
en E
lizab
eth
Hos
pita
l (K
ing'
s Ly
nn)
213
72%
83%
89%
42%
93%
5%7%
27%
8%
The
Roy
al B
ourn
emou
th
and
Chr
istc
hurc
h H
ospi
tals
NH
S Fo
unda
tion
Trus
t
BO
UR
oyal
Bou
rnem
outh
G
ener
al H
ospi
tal
453
66%
77%
85%
50%
78%
7%9%
46%
3%
The
Roy
al W
olve
rham
pton
H
ospi
tals
NH
S Tr
ust
NC
RN
ew C
ross
Hos
pita
l69
58%
69%
77%
38%
53%
48%
58%
40%
0%
The
Whi
ttin
gton
Hos
pita
l N
HS
Trus
tW
HT
Whi
ttin
gton
H
ospi
tal
160
91%
97%
93%
77%
97%
71%
92%
70%
10%
Uni
ted
Linc
olns
hire
H
ospi
tals
NH
S Tr
ust
GR
AG
rant
ham
and
D
istr
ict H
ospi
tal
9675
%93
%94
%36
%10
0%24
%30
%66
%0%
Uni
ted
Linc
olns
hire
H
ospi
tals
NH
S Tr
ust
LIN
Linc
oln
Cou
nty
Hos
pita
l12
154
%71
%63
%39
%97
%24
%35
%57
%1%
Uni
ted
Linc
olns
hire
H
ospi
tals
NH
S Tr
ust
PIL
Pilg
rim
Hos
pita
l19
165
%73
%79
%54
%95
%26
%39
%48
%4%
Uni
vers
ity C
olle
ge L
ondo
n H
ospi
tals
NH
S Fo
unda
tion
Trus
tU
CL
Uni
vers
ity C
olle
ge
Hos
pita
l32
396
%99
%97
%82
%99
%97
%99
%94
%89
%
Trus
t nam
eN
ICOR
ho
spita
l co
de
Hos
pita
l nam
eH
eart
failu
re
adm
issi
ons
(n)
ACEI
on
disc
harg
e (%
)
ACEI
/AR
B o
n di
scha
rge
(%)
Bet
a bl
ocke
r on
di
scha
rge
(%)
MR
A on
di
scha
rge
(%)
Rec
eive
d di
scha
rge
plan
ning
(%
)
Ref
erra
l to
HF
nurs
e fo
llow
-up
(%)
Ref
erra
l to
HF
nurs
e fo
llow
-up
(LVS
D o
nly)
(%
)
Ref
erra
l to
card
iolo
gy
follo
w-u
p (%
)
Ref
erra
l to
car
diac
re
habi
litat
ion
(%)

63National Heart Failure Audit April 2013-March 2014
Uni
vers
ity H
ospi
tal o
f N
orth
Sta
ffor
dshi
re N
HS
Trus
tST
OU
nive
rsity
H
ospi
tal o
f Nor
th
Staf
ford
shir
e67
653
%61
%61
%20
%78
%76
%92
%47
%6%
Uni
vers
ity H
ospi
tal o
f So
uth
Man
ches
ter
NH
S Fo
unda
tion
Trus
tW
YTW
ythe
nsha
we
Hos
pita
l23
596
%98
%93
%67
%99
%50
%59
%57
%10
%
Uni
vers
ity H
ospi
tal
Sout
ham
pton
NH
S Tr
ust
SGH
Sout
ham
pton
G
ener
al H
ospi
tal
324
65%
77%
80%
72%
93%
14%
17%
50%
10%
Uni
vers
ity H
ospi
tals
B
irm
ingh
am N
HS
Foun
datio
n Tr
ust
QEB
Que
en E
lizab
eth
Hos
pita
l (E
dgba
ston
)29
768
%78
%72
%40
%87
%70
%83
%48
%3%
Uni
vers
ity H
ospi
tals
B
rist
ol N
HS
Foun
datio
n Tr
ust
BR
IB
rist
ol R
oyal
In
firm
ary
347
69%
81%
80%
51%
94%
76%
75%
77%
4%
Uni
vers
ity H
ospi
tals
C
oven
try
and
War
wic
kshi
re N
HS
Trus
tW
AL
Uni
vers
ity H
ospi
tal
Cov
entr
y39
073
%84
%88
%56
%86
%54
%73
%37
%7%
Uni
vers
ity H
ospi
tals
of
Leic
este
r N
HS
Trus
tG
RL
Gle
nfiel
d H
ospi
tal
669
57%
71%
78%
42%
84%
55%
59%
77%
40%
Uni
vers
ity H
ospi
tals
of
Leic
este
r N
HS
Trus
tLE
RLe
ices
ter
Roy
al
Infir
mar
y96
57%
65%
73%
22%
63%
8%6%
14%
6%
Uni
vers
ity H
ospi
tals
of
Mor
ecam
be B
ay N
HS
Foun
datio
n Tr
ust
FGH
Furn
ess
Gen
eral
H
ospi
tal
158
79%
94%
89%
45%
99%
84%
88%
70%
4%
Uni
vers
ity H
ospi
tals
of
Mor
ecam
be B
ay N
HS
Foun
datio
n Tr
ust
RLI
Roy
al L
anca
ster
In
firm
ary
175
86%
100%
99%
60%
94%
82%
86%
44%
5%
Wal
sall
Hea
lthc
are
NH
S Tr
ust
WM
HM
anor
Hos
pita
l25
099
%99
%10
0%97
%96
%99
%99
%59
%11
%
War
ring
ton
and
Hal
ton
Hos
pita
ls N
HS
Foun
datio
n Tr
ust
WD
GW
arri
ngto
n H
ospi
tal
9584
%96
%93
%55
%97
%90
%90
%73
%34
%
Wes
t Her
tfor
dshi
re
Hos
pita
ls N
HS
Trus
tW
ATW
atfo
rd G
ener
al
Hos
pita
l57
910
0%10
0%10
0%99
%99
%63
%76
%85
%3%
Wes
t Mid
dles
ex U
nive
rsity
H
ospi
tal N
HS
Trus
tW
MU
Wes
t Mid
dles
ex
Uni
vers
ity H
ospi
tal
225
68%
80%
85%
66%
98%
70%
80%
31%
3%

64 National Heart Failure Audit April 2013-March 2014
Wes
t Suf
folk
NH
S Fo
unda
tion
Trus
tW
SHW
est S
uffo
lk
Hos
pita
l28
366
%82
%85
%57
%97
%38
%50
%48
%8%
Wes
tern
Sus
sex
Hos
pita
ls
NH
S Tr
ust
STR
St R
icha
rd's
H
ospi
tal
300
74%
86%
81%
36%
91%
46%
63%
29%
3%
Wes
tern
Sus
sex
Hos
pita
ls
NH
S Tr
ust
WR
GW
orth
ing
Hos
pita
l32
596
%96
%98
%99
%64
%66
%78
%40
%8%
Wes
ton
Are
a H
ealt
h N
HS
Trus
tW
GH
Wes
ton
Gen
eral
H
ospi
tal
6950
%83
%87
%44
%10
0%5%
3%37
%0%
Wir
ral U
nive
rsity
Tea
chin
g H
ospi
tal N
HS
Foun
datio
n Tr
ust
WIR
Arr
owe
Par
k H
ospi
tal
403
93%
98%
97%
70%
99%
78%
88%
46%
35%
Wor
cest
ersh
ire
Acu
te
Hos
pita
ls N
HS
Trus
tR
EDA
lexa
ndra
Hos
pita
l19
264
%79
%74
%30
%90
%40
%53
%58
%66
%
Wor
cest
ersh
ire
Acu
te
Hos
pita
ls N
HS
Trus
tW
RC
Wor
cest
ersh
ire
Roy
al H
ospi
tal
7874
%84
%82
%59
%10
0%99
%99
%73
%11
%
Wri
ghtin
gton
, Wig
an a
nd
Leig
h N
HS
Foun
datio
n Tr
ust
AEI
Roy
al A
lber
t Ed
war
d In
firm
ary
437
70%
95%
98%
28%
92%
72%
83%
72%
100%
Wye
Val
ley
NH
S Tr
ust
HC
HC
ount
y H
ospi
tal
Her
efor
d14
454
%66
%60
%34
%94
%43
%68
%47
%2%
Yeov
il D
istr
ict H
ospi
tal
NH
S Fo
unda
tion
Trus
tYE
OYe
ovil
Dis
tric
t H
ospi
tal
183
74%
84%
77%
24%
97%
97%
96%
45%
35%
York
Tea
chin
g H
ospi
tal
NH
S Fo
unda
tion
Trus
tSC
ASc
arbo
roug
h G
ener
al H
ospi
tal
0n/
an/
an/
an/
an/
an/
an/
an/
an/
a
York
Tea
chin
g H
ospi
tal
NH
S Fo
unda
tion
Trus
tYD
HTh
e Yo
rk H
ospi
tal
293
76%
82%
83%
60%
6%29
%44
%45
%3%
Trus
t nam
eN
ICOR
ho
spita
l co
de
Hos
pita
l nam
eH
eart
failu
re
adm
issi
ons
(n)
ACEI
on
disc
harg
e (%
)
ACEI
/AR
B o
n di
scha
rge
(%)
Bet
a bl
ocke
r on
di
scha
rge
(%)
MR
A on
di
scha
rge
(%)
Rec
eive
d di
scha
rge
plan
ning
(%
)
Ref
erra
l to
HF
nurs
e fo
llow
-up
(%)
Ref
erra
l to
HF
nurs
e fo
llow
-up
(LVS
D o
nly)
(%
)
Ref
erra
l to
card
iolo
gy
follo
w-u
p (%
)
Ref
erra
l to
car
diac
re
habi
litat
ion
(%)

65National Heart Failure Audit April 2013-March 2014
6.2.
3 In
-hos
pita
l car
e in
Wal
es
Hea
lth B
oard
nam
eN
ICOR
ho
spita
l cod
eH
ospi
tal n
ame
Hea
rt fa
ilure
ad
mis
sion
s (n
)R
ecei
ved
echo
(%
)Ca
rdio
logy
in
patie
nt (%
)In
put f
rom
co
nsul
tant
ca
rdio
logi
st (%
)
Inpu
t fro
m
spec
ialis
t (%
)
Abe
rtaw
e B
ro M
orga
nnw
g U
nive
rsity
H
ealt
h B
oard
MO
RM
orri
ston
Hos
pita
l24
992
%59
%69
%72
%
Abe
rtaw
e B
ro M
orga
nnw
g U
nive
rsity
H
ealt
h B
oard
PO
WP
rinc
ess
Of W
ales
Hos
pita
l24
497
%68
%78
%79
%
Abe
rtaw
e B
ro M
orga
nnw
g U
nive
rsity
H
ealt
h B
oard
SIN
Sing
leto
n H
ospi
tal
109
83%
42%
46%
47%
Ane
urin
Bev
an H
ealt
h B
oard
NEV
Nev
ill H
all H
ospi
tal
209
98%
54%
58%
68%
Ane
urin
Bev
an H
ealt
h B
oard
GW
ER
oyal
Gw
ent H
ospi
tal
161
100%
53%
64%
65%
Ane
urin
Bev
an H
ealt
h B
oard
YYF
Ysby
ty Y
stra
d Fa
wr
0n/
an/
an/
an/
a
Bet
si C
adw
alad
r U
nive
rsity
Hea
lth
Boa
rdC
LWG
lan
Clw
yd H
ospi
tal
281
92%
40%
46%
52%
Bet
si C
adw
alad
r U
nive
rsity
Hea
lth
Boa
rdW
RX
Wre
xham
Mae
lor
Hos
pita
l18
099
%56
%60
%69
%
Bet
si C
adw
alad
r U
nive
rsity
Hea
lth
Boa
rdG
WY
Ysby
ty G
wyn
edd
Hos
pita
l13
486
%38
%52
%55
%
Car
diff
& V
ale
Uni
vers
ity H
ealt
h B
oard
LLD
Uni
vers
ity H
ospi
tal L
land
ough
146
80%
0%8%
37%
Car
diff
& V
ale
Uni
vers
ity H
ealt
h B
oard
UH
WU
nive
rsity
Hos
pita
l of W
ales
223
78%
43%
58%
59%
Cw
m T
af U
nive
rsity
Hea
lth
Boa
rdP
CH
Pri
nce
Cha
rles
Hos
pita
l20
710
0%59
%74
%78
%
Cw
m T
af U
nive
rsity
Hea
lth
Boa
rdR
GH
Roy
al G
lam
orga
n H
ospi
tal
119
99%
55%
68%
84%
Hyw
el D
da H
ealt
h B
oard
BR
GB
rong
lais
Gen
eral
Hos
pita
l19
196
%82
%90
%90
%
Hyw
el D
da H
ealt
h B
oard
WW
GG
lang
wili
Gen
eral
Hos
pita
l69
91%
49%
60%
60%
Hyw
el D
da H
ealt
h B
oard
PP
HP
rinc
e P
hilip
Hos
pita
l11
499
%34
%47
%51
%
Hyw
el D
da H
ealt
h B
oard
WYB
With
ybus
h G
ener
al H
ospi
tal
140
86%
36%
30%
30%

66 National Heart Failure Audit April 2013-March 2014
6.2.
4 Tr
eatm
ent a
nd m
anag
emen
t on
disc
harg
e in
Wal
es
Hea
lth B
oard
nam
eN
ICOR
ho
spita
l co
de
Hos
pita
l nam
eH
eart
failu
re
adm
issi
ons
(n)
ACEI
on
disc
harg
e (%
)
ACEI
/AR
B o
n di
scha
rge
(%)
Bet
a bl
ocke
r on
di
scha
rge
(%)
MR
A on
di
scha
rge
(%)
Rec
eive
d di
scha
rge
plan
ning
(%
)
Ref
erra
l to
HF
nurs
e fo
llow
-up
(%)
Ref
erra
l to
HF
nurs
e fo
llow
-up
(LVS
D o
nly)
(%
)
Ref
erra
l to
card
iolo
gy
follo
w-u
p (%
)
Ref
erra
l to
car
diac
re
habi
litat
ion
(%)
Abe
rtaw
e B
ro M
orga
nnw
g U
nive
rsity
Hea
lth
Boa
rdM
OR
Mor
rist
on H
ospi
tal
249
91%
99%
97%
85%
89%
51%
60%
77%
35%
Abe
rtaw
e B
ro M
orga
nnw
g U
nive
rsity
Hea
lth
Boa
rdP
OW
Pri
nces
s O
f Wal
es
Hos
pita
l24
478
%99
%96
%63
%98
%29
%43
%44
%1%
Abe
rtaw
e B
ro M
orga
nnw
g U
nive
rsity
Hea
lth
Boa
rdSI
NSi
ngle
ton
Hos
pita
l10
983
%91
%91
%43
%78
%8%
13%
53%
4%
Ane
urin
Bev
an H
ealt
h B
oard
NEV
Nev
ill H
all H
ospi
tal
209
91%
93%
91%
76%
79%
57%
68%
38%
24%
Ane
urin
Bev
an H
ealt
h B
oard
GW
ER
oyal
Gw
ent
Hos
pita
l16
190
%93
%89
%58
%52
%57
%66
%53
%8%
Ane
urin
Bev
an H
ealt
h B
oard
YYF
Ysby
ty Y
stra
d Fa
wr*
0n/
an/
an/
an/
an/
an/
an/
an/
an/
a
Bet
si C
adw
alad
r U
nive
rsity
Hea
lth
Boa
rdC
LWG
lan
Clw
yd H
ospi
tal
281
80%
92%
86%
54%
54%
38%
52%
38%
2%
Bet
si C
adw
alad
r U
nive
rsity
Hea
lth
Boa
rdW
RX
Wre
xham
Mae
lor
Hos
pita
l18
071
%81
%89
%55
%89
%64
%80
%49
%1%
Bet
si C
adw
alad
r U
nive
rsity
Hea
lth
Boa
rdG
WY
Ysby
ty G
wyn
edd
Hos
pita
l13
454
%67
%84
%48
%35
%21
%28
%39
%1%
Car
diff
& V
ale
Uni
vers
ity
Hea
lth
Boa
rdLL
DU
nive
rsity
Hos
pita
l Ll
ando
ugh
146
95%
96%
94%
64%
49%
49%
52%
20%
0%
Car
diff
& V
ale
Uni
vers
ity
Hea
lth
Boa
rdU
HW
Uni
vers
ity H
ospi
tal
of W
ales
223
95%
96%
91%
67%
62%
40%
46%
52%
2%
Cw
m T
af U
nive
rsity
Hea
lth
Boa
rdP
CH
Pri
nce
Cha
rles
H
ospi
tal
207
63%
73%
75%
34%
71%
29%
36%
53%
6%
Cw
m T
af U
nive
rsity
Hea
lth
Boa
rdR
GH
Roy
al G
lam
orga
n H
ospi
tal
119
64%
81%
80%
61%
72%
39%
49%
35%
2%
Hyw
el D
da H
ealt
h B
oard
BR
GB
rong
lais
Gen
eral
H
ospi
tal
191
88%
97%
99%
91%
48%
93%
97%
42%
24%
* P
atie
nt E
piso
de D
atab
ase
of W
ales
indi
cate
s th
at Y
sbyt
y Ys
trad
Faw
r H
ospi
tal t
reat
ed p
atie
nts
with
a p
rim
ary
diag
nosi
s of
Hea
rt F
ailu
re d
urin
g th
is p
erio
d. T
he W
elsh
Gov
ernm
ent h
as c
onfir
med
that
the
hosp
ital d
oes
not p
rovi
de h
eart
fa
ilure
ser
vice
s an
d is
cur
rent
ly lo
okin
g in
to th
e di
scre
panc
y.
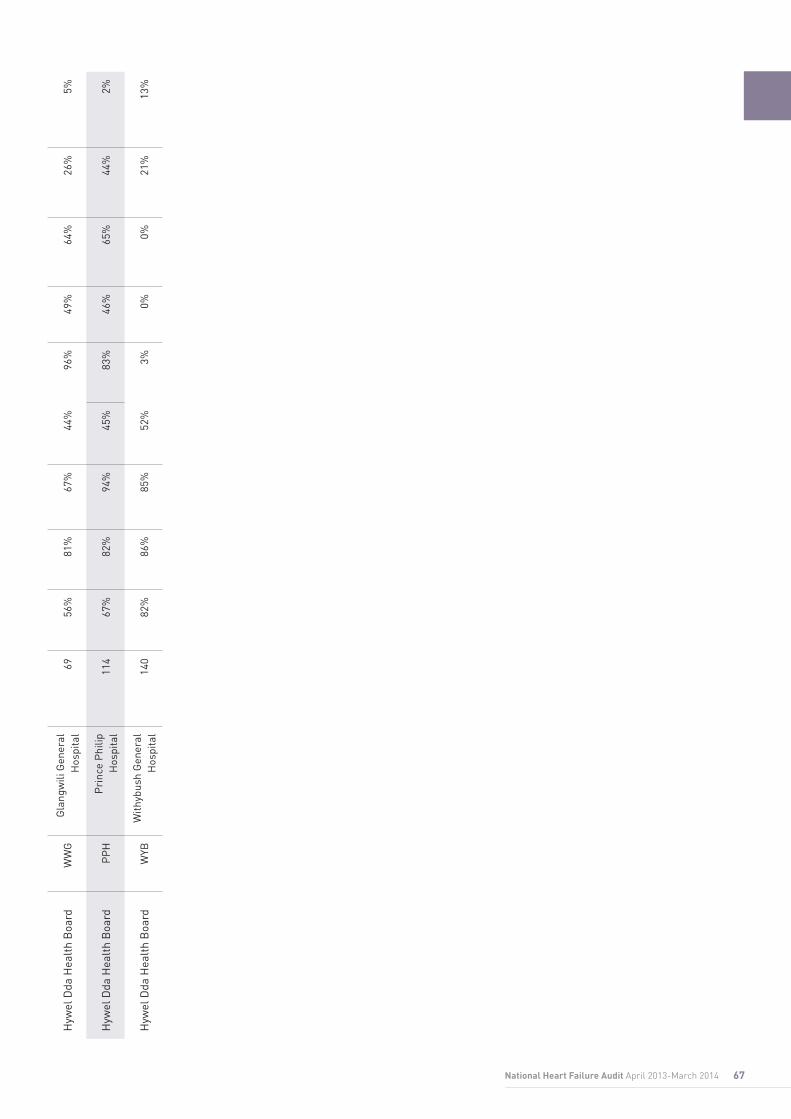
67National Heart Failure Audit April 2013-March 2014
Hyw
el D
da H
ealt
h B
oard
WW
GG
lang
wili
Gen
eral
H
ospi
tal
6956
%81
%67
%44
%96
%49
%64
%26
%5%
Hyw
el D
da H
ealt
h B
oard
PP
HP
rinc
e P
hilip
H
ospi
tal
114
67%
82%
94%
45%
83%
46%
65%
44%
2%
Hyw
el D
da H
ealt
h B
oard
WYB
With
ybus
h G
ener
al
Hos
pita
l14
082
%86
%85
%52
%3%
0%0%
21%
13%

68 National Heart Failure Audit April 2013-March 2014
7 Case Studies
A. National Heart Failure Audit Steering Group membership
Name Job title and organisation Stakeholder representation
Theresa McDonagh Consultant Cardiologist (KCH) and Professor of Heart Failure (KCL) and National Heart Failure Audit Clinical Lead
Clinical lead, Chair
Suzanna Hardman Consultant Cardiologist (Whittington Hospital) and past Chair of British Society of Heart Failure (BSH)
BSH
John Cleland Chair in Clinical Cardiology (Imperial College London) Consultant cardiologist (England), HALO
Gethin Ellis Consultant cardiologist (Cwm Taf University Local Health Board) and Network Lead Cardiologist (South East Wales, South Wales Cardiac Network)
Consultant cardiologist (Wales)
Jackie Austin Nurse Consultant (Aneurin Bevan Health Board) and Lead Nurse South Wales Cardiac Network
Cardiac network/Heart Failure Nurse Specialist (Wales)
Jim Moore General Practitioner and GP with Special Interest, Gloucestershire Heart Failure Service
Primary care physician
Gemma Baldock-Apps Cardiology Audit and Data Manager (East Sussex Healthcare NHS Trust) Audit and clinical effectiveness, database user
Janine Beezer Heart Failure Specialist Clinical Pharmacist (City Hospitals Sunderland) Heart Failure Specialist Clinical Pharmacist, database user
Dawn Lambert Heart Failure Nurse Specialist (Portsmouth Hospitals NHS Trust) Heart Failure Nurse Specialist, database user
Kathy Simmonds Heart Failure Nurse Specialist (Kettering General Hospital NHS Foundation Trust)
Heart Failure Nurse Specialist, database user
Richard Mindham Heart failure patient Patient representative
Marion Standing Senior Developer NICOR
Aminat Shote Information Analyst NICOR
Akosua Donkor National Heart Failure Audit Project Manager NICOR
7 Appendices

69National Heart Failure Audit April 2013-March 2014
7 Case Studies8 Glossary
Word Acronym or abbreviation
Definition
(Acute) Myocardial Infarction
(A)MI Commonly known as a heart attack, a myocardial infarction results from the interruption of blood supply to part of the heart, which causes heart muscle cells to die. The damage to the heart muscle carries a risk of sudden death, but those who survive often go on to suffer from heart failure.
Angiotensin II receptor antagonist/ angiotensin receptor blocker
ARB A group of drugs usually prescribed for those patients who are intolerant of ACE inhibitors. Rather than lowering levels of angiotensin II, they instead prevent the chemical from having any effect on blood vessels.
Angiotensin- converting enzyme inhibitor
ACE inhibitor/ACEI
A group of drugs used primarily for the treatment of high blood pressure and heart failure. They stop the body’s ability to produce angiotensin II, a hormone which causes blood vessels to contract, thus dilating blood vessels and increasing the supply of blood and oxygen to the heart.
Beta blocker A group of drugs which slow the heart rate, decrease cardiac output and lessen the force of heart muscle and blood vessel contractions. Used to treat abnormal or irregular heart rhythms, and abnormally fast heart rates.
British Society of Heart Failure
BSH The professional society for healthcare professionals involved in the care of heart failure patients. The BSH aims to improve care and outcomes for heart failure patients by increasing knowledge and promoting research about the diagnosis, causes and management of heart failure.
Cardiac resynchronisation therapy
CRT CRT, also known as biventricular pacing, aims to improve the heart’s pumping efficiency by making the chambers of the heart pump together. 25-50% of all heart failure patients have hearts whose walls do not contract simultaneously. CRT involves implanting a CRT pacemaker or ICD (implantable cardioverter-defibrillator) that has a lead positioned in each ventricle. Most devices also include a third lead which is positioned in the right atrium to ensure that the atria and ventricles contract together.
Chronic obstructive pulmonary disease
COPD The co-occurrence of chronic bronchitis and emphysema, a pair of commonly co-existing lung diseases in which the airways become narrowed. This leads to a limitation of the flow of air to and from the lungs, causing shortness of breath (dyspnoea). In contrast to asthma, this limitation is poorly reversible and usually gets progressively worse over time.
Contraindication A factor serving as a reason to withhold medical treatment, due to its unsuitability.
Diuretic A group of drugs which help to remove extra fluid from the body by increasing the amount of water passed through the kidneys. Loop diuretics are often used in heart failure patients to ease symptoms of oedema and breathlessness.
Echocardiography Echo A diagnostic test which uses ultrasound to create two dimensional images of the heart. This allows clinicians to examine the size of the chambers of the heart and its pumping function in detail, as well as examine valves and the myocardium (heart muscle).
Electrocardiography ECG/EKG A diagnostic test which records the rhythm and electrical activity of the heart. Electrodes (sticky patches, connected to wires which lead to a recording machine) are attached to the arms, legs and chest, and pick up electrical signals produced by each heartbeat. ECGs are sometimes taken whilst a patient is excercising on a treadmill or exercise bike. Information from exercise tests can help doctors to plan treatment, understand the severity of heart disease in the patient, and determine an optimal cardiac rehabilitation programme.
European Society of Cardiology
ESC The ESC is a professional association for cardiologists across Europe, which aims to facilitate improved diagnosis and treatment of cardiovascular disease in Europe. It runs numerous education and training events, and edits and publishes nine journals on cardiology. The ESC has produced a Clinical Practice Guideline for acute and chronic heart failure, and a set of standards for delivering heart failure care, which the audit uses, along with NICE guidance, as a benchmark for good practice.

70 National Heart Failure Audit April 2013-March 2014
Heart failure A syndrome characterised by the reduced ability of the heart to pump blood around the body, caused by structural or functional cardiac abnormalities. The condition is characterised by symptoms such as shortness of breath and fatigue, and signs such as fluid retention. Acute heart failure refers to the rapid onset of the symptoms and signs of heart failure, often resulting in a hospitalisation, whereas in chronic heart failure the symptoms develop more slowly.
Hospital Episode Statistics
HES The national statistical data warehouse for England of the care provided by NHS hospitals and for NHS hospital patients treated elsewhere. HES is the data source for a wide range of healthcare analysis for the NHS, government and many other organisations. The National Heart Failure Audit uses HES data to calculate case ascertainment.
Left ventricular dysfunction
LVD Any functional impairment of the left ventricle of the heart.
Left ventricular ejection fraction
LVEF A measurement of how much blood is pumped out of the left ventricle with each heartbeat. An ejection fraction of below 40% may be an indication of heart failure.
Left ventricular systolic dysfunction
LVSD A failure of the pumping function of the heart, characterized by a decreased ejection fraction and inadequate ventricular contraction. It is often caused by damage to the heart muscle, for example following a myocardial infarction (heart attack).
Medical Research Information Service
MRIS A Health and Social Care Information Centre service which links datasets at the level of individual patient records for medical research projects. NICOR uses MRIS to determine the life status of patients included in the audit, so as to calculate mortality rates. MRIS also provides the audit with HES data for this report.
Mineralocorticoid receptor antagonist
MRA A group of diuretic drugs, whose main action is to block the response to the hormone aldosterone, which promotes the retention of salt and the loss of potassium and magnesium. MRAs increase urination, reduce water and salt, and retain potassium. They help to lower blood pressure and increase the pumping ability of the heart.
National Clinical Audit and Patient Outcomes Programme
NCAPOP A group of 40 national clinical audits, funded by the Department of Health and overseen by HQIP that collect data on the implementation of evidence based clinical standard in UK Trusts, and report on patient outcomes.
National Institute for Cardiovascular Outcomes Research
NICOR Part of the National Centre for Cardiovascular Prevention and Outcomes, based in the Institute of Cardiovascular Science at University College London. NICOR manages six national clinical audits, including the National Heart Failure Audit, and three new technology registries.
New York Heart Association class
NYHA class NYHA classification is used to describe degrees of heart failure by placing patients in one of four categories based on how much they are limited during physical activity:
Class I (Mild): No limitation of physical activity. Ordinary physical activity does not cause undue fatigue, palpitation, or dyspnoea (shortness of breath).
Class II (Mild): Slight limitation of physical activity. Comfortable at rest, but ordinary physical activity results in fatigue, palpitation, or dyspnoea.
Class III (Moderate): Marked limitation of physical activity. Comfortable at rest, but less than ordinary activity causes fatigue, palpitation, or dyspnoea.
Class IV (Severe): Unable to carry out any physical activity without discomfort. Symptoms of cardiac insufficiency at rest. If any physical activity is undertaken, discomfort is increased.
Oedema An excess build-up of fluid in the body, causing tissue to become swollen. Heart failure patients often suffer from peripheral oedema, affecting the feet and ankles, and pulmonary oedema, in which fluid collects around the lungs.
Patient Episode Database of Wales
PEDW The national statistics database for Wales, collecting data on all inpatient and outpatient activity undertaken in NHS hospitals in Wales, and on Welsh patients treated in English NHS Trusts.
71National Heart Failure Audit April 2013-March 2014
9 References
1. Gibbs JSR, McCoy ASM, Gibbs LME, Rogers AE,
Addington-Hall JM (2002), ‘Living with and dying from
heart failure: the role of palliative care’, Heart 88, 36-
39, http://heart.bmj.com/content/88/suppl_2/ii36.full
[accessed 31/07/2014].
2. Jiang W, Alexander J et al (2001), ‘Relationship
of depression to increased risk of mortality and
rehospitalization in patients with congestive heart failure’,
Archives of Internal Medicine 161 (15), 1849-1856, http://
www.ncbi.nlm.nih.gov/pubmed/11493126
[accessed 31/07/2014].
3. British Heart Foundation Health Promotion Research
Group (2012), Coronary heart disease statistics: 2012
edition, London: British Heart Foundation, p.58, http://
www.bhf.org.uk/publications/view-publication.
aspx?ps=1002097 [accessed 31/07/2014].
4. Ibid. p.81.
5. National Institute for Health and Care Excellence (2010),
CG108 Chronic heart failure: Management of chronic
heart failure in adults in primary and secondary care,
http://nice.org.uk/cg108 [accessed 31/07/2014].
6. For example, ibid.; National Institute for Health and
Care Excellence (2011), Chronic heart failure quality
standard, http://nice.org.uk/qs9 [accessed 31/07/2014];
The Task Force for the Diagnosis and Treatment of Acute
and Chronic Heart Failure 2012 of the European Society
of Cardiology (2012), ‘Guideline for the treatment and
management of acute and chronic heart failure’, European
Heart Journal 33 (14), 1787-1847, http://eurheartj.
oxfordjournals.org/content/33/14/1787.full
[accessed 31/07/2014].
7. Ibid.
8. NICOR, Heart failure: Datasets and user guides, http://
www.ucl.ac.uk/nicor/audits/heartfailure/datasets
[accessed 31/07/2014].
9. http://www.england.nhs.uk/nhs-standard-
contract/13-14/ and http://www.england.nhs.uk/nhs-
standard-contract/ [both accessed 31/07/2014].
10. http://www.wales.nhs.uk/sitesplus/documents/986/
NCAOR%20ANNUAL%20PLAN%202013.14%20
%28FINAL%29.pdf [accessed 31/07/2014].
11. Health and Social Care Information Centre Hospital
Episode Statistics: Admitted Patient Care 2011-12,
‘Summary Report’, p.18, https://catalogue.ic.nhs.uk/
publications/hospital/inpatients/hosp-epis-stat-admi-
pati-care-eng-2011-2012/hosp-epis-stat-admi-head-
figs-11-12-rep.pdf [accessed 21/06/2013].

72 National Heart Failure Audit April 2013-March 2014
Designed and published by:
creative.co.uk

Designed and published by:
This work remains the sole and exclusive property of UCL and may only be reproduced where there is explicit reference to the ownership of UCL. This work may be re-used by NHS and government organisations without permission. Commercial re-use of this work must be granted by UCL.
Copyright © 2014 UCL, NICOR National Heart Failure Audit. All rights reserved.